to be returned to reports desk file copy - World Bank Documents
239
CIRCULATING COPY TO BE RETURNED TO REPORTS DESK FILE COPY DOCUMENT OF INTERNATIONAL BANK FOR RECONSTRUCTION AND DEVELOPMENT INTERNATIONAL DEVELOPMENT ASSOCIA"-'" 1 Not For Public Use 39 Vol. 3 RETURN TO Report No. 39 a-PH AGRICULTURAL SECTOR SURVEY PHILIPPINES (in four volumes) VOLUME III ANNEXES 6 - 10 May 2, 1973 Regional Projects Department Asia Regional Office This report was prepared for official use only by the Bank Group. It may not be published, quoted or cited without Bank Group authorization. The Bank Group does not accept responsibility for the accuracy or completeness of the report. I Public Disclosure Authorized Public Disclosure Authorized Public Disclosure Authorized Public Disclosure Authorized
-
Upload
khangminh22 -
Category
Documents
-
view
3 -
download
0
Transcript of to be returned to reports desk file copy - World Bank Documents

CIRCULATING COPY
TO BE RETURNED TO REPORTS DESK FILE COPYDOCUMENT OF INTERNATIONAL BANK FOR RECONSTRUCTION AND DEVELOPMENT
INTERNATIONAL DEVELOPMENT ASSOCIA"-'" 1
Not For Public Use 39Vol. 3
RETURN TOReport No. 39 a-PH
AGRICULTURAL SECTOR SURVEY
PHILIPPINES
(in four volumes)
VOLUME III
ANNEXES 6 - 10
May 2, 1973
Regional Projects DepartmentAsia Regional Office
This report was prepared for official use only by the Bank Group. It may not be published, quotedor cited without Bank Group authorization. The Bank Group does not accept responsibility for theaccuracy or completeness of the report. I
Pub
lic D
iscl
osur
e A
utho
rized
Pub
lic D
iscl
osur
e A
utho
rized
Pub
lic D
iscl
osur
e A
utho
rized
Pub
lic D
iscl
osur
e A
utho
rized

PHILIPPINES
AGRICULTURAL SECTOR SURVEY
VOLUME III
ANNEXES 6 - 10
ANNEX 6. RICE PRODUCTION
ANNEX 7. CORN AND FEED GRAIN PRODUCTION
ANNEX 8. SUGAR AND TOBACCO PRODUCTION
ANNEX 9. RICE: ESTIMATES OF SUPPLY AND DISAPPEARANCE
ANNEX 10. CROPS MARKETING


AGRICULTURAL SECTOR SURVEY
PHILIPPINES
ANNEX 6. RICE PRODUCTION


ANNEX 6
Page 1
PHILIPPINES
AGRICULTURAL SECTOR SURVEY
RICE PRODUCTION
TABLE OF CONTENTS
Page,No.
Introduction .......................................... 1
Past Trends: Area, Production and Yield ..............
Four-Year Production Plan and Targets ................. 3
NFAC Rice Program ..................................... 4
Research and Extension ................................ 6
Supply of Major Inputs ................................ 10
Recommendations for Improvement ....................... 17
The Outlook for Future Production ..................... 21
Appendix 1: Government Organization: Annual Crops Production Programs
Tables:
1. Rice Production Statistics, All Philippines2. Official Statistics of Rice Harvested Area on Irrigated and Rainfed
Paddy and Upland Rice3. Area Changes of Major Upland Field Crops
4. Rice HYV, Area and Yield5. Rice Balance Sheet for 1971/726. Rice Extension Target of the NFAC Program
7. Estimated Input and Credit Requirement of the NFAC Rice Program8. Comparison of Improved Seed Board Recommended Rice Varieties9. Fertilizer Recommendations for Lowland Rice
10. Number of Farms in Sample Barrios Reporting Using Tractor11. Number of Farms in Sample Barrios Reported Using Power Threshers12. Estimated Number of Tractors in Philippines13. Rice Planting Calendar in Philippines14. Variation of Rainfall Pattern & Typhoon Frequency16A. Projected Change of Rice Land Composition16B. Difference from 197217. Approximated Present Composition of Rice Land18. Projected Rice Harvested Area, Yield & Paddy Production

ANNEX 6Page 2
Figures:
1: Variability in Optimum Level of Nitrogen and Palay Yield Level Dueto Changes in the Fertilizer Price (WB 7226)
2: Sales of Farm Machinery (WB 7227)
3: Price Trends of Selected Factors in Farm Production (WB 7228)

ANNEX 6
Page 1
PHILIPPINES
AGRICULTURAL SECTOR SURVEY
RICE PRODUCTION 1/
Introduction
1. The rice deficit has been a persistent problem for the Philippines.Only a third of the lowland rice harvested area is now under irrigation.And if the upland rice area is included, only about 29% of the harvestedarea is under irrigation. Beginning with the expansion of HYV's in1966/67, rice production increased rapidly and steadily. In 1968/69 and1969/70, the Philippines were thought to have achieved rice self-suffiLciencyfor the first time in recent history. However, deficits became apparentduring the last two years and imports again become necessary. The impactof HYV's is levelling off, as most of irrigated land is now planted to HYV's.HYV's are spreading into rainfed paddy where the yield increment is muchsmaller. The average yield of HYV's in 1970/71 was only 2.9 MT/ha and, with39% of total rice harvested area under HYV's, the national average yieldwas 1.7 MT. The Philippines has a good backlog of research information onrice, but has not been widely disseminated to farmers. Recent trials!on highinput culture of HYV on rainfed lowland gave encouraging results. SeLf-sufficiency in rice requires further improvement in irrigation, drainage andextension. Small farmers require larger supplies of farm inputs and creditin order to take advantage of the potential high yields of HYV's.
Past Trends: Area, Production and Yield
2. Area. The area harvested to rice was below 2.8 million ha until1956/57, jumped to above 3 million ha in 1957/58, and has fluctuated inthe 3-3.3 million ha range since then (Table 1). Since 1965/66 the irrigatedarea has increased rapidly and the first HYV, IR-8, was released to farmersin 1966/67. Until 1965/66, the reported "irrigated rice area" fluctuatedaround 1 million ha. Since then, it registered big gains each year,
except in 1969/70 (Table 2):
1965/66 960,000 ha1966/67 1,170,000 ha1967/68 1,309,000 ha1968/69 1,483,000 ha1969/70 1,346,000 ha
1/ The government organization for rice and other annual crops programsis discussed in Appendix 1.

ANNEX 6
Page 2
The upland rice area has declined slowly since the beginning of the sixties,but dropped sharply from 605,000 ha in 1965/66 to 445,000 ha in 1966/67and, by 1969/70, it was down to 412,000 ha.
3. Competition of other crops with rice increased during the late1960's and early 1970's. Total harvested corn area remained around 1.9 to2.0 million ha from 1961/62 to 1964/65, but exceeded 2.1 million in1965/66 and has expanded steadily since then; by 1969/70, it reached 2.4million ha (Table 4). The sugarcane area has expanded steadily since theforties, and exceeded 300,000 ha for the first time in 1964/65; it was350,000 ha in 1969/70 and 422,000 ha in 1970/71 (Table 3).
4. Data suggests that, until 1965/66, farmers normally would plantmore than 3.3 million ha of rice each year but drought, flood, typhoonand pests would destroy as much as 300,000 ha of the planted area. Whenthe average yield was 1-1.2 MT paddy/ha, the wide fluctuation in theharvested (damaged) area was probably the single most imDortant factor thatkept Philippines' rice production uncertain.
5. Since 1965/66, the expansion in corn and sugarcane area has causeda rapid reduction in upland rice area. The loss of upland rice area hasbeen partly compensated by an expansion in the irrigated area planted torice during the dry season. The rate of expansion in the irrigated area,however, has been overestimated (Annex 3). The mission estimates that lessthan 900,000 ha of the rice harvested area are now under irrigation.
6. Yield and Production. There has been an unbroken upward trendin yields per hectare since 1957/58 and of production since 1954/55. Asindicated, three factors are involved: greater use of improved varieties(old Seedboard varieties before 1965/66 and HYV's after), reduction of thelower yielding upland rice area, and the expansion of irrigated cultivation.Contributions from the use of manufactured inputs have not been significant.
7. Despite the typhoons of 1970 and the tongro disease epidemic in thefall of 1971, the average yield in 1970/71 (39 cavans) was 13% higher thanin 1968/69 (30.3 cavans). Over the two-year period, there was a loss inharvested area of about 6.5%.
8. The rapid increase in yields since 1966/67 was caused primarilyby the introduction and expansion of HYV's. National Food and AgriculturalCouncil (NFAC) reported that the total HYV area increased from 83,000 ha in1966/67 to 1.2 million ha in 1970/71. Over the same period, however, thereported average yield/ha of HYV rice decreased from 100 cavans to 66 cavans(Table 4). NFAC attributed the decline in yield to the following causes:decreasing use of inputs due to rising cost; tight credit; replacement ofIR-8 by varieties with better taste qualities but lower yield: IR-5, IR-20,IR-22, and C-4; severe rat damage, with an average loss of 3 cavans per ha;insufficient supervision by extension workers due to latter's lack oftransportation facility; inadequate post-harvest facilities; peace and order;and three major typhoons in 1970/71 and 19 minor ones.

ANNEX 6Page 3
9. As a general rule, the average yield of new varieties for any cropwill decline as the area expands. In the Philippines, HYV planting beganinitially in irrigated areas. The HYV area in NFAC's programmed area (1970/71)was equal to about 90% of the total irrigated area reported by BAEcon, 1/and was considerably greater than the mission's estimate of less than 900,000ha irrigated. NFAC reports suggest that HYV's spilled onto some 300,000 haof rainfed paddy in 1970/71, and is making rapid inroads onto this categoryof rice land. While the expansion of HYV area has been the main contributionto the rapid production increase since 1966, continued expansion can no longerbe expected to increase the national average rice yield at the same rate, eventhough the national average paddy yield is a mere 1.7 MT/ha. Field trials ofhigh input rainfed HYV culture conducted in 1971/72 gave encouraging resultsand hope that substantial paddy production increase may be possible from therainfed paddy if bottlenecks in extension and credit could be overcome.
10. To keep rice production in line with demand, the Philippines' riceprogram requires four courses of action:
- More substantial expansion of lowland irrigated area,expansion of the HYV area on rainfed paddy in areaswith relatively even distribution of rainfall, andimprovement of drainage of the paddies.
- Improving yields on existing irrigated land by anexpanded irrigation rehabilitation program, and byinducing the use of more inputs by farmers throughreduction of risks.
- Extension of still better HYV's with higher diseaseresistance.
- Controlled reduction of the area planted to uplandrice on slopes that are too steep and- diversion of somerainfed lowland paddy to other crops.
Four-Year Production Plan and Targets
11. The current Four-Year Plan sets the following targets for riceproduction:
1/ BAEcon reported 1,565,390 ha for the whole country. It is suspectedthat this included areas of all old and new Seedboard varieties.

ANNEX 6Page 4
Year 1,000 MT Paddy
Base year 1969/70 5,233
( 1970/71 5,343/1( 1971/72 5,853-
Estimated ( 1972/73 6,301Targets ( 1973/74 6,633
( 1974/75 6,982
Annual Average Growth Rate: 6.1%
/1 BAEcon's February, 1972 estimate: 5,142.
12. The Plan proposes the saturation of existing irrigated rice landwith HYV's and expansion of irrigated crop area by 220,000 ha during theplan period. There would be greater use of certified seed and otherinputs; expansion of applied research; more supervised credit; an increasein the supply of processing technicians; etc. Agricultural diversificationof marginal rice land would be pursued as rice production increases overthe plan period. Agricultural mechanization would be realized principallyby a continuation of Agricultural Guarantee Loan Fund and IBRD financingthrough rural banks and DBP. Additional long-term loans would be soughtfor improving processing and marketing. There would be a price supportprogram and exports of high quality rice would be allowed when domesticsupply is assured.
13. As a national economic plan, it includes no detailed projectionfor planted or harvested area, nor for yield per hectare, nor regionalbreakdown of production targets. It gives no specific plans of implementa-tion for the improvement measures outlined above. In DANR's own "Four-YearRice Production Program", which forms the basis of rice targets of thenational Four-Year Plan, it does give projections of area yield andproduction of HYV's for the four years and estimates of requirements ofseeds, fertilizers, and pesticides for the first year of the plan period.It prepares detailed targets each year thereafter. Thus, the Philippines'rice program under the Four-Year Plan is based mainly on productionincreases to be derived from HYV's and leaves the rest of the riceproduction to taking its own course under the routine extension program.
NFAC Rice Program
14. The planning process of the DANR-NFAC rice program can beillustrated by the 1971/72 program. NFAC first estimated that the countryneeded to produce 5.7 million MT of paddy, 360,000 MT more than 1970/71production (Table 5). To produce that amount, it programmed 1 million haof HYV's in 43 provinces in nine regions to receive intensive programsupport. The target compared with a planted area of 1.2 million ha in 64provinces in 1970/71. The programmed area was expected to achieve anaverage yield of 75 cavans paddy (3,300 kg) per hectare and to produce

ANNEX 6Page 5
a total of 3.3 million MT. The remaining 2.4 million MT are to be producedfrom the 2.1 million ha of unprogrammed paddy and upland rice at about26 cavans per hectare. The average yield on the unprogrammed areareported by NFAC varied from 24 cavans to 28 cavans from 1967/68 to1969/70.
15. The 1 million ha were then distributed among different regions andprovinces (Table 6). Based on area and seasonal distribution, NFAC esti-mated requirements for seeds, fertilizers, pesticides and credit, byseasons, by province and by regions (Table 7). Cost of inputs was put atY 363.4 million, composed of r 210.8 worth of fertilizer (9.6 million bags),P 151.6 million worth of pesticides, and Y 1 million worth of certifiedseed (1.2 million cavan). Credit for the July-December 1971 crop was putat t 371.1 million; and for the January-June 1972 crop, P 116.8 million.
16. NFAC expects the various inputs to contribute to the productionincrease as follows: use of certified seeds, 10%; use of fertilizers,5-10%; use of pesticides, 5-10%; proper weeding, 10-15%; and properirrigation, 30-50%.
17. Except in Ilocos, Cagayan Valley and Central Luzon regions, theregional area targets exceed the listed irrigated area, indicating inclusionof some rainfed paddies. Beginning 1973, NFAC rice program will reguLarlyinclude rainfed lowland paddies. For implementing the Program, NFAC Listsa set of work items following the general guidelines of the Four-Year Plan.NFAC has lined up technical staff of various agencies, particularly thoseof Bureau of Plant Industry (BPI) and Agricultural Productivity CouncL1 (APC),at the national, regional, provincial and municipal levels, to be responsiblefor the program in tandem with their regular job -- it is said that some1,850 persons participate in the Program's work at various levels. NFACprovided incentive allowances (travel allowances) to field staff at Y 50-250per month.
18. The most prominent work component is the so-called "United RiceApplied Research, Training and Information Project". The plan includes fivecategories of field trials conducted in farmers' field. A kit approach toinput distribution was started in 1966. Each "minikit" contains seeds ofsix recommended varieties, each sufficient for planting 50 sq m, or a totalof 0.3 ha, and inputs in proportion to the recommended amounts, plusdirections on cultural practices. Several thousand of such kits aredistributed each year through municipality-based APC Farm ManagementTechnicians (extension officers). Beginning in 1972, a smaller so-called"microkit" was added, each containing one or two varieties and inputs fora 1/200 ha area. The microkits are aimed at permitting more rapid spreadingof new HYV's to replace the old ones.
19. The other three categories are: (1) Farmers' Evaluation of NewRice Selections Applied Research Trials - to be conducted in variousprovinces by BPI, local colleges of Agriculture and APC; (2) Trials of NewSelections in combination with the use of insecticides, and of herbicides,

ANNEX 6Page 6
also to be conducted by BPI, and local colleges of Agriculture in variousProvinces and APC; and (3) Trials on response to nitrogen of new selectionsto be conducted by Bureau of Soils (BS) in various representative soiltypes in different Regions. Reports of the trials are submitted throughmother agencies to NFAC. Once a year, a workshop lasting four or fivedays is held in Manila or Los Banos to review findings and formulate newrecommendations to be incorporated into extension. The training programincludes a six-month training of national, regional and provincial levelrice specialists of APC, BPI and BS. The trainers are BPI senior specialists,UPCA professors and IRRI experts. Those trained in turn conduct two-weektraining courses for APC and BPI provincial and Municipal level Farm Manage-ment technicians. Finally there are several one-day regional programs--seminars,training in applied research, and the minikit project.
20. The information program includes: (a) annual edition of "ThePhilippines Recommends for Rice by NFAC", which contains the latest officialrecommendations on various aspects of rice culture, and is intended forextension workers, agribusiness and farm leaders; (b) monthly issues ofa semitechnical "Philippine Rice Letters" by the United Rice AppliedResearch, Training and Information Project, intended for keeping national,regional and provincial specialists informed of the current decisionsreached by NFAC and noteworthy research findings on rice; and (c) bulletinsand leaflets for distribution to farmers printed in major dialects, andin English.
Research and Extension
21. Rice research has the longest history and the largest program amongall crops in the Philippines. The main Government agencies responsible forthe program are BPI and UPCA. Joined by International Rice Research Insti-tute (IRRI) 10 years ago, rice research in the Philippines is probably asencompassing and productive as any country in the world.
22. Varietal Improvement. Before IRRI began its work in 1963, BPIand UPCA had developed a number of improved varieties and extended themto farmers. IRRI's release of its first variety, IR-8, started in 1965/66and it released other varieties since then. Since then, the BPI and UPCA'snewer varieties have also incorporated shorter and upright plant type andhigher yielding ability which characterize IRRI varieties. The 1971 Seed-board Varieties of the Philippines (Table 8) are composed of varietiesfrom these three institutions. The strong point of HYV's so far has beena plant type conducive to fertilizer responsiveness, but there is muchroom for improvement in disease resistance and eating quality. The tungrooutbreak in the fall of 1972 prompted DANR to remove the susceptible IR-8,IR-5 and IR-22 from the list of Seedboard Varieties, beginning with thespring of 1972. Those remaining are IR-20, C4-63, C4-63G, C4-137 and BPI-76(NS). A significant shift in the composition of HYV's in farmers' field isin the making, although it will take several years to complete.

ANNEX 6Page 7
23. IRRI's rice breeding program has for some years identifiedsources of resistance to all major rice diseases (i.e. rice blast, bacterialleaf blight, bacterial leaf streak, tungro and grassy stunt) and to majorrice insects (i.e. stemborers, gall midge, brown plant hopper, whichtransmits grassy stunt, and green leaf hopper, which transmits tungro).The new approach in rice breeding at IRRI is a deviation from the traditionalobjective of breeding for high resistance to individual diseases (so-calledvertical resistance). It now aims at embodying fairly high resistance tothe full range of major diseases and insects in varieties (so-calledhorizontal resistance), in addition to high yields and good taste qualities.Selections showing various combinations are already available. IRRI isworking to put them all together. The new IRRI selections, once released,promise to be a second breakthrough in the history of rice breeding. Thedate of release of the new phase HYV's, however, is difficult to ascertainat this point. The mission's impression is that, until 1975, the Philippines'rice program will be dependent on the existing line of HYV's. After 1975,say, five to seven years from now, new and higher yielding HYV's may beavailable.
24. Beginning 1971, IRRI/NFAC initiated a 3 year field trial projectof cultivating HYV's on rainfed paddies in 4 municipalities in Central Luzon.The first year result showed that high yield could be obtained: (a) byplanting rice early in the first week of July so that grain would ripenbefore onset of the dry period beginning late September, and (b) if the fullpackage of recommendations on application of fertilizers, pesticides andweedicides are strictly followed. If these findings are sustained by furthertrials and successfully extended to farmers, significant production increasescould be obtained from the huge rainfed paddy area in the Philippines.
25. Pest Control. BPI and UPCA have experimented and recommendedchemical foliage spray, dusting, and seed treatment for rice pest controlfor some years. IRRI carried on chemical pest control studies, also,but once again it broke away from tradition and recommended the use ofsystemic granules, i.e. gamma-BHC, diazinon or sevidol which is by nowwell known to most countries. With two to three direct broadcastings inrice fields, the latter two chemicals control stemborers, green leafhoppers and brown paddy hoppers. The former controls stemborers. Theuse of granules eliminate the use of sprayers which many small farmerscannot afford, but the cost of granules are still too high for mostPhilippine farmers. New chemicals for rice pest control are continuouslybeing tested by the three agencies and field recommendations are includedin extension material. (Soon after the tungro disease outbreak, recommendeduse of Furadin, Sevin or Mipcin seed treatment and seedling dipping was putout quickly, together with the use of resistant Seedboard Varieties.)
26. Research findings and recommendations are available, but the costof chemical control is usually prohibitive. BPI computed that threeapplications of Gamma-BHC for control of stemborer and Sevin or Mipcinfor tungro, and two applications of Plasticidin or Kusumin for rice blastwould cost f 151, f 265 and g 160 per hectare, respectively, at 1972 prices.The real hope of minimizing crop losses from pests, therefore, lies inthe use of HYV's which are resistant to a wide range of pests.

ANNEX 6Page 8
27. Rat Control. During 1970, a sample survey of 98 barrios in 16major rice producing provinces showed an average damage of 4.5% of the crop.Two of the largest plains of the Philippines, Central Luzon and CotabatoValley, have heavy rat infestation.
28. Research on rat control is being carried out mainly by the RodentResearch Center of the UPCA. Cooperating agencies include NEC and BPI,and assisting agencies include USAID and the Denver Wildlife ResearchCenter. Work so far has included field surveys on rat damage and speciesof rats, studies of rat population sampling techniques, comparative studiesof rat population in rainfed and irrigated paddies, and studies of poisons,baits, method of bait setting, and the effect of rat damage done atdifferent stages of rice growth. Findings are well documented. Basicfacts about rat damage are now available and much better quantified thanbefore. Recommendations for rat control methods are included in extensionmaterial but well organized campaigns are yet to be launched.
29. Weed Control. As in most tropical countries, there are threemain types of paddy weeds in the Philippines: the grass weeds (mainly barn-yard weed), the sedges, and broadleaf weeds. Weed problems are aggravatedby the extension of short-stemmed HYV's which are less able to overshadowweeds than long-stemmed lower yielding varieties. Experiments on weed control,conducted mainly by IRRI and UPCA, are limited to the use of herbicides.Effective herbicides for different weeds, rate, timing and methods of appli-cation have been worked out and included in extension material and minikits.New herbicides are being tested. But use of herbicides is limited to largeproducers. A complete application of Eptam M or Treflan R costs f 70 per ha(1970 price), which few small farmers can afford. One good development,the early application of 2-4 D Isopropyl ester, is emerging from IRRIexperiments. 2-4D is an old herbicide. 2-4 D is used to some extent forsecond rice crop in Taiwan, in Thailand and in the Philippines by largefarmers, but when applied at the usual time of two or three weeks aftertransplanting, it fails to control grass weeds. IRRI's recent experimentshows that if applied four days after transplanting, before emergence of anyweeds, 0.8 kg active ingredient per hectare will control all weeds in oneapplication. The cost at 1972 price is about $5/ha for granules and only$2.50/ha if liquid is used, but the latter has to be applied with a sprayer.If the January/February temperature happens to be cool after transplanting,it may stun the seedlings for a short period but they will revive in acouple of weeks with no apparent effect on final yield. IRRI is optimisticabout the possibility. If proven effective under field conditions forsmall farmers at the estimated cost, it will be another breakthrough intropical rice culture.
30. Application Rates of Fertilizers. Research on soil fertilityand fertilizer application rates on rice is carried out mainly by the Bureauof Soils. The current official fertilizer recommendations for rice arebased mainly on the findings of a Bureau of Soils/UNDP Soil Fertility Surveyand Research Project conducted from March 1964 to March 1969. The currentofficial recommendations range from 60-100 (mostly 80-100) kg of N perhectare, 30-50 kg of P205 and 0-50 kg of K20 (Table 9).

ANNEX 6Page 9
31. The recommended rates are much higher than the rates farmersare actually using. Examination of the published experiments 1/ showthat in almost in all trials, the paddy yield was near 45 cavans (2,000kg) per ha or more on control plots with zero application of fertilizers.An IRRI curve (Fig. 1) shows HYV paddy yield response to N application,where paddy yield also began with 2,000 kg per ha at zero kg of N. 2/Apparently, all rice fertilizer experiments done in the Philippines wereconducted on well irrigated lowland paddy and the management of the plotswas such that all adversaries were kept under control so that the responseof the crop to fertilizers could be compared. This is in fact the only wayexperiments can be conducted.
32. When translated into extension level, however, it means:
(a) these recommendations are applicable only to irrigatedlowland rice, not to rainfed lowland rice;
(b) farmers' crops are getting a much lower response even ifthey use the recommended rates, because all other conditions,i.e., adequacy of irrigation and drainage, pest, weed, andrat control, are not under as good control as in trialplots; and
(c) the fertilizer recommendations are at present almostirrelevant to farmers' actual practice.
33. Experiments on fertilizer response of upland rice was started byIRRI in 1969. Work on rainfed lowland rice was also started by IRRI/UPCA/BPIin 1971 (see para 24).
34. Farm Mechanization. Emphasis of IRRI rice farm machinery researchis placed on design and development of equipment of immediate interest tolocal manufacturers, utilizing, to a maximum extent, locally available manu-facturing methods, materials, labor, and other resources of the Asian region.It aims at meeting the requirements of the 2 to 10 ha farms. So far IRRIhas designed and developed: (a) a 4-6 HP power tiller being marketed by twomanufacturers in the Philippines at about US$600, less than half the priceof comparable imported tillers; (b) single and multi-hopper paddy seeders(sow 1 ha in 5 manhours) costing about US$40 to 45; (c) rotary power weeders
1/ Soil Fertility Survey and Research, the Philippines' Field Experiments,Plant Nutrition and Soil Classification. UNDP/FAO. LA:SF/PHI 1pTechnical Report 1, Rome, 1969.
2/ Barker, Meyers and Cordova. The Impact of Devaluation on FertilizerUse and.Profitability in Philippine Rice Production, IRRI (mimeol-graphed), May 21, 1970.

ANNEX 6Page 10
using a 1 hp engine (weed 1 ha in 197 man-hours), (d) a light table thresherthat can be moved to fields with no access roads and can thresh high moisturepaddy (4 to 5 men can thresh 350 kg paddy per hour); (e) a power graincleaner (cleans up to 3 tons per hour); (f) a foot-operated low-lift bellowspump that delivers about 50 gal/min at 1 m head, costing about $40. Underdevelopment are axial-flow thresher that may thresh 650 kg paddy per hour,a tractor PTO thresher for custom rice threshing, a four-row stripper har-vester, a rice hull oil-fired batch drier and a heated sand conductiondrier-parboiler. None of these are in sizeable production, but they representthe first line of products designed to be adaptable to the socio-economicrequirements of small paddy growers and technological capability of machinemanufacturers in Asian region.
35. Water Management. IRRI has recently initiated research on theeconomics of water management for rice. One experiment seeks to determinethe effect on yield of drought conditions at different stages of crop growth.Other research, beginning in 1971, studies the economics of operating anirrigation system, with special emphasis on farm-level water management.Preliminary findings emphasize that to improve efficiency of the existingirrigation systems, achieving equitable distribution of water along thelength of the canals should take precedent over the improvement of theterminal distribution facilities.
Supply of Major Inputs
36. Improved Seeds. The spectacular expansion of HYV's in the Philippinessince 1966 is attributable to three measures: successful introduction ofIR-8 in 1966/67 by contract farming of about 1,000 ha, where use of wellirrigated land and prescribed inputs were required; the wide distribution ofminikits and the continuous rapid farmer-to-farmer dissemination on the advan-tages of the new varieties.
37. BPI's seed multiplication program has not been able to distributea significant quantity of certified seeds. BPI purchased roughly 44,000cavans (44 kg) of certified seeds in 1966/67 but distributed only about2,500 canvans. Apparently, even with the attraction of an average yieldof 100 cavan/ha at that time, farmers did not take full advantage of theBPI certified seed stock indicating their unwillingness to pay premiumprices. Since then, BPI purchases and distribution were reduced to theorder of about 3,500 cavans in 1967/68 and 1968/69, and to under 700cavans in 1969/70. In 1970/71, it purchased and distributed about 9,800cavans of certified seeds of both lowland HYV's and upland rice varieties.This equals to 3% of the seed requirement for a rice harvest of 3.1 million ha.
38. GOP signed a loan agreement in May, 1972, with Japan (Y 17 millionto be provided by GOP, Y 7.63 million and $1.20 million loan from Japan) tofinance an "Expanded Seed Production and Distribution Program". Theproject calls for producing 224,460 cavans of certified rice seeds by1973 (1st year), and increasing to 1.41 million cavans by 1977 (5th year).The latter amount should be sufficient for planting 1.41 million ha, or

ANNEX 6Page 11
44% of the present harvested area. Corn seed will be the other majorcrop to be multiplied under.the project. In view of BPI's inability to dis-pose of its certified seed stock, even with strong demand in 1966/67,disposal of the huge amount of certified seeds to be produced under theloan project is questionable.
39. Like most countries, Philippines' seed program has four main steps:
(a) Breeder seeds are multiplied by stations of origin, i.e.
BPI, UPCA and IRRI.
(b) Foundation seeds are produced mostly by BPI and some byUPCA and IRRI.
(c) Registered seeds are produced by 14 BPI experiment stations,nine for lowland HYV's and five for upland rice varieties.
(d) Certified seeds are produced by selected "farmer cooperators".There are 1,225 accredited rice seed producers with 7,757 haof irrigated paddy registered for seed production. Most ofthese are large farmers who use a part of their land forproducing seeds. They have a seed grower's association.
40. In addition to the usual four seed categories, the Philippinesadopted a 5th category - the "good seeds" which means seeds inspected inthe field to be true to the variety but not certified by laboratory testingand the producing field does not have to be planted with registered seeds.When farmers demanded seeds of tungro resistant HYV's in the spring of 1972,BPI rushed field identification of "good seeds" of IR-20 and otherresistant varieties. Actual movement of seeds was done partly by BPI butmainly through private channels.
41. All categories of seeds multiplied by stations of BPI and otheragencies are tested by the BPI Seed Laboratories in Manila. Those producedby private seed growers are tested by BPI's seven Regional Seed Laboratories.Certified seeds purchased by BPI are sold, distributed or stored in BPI'sCentral Seed Warehouse in Manila and 6 others in different regions. Regis-tered seeds produced by the various BPI stations are handled in the samemanner. Germination and overall quality deteriorate during handling andtransit.
42. BPI is aware of the ineffectiveness of its present seed programand is anxious to improve it. A three-month study was made from Januarythrough March 1971 by a Mississippi State University team under contractwith USAID. Although the emphasis of the team's report is on feed grainseeds, its comments on overall seed program and those relating to rice seedare relevant:
- Too many BPI stations and farms (27 for all seeds) areinvolved; organization is cumbersome and hard to coordinate;

ANNEX 6
Page 12
resource and trained personnel are too diluted; staffworking on seed at different stations are not sufficientlytrained.
- Private certified seed growers are too dependent upon theGovernment for seed marketing. Extension officers are notcoordinated closely enough with BPI and seed growers inproviding seed supply and demand information. Privateseed growers should be encouraged to do their own marketing.
- BPI stations and farms are applying farmer-level technologyto relatively large scale seed operations.
-- The seed program is under-invested and the cost of operationis insufficiently funded.
- The Central Seed Laboratory are overloaded resulting indelays of testing and certification; while the regionallaboratories do not have enough work.
- Field inspectors are too few in number, insufficientlytrained and lack transportation, resulting in delays incertification work.
- Seed marketing and distribution systems are not sufficientlyidentified or developed. Transportation is difficult at alltimes. Back-and-forth shipping of certified seeds betweenproducing region and Manila warehouse should be stopped.
43. In spite of these shortcomings, the MSU Team observed that therice seed program in the Philippines is in much better shape than that forother crops because paddy is more resistant to abuses in handling and storage;the country's technicians and farmers are more experienced in handlingpaddy seeds; and the program has had the stimulus of rice HYV's, which isunique in the Philippines.
44. The mission's interpretation is that rice HYV's have expandedin spite of an inadequate seed multiplication program. When HYV'sdouble the yield of traditional varieties, farmers obtain seeds whether theyare certified or not. A seed lot containing say 5% impurities or with sayonly 85% germination would surely be disqualified for certification, butthe remaining 80% would still give farmers an 80% yield increase and farmerswould use it anyhow. This disregard of certification will probably continuefor rainfed paddy, if the yield margin over traditional varieties issufficiently large. But a sound certified seed program has now becomerelevant on irrigated lowland which is already nearly saturated by HYV's.Future yield gains from seed on such land will come from high germinationrates, high purity, vigor of seedlings and freedom from seed born diseases.

ANNEX 6Page 13
45. The USAID supported construction of the Seed Drying andProcessing Complex at the Malagaya Rice Research and Training Center andthe implementation of the Japanese seed loan are therefore timely steps.When the latter is completed, Philippines seed program will be greatlystrengthened in physical facilities: roads, irrigation and drainagefacilities, farm machineries, drying, processing and storage facilitiesof the BPI seed producing stations, four regional seed processing plantsin addition to Maligaya, vehicles for inspectors, etc. The financing ofthe operation of the program and the purchase of certified seeds will alsobe greatly improved, if the proposals are carried out. The program isaimed at supplying 1,410,000 cavans (62,040 MT) of certified rice seedsand 303,750 cavans (13,365 MT) of certified corn seeds in a year, sufficientfor planting 1,410,000 ha of rice and 1,215,000 ha of corn. The programwill be the best equipped one in Southeast Asia.
46. The mission's concern remains whether that many farmers (some750,000 at 2 ha per farm) would buy certified rice seeds each year, inview of their current reluctance to pay f 10 more per cavan. 1/ AlthoughBPI has yet to determine the future price to be charged for rice seeds,estimated quantity and value of seeds to be produced under the Japanese loanproject places the projected price at # 44 per cavan. The dependence ofthe private seed growers on Government for marketing and the inability ofBPI to dispose larger amounts of seeds so far are basically caused by theprice factor. The private seed growers have capacity to produce more seeds.Exporting certified IRRI variety seeds has become a steady business of largerseed growers in Central Luzon.
47. Use of Fertilizers. Data on fertilizer consumption by crop isnot available from Government sources or from the Fertilizer Instituteof the Philippines (FIP). One indication of the extremely low fertilizerconsumption on rice comes from Fertilizer Commission estimates of totalfertilizer consumption in the Philippines.
1/ The BPI policy has been to keep the price of certified seeds ? 10per cavan higher than the common paddy price.

ANNEX 6Page 14
FERTILIZER COMMITTEE ESTIMATES, 1966-69
Year N P205 K20
MT MT MT
1966 26,030 10,303 7,7811967 65,804 13,159 11,5051968 110,908 28,093 21,3641969 76,706 25,608 22,5564 year average,all crops /1 68,264 19,291 26,052Sugarcane 4-yearaverage /2 41,275 20,638 22,357
/1 Local production plus import, carry over stock unknown andexcluded.
/2 PHILSUGIN data, actual consumption by sugar industry.
Source: Report of Subcommittee No. 1, the Technical Working Committee,Presidential Fertilizer Commission, NEC, April 26, 1971.
48. The data show that 60% of N, practically all P205 and 86% of K20were consumed by sugarcane alone, leaving about 20,000 MT of N and less than2,000 MT of K20 for all other crops including rice.
49. The Tokyo Office of the International Potash Institute and PotashInstitute of North America, based on a study made by its Director, Dr. H. R.von Uexhull in February, 1972, estimated the fertilizer consumption inPhilippines in 1971 and 1972. For rice, in 1972, consumption was 50,000 MTof N, 10,000 MT of P205, and 6,000 MT of K2 0:
ESTIMATES OF FERTILIZER CONSUMPTION, 1971 and 1972
Year Crops N P205 K20
MT MT MT
1971 All Crops 118,000 39,000 39,700Sugarcane 48,700 22,350 23,000Bananas 3,600 - 6,500Others, Including Rice 65,600 16,700 10,200
1972 All Crops 130,000 43,000 46,000Sugarcane 52,000 25,000 25,000Bananas 5,000 - 9,000Rice 50,000 10,000 6,000Others 23,000 8,000 6,000
Source: International Potash Institute, Tokyo Office, unpublished.

ANNEX 6Page 15
When averaged over the lowland paddy harvested area of about 2.7 million ha,it amounted to 18.5 kg of N, 3.7 kg of P205 and 2.2 kg of K20 by 1972 estimates,and no fertilizer application at all for the 400,000 ha of upland rice. Ifonly 33% of the lowland paddy (TVA estimate for 1971) have applied fertilizerthe per ha application rate on land that do use fertilizer would be tripledto 55.5 kg, 11.1 kg and 6.6 kg of N, P205 and K20 respectively.
50. The NEC data shows a slump in fertilizer consumption in 1969, whichis not attributable to the rise of fertilizer price after February 1976 pesodevaluation. The Potash Institute estimates show rather that, after theinitial shock of peso devaluation, total N consumption in Philippines hasreturned to the 1968 level, and total P205 and K20 consumption set new recordsin 1971 and 1972.
1/51. The TVA projectio- for fertilizer consumption by rice is summarizedin the tabulation:
TVA ESTIMATE, FERTILIZER USE ON RICE
Total % Use Area Use ConsumptionYear Area Fertilizer Fertilizer N P2 05 K20
('000 ha) (%) ('000 ha) (MT) (MT) (MT)
1970 3,113 33 1,0221971 3,181 37 1,187 71,226 20,243 7,4691972 3,179 41 1,300 77,977 22,068 8,1771973 3,178 44 1,412 84,349 23,899 8,8811974 3,176 48 1,525 91,485 25,730 9,5881975 3,175 51 1,637 98,257 27,567 10,294
These projections are based on constant application rate of 60 kg of N, 17 kg
of P205 and 6 kg of K20 per hectare. Compared with the Potash Institute es-timate made for 1971 and 1972, the TVA projections were optimistic for allthree nutrient elements. Both the area that will use fertilizers and the N
and P205 application rates are over-estimated. The mission feels that TVAprojection for 1972 may by reached by 1975.
52. It appears that most farmers growing HYV's on irrigated paddy areusing some fertilizers, particularly N, while few farmers would use P205and K20 except the amount included in the compound fertilizers. On rainfedlowland paddy and upland rice, farmers have been using only a small amountof fertilizers or not at all. With expansion of HYV's onto the rainfedpaddy, some farmers in areas with good rainfall distribution have begun touse some, but at an extremely low level.
53. Farm Machinery. Statistics on total number of tractors servingagriculture in the Philippines today are not available. Available data arelimited to BAEcon surveys conducted in 1963 and in 1967, and sales data fromdealers. No licensing is required for owning and using tractors. No Govern-ment agency is responsible for registration of tractors in use. Statisticsare therefore hard to come by.
1/ The Fertilizer Industry in the Philippines, TVA, 1971.

ANNEX 6Page 16
54. A survey on farm machinery conducted by BAEcon in 1963 reportedthe existence of around.5,300 agricultural tractors in the country. A 1967sample survey showed that of around 97,000 farm household covered by 1,930barrios, 5,250 or 5.4% use tractors. Of this number, 1,195 sets were below15 hp, 547 sets were of unknown horsepower range, the balance ranges from15 to 100 hp; 2,305 sets are from 40 to 80 hp range. Central Luzon andSouthern Tagalog have the largest number of tractors, but a larger shareof tractors in the latter region are hand tractors. The 1967 survey alsoshows there were roughly 13,000 power threshers in the sample barrios with11,000 sets in Central Luzon. Details are given in Tables 10 and 11. Sincethe 1967 sampled families form only 4% of the total household of the country,a straight extrapolation would give the Philippines 130,000 tractors andsome 275,000 threshers. This however would be a gross overestimation.
55. Using 1967 data, IRRI 1/ estimated that there were 278,900 mechanicalhorsepower available in the Philippines, 266,340 from large tractors and12,560 from hand tractors. The horsepower per agricultural worker wasestimated to be 0.048, compared to 0.059 in Thailand, 0.070 in Taiwan, and1.05 in Japan for the same period.
56. The large proportion of rainfed lowland makes the use of tractorstechnically relevant, because land preparation needs to be done at the rightmoisture content. Unfortunately, rainfed farmers generally have lower farmincome and can least afford to buy tractors. Expansion of HYV's has beensaid to have stimulated the sales of tractors. The 1970 peso devaluationis blamed for price increases and reduced sales. Sales record of tractorsshows a declining trend since the peak was reached in 1967, long before thepeso devaluation; meanwhile, HYV's area expansion continued.
57. Twenty-three firms are listed as members of the AgriculturalMachinery Distributors of the Philippines (AMDP). Sales record of AMDPmembers are given in Figure 2. In 1967, about 1,500 sets of large tractorsand some 3,000 sets of hand tractors were sold. Since that year, the salesof both types of tractors have fallen, but with the hand tractors decliningmuch more sharply. Sales have followed closely the loans released fortractor purchase by the IBRD-CB rural credit project. Obviously, the buyersof the large tractors are less dependent on this source than are those ofhand tractors. In 1971, AMDP reported a total sale of 1,083 large tractors(39 to 172 hp range), 484 in Luzon, 331 in Visayas, and 268 in Mindanao.This is a further drop from the 1970 sales. Number of hand tractors soldin 1971 is not available.
58. Local tractor prices began to rise long before the 1970 devaluation.The real climb occurred during the period from 1958 to 1963 (Figure 3). Using1956 as a base year, the tractor price index remained around 100 until 1958,
1/ Annual Research Review, Agricultural Economics, February 21-15,1972, IRRI.
ANNEX 6
Page 17
reached 160 in 1961, 240 in 1962, over 274 in 1963, and over 280 by 1968.Over much the same period, until 1964, farm wages increased only a few indexpoints. A change in minimum wage law in 1965 boosted farm wages, and since
then the wage index has been around 140.
59. Actual prices bear out the relatively high cost of tractors. Jan-uary, 1972 price, fob Manila for a 116 hp six-cylinder wheel tractor isquoted at about f 130,000, a 75 h. p., four-cylinder wheel tractor, about
g 99,500, and a 39 h.p. three-cylinder diesel tractor, about V 38,000.' Ata January, 1972 exchange rate of about ? 6.5 to a dollar, the prices wouldbe around $20,000, $15,300 and $5,800, respectively, which are considerablyhigher than prevailing international prices. The tractor price in relationto farm wage has obviously become increasingly a disincentive over the last
decade for farmers to invest in tractors.
60. Using BAEcon 1963 survey as a basis, and adding to it tractors soldsince then (1966-1971, AMDP sales record, 1964-1965, estimated), and allowingretirement of old tractors, Philippines should have about 8,000 to 9,000 handtractors and 11,000 to 13,000 large tractors in service at present (Table 12).Circumstances mentioned above do not promise rapid mechanization. The largetractors are used mainly by plantation owners and custom service operators.
Increase of hand tractors depends heavily on availability of credit. Threshercustom services may expand as rice double cropping increases.
Recommendations for Improvement
61. Reducing Weather Risks. First of all, the Philippines need to makea greater effort to stabilize its rice production environment. This can beaccomplished by: (a) expansion of new irrigated areas; (b) improvement of
farm level irrigation efficiency and reliability of existing systems throughan expanded and better planned rehabilitation program; (c) incorporatingdrainage improvement in new and rehabilitation projects; (d) correspondingreduction of rainfed paddy area; and (e) controlled retirement of uplandrice on steep slopes.
62. Another way of reducing crop risks, in the Philippines' context, isto adjust the crop calendar to avoid maximum damages. Current extensionmaterial gives the rice planting calendar in different regions (Table 13),but which reflects current practices rather than recommended planting time
for obtaining highest yield. It, however, makes reference to experimentsconducted by IRRI in Los Banos and Malagayan which showed that solar radia-tion during the last 45 days before harvest is positively correlated wLthgrain yield, and recommended that planting times be adjusted so that thecrop ripens in months with the highest solar radiation. It recommended thatin climatic type of Central Luzon (old climatic Type I), a 130-day varietyis best seeded in January so that it can be harvested at the end of Aprilor early May when the solar radiation is the highest, and in the wet season,in mid-July, so that flowering will not fall during August and September when
the typhoon trequency is high. inese are good examples ot extension intorma-tion that can help to increase rice yields substantially without additional

ANNEX 6Page 18
production costs. Based on applied research data again from Central Luzon,extension directives for 1973 wet season rainfed paddy emphasized thatplanting should be done in the first week of July so that flowering andripening will not be exposed to dry period beginning late September.
63. Such experiments and recommendations, however, are not availablefor regions other than Central Luzon and the part of Southern Tagalog Regionon the Luzon Island. In fact, other regions, where there are more monthswith high rainfall, rainy days and frequency of typhoon, need such informa-tion more urgently. It is recommended that a research program be organizedto produce a rice crop calendar for different regions. A desk study of theclimatic data may first be made to determine the crop growth stages inrelation to the rainfall and solar radiation distribution patterns accordingto farmers' current planting schedule. Monthly rainfall and rainy day datafor 48 stations are available at the Philippine Weather Bureau, with standarddeviations already computed (1951-70). Detailed typhoon data are availableat the Typhoon Committee Secretariat, Weather Bureau. Planting date fieldexperiments should be carried out in different regions for several years todetermine effects of weather on the growth of rice plants at different stagesand the final yield. Table 14 shows the wide variation of monthly rainfalldistribution and typhoon frequency of different regions, and why a fitting ofcrop calendar to the climatic regimes is needed. This is especially importantfor extension of HYV's on the vast rainfed paddy area to replace the tradi-tional varieties with a longer grower season. Farmers over the years haveprobably found out the best calendar for traditional varieties, which aremostly photosensitive. With HYV's, a study of the adjustment of calendarfor achieving highest yield is deemed necessary. It may also help to expanddouble-cropping on rainfed paddy.
64. Reducing Losses Due to Cropping Hazards. As mentioned before, thereal hope of reducing rice crop losses from pests and weeds is research whichis investigating HYV's with resistance to a wide range of insects and diseases,and leading to reduced costs of herbicide application (to $2.5 to $5.0 perhectare). Over the next five to seven years, or however long it takes torelease the new phase HYV's, some effective means must be found in the mean-time. Basic measures would likely be applicable even after the new phaseHYV's become available.
65. In view of the small farmer's reluctance to use chemicals -- areluctance that stems mainly from cost -- the most efficient measure islikely to be elimination of the causes which tend to keep insect, diseaseand weed populations at high levels at the beginning of the crop seasons.This has to do with the practice of off-season planting by some farmers. Atraveller observes rice that is in nursery, that is being transplanted,flowering, ripening, and being harvested at the same time. This has becomemore prevalent since the extension of the nonphotosensitive HYV's. There isa narrower period within which most farmers plant and harvest, but sufficientoff-season planting is being made to make it increasingly noticeable. Theoff-season planting is reportedly done by big and small farmers who want toavoid depressed price during the peak harvest season, and by large farmerswho want to even out seasonal work distribution of hired laborers.
ANNEX 6Page 19
66. The spread of the planting and harvesting time favors continuousbreeding of insects and diseases by the ever presence of rice plants at: astage of growth that is ideal for pest infestation; thus pest population aremaintained at high levels the year round, making the overall pest controlmore expensive and difficult. The practice favors rat population increasesby providing food and hideouts the year round. And it makes the operationof irrigation systems less economical by having to supply scattered paichesduring the off-season, and by making it difficult-for NIA to keep a clear-cutschedule of closing canals for annual maintenance.
67. The pros and cons need to be weighed. Off-season planting offerscertain advantages for the more knowledgeable farmer. Better price is 'themain one. Also, producers sometimes make deliberate efforts to stretch outthe growing season so that processing can be made more economical -- thePhilippines' own sugar industry is an example. But in the context of thePhilippines' current effort to increase rice production, it is questionablewhether the economic gain to a few farmers, mostly large operators shouldbe made at the expense of the national pest and rat control program, andgood maintenance of the national irrigation system. On the other hand,removal of the off-season planting would further peak the harvesting season,thus putting more pressure on the price of paddy at that time. The magnitudeof possible effects on farm incomes should be assessed, and weighed in thebalance. Possible improvements in the rice marketing system should also beconsidered.
68. Since it is difficult to dictate planting and harvesting seasonsto farmers, the possibility of getting quasivoluntary compliance should beexplored. A plausible approach might be to formulate a project wherebyextension workers would explain to the off-season planters the implicationsof their practices, which they probably do not realize and, secondly, toinsist that they do thorough pest control and rat baiting in off-seasonfields. This will protect their own crop and other farmers as well. Sincethe off-season planters are mostly large farmers, they should be able toafford the inputs. This will help to lower the pest and rat population whenthe majority of farmers start their next crop. The experience at a 1,600 haNIA system (Padada system, Davao del'Sur) is relevant. When the ratinfestation was extremely heavy, the APC officer got the NIA engineer toenforce strict water delivery and closing schedules, got the off-seasonplanters to follow the schedule, and all farmers to carry out a rat baitingcampaign in 1969/70. The paddy yield more than doubled in the next year.In the long run, planting and harvesting season on irrigated paddies shouldbe narrowed at least to the extent that NIA can enforce strict water releaseand maintenance schedules. NIA may consider extra high water charges forirrigation after a certain date.
69. Direct attacks on the weed population must also be made. Theearly application of 2-4 D should be put into wide field trials as soon asIRRI feels it is ready. Suppliers could be asked to contribute to the costof such trials. Since weeds are usually the worst on irrigated land whichhas suffered a dry spell, trials on the higher lands in a system should bring

ANNEX 6Page 20
more impressive results. On rainfed paddy, where weeds are always bad, thelay of the land is less important. But land preparation is a factor. Ifthe rainfed farmers do not want to buy 2-4 D, they should be advised to doa more thorough land preparation so as to reduce the initial weed populationwhich compete with the young rice plants. Straight line transplanting shouldbe further extended to facilitate farmers walking into the field for herbicideapplication or to do weeding by hand tools. In extremely weedy areas, handweeding campaigns should be carried out to check further building up of weedpopulation and spreading to neighboring areas.
70. Use of Fertilizers On Irrigated Land. The reasons often cited toexplain why farmers do not use more fertilizers on fertilizer-responsive HYV'sare the increased fertilizer prices which followed the peso devaluation andthe lack of credit. Analysis shows the price relationship is not the soledeterent. The IRRI (Barker et al) estimated that when the price of paddy isat f 0.36/kg, and price of N is assumed at three levels (f 1.40, V 1.75 andf 2.10 per kg), the economic application rate of N on irrigated HYV's arerespectively 80 kg, 70 kg, and 60 kg (Figure 1). The current price of paddyis about Y 0.68 per kg and N is about f 1.50/kg. Even assuming a paddy priceof J 0.36/kg, it is economical to use 60 kg of N at f 1.50/kg. This range60-80 kg N per ha is what DANR is recommending for lowland paddy.
71. NFAC is launching a campaign for using the recommended rate of Nfertilizer application on 100,000 ha in 1973. Because of risks, intensivecampaigns aimed at usage rates of 60-100 kg should be pushed only on landwhere risk is smallest, i.e. where irrigation and drainage are best. Exten-sion officers do not usually know where such land exists; but the local NIAand ISU project engineers would know. These lands can be demarcated tobecome project areas for campaign to encourage full application of fertilizers,pesticides, and herbicides at recommended levels. Moreover, since currentfertilizer recommendations are made for different soil series, the extensionworkers can be more effective by consulting the local soil surveyers of theBureau of Soils. They will also need to coordinate the supply of inputs.Such intensive campaigns need to begin in small areas but expand over aperiod of a few years. This would be a positive step beyond dispensingminikits and demonstrations. When these nuclei of high input-high outputare established, farmers in surrounding areas will follow suit at perhapslower input levels, but at levels higher than at present.
72. Such campaign programs fit well into NFAC's working pattern, andeach extension officer should be given a substantive large area where farmersactually adopt farm inputs according to full recommendations.
73. To Stabilize Upland Rice Culture. For upland rice, adopting soilconservation practices on gently sloped land is recommended. Control measuresshould be adopted to stop further cultivation of upland rice on land steeperthan 180 slope, which is the limit of "alienable land".

ANNEX 6
Page 21
74. Seed Program. It is recommended that the goal for certified riceseed production under the Japanese loan project be reduced considerably so
that the Government or the private seed growers will not be left with hugeundisposable seed stock due to resistance from farmers to pay premium prices.
The Outlook for Future Production
75. If the irrigation and drainage improvement progresses as projected(summarized in Table 15), the use of slope land is placed under tighter controland soil conservation program, and cultural improvements as recommended aboveare initiated, the rice production in the Philippines may be expected tochange as follows:
1972 1975 1980Index Index Index
Total land used (ha) 2,314,000 100 2,223,000 96 2,020,000 87Total rice harvested (ha) 3,113,000 100 3,051,000 98 2,901,000 83Average yield (kg/ha) 1,652 100 2,074 126 2,501 151Total production (MT) 5,141,000 100 6,329,000 123 7,256,000 141
Details are given in Tables 16, 17 and 18.
76. The projection varies from Philippines' Four-Year Plan targets
as follows:
Four-Year Plan Mission
1,000 MT 1,000 MT
1972 5,343 5,141 /11975 6,982 6,3291980 - 7,256
/1 See Table 18.
77. The mission estimate is based on the following assumptions:
Area Change:
1. Rice harvested area on irrigated land will exceed 1972 byabout 282,000 ha in 1975 1/ and about 644,000 ha by 1980.
2. Rice harvested area on rainfed lowland will decrease from
1972 by corresponding area.
1/ Delay in completing the Upper Pampanga Project would reduce thisestimate and thus make self-sufficiency in rice by 1975 unlikely.

ANNEX 6
Page 22
3. There will be a reduction of lowland used for rice culture,about 29,000 by 1975 and about 82,000 ha by 1980. The totallowland harvested area remains unchanged in spite of the
reduction of land area used because of expansion of double-cropping on irrigated lowland. The lowland so released can
be diverted to other crops. These should be land with light
textured soils.
4. The upland rice area will decrease by about 62,000 by 1975and about 210,000 ha by 1980, as a result of land use controland soil conservation program. The released land should notbe replaced by other annual crops, but should be used forreforestation, pasture, or perennial crops with soil conserva-
tion practices.
Yield Change:
1. Average yield of HYV's on irrigated lowland paddy will in-crease from the present level of 2,875 kg/ha (about 66 cavans)to 3,036 kg/ha (69 cavans) by 1975 and 3,159 kg/ha (72 cavans)by 1980. The moderate increase by 1975 is based on theexpectation of some increased use of fertilizers and herbicides,reduction of areas planted to tungro susceptible varieties,
small increase in area of better controlled irrigated landfollowing the completion of the Upper Pampanga and Cotabato
projects, and rehabilitation of Angat and Magat project areas
being processed by ADB. The further HYV yield increaseprojected for 1980 is based on wider application of fertilizersand chemicals, the possible availability of the "new phaseHYV's" mentioned above and further improvement of irrigation.
2. Average yield of HYV's on rainfed lowland paddy will increasefrom the present level of 1,760 kg/ha (about 40 cavans) to1,848 kg (42 cavans) by 1975 and 1,980 kg/ha (45 cavans) by1980. The projected increase is based on the expectation ofadoption of high-input cultural practices by increasing numberof farmers. No increase in average yield is projected fortraditional varieties on lowland paddy or on upland.
3. The more significant increase in the nation's average yieldis expected to come largely from expansion of irrigated area,reduction of rainfed area and upland rice, and continuousincrease in yield of HYV on both irrigated and rainfed lowland.
78. When the new phase HYV's are made available, the average yield on
irrigated land can actually go higher than hereby projected. It is kept lowto accommodate possible continuous lags in improvement of irrigation, exten-
sion service credit and other agricultural services.

ANNEX 6Appendix 1
Page 1
PHILIPPINES
AGRICULTURAL SECTOR SURVEY
Government Organization: Annual Crops Production Programs
1. The Department of Agriculture and Natural Resources (DANR) isresponsible for the Nation's crop production programs, but it does notpossess full authority over all components needed for their successful im-plementation. DANR has fairly good cooperation from outside agencies onresearch on rice, corn and feed grains. It exercises nominal supervisionover sugar research. Until late 1972, extension, the most important link,was not under DANR. DANR used coordinating councils for promoting its keyannual crop programs. The field operation lacked clear line of command.Extension was divided, understaffed and weak. Excepting HYV's seeds, imuchavailable research findings have not reached average farmers in general.Only recently the Agricultural Productivity Commission returned to DANR tobecome once more the Bureau of Agricultural Extension. This should enableDANR to streamline the extension service throughout the Island.
Research
2. DANR's agencies conducting crop research included the Bureau ofPlant Industry (BPI) and the Bureau of Soils (BS). The former was in chargeof works on varietal improvement, seed multiplication, plant protection,
agricultural engineering, and laboratory services on crops. The latter wasin charge of soil survey, fertilizer experiments and demonstrations, soilresearches and laboratory services on soils. By the end of 1972, the Bureauof Soils was absorbed to become a part of the Bureau of Plant Industry.DANR exercises only administrative supervision over the Philippine Sugar
Institute (PHILSUGIN) whose research branch is in charge of sugarcane andsugar research, and Philippines Tobacco Administration (PTA) and PhilippinesVirginia Tobacco Administration (PVTA) which are intended to conduct someresearch on tobacco in cooperation with BPI.
3. Outside of DANR, there are public and private agencies conductingresearch on annual crops.
A. Under the National Institute of Science and Technology (MIST),there are two agencies whose work include crop research: The Food andNutrition Research Council (FNRC) and the Agricultural Research Center (ARC).
B. Eighteen universities and agricultural colleges are doing someaspects of agricultural research as well. Most prominent is the Universityof the Philippines College of Agriculture (UPCA), which actively conducts
ANNEX 6Appendix 1
Page 2
a wide range of crop research. The Mindanao Institute of Technology (MIT)has developed a downy mildew resistant synthetic corn variety. Othercolleges of agriculture carry limited research activities.
C. A number of private firms have their own crop research programs.Examples are:
(a) Victorias Milling Corporation, Negros Occidental -sugarcane and sugar.
(b) Canlubang Sugar Estate, Laguna, Luzon - sugarcane.
(c) San Miguel Corporation, Quezon City - feed grains.
(d) Shell Chemicals, Manila - fertilizers and pesticides.
(e) Planters Products, Manila - fertilizers and pesticides.
D. Last but not least, the International Rice Research Institute
(IRRI) at Los Banos.
4. DANR, however, has good cooperation from the main research agen-cies in pooling of research information, cooperation in conducting regionaltrial, and use of manpower. UPCA professors play active and important rolesin DANR's food crop production programs. DANR however, leaves the sugarresearch almost entirely to PHILSUGIN, as it derives its budget fromlevies in sugar industry and has its own board of directors controlled bythe sugar industry. PTA and PVTA actually do very little tobacco research.DANR's own tobacco research is also limited at present.
5. Under Presidential Administrative Order No. 267, a NationalAgricultural Research System Survey Technical Panel was created to recom-mend an overall program of agricultural research in the Philippines. Adopt-ing the recommendation of the Panel, the Government created a PhilippineCouncil for Agricultural Research to link with NSDB, DANR and universitiesand colleges and to serve as the main arm of the Government in planning,coordinating and implementing a national agricultural research program.
Extension
6. Until recently, authority of extension service officially waswith the Agricultural Productivity Commission (APC). APC was formerlyBureau of Agricultural Extension of DANR. It assumed the name of APC andwas placed under the Presidential Office on August 8, 1963. The separationwas unfortunate. Many short-comings in the crop extension programs asmanifested today could be traced to the lack of clear-cut line command atthe field level. Para 7 through 20 summarize problems faced by the extensionservice which led to the recent reorganization as mentioned in para 1.

ANNEX 6
Appendix 1
Page 3
7. BPI has five technical divisions at the headquarters: ResearchLaboratory Service, Agricultural Engineering, Seed Production and PlantPropagation, and Plant Protection. It has 10 regional offices, 65 provin-cial offices, and 27 experiment stations and seed farms scattered acrossthe country. The experiment stations have research workers. The regionaland provincial offices have extension specialists of different fields.Under each Province, there are on average some 20 municipalities; undereach municipality, an average of some 20 barrios. At present, BPI fieldstaff stops practically at the provincial level.
8. APC has 10 divisions at its headquarters, three of which arerelated in part to crop production: Agricultural Program Division, Specia-lists Service Division, and Information Division. The Specialists ServiceDivision is responsible for:
(1) Conducting demonstrations and applied research;
(2) Analyzing farm and home survey;
(3) Providing technical advices on subject matters;
(4) Proposing field studies for research to be conductedby research agencies.
(5) Representing the Commission in different technicalcommittees and meetings relative to subject matters.
9. But APC covers all fields in addition to crops, i.e. agriculture,livestock, fishery, forestry, home management, 4-H clubs, forestry cropsand others. It had as of May 1972 24 specialists. Of the 24, there wasonly one specialist for each of the following broad fields, field crops,horticulture, soils/fertilizers, agricultural engineering. APC howeverreaches down further in the field than BPI. It has 9 regional offices, and65 provincial offices. It has one farm management technical (mostly collegegraduates) in each of the 1,400 municipalities. In addition to croptechnical extension, their work covers livestock, fisheries, organizationof co-operatives, helping farmers to prepare farm plans for loan application,etc.
10. If the BPI and APC are in perfect coordination, the two couldform an effective network through which information on crop productioncould be passed to farmers. Unfortunately, this is not the case. Havingto cover all fields of extension, APC has spread its available man-powertoo thin. There are some 2.5 million farm families in the Philippines.Each of APC farm management technician have to supervize an average of1,500 farm families. With the widely diversified work, they actually1cannotserve any one job thoroughly.

ANNEX 6
Appendix 1
Page 4
11. Thus, the Department of Agrarian Reform (DAR) contends that APCcannot serve the urgent need of tenants turning new lease holders or landowners in the agrarian reform areas. It created a Farm Management Bureau,hires Farm Management Technicians of its own to work at the municipal level,and has plans to further expand. BPI also hopes to expand staff so thatit too may have one officer in each municipality. Philippines does needmore municipal and barrio level extension workers, even more than thosecontemplated by DAR and BPI. But to have extension officers under 3 differ-ent lines of command working in the same municipality does not serve well.They will confuse farmers. They may duplicate efforts or even compete insome fields, but leave services void in others, resulting in uneconomic useof the limited man-power available.
DANR's Remedy - NFAC
12. Facing the reality that it does not have full authority over everyaspect of crop production, DANR created a Rice and Corn Production Coordina-tion Council (RCPCC) to coordinate the activities of various agencies onrice and corn production. RCPCC was reorganized into the National Food andAgricultural Council (NFAC) with expanded functions. The Secretary of DANRserves as chairman, with all relevant agencies represented on the Council,including interalia, irrigation agencies (NIA, ISU), agencies with extensionstaff (APC, DAR) financing agency (ACA, PNB, DBP) marketing agency (RCA),food and nutrition agency (FURC), and the DANR's own BPI, BS, BAEcon, Bureauof Animal Husbandry, Bureau of Fisheries.
13. NFAC now sponsors 7 major national programs:
(a) Rice;
(b) White Corn;
(c) Feed Programs;
(1) yellow corn(2) sorghum(3) soybean
(d) Vegetables and beans;
(e) Fish;
(f) Animal protein foods;
(g) Nutrition.
14. The NFAC programs are implemented only in "priority provinces."Each program has its own priority provinces. Extra man-power and monetaryinput are chanelled into the NFAC program areas; the latter as appropriationsto NFAC over and above the regular budgets of the participating agencies.
ANNEX 6Appendix 1Page 5
15. To carry out its tasks, NFAC has a sizeable technical staff atits headquarters which is housed in the DANR building at Quezon City.The day to day operations are handled by an Executive Director and twoDeputy Executive Directors. The two deputy directors serves concurrentlyas National Coordinator for rice program (a former BPI senior officer) andfor white corn and feed grain program (a UPCA professor). Each of them isassisted by an action officer. The vegetable and beans program is headed byan action officer. They are assisted by 4 divisions: Administration,Program management, Manpower and Special operations.
16. At the regional level, each program has a regional director,.All the regional directors of NFAC programs are either existing BPI or APCregional directors. In order to seek balance between the two agencies,NFAC appoints a BPI man as rice program regional director and an APC manas corn and feed grain program regional director, or vice versa.
17. At the provincial level, each NFAC program has a provincial programofficer. In 32 provinces, the provincial government appoint their own agri-cultural officer to that title, in other provinces where NFAC programs arelaunched, BPI or APC men are appointed program officers.
18. At the municipal level, the APC farm management technician servethe NFAC program.
19. Such program organization pattern is a compromise adjusting tothe reality. There are obvious problems. If the regional officer fo!r theNFAC program in a given region is the Director of the BPI regional office,he can command directly his own staff, but he must go through the APCregional director to mobilize the APC staff, and vice versa. This alsoapplies to NFAC provincial program officers. Then, at the municipal level,there is only the APC farm management technician who has to attend to allNFAC program works and other APC works as well.
20. Officers of all agencies lack vehicles. NFAC provides "incentiveallowance" to enable them to travel a bit more and provides loans for themto buy their own motorcycles.
Recommendations for Improvement
21. The return of APC to DANR was effected only recently. DANR hasyet to realign the working relationship between the new Bureau of AgriculturalExtension (BAE), the expanded BPI and NFAC, to solve the problem of under-staffing and immobility of the extension force at the municipal and barriolevels and to strengthen training activities all across the board.
22. The staff of the BAE should be expanded in quantity, quality andmobility. The crop production extension function of the Farm ManagementBureau of the Department of Agrarian Reform should be absorbed by the BAE.Numbers of Farm Management Technicians at the Municipal level should be

ANNEX 6
Appendix 1Page 6
increased to the extent that each will supervise on average no more than
three barrios, or 1,000 ha of farm land. This would average six techniciansto a municipality, allowing some specialization among them. Field officersat all levels should be provided with adequate transportation facilities.
23. The publication of extension information is now scattered amongdifferent agencies. The BAE at present does not have enough extensionspecialists to prepare all the needed material. Under the present set-up,the publication intended for farmers should best be coordinated by NFAC,prepared by BPI and UPCA, edited, serialized and issued by BAE. Technicalbulletins and field manuals intended for extension officers should be pre-pared by BPI/UPCA or other colleges as seen fit by NFAC.
24. Consideration should be given to gradually turning the functionsof implementing the different field programs presently assumed by NFAC overto BPI/BAE/BAEcon, as these agencies are systematically strengthened. Inother words, NFAC should gradually work itself out of routine jobs. In theend, NFAC may well be transformed into a smaller but highly competent groupof specialists, to become a brain-trust body of DANR for planning, coordina-
tion and development of new programs and approaches as discussed in thisreport and its various annexes. Its scope of functions need not be limitedto crop production, but may cover other agricultural sub-sectors as well.

ANNEX 6Table 1
PHILIPPINES
AGRICULTURAL SECTOR SURVEY
Table 1. Rice Production Statistics, All Philippines,
1954-1972 1/
Crop Harvest Yield ProductionYear Area (Paddy) (Paddy)
'000 ha Cavan/ha Kg/ha m tons
1954/55 2,656 27.4 1,206 3,202
195/6 2,743 27.1 1,191 3,273
1956/57 2,768 27.5 1,210 3,346
1957/58 3,154 23.1 1,016 3,203
1958/59 3,329 25.2 1,101 3,68L
1959/60 3,306 25.7 1,131 3,739
1960/61 3,198 26.3 1,157 3,704
1961/62 3,179 28.0 1,232 3,910
1962/63 3,161 28.5 1,254 3,967
1963/64 3,088 28.3 1,245 3,842
1964/65 3,200 28.4 1,248 3,992
1965/66 3,109 29.8 1,310 4,073
1966/67 3,096 30.1 1,322 4,09b
1967/68 3,304 31.4 1,380 4,561
1968/69 3,332 30.3 1,334 4,445
1969/70 3,113 28.3 1,681 5,233
1970/71 3,113 39.0 1,716 5,343
1971/72 2/ 3,184 36.7 1,615 5,142
1/ Source: BAEcon
2/ BAEcon forecast

ANNEX 6Table 2
PHILIPPINES
AGRICULTURAL SECTOR SURVEY
Table 2. Official Statistics of Rice Harvested Area on
Irrigated and Rainfed Paddy and Upland Rice
(A) (B) (C) (D) (E) (F)a/c/ /c/ a/c/ a/ b/ a/c/
Irrigated Rainfed Total TotalCrop Year Lowland Lowland Upland Total Lowland Rainfed
(A) + (B) (B) + (C)----------------------------------- (1,000 ha)-------------------------------------
1961/62 987 1,510 682 3,179 2,497 2,192
1962/63 1,014 1,450 697 3,161 2,464 2,147
1963/64 930 1,531 627 3,088 2,461 2,158
1964/65 1,053 1,514 623 3,200 2,567 2,147
1965/66 960 1,544 605 3,109 2,504 2,149
1966/67 1,171 1,080 4b5 3,096 2,651 1,925
1967/68 1,309 1,514 481 3,304 2,823 1,995
1968/69 1,483 1,406 443 3,332 2,889 1,849
1969/70 1,346 1,355 412 3,113 2,701 1,767
Sources:
a/ BAEcon data
b/ Computed from ABEcon data
c/ Mission believes that there are actually only about 900,000 ha of rice underirrigation in 1970/71 (Annex 3), and irrigated lowland area (A) is overestimatedthroughout the above sequence, the area of rainfed lowland (B), upland (C), andtotal rainfed (F) are probably underestimated.

ANNEX 6Table 3
PHILIPPINES
AGRICULTURAL SECTOR SURVEY
Table 3. Area Changes of Major Upland Field Crops
Upland Upland Total ofRice Corn Rice & Corn Sugarcane 3 Crops-------------------------- 1,000 ha-------------------------------
1961/62 682 2,016 2,698 224 2,922
1962/63 697 1,950 2,647 244 2,891
1963/64 627 1,898 2,525 292 2,817
1964/65 623 1,923 2,546 327 2,873
1965/66 605 2,106 2,711 310 3,021
1966/67 Ub5 2,158 2,603 286 2,889
1967/68 481 2,248 2,729 294 3,026
1968/69 443 2,256 2,699 313 3,012
1969/70 412 2,420 2,832 350 3,182
1970/71 2,392 422
Source: BAEcon

ANNEX 6Table 4
PHILIPPINES
AGRICULTURAL SECTOR SURVEY
Table 4. Rice HYV, Area and Yield
Number ofProvinces under NFAC Average
Crop Year Extension Programs Area Yield'000 ha Cavan/ha
1966/67 10 1 100
1967/68 12 390 75
1968/69 15 606 72
1969/70 - 928 69
1970/71 64 1,200 66
Source: Rice Production Program, 1971/72, NFAC.

PHILIPPINES
AGRICULTURAL SECTOR SURVEY
Table 5. Rice Balance Sheet for 1971/72
In Terms of Rice In Terms of PaddyItem Millions of sacks '000 MT '000 Cavans '000 MT
56 kg/sack 44 kg/cavan
1. Requirement 74.0 4,144 139,623 6,143
a. Food allowance 62.8 a/ 3,517 118,490 5,213b. Feeds 4.1 b/ 229 7,736 340c. Wastage 2.0 c/ 112 3,774 166d. Seeds 1.5 d/ 84 2,830 125e. Buffer 3.6 e/ 202 6,792 299
2. Supply 74.0 4,144 139,623 6,143
a. Import expectedAugust 1971 1.7 95 3,208 141
b. Import to benegotiated 3.6 202 6,792 299
c. Production, 1970/71level 64.h 3,606 121,430 5,343
d. Increment needed 4.3 241 8,193 360
a/ 38,930,000 population, at 1.613 sacks/caput (roughly 90 kg)b/ At 6% of requirementc/ At 3% of productiond/ At 0.9 sacks of hh kg paddy per ha - 3.12 million hae/ Requirement for food allowance for 21 days supply C
So eSource: Rice Production Program, 1971/72, NFAC.

PHILIPPINES
AGRICULTURAL SECTOR SURVEY
Table 6. Rice Extension Target of the NFAC Program, 1971-1972
No. of Provinces Irrigatedb/ July-Dec.- Jan.-June Total YieldRegion Under Program Area 1971 1972 Area per ha Production
ha ha ha ha cavan '000 ha '000 cavans
Ilocos 3 64,493 37,900 19,100 57,000 84 4,788 210.7Cagayan Valley 3 117,837 6O,OO 30,000 90,000 76 6,84o 301.0Central Luzon 7 399,021 223,300 117,700 335,000 69 23,115 1,017.1S. Tagalog 7 77,069 74,700 37,300 112,000 73 8,176 359.7Bicap 3 44,905 36,600 18,400 55,000 68 3,740 164.6W. Visayas 6 76,054 76,60c 38,400 115,000 73 8,370 368.3E. Visayas 3 36,004 45,o40o/ 22,600 68,000 78 5,281 232.4N. & E. Mindanao 5 26,637 31,900 16,100 48,000 86 4,128 181.6W. & W. Mindanao 6 84,019 79,900 40,100 120,000 88 10,560 464.6
Total 43 926,039 666,300 333,700 1,000,000 75 74,998 3,300.0
Source: Rice Production Program, 1971/72, NFAC
a/ The grouping of provinces of NFAC's original tables differ somewhat from the standard regional grouping.Above tables give figures after readjustment to conform with standard regions have been made.
b/ BAEcon statistics give the total irrigated area of Philippines as 1,345,730 ha, of which the NFAC Programcovers only a part. But the 926,039 ha of irrigated area is close to mission's estimate of about 900,000 ha.
c/ Where the July-December crop area exceeds the irrigated area, it means some HYV's will be grown on rainfedpaddy, where rainfall distribution is even.

ANNEX 6Table 7
PHILIPPINES
AGRICULTURAL SECTOR SURVEY
Table 7. Estimated Input and Credit Requirementof the NFAC Rice Program, 1971/72
Input Unit Quantity Valueer ha Toa Unit cost Total
'000 init 11 million
Seeds Cavan 1.2 1,200 40 48.o
FertilizersAnimosul Bag - 45 kg 5,807 18 104.5
(20-0-0) VariesAminophos Bag - 45 kg 1,950 25 49.2
(16-20-0) withComplete Bag - 45 kg 1,903 30 57.1
(12-24-12) Region
Subtotal Bag - 45 kg 9,660 210.8
PesticidesGamma BHC (6%) kg 83 55,302 1.6 88.5Sevin 85 w kg 3 1,999 26.4 52.8Methyl Parathion liter 1 666 15.5 10.3
Subtotal kg or liter 151.6
Total Input 363.4
Credit
July-December Crop 8C% of area 9700 373.1January-June Crop 50% of area 9700 116.8
Total 489.9
Source: Rice Production Program, 1971/72, NFAC. Original data have b reakdownby season, by province and by region.

PHILIPPINES
AGRICULTURE SECTOR SURVEY
Table 8. Comparison of Improved Seed Board Recommended Rice Varieties(releasea since 1966, except FK before 1966), 1971
CHARACTER FPI-76 (NS) C4-630 C4-137 IR8 IR5 IR20 FK-178A IR22 IR24 BPI-121-407 C-12
Plant
jetght (cm) 115 105 115 90 110 85 150 100 90 85 115
Maturity (day) 125-135 125-135 130-140 125-135 140-150 120-130 120-150 115-130 125-130 125-135 125-135
Reactio,, to Non- Non- Non- Non- Non- Weakly Sensitive Weakly Non- Non- Non-Photoperlod sensitive sensitive sensitive sensitive sensitive sensitive sensitive sensitive sensitive sensitive
Position of leavs Slightly Erect Semi-erect Erect Erect Erect Drooping Erect Erect Erect Semi-erectat harveat drooping
Tillering ability Medium Medium Medium High High High Medium low High High High Mediumhigh high high high
Seedling vigor Good Very good Very good Excellent Excellent Excellent Good Excellent Good
Iodging Moderately Resistant Resistant Very Resistant Moderately Moderately Resistant Resistant Resistant Moderatelyresistant revistant resistant resistant resistant
Blast Moderately Moderately Moderately Resistant Inter- Resistant Resistant Resistant Resistant Moderately Moderatelyresistant Tesistsnt resistant mediate resistant resistant
Bacterial leaf Inter- Inter- Moderately Inter- Inter- Inter- Moderately Moderately Inter- Moderately Inter-
blight mediate mediate susceptible mediate mediate mediate resistant resistant mediate resistant mediate
Tungro Inter- Resistant Resistant Susceptible Inter- Resistant Inter- Susceptible - - Resistantmediate mediate mediate
Grain
Axylose content Tnter- Inter. Moderately High High High High LoW - Inter-mediate mediate high mediate
Gelatinization Inter- Inter- - LOW Inter. Inter- Low - * Hightemperature mediate mediate mediate mediate
Head rice Inter- High High LOW High High High High High High Highrecovery mediate
Grain size and Medium Long Long Long Medium Medium Medium Long Long - Me.iumgroup Special Special Special Ordinary Ordinary Special Special Special Special Special
Grain Dormaxcy(weeks) 3 to 4 3 to 4 3 to 4 3 to 4 3 to 4 3 to4 - 3 - - -
Eating Quality Excellent Excellent Excellent Fair Fair Good Very good Good Good Good Excellent
Source of Data: "The Philippines Recomends for Rice" 1970, NFAC

Annex 6PHILIPPINES Table 9
AGRICULTURE SECTOR SURVEY
Table 9. Fertilizer Recommendations for Lowland Rice 1/
Bureau of Soils, The International Rice Research Institute and College of AgricultureUniversity of the Philippines
KILOGRAMS NUTRIENTS PER HECTARE: N +.0 + K,0
PROVINCE IR 22 C4-63G, C463, IR 20, IR 5 Local Varkt and(Arranged by Priority Category and by thre IR 8 C4-137, BPI-76 INS) Varioti. FK-178A
fertility groupingr within each S E A SO NPriority). Wetfrred Wat fry Dry
________________________________ wet___ IriaeWtirrigated Irrigated
I. FIRST PRIORITY PROVINCES (16) S,il Series withResearch Results
Cagayan Quingua, Uminga, Toran 8( 50+0 100+50+0 60+50+0 80+50+0 40+50(')+0Carmarines Sur Pili 80+30+0 100+30+C 60+30+0 80+30+0 40+30+0Laguna Guadalupe 80+30+0 100+30+0 60+30+0 80+30+0 40t30+0 20 + 0 + 0
M1aahas 80+0-0 100+0+0 60+0+0 80+0+0 40#0+0Nueva Vizcava Quingua, San Manuel. Bantog, Maligaya 80+30+0 100+30+0 60+30+0 80+30+0 40t30+0Pampanga Quingua. LaPaz,Angeles, San Fernando, Arayat SO+30+0 100+30+0 60+30+0 80+30+0 40+30+0
Albay 80+30+0 to 30 100+30-0 to 30 60+30+0 to 30 80+30+0 to 30 4a+30+0 to 30Bulacan Quingua 80+30+0 to 30 100+30+0 to 30 60+30+U to 30 SO+30+0 to 30 40+30+0 to 30
Bigaj, Buenavista Prensa 80+50+0 to 30 100+50+0 to 30 60+50+0 to 30 80+50+0 to 30 40*50+0 to 30Sibul 80+50+30 100+50+30 60+30+0 80+30+0 463 0+0
Isabela Sta. Rita 80+30+0 10030+0 4,0+30+0 80+30+0 40+30+0Bago, Cauayan 80+50+30 100+50+30 60+50+30 80+50+30 40+50+30 20 + 0 + 0
Nueva Ecija Quingua,Umingan,Maligaya, Bantog 80+30+0 100+30+0 (0+30+0 80+30+0 40+30+0Annan, Prensa 80-t50+30 100+50+30 60+50+30 80+50+30 4 ,50+30
Pangasinan San.Manuel.Umingan,Annan. San Fabian 80+30+0 100+30+0 60+30+0 80+30+0 4 f30+0Alaminos 80+50+30 100+50*30 60+50+30 80+50+30 40+50+30
Tarlac San Manucl.La Paz, Luisita, Angeles, 80+30+30 100+30430 (,0+30+30 80+30+30 40+30+30 20 +0 + 0Tarlac 80+50+30 100+50+30 0o50+30 80+50+30 46+30+30
Bataan, Cotabato and South Cotabato. Mindoro Oriental 80+30+0 100+30+0 60+30+0 80+30+0 40+30+0 20 +0 + 0
Iloilo, Leyte and Southern Leyte 80*30+30 100+30 30 60+30+30 SO+30+30 40+30+30 20 + 0 + 0
II.- SECOND PRIORITY PROVINCES (23)
Batangas. Bukidnon. Cavite, Davao del Sur. Ilocos Norte.Ilocos Sur. La Union. Queron. Sub-Province Aurora. Rizal. 80+30+0 100+30+0 60+30+0 80+30+0 40+30+0 20 + 0 + 0Sor-,ogon. Zainbales. Zanboanea del Norte. Zamboanga
del Sur
Camarines Norte. Lanao del Norte, Lanao del Sur 80+30+0 to 30 100+30+0 to 30 100+300 to 30 80+30+0 to 30 40+30+0 to 30 20 + 0 + 0
Akan. Antique. Leyte det Sur. Mii%amis Occidental 80H 30+30 100+30+30 60+30130 S0+30+30 40+30+30 20 + 0+0Negros Occidental
III. THIRD PRIORITY PROVINCES (24)
Abra. Agusan. Bontoc, Davao del Norte, DaaoOriental. Ifupio. Kalinga-Apiyao. Mlarindqiic.Mindoro Occidental. Samar Eastern. Sainar Northern. 80*30+0 100+30+0 60+30+0 80+30+0 40+30+0 20 + 0 + 0Samar Western, Sulu, Surigano del Norte. Surigao delSur.
Bohol. Capiz, Catanduanes. Cebu. Mlashale.isanis Oriental. Negros Oriental. Palawian 80+30+30 100+30+30 00+30+30 80+30+30 40+30+30 20 f 0 + 0
P.omblon.
V The new recommend high%vielJg vanrriic ar more responsive to nitrwsen fertilization than Aoal surietia. Ge,7lly.riere,,iids rk-re to urirgenfertili:orim during thie dry tun in the
%et s0solt
AU or half of the trogen needed. all f the phoj,sjlute and a!l potesh shoutj be applii before tnspLring ond hamn . Tkm7he rliniani nitro,"-n is applied at unii!cle iniliation.

PHILIPPINES
AGRICULTURAL SECTOR SURVEY
Table 10. Number of Farms in Sample Barrios Reported Using Tractors,by Horsepower and by Region, 1967
R E G I 0 NHorse Northern iSouthern & o o\Power Iloces Cagayan Central Southern Bicol Eastern Western eastern WesternOrou Phil. Reiion Valley Luzon Tagalog Region Visayas Visyas Mindanae MindanaeAll HP.Group 5,252 11 363 2,122 1,100 311 7 517 5 815
1 12 12 - -
2 31 11 -
3 44 41 3
4 136 5 123 6 2
5 63 46 14 3 -
6 404 10 3 271 96 19 5
7 226 1 23 25 10 167
8 105 6 13 22 54
9 34 11 7 16
10-14 160 7 13 89 14 37
15-19 61 32 24 5
20-39 307 20 181 36 35 30 5
40-59 1,349 148 234 115 79 7 80 186
60-79 1,046 33 902 35 - 6 70
80-99 717 707 - I - 40
Unknown 5147 1 108 5 28 38 106 5
Source: BAEcon, sample survey of 1,930 barrios, 97,000 farm household.

PHILIPPINES
AGRICULTURAL SECTOR SURVEY
Table 11. Number of Farms in Sample Barrios Reported Using PowerThreshers, by Size of Farm and Region
R E G I 0 NNorthern & Southern &
IlQcos Cagayan Central Southern Bicol Eastern Western Eastern WesternSize of Farm Region Valley Luzon _Tagalg Region Visayas Visyas Mindanao Mindanao
All size group 926 11,102 522 42 258 228
Below 0.6 ha. 21 h79 39 9 3 21
0.6 - 0.9 ha. 125 10 7 11 18
1.0 - 1.4 185 1,441 92 5 47 72
1.5 - 1.9 4 99 1,453 55 3 26 42
2.0 - 2.9 269 3,614 144 4 60 2
3.0 - 3.9 179 2,012 69 - 48 S0
4.0 - 4.9 79 1,077 35 1 29 1
5.0 - 9.9 75 832 72 1 19 1
10.0- 14.9 8 47 4 - 12
15.0 -19.9 3 19 1 1 2
20.0 -over 8 3 1 1 2
Source: BAEcon, sanple survey of 1,930 barrios, 97,000 farm household.

ANNEX 6Table 12
PHILIPPINES
AGRICULTURAL SECTOR SURVEY
Table 12. Estimated Number of Tractors in Philippines
Year Hand Tractors Large Tractors(below 15 HP)
1963 (BAEcon Survey) - 5,300
1964 (Estimated) 100 700
1965 (Estimated) 500 700
(AMDP Sales Record Rounded from Figure 2)
1966 1,900 700
1967 2,900 1,500
1968 1,800 1,500
1969 1,000 1,400
1970 500 1,200
1971 500 (estimate) 1,100 (record)
Total 9,200 14,100
Estimated number retired 600 1,400
Estimated number in service 8,600 12,700
Source: BAEcon and Agricultural Machinery Distributors Association of thePhilippines.

PHILIPPINESANNIEX 6
AGRICULTURE SECTOR SURVEY Table 13
Table 13. Rice Planting Calendar in Philippines, by Regions and Provinces
PALAGAD CROP PALAGAD CROP
RMION II REGULAR CROP (Secondary Crop) RMION VI REGULAR CROP (Secondary Crop)
1. Abra June . August January - March 1. Albay May - July December - January2. Ilocos Norte May - September November - February 2. Catanduanes October - December May - July3. Ilocos Sur May September November - January 3. Camnarines Norte October - January May - July4. La Union June - August October - February 4. Camarines Sur July - October November - January5. Mountain Province June - July April -June6. Benguet June - July 5. Masbate May - July October - December7. Ifugoo June.- July 6. Sorsogon November - January June - July
*8. Pangasinan June - September January - Feliruary
RMION III RMl011 VII
1. Batanes None May - June 1. Aklan April - September October - February2. Cagayan 2. Antique May - August November - January
a. Northwestern June - September January - February 3. Capiz April - July October - Januaryb. Northeastern July - October December - January 4. Iloilo Juae- September December - Januaryc. Southern July - September May - August 5. Negros Occidental May - August September - October
3. Isabela August - October Mary - April4. Nueva Vizcaya July - September February - March5. Kalinga - Apayao July - December February - June RMION VIII
REION IV .1. Bohol May - June December - January
1. Bataan June - August January - February August - September
2. Bulacan June - July January - February 2. Cebu June - August November - December
November - December 3. Leyte del Norte
3. Nueva Ecija June - September January - February a. Eastern portion June - July November - December
4. Pampania May - August November - February b. Western portion November - December June - July4.opema r - buary 4. Leyte del Sur November -December June - July
5. Tariae May - August January - February 5. Negros Oriental May - September November - January
October - November 6. Samr, Northern November - December June - July'
6. Zambales June - September January - March 7. Samar, Western June - July November - December
7. Aurora Sub-province August - October March - April 8. Samar, Eastern November - December June - July
REION V
1. Batangas May - August December - February RMION IX2. Cavite July - Auivust February - April 1. Lanao del Norte May - July January - March3. Laguna January - February January - May September - October
July - September September - December 2. Lanao del Sur May - July January - March4. Ma3rinduqoe May - July December - January September - October5. Mindero Ori-ntal June - August December - January 3. Misamis Occidental May - June November - December6. Mindoro Occidental June - August December - January 4. Misvmniis Oriental June - August December - January7. Palawin June - August N o no S. Bukidnon June - September N o n e8. Ouezon September - December Febru,ry - July 6. Sulu April9. Rizal July - September February - April July - August
February - March 7. Zamboanga del Norte June - August December - January10. Romblon June - July November - Decernber 8. Zamboanga del Sur June - August December - January
R1 ION X
1. Agusan October - December April - MayJuly - August
2. North Colabiato June - July September - October3. South Cot;:J ito June - July Septemiher - October4. Sumiar intdel Norte Novcmbr - Decembor Jume - July5. Swrij.D 0A :'Vur Novcmibcr - Decemtmer Junn - JulyG.. oeew Orrltal Ju; - AngiA Decewter - Januay7. Davao dei rfi te Jumn - Auynt December - January8. O;vao del ,mr June - Au.just Detember - Jz!onry
Source: "The Philippines Recommends for Rice" 1970, NFAC

PILIPPINES
AGRICULTURAL SECTR SURVEY
Table 14. Variation of Rainfall Pattern & Typhoon Frequency
jammary Mebruary march April L July Auasgt Beptar October a r December Total H
CENTRAL LCZONRainfall (m) Cabanatuan 5.8 11.4 17.2 44.7 148.0 267.6 272.4 394.2 317.9 149.5 130.6 46.4 1,805.7
Rainy day, Cabanatuan 2 2 3 4 12 17 20 24 22 12 10 6 134
Typhoon Center 0 0 0 0 2 3 1 4 2 3 5 1 21
CAGAYA4 VALLEYRainfall (m), Aparri 148.3 88.8 39.7 41.0 86.3 183.3 201.8 259.3 306.9 331.6 409.0 224.0 2,320.0
Rainy day, Aparri 15 11 7 5 8 13 12 15 16 18 20 19 159
Typhoon Center. Batanes 0 0 0 0 3 5 12 14 17 2 4 2 59
BICOL
Rainfall (m). Legaspi 301.6 176.2 207.6 172.7 182.2 205.4 229.9 282.9 247.3 307.3 478.3 466.3 3,257.7
Rainy day, Legaspi 22 17 17 17 14 15 19 20 20 20 21 23 225
Typhoon Center 1 1 0 0 3 3 2 2 4 7 12 6 39
W. VISAYAS
Rainfall (m) 111l City 42.0 21.0 33.7 38.6 137.7 258.7 280.1 332.9 242.6 212.9 184.0 95.4 1,879.6
Rainy day, Iloilo City 8 6 6 5 12 18 19 20 19 17 15 12 157
Typhoon Center 2 0 3 2 5 4 2 1 0 5 16 9 49
E. VISAYASRainfall (m) Cebu City 100.3 70.3 53.9 58.3 114.8 178.2 208.7 189.5 178.1 191.1 161.9 133.3 1,638.4
Rainy day, Cebu City 13 11 11 8 12 16 18 17 16 20 15 15 172
Typhoon Center 2 0 3 2 5 4 2 1 0 5 16 9 49
S,W. MINDANAORainfall (m) Davao 124.7 109.9 86.0 139.6 226.0 162.2 195.5 153.0 171.5 171.3 149.9 114.7 1,804.3
Rainy day, Davao 13 12 11 12 18 17 17 15 15 15 14 14 173
Typhoon Center 0 0 0 0 0 0 0 0 0 1 0 1 2
Source of Data: Extracted from Tables 4 and 8 of Annex 1.
Rainfall and Rainy day data are normala,1951-70 average. Typhoon Center frequencyis total of 23 years, 1948-70.

PHILIPPINES
AGRICULTURAL SECTOR SURVEY
Table 15. Projected Irrigated Area, 1975 & 1980
As of January, 1972 Projection, 1975 Projection, 1980
Region Potential Crop Area Actually Irrigated Potential Crop Area Irrigated Potential Crop Area IrrigatedIrrigable Regular Palagad Irrigable Regular Palagad irrigable Regular PalagadArea Crop Crop Total Area Crop Crop Total Area Crop Crop Total
I. City of Manilla - - - - - .
11. Ilocos 82,866 52,828 18,415 71,243 94,814 62,503 26,307 88,810 112,062 76,153 36,035 112,188(63.8%) (22.2%) (65.9%) (27.7%) (68.0%) (32.2)
III. Cagayang Valley 128,721 85,437 43,012 128,449 138,570 94,233 47,457 141,690 152,019 105,729 57,630 163,359(66.4%) (33.4%) (68.0%) (34.2%) (69.5%) (37.9%)
IV. Central Luzon 387,685 253,670 97,168 350,838 428,700 285,517 140,560 426,077 467,315 315,564 188,880 504,444(65.4%) (25.1%) (66.6%) (32.8%) (67.5%) (40.4%)
V. S. Tagalog 102,003 64,801 26,195 90,996 115,278 76,747 32,171 108,918 129,453 89,368 44,579 133,947(63.5%) (25.7%) (66.6%) (27.9%) (69.0%) (34.4%)
VI. Bicol 45,937 27,434 12,867 40,301 53.291 35,136 15,960 51,096 64,785 45,943 21,040 66,983(59.7%) (28.0%) (65.9%) (29.9%) (70.9%) (32.5%)
VII. W. Visayas 93,469 66,143 20,845 86,988 111,227 82,576 28,745 111,321 125,185 96,159 40,821 136,980(70.8%) (22.3%) (74.2%) (25.8%) (76.8%) (32.6%)
VII.E. Visayas 25,409 17,638 7,436 25,074 42,449 34,023 14,894 48,917 58,289 49,508 21,776 71,284(69.4%) (29.3%) (80.2%) (35.1%) (84.9%) (36.3%)
IX. N.E. Mindanao 42,586 26,943 12,293 39,236 55,500 39,972 17,822 57,794 89,914 69,126 33,671 102,797(63.3%) (28.9%) (72.0%) (32.1%) (76.9%) (37.4%)
X. S.W. Mindanao 49,831 34,934 15,692 50,626 78,163 61,338 28,249 89,587 120,705 98,450 55,627 154,077(70.1%) (31.5%) (78.5%) (36.1%) (81.6%) (46.1%)
PHILIPPINES 958,507 629,828 253,923 883,751 1,117,992 772,045 352,165 1,124,210 1,319,727 946,000 500,059 1,446,059(65.7%) (26.5%) (69.1%) (31.5%) (71.7%) (37.9%)
(DuSource: Annex 3, Table 6

PHILIPPINESCO]
AGRICULTURAL SECTOR SURVEY oa"
Table 16A: Projected Change of Rice Land Composition
19 7 21J 175 1980
Land Type Zegular Palagad Total Regular Palagad Total Regular Palagad TotalCrop rop Crop Crop Crop Orop
Ha Ha Ha Ha Ha Ha Ha Ha Ha
Lowland
Irrigated 630,000 254,000 884,000 799,000 367,000 1,166,000 999,000 29,000 1,528,000Rainfed 2/ 1,272,000 545,000 1,817,000 1,074,000 461,000 1,535,000 821,000 352,000 1,173,000
Subtotal (1,902,000) (799,000) (2,70?,000 (1,873,000) (828,000) (2,701,000)(1,820,000) (881,000) (2,701,000)
Up1and 412,000 - 412,000 350,000 - 350,000 200,000 - 200,000
Total 2,314,000 799,000 3,113,000 2,223,000 828,000 3,051,000 2,020,000 881,000 2,901,000
Table 16B: Ddfference from 1972
Lowland
Irrigated +169,000 +113,000 +282,000 369,000 275,000 644,000Rainfed -198,000 - 84,000 -282,000 -;:51,000 -193,000 -6)4,000
Subtotal - 29,000 + 29,000 ( - ) - 82,000, + 82,000 ( - )
Upland - 62,000 - - 62,000 -299,000 + 82,000 -212,000
Total - 91,000 + 29,000 - 62,000 -299,000 + 82,000 -212,000
Based an Table 17 and 18.Assumed 30% rainfed lowland rice harvested area are from the Palagad crop, mostly in Regions with even rainfalldistribution.
3/ Area used by the regular crop represent the land area for rice culture.

PHILIPPINES
AGRICULTURAL SECTOR SURVEY
Table 1?. Approximated Present Composition of Rice Land
Total rice Lowland Rice Areaharvested
Area Upland Rice Area Total Area Irrigated RainfedHa. Ha. % of (1) Ha. % of (1) Ha. % of (4) Ha. % of (4)(1) (2) (3) (4) (5) (6) (7) (8) (9)
V. Ilocos 144,820 5,080 3.5 139,740 96.5 71,543 51.0 68,497 49.0
IV. Cagayan Valley 314,040 8,050 2.6 305,990 97.4 128,443 42.0 177,541 58.0
IV. Central Luzon 634,750 11,080 1.8 623,670 98.2 350,838 62.4 272,832 37.6
V. S. Tagalog 345,370 88,180 25.5 257,190 74.5 90,996 35.4 166,194 64.6
VI. Bicol 357,960 84,550 23.6 273,410 76.4 40,301 14.7 233,109 85.3
VII. W. Visayas 397,810 36,850 9.3 360,960 90.7 86,987 24.1 273,972 75.9
VIII. E. Visayas 256,580 19,420 5.4 237,160 94.6 25,074 10.6 212,086 89.4
IX. NE Mindanao 194,330 52,920 27.2 141,410 72.8 39,236 27.7 102,204 72.3
X. SW Mindanao 467,780 105,950 22.6 361,830 77.4 50,626 14.0 311,204 86.0
PHILIPPINES 3,113,440 412,080 13.2 2,701,360 86.8 884,044 32.7 1,817,609 67.3
Source:
(1) (2) (h) BAEcon data for 1970
(6) To the sums of regular crop and palagad crop area under first column of Annex 3 Table 6.O 0

PHILIPPINES D,z
AGRICULTURAL SECTOR SURVEY oX
Table 18. Projected Rice Harvested Area, Yield & Paddy Production, 1975 & 1980
1972 1975 1980 -,Area- Yield/Ha Production Area Yield/Ha- Production Area Yield/Ha-" Production
Variety Ha Cavan Kg 1,000 MT Ha Cavan Kg 1,000 MT Ha Cavan Kg 1,000 MT
Lowland 2/ 1Irrigated HYV 884,000 662 2,875 2,541 1,166,0001/ 69 3,036 3,540 1,528,000-/ 72 3,159 4,827
3/ 2/ 2/Rainfed HYV 317,000 40- 1,760 558 1,074,0002 42 1,848 1,985 1,100,000.7 45 1,980 2,187
Traditional 1,500,000 26- 1,144 1,716 461,000- 26 1,144 527 73,000- 26 1,144 84
Upland Traditional 412,000 184 792 326 350,000 18 792 277 200,0003/ 18 792 158
TOTAL 3,113,000 38 1,652 5,1415/ 3,051,000 47 2,074 6,329 2,901,000 57 2,501 7,256
Source of Data 1972 1975 19801/ Table 16A. Total rainfed lowland 1/ Annex 3, Table 5. 1/ Annex 3, Table 5.
area is 1,817,609 ha. NFAC re-ported total HYV area of 1971 is 2/ Assume total rainfed lowland rice 2/ Assume total rainfed lowland rice
1,200,000 ha. Assuming irrigated area is reduced by 282,000 ha, area is reduced further by 362,000area is all HYV, leaving 317,609 equal to expansion of irrigated ha, equal to expansion of irrigated
ha on rainfed lowland, area. HYV's on rainfed lowland area. HYV's expanded further to2/ NFAC Annual Report, 1970/71. expanded to 70% of area by 1975. 94% of rainfed lowland.3/ Computed from 1/, 2/, 4/ and 5/. 3/ Yield on irrigated land increases 3/ Upland rice is reduced to 200,000
4/ RCPCC (Predecessor of NFAC) data by 3 cavans remain and HYV on ha.
average 1961/62 through 1965/66 rainfed lowland increases by 2 4/ HYV yield on irrigated lowland in-
is 17.9 cavan. No improvement cavans over 1972. Yield of tra- creased to 72 cavans per ha and on
is assumed. ditional varieties remain un- rainfed lowland to 45 cavans per ha.
5/ BAEC on February, 1972 forecast, changed.

PHILIPPINES
AGRICULTURAL SECTOR SURVEY
4000
3500 -
; 3000 -Price of N/kg
A P1.40B 1.75
c C 2.10
2500 -
I II I
2000
I I- -I I
00 T0 30 60 90 120 150
Elemental nitrogen (kg/ha)
Figure 1: VARIABILITY IN OPTIMUM LEVEL OF NITROGEN AND PALAY
YIELD LEVEL DUE TO CHANGES IN THE FERTILIZER PRICE.(PRICE OF PALAY = P0.36/KG)
Source: "The Impact of Devaluation on Fertilizer Use and Profitability inPhilippine Rice Production", a paper presented for a seminar onMay 21, 1970, by Barker, et al., IRRI.
World Bank - 7226


PHILIPPINES
AGRICULTURAL SECTOR SURVEY
4800
4400 - Total 4W tractors &power tillers sold
4000 -
3600 -
3200 - Total power tillers sold
2800 * 0 ./ + (floating exchangeE rate - Feb. 1970)
2400 /
2000(1st CB, IBRD credit 06% Total 4W tractorsline - Apr. 1966) sold
1600
1200 -
800 (n O*I(2nd CB: IBRD credit
400 No loans released for tractors line - Sep, 1969)& power tillers (CB IBRD
0 I I11966 '67 '68 '69 '70
Year
Figure 2: SALES OF FARM MACHINERY, 1966-70
Source: Sales data from Agricultural Machinery Dealers Association, Manila; CB:IBRD data fromDepartment of Rural Banks, Central Bank of the Philippines.
World Bank - 7227


PHILIPPINES
AGRICULTURAL SECTOR SURVEY
280 I280 -Floating
00000exchange rate- Tractors F eb. 1970
240 - Durable equipment
WVork animals end of progressive0d revaluation
200 1959 -
Farm labor
t.*
160 *
100,120changes in
. - -- - d minimumwage law
80-
1956 'S7 '58 '59 '60 '61 '62 '63 '64 '65 '66 '67 '68 *69 70
Figure 3: PRICE TRENDS OF SELECTED FACTORS IN FARM PRODUCTION,1956-70
Source: Adopted from Annual Research Review Agricultural Economics, Februery 21-25, 19?2, fRR(,Based on data from Cristina M. Crisastomo, "Sources of Output Growth in PhilippineAgriculture, 1948-1968", M.A. Thesis, University of the Philippines, 1972.
World Bank - 7228


zоНн��
� А�г� а�и zНд�С
О и аН W С7U 7W Н ди rs. wа w,д�С� Н Г� +w н А
Н а �
��
Н Оа' Uд
г�
ЬСWZzб


ANNEX 7
Page 1
PHILIPPINES
AGRICULTURAL SECTOR SURVEY
CORN AND FEED GRAIN PRODUCTION
TABLE OF CONTENTS
Page No.
Corn Production .........................................
Past TrendsA. Area ........................................ ...B. Yield ................................................... 2
C. Production ......................................... **** 3D. Consumption ......................................... *** 4
Four-Year Production Plan and Target .......................... 4
NFAC Corn ProgramA. Program Targets ......................................... 4B. Performance of hYV's Extension .......................... 6
C. Work Items of NFAC Corn Program Related to Production ... 7
Supply of 'Major Inputs
Improve Seeds ............................................... 12
Fertilizers ............................. i****ize************ 14
Pesticides, Herbicides and Farm Machinery.................... 15
Recommendations for Improvement................................ 15
Outlook of Future Production................................... 19
Sorghum Production .............................................. 21
Introduction .................................................. 21
Present Productionand NFAC Production Targets ................ 21Research .................................................... . 22
Extension and Training ........................................ 25
Supply of Major Inputs ........................................ 26
Recommendations for Improvement ............................... 26
Soybean Production ........................................ 7
Introduction .................................................. 27Past Trends of Production and Demand .......................... 28
Four-Year Plan Targets ........................................ 29NFAC Soybean Program ...................................... 29Research ........................................... ****rch.*.* 1Extension, Training and Information ........................... 32
Recommendations for Improvement ............................... 33
Production outlook ............................................ 35

ANNEX 7Page 2
Tables:
1. Corn Production Statistics, All Philippines2. Corn Area Harvested by Region3. Corn Yields by Region
4. Corn Production by Region5. Corn (Shelled) Production by Variety and by Region
6. Characteristics of Seedboard Varieties of Yellow and White Corn
7. Maize Responses to Nitrogen at the 45 kg/ha Level8. Maize Yield Response to Nitrogen
9. Corn-Seed Production Targets
10. Corn-Planting Calendar11. Corn . Projections of Area, Production and Yield
12. Corn and Sorghum Estimated Consumption13. Sorghum - Area, Production, Yield by Regions
14. Soybeans - Area by Region15. Soybeans Production by Region
16. Average Yield per hectare by Region17. Raw Soybean Imports18. Soybean - Characteristics of Extension Varieties19. Soybean - Estimated Requirement

ANNEX 7
Page 1
PHILIPPINES
AGRICULTURAL SECTOR SURVEY
CORN AND FEED GRAIN PRODUCTION
Corn Production
1. The Philippines currently produces about 2 million MT of corn a
year on 2.4 million harvested hectares. The average yield is only about0.8 MT/ha. About 90% of the production is white corn, used mainly for food,and 10% is yellow corn, used mainly for feed. Recent rapid expansion oflarge modern poultry and pig industries caused a strong demand for yellowcorn. About 250,000 MT of yellow corn is being imported to meet the deficit
in CY 1972.
2. The Government corn program concentrates on extension of HYV's inselected provinces. Two HYV's for white corn, which are resistant to downymildew disease, have recently become available. Similar varieties foryellow corn are expected in 1972/73. About 13% of the total corn area isnow planted to HYV's. Few small farmers are applying fertilizer, insecticide,or herbicide. Corn culture is almost entirely rainfed and by traditionalpractices. Excessive moisture during harvesting and planting contributes tolow yield and depresses farm prices.
3. Few farmers could afford to buy and use fertilizers and otherchemicals at the present low yield conditions. It is proposed that theGovernment will need to develop measures that will raise basic yields with-out added cost, before farmers will be able to invest money in inputs. Suchmeasures include (a) development of disease-resistant HYV's for yellow corn;(b) providing certified seeds with good quality at planting time; (c) con-ducting experiments on new HYV's with the short growing period; and (d) adjust-ing planting and harvesting periods to avoid harvest in heavy rain months
whenever feasible. These measures (a and b have already begun) should helpraise farmers' basic yields to over 2 MT/ha. When this threshold is reached,farmers probably will start using fertilizers and insecticides. Furtheryield increases, resulting from these innovations, will stimulate farmers touse more chemicals and attain even higher yields. The mission projects esti-mates Philippines' corn production at about 2.6 million MT by 1974/75. Thiswill still be short of requirements by about 200,000 MT of yellow corn. By1979/80, corn production could reach nearly 4 million MT, harvested from areduced area and at a national average yield of about 2 MT/ha. This quantitywill be sufficient to meet all requirements.
Past Trend of Area, Yield and Production
A. Area
4. The Philippines grows both white and yellow corn. The harvestedarea stayed below 2.1 million ha until 1964/65. Since 1965/66 it has risen

ANNEX 7Page 2
steadily and reached 2.4 million ha by 1969/70 (Table 1). The expansion is
especially rapid in 5 regions: four grow mainly white corn - the CagayanValley, Western Visayas, SW and NE Mindanao; one grows mainly yellow corn -S. Tagalog.
5. There has been a shifting of land used for growing corn to poor
areas in some regions in the last decade. Corn has been and still is mainlygrown on the plain, on flat lowlands with light textured soils, in the drierseason after rice. On gently undulating upland, it is grown in both seasonsor even in 3 crops. Corn is also grown on rolling land, hill and mountainsides. Sugarcane has expanded by some 200,000 ha during the last decade,replacing corn and upland rice from some undulating and rolling land. Onthe other hand, corn has expanded onto steeper slopes of hills and mountainsafter logging and "Kaingin" 1/. The area of Kaingin crops shifts after afew years of planting, leaving the land behind to cogon grass or secondarybush. Moreover, an undetermined but extensive area of corn is being grownunder coconut trees, especially in SW Mindanao.
6. Region-wise, SW Mindanao now has nearly 40% of the nation's cornarea. The Mindanao Island has 50%. The Visayas had 47% in 1956/57. In
1970/71, its share dropped to 26%. In Eastern Visayas, the center of thecorn eating population of the Philippines, corn area has actually droppeddue to soil erosion after continuously planting on slope land over many
years. The region now imports corn from other regions, especiallyMindanao. The Cagayan Valley is the main white corn and S. Tagalog themain yellow corn producing area on the Island of Luzon (Table 2). Season-wise, some corn is planted in each month in all regions, but information onmonthly distribution of area planted is not available.
B. Yield
7. The national average yield of corn in the Philippines was onlyabout 0.5 MT per ha in the fifties. It was above 0.6 MT in the early sixties,reached 0.7 MT in the late sixties and has exceeded 0.8 MT per ha since thestart of seventies (Table 3). The present yield, however, is still extremelylow. Thailand, for instance, is producing 2 MT/ha.
8. The low yield of corn in the Philippines is attributable to thefollowing:
(a) corn growing is entirely rainfed;
(b) practically no fertilizer (except on large plantations)nor pesticides are applied and losses from insects anddiseases are heavy;
1/ Kaingin means cut and burn clearing of land.

ANNEX 7
Page 3
(c) heavy and frequent rains during the harvesting seasonof the first crop and the planting season of the secondcrop (between August and November) occur in most regions;
(d) high frequency of typhoon and low solar radiation;
(e) corn grown on slopeland and under coconut trees has lowyields;
(f) as of 1971/72, the current Seedboard extension varieties
occupy only about 12% of the total white corn area, and20% of the yellow corn area as shown below. The earlierextension varieties were open pollinated or hybrids. The
hybrids degenerated after the seed supply program stopped(see para 26). The current extension HYV's are allsynthetic varieties. Until recently, all seedboard
varieties were susceptible to downy mildew.
Total Area HYV's Area %1,000 ha 1,000 ha
White corn 2,100 246 12Yellow corn 240 49 20Total 2,340 295 13
(g) loss after harvest is high, especially that of the firstcrop, due to frequent rains and lack of drying facilities.Farmers are forced to sell corn as soon as it is harvestedto middlemen in order to avoid even more severe losses.
C. Production
9. Production increased from around 900,000 MT in 1955/56 to about2 million MT in recent years (Table 4), as a result of expansion in area and
a little yield improvement. Region-wise, white corn production dominatesin the Cagayan Valley, the Visayas and Mindanao. Yellow corn predominatesS. Tagalog. In Ilocos, Central Luzon and Bicol, more white corn is produced,
but yellow corn has a respectable share (Table 5).
10. The share of yellow corn production has dropped from 26% of totalcorn production before 1967/68 to 10% in recent years. This trend is ex-pected to continue in the immediate future. Because of the earlier releaseof downy mildew resistant white corn varieties, its average yield is expectedto improve more rapidly than that of yellow corn for the next few years.
11. The rapid expansion of modern large scale poultry and pig farmingin the Philippines in recent years has greatly increased the demand foryellow corn. With the release of downy mildew resistant varieties, theyellow corn crop can be expected to increase. The Philippines has thecapacity to meet all domestic requirement for corn.

ANNEX 7Page 4
D. Consumption
12. White corn is mainly consumed as food. About 20% of Philippines'population use corn as a staple food in form of grits. In Eastern Visayasand parts of Mindanao, corn is eaten more than rice by rich and poor. Inother white corn producing regions, corn grits are consumed by the poor asa supplement to rice. Both white and yellow corn-on-the-cob are eaten inall regions. About 6-8% of the current white corn production is consumedby the starch, glucose and other industries (Annex 10).
13. Corn is the chief feed grain of the Philippines. It comes in 3forms: (a) by-product feed from milling of white corn for grits, equal toabout 30% of the grain weight; (b) surplus white corn; and (c) the entirecrop of yellow corn, minus corn-on-the-cob consumption. Estimates ofdifferent categories of consumption are given in Table 12.
Four-Year Production Plan and Target
14. The current four-year plan sets the following targets for cornproduction:
Year 1,000 MT
1971/72 2,2921972/73 2,4341973/74 2,5821974/75 2,736
Annual average growth rate = 7.2%
15. The proposed main strategies of the plan include extending HYV'sand complementary packages of inputs, enlarging the share of yellow cornin total production, and establishing adequate storage and processing facili-ties.
16. The 4-year plan provides no goals for area and yield nor regionalbreakdowns. This information is provided in the NFAC Feed Grains and WhiteCorn Program, which includes white corn, yellow corn and sorghum.
NFAC Corn Program
A. Program Targets
17. The NFAC Corn Program, like its Rice Program, centers on theextension of HYV's. The physical targets for 1971/72 to 1973/74 aresummarized below. Those for later years are being added annually by NFAC,but are not yet available.

ANNEX 7Page 5
1971/72 1972/73 1973/74Area Prod. Yield Area Prod. Yield Area Prod. Yield
Crop/Provinces 1,000 ha 1,000 MT Kg/ha 1,000 ha 1,000 MT Kg/ha 1,000 ha 1,000 MT Kg/ha
White Corn
Programmed 596 940 1,578 596 1,063 1,784 596 1,185 1,989Unprogrammed 1,600 1,095 684 1,600 1,095 684 1,600 1,095 684Total 2,196 2,035 929 2,196 2,158 980 2,196 2,280 1,037
Yellow Corn
Programmed 101 161 1,607 101 183 1,824 101 220 2,195Unprogrammed 140 96 684 140 96 684 140 96 684Total 241 257 1,068 241 279 1,163 241 316 1,317
All Corn
Programmed 697 1,101 1,578 697 1,246 1,787 697 1,439 2,064Unprogrammed 1,740 1,191 684 1,740 1,191 684 1,740 1,191 684Total 2,437 2,292 941 2,437 2,427 996 2,437 2,586 1,060
18. The targets include a constant corn area at 2,437,000 ha, the currentlevel. Furthermore, target areas for white and yellow corn are also held atcurrent levels. In other words, NFAC's targeted areas are pegged at theircurrent levels, but these targets do not separate the HYV's from the tradi-tional varieties.
19. In "programmed" provinces, NFAC plans extra support in terms ofpersonnel and budget, program coordination and data grathering for the ex-tension of HYV's. For instance, the "programmed" area of white corn is keptat 596,000 ha throughout the four years, but an increasing share of it willbe in HYV's. Initially, the program does not set targets for HYV extensionfor the four years. Annual targets are worked out each year before planting.
20. In "unprogrammed" provinces, NFAC makes no additional inputs avail-able and programmes a low yield of 12 cavans (684 Kg) per ha. In fact, thereare two kinds of "unprogrammed" provinces. In some, HYV's are being extendedby the routine provincial extension program of BPI and APC. NFAC follows thearea, production and yield of HYV's and traditional varieties and reportsthem in its annual report. In these "unprogrammed" provinces, therefo re,HYV's can also be expected to expand though at a slower rate than the"programmed" provinces. In other "unprogrammed" provinces where no HYV'sare grown, NFAC makes no report. These provinces will maintain the low yieldof 12 cavans/ha.

ANNEX 7Page 6
B. Performance of HYV's Extension
21. Performance of HYV extension in 1970/71 and 1971/72 under the NFACprogram is summarized below:
1970/71a 1971/72aArea Production Yield Area Production Yield
1,000 ha 1,000 MT Kg/ha 1,000 ha. 1,000 MT Kg/ha
White Corn
Programmed
Provinces 102.6 137.2 1,311 220.0 350.4 1,596
UnprogrammedProvinces 43.0 66.2 1,539 26.0 45.2 1,710
Total 145.6 203.4 1,368 246.0 395.6 1,596
Yellow Corn
ProgrammedProvinces 25.6 37.1 1,454 36.3 47.0 1,294
Unprogrammed
Provinces 21.3 31.6 1,482 12.7 11.1 872
Total 46.9 68.7 1,465 49.0 58.1 1,086
/a Unpublished tables, NFAC.
22. The white corn HYV's had expanded by about 100,000 ha in 1971/72;their average yield also attained the NFAC target for that year. The yellow
corn HYV area expanded by 10,000 ha in "programmed" provinces, but lost8,000 ha in "unprogrammed" provinces. Its yield in "unprogrammed" provincesalso suffered a serious setback in 1971/72. At the above rate, white corn
HYV's may reach 596,000 ha, the entire NFC "programmed" area, but it willcome from both the "programmed" and "unprogrammed" provinces. The expansionof yellow corn HYV's is lagging and must be stepped up.
23. The corn program faces a seed supply problem which will be dis-cussed later. Being widely planted, farmer-to-farmer HYV seed disseminationenables white corn HYV to expand more rapidly than yellow corn. Yellow cornwas further handicapped by the lack of downy-mildew resistant varieties untillate 1972.

ANNEX 7
Page 7
C. Work Items of NFAC Corn Program Related to Production
24. The NFAC program includes research, applied research, demonstration,extension, training, improvement of marketing and credit supply. Those
related to production are discussed in this chapter.
25. Research. Early corn research in the Philippines was done mainlyat the UPCA campus and the Economic Garden of BPI, both at Los Banos, LuzonIsland. More recently, three BPI stations (the Ilagan Experiment Station atIsabela, Cagayan Valley, the La Granija Experiment Station on Negros Island,Western Visayas, and the Aroman Experiment Station at Cotabato, S.W. Mindanao),and two Universities (Central Mindanao University, Musuan, Bukidnon, N.W.
Mindanao and Mindanao Institute of Technology, Cotabato, S.W. Mindanao) havejoined corn research under the UPCA Upland Crops Program. Field trials are
carried out in more stations and farmers' fields across the country. Experi-ments on fertilizer response are conducted mainly by the Bureau of Soils, butUPCA conducts a series of experiments on other aspects of fertilizer used on
corn. Each year, the corn researchers meet in Los Banos and report on theirfindings. Like rice, improved corn varieties have produced some impact onfarmers' production. Most corn growers in the Philippines have adopted veryfew other innovations. Research findings relevant to extension are summarizedbelow.
26. The Philippines started its hybrid corn program in the 1950's andsome hybrid corn varieties developed by UPCA have been released for extension.The earlier extension list also included selected open pollinated varieties.In early sixties, due to problems with hybrid corn seed multiplication andthe high price of hybrid seeds, it was decided to change to developing syn-thetics, derived from inbred lines extracted from local and foreign material.Since then, a number of synthetics of white and yellow corn have been developedand approved by the Philippine Seed Board for extension. These syntheticsare the current Seed Board corn varieties in the Philippines.
27. Until 1971, all of the Seed Board varieties were found fairlyresistant to major corn diseases except downy mildew, the most persistentcorn disease in the Philippines. When downy mildew infection is not serious,the HYV's yield 80-100 cavans shelled grain (57 Kg per cavan) per ha, comparedwith 50 to 60 cavans of traditional varieties under fertilized experimentalconditions. At the farm level, the average yield of unfertilized corn hasbeen 25 to 30 cavans per ha for HYV's compared with 10 to 20 cavans per hafor the traditional varieties.
28. The spreading of HYV's has been slow for two reasons: first, theywere susceptible to downy mildew, second, they mature in 105 to 115 dayswhile some native varieties mature in 90 days. In 1971, two downy mildewresistant white corn synthetic varieties were added to the Seed Boardvarieties, MIT-2 and DMR-2. The MIT series, first identified by the MindanaoInstitute of Technology in 1968, is now being used as a source of resistancein the on-going corn breeding program. Resistant yellow corn varieties have

ANNEX 7
Page 8
also been tested, and downy mildew resistant varieties have only been selectedin fall 1972 (Philippines DMR series). The characteristics of 8 corn SeedBoard varieties, 5 white and 3 yellow, are summarized in Table 6.
29. Aside from resistance to downy mildew, the new HYV's have shorter
growing periods. MIT-2 matures in 85-95 days (equalling early maturingnative varieties), compared with 105-115 days for the older HYV's. Althoughthe experimental yield of MIT-2 is somewhat lower, it is expected to yieldmore under field conditions.
30. With the recent selection of downy mildew resistant yellow cornvariety, the existing HYV's are adequate for NFAC to launch an extension
program and justify the modest NFAC projections made so far. When resistantyellow corn seeds are available through multiplication, expected in a coupleof years, the yellow corn yield projections can be raised to a higher level.
31. The Philippines' corn breeding program and the Seedboard varietylist also include glutinous, sweet and pop corns. Since the area planted
to them is relatively small, they will not be treated in this report.
32. Under the Bureau of Soils/UNDP Soil Fertility Survey and ResearchProject, March 1964 to March 1969, 1,340 field experiments on corn responseto fertilizer were carried out. These experiments were conducted under
rainfed conditions. Missing plants and other irregularities in experimentalplots were numerous and data from many plots had to be discarded. Finalanalysis was made from data on about 850 experiments.
33. The BS/UNDP project findings show that the major nutrient needof the maize crop in the Philippines is nitrogen. At 45 Kg N/ha, theresponse varies from a minimum of 8 Kg of shelled grain per Kg of added Nto a maximum of 30 Kg (Table 7). At levels of 45 Kg and 90 Kg N/ha, returnsfrom 100 pesos invested in nitrogen fertilizers varies from a minimum of
Y 115 to f 427 per ha (Table 8). The response of corn to phosphate was
generally much lower but high response was found on the acidic soils of
Bukidnon and the NE Mindanao Region and also on some limestone soils ofCebu and Catanduanes. The response to potash is generally negligible,except in some lime soils and some old alluvial soils in Isabela (CagayanValley) where soils are deficient in this element. Current recommendationsfor fertilizer are for application of 60 Kg of N per ha for HYV's and45 Kg for traditional varieties and no application of P2 05 and K20, except
on soils series where crop responses have been significant in experiments.
34. UPCA experiments produced the following useful information. Up
to 45 Kg N/ha can be applied at all planting time. If higher rates aredesired, split application is recommended. Superphosphate (20% P205) ismore effective than rock phosphate (30% P2 05 ). Higher response was obtained
when superphosphate was applied in plant furrows than when it was broadcast.
With rock phosphate, the manner in which it was applied made no difference.Ammonium sulfate may be mixed with soil, applied on soil surface or in

ANNEX 7
Page 9
furrow, with little difference in corn yield. Moreover, fertilizer responseand corn yield increase as plant population is increased from the conven-tional 20,000 plants per ha to 40,000 plants and 60,000 plants per ha.
35. Continuous cropping experiments with corn from 1954 to 1968 showthat (1) soil pH went down from 5.72 in 1957 to 5.33 in 1965 in plots receiv-ing 90 Kg N/ha every season; (2) calcium, magnesium, phosphorous and potassiumcontents of the soil decreased with continuous application of high rates of
nitrogen. The practical implication is that corn growers can, in most cases,use nitrogen alone at the beginning, but the need for phosphorous and potas-sium will develop later.
36. Insects attack corn in the Philippines from the beginning to the
end of the season. The important insects are:
Preplant: white grubsVery young plants: corn seedling maggots
and thripsYoung to old plants: army worms, cutworms,
locust and grasshoppersBefore and after
picking: corn borer
After ear formation: corn earworm and corn borerlarvae
Chemical control experiments have been made by UPCA and BPI. Pesticides,dosage and time of application have been worked out and included in
extension material, but very few farmers spray their corn. Losses due tocorn borer and earworm infestation is especially serious in the Philippines,
and contribute heavily to the low average yield of corn. Generally, the
loss is heavier on the wet season crop than on the dry season crop.
37. As mentioned before, downy mildew is the most serious corn diseasein the Philippines. It is estimated that at the present yield level, thisdisease together with corn borer and earworms reduce corn production in thecountry by about 50%. In other words, other things being equal, Philippines'
corn production could have been doubled had it not been for these 3 pests.Other common corn diseases in the Philippines are leaf rust, Rhizoctonia andHelminthosporium leaf spot. Minor diseases include bacterial leaf stripe,
leaf blight, corn mosaic, smut, pythium stalk and root rot. Two diseasesaffect the grain; i.e. kernel blast which cause discolored and cracked grainsand Diplodia ear rot which causes brittle grains with dense white mold betweengrains on rotting cobs.
38. Experiments with'chemical treatments for various diseases havebeen tried and recommended, but are seldom used by farmers. Fortunately,the existing HYV's are fairly resistant to rust, helminthosporium andrizoctonia diseases, and the new white corn HYV's are resistant to downymildew as well.

ANNEX 7Page 10
39. UPCA experiments with resistant nonseedboard white corn varietiesshow that resistance to downy mildew improves as plants grow older. Italso shows that the percentage of infected plants increases as planting isdelayed from May 24 to July 5. At all dates of planting, most of theinfection occurs during the first 3 weeks after germination. Hope forreducing losses from diseases lies principally with the breeding ofresistant varieties. Early planting would reduce the incidence of downymildew infection.
40. The predominant weed species in the corn fields of the Philippinesare sedges, grasses and broad leaf weeds. UPCA and BPI have conductedexperiments and made recommendations on herbicide usage but few farmersuse them. UPCA experiments show that satisfactory corn yield can beobtained if the field is kept clean for the first 7 weeks after planting.Weeds that emerge after this period will not appreciably affect corn yield.
41. The extension program for corn reportedly engages the followingnumber of field staff from various agencies for the 1971/72 program.
No. of Farm"Programmed" Specialist or Management Total
Crop Provinces Supervisor Technicians AvailableAPC BPI APC BPI
White corn 13 35 11 237 73 356
Yellow corn- 22 16 8 96 45 165
/a Including other feed grains: sorghum, soybeans, other beans.
In addition to the BPI and APC personnel listed above, UPCA assigns one ofits crop specialists to each region to assist the Regional Program Coordinatorin the applied research aspect of the program. NFAC has expressed the needfor additional Farm Management Technicians (FMT) for implementing theprogram.
42. The applied research project for corn consists mainly of variety,fertilizer and production (methods) trials on farmers' fields. In 1971/72,35 variety, 30 fertilizer and 500 production trials were conducted. In1972/73 and 1973/74, 100 more production trials are to be added. Thevariety and production trials are conducted by selected, trained FIT'sunder the supervision of the Provincial Specialist and/or supervisor.
43. The variety trials include at least 5 varieties (seedboardvarieties and promising lines in advanced tests) and at least one isconducted in each "programmed" province.

ANNEX 7Page 11
44. The production trial consists of distributing mini-kits once theacceptance of a variety is identified in the province. The mini-kits containseeds for 1 variety, fertilizer and pesticides for application at recommendedrates and detailed instruction sheets. They are distributed to farmer-leaders within the provinces through FMT's. The plots selected for plantingthe kits serve for demonstration and for an additional source of seeds.
45. The fertilizer trial is conducted by regional officers of theBureau of Soils (BS). In provinces where the BS men are not available,trained FMT's conduct the trials under supervision of the regional BSofficers or the UPCA regional crop specialists. These trials are mainlyfor demonstrating corn yield responses at the recommended rates of applica-tion.
46. Corn extension consists of conducting field method and resultdemonstrations in connection with the applied research plots mentionedabove, and is conducted in form of farmers' training classes, seminars andmeetings, individual farm visits. In some provinces, radio broadcasts arebeing used. In 1971/72, 210 selected farm leaders in 7 provinces (30 eachfrom Central Luzon and Visayas, 60 from S. Tagalog and 90 from Mindanao)were given a 1-week training course in their respective provinces.
47. All provincial program supervisors in "programmed" provinces aregiven practical training for one crop season (usually 3.5 months) at UPCAor BPI regional experiment stations. After the training, the supervisorsare qualified as specialists. All FMT's in "programmed" provinces aregiven 3-4 weeks of training in corn production, processing, marketing,credit and extension methods at UPCA, Central Mindanao University, and 2BPI stations in Cagayan Valley and Visayas.
48. BPI Seed Inspectors in "programmed" provinces are given specialtraining courses in Manila conducted by BPI and UPCA. In turn, theyreturn to their regions to give a 3-day training course to FMT's on seedprocessing, handling and certification.
49. A total of 20 supervisors, 120 FMT's and 20 seed inspectorsattended training courses in 1971/72. The training courses on corn alsoinclude training on other feed grains, sorghums and soybeans.
50. NFAC issues "Philippines Recommends for Corn 1970/71" whichsummarizes the available extension information for distribution to thefield staff and farm leaders. It also is in the process of preparingbrochures on HYV corn and certified seeds, and leaflets on HYV corn ,production and on preventing molds and diseases in stored grains. Ppstershave been published on control of downy mildew. Since January 1971 UPCAhas published a monthly issue of "Upland Crops Newsletter". Detailedcultivation directives are distributed with the mini-kits.

ANNEX 7Page 12
Supply of Major Inputs
Improved Seeds
51. NFAC recognizes that its corn program is being hampered by anacute shortage of HYV seeds in the "programmed" provinces. Although UPCAand BPI were able to produce foundation and registered seeds to targetamounts in their own stations and seed farms, the multiplication ofcertified seeds and good seeds fell seriously short of demand and targets.BPI had not been able to distribute the small amount of certified seedsit did purchase, as shown below:
1967/68 1968/69 1969/70 1970/71-------------- (cavan) ---------------
BPI purchased 2,483 275 684 254
BPI sold 133 40 337 91
BPI loaned 19 138 51 -
Total disposed 152 178 388 91
52. The price margin of r 30 to 40 per cavan for HYV certified seedsover the common grain causes reluctance by farmers in purchasing cornHYV's. The period of viability for corn seeds (also for other feed grainseeds) when in unrefrigerated storage are much shorter than paddy underwarm and highly humid conditions of rural Philippines. There is a problemin keeping the quality of the certified seed high. Secondly, the corngrowing area is more scattered and much of it is on rolling upland land,where transportation is difficult. NFAC stated that the physical environmentof the Philippines makes it expensive and impractical to transfer corn seedstocks from region to region or even province to province.
53. The BPI corn seed multiplication system - breeder, foundation,registered, certified, and good seeds - and agencies responsible for theirproduction are similar to those for rice (Annex 6). "Good seeds" arerequired to be first or second generation registered seeds, passed by seedinspectors in the field, having a minimum germination rate of 80%.
54. In addition to the general criticisms on seed programs, the SeedMission from Mississippi State University pointed out the following short-comings of the seed program for corn and other feed grains:
(a) a lack of most of the basic equipment needed for threshing,drying, processing and handling seeds by most stationsparticipating in seed production. Many of the essentialsteps are done by hand or methods that contribute todeterioration rather than minimizing it;

ANNEX 7Page 13
(b) lack of drying facilities are critical, because the propertime for harvesting corn (first crop) as far as maturityof the grain is concerned occurs in the Philippines whenthe seed is at a relatively high moisture content of about30%. Seed moisture must be reduced to safe levels 1/ soonafter harvest but weather at that time is not favorable forsun or air drying. Artificial drying of large quantitiesof seeds cannot be done without mechanical drying facilitiesand good warehouses. Most stations do not have adequatedrying facilities at all and have warehouses inadequate forseed storage.
These observations raise many questions concerning the quality of the regis-tered seeds produced by BPI's stations and concerning certified seeds producedby private seed producers.
55. NFAC has adopted the reasoning of the MSU report and made plans torenovate the corn seed program. Salient points at the certified seed levelinclude the following:
(a) In order to provide local supplies of certified and/or goodseed and to minimize inter-regional or inter-provincialshipping of corn seeds, seed co-operators are to be recruitedin municipalities in the "programmed" provinces, to supplycorn growers within the same municipalities. The seed co-operator will sign a memo of agreement with the BPI ProvinceDirector that he should follow the recommended practicespertaining to culture, harvesting, handling and drying. Thepossession of minimal facilities to properly handle the seedsand agreement to attend training courses are made requirementsfor his selection.
(b) Contrary to the target for expandion of corn HYV area, thecertified seed production target for corn has actuallybeen scaled down by NFAC from the original BPI plan toensure proper supervision and quality control, and toachieve better balance between supply and voluntary demandfrom the farmers (Table 9).
(c) As soon as the seeds are certified by BPI, the co-operatorsare encouraged to sell the seeds directly to farmers.
(d) Where FaCoMa's are active, members are urged to be seedco-operators to produce HYV seeds for distribution toother members or other farmers.
1/ 13% for grain, 8-10% for seeds.

ANNEX 7
Page 14
(e) Seed co-operators are encouraged to deposit their certifiedseeds in FaCoMa warehouses.
56. These measures were implemented for the first time in 1971/72;performance is not yet known.
57. A seed processing plant was completed in February 1972 at the BPIMaligaya Rice Research and Training Center (142 Km north of Manila) withassistance from UNDP/USAID. UNDP supplied one expert for the center andprovided 3 six-month fellowships and 1 twelve-month fellowship for trainingabroad. USAID provided design and machinery for the plant. The plant isequipped with modern facilities for drying, cleaning, grading, testing,bagging and storage of seeds, with capacity for processing 50 cavans of seedsper hour. It will serve as a pilot plant for training seed techniciansand for actually processing seeds produced by BPI, other agencies, andprivate seed producers in the nearby area. This plant is establishedmainly with upgrading of corn and feed grain seeds in mind.
58. Under the Japanese seed program loan, as mentioned in Annex 6,irrigation improvement will be made on 20 BPI stations, 11 of which will becorn stations and road improvement, on 17 BPI stations, 8 of which will becorn stations. Farm machinery will be supplied to all BPI participatingstations and four more seed processing plants will be built on 4 BPIstations, one each in Cagayan Valley, Bicol, Visayas and Mindanao to processrice, corn and other seeds. By the 5th year (1976 if work begins in 1972),the project aims to produce about 303,000 cavans per year of certified seeds,sufficient for planting about 1.2 million ha of corn or about one-half ofthe current corn harvested area in the Philippines (Table 1).
59. The scarcity of high quality HYV seeds is hampering the expansionof corn area planted to HYV's and the improvement measures adopted by NFACand BPI. Processing all seeds in the Maligaya Seed Processing Plant and the4 more plants to be built with the Japanese loans, however, seems to runcounter to NFAC's assertion that "Philippine weather conditions would renderit expensive and impractical to transfer seed stocks from region to regionor province to province". The key problem is whether the selected seedcooperators in the municipalities will be able to dry, clean and store thecertified seeds properly; if it is not feasible for their seeds to beprocessed in the above-mentioned 5 plants.
Fertilizers
60. TVA 1/ estimated that in 1968/69, about 9% of the harvested cornarea (203,049 ha out of 2,256,100 ha) used fertilizer. Based on official
1/ The Fertilizer Industry in the Philippines, TVA, 1971. Corn harvestedarea was based on BAEcon data. Area fertilized based on provincialand ACA reports, and fertilizers used based on official recommendedrates.

ANNEX 7Page 15
recommended application rates, TVA estimated that about 12,000 MT of N,6,000 MT of P205 and 3,000 MT of K 20 were applied on corn in that year.These estimates are very much on the high side because farmers who do usefertilizers use much less than the recommended rates. Philippine cornspecialists and extension officers concede that the 1970 peso devaluation hasfurther discouraged farmers from using fertilizer.
61. TVA further estimated that area of corn applying fertilizer willincrease from 27% of total corn area in 1969/70 to 45% in 1974/75, and thattotal plant nutrients required at 56 Kg N, 20 Kg P205 and 12 Kg K 20 per ha,would increase as follows:
Plant Nutrients RequiredTotal % Use Area Use N P205 K20
Year Corn Area Fertilizer Fertilizer1,000 ha % 1,000 ha 1,000 MT 1,000 MT 1,000 MT
1969/70 2,420 27 633 - - -1970/71 2,353 31 728 41 15 91971/72 2,399 34 825 46 17 101972/73 2,444 38 925 52 19 111973/74 2,490 41 1,030 58 21 131974/75 2,536 45 1,138 64 23 14
The quantity actually used will probably be much lower. A BAEcon surveyshows that, in 1969/70, corn farmers in Mindanao spent about V 9 per ha onfertilizer, or applied about 6 Kg of N at Y 1.5 per Kg. This reflects theuse of fertilizer by large growers; small farmers, like farmers in allother regions, perhaps used no fertilizer at all.
Pesticides and Farm Machinery
62. The same BAEcon survey showed Mindanao corn growers used V 3.6worth of pesticides per ha that year. Pesticides apparently were not usedin other regions.
63. Large livestock farms own their own tractors, silage harvesters,corn picker/harvesters or picker-shellers, and corn driers. Custom serviceof tractors is available to small corn growers. Some middlemen bring picker-husker or picker-shellers to farmers' field, harvest and husk corn at t.hefarm and truck ears or grains away to buyers' driers. Other farmers hitndpick, husk and shell their corn before selling to middlemen. Generally,corn is sold on the cob by weight in Mindanao and shelled by weight iniotherregions. Few farmers store their corn for the lack of storage and dryingfacilities. The number of machines used in corn production is not knon.
Recommendations for Improvement
64. Emphasis should be placed on overcoming or minimizing constraintson corn production so that farmers' basic yields may be raised without

ANNEX 7
Page 16
incurring additional outlay. After these constraints are minimized, farmerscan be expected to buy and use inputs such as fertilizers and insecticides.
Proposed improvement are shown below.
65. Bottlenecks in supplying corn HYV seed are (a) questionable
quality of certified seeds; (b) premium prices which farmers are reluctantto pay; and (c) for yellow corn, the susceptibility of existing HYV's to
downy mildew and (d) in sufficient number of seed growers.
66. The USAID and Japanese loan projects will help to improve the
quality of registered seeds produced by the BPI stations. The private seedco-operators who produce certified seeds will indirectly benefit from these
projects; i.e., by receiving better quality registered seeds for plantingand theoretically by receiving closer supervision by better trained BPI seedinspectors. The equipment which they employ to dry, process and store the
certified seeds will not be improved by the USAID and Japanese loan projects.The prospects for improving the quality of certified seed, which farmersuse for planting, remains in doubt.
67. In the Japanese seed loan project plan, BPI estimated the value of
the corn certified seeds at f 56 per cavan from year 1 through year 5. 1/This is much too high compared to the current farm price of corn at f 26per cavan and not in accord with BPI's principle that prices of certified
seeds should be f 10 more than those of the common grain. If the g 56 percavan reflects the estimated cost of production of seeds by BPI, and if theseeds are to be sold at a lower price, the program will have to be subsidized.It appears unlikely that the Government appropriation can finance the repay-ment of loan and subsidize the program at the same time.
68. The BPI proposed production target for corn certified seeds underthe Japanese loan project is overly ambitious (para 56 and Table 9). Itassumes that by the 5th year of the project, 50% of the total corn areawill use certified seeds for planting each year. There is no assurance thatBPI or the seed co-operators will be able to dispose of this huge amount ofseeds, particularly when the quality of the certified seeds remains question-able and the estimated price is high.
69. An alternative would be for BPI to consider (a) reducing theproduction target of the certified seeds, of both rice and corn and reducethe targets for registered, foundation and breeders seeds; (b) reducingproportionally investment on BPI's own stations; and (c) divert the fundssaved from the Japanese loan fund to providing necessary equipment toprivate seed co-operators. The latter would repay their share of the loan.If the loan fund is not sufficient, credit should be sought from domesticsources to ensure that the certified seed producers are adequately equippedto process, dry and store certified seeds.
1/ Expanded Seed Production and Distribution Program, BPI, May 1972.A project proposal for Japanese loan, page 61.

ANNEX 7
Page 17
70. NFAC may also consider surveying and determining the price levelof certified seeds which would be acceptable to farmers and would be fair toseed producers. Technical supervision of the seed producers should beintensified not only to ensure seed quality, but also to achieve highyield per ha by the seed farms so that production cost per cavan of seedsmay be lowered. 1/
71. As the seed production target is reduced, the extension programshould include advice to farmers on how to keep their own seeds. It isbelieved that for synthetic varieties, if a farmer is taught to properlyselect and keep seeds harvested from his fields, he can safely plant hisown seeds for two or more crop seasons between renewal for certified seedswithout serious yield decline.
72. Development of downy mildew resistant varieties for yellow cornmust be expedited. While more resistant varieties have recently becomeavailable, effort to develop highly resistant HYV's must continue. DANRmay wish to revert to hybrid corn breeding, as resistant hybrids havealready been developed in other countries.
73. At the present yield level of the traditional varieties, 10-20cavans per ha, farmers are not likely to use any pesticides. Even if theaverage yield is raised to 35 cavans (about 2 MT) per ha with a grossvalue of about 0 900 per ha (at ? 26 per cavan), farmers probably wouldnot spray. One spraying of 6 Kg of Sevin per ha costs about r 88 for thechemical alone. For controlling corn borer and earworm, NFAC recommendsa minimum of two sprayings.
74. Hopes for reducing losses from insects and diseases lie in thebreeding of resistant varieties. Now that the Philippines has produced itsown downy mildew resistant white and yellow corn synthetic varieties andhas identified sources of resistance to borer, weevil and downy mildew,DANR should secure the services of a senior corn breeder from internationalresearch institutes to review its entire on-going corn breeding program andmap out future strategy and procedures for breeding of insect and diseaseresistant varieties beyond the synthetics. In the meantime, more intensiveextensive insect control should be conducted in areas when average yieldsattain consistently higher levels; i.e., some areas of SW Mindanao andCagayan Valley. With improved seed program, extension of downy mildewresistant HYV's should be accelerated so that the incidence of this diseasecould be drastically reduced.
75. Corn is planted (Table 10) and harvested in practically all monthsin many provinces of the Philippines. The year round harvest is partlydue to the demand for green corn and partly to the need for spreading theshelling operation. Quite often the peak harvesting months fall in periods
1/ BPI projected 28 cavans per ha in the first year, with increment of2 cavans per year.

ANNEX 7Page 18
of high rainfall. In Ilocos, Cagayan Valley and W. Visayas, the peakharvest season is August; in Central Luzon it is June through August;in S. Tagalog, it is October; in Bicol, it is August and September; and inNE Mindanao, it is December. These are all months of high rainfall andhigh relative humidity (see Annex 1, Tables 4 and 6). The peak harvestcomes in February in SW Mindanao the largest corn growing region, when theweather is relatively dry.
76. In all regions except SW Mindanao the avoidance of harvestingin wet months would mean advancing sowing into drier months and runningthe risk of poor germination. Fortunately, the two new downy mildewresistant varieties have significantly shorter growing seasons; 85-90 daysfor MIT's 2 and 95-105 days for DMR 2, compared with 105-115 days for mostof the earlier HYV's. With the exception of Ilocos and Central Luzon,other regions have areas with short and severe dry seasons (Annex 1 and Map3). There may be a possibility for adjusting planting and harvesting seasonsto good advantage.
77. The possibility of such adjustment in regions where dry monthsare not too long nor too severe should be studied. If successful, theaverage yield of corn could be raised without additional cost to farmers.Yield would increase not only because of less direct damage of floweringand fruiting, but also because of less severe insect and disease infestationand higher solar radiation.
78. Most farmers cultivate between rows, weeding and hilling up atthe same time. When properly done, the field has neat furrows and ridges,with corn on ridges. Field observations show that sometimes the ridgesare crooked with segments of corn rows sitting in furrows; these will latersuffer water-logging, which may contribute to the ragged appearances ofmany fields. Since the Extension Service is now advising farmers toincrease the plant population along with fertilizer, UPCA/BPI should alsorecommend the optimum row and plant distances for animal cultivation forweeding and hilling up. Weed infestation increases the population ofwhite grubs and other soil insects. Good land preparation and good subse-quent cultivation would improve the crop stand and uniformity of growth.
79. In view of the recent IRRI experiment showing effective weedcontrol in paddy fields at very low cost by early application of 2-4Dexperiments along the same line should be conducted in corn fields. Weedcontrol experiments being conducted by UPCA should be expanded so that lowcost control methods could also be made available to corn growers.
80. Data of the Bureau of Soils/UNDP Soil Fertility Project showedthat at levels of 45 Kg and 90 Kg N per ha, investment of ' 100 of nitrogenfertilizers brings f 115 to r 427 of return per ha of corn in differentregions (Table 7). However, farmers are not using fertilizers on cornbecause their crops get much lower response than experiments because ofpoor seeds, insects, diseases, weeds, drought and excessive wetness.

ANNEX 7Page 19
81. Government should develop measures which will improve farmers'basic yields without added cost. This includes providing high qualitycertified seeds and disease resistant varieties and adjusting the plantingand harvesting season to reduce losses due to excessive wetness and numberof plants per hectare. It is estimated that farmers will begin to use asmall amount of N fertilizer when the yield reaches 40 cavans and the grossvalue of production reaches r 1,000 per ha. Further increases in yield dueto other innovations will stimulate farmers to use more fertilizers andinsecticides to bring the yield up to even higher levels.
82. The following model illustrates measures that may be employedto increase corn yield in the Philippines:
Estimated EstimatedExpected Gross N
Improvement Yield Estimated Yield Value FarmersMeasures Increment per ha per ha May Use
cavan cavan Kg r(at 26 per Kg/hacavan)
Basic YieldTraditionalVariety - 15 855 390 0
Use older HYV 10 25 1,425 650 0
Use new DownyMildew ResistantHYV 10 35 1,995 910 0
Improve Quality ofCertified Seeds 5 40 2,280 1,040 10
Adjustment ofharvesting season 5 45 2,565 1,170 20
Use Fertilizers upto 45 Kg of N 10 55 3,135 1,430 45
Insect and WeedControl 10 65 3,705 1,690 90
83. When corn production on flat and gently undulating lowlands andupland is increased by above measures, it would be possible to reduce cornplanting on steep hill and mountain sides and under coconut trees withoutupsetting the balance between supply and demand.
Outlook of Future Production
84. The NFAC and Bank mission's projections are compared below (seeTable 11 for details).

ANNEX 7Page 20
N FCA MissionYear Area Production Yield Area Production Yield
1,000 ha 1,000 MT Kg/ha 1,000 ha 1,000 MT Kg/ha
1971/72White corn 2,196 2,035 929 2,100 1,950 929Yellow corn 241 257 1,068 240 214 892Total 2,437 2,292 941 2,340 2,164 925
1973/74 (NFAC)1974/75 (Mission)White corn 2,196 2,280 1,037 2,100 2,338 1,113Yellow corn 241 397 1,314 240 263 1,095Total 2,437 2,677 1,098 2,340 2,601 1,111
1979/80White corn - - - 1,500 2,708 1,805Yellow corn - - - 500 1,249 2,500Total 2,845 3,500 1,230 2,000 3,957 1,979
85. The mission estimated that the total demand for corn will be closeto 4.0 million MT by 1979/80 in order to meet the population increase andrapidly expanding feed requirement. It also feels that the Philippines canno longer afford to expand the corn area, but should instead contract thearea by reducing the area planted by corn on steep hills and mountainsides.The alternative projection therefore calls for reducing total harvestedarea to 2 million ha, increasing average yield to about 2 MT per ha andincreasing production to nearly 4 million MT.
86. Such a production target would require:
(a) selection of downy mildew yellow corn varieties;
(b) extension of high quality certified seeds in sufficientamount so that 1.0 million ha of white corn and 0.47million ha of yellow corn will be planted to downy mildewresistant varieties. Assuming farmers will renew their seedson every third crop, certified seeds will be needed to supplyabout 0.5 million ha each year;
(c) at the projected yield levels, it is estimated that thewhite corn growers will use only about 10 Kg N per haand the yellow corn growers about 20 Kg per ha. Thetotal requirement will be only about 19,400 MT of N.The remaining 0.53 million ha will still not be usingfertilizers;
(d) for yellow corn producing regions, planting andharvesting time, will have to be adjusted to avoidloss, due to excessive wetness;

ANNEX 7Page 21
(e) enforcement of soil conservation practices for retire-ment of corn planting on steep slopes; and
(f) general improvement in extension service.
87. These are modest requirements that can be achieved within thenext 8 or 9 years. As estimated, the 1974/75 production will still fallshort of the feed requirement by about 200,000 MT and imports will stillbe necessary. By 1979/80, the projected production will meet the totalcorn requirement of the Philippines (Table 12).
Sorghum Production
Introduction
88. Sorghum is a new crop in the Philippines. Its promotion was promptedin recent years by the strong demand for feed grains from the expanding live-stock and feed industries. Plant breeding began only in 1965, but 3 extensionvarieties are now available. About 8,000 ha were planted to these varietiesin 1971/72, producing 13,760 MT of grain sorghum. NFAC projected that 44,500ha will be planted in 1974/75 to produce 90,000 MT, and 96,500 ha in 1979/80to produce a quarter million MT.
89. Accomplishment of these targets depends on the satisfactory solutionof a number of production problems. The most obvious one is the difficultyin maintaining seed viability and purity. Secondly, farmers' lack experiencein growing sorghum and feed mills are reluctant to buy. This can be overcomein time. Thirdly, information on a number of production aspects are underexperimentation but recommendations are not yet firmly established; i.e.best planting and harvesting season, rates of fertilizer application, plantpopulation in relation to fertilizer application. Fourthly, more detailedplanning is needed to determine the extension area so that sorghum willcompliment but not compete in land use with corn. If solution of theseproblems comes slowly, the production will reach 90,000 MT not in 1974/75,but perhaps by 1979/80. If the roadblocks are quickly removed, NFAC's pro-duction targets could very well be reached.
Present Production and NFAC Production Targets
90. NFAC reported the following for sorghum in 1970/71 and 1971/72(see also Table 13).
Year Area Production Yieldha Cavan MT Cavan/ha Kg/ha
1970/71 7,043 303,105 15,155 43 2,150
1971/72 8,013 - - - -

ANNEX 7Page 22
Of the total harvested area, 64% in 1970/71 and 53% in 1971/72 were inMindanao (Cotobato and South Cotobato). Of the total production, 94% wasfrom Cotobato in 1970/71. The sorghum area gained in 1971/72 in all otherregions, but lost in SW Mindanao.
91. The NFAC sorghum program is a part of its "Feed Grains and WhiteCorn Program", sorghum being a junior partner to yellow corn as feed grains.The NFAC production targets for sorghum are as follows:
Year Area Production Yieldha Cavan MT Cavan/ha Kg/ha
1971/72 21,380 721,960 36,098 33.8 1,690
1972/73 27,475 1,036,050 51,803 37.7 1,885
1973/74 36,000 1,420,000 71 ,000 39.4 1,970
92. The actual area planted in 1971/72 was only about 38% of the target;the production and yield data were still incomplete at the time of the mis-sion. The reasons given for the shortfall by NFAC are: (a) farmers aregenerally unfamiliar with sorghum and hesitant to try it; (b) the local feedmills had not used sorghum and are hesitant to buy it; and (c) the uncertaintyof a viable market further discouraged farmers from expanding sorghum plant-ing. In areas where feed mills did buy, the extension was successful.
93. In a longer range projection, included in correspondence with FAO,DANR made the following projection:
Year Area Production Yield
ha Cavan MT Cavan/ha Kg/ha
1974/75 44,500 1,800,000 90,000 41.2 2,060
1979/80 96,500 5,000,000 250,000 50.0 2,500
The crop is so new that its future prospect is still unclear. If the initialresistance of farmers and smaller feed mills to a new crop is broken, andcultural practices can be quickly established, its output may expand rapidly,as sorghum is more tolerant than corn to either drought or excessive wetness,the two difficulties besetting corn in many regions.
Research
94. The relatively new research program for sorghum is coordinated by
a committee composed of researchers from UPCA, BPI and BS of various dis-ciplines. The program's current main objectives include the following:
(a) continuous selection of better varieties;

ANNEX 7Page 23
(b) proper use of fertilizers;
(c) insect and disease control; and
(d) solution for the problem of low seed germination.
Variety Improvement
95. The sorghum breeding program in the Philippines began in 1965with the introduction from India of 2,000 varieties from an InternationalSorghum Variety Collection. Since then, a total of over 5,000 lines havebeen brought in from various sources. Selections were made for high yield,high protein and plant types that are short, early maturing and having headsintermediate between compact and spreading types. Going through shortsingle row observation, preliminary yield trial, regional trial, and mini-kit plots, promising lines were selected for extension. Three varietieshave so far been approved as the seedboard varieties: COSOR 1 (Baracaselection), COSOR 2 and DARSO. In experimental plots, these varieties yieldaround 5 MT per ha; in farmers' field, from 1.5 to 2.0 MT per ha. Fourteenmore are being tested in a regional trial at Isabela (Cagayan Valley), LosBanos (S. Tagalog), Negros Oriental (W. Visayas), Bukidnon, (NE Mindanao)and Cotobato (SW Mindanao).
96. The breeding program so far has been based on pureline selection,but 20 promising lines have recently been selected as parents and hybridiza-tion work has begun. Hybrid sorghum varieties may appear in the Philippinesin 4 or 5 years.
Fertilizer Application
97. The Bureau of Soils started to conduct experiments only in recentyears. In 1970/71, 24 field trials on sorghum were carried out, mostly onthe islands of Luzon and Mindanao. Preliminary results show that sorghumyield respond significantly to nitrogen application of up to 90 Kg N perha; less significantly to phosphorous and not at all to potash. Time hasnot been sufficient to determine whether response to potash or a sharperresponse to phosphorous would develop after continuously planting of sorghumfor a number of years using only nitrogen fertilizers. An official fertili-zer recommendation for sorghum has not yet been made, but is expected inthe near future. Interaction between fertilizers and plant population hasnot yet been conclusively established.
Insects and Diseases
98. A survey'of sorghum insects by UPCA and BPI shows that a number ofcommon corn insects, i.e. corn earworm, army worm, cutworm, seedling naggot,thrips and loopers also attack sorghum. In addition, sorghum is attachedby aphids, grain beetle and an unidentified "head worm". Among them, themore severe ones are the headworm, earworm and grain beetle which attack thegrowing and maturing heads, and aphids which attack heads, leaves and stalks.

ANNEX 7Page 24
Among the most common sorghum diseases are the rust, rhizoctonia, helmin-thosporium leaf spot which are also common on corn, and authracnose whichis not an important corn disease.
99. The insect and disease control experiments being conducted byUPCA and BPI are limited to trials on using different chemicals. Althoughofficial recommendations have not yet been made, those made for corn areapplicable to pests common to both crops. On the other hand, since fewsmall corn growers are using the recommended pesticides, it is likely thatmost sorghum growers will not use them either for the time being. Again,final solution will depend on breeding for resistant varieties.
Seed Germination
100. Sorghum seed production both by the BPI stations and by privateseed cooperators has been beset with the problem of low germination. Factorsinvolved in sorghum seed germination are more complex than those for corn,including seed moisture content, degree of seed maturity at harvest, andseed dormancy. BPI experiments revealed the following relevant results:
(a) seeds harvested in dry season have higher germination thanthose harvested in wet season;
(b) in both dry and wet seasons, seed germination rate increasedwith seed maturity up to a point (91% when seeds were har-vested 31 days after flowering began), then decreased again.At this stage of maturity, the moisture content of the dryseason seeds was 26%, while that of the wet season seeds was44%. When harvested at 20 days after flowering, the dryseason freshly harvested seeds gave 70% germination as against34% of the wet season seeds;
(c) when immature seeds were germinated soon after harvest,artificial drying increased germination. When the seeds arefully matured, fresh seeds germinate as well as the dried seeds.
101. UPCA experiments conducted in wet season with COSOR 2 variety gavethe following results:
(a) seeds attain maximum dry weight in about 22 days after pollenshEdding. At this point, the seed moisture content was 47%;
(b) seeds immediately after harvest are about 50% germinable, 25%dormant and 25% dormant ungerminable. COSOR 2 seed dormancylasts for about 2 months. Drying to 8% moisture reduceddormancy to about 5% of the seed sample; and
(c) under ordinary farm level storage, COSOR 2 seeds loses viabilityrapidly after 2 months to 50%. Drying to 8-10% moisture andstoring in air-tight containers prolonged viability to 5 months
or longer.
ANNEX 7
Page 25
102. In practical terms, it means that sorghum seeds should be harvestedabout a month after flowering begins, and should be artificially dried and
stored in air-tight containers. Tentatively, UPCA is recommending thatfarmers store sorghum seeds in air-tight containers with a layer of crushedcharcoal at the bottom. Using this method, COSOR 1 seed is said to give
80-85% germination after 6 months storage, and COSOR 2, 60%.
103. Sorghum seed quality is affected by two more factors. One is bird
damage, which can be reduced only when the planted area has expanded. Theother is 5-6% natural cross pollination in the field. After 3 or 4 crops,
farmers' seeds become quite ununiform and must be renewed with certified seeds.
Threshing
104. Threshing of this new crop poses a problem to farmers. There isnot yet a standard practice adopted by farmers. Larger farmers use paddy
threshers or run tractors over harvested sorghum heads on ground. Smallfarmers thresh by hand or simply sell heads to middlemen. Obviously, a
solution must be found to make threshing easier. UPCA has recently startedresearch on sorghum thresher and also tried implements developed by IRRIfor rice. It found that the IRRI thresher (about f 2,000 each) threshes6 cavans of sorghum per hour. Few farmers, including rice farmers, havebought them.
Extension and Training
105. Sorghum was extended in 1971/72 in 20 NFAC priority provinces in7 regions, i.e., Ilocos, Cagayan Valley, Central Luzon, S. Tagalog, Bicol,W. Visayas and SW Mindanao. Only one "non-programmed" province, Bataan ofCentral Luzon, planted 305 ha of sorghum under the routine BPI/APC extension.Sorghum production under the NFAC program represents almost the total produc-
tion in the whole country, and the crops are practically all planted to seed-board varieties. The future development of sorghum production in the Phil-
ippines, therefore, hinges heavily on the progress of the NFAC program.
106. The field organization for sorghum extension is a part of the
yellow corn program. This includes allocation of personnel, training, theconduction of "applied research plots" in farmers fields and other extensionactivities. For sorghum, 20 variety trials, 21 fertilizer trials and 300production (method) trials were conducted in 1971/72 and same number isplanned for the next two years.
107. Published extension material on sorghum is much less than thatfor rice and corn. It is limited to a few leaflets, the directiveaccompanying the mini-kits and relatively few articles in UPCA Upland CropsNewsletters. "The Philippines Recommends", which forms compilation of basicextension material for rice and corn, is not yet published for sorghum.

ANNEX 7Page 26
Supply of Major Inputs
108. Seed multiplication system for sorghum, administered by BPI, is
the same as that for rice and corn. For 1971/72, NFAC estimated that 69cavans of registered seeds and about 7,000 cavans of certified seeds wasneeded for the target extension area in "programmed" provinces (one cavan
of sorghum seeds plant 3 ha). Actual amount of certified seeds distributedmust have been much smaller, since the actual harvested area was only 36%of the target. BPI has the capacity to supply registered seeds even up to
the 1980 area target. With the implementation of the Japanese loan projects,the quality of registered seeds will improve. The main problem BPI andother agencies must solve in supplying sorghum seeds to an expanding acreageis the technical difficulties of maintaining high seed germination of thecertified seeds and farmers' own seeds.
109. Application of pesticides and herbicides on sorghum is extremelylimited, except by larger farmers. NFAC reported that fairly large percentageof sorghum growers are using some fertilizers, but information on amountactually used is not available.
Recommendations for Improvement
Defining the Extension Area
110. The extension areas of rice and corn programs are more or lesspredetermined. The essence is to replace old by new wherever these crops are
being grown. The sorghum extension area, however, has not been identified.It is therefore necessary to define the best areas for promoting sorghum.Selection of "priority" provinces is not enough.
111. Sorghum grows well where corn grows well, but is more tolerant to
either drought or water-logging than corn. Within limits, it may give acrop where corn fails. For producing maximum feed grains in the country,these two crops should compliment instead of compete with each other for the
use of land. At the present stage, it appears logical to consider leavingareas to corn where corn grows well, but trying out sorghum where corn yielddwindles. Such marginal areas may be ones where land has become too droughty,too wet or too heavy for satisfactory corn production. In short, they maynot be areas where sorghum gives the highest absolute yield, but where itgives the highest incremental yield and income over corn.
112. These criteria may be used by the regional and/or provincial pro-grams to determine the sorghum and corn extension areas within the "priority"provinces. This, of course, does not preclude future adjustment as a resultof changes in prices or relative technological advantage between the twocrops, as may flow from future research.
Seed Supply
113. The following proposals which have been made in the previous chapter
on corn also apply to sorghum:

ANNEX 7Page 27
(a) Financing the improvement of processing, drying and storageequipment of the private seed cooperators who produce thecertified seeds. This is even more important for sorghumbecause of the complex technicalities involved in maintain-ing seed viability of sorghum;
(b) Involving the private livestock and feed industry in thedistribution of certified seeds. In fact, it is alreadybeing practiced in Mindanao, where some buyers buy sorghumheads from farmers and supply seeds in return for planting.The seeds they supply are not certified seeds, but seedsfrom the heads previously bought. With a link to the sourcesof certified seeds, this channel could be utilized to goodadvantage. If hybrid sorghum varieties are developed, itwould also be advantageous to involve the large livestockfarms in seed multiplication work. It should be to theiradvantage to supply hybrid seeds at reasonable prices accept-able to small growers; and
(c) Teaching farmers how to keep their own seeds. This is alsomore important for sorghum than corn, because of the diffi-culty in keeping seed quality, the 5-6% natural cross polli-nation, and the necessity to renew seeds every few years.
Determining the Best Planting Season
114. Since sorghum is new, the planting seasons have not yet set intoa firm pattern. Under the NFAC program, far more sorghum was planted inthe spring seaso.n than in the summer/fall season in 1970/71, but in settingthe targets set for 1972/73, the two seasons were made about even. Itseems highly desirable to conduct field experiments under both dry andwet season conditions in different provinces to determine the best plantingand harvesting seasons. The sensitivity of the current and future seedboardvarieties to photo-periodism should also be determined.
Yield Response to Fertilizers
115. When extension area and planting seasons are better defined, itmay be necessary to re-examine the yield response to fertilizers, as thesoil types and growing seasons may differ from those of today. The inter-action of plant population and fertilizer application is being tested. Thefindings from such tests will be important.
Soybean Production
Introduction
116. Soybean has been a very minor crop in the Philippines, used mainlyin subsidiary foods. The current production is only around 2,000 MT per
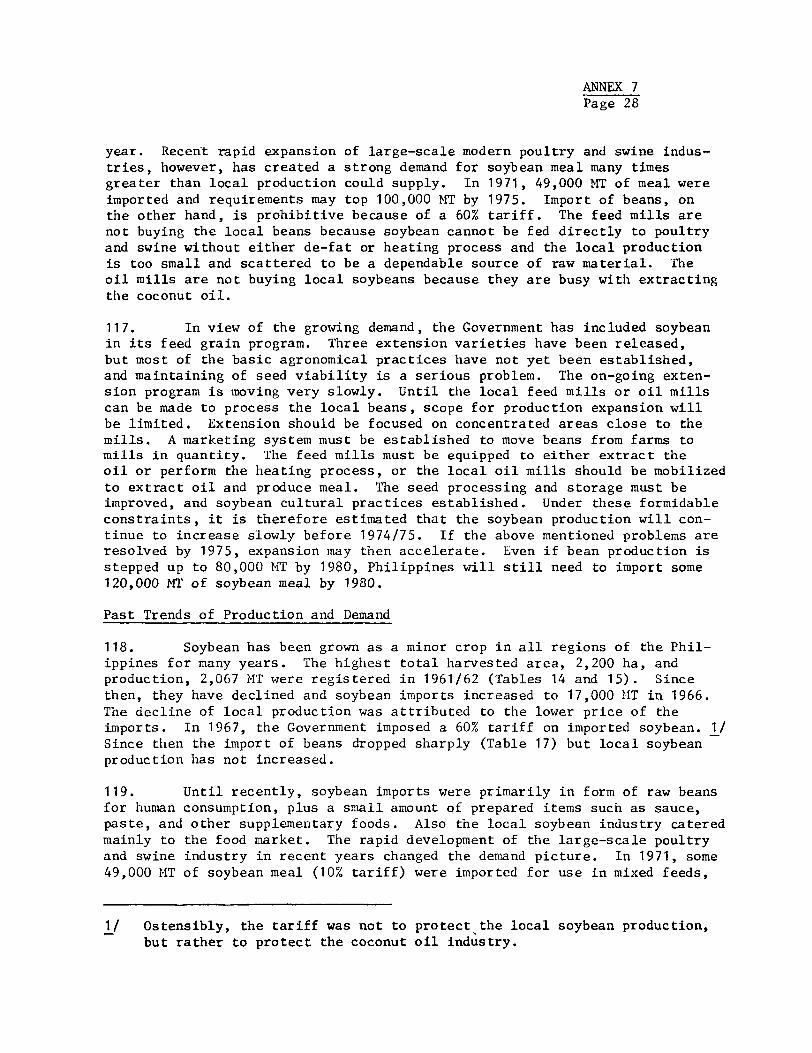
ANNEX 7Page 28
year. Recent rapid expansion of large-scale modern poultry and swine indus-tries, however, has created a strong demand for soybean meal many timesgreater than local production could supply. In 1971, 49,000 MT of meal wereimported and requirements may top 100,000 MT by 1975. Import of beans, onthe other hand, is prohibitive because of a 60% tariff. The feed mills arenot buying the local beans because soybean cannot be fed directly to poultryand swine without either de-fat or heating process and the local productionis too small and scattered to be a dependable source of raw material. Theoil mills are not buying local soybeans because they are busy with extractingthe coconut oil.
117. In view of the growing demand, the Government has included soybeanin its feed grain program. Three extension varieties have been released,but most of the basic agronomical practices have not yet been established,and maintaining of seed viability is a serious problem. The on-going exten-sion program is moving very slowly. Until the local feed mills or oil millscan be made to process the local beans, scope for production expansion willbe limited. Extension should be focused on concentrated areas close to themills. A marketing system must be established to move beans from farms tomills in quantity. The feed mills must be equipped to either extract theoil or perform the heating process, or the local oil mills should be mobilizedto extract oil and produce meal. The seed processing and storage must beimproved, and soybean cultural practices established. Under these formidableconstraints, it is therefore estimated that the soybean production will con-tinue to increase slowly before 1974/75. If the above mentioned problems areresolved by 1975, expansion may then accelerate. Even if bean production isstepped up to 80,000 MT by 1980, Philippines will still need to import some120,000 MT of soybean meal by 1980.
Past Trends of Production and Demand
118. Soybean has been grown as a minor crop in all regions of the Phil-ippines for many years. The highest total harvested area, 2,200 ha, andproduction, 2,067 MT were registered in 1961/62 (Tables 14 and 15). Sincethen, they have declined and soybean imports increased to 17,000 MT in 1966.The decline of local production was attributed to the lower price of theimports. In 1967, the Government imposed a 60% tariff on imported soybean. 1/Since then the import of beans dropped sharply (Table 17) but local soybeanproduction has not increased.
119. Until recently, soybean imports were primarily in form of raw beansfor human consumption, plus a small amount of prepared items such as sauce,paste, and other supplementary foods. Also the local soybean industry cateredmainly to the food market. The rapid development of the large-scale poultryand swine industry in recent years changed the demand picture. In 1971, some49,000 MT of soybean meal (10% tariff) were imported for use in mixed feeds,
1/ Ostensibly, the tariff was not to protect the local soybean production,but rather to protect the coconut oil industry.
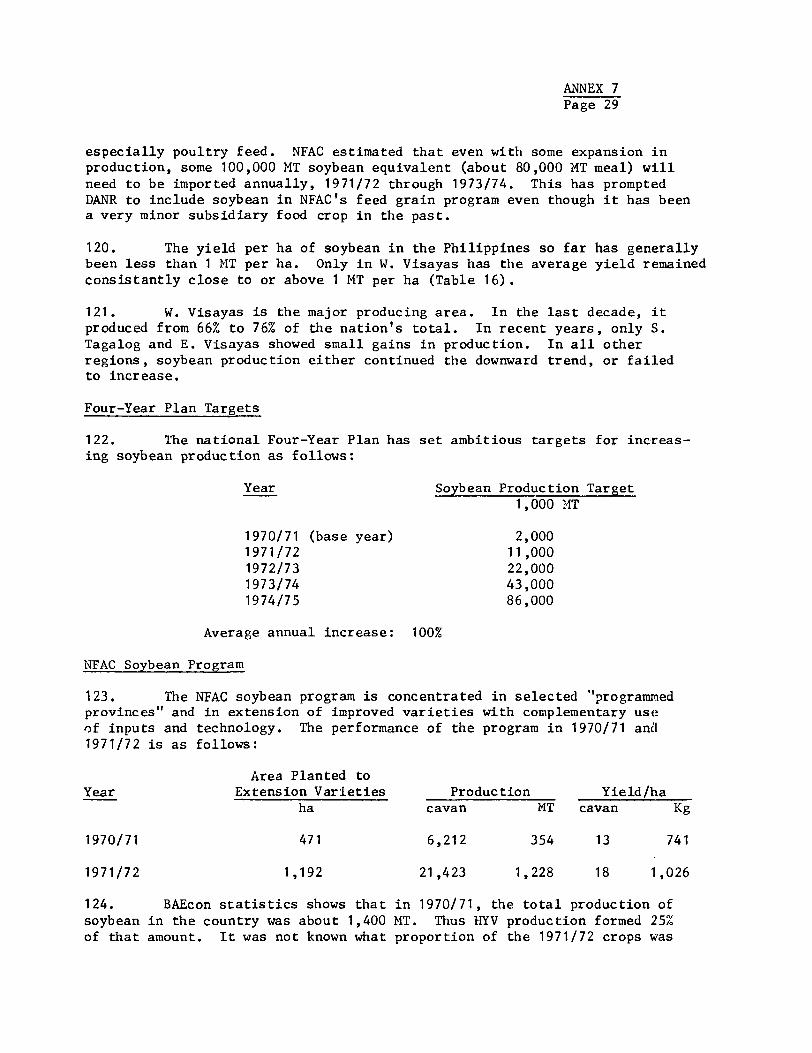
ANNEX 7Page 29
especially poultry feed. NFAC estimated that even with some expansion inproduction, some 100,000 MT soybean equivalent (about 80,000 MT meal) willneed to be imported annually, 1971/72 through 1973/74. This has promptedDANR to include soybean in NFAC's feed grain program even though it has beena very minor subsidiary food crop in the past.
120. The yield per ha of soybean in the Philippines so far has generallybeen less than 1 MT per ha. Only in W. Visayas has the average yield remainedconsistantly close to or above 1 MT per ha (Table 16).
121. W. Visayas is the major producing area. In the last decade, itproduced from 66% to 76% of the nation's total. In recent years, only S.Tagalog and E. Visayas showed small gains in production. In all otherregions, soybean production either continued the downward trend, or failedto increase.
Four-Year Plan Targets
122. The national Four-Year Plan has set ambitious targets for increas-ing soybean production as follows:
Year Soybean Production Target1,000 MT
1970/71 (base year) 2,0001971/72 11,0001972/73 22,0001973/74 43,0001974/75 86,000
Average annual increase: 100%
NFAC Soybean Program
123. The NFAC soybean program is concentrated in selected "programmedprovinces" and in extension of improved varieties with complementary useof inputs and technology. The performance of the program in 1970/71 and1971/72 is as follows:
Area Planted toYear Extension Varieties Production Yield/ha
ha cavan MT cavan Kg
1970/71 471 6,212 354 13 741
1971/72 1,192 21,423 1,228 18 1,026
124. BAEcon statistics shows that in 1970/71, the total production ofsoybean in the country was about 1,400 MT. Thus HYV production formed 25%of that amount. It was not known what proportion of the 1971/72 crops was

ANNEX 7Page 30
contributed by HYV's as the BAEcon national statistics were not yet avail-able. But the impact of the 1971/72 NFAC program may be compared againstthe 1967/68 record of production in the same regions:
1967/68 BAEcon 1971/72 NFACRegions Included in Data Report1971/72 NFAC Program Area Prod. Yield Area Prod. Yield
ha MT Kg/ha ha MT Kg/ha
Ilocos 10 1.6 150 1,046 1,111 1,063Cagayan Valley 50 20.6 412 12 9 833Central Luzon 90 77.4 860 78 75 974S. Tagalog 280 150.4 537 56 33 607Total 430 250.0 581 1,192 1,228 1,026
Apparently, NFAC has been able to make a breakthrough in Ilocos (highestrecord was 30 ha and 36 MT in 1959). In other regions, the HYV's have notyet entirely replaced the traditional varieties, although they achievedbetter average yields in every region. Assuming the production in regionsexcluded from NFAC program remained at the 1967/68 level, the national soy-bean production should be around 2,400 MT in 1971/72.
125. The NFAC program so far covered only the islands of Luzon and Min-doro (belonging to S. Tagalog region). It will include SW Mindanao and Eastand West Visayas in its 1972/73 program and may expand into NE Mindanao andBicol at a later stage. This selectiveness reflects the close orientationof the NFAC program to the requirements of the feed mills which are largelycentered around the Manila area on the Luzon Island.
126. The NFAC Soybean Program targets, as summarized below, amount toapproximately one-half of the national production targets in the 3 programmedyears.
NFAC Production Target (HYV's)Item 1971/72 1972/73 1973/74
Area (ha) 4,200 8,500 17,000Yield (Cavan/ha) 23.6 24.0 24.6
(Kg/ha) 1,345 1,368 1,402Production (Cavan) 99,300 204,000 416,000
(MT) 5,660 11,628 23,712Importation Required (MT) 102,500 107,000 107,000Total Requirement (MT) 108,000 119,000 130,000
Even NFAC's targets are difficult to attain. The actual area planted toextension varieties in the "programmed" provinces in 1971/72 was only 28%of the target, the production, 22% and yield per ha, 76%.
127. The prospect of meeting the NFAC targets is not promising for theimmediate future, for the following reasons:

ANNEX 7
Page 31
(a) Soybean cannot be fed directly to poultry and swine without:either removing the oil or cooking. The small local feed
mills do not have equipment to do either; some of the largerones have oil extraction equipment, but use them mainly for
copra. A marketing system that can move beans in quantityto feed mills is not in existence. For these reasons, thelocal feed industry physically cannot use local soybeans,
but use imported meals instead. Until the local soybeanscan enter the feed mills, the incremental production canonly be absorbed by the food market which has been in short:supply because of the 60% import tariff. This demand is,however, limited;
(b) many of the technical aspects of producing soybean in thePhilippines are still under study. Pertinent information is
not yet ready to go to farmers; some have not even reachedthe extension workers;
(c) Soybean seed, which contains oil and is hygroscopic, deter-iorates even more rapidly than corn and sorghum seeds under
Philippines' natural conditions. Extremely low germinationis a common complaint of farmers, seed producers and evenexperiment station workers. Even seeds for the soybeanmini-kits are generally low in viability before seeding; and
(d) the current SeedBoard varieties are yet imperfect in diseaseresistance, uniform ripening (disuniformity results in highpercentage of immature and low quality grains) and shattering.
Research
128. Soybean research in the Philippines were started only a few yearsago. Four varieties, developed through hybridization of imported varieties,have so far been approved by the Seed Board for extension: Nowoly Milox 399,Biyeloxi 256, L 114 and CES 434. The varietal characteristics of the firstthree varieties are given in Table 18. In general, the yields of thesevarieties are higher in the wet season (2 to 3 MT in regional trials) thanin the dry season (1.3 MT); the growing period varies from 115-120 days inthe wet season to 95-110 days in the dry season. The beans vary in seedoil content from 19-22; in protein content, 36-40%; in size of beans, 18-22gm per 100 beans. Regional test of new promising lines is being continued.The breeding objectives include resistance to diseases, lodging and shatter-ing, high oil and protein content, low sensitivity to photo period, and highyielding.
129. Surveys reveal that the common insects attacking soybeans arecorn earworm, cutworm, army worm, leaf folder caterpillar, green stink bug,grey mealybug and long-horned grasshopper. Chemical control experimentsare being conducted. Use of malathion is recommended in mini-kit directives.The most serious foliar diseases in the wet season are the bacterial postules

ANNEX 7Page 32
and bacterial blight and in the dry season, the soybean rust. Damping-offand seed decay is prevalent in wet season, especially on poorly drained soil.
130. Research on date of planting and spacing is being conducted byUPCA but no conclusive results have yet been obtained. Preliminary indica-tions are that the desirable plant population is around from 300,000 plantsper ha.
131. Fertilizer experiments conducted by the BS/UNDP project werelimited to green house tests on local and imported nodule bacteria (Rhizobiumjaponicum) inoculant, and field experiment at one locality, Rizal, on soy-bean yield response to P205 with or without inoculation. The UNDP projectrecommended that (a) soybean seeds should be inoculated for initial plant-ing; a Brazilian strain SFS 114 was found most effective; (b) on most soils,nitrogen fertilizers are not necessary if seed inoculation is effective;(c) a phosphate application of 60 Kg P20 5 should be given at planting; and(d) neutral soil is best for soybean; liming is necessary for acid soils.BPI isolated 5 local strains of nodule bacteria and found them more effectivefor inoculating soybean than imported strains. In any event, commercialinoculant is not yet made available to farmers in general, although it isincluded in the soybean mini-kits.
132. The Bureau of Soils started fertilizer experiments including 11treatments at Pangasinan, Central Luzon in the dry season of 1970/71. Theexperiments are being continued and need to be expanded to other areas.Official recommendations for fertilizer application on soybean have not yetbeen made.
133. Weeds common in soybean fields are similar to those in corn andsorghum fields, including grass, sedge and broadleave species. Herbicideexperiments have been started by UPCA, but recommendations have not yetbeen established.
134. A research project on retention of viability in soybean seeds wasrecommended 1/ by Professor T. Jackson Smith of Virginia Polytechnic Insti-tute, US/AID consultant,.to be conducted by the Seed Testing Laboratory ofBPI. The objectives were to (a) determine germination, moisture content andfree fatty acids of soybean when stored at different moisture levels usingdifferent packaging materials; and (b) determine the optimum storage tempera-ture and moisture levels for maintaining viability of soybean seeds withacceptable levels of germination for at least 10 to 12 months. The researchis being started in 1972.
Extension, Training and Information
135. The soybean extension and training program is a part of the NFACfeed grain program. For the soybean program, the "Applied Research" included
1/ Review of Soybean Potential in the Philippines, by T. Jackson Smith,Soybean Consultant, US/AID, Philippines, September, 1971.

ANNEX 7Page 33
18 variety trials, 27 fertilizer trials and 200 production trials in 1971/72.For the next two years, the number of production trials will be increasedsuccessively to 250 and 300. Information on soybean, as mentioned before,is yet quite incomplete. "The Philippine Recommends" for soybean is notyet published. 1/
Recommendations for Improvement
136. Professor Smith made a comprehensive set of recommendations whichshould be considered by DANR/NFAC in pursuing the soybean program. Theyare summarized as follows with mission's comments:
Enable Feed Mills to Use the Local Soybeans
137. "The large processing plants could be permitted to import soybeansat a price that would produce soybean meal competitive with imported mealwith the stipulation that all Philippine production would be purchased at aprice competitive with foreign imports. Ultimately the local productionshould supply demand for whole soybeans and imports could be eliminated."
138. "A second alternative which I feel deserves careful study andconsideration involves the use of full-fat heat-cooked soybeans. Full-fat(unextracted) soybeans cannot be utilized in mixed rations for animal feedwithout cooking. Research has well established that full-fat heat-treatedsoybeans can be utilized as part of the ration in mixed feeds. Such soy-beans contain both meal and oil, providing a high-protein, high-energy feed.Specific formulas have been developed that show advantages of using cookedsoybeans in rations. Three types of cookers, infra-red, extrusion andautoclaving are being used extensively in the United States to produce full-fat heat-treated soybean meal for use in mixed feeds. These units can bepurchased in most any size at a reasonable cost and are being used by farmers,private poultry and swine producers and by both large and small feed mills.This method of using soybeans should be carefully studied and cooperationsolicited from feed millers in specific target areas. Information availableshould be adequate to interest feed millers by showing a price advantage forusing full-fat heat-treated soybeans in the mixed feeds due to direct pur-chasing from farmers."
139. "A third alternative that deserves careful consideration is useof small oil processing plants. Some very small units are now being usedin the Philippines and elsewhere to process fresh coconut oil and corngerm oil. I have not seen these units and have no data on use with soybeansnor the efficiency of operation. But here again we have a procedure wherethe small feed miller could produce a protein concentrate from soybeanswithout excessive capital outlay."
1/ A pamphlet, "Growing Soybeans in the Philippines," was published byNFAC in January, 1973.

ANNEX 7Page 34
140. The mission is of the opinion that the second and third alterna-tives could be pursued at the same time. When methodology and cost factorsare established, a financing project will be necessary to enable the feedor oil mills to install the necessary equipment. The first alternative isless desirable, because the Philippines has surplus coconut oil; any pro-posal for easing import of beans would likely be unwelcome. Instead, theimport of soybean meal should be regulated according to demand of the feedindustry and the availability of local soybeans.
Better Define Extension Areas
141. "Production target goals should be concentrated in compact areaswhere rapid increase has the best chance of success and where a local marketmight be developed. Limited production in a large number of scattered areascannot hope to achieve production goals." "Feed manufacturers cannot affordto purchase small quantities at scattered locations over a large area." Themission supports this observation fully.
Improve Seed Supply
142. "The new seed processing plant and cold storage at the Maligaya RiceResearch and Training Center should be utilized to process and store breeder,foundation and registered seeds multiplied by BPI and UPCA for Luzon area withaddition of equipment specific to soybean seed handling. Similar but smallerplants should be built to handle seeds in other major extension areas." (Mis-sion comment: Additional seed processing plants will be built under theJapanese loan for seed program.)
143. "The problem of producing, packaging and disseminating ... certifiedseed is even more critical .... ' "The private sector will have to producethis seed which goes directly to the farmer." Alternatives proposed include:
(a) "Proper packaging that will permit retention of seed viabilityfor 8-10 months ... ." (This is related to the research projectsuggested by Professor Smith.)
(b) "To distribute seed directly to farmers in small quantities andlet farmers increase and maintain their own seed supply bygrowing two crops each year ... However, this ... should bediscouraged if quality seed can be supplied by seed producersat a reasonable price."
(c) "Production of seed during the dry season in areas that mighthave a wet and dry season different from the extension areawhere seed is needed." This, however, will require transporta-tion of seed supplies.
144. The mission feels that basic solution depends on successful research
(a) above, but the completing of research will require some time. In the
meantime, (b) and (c) should be tried out in a few provinces as soon as pos-

ANNEX 7
Page 35
sible. Even when research is concluded, recommendation (c) above is still
applicable in combination with proper seed packaging.
Production Outlook
145. In view of the current low production level, and the numerous con-straints pending solution, the 4-year plan target of producing 86,000 MTin 1974/75 or even the NFAC target of producing 17,000 MT by 1973/74 appearsuntenable.
146. No substantial expansion in production can be expected before thetechnical and marketing restriction now hindering the feed mills from usinglocal soybeans are removed. If the Government and the industry start-to takenecessary steps toward solving these problems now, the channel may hopefullybe opened by 1974/75. That year should also be a reasonable target for es-tablishment of all basic cultural practices and a sound seed program.
147. Up to 1974/75, therefore, the production target can only be projectedon the basis of proven rate of area expansion (about 700-1,000 ha a year),yield levels of the extension varieties achieved in farmers' field, and thereplacement of traditional varieties by extension varieties. The increasedproduction will still be absorbed by the food market without much difficulty.After 1974/1975, assuming feed mills are in a position to use local beans,and agronomical practices, including seed supply, are firmly established,definitive promotion could then begin aiming at meeting the feed and foodrequirement as much as possible.
148. The total feed requirement for poultry and swine industries isestimated to be about 2.65 million MT in 1974/75 and 3.89 million MT in 1979/80 (Annex 4, Table 17). Bulk of the feed will be composed of corn, sorghum,rice bran and copra meal, while the high protein component will be composedof mainly soybean meal and fish meal. It is estimated that about 118,430 MTof soybean meal will be required in 1974/75 and 181,725 MT, in 1979/80 (Table19), equivalent to about 148,000 MT and 227,000 MT of beans respectively.
149. Including food market requirements, the total soybean requirementwould be 150,000 MT in 1974/75 and 240,000 MT in 1979/80.
150. The mission projects local soybean production as follows:
Year Area Production Yield/haha Cavan MT Cavan Kg
1970/71 estimate 1,480 24,500 1,400 16.6 9451971/72 estimate 2,400 42,000 2,400 17.5 1,000
1974/75 projection 5,000 100,000 5,700 20.0 1,1401979/80 projection 40,000 1,360,000 80,000 35.0 2,000
Even if the above projection is realized, Philippines will still need toimport about 120,000 MT of soybean meal equivalent to about 150,000 MT ofbeans in both 1975 and 1980 (Table 19).
April 6, 1973

ANNEX 7Table 1,
PHILIPPINES
AGRICULTURAL SECTOR SURVEY
Table 1: CORN PRODUCTION STATISTICS, ALL PHILIPPINES, 1956-1971
1 cavan shelled grain = 57 kg
Crop Year Harvest Area Yield per Ha Production
1,000 ha Cavan kg 1,000 MT
1955/56 1,675 9.5 51,1 907
1956/57 1,787 8.8 501 895
1957/58 1,381 10.8 617 852
1958/59 2,107 8.5 482 1,016
1959/60 1,846 11.1 633 1,165
1960/61 2,045 10.4 593 1,209
1961/62 2,016 11.0 627 1,323
1962/63 1,950 11.5 656 1,274
1963/64 1,898 12.0 684 1,293
1964/65 1,922 12.0 684 1,313
1965/66 2,106 11.0 656 1,379
1966/67 2,158 12.1 690 1,490
1967/68 2,248 12.6 718 1,620
1968/69 2,256 13.5 770 1,733
1969/70 2,420 14.6 830 2,008
1970/71 2,392 14.7 838 2,005
Source of Data: BAEcon

PHILIPPINES
AGRICULTURAL SECTOR SURVEY
Table 2: CORN AREA HARVESTED, BY REGION, 1956-1971i/
Cagay3n Central Southern Western Eastern S & W N & EYear Ilocos Valley Luzon Tagalog Bicol Visayas Visays M=aao 14Minao Philippines
- II III IV v VI VII VIII II I
-- ('000 heetares)
1956 20.9 109.2 98.5 90.3 64.5 303.9 442.3 371.2 173.8 1,674.61957 18.7 110.3 95.6 114.6 60.5 357.9 486.1 370.6 174.4 1,786.71958 18.2 128.8 41.5 63.4 121.5 161.9 243.0 364.1 238.1 1,380.51959 24.9 172.1 59.7 84.8 171.2 310.3 50-4.9 553.9 225.2 2,107.01260 21.2 128.6 71.5 80.5 76.3 302.7 446.2 449.3 269.3 1,845.51961 24.0 151.1 77.4 107.7 86.8 337.8 345.0 586.9 328.6 2,045.41962 20.6 133.7 71.5 105.2 77.5 272.2 421.7 630.3 283.5 2,016.41963 19.3 126.3 63.7 96.9 72.4 257.4 393.6 685.1 2314.9 1,969.61965 16.5 118.1 57.1 94.9 68.9 272.2 366.6 687.5 215.6 1,897.61965 16.5 121.8 58.6 93.3 70.2 275.2 367.6 709.1 210.6 1,922.71966 16.1 102.6 55.0 118.6 87.1 251.0 19.7 832.2 223.7 2,106.11967 16.2 90.4 58.7 119.8 90.9 196.0 423.6 897.5 265.0 2,158.01968 15.1 133.5 58.5 117.8 96.0 271.5 402.6 899.6 253.3 2,247.91969 17.3 157.1 81.2 127.4 97.2 293.8 309.0 909.0 264.0 2,256.11970 20.9 201 .1 79.3 161.4 101.5 3014.0 333.2 957.5 260.7 2,419.61 9 71L3. 21.6 238.5 82.3 166.5 99.4 324.6 301.7 896.9 269.7 2,392.2
Crop yearsending June 30.
/2 Preliminary.
Source: BAEcon. DANR.

PHILIPPINES
AGRICULTURAL SECTOR SURVEY
Table 3: 0ORN YIELDS, BY REGION, 1956-1970
Cagayan Central Southern Western Eastern S & W N & EIlocos Valley Luzon Tagalog Bicol Visayas Visavas M=Tao fiao Phlippines
11 111 l__ v vi VII vii ix i...
-(-----.-------------- (Kg/Ha)
1956 564 895 519 548 458 463 391 709 521 5411957 558 858 538 439 498 384 348 712 509 5011958 694 722 485 350 557 364 346 916 670 6171959 539 657 529 576 479 395 301 567 614 4821960 513 678 678 673 627 496 524 770 695 6331961 473 912 490 405 473 536 513 638 616 5931962 308 758 445 667 479 570 456 775 650 6271963 336 946 496 741 581 542 422 798 650 6561964 410 952 530 809 610 542 422 827 713 6841965 399 929 573 849 627 570 410 821 701 6841966 519 638 547 547 678 485 456 821 701 6561967 542 621 559 570 678 553 473 851 684 6901968 570 878 621 616 747 576 507 861 701 7181969 502 764 479 747 673 610 542 975 650 7701970 478 1,000 529 929 670 632 546 1,038 648 830
Note: Assumption: 1 cavan = 57 kilos
Source: PA.Econ, DANR

PHILIPPINES
AGRICULTURAL SECTOR SURVEY
Table h: CORN PRODUCTION BY REGION. 1955-19711
1955 1956 1957 1958 1959 1960 1961 1962 1963 1964 1965 1966 1967 1968 1969 1970 1971----------------------------------------------------------- (1000 m tons)--------------------------------------------------------
Ilocos 9 12 10 13 13 11 11 6 7 7 7 8 9 9 9 10 11
Cagayan Valley 96 98 95 93 113 87 138 101 119 112 116 65 56 117 120 201 224
Central Luzon 28 51 52 20 32 48 38 32 32 30 30 30 33 36 39 42 49
Southern Tagalog 47 49 50 22 49 54 44 70 73 77 79 65 68 72 95 150 162
Bicol 37 30 30 68 82 48 41 37 42 42 44 59 62 72 65 68 71
Eastern Visayas 194 173 168 84 152 233 178 192 165 155 150 191 199 204 167 182 179
Western Visayas 114 141 137 59 122 151 182 212 141 147 158 122 108 156 179 192 210
N & E Mindanao 148 263 264 334 314 187 201 184 152 154 147 157 181 178 172 169 160
S & W Mindanao 9 7L2 - -90L2 8 9L2' 1 5 9L 1 39L2 346 376 489 543 569 582 682 774 776 887 99 4L2 940
PHILIPPINES -770 907 895 852 1,016 1,165 1,209 1,266 1,273 1,293 1,313 1,380 1,490 1,619 1,733 2,008 2,005
/1 Crop years ending June.30.
/2 Obtained by subtraction from total.
Source: BAEcon, DANR

ANNEX 7Table 5
PHILIPPINES
AGRICULTURAL SECTOR SURVEY
Table js OORN (SHELLED) PRODUCTION, BY VARIETY AND BY REGION, 1970
(Sack of 57 Kilograma)
Region Vhite Yellow OthersL Total
Philippines 31,121,300 3,251,500 859,000 35,231,800
Ilocos 70,400 77,600 30,500 178,500
Cagayan Valley 2,995,400 96,300 433,500 3,525,200
Central Luzon 539,100 163,600 33,600 736,300
Southern Tagalog 734,200 1,711,300 179,700 2,625,200
Bicol 781,700 387,300 16,400 1,185,400
Eastern Visayas 3,170,400 18,100 900 3,139,400
Western Visayas 2,713,600 551,700 96,400 3,361,700
N & E Mindanao 2,966,900 1,000 25,200 2,993,100
S & W.Mindanao 17,149,600 244,600 42,800 17,437,000
/1 Sweet Corn, Glutinous Corn, Pop Corn.
Source: BAEcon, DANR

PHILIPPINE.- AGRICULTURAL SECTOR SURVEY
Table 6: Characteristics of Seedboard Varieties of Yellow and White Corn
Yellow Corn White Corn
UPCA UPCA BPI UPCA UPCA BPI MIT PHILIPPINEPlant Var. 1 Var. 3 Var. 1 Var. 2 Var. 4 Var. 2 S-2 DMR-2
Maturity (days) 105-115 105-115 95-105 105-115 120-125 100-110 85-95 95-105
Rust relatively relatively relatively relatively relatively - - -resistant resistant resistant resistant resistant
Helaimthosporium relatively relatively relatively - - relatively - -resistant resistant resistant resistant
Rhizoctonia relatively relatively relatively relatively relatively relatively -resistant resistant resistant resistant resistant resistant
Downy Mildew susceptible susceptible suscep.tible susceptible susceptible susceptible highly relativelyresistant resistant
Grain
Type semi-flint flint flint flint flint flint flint flint
Average experimentalYield Level 82 cavans 80 cavans 69 cavans 74 cavans 80 cavans 77 cavans 57-72 67 cavans
cavansYear Released 1966 1968 1969 1966 1967 1969 1971 1971
Derived from Caribbean Cuban & Early Mexican Inter, white Late white Mexican Mt. Rox College whiteyellow flint Caribbean lines synthetic ILI synthetic lines Tiniguib x Tuxpeno
Mimis
Cebu white
Breeding agency UPCA UPCA BPI UPCA UPCA BPI MagnindanaoRedMindanao Inst. UPCA
ofTechnology
Source: Conpiled from "Philippines Recommends for Corn; 1970-71"1,NFAC

ANNEX
PHILIPPINES
AGRICULTURAL SECTOR SURVEY
Table 7: MAIZE RESPONSES TO NITROGEN AT THE 15 KG/HA LEVEL
Agroclimatic No. of Yield ResponseReion Province txpts. per Kg N (kg)
Cagayan Valley Cagayan 35 20Isabela 20 11N. Vizcaya 4 13Batanes 15 16
Central Plain ofLuzon Pangasinan 35 19
Tarlac 3 16
Bicol Region C. Sur, C.Norte andAlbayMasbate 8 7
Catanduanes 14 15
Panay Iloilo 64 17Aklan 18 11-30
Leyte Leyte 12 8
Negros N. Oriental 14 7
Cebu Ceou 212 10-16
North East Mindanao Surigao andAgusan 24 22-25
North CentralMindanao Bukidnon and
M. Oriental 103 8-14
South East Mindanao Davao 153 17-35
South CentralMindanao Cotabato 34 13
West Mindanao Z. del Sur .12 17
Source of Data: Soil Fertility Survey & Research - The Philippines.Field Eperiments, Plant Nutrition and Soil Classi-fication LA:SF/PH1 10 U,DP/FAO. Rome. '196.

PHILIPPINES
AGRICULTURAL SECTOR SURVEY
Table 8: MAIZE YIELD RESPONSE TO NITROGEN
Yield of Yield Increase Value of Cost of Gross Return per 100Region Treatment Grain Over Control Yield Increase Fertilizer Profit Pesos Invested
N P205 K20 Kg/ha Kg/ha Pesos/ha Pesos/ha Pesos/ha Pesos
Central Luzon, Tarlac 0 0 0 2,071 - - - - -45 0 0 2,908 837 251.1 63.0 188.10 39990 0 0 3,203 1,132 339.6 126.0 213.60 270
Cagayan Valley, Cagayan 0 0 0 1,334 - - - - -45 0 0 2,182 848 254.4 63.0 191.4 40590 0 0 2,393 1,059 30.7 126.0 191.7 257
sabel4 0 0 0 1,002 - - - - -
45 0 0 1,418 416 124.0 63.0 61.8 19890 0 0 1,642 640 192.0 126.0 66.0 15?
Aico 0 0 0 2,118 - - - - -
45 0 0 2,541 423 97.3 63.0 34.7 11590 0 0 3,264 1,146 263.6 126.0 138.5 11
E. Visayas, Cebu 0 0 0 695 - - - -
45 0 0 1,230 535 160.5 63.0 97.5 25590 0 0 1,555 860 258.0 126.0 132.0 205
W. Visayas, Iloilo 0 0 0 1,952 - - - - -
45 0 0 2,572 620 142.6 62.6 80.1 22890 0 0 3,329 1,377 316.7 125.1 191 6 253
N E Mindanao, Bukidnon 0 0 0 2,885 - - - - -
and Misamis Oriental 45 0 0 3,659 774 232.2 63.0 169.2 36990 0 0 3,431 546 163.8 126.0 137.8 130
S W Mindanao, Davao 0 0 0 2,810 - - - - -
45 0 0 3,707 897 269.1 63.0 206.1 42790 0 0 4,253 1,443 432.9 126.0 306.9 344
Catabato 0 0 0 1,558 - - - - -
45 0 0 2,044 486 111.8 63.0 49.2 178.790 0 0 2,206 648 149.0 126.0 23.9 119.1
Source of Data: Soil Fertility Survey and Research, Philippines, Field Experiments, Plant Nutrition and Soil Classification, LA: SF/PH1 10 Tech. Report 1.

ANNEX 7
Table 9
PHILIPPINES
Agricultural Sector Survey
Table 9: CORN - SEED PRODUCTION TARGETS
Seed Classes
Plan and Breeder Foundation Rekistered CertifiedYear Ha Cavan Ha Cavan Ha Cavan Ha Cavan
BPI for 1971/72 0.4 12 5.0 109 75.0 2,910 -
NFAC/21971/72 - - 0.15 - 19.1 450 2,089 62,6271972/73 - - 0.18 - 21.9 - 2,633 -1973/74 - - 0.23 - 26.8 - 3,208 -
/3BPI JapaneseLLoan, signedMay, 1971
Year 1 0.4 6 2.0 30 53.0 795 3,180 h7,700Year 2 1.0 5 5.0 75 150.0 2,250 9,000 135,000Year 3 1.5 22 6.0 90 150.0 2,625 10,500 183,750Year 4 2.0 30 7.0 105 150.0 3,000 12,000 2h0,o00Year 5 2.5 37 8.0 120 150.0 3,532 13,500 303,750
Source of Data:
/1 Rice and Corn Seed Production Program, Project 103D, Fiscal Year 1971/72, BPI.
/2 The Feed Grains and White Corn Program, 1971/72 to 1973/74, NFAC.
/3 Expanded Seed Production and Distribution Program, BPI, May, 1972 - A ProjectProposal for Japanese Loan.

AN XTWe 10
PHILIPPINES
Aricultural Sector Survey
Table 10: C0RN PLANTING CALENDAR
Region let Season 2nd Season 3rd Season
Cagayan Valley
Cagayan April November
Central Luzon
Bataan May to August September to December January to April
S. Tagalog
Cavite April to July October to January
Bicol
Camarine Norte December to March March to JuneCamarine Sur May to October December to AprilAlbay April to June November to JanuaryCatanduanes January to April May to August September to DecemberMasbate April to June August to October December to JanuarySoreogon January to March June to August
W. Visayas
Negrop Oriental April to June September to November December to February
E. Visayas
Samar December to March April to July August to NovemberBohol May to August September to December January to AprilCebu May to September September to January January to AprilLeyte July to October November to February March to June
N E Mindanao
Misamis Occidental May to August September to December January to AprilMisamis Oriental July to August August to September December to JanuaryAgusan del Sur February to April July to AugustSurigao del Sur June to October January to May
S W Mindanao
Davao Oriental March to May July to September November to JanuaryDavao City July to October November to February March to JuneDavao Norte January to February May to June September to OctoberDavao Sur April to July August to November December to MarchCotabato July to October November to February March to JuneCotabato South July to October November to February March to June
Sources NFAC

PHILIPPINES
AGRICULTURAL SECTOR SURVEY
Table 11: CORN: PROJECTIONS OF AREA, PRODUCTION AND YIELD
Old HYV's New HYV's Traditional Varieties Total
Year Crop Area Production Yield Area Production Yield Area Production Yield Area Production Yield1,000 ha 1,000 MT Kg/ha 1,000 ha .1,000 MT Kg/ha 1,000 ha 1,000 MT Kg/ha 1,000 ha 1,000 MT Kg/ha
BAECon 1970/71 estimate 2,392 2,005 838NFAC 1971/72 target
White corn 2,196 2,035 929Yellow Corn
241 257 1,068Total 2,437 2,292 941
NFAC 1972/73 targetWhite corn
2,196 2,157 980Yellow corn 241 338 1,163Total
2,437 2,495 1,024NFAC 1973/74 target
White corn 2,196 2,280 1,037Yellow corn
241 397 1,314Total 2,437 2,677 1,098
Mission Projections1971/72 (Base year)
White corn 2,100 1,950 929Yellow corn 240 214 892Total 2,340 2,164 925
1974/75White corn 240 342 1,425 356 710 1,995 1,504 1,286 855 2,180 2,338 1,113Yellow corn 100 143 1,425 - - - 140 120 855 240 263 1,095Total 340 485 1,425 356 710 1,995 1,644 1,406 855 2,340 2,601 1,111
1979/80White corn - - - 1,000 2,280 2,280 500 428 855 1,500 2,708 1,805Yellow corn 30 43 1,425 470 1,206 2,565 - - - 500 1,249 2,500Total 30 43 1,425 1,470 3,486 2,250 500 428 855 2,000 3,957 1,979
Explanatory Notes for Table 31
1. 1971/72 figures adopted by the Mission are a compromise between BAECon 1970/71 estimate and NFAC 1971/72 target. Yield of yellow corn was kept lower than NFAC projectionbecause in NFAC 1971/72 HYV extension program, it was only 93% of the white corn yield.
2. Mission assumes a reduction of corn area by 340,000 ha by 1977/78; through retirement from hill and mountain sides, and replacement by sorghum and other feed grains.Total production, however, will increase significantly by increase in yield per ha,
3. New HrYV means downy mildew resistant varieties and for yellow corn, also hybrid corn varieties if they are developed. New yellow corn HYV's are not available at present,but are expected to be available before 1974/75.

ANNF.X 7ритl тРРl ггеs T3b].� 12
ACRICUC71'RAL SECTOR SUP.VEY
TaЫ e 12 % � � + � s Овсним еsтеите0 cOxs �м Ргl ан
1971/72 1974/75 1979/80
ксет 1,ооо са� . п 1,ооо ггТ 1,ооо с. и о 1, ооо нТ I,ooo с. т. п 1, ооо нт
УЫ [s Сом (5he11ed Сга1п )Food
Ст1св 2Э ,2 В0 1, З27 2Э ,929 1, Эб4 27, ЗЗ9 1,558Gtten Сом (graln equlv в len[) 1,019 58 1,116 6Э 1,275 72
5carch б С lисовг Ind. 2,7 Эб ц 5 2,7 ЗЬ 156 2,776 156Уавсаке 6 Осhетя 2, ОЗ S 166 2,656 140 2,842 1625eeds 396 l4 549 31 ЗЬВ 21FeedsBy-Producte of Сгl се (6,984) (Э98) (7,179) (609) (8,201) (4 Ы )
5cr в lgh[ ( аv а11 вб1е) 614 З5 6,244 З57 В , ц 3 473Carry Over З , В 77 221 ],988 227 4,556 259TOTAL: 36, ц 7 1,9:0 41,018 2, Э38 47, ЭЬ8 2,708
Te11ov СогпFood, Сгееп Сот 1,019 58 1,116 6Э 1,275 72уавсаяе 22 В 12.8 281 16 1, З 16 755eeds 57.5 3.0 5Э .3 З 123 7Fеедв (ava11e61e) 2,45 р 160 Э ,160 181 19,213 I,0%Сатту Over - -TOTAL: 7,754 214 � ,611 26 З� 21,929 1,249
SorRhumЧавсаgе 17 0.8 40. З 2 108 5.4Seede 2,7 0.1 5.7 0. Э 12 0.6Feede ( вv а11аЬ1е) ц 3 ц .8 626.4 71. Э 1, ЬВ0 В4.0Сетгу Over - - - - - -5UB-TOTAL: 275 17.7 872 ЗЗ . б 1,800 90.0
РеедVA1te Сам апд Bv-product, Ye11ov
Сотп апд 5откh ит 10, Э07 S86 17,209 478 � Э7, З49 2,120
I дп етедса l Over 1971172 6,920 ]92 27,042 1,3 Э4
8ти 11 д l всгери tl ев вге дие [о zoupoing.
lsylanatory 8о [ ев for Та61 е Э 2
УЬ1[ е Сом
1. Сотп сопвитед вв food 1n Еогт оЕ grlte [ook ир 1, Э17,000 М 1¢ 1971/72. (Ам ек , 2а61 е 3.5 ееСlтв[ед 1,288,600 !П tor 1970J71; assuaed3Z рори lе [1 оп l пггееее [о R1ve the above втоип [ for 1971/72.) Зi рориl всl от l осп вьс 1в и в, твд vp со 1974/73 впд 2.7; /octtase �L�вввитед for [hereefter.
2, Сл ев еом 1n grsln equivaleo[ - NFAC авсlтв [в (Faed Сгв 1о вод 1П,1[ а Corn Pcogram) ! от I971/72 1в ивед. Аввитед вате тв tав о ! papul в[tonlпск аве ав вЬоvе .
J. 8[ вгс h вдд С l исок Iпдив[ry, е [ с. - NFAC ев [ls вев foc 1971/72 l в ик д и д Ra1d capstaat.
4, Yu[age адд oUere: Авsиое 6I (NFAC евtl тв [ед ЗZ).
!. 8еедв - one сл еп о ! к вдв Еог 4 hв ,
i.� � � Реедв:
( а) 8у-products - авn т ед 70I of grelo к lghe for m1111ng gг 1Св .
(Ь ) Yh1[e сом ивед естаl8 Ьс f от Ееед - Ьа lапса De[veen соса l вт ,т г л а11 аб1е (p тvdue[1en) пад а11 оШ ег ок в Ьис a:elading Ьу -ргодие[Егот grlts. Аввате 1001 of [h1a евюип [ 1в т ед for feed.
7. Свггуоvет -[vo enpthe еирр lу toc атоип [ деедед for me4ing gt1[s.
Ге1lw Сом
В . Роод Ео Еотт of green т гn - вее 2 aб ova. NFAC ввеитед еогдю д -[ Ье -еоб сдорт l и в of 501 uch ot vц Са вn д увll и r еотд,
9. Yuage - вее б sbove.
10. 9еедв - вее 5 a6wa.
11. ieeds - cotal produetlop sl див в11 ochet ик в,
12. Свгтуоvвг - вввите до и ттуои г.
6° тд� т
U. Уавсвgе - вее 4 вЬоvа .
Ч . l авдв - ом сл п of введв for D й .
ц . � ввдв - к в 11 вЬоvе .
16, Свгтуоп г - и виое оо свтг7ои г .

PHILTPPIN8Z
AGRICULTURAL SECTOR SURVEY
Table 13: SOMHUM - AP.Ek, PRODUCTION, YIELD, BY REGI()!JS
1970/71 Actual 1971/72 Preliminary
Area Production Yield/ha Area Production- Yield/haLRegion
ha MT Cavan Kg ha MT Cavan Kcr
Ilocos 68 101 29.8 1,490 1,221
Cagayan Valley 88 150 34.2 1,710 395
Central Luzon 301 333 29.8 1,49o 1,407
Southern Tagalog 165 274 33.2 1,660 476
Bicol 39 39 20.0 1,000 155
W. Visayas 32 18 10.9 545 77
E. Visayas - - - - -
S W Mindanao 6,350 14j,240 44.9 2,245 4,282
N E Mindanao - - - - -
Philippines 7,o43 15,155 43.0 2,150 8.9013
Source of Data: NFAC
/1 Data not available.

PHILIPPINES
AGRICULTURAL SECTOR SURVEY
Table 1 : OYBEANS - AREA BY RBGON 1959-1968
R E G I 0 N 1959 1960 1961 1962 1963 1964 1965 1966 1967 1968
ectares --lhilippines 1,690 1,370 2,090 2,200 1,720 1,630 1,660 1,470 1,430 1,1h80
Ilocos 30 30 30 30 10 /3 10 /2 10 10
Cagayan Valley 100 40 20 20 20 20 20 20 20 50
Central Luzon /2 - 60 70 70 80 80 190 160 90
Southern Tagalog 110 100 1,160 160 200 200 200 200 200 280
Bicol /2 /2 /2 20 10 13 10 10 10 /1
Eastern Visayas 20 30 20 410 10 20 30 30 60 70
Western Visayas 380 380 1,070 1,110 1,120 1,110 1,110 810 820 820
Northern and Eastern Mindanao 180 630 630 650 100 30 40 50 5o 50
Southern and Western Mindanao 870 160 100 100 180 170 160 160 120 110
/1 Preliminary estimates
/2 Less than 10 hectares
/3 Crcp year ending June 30, 1964
SOURCE: BAEcon Ca

PHILIPPINES
AGRICULTURAL SECTOR SURVEY
Table 15: SO=ENS FRODUCTION. BY REGION, 1960-1970
Cagayan Central Southern Western Eastern 6 & W N & EIlocos Valley Luzon Tagalog Bicol Visayas Visayas Mindanao Mindanao Philippines
II III IV V VI VII VIII Ix X-- --------------------- mEri(tons---- -----------------
1960 31.5 126.0 - 32.2 1.2 257.3 7.4 88.7 437.o 981.31961 24.2 11.3 46.5 48.5 1.2 1,316.0 7.8 65.3 378.5 1,899.31962 15.5 10.3 50.5 52.7 5.8 1,363.8 26.5 85.2 456.6 2,066.91963 8.3 8.5 52.8 64.9 5.1 1,323.2 7.5 153.0 139.2 1,762.51964 18.6 12.1 58.4 90.2 0.6 1,087.9 30.7 119.6 92.0 1,490.11965 10.5 10.6 57.2 94.6 2.8 1,071.4 15.7 116.4 25.6 1,404.81966 1.0 12.5 72.2 94.4 2.8 789.2 13.9 116.8 28.7 1,131.51967 1.6 12.5 71.0 96.9 2.8 779.0 16.4 93.8 28.7 1,102.71968 1.5 20.6 77.4 150.4 0.7 861.0 25.2 8-.7 28.7 1,251.21969 1.3 2.9 2.2 127.6 0.8 861.0 25.3 15.6 158.1 1,19L.81970 3.9 2.9 3.0 127.6 0.5 861.0 29.9 84.8 81.7 1,195.3
Source: BAEcon, DANR.

PHILIPPINES
AGRICULTITRAL SECTOR SURVEY
Table 16: AVERAGE IIELD PER HECTAREL BY REGI1ON. 1959-1968 (K/HECTARES)
R E G I 0 N 1959 1960 1961 1962 1963 1964 1965 1966 1967 1968
Philippines 338 716 909 940 1,025 914 846 770 771 845
Ilocos 1,193 1,050 807 517 830 - 1,050 - 16o 150
Cagayan Valley 380 3,150 565 515 1425 605 530 625 625 412
Central Luzon - - 775 721 754 730 715 380 44 860
Southern Tagalog 442 322 303 329 325 451 473 472 485 537
Bicol - - - 290 510 - 280 280 280 -
Eastern Visayas 195 247 390 663 750 535 523 463 410 360
Iestern Visayas 464 677 1,230 1,229 1,181 980 965 974 950 1,050
Northern and Eastern Mindanao 86 694 601 702 1,392 3,067 640 574 574 574
Southern and Western Mindanao 289 554 653 852 850 704 728 730 782 779
SOURCE: BAEcon
0S

ANNEX 7PHILIPPINES Table 17
AGRICULTURAL SECTOR SURVEY
Table 17: RAW SOYBEAN IMPORTS, 1949-1969
Year Quantity Value Price per(kilos) (pesos) Kilo
1949 2,946,692 697.694 .21
1950 3,180,554 787,810 .25
1951 3,825,792 1,162,188 .30
1952 4,077,160 1,287,851 .32
1953 4,879,705 1,461,224 .30
1954 2,961,766 1,203,950 .h1
1955 1,911,431 656,886 .34
1956 498,341 142,686 .29
1957 2,977,983 990,676 .33
1958 2,542,656 806,738 .32
1959 1,642,446 531,162 .32
1960 652,809 402,437 .62
1961 1,599,283 1,026,835 .64
1962 129,594 73,558 .57
1963 11,461,320 4,906.266 .43
1964 4,397,058 2,012,462 .46
1965 11,666,963 5,134,451 .44
1966 17,19,641 9,146,4U0 .53
1967 6,200,484 6,643,2211 1.07
1968 1,521,288 1,540,290 1.01
1969/1 594,100 854,058 1,44
/1 First to the third quarter of the year.
Source of basic data: 1949-1953, Bureau of Cen-sus and Statistics19M4-1969, Central Bank of the Philippines

PHILIPPINES
AGRICULTURAL SECTOR SURVEY
Table 18: SOYBEAN - CMARACTERISTICS OF EXTENSION VARIETIES
Items Biyeloxi 256 Miloxi 399 L 114Bilomi 3 x Yellow Bilox 96 Mis 28 EB x Yellow Bilcxi 37 C-364 x Sankuo
Origin
Growing Period (days)Wet Season 115 120 115Dry Season 95 - 110 110 93
Average Yield (MT)Wet Season 2.00 - 3.00Dry Season 1.32 1.29 - 1.33 -
Oil Content (%) 21 - 22 19 18.68
Protein Content (%) 37 40 36.43
Size of dry bean (gm/100 seeds) 20 - 22 18 - 20 -
Color of Bean Glossy-yellow (olive green Straw colorwhen harvested prematurely)
Lodging Resistant Grow prostrate in early wet Resistantseason
Photoperiodism Less sensitive Less sensitive
Shattering Resistant
Susceptibility to diseases Moderate susceptible to rust Tolerant to rootand bacterial postule and leave disease
resistant to rust
Source of Information: BPI Newly Developed Varieties of Field Legumes, by F.B. Ballon, et al. Intensitied Corn ProductionProgram, Proceedings 1971.

PHILIPPINES
AGRICULTURAL SECTOR SURVEY
Table 19: SOYBEAN - ESTIMATED REQUIREMEN'2, 1975 and 1980
(A) Livestock Feed Requirement
1974/75 1979/80Item Poultry Swine Total Poultry Swine Total
t MT MT MT MT MT
1. 1971 - Sovbean meal imnort for feea base-/ 49,000 49,000
2. Estimated incremental requirement of hi h protein mealsfor incremental-livestock production- 77,100 123,500 200,600 120,000 290,900 410,900
meal /33. Assumed share of soybean n/ 2 (other share is fishmeal)- 50% 25% 50% 25%
4. Estimated incremental requirement of soybean meal in 2 38,550 30,880 69,430 6C,000 72,725 132,725
5. Total soybean meal requirement for feed (1 + 4) 118,430 181,725
6. Total soybean meal requirement in bean equivalent (at 20%oil content) 148,000 227,000
(B) Total Soybean Demand and Supply
1. Feed 168,000 227,000
2. Food market 5,700 12,000
3. Total Demand 153,700 239,000
4. Projected Production 5,700 80,000
5. Import requirement in bean equivalent 148,700 159,000
6. Import requirement in soybean meal 118,400 127,200
/1 Quoted from Review. of Soybean Potential in the Philippines, T.J. Smith, USAID, September 1971./2 Mission report Annex , Table/3 Estimate by Missiof livestock consultant./4 Para 256 of this Annex.

AGRICULTURAL SECTOR SURVEY
PHILIPPINES
ANNEX 9. RICE: ESTIMATES OF SUPPLY AND DISAPPEARANCE

ANNEX 9
PHILIPPINES
AGRICULTURAL SECTOR SURVEY
RICE: ESTIMATES OF SUPPLY AND DISAPPEARANCE
TABLE OF CONTENTS
Page No.
Supply .................................................... 1
Requirements .............................................. 2
TABLE
Rice Production and Disappearance


ANNEX 9Page 1
PHILIPPINES
AGRICULTURAL SECTOR SURVEY
RICE: ESTIMATES OF SUPPLY AND DISAPPEARANCE
Supply
1. GOP computes the available supply of rice by summing the datalisted below:
(a) the palay crop converted to milled rice equivalent;
(b) commercial stocks (including government-owned stocks) as of
July 1, of palay and rice (in milled rice equivalent);
(c) 51% of farm household stocks 1/ of palay in milled rice equiva-lent on July 1; and
(d) rice imports.
2. The data on palay supply were converted to rice equivalent bymultiplying them by 67.4% from 1970/71 on; by 66.2% for earlier years backto 1968/69 and by 64.9% back to 1959/60. These take account of the threetypes of milling in the Philippines, explained below: 2/
(a) Cono (including imported mills) mills are commercial mills withmilling yields of about 70%, depending on the condition of thepalay. The average milling yield may be about 65%.
(b) Kiskisan mills are simple mills run by one or two men. Themilling process is a one-step operation with palay passingbetween a stone inner cylinder and a rough metal outercylinder. The average milling yields may be about 60%.
(c) Hand pounding consists of pounding palay with a mortar andpestle. The milling yield may average about 50%.
3. The proportion of milled palay which is processed by each method,as determined by periodic surveys of the Bureau of Agricultural Economics(BAEcon), is shown below:
1/ Data on farm household stocks of palay are not available prior toJuly 1, 1969. Since a historical series of more than three seasonsis needed for analytical purposes, data on farm stocks are notincluded in the supply estimates used in this annex.
2/ BAEcon Digest, Volume VI, No. 39, September 27, 1972.

ANNEX 9Page 2
Percentage of Processed Palay
HandYear /a Cono Kiskisan Pounded
1955 47.4 30.4 22.21961 57.5 29.7 12.81968 63.9 31.4 4.7
/a The year designates the 12 months ending June 30.
4. Some of the crop is not milled, consisting of allowances for seedand wastage (including rice which is fed to livestock). The Mission estimatesthat these allowances represented about 10% of the palay crop in recent years.
5. The estimates of rice supply and consumption are shown in Table 1.
Requirements
6. GOP computes the historical requirements for rice by the followingprocedure:
(a) Deduct the ending carry over from the supply.
(b) The remainder is the total rice consumption of the Philippines.
(c) Consumption per capita is obtained by dividing step (b) bypopulation.
7. During the past decade, per capita consumption, as computed in thePhilippines, averaged about 88 kg. GOP estimates requirements based on 91kg per capita. This is slightly higher than the peak rate of 90.5 kg attainedin 1969/70.
8. Income elasticity of rice is apparently very low, based on avail-able statistical evidence (Statistical Annex Table 6.3). To provide theconsumption of 91 kg per capita, and marginal self-sufficiency, by 1974/75would require an increase of about 24% in output from 1971/72. With thelikelihood of little increase and perhaps a further shortfall in productionin 1972/73 as a result of the floods, very large increases would be necessaryin the next two years. For 1975-80, population increases now projectedat 2.7% a year would require commensurate increases in output.
9. The requirements for palay output accordingly would be:
'000 tons
1971/72 actual 5.101974/75 projected 6.321979/80 projected 7.22

PHILIPPINES
AGRICULTURAL SECTOR SURVEY
Table: RICE PRODUCTION AND DISAPPEARANCE1
Fiscal Paa Not Rice Net 5 Change Dis- Popula ConsumprYea Produc- Mild31Mle Output-/ Imports2./: in aprnc tion per
Year : tion / : lled%r MOutput Stocks. appearance t CaitaM. . %T M.T. M.T. (.00 kg
1959 3,684,503 11.1 88.9 2,126,142 192,573 170,304 2,148,591 26,190 82.04
1960 3,739,507 11.1 88.9 2,157,882 4,004 32,232 2,129,654 26,986 78.92
1961 3,704,756 11.1 88.9 2,137,829 (1,627) -263,584 2,399,786 27,800 86.32
1962 3,910,056 11.1 88.9 2,256,298 186,380 188,735 2,253,943 28,637 78.71
1963 3,966,983 11.3 88.7 2,283,997 15,701 -105,729 2,405,427 29,500 81.54
1964 2,842,859 11.1 88.9 2,217,522 301,602 3,245 2,515,879 30,388 82.79
1965 3,992,463 10.9 89.1 2,309,034 481,687 54,161 2,736,560 31,304 87.42
1966 4,072,636 10.9 89.1 2,355,402 326,698 -17,394 2,699,494 32,246 83.72
1967 4,094,020 10.9 89.1 2,367,769 214,541 -74,607 2,656,917 33,218 79.98
1968 4,560,697 11.0 89.0 2,686,259 118,517 236,114 2,568,662 34,218 75.07
1969 4,1444,656 10.1 89.9 2,644,385 (27,113) -86,874 2,704,146 35,249 76.72
1970 5,233,408 10.1 89.9 3,173,411 ( 1) -114,639 3,288,049 36,310 90.55
1971 5,342,916 10.1 89.9 3,239,813 16,800 -93,566 3,350,179 37,404 89.57
1972 5,100,084 10.1 89.9 3,090,274 635,000 336,840 3,388,434 38,537 87.931/ Revised. 2/ BAEcon. 3/ Mission estimate.i4/ Conversion rate rice/palay: 64.9%, 1959-67; 66.2%, 1968-69; and 67.4%, 1970-71 as 9
applied by OSCAS, National Economic Council. Q
/ As presented in original table with revisions for 1971 and inclusion of 1972 figures.

u

AGRICULTURAL SECTOR SURVEY
PHILIPPINES
ANNEX 8. SUGAR AND TOBACCO PRODUCTION


ANNEX 8Page 1
PHILIPPINES
AGRICULTURAL SECTOR SURVEY
SUGAR AND TOBACCO PRODUCTION
TABLE OF CONTENTS
Page No.
Sugar
Introduction ..................................... 1Recent Developments .............................. 2Organization ................................. 5Research ................................ ar. 7Extension Service ............................... 9Supply of Inputs ................................. 10Recommendations for Improvement .................. 11The Outlook for Supply and Demand .......... 14
Tobacco
Trends of Production and Export .................. 16Organization ................ .................... 16Research and Extension .......................... 16

ANNEX 8Page 2
Tables
1. Sugar - Area, Production, Yield, All Philippines, 1946-19712. Sugarcane - Area, Production, Yield, by Regions3. Sugarcane - Cane Yield and Sugar Content4A. Percentage Distribution of Sugarcane Farms by Regions4B. Sugarcane Area, No. of Farms & Average Farm Size5. Sugarcane - Agronomic Characteristics of Commercial Varieties6. Sugarcane Yield Response to Fertilizers-Tarlac Mill District, 1969-707. Sugarcane Yield Response to Fertilizers-Tarlac Mill District, 1970-718. Tobacco: Area, Production, Yield of Virginia and Native Tobaccos9. Tobacco: A List of Extension Varieties
Figures:
1: Sugarcane Area & Sugar Yield, Philippine Total (WB 7235)
2: Sugarcane Area & Sugar Yield, Central Luzon (WB 7236)

ANNEX 8Page 1
PHILIPPINES
AGRICULTURAL SECTOR SURVEY
SUGAR AND TOBACCO PRODUCTION
I. SUGAR PRODUCTION
Introduction
1. The Philippines has been exporting sugar to the U.S. for nearlya century. From 1935 to 1960 (excepting the second World War years), itenjoyed a duty free quota of 980,000 tons. The U.S. stopped importingsugar from Cuba in 1961, and the Laurel-Langley Agreement of 1965 increasedthe potential U.S. sugar quota for the Philippines to 1.3 - 1.5 million tonsannually. Stimulated by these actions, the sugarcane area more than doubledduring the last decade, to a record 420,000 ha in 1970/71, and the sugarmills increased from 26 to 36.
2. The rapid expansion, however, created serious difficulties. Sugar-cane was pushed into marginal land, breakdowns occured in the once wellsynchronized harvesting and delivery schedules between planters aand millsand, above all, there was a steady decline of sugar yield from 7.7 tons/hain 1958/59 to only 5.4 tons in 1970/71. From 1966 to 1970, the Philippinesconsistently failed to fulfill the U.S. quota. By 1974, when the Laurel-Langley Agreement expires, Philippine sugar entering the U.S. will have topay full duty of about 0.5 cents per pound. Otherwise, the Philippines hasonly a small residual quota of 60,000 MT in the International SugarConference -- which applies only when there is a deficit in other countries'quota; and it has not supplied any to these outlets since 1961.
3. Future emphasis should be placed on increasing the sugar yield perhectare. The decline of yield in the last decade was due mainly to threethings: the expansion of sugarcane onto rolling land and hillsides withoutsoil conservation practices; prolongation of the period between harvestingand milling; and the prevalance of diseases and insects, especially theratoon-stunting disease. To overcome these constraints, the followingmeasures are recommended:
- Reimposition of a strict schedule of harvesting and deliveryof cane to mills,
- Investment in installing irrigation facilities in mill dis-tricts with distinct dry seasons,
- Strengthening of the PHILSUGIN cane breeding program fordeveloping more varieties with early and late maturity, anda wide range of disease resistance,

ANNEX 8Page 2
- A vigorous campaign against ratoon-stunting disease,
- Imposition of soil conservation practices on cane fields on
slope land.
4. If the above measures are implemented, the sugar yield could prob-ably be revived to 7.7 tons/ha, and 2.7 million ST of sugar might be producedin 1980 from only 355,000 ha of planted area. The plantations on steep
slopes should be retired.
Recent Developments
5. Following World War II, only 25 of the 47 prewar sugar mills werereopened with some mergers. Sugar export to the U.S. revived to the 980,000ST quota level by 1953/54 and continued at that level until 1960. In 1961,Cuba's huge U.S. sugar quota (3,438,000 ST in 1958) was broken up and dis-tributed to new suppliers which included some 30 countries. The Philippineswas not given an increase of its basic quota, but rather the privilege of
nonquota purchase arrangements. Exports from 1961 to 1964 went up to1,155,000-1,355,000 ST annually. This was reflected in a rapid expansionof 100,000 ha of cane area between the 1962/63 and 1964/65 crop years. Threenew mills were established and a few mergers took place, leaving 26 operat-ing. Until this time, contract between planters and mills, scheduling ofharvest and allocation of vehicles for hauling cane to mills followed thelong established patterns and procedures fairly smoothly.
6. In November 1, 1965, the U.S. Sugar Act was amended and subse-quently, under the Laurel-Langley Agreement, provided the Philippines with
the following:
a. a basic sugar quota of 1,050,000 ST;
b. right to supply to the extent of 47.22% of export deficits
of other supplying countries and the U.S. domestic producers;
c. Philippines sugar to enter U.S. with percentage of dutyaccording to the following schedule:
Until December 31, 1970 40%
Beginning January 1, 1971 80%
Beginning January 1, 1974 100%
The Laurel-Langley Agreement brightened the Philippines sugar export outlook
quota-wise.
7. The increased quota ushered in a wave of new mills. Between 1966and 1971, 10 new mills were built (four in Negros, three in Panay and one
each in Batangas, Cebu and SW Mindanao). As of 1971, 26 "old" mills werealso in operation. Total capacity of the 36 mills is about 126,000 MT of

ANNEX 8Page 3
cane per day. Seventeen of the mills are crowded on the Negros Island andsix in the Central Plain of Panay; these 23 mills in W. Visayas have a totalcapacity of 92,000 MT of cane per day. A second wave of cane area expansiontook place, reaching a record 422,631 ha by 1970/71. This brought reper-cussions, as cane fields were pushed onto rolling land, hills and paddyfields; the contractual arrangements between mills and planters became lax;field operations began to show confusion; and the average sugar yielddeclined.
8. As a result, sugar production increased at a slower rate than ex-pected. With domestic demand also on the rise (from 392,000 ST in 1961/62to 613,000 ST in 1965/66), 1/ actual exports to the U.S. from 1966 through1970 did not meet expectations of 1.3 to 1.5 million tons.
CalendarYear Export to U.S.
('000 ST)
1966 1,1861967 1,1231968 1,1241969 1,1241970 1,2981971 1,594
Although the basic quota of 1,050,000 ST was fulfilled, exports did not meetthe shortfalls in the U.S. market proration (actual quantities are not madepublic, but were made known to the Philippines on a quarterly basis). Withexports to the premium U.S. market remaining under the ceiling, there hasbeen no incentive to fill the small residual quota available under the Inter-national Sugar Agreement.
9. As the expiration of the Laurel-Langley Agreement has drawn near,in an effort to make good its allocated quota, the Philippines resorted to"borrowing" sugar from the succeeding crop. As the crop year normally goesfrom mid-September to mid-September, it is possible to ship sugar producedfrom the middle of September up to November 21 (shipment would land in U.S.before December 31) to fill the export deficit for the current year. Thus,against the CY 1971 quota, the Philippines was able to ship 1,594,000 ST.This amount gives indication of how much the Philippines could have shippedfrom 1966 to 1970 had it had the sugar.
10. In October 1971, the U.S. Sugar Act was again amended. Under theamended Act, the Philippines will, effective CY 1973, get the following:
a. A basic quota of 1,126,020 ST a year. This quota may bereduced if U.S. consumption is reduced, but in no eventshould it be less than 980,000 ST,
1/ Domestic withdrawals from mill warehouses. Sugar Quota Administration.

ANNEX 8Page 4
b. A right to supply 30.08% of the shortfall of U.S.domestic producers.,
c. In the event that the Cuban sugar should be allowed to
reenter the U.S. market, (b) above may be cancelled,
but the Philippines will maintain its basic quota of1,126,020 ST.
11. For CY 1972, it is understood that the Philippines has an effec-tive quota of around 1.4 million ST. Although the flood of Central Luzonreduced output in that region, production elsewhere is up. Because of ahistory of lapses, the Philippines' basic supply position is a weak element
in negotiating future quota arrangements with the U.S.
12. Declining Yields. Yields per hectare have declined basically be-
cause the cane has been pushed onto marginal land, rolling land, hills andpaddies. The sugarcane yield of the Philippines reached a peak of about62 MT/ha in 1958/59, then declined to below 58 MT per ha in all years after
1963/64 except 1969/70 (Table 1). The decline was more striking in theaverage sugar content, which came down from more than 110 KG sugar per
metric ton of cane in 1958/59 to around 90 KG (Table 3). This dual reduc-tion in both the cane yield per hectare and sugar content caused the sugaryield per hectare to decline from 7.7 ST sugar/ha in 1958/59 to 5.4 ST in
1970/71 (Tables 1 and 2). The negative relation between area expansion andyield decline is illustrated in Fig. 1.
13. A factor in declining sugar yields was the establishment of newmills, which interrupted the scheduling of harvest and delivery of cane tomills. Mills have to range widely to obtain cane and some new mills haveonly small daily delivery of cane during a part of the season, all resultingin prolonging the period between harvest and milling and the deterioration
of sugar content. Also in areas with distinct dry seasons, harvesting is
affected by the need to plant the next crop before residual soil moisture is
depleted resulting in bunching of harvest. Another cause of declining yields
is the practice of burning cane before harvest by planters to reduce trash --burning cane together with the delayed milling aggravates deterioration ofsugar content in cane.
14. Regional Distribution. The W. Visayas region, and particularlythe Negros Islands, has dominated the sugar production economy throughout
the recent expansion history. During the same period, Visayas was also thebiggest loser in both cane and sugar yield per hectare.

ANNEX 8Page 5
W. VISAYAS AS % OF NATIONAL TOTAL SUGAR OUTPUT
1958/59 1970/71
Sugar SugarCane Area Production Cane Area Production
W. Visayas Region 62 72 67 73Negros Island Alone 56 66 55 62
REDUCTION OF YIELD (1970/71 FROM 1958/59)
Region Cane/Ha Sugar/MT of Cane Sugar/HaMT Picul Kg Picul ST
Central Luzon -3.7 -0.58 -36.8 -28.1 -1.78S. Tagalog 6.6 -0.29 -18.4 - 3.8 -0.24W. Visayas - Negros -10.4 -0.38 -24.1 -42.3 -2.69
- Panay -17.9 -0.28 -17.8 -43.1 -2.74E. Visayas -10.6 -0.40 -25.4 -40.3 -2.56Philippines - 7.2 -0.38 -24.1 -33.9 -2.15
As the "kingpin" of the Philippines sugar industry, the Negros Island hassuffered most from the repercussion of the recent wave of expansion.
15. Central Luzon, with nearly 70,000 ha of cane and six mills, hashad the lowest yield of cane and sugar per hectare among all regions andthroughout the last two decades. This is apparently due to (a) the pro-longed dry period (December through April) which hinders germination, ratoon-ing and growth of the young cane; (b) delays in milling; (c) preponderanceof small cane growers (Table 4). It is the only region where the 1970/71sugar production was actually less than that of 1958/59. A sharp declineof yield in this region accompanied rapid expansion in 1962/63-1964/65 andthe cane area was reduced in the subsequent four years almost as much asit was increased earlier. The negative relationship between area and yieldin Central Luzon is illustrated in Fig. 2.
Organization of the Sugar Industry
16. There are two main Government agencies created by law and onecommittee created by an Executive Order involved in the sugar industry. ThePhilippine Sugar Institute (PHILSUGIN) is a government-sponsored corporationfor undertaking research and development planning of the industry. TheSugar Quota Adminsitration (SQA) is a government board in charge of licensingand marketing controls in the industry. And the Sugar Stabilization Committee(SSC) implements the sugar price stabilization program following decisionsmade by SQA.
17. The National Federation of Sugarcane Planters (NFSP) deals withthe government agencies and millers' association on all matters concerningbenefit of the planters; it arbitiates arguments among planters, etc. sugar

ANNEX 8Page 6
millers are represented by the Philippine Sugar Association (PSA), Associationof Integrated Mills and Araneta Affiliated with Sugar Centrals. The PSAis composed of 16 operating sugar mills.
18. On the marketing side, the Sugar Producers Marketing CooperativeAgency (SPCMA) and Philippine Producers Cooperative Marketing Agency(PHILPROCOM) provide marketing services to private organizations of sugarproducers. SPCMA owns and operates the Planters' Products fertilizer com-pany, imports both raw material and fertilizer products, and distributesfertilizers to member sugarcane planters.
19. PHILSUGIN, which is under the supervision of DANR, has threesources of income: (a) about 85% of its income comes from a 2% tax leviedon the sugar; (b) about 5% from a basic tax of 0.02 per picul collected fromthe total marketable sugar; and (c) about 10% from operational servicesrendered, such as soil/sugar analysis, subsoiling, lime delivery, irrigationfees, income from experimental farms, etc. In FY 1971, PHILSUGIN had atotal revenue of about P 15 million, of which P 13.7 million were from taxesand P 1.3 million from service receipts. Out of the P 0.02 per picul tax,PHILSUGIN provides P 530,000 to SQA for administration and maintenance ex-penses.
20. PHILSUGIN has broad terms of reference which include practicallyevery aspect of development and planning: research, extension, economics,by-products development, merchandising, improving living of sugar laborers,etc. The governing body is a five-man Board of Directors, two nominated byNFSP and two by PSA, all appointed by the President of the Philippines. TheChairman is elected from among the board members; and the board appoints theGeneral Manager. Headquarters are in Quezon City; one regional office islocated at Bacolod City, Negros, which takes care of operations in theVisayas and Mindanao.
21. The research office has two main research stations (one inPaguiruan, Pampanga Province of Central Luzon, and the other in La Granja,Negros Occidental Province, W. Visayas) and 32 substations for conductingagricultural studies. It conducts industrial research in the Central Labo-ratory at headquarters and the regional office at Bacolod City, NegrosOccidental.
22. The Development Office's main activities include providing exten-sion service to and conducting soil testing from the planters. Its opera-tions are based in Paguiruan for the planters of the Luzon Island and inBacolod City for those of the Visayas and Mindanao. In addition, it carriesout some socio-economic, water and weather studies.
23. There are three other staff units. The Planning and EvaluationOffice is responsible for statistics and control, economic research andtraining. The Economic and Marketing Unit makes special studies pertainingto economics and marketing of Philippine sugar. And the Information Unitprepares and publishes extension and public relation material for theInstitute.

ANNEX 8Page 7
24. Some of the larger sugar companies have their own research andextension programs, i.e. Victoria in Negros and Canlubang in Luzon. Thequality of research done by the Victoria Milling Company.is as high as, ifnot higher, than that of PHILSUGIN. Since almost all sugar specialists areconcentrated either in PHILSUGIN or in the industry itself, DANR actuallydoes not have the technical capacity to supervise the sugar research andextension.
Research
25. Sugarcane is one crop in the Philippines for which most farmersare already employing not only improved varieties, but also fertilizers,pesticides, and mechanization. This is because the sugar planters havelarger average holdings (1970: 17.8 ha) than paddy or corn growers, and thenet income per hectare from cane is considerably higher than for the graincrops. PHILSUGIN carries out a wide range of sugarcane research on plantbreeding, agronomy, pest control, fertilizer application, weed control, andsugarcane physiology. The progress and accomplishments of the basic itemsare summarized below.
26. Variety Improvement. The Philippines used mainly POJ varieties ofJava in the forties and early fifties -- first POJ 2878 and later POJ 2883.From 1955 through 1968, these were gradually replaced by H37-1933, Hawaiianvariety, and POJ-3016, a Java variety. Philippine varieties developedthrough hybridization made up 28% of the cane area in 1968/69, 44% in1969/70, and 62% in 1970/71. 1/ Table 5 gives a list of the old foreignvarieties and the new locally developed varieties planted in the Philippines,together with their agronomical characteristics.
27. Generally speaking, the locally bred varieties are more tolerantto drought, more resistant to diseases and lodging, have a lower fiber con-tent and a higher sucrose content than the older foreign varieties underPhilippine conditions. Their ability to steadily replace the well-knownforeign varieties is a credit to the Philippine cane breeders. Nationally,local varieties having the largest planted area at the present are Phil 53-33,CAC 57-11, Phil 56-226, CAC 57-60 and Phil 58-260, in that order. In somesugar districts, however, varieties other than these are more dominant. Forinstance, in Victoria Milling Company's cane district in north Negros, B-37-172 had the largest area in 1969.
28. The current breeding objectives of PHILSUGIN are high yields,endurance to drought and waterlogging, and resistance to major insects anddiseases. New varieties are released from year to year.
29. The Victoria conducts its own breeding program and is expecting to
produce its own cane variety by 1973 for extension in its own mill district.In 1970/71 , the Victoria mill district had 35,000 ha, the largest in thePhilippines.
1/ Statistics Series on Sugar, Volume 11, No. 1, pages 33-35, PHILSUGIN,January, 1972.

ANNEX 8
Page 8
30. Research on Use of Fertilizers. PHILSUGIN conducts fertilizerexperiments to establish general response of sugarcane yield to the threemajor elements and lime; conducts a soil testing service for making recom-mendations to individual planters; and makes complimentary leaf analysisand physiological studies to corroborate the nutrient requirements of the
sugarcane plants.
31. Based on field experiments and soil analysis data, PHILSUGIN estab-
lished optimum fertilizer application levels for various districts. Forexample, available data for eight mill districts show optimal N levels vary-
ing from 64 kg N/ha in La Granja to 210 kg/ha in Ormoc. PHILSUGIN, however,has not been able to get consistantly good results from P2 05 and K2 0 experi-ments. 1/ Failing to obtain satisfactory indigenous data, it is now usingapproximated ratios of N, P205 and K20 needed for every ton of cane harvested,by reference to published foreign literature on P205 and K20 requirements.Thus, up to 1965, the adopted ratio was 1 N: 0.9 P205 : 2.25 K20. Since1965, it has been using ratios varying from 1:1:2.5 to 1:1:3, depending onK soil analysis.
32. According to the PHILSUGIN survey, Philippine planters on averageused 90 kg, 20 kg and 25 kg of N, P2 05 and K 20, respectively, in 1968/69.In crop year 1969/70, the averages were increased to 120 kg, 60 kg and 65 kg,respectively. The N application rate approaches the recommended levels,
but rates for P2 05 and K20 are far below PHILSUGIN recommendations.
33. Although a great deal of work has been done, the failures in P205and K 2 0 experiments have delayed PHILSUGIN from building up its "Tables ofFertilizer Recommendation Based Upon Soil and Suitability" for each milldistrict. Tables 6 and 7 indicate sugarcane response to fertilizers based
on experiments conducted by PHILSUGIN in Tarlac.
1/ Victoria Milling Company of Negros, based on experiments conducted inits mill district, reported that soils with 10 ppm available P205 and40 ppm available K20 need 100 kg P205 and 300 kg K20 per ha for maximumprofit, and soils with 5 ppm available P205, 200 kg P205 per ha. Itrecommended the following rates of application for different parts ofits mill districts.
N P205 K20
----------------- kg/ha----------------
120 120 180100 80 120
80 80 120120 120 240

ANNEX 8Page 9
34. PHILSUGIN also has conducted a great deal of liming experimentsbased principally on determining the quantity of lime needed to modify thepH to desired level, 6.5 to 7.0. A table compiled for extension workersgives MT of lime to be used for correcting soil pH from 4.0 through 6.5,with values given for three kinds of soil textures: loam, silt loam andclay loam (tabulation).
Tons of Lime to Correct pH of Soil
Soil Clauses Mill DistrictSoil Loam Silt Loam Clay Loam Clay Loam
pH (Biscon) (Haw-Phil) (Ma-ao) (Victoria)
4.0 3.7 4.2 3.5 6.34.5 3.4 3.9 3.2 5.85.0 3.0 3.5 2.9 5.25.5 2.5 2.9 2.4 4.46.0 1.9 2.2 1.8 3.36.5 1.1 1.3 1.0 1.97.0 0 0 0 0
35. Pest Control. For disease control, the research is centered onbreeding for disease resistance to smut, mosaic, downy mildew, leaf sc:orch,red rot and nematode. Methods used include hybridization of varieties withknown resistance and mutant initiation by irradiation. It is part of thecontinuing breeding program.
36. Insect control research included experiments on chemicals for con-trolling army worm, locust, sugarcane borer. Studies of rat activities inthe cane fields and control methods are also being conducted. Cultural prac-tices for insect and rodent control have been recommended; and planters doseek the assistance of PHILSUGIN extension officers in controlling them.
37. Cultural Practices. Research includes studies on herbicides,ratoon culture, rate of planting, distance of furrows, and interaction be-tween rate of planting and fertilization. PRESCO 18-15 alone and 2-4D forpreemergence treatment are commonly used. Other chemicals are being studied.
38. The traditional planting rate is 1 meter between furrows at 30,000points/ha. Experiments are being conducted by PHILSUGIN to compare thatwith other combinations; furrow distances ranging from 0.75 meter to 1.5meter and plant populations from 15,000 to 45,000 points/ha, and in someexperiments to as much as 60,000 points/ha. The results of these experi-ments are not yet conclusive.
Extension Service
39. The extension service of PHILSUGIN operates from the two regionaloffices in Pampanga and Bocolod City under the supervision of the RegionalDirectors. For each mill there is a Mill District Director (MDD); for smalldistricts, one MDD may supervise two districts. The MDD's supervise the

ANNEX 8
Page 10
Sugar Extension Workers (SEW). In 1970/71, there were 28 MDD's and 176
SEW's for all mill districts, each SEW supervised an average of 2,500 to2,600 ha of sugar plantations. Each SEW is assigned to a given Extension
Work Area (EWA). The SEW's work includes such activities as surveying and
reporting on area planted or drought damage, harvest date of variety, rain-fall recording and weekly mill statements; conducting applied research plots,
and providing advice and services to planters.
40. Fourteen soil laboratories of PHILSUGIN conduct soil testing forand prescribes fertilizer application to planters. In 1969/70, these labora-tories analyzed approximately 15,000 soil samples representing 31,300 ha;in 1970/71, testing fell to 5,000 samples, representing about 15,000 ha.Records show that for Luzon, since 1957/58, the average holding of plantersrequesting soil testing was never less than 49 ha. Since well over 90% of
the planters in Luzon have less than 50 ha, only the largest planters have
taken advantage of the PHILSUGIN soil testing service.
41. The extension service maintains nurseries of its own and contractsCooperators to multiply seed points in different mill districts for distri-bution to planters. In 1969/70, some 12.6 million pieces of cane points ofimproved varieties, and in 1970/71 20.2 million points, were distributed.At the current rate of planting, 30,000 points/ha, the distribution couldonly plant 420 ha and 673 ha, respectively. However, most planters use their
own cane for planting. They come to PHILSUGIN only when they need to changethe variety, which they may also get from other planters. The supply of
cane points has not been a constraint.
42. The PHILSUGIN extension service also trucks lime and fertilizersand renders subsoiling services to the planters on request, but the cover-age is very small. For example, reports in 1970/71 listed 633 tons of limefor 29 planters, 3,824 bags of fertilizers for 384 planters, and 217 ha of
subsoiling for 18 planters.
43. In 1970/71, the service also conducted hydrological surveys in
three mill districts, irrigation feasibility studies for nine planters,
and recorded rainfall data from 219 rain gauges in 32 mill districts. It
conducted 72 applied research field plots on new varieties (Phil 62 and 63series) in 25 mill districts.
44. The service is preparing mill district maps (1:50,000 base map)
which will include basic information on soil types, fertility levels, hydro-
logical data, adaptability of varieties and locations of MDD, EWA, SEW soil
laboratories, rain gauges, and supervised farms. This should be a useful
computation when published.
Supply of Inputs
45. Fertilizers. Although PHILSUGIN makes fertilizer recommendationson the basis of soil testing -- and the recommendations vary from plantationto plantation -- the national average recommended rates of fertilizer ap-
plication are placed at 120 kg of N, 120 kg of P205 and 240 kg of K20 per

ANNEX 8Page 11
hectare. 1/ The actual rates of application by sugar planters were reportedto be about 120 kg of N, 60 kg of P205 and 65 kg of K20 per hectare in1969/70. More recently there has been some decline mostly reflecting therise in fertilizer prices following the 1970 peso devaluation.
46. The Sugarcane Planters Cooperative Marketing Association (SPCMA)bought the Planters fertilizer plant from Esso in November 1970. The planthas a rated capacity of about 360,000 MT (of the national total of about.690,000 MT). In 1968, it produced about 140,000 MT of fertilizers, out ofnational total of about 240,000 MT. The SPCMA now moves more tonnage offertilizer than any other firm or agency, primarily to its affiliated as-sociations and sugarcane planter members. It maintains warehouses wherethe stocks are stored and distributed.
47. Pesticides, Herbicides and Machinery. Sugarcane is known to bethe largest user of pesticides, herbicides and farm machinery. Quantitativedata, however, are not available.
Recommendations for Improvement
48. The Philippine sugar industry must increase production to fillU.S. quotas and to reduce high costs of production. Twice in the pastdecade, it tried to increase production by expanding area and building newmills. Twice the increase in area was offset by a decline in sugar yieldper hectare and an increase in production costs per pound of sugar. Abetter alternative for the future would be to increase production and reducecosts through increasing sugar yield per hectare. The major responsibilityfalls on the planters and mills themselves.
49. Loss of Sugar After Harvest. The first order of business is toget all the sugar out of the cane produced; that is, reduce the disappearancebetween harvesting and milling. Cane quality declines rapidly after 48hours from harvest; burnt cane loses more sucrose and juice purity thanunburnt cane when milling is delayed. Burning to remove trash is accept-able if the burnt cane is milled within 24-48 hours from harvest. ThePhilippine planters and mills know these well established facts. But withthe expansion of cane area and number of mills, the once strict schedulingof harvest and delivery of cane to mills loosened. Increasingly, it is eachplanter for himself, each mill for itself. The unsyncronized harvestingresulted in a pile-up of cane during a part of the season and delays inmilling. For some mills, the daily delivery is so small during part of themilling season that they have to accumulate enough cane to make one running.It is conservatively estimated that the Philippines loses at least 10% ofsugar production through the combination of delayed milling and burningbefore harvest. This means a loss of 200,000 ST of sugar, or $26 millionannually at $130 per ST. 2/
1/ Report of Sub-Committee No. 1, Technical Working Committee, Presidential
Fertilizer Commission, 1971.
2/ December 1972 Price - $9.07 per picul (63.5 kg), CIF/NY.

ANNEX 8Page 12
50. The solution to this problem is to reestablish a strict schedulingof harvesting and delivery of cane to mills by planters within each milldistrict. Unless the planters and mills are willing and determined to re-impose self-discipline, the Government and PHILSUGIN are impotent to help.Given cooperation, however, PHILSUGIN could work with them im mapping outan overall planting and harvesting plan for each mill district and for in-dividual planters, including:
a. The proportion of early, medium and late maturing canevarieties to be planted in the district and by each planter.
b. Nurseries to supply the cane points of different varieties.
c. The staggering of planting time (including ratooning) withineach category of varieties to further even out harvesting andmilling.
d. Schedules of harvest and delivery.
PHILSUGIN could assist in implementing such a plan. But the actual con-tracting, adherence to schedule, and allocation of cane cars and trucks canonly be enforced by planters and mills themselves. In order that effectivesynchronization of farm and factory operation can be instituted, the sugarplanters will obviously need more tractors for implementing a strict schedulefor land preparation. PHILSUGIN information indicates that only planterswith farm size of 50 ha and up could afford to own tractors. Tractor poolsfor smaller planters have been suggested. More hauling trucks are alsoneeded if smaller planters are to adhere to harvesting schedules. In Panayand Luzon where sugarcane cutting season coincides with rice harvest,mechanical harvesters need to be introduced. Since the Philippine sugarindustry as a whole is not one that is really short of capital, it wouldserve the industry's own interest to invest in procuring the trucks and farmmachinery. The mission recommends that a feasibility study be jointly madeby PHILSUGIN and PNB to analyze financial and economical benefit of suchinvestment to the mills, the planters, the sugar industry, and the nationaleconomy, and the industry's own resources be mobilized for the needed invest-ment.
51. In regions with a distinct dry season, i.e. Central Luzon, Batangasof S. Tagalog, Iloilo of Panay, Negros Occidental south of the Bacolod City,farmers must harvest cane before the onset of the real dry period, so as toplant or ratoon the next crop before the residual soil moisture depletes.During this period, some piling up of cane at the mill or field is unavoid-able at present. However, the loss of sugar can be kept to a minimum byplanting a higher percentage of early maturing cane, by restricting theburning of cane during this critical period, by using self-trashing varie-ties so that the need for burning will be lessened, and by mills operating24 hours a day during the peak.

ANNEX 8
Page 13
52. Evening Out the Harvest Period. Although many of the locally bredvarieties have a maturing period of from 10 to 13 months, they are mostlymedium maturing varieties. There is need to develop more truly early maturing
varieties -- with the sucrose content reaching say 2 piculs per metric tonof cane in less than 12 months under Philippine conditions; and late maturingvarieties -- the sucrose content remaining at a high level for several monthsafter the peak is reached.
53. In regions with a distinct dry season, there appears to be a goodcase for installing irrigation facilities. Only 7% of sugarcane is now ir-
rigated. The profitability would of course have to be studied on a case bycase basis. When the threat of drought is eliminated, the harvesting andplanting schedules can be extended to even out the existing peak of harvest.
The cane tonnage and sugar yield per hectare would also be increased.PHILSUGIN's Office of Development does not have enough irrigation engineers
to effectively serve the planters in this need. The engineering staff should
be strengthened.
54. Pest Control. The existing cane varieties are more resistant todiseases than the foreign varieties used earlier. But they are still sus-ceptible, or only moderately resistant, to one major disease or the other.
Breeding for resistance to a wider range of diseases is necessary.PHILSUGIN's research staff for cane breeding and pathology needs to befurther strengthened.
55. None of the current extension varieties have reached the dominance
once achieved by the foreign varieties used in the fifties and sixties. Onecomplaint is that cane varieties are deteriorating as fast as new varietiesare coming out, caused perhaps mainly by the prevailence of ratoon-stunting
disease. The ongoing pathology research, however, does not seem to emphasizethis disease. Hot-water treatment of cane points is being recommended, butthe extension program does not include a vigorous campaign to see that plantersactually carry out the treatment. Among varieties, the once popular H37 -1933 and POJ3016, and the leading locally bred Phil 53-33, are all suscepti-
ble. A special effort seems necessary to reduce damage from this disease:measures should include investment in equipment for doing the hot-watertreatment, a more vigorous campaign in treating cane points, and breeding
for resistance to ratoon-stunting disease.
56. Soil Erosion on Slope Land. Farmers planting sugarcane on slopeland are experiencing a gradual decrease of cane yield. Furthermore, stonesand pebbles are beginning to appear in hill soils. As stated earlier, thespreading of sugarcane onto slope land without the adoption of soil conserva-tion practices is a major factor in the declining average cane and sugaryield over the last decade.
57. The Victoria Milling Company estimated 1/ in 1968 that "no lessthan 85% of the 30,000 ha area in its mill district is subject to serious
1/ Victoria Experiment Station Bulletin Vol. 15 No. 5 and 6, Mat/June 1968.

ANNEX 8Page 14
soil erosion problems owing to its undulating to rolling topography". Itfurther estimated that under the prevailing rainfall of the mill district(over 100 inches a year, and an intensity of as much as 2.0 inches per hournot being uncommon), the loss of soils per year is as follows:
Land % of Slope MT of Soils Lost Annually
Bottom Land Less than 5 1.50Moderate Slope 5 - 25 25.00Steep Slope Over 25% 50.00Hill Top 35.00
Victoria is an old mill; and the land of its mill district is better thanaverage. If Victoria feels the threat of soil erosion, the problem must beeven more serious for most other mill districts.
58. While one cannot expect the small farmers growing corn or uplandrice on slope land to practice contour farming at this stage, the authori-ties should be more insistent that the sugarcane planters practice it. Withgood contour farming, sugarcane has been grown quite satisfactorily in othertropical countries on land of up to 15% slope. In view of the much higherfarm income per hectare from sugarcane, the larger farm holdings, thesophistication of the sugarcane planters, and the already wide practiceof mechanized farming by the planters, the adoption of contour farmingdepends on the will of the planters. There is no serious technologicalgap. The planters will need assistance in surveying and staking out thecontours and in designing land grading and drainage way treatment. PHILSUGINmay be understaffed to handle this job. The Bureau of Soils' soil conserva-tionists may be called upon to help.
59. In the Philippines, it would also be expedient to use the criterionfor "alienable forest land" -- i.e. 18% slope -- as the first target forrestricting the planting of sugarcane on steep slope land. Lands of morethan 18% slope and the hill tops should be returned to woods or put underimproved pasture.
The Outlook for Supply and Demand
60. The mission projects demand requirements as follows:
Domestic Export MarketYear Demand Potential Carryover Total
------------------------- 000 ST-----------------------
1971/72 (base) 715 1,400 2,1151974/75 775 1,500 - 2,2751979/80 875 1,500 356 2,731
In making these projections, the mission accepted PHILSUGIN's estimates fordomestic demand (increasing 20,000 ST per year) and an export potentialof 1.5 million ST (excepting 1971/72, where actual exports were estimated
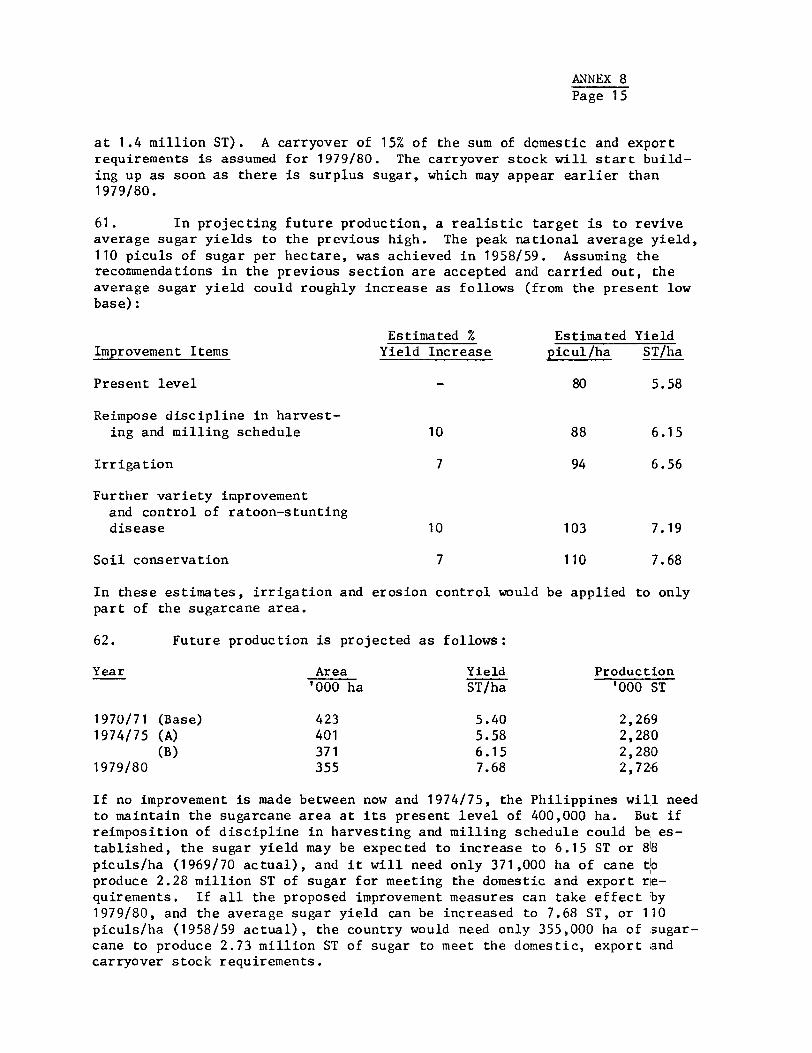
ANNEX 8
Page 15
at 1.4 million ST). A carryover of 15% of the sum of domestic and exportrequirements is assumed for 1979/80. The carryover stock will start build-
ing up as soon as there is surplus sugar, which may appear earlier than1979/80.
61. In projecting future production, a realistic target is to reviveaverage sugar yields to the previous high. The peak national average yield,
110 piculs of sugar per hectare, was achieved in 1958/59. Assuming therecommendations in the previous section are accepted and carried out, theaverage sugar yield could roughly increase as follows (from the present lowbase):
Estimated % Estimated YieldImprovement Items Yield Increase picul/ha ST/ha
Present level - 80 5.58
Reimpose discipline in harvest-
ing and milling schedule 10 88 6.15
Irrigation 7 94 6.56
Further variety improvement
and control of ratoon-stuntingdisease 10 103 7.19
Soil conservation 7 110 7.68
In these estimates, irrigation and erosion control would be applied to only
part of the sugarcane area.
62. Future production is projected as follows:
Year Area Yield Production
'000 ha ST/ha '000 ST
1970/71 (Base) 423 5.40 2,2691974/75 (A) 401 5.58 2,280
(B) 371 6.15 2,2801979/80 355 7.68 2,726
If no improvement is made between now and 1974/75, the Philippines will need
to maintain the sugarcane area at its present level of 400,000 ha. But ifreimposition of discipline in harvesting and milling schedule could be es-tablished, the sugar yield may be expected to increase to 6.15 ST or 88
piculs/ha (1969/70 actual), and it will need only 371,000 ha of cane toproduce 2.28 million ST of sugar for meeting the domestic and export re-quirements. If all the proposed improvement measures can take effect by1979/80, and the average sugar yield can be increased to 7.68 ST, or 110piculs/ha (1958/59 actual), the country would need only 355,000 ha of sugar-cane to produce 2.73 million ST of sugar to meet the domestic, export and
carryover stock requirements.

ANNEX 8Page 16
II. TOBACCO PRODUCTION
Trends of Production and Export
63. The Philippines grows five types of tobacco: Virginia tobaccofor both the local cigarette industry and for export as leaves; Nativetobacco used mainly as cigar filler; cigar wrapper; white burley; and Turkishtobacco for cigarette blending. The first two types are the main crops.
64. According to BAEcon data, the planted area of Virginia declinedfrom over 50,000 ha in 1960 to about 25,000 ha by 1967 and since then in-creased to about 29,000 ha in 1971 (Table 8). Yields have increased inrecent years, averaging 692 kg/ha in 1971 compared with 662 kg/ha in 1960.Production in 1971 was about 20,000 tons compared with 34,000 tons in 1960.Ilocos region is by far the main producing area of Virginia tobacco. IlocosSur province alone produces about 50% of the Nation's total (Table 9).
65. The 1971 planted area of 47,000 ha of Native tobacco was slightlyhigher than in 1960 but down substantially from 65,000 ha planted in 1968.Yields of 767 kg/ha in 1971 compared with 675 kg/ha in 1960 but have notexceeded the yield attained in 1962. Production of 36,000 tons in 1971 wassubstantially below the 47,000 tons produced in 1968.
66. Statistics on the production of the other types of tobacco isincomplete, but production is small. Wrapper tobacco is grown in Ilocos,Cagayan Valley, and S.W. Mindanao.
67. According to Central Bank data, the total FOB value of exports in1971 was US$14.6, just about the average of the 5-year period 1967-71. Thisrepresents some decline from the US$16.7 recorded in 1969. The U.S., Spain,Indonesia, Hongkong and the Netherlands are major markets for Philippineleaf tobacco; while the U.S., Belgium, West Germany, the Netherlands andHongkong are markets for its cigars.
Organization
68. Virginia and Native tobacco industries are looked after by thePhilippine Tobacco Administration, respectively. Functions of marketstabilization formerly exercised by these authorities were recently turnedover to the private sector.
Research and Extension
69. BPI has developed, through introduction and hybridization, im-proved varieties for all types of tobacco being grown. The breeding objec-tives, besides high yield and quality, have been resistant to major dis-eases: bacterial wilt, mosaic and cercospora leaf spot. The BPI recom-mended varieties are being widely accepted by farmers. A list is given inTable 9.

ANNEX 8Page 17
70. Based on survey and field experiments, BPI's recommendations forsoil adaptability and fertilizer application may be summarized as follows:
Tobacco Types Adaptable Soils Fertilizer Rates
Virginia Sandy loam and silty loam 5-10-16, 6-16-184-8-10
Native Rich alluvial and sandy loam 12-12-19, 12-24-1212-12-12
Cigar Wrapper Clay loam and newly opened 12-12-19, 12-24-12forest land 12-12-12
White Burley Fertile silty loam 12-12-19, 12-24-1212-12-12
But, in fact, the majority of tobacco growers in the Philippines do not useany fertilizer at all.
71. BPI has also recommended cultural practices specific to differenttypes of tobacco; such as planting spacing, depth of tillage, topping, suckercontrol, shading for wrapper tobacco, etc. These are followed by farmers tovarying degrees.
72. The major tobacco insects in the Philippines include cutworms,stemborers, aphids, caterpillars and various leaf-eating insects. Nematodesare also prevalent. Control measures have been recommended. Those notrequiring purchase of chemicals are being followed to a greater extent,such as crop rotation, sunlit nurseries, use of resistance varieties,eradication of diseased plants, etc. Use of pesticides and soil fumigantsare limited.
73. Flue-curing recommendations include the best temperatures for dif-ferent curing phases, and use of oil fuel rather than firewood. But mostfarmers are still using firewood for curing.
74. Planting and harvesting seasons are recommended by BPI as follows:
Cigar WrapperTime of Virginia Native Other
Operations Tobacco Tobacco Cotabato Places
Seed bed Aug 15-Oct 31 Aug 15-Oct 31 Sept-Oct Aug-Oct
Transplanting Oct 1-Dec 15 Nov 1-Dec 30 Nov Nov-Dec
Harvesting Nov-Jan First harvest, Dec-March Jan-MarchJan 25-Feb 1followed by, 7-8primings at 5-10day interval.
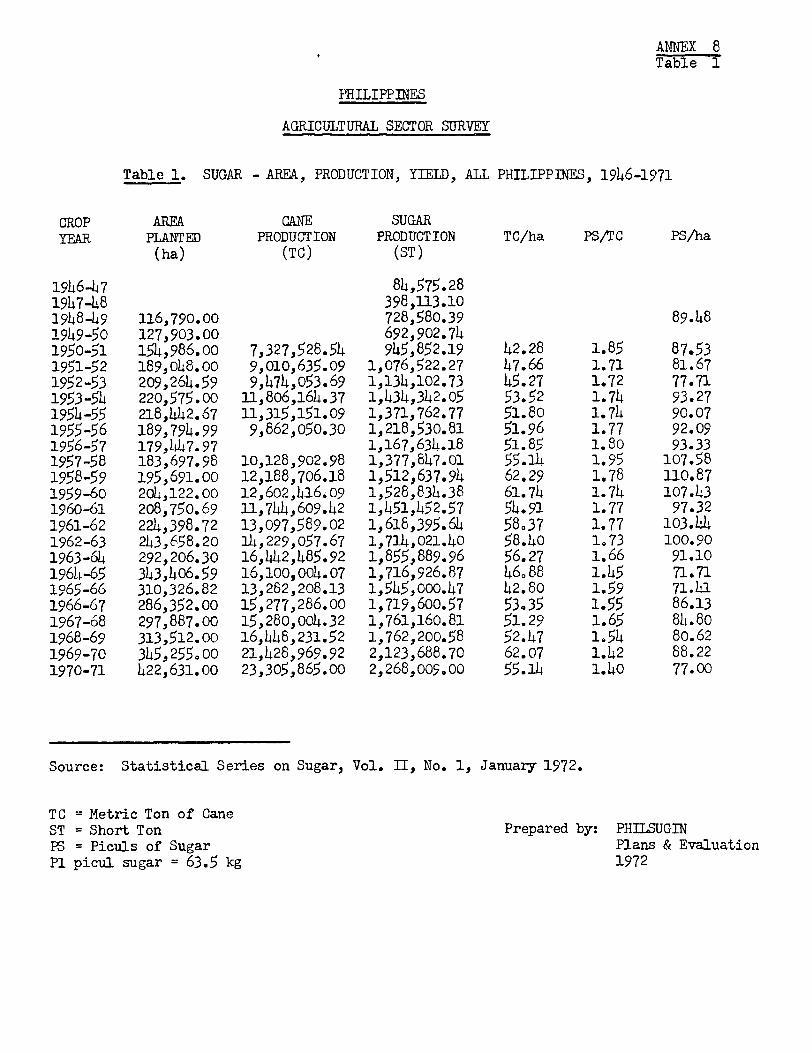
ANNEX 8Table 1
PHILIPPINES
AGRICULTURAL SECTOR SURVEY
Table 1. SUGAR - AREA, PRODUCTION, YIELD, ALL PHILIPPINES, 1946-1971
CROP AREA CANE SUGARYEAR PLANTED PRODUCTION PRODUCTION TC/ha PS/TC PS/ha
(ha) (TC) (ST)
1946-47 84,575.281947-48 398,113.101948-49 116,790.00 728,580.39 89.481949-50 127,903.00 692,902.7411950-51 154,986.00 7,327,528.54 945,852.19 42.28 1.85 87.531951-52 189,048.00 9,010,635.09 1,076,522.27 47.66 1.71 81.671952-53 209,264.59 9,474,053.69 1,134,102.73 45.27 1.72 77.711953-54 220,575.00 11,806,164.37 1,)434,342.05 53.52 1.74 93.271954-55 218,442.67 11,315,151.09 1,371,762.77 51.80 1.74 90.071955-56 189,794.99 9,862,050.30 1,218,530.81 51.96 1.77 92.091956-57 179,147.97 1,167,634.18 51.85 1.80 93.331957-58 183,697.98 10,128,902.98 1,377,847.01 55.14 1.95 107.581958-59 195,691.00 12,188,706.18 1,512,637.94 62.29 1.78 110.871959-60 204,122.00 12,602,416.09 1,528,834.38 61.74 1.74 107.431960-61 208,750.69 11,744,609.42 1,451,452.57 54.91 1.77 97.321961-62 224,398.72 13,097,589.02 1,618,395.64 58.37 1.77 103.41962-63 23,658.20 14,229,057.67 1,71-4,021.40 58.40 1.73 100.901963-64 292,206.30 16,442,485.92 1,855,889.96 56.27 1.66 91.101964-65 343,h06.59 16,100,004.07 1,716,926.87 46.88 1.45 71.711965-66 310,326.82 13,282,208.13 1,545,000.47 42.80 1.59 71.411966-67 286,352.00 15,277,286.00 1,719,600.57 53.35 1.55 86.131967-68 297,887.00 15,280,004.32 1,761,160.81 51.29 1.65 84.8o1968-69 313,512.00 16,448,231.52 1,762,200.58 52.47 1.54 80.621969-70 345,255.00 21,428,969.92 2,123,688.70 62.07 1.42 88.221970-71 422,631.00 23,305,865.00 2,268,009.00 55.14 1.4o 77.00
Source: Statistical Series on Sugar, Vol. II, No. 1, January 1972.
TC = Metric Ton of CaneST = Short Ton Prepared by: PHILSUGINPS = Piculs of Sugar Plans & EvaluationP1 picul sugar = 63.5 kg 1972

PHILIPPINES
AGRICULTUIЫ SECTOR SURVEY
ТаЫ е 2: SUGARCANE - AREA, PROIцTCTION, YIEZD, Ву REGION
1 пс о 1
1Ч19/60 i' �м.1l61 1oG1161 79 б2/G3 19 бЭ /64 1964/65, 1" Ь; гбе 19!_ б/67 1967 69 ] лбS/ б9 1969/70 1Ч 70'71 1Ч5А 59 1tii �,---
19ty!5 а
21 а :: сгд ,1 � г .: (ha)
Сепсга l 7. и о п <5.5]3 с 7.703 5'_, ЬG: 56.2? р 75 �,5 Ч9 Е7. П0) 7:.]93 65.4 С 9 62.nB. 60,555 62,3:0 6fi,};; 44,45s 24,16G
5. T., � aIcS 22.in9 2?,79 В 22.0/5 2G,24t, 26.24 с и . бЭ . 27,225 2b,745 д , с :7 29. �.G2 36,3; � � , гчЛ 21.719 23,L' � 9
У , Viaayea - t:rgr гe 115,4)0 11 Э ,179 127,0'sl 156,214 159,254 1� 'а ,9_ �1 174.104 161,1.U 1Gч ,77J 170, г� 11 194,206 ' а2,416 110,136 1:2, ТА0
-:+.': ц ,' 12,] ЧЭ 3'_,D14 1 Э ,1}7 14,474 18, й54 20,981 20,17 а 19,104 20,541 T7,J11 37.602 49,115 11,432 3/,4 Р Э
Е . Уf яиу , ь В , ц 9 ц ,607 9,412 10,576 12,654 15,46:, 11,726 17,774 14.7:2 Т9,779 19,4UU 27,360 8.226 19,154
P1;1LiPF'7:'ES 20+,122 213,9U] 224,]99 243,696 292,2U6 ]TI,207 310,727 206,152 2 ЭЬ ,597 З i3. Ь4 Т J4o,950 422, Ь31 195,691 226,940
слп. Ргодиги ол П , ОО0 слд
Сепгта l Luzon 2,1 д6 1,656 1,976 2,598 2,631 3,07 Ь 2,19] 2,310 2,2 Ь7 2,tJ0 - 2,483 1,775 70R
5. i ь� а l пБ 1,241 99: 1,142 1,:i6 1,274 1,3:4 1,?59 1,705 1,:00 1,'N2 - 2,472 7,0]5 1,417
Ч . Vfsn)' аь - Nгgros 7,976 ),595 Ь ,4 С9 8,AJ8 10,668 9, Ь71 9,422 9, ВА4 9,76! 10,027 - 14, С42 7,990 6,452
- islqy 75 В 7]5 б+2 !45 1,09 о" 1,148 ЬЬБ 1,016 037 1,3'_? - 2,41) 767 1,bi0
Е. Vieayna 4Е2 554 6Gi G29 813 GЬЧ 5Э6 762 -
В. О 1,496 - 1,560 556 1,OG+Cil1L1PP1 �T.i 12,64] 11,7 Э8 l3, ОЧ8 14,2.9 16,443 16,100 :3,282 15,277 15,285 16,4.6 - 23,324 12,094 11,230
S иРэг Р гоЛисг l ип (1, ОЭ0 Р1си1 е)
Cenrral Luron 3.75L i,222 3,568 4,575 4,299 4.3 ЭЬ 3,534 3,64I 3,404 3,504 Э ,441 3,317 Э ,434 �-77
б . Tagalog 2,1 СЗ 1,750 2,097 2,190 2,105 2,167 2,G5] ,2 А2 2, Э 5Ь 2,l',5 2,930 7.615 1,618 1,657
У . У 1< ауле - Ч_г� соа 14,048 1 Э ,766 35,1:.J 15,29J 17,17 р 15,519 14,4 д7 16,009 1Ь , Ь 89 15,3'i7 15,4iJ 20,293 14,276 6,01 Т
- i: л .'/ 1,25 Н 1,256 1, Э� ) 1,5ti9 1,765 1,659 1,432 1,G11 1,6Ufi 1,H � h 2, р29 3,3:0 1,: ои 2,054
6. У1�;,у� ?)7 82с 1,01s ЧТО 1,1 Ч2 916 л 0 1,120 1,2s5 t, vz 1,ьs1 1,500 во) чч0PXII:P Г16Z5 (1, П00 Р1 си1 ь) 21.Y20 2J,616 23,2 � 3 2 й .5° с 26.f,19 24,626 22.2W 24.6G5 25.311 25.2'r4 70,46 П 32.5.4 2i,696 :0.8 г,`l
(1,CU0 5 Т) 1,129 1,451 1,G;d 1,7: с 1,856 1,):7 1,545 7,120 1,761 1,7 Г,? 2,124 2,16 Ч ),513 75G
(1',OJO М :) 1,3 А7 1,316 1,4i9 1,55i 1,664 . 1,558 1,402 1,560 1,598 1,598 3,927 2,05 В 1,]7 Э ЬЬ 5
г Yi=! д fYicul/h �
Ccntral Luxon В2.4 67.5 61.7 81.4 56.9 50.2 40.8 55.7 54.3 57.9 55.2 4 В .8 ТЬ� 9 -28 � 1
5. Та� а ' п8 96.6 76.7 95.0 87.4 8 Э .'l 80.7 )4.2 В5.] 8l.) )9.6 БО . Ь 81. В 55.6 -3.8
Ч , l'l лауаь -': с5 то з t21.6 175.9 1:5.1 172.2 107.9 87.7 82.9 99. й 9 В .7 50.2 9 Ч .9 Н7.3 125.6 -42.3
- Рьч� ,� 101.5 10� .4 ]С5.3 108.3 95.6 )9.1 71.0 84.3 78.2 72.9 71.1 б7.6 1iJ.7 -43.1
. Ytea � пs 64-1 65.4 1С5.7 97.0 94.2 59.2 48.9 б 1.3 65.1 72.9 95.4 69.4 10v,7 -40.3
РН 7L1r Р]ьг 5 ( Р1си1/ha) 10).4 97.3 103.4 100.9 91.1 75.3 71.4 86.1 84. Ь 80.6 6s.2 )).0 110.9 -33.5(5 Т/h п) 7.5 6.8 Т.2 7.0 6.4 5. Э 5.0 6.1 5.9 5.6 6.2 5.4 ).7 -2.3(пТ/haj 6.8 Ь.2 Ь.5 6.4 5.8 4. В 4.5 5.1 5.6 5.1 5.6 4.9 7.0 -1.1
Source: See ТаЫ е 3. F,ы ь�т
�v « �

РНI тIPPINES
AGRIG`ULTURAI, SECTOR 5UR':ЕУ
ТаЫ е 3 s SUGARCANE - CANE YIELD AND S цГт�1R CONTENT
l пг лч s г of 1970/7lм ог195o,F0 19 п0!61 19 Ы / Ь ' 1аи?Jn7 19Ri'64 19 б :.165 I7GSl п6 19 г6l б7 I967/( Р 1 о(eJlo lnf '7 П 1770J71 1 о� �� i39 1756/59
Сепг 1I._!Л_ � _'h. �
Сгпгга l си�оп GA.O 39.0 Э7.5 46.2 )4.8 75.4 J0.4 35.3 36.2 78.7 - 36.1 39. В 7.75. Таg п '.og 55.9 4 � .7 32.6 4G.3 47.0 45.0 65 А 4 д .8 48.5 43.5 - 53.9 47,3 Ь . ЬИ'. Угь ;.v я в - Аг� гпв 69.1 6]. Ч 66.5 64, у 67.0 55: В 4 В .) 61.7 57.3 58.7 62.] 72.5 - 10.4- Рапгу (.1.1 61.1 67.7 45.6 39.5 54.7 47.0 57.2 50.5 50.1 - 49.1 67.1 - 17.9Е . vi � лу .� s ' S6.5 44.0 72.7 59.) 64.) 4G.5 35.0 45.4 55.6 50.2 - 57.0 67.6 10. оFF111vP]:;e5 61.7 54.9 58. й 58.4 54.] 46.9 42.8 3).4 51.3 52.5 61.1 55.1 6.J - ),25 и .,, г Г ,� п ;, � пг (? гг : � 1 ef- - г Г е ; :Т � Ч п� '1
Сгn ггп l Luzon 1.77 1.73 1.81 1.76 1.63 1.42 1.61 1,5 А 1.50 1.51 - 1.35 1.97 - U.566. 7'ал ,� 1о� 1.7 З 1.7L 1.8! 1,60 1.77 1.65 1.6] 1.75 1.6 В 1.8 Э - 3.52 1.61 0,19ь . У t ь-, уп в - � гсгск 1.76 1.91 1.79 i.)7 1.61 1.57 1.72 1.62 1.71 1.54 - 1.41 1.79 0.] б- Рапгу 1.6G l.%1 1.66 1.63 l.6 1,44 1.65 1.5 б 1.55 1.45 - 1.J7 1.65 0.18Е. Уt вауав ' � 1.45 1.49 1.51 1.54 1.47 1.73 1.40 1.47 1.5] L 45 - 1.12 1.61 0,40P81L1 ЛPi � CS ( Р5/ М С ) 1.74 1.77 1.77 l.7] 1. ЬЬ 1.45 1.59 1.55 1.63 1.34 1.42 1.40 1.7 В - О .3 В(Kge/ К � С) 110.49 112.40 112.40 l09. д6 105.41 92. ОВ 100.97 96.43 104.78 97.79 90.17 88.90 1]].03 ' 24,1]
Fоогпосгх�
1. бта11 д lr сге ; апг l ее ега дсе со rounding.
1. 1958/59 дасе ав р l есед ве che en1 о [ che вгг i еs ( ог еаьу cempari.un vlch 197G/73 длсе .
60l: КСЕ О г' � АТА : 6uvnariz¢ д frOm dat � for ln гilvldual sugnr т111 в , S сас : ьс l га l 5erles ро Sugar, Уо l ите 13, Ко . 1, ] епиагу 1972, Ph(1lpp3ne Suger Inacicuce, Dillnan, Qигкоп С ( су .
Н �Ф
�NФ
Ф

AMM 8Table'7
P11TLIPPI11 =
AG-RICTJLTURA.L SECTOR SUR-ITET
'Table LA: PERCENTAGE DISTRIBUTION OF SUGARCANE FARM, BY REGIONS, 1971
% Distribution of Farms by Size in HaRegion Less 5-30 27-3U-5b-100 100 up Total
than 5
Luzon Island 61.02 15-09 14.47 5.81 2.29 1.30 100W. Visayas
Panay 44-70 25.26 18.64 6.75 2. "0 2 100Negros 25-01 14-52 23-97 16.60 12.81 7.09 100
E. Visayas 35.22 20-38 24-33 9.54 5.54 4.94 100PHILIPPINES 45.48 16-71 18.67 9.69 5-95 3-5o 100
Table B: SUGARCANE AREA, NMIBER OF FAMIS AND AVERAGE FARM SIZE, 1971
Number of Mill /1 Number of Average'FarmRegion Districts Area7- Farms Size
ha haLuzon Island 9 112057 lo,830 10.4W. Visayas
Panay 6 49,117 3)642 13.5Negros- 16 223)874 7.,652 29.3
E. Visayas 3 23,997 819 29.3PHILIPPINES 34 411,505 22,973 17.8
Source: Statistics on Sugar,, 1971, Information Center,National Federation of Sugarcane Planters,Bacolod City.
/1 1070/71 sugarcane area repox-ted b-v PHILSUGIN was Luzon, 113,'720 ha,Panay,, 49,115 ha, Negros 232,416 ha, E. Visayas 27)380 ha. AllPhilippines 422,631 ha. Discrepancy due za!: ibly to fa.-rns not undercontract with any mills.

PКLLIPPINE5
AGRICULr"URAL SECTOR SURVEY
Tab1e 5: SUGARCAЛтEr - AGRONOMIC CHARAC'I'ERI5TICS OF COMMERCIAL VARIETIES AS MANIFESTEDIN VIC't'ORIA. SUrAR CEN'PRAL DISTRICT, rTECP.OS, ?яF. ?rISAYAS
пепгh ч соt'arirc �: Раге :гга_г,е Rаге г Е дго и гh Gггп ( по с( оn Rлга � п i пе titlering Ftwering м , сиг l су 5cn1k Trashln8 Rеь l вгаппг со P,seases То l етапег сп Drouyht А дар l а !,111 су 5 исгоче гпn геп [ F16er с . епс
П ) i д ( з) ( � ) (s) ( ь ) (7) ( в> (9) (1 о > (1;) п 7) л 3i (1 а� п
Recrc г Сг -:-; гг1а : t'.irircir=
1. F;.t1 54-260 С47 а PW1016 .,, га гс i у Сго .: d1gL seub � le сиод Ргоf иье 10-12 5o1id 5 � mi-cclf estscarc го п и с . Noderac г ly reststanc [ о L оы Lovland егеа� xlgh 11ZLf л :c е.огга l[ су [ гелhl пg 1 еяС ьготсб епд yc:lov ., ог
2, Fh11 56-95 1'41:822 к � С0730 Fase Усгу gгод Gопд Very Соод Рго f ияе 11.13 4 о11 д Trashy Res[ егап с te ят гс. Мпдггагг l у resl ь tanc N4gh Ч 1де H1gh 17.5;со leat scorch and yellov ьрос
З . Рм(! 56-226 PCJ х Сг 76-105 51cv 1 п елг l у ConJ Соод Hua � ry .rofuee 10-12 5 е1( д Se1f-treahing Pr �sivta г� c со уг ll ом ьро с впд red roC.n юnthy Нодгге[ е1у resiscanc со leaf s гегсп лпд ьт иС . H1gh 11 де 111gh -
4. PhL1 54-60 CP50-11 х x4G-3098 'гь ее Vrry упод - AveraBe УгоЕиее 11-13 5olid 5e1f-Tre ьhing ., и се l у resi ы anc со 1еа( ь ech апд vel7ovьао гf а 5 иsсгрг l Ы г со тед ь[ г i7 � . Pak4.a еогпg То l етвпс Avereee - 11.5i.апд деад hcarc lю гее .
5. i'hf1 5 Э-33 ИСО -]30 х Aiunan Fasc Ра 1т Average A�ieragc nrn 12-14 Big япд 4e1f-ira чhfnd Rc � ls гan[ гг smuc, yellov врас , l еяf всогеh Leave ь о £ youns Uple:to апа inte[- Lov 11.5 н5o1id апд Pokka Boeng р l яп [s s пь l Сlv е тгJ: а ге ир l апд
сс аип Ьигп
Ь � В- Э7-172 POJ2878x 3-79-35 У.одггасг l у Соед Соод N1gh Уету 12, Ъис Гп i п 5e1f � 1'ra чhi пg Чоде га се l у геч t ьгапс со 1гвЕ ecorch. Lovland апд l псег- H1gh -faat 5 рагьс l у _а и1Л е епд l одуг 5uscepcl6le со ып� : е . Fel г л.еJ1 п [ е ир l апд
[ о 15 ь�lchout .lооям е у1 г1 а пасиее
7.. В-43- о2 В i7161 t PW2d78 Иодигя : е i у l' егу g под Good Average 5 ра сье со 11-13 LacEc, heavy Se1f- 5uscea[i б le со leaf ьtorch end уе ll пv еро [, Lov Агевя vleh вдгGивге N1gh -. дs с Иеоогдсе ьо 11 д Trashing Ргс l е гтед Ъу re,s. оо l яеите лирр l у
В . САС 57-11 � СО-710 . САЗЧ 51ov Lood Сопй xeavy Рго h гьи 12 1'h1n r л1- ьг lf Free Еr оп ьаи [. Very s.cepclble го 1еа Е - - - -7re лhln � ьсо гсм . 5uscepclble сои уе ll ои ьро [
9. W,r, 57- ЬО х77-19 ЭЭ н сео-370 Ееее Соод епод 1�еа. � � Рт tuee � l2 - 5e1f-irn вl,inP, Чпдегаееl у теьl всяпс со s. vecy ьиьггрп - Ntgh Lt66e апд . апду во ll Lov -ь:г со 1гаЕ ,гогсм. sиьсгри 61 г го увll оь.вР0[.
01 Е Со� - г гс l с l t'ar4e[ies
]0. POJ3016 (Java) PJJ2A)8 х POJ? Ч40 Faec Соод Роот durln3 Aveea � e - 12 cof[, l агде - Suacep[161 е [ о уе ll гы в� о[ ыпд гы[ дам gе . Lov V1 дг1 у р l еп ; ед durlnP, - 11Zд гу n �onchs l одгс vhen � tl � tl г s а� �д s.fd
тагиге slztles11. С0440 СОЗЬО se1( гд галс СопЛ Goed Сопд - 12-14 пгд [ип вг� е ilcavy .-rar: � , Rusleca^ с со уг ll оv ьрос , 1 еа Е ь rch, - - - 13' н
1од8 и � hazd го г Р ;1[ а l лгаьг т , д ьпи с . 5 ьвсерп о l г гоаа гигг ое mova fromc дс� пу mrldev.
.coct
12. ИЭ7-3973 ИЭ2- В560 . 1i34-1874 i. яс Guod _ Fв1г - ц -14 Y,cdium ьl ке � 5ивсере161е [о 1еаЕ ecorch - Ч 1дг 1у рl ап[ гд 1пlodgc vЬсп £11 с(гь - 14Атл tигс
13. С Р29-116 Р012723 х Cl'I165 ган[ Good v.. Gоол vhen - PcoPuse 12-14 ИеЕ t ип thln 5 э1 Е Ттаьhl пр, 4 иасерс161 с [ о гоо[ г , уе ll пv вро t япд Ек : ггтс i у � пslclve - - 137.Ф Ol6[VCe,16 пи l В t и гг 1 в 1oEge v И СП г а [. У е г у г г в f е [¢ п[ [ О 1 с е С f С О Г СИ а п д ei[her d Г UUp,h[ и г
гlгм[ т1Е1:с тасиге отис, veccr 1oFn1^ �
Source of Infprmation: S� urm �arized from Victorias Experiment Station Biil.letin, у �цоl о 17, Nos. 1 and 2, Jan.-June, 1970. о-� �со
�

Annex 8Table 6
HIMPPINES
AGRICULTURAL SECTOR SURVEY
Table 6: SUGARCANE YIELD REPONSE TO FERTILIZERSA. TARLAC HILL DISTRICT, 1969-70
Rate of Nitrogen Application per ha. (kg)
Criteria: 0 100 200 300 400 500
Nitrogen TC/Ha 56.21 82.88 98-97 93.68 90.20 85.68PS/TC 1.65 1.64 1.75 1.59 1.52 1.48PS/Ha 95-73 135.89 173-07 148.14 138.28 125-91
Rate of Phosphorous Application per ha (kg)
CriteAa: 0 60 120 180 240 300
Phosphorous TC/Ha 94-32 91-73 1.75 1.67 1.56 1.75PS/Tc 1.78 1.70 98-97 88.87 93.88 98-38PS/Ha 167-55 159-66 173-07 146.69 15o.61 171-99
Rate of Potash Applicaticii per ha (kc,
Criteria: 0 125 250 375 500 625
Potassium TC/Ha 92.02 96.91 98-97 87-53 loo-53 96-34PS/TC 1.69 1.66 1.75 1.66 1.67 1.67PSAIA 155.16 157-53 173-07 31a.41 165-10 158.ol
Source of data: PHILSUGIN Annual Reports, 1969-70 and 1970-71.

ANNEX 8Table 7
PHI IPPINES
AGRICULTURAL SECTOR MURVEY
Table 7: SUGARCANE YIELD RESPONSE TO FERTILIZERSB. TAR-LAC MILL DISTRICT, 1970-71
Rate of Nitrogen Application per ha (kg)
Criteria: 0 60 120 180 240 300
Nitrogen TC/Ha 41.32 63.71 75.32 81.24 79.93 80.72PS/TC 1,69 1.80 1.80 1.75 1.77 1.78PS/Ha 69.93 11468 135.49 142.00 142.00 1I3.L6
Rate of Phosphorous Application per ha (kg)
Criteria: 0 60 120 180 240 300
Phosphorous TC/Ha 71.11 77.60 &1.24 72.50 72.32 72.86PS/TC 1.7h 1.79 T.75 1.69 1.76 1.71PS/Ha 124.00 136.47 142.18 123.68 127/7b 125.13
Criteria: 0 120 240 360 480 600
Potassium TC/Ha 77.20 78.38 77.89 81.24 76.93 77.92PS/TC 1.82 1.66 1.81 1.75 1.77 1.77PS/Ha 135,90 130.28 142.90 142.18 136.48 137.9L
Source of data: PHILSUGIN Annual Reports, 1970-71.
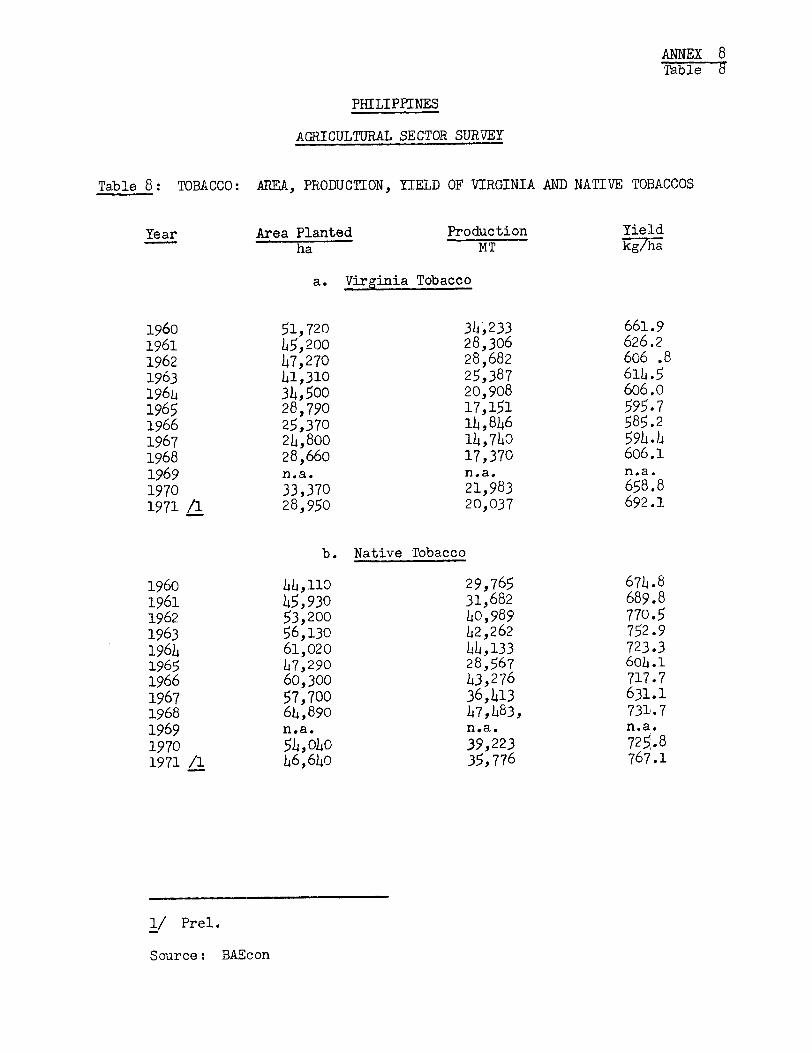
ANNEX 8ableb
PHILIPPINES
AGRICULTURAL SECTOR SURVEY
Table 8: TOBACCO: AREA, PRODUCITON, YIELD OF VIRGINIA AND NATIVE TOBACCOS
Year Area Planted Production Yieldha MT kg/ha
a. Virginia Tobacco
1960 51,720 3b,233 661.9
1961 h5,200 28,306 626.2
1962 47,270 28,682 606 .8
1963 hl,310 25,387 614.5
1964 3h,500 20,908 606.0
1965 28,790 17,151 595.7
1966 25,370 lh,8b6 585.2
1967 2h,8o0 l,7b0 59h.b
1968 28,660 17,370 606.1
1969 n.a. n.a. n.a.
1970 33,370 21,983 658.8
1971 /1 28,950 20,037 692.1
b. Native Tobacco
1960 bb,110 29,765 67.8
1961 L5,930 31,682 689.81962 53,200 h0,989 770.5
1963 56,130 62,262 752.9196 61,020 Ub,133 723.3
1965 h7,290 28,567 60h.1
1966 60,300 h3,276 717.7
1967 57,700 36,L13 631.1
1968 6h,890 h7,483, 731.7
1969 n.a. n.a. n.a.
1970 51,010 39,223 725.8
1971 /l h6,6h0 35,776 767.1
1/ Prel.
Source: BAEcon

ANNEX 8Table 9
PHILIPPINES
AGRICULTURAL SECTOR SURVEY
Table 9: TOBACCO - A LIST OF EXTENSION VARIETIES
1. Virginia Type: Golden Roman, Golden Simox, Golden Oxford, Golden Special,Golden Boon, Simox Gold, Simgold and Dixie Bright x Oxviz
2. Wrapper Type: Reax No. 1, Reax No. 2, BC1 Resumreax, Javiz, Simax, Sim-reax, Simaxax, Vizsimax, Comsumax, Simflor, Simflor-flor,Margie, Colflor, Marflor and Colorgie
3. Cigar-filler Simam, Amsim, Bursim, Simbur, Jamar, Marja, Vizbur, Jarom,Type: Javiz, Oxsimsim, Vizoxviz, Colrom, Colviz, Vizox and Romcol
2. White Burley B Vizburky, White Vizbur, RGK, White Burmar, White Rombur,Type: and White Burflosum
5. Turkish Type: Harmon, Smyrom, Xanrom and Roxan
Source: Bureau of Plant Industry

ANNEX 8Figure 1
PHILIPPINES
AGRICULTURAL SECTOR SURVEY
Sugarcane Area & Sugar Yield
Philippine Total
130 450,000
I120 _ 400,000
IIIII
Yield110 . 350,000
Area
~~4f
100 /- 300,000
90 250,000
0 00IC
CL
80 . 200,000
70 _ 150,000
58 59 60 61 62 63 64 65 66 67 68 69 70111111111111 I II
59 60 61 62 63 64 65 66 67 68 69 70 71
Year
Source : Table 2 World Bank - 7235


ANNEX 8Figure 2
PHILIPPINES
AGRICULTURAL SECTOR SURVEY
Sugarcane Area & Sugar Yield
Central Luzon
90 90,000
*I'ISIS~
80 Yield j a Area 80,000
to 70 -A70,000
I4fCo
60, 60,000 '
I
70 70,000
59 60 61 6 3 64 6 6 67 6 9 7
C,) '4
6 6 6
Im
60 41 0,000
60I 61 62 6 6 6 6 68 69 70 71
Year
Source :Table 2 World Bank -7236


AGRICULTURAL SECTOR SURVEY
PHILIPPINES
ANNEX 10. CROPS MARKETING


ANNEX 10Page 1
PHILIPPINES
AGRICULTURAL SECTOR SURVEY
CROPS MARKETING
TABLE OF CONTENTS
Page No.
INTRODUCTION .......................................... 1
A. ORGANIZATION AND MOVEMENT ............................. 1
Government Agencies .............................. 1Marketing Organizations .......................... 3Movement ......................................... 4
B. TUE COMMODITIES ....................................... 6
Palay ............................................ 6Corn ............................................. 13Sugar ............................................ 16Coconut Products ................................. 19Tobacco .......................................... 21Vegetables ....................................... 23
TABLES
1: Roads in Philippines
2: Existing Highways by Region and by Surface Types3: Comparison of the Costs of Different Methods of Transport4: PSC Standard Freight Rates, 19725: RCA Rice Road Rates, 1970 and from July 19716: Interisland and Other Small Vessels
7: Interisland Shipments of Rice and Palay8: Domestic Production: Marketed Surplus and Volume Controlled by
Government and Private Traders9: Disposition of Palay Sold by Farmers, Nueva Ecija
10: RCA Comparative Sales Volume and Number of Personnel11: RCA Comparative Sales Volume and Local Administrative and
Distribution Costs12: Costs of RCA Rice and Corn Operations13: Comparison of Floor, Ceiling and Actual Palay/Rice Prices14: Palay: Relative Importance of Farm and Commercial Stocks
15: Warehouse Capacity by Regions

ANNEX 10Page 2
TABLES (cont.)
16: Utilization of Storage Capacity by Regions
17: Disposition of Palay Production in the Philippines by Methodof Milling
18: Rice Milling Capacity
19: Milling Capacity Utilization20: Estimated Cost of Marketing Palay Rice through Private Channels21: Cost of Rice at Different Buying Prices up to Consumers22: Palay/Rice Price Relationships
23: Production of White and Yellow Shelled Corn24: Production of Shelled Corn by Variety
25: Farm and Commercial Stocks of Corn
26: Corn Milling Capacity27: White Corn Consumption and Inter-Regional Movement Requirements28: Marketing Margins29: Visayas and Mindanao: 1969 Farm Corn Prices, Wholesale Grit Prices
and Marketing Margins
30: RCA Grades for Yellow and White Corn31: Sugarcane: Total Rated Milling Capacities32: Sugar Prices Philippines and New York
33: Copra: Prices Received by Farmers and Marketing Margins34: Coconut Oil and Copra Meal - Marketing Margins35: Tobacco: Exports, Imports and Values36: Area Production, Yield and Value of Native (Cigar) Tobacco37: PTA Buying Expenses
38: Price Cycle of Cigar Leaf Tobacco39: Area and Production Figures, Virginia (Flue-Cured)40: Vegetable Price Structure: Padre Rada-Divisoria Area and Public
Markets41: Cassava: Area, Production and Value
MAP
Transport System (IBRD 10217)Rice Flow (IBRD 10218)

ANNEX 10Page 1
PHILIPPINES
AGRICULTURAL SECTOR SURVEY
CROPS MARKETING
Introduction
1. Within this annex, marketing is considered to include assembly,processing, storage, transportation and distribution. Attention is givento the basic food and mmajor export crops, and particular importance is paidto the manner in which the needs of the small farmer may be met.
2. A vigorous spirit of free enterprise characterizes commercialactivity in the Philippines. Produce changes ownership many times betweenfarmgate and retail sale. The official marketing organizations are operatedat considerable costs, but low levels of effectiveness.
3. The achievement of self-sufficiency in food and animal feedingstuffs can result from two directions: increased production and reductionof avoidable losses. Good marketing systems and methods provide a catalystfor the former and the physical means for the latter. In many cases thesemeans already exist in the form of permanent drying and storage facilities,but their utilization is low; indeed there is evidence that use has decreasedover the last few years. Lack of an adequate cash payment system and trans-portation difficulties probably account for this condition, in large part.For all smallholder crops, except bananas, and possibly rubber, the primarymarketing methods (that is, up to and including the assembly stage) leavemuch to be desired and full potentials, particularly in terms of return tofarmer for non-food crops, are far from being realized. Achievement ofpossible export earnings is also retarded.
A. Organization and Movement
Government Agencies
4. At present, the main emphasis of Government policy is on theattainment of self-sufficiency in basic food crops. Less attention is paidto the established export crops and development of crops which have goodprospects for export or import substitution.

ANNEX 10Page 2
5. A number of agencies within Government are active in the marketingsector, but there is no authority with specific responsibility for marketingnor an overall coordination of production and marketing. The Governmentagencies whose activities have general impact on marketing are:
(a) The National Food and Agriculture Council (NFAC)
(b) The Agricultural Credit Administration (ACA)
(c) The Bureau of Agricultural Extension (BAEX)
(d) The National Grain Authority (NGA)
(e) The Rice and Corn Board (RICOB)
(f) The Bureau of Agricultural Economics (BAEcon).
6. In addition, specific crops are covered by designated administra-tions and institutes, such as, the Philippine Tobacco Administration (PTA),Philippine Coconut Administration (PHILCOA) and the Philippine Sugar Institute(PHILSUGIN). Their activities are covered in relevant sections below. TheDevelopment Bank of the Philippines (DBP) is indirectly involved in marketingthrough various production/processing financing programs, and directlyinvolved as a result of its ownership of the Greater Manila Terminal FoodMarket (GMTFM).
7. NFAC is a production oriented organization with responsibility forfulfillment of the objective of self-sufficiency in food crops. Therefore,its policies and programs often create marketing problems. It also has thepower and responsibility for coordinating the activities of all agencieswhich are concerned with rice and corn production.
8. The BAEX has major responsibility for translating NFAC policiesinto higher farm productivity. NFAC also has a series of "marketing actionteams" designed to complement the effort of those engaged in encouragingproduction. The activities of these teams often conflict with those ofother agencies involved in marketing. For example, vegetable growers inCentral Luzon are being assisted and encouraged to sell directly to consumers,while the operations of the GMTFM, which is Government financed, are to dateobviously uneconomic due to lack of throughput.
9. ACA assists farmers through the provision of production creditsand marketing loans. This agency has the prime responsibility for coopera-tives (FaCoMas) and GRAMACOP (the Grain Marketing Cooperative of thePhilippines).
10. The purpose of NGA is to provide stability for both farmers andconsumers, through price support programs and import licensing and by maintain-ing sufficient flow of produce to keep consumer prices at or below officialceiling levels in times of shortage.

ANNEX 10Page 3
11. BAEcon is responsible for crop estimation and the provision ofintelligence relevant to assessment of supply/demand situations. It isfrequently assisted by other Government agencies and by the University ofthe Philippines College of Agriculture.
12. RICOB had initial responsibility for nationalizing I the rice andcorn industry and continuing to encourage greater participation by Filipinosin this sector of the economy. A coordinated program with DBP eased thefinancial problems of nationalization and DBP has remained actively involvedin appraising production, processing, and marketing schemes.
13. Resettlement schemes require an integrated approach to marketing
and production but little, if any, consideration is presently given tomarketing requirements.
14. The National Economic Council (NEC) and Presidential EconomicStaff (PES) are involved in numerous programs for national economic develop-
ment. They are vitally concerned with agricultural programs and progressin all its forms. The NEC also has the responsibility for assessingoverall supply-demand for basic food crops and is the only body which mayauthorize imports of these commodities.
Marketing Organizations
15. The FaCoMas, as presently constituted, are not true marketingcooperatives, since in practice marketing is almost a by-product of creditactivities. Analysis of their credit operations and that of their parentbody, ACA, is contained in Annex 11 on Credit.
16. ACA is also largely responsible for GRAMACOP (Grain MarketingCooperative of the Philippines), an organization founded in 1967 with anauthorized capital of 1 500,000 (Y 221,500 issued and paid up as atSeptember 30, 1971). GRAMACOP has 85 members: 73 cooperatives and 12individuals. Members supported it with rice shipments in 1970/71 and twoaccounted for over half the total volume.
17. GRAMACOP performs a wholesaling or trading function rather than
one of coordination. It buys from members and subsequently sells to retail(or another wholesale) outlet. The goods are handled through the GRAMACOPwarehouse but no value is added by packaging or similar operation. For this'service' a charge of 1 0.70 per cavan was set by Board Resolution but hasrecently been arbitrarily increased to r 1.50. Profits are distributed atyear end by usual patronage refunds. Turnover is small (143,000 cavans ofrice in 1971) and deliveries are irregular. GRAMACOP does not providemembers with services which are unobtainable elsewhere. It is neitherproviding leadership for developing improved marketing practices, nor moreefficient distribution between producer cooperatives and consumers, nor isthe attainment of wider selling opportunities for the farmers realized.
1/ Nationalizing means that non-Philippine nationals cannot participatein the industry.
ANNEX 10Page 4
18. The other major "apex" marketing organization is the SugarIndustry Producers Marketing Cooperative (SPCMA), an amalgam of 26 planterscooperatives, which, inter alia, owns Planters' Fertilizer Company.
19. SPCMA provides a comprehensive service to members from supply ofinputs to CIF disposal of production. It was fathered by the Sugar IndustryFoundation, funded by a levy on sales and dedicated to the organization ofproducer cooperatives, educational and vocational training, college andindustry development, etc. Despite the many unresolved difficulties, SPCMAdoes show what can be achieved in the Philippines by a federation ofcooperatives and, in many ways, provides a good example for others to follow.
20. GMTFM is a terminal food market intended to handle many commoditiesincluding fish, livestock and poultry. For crops, its biggest impact couldbe on vegetable marketing, and the organization will be reviewed in thatcontext.
Movement
21. Basic to all marketing activities is the movement of agriculturalproducts. The availability and condition of interregional communicationfacilities are the major factors influencing the overall marketing structureand system in the Philippines. Clearer routes between producer and consumerwould reduce the need for intermediary services. These should become betterdefined as the results of the Marketing Research Unit studies become available.
22. Agriculturally, the islands of Luzon, Mindanao and the Eastern andWestern Visayas are the most important. They are not only separated by water,but production and collection centers within the islands are divided byformidable topographic barriers.
23. The Philippine road system consists primarily of truck routesconnecting sizeable towns, with poor to inadequate feeder roads from produc-tion centers to main highways. Construction and maintenance of all roadsis made more difficult by the climate, and frequently roads are "out" whenthey are most needed. Over 80% have earth or macadam surfaces (Tables 1 and2).
24. A railway system (PNR) runs from San Fernando in Ilocos to Legaspiin Bicol, but freight services are presently inoperative on the northernsection of this line. Panay boasts its own system (PRC) between Iloilo andRoxas (IBRD 10217). The service that PNR can provide for producemovement is inadequate. In 1971 it had 478 closed box cars of 500 cavan(22 m tons) capacity, and of these but 230 were operable.
25. Sea and air routes connect the islands. While the sea is "main-tenance-free" in a basic sense, investment in port facilities and vesselsis inadequate. The poor conditions for movement to and from the seaboardprobably discourage other investment. In contrast, air transport hasexpanded to the stage where comprehensive services are now operated betweenthe main islands. Airplanes are of limited value in crop movement, being

ANNEX 10Page 5
suited only to high value produce, or for emergency distribution where costis not the main consideration.
26. The effects of poor communications are twofold. First, theysubstantially increase costs of marketed production. Second, difficulttransport acts as a disincentive for larger production.
27. Crop transport in the inadequately serviced rural areas isinitially by animal or human power (Carabao drawn sleds, and head loads),then by wheeled cart, and finally by motor transport of some kind. Motorizedtransport ranges from trishaw, jeepney or other public service vehicle, tolarge (15 tons) trucks. The time, energy, and cost of moving produce tomotor transport terminals is a major discouragement to production ofcommercially directed surpluses (Table 3).
28. The poor condition of the railway has resulted in a steady declinein its utilization. Rice and palay movement on PNR totalled 4.4 millionton-km in 1970 compared with 19 million ton-km in 1958.
29. Road transport has taken up the slack, though at increasing ratesas heavier use of the roads has increased operating expenses. Rates are setby the Public Service Commission (Table 4), but in practice are not followedclosely. Competition in more readily accessible areas, such as CentralLuzon results in rates generally somewhat lower, but elsewhere they arefrequently higher. Mears quotes f .80 per ton/km (equal to f4.75 per cavanof rice or Y 6.04 per cavan palay) for the 106 km journey from Tuguegaraoto Aparri (Cagayan Valley) which requires 36 hours to complete. 1/ InSouthern Mindanao, rates vary from V 0.28 to Y 0.75 per ton/km, depending onterrain and road surface. Within metropolitan areas, rates are the highestof all (Table 5). The very high rates for Greater Manila reflect considerabletraffic congestion in this densely populated consumer area.
30. There is a large difference between the capacity figures quotedfor interisland shipping by the Department of Commerce and the PhilippineCoastguard (Table 6). Whatever the actual figure, the fleet is aging to
old (some 40% of "Department of Commerce" vessels being over 24 years old),while a high proportion of the smaller ships are converted naval or militaryvessels not properly suited to the cargo that they carry.
31. There are 97 major ports and 392 municipal ports. But many of thesmaller ports are not serviced by the larger interisland vessels and dependupon small craft, such as batels and bancas.
32. The Conference of Interisland Shipowners and Operators (CISO) isloosely knit and dominated by the larger owners. Ports of call are at ownersoption, although "round trip" voyage times are relatively constant. Oneshipowner quoted a typical round trip voyage from Davao to Manila as 14 dayscalling at 8 - 10 ports, while another estimated the same period for five
1/ Mears, Leon A. and Agabin, Meliza H., "Transport and Rice Marketing inthe Philippines", unpiblished manuscript, page 8.

ANNEX 10Page 6
main ports. Berthing delays and slow handling on and off quay at the larger
ports are the main reasons for slow turn rounds.
33. Barges are used extensively for raw and refined sugar movement,and sometimes on a "backload" basis for rice and other produce. Unfortunately,there is a scarcity of data on interisland traffic flows. Available datafor rice is shown in Table 7 and graphic representation of flow for 1968 inMap IBRD 10218. Rice is but a part of the picture, however; reported ship-ments of corn in/out of Cebu were in excess of 175,000 tons in 1969.
34. The inadequate communication network makes efficient operation ofa marketing system extremely difficult; it contributes to local glut/shortage situations and acts as a deterrent to increased production. High-ways, ports and even feeder roads are expensive and slow to build, buttransportation problems can be eased by relating planned production toaccessibility. For example, food crops in Cagayan Valley could be limitedto local requirements and emphasis placed on production of high-value low-volume commercial crops such as tobacco.
B. The Commodities
Palay
35. Because rice is such an important staple food and so widely grownnumerous detailed descriptions of channels through which rice flows betweenproducer and consumer abound. This discussion covers only those aspects whichare directly applicable.
36. Essentially the flow of rice is three directional:
(a) retained on farm for consumption by farm family;
(b) paid as "wages" for assistance on farm (harvesting, threshing,
etc.) or other services; and
(c) sold to a merchant or miller.
In all three cases, the palay has to be dried, milled, and usually storedbefore being finally consumed by human beings. Before it is milled, aportion is likely to be consumed in whole or in part by birds, rodents, andinsects.
37. The time factor for the farmer who is double cropping palay is afurther constraint on the marketing system. The average period from plantingto harvest is about four and a half months; a total of about six weeks percrop is available for harvesting, threshing, drying, marketing and/orstoring, procurement of new season inputs, and nursery bed preparation andplanting. (Land prepration is assumed to take place during the three weeksbetween planting and transplanting.) If a shorter maturity second seasoncrop, is chosen, such as corn, sorghum or mung beans, this constraint will

ANNEX 10Page 7
occur only once in the year. The marketing system has to be efficientenough to avoid delays that might affect planting times for the following
year and, thus, adversely affect ultimate yields. The system may also have
to provide various services, such as supply of physical inputs, and otherfunctions.
38. In general, the part played by government-sponsored channels andFaCoMas in rice marketing is remarkably small (Tables 8 and 9). The formerRice and Corn Administration (RCA) has little impact on most farmers andconsumers.
39. The initial burden of the marketing operation, assembly, isessentially a "middleman" operation. While the middleman sometimes may takeundue advantage of his position, he plays a vital role in moving crops fromproducer to consumer along definable if frequently complicated lines. Com-petition is the main means of ensuring that profit margins are contained
within reasonable levels.
40. In an effort to strengthen farmer bargaining power, Governmentactively assisted in the formation and development of cooperatives (FaCoMas),
now the responsibility of the Agricultural Credit Administration (ACA). Theobjectives of FaColas are to provide a suitable vehicle for the injection ofsubstantial government credit funds as an incentive to greater production,and to afford farmers better marketing opportunities through participationin an integrated assembly, storage, processing and redistribution unit.
41. This intention has merit. In practice the FaCoMa program has notbeen successful. By attempting to achieve too much too quickly, a large
number of ineffective units were created, overburdened with capital assetsand debts, unable to promptly pay a fair price for produce, and managed withoverly bureaucratic procedures. This led to FaCoMas becoming a one-way
credit channel; credit was provided to members who frequently sold theircrops elsewhere for cash. Many FaCoMas have been reduced to overburdenedcredit agencies, struggling to recover past and present debts. Some have
largely overcome their difficulties and have shifted emphasis from creditto marketing and capital accumulation. These FaCoMas are beginning toattain a position that enables them to contribute effectively to the develop-
ment of production and marketing. Nevertheless, indebtedness is large, anda considerable number of assets in the form of stores and mills lie idle anddeteriorating. Worst of all, cooperative marketing as an idea has falleninto disrepute in the minds of many if not most of the people whom it couldbenefit.
42. National Grains Authority (NGA). Effective September 26, 1972,the responsibility for price stabilization of rice and corn was transferredto a National Grains Authority under the Secretary of Agriculture frbm anindependent body, the Rice and Corn Administration (RCA). Operations underthe latter were clearly unsatisfactory. Overhead costs were high in relationto the volume of procurement (Tables 10-12). Substantial losses were incurredby disappearance of rice inventories even though held under quedan (warehousereceipt). Furthermore, farmers in many parts of the country often receivedprices which were below the floor prices established by RCA (Table 1:3).

ANNEX 10Page 8
43. NGA has been instructed to establish a purchase price ? 5/cavanover costs of production. Financing of f 100 million has been authorizedfor procurement operations. Purchase at the support price is to be made byrice mills appointed as agents of NGA. Furthermore, imports of rice whichwere formerly handled directly by RCA are now licensed to the private sectors.However, the injunction that NGA cannot sell at a loss may well come intoconflict with Government policies to hold down prices to consumers.
44. Drying, Storage and Milling. The direct physical objective of theoverall marketing system is to minimize losses between point of harvest andpoint of sale to final consumer. Losses arise from:
(a) drying practices and facilities;
(b) storage and movement practices and facilities; and
(c) milling practices and facilities.
To a considerable degree (b) and (c) are influenced and affected by (a).
45. The palay crop is almost entirely solar dried, both on the farmbefore and after threshing and at the mill. A number of mechanical driersexist, principally as a result of RCA imports of drier storage units, butthey are seldom used. The reasons for this large underutilization includepoor siting, higher than anticipated operating costs, poor management and,above all, failure to adequately demonstrate to the farmer (and the miller)the true benefits that result from the proper drying of palay. Traditionalsolar drying has many disadvantages, some of which are magnified by the useof HYVs which mature before the end of the rains.
46. Palay needs to be evenly dried to a moisture content of 13-14%.Uneven drying increases tendencies towards grain cracking and breakage; in-adequate drying results in mold formation and overheating and deteriorationin storage; overdrying results in increased brittleness. All contributetoward lower milling efficiency and recovery. Drying in the field prior tothreshing subjects the grain to sudden changes of temperature and humidity,and consequent grain cracking; inadequate ventilation of stacks causessweating and mold damage. Spreading of grain on mats or slabs can lead toover-drying and large losses through rodents and birds. Also, loss frominsect infestation is high.
47. The farmer who offers inadequately dried grain for sale is ina weak bargaining position. The buyer will arbitrarily adjust the weightof a cavan upward but keep prices constant in order to cover drying costsand losses and increased risk. This upward adjustment was observed to bebetween 4-13% on a cavan of 44 kg. No moisture meters were being used bybuyers; "biting" appeared to be a mutually accepted method of moisturedetermination.
48. Drying is one of the areas in which a well-managed cooperativecould provide great assistance. If a farmer could deliver wet palay andknow that it was going to be properly weighed, dried, stored and milled,

ANNEX 10Page 9
one cause of reduced financial return would be minimized. Extensive
education and demonstration will be necessary to achieve this change.
49. Farm surveys suggest that a major portion of the storage processtakes place on the farm. 1/ Unfortunately, the data only cover one pointin the crop year -- July 1 -- which is two months after the peak of tthesecond crop harvest and four months before the peak of the main crop harvest.The surveys need to be repeated at least quarterly if the result are to beusefully applied (Table 14).
50. It has been impossible to obtain worthwhile estimates of grainstorage losses (other than for drying losses) and true storage costs areequally hard to determine. At farm level, while opportunity costs of laborand space may be low, facilities afford less than adequate protection againstweather, fire, infestation and rodent risks. It would not be surprisingif economic costs equalled or exceeded those of permanent modern warehousesfor bagged produce.
51. The only available information on storage and movement lossescomes from RCA 2/; stock movement losses (i.e., from point of purchase to
point of sale, including storage) averaged 7.3% over 1968-70. It is notknown how much of this loss was attributable to theft and pilferage. From
observation of practices and conditions in the process from field to consump-tion, it seems likely that average national loss (to human food) up to point ofmilling is not less than 7.5% of official estimates of total production.
Modern drying, movement and storage practices should contain these losses towithin 1% of total production.
52. Palay and rice are almost exclusively stored in sacks, althoughsome moves have been made towards bulk storage in bin and silo. Conversionof existing warehouses to bin storage would be cheap compared with the capital
costs of new silos, and available storage could be increased by 25-35% as aresult. However, bulk storage requires far stricter control of moistureand stocks than is practiced now; any move in this direction without substan-tial improvement in technique and management could lead to disastrous losses.Sack storage does minimize the effect of poor intake and quality control.
53. Unit storage costs depend largely on turnover, which is in itself afunction of intake and disposal patterns. If keeping qualities permit,produce should be stored in the form which has lowest volume-weight ratio;equally, wherever possible, it should be transported in the same form. Ricein its milled form has a better storage factor than palay, with brown rice(pinawa) coming in between. In terms of keeping qualities, palay is bestand pinawa worst (the oil in air-exposed bran hastens the onset of rancidity).Preliminary experiments by RCA 3/ indicate that pinawa can be stored for "atleast six months", and this may be worthy of further investigation in con-junction with the range of drying and related storage problems.
1/ BAEcon and BCS Surveys.
2/ Source: "The RCA in the Last Eight Months" - J.D. Drilon, Jr.
3/ Source: BAEcon.

ANNEX 10Page 10
54. Reliable figures of serviceable storage capacities are also un-available. No two official sources agree, and some organizations even appearto have more than one set of figures. This state of affairs further under-lines the need for an early and accurate Regional appraisal of the trueposition. In addition to the questionable validity of data, there has beensubstantial deterioration of many storage facilities. Therefore, the lowestavailable figures on capacity were used in analyzing storage utilization(Table 15). The proportion of capacity utilization indicates that a verysignificant proportion of available supply held is on the farm (Table 16).
55. Milling. The conversion of palay to rice is done almost entirelyby two types of mills, the cono and the kiskisan. Only about 4% is estimatedto be hand pounded 1/ (Table 17). Both the cono and the kiskisan mills aremanufactured entirely in the Philippines.
56. The kiskisan mill has small capacity and is relatively simple,carrying out husk and bran removal in one or, very occasionally, two passes.Recovery rates are relatively low compared with sophisticated machinery, andpower requirements are rather high. Some machines are on a mobile base;these are operated on a form of "milling round" within a province. Ruggedand simple, the kiskisan has milled an almost constant percentage of produc-tion over the last 20 years (26-28%).
57. The cono mill has much greater capacity and sophistication; itmills and polishes in separate machines and segregates two bran qualities andsmall grits from the polished rice. Almost exclusively situated in majortransit or terminal points, the cono mills produce essentially for thecommercial market, although some is custom based. The cono miller willoften act as a buyer and dealer in both palay and rice as well as a wholesalerand occasionally a retailer.
58. There has been some pressure to encourage the greater use ofimported mills, using rubber shellers in place of the disc types of thecono, because of higher percentage of head rice recovery attributed to theformer. These moves are questionable. Rubber rollers, which are designedbasically for short round varieties of rice, have a significantly reducedlife expectancy when used on long-grained palay because of more abrasion 2/and operating costs are thereby increased. Secondly, simple design andmanagement improvements in locally produced mills can bring output close tothat of rubber shellers both in terms of quantity and quality and suchimprovement involves only nominal additional investment. 3/ And, thirdly,valuable foreign exchange is being used in a manner detrimental to the local
cono manufacturing industry.
1/ Source: BAEcon.
2/ Husk weight of Indica varieties form 4-5% more of total grain weightthan in Japonica varieties.
3/ Studies by Harry van Ruiten, FAO grain milling expert.

ANNEX 10Page 11
59. Rice mills are almost exclusively in the hands of the privatesector. Less than 1% of the total number and 4% of the capacity are financedor owned by RCA and FaCoMas. Still, there is considerable overinvestmentin certain regions 1/ (Table 18). An early and complete appraisal of millsand milling requirements, by region and province, is necessary before furtherinvestments are made.
60. When considering milling capacity, it must be borne in mind thatthe different methods are indicative of both producer/consumer requirementsand geographical limitations. The nearly static percentage of productionmilled by kiskisans reflects either collectively or individually thefollowing considerations:
(a) small milling requirement, through dispersal of productionareas;
(b) subsistence oriented rice production;
(c) transport and communication limitations; and
(d) taste preferences.
61. The kiskisan miller is essentially a small operator, at most afamily unit. Throughput is mainly custom-based, with payment either in cashor kind. Charges depend on situation and vary from as little as f 0.60 percavan of rice up to about f 1.50. An exceptional charge equivalent to f 2.75was noted at one very busy kiskisan mill which was situated within a mile ofa large cono mill (also busy and charging less). Although an isolated example,it may be an indication of the importance of taste in deciding millingrequirements by type.
62. The large fixed cost of a fully commercial cono mill presentsentirely different throughput requirements to those of the smaller familytype operation. Assuming 300 twenty-two hour "milling" days a year, 6,600hours is probably the maximum annual milling capability for a cono. Thisprovides adequate time for breakdowns (mechanical and supply), maintenance,and normal holidays. In 1969, a study 2/ of nine cono mills in Nueva Ecija,Bulacan and Laguna found an average of 4,060 working hours a year. A 1970study 3/ of 78 conos in Laguna revealed an average of 3,180 working hours ayear.
1/ Milling capacity in Laguna province increased by 60% between 1965 and1969, nearly double the rate of probable increase in marketed surplus.Despite the fact that palay was being hauled from as far as Isabela forsome of the larger mills, fewer mill days were worked in 1970 than in1965. (VsAlph Rarker and Geronimn Sorina, Jr., "Second GeneratlonProblems in the Rice Industry in the Philippines").
2/ Harry van Ruiten, research for RCA.
3/ L. Mears, derived from paper by Randolph Barker, Geronimo Sozina, Jr.

ANNEX 10Page 12
63. It seems likely that effective cono capacity will run between3,000 and 5,000 milling hours during a year of adequate palay supply. Whensubstantial rice imports occur, such as in 1971/72, utilization will dropbelow these levels. Unless transportation and other difficulties imposeinsuperable constraints, the import of brown rather than polished rice wouldhelp the industry. The effects of this upon unit milling costs, employmentand the supply of animal feed (rice bran) need to be fully taken intoaccount when import policies are considered.
64. Although the kiskisan mill seldom has storage facilities, operationsusually are fairly regular since interseason country household stocks areheld in the form of palay, with only ready requirements in milled form. Interms of milling time, the maximum average is probably between 1,500 and
2,500 hours per year, with the latter figure being approached only in regionsof widely dispersed production and difficult transportation such as Ilocos.
Table 19 shows the percentage utilization of milling capacity at assumed
limits. In all four cases, only the Cagayan Valley and Western Visayasshow a possible or actual deficit in milling capacity. Specific surveys
are necessary to show the real situation in each province, but the factthat millers are able to buy palay in Isabela (Cagayan Valley) for millingin Central Luzon indicates that Isabela mills are already operating at or
near practical capacity. It also demonstrates the compelling throughputdemands of capital-intensive imported mills, as transportation costs mustbe very high in this type of transfer.
65. Milling Costs and Marketing Margins. The marketing margin is thedifference between the price received by the farmer and that paid by the
consumer. Some interesting calculations have been made for the more inte-grated producer-consumer complexes such as Nueva Ecija/Central Luzon (sup-
plied by RCA and also used by Mears). Table 20 shows the postulated margin
per cavan palay/cavan rice as 0 6.25 + 1.992x, where x is the cost of palayat farmgate. The most significant factor in this calculation is the recovery
rate which, assuming the standard RCA cavan of 46 kilos gross (45.5 kilosnet), is taken at 67.625% by weight. If the purchase price is taken at? 25.00 per cavan, then the costs to retail come to 0 56.06 per cavan or
? 2.391 per ganta. This figure compares with the V 2.49 under another(more recent) table of costs provided by RCA (Tables 21), and Y 2.50 perganta that results from application of a rule-of-thumb formula that the price
per ganta of rice equals 10% of farm price per cavan of palay.
66. When the first formula is used to convert reported farm prices,a remarkable closeness to reported retail prices is obtained. The relationshipis less satisfactory when the formula, suitably adjusted, is applied to whole-sale and retail prices in Cabanatuan City (Table 22).
67. There are some inconsistencies in the data. For example, Table 21contains a significant difference from Table 20 because the latter omitsthe first assembly and collection function. In both examples, costs ofmoney are unreasonably low, for present and probable future conditions, andlosses in storage are probably understated. A study of 14 NARIC (RCA's

ANNEX 10Page 13
predecessor) warehouses in 1958 showed average losses from insects of 5%in three months. 1/
68. Clearly, the price estimates do not contain adequate allowancefor marketing margins 1/. Given very high transportation costs and allowingfor minimal services such as grading and packing, the margins shown in theseestimates are not large enough to provide incentives to marketers.
69. Market Intelligence. The nature of the country demands a very highstandard of market intelligence, because produce takes a long time to movebetween surplus and deficit areas, and it takes even longer to obtain suppliesfrom exporting countries. For example, NEC authorized imports of rice inApril, 1971 but less than 50% of the quantity ordered had arrived five monthslater, and a severe bunching of subsequent arrivals caused considerabledistribution problems.
70. Great strides are being made by BAEcon in the gathering of statis-tical data on crop conditions. Even so, there is still inadequate provisionfor forecasts to identify probable deficit areas to be spotlighted wellahead of time and to enable remedial action taken to prevent acute shortagesand soaring prices.
71. Classification and Grading. In the Philippines, classification ofrice is by type of grain, varietal group, and class of milling:
- Type is determined by grain length (long, medium, short).
- Group is determined by palatability and appearance. Thereare four groups: fancy, special, ordinary, and inferior,into which specific varieties fall.
- Class of milling is determined by the degree to which husk,germ and bran layers have been removed.
There are five grades of palay and rice within their respective classifica-tions. Palay grades are essentially dependent upon percentage purity andkernel state and rice grades upon percentage head rice and varietal purity.With the exception of Grade 5 palay, maximum moisture content is set at 14%.
72. Although strict grading procedures are laid down, there is noevidence that these are followed by other buyers. Grading is actuallydone on a variety appearance basis. The system is too complicated forgeneral acceptance or enforcement and, if surpluses are forthcoming infuture years, simpler basic requirements for both palay and rice, gearedto common practice elsewhere, would probably prove advantageous.
Corn
73. Corn is the second most important food crop. About 10% of thepopulation consumer mainly corn and another 10% consume both rice and corn.
1/ Source: Mears (from report by R. M. tabadan and G. B. Viado).

ANNEX 10Page 14
Production has increased steadily over the years and is now slightly in excessof 2 million tons.
74. Average national consumption as human food is estimated at about
35 kg per head per annum (whole grain equivalent). The bulk of this isconsumed in the form of grits. The remaining production goes mainly foranimal and poultry feed, the greater proportion being fed directly byfarmers. Approximate percentages of utilization are as follows: humanfood, 60%; animal and poultry feed on farms, 12-15%; manufactured animal and
poultry feed, 10-12%; starch and glucose manufacture, 6-8%; waste, seed and
other uses, 5-12%.
75. Production is concentrated in Mindanao, Visayas, Cagayan Valleyand Southern Tagalog; Mindanao accounts for over half of the total production.White corn is the predominant variety and, up to 1969, accounted for about
three-fourths of total production. Since then the proportion has increasedto about 90% of the total (Tables 23 and 24). Only in Southern Tagalog isthe production of yellow corn larger than that of white corn. This reflectsthe development of the poultry industry in the region.
76. The marketing system is similar to that for palay, with the private
sector dominating trade. While the RCA operates a floor price system, inrecent years net shortages have kept prices well above the floor. Govern-ment activities through RCA were confined to the purchase and distribution
of imported corn, most of which is yellow corn destined for feed manufacturers.
77. On a national basis, the annual pattern of production lends itself
to simple and efficient marketing. Supply is relatively constant over theyear. Patterns of supply vary on a regional basis, but there is no indica-
tion of pronounced lean periods. Single cropping is the exception rather
than the rule; double cropping is common; and treble cropping is found inmany provinces. In South and West Mindanao, corn was observed at all stages
of development, from germination to harvesting.
78. Farm practice is to store ear corn and to shell it as required.
Little, if any, drying of shelled corn is practiced in the farm; the moisturecontent of new crop deliveries to millers is usually 18-22%. Few mechanicaldriers exist or are used, and most mills have extensive concrete floors over
which the grain is spread for solar drying. Lack of proper drying probablyresults in considerable losses through sweating and mold damage. Also, thehigh percentage of the crop held on farms in less than adequate storagefacilities indicates that losses through insects, rats and heating are probablyhigh.
79. The relationship between commercial stocks and net visible supplyshows that, as for palay, most stocks are held on the farm (Table 25). Theprime factors in corn marketing are the millers and wholesalers who move
corn either as grain or grit between the surplus and deficit areas. Most ofthe companies involved in these businesses operate through buying stations,usually situated on lines of reasonable communication to a mill or port, and
farmers or assembly agents are required to move their produce from the farmto these buying centers. The absence of adequate feeder roads results in

ANNEX 10Page 15
very high initial transportation costs, frequently equalling 50% of realizedvalues. As with other crops, this lack of farm to market roads is a substan-tial hinderance to the development of marketing services, as well as a dis-incentive to larger commercial production.
80. Milling methods are similar to those for palay and it appears thatnearly all commercially directed grits are processed through multi-pass conomills--despite the fact that the reported capacity of single pass kiskisantype mills is higher. The number of kiskisans reflect the amount of cornwhich is custom milled for producer/consumer, but it is not clear to whatextent the kiskisan is used as a hammer mill for the production of feed forfarm poultry and livestock. For this reason, it is not possible to determinethe percentage utilization of milling capacity, nor the extent to which mar-keting might be improved through the erection of new mills or the relocationof existing ones (Table 26).
81. Grits are sold by size. Those passing over 10 to 16 mesh screensare used for human consumption; the remaining small grits, flour, germ andbran goes to animal feed, although some mills separate the germ for saleto oil extractors. The generally accepted grit recovery rate is 72%, buttests run by the FAO's Harry van Ruiten on cono mills in Cebu showed anaverage of 68%, and figures obtained from millers elsewhere shaded somewhatbelow. The mission estimates the average recovery rate is 67%. This figurehas been used in estimating national food requirements and consequentavailability of by-products for animal food.
82. One of the most difficult aspects of corn marketing is the develop-ment of corn-dependent industries in regions far removed from productionareas. This increases transport costs and reduces possible returns to cornfarmers. Statistics for interregional movements of corn are not available,but Table 27 demonstrates a possible movement pattern to meet human foodrequirements in 1970/1971.
83. The low utilization of commercial storage facilities probablyreflects, among other factors, poor siting of warehouse facilities relative
to production and shipment areas and lack of infrastructure.
84. Very few mechanical shellers exist and of these most are smallportable models owned by a "first buyer" or miller's agent. Operatorstravel between certain selected centers buying either ear corn directlyfrom the farmer or buying on a shelled basis, making a charge for theshelling operation. There is a lack of adequate shelling and drying flacilities.The formation of farmers' associations or cooperatives owning shellersi,mechanical driers and sack, bin or silo storage facilities could improve this
situation, especially in areas where the private sector is not active inproviding such facilities.
85. Animal Feed and Starch Manufacture. There are 33 registered,animal feed manufacturers, and 80% of present production is centered in
Luzon. Apart from their direct corn purchases, these manufacturers alsoconsume the greater part of the by-products of the commercial corn milling
ANNEX 10Page 16
industry. The regional distribution of the poultry and livestock industryhas tended to follow the concentration of mixed feed production ratherthan that of corn production, with the result of interisland movement ofhigh volume, low value grain rather than low volume, high value meat andmeat products. The location of feed mills in selected production areas(Mindanao and Cagayan Valley) would improve farmers' outlets for feed grainsand reduce the cost of feed.
86. There are five cornstarch factories using the wet milling process,with a total rated capacity of approximately 775 tons per day. This isgreatly in excess of the country's needs; investment in this industry wasencouraged at a time when low corn prices made starch exports a potentiallyprofitable proposition. With higher prices for corn, cornstarch or glucose,exports have not proved possible.
87. Prices and Marketing Margins. The average price of corn has climbedsteadily since 1970, in sympathy with palay prices. Yellow corn prices havemoved up at a slightly faster rate than prices for white corn, as a resultof expansion of the animal feed industry.
88. Retail prices for whole grain are only available for the GreaterManila area, which has the smallest per capita consumption. These indicatemarketing margins varying between 35% and 49% of retail price (Table 28).A similar exercise, carried out on a monthly basis for calendar 1971, revealsan average marketing margin of 40% with an actual variation from 31% to 48%.Some limited information on margins for milled corn is available for theVisayas and Mindanao for 1969, and these reveal a gross margin between thekilo whole corn and kilo milled corn ranging from 15% to 50% (Table 29).Margins are lowest in the Eastern Visayas where corn deficiency is greatest.
89. The animal feed and starch manufacturing industries make thelargest unit purchases of corn and thus exercise a powerful influence onthe market. The majority of their purchases are done through buying agents.There is a complete absence of price data for this important section of themarket. Attention should also be given to collection of prices generally ona per kilo base rather than in varying volume measurements.
90. Grading. Official grades have been established (Table 30) but inpractice are not observed. The grading process by buyers is quite arbitrary,and substantial adjustment of price or weight are made for poor quality orcondition, high admixture, etc. In any event, the official grading standardsare far too stringent for domestic trade and would probably only be desirableor capable of enforcement when the country becomes a net exporter. There-fore, the number of grades for domestic trade should be reduced to tthree,and export grades should be established which are directly comparable withthose commonly accepted in international trade.
Sugar
91. The sugar industry has been insulated from the effects of lowworld prices by the United States Sugar Act, which allots the Philippines thebiggest single basic quota (1,126,020 short tons), plus a significant share

ANNEX 10Page 17
of total quota deficits of other countries. The current total quota is about1,400,000 short tons. A further agreement expiring in 1974 allows Philippinesugar to enter the U.S. at a lower rate of duty than for quota countries(40 cents per 100 lb compared with 62.5 cents).
92. Production and marketing of sugar in the Philippines is controlledunder the Sugar Limitation Law. Production of centrifugal sugar is subjectto licensing and allocations. Output has steadily increased over thedecade. Licenses are related to five categories based on market requirements,and quotas are allocated by the Sugar Quota Administration at the beginningof each crop season. The classes are:
'A' Sugar: Centrifugal raws for export to the United Statesunder the Trade Agreement and U.S. Sugar Act.
'AA' Sugar: Refined sugar for export to the United States.This must be manufactured from 'A' sugar, isincluded in the total export quota, and limitedto a maximum of 56,000 short tons.
'B' Sugar: Centrifugal sugar (raw or manufactured) fordomestic consumption. The aggregate quota maybe varied within crop years to meet requirementsand to stabilize prices.
'C' Sugar: Centrifugal raws which may be produced to offsetshortages in either 'A' or 'B' sugar supplies,or for marketing externally other than to theU.S. This sugar has no market until it has beenconverted to 'A', 'B' or 'D' sugar by means ofa certificate of shortage issued by the SugarQuota Administration (SQA).
'D' Sugar: Sugar that may be exported to any country otherthan the U.S. Exports of 'D' Sugar are limitedby quota set by the International Sugar Organi-zation (presently 45,000 m tons). There havebeen no exports of 'D' sugar since 1961.
93. The regulatory system permits the switching of stocks of difEerentquota classes to enable savings to be made in marketing. The bulk of produc-tion is in the Visayas and consumption in Luzon, so it is common for 'B'Sugar to be exported from Visayas in exchange for a similar amount of 'A'Sugar produced and subsequently sold domestically in Luzon. Such changesbetween classes may only be effected through the SQA.
94. There are three active sugar refineries, of which two share therefined sugar export quota (Philippines Insular Refining Corporation andVictorias Milling Company). These obtain raws from their own mills as wellas from other producers and mills, making use of quota-switching to achieveeconomies of supply.

ANNEX 10Page 18
95. Cane production is carried out on a plantation and a smallholderbasis. But as mills ("centrals") are limited to acquiring or leasing landin excess of 1,024 ha, the greater part of production is in the hands ofsmallholders. About 45% of cultivated area is on plots of less than 5 ha.
96. Primary Marketing and Milling. Primary cane marketing is carriedout under milling agreements which provide for a percentage of the sugarto remain the property of the central as a form of milling fee. Sharing
ratios vary between 55:45 and 70:30, in favor of the planter. In theabsence of milling agreements, the sharing ratio is specified by law, theplanter's share increasing with the volume of sugar. The price for domestic
sugar is fixed by the Price Control Commission; the price of export sugarvaries and is dependent upon movements in the American market.
97. The sucrose content of cane begins to decline steadily aftermaturity (before cutting), at a rate depending on variety and climate. Itdeclines rapidly a few days after cutting. As a consequence, earningsare dependent upon timely harvesting and on prompt milling thereafter. Thetask of organizing the market is substantial. In the southern and easternparts of the main producing areas, harvesting/milling extends over a five toeight month period, and in the north over about 10 months, depending onclimatic conditions.
98. To rationalize production and milling, a system of milling districts
has been created within which planters deliver cane to a specified mill,most of which provide and allocate transport. Increased plantings andproduction (but not increased average yield) have resulted in new districts
being created. Unfortunately, the system of district milling and marketingis beginning to break down. Firstly, throughput requirements of new millsare causing buyers to roam further afield in search of cane. Secondly,inadequate supplies force new mills to operate for relatively short periods,thus forcing planters to sell cane outside their district. Sugar yieldsare, therefore, reduced and marketing costs increased. Quality problemsare also created at the mills through commingling of bulk supplies.
99. The number of mills and their capacities are shown in Table 31.Average utilization has been postulated on a 200 day milling year, but actualindividual utilization will vary with situation and climate. The plannedintroduction of new varieties to give a greater spread of maturity datesshould result in an extension of the milling year and an increase in effectivecapacity.
100. Some research has been done on reducing cutting, loading and deliverycosts, particularly by the Victorias Milling Co. (within whose districtadvanced handling and movement methods are practiced). Improved practices
cannot become widely established, nor industry costs reduced, if the disciplineof the district system continues to erode. The entire industry should besurveyed and milling districts and mill requirements redefined.
101. Storage and Secondary Marketing. Store and warehouse receipts(quedans), endorsed according to the class of sugar they represent, are fully

ANNEX 10Page 19
negotiable documents. Because of the further processing involved and thecontrol systems available to the SQA, the quedan system has been regardedas inviolable; indeed, it must be since it is the prime document in commer-cial trade. However, there are some indications that, under the influence ofhigh price, the system is beginning to break down. In May, 1972, the SQAwarned mills, banks and individuals from executing any transaction on exportor domestic quedan permits "previously reported lost".
102. Export Marketing. There are two bulk loading sugar terminals, oneon Guimaras Island across from Iloilo City and the other at Pulupandan inNegros Occidental. Two mills, also in Negros, have deep water berths.Export shipments usually amount to 10,000-20,000 tons per vessel. Few ifany mills produce enough sugar to be able to economically accumulate enoughstock for large single shipments. Exports are therefore usually on acomposite basis, with two or more sellers uniting to provide the necessarycargo. Merchants and exporters have numerous subagents buying for them atall levels from planters upwards. This is a form of assembly throughownership; physically, much of the assembly has already been carried out asa result of the milling process. Expansion of producers cooperatives wouldreduce the total cost of this marketing function. SPCMA and two othermarketing cooperatives sell members sugar on a CIF basis; thus saving atleast a proportion of the assembly costs which accrue to other planters.
103. Bulk terminal and transport costs depend on geographical relation-ships. Typical costs quoted varied from f 1.00 to f 1.40 per picul (1 14.34to f 20.00 per short ton). Sugar is moved by barge to Guimaras and byspecial trucks and rail cars to Pulupandan.
104. Most exporters have agents or brokers in the U.S. Good communica-tions make it possible to adjust buying prices according to movements in theNew York futures market. Sales are made in the normal way to refiners,merchants or speculators, and are usually on a CIF or exship basis. Notenough information is available to make a valid analysis of the efficiencyof the export marketing operation, nor to show whether the margins arereasonable. Table 32 sets out relevant annual average prices, but the grossmargin includes freight which when expressed as a percentage of the marginmay vary enormously. It does not include sellers benefits for polarizationover 96o, which probably averages about 1.5% of sale price. It is signifi-cant that the prices of sugar in the Philippines run substantially abovethe prices established under the International Sugar Agreement.
Coconut Products
105. The basic problems for coconut at the primary level are dispersionof production and lack of bargaining power on the part of the small producer.Inadequate enforcement of grading standards removes the incentive to producea better quality product.
106. Apart from green coconut'sold for direct human consumption, allnuts are processed either into dessicated, or shredded coconut (used in theconfectionary trade), or into copra. Copra is further processed, bothlocally and overseas, to produce coconut oil and copra meal.
ANNEX 10Page 20
107. Coconut sales by farmers fall into three main categories: on thetree, fresh husked, and copra. Under the "tree" system, the buyer is respon-sible for all harvesting and transportation costs. Since the farmer's roleis confined to price negotiation, this is a popular system, particularly inareas where economic transportation is hard for the small grower to obtain.A number of specialized buyers are able to accumulate a reasonable quantityof cheap nuts for outward transportation, either in shell or after beingmade into copra; the profit potential is high for a skillful buyer.
108. If husked nuts are sold, they are usually hauled by the farmer toa roadside collection point. In this case, or in sales of ready processedcopra, the small farmer will almost invariably sell to a barrio buyer orfirst assembler - who will in turn sell to a Poblacion or larger buyer, andso on up the line until finally the nuts (by now almost invariably in theform of copra) reach an exporter or processor. Only the larger or bettersituated farmer, or a cooperative, is able to break the chain and selldirectly to either processor or export agent.
109. The basic grade for copra is Resecada; legally all copra has tobe sold on this basis with deductions for excess moisture. While reportedprices are for Resecada, in practice trade is conducted on a Buen Corrientebasis. This grade may contain up to 7.5% more moisture than Resecada. Copraobserved in warehouse Davao was of mixed grade and class; while that observedin Cebu was of similar grades but mixed class. Average moisture contentrange reported by one processor was 9-15%. The maximum allowed for Resecadais 7.5%. Until basic copra quality control is established, marketing prob-lems will endure, particularly in regard to free fatty acid (FFA) andaflatoxin.
110. Local buying prices reflect world price movements. The internationalmarket in Philippine copra has a reputation for being highly speculative, whichis hardly surprising in view of quality variations. Consequently, pricelevels fluctuate frequently and occasionally violently.
111. Marketing Margins. Table 33 sets out marketing margins; theaverage of about 31% is high, particularly when the reported farmers' priceis on the basis of a higher grade than that normally traded in local markets.The margin may to some extent be explained by the fact that about 30% of allexporters are situated in Cebu, as is the largest processor, whereas coconutproduction there is relatively small. High transportation and possiblyshrinkage costs may be contained in these margins. Prices reported forcopra delivered to warehouses in Cebu average somewhat higher than in thenation as a whole. Margins for coconut oil, and oil and meal combined, asshown in Table 35, further suggest that farmers get a relatively low shareof the proceeds at the initial sale of copra.
112. The farmers' position could be improved through producer associa-tions or cooperatives using properly controlled drying methods. Such as-sociations should be formed initially in smaller producing areas and centeredupon a single drying unit. Farmers would deliver husked nuts to this unitand receive provisional cash payment on the basis of delivered count. Dryingshould be under the control of a trained operator manager. Final payment

ANNEX 10Page 21
to growers would be made after copra sale has been concluded. By virtue ofvolume and quality control, the operator manager should be able to concludebusiness directly with a processor or major exporter.
113. The Coconut Investment Act is designed to encourage this type ofdevelopment (amongst other things). But the program envisaged seems verycomplex and cumbersome. Levy collection and the procedures involved willbe hard for the small growers to understand; and collection itself possiblyeven harder to enforce.
114. Quality and Grading. With all the pressures on highly saturatedoils, improved quality standards are vital. Prices must be geared to exist-ing grade requirements, which must be enforced. Aflatoxin limitations arebecoming increasingly stringent in importing countries, while high FFAcontent adds to the difficulties and costs of the crusher/refiner. Areputation for consistent and high quality of product and performance mustsomehow be established. The continuing trend towards processing, in orderto export in highest unit value form, is encouraging.
Tobacco
115. Two main types of tobacco are produced: (a) Native, a dark air-cured cigar-filler leaf, and (b) Virginia, which is flue, or very occasion-ally, air-cured. Native tobacco production is widely dispersed over thecountry; flue-cured production is confined to Luzon, and is a particularlyimportant cash crop in Ilocos. Production of both is erratic, and availablestatistics are far from adequate. As an export earner, tobacco ranks fourthin the agricultural sector. However, these earnings are substantially off-set by imports of cigar-wrapper leaf and flue-cured and burley tobaccos forblending in the local manufacture of internationally branded cigarettes(Table 35). Over 150 cigar and cigarette factories are registered andoperating. Approximately 50% of reported production is exported.
116. There are indications that exports have been maintained by drawingdown stocks. Almost certainly, the supply situation is causing internationalbuyers of flue-cured tobacco to look elsewhere. The long-term exchangeearning outlook is bleak unless a major reappraisal and reorganization ofthe industry takes place.
117. The Philippine Tobacco Board (PTB) performs a regulatory andpromotional function for the industry as a whole. Regulation is mainly bycontrol of export standards through the Tobacco Inspection Service of theBureau of Internal Revenue. The Boards' funds come from the inspectionfees; these amount to about ? 10 million annually. Promotion is carried outby the Bureau of Commerce. Extension is handled by the Bureau of PlantIndustry, although some extension work is also done by the two administra-tions specifically responsible for each crop: The Philippine TobaccoAdministration (PTA) for native tobacco and the Philippine Virginia TobaccoAssociation (PVTA) for flue-cured tobacco. The PTA is administered byDANR. The PVTA has very recently been moved under DANR administration.There appears to be little reason for the existence of three agencies ratherthan one which could ensure effective coordination of progress.

ANNEX 10Page 22
118. Exporters are not directly represented on the PTB, PTA or PVTA.Spain, the United States and France are the primary export markets for Nativetobacco, although the quantity allowed preferential entry into the U.S. underthe Laurel-Langley agreement is now very small. Allocation of correspondingexport quotas is made by the Quotas Division of the Sugar Quota Administra-tion, which also meets the cost of providing this service. Exports of flue-cured tobacco are mainly to Europe. Preferred export varietes of Nativetobacco and all flue-cured tobacco are grown in the northern part of Luzon.
119. The two administrations operate on slightly different lines. Butboth have a history of financial crises, high administrative overhead, andineffective participation in the market. Both hold stocks as a result oftheir marketing activities.
120. Native Tobacco. About 90% of production (Table 36) is bought bythe private sector, in bulk from the farmer, and regraded to suit specificdestination requirements. The remaining 10% was bought by the PTA, operatingthrough 30 buying station. Table 37 shows the cost of PTA activities andTable 38 the extent and effect of these activities on the farmer as seen byPTA. The main buying period extends from April to August. By not enteringthe market until June, the PTA takes the risk of being left with the dregs.A new scheme has been approved to remove PTA participation from direct buyingoperations but there has been little progress in implementation.
121. Virginia Tobacco. Statistical information on Virginia tobaccois even harder to come by than for Native tobacco. There is vast difference(between the figures of acreage and production provided by BAEcon and PVTA(Table 39), while total values reported by BAEcon bear no relationship tothe amounts PVTA has reported spending in crop purchase operations. Recently,all trading in Virginia tobacco has been reverted to the private sector.
122. Imports are allowed in a proportion of one to four. They are taxedat 100% of landed cost. An importer is thus bound to take 4 kg of localtobacco (from PTVA/PVTA stocks) for every 1 kg imported. There were indica-tions that much of the tobacco that comes from these stocks is of littlevalue and on occasion has to be destroyed.
123. The large domestic manufacturing industry provides a very soundbase for tobacco production and world demand for cigar leaf and low nicotineflue-cured tobacco of the type produced in the Philippines is strong. Yetproduction is, at best, static and yields are low. Quality is not what itshould be--the very large amounts of Native tobacco imported into the UnitedStates as 'scrap' (i.e., stripped) indicates a low leaf quality which isusually due to caterpillar, insect and disease damage, apart from poorcuring and fermentation.
124. Tobacco in the Philippines is essentially a smallholder crop,and is expensive to produce. Apart from a small contribution by ACA, creditrequirements are almost exclusively met by the private sector which, thus,virtually controls the initial disposal of the crop. Through lack of exten-sion and because of weather conditions, to a degree, plantings are staggered

ANNEX 10Page 23
over a long period. As a result, good prices for early harvesting encourage
premature harvesting of later plantings, with consequent reduction in qualityand therefore price. Severe flooding in the Cagayan Valley results in theneed for occasional replanting and frequent shortages of seedlings occur.
125. A degree of enforced legislation and control is essential. Thismay be more effectively applied through a body with overall responsibilityfor production and marketing. Ultimate selling through a centralized auction
system would promote internationally acceptable grading and quality standards.
126. Virginia production is confined to the Central and Northern parts
of Luzon (Ilocos, Abra, La Union, Pangasinan, Tarlac and Nueva Ecija) whilepreferred export qualities of Native Tobacco are grown in Isabela and Caga-yan. Tobacco from the Visayas and Mindanao is less desirable but issometimes "blended" for export with that from Cagayan/Isabela. The relativeconcentration of this export oriented production of both types of tobacco
should make it relatively easy to mount an action program.
127. The farmers principal present problems stem from lack of first
class seed and/or seedlings, lack of fertilizer and insecticides/acarides,low yields, staggered plantings, lack of extension, high unit productioncosts and low income. For the Virginia farmer, the shortage of fuel forcuring, and the high cost, is becoming a major constraint. This emphasizesthat marketing cannot be separated from production and the quality of theleaf.
Vegetables
128. Commercial vegetable production falls into four distinct sections.The production concentrated in lowland areas directly tributary, or adjacent,to main consumer areas such as greater Manila; production in upland areas,particularly Mountain Province, from which produce may be consigned to any
part of the country; production in one crop rice areas as a second crop;and the sand silt areas left by the 1972 floods. Lowland production tends
to be of,a seasonal nature, while that in the more temperate uplands hasmore leeway to be adjusted to meet anticipated demands.
129. Government policy has been directed towards achieving local self-sufficiency in rural areas. However, the major flow of marketed produce isto Greater Manila, either for consumption or shipment to another island.
(Baguio vegetables are available in Davao trading centers throughout theyear.) The aim of achieving local self-sufficiency could result in temporarysurpluses from various subsistence-oriented areas. If so, the marketing of
produce might become prone to short-term disruptions in supply patterns andreturns.
130. Apart from the Greater Manila Terminal Food Market (GMTFM), the_reare four wholesale markets in Manila; the most important is Divisoria PublicMarket. All of these older markets are congested, lack modern facilities,and are unsanitary in varying degree. What there is at GMTFM is of modern

ANNEX 10Page 24
design and construction and relatively clean. Ambulant vendors, both whole-sale and retail, abound.
131. Long chains of supply exist for vegetables. The Viajero (trucker-buyer) is more dominant than in other crops and plays a very important role
in assembling produce as well as financing. The vialero buys either directlyfrom a farmer, if individual supply is large enough, or from a local assembler.
le then transports the produce and sells, usually to a wholesaler. Becauseof the size and dispersion of individual wholesale markets, the interventionof a secondary wholesaler is frequently necessary before goods reach the
retailer.
132. Payment at all stages may be on a cash or credit base. If creditis involved a farmer may find that his proceeds reflect a consignment ratherthan merchant operation by the viajero. Some major wholesalers and institu-
tional buyers work with larger producers on a crop contract basis, with pricesettlement at the flowering or setting stage. The Marketing Action Team ofNFAC is encouraging producers to market directly to consumers, particularly
those in Government offices. 1/
133. Little information exists on annual price/volume movements, anddaily market intelligence is scanty. Work was done on prices and volumefor a short time during the appraisal and early stages of the GMTFM project,but this was discontinued just as the information was beginning to have somevalue. Considerable effort needs to be devoted to the collection, inter-pretation, and use of market intelligence.
134. Packayin.&_Gradingand Transportation. Traditional types of con-tainers are used, differing by variety of produce and also by origin. Loosely
woven bamboo baskets are customary for all forms of leafy vegetables, wombokand cabbage being packed in large (100 kg) containers and lettuce and celeryin smaller ones holding about 30-35 kg. Spoilage through crushing is high
if the containers are not properly loaded onto a truck. The widespread useof standard-sized wooden crates or boxes would reduce spoilage, increase the
load that could be carried per truck, and make accurate price reportingeasier. The manufacture of bamboo baskets is, however, an important cottageindustry and substitution will require careful planning.
135. Standard grades for some vegetables exist but are not generallyobserved. Presale practices with regard to trimming, bunching, etc., vary
from area to area and crop to crop. Lack of practical simple standard grades
hinders accurate price reporting. If one large wholesale market were
dominant, the problems of instituting grading and packaging improvements
would be eased.
1/ The development of farmers' wholesale markets in or near public marketsat selected sub-regional centers could widen marketing opportunities forsmall producers by bringing them into contact with more buyers, andperhaps eliminating some viajero operations.

ANNEX 10Page 25
136. Transport costs to the main market (Manila) average about 4centavos/kg from Baguio and 4.5 - 6 centavos/kg from Benguet. In lowlandareas, costs are usually computed on a per vehicle basis, which results ina cost of about 2 centavos/kg upwards (on a container basis, the cost issimilar). Charges by sea are calculated on a volume basis plus a handlingfee (the viajero traveling with his produce is exempt from the passengerfee). Sea transport is cheapest of all on a kg/m basis, but risks of spoilageare higher because of longer transit times.
137. Marketing Margins. There are few time series data on marketingmargins for perishable vegetables. Table 40 sets out a price structure,and apparent margins, derived from observations made in February 1971.Recorded margins are high, but show a reasonable relationship withperishability and likely spoilage. As an exception, margins for onionsand garlic appear disproportionate to the keeping qualities of thesevegetables. Margins probably fluctuate a good deal. The unregulated flowof production that results from lack of market intelligence and productionplanning, together with lack of storage, suggests that margins are likelyto be very tight with market saturation and wide at other times.
138. Greater Manila Terminal Food Market (GMTFM). GMTFM is intended tobecome a combined producer-transit-wholesaler market complex. The projectwas created in 1968 following the report of a Presidential committee on theorganization of a farmers marketing system. It is at Fort Bonifacio,situated on 120 ha of land, leased from government.
139. Expenditure of about t 225 million has either been incurred orauthorized so far. Construction of a 120,000 cu m of cold storage has beenauthorized. This was expected to cost about t 90 million. Completion isnot scheduled until mid-1973. During the 25 month period ending August 31,1971, value of trading operations totaled only t 11.4 million, on which grossearnings were f 284 thousand or about 2.5 percent of turnover. Between 400and 500 people are employed, some 200 on a regular basis.
140. The project is financed by DBP, under the assumption that theexistence of the market would improve the viability of agricultural industriesalready financed by DBP. Despite large expenditure, GMTFM facilities arestill limited and underutilized, although attempts to attract produce havebeen augmented by the granting of production and marketing credits toselected cooperatives and farmers. As of August 31, 1971, such advancestotaled f 3.35 million, of which f 2.57 million had been repaid.
141. Basically, GMTFM has much in its favor. The need for a new andsanitary market place is undeniable. The immediate consumer market of about3.5 million people has an average per capita income over three times the,national average. But it has not been successful, probably for the followingreasons:

ANNEX 10Page 26
- Inadequate initial project appraisal, includingoperational procedures.
- Devaluation and subsequent delays in construction, furtherhindered by severe weather.
- Too wide a range of objectives.
- Poor direction and management.
- Failure to consolidate success in one direction before
expanding in others.
- Failure of municipal authorities to enforce Public Healthlaws in other wholesale markets.
- Powerful opposition from owners and employees of other markets.
- Producer disenchantment with failure to maintain originalschedules of operation.
- Attempting to introduce too many innovative marketingpractices and paying insufficient regard to the strengthof traditional ones.
- Gross overstaffing relative to actual or likely turnover.
142. Current sales are estimated at about ? 120,000 daily, of whichabout # 105,000 is in hogs (f 70,000), poultry and eggs. Even if producewas not accompanied by its owner/seller, a staff of not more than 20 wouldbe quite capable of handling this sort of volume.
143. Whatever the future, the following immediate action is required:
(a) GMTFM's system of operations should be changed if it isa realistic and active alternative to grading and packingstandards, then this must be accepted. Turnover is vital.
(b) Reappraisal of possible rate of expansion and relative adjust-ment of staff.
(c) Freezing of all capital expenditure.
144. Sorghum. Efforts are being made to encourage sorghum production butto date accomplishment has fallen short of target. One of the reasons is
that not enough attention has been given to the marketing purposes andfunctions necessary for production development. Sorghum requires lessmoisture than corn and in the Philippines produces significantly higher
yields. However, there are difficult problems in harvesting sorghum andin finding markets.

ANNEX 10Page 27
145. To stimulate production, market outlets need to be developed andsome price assurance established. Farmers in Central Luzon expressed dis-appointment and disinterest in sorghum because they had been unable to selltheir production profitably to local feed millers.
146. Cassava. Areas and production of cassava has declined over thelast decade, despite steadily increasing local unit values (Table 41) andfavorable conditions in world trade. There are four major cassava starchfactories in Mindanao, each with a "home farm", and one modern plant inPangasinan (financed by DBP) which is not operating mainly through lack ofraw material. Cassava has to be processed in some degree before it can beconsumed, whether as flour, starch or as an ingredient in mixed animal feed.
147. Cassava is a subsistence crop in the Philippines. A combinationof marketing and extension improvements would be necessary if this crop is tocontribute to the feed base and perhaps emerge as an export commodity.
148. Peanuts. Production of peanuts is largely for human consump tionin both processed and unprocessed form. Marketing is handled exclusivelyby the private sector and the crop is not officially regarded as acommercial one. There is, nevertheless, a strong potential domestic marketfor processed nuts as a source of protein in the mixed feed industry andpeanut oil has considerable market appeal both locally and internationally.The world market for high class confectionery nuts is also expanding. Philip-pines could probably gain a share of world markets if production were enlargedthrough the development of markets and marketing services.
149. A similar situation applies to other crops, especially beans, whichare traditionally regarded as belonging to the subsistence rather thancommercial sector of production. Many of these products are, or can be, grownas second crops in nonirrigated areas. The study of market possibilitiesshould be given attention in order to increase farmers annual earnings andincrease the turnover of their marketing organizations in the "quiet" season.
150. Bananas. Banana exports involve "imposed" varieties for whichthere is scant domestic demand. Production and marketing is entirelyorganized by commercial companies, the largest being offshoots or subsidiariesof the dominant world banana firms. Growth of exports has been remarkable:from 300 tons in 1966 to over 224,000 tons in 1971.
151. The Philippines has become the major supplier to Japan, makingserious inroads into Taiwan's share. The market is entirely dependent luponJapan and there is no alternative buyer immediately in sight. Shipments ofSouth American bananas are beginning to appear in the Japanese market. ThePhilippines may therefore find it more difficult to expand exports as rapidlysome years hence.
152. Abaca. With the advent of synthetic fibers, the abaca markethas been badly hit (as have all natural fibers). Manufactured exports(i.e. ropes) have stabilized somewhat, but exports of fiber have steadilydeclined. The main use for the fiber is now in high quality specialized
ANNEX 10Page 28
paper such as for tea bags, filters, etc. and for printed electrical circuits.Much research is being carried out to determine alternative uses for thefiber. Pending the results of technical research there is little thatimproved marketing practices can do for this crop. Price pressures havealready made the less efficient producers and marketers turn to other crops.
153. A major plantation/pulp mill project for Bicol is under preparationand appraisal. Government must satisfy itself that the market can absorbthis increased output.
154. Mangoes and Melons. The Philippines produces superb mangoes and,the quality of honeydew and cantaloupe melons appears to be well up to inter-national standards. Mangoes are currently exported to Hong Kong but thereare considerable limitations on market development of both fruits as a resultof fruit fly. Research aimed at overcoming this problem is quite welladvanced. Assuming that this effort is successful, there will still have tobe lengthy negotiations with potential markets (notably Japan) before thesemarkets can be developed.
155. The marketing action required is two-directional. First, a fullmarket study must be made to determine quality, variety and taste preferencesin nearby potential markets (plus the usual economic investigation ofprice levels, elasticities, etc.). Second, a physical marketing study mustbe carried out to determine most desirable flow channels, economics of movement,and practical means of achievements. Probable resultant growers pricesshould be forthcoming from the first market study. Grading and packingshould take place as near as possible to point of production in order tominimize subsequent handling and damage.

ANNEX 10Table 1
PHILIPPINES
AGRICULTURAL SECTOR SURVEY
Table 1: ROADS IN PHILIPPINES 1/
Year Kilometers
(to June 30)
1960 37,153
1965 55,778
1970 67,525 2/
1971 72,820 2/
1/ National, provincial and muncipal/city roads
only.
2/ Feeder roads: 1970 10,425 km
1971 13,791 km additional tokilometerage stated

PHILIPPINES
AGRICULTURAL SECTOR SURVEY
Table 2: EXISTING HIGHWAYS BY REGION AND BY SURFACE TYPES - JUNE 30, 1971.(in kilometers)
SURFACE TY PESNational, (in percentage)
Regions Provincial,& City Feeder Misc. &Roads Roads Total Earth Macadam Bituminous Concrete Combination
0 - Manila & Suburbs / 1,371 1,371I - Ilocos 6,893 1,498 8,391
II - Cagayan Valley 4,894 1,346 6,240III - Central Luzon 8,89 924 9,413 25.4 48.2 19.8 4.6 2.0IV - Southern Tagalog 8,075 1,250 9,325V - Bicol 5,475 2,090 7,565VI - Eastern Visayas 8,40 1,435 9,840 20.3 63.9 11.1 h.5 1.2
VII - Western Visayas 9,255 1,L96 10,751VIII - N. & E. Mindanao 7,419 1,961 9,380 44.9 45.7 6.1 2.2 1.1
IX - S. & W. Mindanao 123543 1,797 14,3 40
Philippines 72,819 13,797 86,6162/ 29.8 51.4 13.4 3.9 1.5
1/ According to the DANR classification of regions.
2/ Includes cities of Manila, Caloocan, Quezon and Pasay. Other Manila and Suburbs included inRegion IV.
2/ This total does not agree with total presented by the DPH in its final summary sheet.
-3P0

PHILIPPINES ANNEX 10Tqble 3
AGRICULTURAL SECTOR SURVEY
Table 3: COMPARISON OF THE COSTS OF DIFFERENT METHODS OF TRANSPORT
(November 1967)
Method of Transport Transport Cost Expressed as Kg.palay equivalentier ton km.
Ox (Carabao) sled 24.54
Railroad 0.14
Motor Vehicle on National Highway 0.11
(highway)
Boats 0.07
Air 0.68
Source: Dr. Margaret R. Haswell - Potential For Economic Growth of ResourceDevelopment in Asian Agriculture

PHILIPPINES ANNEX 10Table 4
AGRICULTURAL SECTOR SURVEY
Table 4: PSC STANDARD FREIGHT RATES 1972
(excluding loading and unloading)
Transport Rate Remarks
Freight Truck P 0.03/100 kg./k. Excluding(P 0.03 per ton/km.) Manila Port Area
Bus, Jeep and P 0.03/100 kg./kr. Minimumauto-calesa (P 0.30 per ton/km.) charge PO.25
Interisland shipping P1.00 + P 0.0075/mile Rate per ton
Basic Rate + 30fo or cubic meter
plus authorized 70% + 10% + 10% + 18% whichever is
PSE Increases + 301 + 30% the greatest
Source: Public Service Commission.

ANNEX 10Table 5
PHILIPPINES
AGRICULTURAL SECTOR SURVEY
Table 5: RCA RICE ROAD RATES 1970 AND FROM JULY 1971.
(per ton/kilometer)
% IncreaseRegion 1970 1971 Decue
1. Luzon
Manila and Suburbs P 7.00 P 9.00 28.6(10 km. radius)
Ilocos 0.14 0.20 42.8
Mt. Province 0.30 - 0.35 0.30 1/ (0 to 16.7)
Cagayan Valley 0.17 0.30 2/ 76.5
Central Luzon 0.14 0.20 42.8
Southern Tagalog 0.14 0.20 42.8
2. Visayas
Negros Occidental 0.18 Within 10 km. radius 66.7 - 83.34.oo - 4.5o
Iliolo 0.22 Beyond 10 km. radius 33.4 - 50.00.30 - 0.33
3. Mindanao
Cotabato 0.17 76.5
Surigao 0.24 - 0.27 15 - 22.2
Davao 0.22 up to 0.30 3/ 36.4
1/ From Burgos to Mountain Province (mountainous).2/ From San Jose, Nueva Ecija, to Cagayan (rough and mountainous).
3/ Rates reduced according to road surface.
Source: RCA.

ANNEX 10Table 6
PHILIPPINES
AGRICULTURAL SECTOR SURVEY
Table 6: INTERISLAND AND OTHER SMALL VESSELSi
Registered withTonnage (GRT) Department of Commerce 2/ Philippine Coastguard
No. Tonnage No. Tonnage
Less than 100 7 1,663 41,426
101 - 500 85 2)?8 53,510
501 -1000 88 87 59,536
1001 -2000 28 271,385.27 32 49,081
2001 -3000 19 36 80,329
3000 and over 22 31 148,044
Sub-Total 271,385.27 431,926
Bay-River NA 1,268 24,0253/
Lake Vessels
Barges NA 1,124 312,312
Sailboats NA 305 4.,920
Bancas NA 20,601 5/ NA
1/ Excluding vessels owned by Philippine Government.
2/ Department of Commerce lowest "classification" is 30-100 tons. PhilippineCoastguard classes "over 100 to less than 500, 500 to less than 1000, etc."however, this cannot account for the 160,000 difference in registeredtonnage.
3/ Mostly tugs, ferries and barges.
4/ Excluding pleasure yachts.
5/ Includes vessels of 3 tons and less capacity. Possibly at least asmany more remain unregistered.

ANNEX 10
PHILIPPINES Table 7
AGRICULTURAL SECTOR SURVEY
Table 7: INTERISLAND SHIPMENTS OF RICE AND PALAY(Expressed in Mbtric Tons, Rice Equivalent)
Eastern WesternIsland Group Luzon Visayas Visayas Mindanao
Year
1964/65Incoming 12,593 3,985 4,497
Outgoing 16,680 4,395
1965/66Incoming 14,469 4,218 6,234
Outgoing 23,740 1,271
1966/67Incoming 53,627 25,721 3,499 8,610
Outgoing 15,626 15,465 10,595 49,771
1967/68Incoming 29,564 30,232 4,012 24,334
Outgoing 22,024 19,006 18,858 28,255
1968/(to 9-30)Incoming 8,933 18,889 6,651 12,008
Outgoing 18,091 8,000 5,623 14,767
Source: Bureau of Census and Statistics.

PHILIPPINES
AGRICULTURAL SECTOR SURVEY
Table 8: DOMESTIC PRODUCTION: MARKETED SURPLUS AND VOLUME CONTROLLED BY GOVERNMENT AND
PRIVATE TRADERS 1954/55, 1960/61, 1965/66 - 1969/70 1/
GOVERNMENT CHANNEL PRIVATE CHANTNELS% of Production Quantity % Purchased , Handled $ Handled
Crop Year Market Directed 2/ of Palay By Government Handled by Private by PrivateMarket by FaCoMas Traders Channel
Directed(M. tons)
1954/55 38.9 1,245,930 1.1 NA 98.9 --
60/61 46.5 1,759,759 NA NA NA --
65/66 53.5 3/ 2,178,860 1.1 1.1 97.8 98.9
66/67 54.8 3/ 2,243,523 4.4 2.2 93.4 95.6
67/68 55.8 2,544,869 9.7 3.3 87.0 90.3
68/69 53.7 2,386,780 3.0 3.5 93.5 97.0
69/70 60.5 3,166,212 7.2 2.3 90.5 92.8
Total/Percent(1965/66- 12,520,2b44 5.3 2.5 92.1 94.61969/70)
1/ Source: Adapted Leon A. Mears from Data collected from BAEcon, RCA, Philippine Exchange, Inc. A.C.A.
2/ Market directed considered to include rent and/or share to Landlord Debt Service to operators, farmerssales, payment to threshers.
3/ Extrapolated on basis of percentage figures from other years. co

PHILIPPINES
AGRICULTURAL SECTOR SURVEY
1/Table 9: DISPOSITION OF PALAY SOLD BY FARMERS, NUEVA ECIJA
(in percent of total volume sold)
Survey Year 1929/30 1955/56 2/ 1961/62 1968/69(620 farmers (985 farmers) (160 farmers) (79 non- 233 farmers (380
excluding tenants) farming and land- farmers) 3/landlords) lords excluding
sales toBuying Agency landlords
Middlemen 4/ 34 53 22 58 56
Millers 66 23 30 35 37 89
Retailers 1 1 1
Money Lenders 6 3 3
FaCoMas 5 4/ 3 3 5
NARIC/RCA 4 6
Landlords 12 41 5/ 4/
Other 3
Total 100 100 100 100 100 100
1/ Source: Leon A. Mears.
2/ Excludes non-farming landlords.
3/ No further breakdown available. Sample refers to 380 farmers of whom only 342 were palay farmers.
4/ Less than one percent.
5/ This appears to the mission to be a derived figure and is accompanied by the comment, "because tenantsare in urgent need of money, they sell their shares of the rice crop to their landlords long beforethe harvest season.
O

ANNEX 10Table 10
PHILIPPINES
AGRICULTURAL SECTOR SURVEY
Table 10: RCA COMPARATIVE SALES VOLUME AND NUMBER OF
PERSONNEL APRIL 1, 1962 TO NOVEIMER 15, 1971.1/
Year Sales Volume Number of Peso Sales perin Million Pesos Personnel Employee
1962 0.2 2266 88
1963 96.1 5694 16,877
1964 120.3 5694 21,128
1965 170.4 8422 20,232
1966 127.0 1911 64,434
1967 83.5 1830 45,628
1968 24.3 1580 15,380
1969 95.9 3213 29,847
1970 8.3 995 8,342
1971 146.2 1831 79,847
1/ Source: "The RCA in the Last 8 Months" (arithmetical error corrected).

ANNEX 10
PHILIPPINES Table 11
AGRICULTURAL SECTOR SURVEY
Table 11: RCA COMPARATIVE SALES VOLUME AND LOCAL
ADMINISTRATIVE AND DISTRIBUTION COSTS
APRIL 1962 - NOVEMBER 15, 1971 1/
Sales Volume Administration and Peso Sales per Peso
Year Million Pesos Distribution ExpenseMillion Pesos
1962 0.2 2.6 0.08
1963 96.1 11.5 8.36
1964 120.3 24.4 4.93
1965 177.h 47.8 3.71
1966 127.0 12.1 10.5
1967 83.5 22.2 3.76
1968 24.3 30.6 0.79
1969 95.9 18.1 5.30
1970 9.3 9.4 0.85
1971 146.2 10.5 13.92
1/ Source: "The RCA in the Last 8 Months"

ANNEX 10Table 12
PHILIPPINES
AGRICULTURAL SECTOR SURVEY
Table 12: COSTS OF RCA RICE AND CORN OPERATIONS
Year 1968/69 1969/70 1970/(1
Sales (Million Pesos) 1/ 43.266 l06.1o 114.197
Purchases (Million Pesos)1/ 60.4-53 143.793 20.917
Net Cost (Million Pesos) 17.187 37.689 6.720
Overhead (Million Pesos)2W 31.741 37.104 10 .60
Sub-total (Million Pesos) 48.928 74.793 17.180
Peso Cost/peso Sale 1.131 0.705 1.210
Accrued and CurrentInterest (Million Pesos) 36.202 54.960 97.412
Total Cost 85.130 129.753 114.592
Peso Cost/Peso Sale 1.967 1.223 8.072
1/ Carry over stocks ignored, i.e., volume of purchasesequal to volume of
sales.
2/ Including depreciation, normal stock wastage, "other income" but
excluding interest charges.
Source: Basic data abstracted from RCA financial statements, July 1968/June
1971.
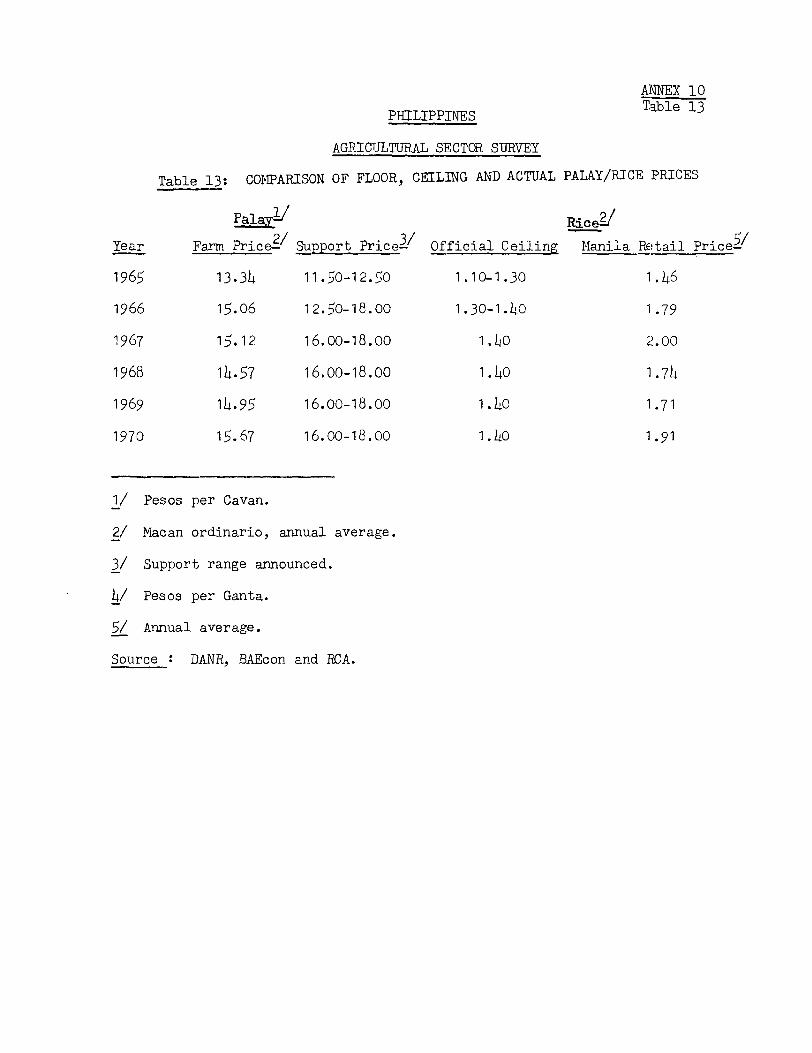
ANNEX 10
PHILIPPINES Table 13
AGRICULTURAL SECTOR SURVEY
Table 13: COMPARISON OF FLOOR, CEILING AND ACTUAL PALAY/RICE PRICES
P.11 RiceYear Farm Price- Suprt Price- Official Ceiling Manila Retail Price-
1965 13.34 11.50-12.50 1.10-1.30 1.46
1966 15.06 12.50-18.00 1.30-1.40 1.79
1967 15.12 16.oo-18.oo 1.40 2.00
1968 14.57 16.oo-18.oo 1.40 1.74
1969 14.95 16.00-18.00 1.40 1.71
1970 15.67 16.00-18.00 1.40 1.91
1/ Pesos per Cavan.
2/ Macan ordinario, annual average.
3/ Support range announced.
4/ Pesos per Ganta.
5/ Annual average.
Source : DANR, BAEcon and RCA.

PHILIPPINES
AGRICULTURAL SECTOR SURVEY
1/Table 14: PALAY: RELATIVE IMPORTANCE OF FARM AND COMMERCIAL STOCKS AS AT JULY 1, 1969-1971
('000 Metri.c Tons)
1969 1970 19712/ 2/ 2/
Farm Comm. Total Farm Comm. Total _ Farm Comm. Total _
PHILIPPINES 639.056 )93.244 1132.300 43.6 855.096 326.766 1181.862 27.6 803.792 210.443 1014.235 20.7
ILOCOS 39.996 4.68i LB.677 17.8 52.140 4.044 56.184 7.2 40.788 4.858 45.646 10.6
CAGAYANVALLEY 73.876 22.937 96.813 23.7 169.796 28.745 198.541 14.6 157.960 54.802 212.762 25.8
CENTRALLUZON 160.116 317.503 507.619 68.4 179.872 165.048 344.920 47.8 204.380 100.729 305.109 33.0
SOUTHERNTAGALOG 08.108 32.872 81.020 40.6 53.988 .45.21 99.409 45.7 88.660 19.470 108.130 18.0
BICOL 95.563 13.825 109.393 12.6 103.444 12.795 116.239 11.0 56.364 11.383 67.747 16.8
EASTERNlVISAYAS 39.644 4.717 44.361 10.6 57.728 8.589 66.317 12.9 46.332 3.106 69.638 6.3
WESTERNVISAYAS 94.64b 19.392 114.576 17.4 109.912 28.362 138.274 20.5 72.556 8.170 80.726 10.1
N.E.MINDANAO 49.720 7.788 57.508 13.5 43.340 7.181 50.521 14.2 61.996 4.893 66.889 7.3
S.w.MINDANAO 36.3))b 34.989 71.333 49.0 84.876 26.58 111.457 23.8 74.756 3.032 77.788 3.9
1/ BASIC DATA: BAEcon. 0
2/ Commercial stocks as percentage of total stocks (excluding non-farm households).

ANNEX 10Table 15
PHILIPPINES
AGRICULTURAL SECTOR SURVEY
Table 15: WAREHOUSE CAPACITY BY REGIONS, 1971('000 metric tons)
Equivalent Equivalent EquivalentRegion Palay 1/ Pinawa 2/ Milled Rice 3/
Philippines h/ 2,179,672 3,205,400 4,112,588
Ilocos 18,920 27,814 35,698
Cagayan Valley 158,796 233,524 299,615
Central Luzon 756,096 1,111,906 1,426,596
S. Tagalog 254,848 374,776 480,845
Bicol 90,156 132,582 170,106
E. Visayas 152,46o 224,206 287,660
W. Visayas 154,528 227,247 291,562
N.E. Mindanao 1-4,892 213,076 273,381
.S.W. Mindanao 448,976 660,259 87,125
1/ SOURCE: BAECON.
2/ Assumed 68% of palay by volume.
J/ Assumed 53% of palay by volume.
4/ NFAC/DBP total equivalent 2,998,787 tons palay.

PNILIPPINES
ACRICULTUHAL SECTOR SUBVEy
Та 51 е lo: UTILIZATION OF STOIiACE CAPACITy gy RBGIONS
19 б9- L 972 1, �
1969 1969 1969 1970 1970 1970 1970 1971 1971 1971 1972 1972Fe бruary 24 7и 1у 1 ОссоЬЕг 1 danuary 1 дрг11 1 Ju1y 1 Ос[оЬет 1 January 1 7и1у 1 Octo бer 1 ] апивгу 1 Арт11 1г̂h111pp1nee (2,179,672) °!
Рв1ву 70 Э ,195 49 Э ,244 231,585 340,085 459, В74 Э 26,766 22 Э ,102 244,939 210,443 В2,240 171,886 267,942Согп 3/ 52,226 24,350 59,973 В4,447 36,982 97,611 66,508 19,430 11,172 10,032 8,291 10,410Tote1 4/ 755,421 517,594 291,55 В 424,532 496,856 424, Э77 289,610 264, ЭЬ9 221,615 92,272 180,177 278,3527. Uc111zat1on 34.7 2Э .7 1Э.4 19.5 22.8 19.5 1Э .1 12.1 10.2 4.2 8,3 12. В
Ilocoe (18,920) 2/
Ре1еу 10,454 В , Ь81 2,077 5,452 4,9 Э7 4,044 2, В38 1, Ч45 4,858 97 ИА NAСогп 3/ -- -- -- Т3 -- 18 14 14 -- -- NA NA
Tote1 10,45G 8,681 2,077 5,475 4,937 4,062 2,852 1,959 4,858 97 ИА NAХ Ucill гa[ion 55. Э 45.9 11.0 28.9 26.1 21.5 15.1 10.4 25.7 0.5
Cegeyen Va11ey (158,796) 2/
Рв1ау з1, а1z 2z,9 Э7 1а,4 ьь а,ьz4 з0,289 ге,745 z з, е4 е tz,z67 54, ео2 1?,257 ИА иАСогп Э/ 287 529 725 2,526 137 9 410 1,035 470 506 ИА NAТо[ а1 72,099 2Э,466 19,381 11,150 30,426 28,754 7у.,258 13,292 55,272 13,76 Э ИА ИА
7. U[111 гвс1оп 20.2 14. В 12.2 7.0 19.2 1В .1 15.3 8.4 14.8 8,7
Сепсге7 Luzon (756,096) 2/
Рв1ау 410,379 347,3 Т1Э 91,392 145,719 233,715 165,04 В 9 В,644 131,595 100,729 27,434 NA NA
Согп 3/ 210 � ,:57 383 985 -- ЭЬ 27 59 -- 5 NA и�
Tota1 410,589 350,855 91,775 146,704 233,715 165,084 98,671 131,554 100,729 27,434 NA NA
7. Uс111 ге[[ оп 54. Э0 4 Ь.4 12.1 19.4 Э0.9 21.9 17.1 17.4 13.3 3.6
5ои[hern Tagelog (254,848) 2/
Ра1ау 72,965 Э 2,872 18,20 Э Э5,050 60, Э90 45,421 19,171 19,323 19,470 12,949 нА НА
Согл 3/ 192 ЭОЬ 474 269 55 780 201 JBB 55 9 NA NA
ТоСе1 7ё ,157 33,178 18,677 35,319 60,445 46,201 19,372 39,711 19,525 12,958 ИА ид
7. цt111 тв[1 оп 28.7 13.0 7.3 1Э .9 2Э .7 18.1 7.6 15.6 7.7 5.1
81 со1 (90,156) 2/
Ре1ву 16,181 13,825 3,124 16,799 10,806 12,795 4,719 В , Э95 11, Э8Э 8,501 иА NA
Согп Э/ 570 Э47 492 716 ЭЬ 74 Э 593 91 137 182 ИА ИА
То[ е1 16,951 14,172 3,616 17,515 10,842 12,5 Э 8 5, Э72 В ,486 11,520 8,683 ИА NA
7. Ut11l га[1 оп 18.8 15.7 4.0 19.4 12.0 13.9 5.9 9.4 12.8 9.6
еввсаrn vl еауев (152,460) г/
Ре1ау 7,427 4,717 4,057 9,36 Э 3,480 '8,689 7,669 7,040 Э ,106 2,482 NA ИА
Согп Э / 24,122 5,417 9,471 21,172 6,553 29,822 12,40 Э 3,014 2,052 Э ,032 NA ИА
То [е 1 Э1,549 10,134 13,528 30,535 10,0 ЭЭ 38,411 20,072 10,054 5,158 5,514 NA NA7. Ut111 ге[1 оп 20.7 б . б 8.9 20.0 Ь . Ь 25.2 13.2 б . б Э .4 З. бЧев[егп Vleayae (154,526) 2/
Ре1ау Э2,3 Э6 19,9 Э2 5,042 Э6,744 43,916 2$ Эб2 1Э ,442 14,120 8,171 4,004 ид NA
Corn З/ 1,290 1,031 1,751 1,956 2, Э21 6,288 3,876 793 670 8Ьб ИА ИАq
Q �n хTote1 ЭЭ , б26 20,96 Э 6,793 Э8,700 46,2 Э7 34,650 17, Э 18 14,91 Э 8,841 4,870 GA NA^, о7. Ut111se[1on Т1.8 13.6 4.4 25.0 29.9 22.4 11.2 9.7 5.7 Э.2 �

Table 16 (cont d) : UTILIZATION OF STORAGE CAPACITY BY REGIONS
1969 1969 1969 1970 1970 1970 1970 1971 1971 1971 1972 1972Febr uary 24 July I October 1 January I April 1 July 1 October I January I July I October 1 January 1 April I
Northern-Easterm Mindartao (144,892) 1/
Palay 13,495 7,788 13,451 12,373 6,450 7,181 5,931 12,113 4,893 4,074 NA NA
Corn 3/ 1,318 930 6,840 4,669 3,329 4,473 9.052 6,133 3,165 2,243 NA NA
Total 14,813 8,718 20,291 17,042 9,779 11,654 14,983 18,246 8,058 6,317 NA NA
% Utilization 10.2 6.0 14.0 11.8 6.7 '8.0 10 3 12.6 5.6 4.4
Southern - Western Mindanao (448,976) 1/
palay 107.945 34,989 75,583 69,920 57,891 26,580 46,820 18,141 3,032 9,442 NA NA
Corn 3/ 24,236 12,440 39,841 52,130 24,551 55,440 39,932 7,902 4,624 3,187 NA NA
Total 132,181 47,429 115,424 122,050 82,442 82.*,020 86,752 26,043 7,656 12,629 NA NA
% Utilization 29.4 10.6 25.7 27.2 18.4 18.3 19.3 5.8 1.7 2.8 NA NA
Source: Data frm BAEcon, except where shown. Includes milldd rice convered to palay.
Storage capacity expressed in ter= of palsy and aas d constant. See Table
3/ Shelled corn 80% by volume Palay, expressed as palsy
May not add, due to rounding.

ANNEX 10Table 17
PHILIPPINES
AGRICULTURAL SECTOR SURVEY
Table 17: DISPOSITION OF PALAY PRODUCTION IN THE PHILIPPINES
BY METHOD OF MILLING 1954/5 - 1967/68
(in percent)
Year Hand Kiskisan Cono NotPounding Mill Mill Milled
1954/55 19.8 27.0 42.1 11.1
1960/61 11.4 26.4 51.1 11.1
1968/69 4.2 27.9 56.9 11.
Source: Mission estimate derived from data supplied by BAEcon.

PHILIPPINES
AGRICULTURAL SECTOR SURVEY
Table 18: RICE MILLING CAPACITY(cavans of 44 kg of palay per 12 hours)
Cono onCono Kiskisan 2! Kiskisan Total ! Total 2/
No. Capacity No. Capacity Eo. CapaItv No Capacity No. Capacity NE. Capacity
Philippines NA 318,794 2,755 364,878 NA 379,882 11,246 504,612 NA 698,668 14,001 869,490Ilocos NA 1,255 11 1,245 NA 35,611 1,385 49,262 NA 36,866 1,396 50,507Cagayan Valley NA 21,028 134 23,470 NA 43,424 1,296 56,375 NA 64,452 1,430 79,845Central Luzon NA 123,306 1,037 157,703 NA 58,624 1,232 76,280 NA 181,930 2,269 233,983Southern Tagalog NA 38,055 440 46,614 NA 49,956 .1,703 69,651 NA 88,011 2,143 116,265Bicol NA 17,750 196 22,934 NA 39,140 946 42,319 NA 56,890 1,142 65,253Eastern Visayas NA 25,012 215 90,077 NA 30,083 788 35,019 NA r5,095 .1,003 55,096Western Visayas NA 23,112 273 3:,717 NA 51,065 1,795 75,040 NA 74,177 2,068 112,757N.E. Mindanao NA 24,097 166 22,411 NA 18,525 569 26,343 NA 42,614 735 48,754S.W. Mindanao NA 45,179 283 32,707 NA 53,454 1,532 74,323 NA 98,633 1,815 107,030
1/ Source: NFAC/DBP (Basis December 31, 1968 plus DBP financed mills January 1969 - February 1971).
2/Source: RICOB (position at June 30, 1971).

PHILIPPINES
AGRICULTURAL SECTOR SURVEY
Table 19: MILLING CAPACITY UTILIZATION, 1970/71
CASE 1 CASE 2 CASE 3 CASE 4
Capacity Riskisan Capacity Cono Percent Utilization Capacit Capacity Percent Utilization Capacity Capacit Percent Utilization Capacity Capacity Percent Utilization1500 Hours 3000 Hours (1) 1/ (2) 2! Kiskisan Cono (1) 1/ (2) 2/ Kiskinsa Cono (1) 1/ (2) 2/ Kiskisan Cono T
1500 Hours 5000 Hours 2500 Hours 3000 Hours 2500 Hours 5000 Hours
PHILIPPINES 47,485.2 79,698.5 81.0 66.7 47,485.2 132,830.8 57.1 47.9 79,142.0 79,698.5 64.8 52.4 79,142.0 132,830.8 48.6 40.0
ILOCOS 4,451.4 313.7 81.3 59.9 4,451.4 522.9 77.9 58.1 7,418.9 313.7 50.1 36.7 7,418.9 522.9 48.8 35.9
CAGAYAN VALLEY 5.428.0 5,257.0 126.3 104.5 5,428.0 8,761.7 95.1 80.2 9,046.7 5,257.0 94.4 76.6 9,046.7 8,761.7 75.8 62.7
CENTRAL LUZON 7,328.0 30,826.5 74.9 57.7 7,328.0 51,337.5 55.0 37.5 12,213.3 30,826.5 65.6 51.0 12,213.3 51,337.5 44.4 34.6
SOUTHERN TAGALOG 6,244.5 9,513.8 78.4 60.7 6,244.5 15,856.2 55.9 43.9 10,407.5 9,513.8 62.0 47.2 10,407.5 15,856.2 47.1 36.4
BICOL 4,892.5 4,437.5 78.0 66.1 4,892.5 7,395.8 59.2 49.1 8,154.2 4,437.5 57.8 50.0 8,154.2 7,395.8 46.8 39.6
EASTERN VISAYAS 3,760.4 6,253.0 64.3 68.8 3,760.4 10,421.7 45.42 50.7 6,267.3 6,253.0 51.4 52.3 6,267.3 10,421.7 38.6 41.1
WESTERN VISAYAS 6,383.1 5,778.0 104.9 67.8 6,383.1 9,630.0 79.6 50.8 10,638.5 5,778.0 67.8 50.9 10,638.5 9,630.0 62.9 40.4
N.E. MINDANAO 2,315.6 6,024.2 78.7 73.8 2,315.6 10,040.4 53.1 52.0 3,859.4 6,024.2 66.4 59.2 3,859.4 10,040.4 47.2 44.3
S.1. MINDANAO 6,681.7 11,294.8 66.5 68.5 6,681.7 18,824.6 46.9 52.2 11,136.2 11,294.8 53.3 50.5 11,136.2 18,824.6 39.9 41.1

ANNEX 10Table 20Page 1
PHILIPPINES
AGRICULTURAL SECTOR SURVEY
Table 20: ESTIMATED COST OF MARKETING PALAY RICE THROUGH PRIVATE-CHANNELS,FARMER-PALAY,WHOLESALER-MILLER-RICE WHOLESALER-RETAILER
CONSUMER (NUEVA ECIJA TO MANILA3 1966 & 1970 1/
1966 1970After Devaluation
P Per Cavan P Per CavanRice Equivalent Rice Equivalent
I. Palay price at farm gate X = R 16.77 1.820X X=R19.19 1.820X
II. Add Costs to Wholesale Palay:a) Transport to mill warehousei/ 0.36 o.64b) Handling: pickup & at
wholesale 0.36 0.55c) Depreciation of palay sack 0.50 0.55d) Palay wholesaler's profit 2/ 0.024X 0.024X
Total Cost to Wholesale Palay 1.22 + 1.84hX 1.74 + 1.844X
III. Add Storage Costs:a) Storage, 3 months average 0.55 0.55b) Interest,3 " at 12%/yr. 0.054X 0.054Xc) Insurance, 3 months at 1.5%/yr. 0.007X 0.007Xd) Losses in warehouse & mill, 1% 0.0181 0.018X
Total Cost to illing 1.77 + 1.923X 2.29 + 1.923X
IV. Add Costs to Wholeogle Rice:a) Milling costs J 0.75 o.95b) Sack - good 2nd hand jute 0.80 0.75 (plastic)c) Spillage - 0.2% of rice 0.004X 0.004Xd) Miller's profit Y7 0.001 0.040Xe) Less: by-products / (0.95) (1.66)
Total Costs, ex-Rice Mill 2.37 + 1.967X 2.33 + 1.967X
V. a) Handling; 2 movements (atmill) 0.10 0.15
b) Transport to wholesale ware-house) 0.70 1.00
c) Handling; in and out atwholesale warehouse 0.15 0.22
d) Warehouse overhead 0.10 0.20e) Wholesaler's profit 1/ 0.025X 0.025X
Total Cost to Wholesale Rice 3.42 + 1.992X 3.90 + 1.992X
VI. Add Retail Expenses:a) Retailers net costs o/ 0.7 1.38b) Retailers net profit 3/ 0.60 0.97
Total Costs to Retail (Y)/cav. rice Y=4.59 + 1.992X Y = 6.25 + 1.992XTotal Costs to Retail (Y) ganta 0.195 + 0.085X 0.266 + 0.085X

ANNEX 10Table 20Page 2
Footnotes:
1 Fastimated marketing costs in Nueva Ecija/Manila market assuming cleandry palay procured in Nueva Ecija, deposited in a bonded mill warehousewith a 300 cavan per day capacity, 12 hours operation, 200 days peryear, 55% recovery by volume of common quality; milled after 3 monthsof storage with milled rice retailed in Manila and suburban markets.
2/ Varies with transport facilities and road conditions in the area. Whereroads are poor, transport costs are much higher than prevailing motorfreight rates. Transport costs included here are for good 2nd classroads.
/ These net profit margins reflect profit levels reported as customary.
/ Jute sack used 4 times; plastic sacks used 2 times.
/ Breakdown of daily expenses in the mill per cavan or rice recovered:
1966 1970(after devaluation)
a) Fixed charged depreciation, mainte-nance 4 repair, insurance & taxes P 0.33 P 0.35
b) Operating expenses 0.13 0.19c) Salaries of personnel 0.08 0.11d) Handling expenses 0.21 0.30
Total 0.75 o.95
6/ Revenue from by-products:
Bran - D-1 0.61 1.02D-3 0.20 0.43
Binlid 0.11 0.16Mata-mata 0.03 0.0
Total revenue 0.95 1.66
/ Retailer's per cavan mark-up:
Less: Retailer's costs/cavan rice:Transport to retailer P 0.20 P 0.30Unloading 0.05 0.08Rents 0.10 0.20Insurance, license, taxes,depreciation, interest 0.05 0.10
Suppliers (paper bags) 0.15 0.30Labor 0.50 0.70Losses and shrinkage allowance 0.04 0.10Other operating expenses 0.08 1.17 0.20 1.98
0 0.37Plus: Proceeds from sales of rice sack 0.60 0.60
Net .rofit to retailer/cavan rice 0.60 0.97
Source: RCA

ANNEX 10Table 21Page 1
PHILIPPINES
AGRICULTURAL SECTOR SURVEY
Table 21: COST OF RICE AT DIFFERENT BUYING PRICES UP TO CONSUMERSON BUY-MILL AND SELL METHOD
(per 100 cavans of Palay)
(1) (2) ()
A. Unit buying price of palay of 46kilos gross P20.00 P3000
For 100 cavans P2,000 12,500 P3,000B. Procurement Expenses
a) Trucking from field to ware-houses at P0.50 per cavan 50.00 50.00 50.00
b) Empty sack depreciation 40.00 40.00 40.00c) Interest at 12%/annum for 2 mos. 40.00 50.00 60.00d) Storage fee at P0.25 for 1st
2 mos. 25.00 25.00 25.00e) Stock insurance at 3%/annum for
2 mos. 10.00 12.50 15.00f) Shrinkage allowance at 1% 20.00 25.00 30.00Cost of palay, Ex-Miller's Whse. R2,185.00 12,702.50 P3,220.00Equivalent cost of Palay to Rice P3,911.56 P24,910.06 P5,850.29
C. MLllingE4penses:aMlling fee at P .50/cavan
of clean rice _/ 83.79 82.56 82.56b) Cost of polythene sack at
PO.80/piece 470 4.0 .0Total Milling Expense P12.9 12 .59 9126. 9
Gross cost of rice after milling P4,040.05 P5,036.65 P5,976.88
Less:
D. Revenue from by-products 108.10 121.90 121.90Cost of rice after deductingrevenue from by-products P3,931.95 P4,914.75 P5,854.98Per cavan P39.32 P49.15 P58.55
E. Add:a7 Transportation from whse. to
wholesalers whse. per cavanof 56 kilos (Manila) 1.00 1.00 1.00
b) Profit of Millers at about 5%of total cost 1.97 2.4 29
Cost of Rice to Wholesalers(Manila) T 0 .F. Add:
7 Cost of storage at P0.25 perCavan of 56 kilos 0.25 0.25 0.25
b) Profit of Wholesaler at 3% ofhis investments 1.27 1L5 1.87
Cost of Rice to Retailer Ex-Whole-saler Warehouse ?44.11 954.43 164.60
G. Add:Retailer's Expenses
a) Trucking expenses from whole-saler 's warehouse toretailer at PO.50/bag 0.50 0.50 0.50
b) Profit of Retailer atR0.15 per ganta minimum 3.52
Final cost of rice per cavanup to consumer P48.13 P58_45 P68.62
Per Ganta P 2.05 9P2.49 P 2.92
CEILING PRICE P 2.10 P 2.50 P 2.90Excess of Ceiling Price over that
to consumers per ganta P 0.05 P 0.01 R(O.02)Per Cavan / P 1.17 P 0.0235 P(0.47)
1 Column 1 was estimated at milling recovery rate of 68% by weight while ti-atof Columns 2 and 3 was estimated at 67% by weight.
2 This will probably add up to the Wholesalers profit/cavan or represent toabout 5.8% for M-2; 3.44% for Special and 2.24% for Fancy instead of straight3%. Ordinarily, profit of wholesalers to retailers ranges from RJ .00 toP1.50 per cavan or about 2.4% to 3.5% of money invested.
Source: Adopted from figures provided by RCA.

ANNEX 10Table 22
PHILIPPINES
AGRICULTURAL SECTOR SURVEY
Table 22: PAIAY/RICE PRICE RELATIONSHIPS
Farm Price Wholesale Retail RetailC. Luzon)/ Cabatuana Cabanatuan2 Manila
(1)!/ (2)2 (1 ) 4 (2 )2/
1969 July 16.05 1.45 1.55 1.88August 17.40 1.56 1.75 1.88September 18.37 1.64 1.70 1.9bOctober 20.00 1.77 1.85 2.02November 15.33 1.39 1.66 2.02December 16.13 1.46 1.51 1.91
1970 January 17.55 1.76 17.41 1.56 1.51 1.72February 17.79 1.78 17.26 1.55 1.50 1.68March 18.32 1.82 17.00 1.53 1.50 1.71April 19.28 1.90 17.00 1.53 1.66 1.87May 19.77 1.95 20.00 1.77 1.80 1.90June 19.74 1.94 - - 1.80 1.90July 19.29 1.91 23.29 2.03 1.83 1.99August 19.10 1.89 22.48 1.97 1.88 2.03September 19.87 1.95 22.62 1.98 1.90 2.06October 17.80 1.78 21.70 1.90 1.90 2.03November 17.12 1.72 19.70 1.74 1.90 2.01December 19.73 1.94 19.00 1.69 1.82 1.98
1971 January 21.20 2.07 23.15 2.02 2.06 2.02February 24.59 2.36 25.93 2.24 2.15 2.17March 24.33 2.07 26.35 2.28 2.20 2.32April 26.28 2.50 27.41 2.36 2.31 2.43May - - 27.68 2.38 2.36 2.46June 26.42 2.51 29.20 2.50 2.28 2.50July 28.00 2.65 34.14 2.90 2.52 2.61August 29.04 2.73 36.00 3.05 2.69 2.81September 30.09 2.82 35.65 3.02 2.70 2.87October 27.75 2.62 25.00 2.17 2.65 2.89November 29.34 2.76 31.50 2.69 2.72 2.88December 28.96 2.73 - - 2.83 2.80
1972 January 29.79 2.55 2.76February 27.79 2.40 2.75March 30.06 2.57 2.73April 2.78
Per cavan Palay.Equivalent Retail price per Ganta Rice, Manila (TableRetail price per Ganta.
Source: BAEcon for Basic Data, RCA for conversion factors.

ANNEX 10Table 23
PHILIPPINES
AGRICULT7jRAL SECTOR SURVEY
Table 23: PRODUCTION OF WHITE AND YELLOW SHELLED CORN ('000 metric tons)
(1) (2) (3)(2) as % of
Crop Year White Yellow (1) + (2)
1964/65 834.7 296.2 26
1965/66 872.6 309.6 26
1966/67 918.3 325.8 26
1967/68 922.6 327.4 26
1968/69 1,476.6 256.2 15
1969/70 1,773.9 185.3 9
1970/71 1,780.9 209.2 10
Source: BAECON and NFAC, Feedgrains Program.

ANNEX 10Table 27
PHILIPPINES
AGRICULTURAL SECTOR SURVEY
Table 24: PRODUCTION OF SHELLED CORN BY VARIETY, 1969/70 - 1970/71 ('000 metric tons)
1969/70 1 1970/71White Yellow Other Total- White Yellow Other Totali
Philippines 1! 1,773.9 185.3 49.0 2,008.2 1,780.9 209.2 14.9 2,005.0
Ilocos 4.1 4.4 1.7 10.2 8.0 2.5 0.2 10.7
Cagayan Valley 170.7 5.5 24.7 200.9 216.6 1.9 5.5 224.0
Central Luzon 30.7 9.3 1.9 41.9 37.3 9.9 1.5 48.7
Southern Tagalog 41.8 97.5 10.3 149.6 44.7 115.2 2.0 161.9
Bicol 44.6 22.1 0.9 67.6 57.2 13.5 - 70.7
Eastern Visayas 180.7 1.0 181.7 177.5 0.4 1.7 179.6
Western Visayas 154.7 31.5 5.5 191.7 166.2 43.0 0.5 209.7
N.E. Mindanao 169.1 2/ 1.4 170.5 156.8 2.9 - 159.7
S.W. Mindanao 977.5 13.9 2.5 993.9 916.6 19.9 3.5 940.0
1/ Totals may not add due to rounding.
2/ Less than 100 tcns.

PHILIPPINES
AGRICULTURAL SECTOR SURVEY
1/Table-25: FARM AND COMMERCIAL STOCKS OF CORN, AS OF JULY 1, 1969-1971 (metric tons)
1969 1970 1971Farm as Farm as Farm as
Farm Commercial Total % of Total Farm Commercial Total % of Total Farm Commercial Total % of Total
Philippines 80,415 30,438 110,853 72.5 103,495 122,015 225,510 45.9 134,138 13,965 148,103 90.6
Ilocos 211 - 211 100.0 621 23 644 96.4 393 - 393 100.0
Cagayan Valley 3,118 661 3,779 82.5 7,877 11 7,888 99.9 8,436 587 9,023 93.5
Central Luton 479 4,189 4,668 10.3 234 46 280 83.6 1,311 - 1,311 100.0
Southern Tagalog 2,485 382 2,867 86.7 2,491 975 3,466 71.9 6,988 68 7,056 99.0
Bicol 5,928 433 6,361 93.2 8,710 929 9,639 90.4 4,725 171 4,896 96.5
Eastern Visayas 7,609 6,772 14,381 52.9 15,145 37,278 52,423 28.9 16,559 2,565 19,124 86.6
Western Visayas 3,565 1,288 4,833 73.3 5,854 7,860 13,714 42.7 8,715 838 9,553 91.2
N.E. Mindanao 24,949 1,163 26,112 95.5 20,229 5,592 25,821 78.3 50,964 3,956 54,920 92.8
S.W. Mindanao 32,091 15,550 47,641 67.4 42,334 69,301 111,635 37.9 36,047 5,780 41,827 86.2
Total Corn Imports
1969 - 24,9371970 - 651971 - 39,190
1/ Includes milled corn converted to shelled corn.
Source: Basic Data, BAECON.

ANNEX 10PHILIPPINES AbE 26
Table 26
AGRICULTURAL SECTOR SURVEY
1/Table 26: CORN MILLING CAPACITY (CAVANS OF q7 KGS SHELLED CORN PER 12 HOURS)
(JUNE 30, 1971)
Cono Mills Kiskisan Mills TotalNo. Capacity No. Capacity No. Capacity
Philippines 596 73,871 3,h6 1h9,o53 4,02 222,924
Ilocos - - 75. 4,143 75 4,143
Cagayan Valley 30 1,663 499 23,419 529 25,082
Central Luzon 17 2,030 124 7,oo 141 9,034
Southern Tagalog 1 30 116 4,956 117 4,986
Bicol 23 2,130 172 6,728 195 8,858
Eastern Visayas 94 25,938 294 10,367 388 36,305
Western Visayas 61 6,896 296 12,053 357 18,949
N.E. Mindanao 122 15,567 488 24,004 610 39,571
S.W. Mindanao 248 19,617 1,382 56,379 1,630 75,996
1/ Excluding dual purpose mills.
Source: RICOB

PHILIPPINES
AGRICULTURAL SECTOR SURVEY
Table 27: WHITE CORN CONSUMPTION AND INTER-REGIONAL MOVEMENT REQUIREMENTS, 1970-71
Apparent Crude Net 1/ Movement 1/ 2/Whole Grain Production 1/ Surplus 1/ Seed Surplus Required
Consumption Population Consumption 1/ Equivalent White Corn (Deficiency) Requirement 1/ (Deficiency) InwardsKg/head 3// '000
year
Philippines 23.0 37,528 863.4 1,288.6 1,780.9 492.3 35.1 457.2 337.1
Manila 0.5 3,267 1.6 2.4 - (2.4) - (2.4) 2.4
Ilocos 2.5 1,641 4.1 6.1 8.0 1.9 0.3 1.6
Cagayan Valley 28.0 1,723 48.2 71.9 216.6 144.7 3.8 140.9
Central Luzon 6.0 5,222 31.3 46.7 37.3 (9.4) 1.1 (10.5) 10.5
Southern Tagalog 1.5 5,148 7.7 11.5 44.7 33.2 0.8 32.4
Bicol 12.0 3,017 36.2 54.0 57.2 3.2 1.3 1.9
Eastern Visayas 65.0 4,758 309.3 416.6 177.5 (284.1) 4.9 (289.0) 289.0
Western Visayas 29.0 4,556 132.1 197.2 166.2 (31.0) 4.2 (35.2) 35.2
N.E. Mindanao 32.0 3,097 99.1 147.9 156.8 8.9 4.3 4.6
S.W. Mindanao 38.0 5,099 193.8 289.3 916.6 627.3 14.4 612.9
1/ '000 metric tons. x2/ Wholegrain equivalent.3/ Mission estimate derived from FNRC data.
Source: BAEcon, NFAC.

ANNEX 10Table 2b
PHILIPPINES
AGRICULTURAL SECTOR SURVEY
Table 28 MARKETING MARGINS. 1965-1970
Grain 1/ Grits 2/ Commercial 5/ Margin to 6/per Kilo per Kilo Margin 3/ Imports 4/ Stocks % Retail Manila
1965 0.256 0.h80 h7 0.36 na 42
1966 0.281 0.480 41 0.18 na 38
1967 0.258 0.455 43 6.99 na 42
1968 0.249 0.450 45 4.73 na 49
1969 0.263 0.500 47 24.94 32.4 43
1970 0.329 0.501 34 0.06 62.1 35
1971 0.468 0.940 50 39.19 13.8 44
1/ National average price received by farmer.2/ National average price paid by farmer.3/ Marketing margin as percentage of price paid by farmer.U/ 'Q000 metric tons.3/ As at July 1.T/ Average Manila retail price for whole grain.

PHILIPPINES
AGRICULTURAL SECTOR SURVEY
Table 29 VISAYAS AND MINDANAO: 1969 FARM CORN PRICES, WHOLESALE GRIT PRICES AND MARKETING MARGINS
Farm Wholesale Farm Wholesale Farm Wholesale . Farm Wholesale AveragePrice Price Margin Price Price Margin Price Price Margirt Price Price Margin Margin
Pesos/Kilo Pesos/Kilo Percent Pesos/Kilo Pesos/Kilo Percent Pesos/Kilo Pesos/Kilo Percent Pesos/Kilo Pesos/Kilo Percent Percent
Eastern Visayas 0.29 0.34 15 0.29 0.43 33 0.27 0.41 34 0.26 0.34 24 26.5
Western Visayas 0.29 0.37 21 0.29 0.46 37 0.24 0.45 47 0.20 0.35 43 37.0
N.E. Mindanao 0.22 0.34 35 0.23 0.46 50 0.20 0.38 47 0.21 0.32 34 41.5
S.W. Mindanao 0.21 0.34 38 0.22 0.40 45 0.18 0.38 53 0.23 0.33 30 41.5
January to March April to June July to September October to December
Source: BAEcon and 'A view of Marketing Agricultural Production Visayas and Mindanao' (DANR).
ro

ANNEX 10Table 30
PHILIPPINES
AGRICULTURAL SECTOR SURVEY
Table 30: RCA GRADES FOR YELLOW AND WHITE CORN
Factor 1/ Grade 1 Grade 2 Grade 3 Grade 4 Grade 5
1. Purity 2/ 98 97 96 95 93
2. Cracked Kernels andForeign Matter 3/ 2 3 4 5 7
3. Other Colored 3/ 2 3 4 5 5
4. Damaged Kernels 3/
a) Total Damaged 3/ 3 5 7 10 12
b) Heat Damaged 37 0.1 0.2 0.5 1 3
5. Immature Kernels 3/ 3 5 10 13 15
6. Maximum Moisture 3/ 14 15 16 18 20
1/ Based on gross weight for factors 1 and 2, net weight for factors 3 to 6.2/ Minimum percentage allowed.3/ Maximum percentage allowed.

PHILIPPINES ANNEX 10Table 31
AGRICULTURAL SECTOR SURVEY
Table 31: SUGARCANE: TOTAL RATED MILLING CAPACITIES
Crop Year Mills Total Rated Cane Pro- AverageCapacity 1 duction 2 Utilisation 3/
1961 23 84,844 11,744.6 69.2
1962 25 87,261 13,097.6 75.0
1963 25 87,911 14,229.1 80.9
1964 25 92,857 16,442.5 88.5
1965 26 104,218 16,100.0 77.2
1966 25 104,551 13,282.2 63.5
1967 25 110,948 15,277.3 68.8
1968 25 115,136 15,280.0 66.4
1969 26 119,801 16,448.o 68.6
1970 33 144,298 20,218.1 70.0
1971 34 164,845 23,305.8 70.7
1972 37 175,314 24,629.8 70.2
1/ Short tons cane per day.
2/ '000 short tons.
3 Percentage basis average 200 day milling year.
6/ Estimated.
Source: Basic Data Philsugin and National Federation of Sugarcane Planters.

PHILIPPINES ANNEX 10Table 32
AGRICULTURAL SECTOR SURVEY
Table 32: SUGAR PRICES PHILIPPINES1/ & NEW YORK2/
US cents/lb
(1) (2) (3) (4) (5) (6)Year Philippines New York Gross (3) as % ISA daily (5) as %
___ _ _Margin of (2) price of (1)
1960 3.32 6.31 2.99 47.38 n.a. n.a.
1961 4.18 6.29 2.11 33.59 2.70 64.6
1962 4.90 6.46 1.56 24.15 2.80 57.1
1963 6.50 8.18 1.68 20.54 8.31 127.8
1964 5.13 6.90 1.77 25.65 5.77 112.5
1965 4.76 6.75 1.99 29.48 2.08 43.7
1966 5.87 6.99 1.12 16.02 1.81 30.8
1967 6.24 7.28 1.04 14.29 1.92 30.8
1968 6.39 7.52 1.13 15.03 1.90 29.7
1969 6.65 7.75 1.10 14.19 3.20 48.1
1970 5.30 8.07 2.77 34.32 3.68 69.4
1971 6.23 8.52 2.29 26.88 4.50 72.2
1] Reported average export prices paid in Luzon and Visayas (Source Philsugin)converted at DTF exchange rates.
2/ Cif Duty paid.
3j Arithmetical average of the NYCSE contract No. 11 spot price and the London
daily price after converting the latter to US cents per pound fob stowed Caribbean
Port in bulk.
Basic Data. Philsugin and ISO Sugar Yearbooks.

PHILIPPINES ANNEX 10Table 33
AGRICULTURAL SECTOR SURVEY
Table 33: COPRA: PRICES RECEIVED BY FARERSAND MARKETING MARGINS
Year Farmers Pricel/ Export Price / Marketing Margini
1961 301.6 484.7 37.8
1962 367.2 566.6 31.2
1963 431.8 636.9 32.2
1964 432.8 670.6 35.5
1965 526.5 752.3 30.0
1966 462.4 651.7 29.0
1967 482.6 656.3 26.5
1968 549.3 755.3 27.3
1969 509.4 676.1 24.7
1970 737.4 1,125.2 34.5
Average 480.1 697.6 31.2
1 Pesos per 1,000 kg Resecada.
2 Pesos per 1,000 kg fob export steaer (converted at IMF rates of exchange).
/ As percentage of fob price.
Source: Basic Data Central Bank and BAEcon.

PHILIPPINES
AGRICULTURAL SECTOR SURVEY
Table 34: COCONUT OIL AND COPRA NEAL - MARKETING MARGINS
Price- Oi4sCr~ 6/Year Copra Pricei/ Oil as_cpr Meal as Copra Oil Margin Oil & Meal Margin- Copra Margin6/
1961 301.6 473.1 57.4 36.2 75.9 37.81962 367.2 535.2 85.1 31.4 6t.9 35.2
1963 431.8 598.6 95.7 27.9 60.8 32.2
1964 432.8 653.6 77.5 33.8 68.9 35.51965 562.5 722.7 89.5 27.1 54.3 30.01966 462.4 600.8 98.4 23.0 51.2 29.0
1967 482.6 647.2 81.2 25.4 50.9 26.51968 549.3 760.6 80.5 27.8 53.1 27.31969 509.4 629.9 73.1 19.1 36.0 24.7
1970 737.4 1,161.7 135.5 36.2 75.9 34.5
1/ From Table 10.1, column (1) (Pesos per 1,000 kg).
2/ Export price converted basis 64/ extraction rate (Pesos per 1,000 kg).
3/ Export price converted basis 35% extraction rate (Pesos per 1,000 kg).
4/ Difference between (2) and (1) as percentage of (2).
5/ Difference between LT2) + (3f and (1) as percentage of L2) + (3)7.
6/ From Table 10.1, column (3).
Source: Basic Data: Central Bank and BAEcon. Exchange rates IMF. X

PHILIPPINES
AGRICULTURAL SECTOR SURVEY
Table 35 TOBACCO: EXPORTS, IMPORTS AND VALUES
EXCESS EXPORTS OVEREX P 0 RTS IMPORT S EXCESS IMPORTS
FOB FOB Landed Landed LandedQuantity Value Value Value Quantity Value Value Value Quantity Valuem tons 1000 US$ Pesos/kg US cents/lb m tons '000 US$ Pesos/kg US cents/lb m tons 1000 US$
1964 33,341 18,130 2.12 24.65 514 650 4.93 126.46 32,917 17,480
1965 24,571 13,590 2.16 25.13 903 830 3.60 91.91 23,668 12,760
1966 22,146 10,680 1.88 21.93 1,740 1,980 4.45 113.14 20,406 8,700
1967 27,438 12,720 1.82 21.07 2,436 3,200 5.15 131.36 25,002 9,520
1968 33,440 17,090 2.01 23.23 3,157 4,870 6.05 154.26 30,283 12,200
1969 32,625 16,020 1.93 22.32 4,836 8,110 6.62 167.70 27,789 7,910
Source: FAO Trade Yearbook 1970 and USDA.
D) z
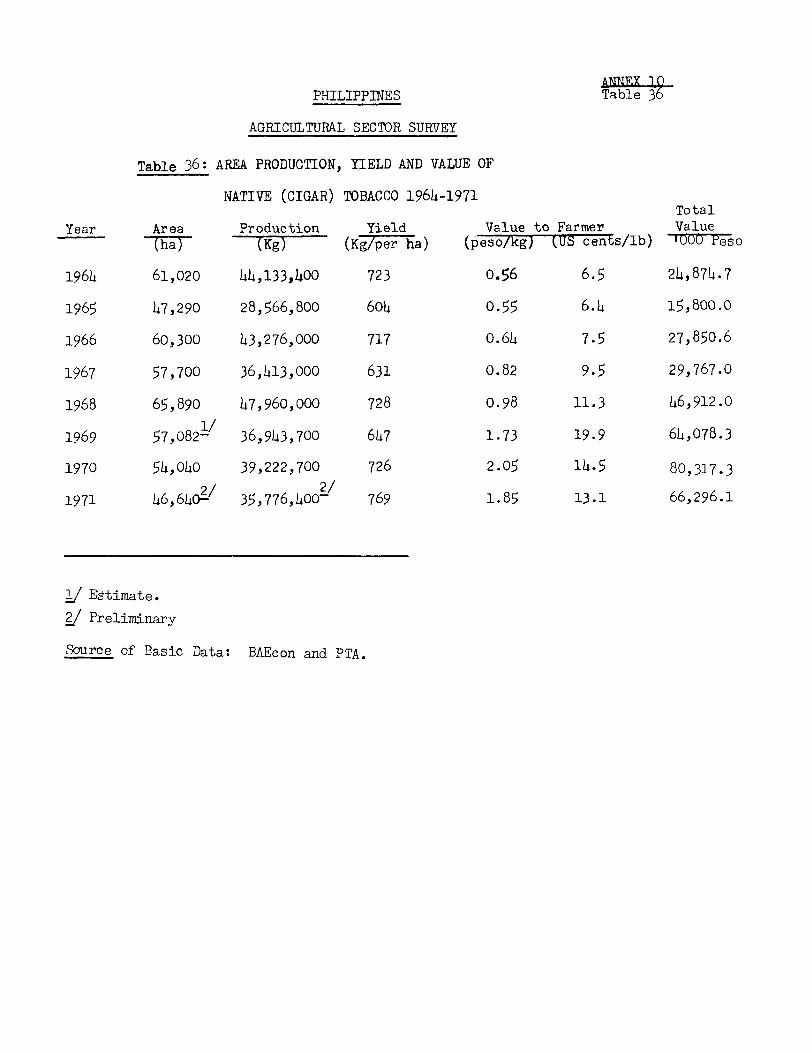
ANNEX 1PHILIPPINES Table
AGRICULTURAL SECTOR SURVEY
Table 36: AREA PRODUCTION, YIELD AND VALUE OF
NATIVE (CIGAR) TOBACCO 1964-1971Total
Year Area Production Yield Value to Farmer Value
TaT (Kg) (Kg/per ha) (peso/kg) (US cents/lb) IUUU Peso
1964 61,020 44,133,00 723 0.56 6.5 24,876.7
1965 47,290 28,566,800 60% 0.55 6.4 15,800.0
1966 60,300 43,276,000 717 0.64 7.5 27,850.6
1967 57,700 36 ,413,000 631 0.82 9.5 29,767.0
1968 65,890 47,960,000 728 0.98 11.3 46,912.0
1969 57,082-/ 36,943,700 647 1.73 19.9 64,078.3
1970 54,040 39,222,700 726 2.05 14.5 80,317.3
1971 46,6402/ 35,776,hoo 769 1.85 13.1 66,296.1
1/ Estimate.
2/ Preliminary
Source of Basic Data: BAEcon and PTA.

PHILIPPINES ANNEX 10Table 37
AGRICULTURAL SECTOR SURVEY
Table 37: PTA BUYING EXPENSES
Crop PurchaseYear Bales Cost Overhead Percentage
1958 18,415.45 P1,491,926.o6 P 366,o7.32 24.53%
1959 24,605.46 1,748,097.74 481,90.72 27.56
1960 4,533.68 434,626.24 310,890.06 71.53
1961 23,876.01 3,024,219.65 1,00,544.70 46631
1962 1,O4O.29 1,607,167.76 992,698.83 61.76
1963 29,056.95 3,412,147.92 1,672,849.58 49.02
1964 30,685.42 3,186,512.03 2,093,111.14 65.68
1965 5,007.23 477,359.45 1,L111,059.05 2W1.39
1966 4,846.09 565,952.84 889,359.14 157.14,
1967 6,677.55 844,O19.05 807,418.30 95.70
Source: Philippines Tobacco Administration

PHILIPPINES
AGRICULTURAL SECTOR SURVEY
Table 38: PRICE CYCLE OF CIGAR LEAF TOBACCO
(Annual/Season Price Average for Three (3) Years (1966-1968) in Leaf Tobacco Buying, by Period andSystem in the Cagayan Valley (Isabela, Cagayan and Nueva Vizcaya)by Private Sector
BASIS - Registered Average Annual Leaf Crop of 19.5 Million Kilos (Three (3) Provinces)BUYING VOLUM IN AVERAGE PRICE VOLUME OF LEAF PRICE INCREASE
STACES AND SYSTEM OF BUYING PERIOD OR PER CENT MILLION PER KILO CROP PRUCHASED AVERAGE BYMONTH BROUGHT KILOS (Farmers' Level) (Farmers' Level) PERIOD
1. FIRST STAGEa. Private Sector Nov.-Dec. 15% 2.925M P0.25 P 731,250.00b. PTA (not yet ready to buy)
2. SECOND STAGEa. Private Sector Jan.-Feb. 15% 2.925M PO.47 1,374,750.00b. PTA (not yet ready to buy)
B. EARLY STAGE OF LEAF BUYING WITH CASH1. Private sector Mar.-Apr. 15% 2.925M PO.52 1,521,000.00 PC.436
(45%) (8.775M) P 3,627,000.002. PTA (Buying Program not yet started)
C. MIDDLE STAGE OF LEAF BUYING WITH CASH1. Private Sector Apr.-May 30% 5.850M PO.80 P 4,680,000.00 PO.564
(75%) (14.725M) P 8,307,000.00
2. PTA (Buying Program not yet started)
D. LAST STAGE BUYJNG WIT11 PTA BUYING1. Private Sector June-Sept. 20% 3.900M P1.06 P 4,134,000,00 PO.661
(95%) (18.625M) P12,441,000.00)
2. PTA (Buying starts JUNE) 5% 0.975MI P1.05 P 1,023,750.00 P1.06 1/100% (19.600M) P13,464,750.00 (PO.69)- co
Source: PTA

ANNEX 10Table 39
PHILIPPINES
AGRICULTURAL SECTOR SURVEY
Table 39: AREA AND PRODUCTION FIGURES, VIRGINIA (FLUE CURED)
BAEcon PVTAArea 1/ Production 2/ Area 1/ Production 2/ Yield 3/
1964 34,500 20,907.6 62,399 48,175.8 772
1965 28,790 17,150.9 60,229 46,218.2 767
1966 25,370 14,846.0 39,109 26,075.5 668
1967 24,800 14,739.7 44,265 31,933.0 726
1968 28,660 17,369.5 49,221 45,000.2 914
1969 - - 60,606 55,552.7 916
1970 33,370 21,983.3 48,614 45,123.6 928
1971 28,950 20,037.3 31,510 30,395.0 965
1/ Hectares2/ '000 metric tons3/ Kilograms per hectareIT/ Estimated.
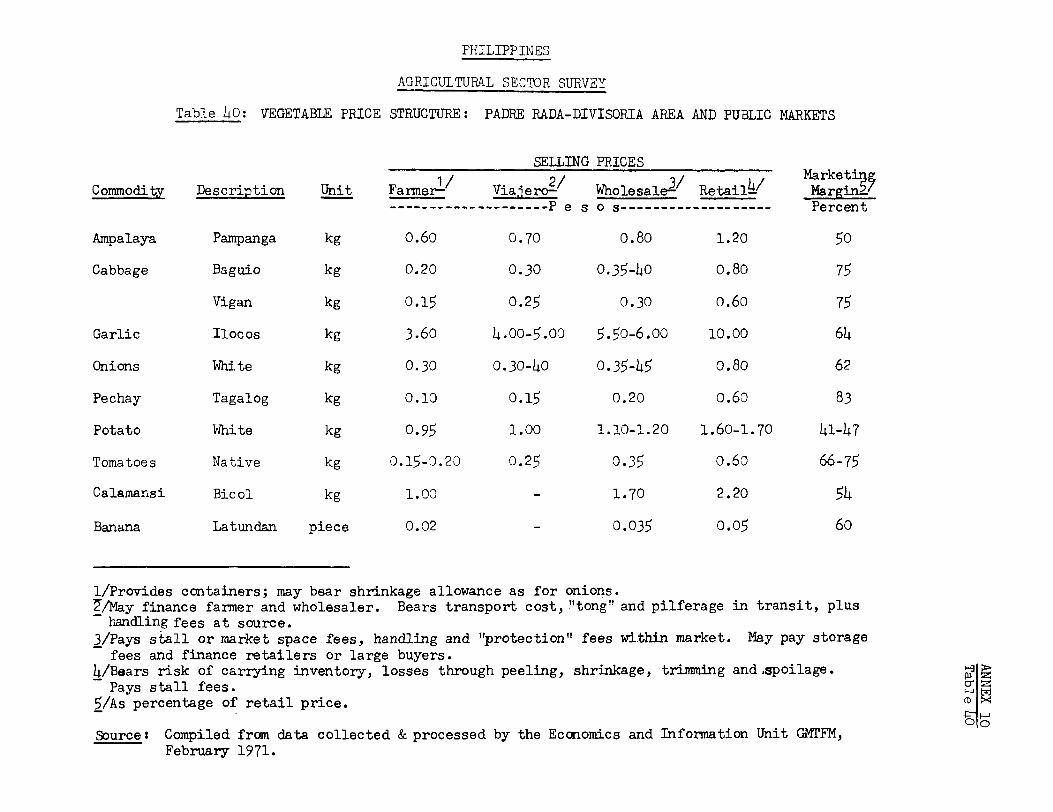
PHILIPPINES
AGRICULTURAL SECTOR SURVEY
Table 40: VEGETABLE PRICE STRUCTURE: PADRE RADA-DIVISORIA AREA AND PUBLIC MARKETS
SELLING PRICES/2/ 3/ akei
Commodity Description Unit Farmer- Viaero2/ Wholesale- Retai MarkginZi-------------- Peso s------------------- Percent
Ampalaya Pampanga kg 0.60 0.70 0.80 1.20 50
Cabbage Baguio kg 0.20 0.30 0.35-40 0.80 75
Vigan kg 0.15 0.25 0.30 0.60 75
Garlic Ilocos kg 3.60 4.00-5.00 5.50-6.00 10.00 64
Onions White kg 0.30 0.30-40 0.35-45 0.80 62
Pechay Tagalog kg 0.10 0.15 0.20 0.60 83
Potato White kg 0.95 1.00 1.10-1.20 1.60-1.70 41-47
Tomatoes Native kg 0.15-J.20 0.25 0.35 0.60 66-75
Calamansi Bicol kg 1.00 - 1.70 2.20 54
Banana Latundan piece 0.02 - 0.035 0.05 60
1/Provides containers; may bear shrinkage allowance as for onions.7/May finance farmer and wholesaler. Bears transport cost, "tong" and pilferage in transit, plus
handling fees at source.3/Pays stall or market space fees, handling and "protection" fees within market. May pay storage
fees and finance retailers or large buyers.
4/Bears risk of carrying inventory, losses through peeling, shrinkage, trimming and.spoilage. 3Pays stall fees.
5/As percentage of retail price. (D
OTO
Source: Compiled from data collected & processed by the Economics and Information Unit GMTFM,February 1971.

PHILIPPINES ANNEX 10
Table 41AGRICULTURAL SECTOR SURVEY
Table 4i: CASSAVA, AREA, PRODUCTION AND VALUE
Area1/ Production2/ Unit Value! Total ValueP-
1964 93,5ho 596.2 0.09 55,099.2
1965 93,280 645.7 0.08 54,561.5
1966 89,700 614.4 0.11 65,075.2
1967 86,520 528.7 0.13 69,567.5
1968 83,880 481.9 0.15 74,453.9
1969 85,690 487.3 0.18 87,066.2
1970 82,620 4h2.2 0.31 138,198.3
1971 81,820 427.1 0.33 142,456.5
Hectare.'000 m tons.Pesos per Kilo.'000 Pesos.
Source: BAEcon.


16RD-10217R11 е° 1 0° 1 2° 1 4' 1 6° APR1L I873�
CLA551F1CAT10N Oi PROVINCES, D Г Н � L � Г Г Е1 V EJВУ GEOGHAPMICAL REG10N5,'972 ° 9QJ� TRANSPORT SYSTEM"1.CITYOFMANILA V11.WESTERNVISAYAS � `, � а V
18 е 35. Ak1an '-"'-"-" 18°п aocos зб. АпбЧие 5 п Vicente Geп.Sonros Project Locat опL АЬга Эг поио .
z, иосо, ио,ге Эв, саР�= °"' Primory Highwoy5Э. 1locosSur э9. ив9го. осс�аспгаi L° о°а, оаип,оп 2 ) � --.- � »--. Roilwo sао. Rотыоп / У5. М оипга�п Provinces. вапупег vuL ЕА SтЕR и Vi5AVA5 _ 0 .i3 Principal PorfS7. гшуао 4 г. вона j
�; 8 . � Trunk Line А rporl8. Ka� iпga �Apavao q2 Се� Э
Ти9 ие ° г° О
111.CAGAYAN VALLEV а3. Nor гherп Leyte r -------- D151f1c1 BOUnCJOГ1QS
� 9 вагапег а4. Souгhcrn Lсуге '. __ - -го, саауап 45. Ев, гет s атаг ' iiogon - Regional Boundariesгг i: ьвiа 48. иеугогОлепгаi 3 5-" -- �гz. ииа°awzcaya 4 г иопnет 5вта. � � г - lnternoliono Boundaries
48. Wеггегп Sатаг ' ^1; � l' iv. сеит8А� ш z ои 5° п ;.'6 I �, ,_ � �
�6° г3, вагаал 1Х . NORTHERN & EASTERN Fernon � � � 6°
14. виlасап MINDANAO 0� 5 г Веп иег � ,z15. Nueva Еп 1а 49. Agusan tlei Norte о т 7hr дипгг�l.r.i гг dr� �n�r' . гп thi5 пар � г, иг,1
�
nrrp/ и г�i нlr �rs<rпrril rr а�rгрги �п b г� гhгге. Ратпап9а 5о. виигдпоп и,,. ю fr шгктвгiл вlГ+�а�ег.17. Pangas ап 57. Lапво aeI Norte ° оп� t8. Ta � lacln 52. Lвпао де1 Sur
Bug 11оп
19. 2ambalcs ° )os53. Misamis О сс�депгаl54. Misamis Orien[ а1 �v. ю итнЕни ТА0 А� оG 55. 5иг�ааодгi иопв ;�Т� г�9с С ° Ьап ° п / � � ю о so ioo iso еоо2о . 8atangas ц , 5urigao де1 5 иг � � / L U Z О / V2 г Cyvlte __ K1LOмp тERS
2z. � а9иПга 5z Agu:anamsur 9 �',._ ,-'\'-
23. Маг� аи9 ие 5в. свп�9и�п у 14 I2а. Мидогоосс�n емвг 01опд° р _ _ SF егпоЛдо25. Мгпдот ог�епгвг х. 5 оитнЕни а wеsТЕни 13 8' �27 �
� о26. Palawan MINDANAO А 1L PosiЗ ,2Z оиекоп 59. СогаЬаго14, 28. игz аi Go. Davao deI Nогге Covi Р а С 1 f/ С �q°6t. Zamboaпga dei Nогге Taqo г у � Р Sг S uz / ose Ропgогоб ° п .vi. eic0� Р�, : 063. Sulu� a пqa де1 Sur Nozug б Q � � � ис ' о 9 °29. А 1Ьау
30. СатаггпегNone 6q, 5оит Стаьаго О С е а Пэг. сатагие:s иг � о -'' v 5 о�п 3 � ; 332, Сагапдиапек
65. Oavao deI 5ur � � Во го о5
\ Nog ._i у
3з. маs Ьат 66. Oavao Ог;опп� � Со1а ° п � q� 1OC3а. 5 огковоп р 2 З С = _ Та6° ср
�� ' � � 29' edFJМ INO 024 `` � � � � / - --
Р _.� � � � У � �
Sou/h Chi пo �� � � дАо� ,1 , '� а5° п1os � (4 � � � s6°г� д 47 --12° SB а `', р
�а�
�
3 о Cal бayog� �. 12°
Q U А 5 В ` о а� � ;, � AMARи11оп�, � "- � � : C0rбobg°
1 к . о5\1 �� ,л� ;35 а � ' � О г
а PANAY � 38 о ( за// � �J' 'то опр 1._" ; � а в "'' О г о �
0 son 1 о5 е б�, � / ; д3��° о Пде Виеп°.ist 1oi1o � BUQп jr д � 7
/ � �- ° со lо Г,(' и � �а L.i ` Л г Ри1° ° пQ° 39 о % 6 Д ' �У ц 2 е и �Z Ь >. � - ,
IO° � °°sin � ,f � го °
NE ROS� 41 � `( � ,иеr го Princes° � 5uri 95 � рPA L A W A N � ,С, ВОН О [ J
BOyow° ДЬ � . ; � -.,.ит uete �' %� / 58 qq,,
NaSip'
� � , � � :/g 4 �зиге п.- ;56SU/U Sea D° Р iю °д ° � � п _ -
О U Ь,� -- р
53к �
Ggarf
�T
1г�
--
^/ '� ; -- �� so �М � N О А / V - .'"- Рад°di° п 5 � . ' � � / �е° 2 0°
5� , ЬО ? ЬбСогаЬаг, � �с н i и д � ТА�wыи � , � / 4� . г� '
и .iЕтид Z° тЬо° п � г
Q Рос�1� с В � оп 59 , Digosу\ � Осеоп � i г </ -.гг' � 5nuzn ' Л В 5/[AN А �5S� � 1 С hгпо PHIUPPINE$ VD' � - -' 1` Ь4
кнмЕв� seo v° 1 о1 бз О ' � . Gen 5оп оREP %5, � иЕ Ам � ы � д р. 0 д а �
д�� р, �р ;;г� оа Се/ebes Sea '
виии г � ( /,,J � р �MALAV 1 � � ,J/v'gQ
i N D 0 N Е 1 д Г /� � 0°' i22° У24° � 6°


18RD 10218П8° ! О ° 1 2° 124' � 6° оееЕмееИгвп
CLASSIFICATIONOFPROVINCES, Q� � nI � I � � I� � � � �еУ GEOORaP1Hp1 ZAl н EG10NS, ч А�С
1. C1TV OF MANILA V11. WESTERN VISAYAS � � а О� � / 1\ I � L � � � О t �
ie° з5. nk �an ' �� -----v- �� 9%S) 1в°u.i � OCOS зв. ппгсqиа
7, АЬга 37. 11oi1o и+� � . �2. 11ос о s Norre зв. СаР1к А Р O1 Г1
з. иовояsиг 39. иврго: Оввfдвпгвг �г �; $ са lе of flow (i п Cavans Ра1ау 45kg5)а. Еаипlлп аб. Rотыоп г; �5. моипхат Ргоvi псе - �r 1r; -- � Less thon-5oo,0006. Веприеt VПUEASTERNVISAYAS С�С�7. нирво а1. eoboi � -' ц "в. каип9а-n Раую а2. cew ;' 1 � � . __ -- � - � so оо - о о о1i � о, о г, о о, о
� 9Э . Northern LeYta гw.cncnrn иvnEEEY аа. sоогьетЕечгв -- .,, � ,,,,,,, ;� :., ,-,^, 2, о0 о,000-3,500,о0 о9. ватпа: л5. ЕагтгпSamar
ю . и рачап аб. ивр. оs Or впwi _ - �11. 1геЬем 97. NorthlгП бвт дг у� � :,2. иивва� ,ксауа <6. wаягвтбатаг � � �,.- � � ��1 з,soo,ooo-s,ooo,0001V. CENTNAL IUZOи 1%. нORTHERN & EASYERN л J � ' � �г3-' � -- 16°
i6° 13. ввгввп Мгиопило 9;, , �- 5,000,000- OverОВе(+14. виlасап 49. Agusaп delNorгв�
`-s�
� .-� � � � " �
�/15. Nueva Edja 5и . Bukidnoп - � _ //� м, в. Рат рю ра 51. wпаодеi иопе - ,j% � ----_____ � i5trict boundories17. Panpasinan 52, Lапю двl5 иг18. Уагlас 53. Misamu Occidental _- _ �19. ZатЬаlея 50, MisamisOriomal = - ы � -+ ��. � �
ц . гиг�раодегиогге . ,f -� Regional бoundariesv.50итЧ� нитАОпИОс 56, su. �pю dвisur )g �' 1
2о. вагапраг 57. при.ю дв�5иг - � - - ln ьemationol бoundaries21. Cevite � ' 58. Camipuin' . �22. Laguna � � �� " � � � t23. Mariпduque Х . SOUTHEfiN & WESTERN R, '; { � 50 0 50 100 150 200 N24. М иеого 0ос iдвп tаl MINDANAO � ,'\_ ; ll1 г г , i � i25. MiпдoroOriemai 59. Согаьаго '113 � ? с� t2В. Раl аwап 6D. Davaodel Norte А °' � � �� v р Kilomelers
2). Оиекоп 81. Zamboanpa де1 Norte , ��� �2 в, Rizai 62. Zвт боапра дв1 5 иг14° вз. 5uw � �� P 7 c i f i c 14°-� и . вгсоЕ sa. soum согатгл 2 г , О 3U
29, А1Ьау 65. Davao деI 5 иг D рЗО. Сатагlпе: иоггв 6 в. Оаvю Ог{впгвг � П � __ . �� �� О с е а пз1. сатаппвг5иг . и°гмлwпил. с. ' � `з2. сагю еиапвг __ � � з� i33, МагЬагв
О (I � ...�, у�С34. 5оггоеоп / v � � I. �
Ё . . � 4 s
24 д ом` � � � � ,.
South Chi пo %� ' Q; -- �.� , 0� ���111 ,г Q
7 4 � 3 � ', ' � ° � -�z° Se а . � �z°� �� .� _ _-_ � � aq `� ` 3 � � � � .,,,,,, � , _,,,J О � а ,
0 р , --'J � i"., е � , _Р Гf г� Уо 1'О !V
о �.6 � � 1 д� � g � .� и f� � --°°... �з4 �,� f
io � 2б /, г '� 7 � �" б !, � О°! 41 � � о
Риегго Princesa � у 1 � �
r пб "' г� `эг-_
� Р � � � � � i - ;',,i
Su/ и Seo -I ап ' '
7 ' � )i ;
а� Е, _ t_,, sз -_ � _ _oi. - - /� t' S1 � ' `51 � - ---- ,;
8° 'тгипвпдап , д�иип лп rЫ r м даппог � 7 � _ � � L . \ ' �1! -� - "" " 8°lniplv гмдовос тепг т пери пК Ьу rhr " У � �wо,i аввпк° м гпвlNюга - � } _
С н i и n л � Cotabar '.� ( frлiw ди _ v о
К � V t � _V1ETN � >Zamб oan -Q Pacilic
� Осеоп j г:Г � \ Sau1h Л � ъ _ '___ г S
i � 1 СА i по 1L1PP1NES VD ' �
� ��
� ,'� : ----
!,'
�� -..:::::.... ,кнм еи� 5 ео b3 � �вЕVт JS. а Q О � 1 �
,SviET дм � f�̀�j' В� р 0 _ �
�� оа �р Се/ebes Seo ' гвиии i р �
MALAY 5 гi Q
� - � � 1 0° 122° �124° 1 6°� 1ND0 NE 1 д '