SMAC mimetic birinapant inhibits hepatocellular carcinoma ...
Upload
independentCategory
view
3download
0
This article appeared in a journal published by Elsevier. The attachedcopy is furnished to the author for internal non-commercial researchand education use, including for instruction at the authors institution
and sharing with colleagues.
Other uses, including reproduction and distribution, or selling orlicensing copies, or posting to personal, institutional or third party
websites are prohibited.
In most cases authors are permitted to post their version of thearticle (e.g. in Word or Tex form) to their personal website orinstitutional repository. Authors requiring further information
regarding Elsevier’s archiving and manuscript policies areencouraged to visit:
http://www.elsevier.com/copyright
Author's personal copy
Research Article
Identification of T-cell factor-4 isoforms that contribute to themalignant phenotype of hepatocellular carcinoma cells
Orkhontuya Tsedensodnoma,b, Hironori Kogaa, Stephen A. Rosenberga, Sarah B. Nambotina,John J. Carrolla, Jack R. Wandsa, Miran Kima,⁎
aLiver Research Center, Rhode Island Hospital and The Warren Alpert Medical School of Brown University, Providence, RI, USAbDepartment of Molecular Biology Cell Biology and Biochemistry, The Warren Alpert Medical School of Brown University, Providence, RI, USA
A R T I C L E I N F O R M A T I O N A B S T R A C T
Article Chronology:
Received 17 August 2010
Revised version received10 January 2011Accepted 11 January 2011Available online 20 January 2011
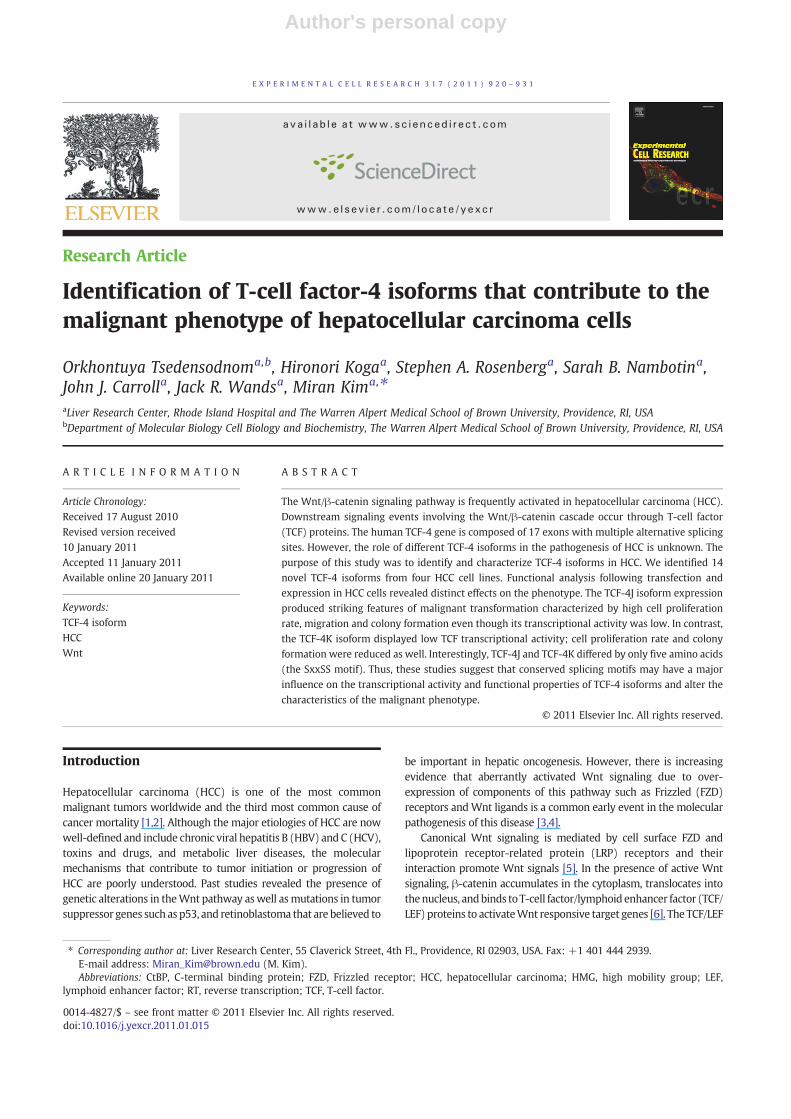
The Wnt/β-catenin signaling pathway is frequently activated in hepatocellular carcinoma (HCC).Downstream signaling events involving the Wnt/β-catenin cascade occur through T-cell factor
(TCF) proteins. The human TCF-4 gene is composed of 17 exons with multiple alternative splicingsites. However, the role of different TCF-4 isoforms in the pathogenesis of HCC is unknown. Thepurpose of this study was to identify and characterize TCF-4 isoforms in HCC. We identified 14novel TCF-4 isoforms from four HCC cell lines. Functional analysis following transfection andexpression in HCC cells revealed distinct effects on the phenotype. The TCF-4J isoform expressionproduced striking features of malignant transformation characterized by high cell proliferationrate, migration and colony formation even though its transcriptional activity was low. In contrast,the TCF-4K isoform displayed low TCF transcriptional activity; cell proliferation rate and colonyformation were reduced as well. Interestingly, TCF-4J and TCF-4K differed by only five amino acids(the SxxSS motif). Thus, these studies suggest that conserved splicing motifs may have a majorinfluence on the transcriptional activity and functional properties of TCF-4 isoforms and alter the
characteristics of the malignant phenotype.© 2011 Elsevier Inc. All rights reserved.
Keywords:
TCF-4 isoformHCCWnt
Introduction
Hepatocellular carcinoma (HCC) is one of the most commonmalignant tumors worldwide and the third most common cause ofcancer mortality [1,2]. Although the major etiologies of HCC are nowwell-defined and include chronic viral hepatitis B (HBV) and C (HCV),toxins and drugs, and metabolic liver diseases, the molecularmechanisms that contribute to tumor initiation or progression ofHCC are poorly understood. Past studies revealed the presence ofgenetic alterations in theWnt pathway aswell asmutations in tumorsuppressor genes such as p53, and retinoblastoma that are believed to
be important in hepatic oncogenesis. However, there is increasingevidence that aberrantly activated Wnt signaling due to over-expression of components of this pathway such as Frizzled (FZD)receptors andWnt ligands is a common early event in the molecularpathogenesis of this disease [3,4].
Canonical Wnt signaling is mediated by cell surface FZD andlipoprotein receptor-related protein (LRP) receptors and theirinteraction promote Wnt signals [5]. In the presence of active Wntsignaling, β-catenin accumulates in the cytoplasm, translocates intothenucleus, andbinds toT-cell factor/lymphoid enhancer factor (TCF/LEF) proteins to activateWnt responsive target genes [6]. The TCF/LEF
E X P E R I M E N T A L C E L L R E S E A R C H 3 1 7 ( 2 0 1 1 ) 9 2 0 – 9 3 1
⁎ Corresponding author at: Liver Research Center, 55 Claverick Street, 4th Fl., Providence, RI 02903, USA. Fax: +1 401 444 2939.E-mail address: [email protected] (M. Kim).Abbreviations: CtBP, C-terminal binding protein; FZD, Frizzled receptor; HCC, hepatocellular carcinoma; HMG, high mobility group; LEF,
lymphoid enhancer factor; RT, reverse transcription; TCF, T-cell factor.
0014-4827/$ – see front matter © 2011 Elsevier Inc. All rights reserved.doi:10.1016/j.yexcr.2011.01.015
ava i l ab l e a t www.sc i enced i r ec t . com
www.e l sev i e r . com/ loca te /yexc r

Author's personal copy
family inmammals is comprisedof fourdifferentproteins: LEF-1, TCF-1, TCF-3, and TCF-4 [7,8]. Several functional domains have beenmapped on the TCF family of proteins as depicted in Fig. 1A. The highmobility group (HMG) DNA binding domain is the most highlyconserved region of the TCF proteins. The second most highlyconserved motif is a β-catenin binding domain at the N-terminus.Binding of β-catenin to an N-terminal domain of TCFs facilitatesassembly of multimeric complexes containing transcriptional co-activators, such as CBP/p300 [9] and BCL9/Legless [10] and Pygopus[11–13], which can activate downstream target genes.
Several investigations suggest that TCF-4 was highly expressedamong the TCF family of proteins in HCC. Over-expression of TCF-4mRNAwas found in human HCC [14] and it has been reported thatTCF-4/β-catenin complex formation was increased in transgenicmice that develop HCC [15]. The human TCF-4 gene (TCF7L2) iscomposed of 17 exons with several alternatively splicing sitesincluding a C-terminal tail (exons 13–17) and exon 4 [16]. Inaddition, alternative splicing in the central domain of TCF-4 is alsoimportant [17], and generates isoforms with or without the highlyconserved LVPQ and SxxSS motifs, which are located at the end ofexon 7 and beginning of exon 9, respectively [16–18].
Even though β-catenin is a main effector of Wnt signaling, thesuccess of relaying signals to the nucleus depends on the presence ofTCF-4 transcription factors. Thus, TCF-4 is equally important inmediating the final transcriptional program, and such activity maybe regulated according to isoform diversity and abundance. Despite
the fact that TCF proteins are bi-functional context-dependentregulators that bind DNA and act as either transcriptional activatorsor repressors (depending on their association with other proteins),the function of TCF transcription factors have been generallyproposed to have activating properties that either upregulateproto-oncogenes or inhibit apoptosis [19–21]. Moreover, the roleof different TCF-4 splicing variants in this process is unknown andthere is no information on their function in HCC, which may becritical to understand the oncogenic process.
We suspect that TCF-4 isoform expression may be associatedwith different biologic properties of tumor cells depending on theisoforms generated by splicing events during hepatic transformationand theywill influence development of themalignant phenotype. Inthe present study, we identified and cloned 14 different TCF-4isoforms and characterized their biologic functions in HCC cell lines.These studies provide evidence that certain TCF-4 isoforms mayfunction as either transcriptional activators or repressors, to producedistinct cellular phenotypes during hepatocarcinogenesis.
Materials and methods
Cloning of TCF-4 isoforms
Total cellular RNA was extracted from four human HCC cell lines(FOCUS, Huh7, Hep3B, andHepG2) using TRIzol reagent (Invitrogen,
Fig. 1 – Identification of novel TCF-4 splicing variants in HCC cell lines. (A) A schematic representation of human TCF-4 gene (TCF7L2)comprising17exonsbasedonreportedcDNAsequences [16]. BCBD,N-terminalβ-cateninbindingdomain; TLE,Groucho/TLEco-repressorbinding site; HMG, high mobility group; NLS, nuclear localization signal; CtBP, C-terminal binding protein binding site. Alternativelysplicing sites are exon 4, LVPQ and SxxSS motifs, and exons 13–16. (B) Summary of the organizational structure of 14 TCF-4 isoforms. InHCC cell lines, 14 different TCF-4mRNA splicing variants were identified by cloning and DNA sequencing. hTCF-4B and Ewere designatedas short and long isoforms, respectively. The remaining 12 were named alphabetically based on their calculated molecular weightrepresented in parentheses (kDa). Note that hTCF-4X included an extra exon 5a, which may produce three different proteins.
921E X P E R I M E N T A L C E L L R E S E A R C H 3 1 7 ( 2 0 1 1 ) 9 2 0 – 9 3 1
Author's personal copy
Carlsbad, CA). The quality of the RNA samples was determined byethidium bromide-stained agarose gel electrophoresis to verifyintact 18S and 28S rRNA bands. To obtain first-strand complemen-tary DNA (cDNA), 500 ng of total RNA was treated with DNase-I,RNase inhibitor, and reverse transcribed with oligo-dT primer andAMV reverse transcriptase (Roche Diagnostics, Indianapolis, IN). Foridentifying different TCF-4 isoforms, PCR was carried out with aprimer pair 1F (forward, 5′-CCGCTCGAGCGGATGCCGCAGCTGAACGGCGG-3′) and 17R (reverse, 5′-CGCGGATCCGCGCTATTCTAAAGACTTGGTGACGAGCGACAGCGGCT-3′) that span from thebeginning of exon 1 to the end of exon 17. The PCR products fromall four HCC cell lines were cloned into the pCR2.1 vector using aTOPO TA cloning kit (Invitrogen) and the individual clones wereDNA sequenced. To verify sequences of the TCF-4 isoforms, aClustalW2 program (http://www.ebi.ac.uk/Tools/clustalw2/index.html) was used to align sequences of all isoforms against thereference sequences as following: 1) The total genomic sequence ofTCF-4 gene was obtained from the NCBI website under the name ofTCF7L2 (transcription factor 7-like 2). 2) The cDNAsequences of TCF-4 mRNA were also acquired from the NCBI.
To generate TCF-4-myc mammalian expression plasmid, TCF-4isoform cDNAs were subcloned into a pcDNA3.1/myc-HisB vectorplasmid. All plasmids constructed were verified by sequencing.Dominant-negative form (dn) of TCF-4 and β-catenin expressionplasmids were obtained from Millipore/Upstate (Billerica, MA)and OriGene (Rockville, MD), respectively.
Semi-quantitative reverse transcription (RT)-PCR
PCR was performed using eight different sets of splicing site-specific primers (P1-F/P1-R, P1-F/P2-R, P2-F/P1-R, P2-F/P2-R, P1-F/P3-R, P2-F/P3-R, P1-F/P4-R, P2-F/P4-R) shown in Fig. 2A andTable 1. The PCR products generated by three primers setsproducing multiple isoforms (P1-F/P1-R, P2-F/P1-R, P1-F/P3-R),were separated on a 3.5% NuSieve 3:1 agarose gel (Lonza Rockland,Inc., Rockland, ME). This analytic technique is capable of resolvingDNA fragments from 10 to 1500 bp. Isoforms E and X generatedfrom primers P1-F and P4-R were isolated on 2% agarose gel due tothe size difference of their PCR products. Single PCR products wereanalyzed on 2% agarose gel. Each TCF-4 isoform plasmid(100 fmol) was amplified to generate PCR product and used asan internal calibrator for determining the expression level of TCF-4isoform. As positive controls for such experiments, each TCF-4isoform plasmid was transfected into Huh7 cells followed byRT-PCR.
Cell culture and transfection studies
Human HCC cell lines (FOCUS, Huh7, Hep3B, and HepG2) werepropagated in DMEM with 10% fetal bovine serum (FBS). Fortransient transfection, cells were plated in either 6-well or 12-wellplates and plasmids were transfected by a TransIT-LT1 transfectionreagent (Mirus Bio Co., Madison, WI). To establish Huh7 HCC cellsstably expressing TCF-4 isoforms, we transfected TCF-4B, J, and K,or empty vector as a control, followed by selection of coloniesusing 400 μg/mL of geneticin (G418, Invitrogen) and expanded forfurther characterization.
For analysis of TCF transcriptional activity, we employed aTOPFlash/FOPFlash reporter gene assay as previously described[4]. In brief, each TCF-4 expressing plasmid was co-transfected
with TOPFlash or FOPFlash, and β-galactosidase in the presence orabsence of a β-catenin expression construct into HEK293 andHuh7 HCC cells. The β-galactosidase activity was used fornormalization of transfection efficiency. At 48 h post-transfection,the luciferase activity was measured and the relative transcrip-tional activity was determined by the ratio of TOP value to FOPbasal activity.
Cyclin D1 promoter activity was measured with cyclin D1promoter reporter plasmids (–163CD1Luc, –163ΔLefCD1Luc) [22],which were kindly provided by Dr. Pestell (Thomas JeffersonUniversity). Briefly, –163CD1LUC or –163ΔLefCD1LUC (a negativecontrol) was co-transfected with β-galactosidase in the presence orabsence of a β-catenin expression plasmid into Huh7 cells stablyexpressing TCF-4B, J or K isoform. At 48 h after transfection, theluciferase activitywasmeasured and the relative activity determinedby the ratio of –163CD1Luc to –163ΔLefCD1Luc basal value.
To examine protein expression of TCF-4 isoforms and β-catenin, Western blot analysis was performed as previouslydescribed [23] using anti-TCF-4 (Upstate/Millipore, Billerica,MA), anti-Myc-tag, anti-β-catenin (Cell Signaling, Danvers, MA),anti-HA (BD Transduction Lab), and anti-actin antibodies (SantaCruz).
Cell proliferation assay
Cell growth rate was measured by using the CellTiter 96 AQeousNon-Radioactive Cell Proliferation Assay (Promega, Madison, WI).Briefly, Huh7 cells were co-transfected with each of the TCF-4isoform expression plasmid or empty vector and β-cateninexpressing plasmid. Twenty-four hours after transfection, thecells were plated in 96-well plates at a density of 2000 cells/well.Cell proliferation was measured with a combined MTS/PMSsolution (Promega), a colorimetric method for determining viableproliferating cells. Results are presented as the average absorbanceof six wells in one experiment and reported as means of threeindependent assays.
Wound healing and transwell cell motility assays
Cell migration was assessed using a scratch wound assay [4]. Inbrief, a scratch was made using a sterile micropipette tip and cellswere washed to remove floating cells and debris. The woundclosure, as an index of cell migration, was photographed at theindicated times from the same area. Phase-contrast images wereacquired with a MicroFire® Microscope Digital CCD Camera(Optronics, Goleta, CA) under an Olympus IX70 fluorescencemicroscope (DSC Optical Services, Newton Centre, MA) usingPicture Frame software (Optronics). The mean wound area wascalculated using Image J software. Results were expressed as apercent of wound closure normalized to wound width at time 0 h.Results were derived from three independent measurements.
Cell motility was evaluated using a luminescence-based assay asdescribed previously with some modifications [24]. In brief, Huh7cells (1×10⁵) were seeded into the upper chamber of 12-well plateseparated by a Transparent PETMembrane (BD Biosciences, San Jose,CA). Migrated cells were harvested with a cotton swab andluminescence was measured after incubation with ATPLite substrate(PerkinElmer, Waltham, MA). The results are expressed as a percentof migrated to total number of cells and the experiments wereperformed in triplicate.
922 E X P E R I M E N T A L C E L L R E S E A R C H 3 1 7 ( 2 0 1 1 ) 9 2 0 – 9 3 1
Author's personal copy
Colony formation in soft-agar
Anchorage independent colonygrowthwasassessed in soft-agar assayusing Cell Transformation Detection Assay kit (Chemicon/Millipore,Billerica,MA) according to themanufacture's instruction. In brief, cells
(2.5×10⁴)were suspended in0.4% topagar over abottomlayerof 0.8%base agar in 6-well plates. The solidified soft-agar was overlaid withDMEM media containing 10% FBS. The media was changed every4–5 days. Colonies were visualized by stainingwith cell stain solution,and the number and size of colonies analyzed using Image J software.
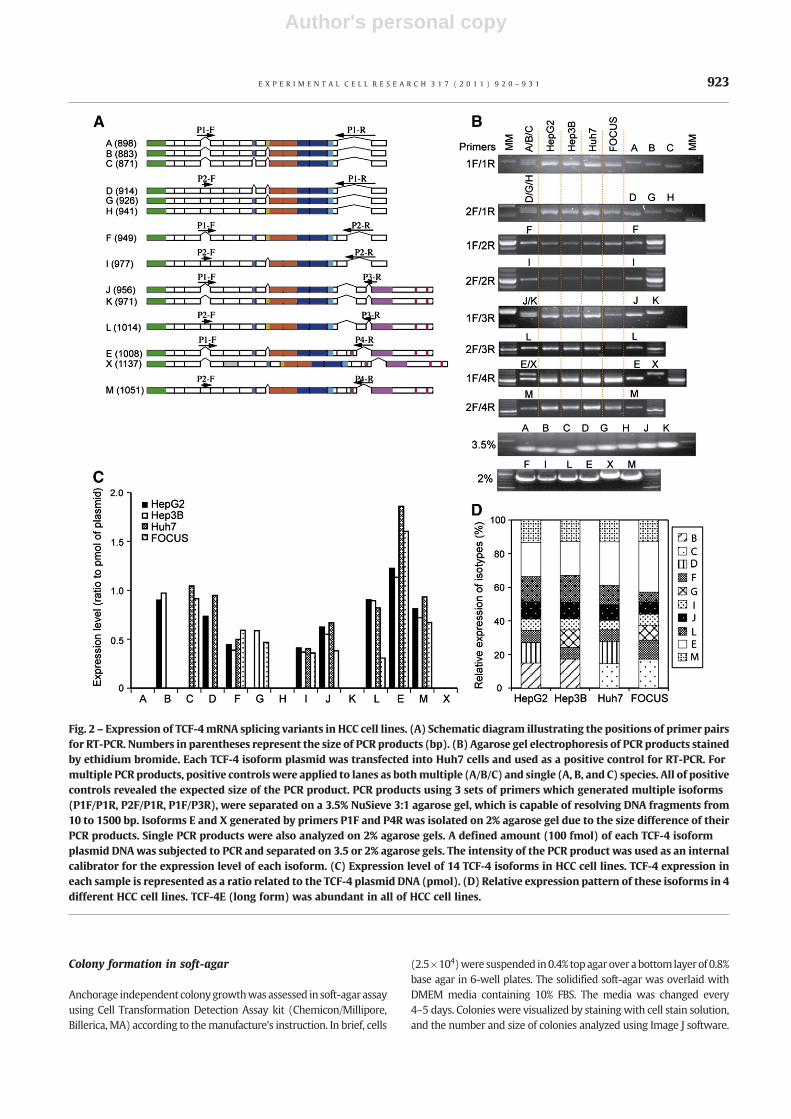
Fig. 2 – Expression of TCF-4mRNA splicing variants in HCC cell lines. (A) Schematic diagram illustrating the positions of primer pairsfor RT-PCR. Numbers in parentheses represent the size of PCR products (bp). (B) Agarose gel electrophoresis of PCR products stainedby ethidium bromide. Each TCF-4 isoform plasmid was transfected into Huh7 cells and used as a positive control for RT-PCR. Formultiple PCR products, positive controls were applied to lanes as bothmultiple (A/B/C) and single (A, B, and C) species. All of positivecontrols revealed the expected size of the PCR product. PCR products using 3 sets of primers which generated multiple isoforms(P1F/P1R, P2F/P1R, P1F/P3R), were separated on a 3.5% NuSieve 3:1 agarose gel, which is capable of resolving DNA fragments from10 to 1500 bp. Isoforms E and X generated by primers P1F and P4R was isolated on 2% agarose gel due to the size difference of theirPCR products. Single PCR products were also analyzed on 2% agarose gels. A defined amount (100 fmol) of each TCF-4 isoformplasmid DNAwas subjected to PCR and separated on 3.5 or 2% agarose gels. The intensity of the PCR product was used as an internalcalibrator for the expression level of each isoform. (C) Expression level of 14 TCF-4 isoforms in HCC cell lines. TCF-4 expression ineach sample is represented as a ratio related to the TCF-4 plasmid DNA (pmol). (D) Relative expression pattern of these isoforms in 4different HCC cell lines. TCF-4E (long form) was abundant in all of HCC cell lines.
923E X P E R I M E N T A L C E L L R E S E A R C H 3 1 7 ( 2 0 1 1 ) 9 2 0 – 9 3 1
Author's personal copy
Statistical analysis
Statistic for dual comparisons was generated using Student's t testsassuming unequal variances. A P value less than 0.05 wasconsidered to be statistically significant in all analyses. The resultswere reported as mean±SD or SE.
Results
Identification of novel TCF-4 isoforms in HCC cell lines
To identify different TCF-4 mRNA isoforms, we performed RT-PCRusing primers specific for exon 1 (forward) and exon 17 (reverse)of the human TCF-4 gene (TCF7L2) in four HCC cell lines (HepG2,Hep3B, Huh7, and FOCUS). The PCR products were cloned into thepCR2.1-TOPO vector using a TA cloning kit and the individualclones were sequenced. DNA sequencing results revealed 14different TCF-4 isoforms that were expressed in HCC cell lines asdepicted in Fig. 1B. Two previously known species designated asshort (TCF-4B) and long (TCF-4E) forms [25] were identifiedamong the 14 isoforms. These 12 new TCF-4 isoforms were namedin alphabetical order according to the calculated size of theirprotein product. They showed several distinct features: 1) sixisoforms were found to include exon 4, 2) six others include exon9L, which encodes for a SxxSS motif that has not been previouslydescribed in human tumors, 3) three isoforms transcribed exon 15,and 4) hTCF-4X (X for unknown) which includes an extra exon 5aat intron/exon boundaries embedded within intron 5. This hTCF-4XmRNA can generate protein products of various sizes (17.9, 49.8and 36.9 kDa) due to insertion of exon 5a as demonstrated inFig. 1B. Although exon 16 has been described in colorectal cancer(CRC) cell lines [16], we did not find any evidence of this isoform inHCC cell lines.
Using the same cloning approach, we also identified andcharacterized TCF-4 isoforms derived from 5 normal human liversamples. In this regard, all clones sequenced represented the singleisoform of TCF-4B.
Expression profiles of TCF-4 isoforms in HCC cell lines
Semi-quantitative RT-PCR was performed to confirm the expres-sion of TCF-4 isoforms in four cell lines. Since these isoforms weregenerated frommultiple splicing sites, it was not possible to detecta single isoform by RT-PCR (such as TCF-4A, B, and C). Thus, weemployed RT-PCR using eight different sets of site-specific primersat potential splicing domains as shown in Fig. 2A (P1-F/P1-R, P1-F/P2-R, P2-F/P1-R, P2-F/P2-R, P1-F/P3-R, P2-F/P3-R, P1-F/P4-R, P2-F/
P4-R) and analyzed products on agarose gels as described inMaterials and methods. For multiple PCR products, positivecontrols were applied to lanes as multiple (A/B/C) and single(A, B, and C) species. All positive controls revealed the expectedsize of PCR product. As shown in Figs. 2B and C, we found thatexpression of 10 isoforms was detected in the 4 different HCC celllines studied. TCF-4A, H, K and X isoforms were undetectable byRT-PCR, possibly due to low expression levels. The TCF-4E, J, andMisoforms were abundant in all HCC cell lines studied. There wasdifferent pattern of expression in four HCC cell lines according todegree of HCC differentiation, i.e. HepG2>Hep3B>Huh7>FOCUS[24]. TCF-4B was detectable only in well differentiated HepG2 andHep3B cell lines, whereas TCF-4C was found in poorly differenti-ated Huh7 and FOCUS cells.
Analysis of β-catenin dependent-TCF transcriptional activity
To evaluate the functional properties of each TCF-4 isoform in HCCcell line, we generated TCF-4-myc plasmids using pcDNA3.1/myc-His vector; protein expression was confirmed by Western blotanalysis after transient transfection into HEK293 and Huh7 cells.The TCF-4X isotype was expressed as one (49.8 kDa) of thepredicted proteins, which included exon5a.
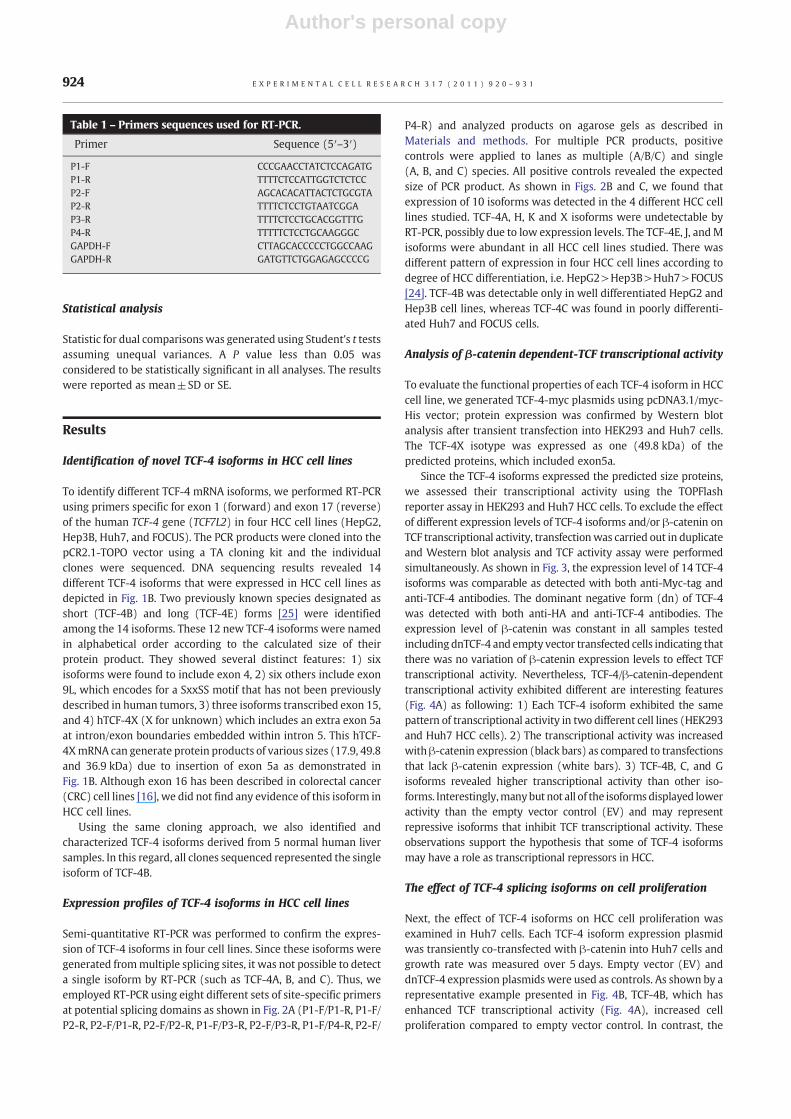
Since the TCF-4 isoforms expressed the predicted size proteins,we assessed their transcriptional activity using the TOPFlashreporter assay in HEK293 and Huh7 HCC cells. To exclude the effectof different expression levels of TCF-4 isoforms and/or β-catenin onTCF transcriptional activity, transfectionwas carried out in duplicateand Western blot analysis and TCF activity assay were performedsimultaneously. As shown in Fig. 3, the expression level of 14 TCF-4isoforms was comparable as detected with both anti-Myc-tag andanti-TCF-4 antibodies. The dominant negative form (dn) of TCF-4was detected with both anti-HA and anti-TCF-4 antibodies. Theexpression level of β-catenin was constant in all samples testedincluding dnTCF-4 and empty vector transfected cells indicating thatthere was no variation of β-catenin expression levels to effect TCFtranscriptional activity. Nevertheless, TCF-4/β-catenin-dependenttranscriptional activity exhibited different are interesting features(Fig. 4A) as following: 1) Each TCF-4 isoform exhibited the samepattern of transcriptional activity in two different cell lines (HEK293and Huh7 HCC cells). 2) The transcriptional activity was increasedwith β-catenin expression (black bars) as compared to transfectionsthat lack β-catenin expression (white bars). 3) TCF-4B, C, and Gisoforms revealed higher transcriptional activity than other iso-forms. Interestingly,manybut not all of the isoformsdisplayed loweractivity than the empty vector control (EV) and may representrepressive isoforms that inhibit TCF transcriptional activity. Theseobservations support the hypothesis that some of TCF-4 isoformsmay have a role as transcriptional repressors in HCC.
The effect of TCF-4 splicing isoforms on cell proliferation
Next, the effect of TCF-4 isoforms on HCC cell proliferation wasexamined in Huh7 cells. Each TCF-4 isoform expression plasmidwas transiently co-transfected with β-catenin into Huh7 cells andgrowth rate was measured over 5 days. Empty vector (EV) anddnTCF-4 expression plasmids were used as controls. As shown by arepresentative example presented in Fig. 4B, TCF-4B, which hasenhanced TCF transcriptional activity (Fig. 4A), increased cellproliferation compared to empty vector control. In contrast, the
Table 1 – Primers sequences used for RT-PCR.
Primer Sequence (5′–3′)
P1-F CCCGAACCTATCTCCAGATGP1-R TTTTCTCCATTGGTCTCTCCP2-F AGCACACATTACTCTGCGTAP2-R TTTTCTCCTGTAATCGGAP3-R TTTTCTCCTGCACGGTTTGP4-R TTTTTCTCCTGCAAGGGCGAPDH-F CTTAGCACCCCCTGGCCAAGGAPDH-R GATGTTCTGGAGAGCCCCG
924 E X P E R I M E N T A L C E L L R E S E A R C H 3 1 7 ( 2 0 1 1 ) 9 2 0 – 9 3 1
Author's personal copy
TCF-4J isoform produced the highest cell growth rate but hadlower transcriptional activity than TCF-4B. Moreover, TCF-4Kreduced the cell growth of Huh7 cells even further compared toempty vector and dnTCF-4 controls.
Analysis of TCF-4B, J and K isoforms in relation to HCC cellmigration and colony formation
The observation that TCF-4B, J, and K exhibited differenttranscriptional activities and cell proliferation rates, led us toconsider that these isoforms may have different biologic functionsand influence the phenotype of HCC cells. To further explore theproperties of these isoforms, we generated stable Huh7 cloneswhich over-expressed TCF-4B, J, and K. To exclude clonal artifacts,two different stable clones representative of each isoform wereused for analysis. An empty vector (EV) was also stably transfectedinto Huh7 cells and used as a control. Expression of TCF-4B, J and Kisoform was confirmed by Western blot analysis (Fig. 5A). TCFtranscriptional activity (Fig. 5B) exhibited by Huh7-stable expres-sion clones was consistent with that of transient transfectionexperiments. Despite low TCF transcriptional activity, transient
expression of TCF-4J resulted in enhanced cell proliferationsuggesting that TCF-4J may activate target genes related to cellproliferation. In this regard, we tested whether TCF-4J had effecton cyclin D1 gene promoter activation. As shown in Fig. 5C, TCF-4J-overexpressing Huh7 cells (J3, J11) increased cyclin D1 promoteractivity compared to control and cyclin D1 promoter activity wascorrelated with cell proliferation (Fig. 5D). In contrast, TCF-4Krevealed a lower proliferation rate and low TCF and cyclin D1transcriptional activities. These results raise the possibility thatdifferent TCF-4 isoforms may activate different target genes andproduce effects on HCC cell proliferation that may not be directlyrelated to the magnitude of TCF transcriptional activity on artificialreporter genes used in transient transfection assays.
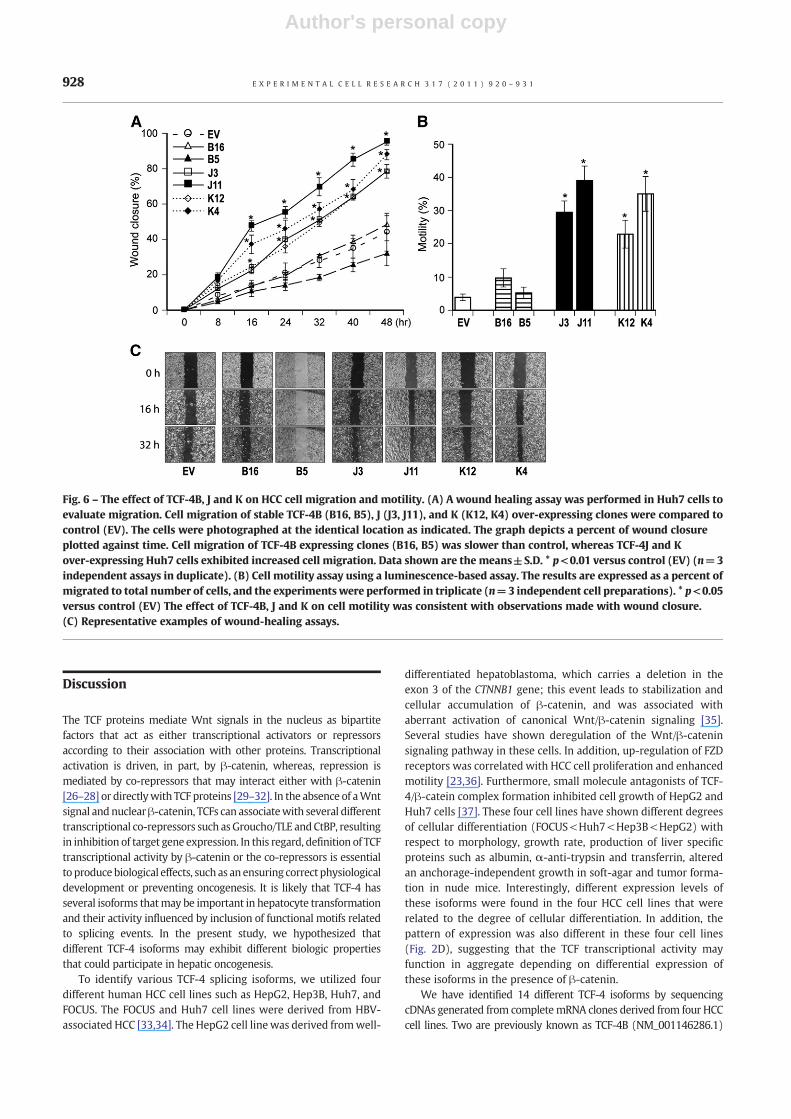
The effects of TCF-4B, J, and K on HCC cell migration and motilitywere then examined. As shown in Figs. 6A and C, Huh7 stable celllines over-express both TCF-4J and K isoforms resulted in increasedcell migration as assessed by a Wound healing assay. In contrast,TCF-4B revealed no difference of cell migration compared to control.The findings regarding TCF-4B, J and K on cellmotility as assessed bya second luminescence-based assay was consistent with theobservations made with wound closure assay (Fig. 6B).
Fig. 3 – Ectopic expression of TCF-4 isoforms and β-catenin in HEK293 and Huh7 cells. Each isoform-containing plasmid wasco-transfected with TOP, β-galactosidase, and β-catenin plasmids. Representative immunoblot results from HEK293 (A) and Huh7(B) cell lines. TCF-4 isoforms containing Myc-tag at the C-terminus were detected with anti-Myc-tag or anti-TCF-4 antibodies (*). Adominant negative form (dn) of TCF-4 (HA-tag at the N-terminus)was detected by anti-HA or anti-TCF-4 antibodies (**). Actin servesas the protein loading control.
925E X P E R I M E N T A L C E L L R E S E A R C H 3 1 7 ( 2 0 1 1 ) 9 2 0 – 9 3 1

Author's personal copy
Finally, to determine if TCF-4B, J, and K play a role in anchorage-independent cell growth, a colony-forming assay in soft-agar wasperformed. This approach is considered to be a reliable test for
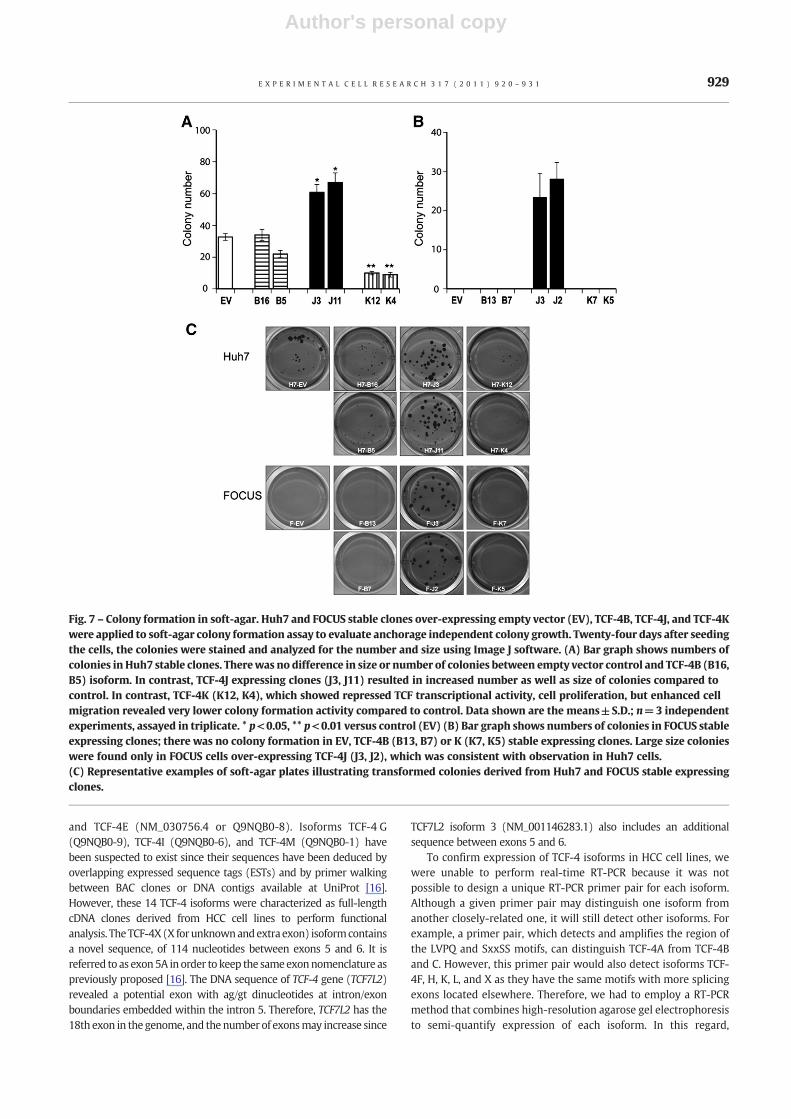
malignant transformation of cells. As shown in Figs. 7A and C, colonyformationwas significantly increased inTCF-4J over-expressingHuh7cells (J3, J11), and was reduced in TCF-4K expressing cells (K12, K4)
Fig. 4 – Effects of TCF-4 isoforms on TCF transcriptional activity andHuh7 cell proliferation. (A) TCF Transcriptional activities of 14 distinctTCF-4 isoforms after transient transfection inHEK293 andHuh7HCC cells. Activitywasmeasuredusing a TOPFlash luciferase reporter genesystem. Each isoform-containing plasmid was co-transfected with TOP or FOP, and β-galactosidase, with/without β-catenin plasmids.Luciferase activitywasmeasured using the Luciferase Assay System (Promega), and relative luciferase activitywas represented by the ratioof TOP value to FOP after normalization of transfection efficiency with β-galactosidase activity. A dominant negative form (dn) of TCF,which is a N-terminal deletion mutant lacking the β-catenin binding domain was used as a control for assessment of repressed TCFtranscriptional activity. (B) Cell proliferation rate ofHuh7HCC cells over-expressing TCF-4 isoforms after transient transfection. EachTCF-4isoform expressing plasmidwas transiently co-transfected with β-catenin into Huh7 cells and growth rate wasmeasured for 5 days usingCellTiter 96 AQeous Non-radioactive cell proliferation assay. Empty vector (EV) and dominant negative (dn) TCF-4 expression plasmidswere used as controls. Note that TCF-4J isoform produced highest cell growth rate, whereas TCF-4K reduced the cell growth of Huh7 cellseven further compared to empty vector (EV) anddnTCF-4 controls. Results shownare themeans±S.D.; *p<0.05versus control (EV) (n=3independent experiments, assayed in quadruplicate). (Right panel) Expression levels of dnTCF-4, TCF-4B, J and K at days 2 and 5post-transfection. TCF-4B, J andK isoforms containingMyc-tag at the C-terminuswere detectedwith anti-Myc-tag and anti-TCF antibodies(*).Adominantnegative form(dn)ofTCF-4 (HA-tagat theN-terminus)wasdetectedbyanti-HAandanti-TCF-4antibodies (**). Actin servesas the protein loading control. Note that protein expression was still detected at 5 day post-transfection.
926 E X P E R I M E N T A L C E L L R E S E A R C H 3 1 7 ( 2 0 1 1 ) 9 2 0 – 9 3 1

Author's personal copy
compared to control. Notably colonies derived from Huh7 cellsexpressing TCF-4J were not only increased in number, but were alsofound to be consistently larger compared to control. In FOCUS HCCcells, therewas no colony formation in EV, TCF-4B (B13, B7) or K (K7,K5) stable expressing clones. Large size colonies were found only inFOCUS cells over-expressing TCF-4 J (J3, J2), which was consistentwith the observations made with the Huh7 cells (Figs. 7B, C).
Taken together, our studies suggest that an individual TCF-4isoformmay exhort a novel biologic function to produce a differentHCC phenotype. Expression of TCF-4B (short form) had the highestTCF and cyclin D1 transcriptional activities and also exhibitedincreased cell proliferation, but there was no apparent effect oncell migration and colony formation compared to control. In
contrast, TCF-4J isoform expression increased cell proliferation,migration as well as colony formation, whichmay have influenced,in part, by increased cyclin D1 promoter activity even though theoverall TCF transcriptional activity was low. In contrast, TCF-4Kisoform expression inhibited TCF and cyclin D1 transcriptionalactivities as well as colony formation, supporting the hypothesisthat some TCF-4 isoforms may act as suppressors under certainconditions. Moreover, even though TCF-4J and TCF-4K varied byonly five amino acids (the SxxSS motif), they exhibited substantialdifferences in generating features of the malignant phenotype. Itwill be of importance to explore the molecular mechanisms bywhich the SxxSSmotif expressed in such TCF-4 isoforms influencesHCC malignant behavior in the future.
Fig. 5 – TCF and cyclin D1 transcriptional activities and cell proliferation of Huh7-stable clones over-expressing TCF-4B, J, and Kisoforms. (A) Expression of TCF-4B, J, and Kwere detected by anti-Myc-tag and anti-TCF-4 antibodies in stable Huh7 clones of TCF-4B(B16, B5), TCF-4 J (J3, J11) and TCF-4 K (K12, K4). (B) TCF transcriptional activity was measured in Huh7-stable clonesover-expressing empty vector (EV), B (B16, B5), J (J3, J11), and K (K12, K4) isoforms. Note that activity of Huh7 cells over-expressingthese isoforms was consistent with the findings after transient transfection. Data shown are the means±S.D.; * p<0.05 versuscontrol (EV) (n=3 independent experiments, assayed in triplicate) (C) Cyclin D1 promoter activity was measured in Huh7-stableclones. Cyclin D1 promoter reporter (–163CD1Luc) was co-transfected with β-galactosidase in the presence or absence of β-cateninfollowed by measurement of luciferase activity. A plasmid (–163ΔLefCD1Luc) was used as a negative control and activity wasdetermined as a ratio of –163CD1LUC to –163ΔLefCD1LUC. Note that expression of TCF-4B and J increased cyclin D1 transcriptionalactivity. Results represent the mean±S.D.; * p<0.05 versus control (EV) (n=3 independent experiments, assayed in triplicate)(D) Cell proliferation assay results of stable Huh7 clones expressing TCF-4B, J, and K. TCF-4B (B16, B5) and J (J3, J11) isoforms show anenhanced growth rate, while TCF-4K (K12, K4) reveals slower cell growth, which is lower than that found with the control (EV).Results are expressed as the mean±S.D.; * p<0.001 versus control (EV) (n=3 independent experiments, assayed in quadruplicate).
927E X P E R I M E N T A L C E L L R E S E A R C H 3 1 7 ( 2 0 1 1 ) 9 2 0 – 9 3 1
Author's personal copy
Discussion
The TCF proteins mediate Wnt signals in the nucleus as bipartitefactors that act as either transcriptional activators or repressorsaccording to their association with other proteins. Transcriptionalactivation is driven, in part, by β-catenin, whereas, repression ismediated by co-repressors that may interact either with β-catenin[26–28] or directlywith TCF proteins [29–32]. In the absence of aWntsignal and nuclearβ-catenin, TCFs can associatewith several differenttranscriptional co-repressors such asGroucho/TLE andCtBP, resultingin inhibition of target gene expression. In this regard, definition of TCFtranscriptional activity by β-catenin or the co-repressors is essentialto producebiological effects, such as an ensuring correct physiologicaldevelopment or preventing oncogenesis. It is likely that TCF-4 hasseveral isoforms thatmay be important in hepatocyte transformationand their activity influenced by inclusion of functional motifs relatedto splicing events. In the present study, we hypothesized thatdifferent TCF-4 isoforms may exhibit different biologic propertiesthat could participate in hepatic oncogenesis.
To identify various TCF-4 splicing isoforms, we utilized fourdifferent human HCC cell lines such as HepG2, Hep3B, Huh7, andFOCUS. The FOCUS and Huh7 cell lines were derived from HBV-associated HCC [33,34]. The HepG2 cell linewas derived fromwell-
differentiated hepatoblastoma, which carries a deletion in theexon 3 of the CTNNB1 gene; this event leads to stabilization andcellular accumulation of β-catenin, and was associated withaberrant activation of canonical Wnt/β-catenin signaling [35].Several studies have shown deregulation of the Wnt/β-cateninsignaling pathway in these cells. In addition, up-regulation of FZDreceptors was correlated with HCC cell proliferation and enhancedmotility [23,36]. Furthermore, small molecule antagonists of TCF-4/β-catein complex formation inhibited cell growth of HepG2 andHuh7 cells [37]. These four cell lines have shown different degreesof cellular differentiation (FOCUS<Huh7<Hep3B<HepG2) withrespect to morphology, growth rate, production of liver specificproteins such as albumin, α-anti-trypsin and transferrin, alteredan anchorage-independent growth in soft-agar and tumor forma-tion in nude mice. Interestingly, different expression levels ofthese isoforms were found in the four HCC cell lines that wererelated to the degree of cellular differentiation. In addition, thepattern of expression was also different in these four cell lines(Fig. 2D), suggesting that the TCF transcriptional activity mayfunction in aggregate depending on differential expression ofthese isoforms in the presence of β-catenin.
We have identified 14 different TCF-4 isoforms by sequencingcDNAs generated from completemRNA clones derived from four HCCcell lines. Two are previously known as TCF-4B (NM_001146286.1)
Fig. 6 – The effect of TCF-4B, J and K on HCC cell migration and motility. (A) A wound healing assay was performed in Huh7 cells toevaluate migration. Cell migration of stable TCF-4B (B16, B5), J (J3, J11), and K (K12, K4) over-expressing clones were compared tocontrol (EV). The cells were photographed at the identical location as indicated. The graph depicts a percent of wound closureplotted against time. Cell migration of TCF-4B expressing clones (B16, B5) was slower than control, whereas TCF-4J and Kover-expressing Huh7 cells exhibited increased cell migration. Data shown are the means±S.D. * p<0.01 versus control (EV) (n=3independent assays in duplicate). (B) Cell motility assay using a luminescence-based assay. The results are expressed as a percent ofmigrated to total number of cells, and the experiments were performed in triplicate (n=3 independent cell preparations). * p<0.05versus control (EV) The effect of TCF-4B, J and K on cell motility was consistent with observations made with wound closure.(C) Representative examples of wound-healing assays.
928 E X P E R I M E N T A L C E L L R E S E A R C H 3 1 7 ( 2 0 1 1 ) 9 2 0 – 9 3 1
Author's personal copy
and TCF-4E (NM_030756.4 or Q9NQB0-8). Isoforms TCF-4 G(Q9NQB0-9), TCF-4I (Q9NQB0-6), and TCF-4M (Q9NQB0-1) havebeen suspected to exist since their sequences have been deduced byoverlapping expressed sequence tags (ESTs) and by primer walkingbetween BAC clones or DNA contigs available at UniProt [16].However, these 14 TCF-4 isoforms were characterized as full-lengthcDNA clones derived from HCC cell lines to perform functionalanalysis. TheTCF-4X(X forunknownandextra exon) isoformcontainsa novel sequence, of 114 nucleotides between exons 5 and 6. It isreferred to as exon5A in order to keep the sameexonnomenclature aspreviously proposed [16]. The DNA sequence of TCF-4 gene (TCF7L2)revealed a potential exon with ag/gt dinucleotides at intron/exonboundaries embedded within the intron 5. Therefore, TCF7L2 has the18th exon in the genome, and the number of exonsmay increase since
TCF7L2 isoform 3 (NM_001146283.1) also includes an additionalsequence between exons 5 and 6.
To confirm expression of TCF-4 isoforms in HCC cell lines, wewere unable to perform real-time RT-PCR because it was notpossible to design a unique RT-PCR primer pair for each isoform.Although a given primer pair may distinguish one isoform fromanother closely-related one, it will still detect other isoforms. Forexample, a primer pair, which detects and amplifies the region ofthe LVPQ and SxxSS motifs, can distinguish TCF-4A from TCF-4Band C. However, this primer pair would also detect isoforms TCF-4F, H, K, L, and X as they have the same motifs with more splicingexons located elsewhere. Therefore, we had to employ a RT-PCRmethod that combines high-resolution agarose gel electrophoresisto semi-quantify expression of each isoform. In this regard,
Fig. 7 – Colony formation in soft-agar. Huh7 and FOCUS stable clones over-expressing empty vector (EV), TCF-4B, TCF-4J, and TCF-4Kwere applied to soft-agar colony formation assay to evaluate anchorage independent colony growth. Twenty-four days after seedingthe cells, the colonies were stained and analyzed for the number and size using Image J software. (A) Bar graph shows numbers ofcolonies in Huh7 stable clones. Therewas no difference in size or number of colonies between empty vector control and TCF-4B (B16,B5) isoform. In contrast, TCF-4J expressing clones (J3, J11) resulted in increased number as well as size of colonies compared tocontrol. In contrast, TCF-4K (K12, K4), which showed repressed TCF transcriptional activity, cell proliferation, but enhanced cellmigration revealed very lower colony formation activity compared to control. Data shown are the means±S.D.; n=3 independentexperiments, assayed in triplicate. * p<0.05, ** p<0.01 versus control (EV) (B) Bar graph shows numbers of colonies in FOCUS stableexpressing clones; there was no colony formation in EV, TCF-4B (B13, B7) or K (K7, K5) stable expressing clones. Large size colonieswere found only in FOCUS cells over-expressing TCF-4J (J3, J2), which was consistent with observation in Huh7 cells.(C) Representative examples of soft-agar plates illustrating transformed colonies derived from Huh7 and FOCUS stable expressingclones.
929E X P E R I M E N T A L C E L L R E S E A R C H 3 1 7 ( 2 0 1 1 ) 9 2 0 – 9 3 1
Author's personal copy
expression of these isoforms was confirmed using RT-PCR. It isnoteworthy that four (TCF-4A, H, K and X) of 14 isoforms wereundetectable in HCC cell lines, due to low expression levels.However, we found that all 14 isoforms were expressed in eitherhuman HCC tumors, or peritumoral tissues, or normal liver.Consistent with results derived from HCC cell lines, TCF-4A, H,and K isoforms revealed exhibited very low or no expression inhuman HCC tumors compared to normal and petitumor tissues;expression levels of TCF-4X was low in all HCC tumor tissuesstudied (unpublished observations).
Assessment of TCF transcriptional activity revealed severalinteresting features. A potentially important finding was thedifferential transcriptional activity observed in three isoform pairsnamely: TCF-4A and B, TCF-4G and H, and TCF-4J and K. Comparisonof their organizational structure revealed identity except for thepresence or absence of a conserved SxxSSmotif (Fig. 1B). Indeed, thetranscriptional activity measured from isoforms TCF-4A, H and Kwere lower than that observedwith TCF-4B, G and J, which containsthismotif. Therefore, the SxxSS sequencemaybe responsible, inpart,for the reduced transcriptional activity observed even in thepresence of β-catenin activation (Fig. 4A). It is of interest that HCCcell lines tend to express more of the TCF-4 isoforms that do notcontain the SxxSS motif such as TCF-4B, C, D, G, J, E and M. Anotherinteresting finding was the differential transcriptional activityobserved between the TCF-4C and TCF-4D isoforms. Transcriptionalactivity of TCF-4D, which has exon 4, is lower than empty vector,whereas TCF-4C lacking exon 4 has the highest transcriptionalactivity. These results suggest that exon 4 may also have a repressorfunction and further study will be required.
In summary, this is the initial identification, description, andcharacterization of 14 different TCF-4 isoforms of 12 novel species.Results reveal the presence of different TCF-4 isoformswith divergentproperties thatmay influence thephenotypeofHCCcells and functionas transcription activators or repressors. In particular, comparison ofTCF-4J and K isoforms suggests that a conserved splicing motif mayhave a major influence on the transcriptional activity and functionand alter the characteristics of the malignant phenotype. How theseTCF-4 isoforms are linked to the progression and course of HCCtumors is unknown. It will be important to define the molecularpathways activated, to promote a better understanding the onco-genesis of these devastating tumors. Furthermore, to identifyinteractions with growth factor signaling cascades may eventuallyprovide novel molecular targets for therapy of HCC.
Accession numbers
TCF-4A, GenBank ID: HM352849TCF-4B, GenBank ID: HM352842TCF-4C, GenBank ID: HM352843TCF-4D, GenBank ID: HM352840TCF-4F, GenBank ID: HM352838TCF-4G, GenBank ID: HM352846TCF-4H, GenBank ID: HM352841TCF-4I, GenBank ID: HM352844TCF-4J, GenBank ID: HM352847TCF-4K, GenBank ID: HM352839TCF-4L, GenBank ID: HM352851TCF-4E, GenBank ID: HM352848TCF-4M, GenBank ID: HM352850TCF-4X, GenBank ID: HM352845
Acknowledgments
The work was supported in part by grants from the NationalInstitutes of Health CA-35711, CA 123544 (JRW), P20 RR015578 andDevelopmental Research Award from Rhode Island Hospital (MK).
R E F E R E N C E S
[1] F.X. Bosch, J. Ribes, R. Cleries, M. Diaz, Epidemiology ofhepatocelluar carcinoma, Clin. Liver Dis. 9 (2005) 191–211.
[2] J. Bruix, A.J. Hessheimer, A. Forner, L. Boix, R. Vilana, J.M. Llovet, Newaspects of diagnosis and therapy of hepatocellular carcinoma,Oncogene 25 (2006) 3848–3856.
[3] A. Bengochea, M.M. de Souza, L. Lefrancois, E.L. Roux, O. Galy, I.Chemin, M. Kim, J.R. Wands, C. Trepo, P. Hainaut, J.-Y. Scoazec, L.Vitvitski, P. Merle, Dysregulation of specific Wnt and Frizzledgenes: a striking event in human hepatocellular carcinoma, Br. J.Cancer 99 (2008) 143–150.
[4] M. Kim, H.C. Lee, O. Tsedensodnom, R. Hartley, Y.-S. Lim, E. Yu, P.Merle, J.R. Wands, Functional interaction between Wnt3 andFrizzled-7 leads to activation of the Wnt/beta-catnein signalingpathway in hepatocellular carcinoma cells, J. Hepatol. 48 (2008)780–791.
[5] C.Y. Logan, R. Nusse, The Wnt signaling pathway in developmentand disease, Annu. Rev. Cell Biol. 20 (2004) 781–810.
[6] J. Behrens, J.P. von Kries, M. Kuhl, L. Bruhn, D. Wedlich, R.Grosschedl, W. Birchmeier, Functional interaction of β-cateninwith the transcription factor LEF-1, Nature 382 (1996) 638–642.
[7] A. Travis, A. Amsterdam, C. Belanger, R. Grosschedl, LEF-1, a geneencoding a lymphoid-specific protein with an HMG domain,regulates T-cell receptor alpha enhancer function, Genes Dev. 5(1991) 880–894.
[8] M. van de Wetering, M. Oosterwegel, D. Dooijes, H. Clevers,Identification and cloning of TCF-1, a T lymphocyte-specifictranscription factor containing a sequence-specific HMG box,EMBO J. 10 (1991) 123–132.
[9] M. Bienz, H. Clevers, Armadillo/beta-catenin signals in thenucleus-proof beyond a reasonable doubt? Nat. Cell Biol. 5 (2003)179–182.
[10] T. Kramps, O. Peter, E. Brunner, D. Nellen, B. Froesch, S. Chatterjee,M. Murone, S. Zullig, K. Basler, Wnt/Wingless signaling requiresBCL9/Legless-mediated recruitement of Pygopus to the nuclearbeta-catenin-TCF complex, Cell 109 (2002) 47–60.
[11] D.S. Parker, J. Jemison, K.M. Cadigan, Pygopus, a nuclearPHD-finger protein required forWingless signaling in Drosophila,Development 129 (2002) 2565–2576.
[12] T.Y. Belenkaya, C. Han, H.J. Standley, X. LIn, D.W. Houston, J.Heasman, X. Lin, Pygopus encides a nuclear protein essential forWingless/Wnt signaling, Development 129 (2002) 4089–4101.
[13] B. Thompson, F. Townsley, R. Rosin-Arbesfeld, H. Musisi, M. Bienz,A new nuclear component of theWnt signaling pathway, Nat. CellBiol. 4 (2002) 367–373.
[14] J. Cui, X. Zhou, Y. Liu, Z. Tang, M. Romeih, Alterations ofbeta-catenin and Tcf-4 instead of GSK-3β contribute to activationof Wnt pathway in hepatocellular carcinoma, Chin. Med. J. 116(2003) 1885–1892.
[15] A. Yanagitani, S. Yamada, S. Yasui, T. Shimomura, R. Murai, Y.Murawaki, K. Hashiguchi, T. Kanbe, T. Saeki, M. Ichiba, Y. Tanabe,Y. Yoshida, S. Morino, A. Kurimasa, N. Usuda, H. Yamazaki, T.Kunisada, H. Ito, Y. Murawaki, G. Shiota, Retinoic acid receptor adominant negative form causes steatohepatitis and liver tumorsin transgenic mice, Hepatology 40 (2004) 366–375.
[16] A. Duval, S. Rolland, E. Tubacher, H. Bui, G. Thomas, R. Hamelin,The human T-cell transcription factor-4 gene: structure,extensive characterization of alternative splicings, and
930 E X P E R I M E N T A L C E L L R E S E A R C H 3 1 7 ( 2 0 1 1 ) 9 2 0 – 9 3 1

Author's personal copy
mutational analysis in colorectal cancer cell lines, Cancer Res. 60(2000) 3872–3879.
[17] T. Pukrop, D. Gradl, K. Henningfeld, W. Knochel, D. Wedlich, M.Kuhl, Identification of two regulatory elements within the highmobility group box transcription factor XTCF-4, J. Biol. Chem. 276(2001) 8968–8978.
[18] R.M. Young, A.E. Reyes, M.L. Allende, Expression and splice variantanalysis of the zebrafish tcf4 transcription factor, Mech. Dev. 117(2002) 269–273.
[19] V.Muncan, O. Sansom, L. Tertoolen, T. Phesse, H. Begthel, E. Sancho,A. Cole, A.Gregorieff, I. deAlboran,H. Clevers, A. Clarke, Rapid loss ofintestinal cryps upon conditional deletion of the Wnt/Tcf-4 targetgene c-Myc, Mol. Cell. Biol. 26 (2006) 8418–8426.
[20] H. Li, G. Ray, B. Yoo, M. Redogan, K. Rosen, Down-regulation ofdeath-associated protein-kinase-2 is required forβ-catenin-induced anoikis resistance of maligant epithelial cells,J. Biol. Chem. 284 (2009) 2012–2022.
[21] K. Nejak-Bowen, G. Zeng, X. Tan, B. Cieply, S. Monga, β-cateninregulates vitamin C biosynthesis and cell survival in murine liver,J. Biol. Chem. 284 (2009) 28115–28127.
[22] M. Shtutman, J. Zhurinsky, I. Simcha, C. Albanese, M. D'Amico, R.Pestell, A. Ben-Ze'ev, The cyclin D1 gene is a target of thebeta-catenin/LEF-1 pathway, Proc. Natl Acad. Sci. USA 96 (1999)5522–5527.
[23] P. Merle, S. de la Monte, M. Kim, M. Herrmann, S. Tanaka, A. VonDem Bussche, M.C. Kew, C. Trepo, J.R. Wands, Functionalconsequences of frizzled-7 receptor overexpression in humanhepatocellular carcinoma, Gastroenterology 127 (2004)1110–1122.
[24] H. Lee, B. Tian, J.M. Sedivy, J.R. Wands, M. Kim, Loss of Raf kinaseinhibitor protein promotes cell proliferation and migration ofhuman hepatoma cells, Gastroenterology 131 (2006) 1208–1217.
[25] V. Korinek, N. Barker, P. Morin, D. van Wichen, R. de Weger, K.W.Kinzler, B. Vogelstein, H. Clevers, Constitutive transcriptionalactivation by a β-catenin-Tcf complex in APC−/− coloncarcinoma, Science 275 (1997) 1784–1787.
[26] A. Bauer, S. Chauvet, O. Huber, F. Usseglio, U. Rothbacher, D.Aragnol, R. Kemler, J. Pradel, Pontin52 and reptin52 function as
antagonistic regulators of β-catenin signalling activity, EMBO J. 19(2000) 6121–6130.
[27] K. Tago, T. Nakamura, M. Nishita, J. Hyodo, S. Nagai, Y. Murata, S.Adachi, S. Ohwada, Y. Morishita, H. Shibuya, T. Akiyama,Inhibition of Wnt signaling by ICAT, a novel β-catenin-interactingprotein, Genes Dev. 14 (2000) 1741–1749.
[28] I. Sakamoto, S. Kishida, A. Fukui, M. Kishida, H. Yamamoto, S. Hino, T.Michiue, S. Takada, M. Asashima, A. Kikuchi, A novelβ-catenin-binding protein inhibits β-catenin-dependent Tcfactivationandaxis formation, J. Biol. Chem.275(2000)32871–32878.
[29] L. Waltzer, M. Bienz, Drosophila CBP represses the transcriptionfactor TCF to antigonize Wingless signalling, Nature 395 (1998)521–525.
[30] M. Brannon, J.D. Brown, R. Bates, D. Kimelman, R.T.Moon, XCtBP is aXTcf-3 co-repressor with roles thoughout Xenopus development,Development 126 (1999) 3159–3170.
[31] E.M. Sampson, Z.K. Haque, M.-C. Ku, S.G. Tevosian, C. Albanese, R.G. Pestell, K.E. Paulson, A.S. Yee, Negative regulation of theWnt-β-catenin pathway by the transcriptional repressor HBP1,EMBO J. 20 (2001) 4500–4511.
[32] L. Snider, H. Thirlwell, J.R. Miller, R.T. Moon, M. Groudine, S.J.Tapscott, Inhibition of Tcf3 binding by I-mfa domain proteins,Mol. Cell. Biol. 21 (2001) 1866–1873.
[33] H. Nakabayashi, K. Taketa, K. Miyano, T. Yamane, J. Sato, Growthof human hepatoma cells lines with differentiated functions inchemically defined medium, Cancer Res. 42 (1982) 3858–3863.
[34] L. He, K.J. Isselbacher, J.R. Wands, H.M. Goodman, C. Shih, A.Quaroni, Establishment and characterization of a new humanhepatocellular carcinoma cell line, In Vitro 20 (1984) 493–504.
[35] D. Lopez-Terrada, S.W. Cheung, M.J. Finegold, B.B. Knowles,HepG2 is a hepatoblastoma-derived cell line, Hum. Pathol. 40(2009) 1512–1515.
[36] T. Fujimoto, M. Tomizawa, O. Yokosuka, SiRNA of frizzled-9suppresses proliferation and motility of hepatoma cells, Int. J.Oncol. 35 (2009) 861–866.
[37] W.Wei, M.S. Chua, S. Grepper, S. So, Small molecule antagonists ofTcf4/beta-catenin complex inhibit the growth of HCC cells in vitroand in vivo, Int. J. Cancer 126 (2010) 2426–2436.
931E X P E R I M E N T A L C E L L R E S E A R C H 3 1 7 ( 2 0 1 1 ) 9 2 0 – 9 3 1
Copyright © 2022 FDOKUMEN