Identification of superior lipid producing Lipomyces and ...
20
AIMS Environmental Science, 3(1): 1-20. DOI: 10.3934/environsci.2016.1.1 Received 24 November 2015, Accepted 04 January 2016, Published 07 January 2016 http://www.aimspress.com/journal/environmental Research article Identification of superior lipid producing Lipomyces and Myxozyma yeasts Bruce S Dien 1, *, Patricia J. Slininger 1 , Cletus P. Kurtzman 2 , Bryan R. Moser 3 and Patricia J. O’Bryan 1 1 Bioenergy Research Unit, National Center for Agricultural Utilization Research, USDA-ARS, Peoria, IL, USA 2 Mycotoxin Prevention and Applied Microbiology Research Unit, National Center for Agricultural Utilization Research, USDA-ARS, Peoria, IL, USA 3 Bio-Oils Research Unit, National Center for Agricultural Utilization Research, USDA-ARS, Peoria, IL, USA * Correspondence: Email: [email protected]; Tel: +1-309-681-6270; Fax: +1-309-681-6427. Abstract: Oleaginous yeasts are of interest for production of single cell oils from sugars. Eighteen members of the Lipomyces and Myxozyma clade were screened for lipid production when cultured on 10%w/v glucose. The highest ranking yeasts included L. tetrasporus (21 g/L), L. spencer-martinsiae (19.6 g/L), and L. lipofer (16.7 g/L). By contrast, Rhodosporidium toruloides, which was included as a positive control, produced 16.7 g/L. The L. tetrasporus and L. lipofer were further characterized for growth and lipid production on sugars present in biomass hydrolysates. These included L-arabinose, xylose, and an equal glucose and xylose mixture. L. tetrasporus had lipid titers of 16.3–20.8 g/L and L. lipofer 12.5–17.0 g/L. When both strains were grown on an equal mixture of glucose and xylose, xylose was consumed immediately following glucose. Lipid contents for the yeasts consisted primarily of C18:1 and C16:0, which makes them a promising source of lipids for fuel applications. Keywords: oleaginous yeasts; single cell oils; xylose; lipid 1. Introduction It is historically known that some yeasts become highly enriched for lipids when grown in
-
Upload
khangminh22 -
Category
Documents
-
view
6 -
download
0
Transcript of Identification of superior lipid producing Lipomyces and ...
AIMS Environmental Science, 3(1): 1-20.
DOI: 10.3934/environsci.2016.1.1
Received 24 November 2015,
Accepted 04 January 2016,
Published 07 January 2016
http://www.aimspress.com/journal/environmental
Research article
Identification of superior lipid producing Lipomyces and Myxozyma
yeasts
Bruce S Dien 1,*, Patricia J. Slininger
1, Cletus P. Kurtzman
2, Bryan R. Moser
3 and
Patricia J. O’Bryan 1
1 Bioenergy Research Unit, National Center for Agricultural Utilization Research, USDA-ARS,
Peoria, IL, USA 2
Mycotoxin Prevention and Applied Microbiology Research Unit, National Center for Agricultural
Utilization Research, USDA-ARS, Peoria, IL, USA 3
Bio-Oils Research Unit, National Center for Agricultural Utilization Research, USDA-ARS,
Peoria, IL, USA
* Correspondence: Email: [email protected]; Tel: +1-309-681-6270;
Fax: +1-309-681-6427.
Abstract: Oleaginous yeasts are of interest for production of single cell oils from sugars. Eighteen
members of the Lipomyces and Myxozyma clade were screened for lipid production when cultured on
10%w/v glucose. The highest ranking yeasts included L. tetrasporus (21 g/L), L. spencer-martinsiae
(19.6 g/L), and L. lipofer (16.7 g/L). By contrast, Rhodosporidium toruloides, which was included as
a positive control, produced 16.7 g/L. The L. tetrasporus and L. lipofer were further characterized for
growth and lipid production on sugars present in biomass hydrolysates. These included L-arabinose,
xylose, and an equal glucose and xylose mixture. L. tetrasporus had lipid titers of 16.3–20.8 g/L and
L. lipofer 12.5–17.0 g/L. When both strains were grown on an equal mixture of glucose and xylose,
xylose was consumed immediately following glucose. Lipid contents for the yeasts consisted
primarily of C18:1 and C16:0, which makes them a promising source of lipids for fuel applications.
Keywords: oleaginous yeasts; single cell oils; xylose; lipid
1. Introduction
It is historically known that some yeasts become highly enriched for lipids when grown in
2
AIMS Environmental Science Volume 3, Issue 1, 1-20.
media with excess sugar and a deficiency of essential macro element(s), typically nitrogen [1]. Yeasts
that are able to accumulate at least 20% of their biomass as lipids are termed oleaginous yeasts [2].
These lipids consist of triglycerides (TAGs) and are observed as prominent granule(s) occurring
within the yeast cell when viewed microscopically. These TAGs act as a carbon and energy reserve
that is advantageous for yeasts living in niches that oscillate between feast and famine nutrient
regimes [1]. The yeast extracted TAGS are similar in composition to vegetable oils and are of interest
as use in sustainable production of fuel, food ingredients, and industrial chemical and polymer
applications [3,4].
The oleaginous phenotype appears to be uncommon as it is observed in approximately 70 of the
known 1500 yeast species [1]. Production of lipids for storage involves a biochemical cascade
mechanism that has been elucidated for a few representative strains [5,6]. The trait appears to be
randomly distributed across multiple clades within the Ascomycota and Basidiomycota phyla [1].
Several exceptional lipid producers occur within the Lipomyces clade; as might be expected from the
genus name. Reported results for Lipomyces starkeyi strains, for example, are among the highest ever
reported (41.8 g/L–67.9 g/L) when cultivated in 2-stage or fed batch cultures [7-9]. Despite these
exceptional titers, Lipomyces yeasts have not been systemically screened for lipid production. There
is merit in having results in which the yeasts have been challenged with a uniform culturing method
because differences in the C:N ratio, nitrogen source, and aeration are known to influence lipid
production [4]. A uniform set of data allows for trends to be uncovered as to how lipid production
varies across and within species of this notable clade. An important question that we seek to address
here is if a yeast’s evolutionary relationship within the clade predicts its relative ability to accumulate
lipids.
We also have another purpose in choosing the Lipomyces clade to screen. We are seeking to
identify yeasts suitable for producing single cell oil (SCO) from lignocellulosic biomass. Using
fibrous biomass as a feedstock is advantageous because it is sustainable, abundant, and has a low
green house footprint compared to glucose originating from row crops [10,11]. It would also afford
the economic opportunity to utilize agricultural waste (e.g. corn stover) and production of perennial
biomass crops grown on marginal farmland, which is unsuitable for growing food and feed
crops [12]. We think that Lipomyces yeasts are promising candidates for this purpose because they
have a broad sugar range and herbaceous lignocelluloses contains a mixture of sugars including
glucose, xylose, and L-arabinose [13]. Many yeasts do not or are limited in their ability to grow and
produce lipids on L-arabinose and xylose, including Yarrowia lipolyitca [14]. This is notable because
Y. lipolyitca Po1f has been genetically engineered to produce lipids on glucose to high titers (e.g.,
40 g/L) [15] and health promoting polyunsaturated lipids [16]. Furthermore, we have observed in a
more limited screening of Lipomyces on authentic biomass hydrolyzates that many were robust for
growth and lipid production [17].
Measurement of lipid production by yeasts is problematic in part because they are stored within
the yeast cells. Here we chose to use the sulfo-phospho-vanillin (SPV) [18-21] assay because it is
sensitive (10 µg lipids) [18], convenient, and only requires access to a standard laboratory
spectrophotometer. Other methods for measuring lipids include gravimetric, Nile red or BODIPY
fluorescent staining [22-24], time-domain NMR [25], thin layer chromatography, and gas
chromatography of FAMEs with flame ionization or mass spectrometry detection [26]. These
alternatives are either tedious, require too much sample for small flask cultures, or require
specialized instrumentation. The SPV assay was originally developed for human serum samples but
3
AIMS Environmental Science Volume 3, Issue 1, 1-20.
has been applied to bacterial [18], algal [21], and even yeast samples [20]. However, the single yeast
study only included R. glutinis [20]. Herein the SPV assay is validated on multiple yeast species and
tested for interference from non-lipid components.
In the current study, 18 members of the Lipomyces/Myxozyma clade were screened for lipid
production on glucose medium with a high C:N ratio. In addition, four unrelated but commonly
reported oleaginous yeast species (Cryptococcus aerius, Torulaspora delbrueckii, Rhodosporidium
toruloides, and Y. lipolytica) are included for comparison. Finally, two of the exceptional yeasts from
this screen are further characterized for growth on L-arabinose, glucose, xylose, and an equal
mixture of the later two.
2. Methods
2.1. Source and maintenance of cultures
All yeast cultures were generously supplied by the ARS culture collection (Peoria, IL) and
strains are identified by accession number. Yeast cultures were routinely stored in glycerol solution
(20% v/v) at −80 °C.
2.2. Media formulations
Yeasts were grown on Lipid Production Medium (LPM, 3 g/L peptone and 8 g/L yeast extract) and
supplemented (unless stated otherwise) with 100 g/L glucose. Yeast inocula were grown on YP2D
(20 g/L peptone, 10 g/L yeast extract, 20 g/L glucose) supplemented with 15 g/L Difco agar for solid
cultures.
2.3. Phosphoric acid–Vanillin lipid assay
Lipids were measured using the phosphoric vanillin lipid (PVL) assay modified from Izard and
Limberger (2003). The yeast suspension (50 µl) was mixed with 1 mL of 18 M sulfuric acid in a
threaded 13 × 100 mm Pyrex™ test tube (Corning # 9826-13) and heated at 100 °C for 10 min in a
dry heating bath. The solution was cooled for 5 min in an ambient water bath. Next, 2.5 mL of the
vanillin-phosphoric acid was added and reacted for 15 min at 37 °C. The test tube was cooled for
10 min in water bath at ambient temperature. The absorbance of each reaction was read at 530 nm
against a reference sample prepared with 50 µl water. It is believed that sulfuric acid reacts with the
unsaturated lipid to form a carbonium ion that reacts with the activated carbonyl group of the
phospho-vanillin to produce a colored complex that has a maximum absorption at 525 nm [19].
Absorbance measurements were converted to lipid concentration using a calibration curve
prepared using refined corn oil. Corn oil (100 mg) was dissolved in 2:1 chloroform:methanol (20 mL)
and the stock solution was loaded into the assay mixture at 50–250 µg. A standard curve was run
with each set. The vanillin-phosphoric acid solution was prepared that day by dissolving 0.12 g
vanillin in 20 mL dH2O, and adjusting the volume to 100 mL with 85% o-phosphoric acid.
4
AIMS Environmental Science Volume 3, Issue 1, 1-20.
2.4. Flask cultivation
Lipid production flask cultures were routinely cultivated in 250 mL baffled Erlenmeyer flasks
capped with breathable silicone sponge closures (Bellco, Vineland, NJ) and filled with 50 mL of
LPM supplemented with 100 g/L sugar. Cultures were inoculated to 0.1 OD600 (optical density at 600
nm). Flasks were incubated at 25 °C and mixed at 200 rpm in a refrigerated shaker (Innova 4230,
New Brunswick, NJ). Precultures were prepared by transferring a single colony grown on solid
YP2D to a 250 mL Erlenmeyer flask filled with 50 mL of YP2D and incubating (200 rpm, 25 °C) for
48 h.
Lipid production cultures were sampled every 1–2 days by withdrawing 1 mL of broth to a
microfuge tube. Samples were clarified by centrifuging (10 min, 16,000x g). The liquid was
transferred to a HPLC target vial with the appropriate dilution. The pellet was washed with 1 mL of
dH2O and re-suspended to 1 mL volume and stored at −20 °C to await lipid analysis.
2.5. Micro growth cultures
Growth curves were conducted using the BioLector® bench top micro bioreactor (m2p-labs,
Aachen, Germany) equipped with 48 well FlowerPlate® plates. The BioLector is designed for
enhanced aeration and equipped with automated backscatter measurement of cell biomass. The
settings used were: 0.80 mL LPM cultures, 25 °C, 85–90% humidity, 1500 rpm mixing, and
backscatter (620 nm) was measured at gains of 1, 10, and 20 with each well sampled every 30 min.
Well cultures were inoculated to a beginning OD600 of 0.1. The seed culture was prepared as
described above for the flask cultures.
2.6. Bioreactor runs
Larger volumes of yeast to produce extracted lipids were grown in computer controlled 2.5 L
working volume Biostat B bioreactors (Sartorius AG, Goettingen, Germany). The medium used was
1.5 L of LPM supplemented with 100 g/L glucose and the culture was inoculated with 50 mL of a
flask culture. Similar culture conditions were used for all yeasts: pH 6 (controlled with 4 N NaOH),
25 °C, 800 rpm mixing, and 1.0 L/min aeration. Sugar consumption was monitored and following its
exhaustion, the cell metabolism was halted by heating at 55 °C for 30 min. Cells were harvested by
centrifugation 16,800 x g, 10 min; Eppendorf 5418 centrifuge, Hamburg, Germany ), freeze dried
(freeze dry system, Labconco Corporation, Kansas City, MO), and stored at −20 °C. Yeast inocula
were grown in a foam capped 250 mL Erlenmeyer baffled flasks filled with 50 mL of YP2D with
mixing at 200 rpm at 25 °C in a refrigerated shaker (Innova 4230, New Brunswick) for 3 days.
2.7. Extraction of lipids
Freeze dried cells (10 g) were ruptured by ball milling for 1 min (settings: 30 cycles per sec,
25 mL 316 stainless steel bottles filled with 20 mm balls, Retsch Mill model MM301). Ground cells
were resuspended in 80 mL of dH2O. Lipid extraction solvent (200 mL methanol and 100 mL
chloroform) was added and the mixture was agitated in an ultrasonic bath for 30 min (Branson
ultrasound bath model 2510). The suspension was then mixed at 4 °C for 10 min using a magnetic
5
AIMS Environmental Science Volume 3, Issue 1, 1-20.
stirrer and 100 mL of chloroform and 100 mL of dH2O was added. The mixture was centrifuged for
15 min at 3000 rpm and 20 °C (Sorvall floor centrifuge RC5C Plus, rotor SLA 1500, 867 x g) to
separate the mixture into two layers. The lower layer (e.g. chloroform) was recovered using a glass
pipette and transferred to a separatory funnel, which was allowed to settle overnight. The lower layer
was removed to a pre-weighed beaker. The solvent was evaporated at room temperature and the oil
weighed to determine the yield.
2.8. Analytical methods
Fatty acid composition was determined using extracted lipids. Derivatization to FAMEs (via
methanolic KOH) was performed as described previously [1] and analyzed using a PerkinElmer
(Waltham, MA) Clarus 580 GC equipped with an FID and an HP88 capillary column
(30 m × 0.25 mm i.d., 0.20 μm film thickness). Carrier gas was H2 with a flow rate of 15.0 mL/min.
The temperature program was: hold at 100 °C for 5 min, ramp from 100 °C to 220 °C at 10 °C/min
and hold at 220 °C for 15 min. Injection volume was 1.0 µl with a split ratio of 10.0:1. The
concentration of sample in hexane was approximately 20 mg/mL. The injector and detector
temperatures were 240 °C and 280 °C, respectively. FAME peaks were identified by comparison to
reference standards (>99%, Nu-Chek Prep, Inc., Elysian, MN).
Sugar concentrations were measured in culture broths using a SpectraSYSTEM™ liquid
chromatography system (Thermo Electron Corporation, Waltham, MA equipped with an automatic
sampler, column heater, isocratic pump, refractive index detector, and computer based integrator
running Chromquest ver. 2.5 (Thermo Electron Corporation). Samples (20 µl) were injected onto a
sugar analysis column (Aminex HPX-87H Column, 300 × 7.8 mm, Bio Rad Laboratories, Inc.,
Hercules, CA) and eluted with 5 mM sulfuric acid at 0.6 mL/min and 65 °C as previously described.
3. Results and Discussion
3.1. Lipid quantification assay
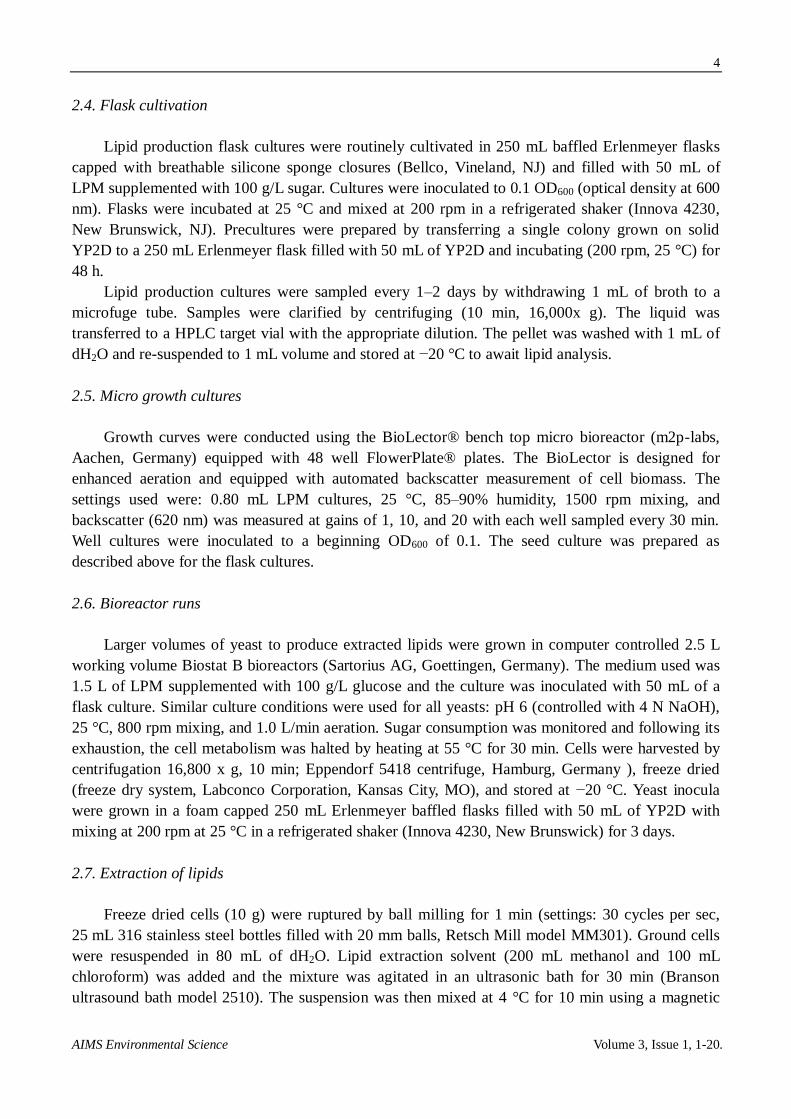
Our first aim was to validate a simple and sensitive assay for measurement of yeast lipids.
Quantification of the SPV assay was first tested by extracting lipids from L tetrasporus Y-11562 and
L. lipofer Y-11555. The responses of the assay were correlated to the amounts of added lipid
(Figure 1A). Refined corn oil was used an external control because it has a similar fatty acid profile.
The assay was quantitative for determining lipids for both yeasts (R > 0.99) and furthermore the
absolute responses virtually overlapped with the refined corn oil.
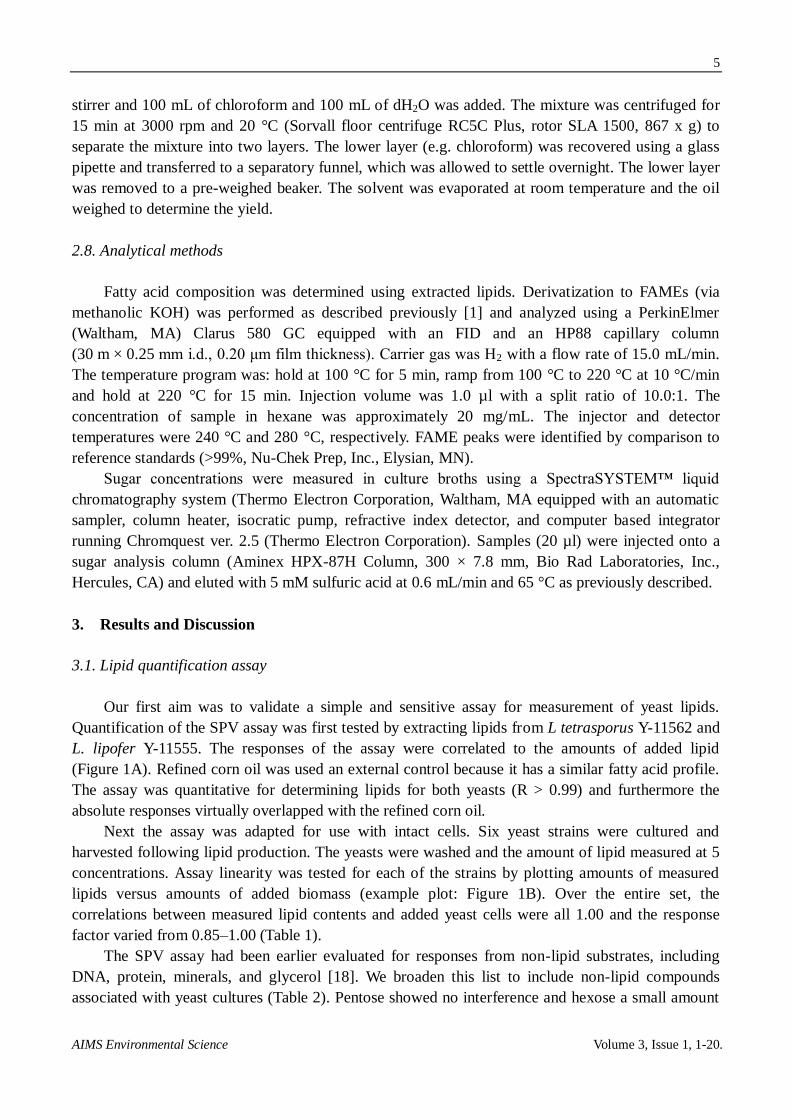
Next the assay was adapted for use with intact cells. Six yeast strains were cultured and
harvested following lipid production. The yeasts were washed and the amount of lipid measured at 5
concentrations. Assay linearity was tested for each of the strains by plotting amounts of measured
lipids versus amounts of added biomass (example plot: Figure 1B). Over the entire set, the
correlations between measured lipid contents and added yeast cells were all 1.00 and the response
factor varied from 0.85–1.00 (Table 1).
The SPV assay had been earlier evaluated for responses from non-lipid substrates, including
DNA, protein, minerals, and glycerol [18]. We broaden this list to include non-lipid compounds
associated with yeast cultures (Table 2). Pentose showed no interference and hexose a small amount
6
AIMS Environmental Science Volume 3, Issue 1, 1-20.
(4.5–4.6%) on a weight basis. Next the nitrogen sources (ammonium sulfate, peptone, and yeast
extract) were evaluated and each showed less than 1% interference with the assay. The overall
medium had a background of 5.9%. This amount of interference should be easily eliminated
provided the yeasts are washed prior to the assay. Finally, yeast extract can be used to model low
lipid containing yeast biomass and this as well had a minor response compared to lipids (0.9%).
Therefore the lipid assay appears robust to various yeasts and provided the yeast cells are washed
interference should not be a concern.
Figure 1A. Validation of phosphoric vanillin lipid (PVL) assay for measurement of
yeast lipids. Measurements for the PVL assay (absorbance 500 nm) were linear with the
amounts of extract lipid added to the assay for both yeasts and (control) corn oil.
Figure 1B. Validation of phosphoric vanillin lipid (PVL) assay for measurement of
yeast lipids. Assay results were also correlated to lipid contents when whole yeast cells
were added to the assay at varying amounts (dry weight basis); also see Table 1. Corn oil
was used as an external standard for conversion of absorbance units to µg of lipids.
Rhodosporidium yeast (mg)
0 20 40 60 80 100 120
Lip
ids (
ug
)
0
100
200
300
400
500
600
7
AIMS Environmental Science Volume 3, Issue 1, 1-20.
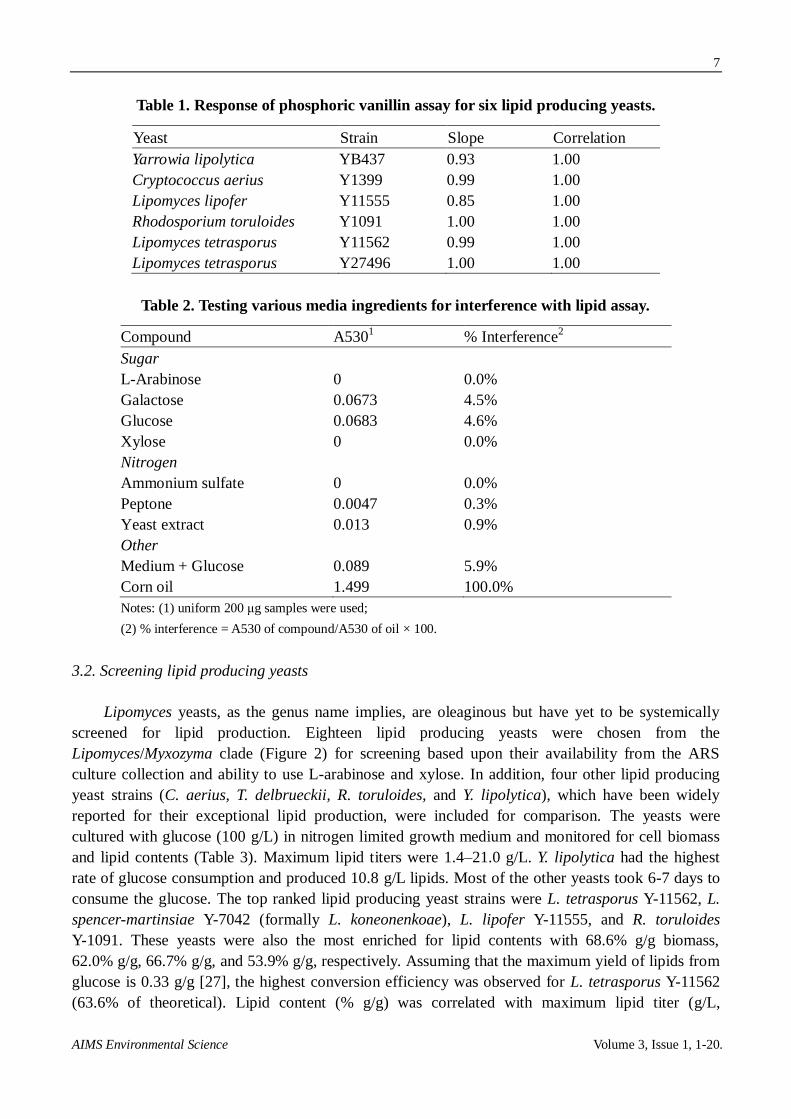
Table 1. Response of phosphoric vanillin assay for six lipid producing yeasts.
Yeast Strain Slope Correlation
Yarrowia lipolytica YB437 0.93 1.00
Cryptococcus aerius Y1399 0.99 1.00
Lipomyces lipofer Y11555 0.85 1.00
Rhodosporium toruloides Y1091 1.00 1.00
Lipomyces tetrasporus Y11562 0.99 1.00
Lipomyces tetrasporus Y27496 1.00 1.00
Table 2. Testing various media ingredients for interference with lipid assay.
Compound A5301 % Interference
2
Sugar
L-Arabinose 0 0.0%
Galactose 0.0673 4.5%
Glucose 0.0683 4.6%
Xylose 0 0.0%
Nitrogen
Ammonium sulfate 0 0.0%
Peptone 0.0047 0.3%
Yeast extract 0.013 0.9%
Other
Medium + Glucose 0.089 5.9%
Corn oil 1.499 100.0%
Notes: (1) uniform 200 μg samples were used;
(2) % interference = A530 of compound/A530 of oil × 100.
3.2. Screening lipid producing yeasts
Lipomyces yeasts, as the genus name implies, are oleaginous but have yet to be systemically
screened for lipid production. Eighteen lipid producing yeasts were chosen from the
Lipomyces/Myxozyma clade (Figure 2) for screening based upon their availability from the ARS
culture collection and ability to use L-arabinose and xylose. In addition, four other lipid producing
yeast strains (C. aerius, T. delbrueckii, R. toruloides, and Y. lipolytica), which have been widely
reported for their exceptional lipid production, were included for comparison. The yeasts were
cultured with glucose (100 g/L) in nitrogen limited growth medium and monitored for cell biomass
and lipid contents (Table 3). Maximum lipid titers were 1.4–21.0 g/L. Y. lipolytica had the highest
rate of glucose consumption and produced 10.8 g/L lipids. Most of the other yeasts took 6-7 days to
consume the glucose. The top ranked lipid producing yeast strains were L. tetrasporus Y-11562, L.
spencer-martinsiae Y-7042 (formally L. koneonenkoae), L. lipofer Y-11555, and R. toruloides
Y-1091. These yeasts were also the most enriched for lipid contents with 68.6% g/g biomass,
62.0% g/g, 66.7% g/g, and 53.9% g/g, respectively. Assuming that the maximum yield of lipids from
glucose is 0.33 g/g [27], the highest conversion efficiency was observed for L. tetrasporus Y-11562
(63.6% of theoretical). Lipid content (% g/g) was correlated with maximum lipid titer (g/L,
8
AIMS Environmental Science Volume 3, Issue 1, 1-20.
R2 = 0.87), but not total cell biomass (g/L; R
2 = 0.33). These trends are expected as total cellular
biomass would be determined in part by the nitrogen content of the medium.
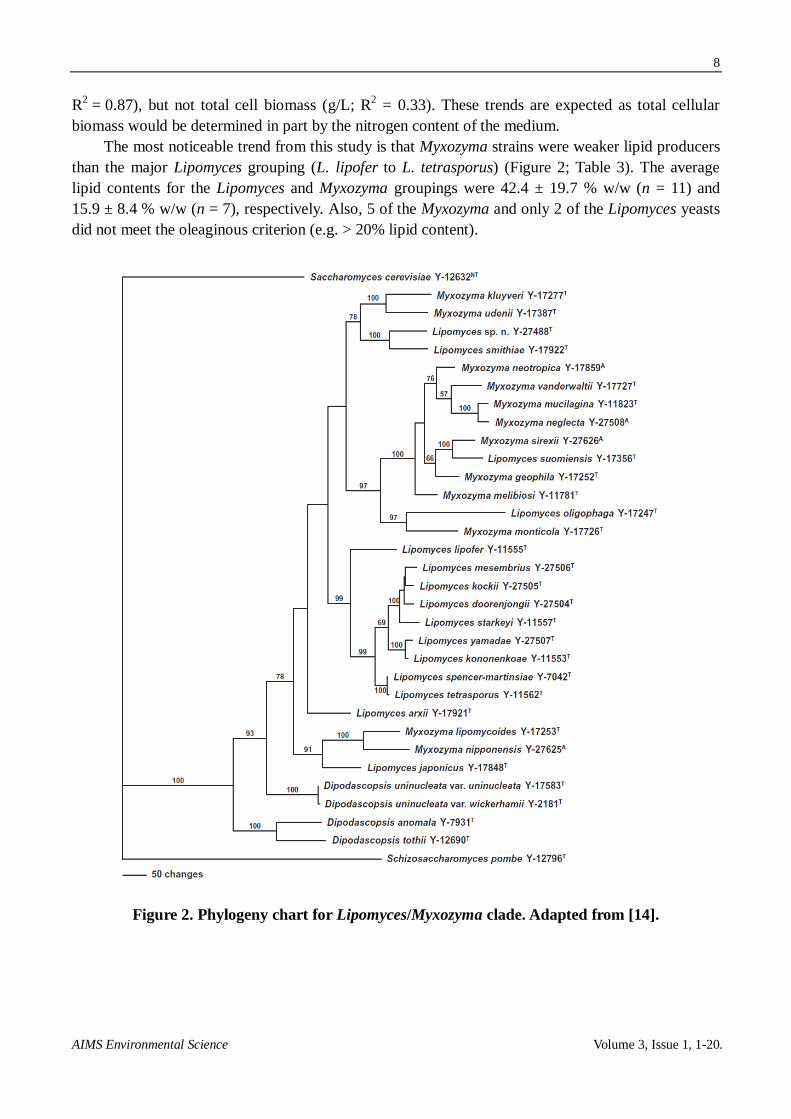
The most noticeable trend from this study is that Myxozyma strains were weaker lipid producers
than the major Lipomyces grouping (L. lipofer to L. tetrasporus) (Figure 2; Table 3). The average
lipid contents for the Lipomyces and Myxozyma groupings were 42.4 ± 19.7 % w/w (n = 11) and
15.9 ± 8.4 % w/w (n = 7), respectively. Also, 5 of the Myxozyma and only 2 of the Lipomyces yeasts
did not meet the oleaginous criterion (e.g. > 20% lipid content).
Figure 2. Phylogeny chart for Lipomyces/Myxozyma clade. Adapted from [14].
9
AIMS Environmental Science Volume 3, Issue 1, 1-20.
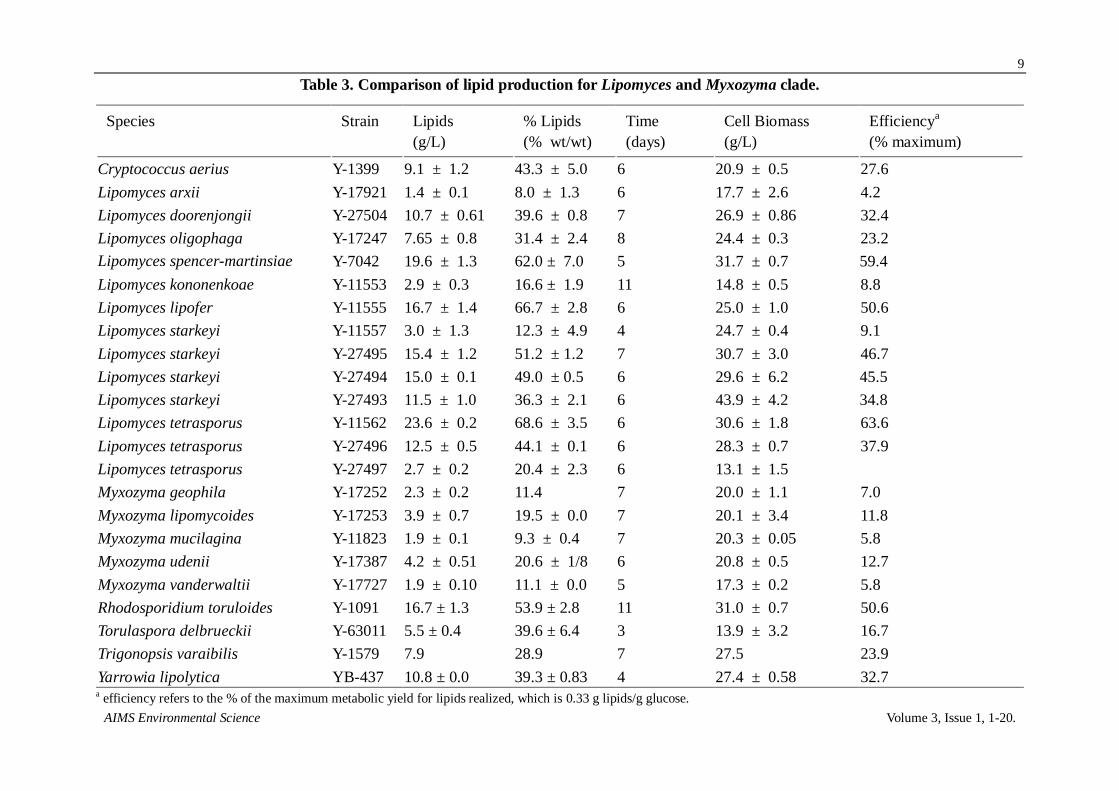
Table 3. Comparison of lipid production for Lipomyces and Myxozyma clade.
Species Strain Lipids
(g/L)
% Lipids
(% wt/wt)
Time
(days)
Cell Biomass
(g/L)
Efficiencya
(% maximum)
Cryptococcus aerius Y-1399 9.1 ± 1.2 43.3 ± 5.0 6 20.9 ± 0.5 27.6
Lipomyces arxii Y-17921 1.4 ± 0.1 8.0 ± 1.3 6 17.7 ± 2.6 4.2
Lipomyces doorenjongii Y-27504 10.7 ± 0.61 39.6 ± 0.8 7 26.9 ± 0.86 32.4
Lipomyces oligophaga Y-17247 7.65 ± 0.8 31.4 ± 2.4 8 24.4 ± 0.3 23.2
Lipomyces spencer-martinsiae Y-7042 19.6 ± 1.3 62.0 ± 7.0 5 31.7 ± 0.7 59.4
Lipomyces kononenkoae Y-11553 2.9 ± 0.3 16.6 ± 1.9 11 14.8 ± 0.5 8.8
Lipomyces lipofer Y-11555 16.7 ± 1.4 66.7 ± 2.8 6 25.0 ± 1.0 50.6
Lipomyces starkeyi Y-11557 3.0 ± 1.3 12.3 ± 4.9 4 24.7 ± 0.4 9.1
Lipomyces starkeyi Y-27495 15.4 ± 1.2 51.2 ± 1.2 7 30.7 ± 3.0 46.7
Lipomyces starkeyi Y-27494 15.0 ± 0.1 49.0 ± 0.5 6 29.6 ± 6.2 45.5
Lipomyces starkeyi Y-27493 11.5 ± 1.0 36.3 ± 2.1 6 43.9 ± 4.2 34.8
Lipomyces tetrasporus Y-11562 23.6 ± 0.2 68.6 ± 3.5 6 30.6 ± 1.8 63.6
Lipomyces tetrasporus Y-27496 12.5 ± 0.5 44.1 ± 0.1 6 28.3 ± 0.7 37.9
Lipomyces tetrasporus Y-27497 2.7 ± 0.2 20.4 ± 2.3 6 13.1 ± 1.5
Myxozyma geophila Y-17252 2.3 ± 0.2 11.4 7 20.0 ± 1.1 7.0
Myxozyma lipomycoides Y-17253 3.9 ± 0.7 19.5 ± 0.0 7 20.1 ± 3.4 11.8
Myxozyma mucilagina Y-11823 1.9 ± 0.1 9.3 ± 0.4 7 20.3 ± 0.05 5.8
Myxozyma udenii Y-17387 4.2 ± 0.51 20.6 ± 1/8 6 20.8 ± 0.5 12.7
Myxozyma vanderwaltii Y-17727 1.9 ± 0.10 11.1 ± 0.0 5 17.3 ± 0.2 5.8
Rhodosporidium toruloides Y-1091 16.7 ± 1.3 53.9 ± 2.8 11 31.0 ± 0.7 50.6
Torulaspora delbrueckii Y-63011 5.5 ± 0.4 39.6 ± 6.4 3 13.9 ± 3.2 16.7
Trigonopsis varaibilis Y-1579 7.9 28.9 7 27.5 23.9
Yarrowia lipolytica YB-437 10.8 ± 0.0 39.3 ± 0.83 4 27.4 ± 0.58 32.7 a efficiency refers to the % of the maximum metabolic yield for lipids realized, which is 0.33 g lipids/g glucose.
10
AIMS Environmental Science Volume 3, Issue 1, 1-20.
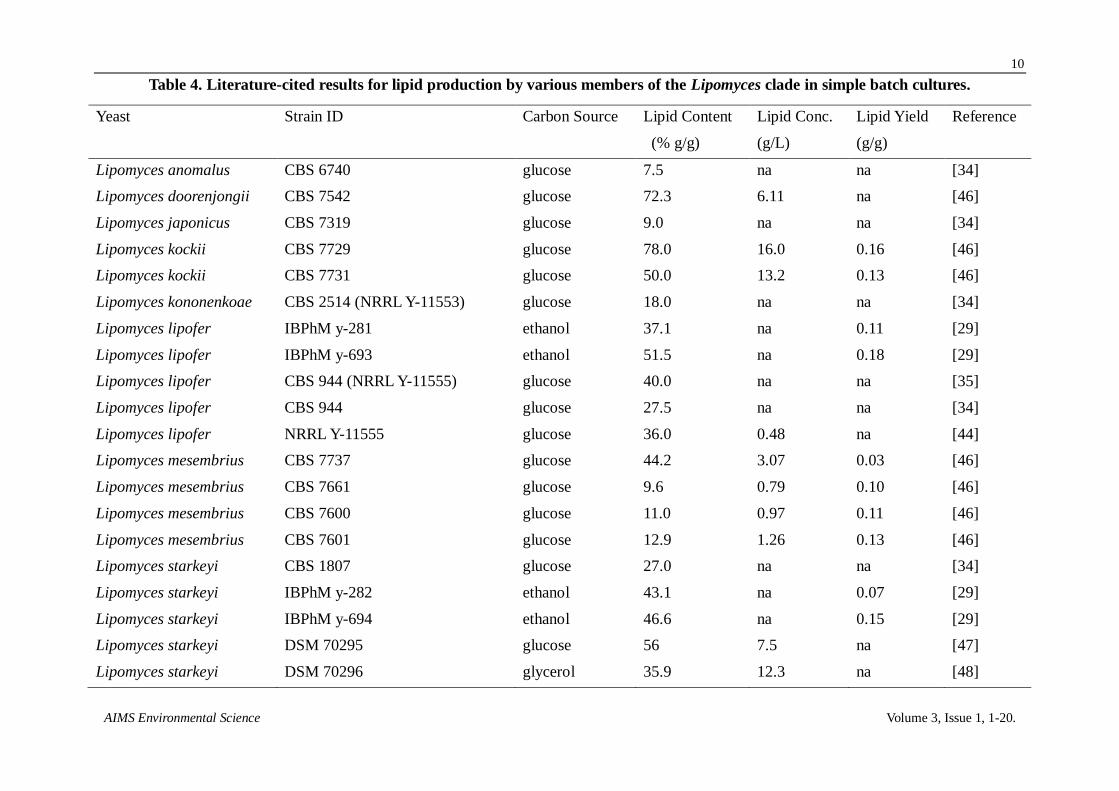
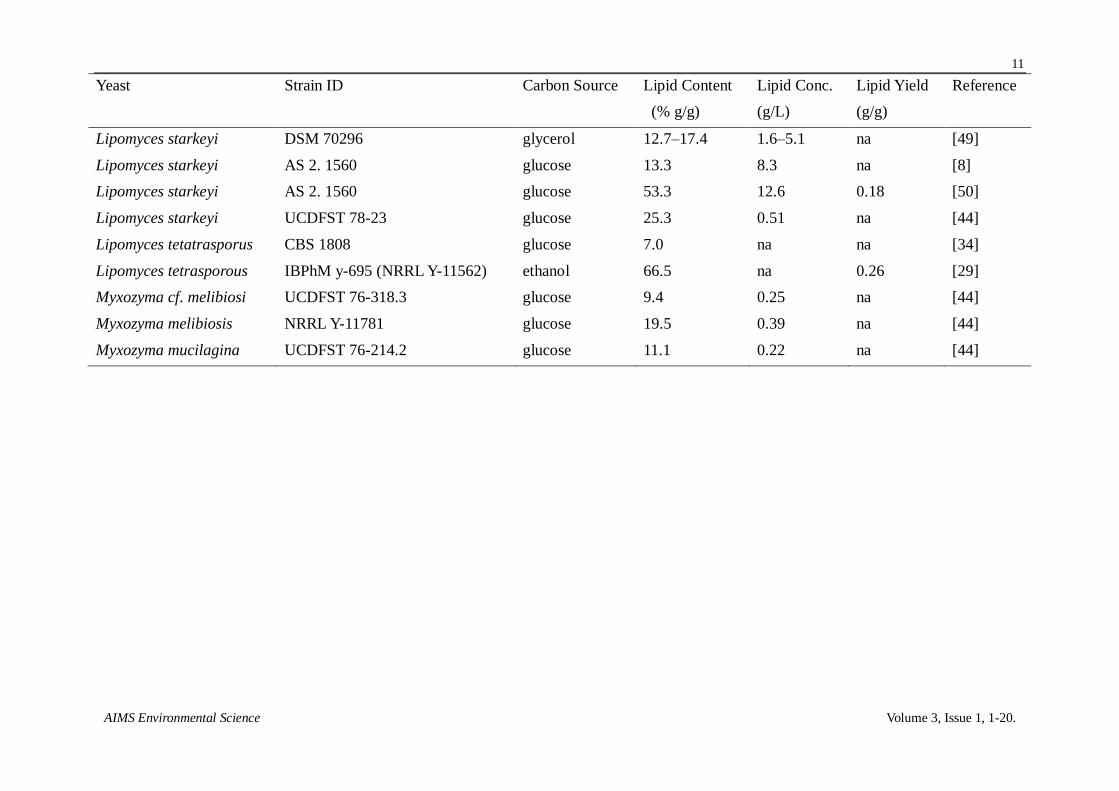
Table 4. Literature-cited results for lipid production by various members of the Lipomyces clade in simple batch cultures.
Yeast Strain ID Carbon Source Lipid Content Lipid Conc. Lipid Yield Reference
(% g/g) (g/L) (g/g)
Lipomyces anomalus CBS 6740 glucose 7.5 na na [34]
Lipomyces doorenjongii CBS 7542 glucose 72.3 6.11 na [46]
Lipomyces japonicus CBS 7319 glucose 9.0 na na [34]
Lipomyces kockii CBS 7729 glucose 78.0 16.0 0.16 [46]
Lipomyces kockii CBS 7731 glucose 50.0 13.2 0.13 [46]
Lipomyces kononenkoae CBS 2514 (NRRL Y-11553) glucose 18.0 na na [34]
Lipomyces lipofer IBPhM y-281 ethanol 37.1 na 0.11 [29]
Lipomyces lipofer IBPhM y-693 ethanol 51.5 na 0.18 [29]
Lipomyces lipofer CBS 944 (NRRL Y-11555) glucose 40.0 na na [35]
Lipomyces lipofer CBS 944 glucose 27.5 na na [34]
Lipomyces lipofer NRRL Y-11555 glucose 36.0 0.48 na [44]
Lipomyces mesembrius CBS 7737 glucose 44.2 3.07 0.03 [46]
Lipomyces mesembrius CBS 7661 glucose 9.6 0.79 0.10 [46]
Lipomyces mesembrius CBS 7600 glucose 11.0 0.97 0.11 [46]
Lipomyces mesembrius CBS 7601 glucose 12.9 1.26 0.13 [46]
Lipomyces starkeyi CBS 1807 glucose 27.0 na na [34]
Lipomyces starkeyi IBPhM y-282 ethanol 43.1 na 0.07 [29]
Lipomyces starkeyi IBPhM y-694 ethanol 46.6 na 0.15 [29]
Lipomyces starkeyi DSM 70295 glucose 56 7.5 na [47]
Lipomyces starkeyi DSM 70296 glycerol 35.9 12.3 na [48]
11
AIMS Environmental Science Volume 3, Issue 1, 1-20.
Yeast Strain ID Carbon Source Lipid Content Lipid Conc. Lipid Yield Reference
(% g/g) (g/L) (g/g)
Lipomyces starkeyi DSM 70296 glycerol 12.7–17.4 1.6–5.1 na [49]
Lipomyces starkeyi AS 2. 1560 glucose 13.3 8.3 na [8]
Lipomyces starkeyi AS 2. 1560 glucose 53.3 12.6 0.18 [50]
Lipomyces starkeyi UCDFST 78-23 glucose 25.3 0.51 na [44]
Lipomyces tetatrasporus CBS 1808 glucose 7.0 na na [34]
Lipomyces tetrasporous IBPhM y-695 (NRRL Y-11562) ethanol 66.5 na 0.26 [29]
Myxozyma cf. melibiosi UCDFST 76-318.3 glucose 9.4 0.25 na [44]
Myxozyma melibiosis NRRL Y-11781 glucose 19.5 0.39 na [44]
Myxozyma mucilagina UCDFST 76-214.2 glucose 11.1 0.22 na [44]
12
AIMS Environmental Science Volume 3, Issue 1, 1-20.
Within species, there was no observed trend. While L. lipofer was the third highest ranking
yeast by lipid content, it was also the most distantly related to the two top ranked yeasts (L.
tetrasporus and L. spencer-martinsiae) [14]. Furthermore, a wide range of lipid values was observed
when multiple isolates were screened in this study (Table 3). Therefore, species identification is not
predictive of an isolate’s ability to produce lipids. Still it is of interest that the two top ranked
Lipomyces strains (L. tetrasporus and L. spencer-martinsiae) are closest neighbors (Figure 2).
Results from prior studies reporting on Lipomyces and Myxozyma yeasts are summarized in Table 4.
In agreement with the trends observed in the present study, yeasts that ranked highest for lipid
production are scattered among the clade members and yeast falling with the Myxozyma group were
poor lipid producers.
Lipid titers reported here for glucose flask culture are among the highest reported for flask
cultures of Lipomyces (Table 4) or other yeast [28]. The top ranking 5 strains produced
15.0–23.6 g/L (Table 3), while prior reported results were 12.4–16.0 g/L. Lipid yields were also very
high for the top 5 yeasts: 0.150–0.236 g/g. The highest previously reported for flask cultures were
0.16 and 0.18 g/g for growth on glucose. However, comparison of various studies needs to be treated
with caution because media, including glucose concentration, varied widely. Furthermore, as noted in
the introduction, lipid titers were much higher for fed- or 2 stage- batch cultures
(41.8 g/L–67.9 g/L) [7-9] than observed for single-stage flask cultures.
Our top lipid producer, L. tetrasporus has also been previously identified as a high lipid
producing strain. L. tetrasporus was originally discovered in a screen of lipid producing yeasts
grown on ethanol that was collected from Russian soil [29], where this yeast was observed to
accumulate lipid to a respectful 66.5% g/g content. This result is somewhat tempered by the
consideration that the maximum lipid yield on ethanol (0.33–0.35 g/g; [27,30]) is considerably
higher than on glucose (0.54 g/g; [30]). L. spencer-martinsiae has attracted interest for its ability to
degrade native starch granules and was explored as a possible candidate for production of single cell
protein, presumably in nitrogen rich medium [31-33]. We were unable to find previous reference to
its favorable potential for lipid production. We were also unable to find previous papers reporting on
lipid producing cultures of L. starkeyi strains Y27495 and Y27494. These strains are worthy of
further investigation because L. starkeyi DSM70296 and AS2. 1560, neither of which was screened
here, are among the top yeast lipid producers described in the literature (Table 4). This was not the
case for L. lipofer, which has been previously explored for lipid production [34,35]. L. kockii is the
only Lipomyces yeast species not included in this study that has been previously reported to have a
high lipid titer (Table 4). In summary, of the top 5 ranked lipid producing yeast strains only two had
been previously characterized for lipid production in flask cultures.
3.3. Lipid production on sugar mixtures
Two of the top producing Lipomyces yeast strains (L. lipofer Y-11555 and L. tetrasporus
Y-11562 ) were selected for further characterization. The major sugars associated with herbaceous
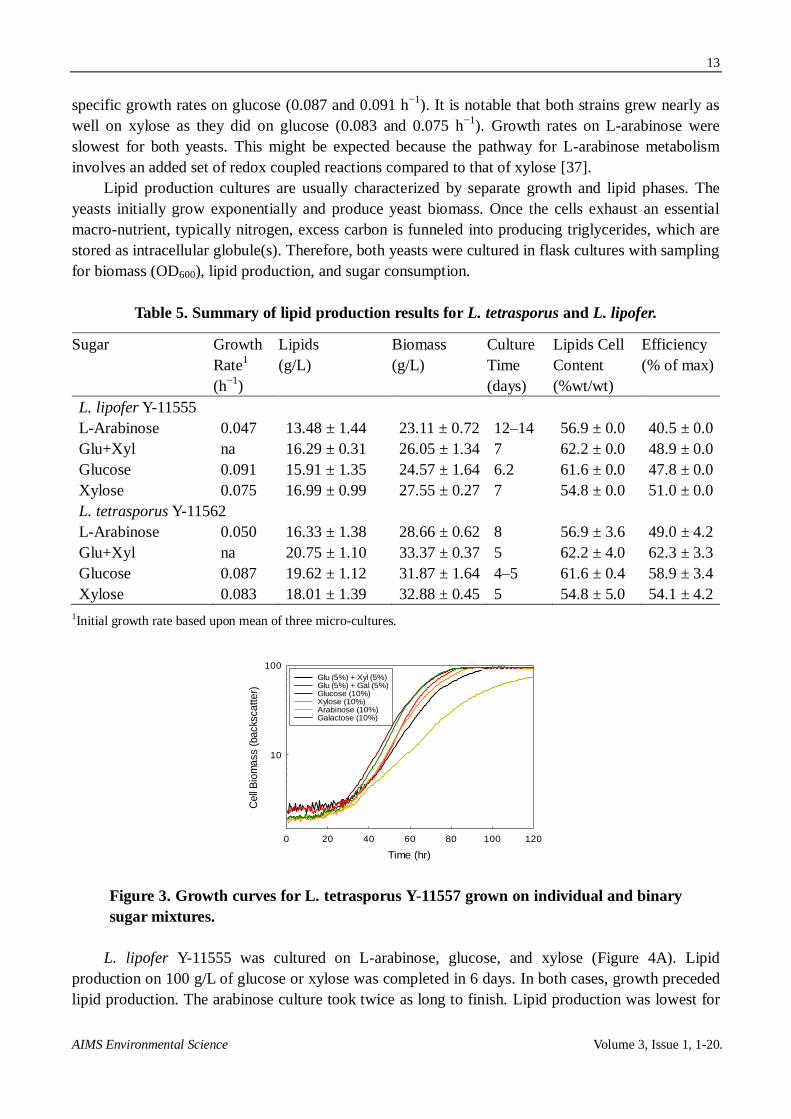
biomass include L-arabinose, glucose, and xylose. Specific growth rates were measured for yeasts
cultured in each of these sugars (Table 5) using a specialized micro-titer culture system equipped
with an optical sensor used for monitoring cell growth (Figure 3). The mini-culture system allows for
high aeration rates and continuous measurement of cell density; cell density is measured using
backscatter, which remains linear at high biomass concentrations [36]. Both yeasts strains had similar
13
AIMS Environmental Science Volume 3, Issue 1, 1-20.
specific growth rates on glucose (0.087 and 0.091 h−1
). It is notable that both strains grew nearly as
well on xylose as they did on glucose (0.083 and 0.075 h−1
). Growth rates on L-arabinose were
slowest for both yeasts. This might be expected because the pathway for L-arabinose metabolism
involves an added set of redox coupled reactions compared to that of xylose [37].
Lipid production cultures are usually characterized by separate growth and lipid phases. The
yeasts initially grow exponentially and produce yeast biomass. Once the cells exhaust an essential
macro-nutrient, typically nitrogen, excess carbon is funneled into producing triglycerides, which are
stored as intracellular globule(s). Therefore, both yeasts were cultured in flask cultures with sampling
for biomass (OD600), lipid production, and sugar consumption.
Table 5. Summary of lipid production results for L. tetrasporus and L. lipofer.
Sugar Growth
Rate1
(h−1
)
Lipids
(g/L)
Biomass
(g/L)
Culture
Time
(days)
Lipids Cell
Content
(%wt/wt)
Efficiency
(% of max)
L. lipofer Y-11555
L-Arabinose 0.047 13.48 ± 1.44 23.11 ± 0.72 12–14 56.9 ± 0.0 40.5 ± 0.0
Glu+Xyl na 16.29 ± 0.31 26.05 ± 1.34 7 62.2 ± 0.0 48.9 ± 0.0
Glucose 0.091 15.91 ± 1.35 24.57 ± 1.64 6.2 61.6 ± 0.0 47.8 ± 0.0
Xylose 0.075 16.99 ± 0.99 27.55 ± 0.27 7 54.8 ± 0.0 51.0 ± 0.0
L. tetrasporus Y-11562
L-Arabinose 0.050 16.33 ± 1.38 28.66 ± 0.62 8 56.9 ± 3.6 49.0 ± 4.2
Glu+Xyl na 20.75 ± 1.10 33.37 ± 0.37 5 62.2 ± 4.0 62.3 ± 3.3
Glucose 0.087 19.62 ± 1.12 31.87 ± 1.64 4–5 61.6 ± 0.4 58.9 ± 3.4
Xylose 0.083 18.01 ± 1.39 32.88 ± 0.45 5 54.8 ± 5.0 54.1 ± 4.2
1Initial growth rate based upon mean of three micro-cultures.
Figure 3. Growth curves for L. tetrasporus Y-11557 grown on individual and binary
sugar mixtures.
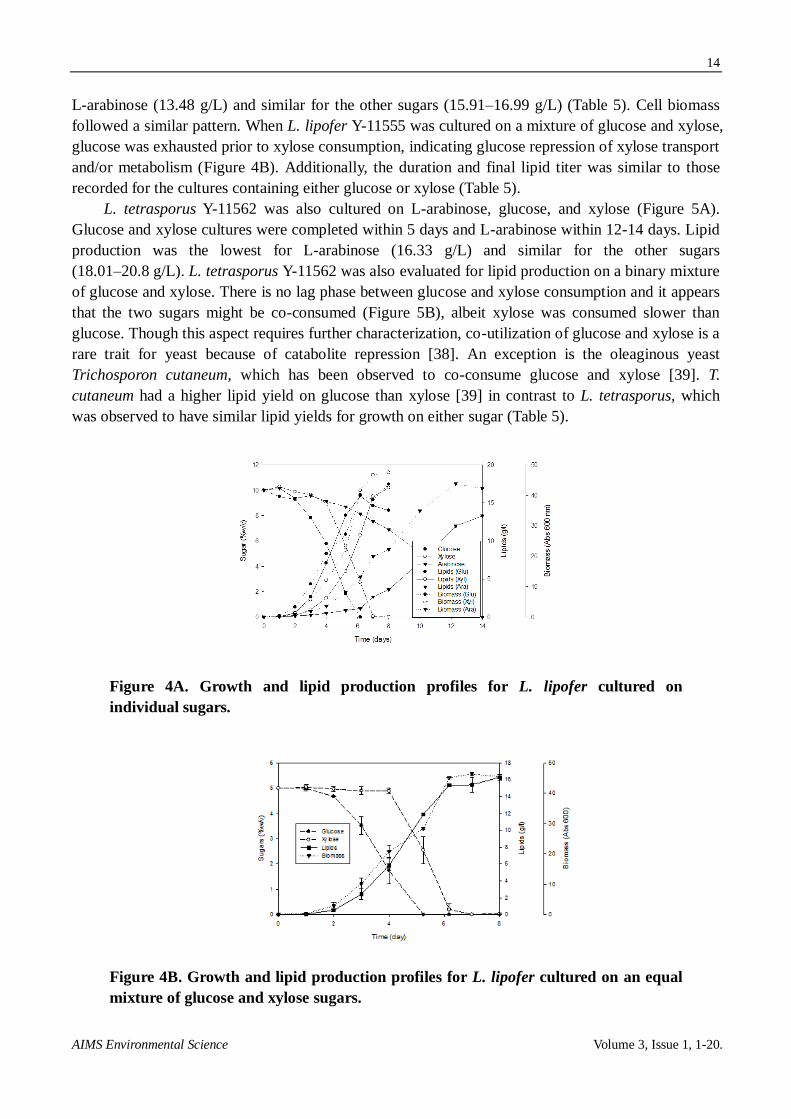
L. lipofer Y-11555 was cultured on L-arabinose, glucose, and xylose (Figure 4A). Lipid
production on 100 g/L of glucose or xylose was completed in 6 days. In both cases, growth preceded
lipid production. The arabinose culture took twice as long to finish. Lipid production was lowest for
Time (hr)
0 20 40 60 80 100 120
Ce
ll B
iom
ass (
ba
cks
ca
tte
r)
10
100
Glu (5%) + Xyl (5%)Glu (5%) + Gal (5%)Glucose (10%)Xylose (10%)Arabinose (10%)Galactose (10%)
14
AIMS Environmental Science Volume 3, Issue 1, 1-20.
L-arabinose (13.48 g/L) and similar for the other sugars (15.91–16.99 g/L) (Table 5). Cell biomass
followed a similar pattern. When L. lipofer Y-11555 was cultured on a mixture of glucose and xylose,
glucose was exhausted prior to xylose consumption, indicating glucose repression of xylose transport
and/or metabolism (Figure 4B). Additionally, the duration and final lipid titer was similar to those
recorded for the cultures containing either glucose or xylose (Table 5).
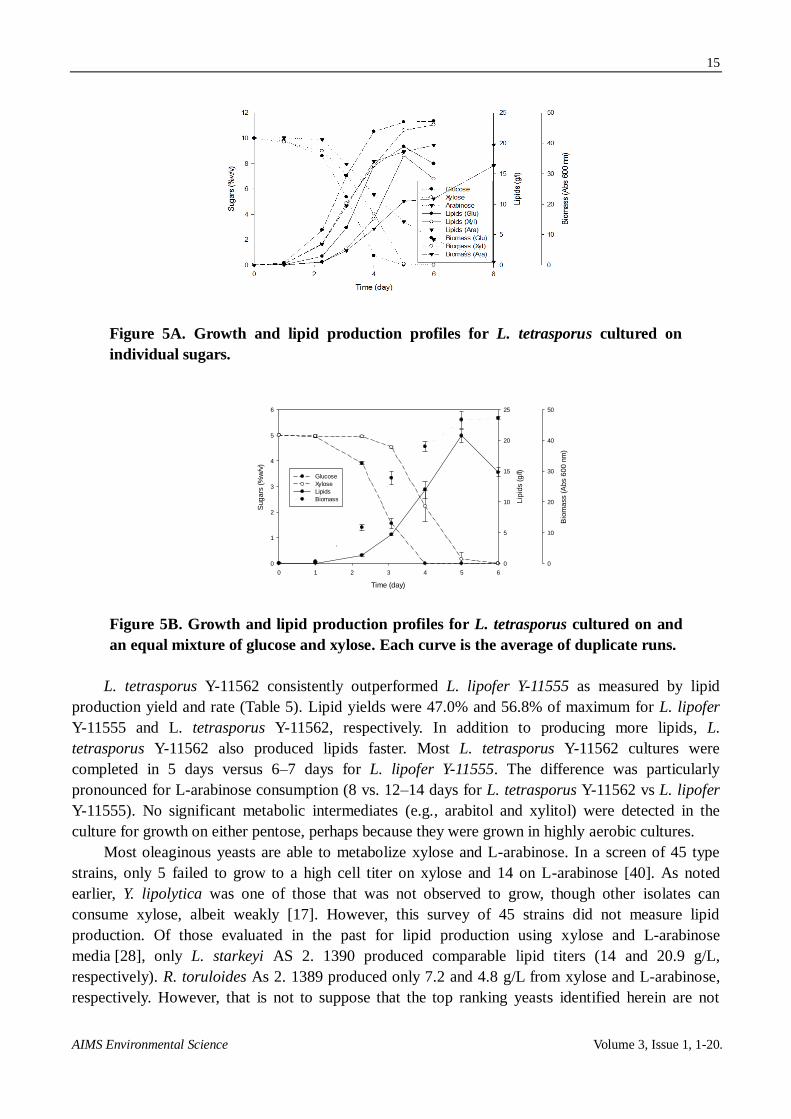
L. tetrasporus Y-11562 was also cultured on L-arabinose, glucose, and xylose (Figure 5A).
Glucose and xylose cultures were completed within 5 days and L-arabinose within 12-14 days. Lipid
production was the lowest for L-arabinose (16.33 g/L) and similar for the other sugars
(18.01–20.8 g/L). L. tetrasporus Y-11562 was also evaluated for lipid production on a binary mixture
of glucose and xylose. There is no lag phase between glucose and xylose consumption and it appears
that the two sugars might be co-consumed (Figure 5B), albeit xylose was consumed slower than
glucose. Though this aspect requires further characterization, co-utilization of glucose and xylose is a
rare trait for yeast because of catabolite repression [38]. An exception is the oleaginous yeast
Trichosporon cutaneum, which has been observed to co-consume glucose and xylose [39]. T.
cutaneum had a higher lipid yield on glucose than xylose [39] in contrast to L. tetrasporus, which
was observed to have similar lipid yields for growth on either sugar (Table 5).
Figure 4A. Growth and lipid production profiles for L. lipofer cultured on
individual sugars.
Figure 4B. Growth and lipid production profiles for L. lipofer cultured on an equal
mixture of glucose and xylose sugars.
15
AIMS Environmental Science Volume 3, Issue 1, 1-20.
Figure 5A. Growth and lipid production profiles for L. tetrasporus cultured on
individual sugars.
Time (day)
0 1 2 3 4 5 6
Sug
ars
(%
w/v
)
0
1
2
3
4
5
6
Lip
ids (
g/l)
0
5
10
15
20
25
Bio
ma
ss (
Ab
s 6
00
nm
)0
10
20
30
40
50
Glucose
Xylose
Lipids
Biomass
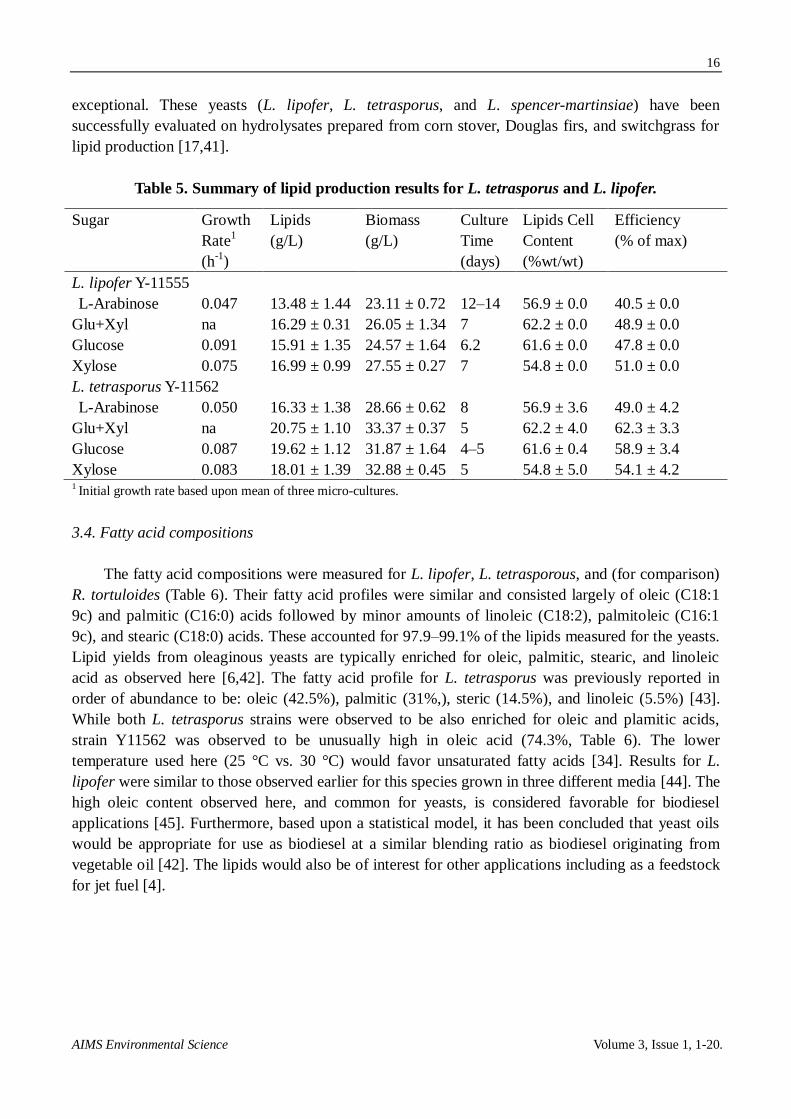
Figure 5B. Growth and lipid production profiles for L. tetrasporus cultured on and
an equal mixture of glucose and xylose. Each curve is the average of duplicate runs.
L. tetrasporus Y-11562 consistently outperformed L. lipofer Y-11555 as measured by lipid
production yield and rate (Table 5). Lipid yields were 47.0% and 56.8% of maximum for L. lipofer
Y-11555 and L. tetrasporus Y-11562, respectively. In addition to producing more lipids, L.
tetrasporus Y-11562 also produced lipids faster. Most L. tetrasporus Y-11562 cultures were
completed in 5 days versus 6–7 days for L. lipofer Y-11555. The difference was particularly
pronounced for L-arabinose consumption (8 vs. 12–14 days for L. tetrasporus Y-11562 vs L. lipofer
Y-11555). No significant metabolic intermediates (e.g., arabitol and xylitol) were detected in the
culture for growth on either pentose, perhaps because they were grown in highly aerobic cultures.
Most oleaginous yeasts are able to metabolize xylose and L-arabinose. In a screen of 45 type
strains, only 5 failed to grow to a high cell titer on xylose and 14 on L-arabinose [40]. As noted
earlier, Y. lipolytica was one of those that was not observed to grow, though other isolates can
consume xylose, albeit weakly [17]. However, this survey of 45 strains did not measure lipid
production. Of those evaluated in the past for lipid production using xylose and L-arabinose
media [28], only L. starkeyi AS 2. 1390 produced comparable lipid titers (14 and 20.9 g/L,
respectively). R. toruloides As 2. 1389 produced only 7.2 and 4.8 g/L from xylose and L-arabinose,
respectively. However, that is not to suppose that the top ranking yeasts identified herein are not
16
AIMS Environmental Science Volume 3, Issue 1, 1-20.
exceptional. These yeasts (L. lipofer, L. tetrasporus, and L. spencer-martinsiae) have been
successfully evaluated on hydrolysates prepared from corn stover, Douglas firs, and switchgrass for
lipid production [17,41].
Table 5. Summary of lipid production results for L. tetrasporus and L. lipofer.
Sugar Growth
Rate1
(h-1
)
Lipids
(g/L)
Biomass
(g/L)
Culture
Time
(days)
Lipids Cell
Content
(%wt/wt)
Efficiency
(% of max)
L. lipofer Y-11555
L-Arabinose 0.047 13.48 ± 1.44 23.11 ± 0.72 12–14 56.9 ± 0.0 40.5 ± 0.0
Glu+Xyl na 16.29 ± 0.31 26.05 ± 1.34 7 62.2 ± 0.0 48.9 ± 0.0
Glucose 0.091 15.91 ± 1.35 24.57 ± 1.64 6.2 61.6 ± 0.0 47.8 ± 0.0
Xylose 0.075 16.99 ± 0.99 27.55 ± 0.27 7 54.8 ± 0.0 51.0 ± 0.0
L. tetrasporus Y-11562
L-Arabinose 0.050 16.33 ± 1.38 28.66 ± 0.62 8 56.9 ± 3.6 49.0 ± 4.2
Glu+Xyl na 20.75 ± 1.10 33.37 ± 0.37 5 62.2 ± 4.0 62.3 ± 3.3
Glucose 0.087 19.62 ± 1.12 31.87 ± 1.64 4–5 61.6 ± 0.4 58.9 ± 3.4
Xylose 0.083 18.01 ± 1.39 32.88 ± 0.45 5 54.8 ± 5.0 54.1 ± 4.2 1 Initial growth rate based upon mean of three micro-cultures.
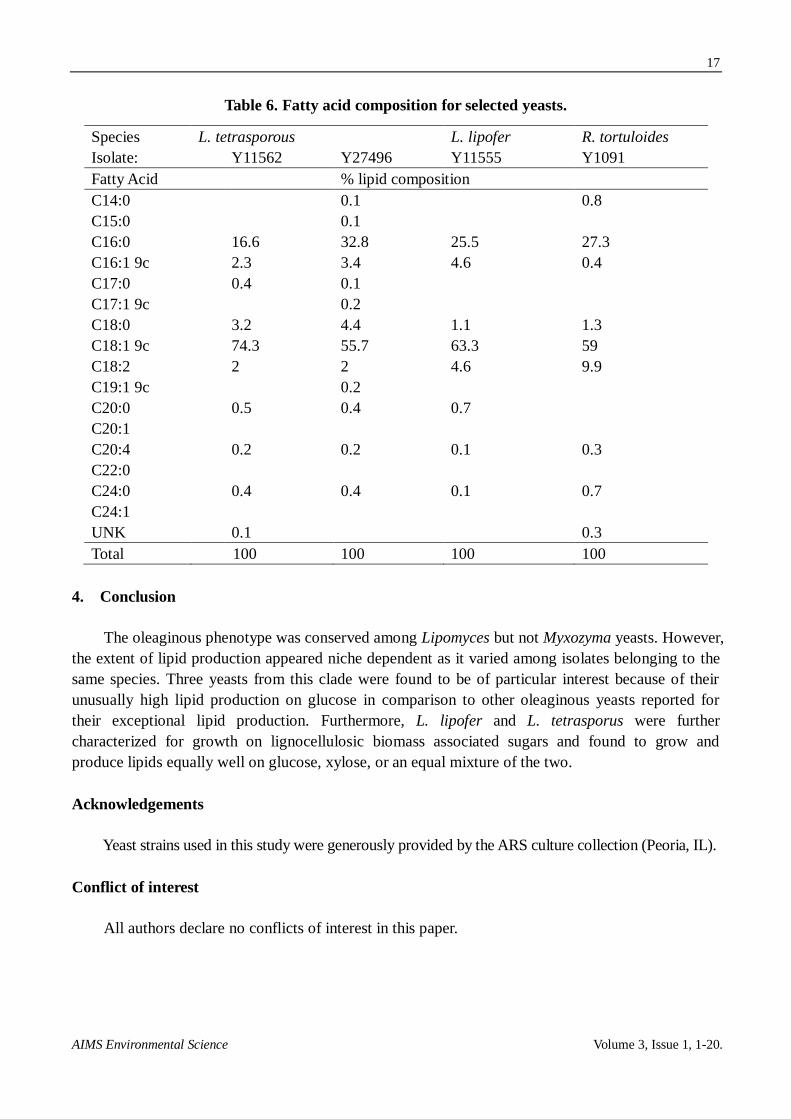
3.4. Fatty acid compositions
The fatty acid compositions were measured for L. lipofer, L. tetrasporous, and (for comparison)
R. tortuloides (Table 6). Their fatty acid profiles were similar and consisted largely of oleic (C18:1
9c) and palmitic (C16:0) acids followed by minor amounts of linoleic (C18:2), palmitoleic (C16:1
9c), and stearic (C18:0) acids. These accounted for 97.9–99.1% of the lipids measured for the yeasts.
Lipid yields from oleaginous yeasts are typically enriched for oleic, palmitic, stearic, and linoleic
acid as observed here [6,42]. The fatty acid profile for L. tetrasporus was previously reported in
order of abundance to be: oleic (42.5%), palmitic (31%,), steric (14.5%), and linoleic (5.5%) [43].
While both L. tetrasporus strains were observed to be also enriched for oleic and plamitic acids,
strain Y11562 was observed to be unusually high in oleic acid (74.3%, Table 6). The lower
temperature used here (25 °C vs. 30 °C) would favor unsaturated fatty acids [34]. Results for L.
lipofer were similar to those observed earlier for this species grown in three different media [44]. The
high oleic content observed here, and common for yeasts, is considered favorable for biodiesel
applications [45]. Furthermore, based upon a statistical model, it has been concluded that yeast oils
would be appropriate for use as biodiesel at a similar blending ratio as biodiesel originating from
vegetable oil [42]. The lipids would also be of interest for other applications including as a feedstock
for jet fuel [4].
17
AIMS Environmental Science Volume 3, Issue 1, 1-20.
Table 6. Fatty acid composition for selected yeasts.
Species L. tetrasporous L. lipofer R. tortuloides
Isolate: Y11562 Y27496 Y11555
Y1091
Fatty Acid % lipid composition
C14:0 0.1 0.8
C15:0 0.1
C16:0 16.6 32.8 25.5 27.3
C16:1 9c 2.3 3.4 4.6 0.4
C17:0 0.4 0.1
C17:1 9c 0.2
C18:0 3.2 4.4 1.1 1.3
C18:1 9c 74.3 55.7 63.3 59
C18:2 2 2 4.6 9.9
C19:1 9c 0.2
C20:0 0.5 0.4 0.7
C20:1
C20:4 0.2 0.2 0.1 0.3
C22:0
C24:0 0.4 0.4 0.1 0.7
C24:1
UNK 0.1 0.3
Total 100 100 100 100
4. Conclusion
The oleaginous phenotype was conserved among Lipomyces but not Myxozyma yeasts. However,
the extent of lipid production appeared niche dependent as it varied among isolates belonging to the
same species. Three yeasts from this clade were found to be of particular interest because of their
unusually high lipid production on glucose in comparison to other oleaginous yeasts reported for
their exceptional lipid production. Furthermore, L. lipofer and L. tetrasporus were further
characterized for growth on lignocellulosic biomass associated sugars and found to grow and
produce lipids equally well on glucose, xylose, or an equal mixture of the two.
Acknowledgements
Yeast strains used in this study were generously provided by the ARS culture collection (Peoria, IL).
Conflict of interest
All authors declare no conflicts of interest in this paper.
18
AIMS Environmental Science Volume 3, Issue 1, 1-20.
References
1. Sitepu IR, Garay LA, Sestric R, et al. (2014) Oleaginous yeasts for biodiesel: Current and future
trends in biology and production. Biotechnol adv 32: 1336-1360.
2. Thorpe R, Ratledge C (1972) Fatty acid distribution in triglycerides of yeasts grown on glucose
or n-alkanes. J Gen Microbiol 72: 151-163.
3. Papanikolaou S, Aggelis G (2010) Yarrowia lipolytica: A model microorganism used for the
production of tailor‐made lipids. Eur j lipid sci tech 112: 639-654.
4. Jin M, Slininger PJ, Dien BS, et al. (2015) Microbial lipid-based lignocellulosic biorefinery:
feasibility and challenges. Trends biotechnol 33: 43-54.
5. Davies RJ (1992) Scale Up of Yeast Oil Technology. Industrial Applications of Single Cell Oils:
AOCS Publishing.
6. Ratledge C, Wynn JP (2002) The biochemistry and molecular biology of lipid accumulation in
oleaginous microorganisms. Advances in Applied Microbiology: Academic Press. pp. 1-51.
7. Anschau A, Xavier MC, Hernalsteens S, et al. (2014) Effect of feeding strategies on lipid
production by Lipomyces starkeyi. Bioresource technol 157: 214-222.
8. Lin J, Shen H, Tan H, et al. (2011) Lipid production by Lipomyces starkeyi cells in glucose
solution without auxiliary nutrients. J biotechnol 152: 184-188.
9. Tsakona S, Kopsahelis N, Chatzifragkou A, et al. (2014) Formulation of fermentation media
from flour-rich waste streams for microbial lipid production by Lipomyces starkeyi. J biotechnol
189: 36-45.
10. Schmer MR, Vogel KP, Varvel GE, et al. (2014) Energy potential and greenhouse gas emissions
from bioenergy cropping systems on marginally productive cropland. PloS one 9.
11. Fulton LM, Lynd LR, Körner A, et al. (2015) The need for biofuels as part of a low carbon
energy future. Biofuels, bioprod bioref 9: 476-483.
12. Perlack RD, Eaton LM, Turhollow Jr AF, et al. (2011) US billion-ton update: biomass supply for
a bioenergy and bioproducts industry.
13. Dien BS, Jung H-JG, Vogel KP, et al. (2006) Chemical composition and response to dilute-acid
pretreatment and enzymatic saccharification of alfalfa, reed canarygrass, and switchgrass.
Biomass bioenerg 30: 880-891.
14. Kurtzman C, Fell JW, Boekhout T (2011) The yeasts: a taxonomic study: Elsevier.
15. Liu L, Pan A, Spofford C, et al. (2015) An evolutionary metabolic engineering approach for
enhancing lipogenesis in Yarrowia lipolytica. Metab eng 29: 36-45.
16. Xie D, Jackson E, Zhu Q (2015) Sustainable source of omega-3 eicosapentaenoic acid from
metabolically engineered Yarrowia lipolytica: from fundamental research to commercial
production. Appl microbiol biotechnol 99: 1599-1610.
17. Slininger PJ, Dien BS, Kurtzman CP, et al. (submitted) Comparative Lipid Production by
Oleaginous Yeasts in Hydrolyzates of Lignocellulosic Biomass and Process Strategy for High
Titers Biotechnol Bioeng.
18. Izard J, Limberger RJ (2003) Rapid screening method for quantitation of bacterial cell lipids
from whole cells. J microbiol meth 55: 411-418.
19. Knight JA, Anderson S, Rawle JM (1972) Chemical basis of the sulfo-phospho-vanillin reaction
for estimating total serum lipids. Clin chem 18: 199-202.
20. Wang J, Li R, Lu D, et al. (2009) A quick isolation method for mutants with high lipid yield in
19
AIMS Environmental Science Volume 3, Issue 1, 1-20.
oleaginous yeast. World j microb biot 25: 921-925.
21. Cheng Y-S, Zheng Y, VanderGheynst JS (2011) Rapid quantitative analysis of lipids using a
colorimetric method in a microplate format. Lipids 46: 95-103.
22. Govender T, Ramanna L, Rawat I, et al. (2012) BODIPY staining, an alternative to the Nile Red
fluorescence method for the evaluation of intracellular lipids in microalgae. Bioresour technol
114: 507-511.
23. Greenspan P, Fowler SD (1985) Spectrofluorometric studies of the lipid probe, nile red. J lipid
res 26: 781-789.
24. Sitepu I, Ignatia L, Franz A, et al. (2012) An improved high-throughput Nile red fluorescence
assay for estimating intracellular lipids in a variety of yeast species. J microbiol meth 91:
321-328.
25. Gao C, Xiong W, Zhang Y, et al. (2008) Rapid quantitation of lipid in microalgae by
time-domain nuclear magnetic resonance. J microbiol meth 75: 437-440.
26. Laurens LM, Quinn M, Van Wychen S, et al. (2012) Accurate and reliable quantification of total
microalgal fuel potential as fatty acid methyl esters by in situ transesterification. Anal bioanal
chem 403: 167-178.
27. Dugar D, Stephanopoulos G (2011) Relative potential of biosynthetic pathways for biofuels and
bio-based products. Nat biotechnol 29: 1074-1078.
28. Ageitos JM, Vallejo JA, Veiga-Crespo P, et al. (2011) Oily yeasts as oleaginous cell factories.
Appl microbiol biotechnol 90: 1219-1227.
29. Eroshin V, Krylova N (1983) Efficiency of lipid synthesis by yeasts. Biotechnol bioeng 25:
1693-1700.
30. Davies RJ, Holdsworth JE (1992) Synthesis of lipids in yeasts: Biochemistry, physiology and
production. Adv appl lipid res 1: 119-159.
31. Spencer-Martins I, Van Uden N (1977) Yields of yeast growth on starch. Eur j appl microbiol
biotechnol 4: 29-35.
32. Spencer-Martins I, van Uden N (1979) Extracellular amylolytic system of the yeast Lipomyces
kononenkoae. Eur j appl microbiol biotechnol 6: 241-250.
33. Spencer-Martins I, van Uden N (1982) The temperature profile of growth, death and yield of the
starch-converting yeast Lipomyces kononenkoae. Zeitschrift für allgemeine Mikrobiologie 22:
503-505.
34. Lomascolo A, Dubreucq E, Perrier V, et al. (1994) Study of lipids in Lipomyces and
Waltomyces. Can j microbiol 40: 724-729.
35. McElroy FA, Stewart H (1967) The lipids of Lipomyces lipofer. Can j biochem 45: 171-178.
36. Funke M, Buchenauer A, Schnakenberg U, et al. (2010) Microfluidic biolector—Microfluidic
bioprocess control in microtiter plates. Biotechnol bioeng 107: 497-505.
37. Dien BS, Kurtzman CG, Saha BC, et al. Screening for L-arabinose fermenting yeasts; 1996.
Springer. pp. 233-242.
38. Zhang G-C, Liu J-J, Kong II, et al. (2015) Combining C6 and C5 sugar metabolism for
enhancing microbial bioconversion. Curr opin chem biol 29: 49-57.
39. Hu C, Wu S, Wang Q, et al. (2011) Simultaneous utilization of glucose and xylose for lipid
production by Trichosporon cutaneum. Biotechnol biofuels 4: 25.
40. Sitepu I, Selby T, Lin T, et al. (2014) Carbon source utilization and inhibitor tolerance of 45
oleaginous yeast species. Journal of industrial microbiology & biotechnology 41: 1061-1070.
20
AIMS Environmental Science Volume 3, Issue 1, 1-20.
41. Xue YP, Jin M, Orjuela A, et al. (2015) Microbial lipid production from AFEX™ pretreated
corn stover. RSC advances 5: 28725-28734.
42. Leiva-Candia D, Pinzi S, Redel-Macías M, et al. (2014) The potential for agro-industrial waste
utilization using oleaginous yeast for the production of biodiesel. Fuel 123: 33-42.
43. Viljoen B, Kock J, Lategan P (1986) Long-chain fatty acid composition of selected genera of
yeasts belonging to the Endomycetales. Antonie van leeuwenhoek 52: 45-51.
44. Sitepu IR, Sestric R, Ignatia L, et al. (2013) Manipulation of culture conditions alters lipid
content and fatty acid profiles of a wide variety of known and new oleaginous yeast species.
Bioresource technol 144: 360-369.
45. Knothe G (2008) ―Designer‖ Biodiesel: Optimizing Fatty Ester Composition to Improve Fuel
Properties. Energ fuel 22: 1358-1364.
46. Oguri E, Masaki K, Naganuma T, et al. (2012) Phylogenetic and biochemical characterization of
the oil-producing yeast Lipomyces starkeyi. Antonie van leeuwenhoek 101: 359-368.
47. Angerbauer C, Siebenhofer M, Mittelbach M, et al. (2008) Conversion of sewage sludge into
lipids by Lipomyces starkeyi for biodiesel production. Bioresource technol 99: 3051-3056.
48. Tchakouteu S, Kalantzi O, Gardeli C, et al. (2015) Lipid production by yeasts growing on
biodiesel‐derived crude glycerol: strain selection and impact of substrate concentration on the
fermentation efficiency. J appl microbiol 118: 911-927.
49. Leiva-Candia DE, Tsakona S, Kopsahelis N, et al. (2015) Biorefining of by-product streams
from sunflower-based biodiesel production plants for integrated synthesis of microbial oil and
value-added co-products. Bioresource technol 190: 57-65.
50. Gong Z, Wang Q, Shen H, et al. (2012) Co-fermentation of cellobiose and xylose by Lipomyces
starkeyi for lipid production. Bioresource technol 117: 20-24.
© 2016 Bruce S Dien, et al., licensee AIMS Press. This is an open
access article distributed under the terms of the Creative
Commons Attribution License
(http://creativecommons.org/Licenses/by/4.0)