Zero-temperature phase transitions in quantum systems with symmetry-conserving impurities
Idf
NC
a
ARRAA
K3LSMF
1
salcdin(estaWcssf
h0
Journal of Pharmaceutical and Biomedical Analysis 100 (2014) 157–166
Contents lists available at ScienceDirect
Journal of Pharmaceutical and Biomedical Analysis
j o ur na l ho mepage: www.elsev ier .com/ locate / jpba
dentification of process related trace level impurities in the actinideecorporation agent 3,4,3-LI(1,2-HOPO): Nozzle–skimmerragmentation via ESI LC–QTOFMS
agender R. Panyala, Manuel Sturzbecher-Hoehne, Rebecca J. Abergel ∗
hemical Sciences Division, Lawrence Berkeley National Laboratory, Berkeley, CA 94720, USA
r t i c l e i n f o
rticle history:eceived 3 June 2014eceived in revised form 29 July 2014ccepted 1 August 2014vailable online 12 August 2014
eywords:,4,3-LI(1,2-HOPO) ligand
a b s t r a c t
3,4,3-LI(1,2-HOPO) is a chelating ligand and decorporation agent that can remove radioactive lanthanidesand actinides from the body. Identification of trace impurities in drug samples is gaining much interestdue to their significant influence on drug activity. In this study, trace impurities were detected in man-ufactured lots of 3,4,3-LI(1,2-HOPO) by a developed method of liquid chromatography coupled withphoto-diode array UV detection and electrospray ionization–quadrupole time of flight mass spectrom-etry (LC–QTOFMS), via induced-in-source or collision-induced mass fragmentation (nozzle–skimmerfragmentation). Molecular ions were fragmented within the nozzle–skimmer region of electrospray ion-
C–MS/MStructural elucidationethod development
ragmentation
ization (ESI) mass spectrometer equipped with a Time of Flight detector. Eight major (detected at levelshigher than a 0.1% threshold) and seven minor trace impurities were identified. The respective structuresof these impurities were elucidated via analysis of the generated fragment ions using mass fragmenta-tion and elemental composition software. Proposed structures of impurities were further confirmed viaisotopic modeling.
© 2014 Elsevier B.V. All rights reserved.
. Introduction
The only functional therapy to reduce the dramatic health con-equences of internal contamination with radionuclides such as thectinides is treatment with chelating agents that form excretableow molecular weight metal complexes [1,2]. The novel synthetichelator 3,4,3-LI(1,2-HOPO) is currently undergoing pre-clinicalevelopment as an actinide decorporation agent for the following
ndication: treatment of individuals with known or suspected inter-al contamination with plutonium (Pu), americium (Am), curiumCm), uranium (U) or neptunium (Np) to increase the rates oflimination of these radionuclides [3–7]. This compound is a metal-eeking octadentate ligand that chelates actinide ions effectivelyhrough four 1-hydroxy-pyridin-2-one metal-binding units thatre linked to a linear spermine backbone via amide linkages (Fig. 1).hile a large-scale synthetic process for the preparation of this
ompound is well established [8–12], information on potential drug
ubstance impurities must be gathered to pursue development andeek regulatory approval [13,14]. The type of information providedor each impurity can vary with the nature of the impurity, the∗ Corresponding author. Tel.: +1 510 486 5249; fax: +1 510 486 5596.E-mail address: [email protected] (R.J. Abergel).
ttp://dx.doi.org/10.1016/j.jpba.2014.08.004731-7085/© 2014 Elsevier B.V. All rights reserved.
analytical procedure by which it is detected, whether it is actuallypresent in significant quantities in the drug substance, whether ithas been identified, and the methods used to identify the impu-rity [15–17]. However, as per the specifications of the InternationalConference on Harmonization (ICH) guidelines [18], any compo-nent of a pharmaceutical product that is not the active substanceand is present at levels higher than 0.1% or 1 mg/day intake for amaximum daily dose of 2 g or less, or at levels higher than 0.05% fora daily dose greater than 2 g of drug substance, must be qualifiedand identified with corresponding toxicity information.
It is very common that impurities arise from the synthetic pro-cess itself, yielding molecular structures similar to that of thesynthesized drug. In addition, for 3,4,3-LI(1,2-HOPO), a highly effi-cient metal scavenger, it is also expected that impurities maybe formed after chelation of, or reaction with, trace metal ionspresent in the vessels used throughout the synthesis. In both cases,the structural resemblance between the parent compound andthe unknown impurities may result in similar solution behav-iors and spectroscopic signatures that make the separation andcharacterization processes difficult. Liquid chromatography (LC)
in combination with mass spectrometry (MS) is one of the mostefficient techniques for accurate characterization, structural elu-cidation, and determination of unknown trace impurities in bulkdrug substance batches [19,20]. The use of liquid chromatography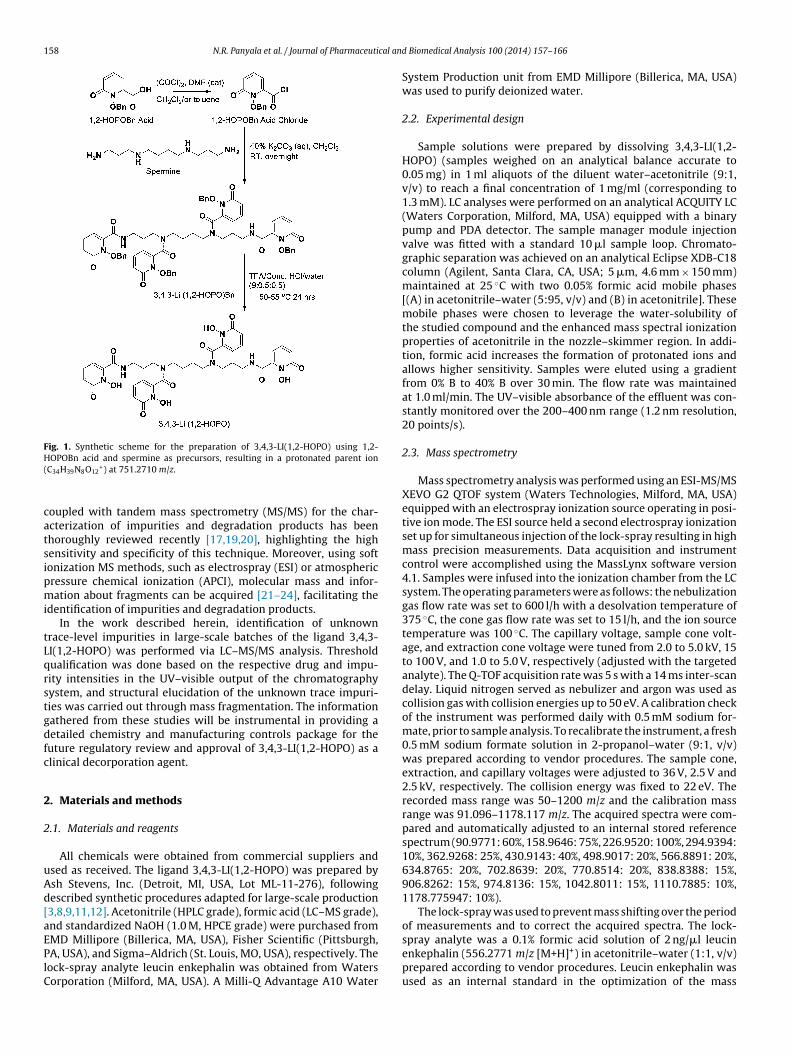
158 N.R. Panyala et al. / Journal of Pharmaceutical an
Fig. 1. Synthetic scheme for the preparation of 3,4,3-LI(1,2-HOPO) using 1,2-H(
catsipmi
tLqrstgdfc
2
2
uAd[aEPlC
spray analyte was a 0.1% formic acid solution of 2 ng/�l leucin
OPOBn acid and spermine as precursors, resulting in a protonated parent ionC34H39N8O12
+) at 751.2710 m/z.
oupled with tandem mass spectrometry (MS/MS) for the char-cterization of impurities and degradation products has beenhoroughly reviewed recently [17,19,20], highlighting the highensitivity and specificity of this technique. Moreover, using softonization MS methods, such as electrospray (ESI) or atmosphericressure chemical ionization (APCI), molecular mass and infor-ation about fragments can be acquired [21–24], facilitating the
dentification of impurities and degradation products.In the work described herein, identification of unknown
race-level impurities in large-scale batches of the ligand 3,4,3-I(1,2-HOPO) was performed via LC–MS/MS analysis. Thresholdualification was done based on the respective drug and impu-ity intensities in the UV–visible output of the chromatographyystem, and structural elucidation of the unknown trace impuri-ies was carried out through mass fragmentation. The informationathered from these studies will be instrumental in providing aetailed chemistry and manufacturing controls package for theuture regulatory review and approval of 3,4,3-LI(1,2-HOPO) as alinical decorporation agent.
. Materials and methods
.1. Materials and reagents
All chemicals were obtained from commercial suppliers andsed as received. The ligand 3,4,3-LI(1,2-HOPO) was prepared bysh Stevens, Inc. (Detroit, MI, USA, Lot ML-11-276), followingescribed synthetic procedures adapted for large-scale production3,8,9,11,12]. Acetonitrile (HPLC grade), formic acid (LC–MS grade),nd standardized NaOH (1.0 M, HPCE grade) were purchased fromMD Millipore (Billerica, MA, USA), Fisher Scientific (Pittsburgh,
A, USA), and Sigma–Aldrich (St. Louis, MO, USA), respectively. Theock-spray analyte leucin enkephalin was obtained from Watersorporation (Milford, MA, USA). A Milli-Q Advantage A10 Waterd Biomedical Analysis 100 (2014) 157–166
System Production unit from EMD Millipore (Billerica, MA, USA)was used to purify deionized water.
2.2. Experimental design
Sample solutions were prepared by dissolving 3,4,3-LI(1,2-HOPO) (samples weighed on an analytical balance accurate to0.05 mg) in 1 ml aliquots of the diluent water–acetonitrile (9:1,v/v) to reach a final concentration of 1 mg/ml (corresponding to1.3 mM). LC analyses were performed on an analytical ACQUITY LC(Waters Corporation, Milford, MA, USA) equipped with a binarypump and PDA detector. The sample manager module injectionvalve was fitted with a standard 10 �l sample loop. Chromato-graphic separation was achieved on an analytical Eclipse XDB-C18column (Agilent, Santa Clara, CA, USA; 5 �m, 4.6 mm × 150 mm)maintained at 25 ◦C with two 0.05% formic acid mobile phases[(A) in acetonitrile–water (5:95, v/v) and (B) in acetonitrile]. Thesemobile phases were chosen to leverage the water-solubility ofthe studied compound and the enhanced mass spectral ionizationproperties of acetonitrile in the nozzle–skimmer region. In addi-tion, formic acid increases the formation of protonated ions andallows higher sensitivity. Samples were eluted using a gradientfrom 0% B to 40% B over 30 min. The flow rate was maintainedat 1.0 ml/min. The UV–visible absorbance of the effluent was con-stantly monitored over the 200–400 nm range (1.2 nm resolution,20 points/s).
2.3. Mass spectrometry
Mass spectrometry analysis was performed using an ESI-MS/MSXEVO G2 QTOF system (Waters Technologies, Milford, MA, USA)equipped with an electrospray ionization source operating in posi-tive ion mode. The ESI source held a second electrospray ionizationset up for simultaneous injection of the lock-spray resulting in highmass precision measurements. Data acquisition and instrumentcontrol were accomplished using the MassLynx software version4.1. Samples were infused into the ionization chamber from the LCsystem. The operating parameters were as follows: the nebulizationgas flow rate was set to 600 l/h with a desolvation temperature of375 ◦C, the cone gas flow rate was set to 15 l/h, and the ion sourcetemperature was 100 ◦C. The capillary voltage, sample cone volt-age, and extraction cone voltage were tuned from 2.0 to 5.0 kV, 15to 100 V, and 1.0 to 5.0 V, respectively (adjusted with the targetedanalyte). The Q-TOF acquisition rate was 5 s with a 14 ms inter-scandelay. Liquid nitrogen served as nebulizer and argon was used ascollision gas with collision energies up to 50 eV. A calibration checkof the instrument was performed daily with 0.5 mM sodium for-mate, prior to sample analysis. To recalibrate the instrument, a fresh0.5 mM sodium formate solution in 2-propanol–water (9:1, v/v)was prepared according to vendor procedures. The sample cone,extraction, and capillary voltages were adjusted to 36 V, 2.5 V and2.5 kV, respectively. The collision energy was fixed to 22 eV. Therecorded mass range was 50–1200 m/z and the calibration massrange was 91.096–1178.117 m/z. The acquired spectra were com-pared and automatically adjusted to an internal stored referencespectrum (90.9771: 60%, 158.9646: 75%, 226.9520: 100%, 294.9394:10%, 362.9268: 25%, 430.9143: 40%, 498.9017: 20%, 566.8891: 20%,634.8765: 20%, 702.8639: 20%, 770.8514: 20%, 838.8388: 15%,906.8262: 15%, 974.8136: 15%, 1042.8011: 15%, 1110.7885: 10%,1178.775947: 10%).
The lock-spray was used to prevent mass shifting over the periodof measurements and to correct the acquired spectra. The lock-
enkephalin (556.2771 m/z [M+H]+) in acetonitrile–water (1:1, v/v)prepared according to vendor procedures. Leucin enkephalin wasused as an internal standard in the optimization of the mass
cal and
suomwpw1e
“tpIssMcaei
2
wMElF
3
howu(TastrqotauptbaHs
3s
3
ost1
N.R. Panyala et al. / Journal of Pharmaceuti
pectrometers for LC–MS experiments. The instrument was tunedsing the standard solution to provide a minimum mass accuracyr resolving power of 22,500 FWHM resolution (full width at half-aximum, m/z 556.2771 [M+H]+ in ESI (+) mode). This solutionas used as a lock mass to correct small mass drifts during multi-le measurements. During LC acquisitions the lock-spray solutionas injected every 30 s for a scan time of 0.1 s, with a flow rate of
0 �l/min. The capillary voltage was set to 3.0 kV and the collisionnergy to 15 eV.
Tandem mass spectra were obtained by applying thenozzle–skimmer fragmentation” (NSF) method, which referso the purposeful induction of in-source fragmentation of thearent ion through nozzle–skimmer potential increase [25–30].
n-source fragmentation was used in addition to tandem masspectrometry (with post-source fragmentation) to allow for twoteps of fragmentation in a pseudo MS3 experimental mode.ass spectra were obtained through the combination of NSF and
ollision-induced fragmentation (CID) by Argon gas (collision gas)fter isolation of precursor ions and optimization of the collisionnergy in the 15–100 eV range to maximize the ion current in theon track.
.4. Software and computation
MassLynx, MassFragmenter, and Elemental Composition Soft-are (ECS) were purchased from Waters Technologies (Milford,A, USA) and theoretical isotopic patterns were calculated using
CS, Launchpad (Kompact version 2.9.3, 2011) from Kratos Ana-ytical Ltd (Manchester, UK), as well as the freeware Molecularragment Calculator (MFC), version 1.0 (James E. Deline, 1995).
. Results and discussion
The large-scale preparation of the octadentate spermine-basedydroxypyridinonate ligand 3,4,3-LI(1,2-HOPO) followed meth-ds previously described in the literature that were implementedith minimal optimization [3], over three synthetic steps (Fig. 1),sing the commercially available 1,2-HOPOBn (1,6-carboxy-1-benzyl)hydroxy-2-pyridinone) acid and spermine as precursors.he resulting 5-kg lot was used for the characterization of thective pharmaceutical ingredient (API), preliminary API stabilitytudies, as well as the work described here to identify all detectedrace impurities. An efficient software-assisted workflow for impu-ity identification and profiling of 3,4,3-LI(1,2-HOPO) using a singleuadrupole time-of-flight (Q-TOF) LC–MS/MS system was carriedut. This workflow involved two steps: (i) on-line LC-UV detec-ion, further followed by MS and auto/or direct infusion MS/MSnalysis; (ii) identification and structure elucidation of impuritiessing advanced mass fragmentation tools, qualitative analysis datarocessing algorithms, and isotopic modeling software. The effec-ive use of this workflow for impurity profiling was demonstratedy the rapid identification and structural elucidation of eight majornd seven minor impurities present in the studied 3,4,3-LI(1,2-OPO) lot, the threshold between minor and major impurities been
et at 0.1%.
.1. Detection of target compound and impurities after LCeparation
.1.1. Absorption spectroscopyA typical LC-UV chromatogram of 3,4,3-LI(1,2-HOPO) was
btained using the LC method described in Section 2.3. The analy-is revealed the presence of 15 impurities at the relative retentionimes (Rel. Rt) of 0.53, 0.86, 0.90, 1.06, 1.13, 1.20, 1.32, 1.34, 1.40,.55, 1.72, 1.88, 2.37, 2.54, and 2.89, with respect to the main API
Biomedical Analysis 100 (2014) 157–166 159
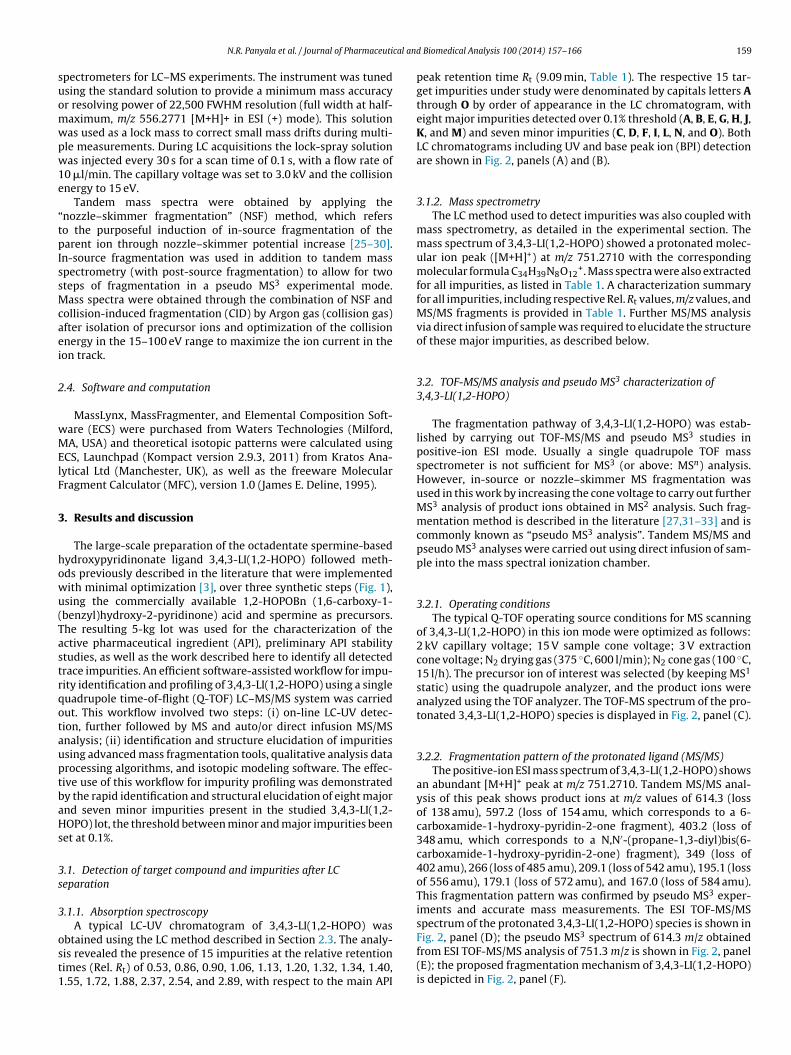
peak retention time Rt (9.09 min, Table 1). The respective 15 tar-get impurities under study were denominated by capitals letters Athrough O by order of appearance in the LC chromatogram, witheight major impurities detected over 0.1% threshold (A, B, E, G, H, J,K, and M) and seven minor impurities (C, D, F, I, L, N, and O). BothLC chromatograms including UV and base peak ion (BPI) detectionare shown in Fig. 2, panels (A) and (B).
3.1.2. Mass spectrometryThe LC method used to detect impurities was also coupled with
mass spectrometry, as detailed in the experimental section. Themass spectrum of 3,4,3-LI(1,2-HOPO) showed a protonated molec-ular ion peak ([M+H]+) at m/z 751.2710 with the correspondingmolecular formula C34H39N8O12
+. Mass spectra were also extractedfor all impurities, as listed in Table 1. A characterization summaryfor all impurities, including respective Rel. Rt values, m/z values, andMS/MS fragments is provided in Table 1. Further MS/MS analysisvia direct infusion of sample was required to elucidate the structureof these major impurities, as described below.
3.2. TOF-MS/MS analysis and pseudo MS3 characterization of3,4,3-LI(1,2-HOPO)
The fragmentation pathway of 3,4,3-LI(1,2-HOPO) was estab-lished by carrying out TOF-MS/MS and pseudo MS3 studies inpositive-ion ESI mode. Usually a single quadrupole TOF massspectrometer is not sufficient for MS3 (or above: MSn) analysis.However, in-source or nozzle–skimmer MS fragmentation wasused in this work by increasing the cone voltage to carry out furtherMS3 analysis of product ions obtained in MS2 analysis. Such frag-mentation method is described in the literature [27,31–33] and iscommonly known as “pseudo MS3 analysis”. Tandem MS/MS andpseudo MS3 analyses were carried out using direct infusion of sam-ple into the mass spectral ionization chamber.
3.2.1. Operating conditionsThe typical Q-TOF operating source conditions for MS scanning
of 3,4,3-LI(1,2-HOPO) in this ion mode were optimized as follows:2 kV capillary voltage; 15 V sample cone voltage; 3 V extractioncone voltage; N2 drying gas (375 ◦C, 600 l/min); N2 cone gas (100 ◦C,15 l/h). The precursor ion of interest was selected (by keeping MS1
static) using the quadrupole analyzer, and the product ions wereanalyzed using the TOF analyzer. The TOF-MS spectrum of the pro-tonated 3,4,3-LI(1,2-HOPO) species is displayed in Fig. 2, panel (C).
3.2.2. Fragmentation pattern of the protonated ligand (MS/MS)The positive-ion ESI mass spectrum of 3,4,3-LI(1,2-HOPO) shows
an abundant [M+H]+ peak at m/z 751.2710. Tandem MS/MS anal-ysis of this peak shows product ions at m/z values of 614.3 (lossof 138 amu), 597.2 (loss of 154 amu, which corresponds to a 6-carboxamide-1-hydroxy-pyridin-2-one fragment), 403.2 (loss of348 amu, which corresponds to a N,N′-(propane-1,3-diyl)bis(6-carboxamide-1-hydroxy-pyridin-2-one) fragment), 349 (loss of402 amu), 266 (loss of 485 amu), 209.1 (loss of 542 amu), 195.1 (lossof 556 amu), 179.1 (loss of 572 amu), and 167.0 (loss of 584 amu).This fragmentation pattern was confirmed by pseudo MS3 exper-iments and accurate mass measurements. The ESI TOF-MS/MSspectrum of the protonated 3,4,3-LI(1,2-HOPO) species is shown in
Fig. 2, panel (D); the pseudo MS3 spectrum of 614.3 m/z obtainedfrom ESI TOF-MS/MS analysis of 751.3 m/z is shown in Fig. 2, panel(E); the proposed fragmentation mechanism of 3,4,3-LI(1,2-HOPO)is depicted in Fig. 2, panel (F).
160 N.R. Panyala et al. / Journal of Pharmaceutical and Biomedical Analysis 100 (2014) 157–166
Table 1Characterization summary for impurities identified in 3,4,3-LI(1,2-HOPO) large-scale synthetic batch.
Identity Rel. RTa % areab Compositionc Measured m/zc Calculated m/zc �m (ppm) MS/MS fragment ions (MSn parameters)d
[API-H] 1 98.43 ± 0.03 C34H39N8O12+ 751.2759 751.2687 −10 614.3, 597.2, 403.2, 209.1, 195.1, 179.1, 167.0 (2 kV,
15 V, 3.0 V, 35 eV, 4.7 LM)e
A 0.53 0.10 ± 0.01 C28H36N7O9+ 614.2081 614.2574 80 597.2, 580.2, 420.2, 403.1, 264.1, 209.1, 195.1, 179.1,
167.0, 110.1, 84.1 (5 kV, 45 V, 5.0 V, 33 eV, 22 LM)e
B 0.86 0.20 ± 0.02 C25H29N6O9+ 557.1539 557.1996 82 420.2, 403.1, 349.1, 264.1, 209.1, 195.1, 179.1, 167.0,
138.0, 110.1, 84.1 (2 kV, 100 V, 2.5 V, 33 eV, 22 LM)f
C 0.90 0.03 ± 0.01 C28H33N7O9Fe+ 667.1171 667.1689 77 640.1, 614.1, 547.1, 531.1. 503.1, 486.1, 442.1, 403.1,369.1, 349.0, 319.1, 292.1, 266.1, 250.1, 248.1, 209.0,195.0, 179.0, 167.0, 155.1, 110.1 (4 kV, 55 V, 4.0 V,36 eV, 4.7 LM)e
D 1.06 0.03 ± 0.01 C34H39N8O11+ 735.2152 735.2738 79 701.1, 598.1, 581.1, 563.1, 541.1, 525.1, 458.1, 442.1,
426.1, 403.1, 387.1, 369.1, 349.1, 333.0, 266.1, 248.1,209.0, 195.0, 179.0, 167.0, 151.0, 110.1, 84.1 (3.5 kV,45 V, 4.0 V, 36 eV, 25 LM)e
E 1.13 0.08 ± 0.02 C30H38N7O11+ 672.2061 672.2629 84 640.2, 614.2, 597.2, 557.2, 535.2, 403.1, 349.1, 292.1,
195.1, 179.1, 110.1 (4 kV, 45 V, 1.0 V, 27 eV, 4.7 LM)e
F 1.20 0.04 ± 0.02 C34H38N8O11Cl+ 769.1680 769.2349 87 632.2, 615.2, 597.2, 421.1, 403.2, 367.1, 350.1, 349.1,213.0, 195.1, 179.1, 167.0, (2 kV, 15 V, 3.0 V, 25–50 eV –ramp, 4.7 LM)e
G 1.32 0.16 ± 0.02 C34H37N8Na2O12+ 795.1210 795.2326 140 781.1, 735.1, 658.1, 614.1, 598.1, 403.1, 266.1, 209.1,
195.0, 179.0, 167.0, 110.1 (2 kV, 95 V, 3.0 V, 34 eV, 4.9LM)f
H 1.34 0.31 ± 0.01 C34H38N8O11Cl+ 769.1680 769.2349 87 632.2, 614.2, 597.2, 575.2, 557.2, 487.6, 421.1, 403.1,367.1, 349.1, 292.1, 284.1, 266.1, 213.0, 195.0, 179.1,167.0 (2 kV, 95 V, 3.0 V, 34 eV, 4.9 LM)f
I 1.40 0.05 ± 0.02 C32H40N7O12+ 714.2157 714.2735 81 640.3, 579.2, 560.3, 504.2, 403.2, 382.2, 366.2, 266.2,
248.1, 195.1, 179.1, 167.0, 128.8 (3 kV, 45 V, 4.0 V,30 eV, 18 LM)e
J 1.55 0.25 ± 0.03 C34H36N8O12Fe+ 804.1772 804.1803 4 667.2, 650.2, 610.1, 596.1, 402.0, 266.1, 195.1, 179.1,167.1 (2 kV, 80 V, 3.0 V, 28 eV, 9.9 LM)f
K 1.72 0.15 ± 0.04 C41H45N8O12+ 841.3124 841.3157 4 807.2, 704.2, 687.1, 647.3, 614.1, 597.1, 493.1, 403.1,
349.1, 299.1, 285.1, 266.1, 195.0, 179.0, 167.0, 110.1(3 kV, 25 V, 4.0 V, 36 eV, 25 LM)e
L 1.88 0.02 ± 0.01 C34H35ClFeN8O11+ 822.1500 822.1464 −4.3 805.1, 789.1, 773.1, 751.1, 735.1, 636.1, 614.1, 597.1,
557.1, 442.1, 403.1, 385.1, 349.0. 266.1, 195.0, 179.0,167.0 (3 kV, 15 V, 4.0 V, 36 eV, 4.7 LM)e
M 2.37 0.06 ± 0.04 C41H42FeN8O12+ 894.2275 894.2272 −0.4 801.0, 757.4, 740.3, 700.3, 667.3, 650.3, 610.2, 559.1,
419.4, 285.2, 259.7, 195.1, 110.2 (4 kV, 25 V, 4.0 V,39 eV, 4.7 LM)e
N 2.54 0.02 ± 0.01 C41H42FeN8O12+ 894.2275 894.2272 −0.4 869.4, 828.4, 757.2, 740.2, 700.2, 667.2, 650.2, 605.9,
585.7, 560.4, 546.1, 418.4, 285.1, 195.1, 110.5 (2 kV,15 V, 3.0 V, 25–50 eV – ramp, 4.7 LM)e
O 2.89 0.07 ± 0.01 C34H34Cl2FeN8O10+ 840.1139 840.1125 −1.66 822.1, 800.1, 705.1, 646.0, 623.9, 615.4, 572.0, 430.2,
271.2, 211.5, 261.0, 211.5, 178.0, 110.5 (2 kV, 15 V,3.0 V, 15 eV, 4.7 LM)e
a Relative retention time with respect to the main API peak (Rt of 9.09 min).b %Area based on LC UV–visible chromatogram.c Composition and mass parameters are given for the charged molecular ion peaks detected by TOF-MS/MS analysis.
), ext
3p
tcspooie
3
fw
(
d Tunable MS3 parameters include: capillary voltage (kV), sample cone voltage (Ve Denotes MS2 analysis.f Denotes pseudo MS3 analysis.
.3. Impurity identification through TOF-MS/MS analysis andseudo MS3 characterization
TOF-MS/MS analysis as well as pseudo MS3 characteriza-ion of the 15 impurities observed in both LC-UV and LC–MShromatograms were carried out to elucidate their respectivetructures. Tandem MS/MS analysis of the impurity ion peaks waserformed and in all cases several dissociation products werebserved, as reported in Table 1. Pseudo MS3 analysis was carriedut for all product ions (or fragments) derived from the selectedmpurity peaks. MS tune file parameters are reported in Table 1 forach impurity.
.3.1. Identification of major impurities (>0.1%)The MS/MS fragmentation patterns and pseudo MS3 analyses
or major impurities are depicted in Fig. 3 and reported in Table 1,ith respective m/z values for the parent and fragmentation ions.
The ESI-MS/MS spectrum of impurity A observed at 4.85 minRel. Rt = 0.53) showed a molecular ion peak at m/z 614.2081. That
raction cone voltage (V), collision energy (eV), and resolution (LM).
same peak had been observed in the MS/MS fragmentation of theAPI (m/z 751.2710). The fragments observed in the MS/MS modewere identical to those obtained from the molecular ion peak ofthe parent compound (751.3 m/z). It is evident from the mass spec-trum of impurity A (Fig. 3) that formation of the fragment at them/z value of 195.1 is predominant and stable, which corresponds tothe terminal hydroxypyridinone unit linked to an alkyl fragment ofthe spermine backbone, with a molecular formula of C9H11N2O3
+.Fragmentation pattern analysis and isotopic modeling confirmedthe molecular formula of impurity A as C28H36N7O9
+, with thestructure corresponding to a partially reacted product missing aterminal hydroxypyridinone unit, as shown in Fig. 4. Formation ofthis trace impurity must have occurred during the coupling of thebenzyl-protected metal-binding units to the spermine scaffold.
The second major impurity (B) was eluted at 7.91 min (Rel.
Rt = 0.86). The ESI MS/MS spectrum of impurity B revealed a molec-ular ion peak [M+H]+ of 557.1539 m/z. Most of the fragments werepresumed to be identical to the product ion peaks of 3,4,3-LI(1,2-HOPO). These characteristic fragment ions were highly compatible
N.R. Panyala et al. / Journal of Pharmaceutical and Biomedical Analysis 100 (2014) 157–166 161
Fig. 2. (A) Magnified base peak ion (BPI) Chromatogram, (B) magnified UV chromatogram (inlet: full scale UV chromatogram), (C) time of flight mass spectrum (TOF-MS,7 3 3 m/z3
wCpu
RMipfrFcc
RAmt
51.3 m/z), (D) TOF-MS/MS analysis (751.3 m/z), and (E) TOF-MS spectrum (614.,4,3-LI(1,2-HOPO).
ith the structure displayed in Fig. 4, with a molecular formula of25H29N6O9
+. This trace impurity most likely originates with theresence of trace amounts of spermidine in the spermine reagentsed in the backbone-coupling step of the synthesis.
The ESI-MS/MS spectrum of impurity E, eluted at 10.36 min (Rel.t = 1.13), showed a molecular ion peak [M+H]+ of 672.2061 m/z.ost of the dissociation products were similar to those observed
n the fragmentation of the API 3,4,3-LI(1,2-HOPO), including theeaks at 614.3, 597.2, 403.2, 209.1, 195.1, and 179.1. The molecularormula of impurity E was confirmed as C30H38N7O11
+ using accu-ate mass measurements, with the resulting structure shown inig. 4. This impurity could also be a side product of the backbone-oupling step, due to the presence of residual amounts of oxalylhloride with the 1,2-HOPOBn acid chloride.
The ESI-MS/MS spectrum of impurity G, eluted at 11.97 min (Rel.
t = 1.32), displayed a molecular ion peak [M+H]+ of 795.1210 m/z.gain, most of the fragments obtained in the pseudo MS3 analysisode were the same as those resulting from the fragmentation ofhe main ligand [M+H]+ ion (751.3 m/z), with, the formation of the
peak from TOF-MS/MS analysis of 751.3 m/z), and (F) fragmentation patterns for
species at 195.1 m/z corresponding to the most abundant peak inthe spectra. Fragments at the m/z values of 781.1, 658.1, and 614.1are unique to this impurity. While the m/z value 614.1 seems to besimilar to the original ligand fragment at m/z of 614.3, the difference�m/z = 0.2 is significant and is consistent with a different structurecontaining two Na ions (Fig. 4). The presence of Na in this impuritywas confirmed by elemental composition analysis, consistent witha molecular formula of C34H37N8Na2O12
+. The acidity of the twofirst pKa values of 3,4,3-LI(1,2-HOPO) (3.87 and 5.01 [34]) make it anexcellent chelator for hard Lewis acids such as the actinide cations,but also a good scavenger for common ions such as Na+. Under thepurification and analysis conditions described here, the formationof sodium adducts is therefore not surprising. The four pKa valuesof 3,4,3-LI(1,2-HOPO) have never been specifically assigned to eachof the four hydroxyl groups of the 1,2-HOPO rings. Such assign-
ment could be performed through 1H nuclear magnetic resonancetitrations and may provide indications as to which 1,2-HOPO unitsbear the sodium ions. However, ion pair formation and exchangebetween the different 1,2-HOPO units may also occur in solutions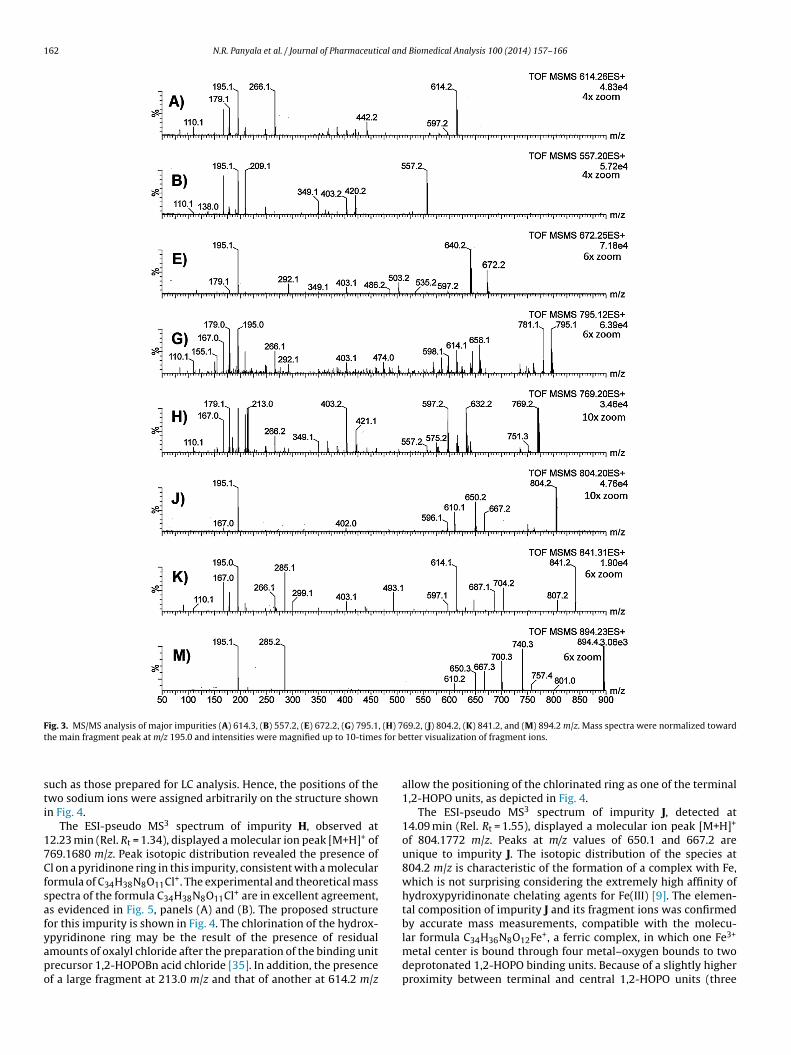
162 N.R. Panyala et al. / Journal of Pharmaceutical and Biomedical Analysis 100 (2014) 157–166
F , (H) 7t s for b
sti
17Cfsafyapo
ig. 3. MS/MS analysis of major impurities (A) 614.3, (B) 557.2, (E) 672.2, (G) 795.1he main fragment peak at m/z 195.0 and intensities were magnified up to 10-time
uch as those prepared for LC analysis. Hence, the positions of thewo sodium ions were assigned arbitrarily on the structure shownn Fig. 4.
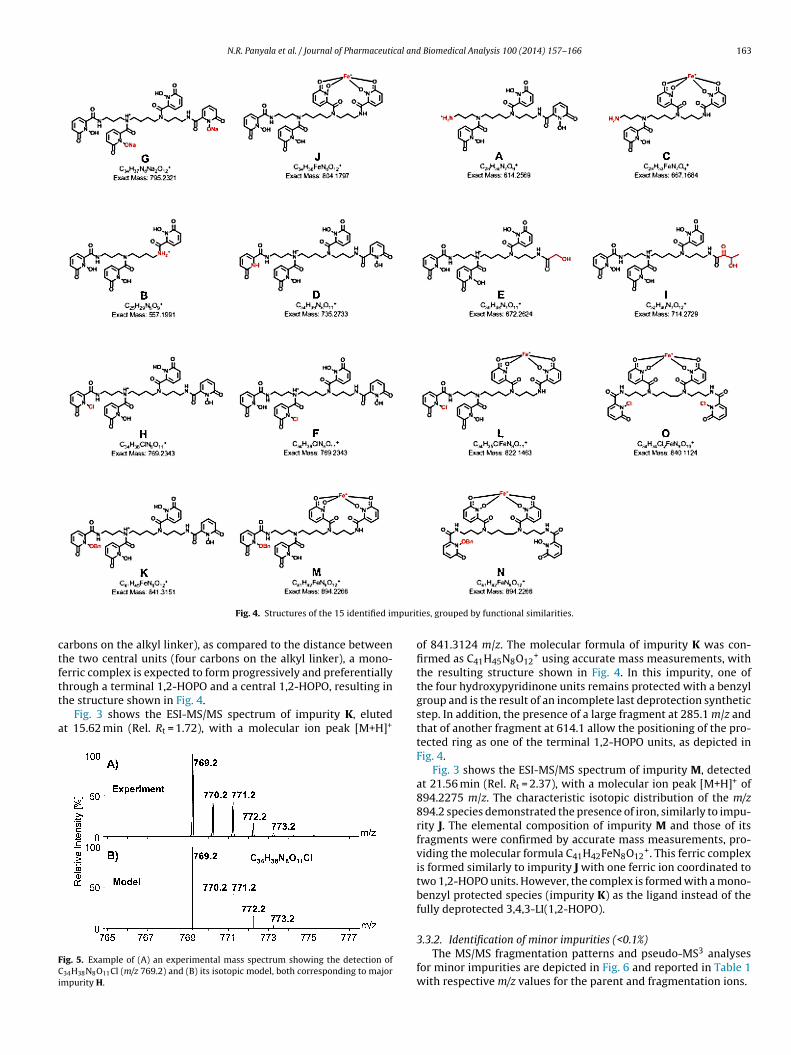
The ESI-pseudo MS3 spectrum of impurity H, observed at2.23 min (Rel. Rt = 1.34), displayed a molecular ion peak [M+H]+ of69.1680 m/z. Peak isotopic distribution revealed the presence ofl on a pyridinone ring in this impurity, consistent with a molecular
ormula of C34H38N8O11Cl+. The experimental and theoretical masspectra of the formula C34H38N8O11Cl+ are in excellent agreement,s evidenced in Fig. 5, panels (A) and (B). The proposed structureor this impurity is shown in Fig. 4. The chlorination of the hydrox-
pyridinone ring may be the result of the presence of residualmounts of oxalyl chloride after the preparation of the binding unitrecursor 1,2-HOPOBn acid chloride [35]. In addition, the presencef a large fragment at 213.0 m/z and that of another at 614.2 m/z69.2, (J) 804.2, (K) 841.2, and (M) 894.2 m/z. Mass spectra were normalized towardetter visualization of fragment ions.
allow the positioning of the chlorinated ring as one of the terminal1,2-HOPO units, as depicted in Fig. 4.
The ESI-pseudo MS3 spectrum of impurity J, detected at14.09 min (Rel. Rt = 1.55), displayed a molecular ion peak [M+H]+
of 804.1772 m/z. Peaks at m/z values of 650.1 and 667.2 areunique to impurity J. The isotopic distribution of the species at804.2 m/z is characteristic of the formation of a complex with Fe,which is not surprising considering the extremely high affinity ofhydroxypyridinonate chelating agents for Fe(III) [9]. The elemen-tal composition of impurity J and its fragment ions was confirmedby accurate mass measurements, compatible with the molecu-
lar formula C34H36N8O12Fe+, a ferric complex, in which one Fe3+metal center is bound through four metal–oxygen bounds to twodeprotonated 1,2-HOPO binding units. Because of a slightly higherproximity between terminal and central 1,2-HOPO units (three
N.R. Panyala et al. / Journal of Pharmaceutical and Biomedical Analysis 100 (2014) 157–166 163
purit
ctftt
a
FCi
Fig. 4. Structures of the 15 identified im
arbons on the alkyl linker), as compared to the distance betweenhe two central units (four carbons on the alkyl linker), a mono-erric complex is expected to form progressively and preferentially
hrough a terminal 1,2-HOPO and a central 1,2-HOPO, resulting inhe structure shown in Fig. 4.Fig. 3 shows the ESI-MS/MS spectrum of impurity K, elutedt 15.62 min (Rel. Rt = 1.72), with a molecular ion peak [M+H]+
ig. 5. Example of (A) an experimental mass spectrum showing the detection of34H38N8O11Cl (m/z 769.2) and (B) its isotopic model, both corresponding to major
mpurity H.
ies, grouped by functional similarities.
of 841.3124 m/z. The molecular formula of impurity K was con-firmed as C41H45N8O12
+ using accurate mass measurements, withthe resulting structure shown in Fig. 4. In this impurity, one ofthe four hydroxypyridinone units remains protected with a benzylgroup and is the result of an incomplete last deprotection syntheticstep. In addition, the presence of a large fragment at 285.1 m/z andthat of another fragment at 614.1 allow the positioning of the pro-tected ring as one of the terminal 1,2-HOPO units, as depicted inFig. 4.
Fig. 3 shows the ESI-MS/MS spectrum of impurity M, detectedat 21.56 min (Rel. Rt = 2.37), with a molecular ion peak [M+H]+ of894.2275 m/z. The characteristic isotopic distribution of the m/z894.2 species demonstrated the presence of iron, similarly to impu-rity J. The elemental composition of impurity M and those of itsfragments were confirmed by accurate mass measurements, pro-viding the molecular formula C41H42FeN8O12
+. This ferric complexis formed similarly to impurity J with one ferric ion coordinated totwo 1,2-HOPO units. However, the complex is formed with a mono-benzyl protected species (impurity K) as the ligand instead of thefully deprotected 3,4,3-LI(1,2-HOPO).
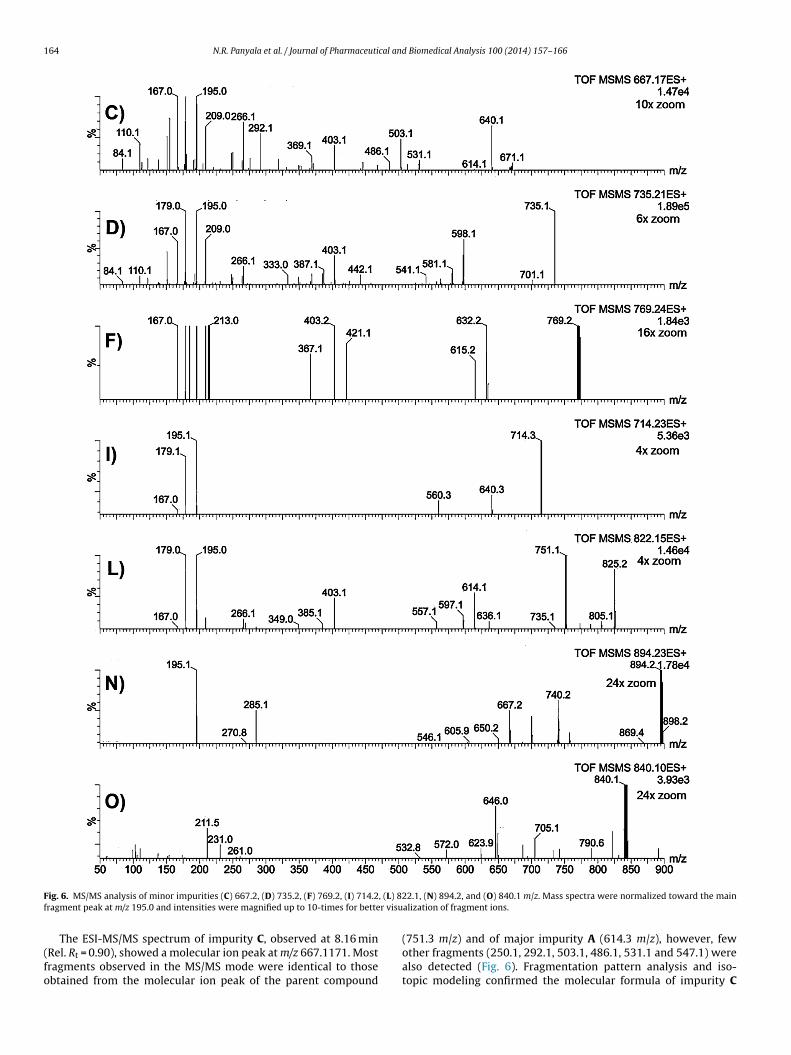
3.3.2. Identification of minor impurities (<0.1%)The MS/MS fragmentation patterns and pseudo-MS3 analyses
for minor impurities are depicted in Fig. 6 and reported in Table 1with respective m/z values for the parent and fragmentation ions.
164 N.R. Panyala et al. / Journal of Pharmaceutical and Biomedical Analysis 100 (2014) 157–166
F , (L) 8f r visu
(fo
ig. 6. MS/MS analysis of minor impurities (C) 667.2, (D) 735.2, (F) 769.2, (I) 714.2ragment peak at m/z 195.0 and intensities were magnified up to 10-times for bette
The ESI-MS/MS spectrum of impurity C, observed at 8.16 minRel. Rt = 0.90), showed a molecular ion peak at m/z 667.1171. Mostragments observed in the MS/MS mode were identical to thosebtained from the molecular ion peak of the parent compound
22.1, (N) 894.2, and (O) 840.1 m/z. Mass spectra were normalized toward the mainalization of fragment ions.
(751.3 m/z) and of major impurity A (614.3 m/z), however, fewother fragments (250.1, 292.1, 503.1, 486.1, 531.1 and 547.1) werealso detected (Fig. 6). Fragmentation pattern analysis and iso-topic modeling confirmed the molecular formula of impurity C
cal and
ac
(maorColtdd
(mHtatatfr
RMii2cwao1
a88Tmtfdwe3
(mpfttfH
a8i1smcu
[
[
[
N.R. Panyala et al. / Journal of Pharmaceuti
s C28H33N7O9Fe+, with the structure corresponding to the ironomplex of impurity A, as shown in Fig. 4.
The ESI-MS/MS spectrum of impurity D, detected at 9.60 minRel. Rt = 1.06), displayed a molecular ion peak [M+H]+ of 735.2152/z. Peaks at m/z values of 701.1, 598.1, 581.1, 563.1, 541.1, 525.1,
nd 458.1 are unique to this impurity. The elemental compositionf impurity D and its fragment ions was confirmed by accu-ate mass measurements, compatible with the molecular formula34H39N8O11
+ and a structure in which one of the 1,2-HOPO unitf the parent ligand is dehydroxylated. In addition, the presence ofarge fragments at 179.0 and 598.1 m/z allows the positioning ofhe dehydroxylated ring as one of the terminal 1,2-HOPO units, asepicted in Fig. 4. Formation of this impurity most likely occurreduring the final deprotection step.
The ESI-MS/MS spectrum of impurity F, observed at 10.96 minRel. Rt = 1.20), displayed a molecular ion peak [M+H]+ of 769.1680/z, with abundant product ions similar to those found for impurity. Fragmentation pattern analysis and isotopic modeling confirmed
he molecular formula of impurity F as C34H38N8O11Cl+, indicating structure isobaric with that of impurity H, despite a different elu-ion time. Impurities H and F are therefore structural isomers with
different positioning of the chlorinated hydropyridinone ring onhe spermine skeleton. The presence of a peak at 367.1 m/z in theragmentation pattern of impurity F indicates that the chlorinateding is linked to one of the secondary central amines (Fig. 4).
The ESI-MS/MS spectrum of impurity I, eluted at 12.65 min (Rel.t = 1.40), showed a molecular ion peak [M+H]+ of 714.2157 m/z.ost of the dissociation products were similar to those observed
n the fragmentation of all impurities in which one 1,2-HOPO rings missing or degraded, including the peaks at 640.3, 560.3, 403.2,66.2, 195.1, and 179.1. The molecular formula of impurity I wasonfirmed as C32H40N7O12
+ using accurate mass measurements,ith the resulting structure shown in Fig. 4. This impurity could be
side product of the backbone-coupling step, due to the presencef residual amounts of dimethylformamide with the deprotected,2-HOPO terminal moiety.
Fig. 6 shows the ESI-MS/MS spectrum of impurity L, detectedt 16.97 min (Rel. Rt = 1.88), with a molecular ion peak [M+H]+ of22.1500 m/z. The characteristic isotopic distribution of the m/z22.2 species demonstrated the presence of iron and chlorine.he elemental composition of impurity L and those of its frag-ents were confirmed by accurate mass measurements, providing
he molecular formula C34H35ClFeN8O11+. This ferric complex is
ormed similarly to impurities J and M with one ferric ion coor-inated to two 1,2-HOPO units. However, the complex is formedith a chlorinated species (major impurity H based on the pres-
nce of the fragment at 614.1 m/z) as the ligand instead of the intact,4,3-LI(1,2-HOPO) (Fig. 4).
The ESI-MS/MS spectrum of impurity N, observed at 22.91 minRel. Rt = 2.54), displayed a molecular ion peak [M+H]+ of 894.2275/z, with abundant product ions (Table 1 and Fig. 6). Fragmentationattern analysis and isotopic modeling confirmed the molecularormula of impurity N as C41H42FeN8O12
+, indicating a struc-ure isobaric with that of impurity M, despite a different elutionime. Impurities N and M are therefore structural isomers of theerric complex formed with a mono-benzyl protected 3,4,3-LI(1,2-OPO), as shown in Fig. 4.
Fig. 6 shows the ESI-MS/MS spectrum of impurity O, detectedt 26.05 min (Rel. Rt = 2.89), with a molecular ion peak [M+H]+ of40.1139 m/z, and abundant product ions at the m/z values reported
n Table 1. Predominant peaks included those at m/z 285.2, 195.1,79.1, and 167.1. The characteristic isotopic distribution of the main
pecies demonstrated the presence of iron and chlorine. The ele-ental composition of impurity O and those of its fragments wereonfirmed by accurate mass measurements, providing the molec-lar formula C34H34Cl2FeN8O10
+. This ferric complex is formed[
Biomedical Analysis 100 (2014) 157–166 165
similarly to other Fe-containing impurities, with one ferric ion coor-dinated to two 1,2-HOPO units. However, the complex is formedwith a species in which two hydroxypyridinone rings are chlori-nated as the ligand, instead of the intact 3,4,3-LI(1,2-HOPO). This isthe only impurity for which the peak at 195.1 m/z is absent from thefragmentation pattern, which is indicative of a lack of intact termi-nal 1,2-HOPO unit. Therefore the two chlorine atoms were assignedto each of the external hydroxypyridinone rings, as displayed inFig. 4.
4. Conclusions
Impurity profiling of the 3,4,3-LI(1,2-HOPO) ligand was car-ried out according to ICH guidelines. The liquid chromatographymethod described in the present study allows the separationof all the impurities present in the available 3,4,3-LI(1,2-HOPO)commercial batch. A total of 15 (8 major and 7 minor) impuri-ties were detected and their structure elucidation was performedusing quadrupole time of flight mass spectrometry, via MS/MS andpseudo MS3 experiments combined with accurate mass measure-ments of fragment ions and precursors. The impurity determinationmethod described here is a simple, sensitive, rapid and powerfulapproach for the identification of unknown compounds. In addi-tion, it can be used to identify trace amounts of various metabolitesand can be potentially used to analyze the impurities and degrada-tion products in more complex systems.
Acknowledgements
This work was supported by the National Institutes ofHealth/National Institute of Allergy and Infectious Diseases MedicalCountermeasures Against Radiological Threats (MCART) Con-sortium (Contract #HHSN272201000046C to the University ofMaryland School of Medicine), through the U.S. Department ofEnergy under Contract #DE-AC02-05CH11231.
References
[1] D.R. Cassatt, et al., Medical countermeasures against nuclear threats: radionu-clide decorporation agents, Radiat. Res. 170 (2008) 540–548.
[2] P.W. Durbin, S. Lauriston, Taylor Lecture: the quest for therapeutic actinidechelators, Health Phys. 95 (5) (2008) 465–492.
[3] R.J. Abergel, et al., Biomimetic actinide chelators: an update on the pre-clinical development of the orally active hydroxypyridonate decorporationagents 3,4,3-LI(1,2-HOPO) and 5-LIO(ME-3,2-HOPO), Health Phys. 99 (3) (2010)401–407, http://dx.doi.org/10.1097/HP.0b013e3181c21273.
[4] D.I. Bunin, et al., Efficacy and safety toxicology of hydroxypyridinonate actinidedecorporation agents in rodents: towards a safe and effective human dosingregimen, Radiat. Res. 179 (2013) 171–182.
[5] P.Y. Chang, et al., Analytical methods for the bioavailability evaluation ofhydroxypyridinonate actinide decorporation agents in pre-clinical pharma-cokinetic studies, J. Chromatogr. Sep. Tech. S4 (2012).
[6] E.E. Jarvis, et al., Significance of single variables in defining adequate animalmodels to assess the efficacy of new radionuclide decorporation agents: usingthe contamination dose as an example, Drug Dev. Res. 73 (2012) 281–289.
[7] B. Kullgren, et al., Actinide chelation: biodistribution and in vivo complex sta-bility of the targeted metal ions, Toxicol. Mech. Methods 21 (1) (2013) 18–26.
[8] R. Burgada, et al., Synthesis of 3,4,3-LI-1,2-HOPO labelled with 14C, J. Label.Compd. Radiopharm. 44 (2001) 13–19.
[9] R.C. Scarrow, et al., Ferric ion sequestering agents. 13. Synthesis: structures,and thermodynamics of complexation of cobalt(III) and iron(III) tris complexesof several chelating hydroxypyridinones, Inorg. Chem. 24 (6) (1985) 954–967.
10] D.L. White, et al., Specific sequestering agents for the actinides. 16. Synthe-sis and initial biological testing of polydentate oxohydroxypyridinecarboxylateligands, J. Med. Chem. 31 (1988) 11–18.
11] J. Xu, et al., Gadolinium complex of tris[(3-hydroxy-1-methyl-2-oxo-1,2-didehydropyridine-4-carboxamido)ethyl]-amine: a new class of gadoliniummagnetic resonance relaxation agents, J. Am. Chem. Soc. 117 (1995) 7245–7246.
12] J. Xu, et al., Specific sequestering agents for the actinides. 28. Synthesis and
initial evaluation of multidentate 4-carbamoyl-3-hydroxy-1-methyl-2(1H)-pyridinone ligands for in vivo plutonium(IV) chelation, J. Med. Chem. 38 (1995)2606–2614.13] U.S. Food and Drug Administration, Guidance for Industry Internal RadioactiveContamination – Development of Decorporation Agents, 2006.
1 cal an
[
[
[
[
[
[
[
[
[
[
[
[
[
[
[
[
[
[
[
[
[
10868–10870.
66 N.R. Panyala et al. / Journal of Pharmaceuti
14] U.S. Food and Drug Administration, Approval of New Drugs When Human Effi-cacy Studies Are Not Ethical or Feasible, U.S. FDA, Washington, DC, 2010.
15] J. Ermer, M. Vogel, Applications of hyphenated LC–MS techniques in pharma-ceutical analysis, Biomed. Chromatogr. 14 (6) (2000) 373–383.
16] C. Pan, J. Guan, M. Lin, A multidisciplinary approach to identify a degradationproduct in a pharmaceutical dosage form, J. Pharm. Biomed. Anal. 54 (4) (2011)855–859.
17] P.K. Basniwal, D. Jain, Simvastatin review of updates on recent trends inpharmacokinetics, pharmacodynamics, drug–drug interaction, impurities andanalytical methods, Curr. Pharm. Anal. 8 (2) (2012) 135–156.
18] International Conferences on Harmonization, Draft revised guidance on impu-rities in new drug products. Q3B(R), Fed. Regist. 65 (139) (2000) 44791–44797.
19] M. Narayanam, et al., Critical practical aspects in the application of liquidchromatography–mass spectrometric studies for the characterization of impu-rities and degradation products, J. Pharm. Biomed. Anal. (2013).
20] S. Singh, et al., A critical review on the use of modern sophisticated hyphenatedtools in the characterization of impurities and degradation products, J. Pharm.Biomed. Anal. 69 (2012) 148–173.
21] V.G. Dongre, et al., Identification and characterization of process related impuri-ties in chloroquine and hydroxychloroquine by LC/IT/MS, LC/TOF/MS and NMR,J. Pharm. Biomed. Anal. 49 (4) (2009) 873–879.
22] V.G. Dongre, et al., Isolation and structural identification of an impurity influconazole bulk drug substance, J. Pharm. Biomed. Anal. 45 (3) (2007) 422–429.
23] V.G. Dongre, et al., Characterization and quantitative determination of impuri-ties in piperaquine phosphate by HPLC and LC/MS/MS, J. Pharm. Biomed. Anal.43 (1) (2007) 186–195.
24] V.G. Dongre, et al., Investigation of amodiaquine bulk drug impurities by liquidchromatography/ion trap mass spectrometry, Rapid Commun. Mass Spectrom.
22 (14) (2008) 2227–2233.25] C. Hagman, Y.O. Tsybin, P. Hakansson, Solution-phase deuterium/hydrogenexchange at a specific residue using nozzle–skimmer and electron capture dis-sociation mass spectrometry, Rapid Commun. Mass Spectrom. 20 (4) (2006)661–665.
[
d Biomedical Analysis 100 (2014) 157–166
26] K. Hakansson, R. Zubarev, P. Hakansson, Combination of nozzle–skimmer frag-mentation and partial acid hydrolysis in electrospray ionization time-of-flightmass spectrometry of synthetic peptides, Rapid Commun. Mass Spectrom. 12(11) (1998) 705–711.
27] P. Marquet, et al., In-source CID mass spectral libraries for the general unknownscreening of drugs and toxicants, Analysis 28 (10) (2000) 925–934A.
28] Z.J. Meng, P.A. Limbach, Shotgun sequencing small oligonucleotides bynozzle–skimmer dissociation and electrospray ionization mass spectrometry,Eur. J. Mass Spectrom. 11 (2) (2005) 221–229.
29] R.D. Smith, et al., New developments in biochemical mass-spectrometry-electrospray ionization, Anal. Chem. 62 (9) (1990) 882–899.
30] H. Zhai, et al., Consecutive ion activation for top down mass spectrometry:improved protein sequencing by nozzle–skimmer dissociation, Anal. Chem. 77(18) (2005) 5777–5784.
31] L. Abrankó, J.F. García-Reyes, A. Molina-Díaz, In-source fragmentation andaccurate mass analysis of multiclass flavonoid conjugates by electrospray ion-ization time-of-flight mass spectrometry, J. Mass Spectrom. 46 (5) (2011)478–488.
32] C.A.M. Pereira, J.H. Yariwake, M. McCullagh, Distinction of the C-glycosylflavoneisomer pairs orientin/isoorientin and vitexin/isovitexin using HPLC–MS exactmass measurement and in-source CID, Phytochem. Anal. 16 (5) (2005) 295–301.
33] J. Chen, et al., A pseudo MS3 approach for identification of disulfide-bonded pro-teins: uncommon product ions and database search, J. Am. Soc. Mass Spectrom.23 (2) (2012) 225–243.
34] R.J. Abergel, et al., Using the antenna effect as a spectroscopic tool;photophysics and solution thermodynamics of the model luminescent hydrox-ypyridonate complex [EuIII(3,4,3LI(1,2-HOPO))]− , Inorg. Chem. 48 (2009)
35] F.M. Adam, et al., Development of a practical synthesis of Toll-likereceptor agonist PF-4171455: 4-amino-1-benzyl-6-trifluoromethyl-1,3-dinydroimidazo[4,5-c]pyridin-2-one, Org. Process Res. Dev. 15 (4) (2011)788–796.
Copyright © 2022 FDOKUMEN