Identification of Genes Involved in the Resistance of Mycobacteria to Killing by Macrophages
13
Identification of Genes Involved in Resistance to Interferon- in Cutaneous T-Cell Lymphoma Lorraine Tracey,* Raquel Villuendas,* Pablo Ortiz, † Ana Dopazo,* Inmaculada Spiteri,* Luis Lombardia,* Jose L. Rodrı ´guez-Peralto, ‡ Jesu ´s Ferna ´ ndez-Herrera, § Almudena Herna ´ ndez, § Javier Fraga, ‡ Orlando Dominguez,* Javier Herrero,* Miguel A. Alonso, ¶ Joaquin Dopazo,* and Miguel A. Piris* From the Centro Nacional de Investigaciones Oncolo ´gicas,* Madrid; the Departments of Dermatology † and Pathology, ‡ Hospital 12 de Octubre, Madrid; the Departments of Dermatology § and Pathology, ‡ Hospital de la Princesa, Madrid; and the Centro de Biologı ´a Molecular, ¶ Cantoblanco, Madrid, Spain Interferon- therapy has been shown to be active in the treatment of mycosis fungoides although the in- dividual response to this therapy is unpredictable and dependent on essentially unknown factors. In an ef- fort to better understand the molecular mechanisms of interferon- resistance we have developed an in- terferon- resistant variant from a sensitive cutane- ous T-cell lymphoma cell line. We have performed expression analysis to detect genes differentially ex- pressed between both variants using a cDNA microar- ray including 6386 cancer-implicated genes. The ex- periments showed that resistance to interferon- is consistently associated with changes in the expres- sion of a set of 39 genes, involved in signal transduc- tion , apoptosis , transcription regulation , and cell growth. Additional studies performed confirm that STAT1 and STAT3 expression and interferon- induc- tion and activation are not altered between both vari- ants. The gene MAL , highly overexpressed by resis- tant cells, was also found to be expressed by tumoral cells in a series of cutaneous T-cell lymphoma pa- tients treated with interferon- and/or photochemo- therapy. MAL expression was associated with longer time to complete remission. Time-course experi- ments of the sensitive and resistant cells showed a differential expression of a subset of genes involved in interferon-response (1 to 4 hours) , cell growth and apoptosis (24 to 48 hours.) , and signal transduction. (Am J Pathol 2002, 161:1825–1837) Interferons (IFNs) are members of the cytokine family of proteins with pleiotrophic cellular effects, such as anti- proliferative, proapoptotic, and immunomodulatory ef- fects in addition to possessing anti-viral and anti-tumoral properties. 1 Although the basic pathway through which IFNs act is only partially understood, there is an increas- ing flow of data concerning IFN targets. Thus IFN- binds to its cognate receptor on the surface of cells, mainly lymphocytes, monocytes, and some neoplastic cells, 2 thereby initiating a signal cascade involving the JAK/ STAT signaling pathway. 3 The JAK proteins are members of a family of tyrosine kinases, able to phosphorylate and thereby activate members of the STAT family of transcrip- tion factors. These phosphorylated STAT proteins trans- locate to the nucleus where they activate the transcription of a set of IFN-stimulated genes by binding to IFN-re- sponse elements in the DNA. 4 Apoptosis and growth inhibition are disparate re- sponses of cells to IFN- and the sensitivity toward these phenomena may vary independently between different cell types. 5 Some of the recognized IFN- targets that explain its anti-tumoral role are hTERT, 6 bcl2, 7 c-MYC, 8 and other cell-cycle regulators such as p15, p21, and p27. 9 IFN- is commonly used in the treatment of a variety of neoplasms including mycosis fungoides (MF), chronic myeloid leukemia, multiple myeloma, and malignant mel- anoma although the individual response to this therapy is essentially unpredictable. Despite the favorable effect in a large proportion of patients, a significant group of pa- tients show initial or acquired resistance to this therapy. Although alterations in some of the IFN- response genes, such as well-known members of the JAK/STAT signaling pathway, (STAT1, STAT3, SOCS1, or IFNR) have been claimed to play a role in IFN- resistance, 10 –14 this has not been able to explain the frequent clinical phe- nomenon of IFN- resistance. Here we have focused on mechanisms of resistance to IFN- in MF, the most frequent type of cutaneous T-cell lymphoma (CTCL), a relatively frequent type of T-cell lymphoma in which IFN- is commonly used as a first-line treatment. CTCLs comprise a heterogeneous group of neoplasms characterized by an accumulation of malig- nant T lymphocytes in skin and occasionally, as in Sezary syndrome, in skin and blood. 15 Because acquisition of Supported by the Ministerio de Ciencia y Tecnologı ´a (grants 1FD97-0431, BIO2000-0275-C02/01 and/02) and the Centro Nacional de Investigacio- nes Oncolo ´gicas (to L. T. and J. H.). Accepted for publication August 7, 2002. Address reprint requests to Dr. Miguel A. Piris, Programa de Patologı ´a Molecular, Centro Nacional de Investigaciones Oncolo ´ gicas, Melchor Ferna ´ ndez Almagro, 3, Madrid 28029 Spain. E-mail: [email protected]. American Journal of Pathology, Vol. 161, No. 5, November 2002 Copyright © American Society for Investigative Pathology 1825
-
Upload
independent -
Category
Documents
-
view
2 -
download
0
Transcript of Identification of Genes Involved in the Resistance of Mycobacteria to Killing by Macrophages

Identification of Genes Involved in Resistance toInterferon-� in Cutaneous T-Cell Lymphoma
Lorraine Tracey,* Raquel Villuendas,*Pablo Ortiz,† Ana Dopazo,* Inmaculada Spiteri,*Luis Lombardia,* Jose L. Rodrıguez-Peralto,‡Jesus Fernandez-Herrera,§Almudena Hernandez,§ Javier Fraga,‡Orlando Dominguez,* Javier Herrero,*Miguel A. Alonso,¶ Joaquin Dopazo,* andMiguel A. Piris*From the Centro Nacional de Investigaciones Oncologicas,*
Madrid; the Departments of Dermatology † and Pathology,‡
Hospital 12 de Octubre, Madrid; the Departments of
Dermatology § and Pathology,‡ Hospital de la Princesa, Madrid;
and the Centro de Biologıa Molecular,¶ Cantoblanco,
Madrid, Spain
Interferon-� therapy has been shown to be active inthe treatment of mycosis fungoides although the in-dividual response to this therapy is unpredictable anddependent on essentially unknown factors. In an ef-fort to better understand the molecular mechanismsof interferon-� resistance we have developed an in-terferon-� resistant variant from a sensitive cutane-ous T-cell lymphoma cell line. We have performedexpression analysis to detect genes differentially ex-pressed between both variants using a cDNA microar-ray including 6386 cancer-implicated genes. The ex-periments showed that resistance to interferon-� isconsistently associated with changes in the expres-sion of a set of 39 genes, involved in signal transduc-tion, apoptosis, transcription regulation, and cellgrowth. Additional studies performed confirm thatSTAT1 and STAT3 expression and interferon-� induc-tion and activation are not altered between both vari-ants. The gene MAL , highly overexpressed by resis-tant cells, was also found to be expressed by tumoralcells in a series of cutaneous T-cell lymphoma pa-tients treated with interferon-� and/or photochemo-therapy. MAL expression was associated with longertime to complete remission. Time-course experi-ments of the sensitive and resistant cells showed adifferential expression of a subset of genes involvedin interferon-response (1 to 4 hours), cell growth andapoptosis (24 to 48 hours.), and signal transduction.(Am J Pathol 2002, 161:1825–1837)
Interferons (IFNs) are members of the cytokine family ofproteins with pleiotrophic cellular effects, such as anti-
proliferative, proapoptotic, and immunomodulatory ef-fects in addition to possessing anti-viral and anti-tumoralproperties.1 Although the basic pathway through whichIFNs act is only partially understood, there is an increas-ing flow of data concerning IFN targets. Thus IFN-� bindsto its cognate receptor on the surface of cells, mainlylymphocytes, monocytes, and some neoplastic cells,2
thereby initiating a signal cascade involving the JAK/STAT signaling pathway.3 The JAK proteins are membersof a family of tyrosine kinases, able to phosphorylate andthereby activate members of the STAT family of transcrip-tion factors. These phosphorylated STAT proteins trans-locate to the nucleus where they activate the transcriptionof a set of IFN-stimulated genes by binding to IFN-re-sponse elements in the DNA.4
Apoptosis and growth inhibition are disparate re-sponses of cells to IFN-� and the sensitivity toward thesephenomena may vary independently between differentcell types.5 Some of the recognized IFN-� targets thatexplain its anti-tumoral role are hTERT,6 bcl2,7 c-MYC,8 andother cell-cycle regulators such as p15, p21, and p27.9
IFN-� is commonly used in the treatment of a variety ofneoplasms including mycosis fungoides (MF), chronicmyeloid leukemia, multiple myeloma, and malignant mel-anoma although the individual response to this therapy isessentially unpredictable. Despite the favorable effect ina large proportion of patients, a significant group of pa-tients show initial or acquired resistance to this therapy.Although alterations in some of the IFN-� responsegenes, such as well-known members of the JAK/STATsignaling pathway, (STAT1, STAT3, SOCS1, or IFNR) havebeen claimed to play a role in IFN-� resistance,10–14 thishas not been able to explain the frequent clinical phe-nomenon of IFN-� resistance.
Here we have focused on mechanisms of resistance toIFN-� in MF, the most frequent type of cutaneous T-celllymphoma (CTCL), a relatively frequent type of T-celllymphoma in which IFN-� is commonly used as a first-linetreatment. CTCLs comprise a heterogeneous group ofneoplasms characterized by an accumulation of malig-nant T lymphocytes in skin and occasionally, as in Sezarysyndrome, in skin and blood.15 Because acquisition of
Supported by the Ministerio de Ciencia y Tecnologıa (grants 1FD97-0431,BIO2000-0275-C02/01 and/02) and the Centro Nacional de Investigacio-nes Oncologicas (to L. T. and J. H.).
Accepted for publication August 7, 2002.
Address reprint requests to Dr. Miguel A. Piris, Programa de PatologıaMolecular, Centro Nacional de Investigaciones Oncologicas, MelchorFernandez Almagro, 3, Madrid 28029 Spain. E-mail: [email protected].
American Journal of Pathology, Vol. 161, No. 5, November 2002
Copyright © American Society for Investigative Pathology
1825

clinical resistance to IFN-� is commonly observed inCTCL, it would be of great interest to determine themechanism of clinical resistance to IFN-� at a molecularlevel, leading to development of tailored treatment strat-egies or alternative therapies.
As IFN-� exerts its action through different cell path-ways involving a large number of genes and there maybe cross-talk with other signal transduction pathways, wehypothesized that only a system of massive molecularanalysis, such as cDNA microarray analysis, could allowthe identification of a significant proportion of the geneseventually involved in IFN-� resistance, giving informa-tion about the diversity of the cell pathways involved.
cDNA microarrays are a powerful technique that allowthe analysis of the expression of thousands of genessimultaneously. Gene expression is visualized by excitingfluorescein-labeled hybridized samples using a laser. Adigital image of the array is captured using a confocalscanning laser microscope.16 The raw data collected is amonochrome image, which is subsequently converted tonumerical matrices, allowing analysis to be performedusing bioinformatical techniques. Comparison of fluores-cence intensities using microarrays is quite a robustmethod and correlates well to other methods used toquantify gene expression such as Northern blot hybrid-ization and quantitative reverse transcriptase-polymer-ase chain reaction (PCR).17,18
These cDNA microarrays have been used for monitor-ing the expression profile in CTCL cells selected forresistance to IFN-�. To confirm the results obtained, wehave used quantitative PCR for the most relevant genes.Interestingly, this strategy has pinpointed to the existenceof changes in the expression of a selected group ofgenes involved in signal transduction and apoptosis reg-ulation. Time-course experiments to monitor differencesin IFN-� response have confirmed that resistance ap-pears to be caused by deregulation of cell-cycle control,apoptosis, and signal transduction.
Materials and Methods
Tumor Cell Lines
huT78 cells were obtained from the American Type Cul-ture Collection (Rockville, MD). Cells were maintained inRPMI 1640 medium (Sigma Chemical Co., St. Louis, MO)supplemented with 20% fetal bovine serum (SigmaChemical Co.), 2 mmol/L L-glutamine (Life Technologies,Inc., Grand Island, NY), 50 mg/ml penicillin (Life Tech-nologies, Inc.), 50 mg/ml streptomycin (Life Technolo-gies, Inc.), and 2.5 �g/ml fungizone (Life Technologies,Inc.) and grown at 37°C in a humidified atmosphere and5% CO2.
The sensitivity to IFN-� was tested by culturing thecells for 72 hours to 96 hours in medium containingbetween 0 U/ml of IFN-� 2A (Hoffman La Roche, Nutley,NJ) and 1,000,000 U/ml of IFN-�. Cell viability was deter-mined every 24 hours by trypan blue exclusion. Theresistant variant of the huT78 cell line was obtained byculturing the cells in an increasing concentration of IFN-�
2A beginning with 100 U/ml and increasing to 200,000U/ml loosely following a previously described protocol.13
Cells were passaged once per week and viability deter-mined by trypan blue exclusion. Resistant cells wereretested after 1 month in the absence of treatment toensure culture was nonrevertant.
For quantitative PCR studies huT78R and huT78S cellswere stimulated with IFN-� (5000 U/ml) for 3 and 24 hoursand the cells were collected along with pretreatment cellsfor RNA extraction. Time-course experiments were per-formed with the cell lines huT78R and huT78S. Cells weretreated with 5000 U/ml of IFN-� and cells were collectedbefore treatment and at time points 1 hour, 4 hours, 24hours, and 48 hours after commencement of treatment.
Case Selection
A group of 20 samples from MF patients was selectedfrom the medical records of the 12 de Octubre Hospitaland the La Princesa Hospital, Madrid Spain [tissue sam-ples were provided by the National Tumor Bank (CNIO),with the collaboration of the hospitals]. Diagnosis wasbased on generally accepted clinical-pathological crite-ria. Patients were included in a randomized clinical trial tocompare the efficacy of combination psoralen and ultra-violet (UVA) irradiation (PUVA) versus PUVA � IFN-� in agroup of stage Ia, Ib, or IIa MF patients. Ten patients werereceiving PUVA alone and 10 patients were under PUVA� IFN-� treatment (9 �, three times a week). Informedconsent was obtained from the patients enrolled underthe supervision of the local Ethical Committees.
RNA Isolation
Total RNA extraction was performed using the RNeasy kit(Qiagen Inc., Valencia, CA) and digested with RNase-free DNase I following the manufacturer’s instructions.
Quantitative PCR
The huT78R and huT78S cells were stimulated with IFN-�for 3 and 24 hours and the cells were collected along withpretreatment cells for RNA extraction for testing the levelsof STAT1 and STAT3 mRNA expression. cDNA for use inquantitative PCR studies was synthesized using AMVreverse transcriptase (Access RT-PCR System; Pro-mega, Madison, WI) and random hexamer primers (Pro-mega). One �g of total RNA was transcribed. Primersand probes for quantitative PCR were designed usingPrimer express (Applied Biosystems, Foster City, CA)following whenever possible, the universal conditions ofprimer design recommended. In addition the probeswere designed so that genomic DNA would not be de-tected during the PCR. Primers were synthesized byApplied Biosystems and/or Life Technologies, Inc. and allprobes were synthesized by Applied Biosystems. Probeswere labeled at the 5� end with a reporter dye FAM(6-carboxy-fluorescein) and at the 3� end with a quencherdye TAMRA (6-carboxy-tetramethylrhodamine). The se-
1826 Tracey et alAJP November 2002, Vol. 161, No. 5

quences of primers and probes used for these studiesare shown in Table 1.
In all cases a standard curve containing at least threeconcentrations (represented in duplicate or triplicate) of acontrol cDNA was constructed for both the endogenouscontrol gene (GAPDH) and the gene of interest. In allcases standard curves had a coefficient of correlation�0.98. In each case all samples were represented induplicate or triplicate for calculations.
For STAT1 and MAL 600 nmol/L of primers and probewere used. STAT3, BAG3, and SAMSN1 PCR reactionswere performed using 200 nmol/L of primers and probeand 300 nmol/L of primers were used for all remaininggenes. GAPDH PCR was performed using 20� pre-de-veloped assay reagents (PDAR) primers and probe forGAPDH (Applied Biosystems). All PCRs were performedunder the same conditions using the ABI prism 7700(Applied Biosystems) and analysis and normalization ofresults were performed using the sequence detector soft-ware (Applied Biosystems). Principles of real time PCRhave been described elsewhere.19 The quantitative PCRcontrol gene GAPDH was chosen based on initial exper-iments with three cell lines (huT78, EM2, Hs.895T) thatwere tested with GAPDH before and 24 hours after treat-ment with IFN-�. No significant changes were seen in anycase. Of three endogenous control genes tested (cyclo-philin, GAPDH, and 18S rRNA) GAPDH showed the low-est variability between samples and between treatmentstates (data not shown).
Construction and Analysis of cDNA Microarray
For all microarray studies the CNIO OncoChip was used.The CNIO OncoChip is a cDNA microarray that has beenspecially designed for looking at genes involved in can-cer and includes a core of 2489 cancer-relevant genes inaddition to genes involved in drug-response, tissue-spe-
cific genes, and control genes. There are a total of 6386genes represented by 7237 clones. Human cDNA cloneswere purchased from Research Genetics (Huntsville,AL). The set consists of 7237 sequence validatedI.M.A.G.E. clones, including 5253 clones representingknown genes and the remaining 1984 clones represent-ing expressed sequence tags (ESTs). Time-course ex-periments were performed using an extended version ofthe CNIO OncoChip in which cancer-related clones (n �2489) were printed twice. The list of genes on the arraycan be found at: http://bioinfo.cnio.es/data/oncochip.
Microarray Fabrication
In brief, individual IMAGE clones were grown in 96-wellplates at 37°C for 6 hours. The bacterial culture was usedfor PCR amplification and the products were purified.PCR amplification products were verified by agarose gelelectrophoresis. c-DNAs were printed onto chemicallyactivated glass slides (CMT-GAPS: Corning, Corning,NY) using the spotter Multigrid II (BioRobotics, Woburn,MA). After printing, the slides were stored in the dark atroom temperature.
Target Preparation
T-7-based RNA amplifications and preparations ofcDNA probes were performed as described previous-ly.20,21 Briefly, 5 �g of total RNA were converted to dou-ble-stranded cDNA using the superscript choice system(Life Technologies) using oligo-dT primer containing a T7RNA polymerase promoter. The double-stranded cDNAwas cleaned up, and T7 in vitro transcription was per-formed using Ampliscribe T7 in vitro transcription kit (Epi-centre Technologies, Madison, WI) or Megascript T7 invitro transcription kit (Ambion, Austin, TX) following the
Table 1. Primers and Probes Used for Quantitative PCR Studies
Primer name Accession number Location Primer sequence Product size
A: Primer and probe sets used for quantitative PCR using Taqman probesSTAT1-F XM_010893 722 5�-GCTGCGGTTCAGTGAGAGCT-3�STAT1-R 886 5�-GCCATGACTTTGTAATTGCGAAT-3�STAT1-P 784 5�-AGAACGGAGGCGAACCTGACTTCCA-3� 165 bpSTAT3-F NM_003150 2311 5�-CCTGAAGCTGACCCAGGTAGC-3�STAT3-R 2458 5�-CACCTTCACCATTATTTCCAAACTG-3�STAT3-P 2630 5�-TCTGTGTGACACCAACGACCTGCAGC-3� 148 bpMAL-F NM_002371 92 5�-CCTGCCCAGTGGCTTCTC-3�MAL-R 191 5�-GGAGGAGGCCACCAGGAT-3�MAL-P 126 5�-CCCGACTTGCTCTTCATCTTTGAGTTTAT-3� 100 bpBAG3-F XM_055575 1969 5�-ACAGCAGCAGCGACTTCAAA-3�BAG3-R 2072 5�-ACACATCGGTTCCGAGTCTGA-3�BAG3-P 2017 5�-AACCCAGCAGCACCGTAGCCTCTG-3� 104 bpSAMSN1-F XM_012974 443 5�-AAAGCCAGTGACTCCATGGATAGT-3�SAMSN1-R 541 5�-TCGAAAGCTGTCCCGGTT-3�SAMSN1-P 475 5�-CTTGTTATGCCACTTGATGAGCTCTGTCCA-3� 99 bp
B: Primer pairs used for gene expression studies using SYBR greenCAV1-F NM_001753 431 5�-GGTCAACCGCGACCCTAA-3�CAV1-R 512 5�-TGTCCCTTCTGGTTCTGCAA-3� 82 bpTNFSF7-F NM_001252 293 5�-TGCCGCTCGAGTCACTTG-3�TNFSF7-R 418 5�-CTGGTCCATGCAGGAAGGA-3� 126 bpP2Y5-F AF000546 401 5�-CTACCCATTTAAGTCAAAGACTCTAAGAACC-3�P2Y5-R 548 5�-GCAGGCTTCTGAGGCATTGTT-3� 148 bp
Genes Implicated in IFN Resistance 1827AJP November 2002, Vol. 161, No. 5

manufacturers’ instructions. Fluorescent first-strandcDNA was made with 5 �g of amplified RNA in thepresence of 50 �mol/L of Cy5-dCTP or Cy3-dCTP (Am-ersham, Uppsala, Sweden), random hexamers (Pro-mega), DTT, RNAsin, unlabeled dNTP (25 nmol of dCTP,dATP, and dGTP and 5 nmol of dDTP), Amp syntheticRNA (spiked cDNA synthesis control), and superscriptreverse transcriptase.22 Ten �g of Cot1 human DNA (LifeTechnologies, Inc.) was added to the labeled probe. Themicroarray slides were denaturalized by placing in boil-ing water for 3 minutes. Slides were incubated in a buffercontaining 4� standard saline citrate, 1� bovine serumalbumin, 2 �g/ml DNAs, and 0.1% sodium dodecyl sul-fate for 45 minutes at 65°C followed by washing withwater and filtered using a 45-�m filter. The probe wasadded to a solution containing 50% formamide, 20�standard saline citrate and 10% sodium dodecyl sulfateand incubated at 100°C for 3 minutes followed by 20minutes at 42°C before applying to the microarray slide.Hybridization was performed at 42°C for 15 hours. Slideswere scanned for Cy3 and Cy5 fluorescence usingScanarray 5000 XL (GSI Lumonics Kanata, Ontario, Can-ada) and quantified using the Quantarray software (GSILumonics) and/or GenePix Pro 4.0 software (Axon Instru-ments Inc., Union City, CA). The huT78S versus huT78Rhybridizations were performed in duplicate using differ-ent target preparations. For the time-course experimentseach sample (Cy5) was analyzed using the cDNA mi-croarray CNIO OncoChip using the untreated cells as acontrol (Cy3).
Data Analysis
Fluorescence intensity measurements from each arrayelement were compared with local background andbackground subtraction was performed. To normalize thedata, the Cy3/Cy5 ratio was adjusted to a normalizedfactor equal to the median ratio value of all spots in thearray. In addition, spots with background-subtracted sig-nal intensities lower than 500 fluorescence units (sum ofthe two channels) were excluded from the analysis. Fur-thermore, bad spots or areas of the array with obviousdefects were manually flagged. The Cy3:Cy5 ratios of theduplicated spots of the array were averaged. Genes weredeemed to be up-regulated or down-regulated if the dif-ference ratio was at least twofold.
For the time-course experiments, genes whose ex-pression change was not significant (twofold) in at leastone of the four time points were discarded from analysis.Analysis of the genes was divided into two subgroupswith 1 and 4 hours being considered as early responsegenes, and 24 and 48 hours considered as late responsegenes. Within each category genes whose expressionwas not significantly different (twofold) between huT78Sand huT78R at one or both time points were also dis-carded from analysis. For clustering analysis all ESTs andgenes with unknown function were excluded. To classifythe temporal profiles of gene expression cluster analysis
was performed using the Cluster program SOTA (http://bioinfo.cnio.es/cgi-bin/tools/clustering/sotarray) based onEuclidean distances between genes. Biological functionswere assigned by using the GENECARDS database23
(http://bioinformatics.weizmann.ac.il/cards). Additionallyeach time point was considered individually. In this casegenes whose expression was not significant (twofold) ineither huT78S or huT78R for each time point were dis-carded from analysis. Genes for which the difference inexpression was significantly different between huT78Sand huT78R were retained. ESTs and hypothetical pro-teins were discarded. The raw data can be found in thesupplementary information at http://bioinfo.cnio.es/data/interferon�resistance/.
Immunohistochemistry
Cell cytospins from sensitive and resistant huT78 cellswere collected and fixed for 5 minutes using acetone.Immunohistochemistry assays were performed in the Im-munohistochemistry Unit (CNIO) on the cell line cytospinpreparations using monoclonal STAT1 and STAT3 anti-bodies (Santa Cruz, San Francisco, CA). Immunohisto-chemical techniques were also performed on paraffin-embedded tissue sections taken from the 20 patientsincluded in the clinical trial before the start of the treat-ment using MAL antibody.24
A heat-induced epitope retrieval step was performedin a solution of sodium citrate buffer with 0.01 mol/L oftri-sodium citrate solution, and heated for 2 minutes in aconventional pressure cooker. After heating, slides wererinsed in cool running water for 5 minutes. They were thenquickly washed in Tris-buffered saline, pH 7.4, and incu-bated with mouse monoclonal IgG1 antibodies: STAT1(C-136), STAT3 (F-2) (Santa Cruz), and MAL antibody,diluted 1:50, 1:500, and 1:250, respectively. After incu-bation with the primary antibody, immunodetection wasperformed with biotinylated anti-mouse Ig, followed byperoxidase-labeled streptavidin-biotin (LSAB-DAKO,Glostrup, Denmark) with diaminobenzidine chromogenas substrate. All immunostaining was performed usingthe TechMate 500 (DAKO) automatic immunostaining de-vice. Incubations omitting the specific antibody, includ-ing incubation including unrelated antibodies, were usedas a control of the technique.
Clinical Data and Statistical Analysis
Rapid response is defined as complete remission within16 weeks of treatment commencement whereas patientswhose time to complete remission is longer than 16weeks are considered to have a slow response. Sixteenweeks was the mean and the median of the time neces-sary to induce complete remission. The Fisher’s exacttest was used to analyze the relationship between clinicaloutcome (rapid response or slow response) and MALexpression.
1828 Tracey et alAJP November 2002, Vol. 161, No. 5

Results
Production of IFN-� Resistant huT78 Cell Line
huT78 is a cell line derived originally from a MF patient.25
To test for sensitivity to IFN-�, cells were cultured forbetween 72 and 96 hours in medium containing between0 U/ml of IFN-�-2a (Hoffman La Roche) and 1,000,000U/ml IFN-� (Figure 1A). The IC50 (the concentration ofIFN-� required for 50% growth inhibition in 4 days) ofhuT78S cells was determined to be between 100 U/mland 1000 U/ml.
With the purpose of producing a resistant variant of thehuT78 cell line, the cells were cultured in an increasingconcentration of IFN-�, beginning with 100 U/ml andincreasing to 200,000 U/ml IFN-�, following a previouslydescribed protocol.13 Cells were passaged once perweek and viability determined by trypan blue exclusion.Resistant cells were retested after 1 month in the ab-sence of treatment to ensure culture was nonrevertant(Figure 1B).
This resistant cell line is characterized by high levels ofproliferation even in the presence of elevated IFN-� lev-els. In fact, cell proliferation is increased in the presenceof IFN-�. This resistant cell culture was used as a modelsystem for the study of IFN-� resistance.
IFN-� Induces STAT1 and Activates STAT1 andSTAT3 in Both the Resistant and SensitivehuT78 Cell Lines
Expression of STAT1 and STAT3 were studied in thesensitive parental huT78S line and its resistant huT78Rpartner. In both cell lines STAT1 mRNA expression showsa rapid and dramatic increase after 3 and 24 hours oftreatment with 5000 U/ml of IFN-�, with the basal level ofexpression being similar between both cell lines (Figure2, A and B). STAT3 mRNA was also measured in thesame cell lines using cells without treatment and cellsharvested at 3 and 24 hours after treatment with 5000U/ml of IFN-�. The basal level of STAT3 is much moresimilar between sensitive and resistant cells (Figure 2A).However in response to treatment with IFN-�, sensitivecells show some up-regulation of STAT3 shortly aftertreatment (3 hours). This observed increase is borderingon significance showing slightly less than a twofold in-crease in expression. This IFN-�-dependent induction ofSTAT3 is not observed in the resistant variant (Figure 2C).
To determine whether IFN-� induces activation ofSTAT1 and STAT3 in resistant and sensitive huT78 cellsafter treatment with 5000 U/ml IFN-� at 0, 3, and 24 hours,immunohistochemistry studies were performed to detectthe nuclear translocation associated with STAT activa-tion. STAT1 and STAT3 proteins were observed in thecytoplasm before treatment, moving to the nucleus after 3hours, and more dramatically after 24 hours of treatment.The nuclear localization of both proteins was observed inboth sensitive and resistant cell lines and there were noobvious differences between the huT78S and huT78Rpatterns (Figure 3).
Genes Differentially Expressed in huT78R andhuT78S
To identify genes that may be of interest in contributing toIFN-� resistance, c-DNA microarray studies were per-
Figure 1. Comparison of the IFN-� sensitivity of huT78S and huT78R. A: Theparental huT78 (huT78S) was tested for its sensitivity to IFN-� by culturingcells throughout 96 hours in concentrations of between 0 U/ml IFN-� and1,000,000 U/ml IFN-�. The viability of cells was determined every 24 hoursby trypan blue exclusion. These cells are sensitive to IFN-� at concentrationsas low as 100 U/ml. The IC50 for this cell line at 96 hours was calculated tobe between 100 U/ml and 1000 U/ml. B: The huT78R cell line produced wastested for its IFN-� sensitivity after 1 month of growth in the absence ofIFN-�. As can be seen above this variant strain is extremely resistant to IFN-�even at concentrations of IFN-� of 1,000,000 U/ml.
Genes Implicated in IFN Resistance 1829AJP November 2002, Vol. 161, No. 5

formed to compare the resistant and sensitive strains.Total RNA was extracted from 3 million cells in each case,amplified by T7 in vitro transcription, labeled with Cy3(huT78S) or Cy5 (huT78R), and hybridized simulta-neously to the CNIO OncoChip v.1 microarray to com-pare expression levels of 6386 genes between sensitiveand resistant strains. The hybridization was performed induplicate using RNAs extracted and amplified indepen-dently to ensure result reproducibility. Taking into ac-count the results of both experiments, a total of 39 geneswere found to be consistently and significantly changed inexpression level between the two samples. Of the 39 geneswhose expression was found to be changed, the resistantcells overexpress 6 genes while the other 33 genes arerepressed. These genes can be seen in Table 2. The rawdata can be found in the supplementary information athttp://bioinfo.cnio.es/data/interferon_resistance/.
Validation of Microarray Results
To confirm the differential expression observed in thecDNA microarray analysis, quantitative PCR was per-formed. In the case of five genes (MAL, BAG3, SAMSN1,STAT1, and STAT3), TaqMan probes were used andSYBR green was used in the case of three further genes(CAV1, TNFSF7, and P2Y5). The primers and probesused are shown in Table 1. As shown in Figure 4 thechanges in gene expression detected were similar usingboth techniques and although in some cases there is aslight difference between results, these differences arenot significant in any case.
Expression of MAL Protein in Patient Samples:Correlation with Clinical Data
MAL protein expression was analyzed in the samples of20 patient treated with PUVA and/or IFN-� and variabilityin expression was observed (Figure 5 and Table 3). Therelationship between MAL expression and the responseto therapy was examined using the Fisher test (Table 3).Of the 10 patients that achieved complete remissionwithin 16 weeks of treatment (rapid response), 70% donot express the MAL protein whereas 80% of the 10patients who showed a slow response do express MALprotein. The association between MAL expression andabsence of complete remission within 16 weeks wassignificant (Fisher’s exact test, P � 0.03) (Table 3A).
Taking into consideration exclusively the 10 patientstreated with IFN-� � PUVA, 6 of them presented rapidresponse and the remaining, slow response. Among therapid response patients, only 1 of 6 expressed MALprotein. All four patients with slow response were MAL-positive. Fisher’s test showed a statistically significantdifference (P � 0.04) (Table 3B).
Time-Course Experiments
A time-course experiment has been performed to identifygenes expressed after IFN-� treatment in IFN-�-resistant
Figure 2. Basal expression of STAT1 and STAT3 in huT78S and huT78R andthe changes induced in the expression of these genes by IFN-� (5000 U/ml)after 3 and 24 hours. A: Quantitative PCR results showing that the basal levelsof STAT1 and STAT3 are not significantly different between huT78S andhuT78R variants. B: Cells from huT78S and huT78R were harvested beforecommencement of treatment and 3 and 24 hours after commencement oftreatment of the cultures with 5000 U/ml IFN-�. Quantitative PCR for STAT1showed a rapid and significant increase in STAT1 mRNA levels in the case ofboth huT78S and huT78R. C: STAT3 was also studied under the sameconditions. In the case of huT78S there is a slight up-regulation of STAT3 inresponse to IFN-�. There is no significant change in expression observed inthe huT78R variant.
1830 Tracey et alAJP November 2002, Vol. 161, No. 5

and -sensitive cells using the CNIO OncoChip v.1.1. De-tails of the genes co-ordinately up- or down-regulated byIFN at the various times can be found in the supplemen-tary information at http://bioinfo.cnio.es/data/interferon_resistance/. Results have been analyzed at 1 and 4 hours(early times) and 24 and 48 hours (late times). The SOTAcluster program organized the differentially regulatedgenes into four main clusters in each case (Figure 6).Forty-nine early response genes differentially expressedhave been identified, including mainly genes involved insignal transduction, drug metabolism, and cell-cyclecontrol (Table 4). Fifty-one late response differentiallyexpressed genes have been observed, mainly com-posed by genes involved in cell growth and mainte-nance, signal transduction, transcription regulation, cellcycle, and apoptosis (Table 4).
Additionally we have performed analysis of each timepoint on an individual basis comparing genes differen-tially expressed after IFN treatment between huT78S andhuT78R (see supplementary information at http://bioinfo.cnio.es/data/interferon_resistance/.). At 1 hour we haveobserved genes implicated in signal transduction, apo-ptosis, stress response, and oncogenes. At 4 hours wehave found a very small number of genes, which aredifferentially regulated, most of which are implicated inIFN response. At 24 hours the differentially regulated
genes are involved in a large variety of functions mainlysignal transduction and cell-cycle control, apoptosis,stress response, immune response, and oncogenes. At48 hours we have found that the majority of differentiallyregulated genes are implicated in signal transduction,IFN signaling, apoptosis, and cell-cycle control.
DiscussionThe huT78 cell line used in these studies is a MF-derivedcell line, in which initial studies using trypan blue exclu-sion to test cell viability indicated a high sensitivity toIFN-� treatment, even at an IFN-� concentrations as lowas 100 U/ml. The culture of cells throughout a period of 9months by gradually increasing the concentration ofIFN-� in the growth medium has produced a cell lineresistant to IFN-� concentrations of up to 1,000,000 U/ml.The cells were retested after 1 month in the absence ofIFN-� and resistance was persistent. Thus this huT78Rcell line was deemed to be a good model for the study ofIFN-� resistance.
Previous studies have shown that IFN-� resistancecould be dependent on alterations in the level of expres-sion of STAT113 or defects in STAT3 activation14 presum-ably secondary to the presence of undetected STAT1 null
Figure 3. STAT1 and STAT3 expression and activation by IFN-� in huT78S and huT78R. Cells from huT78S and huT78R were collected by cytospin and fixed inacetone before commencement of treatment and 3 and 24 hours after commencement of treatment of the cultures with 5000 U/ml IFN-� (0 and 24 hours onlyshown here). Cytospins were stained with both STAT1 and STAT3 antibodies. In huT78S (A) and huT78R (B) initially STAT1 protein is found in the cytoplasm.At 24 hours STAT1 has been activated with protein clearly visible and concentrated in the nucleus. In huT78S (C) and huT78R (D) STAT3 is also initially locatedin the cytoplasm. The protein is activated and translocated to the nucleus after 24 hours.
Genes Implicated in IFN Resistance 1831AJP November 2002, Vol. 161, No. 5
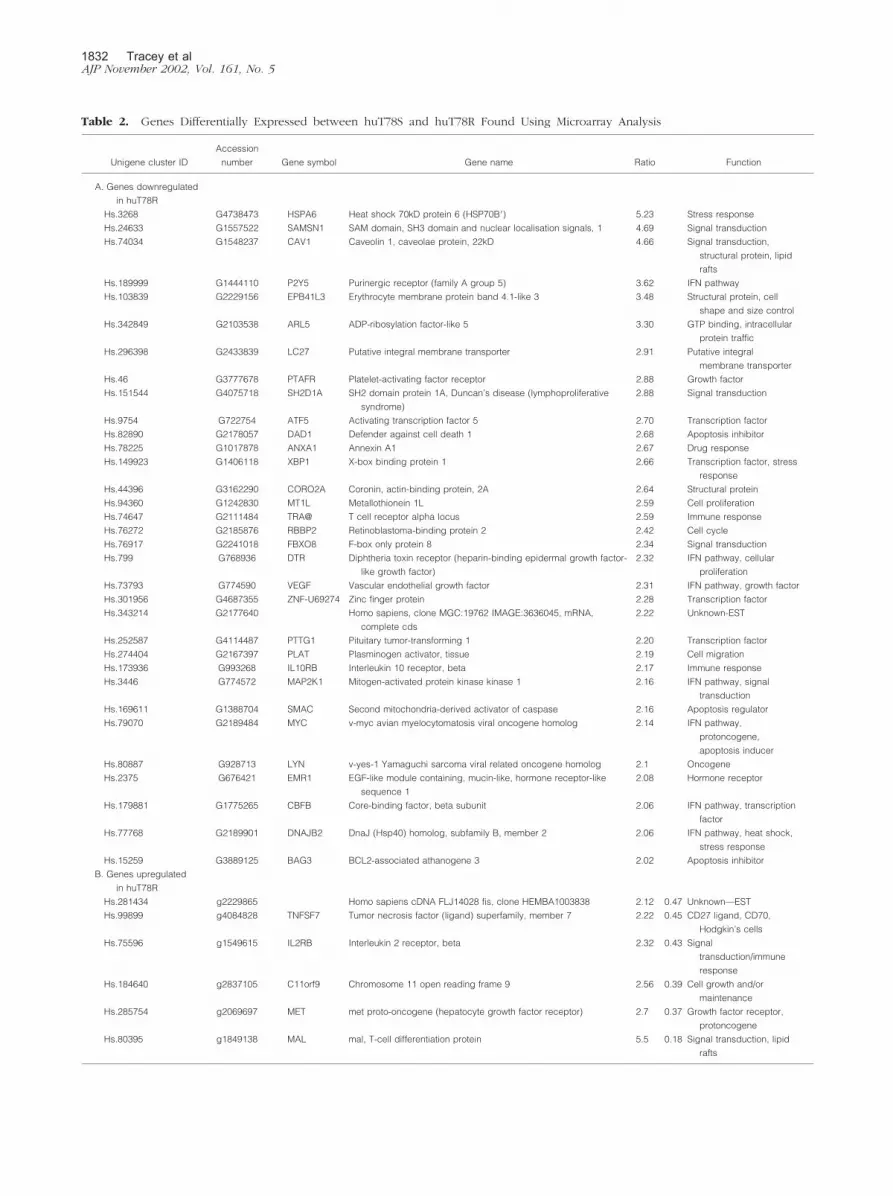
Table 2. Genes Differentially Expressed between huT78S and huT78R Found Using Microarray Analysis
Unigene cluster ID
Accession
number Gene symbol Gene name Ratio Function
A. Genes downregulated
in huT78R
Hs.3268 G4738473 HSPA6 Heat shock 70kD protein 6 (HSP70B�) 5.23 Stress response
Hs.24633 G1557522 SAMSN1 SAM domain, SH3 domain and nuclear localisation signals, 1 4.69 Signal transduction
Hs.74034 G1548237 CAV1 Caveolin 1, caveolae protein, 22kD 4.66 Signal transduction,
structural protein, lipid
rafts
Hs.189999 G1444110 P2Y5 Purinergic receptor (family A group 5) 3.62 IFN pathway
Hs.103839 G2229156 EPB41L3 Erythrocyte membrane protein band 4.1-like 3 3.48 Structural protein, cell
shape and size control
Hs.342849 G2103538 ARL5 ADP-ribosylation factor-like 5 3.30 GTP binding, intracellular
protein traffic
Hs.296398 G2433839 LC27 Putative integral membrane transporter 2.91 Putative integral
membrane transporter
Hs.46 G3777678 PTAFR Platelet-activating factor receptor 2.88 Growth factor
Hs.151544 G4075718 SH2D1A SH2 domain protein 1A, Duncan’s disease (lymphoproliferative
syndrome)
2.88 Signal transduction
Hs.9754 G722754 ATF5 Activating transcription factor 5 2.70 Transcription factor
Hs.82890 G2178057 DAD1 Defender against cell death 1 2.68 Apoptosis inhibitor
Hs.78225 G1017878 ANXA1 Annexin A1 2.67 Drug response
Hs.149923 G1406118 XBP1 X-box binding protein 1 2.66 Transcription factor, stress
response
Hs.44396 G3162290 CORO2A Coronin, actin-binding protein, 2A 2.64 Structural protein
Hs.94360 G1242830 MT1L Metallothionein 1L 2.59 Cell proliferation
Hs.74647 G2111484 TRA@ T cell receptor alpha locus 2.59 Immune response
Hs.76272 G2185876 RBBP2 Retinoblastoma-binding protein 2 2.42 Cell cycle
Hs.76917 G2241018 FBXO8 F-box only protein 8 2.34 Signal transduction
Hs.799 G768936 DTR Diphtheria toxin receptor (heparin-binding epidermal growth factor-
like growth factor)
2.32 IFN pathway, cellular
proliferation
Hs.73793 G774590 VEGF Vascular endothelial growth factor 2.31 IFN pathway, growth factor
Hs.301956 G4687355 ZNF-U69274 Zinc finger protein 2.28 Transcription factor
Hs.343214 G2177640 Homo sapiens, clone MGC:19762 IMAGE:3636045, mRNA,
complete cds
2.22 Unknown-EST
Hs.252587 G4114487 PTTG1 Pituitary tumor-transforming 1 2.20 Transcription factor
Hs.274404 G2167397 PLAT Plasminogen activator, tissue 2.19 Cell migration
Hs.173936 G993268 IL10RB Interleukin 10 receptor, beta 2.17 Immune response
Hs.3446 G774572 MAP2K1 Mitogen-activated protein kinase kinase 1 2.16 IFN pathway, signal
transduction
Hs.169611 G1388704 SMAC Second mitochondria-derived activator of caspase 2.16 Apoptosis regulator
Hs.79070 G2189484 MYC v-myc avian myelocytomatosis viral oncogene homolog 2.14 IFN pathway,
protoncogene,
apoptosis inducer
Hs.80887 G928713 LYN v-yes-1 Yamaguchi sarcoma viral related oncogene homolog 2.1 Oncogene
Hs.2375 G676421 EMR1 EGF-like module containing, mucin-like, hormone receptor-like
sequence 1
2.08 Hormone receptor
Hs.179881 G1775265 CBFB Core-binding factor, beta subunit 2.06 IFN pathway, transcription
factor
Hs.77768 G2189901 DNAJB2 DnaJ (Hsp40) homolog, subfamily B, member 2 2.06 IFN pathway, heat shock,
stress response
Hs.15259 G3889125 BAG3 BCL2-associated athanogene 3 2.02 Apoptosis inhibitor
B. Genes upregulated
in huT78R
Hs.281434 g2229865 Homo sapiens cDNA FLJ14028 fis, clone HEMBA1003838 2.12 0.47 Unknown—EST
Hs.99899 g4084828 TNFSF7 Tumor necrosis factor (ligand) superfamily, member 7 2.22 0.45 CD27 ligand, CD70,
Hodgkin’s cells
Hs.75596 g1549615 IL2RB Interleukin 2 receptor, beta 2.32 0.43 Signal
transduction/immune
response
Hs.184640 g2837105 C11orf9 Chromosome 11 open reading frame 9 2.56 0.39 Cell growth and/or
maintenance
Hs.285754 g2069697 MET met proto-oncogene (hepatocyte growth factor receptor) 2.7 0.37 Growth factor receptor,
protoncogene
Hs.80395 g1849138 MAL mal, T-cell differentiation protein 5.5 0.18 Signal transduction, lipid
rafts
1832 Tracey et alAJP November 2002, Vol. 161, No. 5

mutations or STAT3 active mutations. The data obtainedin our experimental model do not confirm these results,because all of the expression analysis performed here(c-DNA microarray, quantitative PCR, and immunohisto-chemistry) show that the resistant cells preserve STAT1and STAT3 expression. Similarly both cell lines retain
STAT1 induction by IFN-�. Additionally both cell linesshow similar activation of STAT1 and STAT3 by IFN-� asshown by the nuclear expression of STAT1 and STAT3,which has been demonstrated to be a necessary step forSTAT activity, secondary to phosphorylation. Thus, in-stead of unique alterations in genes closely related withthe IFN receptor pathway, our results point toward theimplication of a relatively large number of genes involvedin different cell pathways as responsible for IFN-� resis-tance.
To gain a better understanding of the intrinsic factorsthat may give rise to IFN-� resistance, we used the CNIOOncoChip to look at differences in gene expression be-tween the two variants of huT78. c-DNA microarray ex-periments identified that in the huT78 cell line the resis-tance to IFN-� is associated with significant changes inthe expression of a total of 39 genes. Thus, six genes orESTs (MAL, MET, C11ORF9, IL2RB, TNFSF7, and 1 EST)are expressed at a higher level by the IFN-� resistantcells, whereas the expression of a set of 33 genes andESTs is down-regulated in the resistant cell line. The mostsignificant of these genes were HSPA6, SAMSN1, CAV1,P2Y5, EPB41L3, ARL5, and SH2D1A. Additionally the c-DNA microarray study confirmed that STAT1 and STAT3basal levels are not significantly different between the twovariants.
The genes identified as being implicated in intrinsicresistance of cells to IFN-� code for proteins involved ina variety of functions including membrane transport andsignal transduction (MAL, CAV1, ARL5, SAMSN1, IL2RB,MAP2K1, SH2D1A), apoptosis (BAG3, SMAC, DAD1),stress-response (HSPA6, DNAJB2), transcription regula-tion (ATF5, PTTG1, CBFB), and cell growth (MET, VEGF,TNFSF7), or play a role as multifunctional genes (MYC).Notably all of the genes overexpressed by the resistantcode for membrane proteins, all of them having beendescribed as being involved in signal transduction andcell growth.
The functional significance of these changes, and theirrelationship with the response to IFN-� can be partiallyexplained taking into account the existing informationconcerning the function of all these genes. Thus, al-though some of the genes identified by this strategyappear to belong to the IFN pathway (P2Y5, DTR, VEGF)the presence of the majority of them can only be ex-plained taking into account the relevant role that they playin the control of key gene functions, such as signal trans-duction, cell growth, or apoptosis.
MAL, the gene up-regulated in resistant cells to thehighest degree, is a component of membrane rafts.26
These rafts are membrane microdomains that play acentral role in signal transduction acting as a scaffold inwhich molecules of signal transduction pathways caninteract. Indeed �10% of STAT3, and other STAT mole-cules such as STAT1 and STAT5, are found in suchmembrane rafts.27 Membrane rafts, in addition to STATsand other signaling molecules, contain membrane-boundreceptors such as gp130 and IFN receptors (IFNAR1 andIFNGR2) in the case of caveolin-containing rafts.28 Apotential role for MAL protein in IFN-� and PUVA resis-tance has indeed been identified in the group of patients
Figure 4. Comparison of the results achieved using microarray analysis andquantitative PCR between the two variants. To validate the microarray result,quantitative PCR was performed for eight genes using TaqMan probes (fivegenes; MAL, SAMSN1, BAG3, STAT1, and STAT3) or SYBR green (threegenes; TNFSF7, CAV1, and P2Y5). The genes studied included: o, genesup-regulated huT78R (MAL, SAMSN1), `, genes whose expression wasunchanged between the two variants (STAT1, STAT3), and p, genes down-regulated in huT78R (BAG3, TNFSF7, CAV1, P2Y5). For all eight genesstudied the microarray results were confirmed and in most cases the resultsobtained from both techniques were extremely similar and no differencesobserved were significant.
Figure 5. Immunohistochemical study of MAL protein in paraffin sections ofMF tumoral tissue from patients treated with IFN-�. A and B: A case of MF ina patient in which MAL is not detected. B and D: A case of a MF in a patientpositive for MAL and who shows a slow response in the case of IFN-�treatment.
Genes Implicated in IFN Resistance 1833AJP November 2002, Vol. 161, No. 5

Figure 6. A: Cluster of IFN-� early response genes (1 and 4 hours) in huT78S and huT78R. CI: Genes down-regulated in huT78R, expression in huT78S does notchange. CII-A: Genes up-regulated in huT78S, expression in huT78R does not change or is up-regulated but delayed. CIII: Genes up-regulated in huT78R,expression change in huT78S variable (unchanged, down-regulated or up-regulated but delayed). CIV: Genes down-regulated in huT78S and either up-regulatedin huT78R and/or down-regulated but delayed. B: Cluster of IFN-� late response genes (24 and 48 hours) in huT78S and huT78R. CI: Genes up-regulated in thehuT78R, expression in huT78S does not change or down-regulation is observed. CII: Genes down-regulated in huT78S, expression in huT78R does not change.CIII: Genes down-regulated in huT78R, expression in huT78S does not change. CIV: Genes up-regulated in huT78S and expression does not change in huT78R.
1834 Tracey et alAJP November 2002, Vol. 161, No. 5

analyzed here, thus underscoring the critical role that thisprotein seems to play in signal transduction, and extend-ing the results of the experimental model chosen to agroup of patients.
CAV1, a caveolin underexpressed by IFN-resistantcells, is also a membrane raft protein. However MAL andCAV1 are found in distinct membrane microdomains/rafts,29 thus suggesting that they may have specializedfunctions. CAV1 is a tumor suppressor gene, localized onchromosome 7q31, for which a role as a negative regu-lator of the Ras-p42/44 MAP kinase cascade has beenproposed (Figure 7). The down-regulation of caveolin inthe resistant cell line suggests that these caveolin-con-taining membrane rafts may be essential for IFN signalingand particularly for IFN-� signaling because it is knownthat these rafts do contain IFN receptors.28 The up-reg-ulation of MAL in the resistant cells suggests that, in theabsence or depletion of CAV1, MAL-containing mem-brane rafts become more important for maintaining nor-mal membrane trafficking and signaling.
Interleukin2 receptor B is another of the genes that isup-regulated in resistant cells. The receptor for interleu-kin 2 is composed of three subunits �, �, and �. The �subunit (shown here to be overexpressed by huT78R) ofthe interleukin receptor is critical for receptor-mediatedsignaling leading to the proliferative and survival effect of
interleukin activation.30 Hence the resistant cells, whichoverexpress this subunit, may be more responsive tointerleukin-induced proliferation and survival giving thema survival advantage over sensitive cells.
The SH2D1A gene (also known as SAP, DSHP, andXLP) encodes a small protein consisting of a single SH2domain. In vitro and in vivo analysis of gene expressionsuggest that this gene is an intrinsic component of lym-phocyte activation pathways being present in activatedlymphocytes and high-grade lymphomas.31 On the otherhand, deletions and nonsense mutations have been de-scribed in SAP/SH2D1A in XLP patients32 and those pa-tients present severe EBV-associated illness.33 Althoughthe function of this protein is not completely character-ized, the absence of mRNA in the resistance cell linesuggests a possible role in the resistance phenotype.However this gene is found to be differentially regulatedin response to IFN treatment as shown by the time-courseexperiments (1 hour), which raises some doubt about therole that this gene may play in the resistance to IFN-�.
MET, a transforming gene up-regulated in the resistantcells codes for a membrane protein containing a SH2domain. It has features characteristic of the tyrosine ki-nase family of growth factor receptors. It has been shownto be capable of activating some signal transductionpathways including the RAS/MAPK pathway. Additionallythe MET gene is activated by IFN-� and other cytokines,and can also activate STAT proteins.34
TNFSF7 (tumor necrosis factor ligand superfamilymember 7) (cd27 ligand, CD70) is a surface antigenfound on activated, but not resting, B and T cells. Thisgene has been found to be up-regulated in resistantcells. It induces cell proliferation35 and it has been de-scribed as an initiator of anti-apoptotic signaling via TRAFproteins,36 although a description as an apoptotic in-ducer molecule has also been described (Figure 7).37
Heat shock protein 70B (HSPA6), a gene regulated viaJAK/STAT signaling, is the most down-regulated gene inresistant cells. HSP70 has binding sites in its promoterthat can bind both STAT1 and STAT3, and is known to beinduced by IFN-� in a STAT1-dependent manner.38 Thedown-regulation of this gene in resistant cells could bederived from the loss of some upstream regulators inthese cells. A relation between HSP70 expression and
Table 4. Function/Biological Process of the Differentially Regulated Genes Induced by IFN-� [Clusters (c) Defined by Figure 6]
Function/biologicalprocess
Early Late
Totalc. I c. II c. III c. IV Total c. I c. II c. III c. IV Total
Signal transduction 1 1 3 5 10 1 4 5 15Cell cycle 4 3 1 8 1 1 2 2 6 14Cell growth/maintenance 3 1 4 2 3 7 12 16Developmental process 1 1 1 2 3 4IFN induced 2 5 7 3 3 10Transport 1 1 1 1 1 3 4Cell adhesion 1 1 1Apoptosis 1 1 2 1 2 5 6Metabolism 3 5 1 9 1 2 3 12Transcription regulation 2 2 4 1 3 4 8 12Immune response 1 1 1 3 1 2 3 6Total 9 8 21 11 49 8 6 10 27 51 100
Table 3. MAL Protein Expression and Clinical Response
MAL �ve MAL �ve Total
A: Relationship between MAL protein expression andclinical response to IFN-� and/or PUVA (Fisher’s exacttest, P � 0.03)RR 3 7 10SR 8 2 10Total 11 9 20
B: Relationship between MAL protein expression andclinical response to IFN-� and PUVA (Fisher’s exacttest, P � 0.04)RR 1 5 6SR 4 0 4Total 5 5 10
RR, Rapid response: patients that achieved complete remissionwithin 16 weeks of treatment commencement; SR, slow response:patients that needed more than 16 weeks of treatment to achievecomplete remission; MAL �ve, MAL � positive; MAL �ve, MAL �negative.
Genes Implicated in IFN Resistance 1835AJP November 2002, Vol. 161, No. 5

apoptosis sensitivity has been previously provided by thefindings of Gerner and colleagues,39 in which HSP70expression was associated with apoptosis dependent onfas-signaling (Figure 7).
The time-course experiments reveal that indeed thedifferent behavior exhibited by the resistant and sensitivecell line seems to be the result of deregulation of cell-cycle control, cell growth and maintenance, and signaltransduction pathways (Table 4). Although the group ofapoptosis genes differentially expressed is low8 (8genes) they could be critical in the process of resistanceto IFN-�.
One interesting gene, which is differentially regulatedbetween the sensitive and resistant variants, is the onco-gene MYC. This gene is up-regulated in huT78R in re-sponse to IFN-� whereas expression in huT78S appearsto be down-regulated. In fact this gene is known to beregulated by IFN.8 Conflicting data with that observed inthe analysis of basal levels of c-myc expression inhuT78S and huT78R possibly reflects the pleiotrophiceffects of c-myc on cell growth, proliferation, and controlof apoptosis.40 Another gene MAZ [MYC-associated zincfinger protein (purine-binding transcription factor)], isalso found in the same cluster as MYC. It plays an im-portant role in transcription initiation and binds two sitesin the MYC promoter region.41 Up-regulation of bothgenes in huT78R indicates that transcription of MYC isactive in huT78R while being suppressed in huT78S giv-ing the resistant cells a growth advantage over theirsensitive counterparts, because MYC is responsible forthe transcription of genes involved in cell proliferationand growth.40
Another gene that could be implicated in the resistance isRANBP2 (RAN-binding protein 2), which plays an importantrole in cell-cycle progression. The down-regulation de-tected in huT78S may imply that cells are not able to
progress through the cell cycle while in huT78R, becauseno down-regulation is observed, cell-cycle progressioncontinues. Another potential gene involved in apoptosissensitivity in huT78S cells is TRADD (TNFRSF1A-associatedvia death domain) which encodes a proapoptotic deathreceptor.42 The lack of induction of this gene in huT78Rmayhelp explain the resistance observed.
By examining the differences in the basal expressionof genes between huT78S and huT78R the factors re-sponsible for the intrinsic resistance of huT78R to theeffects of IFN can be identified, whereas the time-courseexperiments that we have performed, illustrate the down-stream signal transduction pathway deregulation causedby these basal changes. Thus the changes observedhere in the signal transduction pathways after IFN-� chal-lenge could be secondary to the malfunction of the mem-brane raft microdomains, linked with the abnormal ex-pression of MAL and CAV1, as detected in the basal celllines.
In summary, these results show that resistance toIFN-� in CTCL cells is dependent on changes in theexpression of a selected number of genes, includinggenes implicated in signal transduction, cell cycle, cellgrowth, and apoptosis. The most up-regulated gene,MAL, was found to be a prediction factor for treatmentoutcome of IFN-� in a clinical series. Nevertheless itseems plausible that to fully explain the clinical phenom-ena of IFN-� resistance, a larger number of genes needto be taken into account.
AcknowledgmentsWe thank I. Fernandez for her invaluable help with the cellculture, M. Lopez for excellent technical assistance withmolecular assays, the Immunohistochemistry Unit (CN10)for assistance afforded for immunohistochemical assays,and Andreas Rosenwald for his comments and discussionon the time-course experiments.
References
1. Stark GR, Kerr IM, Williams BR, Silverman RH, Schreiber RD: Howcells respond to interferons. Annu Rev Biochem 1998, 67:227–264
2. Platanias LC: Interferons: laboratory to clinic investigations. Curr OpinOncol 1995, 7:560–565
3. Ihle JN, Witthuhn BA, Quelle FW, Yamamoto K, Thierfelder WE, Kre-ider B, Silvennoinen O: Signaling by the cytokine receptorsuperfamily: JAKs and STATs. Trends Biochem Sci 1994, 19:222–227
4. Darnell JR JE, Kerr IM, Stark GR: Jak-STAT pathways and transcrip-tional activation in response to IFNs and other extracellular signalingproteins. Science 1994, 264:1415–1421
5. Sangfelt O, Erickson S, Castro J, Heiden T, Einhorn S, Grander D:Induction of apoptosis and inhibition of cell growth are independentresponses to interferon-alpha in hematopoietic cell lines. Cell GrowthDiffer 1997, 8:343–352
6. Xu D, Erickson S, Szeps M, Gruber A, Sangfelt O, Einhorn S, Pisa P,Grander D: Interferon alpha down-regulates telomerase reverse tran-scriptase and telomerase activity in human malignant and nonmalig-nant hematopoietic cells. Blood 2000, 96:4313–4318
7. Jewell AP, Worman CP, Lydyard PM, Yong KL, Giles FJ, GoldstoneAH: Interferon-alpha up-regulates bcl-2 expression and protects B-CLL cells from apoptosis in vitro and in vivo. Br J Haematol 1994,88:268–274
Figure 7. Apoptotic and signal transduction pathways disrupted in the IFN-�resistant cell line detected by microarray analysis. Expression of severalgenes acting in concert to regulate the balance between proliferation andprogrammed cell death is altered in the resistance variant (hut78R) as com-pared to the sensitive variant (hut78S). Up-regulated (red text label) anddown-regulated genes (green text label) in huT78R versus huT78S are noted.Changes in the expression of several genes could possibly be the cause of theresistance phenotype (as the up-regulation of TNFSF7 and MAL and thedown-regulation of SHD2H1A and CAV1) although some others may be aconsequence.
1836 Tracey et alAJP November 2002, Vol. 161, No. 5

8. Matikainen S, Sareneva T, Ronni T, Lehtonen A, Koskinen PJ,Julkunen I: Interferon-alpha activates multiple STAT proteins andupregulates proliferation-associated IL-2Ralpha, c-myc, and pim-1genes in human T cells. Blood 1999, 93:1980–1991
9. Sangfelt O, Erickson S, Castro J, Heiden T, Gustafsson A, Einhorn S,Grander D: Molecular mechanisms underlying interferon-alpha-in-duced G0/G1 arrest: CKI-mediated regulation of G1 Cdk-complexesand activation of pocket proteins. Oncogene 1999, 18:2798–2810
10. Abramovich C, Shulman LM, Ratovitski E, Harroch S, Tovey M, Eid P,Revel M: Differential tyrosine phosphorylation of the IFNAR chain ofthe type I interferon receptor and of an associated surface protein inresponse to IFN-alpha and IFN-beta. EMBO J 1994, 13:5871–5877
11. McKendry R, John J, Flavell D, Muller M, Kerr IM, Stark GR: High-frequency mutagenesis of human cells and characterization of amutant unresponsive to both alpha and gamma interferons. Proc NatlAcad Sci USA 1991, 88:11455–11459
12. Sakamoto H, Yasukawa H, Masuhara M, Tanimura S, Sasaki A, YugeK, Ohtsubo M, Ohtsuka A, Fujita T, Ohta T, Furukawa Y, Iwase S,Yamada H, Yoshimura A: A Janus kinase inhibitor, JAB, is an inter-feron-gamma-inducible gene and confers resistance to interferons.Blood 1998, 92:1668–1676
13. Sun WH, Pabon C, Alsayed Y, Huang PP, Jandeska S, Uddin S,Platanias LC, Rosen ST: Interferon-alpha resistance in a cutaneousT-cell lymphoma cell line is associated with lack of STAT1 expression.Blood 1998, 91:570–576
14. Yang CH, Murti A, Pfeffer LM: STAT3 complements defects in aninterferon-resistant cell line: evidence for an essential role for STAT3in interferon signaling and biological activities. Proc Natl Acad SciUSA 1998, 95:5568–5572
15. Siegel RS, Pandolfino T, Guitart J, Rosen S, Kuzel TM: Primary cuta-neous T-cell lymphoma: review and current concepts. J Clin Oncol2000, 18:2908–2925
16. Zhang L, Zhou W, Velculescu VE, Kern SE, Hruban RH, Hamilton SR,Vogelstein B, Kinzler KW: Gene expression profiles in normal andcancer cells. Science 1997, 276:1268–1272
17. DeRisi J, Penland L, Brown PO, Bittner ML, Meltzer PS, Ray M, ChenY, Su YA, Trent JM: Use of a cDNA microarray to analyse geneexpression patterns in human cancer. Nat Genet 1996, 14:457–460
18. Iyer VR, Eisen MB, Ross DT, Schuler G, Moore T, Lee JC, Trent JM,Staudt LM, Hudson Jr J, Boguski MS, Lashkari D, Shalon D, BotsteinD, Brown PO: The transcriptional program in the response of humanfibroblasts to serum. Science 1999, 283:83–87
19. Heid CA, Stevens J, Livak KJ, Williams PM: Real time quantitativePCR. Genome Res 1996, 6:986–994
20. Van Gelder RN, von Zastrow ME, Yool A, Dement WC, Barchas JD,Eberwine JH: Amplified RNA synthesized from limited quantities ofheterogeneous cDNA. Proc Natl Acad Sci USA 1990, 87:1663–1667
21. Eberwine J: Amplification of mRNA populations using aRNA gener-ated from immobilized oligo(dT)-T7 primed cDNA. Biotechniques1996, 20:584–591
22. Hegde P, Qi R, Abernathy K, Gay C, Dharap S, Gaspard R, HughesJE, Snesrud E, Lee N, Quackenbush J: A concise guide to cDNAmicroarray analysis. Biotechniques 2000, 29: 548–556
23. Rebhan M, Chalifa-Caspi V, Prilusky J, Lancet D: GeneCards: a novelfunctional genomics compendium with automated data mining andquery reformulation support. Bioinformatics 1998, 14:656–664
24. Copie-Bergman C, Gaulard P, Maouche-Chretien L, Briere J, HaiounC, Alonso MA, Romeo PH, Leroy K: The MAL gene is expressed inprimary mediastinal large B-cell lymphoma. Blood 1999, 94:3567–3575
25. Gazdar AF, Carney DN, Bunn PA, Russell EK, Jaffe ES, SchechterGP, Guccion JG: Mitogen requirements for the in vitro propagation ofcutaneous T-cell lymphomas. Blood 1980, 55:409–417
26. Alonso MA, Millan J: The role of lipid rafts in signalling and membranetrafficking in T lymphocytes. J Cell Sci 2001, 114:3957–3965
27. Ndubuisi MI, Guo GG, Fried VA, Etlinger JD, Sehgal PB: Cellularphysiology of STAT3: where’s the cytoplasmic monomer? J Biol Chem1999, 274:25499–25509
28. Takaoka A, Mitani Y, Suemori H, Sato M, Yokochi T, Noguchi S,Tanaka N, Taniguchi T: Cross talk between interferon-gamma and-alpha/beta signaling components in caveolar membrane domains.Science 2000, 288:2357–2360
29. Millan J, Puertollano R, Fan L, Alonso MA: Caveolin and MAL, twoprotein components of internal detergent-insoluble membranes, arein distinct lipid microenvironments in MDCK cells. Biochem BiophysRes Commun 1997, 233:707–712
30. Zamorano J, Wang HY, Wang R, Shi Y, Longmore GD, Keegan AD:Regulation of cell growth by IL-2: role of STAT5 in protection fromapoptosis but not in cell cycle progression. J Immunol 1998, 160:3502–3512
31. Nichols KE, Harkin DP, Levitz S, Krainer M, Kolquist KA, Genovese C,Bernard A, Ferguson M, Zuo L, Snyder E, Buckler AJ, Wise C, AshleyJ, Lovett M, Valentine MB, Look AT, Gerald W, Housman DE, HaberDA: Inactivating mutations in an SH2 domain-encoding gene in X-linked lymphoproliferative syndrome. Proc Natl Acad Sci USA 1998,95:13765–13770
32. Sumegi J, Huang D, Lanyi A, Davis JD, Seemayer TA, Maeda A, KleinG, Seri M, Wakiguchi H, Purtilo DT, Gross TG: Correlation of mutationsof the SH2D1A gene and Epstein-Barr virus infection with clinicalphenotype and outcome in X-linked lymphoproliferative disease.Blood 2000, 96:3118–3125
33. Sumazaki R, Kanegane H, Osaki M, Fukushima T, Tsuchida M, Mat-sukura H, Shinozaki K, Kimura H, Matsui A, Miyawaki T: SH2D1Amutations in Japanese males with severe Epstein-Barr virus-associ-ated illnesses. Blood 2001, 98:1268–1270
34. Nagahori T, Dohi M, Matsumoto K, Saitoh K, Honda ZI, Nakamura T,Yamamoto K: Interferon-gamma upregulates the c-Met/hepatocytegrowth factor receptor expression in alveolar epithelial cells. Am JRespir Cell Mol Biol 1999, 21:490–497
35. Goodwin RG, Alderson MR, Smith CA, Armitage RJ, VandenBos T,Jerzy R, Tough TW, Schoenborn MA, Davis-Smith T, Hennen K:Molecular and biological characterization of a ligand for CD27 de-fines a new family of cytokines with homology to tumor necrosisfactor. Cell 1993, 73:447–456
36. Gravestein LA, Amsen D, Boes M, Calvo CR, Kruisbeek AM, Borst J:The TNF receptor family member CD27 signals to Jun N-terminalkinase via Traf-2. Eur J Immunol 1998, 28:2208–2216
37. Prasad KV, Ao Z, Yoon Y, Wu MX, Rizk M, Jacquot S, Schlossman SF:CD27, a member of the tumor necrosis factor receptor family, inducesapoptosis and binds to Siva, a proapoptotic protein. Proc Natl AcadSci USA 1997, 94:6346–6351
38. Stephanou A, Isenberg DA, Nakajima K, Latchman DS: Signal trans-ducer and activator of transcription-1 and heat shock factor-1 interactand activate the transcription of the Hsp-70 and Hsp-90beta genepromoters. J Biol Chem 1999, 274:1723–1728
39. Gerner C, Frohwein U, Gotzmann J, Bayer E, Gelbmann D, Bursch W,Schulte-Hermann R: The Fas-induced apoptosis analysed by highthroughput proteome analysis. J Biol Chem 2000, 275:39018–39026
40. Amati B, Alevizopoulos K, Vlach J: Myc and the cell cycle. FrontBiosci 1998, 3:D250–D268
41. Bossone SA, Asselin C, Patel AJ, Marcu KB: MAZ, a zinc fingerprotein, binds to c-MYC and C2 gene sequences regulating tran-scriptional initiation and termination. Proc Natl Acad Sci USA 1992,89:7452–7456
42. Hsu H, Xiong J, Goeddel DV: The TNF receptor 1-associated proteinTRADD signals cell death and NF-kappa B activation. Cell 1995,81:495–504
Genes Implicated in IFN Resistance 1837AJP November 2002, Vol. 161, No. 5