Identification of genes downstream of the Shh signalling in the developing chick wing and...
14
Identification of genes downstream of the Shh signalling in the developing chick wing and syn-expressed with Hoxd13 using microarray and 3D computational analysis Fiona Bangs a , Monique Welten a , Megan G. Davey b , Malcolm Fisher c , Yili Yin d , Helen Downie a,e , Bob Paton b , Richard Baldock c , David W. Burt b , Cheryll Tickle a, * a Department of Biology and Biochemistry, University of Bath, Bath BA2 7AY, UK b Department of Genetics and Genomics, The Roslin Institute and Royal (Dick) School of Veterinary Studies, The University of Edinburgh, Midlothian EH25 9PS, UK c MRC Human Genetics Unit, Western General Hospital, Crewe Road, Edinburgh EH4 2XU, Scotland, UK d Division of Cell and Developmental Biology, Wellcome Trust Biocentre, The University of Dundee, Dundee DD1 5EH, UK e SCRI, Invergowrie, Dundee DD2 5DA, Scotland, UK ARTICLE INFO Article history: Received 12 May 2010 Received in revised form 30 July 2010 Accepted 3 August 2010 Available online 12 August 2010 Keywords: Sonic hedgehog Limb Talpid 3 Chicken OPT Microarray Hoxd13 Ptc1 ABSTRACT Sonic hedgehog (Shh) signalling by the polarizing region at the posterior margin of the chick wing bud is pivotal in patterning the digits but apart from a few key downstream genes, such as Hoxd13, which is expressed in the posterior region of the wing that gives rise to the digits, the genes that mediate the response to Shh signalling are not known. To find genes that are co-expressed with Hoxd13 in the posterior of chick wing buds and regulated in the same way, we used microarrays to compare gene expression between anterior and posterior thirds of wing buds from normal chick embryos and from polydactylous talpid 3 mutant chick embryos, which have defective Shh signalling due to lack of primary cilia. We identified 1070 differen- tially expressed gene transcripts, which were then clustered. Two clusters contained genes predominantly expressed in posterior thirds of normal wing buds; in one cluster, genes including Hoxd13, were expressed at high levels in anterior and posterior thirds in talpid 3 wing buds, in the other cluster, genes including Ptc1, were expressed at low levels in anterior and posterior thirds in talpid 3 wing buds. Expression patterns of genes in these two clusters were validated in normal and talpid 3 mutant wing buds by in situ hybridisation and demonstrated to be responsive to application of Shh. Expression of several genes in the Hoxd13 cluster was also shown to be responsive to manipulation of protein kinase A (PKA) activity, thus demon- strating regulation by Gli repression. Genes in the Hoxd13 cluster were then sub-clustered by computational comparison of 3D expression patterns in normal wing buds to produce syn- expression groups. Hoxd13 and Sall1 are syn-expressed in the posterior region of early chick wing buds together with 6 novel genes which are likely to be functionally related and repre- sent secondary targets of Shh signalling. Other groups of syn-expressed genes were also iden- tified, including a group of genes involved in vascularisation. Ó 2010 Elsevier Ireland Ltd. All rights reserved. 0925-4773/$ - see front matter Ó 2010 Elsevier Ireland Ltd. All rights reserved. doi:10.1016/j.mod.2010.08.001 * Corresponding author. Tel.: +44 01225 386597; fax: +44 01225 386779. E-mail address: [email protected] (C. Tickle). MECHANISMS OF DEVELOPMENT 127 (2010) 428 – 441 available at www.sciencedirect.com journal homepage: www.elsevier.com/locate/modo
Transcript of Identification of genes downstream of the Shh signalling in the developing chick wing and...

M E C H A N I S M S O F D E V E L O P M E N T 1 2 7 ( 2 0 1 0 ) 4 2 8 – 4 4 1
. sc iencedi rec t .com
avai lab le at wwwjournal homepage: www.elsevier .com/ locate /modo
Identification of genes downstream of the Shh signalling inthe developing chick wing and syn-expressed with Hoxd13using microarray and 3D computational analysis
Fiona Bangs a, Monique Welten a, Megan G. Davey b, Malcolm Fisher c, Yili Yin d,Helen Downie a,e, Bob Paton b, Richard Baldock c, David W. Burt b, Cheryll Tickle a,*
a Department of Biology and Biochemistry, University of Bath, Bath BA2 7AY, UKb Department of Genetics and Genomics, The Roslin Institute and Royal (Dick) School of Veterinary Studies, The University of Edinburgh,
Midlothian EH25 9PS, UKc MRC Human Genetics Unit, Western General Hospital, Crewe Road, Edinburgh EH4 2XU, Scotland, UKd Division of Cell and Developmental Biology, Wellcome Trust Biocentre, The University of Dundee, Dundee DD1 5EH, UKe SCRI, Invergowrie, Dundee DD2 5DA, Scotland, UK
A R T I C L E I N F O
Article history:
Received 12 May 2010
Received in revised form
30 July 2010
Accepted 3 August 2010
Available online 12 August 2010
Keywords:
Sonic hedgehog
Limb
Talpid3
Chicken
OPT
Microarray
Hoxd13
Ptc1
0925-4773/$ - see front matter � 2010 Elsevidoi:10.1016/j.mod.2010.08.001
* Corresponding author. Tel.: +44 01225 38659E-mail address: [email protected] (C. Tick
A B S T R A C T
Sonic hedgehog (Shh) signalling by the polarizing region at the posterior margin of the chick
wing bud is pivotal in patterning the digits but apart from a few key downstream genes, such
as Hoxd13, which is expressed in the posterior region of the wing that gives rise to the digits,
the genes that mediate the response to Shh signalling are not known. To find genes that are
co-expressed with Hoxd13 in the posterior of chick wing buds and regulated in the same way,
we used microarrays to compare gene expression between anterior and posterior thirds of
wing buds from normal chick embryos and from polydactylous talpid3 mutant chick embryos,
which have defective Shh signalling due to lack of primary cilia. We identified 1070 differen-
tially expressed gene transcripts, which were then clustered. Two clusters contained genes
predominantly expressed in posterior thirds of normal wing buds; in one cluster, genes
including Hoxd13, were expressed at high levels in anterior and posterior thirds in talpid3 wing
buds, in the other cluster, genes including Ptc1, were expressed at low levels in anterior and
posterior thirds in talpid3 wing buds. Expression patterns of genes in these two clusters were
validated in normal and talpid3 mutant wing buds by in situ hybridisation and demonstrated
to be responsive to application of Shh. Expression of several genes in the Hoxd13 cluster was
also shown to be responsive to manipulation of protein kinase A (PKA) activity, thus demon-
strating regulation by Gli repression. Genes in the Hoxd13 cluster were then sub-clustered by
computational comparison of 3D expression patterns in normal wing buds to produce syn-
expression groups. Hoxd13 and Sall1 are syn-expressed in the posterior region of early chick
wing buds together with 6 novel genes which are likely to be functionally related and repre-
sent secondary targets of Shh signalling. Othergroups of syn-expressed genes were also iden-
tified, including a group of genes involved in vascularisation.
� 2010 Elsevier Ireland Ltd. All rights reserved.
er Ireland Ltd. All rights reserved.
7; fax: +44 01225 386779.le).
M E C H A N I S M S O F D E V E L O P M E N T 1 2 7 ( 2 0 1 0 ) 4 2 8 – 4 4 1 429
1. Introduction
The formation of the digits of the chick wing is a classical
model for investigating how a precise pattern of structures
is generated during embryonic development. It is now well-
established that Sonic hedgehog (Shh) plays a pivotal role in
specifying both the number of digits and the digit pattern
but less is known about the downstream genes that mediate
the response to Shh signalling, apart from a few key genes,
5 0Hox genes including Hoxd13, together with Tbx2 and Tbx3
genes (Fromental-Ramain et al., 1996; Suzuki et al., 2004; Zak-
any et al., 2004). Here we have used microarrays together with
analysis of 3D gene expression patterns to identify genes
downstream of Shh signalling that are syn-expressed with
Hoxd13 in the chick wing bud and likely to represent genes
functionally related to Hoxd13 and involved in digit
patterning.
The chick wing has three morphologically distinct digits, 2,
3 and 4 (running from anterior to posterior). All three digits
arise from the posterior half of the early wing bud as shown
by fate mapping experiments (Towers et al., 2008; Vargesson
et al., 1997). A small region of cells at the posterior margin
of the wing bud, now known as the polarizing region or zone
of polarizing activity (ZPA), was found to act as an organizer
and induce formation of an additional set of digits when
grafted to the anterior margin of a second bud (Saunders
and Gasseling, 1968; Tickle, 1981). The polarizing region ex-
presses Shh (Riddle et al., 1993) and Shh protein diffuses into
the adjacent region of the wing bud to set up a concentration
gradient to specify antero-posterior positional values in a
step-wise fashion. The positional values are then remem-
bered and interpreted later when the digits develop to give
each digit its particular morphology (Towers and Tickle,
2009). Shh also controls growth of the responding cells in
the early bud and the region of the wing bud that gives rise
to the digits expands about twofold during the 24 h period
of pattern specification. Growth is therefore an integral part
of the patterning process and determines digit number (Tow-
ers et al., 2008). In the chick wing, Shh induces Bmp2 expres-
sion and there is some evidence that Bmp2 signalling might
act downstream of Shh and contribute to specifying antero-
posterior positional values (Drossopoulou et al., 2000).
5 0Hox genes have long been considered as candidates for
encoding antero-posterior positional values in the early chick
wing bud (Izpisua-Belmonte et al., 1991; Morgan et al., 1992).
Application of Shh to the anterior margin of the early chick
wing bud leads to induction of 5 0Hox gene expression (Yang
et al., 1997) and misexpression of Hoxd12 leads to changes
in digit patterning. Genetic studies in mice however have re-
vealed that the 5’Hox genes play multiple roles in vertebrate
limb development, including an early role in establishing
Shh expression in the polarizing region, and that Hoxd13 and
Hoxa13 together are required for digit development (Zakany
and Duboule, 2007). Tbx2 and Tbx3 have also been implicated
in antero-posterior patterning with misexpression in devel-
oping chick legs leading to changes in digit patterning (Suzuki
et al., 2004). In early chick wing buds, Hoxd13 is expressed in
the posterior distal region that is fated to form digits whereas
Tbx2 and Tbx3 genes are expressed in two stripes, one poster-
ior and one anterior.
We used the fact that Hoxd13 expression defines the region
of the early chick wing bud fated to form digits to design a
microarray experiment in which we compared the transcrip-
tional profiles of anterior and posterior thirds of chick wing
buds to identify genes co-expressed with Hoxd13 and there-
fore likely to be involved in digit patterning. Hoxd13 is ex-
pressed in the posterior region of the chick wing because its
expression is repressed anteriorly by Gli proteins, the tran-
scriptional effectors of Shh signalling which are processed
on primary cilia to repressor forms, in the absence of Shh.
Therefore to refine this analysis further, we also added a com-
parison with transcriptional profiles of anterior and posterior
thirds of wing buds from the chicken talpid3 mutant, in which
Gli processing cannot take place due to absence of primary ci-
lia (Davey et al., 2006; Yin et al., 2009) and in which Hoxd13 is
expressed at high levels both posteriorly and anteriorly (Izpi-
sua-Belmonte et al., 1992; Lewis et al., 1999). Other genes such
as Ptc1, are also expressed posteriorly in normal wing buds
due to processing of Gli to activator forms which also occurs
on primary cilia in the presence of Shh. In talpid3 mutant wing
buds Ptc1 is expressed at very low levels. Thus comparing
expression of ‘‘posterior genes’’ in the wing buds of talpid3
mutants provides a way of identifying posteriorly expressed
genes that, like Hoxd13, are regulated by Gli repression. Other
methods such as comparing gene expression between normal
and cyclopamine treated wing buds would not distinguish be-
tween posteriorly expressed genes regulated by Gli activator
or repressor.
We focussed on two clusters of genes identified by our
microarrays, one cluster of genes expressed like Hoxd13, the
other like Ptc1. We validated expression patterns in the wing
buds of both normal and talpid3 mutant embryos via in situ
hybridisation and then carried out functional analyses to
demonstrate responsiveness to Shh for genes in both clusters.
We also tested whether expression of a sample of genes from
the Hoxd13 cluster was regulated by Gli repression by blocking
protein kinase A (PKA) activity in the anterior region of nor-
mal chick wing buds, which is required for phosphorylation
of Gli proteins and Gli repressor formation (Tiecke et al.,
2007). To further refine our search for Hoxd13 syn-expressed
genes we compared the 3D expression patterns of a cohort
of mostly novel Shh responsive genes in the Hoxd13 cluster
and used previously described computational methods (Fish-
er et al., 2008) to cluster genes that were similarly expressed.
Through this sub-clustering, we dissected out a small group
of 6 genes syn-expressed with Hoxd13 and predicted to be
functionally related. We also identified other groups of syn-
expressed genes potentially involved in other processes, such
as vascularisation.
2. Materials and methods
2.1. Embryos
Fertilized white leghorn chicken eggs were obtained from
H. Stewart (Lincolnshire), incubated at 37 �C and staged
according to (Hamburger and Hamilton, 1951). Talpid3 carri-
ers were maintained and genotyped as per Davey et al.
(2006).

430 M E C H A N I S M S O F D E V E L O P M E N T 1 2 7 ( 2 0 1 0 ) 4 2 8 – 4 4 1
2.2. Collection of tissue and RNA extraction
Workspace and dissection tools were thoroughly cleaned
using RNaseZap (Ambion), and then rinsed in diethyl pyrocar-
bonate (depc, SIGMA) treated water. Stage HH24 embryos
were dissected into fresh depc treated PBS. Wing buds were
cut into thirds along the antero-posterior axis then placed
in RNAlater (Ambion). Normal anterior and posterior thirds
were pooled into groups of 10 pieces, which yielded sufficient
RNA (<500 ng/ll) to hybridise to a single Affymetrix gene
expression chip, so no amplification was required. We used
anterior and posterior thirds because this ensured that the
two limb regions were discrete. Talpid3 wing bud thirds were
stored separately until genotypes were confirmed. RNA was
extracted as per Affymetrix recommended protocol.
2.3. Microarray analysis
Relative levels of RNA transcripts were compared between
anterior and posterior wing bud thirds using chicken Affyme-
trix chips. Data collected with Affymetrix scanner was norma-
lised using the Plier algorithm within the expression console
package from Affymetrix and log2 transformed. Five replicates
of anterior third normal wing buds, 4 replicates of posterior
third of normal wing buds and 4 replicates each of anterior
and posterior thirds of talpid3 wing buds at stage HH24 were
examined. The correlation coefficient of these replicates is
95%. Sets of differentially expressed genes between specific
limb bud regions in normal and talpid3 mutant embryos were
identified using Limma (http://bioinf.wehi.edu.au/limma/). A
false discovery rate (FDR) of 5% was used. The data were then
clustered using Chinese restaurant clustering (Qin, 2006) and
visualised within the Genesis package (http://genome.tugra-
z.at/). The microarray data has been deposited in Array express
(accession E-MTAB-309).
2.4. Whole mount RNA in situ hybridisation
Whole mount in situ hybridization was performed as per
Wilkinson and Nieto (1993). For simultaneous detection of
two transcripts, embryos were hybridised with dioxygenin,
(DIG, Roche) and fluorescein (Roche) labelled probe. INT/BCIP
(Roche) was used to detect the first probe then subsequently
washed out using 100% methanol before the second probe
was detected with NBT/BCIP (Roche).
2.5. Implantation of Shh-soaked beads
Beads were prepared and implanted into the anterior of stage
HH21 Normal embryos as per Tiecke et al. (2007). Embryos
were incubated for 4–20 h before fixing in 4% PFA, then gene
expression analysed via in situ hybridisation.
2.6. Electroporation of presumptive limb
dnPKA RCAS or RCAS:GFP (1 lg/ll) construct and 1 lg/ll
pCAGGs RFP + 0.2% fast green were injected into the coelom
on right side of stage HH14 Normal embryos and a square
wave current of 60 V was applied for 50 ms 5 times using a
CUY21 Bex company electroporator (Tokyo). Embryos were
then incubated for 48 h. Those expressing RFP were fixed in
4% PFA and expression of viral protein and candidate gene
were analysed via double in situ hybridisation.
2.7. OPT scanning, mapping and computational analysis
Embryos were processed as previously described (Fisher et al.,
2008) and scanned with Bioptonics 3001 OPT scanner
(www.bioptonics.com). Three replicates of each gene expres-
sion pattern were mapped onto a reference limb at corre-
sponding stage (HH24) using Amira 4.1.1 software and a
median expression pattern was calculated using Wlz soft-
ware (Fisher et al., 2008). The reference limb was divided into
non-overlapping subregions of 5 · 5 · 5 voxels or tiles giving a
total of 2072 tiles using software from MRC HGU (Fisher et al.,
2008). Each tile was used to calculate mean gene expression
strength for each experimental gene expression pattern. Data
were normalised by stretching the grey histogram for each 3D
gene expression pattern to cover range from 0 to 255. A data
set containing medians only and a data set containing total
gene expression data (3 replicates for each gene, no medians)
were imported in Tigr Multi experiment Viewer (TMeV, http://
www.tm4.org/mev.html). Hierarchical clustering (Eisen et al.,
1998) was applied using Pearson correlation with complete
linkage to produce nested trees of (1) genes showing similar
patterns and (2) tiles showing similar expression profiles.
The number of clusters was determined by setting distance
threshold to 50%. Both gene clusters and tile clusters (spatial
domains) were then visualised using Amira 4.1.1 software
(Ruthensteiner and Hess, 2008).
3. Results
3.1. Microarray analysis of gene expression in normal andtalpid3 wing buds
Microarray analysis was used to compare gene expression
across the antero-posterior axis of wing buds in normal and
talpid3 mutant chicken embryos at stage HH24. 1070 differen-
tially expressed transcripts were identified and clustered
using Chinese Restaurant Clustering (Qin, 2006). This repre-
sents about 10% of genes expressed in the limb (Boardman
et al., 2002). Sixteen clusters of genes with different expres-
sion profiles (Supplementary Table 1) were obtained. We fo-
cussed on two clusters of genes expressed predominantly in
the posterior of normal wing buds; cluster 6 containing 66
transcripts relating to 56 genes, including Hoxd13, expressed
at high levels in anterior and posterior thirds of talpid3 mutant
wing buds and predicted to be regulated by Gli repressor
(Fig. 1A–C; Fig. 2A, class IV and Supplementary Table 2) and
cluster 5 containing 68 transcripts relating to 59 genes,
including Ptc1, expressed at low levels in anterior and poster-
ior thirds of talpid3 mutant wing buds and predicted to be reg-
ulated by Gli activator (Fig. 1D–F; Supplementary Table 3 and
Fig. 2A, class II; analogous to class II neural transcription fac-
tor genes Fig. 2B). Other clusters contained genes e.g., Bmp4,
expressed predominantly in the anterior of normal wing buds
and at high levels in anterior and posterior thirds of talpid3
mutant wing buds (Fig. 2A, class I; analogous to class I neural
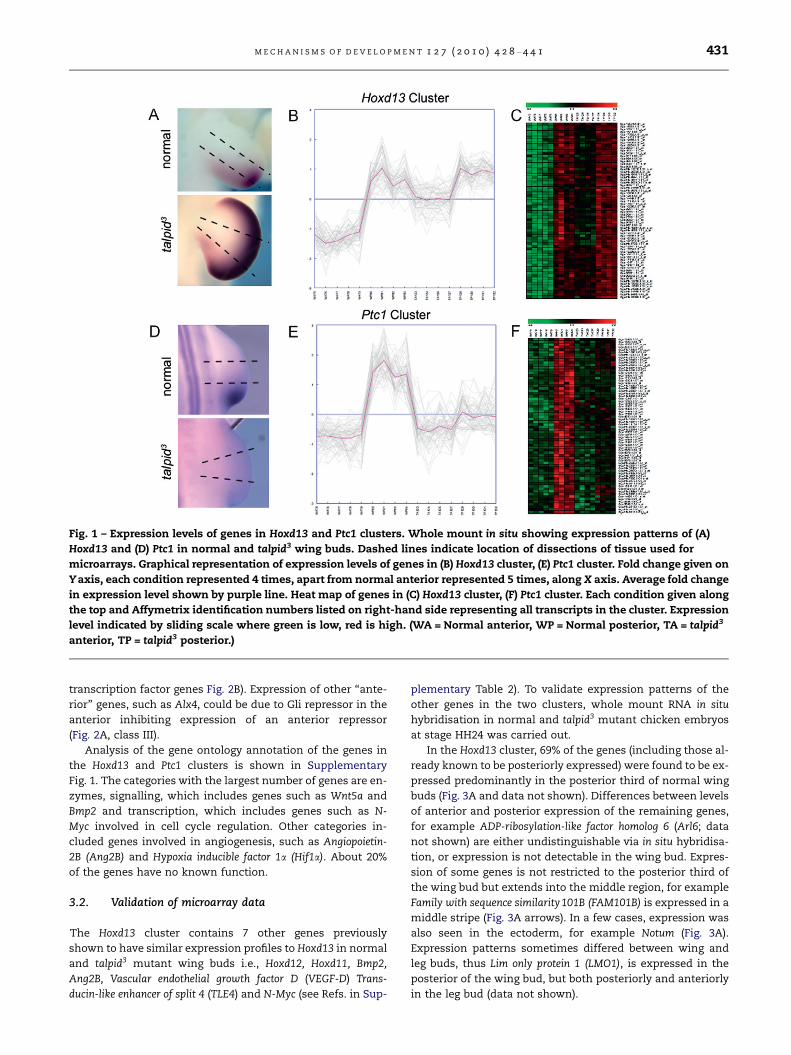
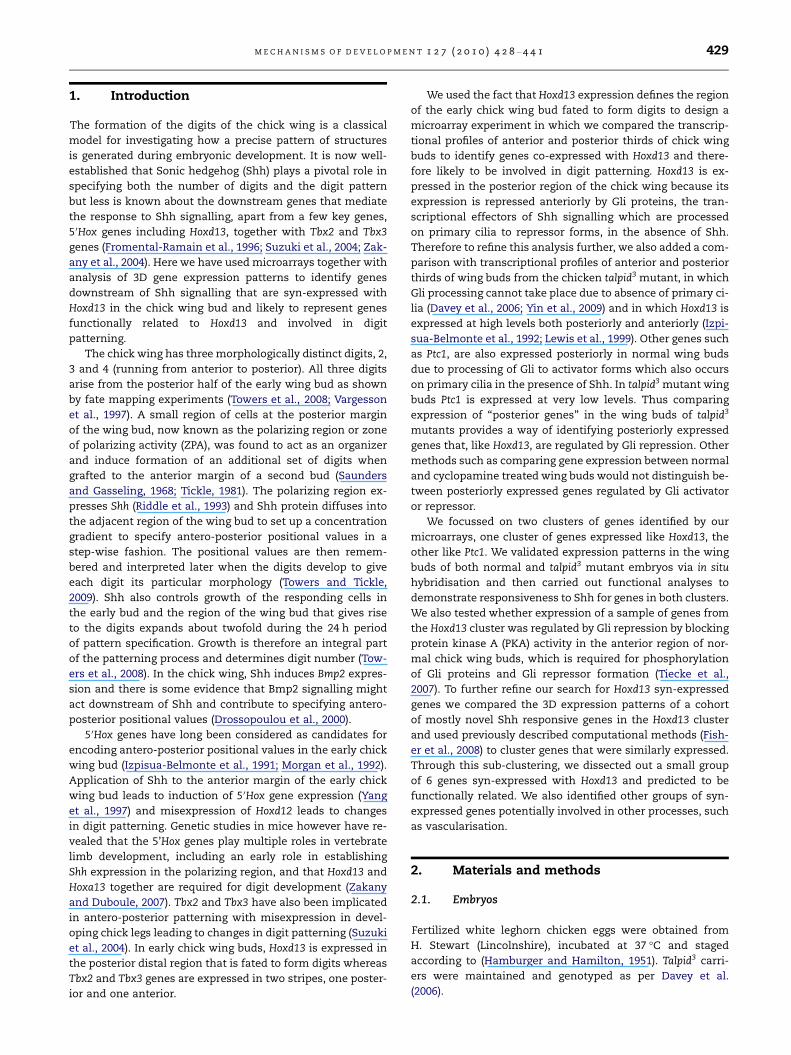
Fig. 1 – Expression levels of genes in Hoxd13 and Ptc1 clusters. Whole mount in situ showing expression patterns of (A)
Hoxd13 and (D) Ptc1 in normal and talpid3 wing buds. Dashed lines indicate location of dissections of tissue used for
microarrays. Graphical representation of expression levels of genes in (B) Hoxd13 cluster, (E) Ptc1 cluster. Fold change given on
Yaxis, each condition represented 4 times, apart from normal anterior represented 5 times, along X axis. Average fold change
in expression level shown by purple line. Heat map of genes in (C) Hoxd13 cluster, (F) Ptc1 cluster. Each condition given along
the top and Affymetrix identification numbers listed on right-hand side representing all transcripts in the cluster. Expression
level indicated by sliding scale where green is low, red is high. (WA = Normal anterior, WP = Normal posterior, TA = talpid3
anterior, TP = talpid3 posterior.)
M E C H A N I S M S O F D E V E L O P M E N T 1 2 7 ( 2 0 1 0 ) 4 2 8 – 4 4 1 431
transcription factor genes Fig. 2B). Expression of other ‘‘ante-
rior’’ genes, such as Alx4, could be due to Gli repressor in the
anterior inhibiting expression of an anterior repressor
(Fig. 2A, class III).
Analysis of the gene ontology annotation of the genes in
the Hoxd13 and Ptc1 clusters is shown in Supplementary
Fig. 1. The categories with the largest number of genes are en-
zymes, signalling, which includes genes such as Wnt5a and
Bmp2 and transcription, which includes genes such as N-
Myc involved in cell cycle regulation. Other categories in-
cluded genes involved in angiogenesis, such as Angiopoietin-
2B (Ang2B) and Hypoxia inducible factor 1a (Hif1a). About 20%
of the genes have no known function.
3.2. Validation of microarray data
The Hoxd13 cluster contains 7 other genes previously
shown to have similar expression profiles to Hoxd13 in normal
and talpid3 mutant wing buds i.e., Hoxd12, Hoxd11, Bmp2,
Ang2B, Vascular endothelial growth factor D (VEGF-D) Trans-
ducin-like enhancer of split 4 (TLE4) and N-Myc (see Refs. in Sup-
plementary Table 2). To validate expression patterns of the
other genes in the two clusters, whole mount RNA in situ
hybridisation in normal and talpid3 mutant chicken embryos
at stage HH24 was carried out.
In the Hoxd13 cluster, 69% of the genes (including those al-
ready known to be posteriorly expressed) were found to be ex-
pressed predominantly in the posterior third of normal wing
buds (Fig. 3A and data not shown). Differences between levels
of anterior and posterior expression of the remaining genes,
for example ADP-ribosylation-like factor homolog 6 (Arl6; data
not shown) are either undistinguishable via in situ hybridisa-
tion, or expression is not detectable in the wing bud. Expres-
sion of some genes is not restricted to the posterior third of
the wing bud but extends into the middle region, for example
Family with sequence similarity101B (FAM101B) is expressed in a
middle stripe (Fig. 3A arrows). In a few cases, expression was
also seen in the ectoderm, for example Notum (Fig. 3A).
Expression patterns sometimes differed between wing and
leg buds, thus Lim only protein 1 (LMO1), is expressed in the
posterior of the wing bud, but both posteriorly and anteriorly
in the leg bud (data not shown).

Fig. 2 – Classification of genes expressed in the chick wing according to how they are regulated by Shh signalling. (A)
Schematic showing 4 classes of gene expression in chick wing. Class I genes e.g., Bmp4, expressed predominantly in anterior
normal wing buds but at high levels throughout talpid3 wing buds (Francis-West et al., 1995) due to lack of posterior Gli
activator which normally promotes expression of unknown repressor; analogous to class I neural transcription factors
(shown in B). Class II genes e.g. Ptc1, expressed predominantly in posterior of normal wing buds but with no high level
expression in talpid3 wing buds (Lewis et al., 1999) due to absence of Gli activator in posterior; analogous to class II neural
transcription factors (shown in B). Class III genes e.g., Alx4 expressed predominantly in anterior normal wing buds but not
expressed in talpid3 wing buds (Davey, M.; unpublished observations) due to absence of anterior Gli repressor which normally
inhibits expression of an unknown repressor. Class IV genes e.g. Hoxd13 expressed predominantly in posterior normal wing
buds but at high levels throughout talpid3 wing buds (Izpisua-Belmonte et al., 1992) due to absence of anterior Gli repressor.
432 M E C H A N I S M S O F D E V E L O P M E N T 1 2 7 ( 2 0 1 0 ) 4 2 8 – 4 4 1
92% of the ‘‘posterior’’ genes in the Hoxd13 cluster are ex-
pressed at high levels across the entire antero-posterior axis
of talpid3 mutant wing buds (Fig. 3A and data not shown, Sup-
plementary Table 2 red, orange, yellow and tan), while expres-
sion of the remaining genes was barely detectable in the wing
bud, thus resembling an Ptc1 expression profile (Supplemen-
tary Table 2 green). Ectoderm neural cortex 1 (ENC1) is expressed
throughout talpid3 wing buds (Fig. 3A) but no expression was
detected in talpid3 leg buds (data not shown).
In the Ptc1 cluster, 54% of the genes were found to be ex-
pressed predominantly in posterior thirds of normal wing
buds. 31% of these ‘‘posterior’’ genes are expressed at very
low levels in both anterior and posterior thirds of talpid3 mu-
tant wing buds (Fig. 3B and data not shown; Supplementary
Table 3 red, orange and yellow), while, unexpectedly, 50%
are expressed at high levels throughout talpid3 mutant wing
buds, more like Hoxd13 (Supplementary Table 3 green; expres-
sion of 5 genes was the same in talpid3 as in wild-type; 1 gene
was not tested; Supplementary Table 3 blue and tan).
Although these in situ hybridization data generally confirm
the microarray data, a few Hoxd13-like genes are expressed in
a Ptc1-like pattern while many genes in the Ptc1 cluster are
expressed in a Hoxd13-like pattern. The difference between
these clusters is the level of gene expression in the talpid3
mutant wing bud. The Chinese restaurant clustering algo-
rithm determines a threshold expression value above which
genes are clustered with Hoxd13 and below with Ptc1. Some
genes in the Ptc1 cluster have an expression level below this
threshold however by in situ hybridisation gene expression
can be detected throughout the talpid3 mutant wing bud more
akin to Hoxd13.
3.3. Regulation of gene expression by Shh
To test directly whether expression of genes in the Hoxd13
and Ptc1 clusters in normal chick wing buds is responsive to
Shh, beads soaked in 1 mg/ml Shh protein were implanted
into the anterior margin or middle of stage HH19/20 wing
buds and gene expression analysed by in situ hybridisation
after 16–20 h (Yang et al., 1997). Beads soaked in PBS were
used as a control and no change in Hoxd13 expression was de-
tected (11/11 cases).
Nine genes in the Hoxd13 cluster have already been shown
to be responsive to Shh, including Hoxd13, Bmp2 and VEGF-D,
with ectopic gene expression being induced following Shh
treatment (Supplementary Table 2 see references) (Dealy
et al., 1993; Farrell and Munsterberg, 2000; Francis et al.,
1994; Nelson et al., 1996; Ros et al., 1997; Trelles et al., 2002).
Nineteen other genes in the cluster were also found to be
responsive to Shh (Fig. 4A and data not shown; Supplemen-
tary Table 2 red, orange, yellow). High levels of ectopic expres-
sion of some genes, for example Ubiquitin carboxyl-terminal
hydrolase isozyme L1 (UCHL1) were induced anteriorly by Shh
(Fig. 4A), while for other genes, there is weaker induction,
for example FAM101B (Fig. 4A).
Expression of 5 genes from the Ptc1 cluster, Ptc1 itself, Phos-
phatidylinositol-specific phospholipase C, X domain containing 3
(PLC DX), Potassium voltage-gated channel subfamily H member
5 (KCNH5), SIX1, Synaptotagmin-9 (SYNT9-near) was found to
be induced in response to Shh (Fig. 4B and data not shown;
Supplementary Table 3, red) while expression of Mu-type opi-
oid receptor (OPRM1) was not (Fig. 4B and Supplementary Ta-
ble 3 orange). The extent of the response was variable with

Fig. 3 – Expression patterns of genes in Hoxd13 and Ptc1 clusters in stage HH24 normal and talpid3 mutant wing buds. Whole
mount in situ hybridizations in normal and talpid3 mutant wing buds at stage HH24 showing expression of a sample of the
genes identified by the microarrays in (A) Hoxd13 and (B) Ptc1 clusters. Gene name on left-hand side. All genes expressed in
posterior of normal wing buds and either expressed throughout talpid3 wing (genes in Hoxd13 cluster) or absent in talpid3
wing (genes in Ptc1 cluster). In most cases, expression in the normal wing bud is restricted to posterior mesenchyme, but
FAM101B is also expressed in stripe through middle of wing (arrows) and Notum expressed in apical ectodermal ridge.
M E C H A N I S M S O F D E V E L O P M E N T 1 2 7 ( 2 0 1 0 ) 4 2 8 – 4 4 1 433
expression of some genes, for example, KCHN5 being induced
all around the bead, while, in the case of SYNT9-near, poster-
ior expression was extended more anteriorly. Ptc1 is known to
be a direct target of Gli activator and ectopic Ptc1 expression
has been shown to be induced in anterior mesenchyme as
early as 4 h following implantation of a Shh-soaked bead
(Drossopoulou et al., 2000). Ectopic expression of PLC DX
was also induced after 4 h exposure to Shh (1/2 cases)
whereas SYNT-near was not (0/2 cases; Fig. 3C) suggesting
that PLC DX may be a direct target of Gli activator.
These results show that expression of many genes in both
clusters is regulated by Shh signalling as would be predicted
from the changes in expression seen in talpid3 wing buds.
3.4. Regulation of expression of genes in the Hoxd13cluster by Gli repressor
To determine directly whether expression of genes in the
Hoxd13 cluster is negatively regulated by Gli3 repressor, we
over-expressed dnPKA in the anterior region of normal wing
buds, along with RFP, to control for transfection efficiency (Tie-
cke et al., 2007). Expression of Hoxd13 was expanded anteriorly
after dnPKA over-expression (5/5 cases, Fig. 5; over-expression
of GFP acted as a control and Hoxd13 expression was unaffected
despite significant GFP expression, 5/5 cases). Expression of
LMO1, Scrapie-responsive protein 1 precursor (SCRG1), UCHL1,
ENC1, notum, 1-acyl-sn-glycerol-3-phosphate acyltransferase epsi-
lon (AGPAT5), Family with sequence similarity 49, member A
(FAM49A) and Bmp2 was also increased in the anterior region
of the wing bud after over-expression of dnPKA (Fig. 5 and Sup-
plementary Table 2 red). In contrast, expression of FAM101B ap-
peared to be reduced (Fig. 5) together with expression of
Rabphilin3A-like (DOC2A) while expression of 3 other genes
was unchanged (Supplementary Table 2 yellow).
These results demonstrate that expression of Hoxd13 and 8
out of the 13 other genes in the cluster tested is regulated by
Gli repressor in the chick wing bud, validating our approach of
using the expression pattern in talpid3 mutant wing bud to
identify genes that are regulated by Gli repressor versus Gli
activator.

Fig. 4 – Regulation of gene expression by Shh. Whole mount
in situ hybridisation either (A) and (B) 16–20 h or (C) 4 h, after
implantation of Shh-soaked bead to anterior or middle of
right wing bud. Gene names on left-hand side. Compare
right and left wing buds, arrows indicate ectopic gene
expression; asterisks indicate location of bead.
Fig. 5 – Regulation of expression of genes in the Hoxd13
cluster by dnPKA. Co-electroporation of dnPKA viral
construct and RFP into presumptive right wing bud. Left
hand column shows RFP expression, limb outlined with
dashed white line. Whole mount in situ hybridsation shows
change in gene expression (arrows), compare left and right
wing buds. Expression of all genes is upregulated apart
from FAM101B, which appears to be reduced.
434 M E C H A N I S M S O F D E V E L O P M E N T 1 2 7 ( 2 0 1 0 ) 4 2 8 – 4 4 1
3.5. Syn-expression groups within Hoxd13 cluster
The precise expression patterns of genes within the
Hoxd13 cluster in normal wing buds varied with some pat-
terns being more posteriorly restricted than others (Fig. 3).
Therefore to sift out genes that are syn-expressed with
Hoxd13, we compared 3D expression patterns of 26 genes in
the Hoxd13 cluster in normal wing buds, concentrating mostly
on novel genes, 23 of which had been shown to be responsive
to Shh. Whole mount in situ hybridization was carried out to
give 3 replicate expression patterns for each of the 26 genes
(Shh expression patterns were also added for comparison),
the whole mounts were scanned using Optical Projection
Tomography (Sharpe et al., 2002), the digital 3D spatial
expression patterns obtained were mapped onto a reference
wing bud at the corresponding stage using Amira software
(Fisher et al., 2008) and a median gene expression pattern
for each gene was calculated. Quantitative comparisons were
made by dividing the reference limb, with all the expression
data mapped onto it, into 5 · 5 · 5 voxels giving a total of
2072 ‘tiles’ (see Section 2); and the mean gene expression
M E C H A N I S M S O F D E V E L O P M E N T 1 2 7 ( 2 0 1 0 ) 4 2 8 – 4 4 1 435
strength in each tile was calculated for each experimental
gene expression pattern.
Fig. 6 (Supplementary Video 1) shows a heat map gener-
ated using median expression patterns of each gene and illus-
trates the number of genes with a mean expression value
greater than 30 in each tile throughout the wing bud; red indi-
cates where the highest number of genes is expressed and
blue indicates where very few genes are expressed. The
superimposition of dissection cuts on the heat map (Fig. 6A)
shows that all the genes are expressed in the posterior third
of the limb and none in the anterior third. Thus the 3D
expression profiles produced by OPT from whole mount
in situ hybridisation fit very well with the microarray expres-
sion profile. Many genes are also expressed in the middle
third of the limb, correlating with in situ hybridisation
expression patterns (Fig. 3A). The heat map also reveals that
many genes are expressed with a ventral bias (Fig. 6B–E).
Although we have not verified these data by section analysis
our previous work has shown OPT is able to accurately distin-
guish dorsal ventral asymmetry of gene expression (Fisher
et al., 2008).
Both data sets, the medians and the total gene expression
data (3 replicates for each gene, no medians) were clustered
using hierarchical clustering. This produced clusters of non-
overlapping spatial domains, each expressing a unique set
of genes, and clusters of genes with similar expression pat-
terns. Twenty three spatial clusters were generated from the
median data set (Fig. 7, rows; 3 spatial clusters showed
Fig. 6 – Heat Map showing expression intensity of genes from Ho
Hoxd13 cluster and the Shh gene to show the number of genes
indicates all 27 genes expressed with a gradient red to blue ind
Highest number of genes expressed in distal posterior ventral re
view, dashed lines indicate location of dissections of tissue use
planes of section for digital sections in C–E. (C) Digital section nu
is slightly higher in ventral region (v). (D) Digital section numbe
region of wing bud showing expression of genes in ventral regi
expression artefacts outside the limb and were omitted from
further analysis; also see Supplementary Video 2, Supplemen-
tary Tables 4 and 5). Seven gene clusters were generated from
the median data set (Fig. 7 columns, Fig. 8; also see Supple-
mentary Table 6). In the total gene expression data set, repli-
cates of 15 genes had a correlation coefficient >80%, replicates
of 9 genes had a correlation coefficient >70% and replicates of
3 genes had a correlation coefficient >60% indicating the cor-
relation between replicates was high and expression patterns
were consistent.
Four of the spatial clusters, 9, 14, 19 and 22 contain Hoxd13
(Table 1) and when added together recreate the complete
Hoxd13 expression pattern. Cluster 19 contains 21 genes,
(Supplementary Video 3 green) is the most posteriorly re-
stricted cluster of tiles at the tip of the wing bud and the only
cluster to include Shh. String analysis of the genes in this clus-
ter show predicted interactions based on neighbourhood evi-
dence between 5 of the genes (Shh, Hoxa10, Sall1, Hoxd13 and
LMO1; Jensen et al., 2009). Cluster 19 is encircled by cluster 14,
containing 23 genes, which forms a narrow ring of tiles more
proximally (Fig. 6 yellow). Cluster 9 contains 24 genes, (Sup-
plementary Video 3 purple) is posterior but further proximal
and ventral to cluster 14. Cluster 22 containing 23 genes, (Sup-
plementary Video 3 pink) extends further proximally still and
dorsally from cluster 9 and represents the faint ‘‘tail’’ of
Hoxd13 expression which extends proximally. Other more
anterior spatial clusters are also present and contain smaller
numbers of genes not including Hoxd13.
xd13 cluster. Heatmap depicting expression of 26 genes from
expressed in different regions of reference wing bud. Red
icating lower numbers of genes expressed, see scale (Ai).
gion of wing bud (see also Supplementary Fig. 3). (A) Dorsal
d for microarrays. (B) Ventral view; lines on wing bud depict
mber 25, showing expression of genes in distal part of limb
r 35 through middle and (E) number 50 through proximal
on (v) is higher than in dorsal region (d).

Fig. 7 – Hierarchical clustering of median expression pattern of genes from Hoxd13 cluster. (A) Matrix showing hierarchical
clustering of median 3D expression of posterior clusters generated using 26 genes from Hoxd13 cluster and Shh. Each cell
represents a 5 · 5 · 5 voxel spatial volume in HH24 reference limb and coloured according to mean signal intensity, red = high
gene expression to dark blue = low expression. Columns represent gene clusters; rows represent spatial clusters. (B) 3D
Visualisation of the posterior spatial domains, representing the spatial clusters shown in Fig. 7A.
436 M E C H A N I S M S O F D E V E L O P M E N T 1 2 7 ( 2 0 1 0 ) 4 2 8 – 4 4 1
One of the 7 gene syn-expression groups contains Hoxd13
and 6 other genes including Sall1 (Supplementary Fig. 2), 3
syn-expression groups contain 2–10 genes and 3 contain only
one gene (Fig. 8). Another syn-expression group contains
VEGF-D and FAM101B, which both appear to be expressed in
the main limb artery and Ephrin type-B receptor 1 (EphB1;
Fig. 8). It should be noted that genes whose expression was in-
duced anteriorly by dnPKA and therefore regulated by Gli
repressor are represented in 5 of the 7 groups (Fig. 8, Bold).
Thus the computational analysis not only dissected out
discrete domains of expression with, as expected, those con-
taining Hoxd13 being located in the posterior region of the
wing bud, but also identified genes syn-expressed with
Hoxd13.
4. Discussion
We have used microarrays to compare the transcriptional
profiles of tissue from normal and mutant chick wing buds
and identified 35 genes that are predominantly expressed in
the posterior of chick wing buds like Hoxd13 and regulated
by Gli repressor. We have identified a further 10 genes also ex-
pressed in the posterior which are likely to be regulated by Gli
activator as expression of these genes is lost in talpid3 mutant
wing buds. Previous work comparing the genes expressed in
the anterior of normal and Gli3 mutant mouse limb buds
identified 17 genes differentially expressed, and one of these
was Slug also identified in our analysis (McGlinn et al., 2005).
More recently, Vokes et al. (2008) carried out a series of micro-

Cluster Gene Name 1 Notum *
2 Shh CPXM2 TCERG1L TLE4 SALL1 Hoxd13 SCRG1
3
FAM49A FAM123A RASSF3 DOC2A SYMD2
4
MAN1A1 LMO1 ENC1 EphB1 MME BID FAM101B FSTL4 Hoxa10 Hoxa11
5
VEGFD COLEC12 6 AGPAT5
7 UCHL1
1and 2
3
4
5
6
7
Fig. 8 – Gene clusters of median 3D expression data. Seven gene clusters generated by Hierarchical clustering of median 3D
expression patterns of 26 genes from the Hoxd13 cluster and of the Shh gene. Shh clusters alone indicating no other gene has
exactly the same expression pattern. Expression of genes in bold, is induced by over-expression of dnPKA demonstrating
negative regulation by Gli repressor. Each cluster of genes depicted on right-hand side in 3D. *Only ectodermal expression of
Notum was mapped in this analysis.
M E C H A N I S M S O F D E V E L O P M E N T 1 2 7 ( 2 0 1 0 ) 4 2 8 – 4 4 1 437
array comparisons between various normal and mutant
mouse limb buds, including Gli3 mutants, and sophisticated
genetic experiments to find posterior genes directly regulated
by Gli3 repressor. They identified 23 genes with a Gli binding
site that showed very pronounced asymmetry in expression.
Despite the species difference, tissue selection and stage of
development (E11.5 mouse limb bud is more developmentally
advanced than chick stage HH24 wing buds), 9 of the genes
identified by Vokes et al. (2008) also featured in our analysis
(Supplementary Table 5), including 4 of the genes in our
Hoxd13 cluster, Hoxd13 itself, Sall, Hoxd11, and Bmp2 and two
of the genes in our Ptc1 cluster, Ptc1 itself and Hand2. All of
these 6 genes are already known to be involved in vertebrate
limb development.
By clustering 3D expression patterns of genes in the
Hoxd13 cluster, we found 6 genes that are syn-expressed with
Hoxd13 at the posterior of the chick wing bud and potentially
functionally related and involved in digit patterning. Interest-
ingly, the product of another gene in this syn-expression
group, Sall1, a gene also likely to be directly regulated by Gli
repressor according to Vokes et al. (2008) is known to interact
with Hoxd13 by competing for target binding sequences of
Hoxd13 target genes (Kawakami et al., 2009). The fact that
two of the genes in this syn-expression group are already
known to be functionally related validates our approach.
Fig. 9 shows how our data can fit into the relevant part of
the model for the cis-regulatory network underlying Gli-med-
iated limb patterning produced by Vokes et al. (2008). Since
our microarray analysis will identify both direct and indirect
targets of Shh signalling, the other 5 syn-expressed genes in
the group TLE4, TCERG1L, SCRG1, CPXM2 and FAM49A are
therefore predicted to be downstream of Hoxd13 and/or Sall1
and the next step will be to determine whether and how the
syn-expressed genes interact.
Expression of one of these genes, TLE4, a member of the
Groucho family, has been previously described in developing
wing buds (Van Hateren et al., 2005) and TLE4 and TCERG1L
encode proteins that play roles in regulating gene transcrip-
tion. TLE4 can function as a co-repressor and interact with a
range of different DNA-binding proteins including those in-
volved in mediating signalling pathways, including Notch,
Wnt and Bmp (Buscarlet and Stifani, 2007). SCRG1 encodes a
secreted protein and is strongly expressed in articular carti-
lage (Ochi et al., 2006), while CPXM2 encodes a novel metallo-
carboxypeptidase, although it is not clear whether it has
enzymatic activity (Xin et al., 1998). There is no information
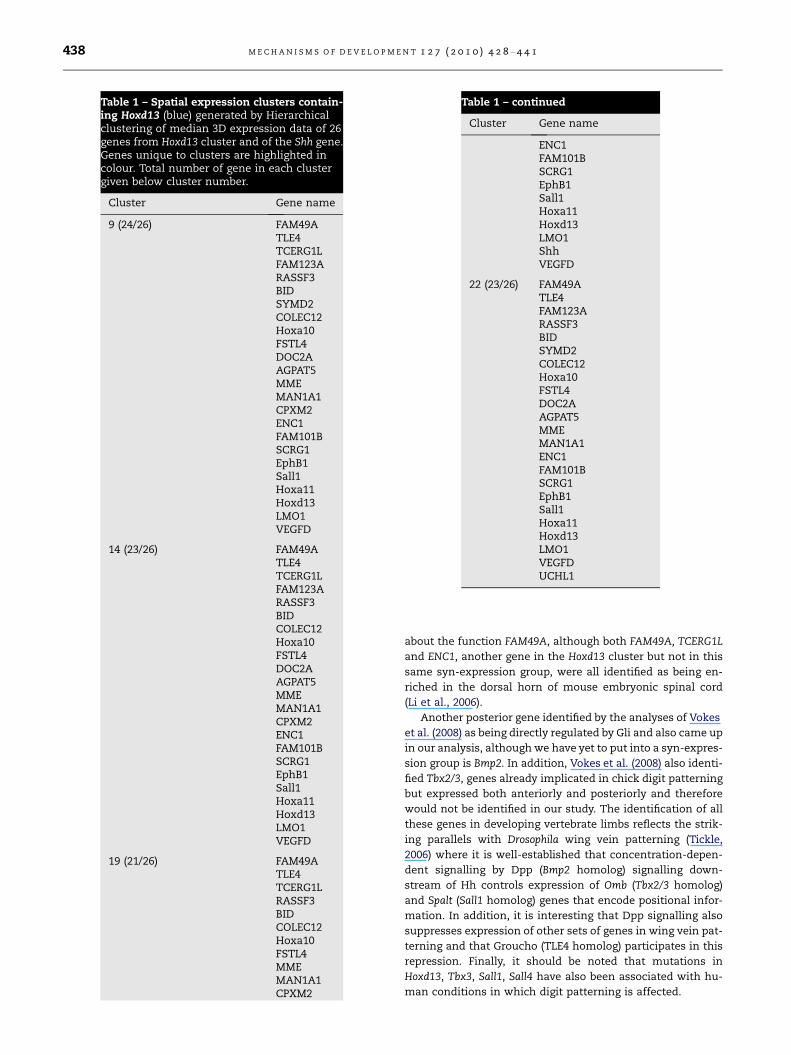
Table 1 – continued
Cluster Gene name
ENC1FAM101BSCRG1EphB1Sall1Hoxa11Hoxd13LMO1ShhVEGFD
22 (23/26) FAM49ATLE4FAM123ARASSF3BIDSYMD2COLEC12Hoxa10FSTL4DOC2AAGPAT5MMEMAN1A1ENC1FAM101BSCRG1EphB1Sall1Hoxa11Hoxd13LMO1VEGFDUCHL1
Table 1 – Spatial expression clusters contain-ing Hoxd13 (blue) generated by Hierarchicalclustering of median 3D expression data of 26genes from Hoxd13 cluster and of the Shh gene.Genes unique to clusters are highlighted incolour. Total number of gene in each clustergiven below cluster number.
Cluster Gene name
9 (24/26) FAM49ATLE4TCERG1LFAM123ARASSF3BIDSYMD2COLEC12Hoxa10FSTL4DOC2AAGPAT5MMEMAN1A1CPXM2ENC1FAM101BSCRG1EphB1Sall1Hoxa11Hoxd13LMO1VEGFD
14 (23/26) FAM49ATLE4TCERG1LFAM123ARASSF3BIDCOLEC12Hoxa10FSTL4DOC2AAGPAT5MMEMAN1A1CPXM2ENC1FAM101BSCRG1EphB1Sall1Hoxa11Hoxd13LMO1VEGFD
19 (21/26) FAM49ATLE4TCERG1LRASSF3BIDCOLEC12Hoxa10FSTL4MMEMAN1A1CPXM2
438 M E C H A N I S M S O F D E V E L O P M E N T 1 2 7 ( 2 0 1 0 ) 4 2 8 – 4 4 1
about the function FAM49A, although both FAM49A, TCERG1L
and ENC1, another gene in the Hoxd13 cluster but not in this
same syn-expression group, were all identified as being en-
riched in the dorsal horn of mouse embryonic spinal cord
(Li et al., 2006).
Another posterior gene identified by the analyses of Vokes
et al. (2008) as being directly regulated by Gli and also came up
in our analysis, although we have yet to put into a syn-expres-
sion group is Bmp2. In addition, Vokes et al. (2008) also identi-
fied Tbx2/3, genes already implicated in chick digit patterning
but expressed both anteriorly and posteriorly and therefore
would not be identified in our study. The identification of all
these genes in developing vertebrate limbs reflects the strik-
ing parallels with Drosophila wing vein patterning (Tickle,
2006) where it is well-established that concentration-depen-
dent signalling by Dpp (Bmp2 homolog) signalling down-
stream of Hh controls expression of Omb (Tbx2/3 homolog)
and Spalt (Sall1 homolog) genes that encode positional infor-
mation. In addition, it is interesting that Dpp signalling also
suppresses expression of other sets of genes in wing vein pat-
terning and that Groucho (TLE4 homolog) participates in this
repression. Finally, it should be noted that mutations in
Hoxd13, Tbx3, Sall1, Sall4 have also been associated with hu-
man conditions in which digit patterning is affected.

Fig. 9 – Gene regulatory network downstream of Shh. Gene regulatory network downstream of Shh in the limb (modified from
Vokes et al., 2008). Arrows originate from a gene that positively regulates the target where the arrow ends. Blunt ended lines
originate from a gene that negatively regulates the target where the line ends. Solid lines are taken from a schematic in Vokes
et al. (2008). Dashed lines and highlighted genes are those identified in our study. Dashed lines indicate this regulation is not
proven and may be indirect. Genes highlighted in green are primary targets and genes highlighted in blue are secondary
targets, of Shh signalling identified in the Hoxd13 cluster. Genes highlighted in pink are primary targets of Shh signalling
identified in the Ptc1 cluster, this includes HAND2 however HAND2 is expressed throughout the talpid3 wing bud indicating it
is negatively regulated by Gli repressor as shown in Vokes et al. (2008). Our data also shows that Bmp2 expression is
negatively regulated by Gli repressor, see red dotted line.
M E C H A N I S M S O F D E V E L O P M E N T 1 2 7 ( 2 0 1 0 ) 4 2 8 – 4 4 1 439
Another syn-expression group includes genes known to be
expressed in the vasculature, VEGFD and Ephrin type-B receptor
1 (EphB1) (Huynh-Do et al., 2002), this suggests a potential role
of Shh in regulating the vasculature. FAM101B, apparently co-
expressed with VEGFD in the main artery of the chick wing,
has no known function and these results suggest that it could
be involved in vascular development. This is further demon-
strated in the talpid3 mutant which has a highly abnormal
vasculature (Davey et al., 2007). Other syn-expressed genes
include Membrane metalloendopeptidase, LMO1 and BH3 death
domain agonist, which have been functionally linked in lym-
phomas (Bai et al., 2004). LMO1, has a homolog in Drosophila,
dLMO which negatively regulates activity of the LIM homeo-
domain transcription factor, Apterous (Zeng et al., 1998) in
wing development. Interestingly, LMO1 was recently identi-
fied as a potential Hox gene target in the hindbrain (Chambers
et al., 2009).
Another gene in the Hoxd13 cluster with a homolog in
Drosophila is Notum, currently not an syn-expression group
on its own because only the epithelial expression has been
mapped. Notum was first discovered through its ability to
modulate the gradient of Wingless across the Drosophila
wing disc (Giraldez et al., 2002). More recently it has emerged
that Notum, including mammalian Notum, cleaves the GPI
anchor that attaches heparin sulphate proteoglycans to the
cell surface (Traister et al., 2007). These proteoglycans not
only regulate Wnt activity but also the activity of several sig-
nalling molecules including Hedgehog. Therefore regulation
of Notum expression downstream of Shh signalling in the
chick wing may represent a feedback mechanism to modu-
late Shh signalling.
A larger set of 205 genes identified by Vokes et al. (2008)
included the gene encoding Arl6 or Bardet–Biedl syndrome
3 protein (BBS3) (Chiang et al., 2004), which was present
in our Hoxd13 cluster. Arl6 localises to ciliated cells in C. ele-
gans (Fan et al., 2004) and it is intriguing that our analysis
using talpid3 mutant embryos that lack primary cilia (Yin
et al., 2009) predicts that Arl6 is downstream of Shh signal-
ling in the chick wing. Arl6 is also another example of a
common gene that has been identified in these studies of
both chick and mouse embryos. This comparative approach
should be powerful in identifying conserved genes down-
stream of the Shh signalling with fundamental roles in digit
patterning.

440 M E C H A N I S M S O F D E V E L O P M E N T 1 2 7 ( 2 0 1 0 ) 4 2 8 – 4 4 1
Acknowledgments
This work was supported by Grants from the Biotechnology
and Biological Sciences Research Council CT and DB (joint
grants) G20298 and G20297 supporting YY and MD, respec-
tively, FB was supported by a BBSRC Studentship and Grant
BB/E014496/1 to CT, MW by grant BB/G00093X/1 to CT. CT
and HD were supported by The Royal Society. We thank Ark
Genomics funded by the BBSRC for supplying ESTs and micro-
array analysis.
Appendix A. Supplementary data
Supplementary data associated with this article can be found,
in the online version, at doi:10.1016/j.mod.2010.08.001.
R E F E R E N C E S
Bai, M., Skyrlas, A., Agnantis, N.J., Kamina, S., Tsanou, E., Grepi,C., Galani, V., Kanavaros, P., 2004. Diffuse large B-celllymphomas with germinal center B-cell-like differentiationimmunophenotypic profile are associated with high apoptoticindex, high expression of the proapoptotic proteins bax, bakand bid and low expression of the antiapoptotic protein bcl-xl.Mod. Pathol. 17 (7), 847–856.
Boardman, P.E., Sanz-Ezquerro, J., Overton, I.M., Burt, D.W., Bosch,E., Fong, W.T., Tickle, C., Brown, W.R., Wilson, S.A., Hubbard,S.J., 2002. A comprehensive collection of chicken cDNAs. Curr.Biol. 12 (22), 1965–1969.
Buscarlet, M., Stifani, S., 2007. The ‘Marx’ of Groucho ondevelopment and disease. Trends Cell Biol. 17 (7), 353–361.
Chambers, D., Wilson, L.J., Alfonsi, F., Hunter, E., Saxena, U.,Blanc, E., Lumsden, A., 2009. Rhombomere-specific analysisreveals the repertoire of genetic cues expressed across thedeveloping hindbrain. Neural Dev. 4, 6.
Chiang, A.P., Nishimura, D., Searby, C., Elbedour, K., Carmi, R.,Ferguson, A.L., Secrist, J., Braun, T., Casavant, T., Stone, E.M.,Sheffield, V.C., 2004. Comparative genomic analysis identifiesan ADP-ribosylation factor-like gene as the cause of Bardet–Biedl syndrome (BBS3). Am. J. Hum. Genet. 75 (3), 475–484.
Davey, M.G., Paton, I.R., Yin, Y., Schmidt, M., Bangs, F.K., Morrice,D.R., Smith, T.G., Buxton, P., Stamataki, D., Tanaka, M.,Munsterberg, A.E., Briscoe, J., Tickle, C., Burt, D.W., 2006. Thechicken talpid3 gene encodes a novel protein essential forHedgehog signaling. Genes Dev. 20 (10), 1365–1377.
Davey, M.G., James, J., Paton, I.R., Burt, D.W., Tickle, C., 2007.Analysis of talpid3 and wild-type chicken embryos revealsroles for Hedgehog signalling in development of the limb budvasculature. Dev. Biol. 301 (1), 155–165.
Dealy, C.N., Roth, A., Ferrari, D., Brown, A.M., Kosher, R.A., 1993.Wnt-5a and Wnt-7a are expressed in the developing chicklimb bud in a manner suggesting roles in pattern formationalong the proximodistal and dorsoventral axes. Mech. Dev. 43(2–3), 175–186.
Drossopoulou, G., Lewis, K.E., Sanz-Ezquerro, J.J., Nikbakht, N.,McMahon, A.P., Hofmann, C., Tickle, C., 2000. A model foranteroposterior patterning of the vertebrate limb based onsequential long- and short-range Shh signalling and Bmpsignalling. Development 127 (7), 1337–1348.
Eisen, M.B., Spellman, P.T., Brown, P.O., Botstein, D., 1998. Clusteranalysis and display of genome-wide expression patterns.Proc. Natl. Acad. Sci. USA 95 (25), 14863–14868.
Fan, Y., Esmail, M.A., Ansley, S.J., Blacque, O.E., Boroevich, K., Ross,A.J., Moore, S.J., Badano, J.L., May-Simera, H., Compton, D.S.,Green, J.S., Lewis, R.A., van Haelst, M.M., Parfrey, P.S., Baillie,D.L., Beales, P.L., Katsanis, N., Davidson, W.S., Leroux, M.R.,2004. Mutations in a member of the Ras superfamily of smallGTP-binding proteins causes Bardet–Biedl syndrome. Nat.Genet. 36 (9), 989–993.
Farrell, E.R., Munsterberg, A.E., 2000. Csal1 is controlled by acombination of FGF and Wnt signals in developing limb buds.Dev. Biol. 225 (2), 447–458.
Fisher, M.E., Clelland, A.K., Bain, A., Baldock, R.A., Murphy,P., Downie, H., Tickle, C., Davidson, D.R., Buckland, R.A.,2008. Integrating technologies for comparing 3D geneexpression domains in the developing chick limb. Dev.Biol. 317 (1), 13–23.
Francis, P.H., Richardson, M.K., Brickell, P.M., Tickle, C., 1994. Bonemorphogenetic proteins and a signalling pathway thatcontrols patterning in the developing chick limb. Development120 (1), 209–218.
Francis-West, P.H., Robertson, K.E., Ede, D.A., Rodriguez, C.,Izpisua-Belmonte, J.C., Houston, B., Burt, D.W., Gribbin, C.,Brickell, P.M., Tickle, C., 1995. Expression of genes encodingbone morphogenetic proteins and sonic hedgehog in talpid(ta3) limb buds: their relationships in the signalling cascadeinvolved in limb patterning. Dev. Dyn. 203 (2), 187–197.
Fromental-Ramain, C., Warot, X., Messadecq, N., LeMeur, M.,Dolle, P., Chambon, P., 1996. Hoxa-13 and Hoxd-13 play acrucial role in the patterning of the limb autopod.Development 122 (10), 2997–3011.
Giraldez, A.J., Copley, R.R., Cohen, S.M., 2002. HSPG modificationby the secreted enzyme Notum shapes the Winglessmorphogen gradient. Dev. Cell 2 (5), 667–676.
Hamburger, H., Hamilton, H.L., 1951. A series of normal stages inthe development of the chick e4mbryo. J. Exp. Morphol. 88, 49–92.
Huynh-Do, U., Vindis, C., Liu, H., Cerretti, D.P., McGrew, J.T.,Enriquez, M., Chen, J., Daniel, T.O., 2002. Ephrin-B1 transducessignals to activate integrin-mediated migration, attachmentand angiogenesis. J. Cell Sci. 115 (Pt 15), 3073–3081.
Izpisua-Belmonte, J.C., Tickle, C., Dolle, P., Wolpert, L., Duboule,D., 1991. Expression of the homeobox Hox-4 genes and thespecification of position in chick wing development. Nature350 (6319), 585–589.
Izpisua-Belmonte, J.C., Ede, D.A., Tickle, C., Duboule, D., 1992. Themis-expression of posterior Hox-4 genes in talpid (ta3) mutantwings correlates with the absence of anteroposterior polarity.Development 114 (4), 959–963.
Jensen, L.J., Kuhn, M., Stark, M., Chaffron, S., Creevey, C., Muller, J.,Doerks, T., Julien, P., Roth, A., Simonovic, M., Bork, P., vonMering, C., 2009. STRING 8–a global view on proteins and theirfunctional interactions in 630 organisms. Nucleic Acids Res.(Database Issue), D412–D416.
Kawakami, Y., Uchiyama, Y., Rodriguez Esteban, C., Inenaga, T.,Koyano-Nakagawa, N., Kawakami, H., Marti, M., Kmita, M.,Monaghan-Nichols, P., Nishinakamura, R., Izpisua Belmonte,J.C., 2009. Sall genes regulate region-specific morphogenesis inthe mouse limb by modulating Hox activities. Development136 (4), 585–594.
Lewis, K.E., Drossopoulou, G., Paton, I.R., Morrice, D.R., Robertson,K.E., Burt, D.W., Ingham, P.W., Tickle, C., 1999. Expression ofptc and gli genes in talpid3 suggests bifurcation in Shhpathway. Development 126 (11), 2397–2407.
Li, M.Z., Wang, J.S., Jiang, D.J., Xiang, C.X., Wang, F.Y., Zhang, K.H.,Williams, P.R., Chen, Z.F., 2006. Molecular mapping ofdeveloping dorsal horn-enriched genes by microarray anddorsal/ventral subtractive screening. Dev. Biol. 292 (2), 555–564.
McGlinn, E., van Bueren, K.L., Fiorenza, S., Mo, R., Poh, A.M.,Forrest, A., Soares, M.B., Bonaldo Mde, F., Grimmond, S., Hui,
M E C H A N I S M S O F D E V E L O P M E N T 1 2 7 ( 2 0 1 0 ) 4 2 8 – 4 4 1 441
C.C., Wainwright, B., Wicking, C., 1998. Pax9 and Jagged1 actdownstream of Gli3 in vertebrate limb development. Mech.Dev. 122 (11), 1218–1233.
Morgan, B.A., Izpisua-Belmonte, J.C., Duboule, D., Tabin, C.J., 1992.Targeted misexpression of Hox-4.6 in the avian limb budcauses apparent homeotic transformations. Nature 358 (6383),236–239.
Nelson, C.E., Morgan, B.A., Burke, A.C., Laufer, E., DiMambro, E.,Murtaugh, C., Gonzalez, E., Tessarollo, L., Parada, L.F., Tabin, C.,1996. Analysis of Hox gene expression in the chick limb bud.Development 122, 1449–1466.
Ochi, K., Derfoul, A., Tuan, R.S., 2006. A predominantly articularcartilage-associated gene, SCRG1, is induced by glucocorticoidand stimulates chondrogenesis in vitro. OsteoarthritisCartilage 14 (1), 30–38.
Qin, Z.S., 2006. Clustering microarray gene expression data usingweighted Chinese restaurant process. Bioinformatics 22 (16),1988–1997.
Riddle, R.D., Johnson, R.L., Laufer, E., Tabin, C., 1993. Sonichedgehog mediates the polarizing activity of the ZPA. Cell 75(7), 1401–1416.
Ros, M.A., Sefton, M., Nieto, A., 1997. Slug, a zinc finger genepreviously implicated in early patterning of the mesodermand neural crest, is also involved in chick limb development.Development 124, 1821–1829.
Ruthensteiner, B., Hess, M., 2008. Embedding 3D models ofbiological specimens in PDF publications. Microsc. Res. Tech.71 (11), 778–786.
Saunders, J.W., Gasseling, M.T., 1968. Ectodermal–mesenchymalinteractions in the origin of limb symmetry. In: Fleischmeyer,R., Billingham, R.E. (Eds.), Epithelial–MesenchymalInteractions. Baltimore, Williams & Wilkins, pp. 78–97.
Sharpe, J., Ahlgren, U., Perry, P., Hill, B., Ross, A., Hecksher-Sorensen, J., Baldock, R., Davidson, D., 2002. Optical projectiontomography as a tool for 3D microscopy and gene expressionstudies. Science 296 (5567), 541–545.
Suzuki, T., Takeuchi, J., Koshiba-Takeuchi, K., Ogura, T., 2004. Tbxgenes specify posterior digit identity through Shh and BMPsignaling. Dev. Cell 6 (1), 43–53.
Tickle, C., 1981. The number of polarizing region cells required tospecify additional digits in the developing chick wing. Nature289 (5795), 295–298.
Tickle, C., 2006. Making digit patterns in the vertebrate limb. Nat.Rev. Mol. Cell Biol. 7 (1), 45–53.
Tiecke, E., Turner, R., Sanz-Ezquerro, J.J., Warner, A., Tickle, C.,2007. Manipulations of PKA in chick limb development revealroles in digit patterning including a positive role in SonicHedgehog signaling. Dev. Biol. 305 (1), 312–324.
Towers, M., Tickle, C., 2009. Generation of pattern and form in thedeveloping limb. Int. J. Dev. Biol. 53 (5–6), 805–812.
All in-text references underlined in blue are linked to publications on Res
Towers, M., Mahood, R., Yin, Y., Tickle, C., 2008. Integration ofgrowth and specification in chick wing digit-patterning.Nature 452 (7189), 882–886.
Traister, A., Shi, W., Filmus, J., 2007. Mammalian Notum inducesthe release of glypicans and other GPI-anchored proteins fromthe cell surface. Biochem J. 410, 503–511.
Trelles, R.D., Leon, J.R., Kawakami, Y., Simoes, S., IzpisuaBelmonte, J.C., 2002. Expression of the chick vascularendothelial growth factor D gene during limb development.Mech. Dev. 116 (1–2), 239–242.
Van Hateren, N., Belsham, A., Randall, V., Borycki, A.G., 2005.Expression of avian Groucho-related genes (Grgs) duringembryonic development. Gene Expr. Patterns 5 (6), 817–823.
Vargesson, N., Clarke, J.D.W., Vincent, K., Coles, C., Wolpert, L.,Tickle, C., 1997. Cell fate in the chick limb bud and relationshipto gene expression. Development 124, 1909–1918.
Vokes, S.A., Ji, H., Wong, W.H., McMahon, A.P., 2008. A genome-scale analysis of the cis-regulatory circuitry underlying sonichedgehog-mediated patterning of the mammalian limb.Genes Dev. 22 (19), 2651–2663.
Wilkinson, D.G., Nieto, M.A., 1993. Detection of messenger RNA byin situ hybridization to tissue sections and whole mounts.Methods Enzymol. 225, 361–373.
Xin, X., Day, R., Dong, W., Lei, Y., Fricker, L.D., 1998. Identificationof mouse CPX-2, a novel member of themetallocarboxypeptidase gene family: cDNA cloning, mRNAdistribution, and protein expression and characterization.DNA Cell Biol. 17 (10), 897–909.
Yang, Y., Drossopoulou, G., Chuang, P.T., Duprez, D., Marti, E.,Bumcrot, D., Vargesson, N., Clarke, J., Niswander, L., McMahon,A., Tickle, C., 1997. Relationship between dose, distance andtime in Sonic Hedgehog-mediated regulation ofanteroposterior polarity in the chick limb. Development 124(21), 4393–4404.
Yin, Y., Bangs, F., Paton, I.R., Prescott, A., James, J., Davey, M.G.,Whitley, P., Genikhovich, G., Technau, U., Burt, D.W., Tickle, C.,2009. The Talpid3 gene (KIAA0586) encodes a centrosomalprotein that is essential for primary cilia formation.Development 136 (4), 655–664.
Zakany, J., Duboule, D., 2007. The role of Hox genes duringvertebrate limb development. Curr. Opin. Genet. Dev. 17 (4),359–366.
Zakany, J., Kmita, M., Duboule, D., 2004. A dual role for Hox genesin limb anterior-posterior asymmetry. Science 304, 1669–1672.
Zeng, C., Justice, N.J., Abdelilah, S., Chan, Y.M., Jan, L.Y., Jan, Y.N.,1998. The Drosophila LIM-only gene, dLMO, is mutated inBeadex alleles and might represent an evolutionarilyconserved function in appendage development. Proc. Natl.Acad. Sci. USA 95 (18), 10637–10642.
earchGate, letting you access and read them immediately.