Identification of Crop Areas Using SPOT - 5 Data
12
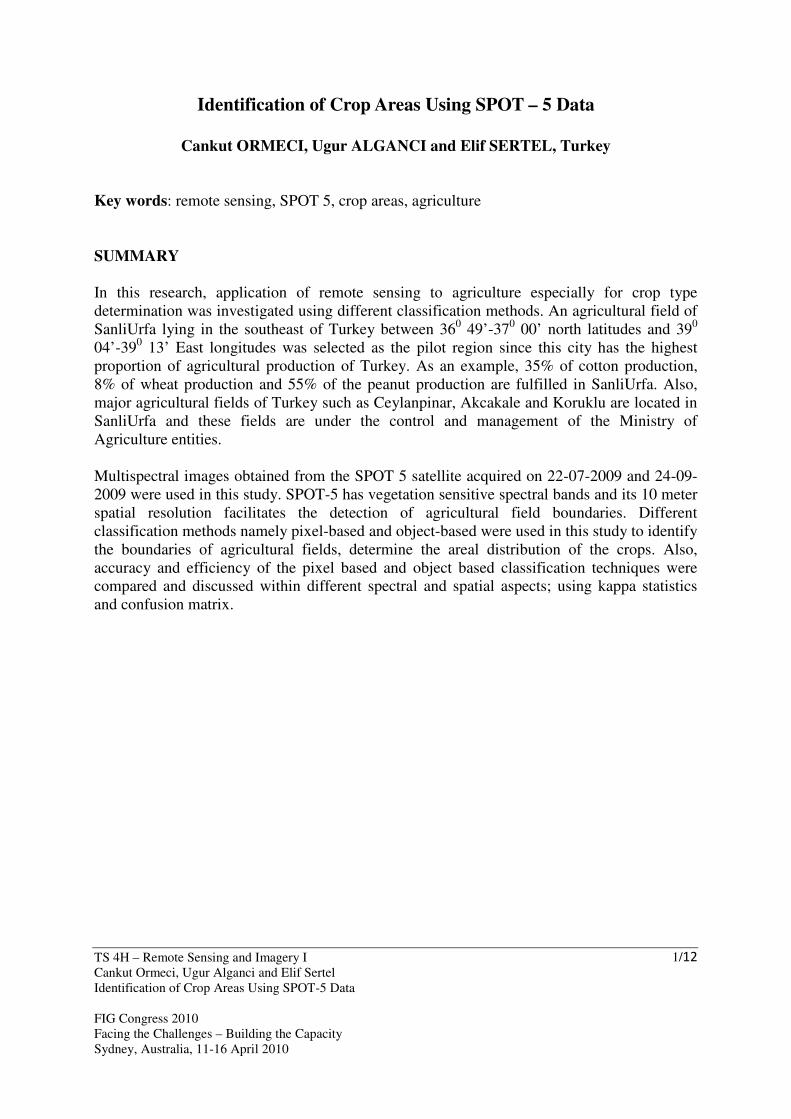
TS 4H – Remote Sensing and Imagery I Cankut Ormeci, Ugur Alganci and Elif Sertel Identification of Crop Areas Using SPOT-5 Data FIG Congress 2010 Facing the Challenges – Building the Capacity Sydney, Australia, 11-16 April 2010 1/12 Identification of Crop Areas Using SPOT – 5 Data Cankut ORMECI, Ugur ALGANCI and Elif SERTEL, Turkey Key words: remote sensing, SPOT 5, crop areas, agriculture SUMMARY In this research, application of remote sensing to agriculture especially for crop type determination was investigated using different classification methods. An agricultural field of SanliUrfa lying in the southeast of Turkey between 36 0 49’-37 0 00’ north latitudes and 39 0 04’-39 0 13’ East longitudes was selected as the pilot region since this city has the highest proportion of agricultural production of Turkey. As an example, 35% of cotton production, 8% of wheat production and 55% of the peanut production are fulfilled in SanliUrfa. Also, major agricultural fields of Turkey such as Ceylanpinar, Akcakale and Koruklu are located in SanliUrfa and these fields are under the control and management of the Ministry of Agriculture entities. Multispectral images obtained from the SPOT 5 satellite acquired on 22-07-2009 and 24-09- 2009 were used in this study. SPOT-5 has vegetation sensitive spectral bands and its 10 meter spatial resolution facilitates the detection of agricultural field boundaries. Different classification methods namely pixel-based and object-based were used in this study to identify the boundaries of agricultural fields, determine the areal distribution of the crops. Also, accuracy and efficiency of the pixel based and object based classification techniques were compared and discussed within different spectral and spatial aspects; using kappa statistics and confusion matrix.
-
Upload
istanbultek -
Category
Documents
-
view
2 -
download
0
Transcript of Identification of Crop Areas Using SPOT - 5 Data
TS 4H – Remote Sensing and Imagery I
Cankut Ormeci, Ugur Alganci and Elif Sertel
Identification of Crop Areas Using SPOT-5 Data
FIG Congress 2010
Facing the Challenges – Building the Capacity
Sydney, Australia, 11-16 April 2010
1/12
Identification of Crop Areas Using SPOT – 5 Data
Cankut ORMECI, Ugur ALGANCI and Elif SERTEL, Turkey
Key words: remote sensing, SPOT 5, crop areas, agriculture
SUMMARY
In this research, application of remote sensing to agriculture especially for crop type
determination was investigated using different classification methods. An agricultural field of
SanliUrfa lying in the southeast of Turkey between 360 49’-37
0 00’ north latitudes and 39
0
04’-390 13’ East longitudes was selected as the pilot region since this city has the highest
proportion of agricultural production of Turkey. As an example, 35% of cotton production,
8% of wheat production and 55% of the peanut production are fulfilled in SanliUrfa. Also,
major agricultural fields of Turkey such as Ceylanpinar, Akcakale and Koruklu are located in
SanliUrfa and these fields are under the control and management of the Ministry of
Agriculture entities.
Multispectral images obtained from the SPOT 5 satellite acquired on 22-07-2009 and 24-09-
2009 were used in this study. SPOT-5 has vegetation sensitive spectral bands and its 10 meter
spatial resolution facilitates the detection of agricultural field boundaries. Different
classification methods namely pixel-based and object-based were used in this study to identify
the boundaries of agricultural fields, determine the areal distribution of the crops. Also,
accuracy and efficiency of the pixel based and object based classification techniques were
compared and discussed within different spectral and spatial aspects; using kappa statistics
and confusion matrix.
TS 4H – Remote Sensing and Imagery I
Cankut Ormeci, Ugur Alganci and Elif Sertel
Identification of Crop Areas Using SPOT-5 Data
FIG Congress 2010
Facing the Challenges – Building the Capacity
Sydney, Australia, 11-16 April 2010
2/12
Identification of Crop Areas Using SPOT – 5 Data
Cankut ORMECI, Ugur ALGANCI and Elif SERTEL, Turkey
1. INTRODUCTION
Remote sensing systems with their synoptic viewing capability and variety of temporal and
spatial resolution are important data source to derive agricultural information. Remote sensing
methods are superior to conventional methods since fast and economic data acquisition and
fast processing of data using computer based analyses are possible in remote sensing.
Characteristics of agricultural field, difference of spectral reflectance of different crop types
and differences in feature characteristics such as shape and texture are important parameters
that should be considered while working agricultural areas with remote sensing. Remotely
sensed data provide identifiable signatures for crop type, crop density, crop geometry etc. in
order to perform agricultural survey and analysis.
With the development of remote sensing satellite systems, data derived from these systems
has been started to be widely used to map crop areas in different temporal and spatial scales.
It is possible to derive information about crop type, crop density and crop area with the
availability of different satellite imagery and developments in image processing and
interpretation systems (Turker et al., 2005).
Crop productivity information, which is a combination of two parameters namely the
information about crop type and the information about spatial coverage of that crop, is very
important for accurate crop yield estimation (Omkar et al, 2008). Crop productivity can be
expressed in terms of vegetation health and biomass density that can be derived from spectral
reflectance differences in different bands in satellite image. Spatial coverage of the crop area
can be interpreted by aerial properties such as shape and specific texture which also can be
derived from satellite imagery. Therefore, remotely sensed data can be used to produce these
information via specific analyses and results of these analyses can be used to create crop
maps.
Results of different studies that focused on crop area identification with remotely sensed data
has pointed out that, determination of different crop types in their growing stages cannot be
performed efficiently with single dated images. Within this context, classification of
multitemporal images gives identifiable results with added phenologic information (Murthy et
al, 2003).
Generally, classification and/or pattern recognition methods are used to identify and map crop
areas from multitemporal satellite imagery. Several image classification techniques are
available in the literature in which specific algorithms like Maximum Likelihood, Nearest
neighbor and minimum distance are used to identify surface objects and produce thematic
land cover maps (Harris, 2003).
TS 4H – Remote Sensing and Imagery I
Cankut Ormeci, Ugur Alganci and Elif Sertel
Identification of Crop Areas Using SPOT-5 Data
FIG Congress 2010
Facing the Challenges – Building the Capacity
Sydney, Australia, 11-16 April 2010
3/12
Several studies have been conducted to investigate the use of remotely sensed data in
agricultural monitoring and researches. Harris (2003) used multitemporal Landsat images to
determine agricultural change in selected two test areas located in Oman. He mainly focused
on unsupervised and supervised classification methods. He utilized two ISODATA
unsupervised classification with different number of clusters and a supervised maximum
likelihood classification. The results of these classifications were compared and it was
concluded that both ISODATA and Maximium likelihood methods could be able to define the
spatial extent well.
In this study, pixel based and object based classification techniques were used to perform
multitemporal crop area identification using two different dated SPOT 5 imageries. Dates
were selected to represent the agricultural activity period for the selected study area. Pixel and
object based classification results of these two images were compared and the best method in
terms of accuracy and efficiency was proposed.
2. STUDY AREA
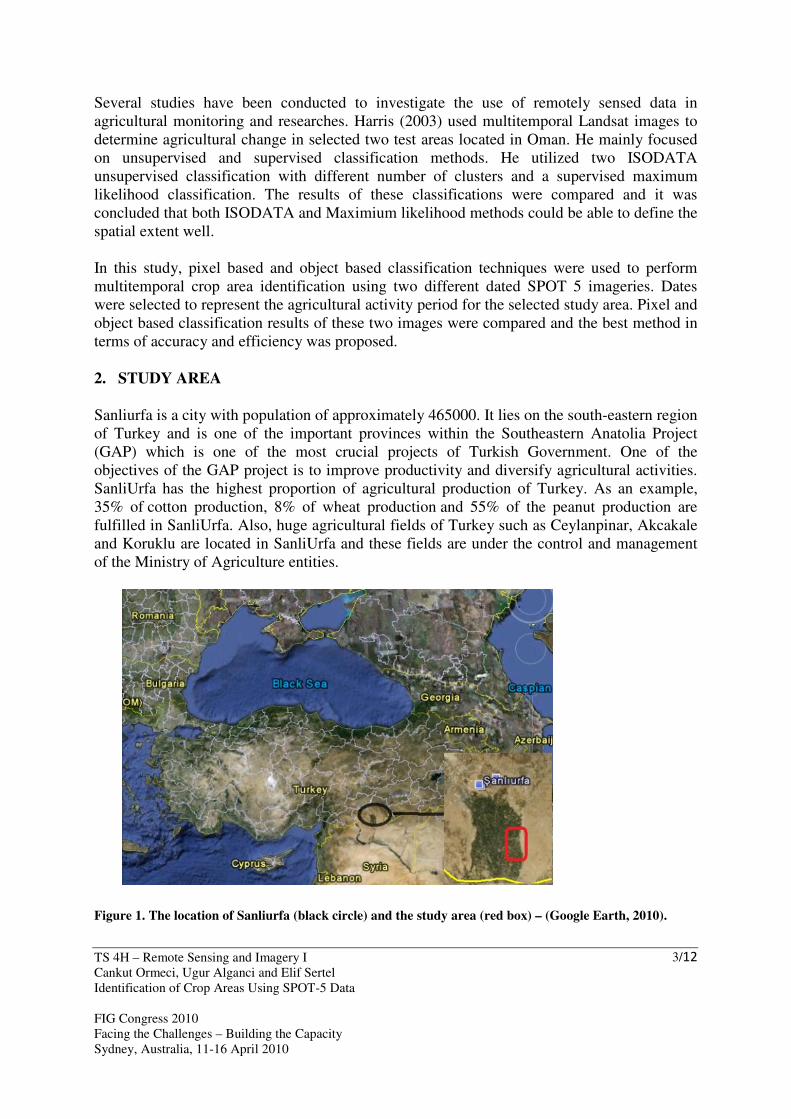
Sanliurfa is a city with population of approximately 465000. It lies on the south-eastern region
of Turkey and is one of the important provinces within the Southeastern Anatolia Project
(GAP) which is one of the most crucial projects of Turkish Government. One of the
objectives of the GAP project is to improve productivity and diversify agricultural activities.
SanliUrfa has the highest proportion of agricultural production of Turkey. As an example,
35% of cotton production, 8% of wheat production and 55% of the peanut production are
fulfilled in SanliUrfa. Also, huge agricultural fields of Turkey such as Ceylanpinar, Akcakale
and Koruklu are located in SanliUrfa and these fields are under the control and management
of the Ministry of Agriculture entities.
Figure 1. The location of Sanliurfa (black circle) and the study area (red box) – (Google Earth, 2010).
TS 4H – Remote Sensing and Imagery I
Cankut Ormeci, Ugur Alganci and Elif Sertel
Identification of Crop Areas Using SPOT-5 Data
FIG Congress 2010
Facing the Challenges – Building the Capacity
Sydney, Australia, 11-16 April 2010
4/12
The study area is called East Harran that is located in the east of Akcakale region, having
large agriculture parcels and controlled agricultural activity (Figure 1). Between the seventh
and ninth month of the year, only cotton and corn were farmed in this region. The planting
and harvesting of the parcels are not stable, so different stages of farming can be seen on the
satellite imagery.
3. METHODOLOGY
In this study, three different classification algorithms were performed for crop area
identification and multitemporal change detection. The first two of them are ISODATA
unsupervised classification and Maximum Likelihood supervised classification techniques
which are two main pixel based classification algorithms and the last one is the object based
classification algorithm.
3.1 Preprocessing
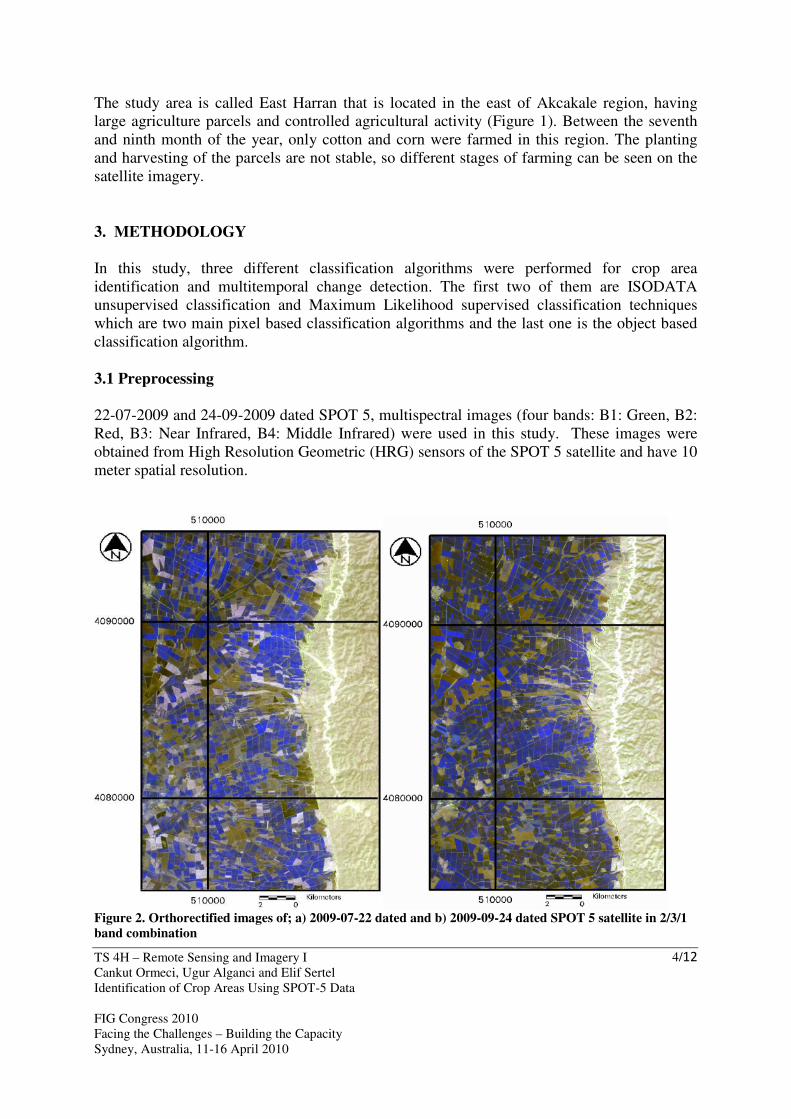
22-07-2009 and 24-09-2009 dated SPOT 5, multispectral images (four bands: B1: Green, B2:
Red, B3: Near Infrared, B4: Middle Infrared) were used in this study. These images were
obtained from High Resolution Geometric (HRG) sensors of the SPOT 5 satellite and have 10
meter spatial resolution.
Figure 2. Orthorectified images of; a) 2009-07-22 dated and b) 2009-09-24 dated SPOT 5 satellite in 2/3/1
band combination
TS 4H – Remote Sensing and Imagery I
Cankut Ormeci, Ugur Alganci and Elif Sertel
Identification of Crop Areas Using SPOT-5 Data
FIG Congress 2010
Facing the Challenges – Building the Capacity
Sydney, Australia, 11-16 April 2010
5/12
Firstly, orthorectification procedure was utilized to these two images in order to correct
geometric distortions. In this procedure 30 m ASTER Global Digital GDEM digital elevation
model (DEM) and ground control points (GCP) collected from 1/25000 scaled maps were
used. Orthorectification procedures were resulted with ± 0, 30 and 0, 42 pixel root mean
square error (RMSE), respectively. Orthorectified images are shown in Figure 2.
3.2 Unsupervised Classification
This pixel–based classification technique classifies the pixels and forms clusters or classes
according to the n dimensional spectral space whose dimensions are specified by the number
of bands in satellite imagery. Results of this technique are spectral clusters automatically
identified by computer algorithm (Foody, 2002; Alparslan et al., 2009).
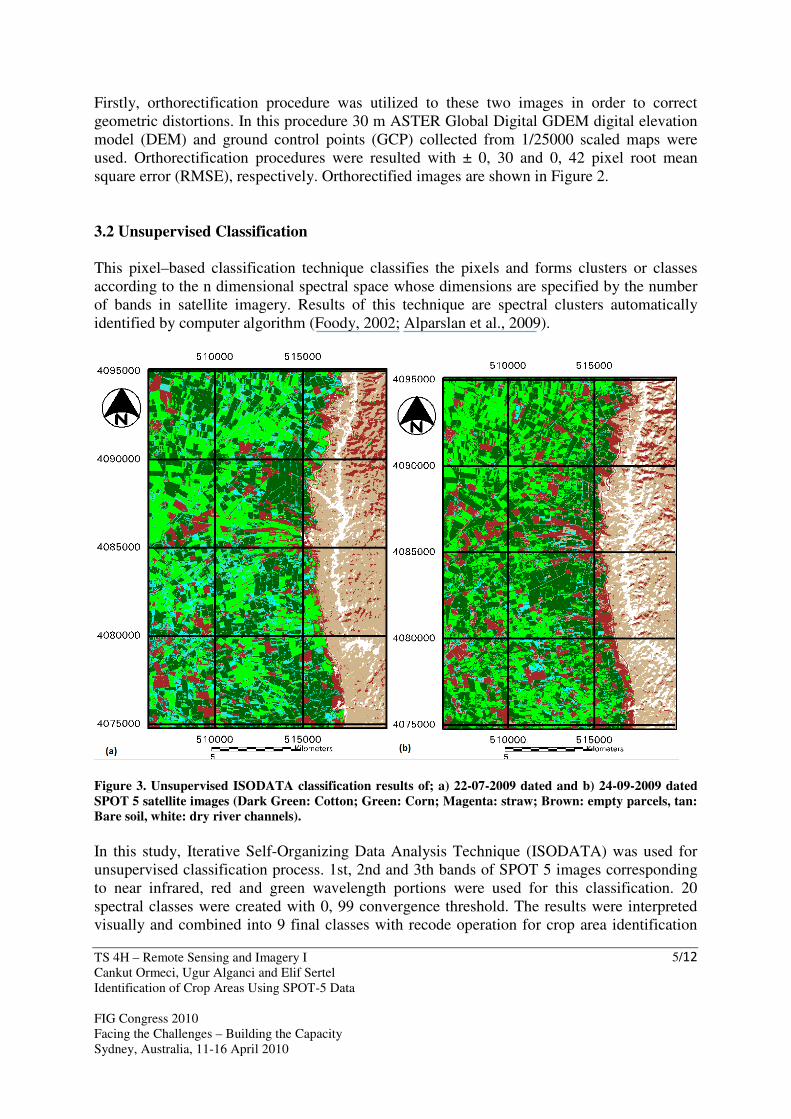
Figure 3. Unsupervised ISODATA classification results of; a) 22-07-2009 dated and b) 24-09-2009 dated
SPOT 5 satellite images (Dark Green: Cotton; Green: Corn; Magenta: straw; Brown: empty parcels, tan:
Bare soil, white: dry river channels).
In this study, Iterative Self-Organizing Data Analysis Technique (ISODATA) was used for
unsupervised classification process. 1st, 2nd and 3th bands of SPOT 5 images corresponding
to near infrared, red and green wavelength portions were used for this classification. 20
spectral classes were created with 0, 99 convergence threshold. The results were interpreted
visually and combined into 9 final classes with recode operation for crop area identification
TS 4H – Remote Sensing and Imagery I
Cankut Ormeci, Ugur Alganci and Elif Sertel
Identification of Crop Areas Using SPOT-5 Data
FIG Congress 2010
Facing the Challenges – Building the Capacity
Sydney, Australia, 11-16 April 2010
6/12
using ground truth information obtained from SanliUrfa Agricultural Research Institute
(Figure 3).
3.4. Supervised Classification
Supervised Classification is a technique which requires the a priori knowledge of the
concerned region and this can be fulfilled by the selection of training areas defined by the
analyst having the knowledge about land cover and spectral characteristics of the region.
These training sites are the representatives of land cover categories on the image and used to
train the classification algorithm. Classification procedure runs with use of homogenously
distributed signatures that are associated with training sites and the result is the determination
of information classes (Kucukmehmetoglu et al., 2008).
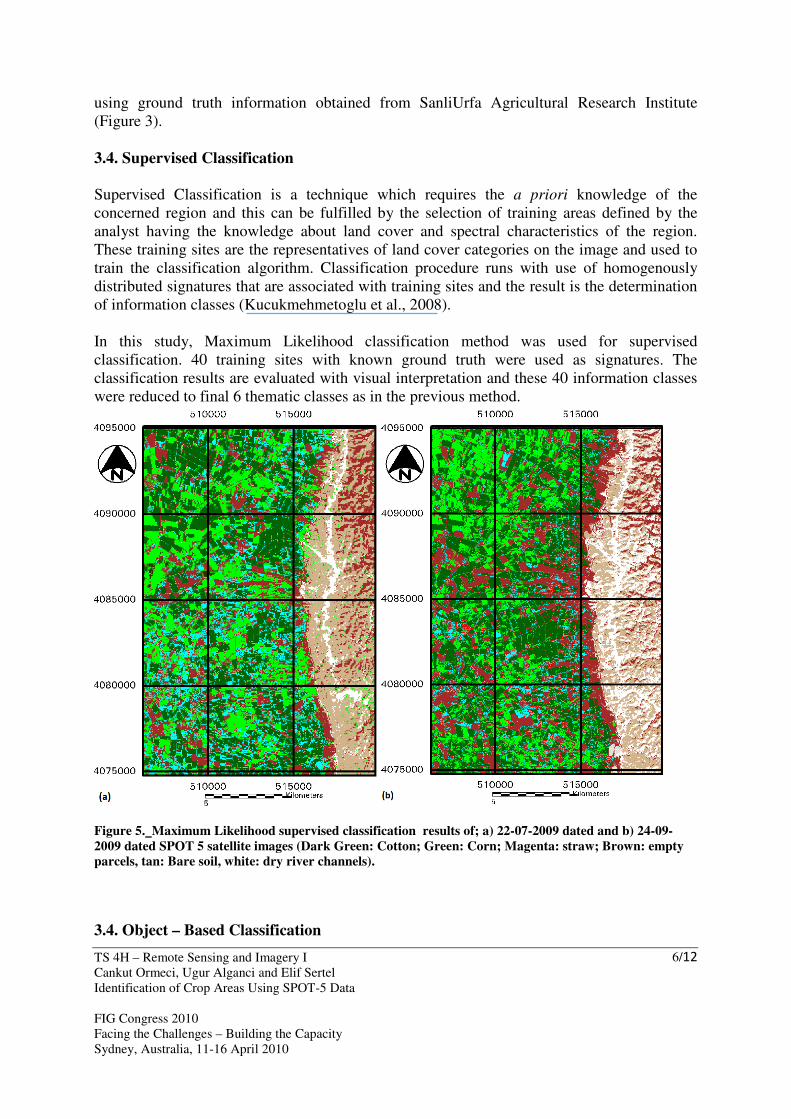
In this study, Maximum Likelihood classification method was used for supervised
classification. 40 training sites with known ground truth were used as signatures. The
classification results are evaluated with visual interpretation and these 40 information classes
were reduced to final 6 thematic classes as in the previous method.
Figure 5. Maximum Likelihood supervised classification results of; a) 22-07-2009 dated and b) 24-09-
2009 dated SPOT 5 satellite images (Dark Green: Cotton; Green: Corn; Magenta: straw; Brown: empty
parcels, tan: Bare soil, white: dry river channels).
3.4. Object – Based Classification
TS 4H – Remote Sensing and Imagery I
Cankut Ormeci, Ugur Alganci and Elif Sertel
Identification of Crop Areas Using SPOT-5 Data
FIG Congress 2010
Facing the Challenges – Building the Capacity
Sydney, Australia, 11-16 April 2010
7/12
The basic processing units of object-oriented image analysis are segments (also called image
objects) but not pixels like in pixel-based methods (Benz et al 2004). During the segmentation
process, image is subdivided into segments and then these objects are classified.
The scale and heterogeneity criteria control the outcome of the segmentation algorithm. The
scale parameter defines the size of the image object therefore different scale values are used
for different data sets and different objects. There is a relationship between scale and image
spatial resolution and scale and size of the objects. On the other hand, heterogeneity criterion
is computed using spectral or non-spectral layers and this criterion controls the merging
decision (Mattheu et al., 2005).
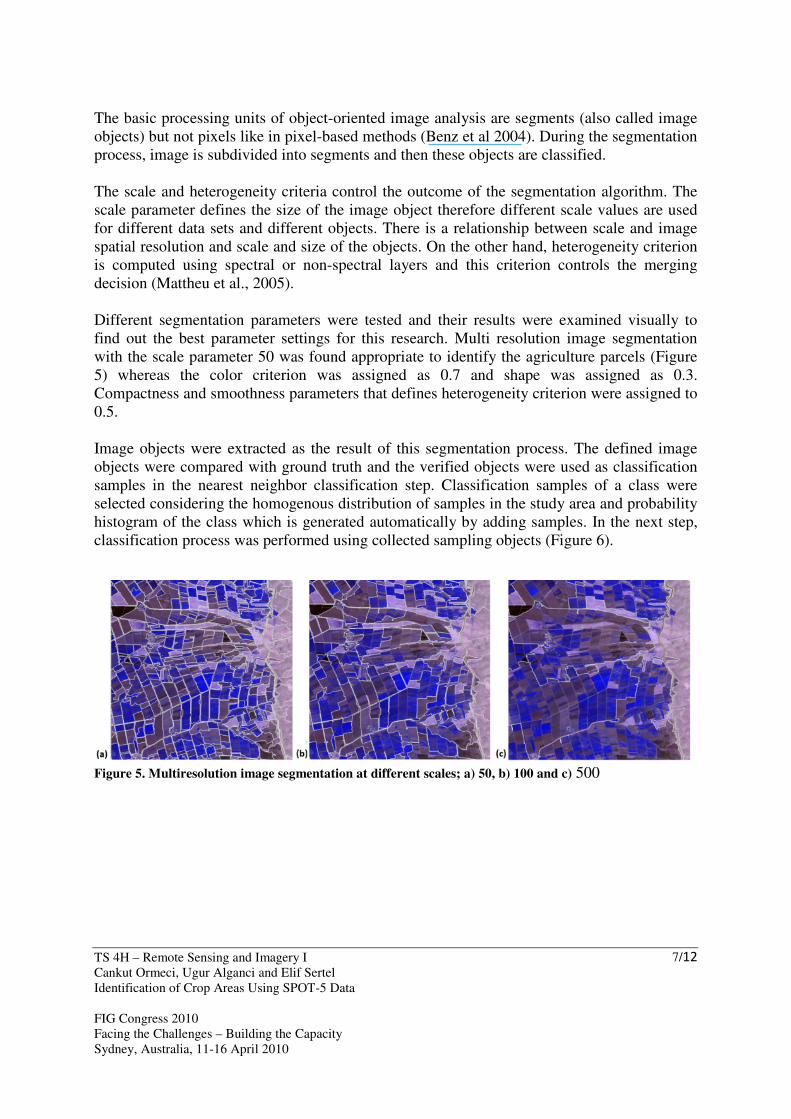
Different segmentation parameters were tested and their results were examined visually to
find out the best parameter settings for this research. Multi resolution image segmentation
with the scale parameter 50 was found appropriate to identify the agriculture parcels (Figure
5) whereas the color criterion was assigned as 0.7 and shape was assigned as 0.3.
Compactness and smoothness parameters that defines heterogeneity criterion were assigned to
0.5.
Image objects were extracted as the result of this segmentation process. The defined image
objects were compared with ground truth and the verified objects were used as classification
samples in the nearest neighbor classification step. Classification samples of a class were
selected considering the homogenous distribution of samples in the study area and probability
histogram of the class which is generated automatically by adding samples. In the next step,
classification process was performed using collected sampling objects (Figure 6).
Figure 5. Multiresolution image segmentation at different scales; a) 50, b) 100 and c) 500
TS 4H – Remote Sensing and Imagery I
Cankut Ormeci, Ugur Alganci and Elif Sertel
Identification of Crop Areas Using SPOT-5 Data
FIG Congress 2010
Facing the Challenges – Building the Capacity
Sydney, Australia, 11-16 April 2010
8/12
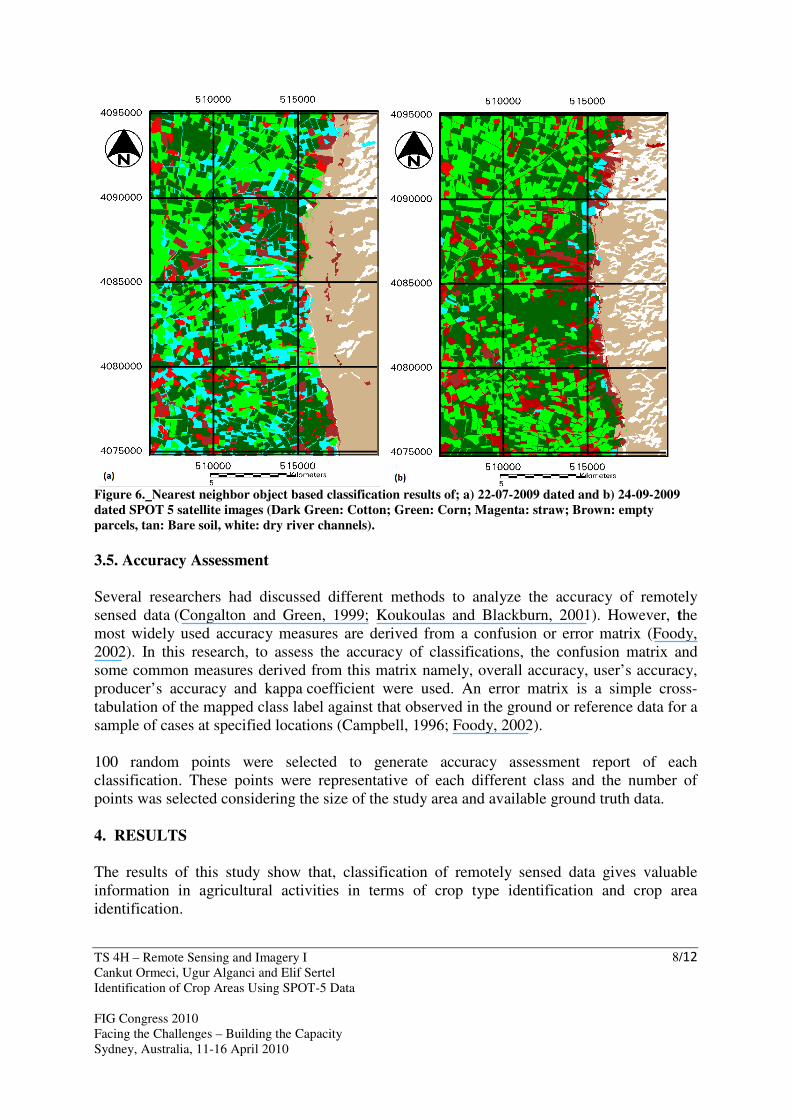
Figure 6. Nearest neighbor object based classification results of; a) 22-07-2009 dated and b) 24-09-2009
dated SPOT 5 satellite images (Dark Green: Cotton; Green: Corn; Magenta: straw; Brown: empty
parcels, tan: Bare soil, white: dry river channels).
3.5. Accuracy Assessment
Several researchers had discussed different methods to analyze the accuracy of remotely
sensed data (Congalton and Green, 1999; Koukoulas and Blackburn, 2001). However, the
most widely used accuracy measures are derived from a confusion or error matrix (Foody,
2002). In this research, to assess the accuracy of classifications, the confusion matrix and
some common measures derived from this matrix namely, overall accuracy, user’s accuracy,
producer’s accuracy and kappa coefficient were used. An error matrix is a simple cross-
tabulation of the mapped class label against that observed in the ground or reference data for a
sample of cases at specified locations (Campbell, 1996; Foody, 2002).
100 random points were selected to generate accuracy assessment report of each
classification. These points were representative of each different class and the number of
points was selected considering the size of the study area and available ground truth data.
4. RESULTS
The results of this study show that, classification of remotely sensed data gives valuable
information in agricultural activities in terms of crop type identification and crop area
identification.
TS 4H – Remote Sensing and Imagery I
Cankut Ormeci, Ugur Alganci and Elif Sertel
Identification of Crop Areas Using SPOT-5 Data
FIG Congress 2010
Facing the Challenges – Building the Capacity
Sydney, Australia, 11-16 April 2010
9/12
The two basic classification approaches were evaluated with accuracy assessment procedure
and visual interpretation of the result images based on ground truth information.
According to accuracy assessment results, for the unsupervised classified image of 22-07-
2009 dated image; overall classification accuracy was 84.33%, kappa value was 0.7875. For
the unsupervised classification of 24-09-2009 dated image overall classification accuracy was
83.45% and kappa value was 0.8100. For the supervised classification of 22-07-2009 dated
image; overall classification accuracy was 80.00%, kappa value was 0.7595. For the
supervised classification of 24-09-2009 dated image overall classification accuracy was
82.22%, kappa value was 0.8036. For the 22-07-2009 dated object based classified image;
overall classification accuracy was 88.60%, kappa value was 0.8385. For the 24-09-2009
dated object based classified image; overall classification accuracy was 87.50%, kappa value
was 0.8430.
Evaluation results with visual interpretation illustrated that all classification techniques
reached a reasonable accuracy in crop type determination and spatial locations of the crop
types were mostly determined. At this point, object based classification technique results gave
more accurate information in determining the agricultural parcels in terms of homogeneity
and shape as a result of generating image objects with image segmentation. Pixel based
classification techniques failed to determine the borders of agriculture parcels especially in
which the parcel held different surface cover having heterogeneous reflectance. On the other
hand, each segment created in object based classification has a unique value, so differences of
surface patterns inside the segment cannot be designated.
In conclusion, this study searched the efficiency of satellite images in crop type and area
determination. The results indicated that, acceptable identification performance of crop areas
can be obtained by using both pixel based and object based classification techniques. Object
based classification results gave superior results compared to pixel based classification
techniques.
TS 4H – Remote Sensing and Imagery I
Cankut Ormeci, Ugur Alganci and Elif Sertel
Identification of Crop Areas Using SPOT-5 Data
FIG Congress 2010
Facing the Challenges – Building the Capacity
Sydney, Australia, 11-16 April 2010
10/12
REFERENCES
Alparslan, E., Coskun, H.G., Alganci, U., 2009. Water Quality Determination of
Küçükçekmece Lake, Turkey by Using Multispectral Satellite Data, The Scientific World
JOURNAL, 9, pp. 1215–1229.
Benz, U.C., Hofmann, P., Willhauck, G., Lingenfelder, I., Heynen, M., 2004. Multi-
resolution, object-oriented fuzzy analysis of remote sensing data for GIS - ready information.
ISPRS Journal of Photogrammetry and Remote Sensing 58, pp. 239-258.
Campbell, J. B., 1996. Introduction to Remote Sensing (2nd ed.). Taylor and Francis. London.
Congalton, R. G., and Green, K., 1999. Assessing the accuracy of remotely sensed data:
principles and practices. Boca Raton: Lewis Publishers.
Foody, G.M., 2002. Status of land cover classification accuracy assessment. Remote Sensing
of Environment, 80, pp.185–201.
Harris, R., 2003. Remote sensing of agriculture change in Oman International Journal of
Remote Sensing, 24 (23), pp.4835–4852.
Koukoulas, S., and Blackburn, G. A., 2001. Introducing new indices for accuracy evaluation
of classified images representing semi-natural woodland environments. Photogrammetric
Engineering and Remote Sensing, 67, pp.499– 510.
Kucukmehmetoglu, M. and Geymen, A. (2008) Measuring the spatial impacts of urbanization
on the surface water resource basins in Istanbul via remote sensing. Environmental
Monitoring and Assessment, 142, pp.153–169.
Mathieu, R., Aryal, J. 2005. Object-oriented classification and Ikonos multispectral imagery
for mapping vegetation communities in urban areas. SIRC 2005 – The 17th Annual
Colloquium of the Spatial Information Research Centre University of Otago, Dunedin, New
ZealandNovember 24th-25th 2005
Murty, C.S., Raju, P.V. and Badrinath, K.V.S. 2003. Classification of wheat crop with multi-
temporal images: performanceof maximum likelihood and artificial neural networks.
International Journal of Remote Sensing, 24(23), 4871 – 4890.
Omkar, S.N., Senthilnath, J., Mudigere, D. and Kumar M.M., 2008. Crop Classification using
Biologically-inspired Techniques with High Resolution Satellite Image. Journal of Indian
Society of Remote Sensing, 36, 175-182.
BIOGRAPHICAL NOTES
Cankut Ormeci
TS 4H – Remote Sensing and Imagery I
Cankut Ormeci, Ugur Alganci and Elif Sertel
Identification of Crop Areas Using SPOT-5 Data
FIG Congress 2010
Facing the Challenges – Building the Capacity
Sydney, Australia, 11-16 April 2010
11/12
Cankut Ormeci received his BSc and MSc in Civil Engineering and PhD in Geodesy and
Photogrammetry Engineering at Istanbul Technical University (ITU). He was a Research
fellow of Alexander von Humboldt Foundation in the Institute of Photogrammetry and
Topography of Karlsruhe University (Germany) between 1981 and1983. He is a Professor at
Geomatic Engineering Department of ITU and the Director of Center for Satellite
Communications and Remote Sensing (ITU-CSCRS). He has been the principal investigator
of many national projects and participated to international projects. He has published 6 SCI
articles, 70 papers and 4 books.
Ugur Alganci
He has graduated from Istanbul Technical University, Geodesy and Photogrammetry
Engineering Division in 2006. He completed Masters of Science education in Geomatics
Engineering at the same University in 2008. He has been a PhD Student in Geomatics
Engineering since 2008 and working as a Research Assistant in the Center for Satellite
Communications and Remote Sensing since May 2009. He has worked as a Researcher in
TUBITAK projects as remote sensing expert. He has research articles and conference papers
mostly focused on water quality analysis and land use analysis for environmental monitoring
of watersheds. He is a member of Turkish Chamber of Surveying Engineers.
Elif Sertel
Elif Sertel received her BSc in Geodesy and Photogrammetry Engineering and MSc and PhD
in Geomatic Engineering at ITU. She was a Fulbright Scholar at Rutgers University, USA
between August 2006 and January 2008 and she was a Post-Doctoral Researcher between
January 2008 and September 2008 at Rutgers University supported by a NSF project. Elif
Sertel is an Assistant Professor at Geomatic Engineering Department of ITU and she is the
Vice-Director of ITU- CSCRS. She has been involved several national and international
research projects and published 11 SCI articles and 25 papers. She is a member of Union of
Chambers of Turkish Engineers and Architects, Chamber of Surveying Engineers (HKMO),
American Geophysical Union, American Meteorological Society, Fulbright Association and
the Association of American Geographers.
CONTACTS
Cankut Ormeci
Istanbul Technical University – Civil Engineering Faculty – Geomatics Engineering
Department 34469 Maslak
Istanbul
TURKEY
Tel. +90 212 285 3807
Fax +90 212 285 3807
Email: [email protected]
Web site: http://www.akademi.itu.edu.tr/cankut/

TS 4H – Remote Sensing and Imagery I
Cankut Ormeci, Ugur Alganci and Elif Sertel
Identification of Crop Areas Using SPOT-5 Data
FIG Congress 2010
Facing the Challenges – Building the Capacity
Sydney, Australia, 11-16 April 2010
12/12
Ugur Alganci
Istanbul Technical University - Center for Satellite Communications and Remote Sensing
ITU Ayazaga Campus CSCRS Ground Receiving Station 34469 Maslak
Istanbul
TURKEY
Tel. +90 212 285 68 13 - 129
Fax +90 212 285 7167
Email: [email protected]
Web site: http://www.akademi.itu.edu.tr/alganci/
Elif Sertel
Istanbul Technical University – Civil Engineering Faculty – Geomatics Engineering
Department 34469 Maslak
Istanbul
TURKEY
Tel. +90 212 285 3803
Fax +90 212 285 3414
Email: [email protected]
Web site: http://atlas.cc.itu.edu.tr/~sertele/