Identification of a host-associated species complex using molecular and morphometric analyses with...
13
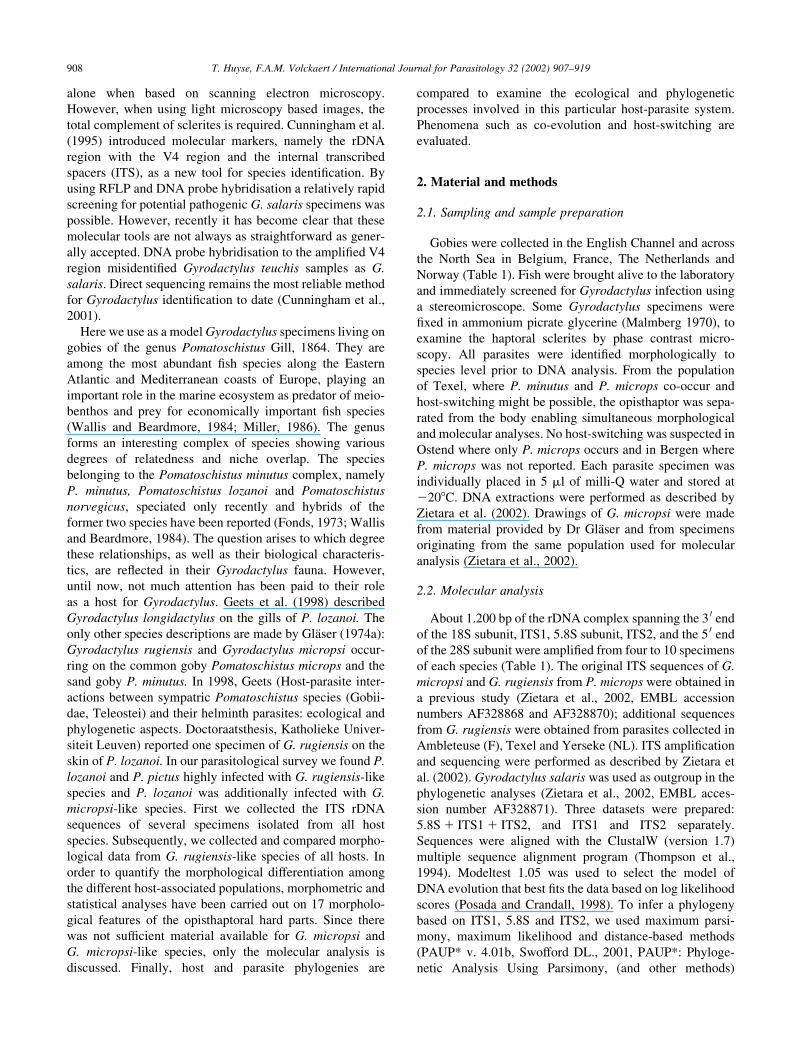
Identification of a host-associated species complex using molecular and morphometric analyses, with the description of Gyrodactylus rugiensoides n. sp. (Gyrodactylidae, Monogenea) q Tine Huyse * , Filip A.M. Volckaert Katholieke Universiteit Leuven, Laboratory of Aquatic Ecology, Ch. de Be ´riotstraat 32, B-3000 Leuven, Belgium Received 21 January 2002; received in revised form 20 February 2002; accepted 20 February 2002 Abstract Gyrodactylus rugiensis was originally described as a parasite occurring on the marine gobies Pomatoschistus minutus and Pomatoschistus microps. In our preliminary survey this species was also frequently found on Pomatoschistus pictus and Pomatoschistus lozanoi. Subsequent molecular analysis of the internal transcribed spacers rDNA region revealed that this parasite actually represents a complex of two apparently cryptic species, one restricted to P. microps and the other shared by P. minutus, P. lozanoi and P. pictus. Morphometric analyses were conducted on 17 features of the opisthaptoral hard parts of specimens collected from all four host species. Standard discriminant analysis showed a clear separation of both genotypes by significant differences in marginal hook and ventral bar features. Statistical classifiers (linear discriminant analysis and nearest neighbours) resulted in an estimated misclassification rate of 4.7 and 3.1%, respectively. Based on molecular, morpho- logical and statistical analyses a new species, Gyrodactylus rugiensoides is described. This species seems to display a lower host-specificity than generally observed for Gyrodactylus species as it infects three sympatric host species.However, seasonal and host-dependent morpho- metric variation is shown for G. rugiensoides collected on P. pictus. Host-switching and gene flow might be important factors preventing speciation on closely related and sympatric host species. The presence of host associated species complexes in this Gyrodactylus-Poma- toschistus system is also confirmed by the presence of two host-dependent genotypes within G. micropsi found on P. minutus and P. lozanoi, and P. microps, respectively. By comparing host and parasite phylogeny, phylogenetic and ecological factors influencing host-specificity are discussed. q 2002 Australian Society for Parasitology Inc. Published by Elsevier Science Ltd. All rights reserved. Keywords: Gyrodactylus rugiensoides n. sp; Internal transcribed spacers rDNA; Host-parasite relationships; Host-specificity; Morphometrics; Pomatoschistus 1. Introduction Since the introduction of molecular tools into taxonomy, systematics and phylogeny, many species descriptions are re-evaluated, new species are described while some are assigned new taxonomic positions (e.g. Burridge and White, 2000; Jousson et al., 2000; Lazoski et al., 2001; Desdevises, 2001). In classical morphological analysis, cryptic speciation may lead to an underestimation of the number of species while phenotypic plasticity may induce the reverse effect. In parasitic organisms, the morphological identification can be furthermore obliterated by convergent evolution (Price, 1980). In this study we assess the validity of molecular markers, comparative morphometric analysis and statistical classifiers in discriminating closely related Gyrodactylus species. Gyrodactylus is a species-rich genus of monogenean ectoparasites, mostly found on fish. Anatomical conserva- tism as a result of viviparity and progenesis has led to a reduced number of useful taxonomic characteristics (Cable et al., 1999). A morphological identification method has been developed by Malmberg (1970) based on the hard parts of the posterior attachment organ. Marginal hook features appeared crucial for discrimination of very closely related species, but the discrimination of some taxa, includ- ing the pathogenic Gyrodactylus salaris, remained proble- matic. Shinn et al. (1996) used univariate and multivariate analyses on morphometric data of the opisthaptoral sclerites to address this problem, but an unambiguous separation did not seem feasible. More recently, Kay et al. (1999) constructed a classification system with the use of statistical classifiers. According to these authors identification of G. salaris is possible from measurements of the marginal hook International Journal for Parasitology 32 (2002) 907–919 0020-7519/02/$20.00 q 2002 Australian Society for Parasitology Inc. Published by Elsevier Science Ltd. All rights reserved. PII: S0020-7519(02)00026-7 www.parasitology-online.com q Note: Nucleotide sequence data reported in this paper are available in the EMBL databases under the accession numbers AJ427414 and AJ427221. * Corresponding author. Tel.: 132-16-323-857; fax: 132-16-324-575. E-mail address: [email protected] (T. Huyse).
Transcript of Identification of a host-associated species complex using molecular and morphometric analyses with...

Identification of a host-associated species complex using molecular andmorphometric analyses, with the description of Gyrodactylus rugiensoides
n. sp. (Gyrodactylidae, Monogenea)q
Tine Huyse*, Filip A.M. Volckaert
Katholieke Universiteit Leuven, Laboratory of Aquatic Ecology, Ch. de Beriotstraat 32, B-3000 Leuven, Belgium
Received 21 January 2002; received in revised form 20 February 2002; accepted 20 February 2002
Abstract
Gyrodactylus rugiensis was originally described as a parasite occurring on the marine gobies Pomatoschistus minutus and Pomatoschistus
microps. In our preliminary survey this species was also frequently found on Pomatoschistus pictus and Pomatoschistus lozanoi. Subsequent
molecular analysis of the internal transcribed spacers rDNA region revealed that this parasite actually represents a complex of two apparently
cryptic species, one restricted to P. microps and the other shared by P. minutus, P. lozanoi and P. pictus. Morphometric analyses were conducted
on 17 features of the opisthaptoral hard parts of specimens collected from all four host species. Standard discriminant analysis showed a clear
separation of both genotypes by significant differences in marginal hook and ventral bar features. Statistical classifiers (linear discriminant
analysis and nearest neighbours) resulted in an estimated misclassification rate of 4.7 and 3.1%, respectively. Based on molecular, morpho-
logical and statistical analyses a new species, Gyrodactylus rugiensoides is described. This species seems to display a lower host-specificity
than generally observed for Gyrodactylus species as it infects three sympatric host species.However, seasonal and host-dependent morpho-
metric variation is shown for G. rugiensoides collected on P. pictus. Host-switching and gene flow might be important factors preventing
speciation on closely related and sympatric host species. The presence of host associated species complexes in this Gyrodactylus-Poma-
toschistus system is also confirmed by the presence of two host-dependent genotypes within G. micropsi found on P. minutus and P. lozanoi, and
P. microps, respectively. By comparing host and parasite phylogeny, phylogenetic and ecological factors influencing host-specificity are
discussed. q 2002 Australian Society for Parasitology Inc. Published by Elsevier Science Ltd. All rights reserved.
Keywords: Gyrodactylus rugiensoides n. sp; Internal transcribed spacers rDNA; Host-parasite relationships; Host-specificity; Morphometrics; Pomatoschistus
1. Introduction
Since the introduction of molecular tools into taxonomy,
systematics and phylogeny, many species descriptions are
re-evaluated, new species are described while some are
assigned new taxonomic positions (e.g. Burridge and
White, 2000; Jousson et al., 2000; Lazoski et al., 2001;
Desdevises, 2001). In classical morphological analysis,
cryptic speciation may lead to an underestimation of the
number of species while phenotypic plasticity may induce
the reverse effect. In parasitic organisms, the morphological
identification can be furthermore obliterated by convergent
evolution (Price, 1980). In this study we assess the validity
of molecular markers, comparative morphometric analysis
and statistical classifiers in discriminating closely related
Gyrodactylus species.
Gyrodactylus is a species-rich genus of monogenean
ectoparasites, mostly found on fish. Anatomical conserva-
tism as a result of viviparity and progenesis has led to a
reduced number of useful taxonomic characteristics
(Cable et al., 1999). A morphological identification method
has been developed by Malmberg (1970) based on the hard
parts of the posterior attachment organ. Marginal hook
features appeared crucial for discrimination of very closely
related species, but the discrimination of some taxa, includ-
ing the pathogenic Gyrodactylus salaris, remained proble-
matic. Shinn et al. (1996) used univariate and multivariate
analyses on morphometric data of the opisthaptoral sclerites
to address this problem, but an unambiguous separation did
not seem feasible. More recently, Kay et al. (1999)
constructed a classification system with the use of statistical
classifiers. According to these authors identification of G.
salaris is possible from measurements of the marginal hook
International Journal for Parasitology 32 (2002) 907–919
0020-7519/02/$20.00 q 2002 Australian Society for Parasitology Inc. Published by Elsevier Science Ltd. All rights reserved.
PII: S0020-7519(02)00026-7
www.parasitology-online.com
q Note: Nucleotide sequence data reported in this paper are available in
the EMBL databases under the accession numbers AJ427414 and
AJ427221.
* Corresponding author. Tel.: 132-16-323-857; fax: 132-16-324-575.
E-mail address: [email protected] (T. Huyse).
alone when based on scanning electron microscopy.
However, when using light microscopy based images, the
total complement of sclerites is required. Cunningham et al.
(1995) introduced molecular markers, namely the rDNA
region with the V4 region and the internal transcribed
spacers (ITS), as a new tool for species identification. By
using RFLP and DNA probe hybridisation a relatively rapid
screening for potential pathogenic G. salaris specimens was
possible. However, recently it has become clear that these
molecular tools are not always as straightforward as gener-
ally accepted. DNA probe hybridisation to the amplified V4
region misidentified Gyrodactylus teuchis samples as G.
salaris. Direct sequencing remains the most reliable method
for Gyrodactylus identification to date (Cunningham et al.,
2001).
Here we use as a model Gyrodactylus specimens living on
gobies of the genus Pomatoschistus Gill, 1864. They are
among the most abundant fish species along the Eastern
Atlantic and Mediterranean coasts of Europe, playing an
important role in the marine ecosystem as predator of meio-
benthos and prey for economically important fish species
(Wallis and Beardmore, 1984; Miller, 1986). The genus
forms an interesting complex of species showing various
degrees of relatedness and niche overlap. The species
belonging to the Pomatoschistus minutus complex, namely
P. minutus, Pomatoschistus lozanoi and Pomatoschistus
norvegicus, speciated only recently and hybrids of the
former two species have been reported (Fonds, 1973; Wallis
and Beardmore, 1984). The question arises to which degree
these relationships, as well as their biological characteris-
tics, are reflected in their Gyrodactylus fauna. However,
until now, not much attention has been paid to their role
as a host for Gyrodactylus. Geets et al. (1998) described
Gyrodactylus longidactylus on the gills of P. lozanoi. The
only other species descriptions are made by Glaser (1974a):
Gyrodactylus rugiensis and Gyrodactylus micropsi occur-
ring on the common goby Pomatoschistus microps and the
sand goby P. minutus. In 1998, Geets (Host-parasite inter-
actions between sympatric Pomatoschistus species (Gobii-
dae, Teleostei) and their helminth parasites: ecological and
phylogenetic aspects. Doctoraatsthesis, Katholieke Univer-
siteit Leuven) reported one specimen of G. rugiensis on the
skin of P. lozanoi. In our parasitological survey we found P.
lozanoi and P. pictus highly infected with G. rugiensis-like
species and P. lozanoi was additionally infected with G.
micropsi-like species. First we collected the ITS rDNA
sequences of several specimens isolated from all host
species. Subsequently, we collected and compared morpho-
logical data from G. rugiensis-like species of all hosts. In
order to quantify the morphological differentiation among
the different host-associated populations, morphometric and
statistical analyses have been carried out on 17 morpholo-
gical features of the opisthaptoral hard parts. Since there
was not sufficient material available for G. micropsi and
G. micropsi-like species, only the molecular analysis is
discussed. Finally, host and parasite phylogenies are
compared to examine the ecological and phylogenetic
processes involved in this particular host-parasite system.
Phenomena such as co-evolution and host-switching are
evaluated.
2. Material and methods
2.1. Sampling and sample preparation
Gobies were collected in the English Channel and across
the North Sea in Belgium, France, The Netherlands and
Norway (Table 1). Fish were brought alive to the laboratory
and immediately screened for Gyrodactylus infection using
a stereomicroscope. Some Gyrodactylus specimens were
fixed in ammonium picrate glycerine (Malmberg 1970), to
examine the haptoral sclerites by phase contrast micro-
scopy. All parasites were identified morphologically to
species level prior to DNA analysis. From the population
of Texel, where P. minutus and P. microps co-occur and
host-switching might be possible, the opisthaptor was sepa-
rated from the body enabling simultaneous morphological
and molecular analyses. No host-switching was suspected in
Ostend where only P. microps occurs and in Bergen where
P. microps was not reported. Each parasite specimen was
individually placed in 5 ml of milli-Q water and stored at
2208C. DNA extractions were performed as described by
Zietara et al. (2002). Drawings of G. micropsi were made
from material provided by Dr Glaser and from specimens
originating from the same population used for molecular
analysis (Zietara et al., 2002).
2.2. Molecular analysis
About 1.200 bp of the rDNA complex spanning the 3 0 end
of the 18S subunit, ITS1, 5.8S subunit, ITS2, and the 5 0 end
of the 28S subunit were amplified from four to 10 specimens
of each species (Table 1). The original ITS sequences of G.
micropsi and G. rugiensis from P. microps were obtained in
a previous study (Zietara et al., 2002, EMBL accession
numbers AF328868 and AF328870); additional sequences
from G. rugiensis were obtained from parasites collected in
Ambleteuse (F), Texel and Yerseke (NL). ITS amplification
and sequencing were performed as described by Zietara et
al. (2002). Gyrodactylus salaris was used as outgroup in the
phylogenetic analyses (Zietara et al., 2002, EMBL acces-
sion number AF328871). Three datasets were prepared:
5.8S 1 ITS1 1 ITS2, and ITS1 and ITS2 separately.
Sequences were aligned with the ClustalW (version 1.7)
multiple sequence alignment program (Thompson et al.,
1994). Modeltest 1.05 was used to select the model of
DNA evolution that best fits the data based on log likelihood
scores (Posada and Crandall, 1998). To infer a phylogeny
based on ITS1, 5.8S and ITS2, we used maximum parsi-
mony, maximum likelihood and distance-based methods
(PAUP* v. 4.01b, Swofford DL., 2001, PAUP*: Phyloge-
netic Analysis Using Parsimony, (and other methods)
T. Huyse, F.A.M. Volckaert / International Journal for Parasitology 32 (2002) 907–919908

Sunderland, MA: Sinauer Associates). In maximum parsi-
mony gaps were treated as missing data and all sites were
equally weighted but different transition:transversion (ti/tv)
ratios were applied; 10:5 for 5.8S and 1:5 for ITS1 and
ITS2, to compensate for the difference in evolutionary rate
between coding and non-coding regions. The maximum
likelihood analysis was performed using the parameters
estimated under the best-fit model and optimised through
repeated estimation. We conducted the exhaustive search
method and bootstrapped (n ¼ 1:000) with the branch and
bound algorithm. With the minimum-evolution distance
method, the maximum likelihood genetic distances were
calculated under the optimised model. The heuristic search
method was applied and we bootstrapped (n ¼ 1000) with
the tree-bisection-reconnection branch-swapping algorithm
in force.
2.3. Morphometric and statistical analyses on G. rugiensis-
like species
In total, 72 specimens of G. rugiensis-like species were
measured (Table 1). In analogy with Shinn et al. (1996) and
Geets et al. (1999) 17 hook characteristics were selected for
morphometric analysis (Fig. 1). Measurements were done
using a Zeiss HBO50 microscope (magnification of
10 £ 40 £ for the anchors, 10 £ 100 £ oil for the marginal
hook features, with phase contrast). Images were analysed
with the program SigmaScan Pro 5. For the statistical
analyses STATISTICA 5.0 was used, except for nearest
neighbours and linear discriminant analysis which was
done with S-PLUS 2000 for Windows. Drawings of the
anchors and ventral bar were done using a magnification
of 10 £ 90 £ oil; drawings of the marginal hook features
were done using 16 £ 90 £ oil using the equipment from
Malmberg (1970).
Significant differences between the second and eighth
marginal hook within one group (Texel, n ¼ 21, Nov.
2000) were tested using a t-test for dependent variables on
the variables of the marginal hook. Correlations between all
measured features were tested using Pearson’s correlation
coefficient. To test for host-dependent differences in hook
morphology, Tukey’s honest significant difference test for
unequal sample sizes was performed. This test allows for
post hoc multiple comparisons between the means of each
group. The specimens were grouped according to their
genotype and according to their respective host. Observa-
tions with missing variables or with a C.V. exceeding 12%
were excluded to avoid measurement errors. A standard
discriminant analysis was used to assess the contribution
of each variable in the separation of the different groups.
Finally, in analogy with Kay et al. (1999), statistical classi-
fiers were tested for their ability to discriminate among G.
rugiensis-like species from the different host groups. Again
two datasets were prepared; in the first set the specimens
were grouped by means of their genotype and in the second
by means of their respective host. A measure of error was
T. Huyse, F.A.M. Volckaert / International Journal for Parasitology 32 (2002) 907–919 909
Table 1
species, host, locality and date of sampling of the specimens used for morphometric and molecular analysisa
Parasite Host Locality Date, temperature, salinity N/G
G. rugiensis P. microps Ostend, Belgium 08/99, 16–188Cb 20/c
51814 0 N, 2857 0 E 31.1 ppm
G. rugiensis P. microps Ambleteuse, France 09/99, 158C –/1
508 N, 18 36 0 E 16–30 ppm
G. rugiensis P. microps Texel, The Netherlands 11/00, 128C –/2
538 N, 4848 0 E 31.0 ppm
G. rugiensis P. microps Yerseke, The Netherlands 11/99, 16.78C 3/2
518 30 0 N, 484 0 E 30.1 ppm
G. rugiensoides P. minutus Texel, The Netherlands 11/00, 128C 21/3
P. lozanoi 538N, 4848 0 E 31.0 ppm
G. rugiensoides P. minutus Texel, The Netherlands 05/99, 128C 6/–
538 N, 4848 0 E 31. 0 ppm
G. rugiensoides P. lozanoi Belgian continental shelf 10/99, 128C –/2
51835 0 N, 2818 0 E 35.0 ppm
G. rugiensoides P. minutus Bergen, Norway
60816 0 N, 5810 0 E 06/00, 9–108C 2/2
33.0 ppm
G. rugiensoides P. pictus Bergen, Norway 06/00, 9–108C 20/3
60816 0 N, 5810 0 E 33.0 ppm
G. cf. micropsi P. minutus Texel, The Netherlands 05/99, 128C –/4
P. lozanoi 538 N, 4848 0 E 31.0 ppm
G. micropsi P. microps Doel, Belgium 09/98, 158C –/c
51819 0 N, 4816 0 E 5–10 ppm
a N ¼ number of specimens measured, G ¼ number of specimens sequenced in this study.b Fish were kept in the laboratory at a water temperature of about 188C.c See Zietara et al., 2002.

expressed using a misclassification matrix. The perfor-
mance of the classifier was assessed by sevenfold cross-
validation. Linear discriminant analysis and nearest neigh-
bours were selected since they gave the best results in the
study of Kay et al. (1999).
3. Results
3.1. Molecular identification
Both G. rugiensis and G. micropsi consisted of two host-
dependent genotypes. The specimens found on P. lozanoi
and P. pictus had the same genotype as found on P. minutus,
hereafter named Gyrodactylus rugiensoides. Pomatoschis-
tus lozanoi harboured also the same genotype of G. micropsi
as found on P. minutus, hereafter named G. cf. micropsi.
The genotypes found on P. microps will be referred to as G.
micropsi and G. rugiensis, respectively. The alignment of
the ITS sequences is shown in Fig. 2. The gene 5.8S was
identical for all species. Genetic distances among the four
species varied from 2.5 to 16.5% (Table 2). No intraspecific
differences were found between ITS1 and ITS2 sequences
of specimens from France, Norway, Belgium and the Neth-
erlands. The phylogenetic relationships are visualised in a
maximum likelihood phylogram (Fig. 3). The phylogeny of
the host is inferred from the study of Wallis and Beardmore
(1984). Comparison of the different models of evolution
judged the HKY 1 G4 model of substitution (Hasegawa et
al., 1985), with gamma shape parameter ¼ 0.7 as the most
suited for the ITS1 and ITS2 data. Tree topologies generated
by the different datasets and different tree building methods
were identical and supported by high bootstrap values of
100%. Maximum parsimony analysis was based on 116
parsimony informative sites, length ¼ 152, CI ¼ 0.93,
RI ¼ 0.91. The ITS sequences of G. rugiensoides and G.
cf. micropsi have been submitted to the EMBL nucleotide
database under accession numbers AJ427414 and
AJ427221, respectively.
3.2. Morphometric and statistical analyses on G. rugiensis-
like species
A morphometric comparison between features from the
second and eighth marginal hook showed that the total
length (LMH, P , 0:0001), the shaft length (LH,
P , 0:0001), the sickle distant width (DWSI, P , 0:018),
sickle length (LSI, P , 0:025), the aperture (P , 0:0002)
and the toe (TOE, P , 0:016) of both marginal hooks are
significantly different. This is not the case for the sickle
proximal width (PWSI, P , 0:885) and the filament loop
(LOOP, P , 0:14). In order to exclude variation caused by
these intra-individual differences, only measurements of the
eighth marginal hook will be used in further analyses.
The mean, range and coefficient of variation of all 17
features are presented in Table 3. In general, measurements
on the anchor resulted in low C.V. values. The median width
of the ventral bar appeared to be the most variable structure
of the ventral bar (C.V. 15%). Regarding the marginal hook,
all features except the loop and the aperture displayed a
C.V. less than 12%. If a comparison was made with the
original species description of Glaser (1974a) (Table 3),
the majority of measurements were most comparable with
G. rugiensis collected from P. microps of Ostend. This is
especially the case for the marginal hook features where the
differences with the specimens collected from P. minutus
and P. pictus are more pronounced. Regarding the anchors,
the results of Glaser (1974a) show a lower range in total
length of anchor and length of anchor shaft (LA and LAS)
and length of anchor root (LAR) compared with our results.
It should be noted that Glaser (1974a) made no discrimina-
tion between specimens collected from different host
species, which were kept together in tanks for several
days. Moreover, no specification is given regarding which
marginal hook was used for measurements. This hampers
the comparison between his results and the results from the
present study. However, Dr Glaser kindly provided some of
his material (G. rugiensis from fins of P. minutus, Breeger
Bodden, Germany, 20/06/73), which allowed a re-examina-
tion. One specimen is redrawn (Fig. 4a) and measured
(Table 3) according to our procedure. The drawings and
T. Huyse, F.A.M. Volckaert / International Journal for Parasitology 32 (2002) 907–919910
Fig. 1. Measurements of the opisthaptoral hard parts of Gyrodactylus spp.
Hamulus: (1) LAP, length of anchor point; (2) LA, total length of anchor;
(3) LAS, length of anchor shaft; and (4) LAR, length of anchor root. Ventral
bar: (5) LVB, length of ventral bar; (6) BWVB, basal width of ventral bar;
(7) MWVB, median width of ventral bar; (8) VBM, length of ventral bar
membrane; and (9) TLVBM, total length of ventral bar membrane (median
width of ventral bar 1 length of ventral bar membrane). Marginal hook:
(10) LMH, total length of marginal hook; (11) LH, length of marginal hook
handle; (12) LSI, length of marginal hook sickle; (13) DWSI, distal width of
marginal hook sickle; (14) PWSI, proximal width of marginal hook sickle;
(15) LOOP, length of marginal hook filament loop; (16) APERTURE,
marginal hook sickle aperture distance; and (17) TOE, marginal hook toe
length.

T. Huyse, F.A.M. Volckaert / International Journal for Parasitology 32 (2002) 907–919 911
Fig. 2. Alignment of internal transcribed spacers (ITS) 1 and 2 and 5.8S gene sequences from G. micropsi, G. rugiensis (EMBL accession number AF328868
and AF328870), G. rugiensoides n. sp. and G. cf. micropsi. Dots (.) indicate nucleotides identical to G. rugiensoides; dashes (–) indicate alignment gaps.

measurements of the ventral bar and the marginal hook
features of this specimen resemble most with G. rugiensis
collected from P. microps of Ostend.
The highest Pearson’s correlation coefficients are found
between features measured on the same structure along the
same direction (LA and LAS; LMH and LH) (Table 4). As a
consequence, these variables are likely to produce redun-
dant information. As shown in the study of Geets et al.
(1999), features measured on different structures of the
haptor show lower correlations, which might imply that
they provide complementary information.
The results of the Tukey’s honest significant difference
test for unequal sample sizes are summarised in Table 5.
Significant differences (P , 0:05) between both genotypes
can be found in the length of anchor point (LAP), basal and
median width of ventral bar (BWVB, MWVB) and total
length of the ventral bar membrane (TLVBM). Regarding
the marginal hook features, differences in the total length of
marginal hook (LMH), length of handle (LH), length of
sickle (LSI), proximal width of sickle (PWSI) and sickle
aperture could be detected. These features of the marginal
hook are highly responsible for the interspecific differences
since they did not generate significant intraspecific varia-
tions. In contrast, the LAP, LAS and LA and likewise the
length of the ventral bar (LVB), generated significant differ-
ences within G. rugiensoides, found on P. pictus and P.
minutus respectively. In all cases, the largest values were
found for the specimens from P. pictus. This population is
caught in spring whereas most specimens from P. minutus
were caught in autumn. Two specimens from P. minutus
were caught together with the population from P. pictus.
Those measurements appeared to be the maximum range
found for the total population from P. minutus and were
thus of comparable magnitude as the specimens from P.
pictus (Table 3). Still, the differences in LAP and LVB
are significant and can only be partly explained by seasonal
variation.
A standard discriminant analysis was performed to detect
the variables responsible for the differences between the
groups. Three variables with a C.V. greater than 12%
were eliminated: MWVB, the sickle filament loop and
sickle aperture, as well as eight specimens with missing
variables. The specimens are grouped according to their
respective hosts. G. rugiensis on P. microps is clearly sepa-
rated from G. rugiensoides found on P. minutus and P.
pictus (Fig. 5). The variables mainly responsible for this
separation are the marginal hook features (LMH, LH,
LSI), the TLVMB and to a lesser extent the MWVB,
BWVB and the proximal width of the marginal hook sickle.
Intraspecific differences, between specimens from P. minu-
tus and P. pictus respectively, can be found in the LVB and
the LAS and LAP. The performances of the two statistical
classifiers, namely linear discriminant analysis and nearest
neighbours, are summarised in Table 6. In the nearest neigh-
bours method nine neighbours were used. Both methods
performed more or less equally well. The estimated misclas-
sification rate was markedly lower for the dataset where the
specimens were divided according to their genotype (3.1/4.7
versus 17.2). This difference can be explained by misclassi-
fications between specimens from P. minutus and P. pictus.
For example, nearest neighbours assigned 50% of the latter
group as members of the first group. When grouped accord-
ing to the respective genotype, G. rugiensoides was
perfectly discriminated by nearest neighbours and one
time misclassified by linear discriminant analysis.
3.3. Species description
Family Gyrodactylidae Cobbold, 1864Genus Gyrodactylus Nordmann, 1832Subgenus: G. (Paranephrotus) Malmberg, 1964Species group: G. rugiensis-group Glaser, 1974Gyrodactylus rugiensis Glaser, 1974Host: P. microps Krøyer, 1838 (Gobioidea), common
goby; Table 1.
Location on host: Fins and skin, occasionally on gill
arches.
Locality: Spuikom, Ostend, Belgium (51814 0 N, 2857 0 E);
Table 1.
Water temperature, salinity and date of collection: 188C,
31.1 ppm (18/8/1999); Table 1.
Morphological examination: 33 specimens collected live
at Ostend (Belgium), Ambleteuse (France) and Yerseke
(The Netherlands); Table 1.
Number measured: 23; Tables 1 and 3.
Number drawn: 5.
T. Huyse, F.A.M. Volckaert / International Journal for Parasitology 32 (2002) 907–919912
Fig. 3. Comparison of host and parasite phylogeny. The maximum like-
lihood phylogram of the parasites is constructed with the 5.8S and ITS2
sequences using the HKY 1 G4 model of substitution with gamma shape
parameter ¼ 0.7; Ln L ¼23207.3. The bootstrap values are identical for
all treebuilding methods. The host cladogram is inferred from Wallis and
Beardmore (1984). Lines connect hosts with their parasites.
Table 2
HKY distance matrix on ITS1 and ITS2 sequences of five Gyrodactylus
species; rates are assumed to follow a gamma distribution with gamma
shape parameter ¼ 0.7
1 2 3 4 5
1 G. rugiensoides –
2 G. rugiensis 0.025 –
3 G. cf. micropsi 0.146 0.163 –
4 G. micropsi 0.147 0.165 0.033 –
5 G. salaris 0.352 0.353 0.365 0.373 –

Deposited specimens: two slides: Fig. 4b and one extra
are deposited in the Natural History Museum, London
(Reg. No. 2002.2.14.4 and 2002.2.14.5, respectively).
Molecular analysis: Polymerase chain reaction (PCR)
amplified ITS1 and 2 and 5.8S gene sequences were
previously obtained of specimens from Ostend (Zietara
et al., 2002, EMBL accession number AF328870). For
this study five additional specimens were sequenced:
two from Yerseke (The Netherlands), two from Texel
(The Netherlands) and one from Ambleteuse (France).
Diagnosis
Pharynx with eight long processes. Cirrus with one large
and five small spines arranged in a single arched row.
Anchors and ventral bar reminding those of members of
the Gyrodactylus wageneri-group, subgenus G. (Limno-
nephrotus) Malmberg, 1964. Anchors and anchor points
longer than those of G. micropsi Glaser (1974a). Ventral
bar with distinct processes. Length of marginal hook
sickle shorter than in G. rugiensoides n. sp. Ventral bar
membrane tongue-shaped, its posterior part more blunted
and total length of ventral bar membrane shorter than in
G. rugiensoides n. sp. Proximal and distal width of
marginal hook almost equal, sickle point reaching further
than marginal hook toe. Marginal hook sickle aperture
T. Huyse, F.A.M. Volckaert / International Journal for Parasitology 32 (2002) 907–919 913
Table 3
Size range of characters of the opisthaptoral hard parts of G. rugiensis on P. minutus and P. microps, measured by Glaser (1974a) and measured in this study on
a single drawing of material provided by Glaser. Mean, range and C.V. (C.V. ¼ 100 £ the square root of the variance divided by the mean) of G. rugiensis on P.
microps(Ostend, 08/98); G. rugiensoides n. sp. on P. minutus (Texel, 11/00); G. rugiensoides n. sp. on P. pictus (Bergen, 06/00); and all Gyrodactylus species
used in the present study pooled on all hosts. a
Gyr. species G. rugiensis G. rugiensis G. rugiensoides G. rugiensoides All parasites
Host Species P. microps/P. minutus P. microps P. minutus/P. lozanoi P. pictus All hosts
N specimens 33 23 29 20 72
Anchors
LAP Mean 29.4 (27–31) 30.2 (28.6–32.0) 28.6 (27.2–31.2) 30.3 (28.7–32.0) 29.6 (27.2–32.0)
C.V. 3.5 3.1 3.0 4.3
LA Mean 59.4 (50–59) 58.4 (54.7–61.2) 58.9 (54.6–64.3) 60.0 (56.6–62.1) 59.1 (54.6–64.3)
C.V. 2.8 3.6 2.7 3.7
LAS Mean 42.4 (39–43) 42.5 (39.0–44.4) 42.5 (39.4–48.1) 43.9 (40.8–47.7) 42.9 (39.0–48.1
C.V. 2.9 3.6 3.9 4.1
LAR Mean 19.9 (13–18) 19.7 (18.1–21.1) 19.5 (17.9–21.5) 19.6 (18.4–21.6) 19.6 (17.9–21.6)
C.V. 4.6 4.3 3.7 4.8
Ventral bar
LVB Mean 25.7 (21–25) 25.9 (23.1–28.5) 26.1 (23.8–30.0) 28.2 (26.1–31.1) 26.4 (23.1–31.1)
C.V. 5.7 5.9 4.8 6.8
BWVB Mean 7.2 7.3 (6.1–8.3) 7.7 (6.2–8.9) 8.0 (6.7–9.0) 7.6 (6.1–9.0)
C.V. 7.7 8.4 7.5 8.8
MWVB Mean 5.6 (4.2–4.7) 5.5 (3.4–6.8) 6.6 (4.9–9.7) 6.1 (5.2–7.0) 6.1 (3.4–9.7)
C.V. 16.1 13.4 8.1 15.0
VBM Mean 12.3 12.1 (9.4–15.0) 12.6 (11.7–14.2) 13.4 (11.2–16.9) 12.5 (9.4–16.9)
C.V. 11.6 5.8 11.9 12.0
TLVBM Mean 18.0 17.6 (15.0–20.2) 19.1 (17.6–21.3) 19.4 (14.8–22.9) 18.5 (14.8–22.9)
C.V. 8.6 5.3 10 9.5
Marginal hook
LMH Mean 29.7 (28–31) 29.4 (26.7–30.6) 32.5 (30.8–34.6) 33.0 (32.0–34.3) 31.7 (26.7–34.6)
C.V. 3.6 3.7 1.7 5.9
LH Mean 25.2 (21–25) 23.5 (21.4–24.8) 26.3 (24.4–28.4) 26.7 (25.9–27.6) 25.5 (21.4–28.4)
C.V. 4.1 1.5 1.8 6.7
LSI Mean 6.0 (5.5–6.7) 6.5 (5.7–6.9) 7.0 (6.4–7.4) 7.0 (6.2–7.8) 6.8 (5.7–7.8)
C.V. 5.0 3.3 4.8 5.5
DWSI Mean 3.7 3.7 (3.1–4.3) 3.7 (3.0–4.5) 3.6 (3.0–3.9) 3.7 (3.0–4.5)
C.V. 8.6 9.2 8.0 8.7
PWSI Mean 3.8 3.8 (3.4–4.2) 4.12 (3.8–4.6) 4.0 (3.4–4.2) 4.0 (3.4–4.6)
C.V. 5.5 4.8 5.6 6.0
Aperture Mean 5.2 5.0 (4.5–5.5) 5.3 (4.5–6.0) 5.4 (5.0–6.1) 5.2 (4.5–6.1)
C.V. 4.9 6.0 5.6 15.6
Toe Mean 1.5 1.4 (1.1–1.7) 1.5 (1.3–1.8) 1.5 (1.2–1.8) 1.5 (1.1–1.8)
C.V. 10.6 8.7 8.2 9.4
LOOP Mean 6.6 8.4 (5.1–104) 8.8 (7.1–11.7) 8.7 (6.5–11.1) 8.7 (5.1–11.7)
C.V. 17.9 14.1 15 15.6
a All measurements are in mm. N ¼ number of parasite specimens measured. For abbreviations see Fig. 1.
smaller compared with G. rugiensoides. Total length of
marginal hook about half the size of the total anchor
length.
Molecular diagnosis
Genetic distance between G. rugiensis and G. rugien-
soides amounts to 2.6% (ITS1 and 2; calculated under
the HKY model with gamma shape parameter ¼ 0.7).
No intraspecific differences were found. The phyloge-
netic position is visualised in Fig. 3.
Gyrodactylus rugiensoides n. sp.Synonyms: G. rugiensis sensu Geets (1998. Doctoraatsth-
esis, Katholieke Universiteit Leuven), p 109
Host: P. minutus Pallas, 1970 (Gobioidea), sand goby;
Table 1.
Other hosts: P. lozanoi de Buen, 1923 (Gobioidea), Loza-
no’s goby; P. pictus Malm, 1865 (Gobioidea), painted
goby; Table 1.
Location on hosts: Fins, skin, occasionally on gill arches.
Type-locality: Texel1, The Netherlands (538 N, 4848 0 E);
Table 1.
Other localities: Bergen2, Norway (60816 0 N, 5810 0 E);
Table 1.
T. Huyse, F.A.M. Volckaert / International Journal for Parasitology 32 (2002) 907–919914
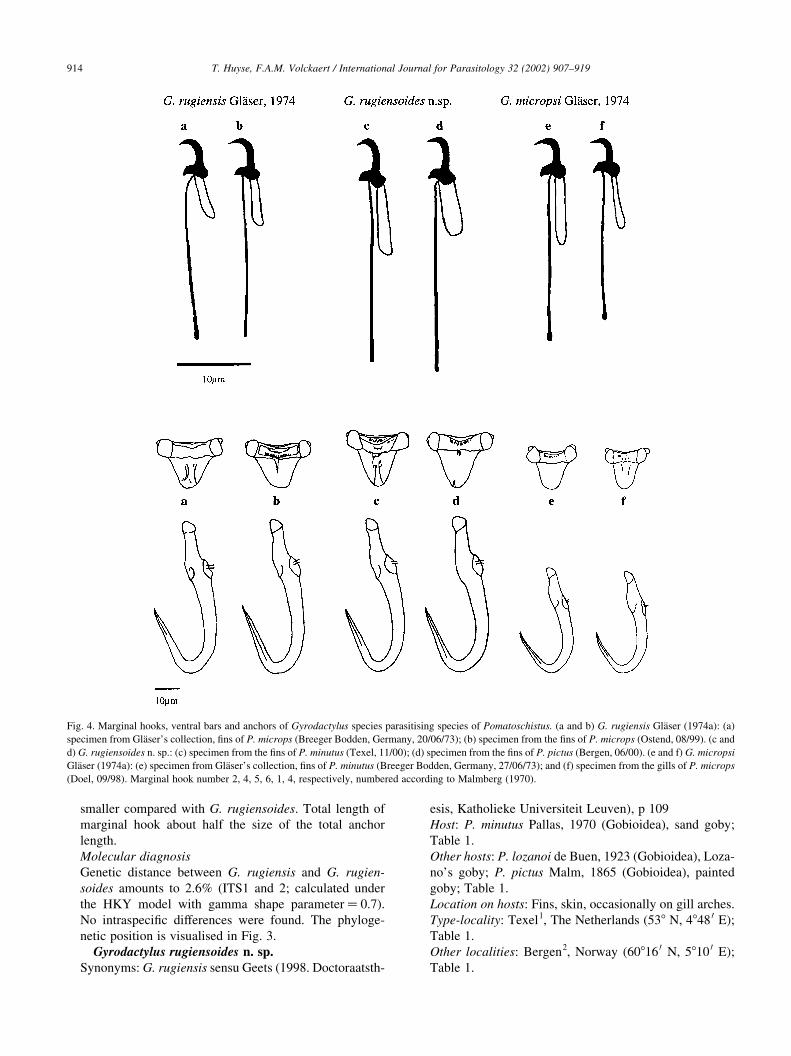
Fig. 4. Marginal hooks, ventral bars and anchors of Gyrodactylus species parasitising species of Pomatoschistus. (a and b) G. rugiensis Glaser (1974a): (a)
specimen from Glaser’s collection, fins of P. microps (Breeger Bodden, Germany, 20/06/73); (b) specimen from the fins of P. microps (Ostend, 08/99). (c and
d) G. rugiensoides n. sp.: (c) specimen from the fins of P. minutus (Texel, 11/00); (d) specimen from the fins of P. pictus (Bergen, 06/00). (e and f) G. micropsi
Glaser (1974a): (e) specimen from Glaser’s collection, fins of P. minutus (Breeger Bodden, Germany, 27/06/73); and (f) specimen from the gills of P. microps
(Doel, 09/98). Marginal hook number 2, 4, 5, 6, 1, 4, respectively, numbered according to Malmberg (1970).

Water temperature, salinity and date of collection: 128C,
31.0 ppm (26/11/2000)1; 33.0 ppm, 98C (26/6/2000)2;
Table 1.
Number studied: 47 specimens collected live at Texel
(The Netherlands), the Belgian continental shelf and
Bergen (Norway); Table 1.
Number measured: 29 individuals of P. minutus and 20 of
P. pictus; Tables 1 and 3.
Number drawn: 7; Figs. 4c,d.
Types: one holotype and two paratypes are deposited in
the Natural History Museum, London (Reg. No.
2002.2.14.5, 2002.2.14.2 and 2002.2.14.3, respectively).
Molecular analysis: five specimens from Bergen (three
from P. pictus; two from P. minutus); three from Texel
and two from the North Sea. PCR amplified internal tran-
scribed spacers (ITS) 1 and 2 and 5.8S gene sequences are
submitted to the EMBL nucleotide database under acces-
sion number AJ427414; Fig. 2.
Diagnosis
Pharynx with eight long processes. Cirrus with one large
and five small spines arranged in a single arched row.
Anchors and ventral bar reminding those of members of
the G. wageneri group, subgenus G. (Limnonephrotus)
Malmberg, 1964. Anchors and anchor points longer
than those of G. micropsi Glaser (1974a). Ventral bar
with small processes, not always visible. Median width
of ventral bar wider than in G. rugiensis Glaser (1974a).
Ventral bar membrane triangular and longer than in G.
T. Huyse, F.A.M. Volckaert / International Journal for Parasitology 32 (2002) 907–919 915
Table 4
Pearson’s correlation coefficients for 13 morphometric features measured on G. rugiensis and G. rugiensoides n. sp. on all host species (n ¼ 72)a
LAP 1 LA 2 LAS 3 LAR 4 LVB 5 BWVB 6 MWVB 7 LMH 8 LH 9 LSI 10 DWSI 11 PWSI 12 LOOP 13
1 1.00
2 0.42 1.00
3 0.50 0.90 1.00
4 0.18 0.63 0.37 1.00
5 0.40 0.48 0.50 0.34 1.00
6 2 0.04 0.07 0.09 2 0.01 0.29 1.00
7 2 0.32 2 0.01 2 0.01 2 0.10 0.07 0.60 1.00
8 2 0.05 0.46 0.42 0.10 0.25 0.18 0.32 1.00
9 2 0.05 0.44 0.41 0.08 0.22 0.10 0.29 0.92 1.00
10 0.29 0.25 0.34 2 0.09 0.35 0.31 0.10 0.42 0.25 1.00
11 2 0.07 0.19 0.09 0.18 2 0.16 0.07 0.18 0.13 0.11 2 0.07 1.00
12 0.15 0.26 0.23 0.15 0.22 0.34 0.32 0.31 0.29 0.40 0.44 1.00
13 0.08 0.25 0.21 0.26 0.16 0.25 0.22 0.38 0.30 0.17 0.03 0.15 1.00
a Correlations .0.70 are underlined. For abbreviations see Fig. 1.
Table 5
Analysis of variance testing for differences in morphological traits of G. rugiensis and G. rugiensoides n. spa
Groups P. microps-P. pictus/P. minutus P. microps-P. minutus P. minutus-P. pictus P. microps-P. pictus
Variables
LAP 0.0089 0.0001 0.0001 0.9423
LA 0.2153 0.9163 0.0027 0.0079
LAS 0.4414 0.3825 0.0002 0.0065
LAR 0.4931 0.2862 0.2193 0.9612
LVB 0.1409 0.3333 0.0001 0.0001
BWVB 0.0052 0.0316 0.3443 0.0011
MWVB 0.0021 0.0019 0.6642 0.0418
LVBM 0.0936 0.4961 0.5374 0.0932
TLVBM 0.0018 0.0092 0.8732 0.0057
LMH 0.0001 0.0001 0.0563 0.0001
LH 0.0001 0.0001 0.0812 0.0001
LSI 0.0001 0.0001 0.7493 0.0001
DWSI 0.4103 0.9617 0.5202 0.3773
PWSI 0.0004 0.0003 0.5233 0.0142
APERTURE 0.0001 0.0012 0.0562 0.0001
TOE 0.1688 0.4521 0.9624 0.3532
LOOP 0.3227 0.7592 0.8633 0.4733
a Specimens are grouped according to genotype and respective host species. Correlations in bold are significant at P , 0.05. For abbreviations see Fig. 1.
rugiensis. Length of marginal hook sickle longer than in
G. rugiensis. Marginal hook sickle aperture more open;
its aperture larger than in G. rugiensis. Proximal width of
marginal hook sickle always wider than distal width;
sickle point rarely reaching further than marginal hook
toe. Total length of marginal hook longer than half the
total anchor length.
Molecular diagnosis
Genetic distance between G. rugiensis and G. rugien-
soides amounts to 2.6% (ITS1 and 2; calculated under
the HKY model with gamma shape parameter ¼ 0.7).
No intraspecific differences were found. The phyloge-
netic position is visualised in Fig. 3.
Comments
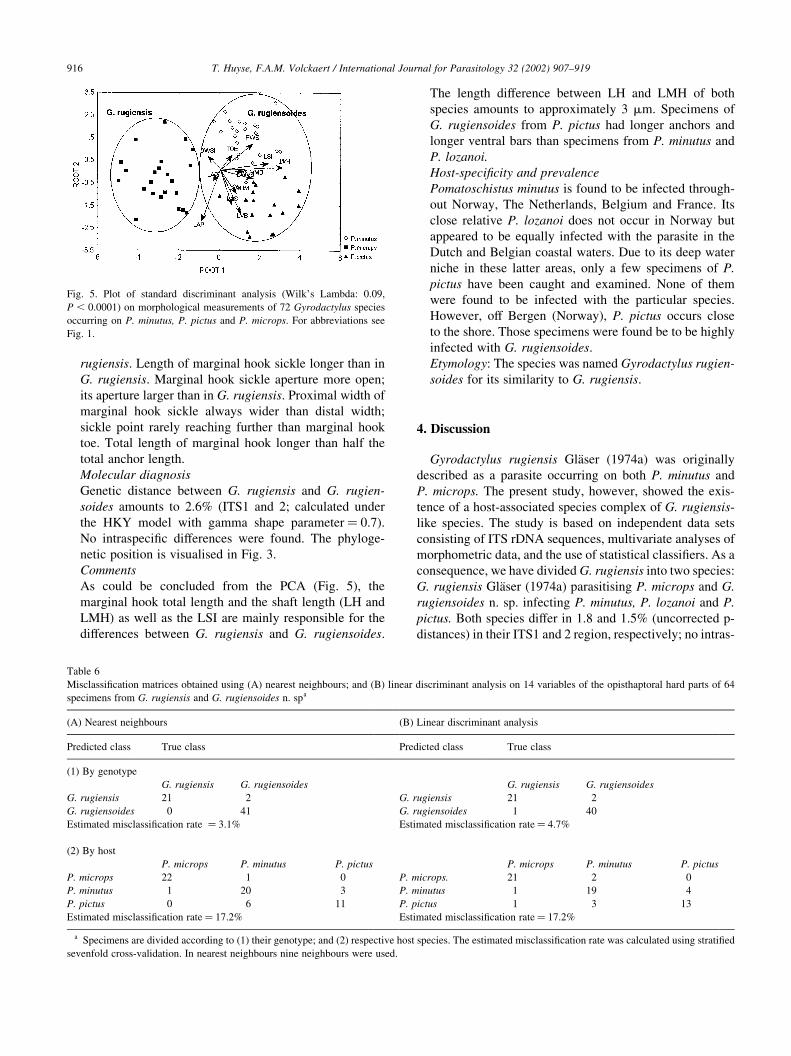
As could be concluded from the PCA (Fig. 5), the
marginal hook total length and the shaft length (LH and
LMH) as well as the LSI are mainly responsible for the
differences between G. rugiensis and G. rugiensoides.
The length difference between LH and LMH of both
species amounts to approximately 3 mm. Specimens of
G. rugiensoides from P. pictus had longer anchors and
longer ventral bars than specimens from P. minutus and
P. lozanoi.
Host-specificity and prevalence
Pomatoschistus minutus is found to be infected through-
out Norway, The Netherlands, Belgium and France. Its
close relative P. lozanoi does not occur in Norway but
appeared to be equally infected with the parasite in the
Dutch and Belgian coastal waters. Due to its deep water
niche in these latter areas, only a few specimens of P.
pictus have been caught and examined. None of them
were found to be infected with the particular species.
However, off Bergen (Norway), P. pictus occurs close
to the shore. Those specimens were found be to be highly
infected with G. rugiensoides.
Etymology: The species was named Gyrodactylus rugien-
soides for its similarity to G. rugiensis.
4. Discussion
Gyrodactylus rugiensis Glaser (1974a) was originally
described as a parasite occurring on both P. minutus and
P. microps. The present study, however, showed the exis-
tence of a host-associated species complex of G. rugiensis-
like species. The study is based on independent data sets
consisting of ITS rDNA sequences, multivariate analyses of
morphometric data, and the use of statistical classifiers. As a
consequence, we have divided G. rugiensis into two species:
G. rugiensis Glaser (1974a) parasitising P. microps and G.
rugiensoides n. sp. infecting P. minutus, P. lozanoi and P.
pictus. Both species differ in 1.8 and 1.5% (uncorrected p-
distances) in their ITS1 and 2 region, respectively; no intras-
T. Huyse, F.A.M. Volckaert / International Journal for Parasitology 32 (2002) 907–919916
Fig. 5. Plot of standard discriminant analysis (Wilk’s Lambda: 0.09,
P , 0:0001) on morphological measurements of 72 Gyrodactylus species
occurring on P. minutus, P. pictus and P. microps. For abbreviations see
Fig. 1.
Table 6
Misclassification matrices obtained using (A) nearest neighbours; and (B) linear discriminant analysis on 14 variables of the opisthaptoral hard parts of 64
specimens from G. rugiensis and G. rugiensoides n. spa
(A) Nearest neighbours (B) Linear discriminant analysis
Predicted class True class Predicted class True class
(1) By genotype
G. rugiensis G. rugiensoides G. rugiensis G. rugiensoides
G. rugiensis 21 2 G. rugiensis 21 2
G. rugiensoides 0 41 G. rugiensoides 1 40
Estimated misclassification rate ¼ 3.1% Estimated misclassification rate ¼ 4.7%
(2) By host
P. microps P. minutus P. pictus P. microps P. minutus P. pictus
P. microps 22 1 0 P. microps. 21 2 0
P. minutus 1 20 3 P. minutus 1 19 4
P. pictus 0 6 11 P. pictus 1 3 13
Estimated misclassification rate ¼ 17.2% Estimated misclassification rate ¼ 17.2%
a Specimens are divided according to (1) their genotype; and (2) respective host species. The estimated misclassification rate was calculated using stratified
sevenfold cross-validation. In nearest neighbours nine neighbours were used.

pecific variation among specimens from different sampling
sites was found. It is known that the ITS region can vary
greatly among species. Sequence variation between Gyro-
dactylus species as reported in the literature ranges from 2.7
to 56 to 1.5 to 38.7% for ITS1 and 2 respectively (Kimura
distances from Matejusova et al., 2001). In a study on poly-
stomatid monogeneans the ITS1 sequence variation ranges
from 0.6 to 23.3% (Tajima-Nei distances, Bentz et al.,
2001). Species differences found in the present study varied
from 2.5 to 16.5% (HKY distances from ITS1 1 ITS2,
Table 2), and are thus falling within the lower range of
the above results. However, it should be taken into account
that our species were sampled within a single fish genus
whereas in the above studies species were also collected
from different fish families.
4.1. Morphometric and statistical analyses
The morphological differences between the new species
G. rugiensoides and G. rugiensis can be mainly found in the
shape and size of the marginal hook and ventral bar. The
importance of the marginal hook features in discriminating
among closely related Gyrodactylus species has also been
reported in other studies (Malmberg, 1970; Shinn et al.,
1996; Cunningham et al., 2001). However, caution has to
be taken regarding the marginal hooks since this study
confirmed earlier observations (e.g. Malmberg, 1970) that
features of the second and eighth marginal hook significantly
differ in length. Despite the small and relatively limited
morphological differences, multivariate analysis could effec-
tively separate both species. With the use of statistical clas-
sifiers, G. rugiensoides was clearly discriminated from G.
rugiensis by nearest neighbours and one time misclassified
by linear discriminant analysis. The resulting estimated
misclassification rate was in both methods lower than the
estimated misclassification rate reported by Kay et al.
(1999). When we divided the specimens according to their
respective host species, the estimated misclassification rate
increased markedly. This indicates that the interspecific
differences far exceed intraspecific differences. However,
since this value is still comparable with the results of Kay
et al. (1999), it might indicate some host-dependent variation
in the morphology of G. rugiensoides. This is also suggested
by the Tukey’s honest significant difference test and the stan-
dard discriminant analysis (Table 5; Fig. 5). Specimens
found on the host P. pictus are characterised by larger
anchors, a significantly longer ventral bar, smaller median
width of the ventral bar and a longer ventral bar membrane. It
might be postulated that the populations are morphologically
adapted to their respective host, which might be followed by
genetic differentiation in the absence of gene flow. Gobies of
the genus Pomatoschistus are very abundant and some
species may occur in sympatry. These two features may
create possibilities for accidental host-switching. Already a
very low amount of gene flow is sufficient to prevent specia-
tion (Slatkin, 1987). However, variation in size caused by
different water temperatures has to be taken into considera-
tion as well. Samples from P. pictus were taken in spring
whereas the samples from P. minutus were taken in autumn.
There is a tendency for larger opisthaptoral hard parts in
colder periods (Malmberg, 1970; Mo, 1991; Geets et al.,
1999). Still, this will only partly explain the observed size
differences. Therefore it would be interesting to investigate
G. rugiensoides from P. pictus from the Dutch and Belgian
North Sea where it does not occur in sympatry with P. minu-
tus. The fact that interspecific morphological variation
succeeds intraspecific variation rejects the possibility that
the morphological differences found between G. rugiensis
and G. rugiensoides n. sp. only represent seasonal or host-
dependent phenotypic plasticity. Moreover, the consistent
molecular differentiation and the absence of intraspecific
variation between populations from different regions justify
the identification of two distinct species.
The existence of two host depending genotypes within G.
micropsi found on P. minutus and P. lozanoi, and P.
microps, respectively, points to the presence of host asso-
ciated species complexes within Gyrodactylus parasitising
Pomatoschistus species (see Fig. 3 and Table 2). The differ-
entiation between both genotypes amounted to 2.4 and 2.6%
in ITS1 and ITS2, respectively (uncorrected p-distances).
The drawing of G. micropsi from material provided by Dr
Glaser (Fig. 4e) resembles very much the drawing from
material collected from Doel (Fig. 4f). The differences in
size may be explained by seasonal variation since the former
is collected in spring whereas the latter is collected in late
summer. The difference between this species and G. rugien-
sis/G. rugiensoides is very clearly pronounced in the anchor
and the ventral bar morphology. However, the marginal
hooks are rather similar despite the fact that these features
are mainly responsible for the interspecific differences
between G. rugiensis and G. rugiensoides. This indicates
that morphological parameters may have a different mode
of evolution in different species groups.
4.2. Phylogenetic versus ecological influences
Parasite speciation is influenced by ecological and phylo-
genetic factors. To differentiate among the different specia-
tion modes phylogenetic studies are needed (Brooks and
McLennan, 1993). On the one hand, the direct life-cycle
and the high host-specificity enforce a tight relationship of
a Gyrodactylus species and its host, promoting co-evolution.
On the other hand, the ability for auto-infection increases the
chance for sympatric speciation and speciation by host-
switching (Brooks and McLennan, 1993). Each of the inves-
tigated host species, except P. pictus, harbours a member of
both species complexes (Fig. 3), which are clearly separated
from each other (HKY distances about 15%). Gyrodactylus
species infecting different host species cluster together and
are thus more closely related to each other than to the para-
sites on the same host species. Therefore sympatric specia-
tion could be ruled out. Two other explanations can be
T. Huyse, F.A.M. Volckaert / International Journal for Parasitology 32 (2002) 907–919 917
proposed: the current host-parasite association represents an
association by descent (co-speciation) or an association by
colonisation. Since the hosts P. lozanoi and P. minutus
speciated only recently (Fonds, 1973; Wallis and Beardmore,
1984), their similar parasite fauna could be explained by
delayed co-speciation (Brooks and McLennan, 1993).
However, since they live sympatrically in the North Sea,
host-switching might provide another explanation. It should
be noted that despite this sympatric lifestyle P. lozanoi
harbours a highly host-specific gill parasite G. longidactylus
(Geets et al., 1999). The other host pair sharing the same
Gyrodactylus species is P. minutus and P. pictus. They are
more distantly related (Wallis and Beardmore, 1984; Fig. 4),
but in Norway both hosts occur in sympatry. In this situation
host transfer is the most probable explanation for the occur-
rence of G. rugiensoides on both hosts. In Norway only one
catch (June 2000) was checked for the presence of G. cf.
micropsi and only very few P. pictus specimens from
Belgium were examined. Thus, no conclusion can yet be
made on the role of P. pictus as a potential host for G. cf.
micropsi.
Species diversity and host-specificity of Gyrodactylus
species infecting the Pomatoschistus species have been
underestimated. However, the species here presented have
only been reported from this host group, despite extensive
research on the Gyrodactylus fauna of other fish species
sharing the same habitats, e.g. gasterosteids and pleuronec-
tids (Glaser, 1974b; Geets, 1998. Doctoraatsthesis, Katho-
lieke Universiteit Leuven, Belgie; Zietara et al., 2000). As
such, we may assign these parasite species a phylogenetic
host-specificity towards gobies of the genus Pomatoschis-
tus. Besides phylogenetic factors, also ecological factors
such as host habitat seem to play an important role in this
Gyrodactylus-Pomatoschistus system.
Acknowledgements
T.H. is supported by a scholarship of the Institute of
Scientific and Technological research (IWT-Vlaanderen).
LSF Bergen and the EU-TMR programmes supported
sampling in Norway. We would like to thank M. Fonds
for the sampling in Texel (The Netherlands), G. Malmberg
for the important help with the treatment of the Gyrodacty-
lus species, K. Cottenie for help with the statistical analysis
and H.-J. Glaser for providing material. This study is
supported by the Belgian government (Federal Services of
Scientific, Technological and Cultural Research, contract
MN/DD/42).
References
Bentz, S., Leroy, S., Du Preez, L., Mariaux, J., Vaucher, C., Verneau, O.,
2001. Origin and evolution of African Polystoma (Monogenea: Poly-
stomatidae) assessed by molecular methods. Int. J. Parasitol. 31, 697–
705.
Brooks, D.R., McLennan, D.A., 1993. Parascript. Parasites and the
Language of Evolution, Smithsonian Institution Press, Washington
and London.
Burridge, C.P., White, R.W.G., 2000. Molecular phylogeny of the antitro-
pical subgenus Goniistius (Perciformes: Cheilodactylidae: Cheilodac-
tylus): evidence for multiple transequatorial divergences and non-
monophyly. Biol. J. Linn. Soc. 70, 435–58.
Cable, J., Harris, P.D., Lazarus, C.M., Tinsley, R.C., 1999. Molecular
phylogeny of Gyrodactylus (Platyhelminthes, Monogenea) using ribo-
somal DNA sequences. Can. J. Zool. 77, 1439–49.
Cunningham, C.O., McGillivray, D.M., MacKenzie, K., Melvin, W.T.,
1995. Discrimination between Gyrodactylus salaris, G. derjavini and
G. truttae (Platyhelminthes: Monogenea) using restriction fragment
length polymorphisms and an oligonucleotide probe within the small
subunit ribosomal RNA gene. Parasitology 111, 87–94.
Cunningham, C.O., Mo, T.A., Collins, C.M., Buchmann, K., Thiery, R.,
Blanc, G., Lautraite, A., 2001. Redescription of Gyrodactylus teuchis
Lautraite, Blanc, Thiery, Daniel & Vigneulle, 1999 (Monogenea: Gyro-
dactylidae); a species identified by ribosomal RNA sequence. Syst.
Parasitol. 48, 141–50.
Desdevises, Y., 2001. The phylogenetic position of Furnestinia Echeneis
(Monogenea, Diplectanidae) based on molecular data: a case of
morphological adaptation? Int. J. Parasitol. 31, 205–8.
Fonds, M., 1973. Sand gobies in the Dutch Wadden Sea (Pomatoschistus,
Gobiidae, Pisces). Neth. J. Sea Res. 6, 417–78.
Geets, A., Malmberg, G., Ollevier, F., 1998. Gyrodactylus longidactylus n.
sp., a monogenean from Pomatoschistus lozanoi (de Buen, ) from the
North Sea. Syst. Parasitol. 41, 63–70.
Geets, A., Appleby, C., Ollevier, F., 1999. Host-dependent and seasonal
variation in opisthaptoral hard parts of Gyrodactylus cf. arcuatus from
three Pomatoschistus spp. and G. arcuatus from Gasterosteus aculea-
tus: a multivariate approach. Parasitology 119, 27–40.
Glaser, H.-J., 1974a. Eine neue artengruppe des subgenus Gyrodactylus
(Paranephrotus) (Monogenea, Gyrodactylidae). Zool. Anz. 192,
271–8.
Glaser, H.-J., 1974b. Sechs neue arten der Gyrodactylus-wageneri-gruppe
(Monogenea, Gyrodactylidae) nebst bemerkungen zur Praparation,
determination, Terminologie und Wirtsspezifitat. Zool. Anz. 192, 56–
76.
Hasegawa, M., Kishino, H., Yano, T.A., 1985. Dating of the human ape
splitting by a molecular clock of mitochondrial-DNA. J. Mol. Evol. 22,
160–74.
Jousson, O., Bartoli, P., Pawlowski, J., 2000. Cryptic speciation among
intestinal parasites (Trematoda: Digenea) infecting sympatric host
fishes (Sparidae). J. Evol. Biol. 13, 778–85.
Kay, J.W., Shinn, A.P., Sommerville, C., 1999. Towards an automated
system for the identification of notifiable pathogens: using Gyrodacty-
lus salaris as an example. Parasitol. Today 15, 201–6.
Lazoski, C., Sole-Cava, A.M., Boury-Esnault, N., Klautau, M., Russo,
C.A.M., 2001. Cryptic speciation in a high gene flow scenario in the
oviparous marine sponge Chondrosia Reniformis. Mar. Biol. 139, 421–
9.
Malmberg, G., 1970. The exretory systems and the marginal hooks as basis
for the systematics of Gyrodactylus (Trematoda, Monogenea). Arkiv
Zool. 23, 1–235.
Matejusova, I., Gelnar, M., Mcbeath, A.J.A., Collins, C.M., Cunningham,
C.O., 2001. Molecular markers for Gyrodactylids (Gyrodactylidae:
Monogenea) from five fish families (Teleostei). Int. J. Parasitol. 31,
738–45.
Miller, P.J., 1986. Gobiidae. In: Whitehead, P.J.P., Bauchot, M.-L., Hureau,
J.-C., Nielsen, J., Tortonese, E. (Eds.). Fishes of the North-eastern
Atlantic and the Mediterranean, volume 3. Unesco, Paris, pp. 1019–85.
Mo, T.A., 1957. Seasonal variations of opisthaptoral hard parts of Gyro-
dactylus salaris Malmberg, (Monogenea: Gyrodactylidae) on parr of
Atlantic salmon Salmo salar L. in the River Batnfjordselva. Norw. Syst.
Parasitol. 19, 231–40.
T. Huyse, F.A.M. Volckaert / International Journal for Parasitology 32 (2002) 907–919918

Posada, D., Crandall, K.A., 1998. Modeltest: testing the model of DNA
substitution. Bioinformatics 14, 817–8.
Price, P.W., 1980. Evolutionary Biology of Parasites, Princeton University
Press, Princeton.
Shinn, A.P., des Clers, S., Gibson, D.I., Sommerville, C., 1996. Multivari-
ate analysis of morphometrical features from Gyrodactylus spp. (Mono-
genea) parasitising British salmonids: light microscope based studies.
Syst. Parasitol. 33, 115–25.
Slatkin, M., 1987. Gene flow and the geographic structure of natural popu-
lations. Science 236, 787–92.
Thompson, J.D., Higgins, D.G., Gibson, T.J., 1994. CLUSTAL W: improv-
ing the sensitivity of progressive multiple sequence alignment through
sequence weighting positions-specific gap penalties and weight matrix
choice. Nucleic Acids Res. 22, 4673–80.
Wallis, G.P., Beardmore, J.A., 1984. An electrophoretic study of the
systematic relationships of some closely related goby species (Pisces,
Gobiidae). Biol. J. Linn. Soc. 22, 107–23.
Zietara, M.S., Arndt, A., Geets, A., Hellemans, B., Volckaert, F.A.M.,
2000. The nuclear rDNA region of Gyrodactylus arcuatus and
G. branchicus (Monogenea: Gyrodactylidae). J. Parasitol. 86, 1368–
73.
Zietara, M.S., Huyse, T., Lumme, J., Volckaert, F.A.M., 2002. Deep diver-
gence among subgenera of Gyrodactylus inferred from rDNA ITS
region. Parasitology 124, 39–52.
T. Huyse, F.A.M. Volckaert / International Journal for Parasitology 32 (2002) 907–919 919