Hominoid Humeral Morphology: 3D Morphometric Analysis
10
Hominoid Humeral Morphology: 3D Morphometric Analysis Trenton W. Holliday 1 * and Luk a s Friedl 1,2 1 Department of Anthropology, Tulane University, New Orleans, LA 70118 2 Department of Anthropology, University of West Bohemia, 30614 Plze n, Czech Republic KEY WORDS humerus; upper limb; allometry; apes ABSTRACT Variation in humeral morphology among hominoids has long been recognized in relation to both phylogeny and behavior. Here, we use 3D landmark data to analyze humeral shape among hominoids, including hylobatids (n 5 37), Pongo (n 5 33), Homo (n 5 74), Pan (n 5 55), and Gorilla (n 5 45) to examine the relative influence of phylogenetic history vs. locomo- tor adaptation on humeral shape. Principal components analysis (PCA) of Procrustes shape data derived from 19 humeral type II or type III landmarks (Bookstein, 1991) for these taxa reveals the following: PC1, which primar- ily reflects the humeral torsion (or lack thereof) and rel- ative diaphyseal and epiphyseal breadths, separates the relatively narrow-shafted, small articular dimensions and low humeral torsion Hylobates, and to a lesser extent, Pongo, humeri from those of the African homi- noids. PC2, which largely contrasts shafts that are pos- teriorly convex (high PC2 scores) with antero-posteriorly straight humeral shafts (low PC2 scores) separates Homo, who tend to have A-P straighter shafts, from the more A-P bowed humeral shafts of the apes. These shape patterns suggest that the bowed shafts of Pan, Pongo, and Gorilla (and to a lesser extent, hylobatids) are due to the fact that in each of these taxa, the humerus is a weight-bearing bone, whereas the shafts of Homo are freed from locomotion. More subtle behavioral indicators are also elucidated, whereas cluster analyses (minimum spanning tree fit to a principal coordinates [PCO] plot and UPGMA dendrogram) reveal strong phylogenetic signals in the hominoid humerus as well. Am J Phys Anthropol 152:506–515, 2013. V C 2013 Wiley Periodicals, Inc. The superfamily Hominoidea is a primate taxon that has long been characterized by a marked diversity of locomotor adaptations (cf., Schultz, 1930, 1933; Andrews, 1981). Humans are the only full-time bipeds in the class Mammalia, the hylobatids (gibbons and siamangs) include the most highly specialized brachiators among the primates, and knuckle- and fist-walking of the great apes is a unique form of quadrupedalism not observed in other primates. In contrast, all hominoids are capable of forelimb suspension, but engage in it to varying degrees—from the highly suspensory gibbons and sia- mangs, to the frequently suspensory orangutans, bono- bos, common chimpanzees and lowland gorillas, to the less suspensory mountain gorillas, and (in adulthood), virtually never suspensory humans. Given the diversity in both size (female Hylobates lar weigh in at 5.3 kg, while male eastern lowland gorillas tip the scales at 175.2 kg; Smith and Jungers, 1997) and locomotor repertoires, it is not surprising that much morphological diversity in the limb skeleton of apes has been documented (see below). Here, we focus on the humerus, the largest bone of the forelimb, which is par- ticipating in locomotion for all extant hominoids with the exception of humans. It seems likely, given the locomotor variability of the Hominoidea, that functional differences in humeral mor- phology are manifest. We might expect, for example, there to be humeral shape differences (other than just limb length) between the Hylobatidae and other homi- noids. Indeed, the Hylobatidae have long been known to show lower humeral torsion (orientation of the humeral head relative to the plane of the distal articular surfa- ces) than other apes (Larson, 1988, 1998). Likewise, if orangutans are more suspensory than the African homi- noids (but see below), then there may be functional dif- ferences related to suspension evident in their humeri, as well. Additionally, given that gorillas and chimpanzees are knuckle-walkers with varying degrees of arboreality, we might expect some humeral characters to be bony mani- festations of this. For example, humeral bowing, likely the result of axial compressive and strong bending moments on the forelimbs, could be one of the morpho- logical features that have the potential to differentiate suspensory, quadrupedal/quadrumanous, versus bipedal hominoids. If bowing is primarily caused by axial com- pressive loads and/or high bending moments, then goril- las and chimpanzees should express this characteristic to the greatest degree. However, it must be remembered that suspensory taxa also stress the humerus in myriad Additional Supporting Information may be found in the online ver- sion of this article. Grant sponsor: Tulane University; Grant sponsor: New Technologies for Research of Contemporary and Past Societies; Grant number: OPVK NOTES CZ.1.07/2.3.00/20.0135; Grant spon- sor: University of West Bohemia; Grant number: SGS-2013-059. *Correspondence to: Trenton W. Holliday, Department of Anthro- pology, Tulane University, 101 Dinwiddie Hall, 6823 St. Charles Avenue, New Orleans, LA 70118. E-mail: [email protected] Received 24 August 2012; accepted 13 September 2013 DOI: 10.1002/ajpa.22385 Published online 17 October 2013 in Wiley Online Library (wileyonlinelibrary.com). Ó 2013 WILEY PERIODICALS, INC. AMERICAN JOURNAL OF PHYSICAL ANTHROPOLOGY 152:506–515 (2013)
Transcript of Hominoid Humeral Morphology: 3D Morphometric Analysis
Hominoid Humeral Morphology: 3D MorphometricAnalysis
Trenton W. Holliday1* and Luk�a�s Friedl1,2
1Department of Anthropology, Tulane University, New Orleans, LA 701182Department of Anthropology, University of West Bohemia, 30614 Plze�n, Czech Republic
KEY WORDS humerus; upper limb; allometry; apes
ABSTRACT Variation in humeral morphology amonghominoids has long been recognized in relation to bothphylogeny and behavior. Here, we use 3D landmarkdata to analyze humeral shape among hominoids,including hylobatids (n 5 37), Pongo (n 5 33), Homo(n 5 74), Pan (n 5 55), and Gorilla (n 5 45) to examinethe relative influence of phylogenetic history vs. locomo-tor adaptation on humeral shape. Principal componentsanalysis (PCA) of Procrustes shape data derived from 19humeral type II or type III landmarks (Bookstein, 1991)for these taxa reveals the following: PC1, which primar-ily reflects the humeral torsion (or lack thereof) and rel-ative diaphyseal and epiphyseal breadths, separates therelatively narrow-shafted, small articular dimensionsand low humeral torsion Hylobates, and to a lesserextent, Pongo, humeri from those of the African homi-
noids. PC2, which largely contrasts shafts that are pos-teriorly convex (high PC2 scores) with antero-posteriorlystraight humeral shafts (low PC2 scores) separatesHomo, who tend to have A-P straighter shafts, from themore A-P bowed humeral shafts of the apes. Theseshape patterns suggest that the bowed shafts of Pan,Pongo, and Gorilla (and to a lesser extent, hylobatids)are due to the fact that in each of these taxa, thehumerus is a weight-bearing bone, whereas the shafts ofHomo are freed from locomotion. More subtle behavioralindicators are also elucidated, whereas cluster analyses(minimum spanning tree fit to a principal coordinates[PCO] plot and UPGMA dendrogram) reveal strongphylogenetic signals in the hominoid humerus as well.Am J Phys Anthropol 152:506–515, 2013. VC 2013 Wiley
Periodicals, Inc.
The superfamily Hominoidea is a primate taxon thathas long been characterized by a marked diversity oflocomotor adaptations (cf., Schultz, 1930, 1933; Andrews,1981). Humans are the only full-time bipeds in the classMammalia, the hylobatids (gibbons and siamangs)include the most highly specialized brachiators amongthe primates, and knuckle- and fist-walking of the greatapes is a unique form of quadrupedalism not observed inother primates. In contrast, all hominoids are capable offorelimb suspension, but engage in it to varyingdegrees—from the highly suspensory gibbons and sia-mangs, to the frequently suspensory orangutans, bono-bos, common chimpanzees and lowland gorillas, to theless suspensory mountain gorillas, and (in adulthood),virtually never suspensory humans.
Given the diversity in both size (female Hylobates larweigh in at 5.3 kg, while male eastern lowland gorillastip the scales at 175.2 kg; Smith and Jungers, 1997) andlocomotor repertoires, it is not surprising that muchmorphological diversity in the limb skeleton of apes hasbeen documented (see below). Here, we focus on thehumerus, the largest bone of the forelimb, which is par-ticipating in locomotion for all extant hominoids withthe exception of humans.
It seems likely, given the locomotor variability of theHominoidea, that functional differences in humeral mor-phology are manifest. We might expect, for example,there to be humeral shape differences (other than justlimb length) between the Hylobatidae and other homi-noids. Indeed, the Hylobatidae have long been known toshow lower humeral torsion (orientation of the humeralhead relative to the plane of the distal articular surfa-ces) than other apes (Larson, 1988, 1998). Likewise, iforangutans are more suspensory than the African homi-
noids (but see below), then there may be functional dif-ferences related to suspension evident in their humeri,as well.
Additionally, given that gorillas and chimpanzees areknuckle-walkers with varying degrees of arboreality, wemight expect some humeral characters to be bony mani-festations of this. For example, humeral bowing, likelythe result of axial compressive and strong bendingmoments on the forelimbs, could be one of the morpho-logical features that have the potential to differentiatesuspensory, quadrupedal/quadrumanous, versus bipedalhominoids. If bowing is primarily caused by axial com-pressive loads and/or high bending moments, then goril-las and chimpanzees should express this characteristicto the greatest degree. However, it must be rememberedthat suspensory taxa also stress the humerus in myriad
Additional Supporting Information may be found in the online ver-sion of this article.
Grant sponsor: Tulane University; Grant sponsor: NewTechnologies for Research of Contemporary and Past Societies;Grant number: OPVK NOTES CZ.1.07/2.3.00/20.0135; Grant spon-sor: University of West Bohemia; Grant number: SGS-2013-059.
*Correspondence to: Trenton W. Holliday, Department of Anthro-pology, Tulane University, 101 Dinwiddie Hall, 6823 St. CharlesAvenue, New Orleans, LA 70118. E-mail: [email protected]
Received 24 August 2012; accepted 13 September 2013
DOI: 10.1002/ajpa.22385Published online 17 October 2013 in Wiley Online Library
(wileyonlinelibrary.com).
� 2013 WILEY PERIODICALS, INC.
AMERICAN JOURNAL OF PHYSICAL ANTHROPOLOGY 152:506–515 (2013)

ways that would lead to high bending moments (Swartzet al., 1989). Thus, we may expect that suspensory taxawill exhibit reduced humeral curvature relative to goril-las and chimpanzees, but still greater than those ofhumans, whose humeri are generally nonweight-bearing.
This point—that among the hominoids, only inhumans is the upper limb not weight-bearing duringlocomotion—would predict that there are humeral func-tional morphological differences between humans andother apes. For example, shaft robusticity relative tojoint size could point to functional differences betweenthe taxa. Although joint size is ontogeneticallyrestrained to body mass (Lieberman et al., 2001), shaftrobusticity is known to reflect behavior through activebone deposition and remodeling in adulthood (for a thor-ough review of the influence of ontogeny on bone form,see Ruff et al., 2006). Moreover, following Burr et al.(1989), the shaft should be more robust per unit bodyweight in species that are more terrestrial than in thosethat are more arboreal, at least among closely relatedspecies.
Using geometric morphometrics, we here provide amultivariate analysis to investigate the influence of phy-logenetic history and locomotor adaptation on humeralshape. The application of geometric morphometrics(which is widely regarded as the study of variation andchange in biological form—Bookstein, 1991) to bioan-thropological questions is now quite common (e.g., Book-stein et al., 1999; Ponce de Le�on and Zollikofer, 2001;Gunz and Harvati, 2007; Harmon, 2007, 2009). Mostcommonly, geometric morphometrics quantifies biologicalform via the use of landmark data, and since its dataare three-dimensional coordinate points that capture theshape of the object of study, it is arguably one of the bestmeans by which to quantify morphological shape (Rohlfand Marcus, 1993).
MATERIALS AND METHODS
Nineteen humeral anatomical landmarks and type IIor III landmarks (after Bookstein, 1991; Table 1, Fig. 1;color figure available in supporting information) weredigitized by the authors using a digitizing arm (Micro-scribe 3D, Immersion Technologies, San Jose, CA) on asample of humeri from 74 recent humans, 37 hylobatids,33 orangutans, 55 chimpanzees, and 45 gorillas (seebelow for details). These landmarks were selected tobest capture the shape of the humerus, including thehead, greater tubercle, midshaft diaphysis, condyles(trochlea and capitulum), and epicondyles. In most cases,these data points have been instrumentally determined(e.g., the inferior-most point of the capitulum). The land-marks were chosen because they help to quantify biobe-haviorally salient features such as the size and positionof the epicondyles and greater tubercle, diaphysealthickness, and torsion along the bone’s long axis. Thelandmarks also effectively capture the relative size ofthe humeral head and distal condyles, structures thatmust accommodate many of the joint and muscle reac-tion forces associated with use of the upper limb (andthose associated with body weight for all taxa exceptHomo).
In order to assess intraobserver and interobservererror in landmark capture, one recent human humerus,chosen at random, was sampled 10 times by each authorover the course of several weeks. The mean between-
TABLE 1. Landmarks (type II and III; Bookstein, 1991) used inthis study. The distal articular axis defines the medio-lateral
orientation
Anatomical Region LocationLandmarkNumber
Humeral Head center 1Head-Neck
Intersectionmost superior point 2
most inferior point 3most anterior point 4most posterior point 5
Greater tubercle most superior point 6Midshaft most anterior point 7
most posterior point 8most medial point 9most lateral point 10
Epicondyles medial-most point, medial 11lateral-most point, lateral 12
Capitulum capitulum/lat. epicondyle junction 13distal-most point 14anterior-most point 15
Trochlea distolateral-most point 16apex of trochlear groove 17distomedial-most point 18trochlea/med. epicondyle junction 19
Fig. 1. Anterior (L) and posterior (R) views of Tulane Uni-versity human left humerus number 30, with landmarks takenindicated by dots. Landmark numbers correspond to those inTable 1. A color version (Supporting Informtion Figure S1) isfound in the supporting online material. [Color figure can beviewed in the online issue, which is available atwileyonlinelibrary.com.]
HOMINOID HUMERAL MORPHOLOGY 507
American Journal of Physical Anthropology

OTU Procrustes chord distance between repeats of thesame specimen (n 5 10) measured by TWH was 0.013.The mean between-OTU Procrustes chord distancebetween repeats of the same specimen (n 5 10) measuredby LF was 0.006. In contrast, the average between-OTUProcrustes chord distance between different recenthuman specimens was 3–6 times greater (0.04), indicat-ing that intraobserver error is minimal. When the twoauthors’ repeated measures are compared with eachother, the average Procrustes between-OTU distancebetween them is also small (0.016), indicative of minimalinterobserver error (and see Figure S2 in SupportingInformation).
The recent human sample (n 5 74) is made up of early20th century individuals taken from a cadaver samplefrom New Orleans curated in the Department of Anthro-pology at Tulane University. The skeletons that make upthis sample were divided by element sometime in the1950s or 1960s, so sex for this sample is unknown. Thetaxonomic and sex composition of the nonhuman homi-noid samples is presented in Table 2. With very fewexceptions, all of the nonhuman primate humeri arefrom wild animals. The hylobatid sample has represen-tatives of all four purported genera within the family:Hylobates is represented by 21 individuals, Symphalan-gus (siamangs) by 10, and Nomascus by 5. There is onlya single representative of Hoolock. The orangutan(Pongo) sample is roughly evenly divided between Bor-nean and Sumatran orangutans, here considered sepa-rate species (Pongo pygmaeus and P. abelii,respectively). The entire hylobatid and Pongo samplesare taken from the Smithsonian Institution’s Depart-ment of Zoology collections. The chimpanzee (Pan troglo-dytes) sample (subspecies unknown) includes 38individuals measured at the Cleveland Museum of Natu-ral History, 16 individuals measured at the SmithsonianInstitution, and a single (almost certainly captive) chim-panzee skeleton housed at the Department of Anthropol-ogy at Tulane University. The gorilla sample includes
both western lowland (Gorilla gorilla) and mountain (G.beringei) gorillas, albeit more of the former than the lat-ter. Twenty-three of the individuals (all western lowland)were drawn from the Cleveland Museum of Natural His-tory, with an additional 21 gorillas (a mixture of westernlowland and mountain gorillas) measured at the Smith-sonian Institution.
As mentioned earlier, the long bones of the Tulanecadaver sample were comingled sometime in the mid-20th century, and therefore in order to ensure that thesame individuals from this sample were not sampledtwice, only left humeri were measured for that sample.With regard to the nonhuman primate samples (forwhich individual associated skeletons were available), ifhumeri from the right side were used, they werereflected (i.e., mirror-imaged) in Morphologika2 (version2.5; O’Higgins and Jones, 2006) for analysis. This wasdone for 5 Pan, 7 Gorilla, 5 Pongo, and 4 hylobatids.
Before multivariate analysis began, landmarks werefirst subjected to generalized Procrustes analysis (GPA)using Morphologika2 (version 2.5; O’Higgins and Jones,2006) software. This method first computes a commoncentroid for all humeri sampled. Then, in an effort tosize-standardize the data, all humeri are scaled relativeto an “average” humerus (which itself is determined byaveraging all the 3D coordinate values for each land-mark for all of the humeri sampled). Procrustes numbersare then computed for all landmarks. These numbersare the sum of all Procrustes distances between the“average” humerus and those of the sampled humeri forany given landmark (Gower, 1975). This procedureremoves an isometric size component from the data, butit is important to note that allometric shape componentsmay still remain (O’Higgins, 2000).
In order to reveal patterns of shape differences acrossthe samples, the covariance matrix of the Procrustesnumbers described earlier was subjected to principalcomponents analysis (PCA). Principal component (PC)scores for each individual were computed in Morpholo-gika2 and plotted using NCSS 2007 version (Hintze,2007). Wireframe models are derived from those pro-duced by Morphologika2 (O’Higgins and Jones, 2006),and are used to provide a visual representation of thechanges in morphology associated with the principalcomponent axes. Differences in PC scores between taxaare elucidated via analysis of variance (ANOVA) andpost hoc Scheff�e’s multiple comparison tests.
In an attempt to investigate the impact of phylogenyon morphology, the mean principal component scores forthe first 20 principal components were used as data intwo phenetic clustering algorithms. The first was a prin-cipal coordinates (PCO) plot to which was fit a minimumspanning tree. This method produces a tree that isequivalent to an unrooted dendrogram. The second wasthe unweighted pairgroup method using averages(UPGMA) clustering algorithm. All cluster analyseswere performed using NTSYS-PC, Version 2.11W (Rohlf,2004). The first 20 components were chosen a prioribecause these explain close to 95% (specifically, 94.8%)of the variation. Note, however, that clusters based onas few as 7, and as many as 50, PC scores yielded nearlyidentical results, with only slight differences in branchlengths evident. For cluster analyses, the gorillas wereseparated into mountain and western lowland species,the orangutans were separated into Sumatran and Bor-nean species, and the hylobatids were split into onegroup composed of siamangs (Symphalangus), and a
TABLE 2. Nonhuman hominoid sample composition by taxonand sex
Male Female Indeter.
HominidaePan troglodytes 22 29 4
Gorilla gorilla 19 14 0Gorilla beringei 7 4 0Gorilla sp. 0 1 0
26 19 0
Pongo pygmaeus (Borneo) 5 10 1Pongo abelii (Sumatra) 7 9 0Pongo sp. 0 1 0
12 20 1HylobatidaeHoolock hoolock 0 1 0Symphalangus syndactylus 4 6 0Nomascus 2 3 0Hylobates lar 2 2 1Hylobates pileatus 1 0 0Hylobates klossii 4 4 0Hylobates moloch 2 0 0Hylobates agilis 2 0 0Hylobates muelleri 0 1 0Hylobates spp. 0 1 1
17 18 2
508 T.W. HOLLIDAY AND L. FRIEDL
American Journal of Physical Anthropology
second group that was a mixture of the three gibbongenera. This last arrangement does not reflect the cur-rently hypothesized phylogeny of the Hylobatidae, inwhich Hoolock and Nomascus are outgroups to the othergibbon genera (Israfil et al., 2011), but rather was cho-sen for phenetic reasons (i.e., Symphalangus is signifi-cantly larger in body size than the other hylobatidgenera).
RESULTS
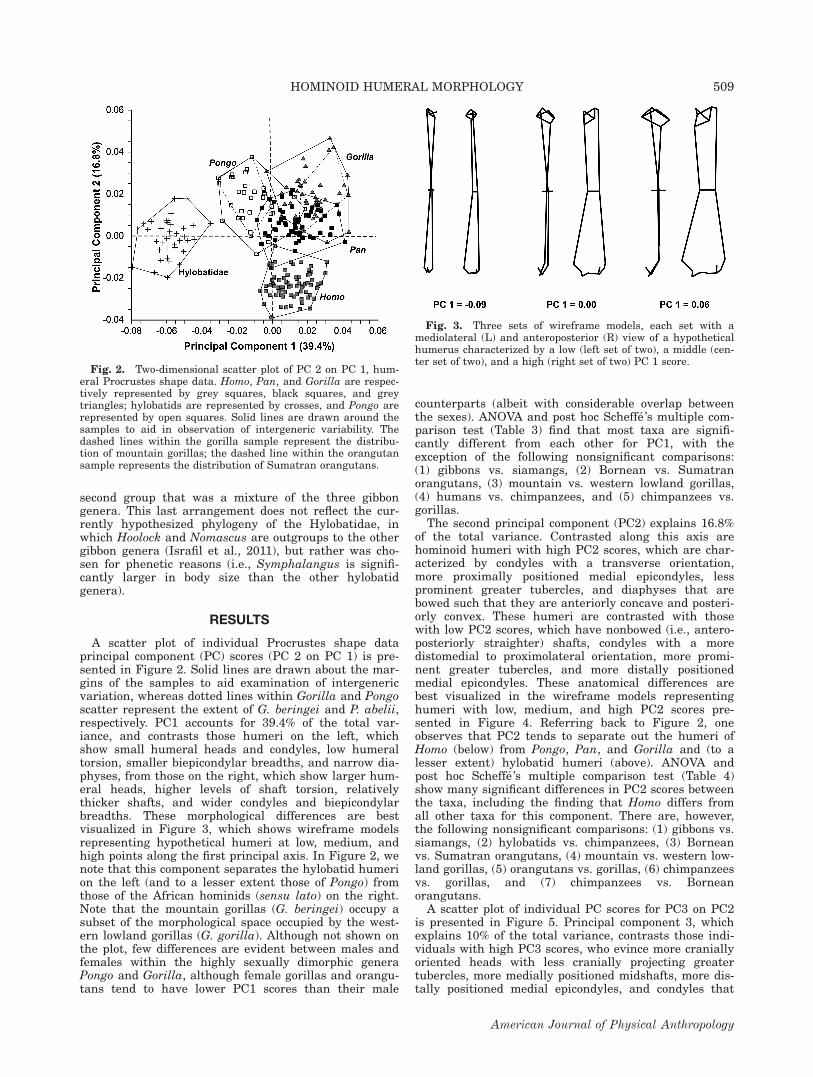
A scatter plot of individual Procrustes shape dataprincipal component (PC) scores (PC 2 on PC 1) is pre-sented in Figure 2. Solid lines are drawn about the mar-gins of the samples to aid examination of intergenericvariation, whereas dotted lines within Gorilla and Pongoscatter represent the extent of G. beringei and P. abelii,respectively. PC1 accounts for 39.4% of the total var-iance, and contrasts those humeri on the left, whichshow small humeral heads and condyles, low humeraltorsion, smaller biepicondylar breadths, and narrow dia-physes, from those on the right, which show larger hum-eral heads, higher levels of shaft torsion, relativelythicker shafts, and wider condyles and biepicondylarbreadths. These morphological differences are bestvisualized in Figure 3, which shows wireframe modelsrepresenting hypothetical humeri at low, medium, andhigh points along the first principal axis. In Figure 2, wenote that this component separates the hylobatid humerion the left (and to a lesser extent those of Pongo) fromthose of the African hominids (sensu lato) on the right.Note that the mountain gorillas (G. beringei) occupy asubset of the morphological space occupied by the west-ern lowland gorillas (G. gorilla). Although not shown onthe plot, few differences are evident between males andfemales within the highly sexually dimorphic generaPongo and Gorilla, although female gorillas and orangu-tans tend to have lower PC1 scores than their male
counterparts (albeit with considerable overlap betweenthe sexes). ANOVA and post hoc Scheff�e’s multiple com-parison test (Table 3) find that most taxa are signifi-cantly different from each other for PC1, with theexception of the following nonsignificant comparisons:(1) gibbons vs. siamangs, (2) Bornean vs. Sumatranorangutans, (3) mountain vs. western lowland gorillas,(4) humans vs. chimpanzees, and (5) chimpanzees vs.gorillas.
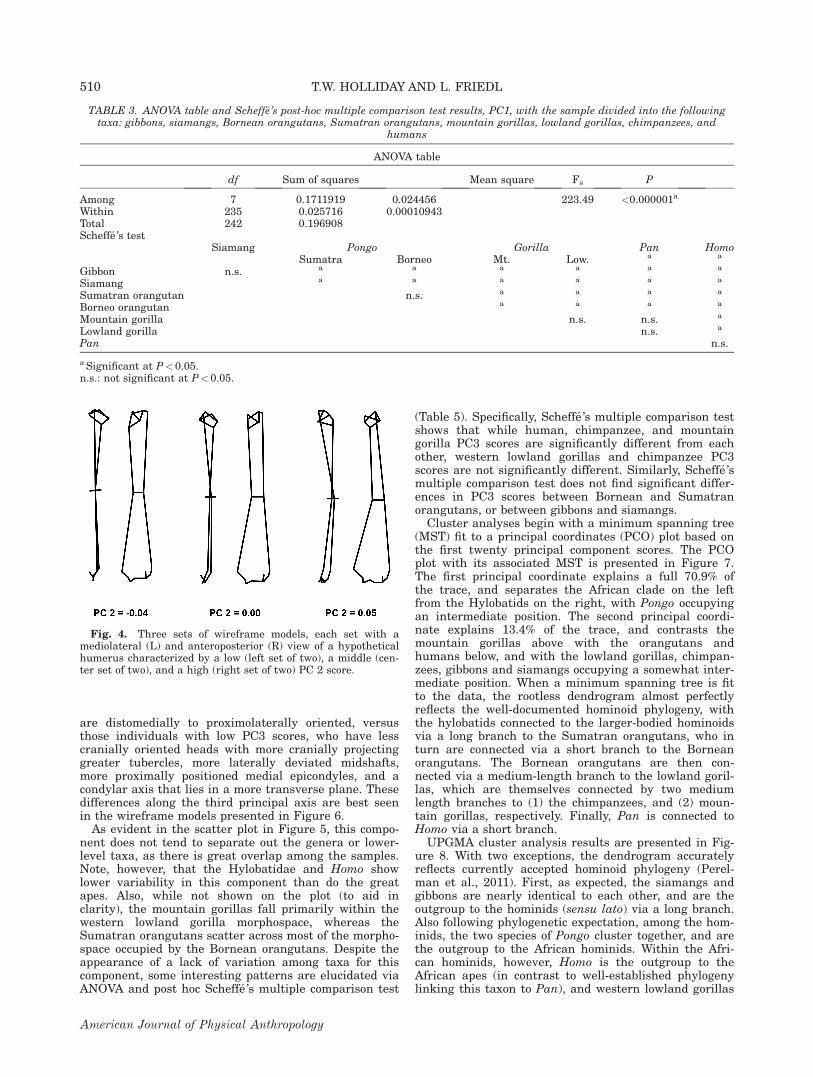
The second principal component (PC2) explains 16.8%of the total variance. Contrasted along this axis arehominoid humeri with high PC2 scores, which are char-acterized by condyles with a transverse orientation,more proximally positioned medial epicondyles, lessprominent greater tubercles, and diaphyses that arebowed such that they are anteriorly concave and posteri-orly convex. These humeri are contrasted with thosewith low PC2 scores, which have nonbowed (i.e., antero-posteriorly straighter) shafts, condyles with a moredistomedial to proximolateral orientation, more promi-nent greater tubercles, and more distally positionedmedial epicondyles. These anatomical differences arebest visualized in the wireframe models representinghumeri with low, medium, and high PC2 scores pre-sented in Figure 4. Referring back to Figure 2, oneobserves that PC2 tends to separate out the humeri ofHomo (below) from Pongo, Pan, and Gorilla and (to alesser extent) hylobatid humeri (above). ANOVA andpost hoc Scheff�e’s multiple comparison test (Table 4)show many significant differences in PC2 scores betweenthe taxa, including the finding that Homo differs fromall other taxa for this component. There are, however,the following nonsignificant comparisons: (1) gibbons vs.siamangs, (2) hylobatids vs. chimpanzees, (3) Borneanvs. Sumatran orangutans, (4) mountain vs. western low-land gorillas, (5) orangutans vs. gorillas, (6) chimpanzeesvs. gorillas, and (7) chimpanzees vs. Borneanorangutans.
A scatter plot of individual PC scores for PC3 on PC2is presented in Figure 5. Principal component 3, whichexplains 10% of the total variance, contrasts those indi-viduals with high PC3 scores, who evince more craniallyoriented heads with less cranially projecting greatertubercles, more medially positioned midshafts, more dis-tally positioned medial epicondyles, and condyles that
Fig. 2. Two-dimensional scatter plot of PC 2 on PC 1, hum-eral Procrustes shape data. Homo, Pan, and Gorilla are respec-tively represented by grey squares, black squares, and greytriangles; hylobatids are represented by crosses, and Pongo arerepresented by open squares. Solid lines are drawn around thesamples to aid in observation of intergeneric variability. Thedashed lines within the gorilla sample represent the distribu-tion of mountain gorillas; the dashed line within the orangutansample represents the distribution of Sumatran orangutans.
Fig. 3. Three sets of wireframe models, each set with amediolateral (L) and anteroposterior (R) view of a hypotheticalhumerus characterized by a low (left set of two), a middle (cen-ter set of two), and a high (right set of two) PC 1 score.
HOMINOID HUMERAL MORPHOLOGY 509
American Journal of Physical Anthropology
are distomedially to proximolaterally oriented, versusthose individuals with low PC3 scores, who have lesscranially oriented heads with more cranially projectinggreater tubercles, more laterally deviated midshafts,more proximally positioned medial epicondyles, and acondylar axis that lies in a more transverse plane. Thesedifferences along the third principal axis are best seenin the wireframe models presented in Figure 6.
As evident in the scatter plot in Figure 5, this compo-nent does not tend to separate out the genera or lower-level taxa, as there is great overlap among the samples.Note, however, that the Hylobatidae and Homo showlower variability in this component than do the greatapes. Also, while not shown on the plot (to aid inclarity), the mountain gorillas fall primarily within thewestern lowland gorilla morphospace, whereas theSumatran orangutans scatter across most of the morpho-space occupied by the Bornean orangutans. Despite theappearance of a lack of variation among taxa for thiscomponent, some interesting patterns are elucidated viaANOVA and post hoc Scheff�e’s multiple comparison test
(Table 5). Specifically, Scheff�e’s multiple comparison testshows that while human, chimpanzee, and mountaingorilla PC3 scores are significantly different from eachother, western lowland gorillas and chimpanzee PC3scores are not significantly different. Similarly, Scheff�e’smultiple comparison test does not find significant differ-ences in PC3 scores between Bornean and Sumatranorangutans, or between gibbons and siamangs.
Cluster analyses begin with a minimum spanning tree(MST) fit to a principal coordinates (PCO) plot based onthe first twenty principal component scores. The PCOplot with its associated MST is presented in Figure 7.The first principal coordinate explains a full 70.9% ofthe trace, and separates the African clade on the leftfrom the Hylobatids on the right, with Pongo occupyingan intermediate position. The second principal coordi-nate explains 13.4% of the trace, and contrasts themountain gorillas above with the orangutans andhumans below, and with the lowland gorillas, chimpan-zees, gibbons and siamangs occupying a somewhat inter-mediate position. When a minimum spanning tree is fitto the data, the rootless dendrogram almost perfectlyreflects the well-documented hominoid phylogeny, withthe hylobatids connected to the larger-bodied hominoidsvia a long branch to the Sumatran orangutans, who inturn are connected via a short branch to the Borneanorangutans. The Bornean orangutans are then con-nected via a medium-length branch to the lowland goril-las, which are themselves connected by two mediumlength branches to (1) the chimpanzees, and (2) moun-tain gorillas, respectively. Finally, Pan is connected toHomo via a short branch.
UPGMA cluster analysis results are presented in Fig-ure 8. With two exceptions, the dendrogram accuratelyreflects currently accepted hominoid phylogeny (Perel-man et al., 2011). First, as expected, the siamangs andgibbons are nearly identical to each other, and are theoutgroup to the hominids (sensu lato) via a long branch.Also following phylogenetic expectation, among the hom-inids, the two species of Pongo cluster together, and arethe outgroup to the African hominids. Within the Afri-can hominids, however, Homo is the outgroup to theAfrican apes (in contrast to well-established phylogenylinking this taxon to Pan), and western lowland gorillas
TABLE 3. ANOVA table and Scheff�e’s post-hoc multiple comparison test results, PC1, with the sample divided into the followingtaxa: gibbons, siamangs, Bornean orangutans, Sumatran orangutans, mountain gorillas, lowland gorillas, chimpanzees, and
humans
ANOVA table
df Sum of squares Mean square Fs P
Among 7 0.1711919 0.024456 223.49 <0.000001a
Within 235 0.025716 0.00010943Total 242 0.196908Scheff�e’s test
Siamang Pongo Gorilla Pan HomoSumatra Borneo Mt. Low. a a
Gibbon n.s. a a a a a a
Siamang a a a a a a
Sumatran orangutan n.s. a a a a
Borneo orangutan a a a a
Mountain gorilla n.s. n.s. a
Lowland gorilla n.s. a
Pan n.s.
a Significant at P<0.05.n.s.: not significant at P<0.05.
Fig. 4. Three sets of wireframe models, each set with amediolateral (L) and anteroposterior (R) view of a hypotheticalhumerus characterized by a low (left set of two), a middle (cen-ter set of two), and a high (right set of two) PC 2 score.
510 T.W. HOLLIDAY AND L. FRIEDL
American Journal of Physical Anthropology

cluster more closely with Pan than with mountain goril-las. This latter finding is clearly in conflict with phylog-eny, but may reflect locomotor convergence (see below).
DISCUSSION
When working with the postcranial skeleton, it isoften difficult to tease out phylogenetic signal from thatof functional morphology and convergences, since it hasbeen argued by some that the postcranium is subject tostrong (and sometimes competing) selective pressure (aswell as phenotypic and/or developmental plasticity; Lie-berman, 1997; Young, 2005; but see S�anchez-Villagraand Williams, 1998; Lockwood, 1999; Spaulding andFlynn, 2012). The hominoid humerus appears to show astrong phylogenetic signal in that the cluster analysesperformed here, with few exceptions, are consistent withwell-documented phylogenetic relationships. For exam-ple, in terms of humeral 3D morphometric shape, hylo-batids show the greatest morphological differentiationfrom the other taxa, and these taxa likely diverged fromthe last common ancestor of the great apes and humans
ca. 20 Ma (Israfil et al., 2011). Similarly, the two speciesof Pongo cluster much more closely with humans andthe African apes than do the hylobatids, but are none-theless more different from Pan/Homo/Gorilla than anyof the African hominids is to each other, also in agree-ment with the molecular phylogenies of these taxa(Maeda et al., 1988; Goodman et al., 1990; Horai et al.,1995; Israfil et al., 2011). The caveat in calling these dif-ferences purely phylogenetic is that in terms of locomo-tor differentiation (which clearly impacts humeralmorphology), the hylobatids (highly specialized brachia-tors) are the most distinct from the African hominids,followed by Pongo (primarily quadrumanous climbers).
It is of interest that according to the Procrustes analy-ses, the African hominids, including humans, are charac-terized by relatively thicker diaphyses than either thehylobatids or the orangutans. We find that this is due tolonger humeri relative to body size in Pongo, and notthicker diaphyses of the African clade; shaft thicknessrelative to body size is similar between the African andAsian great apes (see Figures S3 and S4 in SupportingInformation). Within the African clade itself, thehumerus of Homo is more differentiated from Pan and
TABLE 4. ANOVA table and Scheff�e’s post-hoc multiple comparison test results, PC2. Groups as in Table 3.
ANOVA table
df Sum of squares Mean square Fs P
Among 7 0.06661184 0.009515977 130.63 <0.000001a
Within 235 0.01711899 0.000072847Total 242 0.08373084Scheff�e’s test
Siamang Pongo Gorilla Pan HomoSumatra Borneo Mt. Low
Gibbon n.s. a a a a n.s. a
Siamang a a a a n.s. a
Sumatran orangutan n.s. n.s. n.s. a a
Borneo orangutan n.s. n.s. n.s. a
Mountain gorilla n.s. a a
Lowland gorilla a a
Pan a
a significant at P<0.05.n.s.: not significant at P<0.05.
Fig. 6. Three sets of wireframe models, each set with amediolateral (L) and anteroposterior (R) view of a hypotheticalhumerus characterized by a low (left set of two), a middle (cen-ter set of two), and a high (right set of two) PC 3 score.
Fig. 5. Two-dimensional scatter plot of PC 3 on PC 2, hum-eral Procrustes shape data. Symbols are as in Figure 2.
HOMINOID HUMERAL MORPHOLOGY 511
American Journal of Physical Anthropology

Gorilla than these latter two genera are from each other.This result is in discordance with molecular phylogeny,but is explicably the result of differential selection onthe upper limb of hominins (where it is freed from loco-motion) vs. the African apes, where it is not (Napier,1956, 1960; Susman, 1979, 1998; Alba et al., 2003; Greenand Gordon, 2008). Similarly, the close affinity of Pantroglodytes with western lowland gorillas, due largely totheir similarity in PC3 scores, likely reflects the factthat these two apes are more similar in locomotorregimes, as these two taxa are more arboreal than thealmost exclusively terrestrial mountain gorillas (Remis,1995).
The humeral feature that most distinguishes Homofrom the other apes is evident along the second principalProcrustes shape axis. Differences along this axis areprimarily driven by an anteroposteriorly bowed (posteri-orly convex) shafts (high PC2 scores) vs. straight shafts(low PC2 scores). Pan, Gorilla, and Pongo, and to alesser extent, hylobatids, tend to have bowed humeralshafts, whereas those of Homo tend to be straight.
There are competing hypotheses as to why some longbones become curved. Lanyon (1980) argued that
perhaps shaft curvature allows muscle attachments tobe advantageously positioned close to joints while at thesame time permitting the expansion of muscle belliesnear midshaft. Alternatively, Lanyon (1980) also sug-gested that curvature may be necessary to raise levels ofstress to a minimum level (the so-called “safety factor”)in order to maintain bone health and keep bone capableof resisting periodically high levels of stress. By way ofcontrast, Frost (1979) hypothesized that long bone shaftcurvature may help achieve net axial compressionwithin the bone by counteracting the bending forces thatresult from eccentrically applied loads. The problemwith Frost’s hypothesis, according to Bertram and Biew-ener (1988), is that experimental data suggest that longbone curvature increases, rather than minimizes, thebending moments within the bone. Bertram and Biew-ener (1988) argue instead that what bending a long bonedoes is to make the direction of bending forces muchmore predictable, thereby allowing the bone to betterresist the habitual forces (especially bending forces) thatact on it.
While variable, Gorilla and Pan spend a considerableamount of time on the ground (from ca. 50–99%), vary-ing from mountain gorillas (G. beringei), which arealmost exclusively terrestrial, to bonobos (P. paniscus),
TABLE 5. ANOVA table and Scheff�e’s post-hoc multiple comparison test results, PC3. Groups as in Table 3.
ANOVA table
df Sum of squares Mean square Fs P
Among 7 0.01622406 0.002317724 16.39 <0.000001a
Within 235 0.03323707 0.000141434Total 242 0.04946113Scheff�e’s test
Siamang Pongo Gorilla Pan HomoSumatra Borneo Mt Low.
Gibbon n.s. a a a n.s. n.s. n.s.Siamang n.s. n.s. n.s. n.s. n.s. n.s.Sumatran orangutan n.s. n.s. a a n.s.Borneo orangutan n.s. a a n.s.Mountain gorilla a a a
Lowland gorilla n.s. n.s.Pan a
a significant at P<0.05.n.s.: not significant at P<0.05.
Fig. 7. PCO plot of sample means (PC scores from the first20 Procrustes shape principal components) with minimum span-ning tree fit to the data.
Fig. 8. UPGMA cluster analysis of sample means, PC scoresfrom the first 20 Procrustes shape principal components.
512 T.W. HOLLIDAY AND L. FRIEDL
American Journal of Physical Anthropology

which are more acrobatic than common chimpanzeesand spend much of their time in the trees (Tuttle andWatts, 1985; Doran, 1993, 1996). Common chimpanzees(P. troglodytes) are more suspensory than mountaingorillas, slightly less suspensory than bonobos, and gen-erally less suspensory than orangutans and much lesssuspensory than gibbons (Hunt, 1991, Doran, 1993). Ingeneral, it is argued that unlike the gibbons or orangu-tans, the African apes tend to use bimanual suspensionas a posture, and not as a mode of locomotion (Larson,1998). Chimpanzees and gorillas also tend to knuckle-walk while traveling on the ground, a quadrupedal formof locomotion in which much of the body’s weight is sup-ported by the hindlimbs, but the forelimbs experiencegreater stresses while braking during locomotion (Demeset al., 1994).
Orangutan locomotion has been long described as sus-pensory, but recent studies on positional behaviors sug-gest that there is rather a continuum with a widespectrum of positional forms (Thorpe and Crompton,2006). Suspensory postures are not the dominant formin Pongo. Rather, suspension is used primarily for loco-motion between terminal branches, but even thatdepends on specific ecological conditions (Thorpe andCrompton, 2005; Manduell et al., 2011). Orangutansspend a substantial amount of time in pronograde ororthograde positions that are compressive in naturerather than tensile (as suspension) (Thorpe and Cromp-ton, 2006). Moreover, these more recent studies suggestthat the whole positional repertoire of orangutans ismore similar to lowland gorillas than highly suspensoryhylobatids. In contrast to gorillas, however, less associa-tion between sex-age categories and the locomotor spec-trum has been reported (Sugardjito and van Hooff, 1986;Thorpe and Crompton, 2005; Manduell et al., 2011), butthis also may be dependent on specific environmentaland local conditions.
Pongo tends to be a less frequent visitor to the ground;when orangutans walk terrestrially they engage in fist-walking, which, like knuckle-walking, is a quadrupedalform of locomotion in which a greater portion of thebody’s weight is supported by the hindlimbs. In fist-walking, even the peak vertical forces on the forelimbsare generally smaller than those on the hindlimbs,which are (in most forms of locomotion) the drivinglimbs (Demes et al., 1994). By way of contrast, hyloba-tids rarely venture to the ground, and when they do,they walk bipedally. Similarly, human bipedal locomo-tion means the forelimb of Homo is freed from locomo-tion. It is of interest, then, that both of these taxa haverelatively straighter humeri, although those of the hylo-batids exhibit more antero-posterior bowing than thoseof Homo. Swartz (1990) concludes that the relativelystraighter humerus in hylobatids is the result of torsion-dominated loading regime, and with this, the greatlyincreased stress magnitude developed in torsionallyloaded curved beams. Instead of having bowed theirhumeri, hylobatid radii are curved, in part because oftheir massive supinator muscles.
In this light, the pattern of humeral bowing found inthis study appears to be a function of the amount oftime the forelimb is used in terrestrial locomotion.Mountain gorillas are the most terrestrial of the nonhu-man hominoids analyzed here, and their humeri showamong the greatest degree of anteroposterior bowing(although Pongo and western lowland gorillas, which aredecidedly less terrestrial, nonetheless have rather bowed
humeral diaphyses, as well). One might also assumethat shaft bowing is related to body size, since bodyweight will impact the loads the humerus experiences,and here, we find that among the apes it is most markedin the gorillas and least marked in the hylobatids. Ourdata are consistent with humeral bowing being some-what size-dependent, since the correlation of PC2 scores(the component most marked by humeral bowing) withcentroid sizes (apes only, with humans excluded) is sig-nificantly positive (r 5 0.57), but only explains 32% ofthe variance (i.e., r2 5 0.32).
In contrast, the nonquadrupedal hominoids (Hylobati-dae and Homo) are characterized by the humeri withthe straightest shafts (with Homo having straightershafts than the hylobatids). It follows, then, from thesedata that loading the forelimbs via quadrupedal locomo-tion (i.e., axial compressive loads and associated bendingmoments) may be the main factor that leads to bowingof the humeral shaft. The hylobatids and Homo differ inwhether their humeri are used in locomotion, as theupper limb is nonlocomotor in Homo, which, again, hasthe straightest humeral shafts. In hylobatids, however,the forelimb is used exclusively in suspension. Thismeans that the humerus is likely loaded more frequentlyin tension than in compression. However, during climb-ing, the hylobatid humerus will experience some axialcompressive loads because of muscular contraction, andgiven the marked length of this taxon’s humerus, thelong bones of the forelimb likely experience strong bend-ing moments as well. As a result, their humeri are morecurved than those of Homo, although straighter thanmany of the great apes.
CONCLUSIONS
Three-dimensional morphometric assessment of thehumeral morphology of extant hominoid taxa revealskey morphological differences between them, differenceswhich appear to reflect phylogeny, but which are attimes also driven by different locomotor repertoires. Spe-cifically, relatively large articular surfaces, humeral tor-sion, and humeral length appear to show a phylogeneticsignal, as they link the African hominoids together, sep-arate from Pongo and to an even greater extent the hylo-batids, who are the outliers to all other hominoids.
Deviations from the currently accepted and well-documented hominoid phylogeny are few, and explicablein light of locomotor patterns. First, humans are the out-group to the African apes in these analyses due to thefact that our humeri are no longer engaged in locomo-tion. Similarly, mountain gorillas tend to be more distantto western lowland gorillas in their humeral morphology,whereas lowland gorillas are more similar to chimpan-zees, most likely due to the observation that lowlandgorillas and chimpanzees are more similar to each otherin locomotor patterns than either is to mountaingorillas.
ACKNOWLEDGMENTS
The authors like to thank the Editor-in-Chief, the Asso-ciate Editor, and two anonymous referees for providing uswith several key insights into hominoid locomotion viatheir critique of earlier versions of this article. TWHwishes to thank Lyman Jellema and Dr. Yohannes Haile-Selassie of the Cleveland Museum of Natural History, andDarrin Lunde of the Division of Mammals at the National
HOMINOID HUMERAL MORPHOLOGY 513
American Journal of Physical Anthropology

Museum of Natural History, for their hospitality and helpduring research collection.
LITERATURE CITED
Alba DM, Moya Sola S, K€ohler M. 2003. Morphological affinitiesof the Australopithecus afarensis hand on the basis of manualproportions and relative thumb length. J Hum Evol 44:225–54.
Andrews PJ. 1981. Species diversity and diet in monkeys andapes during the Miocene. In: Stringer CB, editor. Aspects ofhuman evolution. London: Taylor and Francis. p 25–41.
Bertram JEA, Biewener AA. 1988. Bone curvature: sacrificingstrength for load predictability? J Theor Biol 131:75–92.
Bookstein FL. 1991. Morphometric tools for landmark data.Cambridge: Cambridge University Press.
Bookstein FL, Schafer K, Prossinger H, Seideler H, Fieder M,Stringer C, Weber GW, Arsuaga JL, Slice DE, Rohlf FJ,Recheis W, Mariam AJ, Marcus LF. 1999. Comparing frontalcranial profiles in archaic and modern Homo by morphomet-ric analysis. Anat Rec 257:217–24.
Burr DB, Ruff CB, Johnson C. 1989. Structural adaptations ofthe femur and humerus to arboreal and terrestrial environ-ments in three species of macaque. Am J Phys Anthropol 79:357–67.
Demes B, Larson SG, Stern JT Jr., Jungers WL, BikneviciusAR, Schmitt D. 1994. The kinetics of primate quadrupedal-ism: “hindlimb drive” reconsidered. J Hum Evol 26:353–74.
Doran DM. 1993. Comparative locomotor behavior of chimpan-zees and bonobos: the influence of morphology on locomotion.Am J Phys Anthropol 91:83–98.
Doran DM. 1996. Comparative positional behavior of the Afri-can apes. In: McGrew, WC, Marchant LF, Nishida T, editors.Great ape societies. Cambridge: Cambridge University Press.p 213–24.
Frost HM. 1979. A chondral modeling theory. Calcif Tissue Int28:181–200.
Goodman M, Tagle DA, Fitch DHA, Bailey W, Czelusniak J,Koop BF, Benson P, Slightom JL. 1990. Primate evolution atthe DNA level and a classification of hominoids. J Mol Evol30:260–66.
Gower JC. 1975. Generalized Procrustes analysis. Psychome-trika 40:33–51.
Green DJ, Gordon AD. 2008. Metacarpal proportions in Austral-opithecus africanus. J Hum Evol 54:705–719.
Gunz P, Harvati K. 2007. The Neanderthal “chignon”: variation,integration, and homology. J Hum Evol 52:262–74.
Harmon EH. 2007. The shape of the hominoid proximal femur:a geometric morphometric analysis. J Anat 210:170–85.
Harmon EH. 2009. The shape of the early hominin femur. Am JPhys Anthropol 139:154–71.
Hintze JL. 2007. Number Cruncher Statistical System 2007Version. Kaysville, UT: NCSS:.
Horai S, Hayasaka K, Kondo R, Tsugane K, Takahata N. 1995.Recent African origin of modern humans revealed by com-plete sequences of hominoid mitochondrial DNAs. Proc NatlAcad Sci USA 92:532–36.
Hunt KD. 1991. Positional behavior in the Hominoidea. Int JPrimatol 12:95–118.
Israfil H, Zehr SM, Mootnick AR, Ruvolo M, Steiper ME. 2011.Unresolved molecular phylogenies of gibbons and siamangs(Family: Hylobatidae) based on mitochondrial, Y-linked, andX-linked loci indicate a rapid Miocene radiation or suddenvicariance event. Mol Phylogenet Evol 58:447–55.
Lanyon LE, 1980. The influence of function on the developmentof bone curvature–an experimental study on the rat tibia. JZool 192:457–66.
Larson SG, 1988. Subscapularis function in gibbons and chim-panzees: implications for interpretation of humeral head tor-sion in hominoids. Am J Phys Anthropol 76:449–62.
Larson SG, 1998. Parallel evolution in the hominoid trunk andforelimb. Evol Anthropol 6:87–99.
Lieberman DE. 1997. Making behavioral and phylogeneticinferences from hominid fossils: considering the developmen-tal influence of mechanical forces. Ann Rev Anthropol 26:185–210.
Lieberman DE, Devlin MJ, Pearson OM. 2001. Articular arearesponses to mechanical loading: effects of exercise, age, andskeletal location. Am J Phys Anthropol 116:266–77.
Lockwood CA. 1999. Homoplasy and adaptation in the atelidpostcranium. Am J Phys Anthropol 108:459–82.
Maeda M, Wu C-I, Bliska J, Reneke J. 1988. Molecular evolu-tion of intergenic DNA in higher primates: pattern of DNAchanges, molecular clock, and evolution of repetitive sequen-ces. Mol Biol Evol 5:l–20.
Manduell KL, Morrogh-Bernard HC, Thorpe SKS. 2011. Loco-motor behavior of wild orangutans (Pongo pygmaeus wurm-bii) in disturbed Peat Swamp Forest, Sabangau, CentralKalimantan, Indonesia. Am J Phys Anthropol 145:348–59.
Napier JR. 1956. The prehensile movements of the humanhand. J Bone Jt Surg (Br) 38-B:902–913.
Napier JR. 1960. Studies of the hands of living primates. ProcZool Soc London 134:647–56.
O’Higgins P. 2000. The study of morphological variation in thehominid fossil record: biology, landmarks and geometry. JAnat 197:103–20.
O’Higgins P, Jones N. 2006. Tools for statistical shape analysis.Hull: York Medical School.
Perelman P, Johnson WE, Roos C, Seu�anez HN, Horvath JE,Moreira MAM, Kessing B, Pontius J, Roelke M, Rumpler Y,Schneider MPC, Silva A, O’Brien SJ, Pecon-Slattery J. 2011.A molecular phylogeny of living primates. PLoS Genet 7(3):e1001342.
Ponce de Le�on M, Zollikofer C. 2001. Neanderthal cranialontogeny and its implications for late hominid diversity.Nature 412:534–38.
Remis MJ. 1995. Effects of body size and social context on thearboreal activities of lowland gorillas in the Central AfricanRepublic. Am J Phys Anthropol 97:413–33.
Rohlf FJ. 2004. NTSYS-PC, version 2.11W: Numerical Taxon-omy and Multivariate Analysis System. Exeter Software,Setauket.
Rohlf FJ, Marcus LF. 1993. A revolution in morphometrics.Trends Ecol Evol 8:129–32.
Ruff CB, Holt BM, Trinkaus E. 2006. Who’s afraid of the bigbad Wolff? “Wolff ’s Law” and bone functional adaptation. AmJ Phys Anthropol 129:484–98.
S�anchez-Villagra MR, Williams BA. 1998. Levels of homoplasyin the evolution of the mammalian skeleton. J Mamm Evol 5:113–26.
Schultz AH. 1930. The skeleton of the trunk and limbs ofhigher primates. Hum Biol 2:303–438.
Schultz AH. 1933. Die K€orperproportionen der erwachsenencatarrhinen primaten, mit spezieller Ber€ucksichtigung derMenschenaffen. Anthropol Anz 10:154–85.
Smith RJ, and Jungers WL. 1997. Body mass in comparativeprimatology. J Hum Evol 32:523–59.
Spaulding M, Flynn JJ. 2012. Phylogeny of Carnivoramorpha:the impact of postcranial characters. J Syst Palaeontol 10:653–77.
Sugardjito J, van Hooff JARAM. 1986. Age-sex class differencesin the positional behaviour of the Sumatran orang-utan(Pongo pygmaeus abelii) in the Gunung Leuser NationalPark, Indonesia. Folia Primatol 47:14–25.
Susman RL. 1979. Comparative and functional morphology ofhominoid fingers. Am J Phys Anthropol 50:215–36.
Susman RL. 1998. Hand function and tool behavior in earlyhominids. J Hum Evol 35:23–46.
Swartz SM. 1990. Curvature of the forelimb bones of anthropoidprimates: overall allometric patterns and specializations insuspensory species. Am J Phys Anthropol 83:477–98.
Swartz SM, Bertram JEA, and Biewener AA. 1989. Telemeteredin vivo strain analysis of locomotor mechanics of brachiatinggibbons. Nature 342:270–72.
Thorpe SKS, Crompton RH. 2005. Locomotor ecology of wildorangutans (Pongo pygmaeus abelii) in the Gunung Leuser
514 T.W. HOLLIDAY AND L. FRIEDL
American Journal of Physical Anthropology

ecosystem, Sumatra, Indonesia: a multivariate analysis usinglog-linear modelling. Am J Phys Anthropol 127:58–78.
Thorpe SKS, Crompton RH. 2006. Orangutan positional behav-ior and the nature of arboreal locomotion in Hominoidea. AmJ Phys Anthropol 131:384–401.
Tuttle RH, Watts DP. 1985. The positional behavior and adapt-ive complexes for Pan gorilla. In: Kondo S, editor. Primate
morphophysiology, locomotor analysis and bipedalism. Tokyo:University of Tokyo Press. p 261–88.
Young NM. 2005. Estimating hominoid phylogeny from morpho-logical data: character choice, phylogenetic signal and post-cranial data. In: Lieberman D, Smith RJ, Kelley J, editors.Interpreting the past: essays on human, primate, and mam-mal evolution in honor of David Pilbeam. Boston: Brill Aca-demic. p 1–13.
HOMINOID HUMERAL MORPHOLOGY 515
American Journal of Physical Anthropology