ICT in Schools Estimating the level of investment
28
Report No: 02.01 ICT in Schools Estimating the level of investment Peter Twining April 2002 Further copies available from: www.meD8.info or email [email protected]
Transcript of ICT in Schools Estimating the level of investment
Report No: 02.01
ICT in Schools Estimating the level of investment
Peter Twining
April 2002
Further copies available from:
www.meD8.info
or
email [email protected]
© 2002 meD8 This report was produced by meD8. The report is available for free download from the meD8 website (www.meD8.info) and it may be copied for use in educational organisations free of charge. Whilst every effort has been made to ensure the accuracy of the data contained within this report you use it at your own risk. Neither meD8 nor the author can be held liable for any inaccuracies within the report or for any consequences arising from its use. Date: April 2002
Author: Peter Twining
Report No: meD8 02-01
URL: www.meD8.info/docs/meD8_02-01.pdf
Peter Twining ICT in Schools: Investment
Contents Page
Introduction 2 Indicators of Investment 2
Investment in England
4
Investment in the USA
11
Investment around the world
16
Conclusions
24
Bibliography 25
Abstract This report provides evidence of the level of investment in ICT in primary and secondary schools in a range of countries around the world. The indicators of investment used include: the amount of money spent; the student to computer ratio; and the percentage of schools connected to the Internet. The main focus of the report is on England and the USA. For each of these countries data from a number of separate sources are compared. The data for English schools is compared with the data from schools in the USA, other EU countries and a range of other ‘developed’ countries around the world. The report concludes that there has been a substantial level of investment in ICT in English schools over at least the last 20 years. This reflects the pattern in the USA and other ‘developed’ countries.
© meD8 2002 www.meD8.info Page 1

ICT in Schools: Investment Peter Twining
Introduction There is a widely held belief that there has been a high level of investment in information and communications technology (ICT) in education over a prolonged period of time throughout the ‘developed world’. This is a claim that is frequently made in the educational technology literature (e.g. Lemke and Coughlin 1998; Twining and McCormick 1999; Twining 2001a; Twining 2001b). However, evidence to substantiate the claim is seldom presented in a comprehensive manner. This report provides that evidence in the form of:
• a detailed examination of the level of investment in ICT in state schools in England;
• a detailed review of investment in ICT in schools in the USA; • comparative data for a range of countries that illustrates the
degree to which England and the USA are typical in terms of their levels of investment in ICT in education.
Indicators of investment In order to enable comparisons to be made across contexts (time and place) we need agreed indicators of the level of investment. Perhaps the most obvious indicator of the level of investment in ICT is the amount of money spent. However, extracting accurate information about financial expenditure on ICT in schools is problematic (Twining 2002). This is illustrated by the fact that even the UK government’s own surveys often contain contradictory information. For example, the estimated level of expenditure on ICT in primary schools in England in 1992, as reported in the governments statistical bulletins, varies between £30million (DfEE 1997) and £49.5million (DFE 1993). These difficulties have led to a range of other indicators of the level of investment in ICT in schools being used. These fall into three main groups:
• indicators involving the number of computers; • indicators involving the level of Internet connectivity; • indicators involving ‘soft’ factors (such as training).
Each of these groups of measures presents problems when it comes to identifying the level of investment or making comparisons across contexts (Twining 2002). In each case there has been a proliferation of variations on the basic indicator, often in an attempt to provide additional information, such as about the quality of provision. For example, the number of computers per school may include obsolete equipment as well as high spec and up-to-date machines, which has lead to a proliferation of variations on the ‘number of computers per school’, including:
• the number of computers per school; • the number of multimedia computers per school;
Page 2 www.meD8.info © meD8 2002

Peter Twining ICT in Schools: Investment
• the number of desktop computers per school; • the number of laptop computers per school; • the number of machines less than x years old per school;
This proliferation around one apparently simple measure makes comparisons across contexts problematic. This is accentuated where the measure does not include additional information that allows you to make judgements about the relative size of the investment (as illustrated in Table 1).
Comparison of ‘absolute’ vs ‘relative’ measures Table 1
Measure Context A Context B
Number of computers per school 25 34
Number of pupils per school 100 1000
Number of students per computer 4 29
In presenting evidence about the levels of investment in ICT in education in this report, I will focus on three key measures:
• estimates of the ‘actual’ expenditure, as this is the most direct measure of the level of investment; Key indicators of investment:
• Money spent • Student:computer ratio • Internet connectivity
• the number of students per computer, as this is “The common metric to judge public schools' response to the massive technological changes of the last quarter-century” (Cuban 2001 p82);
• the % of schools connected to the Internet, as this figure is now commonly used and reflects the current emphasis on the WWW and ‘e-learning’.
Where this data is not available, or can be usefully complemented with other indicators I will also include other measures.
© meD8 2002 www.meD8.info Page 3
ICT in Schools: Investment Peter Twining
Investment in England Interest in ICT in education in England stretches back to at least the mid 1960s, when the original National Council for Educational Technology was first formed (CET 1975). Explicit programmes investing substantial sums in computer assisted learning, as it was called at the time, were evident from the early 1970s. For example, The National Development Programme in Computer Assisted Learning was announced in 1972, started in 1973 and continued for five years, with a budget of £2million (CET 1975). At this time the main focus was often on further and higher education rather than on schools. However, school oriented projects were starting to be funded in the early 1970s, such as The Computers in the Curriculum Project. This was funded by the Schools Council, and produced materials in five subject areas using interactive software (Thomas 1992a). In 1979 the Microelectronics in Education Programme (MEP) was launched. The MEP, which had a total budget of around £12.4million of Department of Education and Science (DES) funding, was concerned with staff development and software production for schools and colleges (Thomas 1992a). In 1980 the Department of Trade and Industry’s (DTI) Micros in School Scheme was announced. This was the first of many centrally funded initiatives to invest heavily in ICT equipment for schools. The scheme provided 50% of the funding from central government for each school to buy one computer. Initially the scheme focused on secondary schools, but by 1982 it included funding
for primary schools as well. Thomas (1992b) reports that the estimated government funding for IT programmes in education had cost £30million by 1983. This pattern of significant investment continued throughout the 1980s and into the 1990s.
£30million on ‘educational’ IT programmes by 1983
Following the election of a new Labour government in 1997 the level of investment in ICT in schools increased still further. The government committed itself to spending £1.6billion in order to meet its targets for ICT in education in the period from 1998 to 2002 (DfEE 1999 p3). This included funding for:
• The National Grid for Learning (NGfL); • connecting every school in the country to the Internet; • providing additional computer equipment for every school in
order to meet the government targets of at least one computer to every 11 pupils in primary schools and at least one computer to every 7 pupils in secondary schools (DfES
2001b). New Labour Government (1997) increased rate of investment
In addition to this £1.6billion further funding was made available for:
• setting up of a number of Centres of Excellence for IT and High Technology training and Skills Challenge projects - £60million (DfES 2001a);
Page 4 www.meD8.info © meD8 2002

Peter Twining ICT in Schools: Investment
• training every teacher in state schools in the UK to make effective use of ICT as a tool to support teaching in other subjects - £230million from the Lottery funded New Opportunities Fund (including funding to train librarians)(Twining and McCormick 1999);
• extension of the NGfL programme from 2002 to 2004, focused on increasing the provision of ICT hardware and Internet access in schools - £710million of new money (Twining 2000);
• cutting bureaucracy in schools through the use of ICT - £35million (BECTa 2001)
This brief overview creates a general picture of investment in ICT in education in English state schools since the 1970s. However, many of the initiatives identified above are not limited to schools and in addition they do not identify other monies that may have been spent on computers in schools from other sources. In order to obtain a more accurate picture we need to look at the level of investment, using our three core indicators. One source of data on ICT investment is the UK government’s statistical branch surveys of ICT in schools, which go back to 1985. These data are based on postal surveys, which are sent to head teachers in hundreds of ‘representative’ schools throughout England. Figures 1 to 3 are based on data from these surveys. Figure 1 shows the level of expenditure on ICT in primary and secondary schools in England rising from the low millions in 1985 to hundreds of millions of pounds per year in 2001. This investment amounts to over £1.6billion being spent on ICT in English state schools since 1985.
Estimated total expenditure on ICT in English state schools Figure 1
0
50
100
150
200
250
1985 1988 1990 1992 1994 1996 1998 1999 2000 2001
Mill
ions
of
£ Primary schools
Secondary schools
(1985-1996 figures taken from (DfEE 1997); 1998-2001 figures taken from (DfES 2001b))
© meD8 2002 www.meD8.info Page 5

ICT in Schools: Investment Peter Twining
Figure 2 shows that the number of students per computer has decreased significantly since 1985. In looking at these figures it is important to remember that computers have a limited ‘useful’ working life. Thus, in order to maintain the same student:computer ratio requires investment. As the student:computer improves the amount of investment needed to maintain that student:computer ratio also
increases. This helps to explain the slowing down in the rate of improvement of the student:computer ratio in Figure 2.
Figure 2 Average number of pupils per computer in English state schools
0
20
40
60
80
100
120
1985 1988 1990 1992 1994 1996 1998 1999 2000 2001
Primary schools
Secondary schools
(1985-1996 figures taken from (DfEE 1997); 1998-2001 figures taken from (DfES 2001b))
Figure 3 shows that the number of schools connected to the Internet has increased rapidly since 1996, and is now reaching 100% for secondary schools, with primary schools not far behind.
Figure 3 Percentage of English state schools connected to the Internet
0%
20%
40%
60%
80%
100%
1996 1998 1999 2000 2001
Primary schools Secondary schools
(1996 figures taken from (DfEE 1997); 1998-2001 figures taken from (DfES 2001b))
On the basis of the data in these three figures it is clear that each of our three core measures of investment indicates that there has indeed
Page 6 www.meD8.info © meD8 2002

Peter Twining ICT in Schools: Investment
been a substantial investment in ICT in English schools over a prolonged period of time. The data obtained by these government (DfEE and DfES) surveys are based on self-reporting by head teachers (or their representatives). This leads to the potential for biases in the data, which may be due to problems of self-reporting, particularly in the context of responding to a survey from the same body that ultimately funds your institution. Indeed, comparing the DfES data with that collected by an ‘independent source’ (BESA 2001) suggests that the government data on expenditure exaggerates the levels of investment (see Tables 2 and 3). In comparing these figures it is important to remember that the DfES data relates just to England, whilst the BESA data covers the whole of the UK. One would thus expect the BESA figures for total expenditure to be higher than the DfES ones, which is not the case.
Comparison of the levels of expenditure on ICT in primary schools in 1998 and 2001, based on data from different sources
Table 2
1998/9 2001 Primary schools UK
(BESA 2001) England
(DfES 2001b) UK
(BESA 2001) UK
(DfES 2001b)
Average total ICT expenditure per school
- £3,600 £7,620 £10,300
Estimated ICT expenditure, excluding technical support, training and advisory services
£71.7million ~ £149.5million ~
Estimated total ICT
expenditure~ £68million £175.6million £186million
Comparison of the levels of expenditure on ICT in secondary schools in 1998 and 2001, based on data from different sources
Table 3
1998/9 2001 Secondary schools UK
(BESA 2001) England
(DfES 2001b) UK
(BESA 2001) UK
(DfES 2001b)
Average total ICT expenditure per school
~ £40,100 £34,640 £60,300
Estimated ICT expenditure, excluding technical support, training and advisory services
£120.2million ~ £137.2million ~
Estimated total ICT
expenditure~ £153million £156.5million £210million
© meD8 2002 www.meD8.info Page 7

ICT in Schools: Investment Peter Twining
An additional sampling biases has been found in ICT surveys of the kind quoted here; there is a tendency for larger or more ‘ICT-ready’ primary schools to respond to them (BESA 2001). In analysing the data from their own surveys BESA (2001) applied a weighting to it in order to account for this sampling bias. This may account for some of the differences between the DfES and BESA results. The Eurobarometer surveys (e.g. European Commission 2001b; European Commission 2001a) attempt to overcome this particular sampling bias by using phone interviews rather than postal surveys. Tables 4 and 5 provide comparisons of the level of investment in primary and secondary schools respectively according to the DfES, BESA and Eurobarometer data.
Figure 4 Comparison of the levels of Internet connectivity in primary schools in 2001, according to three different major surveys
(England April data - DfES (2001b); UK Jan-May data - European Commission (2001a); UK April data - BESA (2001))
0%
20%
40%
60%
80%
100%
Schools Computersconnected to the Internet
Perc
ent
England April UK Jan-May UK April
Figure 5 Comparison of the levels of computer resourcing in Primary schools in 2001, according to three different major surveys
(England April data - DfES (2001b); UK Jan-May data - European Commission (2001a); UK April data - BESA (2001))
0
5
10
15
20
25
30
Number of computersper school
Number of computersper school for
educational use
Number of students percomputer
Ave
rage
England April UK Jan-May UK April
Page 8 www.meD8.info © meD8 2002
Peter Twining ICT in Schools: Investment
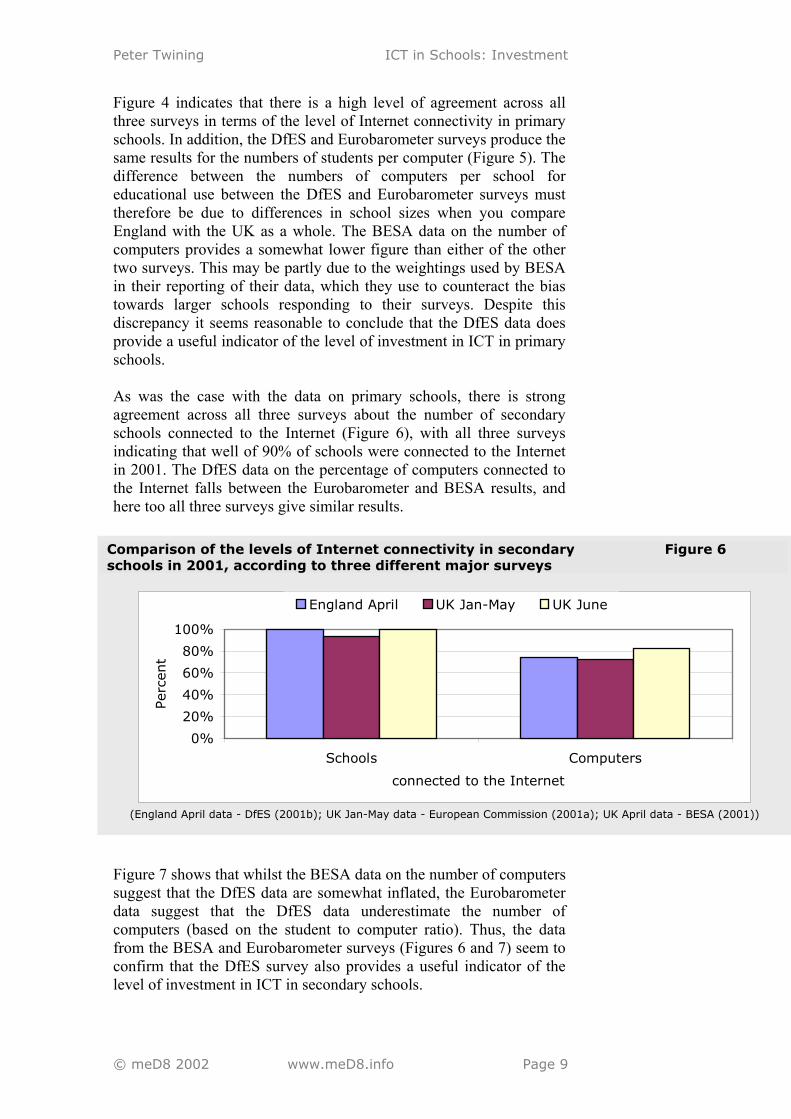
Figure 4 indicates that there is a high level of agreement across all three surveys in terms of the level of Internet connectivity in primary schools. In addition, the DfES and Eurobarometer surveys produce the same results for the numbers of students per computer (Figure 5). The difference between the numbers of computers per school for educational use between the DfES and Eurobarometer surveys must therefore be due to differences in school sizes when you compare England with the UK as a whole. The BESA data on the number of computers provides a somewhat lower figure than either of the other two surveys. This may be partly due to the weightings used by BESA in their reporting of their data, which they use to counteract the bias towards larger schools responding to their surveys. Despite this discrepancy it seems reasonable to conclude that the DfES data does provide a useful indicator of the level of investment in ICT in primary schools. As was the case with the data on primary schools, there is strong agreement across all three surveys about the number of secondary schools connected to the Internet (Figure 6), with all three surveys indicating that well of 90% of schools were connected to the Internet in 2001. The DfES data on the percentage of computers connected to the Internet falls between the Eurobarometer and BESA results, and here too all three surveys give similar results.
Comparison of the levels of Internet connectivity in secondary schools in 2001, according to three different major surveys
Figure 6
0%
20%
40%
60%
80%
100%
Schools Computers
connected to the Internet
Per
cent
England April UK Jan-May UK June
(England April data - DfES (2001b); UK Jan-May data - European Commission (2001a); UK April data - BESA (2001))
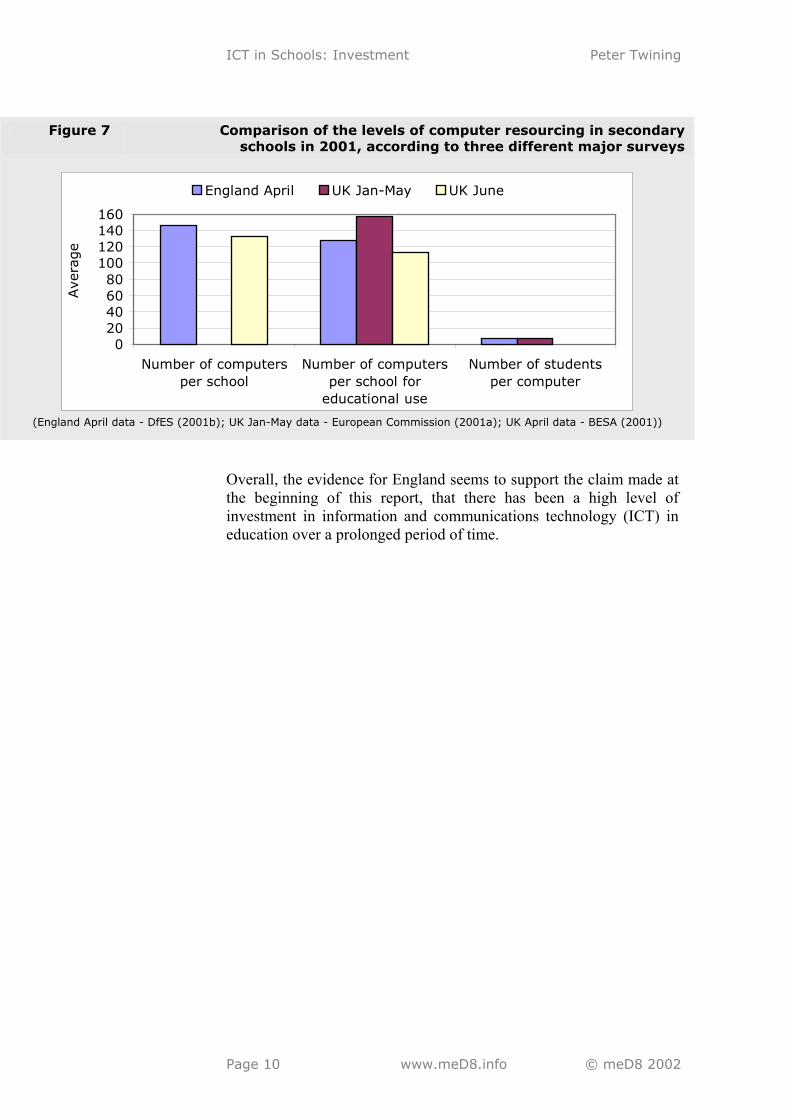
Figure 7 shows that whilst the BESA data on the number of computers suggest that the DfES data are somewhat inflated, the Eurobarometer data suggest that the DfES data underestimate the number of computers (based on the student to computer ratio). Thus, the data from the BESA and Eurobarometer surveys (Figures 6 and 7) seem to confirm that the DfES survey also provides a useful indicator of the level of investment in ICT in secondary schools.
© meD8 2002 www.meD8.info Page 9
ICT in Schools: Investment Peter Twining
Figure 7 Comparison of the levels of computer resourcing in secondary schools in 2001, according to three different major surveys
020406080
100120140160
Number of computersper school
Number of computersper school for
educational use
Number of studentsper computer
Ave
rage
England April UK Jan-May UK June
(England April data - DfES (2001b); UK Jan-May data - European Commission (2001a); UK April data - BESA (2001))
Overall, the evidence for England seems to support the claim made at the beginning of this report, that there has been a high level of investment in information and communications technology (ICT) in education over a prolonged period of time.
Page 10 www.meD8.info © meD8 2002

Peter Twining ICT in Schools: Investment
Investment in the USA There has been a long history of expectation about technological innovation revolutionising education in the US since the mid 1800s, starting with the introduction of text books and moving through technologies such as film, radio, television and computers (Kent and McNergney 1999). Cuban (2001) explains this push for school reform as being based on most Americans’ strong beliefs about the power of education to change lives. Each wave of reform reflected wider concerns in American society, as illustrated by this quote: "Vast numbers of federal dollars have been pumped into educational innovation since the sputnik scare of the late 1950s." (CET 1975 p37). The use of computers in school level education in the US started in the sixties (Hasselbring 1986 p25). The National Council of Teachers of Mathematics (NCTM) began promoting computing as early as 1963 (Charp 1967). In 1967 the President's Science Advisory Committee report, ‘Computers in Higher Education’ argued for the acquisition of computers and teacher training programmes (reported in Anderson, Hansen et al. 1979). By the late 1970s computers had started to be a feature of American schools and leading thinkers were starting to predict that computers would be the technology that revolutionized education (Hasselbring 1986). The early 1980s saw a growing emphasis on computers in schools, with increasing pressure from “a loosely tied national coalition of public officials, corporate executives, vendors, policymakers, and parents” that was pushing for increased access to computers in schools (Cuban 2001 p12). 1984 saw the then Secretary of Education stating his belief in the important role that computers needed to play in teaching children in schools (Bell 1984).
Computers were in use in US schools by the 1970s
As was the case in the UK, the 1990s saw even greater pressure for technological innovation in schools. The first national educational technology plan, Getting America’s Students Ready for the 21st Century: Meeting the Technology Literacy Challenge, was developed under the Clinton-Gore Administration. This plan included four key goals for educational technology:
Pressure for computers in schools increased in the 1990s
• All teachers in the nation will have the training and support they need to help students learn using computers and the information superhighway.
• All teachers and students will have modern multimedia computers in their classrooms.
• Every classroom will be connected to the information superhighway.
• Effective software and on-line learning resources will be an integral part of every school’s curriculum.
(Based on US Department of Education - Office of Educational Technology 2000 p2)
© meD8 2002 www.meD8.info Page 11

ICT in Schools: Investment Peter Twining
It is estimated that between 1995 and 2000 the Clinton-Gore Administration invested more than $8billion in educational technology (US Department of Education - Office of Educational Technology 2000). This brief history of ICT in education in the USA seems to indicate that substantial investment in ICT in education has indeed taken place over a sustained period of time. However, much of the investment that has been identified was not focused on schools. In addition, obtaining accurate data on the expenditure on ICT in schools in the USA is difficulty. At the Federal level the published figures on ‘Educational Technology’ expenditure vary widely, as illustrated in Figure 8, due to differences in what is included within ‘Educational Technology’. This data also excludes state level funding for ICT in education. Obtaining an accurate figure for expenditure on ICT in education that includes both federal and state funding for the USA as a whole is therefore very problematic. In order to obtain a more accurate picture of the level of investment in ICT in schools we need to look at our other two core indicators: the number of students per computer and the level of Internet connectivity.
Figure 8 Comparison of the figures quoted for expenditure on ICT in education by two different sources
0500,000,000
1,000,000,0001,500,000,0002,000,000,0002,500,000,0003,000,000,000
1995 1996 1997 1998 1999 2000
$
Office of Educational Technology 2000 US Dept of Education 2001
(US Department of Education - Office of Educational Technology 2000; US Department of Education 2001)
Cuban (2001), drawing on statistics from the US Department of Commerce and data from an organization called Market Data Retrieval (MDR), identifies that there has been a significant reduction in the number of students per computer since 1981 (see Figure 9). Cuban’s data fits well with that from the US Department of Education’s Office of Education Technology, which provides a state by state analysis of investment in ICT, including the number of students per computer (see Table 4 and Figure 9). Cuban’s data also fits well with that from Pelgrum and Plomp (1991) who carried out an independent survey of ICT use in US schools in 1989 (see Figure 9).
Page 12 www.meD8.info © meD8 2002

Peter Twining ICT in Schools: Investment
Data on the number of students per computer Figure 9
0
20
40
60
80
100
120
140
1981 1983 1988 1989 1990 1991 1998 1999 2000
Ave
rage
Cuban (2001) Per instructional computerIn primary schools In secondary schools
(Figures based on: Cuban (2001); Per instructional computer – US Dept of Education, Office of Educational Technology
(2000); In primary and secondary schools – Pelgrum and Plomp (1991))
Additional corroboration for the accuracy of these figures comes from a state by state comparison of the numbers of students per computer in 2000 from two separate sources: the US Department of Education’s Office of Educational Technology (US Department of Education - Office of Educational Technology 2000) and MDR’s survey, which was carried out between October 1999 and March 2000 (reported in Education Week 2001). MDR’s survey involved contacting all of the nearly 88,000 public schools in the USA by snail mail, phone or email. Just over 30,000 schools completed the survey, the majority of these (88%) responded to the telephone survey. Table 4 (overleaf) shows the raw data from each source and the results of carrying out a Pearson’s Product Correlation on these two sets of data. There is a tendency for the government figures to indicate a better student:computer ratio than MDR’s figures. However, these two sets of data are highly positively correlated (r=+0.94, df=49, p<0.001), which suggests that these figures do provide a useful indicator of the level of investment in ICT in US public schools. This data confirms that there has indeed been substantial investment in ICT in US public schools over a prolonged period of time. Data on the percentage of schools connected to the Internet also indicates a substantial level of investment in ICT in US public schools (see Figure 10). Corroboration for the accuracy of this data comes from a comparison with data from two other sources (see Figure 11).
© meD8 2002 www.meD8.info Page 13

ICT in Schools: Investment Peter Twining
Table 4 Breakdown by state of the number of students per instructional computer in 1999/2000 according to two separate sources
State
US Department of Education’s Office of
Educational Technology (2000)
MDR (Education Week 2001)
Alabama 7 5.0 Alaska 4.5 3.7 Arizona 5.8 4.8 Arkansas 5.6 5.1 California 8.1 7.2 Colorado 5.3 4.6 Connecticut 5.9 5.4 Delaware 5.3 4.4 Columbia 5.4 5.8 Florida 5 4.2 Georgia 5.5 4.7 Hawaii 6.7 5.8 Idaho 5.3 3.8 Illinois 5.9 4.9 Indiana 4.5 3.7 Iowa 4.7 3.8 Kansas 4.1 3.3 Kentucky 5.3 4.2 Louisiana 7.4 6.8 Maine 5.8 4.6 Maryland 6.6 5.6 Massachusetts 6.1 5.2 Michigan 5.9 5.1 Minnesota 4.9 4.2 Mississippi 7 6.4 Missouri 5.2 4.5 Montana 4.4 3.1 Nebraska 3.9 3.7 Nevada 7.3 6.1 New Hampshire 6.8 6.1 New Jersey 5.7 4.6 New Mexico 5.5 4.9 New York 6.3 5.3 North Carolina 6 5.2 North Dakota 4.2 3.6 Ohio 5.4 4.4 Oklahoma 5.6 4.6 Oregon 5.6 5.2 Pennsylvania 5.5 4.6 Rhode Island 7.5 6.5 South Carolina 5.6 5.0 South Dakota 4.2 3.2 Tennessee 6.7 5.4 Texas 5.1 4.3 Utah 6 5.5 Vermont 5.6 4.9 Virginia 5.4 4.7 Washington 5 4.7 West Virginia 4.7 3.9 Wisconsin 4.6 3.7 Wyoming 3.5 3.0 Mean 5.6 4.9
Pearson’s Product Correlation
r = +0.94
N=51
df = 49
p < 0.001
US Department of Education’s Office of Educational Technology (2000); MDR (Education Week 2001)
Page 14 www.meD8.info © meD8 2002

Peter Twining ICT in Schools: Investment
Percentage of US public schools with Internet access Figure 10
0102030405060708090
100
1994 1995 1996 1997 1998 1999 2000
Perc
ent
All public schools Elementary schools Secondary schools
(National Center for Education Statistics 2001 p2)
Comparison of the percentage of US public schools connected to the Internet according to three sources
Figure 11
0%
20%
40%
60%
80%
100%
1994 1999 2000
Perc
ent
Cuban (2001 p82)Education Week (2001)National Center for Education Statistics (2001)
(Cuban 2001; Education Week 2001; National Center for Education Statistics 2001)
Overall, the evidence suggests that there has indeed been substantial investment in ICT in US public schools over at least the last 20 years.
© meD8 2002 www.meD8.info Page 15

ICT in Schools: Investment Peter Twining
Investment around the world It is clear from the detailed analyses of the evidence that has been presented in relation to England and the USA that in these two countries at least there has been a substantial level of investment in ICT in schools over a prolonged period of time. In order to establish the extent to which this is also true for other countries this section provides three sets of comparisons:
• England with the USA from the mid to late 1990s • England with the other countries in the EU in 2001; • England with a number of other countries around the world in
1998. The initial comparison of England with the USA will allow some conclusions to be drawn about the extent to which investment in the USA is comparable to that in other countries, based on the subsequent comparison of investment in ICT in England and those other countries.
Comparison of investment in England and the USA Using government data for England and the USA, which we have already shown to be a useful indicator of the level of investment in ICT in education, makes it clear that the student:computer ratio was better in the USA than in England for the entire period for which we have data (Figure 12). The student:computer ratio stopped improving in the USA towards the end of the 1990s whilst that for England continued to improve during this period. This suggests that investment in computers in schools started earlier in the USA, but that England invested more heavily in the late 1990s.
Figure 12 Comparison of the average number of students per computer in England and the USA
0
5
10
15
1998 1999 2000
Ave
rage
England USA
(US Department of Education - Office of Educational Technology 2000; Cuban 2001; DfES 2001b p9; Education Week 2001)
Page 16 www.meD8.info © meD8 2002

Peter Twining ICT in Schools: Investment
Figure 13 shows a much higher level of Internet connectivity in the USA in 1996, and that the differential between the USA and England fell rapidly after 1998. This seems to confirm the view that investment in ICT in schools was greater in the USA than in England before about 1998, but that the level of investment in ICT in England overtook that in the USA towards the end of the 1990s. This pattern is not so marked when you look at the percentage of secondary schools connected to the Internet in each country (Figure 14), though this data does still support this view.
Comparison of the percentages of primary schools connected to the Internet in England and the USA
Figure 13
0%
20%
40%
60%
80%
100%
1996 1998 1999 2000 2001
England USA
(DfEE 1997; DfES 2001b; National Center for Education Statistics 2001)
Comparison of the percentages of secondary schools connected to the Internet in England and the USA
Figure 14
0%
20%
40%
60%
80%
100%
1996 1998 1999 2000 2001
England USA
(DfEE 1997; DfES 2001b; National Center for Education Statistics 2001)
Given that the level of investment in ICT the USA appears to have tailed of towards the end of the 20th century, whilst this does not
© meD8 2002 www.meD8.info Page 17

ICT in Schools: Investment Peter Twining
seem to be the case in England it seems likely that both the USA and England will have had similar levels of investment, relative to their student populations, by the early 2000s.
Comparison of investment in England and other EU countries Whilst it is the case that all the countries of the EU in 2001 had started to use computers in education, there are still significant differences in the percentage of schools that did so in each country (Figure 15). This suggests that the level of investment in ICT in schools in some countries of the EU has been much lower than in others. This does appear to be the case, based on data from the Eurobarometer survey (European Commission 2001a) that is used here (Figures 16 & 17).
Figure 15 Percentage of schools in which computers are used for educational purposes
0%
20%
40%
60%
80%
100%
Bel
giu
m
Den
mar
k
Ger
man
y
Gre
ece
Spai
n
Fran
ce
Irel
and
Ital
y
Luxe
mburg
Net
her
lands
Aust
ria
Port
ugal
Finla
nd
Sw
eden UK
EU
ave
rage
Primary Secondary
(Based on European Commission 2001a p27 & 44)
This Eurobarometer survey was carried out in early 2001 and involved 7386 telephone interviews with ‘head teachers’ across the 15 member states. The samples were selected to be representative of each country’s target population as a whole. The Eurobarometer data for the UK was compared with that from the DfES and BESA in the previous discussion of investment in ICT in England, and there appeared to be a close match between these different sources. Thus is seems reasonable to treat the Eurobarometer figures, which are for the UK as a whole, as being equivalent to figures for England. The average number of students per computer in primary schools across the EU varies dramatically, ranging from 67 students per computer in Greece to 2 students per computer in Luxemburg (Figure 16). The inter-quartile range is from 11.2 to 45.5 students per computer. The UK figure of 11.8 falls within this range, though at the lower end of it.
Page 18 www.meD8.info © meD8 2002

Peter Twining ICT in Schools: Investment
There is a closer match between the average numbers of students per computer in secondary schools across the EU (Figure 16). The range runs from just under 18 students per computer in Portugal to just under 2 students per computer in Denmark. The figure for the UK (6.5 students per computer) falls outside the inter-quartile range, which is from 7.5 to 26.3 students per computer. Thus the level of investment in ICT in secondary school appears to be higher in the UK than in most of the rest of the EU.
Average number of students per computer in 2001 Figure 16
010203040506070
Bel
giu
m
Den
mar
k
Ger
man
y
Gre
ece
Spai
n
Fran
ce
Irel
and
Ital
y
Luxe
mburg
Net
her
lands
Aust
ria
Port
ugal
Finla
nd
Sw
eden UK
EU
ave
rage
Primary Secondary
(Based on European Commission 2001a p30 & 47)
Looking at the percentage of schools connected to the Internet across the EU presents a less clear distinction between the UK and the rest of the EU (Figure 17). The percentage of primary schools connected to the Internet varies between 22% in Greece and 100% in Sweden. The UK figure of 93% is higher than the EU mean of 84%. In secondary schools there is again a much closer match across countries, with a minimum of 58% in Greece and a maximum of 100% in Luxembourg, the Netherlands and Sweden. The UK figure of 98% is only just above the EU mean of 96%.
Percentage of schools connected to the Internet Figure 17
0%
20%
40%
60%
80%
100%
Bel
giu
m
Den
mar
k
Ger
man
y
Gre
ece
Spai
n
Fran
ce
Irel
and
Ital
y
Luxe
mburg
Net
her
lands
Aust
ria
Port
ugal
Finla
nd
Sw
eden UK
EU
ave
rage
Primary Secondary
(Based on European Commission 2001a p27 & 44)
© meD8 2002 www.meD8.info Page 19

ICT in Schools: Investment Peter Twining
Overall, and on the basis that the Eurobarometer data for the UK matches closely to the equivalent English data, it would appear that the level of investment in ICT in England is above average for the EU countries. This difference is largely due to the fact that a small number of EU countries, most notably Greece and Portugal, have had much lower levels of investment in ICT in schools than is the case for many EU countries. On both the indicators of investment used here there are several other EU countries that have higher levels of investment in ICT than England.
Comparison of investment in England and other countries around the world Pelgrum (2001) provides data about the level of investment in ICT for 26 countries around the world. His figures are based on a survey conducted by the International Association for the Evaluation of Educational Achievement between November 1998 and February 1999. Unfortunately this survey did not include England or the USA, so comparative data for these countries from the Department for Educational and Skills (2001b) and the National Centre for Educational Statistics (2001) are used (Table 5). A comparison of the numbers of students per computer in primary schools in 1998/99 around the world (Table 5 and Figure 18) shows that whilst England’s student:computer ratio (16 students per computer) is better than the mean for all the countries surveyed (37 students per computer), it falls within the inter-quartile range (1st quartile=13, 3rd quartile=27). As was the case in the EU comparison, it would appear that a small number of countries which had particularly high student:computer ratios (Chinese Taipei, Cyprus and Italy in this case) had a major impact on the mean figure. The fact that many of the 26 countries surveyed did not supply data on ICT in primary
Figure 18 Distribution of the average number of students per computer in schools in different countries in 1998/99
-
50
100
150
200
250
Primary schools Secondary schools
Ave
rage
num
ber
of
studen
ts
per
com
pute
r
Figures taken from Pelgrum (2001) except England’s which come from DfES (2001b)
Page 20 www.meD8.info © meD8 2002

Peter Twining ICT in Schools: Investment
schools may indicate that they do not use ICT in primary schools in those countries. This in turn would indicate that the level of investment in ICT in English primary schools, whilst similar to that in a number of ‘developed’ countries, is higher than in most countries around the world. In secondary schools the English student:computer ratio is substantially better than the mean for the 25 countries and there are only 3 countries with better ratios than England’s (Table 5) The English figure of 9 students per computer falls outside the inter-quartile range (1st quartile=10, 3rd quartile=34).
Comparisons of investment in ICT in different countries Table 5
Students per Computer % schools connected to Internet
Primary schools Secondary
schools Primary schools
Secondary schools
Belgium-French ~ 25 41% Bulgaria ~ 238 ~ 26% Canada 8 7 88% 98%
China Hong Kong 25 23 10% 80% Chinese Taipei 81 25 55% 62%
Cyprus 183 216 17% 11% Czech Republic ~ 34 ~ 33%
Denmark ~ 9 ~ 85% England 16 9 40% 88% Finland 12 10 87% 96% France 25 17 24% 55%
Hungary ~ 25 ~ 41% Iceland 13 12 98% 100%
Israel 16 14 35% 53% Italy 88 16 28% 73%
Japan 28 14 69% 58% Lithuania ~ 90 ~ 56%
Luxembourg ~ 12 ~ 79% New Zealand 14 8 77% 89%
Norway 13 9 56% 81% Russian Federation ~ 121 ~ 4%
Singapore ~ 8 ~ 100% Slovenia 23 25 84% 85%
South Africa ~ 123 ~ 52% Thailand ~ 62 ~ 25%
USA 88% 94% Mean of countries 37 60 58% 64%
(all data taken from Pelgrum (2001), except: England data based on mean of figures from 1998 and 1999 in DfES (2001b); USA data taken from the National Centre for Educational Statistics (2001))
~
Most of the countries surveyed provided data on ICT in secondary schools, and it is noticeable that there were substantially more countries with high student:computer ratios. As with the data on primary schools, there is a group of countries that have similar student:computer ratios (13 of the 26 countries had fewer than 18 students per computer). This seems to support the view that the level of investment in ICT in English schools is higher than the average across the world, but comparable with that of many ‘developed’ countries.
© meD8 2002 www.meD8.info Page 21

ICT in Schools: Investment Peter Twining
Looking at the percentages of primary schools connected to the Internet in 1998/99 (Table 5 & Figure 19) the English figure of 40% is lower than the mean for all the countries (58%) but does fall within the inter-quartile range (1st quartile=33%, 3rd quartile=87%). This suggests that England had invested less in ICT in primary schools than other countries at this point. However, as was the case for the student:computer ratio, a large number of countries did not provide any data for Internet access in primary schools, which may indicate that they had not invested in ICT in primary schools. The data for Internet connectivity in secondary schools (Table 5 & Figure 19) places England at the high end of the investment scale. England’s figure of 88% of secondary schools connected to the Internet falls outside the inter-quartile range (1st quartile=44%, 3rd quartile=87%). This may indicate that up to 1998/99 England had focused its ICT investment on the secondary rather than the primary sector, as also appears to have been the case for many of the other countries in this analysis who have only provided data for their secondary schools.
Figure 19 Distribution of the percentages of schools connected to the Internet in different countries
0%
20%
40%
60%
80%
100%
Primary schools Secondary schools
(all data taken from Pelgrum (2001), except: England data based on mean of figures from 1998 and 1999
in DfES (2001b); USA data taken from the National Centre for Educational Statistics (2001))
Looking at the overall comparisons on both the indicators being used here it seems that in 1998/99 England was typical of a group of ‘developed’ countries in terms of the level of investment in ICT. England also seems to have followed a pattern, which appears to have been common elsewhere, of focusing their investment on ICT in secondary schools before primary schools. Comparing the percentage of schools in the USA that were connected to the Internet in 1998/9 with the rest of the world seems to confirm the conclusion reached in the earlier comparison of the USA and England; the level of investment in the USA up to 1998/9 was somewhat higher than in most other countries around the world. Looking at the rate of increase in the percentage of schools connected
Page 22 www.meD8.info © meD8 2002

Peter Twining ICT in Schools: Investment
to the Internet between 1998/9 and 2001 (Figure 20) also seems to confirm the earlier conclusion that the relative level of investment in ICT in the USA is decreasing compared with most other countries.
Percentage of schools connected to the Internet Figure 20
0%
20%
40%
60%
80%
100%
Bel
giu
m-
Fren
ch
Den
mar
k
Engla
nd/U
K
Finla
nd
Fran
ce
Ital
y
Luxe
mbourg
USA
Incr
ease
Primary schools Secondary schools
Based on Eurobarometer data (2001a), Pelgrum (2001), National Centre for Educational Statistics (2001)
© meD8 2002 www.meD8.info Page 23

ICT in Schools: Investment Peter Twining
Conclusions It is clear that the level of access to computers has increased significantly in schools, as has Internet connectivity. This clearly indicates that there has been substantial investment in ICT in schools.
Cuban (2001 p17), talking about the level of resourcing in schools in the USA, points out that "These figures suggest only the barest outline of the major investments that have been pumped into the project of computerizing schools." The reason
for this being that “as Levin and Meister (1984) point out, such figures significantly understate real costs since substantial training and maintenance expenses are also incurred when computers are used.” (Schofield 1995 p4).
High level of investment over a prolonged period of time
The overall the analyses presented here therefore supports the claim that there has indeed been a high level of investment in information
and communications technology (ICT) in schools over a prolonged period of time throughout the ‘developed world’. What it does not do is provide any evidence about the degree to which this investment has impacted on learning outcomes or educational practices within schools.
But has it had any impact on educational practice or learning outcomes?
Page 24 www.meD8.info © meD8 2002

Peter Twining ICT in Schools: Investment
Bibliography Anderson, R., T. Hansen, et al. (1979). "Instructional computing:
acceptance and rejection by secondary school teachers." Sociology of Work and Occupations 6(2): 227-250.
BECTa (2001). ICTSN Weekly News, BECTa. 2001. Bell, T. (1984). "Effective use of computers in schools requires
coordinated development." T.H.E. Journal 11(5): 80-83. BESA (2001). Information and Communication Technology in UK
State Schools. London, British Educational Suppliers Association.
CET (1975). Two Years On: The National Development Programme in Computer Assisted Learning. London, The Council for Educational Technology (CET): 106.
Charp, S. (1967). Computer programming courses in secondary schools. The Computer in American Education. D. B. Bushnelland and A. Dwight. New York, Wiley: 137-155.
Cuban, L. (2001). Oversold and Underused: Computers in the Classroom London, Harvard University Press
DFE (1993). Survey of Information Technology in schools, DFE. DfEE (1997). Survey of Information Technology in schools 1996.
Norwich, DfEE. DfEE (1999). Survey of Information and Communications
Technology in schools 1999. Norwich, DfEE. DfES (2001a). Statistics of Education: Education and Training
Expenditure Since 1991-92. London, Department for Education and Skills: 21.
DfES (2001b). Survey of Information and Communications Technology in Schools 2001. London, DfES: 34.
Education Week (2001). Technology Counts 2001: The New Divides - Looking beneath the numbers to reveal digital inequities. 2002.
European Commission (2001a). Eurobarometer Flash 94/101. Brussels, Commission to the Council and European Parliament.
European Commission (2001b). Eurobarometer Flash 95/102. Brussels, Commission to the Council and European Parliament.
Hasselbring, T. S. (1986). History and Status of Computers in Education. Computer Strategies for education: Foundations and Content-Area Applications. C. K. Kinzer, R. D. Sherwood and J. D. Bransford. Columbus, 0hio, Merrill Publishing Company: 15-29.
Kent, T. W. and R. F. McNergney (1999). Will technology really change education?: From blackboard to Web. Thousand Oaks, California, Corwin Press Inc.
© meD8 2002 www.meD8.info Page 25
ICT in Schools: Investment Peter Twining
Lemke, C. and E. C. Coughlin (1998). Technology in American Schools: Seven Dimensions for Gauging Progress - A Policymaker's Guide. Santa Monica, Milken Exchange on Education Technology.
National Center for Education Statistics (2001). Internet Access in US Public Schools and Classrooms: 1994-2000. Washington DC, National Center for Education Statistics.
Pelgrum, W. and T. Plomp (1991). The Use of Computers in Education Worldwide. Oxford, Pergamon Press.
Pelgrum, W. J. (2001). "Obstacles to the integration of ICT in education: results from a worldwide education assessment." Computers & Education 37: 163-178.
Schofield, J. W. (1995). Computers and Classroom Culture. Cambridge, Cambridge University Press.
Thomas, S. (1992a). "IT Curriculum Reform: Key dates (Part 1)." ITTE Newsletter Spring '92: 11.
Thomas, S. (1992b). "IT Curriculum Reform: Key dates (Part 2)." ITTE Newsletter Winter '92-'93: 15-18.
Twining, J. E. (2000). Digest: ICT in schools. EDUCA: The digest for vocational education and training: 7.
Twining, P. (2001a). Pedagogic re-engineering: issues surrounding the use of new media to support a move from 'didactic' to 'constructivist' models of transaction on an Open University course. Educational Technology and the impact on teaching and learning. M. Selinger and J. Wynn. Oxford, Research Machines: 54-60.
Twining, P. (2001b). "Planning to use ICT in schools?" Education 3-13 29(1): 9-17.
Twining, P. (2002). The CPF Website: Investment, meD8. 2002. Twining, P. and R. McCormick (1999). Learning Schools Programme:
Developing Teachers' Information Communication Technology Competence In The Support Of Learning. 10th International Conference of The Society for Information Technology & Teacher Education, San Antonio, Texas, AACE.
US Department of Education (2001). Budget History table, US Education Department. 2001.
US Department of Education - Office of Educational Technology (2000). Progress Report on Educational Technology: State-by-State Profiles, Office of Educational Technology, US Department of Education: 60.
Page 26 www.meD8.info © meD8 2002