Name of the Asset Management Company: - ICICI Prudential ...
Upload
khangminh22Category
view
0download
0
ICICI LOMBARD GENERAL INSURANCE LTD. | PI INDUSTRIES LTD. ABBOTT INDIA LTD.
Market Overview Prominent Headlines Q&A with CIOMutual Fund Overview
Stock Picks Monthly Insight Performance Sector Outlook - Pharma
Q4FY22 Management ConcallEconomy Review Startup Corner
State of Capex CycleTechnical View World Economic Event Calendar
June 2022
INSIGHT
Market Pricing Risk
Q&A WITHMr. Rahul SinghCIO Equities, Tata Asset Management

2June 2022 INSIGHT
INSIDE THIS ISSUE
Marketoverview1
30 Sector -Pharma
50 State ofCapex Cycle
Startupcorner 49
Monthlyinsight performance 25
Technicalview 5616 Stock Picks
• ICICI Lombard General Insurance Ltd.
• PI Industries Ltd.• Abbott India Ltd.
9 Q&A with Mr. Rahul Singh, CIO Equities, Tata Asset Management
Prominentheadlines May 2022 6PROMINENT
HEADLINES
Mutualfund overview 11
Q4FY22Management Earning Concall 35
44 EconomicReview
60 Worldeconomic calendar

1 June 2022INSIGHT
MarketOVERVIEW
From being perceived as ‘transitory’ to being rather structural, infl ation has become a challenge for every nation, keeping the central bankers on their toes. Certainly, the world has changed and de-globalization played out even before COVID-19 hit us with tussle between US and China over trade. With COVID-19, the global supply chains were snapped, which led to concept of China+1 strategy, as the world scouted for alternative supplies ex-China. Nevertheless, the European companies have also strategized to bring back essential
production back home or to their close proximity. However, the fi nal nail in the coffi n probably came in the form of the present crisis in Russia and Ukraine. Nobody anticipated that the confl ict to go so long with the world paying the price in terms of higher commodity and food prices. The unfortunate part being, nobody knows for sure whether commodity prices have hit their
roof or a new crisis will eventually appear. Stagfl ation is almost certain in the developed economies, while recessionary risks in the US are also talked about, which albeit depends on evolving infl ationary scenario and how aggressive will the US Federal Reserve get from here on, as it inhibits growth to great extent. So far, the risks are now tilted to the upside and the governments are now

2June 2022 INSIGHT
fi guring out what’s the best for their people. However, as economics has taught us, de-globalization will lead to ineffi cient allocation of capital and labour and thus, the fallout of the same will result in higher cost. Hence, there are chances that the supply chains might not get fully restored and infl ation might exceed the estimates.
In a bid to lower infl ationary trends, the Government of India (GoI) has taken steps including reducing excise duty on diesel and petrol, cutting import duty on crucial raw materials, banning exports of wheat and putting limits on sugar exports. The GoI has also permitted duty-free import of 20 lakh MT each of crude soyabean oil and crude sunfl ower oil for this year as well as 2023-24. Besides, Indonesia has also started exporting of palm oil, which will anyway cool edible oil prices. However, the experts are divided with regard to achieving fi nal outcome of cooling prices especially for the packaged goods. As per media articles, the industry executives are of the view that consumer prices of packaged foods will continue to increase despite recent government measures due to sustained increase in cost of packaging and not enough cost benefi ts on oil and industry fuel. Moreover, while putting a tab on wheat exports was understandable given lower production on account of heat wave as well as higher market prices (which deters the farmers to sell to government), the same remains puzzling for sugar exports since sugar production has not been hampered. The GoI might have taken proactive step here, as higher global prices (on lower production in Brazil) could have caught the government off guard. While the rhetoric of protecting own population does fi nd justifi cation, it nevertheless translates into higher global food
prices, especially after having promised to supply food articles in large quantities, which certainly marks India in bad book.
These challenges are quite pronounced, which warrant coordinated eff orts from both the RBI and the GoI. The RBI in its recently released annual report stated that “…the year gone by brought many challenges, but a recovery is underway in spite of headwinds. The future path of growth will be conditioned by addressing supply-side bottlenecks, calibrating monetary policy to bring infl ation within the target, while supporting growth and targeted fi scal policy support to aggregate demand, especially by boosting capital spending,” While majority of economists now expect CPI to average at 6.7% in FY23, the growth projections have been slashed too. Moody’s lowered India’s GDP growth forecast to 8.8% for CY22 from its March estimate of 9.1%, holding that rising infl ation and interest rates will tamper the economic growth momentum. Economic activities have also been hit with the latest set of indicators released by Mint (Mint Macro tracker) showed that only 4 out of 16 indicators in the tracker are above the fi ve-year trend, 7 are below and 5 maintained the trend, which marks a deterioration from the reading six months ago. For CY23, Moody’s expects GDP growth to fall sharply to 5.4%. One of the positive aspects is that the Indian corporate have de-leveraged their balance-sheet during the pandemic and haven’t heavily resorted to low-cost of funds when interest rates were going low. Besides, the banking system has also been cleansed and the public sector banks (PSBs) are now ready to lend aggressively again and improve their RoAs as well. The PSBs will give the government a record Rs. 7,867 crore in dividends this year, an indication of better profi tability and capital position, largely driven by waning NPAs. In
One of the positive aspects is that the Indian corporate have de-leveraged their balance-sheet during the pandemic and haven’t heavily resorted to low-cost of funds when interest rates were going low. Besides, the banking system has also been cleansed and the public sector banks (PSBs) are now ready to lend aggressively again and improve their RoAs as well.
Food Price Index
125 125 128 129 133 135 134 136 141
160 158
Jun-21 Jul-21 Aug-21 Sep-21 Oct-21 Nov-Nov-No 21 Dec-21 Jan-22 Feb-22 Mar-22 Apr-22
Source: FAO

3 June 2022INSIGHT
Mar’22 quarter, the PSBs witnessed sharp improvement in credit growth to 7.8% from 3.6% in the year-ago quarter. Moreover, the capacity utilization level in Indian economy is already inching back towards its pre-pandemic levels. These are positive indications for future capex and the street expects momentum in private capex to pick up in the coming months, which will support economic growth since private capex accounts for ~80% of total capex.
India Inc. experienced pricing pressures in 4QFY22 earnings season, as higher input cost could not have been fully passed on apprehension of resultant demand destruction. Moreover, there is always apprehension of losing market share even for the incumbents in an intense competitive scenario. It is a hard time for the start-ups also, as easy fi nancing has dried up and they are now exploring all possible ways to
trim cost including lay-off s. Based on the data assessed from The Economic Times, sales of 1,808 companies which have declared results so far grew by 8.45% YoY and PAT grew by 12.4% YoY, while the sales of Nifty companies grew by 8.35% YoY in-line with the entire listed universe. Sales of 1779 companies (ex-banks) grew by 9.42%, while net profi t grew by 14.16% YoY. Notably, the companies, which have actually seen upgrades, have outnumbered those which have seen downgrades. However, the 4QFY22 depicts a wide divergence between sectors stuck in the throes of supply-led infl ation shock (Consumer Staples & Durables, Cement, Auto and Metal) and other sectors, which did not get a direct hit by the rising prices (Private Banks, NBFCs and Technology). However, most experts have not downgraded earnings estimates as they consider these pressures as short-term in nature, while some experts expect pressure to last at least till 2HFY23.
Nevertheless, the extent to which these negatives have been priced in is a debatable subject. Media articles state that although, Nifty’s 14% decline from the lifetime highs hit in Oct’21 may not qualify as a bear market but it is surely one of its longest corrections, while the index could decline by another 10% based on the historical trends. A bear market is said to happen when a stock or index falls 20% from the recent highs. Ongoing correction for 7 months has already made it the seventh longest decline out of 19 corrections of >10% which Nifty witnessed over the last three decades. This complicates matters more with the FPIs seeking an exit route. Albeit bond yields in India are
signifi cantly higher than the earnings yield, which indicates either the stock market is overvalued or it is trading at a premium. India’s yield gap has traditionally been large and remains higher than several emerging markets as well as the developed markets like the US, which has been justifi ed with higher earnings growth potential in India. However, that theory is also losing grounds with the 12-month trailing EPS growing at a slower pace than the emerging market peers like Brazil, South Korea and South Africa during FY21-FY22. The investors, who paid aggressive valuations for the growth stocks have now started to switch towards the defensives and high dividend yield stocks to ensure payouts as well as to preserve their capital. While this is a general tendency, at times the markets have caught the investors off -guard as timing the markets is not easy task. Bear market rallies are also part and parcel of the markets and we could soon witness one and the investors might again be late by the time the confi rmation comes.
Research DeskEmail - [email protected]: +91 33 4010 2500
Moreover, the capacity utilization level in Indian economy is already inching back towards its prepandemic levels. These are positive indications for future capex and the street expects momentum in private capex to pick up in the coming months
Bear market rallies are also part and parcel of the markets and we could soon witness one and the investors might again be late by the time the confi rmation comes.

4June 2022 INSIGHT

5 June 2022INSIGHT

6June 2022 INSIGHT
India Inc must think
outside the regime
of incentives and
subsidies and improve
its competitiveness and
productivity while ramp-
ing up R&D expenditure
for being future ready….
T. V. NARENDRAN CII
President
Apart from rural
distress, multiple
price hikes
coupled with high fuel
prices are keeping
price-sensitive entry-level
two-wheeler custom-
ers away…..VINKESH GULATI, President, FADA
Infl ation must be
tamed in order to
keep the Indian
economy resolute on
its course to sustained
and inclusive growth….
SHAKTIKANTA DAS, RBI
Governor
The Fed overall is
going to tighten
less. That will
lead to a market begins
to fi nd its feet and move
higher in the coming
quarters infl ation does
come off the boil….
BRENT SCHUTTE, Chief
investment strategist,
Northwestern Mutual Life
Insurance
Equities are
starting to look
attractive for
medium-to-longer term
buyers…it is important
emphasise that we have
seen a huge absorption
of a lot of worrying
things…PETER OPPEN-
HEIMER, Chief global
equity strategist, Gold-
man Sachs Group Inc.
Investors should
keep their seat belt
on. Learning to live
with tighter liquidity
will not be a smooth
process, although froth
has already been taken
away from some parts
of fi nancial markets…..
EMMANUEL CAU,
Strategist, Barclays
GREED & fear
had been
expecting India
to underperform in the
Asian context in the fi rst
quarter of this year, as
it probably would have
done were it not for the
further collapse in Chi-
nese equities triggered
by President Xi Jinping’s
decision to double down
on the Covid suppres-
sion policy. This had also
been the expectation
of foreign investors,
which is why there was
record foreign selling
of Indian equities in the
fi rst quarter of this year….
CHRISTOPHER WOOD,
Global head of equity
strategy at Jefferies
The markets
have already
priced in the
upcoming anticipated
rate hikes, and that peak
hawkishness has been
reached. If subsequent
messaging from the Fed
becomes more neutral,
it could stabilise yields
or even trigger a rally…
JEAN-CHARLES SAM-BOR, Head of EMs fi xed
income at BNP Paribas
Asset Management
There is a diffi cult
set-up in general
for risky assets
as valuations remain
stretched despite adrop
in equities. Some people
think stagfl ation is a real
risk…KATHRYN KOCH, CIO, public markets
equity, Goldman Sachs
& Co.
If China’s economy
slows signifi cantly,
EM currencies, as well
as the yuan could experi-
ence a period of elevated
and persistent volatility…
BRENDAN MCKENNA , International economist
& forex strategist, Wells
Fargo Securities
The macro indi-
cators are really
looking good, the
GST collection we have
all seen is all-time high in
April, the e-way bills have
picked up, I would say
all sectors of the econ-
omy have opened up….
NIRANJAN GUPTA CFO,
Hero Motocorp
PROMINENT HEADLINESMAY 2022

7 June 2022INSIGHT
In the US, there was
over-stimulus due to
large government
spending. Labour markets
are tight. The Fed may be
behind the curve, the RBI
(Reserve Bank of India) is
not. The Indian infl ation tra-
jectory differs from that of
the US…. ASHIMA GOYAL,
Member, RBI MPC
Investors are fearing that
central banks will fail to
tame infl ation without
triggering a recession or
sharp economic down-
turn… CHARLES-HENRY
MONCHAU, Chief invest-
ment offi cer, Banque Syz
We believe that
Nifty would
likely move
sideways for the remainder
of 2022 and would likely
end the year within 16,000-
17,000 range…MAHESH
NANDURKAR, MD & India
Strategist, Jefferies
A recession is
not inevitable.
Rotations within
the US equity market
indicate that investors are
pricing elevated odds of
a downturn, compared
with the strength of recent
economic data…DAVID
KOSTIN, Chief US equity
strategist, Goldman Sachs
According to IMF,
our economy might
see economic
growth of 8.2 per cent, it
is the fastest in the world
and I would say that it
means that broadly we are
now out of the turbulence
that occured due to the
pandemic…. SANJEEV
SANYAL, PRINCIPAL
ECONOMIC ADVISOR
The challenge (for
India) is to sustain
high growth of 8-9
per cent over the next three
decades and without tech-
nological leapfrogging,
it will be diffi cult for India
to grow at high rates….
AMITABH KANT, CEO, NITI
Aayog
The good news in
India is that we
fi nally saw evidence
of the residential property
cycle turning up last year
after a seven-year down-
turn. That is very important
because that is the supplier
for the whole economy and
my base case is that resi-
dential cycle can run for as
long as the last down cycle
went on which is seven
years and that was a period
of positive employment
generation…. CHRISTO-
PHER WOOD, Global Head
of Equity Strategy, Jefferies.
100% saturation of government schemes ends dis-crimination and need for a recom-mendation to get the benefi ts. It also puts an end to appease-ment politics…. NAR-ENDRA MODI, Prime Minister
Industries should get quality power... States should build infrastructure and tap various forms of energy, includ-ing solar energy, so that there is no power shortage…. NIRMALA SITHA-RAMAN , Finance Minister

8June 2022 INSIGHT
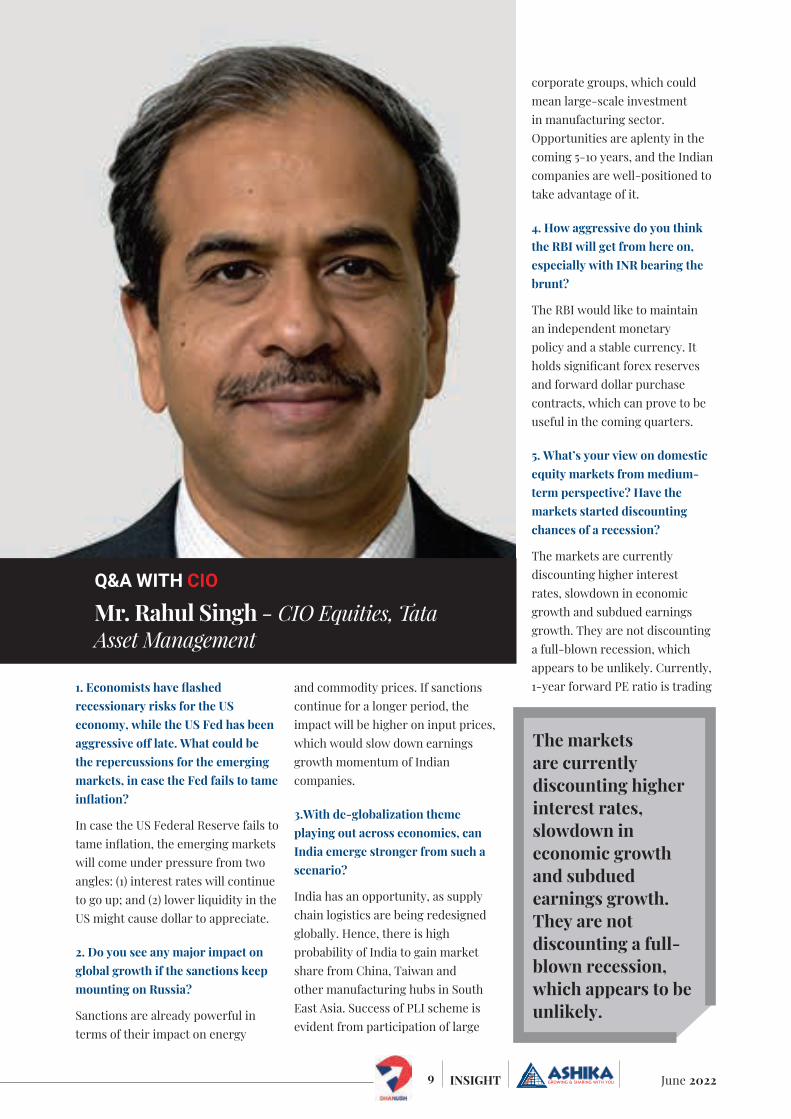
Rahul SinghChief Investment Officer (CIO) – Equities, Tata Asset Management
Rahul is a Bachelor of Technology in Mechanical Engineering from IIT Bombay and an alumnus of IIM Lucknow where he pursued his Master of Business Administration in Finance and Financial Management Services.
In his previous role at Ampersand Capital Investment Advisors LLP, Rahul was the Managing Partner. He has also worked with many reputed financial institutions like Standard Chartered Securities and Citigroup Global Markets India as Head of Equity Research.
With over 26 years of investment experience, Rahul Singh joined Tata Asset Management in October 2018 as CIO-Equities, leading the fund management and equity research teams.
9 June 2022INSIGHT
1. Economists have fl ashed recessionary risks for the US economy, while the US Fed has been aggressive off late. What could be the repercussions for the emerging markets, in case the Fed fails to tame infl ation?
In case the US Federal Reserve fails to tame infl ation, the emerging markets will come under pressure from two angles: (1) interest rates will continue to go up; and (2) lower liquidity in the US might cause dollar to appreciate.
2. Do you see any major impact on global growth if the sanctions keep mounting on Russia?
Sanctions are already powerful in terms of their impact on energy
and commodity prices. If sanctions continue for a longer period, the impact will be higher on input prices, which would slow down earnings growth momentum of Indian companies.
3.With de-globalization theme playing out across economies, can India emerge stronger from such a scenario?
India has an opportunity, as supply chain logistics are being redesigned globally. Hence, there is high probability of India to gain market share from China, Taiwan and other manufacturing hubs in South East Asia. Success of PLI scheme is evident from participation of large
corporate groups, which could mean large-scale investment in manufacturing sector. Opportunities are aplenty in the coming 5-10 years, and the Indian companies are well-positioned to take advantage of it.
4. How aggressive do you think the RBI will get from here on, especially with INR bearing the brunt?
The RBI would like to maintain an independent monetary policy and a stable currency. It holds signifi cant forex reserves and forward dollar purchase contracts, which can prove to be useful in the coming quarters.
5. What’s your view on domestic equity markets from medium-term perspective? Have the markets started discounting chances of a recession?
The markets are currently discounting higher interest rates, slowdown in economic growth and subdued earnings growth. They are not discounting a full-blown recession, which appears to be unlikely. Currently, 1-year forward PE ratio is trading
The markets are currently discounting higher interest rates, slowdown in economic growth and subdued earnings growth. They are not discounting a full-blown recession, which appears to be unlikely.
Mr. Rahul Singh - CIO Equities, Tata Asset Management
Q&A WITH CIO

10June 2022 INSIGHT
at ~17.50x, which is lower than the 10-year average.
In case there is a deeper slowdown or recessionary environment, these dynamics will change valuations.
6. How challenging will be for India Inc. with double whammy of higher commodity infl ation and probability of a demand slowdown? What’s your expectations of Nifty earnings growth for next two years?
The challenge will be in form of margin pressure and demand slowdown (if the companies pass the rising input prices to consumers). As of now, we expect profi t growth for Nifty50 to slow down to ~14-15% from ~18-19% in Jan’22. In case, the input prices continue to remain higher for a long time, earnings may decline to low teens or 10%.
It depends on how the impact of input costs are passed on to the customers and to what extent demand is aff ected by it. There are
signifi cant downside risks in the coming months compared to upside risks.
7. Which are the sectors you think could do well in the current scenario?
Sectors, which are likely to do well in an investment revival, are: Capital Goods, Industrials, Real Estate and Banking (which is seeing reasonable valuations). These sectors tend to do well in a rising rates and investment revival scenario. Some companies in sectors such as Capital Goods and other cyclicals such as real estate are seeing signifi cant demand revival.
8. What are the themes you like the most now, which have to be a part of portfolio from a long-term perspective?
As mentioned above, anything to do with the investment cycles should be part of the portfolio. As the market is also becoming more value conscious, the stocks, where we have more visibility of earnings and profi ts and are available at reasonable valuations, are preferable. Other sectors such as Banking, Real Estate, Capital Goods and Industrials are also positive from long-term horizon.
9. How do one play out the technology sector and some of the new-age companies, which have seen signifi cant correction?
The impacts of the recent events on business models and valuations are very real. We have to wait and watch for 2 factors: (1)as the economy comes out of lockdown, how the businesses such as e-commerce and food delivery will be impacted
in normalized conditions; and (2) how these businesses are hit by a slowdown in demand, as these are as much a part of broader economy as the traditional businesses.
Given where the interest rates and valuations scenarios are, the impact on valuations have already been priced in. What impact this will have on business projections is not yet priced in.
10. Do you expect retail participation to ease amid heightened market volatility?
Retail participation in the markets is a function of two factors: FD rates and last 12-24 month trailing returns. In case FD rates go up to ~6-6.5% and the markets remained range-bound, we might see some impact. However, there was signifi cant amount of money sitting on the sidelines waiting for cheaper valuations, which will likely balance out the core infl ows/outfl ows.
Sectors, which are likely to do well in an investment revival, are: Capital Goods, Industrials, Real Estate and Banking (which is seeing reasonable valuations). These sectors tend to do well in a rising rates and investment revival scenario.
Retail participation in the markets is a function of two factors: FD rates and last 12-24 month trailing returns. In case FD rates go up to ~6-6.5% and the markets remained range-bound, we might see some impact.
Disclaimer: Stocks conveyed by Fund manager are just for illustration and these are not recommendations

11 June 2022INSIGHT
Investment ObjectiveThe investment objective of the scheme is to seek long term capital appreciation by investing atleast 80% of its net assets in equity/equity related instruments of the companies in the Banking and Financial Services sector in India.
Why invest in banking and Financial services sector? Banking is the vein of an economy. Growth of banking and economy is interdependent. As the Indian economy is expected to do better than other economies in future, the banking sector will also perform in line with the econ-omy. With various restrictions on cash transactions under the Indian tax laws, more and more transactions are happening through banking channels. The decision of the government, in the budget, to introduce the core banking system in the Indian post offi ces will also give a major boost to the banking sector as millions of post offi ce account holders will be able to transact online across the banking sector. With Non-Performing Assets (NPA) levels coming down after clean up in the banking sector, this sector is expected to perform better in future is also one of the reasons for taking exposure to this sector. So, at this juncture, it makes sense for an average investor to invest in the banking sector.
Segments in the Portfolio: Banks (~67% of the portfolio): This segment of the
portfolio largely comprises of major private sector banks (~45% of the portfolio), with some holdings in large PSU banks as well (~10% of the portfolio.). Large banks have the capacity eff ectively raise funds from the market and have the capacity to distribute fi nancial services as well.
Financial Services (~21% of the portfolio): This segment is dominated by housing fi nance corporates (~10% of the portfolio). These companies may see relatively lower stress in the coming months as a large portion of their loan portfolio is lent out to salaried workers. This
segment of population is likely to see lower stress levels in the coming months. The balance is in fi nancial services companies that are involved in businesses such as payment services, ratings, asset management etc. which make up ~11% of the portfolio.
Insurance (~9% of the portfolio): Life Insurance companies (7% of the portfolio) make up the majority of this segment. Life Insurance companies are steady state compounders who have a long runway for growth over the long term. The fund also holds a private sector general insurance company.
Important InformationNAV (G) (Rs.) 23.13IDCW (Rs.) 21.29Inception Date Dec 28, 2015Fund size (Rs. Cr.) 947.0Fund Manager Amey SatheEntry load N.AExit Load 0.25% of NAV if redeemed
within 30 daysBenchmark Nifty Financial Services TRIMin Investment (Rs.) 5000Min SIP Investment (Rs.) 150
Key RatiosBeta (x) 0.89Standard deviation (%) 27.25Sharpe Ratio 0.09Alpha (%) 0.73R Squared 0.98Expense ratio (%) 2.40Portfolio Turnover ratio 11.26%Avg. Market Cap (Rs. Cr.) 15187.8
Mutual Fund Overview TATA BANKING AND FINANCIAL SERVICES FUND

12June 2022 INSIGHT
Performance of the Fund alongwith Benchmark (as on May 26, 2022)1 month 3 months 6 months 1 year 3 Years 5 Years Since Inception
Fund (%) -4.66 -3.69 -8.83 -5.08 5.43 8.48 13.97Benchmark (%) -2.67 -2.51 -0.7 4.01 5.29 9.37
Asset AllocationEquity Cash97.5% 2.5%
% SECTOR ALLOCATION Top 10 holdingsStocks % of Net AssetsICICI Bank 15.4HDFC Bank 13.7Axis Bank 8.8State Bank Of India 7.7HDFC 7.4Kotak Mahindra Bank 6.8SBI Cards & Payment Services 3.5HDFC Life Insurance Company 2.8SBI Life Insurance Company 2.7ICICI Lombard Gen. Insurance Co. 2.6
Note: All data are as on Apr 30, 2022; NAV are as on May 26, 2022Source: Factsheet, Value Research
Ashika Mutual Fund Recommendation Alpha Generation
Month of Recom
Fund Name Benchmark NAV as on 26.05.2022
1 Year Return
(%)
3 Year Return
(%)
5 Year Return
(%)
Jun-21 ICICI Pru Large & Mid Cap Fund Reg (G) NSE - NIFTY Large Midcap 250 TRI
508.2 15.8 15.6 11.2
Jul-21 Edelweiss Balanced Advantage Fund (G) CRISIL Hybrid 50+50 Moder-ate Index
34.0 4.6 12.5 10.4
Aug-21 Nippon India Flexi Cap Fund Reg (G) NSE - Nifty 500 TRI 9.8 0.0 0.0 0.0
Sep-21 SBI Balanced Advantage Fund Reg (G) CRISIL Hybrid 50+50 Moder-ate Index
10.1 0.0 0.0 0.0
Oct-21 HDFC Dividend Yield Fund Reg (G) NSE - Nifty Dividend Opp 50 TRI
13.4 14.4 0.0 0.0
Nov-21 PGIM India Flexi Cap Fund (G) S&P BSE 200 TRI 22.9 2.6 18.6 13.0
Dec-21 Quant Tax Plan (G) NSE - Nifty 500 TRI 210.8 13.2 30.3 20.7
Jan-22 HSBC Large Cap Equity Fund (G) NSE - Nifty 50 TRI 284.0 1.0 9.7 9.1
Feb-22 SBI Long Term Equity Fund Reg (G) S&P BSE 500 TRI 204.5 5.9 12.0 9.2
Mar-22 IDFC Tax Advantage Reg (G) S&P BSE 200 TRI 89.3 8.2 16.0 12.7
Apr-22 ICICI Pru Multi Asset Fund (G) NSE - Nifty 50 TRI 428.4 20.0 16.8 12.9
May-22 Sundaram Services Fund (G) S&P BSE 200 TRI 19.2 13.9 19.5 0.0Note: All data are as on Apr 30, 2022; NAV are as on May 26, 2022Source: Factsheet, Value Research
65.51
8.64
8.12
6.07
4.54
3.14
1.48
Banks
HousingFinance
Insurance
NBFC
Investment Co.
Other fin. serv.
Healthcare

13 June 2022INSIGHT
All Data Belongs To May 26, 2022
NAV AUM (Rs Cr)
3 M 6 M 1 Yr 3 Yr 5 Yr Since Inception
Return
Sharpe Ratio
Exp. Ratio
SBI Large & Midcap Fund Reg (G) 341.4 6599 (1.6) (4.9) 8.2 15.0 12.3 13.9 0.7 2.2
Mirae Asset Emerging Bluechip Fund Reg (G)
88.4 21932 (3.4) (7.9) 5.1 17.9 14.5 19.9 0.8 1.7
ICICI Pru Large & Mid Cap Fund Reg (G) 508.2 4322 (0.1) (3.0) 15.8 15.6 11.2 17.9 0.7 2.2
LIC Large & Mid Cap Fund Reg (G) 22.2 1699 (4.7) (6.8) 9.1 14.4 11.0 11.6 0.7 2.4
Kotak Emerging Equity (G) 66.4 19303 (2.2) (5.9) 9.2 19.9 13.2 13.3 0.9 1.7
Large & Mid Cap Fund
Value Fund
SBI Contra Fund Reg (G) 194.7 4491 1.4 (1.5) 16.1 21.0 13.6 16.9 0.9 2.1
IDFC Sterling Value Fund Reg (G) 82.2 4636 (2.3) (2.1) 13.0 16.9 11.7 15.8 0.7 1.9
Nippon India Value Fund (G) 111.7 4389 (4.5) (6.6) 8.1 13.9 11.5 15.3 0.7 2.0
Kotak India EQ Contra Fund (G) 76.6 1260 (3.3) (4.7) 5.8 12.8 12.7 12.9 0.6 2.3
Invesco India Contra Fund (G) 70.1 8655 (3.4) (7.4) 3.9 13.2 12.2 13.7 0.6 2.0
Focus Fund
Axis Focused 25 Fund Reg (G) 37.7 19146 (10.5) (17.8) (5.5) 10.2 11.0 14.2 0.6 1.6
Mirae Asset Focused Fund Reg (G) 17.5 8415 (5.8) (10.8) 6.8 17.9 0.0 19.8 0.0 1.8
SBI Focused Equity Fund Reg (G) 211.4 24707 (7.9) (16.4) 6.4 13.2 14.2 18.7 0.7 1.9
DSP Focus Fund Reg Fund (G) 30.0 1861 (5.4) (10.8) (3.4) 8.1 7.2 9.5 0.4 2.2
IDFC Focused Equity Fund Reg (G) 47.8 1327 (7.9) (9.2) 0.3 8.8 7.8 10.1 0.5 2.2
ELSS Fund
Quant Tax Plan (G) 210.8 1316 2.0 (4.4) 13.2 30.3 20.7 15.4 1.3 2.6
Kotak Tax Saver Scheme (G) 66.1 2670 (2.9) (6.4) 6.8 13.6 11.1 12.1 0.7 2.2
Mirae Asset Tax Saver Fund Reg (G) 28.5 11963 (2.7) (6.8) 5.5 16.8 14.7 17.8 0.8 1.9
IDFC Tax Advantage Reg (G) 89.3 3742 (3.1) (4.4) 8.2 16.0 12.7 17.6 0.7 2.0
SBI Long Term Equity Fund Reg (G) 204.5 10575 (1.8) (7.4) 5.9 12.0 9.2 14.0 0.6 2.0
Flexi Cap Fund
Quant Active Fund (G) 388.0 2300 0.5 (6.6) 10.5 27.9 20.6 18.9 1.2 2.6
SBI Flexi Cap Fund Reg (G) 69.8 15449 (3.7) (6.2) 4.9 11.8 10.6 12.4 0.6 1.9
Kotak Flexi Cap Fund Reg (G) 48.1 36463 (3.0) (5.6) 2.9 9.7 9.7 13.0 0.5 1.6
Motilal Oswal Flexi Cap Fund Reg (G) 30.2 9690 (5.0) (10.5) (6.5) 4.7 5.0 14.6 0.3 1.9
Parag Parikh Flexi Cap Fund Reg (G) 44.9 21907 (4.8) (11.0) 8.6 21.6 17.4 18.1 1.1 1.8
Small Cap Fund
Quant Small Cap Fund (G) 118.2 1822 (3.7) (8.3) 11.6 36.1 19.1 14.4 1.1 2.6
SBI Small Cap Fund Reg (G) 98.3 12098 (0.4) (4.6) 10.9 24.2 18.1 19.7 1.0 2.0
Axis Small Cap Fund Reg (G) 55.8 9261 (3.9) (5.8) 13.1 25.0 18.2 22.4 1.1 2.0
Invesco India Smallcap Fund Reg (G) 18.7 1257 (4.1) (10.9) 7.8 21.1 0.0 18.9 0.9 2.2
Kotak Smallcap Fund (G) 149.6 7385 (3.6) (9.0) 13.0 28.1 15.7 17.0 1.1 1.9

14June 2022 INSIGHT
Balanced Advantage Fund
IDFC Balanced Advantage Fund Reg (G) 16.7 3058 (4.9) (7.9) 0.1 7.7 7.3 6.9 0.6 2.0
Sundaram Balanced Advantage Fund (Formerly Principal Balanced Advantage) Reg (G)
24.1 1630 (2.0) (3.5) 1.7 4.9 5.0 8.0 1.1 2.2
Edelweiss Balanced Advantage Fund (G) 34.0 8008 (2.8) (4.1) 4.6 12.5 10.4 10.1 0.9 1.9
Kotak Balanced Advantage Fund Reg (G) 14.0 13573 (1.2) (2.4) 3.9 9.7 0.0 9.0 0.6 1.7
Aditya Birla SL Balanced Advantage Fund (G)
70.0 6761 (1.5) (3.3) 2.7 9.4 7.6 9.2 0.6 1.8
Equity Savings Fund
Aditya Birla SL Equity Savings Fund Reg (G) 16.4 536 (3.6) (5.9) 0.6 6.8 5.4 6.8 0.5 2.4
DSP Equity Saving Fund Reg (G) 15.9 413 (0.2) 0.9 4.2 7.6 6.5 7.7 0.5 1.4
Kotak Equity Savings Fund Reg (G) 18.4 1854 (0.1) 0.8 7.5 8.6 8.1 8.2 0.7 2.1
Nippon India Equity Savings Fund Reg (G) 12.1 199 0.1 (0.7) 4.1 (1.5) 0.6 2.8 (0.3) 2.6
SBI Equity Savings Fund Reg (G) 16.9 2362 (1.4) (2.0) 4.0 8.7 7.3 7.7 0.7 1.2
Arbitrage Fund
Aditya Birla SL Arbitrage Fund Reg (G) 21.7 8406 0.7 1.6 3.6 4.3 5.0 6.2 1.0 1.0
ICICI Pru Equity Arbitrage Fund Reg (G) 28.0 14077 0.7 1.6 3.8 4.3 5.0 6.9 1.0 1.0
Kotak Equity Arbitrage Fund (G) 30.4 24648 0.8 1.8 4.0 4.5 5.2 6.9 1.2 1.0
Nippon India Arbitrage Fund (G) 21.8 10898 0.7 1.7 3.8 4.4 5.2 6.9 1.0 1.0
SBI Arbitrage Opp Fund Reg (G) 27.5 7589 0.8 1.8 4.2 4.2 5.0 6.7 0.8 0.8
Thematic/Sectoral Fund
All Data Belongs To May 26, 2022
NAV AUM (Rs Cr)
3 M 6 M 1 Yr 3 Yr 5 Yr Since Inception
Return
Sharpe Ratio
Exp. Ratio
Franklin Build India Fund (G) 60.0 1100 (1.1) (6.7) 9.1 10.8 9.7 14.9 0.5 2.3
ICICI Pru Banking and Financial Services Fund Reg (G)
77.3 4757 (3.0) (6.1) (2.1) 3.9 6.8 16.0 0.3 2.1
Nippon India Pharma Fund (G) 266.1 4932 (3.8) (13.0) (9.5) 22.4 17.4 20.0 1.0 2.7
Sundaram Rural and Consumption Fund Reg (G)
53.5 1157 (3.2) (5.8) 4.7 8.6 6.6 11.1 0.5 2.3
Aditya Birla SL Digital India Fund Reg (G) 109.9 3161 (13.9) (20.1) 5.3 28.7 24.9 9.3 1.2 2.2
Index Fund
HDFC Index Fund-NIFTY 50 Plan(G) 149.4 5721 (2.8) (4.8) 6.6 11.6 11.8 14.4 0.6 0.4
ICICI Pru Nifty Next 50 Index Fund Reg (G) 33.3 2098 (4.4) (10.4) 1.8 10.9 7.7 10.6 0.6 0.7
HDFC Index Fund Sensex Plan 488.4 3307 (2.7) (4.7) 7.2 11.9 12.6 14.7 0.6 0.4
Motilal Oswal Nasdaq 100 FOF (G) 19.1 3688 (12.2) (23.9) (8.7) 20.7 0.0 20.1 0.8 0.5
Motilal Oswal S&P 500 Index Fund Reg (G) 13.8 2530 (4.6) (12.4) 0.9 0.0 0.0 16.6 0.0 1.1

15 June 2022INSIGHT
Multi Assets
HDFC Multi Asset Fund (G) 46.0 1517 0.7 43.147 (27/05/2021)
(0.6) (3.5) 6.6 26.1 0.7 2.4
SBI Multi Asset Allocation Fund Reg (G)
36.4 564 1.2 34.8906 (28/05/2021)
(1.6) (2.1) 4.3 14.3 1.0 1.9
ICICI Pru Multi Asset Fund (G) 428.4 13315 1.0 356.913 (28/05/2021)
2.0 4.4 20.0 35.6 0.8 1.9
Axis Triple Advantage Fund (G) 27.5 1722 0.8 27.0489 (28/05/2021)
(6.4) (10.7) 1.5 22.7 0.7 2.1
Nippon India Multi-Asset Fund Reg (G) 12.5 1150 0.0 11.8237 (28/05/2021)
(2.2) (3.4) 6.1 0.0 0.0 1.8
Disclaimer: Mutual Fund investments are subject to market risks, read all scheme related documents carefully.
Solutions
All Data Belongs To May 26, 2022
NAV AUM Mod Dura-tion
(in Yrs)
AMP (IN Yrs )
3 M 6 M 1 Yr 2 Yr Sharpe Ratio
Exp. Ratio
ICICI Pru Retirement Fund Pure Debt Plan (G)
12.4 249 2.7 12.1356 (06/07/2021)
(0.4) (0.2) 1.6 4.2 1.3 2.3
Aditya Birla SL Retirement Fund 30s Plan (G)
12.0 235 0.4 11.743 (12/05/2022)
(3.3) (9.7) (3.2) 19.5 0.3 2.1
HDFC Retirement Savings Fund Hybrid Equity Reg (G)
23.4 806 0.7 22.713 (27/05/2021)
(1.5) (6.7) 3.1 28.3 0.6 2.6
Aditya Birla SL Bal Bhavishya Yojna Reg (G)
12.3 553 0.4 12.03 (13/05/2022)
(4.1) (10.6) (4.1) 18.4 0.3 2.0
ICICI Pru Child Care Gift Plan Reg 183.5 836 0.4 172.21 (28/05/2021)
(2.8) (5.0) 6.7 24.8 0.5 2.4
SBI Magnum Children Benefi t Fund Investment Plan Reg (G)
22.1 479 0.0 15.801 (01/06/2021)
(1.2) (3.5) 38.8 0.0 0.0 2.6

16June 2022 INSIGHT
STOCK PICKS
ICICI Lombard General Insurance Company Ltd.
Company OverviewICICI Lombard General Insurance Company (ICICI Lombard) is India’s second largest non-life insurance player and one of the largest within the private sector with an overall market share of 8.1% and 12.9% mar-ket share in private general insurance space. Motor insurance remains the largest contributor to its premium at 46% as of FY22 followed by Health, Travel & PA, Fire, Marine and Crop at
22%, 26%, 3% and 4%, respectively. Its key distribution channels are direct sales, individual agents, corporate agents-banks, other corporate agents, brokers, MISPs and digital, through which it serves customers ranging from individual, corporate and government. The company has a diversifi ed and strong distribution network with broker network share of 47%, while network share of direct business and corporate agents and
individual agent stands at 31%, 11% and 11%, respectively.
Investment RationaleMassive Opportunity in Non-Life Insurance SpaceIndia’s non-life insurance market stood at Rs. 2,207.7 billion on the basis of gross direct premium income (GDPI) and has been clocking 16% CAGR over the last 10 years. Non-life insurance covers a wide range of
Company InformationBSE Code 540716NSE Code ICICIGIBloomberg Code ICICIGI INISIN INE765G01017Market Cap (Rs. Cr) 61,610Outstanding shares(Cr) 49.0952-wk Hi/Lo (Rs.) 1,674/1,192Avg. daily volume (1yr. on NSE) 795,920Face Value(Rs.) 10.0Book Value (Rs) 186
CMP: Rs 1,250 Rating: BUY Target: Rs 1,460
Promoters, 48.04%
DIIs, 13.73%FIIs, 26.88%Others, 11.34%
Share holding pattern as on March 2022 (%)

17 June 2022INSIGHT
categories viz. motor, health, marine, fi re, engineering, crop and others. The motor insurance segment is the largest among these followed by health insurance. Excluding stand-alone health insurers, the industry is dominated by private players with 49.7% market share, which grew at tremendous rate during the non-tariff era from 36.6% (FY08) in the tariff era. Despite such growth, penetration of non-life insurance in India stood at ~1/4th of global in 2020. As percentage of GDP (CY20 in USD terms), premium is at 1% in India vs. 9% in the USA and even 1.9% and 1.8% in China and Brazil, respectively. Demographic advantage of India with >50% of population below 25 years of age and 65% below age of 35 years naturally results in a huge potential opportunity in insurance space. Signifi cant under penetration, formalization of the economy, rising awareness for fi nancial protection (accelerated by pandemic), large protection gap and expanding per capita income among others are the key long-term growth drivers for the sector.
4QFY22 GWP Growth Driven by Health & Motor TP ICICI Lombard is the largest motor insurer in the private space with 11.8% market share as on March 31, 2022. Motor insurance (OD+TP) segment accounted for 46% (with
both segments contributing equally) of the company’s total gross premium vs. the industry average of 31%. Motor segment have been in trouble owing to the pandemic. However, hike in TP insurance premium in last two quarters as well as expected growth in auto sales would drive growth in the medium-term ultimately benefi tting ICICI Lombard. In fact, motor insurance saw faster growth than the industry and the company has attained market leadership during the year with a market share of 11.8% as on Mar’22. In retail health segment, the company has started witnessing results with investments in the segment and its agency channel’s premium growing by
29.5% in 4QFY22. With the company’s aim to add 1,000 health agency managers, it has now on-boarded 750 health agents and the balance 200 is expected to be on-boarded, going ahead. Overall, gross premium increased by 32.9% YoY in 4QFY22 driven by 49.3% YoY growth in health line and 42.3% YoY growth in motor TP line. Within health, growth was driven by 52.9% YoY increase in group business on the back of strong renewals and price hikes. Within motor, CV segment witnessed robust 69.6% YoY growth led by: (a) greater comfort owing to recent TP hikes and higher use of analytics/ segmentation; and (b) combined operating ratio (COR) approach to underwriting.
Focus on Businesses with Lower Loss RatiosICICI Lombard has strategically chosen to be in business segments with lower loss ratios and thus, be profi table. Motor OD and Motor TP have loss ratios of 68.1% and 74% as of FY22, where it derives 46% of total gross premium from. It has tradi-tionally shied away from the crop segment, which runs loss ratios of 108%, but now contributes 4% to its portfolio, which is largely on account of integration with Bharti AXA. Even within motor segment, private car and two-wheeler contribute 54% and 26.4% of Motor GDPI since both these segments have lower claims, while CV segment has usually higher accidental incidences and higher loss ratios resulting in underwriting losses. However, underwriting loss increased 15% QoQ to Rs. 308.98 crore in 4QFY22 led by: (a) higher claims and resultant higher loss ratio by 246bps QoQ to 72% (led by motor TP loss and crop loss ratios); (b) increase in cost structure; and (c) higher investment into distribution (ICICI Lombard added 350 retail health agency sales force taking the total number of health agents to 750 in FY22). Combined ratio stood at
ICICIGI 3 Year share price (Rs)
750850950
10501150125013501450155016501750
May
-19
Aug-
19
Nov
-N
ov-
No
19
Feb-
20
May
-20
Aug-
20
Nov
-N
ov-
No
20
Feb-
21
May
-21
Aug-
21
Nov
-N
ov-
No
21
Feb-
22
May
-22
ICICI Lombard has strategically chosen to be in business segments with lower loss ratios and thus, be profi table. Motor OD and Motor TP have loss ratios of 68.1% and 74% as of FY22, where it derives 46% of total gross premium from.

18June 2022 INSIGHT
103.2% in 4QFY22 and 108.8% in FY22 vs. 99.8% in FY21. The management expects COR to remain above 100%, as the focus is on growth/market share.
Leveraging Investment Book Supports Earnings ICICI Lombard has a large invest-ment book with corpus of Rs. 38,786 crore as of FY22 and investment-mix has been towards 38.3% corporate bonds (rated AA and above), 42.5% in G-Secs and 12.2% in equity. The company has increased investment leverage (total investment assets (net of borrowings) / net worth) to 4.23x in FY22 from 4.09x in FY21. The com-pany has delivered realized return of 8.45% in FY22 vs. 7.855 in FY21. The company hasn’t reported any instance of default on debt portfolio since inception. Strong investment income supports earnings amid vol-atility in underwriting profi tability, especially during catastrophic events and pandemic. Moreover with ~81% of investments in debt, there is scope for higher realized returns with turn in interest rate cycle.
Key risks: Similar products or strategies
adopted by the competitors.
Further waves of COVID-led claims.
ValuationICICI Lombard is India’s second larg-est non-life insurance player and one of the largest private sector players with 8.1% market share on an overall basis and 12.9% in private general insurance space. Motor insurance remains the largest contributor to its premium at 46% as of FY22 followed by Health, Travel & PA, Fire, Marine
and Crop at 22%, 26%, 3% and 4%, respectively. The company is thus a natural benefi ciary of a pick-up in penetration in non-life insurance space given huge under penetration. Traditionally, the company has concentrated into business segments with lower loss ratios like motor OD and TP. However, loss ratios have been higher off -late due to Motor TP losses as well as higher expenses and higher investment for expansion of retail health network. Combined ratio stood at 103.2% in 4QFY22 and 108.8% in FY22 vs. 99.8% in FY21. The management expects COR to remain above 100%, as the focus is on growth/market share. However, a strong investment book of Rs. 38,786 crore as of FY22 and realized return of 8.45% in FY22 supports earnings. Moreover, with ~81% of investments in debt, there is a scope for higher realized returns with turn in interest rate cycle. Besides, synergy benefi ts from Bharti Axa’s product profi le would fl ow in terms of operating effi -ciency coupled with pick-up in the industry volume. At CMP, the scrip is valued at P/E of 26.9x FY24E EPS and investors are advised to ‘BUY’ the scrip based on strong positioning and growth ahead.
Particulars (in Rs Cr) FY21 FY22 FY23E FY24E
Revenue 12,161 16,130 16,452 18,988
Growth (%) 10.0 32.6 2.0 13.8
Operating Profi t 1,955 1,794 2,362 5,944
Operating Profi t Margin (%) 16.1 11.1 14.4 31.3
Net profi t 1,473 1,271 1,840 2,300
Net profi t Margin (%) 11.3 10.7 11.2 12.1
EPS (Rs) 32.3 25.8 37.39 46.51Source: Bloomberg Consensus
The company hasn’t reported any instance of default on debt portfolio since inception. Strong investment income supports earnings amid volatility in underwriting profi tability, especially during catastrophic events and pandemic.

19 June 2022INSIGHT
STOCK PICKS
Company overviewPI industries Ltd. (PI) is the manu-facturer and developer of complex chemistry solutions in agri-sciences with an integrated approach.PI is the India’s largest CRAMS company with patented products accounting for major chunk of revenue. It is also the leading agrochemical company in India with leading market share in certain crops. The company operates through a strong infrastructure
set up consisting of 3 formulation facilities. Export accounts for~75% of its topline, while domestic business contributes25% to its revenue. Hence, PI is an export driven company.
Investment RationaleStrong Order Book in CSM Space off ers Long-term Growth Visibility PI has strong CSM order book of >US$1.4bn, which provides long-term revenue growth visibility. In FY22,
the company commercialized 9 new molecules and expects to launch 7 new molecules in FY23. More than 40 products in CSM division are at diff erent stage of development. The CSM exhibits strong growth per-formance over FY15-22 by clocking 20% CAGR over the same period. In CSM export, the company received record number of enquiries from new clients. PI has started supplying some of its existing CSM molecules
PI Industries Ltd. Company InformationBSE Code 523642NSE Code PIINDBloomberg Code PI INISIN INE603J01030Market Cap (Rs. Cr) 42,235Outstanding shares(Cr) 15.1752-wk Hi/Lo (Rs.) 3,533.3/2,334.3Avg. daily volume (1yr. on NSE) 335,660Face Value(Rs.) 1.0Book Value (Rs) 403.4
CMP: Rs 2,780 Rating: BUY Target: Rs 3,203
Promoters, 46.74%
DIIs, 25.32%FIIs, 16.44%Others, 11.49%
Share holding pattern as on March 2022 (%)

20June 2022 INSIGHT
very recently, thus there remains an opportunity for PI to scale up in these molecules. Some of these molecules are: Chlorantraniliprole (estimated end-market size of US$1.7bn with patent getting expired in CY24) and Flubendiamide (estimated end-mar-ket size of US$507mn with patent getting expired in CY24). With an opportunity to scale up in existing CSM molecules and strong visibility from upcoming products, the man-agement expects CSM to clock 20% CAGR in the long-term.
Surge in New Enquiries/Prod-ucts to Drive Export GrowthIn CSM export, PI received record number of enquiries from new clients. During the last few months, the company has received 36 new enquiries and >35% of which are from non-agrochem space. In FY22, PI added 8 new customers with CSM export order book standing at >US$1.4bn as of Mar’22. The company is also focusing on high-value mol-ecules, which will drive the growth. Over the years, PI witnessed growth in number of high-value molecules and high-revenue customers. The company is also implementing technology at all levels to increase its plant effi ciency to meet up the export demand. It has implemented a strategy to improve solvent quality and recovery. There is strong growth potential in CRAMS markets and it is expected that Indian CRAMs market to double by FY25E driven
by China+ strategy of global chem-ical companies, which are likely to increase sourcing of chemicals from Indian CSM companies to de-risk their global supply chain.Hence, PI being one of the dominant players in agrochemical CRAMs space is going to benefi t from increased number of new enquiries from the MNCs in order to diversify their sourcing from China.
Portfolio of Specialized Products to Drive Domestic Business PI’s specialized product portfo-lio and robust pipeline for new products are expected to drive its domestic business growth. In FY22, the company received 3 regulatory approvals including the 1st product to receive MRL exemption in India. For domestic market launch, there
are 15+ products at diff erent stages of development and registration. The company expects to launch 5 innova-tive products in FY23 to strengthen its domestic market share. In FY22, PI launched 1 new insecticide for rice and three specialty fungicide focused on horticulture and rice. It has also increased its farm application services by doubling the area treating under high-tech spray machines and started drone application on pilot basis. Such initiatives will create awareness among the farmers for using the agrochemical products and will drive the domestic revenue growth. The company has also enhanced its channel distribution by implementing digital sales order-ing module for channel partners. Further, PI has rolled out loyalty programme for deeper engagement with the channel partners. In last year, the Kharif season was not good for overall industry due to the timing of monsoon. There are announcement for normal monsoon and improvement in acreages and thus, it expects good Kharif season in FY23.Domestic revenue growth was impacted by unfavourable agro-cli-matic conditions in Kharif season. However, good Rabi season helped the recovery in 3QFY22 and 4QFY22. Given the normal monsoon forecast in 2022, the demand is expected to remain strongin domestic market.
Strong Performance in 4QFY22 amid Challenging TimesThe company started FY22 with high challenges with COVID 2nd wave followed by supply chain disruption. However, it reported strong revenue and EBITDA growth in 4QFY22 despite high infl ationary pressure. Its revenue grew by 16% YoY and 2.9% QoQ to Rs. 1,395 crore in 4QFY22, while EBITDA increased by 34% YoY and 2.9% QoQ to Rs. 305 crore. EBITDA margin expanded by 286bps to 21.9% (remained fl at on QoQ basis).As per the management, a signifi cant part of raw material
PI Industries ltd. 3 year Price Chart
05001000150020002500300035004000
May-19
Jul-
Jul-
Ju19l-19
l-Sep-19
Nov-19
v-19
v-Jan-20
Mar-20
r-20
r-May-20
Jul-
Jul-
Ju20l-20
l-Sep-20
Nov-20
v-20
v-Jan-21
Mar-21
r-21
r-May-21
Jul-
Jul-
Ju21l-21
l-Sep-21
Nov-21
v-21
v-Jan-22
Mar-22
r-22
r-May-22
In CSM export, PI received record number of enquiries from new clients. During the last few months, the company has received 36 new enquiries and >35% of which are from non-agrochem space.

21 June 2022INSIGHT
infl ation has been passed through but still there is some raw material infl ation, which needs to be passed on and will refl ect in the next quarter. The change in product-mix also aided margin expansion. In last 2 years, there has been change in business-mix and domestic prod-uct-mix, which helped the company on margin front. Despite all adversi-ties on supply chain and cost infl ation front, the company has been able to maintain margin profi le. Net profi t increased by 13.7% YoY to Rs. 204 crore, which albeit declined by 8.2% QoQ due to higher tax outgo. PAT margin declined by 37bps YoY and 176bps QoQ to 14.7%. However, the management is confi dent of deliv-ering 18%-20% revenue growth with continued improvement in margin and returns. As per the management, the company is operating at 2.1x of asset turnover and it is reasonable good ratio compared to the industry average. The company is working on improving product-mix to improve asset turnover and asset utilization. The company has planned a capex of ~Rs. 500 crore in FY23, which would be in the range of Rs. 300-400 crore in FY24. The capex will be incurred mostly in CSM space in FY23. The capex will be spent towards multi-purpose plant, R&D, maintenance and technology development. Hence,
it can be expected that PI has all the ingredients and ability to withstand the current challenging times and deliver encouraging numbers in the coming quarters.
Key Risks Continued rise in the prices of
key inputs and inability to pass the same could bring the margin under pressure.
Below normal monsoon could hurt the demand for agrochemical products.
ValuationPI is the India’s largest CRAMS company with patented products accounting for major chunk of reve-nue. It is also the leading agrochem-ical company in India with leading market share in certain crops. In CSM business, PI is receiving increased number of new enquiries, which confi rmed the fact that the foreign companies are looking for alternative sourcing from China and that throws huge opportunity for Indian CRAMs players. India could be the preferred destination for global innovators for sourcing their key molecules given the scale and effi -ciency the country holds. Further, the management expects good monsoon to revive its domestic business, which was not up to the mark last year
due to weak Kharif season. Further, portfolio of specialized products and robust pipeline of new products are expected to drive domestic revenue. For FY23, the management has guided 18-20% revenue growth on the back of double-digit growth in CSM (largely volume growth) and domestic formulations. The 20% growth that company is targeting will be achieved through improved operating leverage and the company has signifi cant headroom to improve the margin as well. The management expects to further improve net assets turnover from FY22 level of 2.1x with ramp-up of new products and improved processes. Further, PI delivered good set of numbers for 4QFY22 despite challenging times. Hence, we remain constructive on PI’s growth story and believe that the company has the capability to sail through challenging times and deliver sustainable growth, going forward. Further, due to the current volatility in equity market, the share price of PI has corrected by~25% from 52-week high. Thus, the valuation looks compelling at the current level. Hence, we recommend our investors to BUY the scrip with a target price of Rs. 3,203 from 1-year investment perspective. At CMP, the scrip is valued at P/E multiple of 33.3x on FY24E Bloomberg Consensus EPS of Rs 83.6.
Particulars (in Rs Cr) FY21 FY22 FY23E FY24E
Revenue 4,520.0 5,299.5 6,323.2 7,427.7
Growth (%) 36.7% 17.2% 19.3% 17.5%
EBITDA 988.3 1,142.4 1,403.1 1,697.6
EBITDA Margin (%) 21.9% 21.6% 22.2% 22.9%
Net profi t 718.0 843.8 1,040.1 1,218.6
Net Profi t Margin (%) 15.9% 15.9% 16.4% 16.4%
EPS (Rs) 48.5 55.5 68.7 83.6 Source: Bloomberg Consensus Estimates

22June 2022 INSIGHT
STOCK PICKS
Abbott India Ltd.
Company overviewAbbott India Ltd. (AIL) is one of the largest multinational pharma companies operating in India. It is a subsidiary of Abbott Laboratories of USA, which holds 75% stake in Abbott India. The company is engaged in the discovery, development, manufacture and marketing of pharmaceutical diagnostic nutritional and hospital products. The company has presence in both OTC drugs and formula-tions. The manufacturing facilities are located at Verna in Goa. It has outperformed the industry on a consistent basis in women’s health, GI, metabolic, pain management
and CNS among others. Its global products include: Brufen, Prothiaden, Thyronorm and Leptos. The company has four divisions. The Primary Care division markets products in the areas of pain management and gastroenterology. The Specialty Care-Methabolic and Urology divi-sion provides solutions in the areas of thyroid obesity diabetes and benign prostatic hyperplasia. The Specialty Care-Neuroscience division has var-ied specialty products in neurology and psychiatric segments. Hospital Care off ers products in the fi eld of anesthesiology and neonatology such as Forane Sevorane and Survanta.
Investment RationaleStrong 4QFY22 Results Abbott India reported a strong performance in 4QFY22 with the revenue and PAT witnessing a strong double-digit growth. Net revenue increased by 14.6% YoY to Rs. 1,255 crore from Rs. 1,095.5 crore in 4QFY21 and on QoQ basis, it increased by 2.5% from Rs. 1,224.4 crore in 3QFY22. Abbott’s revenue growth for 4QFY22 was higher than that of the IPM, owing to sustained momentum in acute therapies, which have a higher revenue share. EBITDA increased by 43% YoY to Rs. 293.8 crore in 4QFY22 from Rs. 205.5 crore in 4QFY21,
Company InformationBSE Code 500488NSE Code ABBOTINDIABloomberg Code BOOT INISIN INE358A01014Market Cap (Rs. Cr) 37,780Outstanding shares(Cr) 2.152-wk Hi/Lo (Rs.) 23934.45 / 15514Avg. daily volume (1yr. on NSE) 19321Face Value(Rs.) 10Book Value 1327.0
CMP: Rs 17,650 Rating: BUY Target: Rs 20,500
Promoters, 75.0%
DIIs, 7.5%FIIs, 0.2%Others, 17.3%
Shareholding Pattern as on March 2022

23 June 2022INSIGHT
while on QoQ basis, it increased by 9.2% from Rs. 269.1 crore in 3QFY22. EBITDA margin improved by 465bps YoY and 144bps QoQ to 23.4% in 4QFY22 compared to 18.8% in 4QFY21 and 22% in 3QFY22. Net profi t increased by 38.7% YoY to Rs. 211.4 crore in 4QFY22 from Rs. 152.5 crore in 4QFY21, while on QoQ basis, it increased by 6.1% from Rs. 199.2 crore in 3QFY22. Net profi t margin improved by 293bps YoY and 58bps QoQ to 16.8% in 4QFY22 from 13.9% in 4QFY21 and 16.3% in 3QFY22.
Diverse Product Portfolio & New Product Launch In order to expand its Indian market share, the company has been continuously launching new products. The company’s key brands include Duphaston, Thyronorm, Duphalac and Udiliv. The company has outperformed the market and maintained its leadership in these brands. Further, the company had launched 15 new products in FY21 and over 52 products (including line extensions) in the past three years. It has a healthy pipeline of products, which would unfold gradually, going ahead. It also developed strong OTC and vaccine franchises. Digene continues to be its popular consumer brand. Despite being a late entrant
in vaccines, it has developed strong operations in Infl uvac vaccine, which enjoys 10% market share. As per the management, the company is gearing up to introduce over 100 new prod-ucts in next 3-5 years. New product portfolio includes segments such as Women’s Health, Gastroenterology, Consumer Care, CNS, Metabolic, General Care and Vaccines. Presence in high-margin vaccine segment, eff orts to improve penetration, price revision of non-NLEM (National List of Essential Medicines) products and
product portfolio expansion would drive the company’s growth.
Top Brands to Drive GrowthAbbott India is one of the fastest growing listed pharma MNCs. It has outperformed the industry on a consistent basis in Women’s Health, GI, Metabolic, Pain Management and CNS among others. Its consistent revenue growth is backed by its strong brand equity. The IPM indus-try grew by 3.9%, while the company reported 14.8% YoY in 4QFY22. Major therapies such as Udiliv and Cre-maffi n Plus grew by 24.8% and 26.9% YoY, respectively while therapies such as Udiliv and Duphalac grew by 24.8% and 14.5%, respectively. The company’s top fi ve brands - (Mixtard, Thyronorm, Novomix, Udiliv and Duphaston) together posted revenue CAGR of ~6.6% MAT (March 2019-22). Thus, revenue growth has been driven by top brands. Currently, it has ~20 products, which appear in the list of top 500 domestic products. After a modest 1.6% YoY growth for FY21, IPM grew by ~16% YoY in FY22, largely backed by a low base. The IPM growth was also supported by 6.3% volume growth, while the pricing-led growth was at 5.4% and the share of growth from new launches stood at 3.8%. It is expected that future launches of new products from key divisions, along with brand extensions and access to innovative molecules from global parent to drive growth. Additionally, continuous new launches along with line extension in existing and new segments are also driving growth. Going ahead, the IPM is expected to witness a double-digit growth of ~10-12%, mainly led by improved access to healthcare, increased awareness and diagnosis of non-communicable diseases, new product launches and expansion of hospital infrastructure.
Healthy Cash Flow & Debt-free Balance Sheet Led by strong branded products and overseas parent company, the
Abbott India 3Yr. Price Chart
7500
9500
11500
1350015500
17500
19500
2150023500
25500
May
-19
Au
g-1
9
Nov
-N
ov-
No
19
Feb-
20
May
-20
Au
g-2
0
Nov
-N
ov-
No
20
Feb-
21
May
-21
Au
g-2
1
Nov
-N
ov-
No
21
Feb-
22
The company is gearing up to introduce over 100 new products in next 3-5 years. New product portfolio includes segments such as Women’s Health, Gastroenterology, Consumer Care, CNS, Metabolic, General Care and Vaccines.

24June 2022 INSIGHT
company has delivered a healthy fi nancial growth over the last fi ve years. While top-line clocked 11% CAGR over past fi ve years, com-pounding growth of EBITDA stood at 23% and net profi t witnessed com-pounding growth of 24% during the same period. Strong earnings growth and healthy operating cash fl ows over the years aided the company to maintain debt-free balance sheet. As of March 2022, the company has cash balance of Rs. 2,749 crore out of total Rs. 4,224 crore in the balance sheet. The company has maintained divi-dend payout in the range of 30% over the past fi ve years and has cash per share of Rs. 1,294 in 4QFY22. Further, the company has been maintaining a healthy RoE of 27% over the years. Continued new product launches, volume-led growth in top brands and intermittent price hikes provide comfort on return ratios front. Given, strong branded product portfolio and dominant market share in India, the company is expected to sustain such high growth in the coming years as well.
Key risks As pharmaceutical sector is highly
regulated sector, any adverse on
regulatory development could have negative impact on the company’s business.
Impact of substitution from the cheaper priced generic Aushadi or trade generics can impact its overall profi tability.
More products under price control.
ValuationAbbott India off ers brand portfolio of market leading products that align with long-term health care trends around the world. As per the industry estimates, the domestic
pharma industry is expected to grow in the range of 10-12% per annum. Strong parentage, dominant market share in domestic pharma market, strong branded product portfolio and healthy fi nancials augur well for the company. Double-digit growth in IPM is expected to sustain, going ahead driven by multiple growth drivers as well as a sizeable contri-bution from the acute therapies. This coupled with increasing geographic penetration and strong performance of its top brands is expected to drive growth. Moreover, Abbott India has shown strong fi nancial growth over the past fi ve years with healthy oper-ating cash fl ows aiding the company to maintain debt-free balance sheet and strong cash per share of Rs. 1,294. We expect the company to deliver healthy performance and command a premium valuation due to its sustainable business model backed by healthy growth prospects, debt-free balance sheet, healthy operating cash fl ows and strong dividend pay-out. Thus, we recommend our investors to BUY the scrip with target price of Rs. 20,500 from 1-year perspective. At CMP, the scrip is valued at P/E multiple of 34.7x of FY24E Bloomberg consensus EPS of Rs. 509.4.
Particulars (in Rs Cr) FY21 FY22 FY23E FY24E
Net Sales 4310.0 4919.3 5485.0 6115.8
Growth (%) 5.3 14.1 11.5 11.5
EBITDA 918.9 1087.7 1261.5 1437.2
EBITDA Margin (%) 21.3 22.1 23.0 23.5
Net profi t 690.7 798.7 943.4 1082.5
Net Profi t Margin (%) 16.0 16.2 17.2 17.7
EPS (Rs) 325.0 375.9 444.0 509.4Consensus Estimate: Bloomberg, Ashika Research
Abbott India has shown strong fi nancial growth over the past fi ve years with healthy operating cash fl ows aiding the company to maintain debt-free balance sheet and strong cash per share of Rs. 1,294.

25 June 2022INSIGHT
Monthly InsightPerformanceSince Jan-2019... Return @CAGR 21.4%
6000
8000
10000
12000
14000
16000
18000
20000
(2000000)(1000000)
01000000200000030000004000000500000060000007000000
Jan-
19Ap
r-19
Jul-1
9Oc
t-19
Jan-
20Ap
r-20
Jul-2
0Oc
t-20
Jan-
21Ap
r-21
Jul-2
1Oc
t-21
Jan-
22Ap
r-22
Net ProfProfPr it Nifty (RHS(RHS(R )
Ashika Insight Reco CAGR: 21.4%
Nifty CAGR: 12.1%
6236
551
6236
551
6783
630
6783
630
6780
638
6822
476
6822
476
(475
411)
(475
411)
(475
411)
(475
411)
(317
343)
(317
343)
(317
343)
(317
343)
(529
897)
(529
897)
(529
897)
(529
897)
(981
692)
(981
692)
(981
692)
(981
692)
(927
092)
(927
092)
(927
092)
(927
092)
(847
570)
(847
570)
(847
570)
(847
570)
(202
7276
)(2
0272
76)
5761
140
5919
208
6253
733
5801
938
5853
545
5974
906
4795
200
(3000000) (2000000) (1000000)
0 1000000 2000000 3000000 4000000 5000000 6000000 7000000 8000000
Nov
-21
Dec-
21
Jan-
22
Feb-
22
Mar
-22
Apr-
22
May
-22 (2
0272
76)
May
-22 (2
0272
76)
Booked Profit M2M Net Profit
6000
8000
10000
12000
14000
16000
18000
20000
(3000000)
(2500000)
(2000000)
(1500000)
(1000000)
(500000)
0
500000
1000000
Jan-
19
Apr-
19
Jul-1
9 Oc
t-19
Ja
n-20
Ap
r-20
Ju
l-20
Oct-
20
Jan-
21
Apr-
21
Jul-2
1 Oc
t-21
Ja
n-22
Ap
r-22
M2M Nifty (RHS)
(6000000)
(4000000)
(2000000)
0
2000000
4000000
6000000
8000000
10000000
Jan-
19
Mar
-19
May
-19
Jul-1
9 Se
p-19
N
ov-1
9 Ja
n-20
M
ar-2
0 M
ay-2
0 Ju
l-20
Sep-
20
Nov
-20
Jan-
21
Mar
-21
May
-21
Jul-2
1 Se
p-21
N
ov-2
1 Ja
n-22
M
ar-2
2 M
ay-2
2
Net Profit Invested Capital sted Capital
Booked Profit M2M
(6000000)
(4000000)
(2000000)
0
2000000
4000000
6000000
8000000
10000000
Jan-
19
Apr-
19
Jul-1
9
Oct-
19
Jan-
20
Apr-
20
Jul-2
0
Oct-
20
Jan-
21
Apr-
21
Jul-2
1
Oct-
21
Jan-
22
Apr-
22
Invested Capital Net Profit
0 2000 4000 6000 8000 10000 12000 14000 16000 18000 20000
(4000000)
(2000000)
0
2000000
4000000
6000000
8000000
10000000
Jan-
19
Apr-
19
Jul-1
9 Oc
t-19
Ja
n-20
Ap
r-20
Ju
l-20
Oct-
20
Jan-
21
Apr-
21
Jul-2
1 Oc
t-21
Ja
n-22
Ap
r-22
Invested Capital Net Profit Nifty (RHS)
* All Figures quoted in Rs.Calculated as on May 25, 2022

26June 2022 INSIGHT
Monthly Profi t & Loss Fact Sheet (Rs.) Date Invested Capital Booked Profi t M2M Net Profi t
31-Jan-19 1496513 0 (15549) (15549)28-Feb-19 2500555 0 (12120) (12120)31-Mar-19 3499100 0 87058 87058 30-Apr-19 4423753 77386 (8924) 68462 31-May-19 4843373 149734 (192232) (42498)30-Jun-19 5780649 212997 (312556) (99559)31-Jul-19 7280745 212997 (523193) (310197)31-Aug-19 6252245 237315 (318110) (80795)30-Sep-19 5638553 351653 (183965) 167688 31-Oct-19 3805452 689902 (279263) 410639 30-Nov-19 5300467 689902 (286815) 403087 31-Dec-19 6799062 689902 (159580) 530321 31-Jan-20 6506557 981148 (270658) 710490 29-Feb-20 5711903 1272382 (733289) 539092 31-Mar-20 7207537 1272382 (2755943) (1483561)30-Apr-20 7623497 356948 (1030982) (674034)31-May-20 6149806 833936 (1351330) (517394)30-Jun-20 7651620 833936 (956088) (122152)31-Jul-20 9152079 833936 (463266) 370670 31-Aug-20 8360481 1124891 (241678) 883213 30-Sep-20 7410397 1581629 (634208) 947421 31-Oct-20 6589893 1902621 (554750) 1347871 30-Nov-20 4415962 2580822 (272418) 2308404 31-Dec-20 4744368 2757455 (224457) 2532998 31-Jan-21 4512183 2992911 (360195) 2632716 28-Feb-21 4855257 3147357 (126852) 3020505 31-Mar-21 5103512 3388344 (151565) 3236779 30-Apr-21 4908741 3581795 (17805) 3563990 31-May-21 4608003 3892602 463903 4356505 30-Jun-21 2426006 4576540 266976 4843516 31-Jul-21 3924461 4576540 397901 4974441 31-Aug-21 1920864 5080743 (120808) 4959935 30-Sep-21 (97678) 5531501 137699 5669200 31-Oct-21 (1282290) 5785074 (23817) 5761257 30-Nov-21 (2236970) 6236551 (475411) 5761140 31-Dec-21 (2236970) 6236551 (317343) 5919208 31-Jan-22 (4317924) 6783630 (529897) 6253733 28-Feb-22 (2818510) 6783630 (981692) 5801938 31-Mar-22 (806543) 6780638 (927092) 5853545 30-Apr-22 1233766 6822476 (847570) 5974906 25-May-22 2733017 6822476 (2027276) 4795200
*Booked Profi t = Profi t booked after target achieved**M2M = Open position marked to market as on date***Net profi t = Booked Profi t + M2M P/L****Invested Capital = Stock investment as recommended (minus) Stock sold on target *****Calculation based on Rs. 5 lac invested on each stock recommended in our monthly insight on release date******All Figures quoted in Rs.****** Calculated as on May 25, 2022
27 June 2022INSIGHT
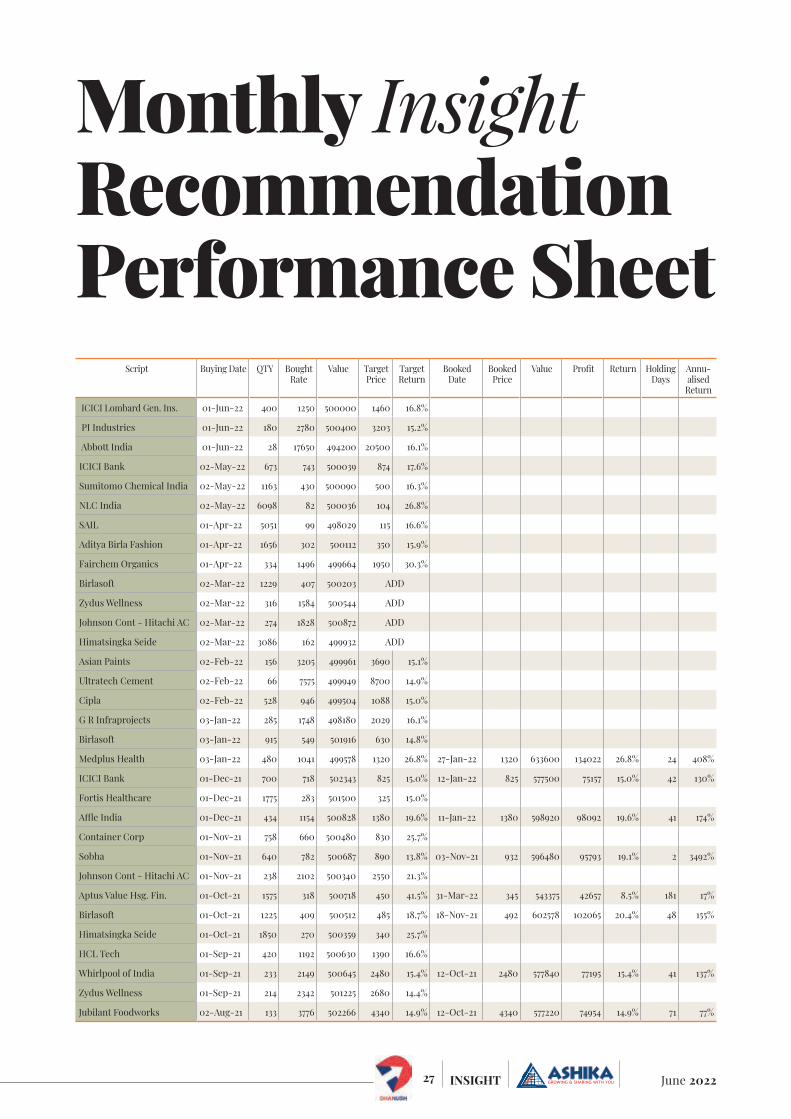
Script Buying Date QTY BoughtRate
Value TargetPrice
TargetReturn
BookedDate
BookedPrice
Value Profi t Return Holding Days
Annu-alised
Return
ICICI Lombard Gen. Ins. 01-Jun-22 400 1250 500000 1460 16.8%
PI Industries 01-Jun-22 180 2780 500400 3203 15.2%
Abbott India 01-Jun-22 28 17650 494200 20500 16.1%
ICICI Bank 02-May-22 673 743 500039 874 17.6%
Sumitomo Chemical India 02-May-22 1163 430 500090 500 16.3%
NLC India 02-May-22 6098 82 500036 104 26.8%
SAIL 01-Apr-22 5051 99 498029 115 16.6%
Aditya Birla Fashion 01-Apr-22 1656 302 500112 350 15.9%
Fairchem Organics 01-Apr-22 334 1496 499664 1950 30.3%
Birlasoft 02-Mar-22 1229 407 500203 ADD
Zydus Wellness 02-Mar-22 316 1584 500544 ADD
Johnson Cont - Hitachi AC 02-Mar-22 274 1828 500872 ADD
Himatsingka Seide 02-Mar-22 3086 162 499932 ADD
Asian Paints 02-Feb-22 156 3205 499961 3690 15.1%
Ultratech Cement 02-Feb-22 66 7575 499949 8700 14.9%
Cipla 02-Feb-22 528 946 499504 1088 15.0%
G R Infraprojects 03-Jan-22 285 1748 498180 2029 16.1%
Birlasoft 03-Jan-22 915 549 501916 630 14.8%
Medplus Health 03-Jan-22 480 1041 499578 1320 26.8% 27-Jan-22 1320 633600 134022 26.8% 24 408%
ICICI Bank 01-Dec-21 700 718 502343 825 15.0% 12-Jan-22 825 577500 75157 15.0% 42 130%
Fortis Healthcare 01-Dec-21 1775 283 501500 325 15.0%
Affl e India 01-Dec-21 434 1154 500828 1380 19.6% 11-Jan-22 1380 598920 98092 19.6% 41 174%
Container Corp 01-Nov-21 758 660 500480 830 25.7%
Sobha 01-Nov-21 640 782 500687 890 13.8% 03-Nov-21 932 596480 95793 19.1% 2 3492%
Johnson Cont - Hitachi AC 01-Nov-21 238 2102 500340 2550 21.3%
Aptus Value Hsg. Fin. 01-Oct-21 1575 318 500718 450 41.5% 31-Mar-22 345 543375 42657 8.5% 181 17%
Birlasoft 01-Oct-21 1225 409 500512 485 18.7% 18-Nov-21 492 602578 102065 20.4% 48 155%
Himatsingka Seide 01-Oct-21 1850 270 500359 340 25.7%
HCL Tech 01-Sep-21 420 1192 500630 1390 16.6%
Whirlpool of India 01-Sep-21 233 2149 500645 2480 15.4% 12-Oct-21 2480 577840 77195 15.4% 41 137%
Zydus Wellness 01-Sep-21 214 2342 501225 2680 14.4%
Jubilant Foodworks 02-Aug-21 133 3776 502266 4340 14.9% 12-Oct-21 4340 577220 74954 14.9% 71 77%
Monthly InsightRecommendation Performance Sheet

28June 2022 INSIGHT
Script Buying Date QTY BoughtRate
Value TargetPrice
TargetReturn
BookedDate
BookedPrice
Value Profi t Return Holding Days
Annu-alised
Return
Can Fin Homes 02-Aug-21 920 545 501193 650 19.3% 08-Sep-21 650 598000 96807 19.3% 37 191%
Arvind 02-Aug-21 4750 105 500083.7 135 28.2% 19-Oct-21 135 641250 141166 28.2% 78 132%
Tech Mahindra 01-Jul-21 455 1098 499537.7 1270 15.7% 06-Aug-21 1270 577850 78312 15.7% 36 159%
Hero Motocorp 01-Jul-21 172 2910 500519.4 3390 16.5%
Zee Entertainment 01-Jul-21 2310 217 500975.2 250 15.3% 14-Sep-21 250 577500 76525 15.3% 75 74%
Infosys 01-Jun-21 358 1402 502062.1 1610 14.8% 26-Jul-21 1610 576380 74318 14.8% 55 98%
HDFC Ltd. 01-Jun-21 195 2571 501426 2940 14.3% 27-Oct-21 2940 573300 71874 14.3% 148 35%
Natco Pharma 01-Jun-21 472 1060 500471.3 1230 16.0%
ICICI Bank 03-May-21 845 593 499800 720 21.4% 31-Aug-21 717 605696 105896 20.8% 120 63%
DCM Shriram 03-May-21 700 716 499833 840 17.3% 22-Jun-21 840 588000 88167 17.3% 50 126%
Indian Metals & Ferro Alloys
03-May-21 1125 445 499840 570 28.2% 22-Jun-21 551 619976 120136 23.9% 50 175%
Vardhman Textiles 01-Apr-21 375 1330 498785 1550 16.5% 12-Jul-21 1550 581250 82465 16.5% 102 59%
Kirloskar Oil Engines 01-Apr-21 2960 170 502879 208 22.4% 11-May-21 203 600051 97172 19.3% 40 176%
Amrutanjan Health Care 01-Apr-21 870 575 499864 670 16.6% 11-May-21 669 581900 82035 16.4% 40 150%
Divis Lab 01-Mar-21 147 3407 500807 3900 14.5% 27-Apr-21 3893 572315 71508 14.3% 57 91%
Supreme Industries 01-Mar-21 240 2068 496299 2350 13.6% 17-Sep-21 2350 564000 67701 13.6% 200 25%
Somany Home Innov. 01-Mar-21 1700 290 493763 370 27.4% 08-Jun-21 370 629000 135237 27.4% 99 101%
Infosys 02-Feb-21 390 1276 497754 1457 14.2% 12-Apr-21 1471 573869 76116 15.3% 69 81%
Kajaria Ceramics 02-Feb-21 595 839 499295 980 16.8% 16-Feb-21 972 578102 78807 15.8% 14 412%
Borosil Renewables 02-Feb-21 1810 276 500329 340 23.0% 09-Aug-21 340 615400 115071 23.0% 188 45%
BPCL 01-Jan-21 1312 383 502046 480 25.4% 02-Mar-21 469 615577 113531 22.6% 60 138%
Welspun India 01-Jan-21 7353 69 508230 84 21.5% 12-Mar-21 84 616623 108393 21.3% 70 111%
Kaveri Seed 01-Jan-21 962 525 504955 650 23.8% 10-May-21 649 624223 119268 23.6% 129 67%
Bosch 01-Dec-20 39 12842 500840 15200 18.4% 19-Jan-21 15174 591781 90941 18.2% 49 135%
Sumitomo Chemical 01-Dec-20 1750 286 501133 340 18.7% 02-Jun-21 340 595000 93867 18.7% 183 37%
Prestige Estate 01-Dec-20 1850 271 500563 312 15.3% 18-Feb-21 311 576201 75638 15.1% 79 70%
MRF 02-Nov-20 7 66042 462295 76588 16.0% 19-Nov-20 76456 535194 72899 15.8% 17 339%
Dixon 02-Nov-20 52 9586 498474 11268 17.5% 26-Nov-20 11249 584928 86455 17.3% 24 264%
Privi Speciality Chem. 02-Nov-20 910 549 499328 640 16.6% 21-Jan-21 639 581399 82071 16.4% 80 75%
Ultratech Cement 01-Oct-20 122 4095 499594 4543 10.9% 19-Oct-20 4535 553293 53699 10.7% 18 218%
Essel Propack 01-Oct-20 2025 248 501522 290 17.1% 11-Jan-21 290 586238 84715 16.9% 102 60%
Valiant Organics 01-Oct-20 168 2970 498946 3350 12.8% 09-Oct-20 3344 561832 62886 12.6% 8 575%
Mishra Dhatu Nigam 01-Sep-20 2400 209 502246 260 24.2% 30-Sep-21 191 457200 -45046 -9.0% 394 -8%
Hawkins Cooker 01-Sep-20 103 4852 499740 5890 21.4% 29-Dec-20 5671 584118 84379 16.9% 119 52%
Phillips Carbon Black 01-Sep-20 4275 117 501035 151 28.8% 25-Oct-20 148 630563 129527 25.9% 54 175%
Wipro 03-Aug-20 1770 282 499999 325 15.1% 05-Oct-20 325 574878 74880 15.0% 63 87%
Divis Lab 03-Aug-20 190 2644 502371 3050 15.4% 10-Aug-20 3058 581026 78654 15.7% 7 816%
Fine Organics 03-Aug-20 230 2177 500822 2470 13.4% 24-Aug-20 2466 567123 66300 13.2% 21 230%
ICICI Securities 01-Jul-20 1050 476 499818 620 30.2% 03-Jun-21 601 631050 131232 26% 337 28%
Apollo Tyres 01-Jul-20 4600 109 501341 130 19.3% 10-Aug-20 127 582498 81157 16.2% 40 148%
Galaxy Surfactants 01-Jul-20 335 1490 499300 1680 12.7% 04-Aug-20 1684 564130 64829 13.0% 34 139%
Nestle India 01-Jun-20 28 17571 491987 19500 11.0% 20-Aug-21 19500 546000 54013 11% 445 9%
Tech Mahindra 01-Jun-20 925 541 500453 ADD 29-Sep-20 774 715691 215238 43.0% 120 131%
Abbott India 01-Jun-20 30 16979 509375 19464 14.6% 02-Aug-21 19464 583920 74545 14.6% 427 13%
Bharti Airtel 04-May-20 985 508 500232 610 20.1% 20-May-20 606 597058 96826 19.4% 16 442%
Pfi zer 04-May-20 102 4934 503304 5800 17.5% 28-Jun-21 5600 571200 67896 13.5% 420 12%

29 June 2022INSIGHT
Script Buying Date QTY BoughtRate
Value TargetPrice
TargetReturn
BookedDate
BookedPrice
Value Profi t Return Holding Days
Annu-alised
Return
Bayer Cropscience 04-May-20 116 4287 497334 5425 26.5% 27-May-20 5281 612584 115251 23.2% 23 368%
ITC 01-Apr-20 2950 170 502363 ADD 17-Nov-21 240 708000 205637 40.9% 595 25%
Britannia Industries 01-Apr-20 184 2719 500320 ADD 29-May-20 3384 622704 122384 24.5% 58 154%
TCS 01-Apr-20 274 1827 500508 ADD 14-Sep-20 2480 679520 179012 35.8% 166 79%
HDFC Bank 01-Apr-20 586 852 499290 ADD 10-Nov-20 1361 797739 298450 59.8% 223 98%
Britannia Industries 02-Mar-20 164 3048 499888 3400 11.5% 29-May-20 3384 555019 55130 11.0% 88 46%
Aarti Industries 02-Mar-20 505 990 499799 1177 18.9% 05-May-20 1139 575018 75220 15.1% 64 86%
Metropolis Healthcare 02-Mar-20 263 1886 495946 2200 16.7% 23-Nov-20 2187 575165 79219 16.0% 266 22%
Bajaj Finance 03-Feb-20 115 4306 495178 5000 16.1% 01-Dec-20 4894 562761 67583 13.6% 302 16%
Gujarat State Petronet 03-Feb-20 2040 246 501493 300 22.0% 01-Apr-20 169 344168 -157325 -31.4% 58 -197%
Granules India 03-Feb-20 3600 140 502632 170 21.8% 07-Feb-20 164 591156 88524 17.6% 4 1607%
Concor 01-Jan-20 870 575 500239 665 15.7% 25-May-21 665 578550 78311 15.7% 510 11%
Mahanagar Gas 01-Jan-20 470 1066 501095 1164 9.2% 23-Jan-20 1162 546140 45045 9.0% 22 149%
SIS 01-Jan-20 1020 490 500147 568 15.8% 07-Feb-20 559 570119 69972 14.0% 37 138%
HDFC Life 02-Dec-19 875 571 499608 680 19.1% 17-Nov-20 671 586740 87133 17.4% 351 18%
Dr. Reddy’s Lab 02-Dec-19 171 2923 499818 3503 19.8% 07-Apr-20 3554 607713 107896 21.6% 127 62%
Just Dial 02-Dec-19 875 570 499170 750 31.5% 01-Apr-20 288 251615 -247555 -49.6% 121 -150%
IRCTC 01-Nov-19 561 893 500709 1170 31.1% 30-Jan-20 1158 649638 148929 29.7% 90 121%
PI Industries 01-Nov-19 350 1432 501323 1613 12.6% 07-Feb-20 1612 564109 62787 12.5% 98 47%
Procter & Gamble Hygiene 01-Nov-19 40 12325 492982 14078 14.2% 16-Apr-21 14026 561034 68052 13.8% 532 9%
HDFC Bank 01-Oct-19 405 1235 500212 1395 12.9% 10-Nov-20 1361 551339 51127 10.2% 406 9%
Indian Hotels 01-Oct-19 3130 160 500595 179 11.9% 01-Apr-20 74 230525 -270071 -53.9% 183 -108%
Siemens 01-Oct-19 330 1549 511213 1680 8.4% 23-Oct-19 1689 557420 46207 9.0% 22 150%
Gujarat Gas 01-Sep-19 2800 179 501501 200 11.7% 30-Oct-19 200 559048 57547 11.5% 59 71%
Hindustan Unilever 01-Sep-19 265 1888 500371 1975 4.6% 20-Sep-19 1957 518507 18136 3.6% 19 70%
Divi’s Lab 01-Aug-19 305 1636 498882 1750 7.0% 22-Oct-19 1757 535885 37003 7.4% 82 33%
ICICI Bank 01-Aug-19 1175 426 500234 473 11.1% 25-Oct-19 468 550206 49972 10.0% 85 43%
City Union Bank 01-Jul-19 2410 208 500935 254 22.2% 16-Jan-20 248 597005 96070 19.2% 199 35%
Reliance Nippon Life 01-Jul-19 2250 222 499773 265 19.3% 27-Aug-19 258 579510 79737 16.0% 57 102%
Sanofi India 01-Jul-19 87 5740 499387 6775 18.0% 29-Oct-19 6678 581029 81641 16.3% 120 50%
Asian Paints 01-Jun-19 346 1445 499797 1560 8.0% 02-Aug-19 1549 535985 36188 7.2% 62 43%
Axis Bank 01-Jun-19 614 812 498614 905 11.4% 18-Oct-21 820 503480 4866 1.0% 870 0%
Honeywell Automation 01-Jun-19 19 26087 495655 30195 15.7% 25-Oct-19 29105 552999 57344 11.6% 146 29%
MCX 01-May-19 575 868 499354 1005 15.7% 30-Aug-19 971 558147 58793 11.8% 121 36%
TCS 01-May-19 220 2259 496953 2490 10.2% 14-Sep-20 2480 545600 48647 9.8% 502 7%
Crompton Greaves Cons. 01-Apr-19 2138 234 501153 256 9.2% 20-Sep-19 251 536681 35528 7.1% 172 15%
Equitas Holdings 01-Apr-19 3637 138 500875 191 38.7% 01-Apr-20 42 152499 -348375 -69.6% 366 -69%
Page Industries 01-Apr-19 20 25219 504373 29080 15.3% 14-Aug-19 17525 350506 -153867 -30.5% 135 -82%
ITC 01-Mar-19 1800 278 500089 319 14.8% 13-Sep-21 215 387000 -113089 -23% 927 -9%
Tech Mahindra 01-Mar-19 605 824 498456 960 16.5% 29-Sep-20 774 468101 -30356 -6.1% 578 -4%
HDFC Bank 01-Feb-19 240 2101 504338 1204 -42.7% 20-May-19 2403 576686 72348 14.3% 108 48%
Pfi zer 01-Feb-19 163 3066 499703 3490 13.8% 20-Sep-19 3389 552433 52730 10.6% 231 17%
Abbott India 01-Jan-19 65 7593 493527 8580 13.0% 11-Jun-19 8566 556790 63263 12.8% 161 29%
Indraprastha Gas 01-Jan-19 1850 273 504362 315 15.5% 08-Apr-19 314 581748 77386 15.3% 97 58%
United Spirits 01-Jan-19 800 623 498624 735 17.9% 14-Feb-20 711 568576 69952 14.0% 409 13%

30June 2022 INSIGHT
PHARMA SECTOR: GOVERNMENT FOCUS ON IMPROVING HEALTHCARE SECTOR
SECTOR OUTLOOK
During the pre-COVID time, Indian pharma sector was battling with multiple challenges such as steep price erosion in generic drugs in the US, increasing number of generic
approvals by the US FDA, frequent regulatory inspection on plants and muted domestic demand in both chronic and acute segments. Such challenges started to refl ect on their subdued earnings growth, with which several pharma companies witnessed sharp erosion in their market value. The companies, which have greater exposure to the US and much dependent on US revenue, witnessed more price correction compared to those companies, which are India and emerging market focused and more diversifi ed. However, COVID-19 has changed the fortune of Indian pharma companies to large extent. The last two COVID years have been spectacular for these pharma companies, though during this time, their non-COVID portfolio was in pressure due to restriction on movement. During this COVID pandemic, the government realized that India lags in healthcare infrastructure and there is need for lot of improvement and up-gradation
to bring it at par with global standard. During COVID time, the US, which is the largest drug market, was focused on maintaining adequate medicine supply to avoid any shortages. Indian companies leveraged on this opportunity and tried to bridge pent-up demand by up-scaling manufacturing operations. On an average, the US wholesale drug inventory rose by ~15% YoY in October 2020 and remained stable thereafter. Besides,
inspection by the US FDA was also halted due to travel restrictions. Thus, the Indian generic companies capitalized on these opportunities. Further, they increased their COVID portfolio by in partnership with foreign drug companies and got the license to manufacture COVID drugs and vaccines, which boosted their earnings during that time. However, it is now expected that India’s healthcare space could witness large investments over the next few years in the post-COVID era, as the government is focused on improving the healthcare infrastructure, going ahead. Indian pharma market is valued at Rs. 1.7 trillion and has clocked 10% CAGR over the last fi ve years, making the country one of the fastest-growing markets globally.
The companies, which have greater exposure to the US and much dependent on US revenue, witnessed more price correction compared to those companies, which are India and emerging market focused and more diversifi ed.

31 June 2022INSIGHT
Improved healthcare infrastructure across India and better resource availability are driving this growth. Nonetheless, still now, the healthcare penetration in India is at low compared to the global average and that would provide immense growth opportunity for the pharma companies. Going forward, improved access and surge in lifestyle diseases will drive the growth for Indian pharma companies. Further, the companies, which are diversifying their product basket and moving up the complexity curve in terms of specialty drugs, complex generics, biosimilars and immune-therapy, will be in better place in the US generic drug market and will be less impacted due to generic price erosion in the US.
Better Penetration to Drive Growth Indian Pharma market is valued at Rs. 1.7 trillion and clocked 10% CAGR over the last fi ve years. Improved healthcare infrastructure across India and better resource availability are driving this growth. But healthcare penetration continues to remain low compared to global average. Indian pharma market is highly fragmented with Top-10 companies accounting for ~44% market share and in terms of regions, the market is skewed towards metros/Tier-I cities, which account for ~65% of total revenue. The benefi ts of Indian pharma sector have been immense, as the sector accelerates its pace to meet the growing domestic and global demand for vaccines and pharmaceutical drugs. COVID outbreak had led to a demand surge for pharma products, while the companies also launched many brands to help India sail through the crisis. Pharma companies remain committed to achieving profi table growth in India and in line with the government’s guidelines. The COVID-19 pandemic helped the pharma sector to surge ahead in terms of growth in India, but it also exposed its limitations. The surging demand also catalyzed the rapid transformation of this sector into a more digitized and modernized entity and helped this sector to emerge stronger in developing medicines, vaccines and therapies. Indian pharmaceutical sector has proved its prowess to the world during the challenging times of the pandemic by supplying 60% of global COVID-19 vaccine. During the pandemic, the government came to realize that India’s healthcare infrastructure needs massive up-gradation to bring it at par with global standard. The centre is also planning to increase its healthcare spending to 3% of GDP. Healthcare sector is witnessing expansion by existing hospitals in terms of new services through technology platforms, investment in next-generation tools for diagnosis, tie-ups with insurance companies and geographical expansion with focus on providing world-class medical care at aff ordable cost. The sector is also attracting fresh investment from domestic as well as international investors to fund expansion by existing large hospital chains and green-fi eld projects. In order to boost indigenous production of pharma intermediates and molecules, the government announced PLI scheme for API/bulk drugs. The government has
announced incentive of setting up of two categories of pharmaceutical products including biopharmaceuticals, complex generics, patented drugs (nearing expiry), bulk drugs and intermediates. The government emphasizes on developing country’s healthcare system will create incremental demand for drugs and thus, will help in increasing penetration of pharma drugs.
Pharma PLI to Boost GrowthLoopholes in Indian healthcare system were exposed during the COVID pandemic, when the country faced the shortfall of drugs amid supply disruption due to lockdown across the globe. The lockdown across the globe
Countrywise healthcare access and quality score
Source: Industry report
0 20 40 60 80 100
Taiwan
UK
Germany
US
China
India
Russia
IPM therapy-wise market share (%)
Source: Industry report
14.3%13.0%
11.6%
9.4% 9.0%7.6%
6.8% 6.4% 5.9%4.8%
1.8% 1.6% 1.8% 1.2%
4.8%
An
ti-In
fect
ives
Ca
rdia
c
Ga
stro
An
ti-D
iabe
tic
VM
N
Res
pira
tira
tir
ory
Pai
n/A
nal
gesi
cs
Der
ma
tolo
gy
Neu
ro/C
NS
Gyn
eco
log
ical
An
ti-N
eopl
ast
ics
Op
htha
lmic
Hor
mo
nes
Vac
cine
s
Oth
ers
IPM therapy-wise market size in 2021 (Rs bn)
Source: Industry report
92
41 3931 29
2011 10
An
ti-In
fect
ives
An
ti-D
iabe
tic
Vit
amin
s/
Min
eral
s/
Nut
rietrie
trnt
s
Pai
n/
An
alge
sics
Ga
stro
inte
stin
al
Ca
rdia
c
Res
pira
tira
tir
ory
Gyn
aeco
log
ical

32June 2022 INSIGHT
jeopardized the supply system, which impacted import of key pharma intermediates. Further, escalation of border dispute with China also made the Indian government more proactive in boosting indigenous manufacturing, as India imports ~68% of APIs from China. Hence, the government announced PLI scheme for promotion of domestic manufacturing of critical materials, drug intermediates and APIs. The PLI scheme is a step in right direction, which will act as a catalyst for evolving landscape. China+ strategy seems to be playing out well for the contract manufacturers and API companies. The shift is driven by an escalation in Chinese selling prices and resultant reduction of price gap of Indian products vs. Chinese products. The government is implementing the PLI scheme for pharma sector with a total outlay of ~Rs. 25,000 crore, which includes Rs. 6,940 crore for bulk drugs, Rs. 3,420 crore for medical devices and Rs. 15,000 crore for pharmaceuticals. The scheme is designed to increase domestic manufacturing of bulk drugs, medical devices and pharmaceuticals and create global champions in the fi eld of pharmaceuticals and medical devices. PLI scheme for bulk drugs, approved by the union cabinet in the year 2020, is the fl agship scheme that aims to attain self-reliance and reduce import dependence of critical KSMs/DIs/APIs and attract large investments in API sector. After two rounds of inviting applications, total 49 projects have been approved for 33 critical APIs with a committed investment of Rs. 3,685 crore. The government has also informed that against a notifi ed quantity of ~44,000 MT of annual production capacity of these APIs, the industry has responded very well with the committed production capacity of 83,270 MT. For several APIs in segments such as antibiotics and vitamins, India is almost completely reliant on Chinese imports. High dependence on China led to initiation of several measures by the Indian government to boost API manufacturing in India to lower overdependence on China. Thus, it is expected that the government is in right direction and the PLI scheme will boost India’s pharma sector growth, going ahead.
NPPA Allows Price Hike to Ensure Stable Margin The National Pharmaceutical Pricing Authority (NPPA) has allowed the Indian pharmaceutical companies to hike prices by 10% or as per the WPI, whichever is lower every year for the products that are governed under NLEM (National List of Essential Medicines). For non-NLEM products, the companies are able to hike prices up to 10% every year. Rise in WPI infl ation helped the companies to undertake 10.77% price hike on the portfolio that is under the price control in India. There are >800 drugs under the (NLEM), which witnessed price hike since April 2022. The NLEM list includes drugs like paracetamol, antibiotics like azithromycin, anti-anaemia drugs, vitamins and minerals. Some drugs used for treating moderately to severely ill COVID-19 patients and steroids are also included in the list. As the pharma sector has been under severe pressure of high raw material cost, price hike to the tune of 10.7% will provide some respite on margin front. Over the last 2 years, the prices of some key APIs increased in the range of 15-130% with the price of paracetamol increased by 130%. Likewise, the prices of excipients have risen in 18-262% range. The prices of glycerin and propylene glycol, solvents used in every liquid preparation including syrups, oral drops and sterile preparations have skyrocketed by 263% and 83%, respectively. The basket of drugs under price control, which accounts 16% of total Indian pharmaceutical market, witnessed 10% price hike. Hike in drug prices will help the pharma companies to pass on the higher input cost to customers in order to sustain stable margin.
Companies in Complex Generics Biz in the US to Benefi t MostThe global prescription generic drug market size was estimated at US$74bn in 2020 and remained fl at over the last 2 years on the back of price erosion, rising competition and stringent regulatory framework. Indian generic pharma companies having exposure to the US (the largest pharma market) have been tweaking their business model and start foraying in complex
India’s API import by country
Source: Industry report
China, 68%US, 4%
Italy, 3%
Singapore, 3%
Hong Kong, 2%
Other, 20%
Cost comparison between India and China
Source: Industry report

33 June 2022INSIGHT
generic drugs, injectables and bio-similars, where the competition is less and thus less prone to price erosion risk. FY22 was a challenging year for most pharma companies due to higher supply. However, the companies were largely able to grow and maintain margin profi le above FY20 levels. Going ahead, drugs worth US$214bn are at risk in the US, given losing patent protection in the next 4 years. This along with the complex generic pipeline and bio-similars may prop growth in next 2-3 years. ANDA fi llings with the US FDA have started sliding since its peak in 2018. The companies have also exited the products that faced higher price erosion or unviable for manufacturing. However, the concerns like price erosion and regulatory inspection were temporarily halted during the COVID pandemic, as the countries across the globe, including US focused on maintaining adequate medicine supply to avoid any shortage. On an average, US wholesale drug inventory rose by 15% YoY in October 2020 and remained stable thereafter. Besides, the US FDA inspection was halted due to travel restrictions. Indian pharma companies are well-placed to leverage on this opportunity and bridge pent-up demand by up-scaling manufacturing operations. Despite of such headwinds, the US continues to remain the key focus region for the companies due to higher incremental sales potential owing to patent loss and preference for generic drugs given rising healthcare cost. Indian companies remain hopeful and stay invested in the US owing to better price realization and higher per capita healthcare spending.
Injectables & Bio-similars Throw Huge OpportunityConcerns such as price erosion and regulatory inspection have been adversely impacting the US business of Indian pharma companies. Thus, the Indian pharma companies are focusing on strong R&D to diversify its business to injectable and bio-similar. Global injectable market has grown at a higher pace compared with overall global pharmaceuticals market over the past fi ve years, led by rising adoption of injectable drugs for chronic diseases such as cardiovascular diseases, autoimmune and infl ammatory diseases, cancer and other infectious diseases. The US injectable market, which is pegged at US$502bn, is expected clock 8% CAGR to reach US$700bn in the next fi ve years. The generic injectables market in the US is concentrated among a few players, with the Top-3 players enjoying 57% volume share and the Top-7 players accounting for ~50% of value market share. Frequent manufacturing-related issues created shortage of injectable products in the US. Nearly 66% of total drug shortages in the US are injectable products. Apart from injectable, bio-similar is another area, which could provide immense scope of growth. Bio-similar market is expected to reach US$75bn from ~US$17.9bn by 2030 with 15% CAGR over 2020-2030. At 127, India has the highest number of globally-approved bio-similars. The US and Germany have ~71 approvals. Oncology and autoimmune segments witnessed most bio-similar launches in the US. Hence, diversifying into injectables and bio-similars will provide the next leg of growth for Indian pharma companies.
ANDAs fi lling in US has slowed down
Source: Industry report
153 173
249
373
218 224274
215170 177
FY12
FY13
FY14
FY15
FY16
FY17
FY18
FY19
FY20
FY21
Number of ANDAs
US continues to the largest pharma market in the world (market size in USD bn)
Source: IQVIA
528
180
2388
12
134
16 29 21 18
US EU
Cana
da
Japa
n
Aust
ralia
Chin
a
Sout
h Ko
rea
Braz
il
Indi
a
Russ
ia
US continues to be the largest injectable market (USD bn)
Source: Industry report
0
50
100150
200
250300
350
US Europe Asia-Pacific Middle East &Africa
South America
CY20 CY25E
Regulatory Approval declined during COVID times
Source: Industry report

34June 2022 INSIGHT
Post COVID Resumption of US FDA Inspection – Near-term Setback After 2 years of COVID-19 pandemic, the US FDA resumed its onsite inspections of drug manufacturing units outside its borders including China and India. It has been following this practice to make sure that all the medicines, which enter into the US follow the set standards. Most inspections were put on hold in March 2020, when the world was hit by the pandemic. Indian pharma companies, on their part, try to adhere to the norms as any departure may hit their exports. According to the US FDA, Form 483 is issued to the management of the fi rm being inspected. It is issued at the end of the inspection if the investigators come across anything that might constitute violations of the Food Drug and Cosmetic Act and related Acts of the US. Observations are made when the investigators fi nd that the conditions
or practices observed indicate that any food items, drugs, devices or cosmetics have been adulterated. The company, which has been inspected, is supposed to respond to the Form 483 in writing along with its corrective action plan. The US FDA expects that the company will implement the stated plan subsequently. Thus, the resumption of US FDA inspection could pose a near-term risk for those companies, which have some compliance issue in their manufacturing process.
The Indian pharma companies have been witnessing multiple challenges during the last few years starting from price erosion in generic drug in US, frequent US FDA inspection and supply disruption due to COVID curbs and geo-political issue between Russia and Ukraine. Supply disruption on the backdrop of higher freight rates, availability of container and port congestion pushed the price of basic raw materials to elevated levels, which aff ected their margin. However, NPPA allows the pharma companies to take price hike to the tune of 10.7% on the backdrop of high commodity infl ation to ensure stable margin. During the pandemic, Indian pharma companies were benefi tted from prescription drug stocking and better pricing. However, the headwinds like price erosion in US, regulatory inspection and higher raw material prices weigh on pharma companies’ earnings growth, which resulted in sharp fall in their market value. The concerns over margin sustainability catalyzed a correction in the BSE Healthcare Index, which now trades at near 10-year average forward P/E multiple. However, the pharma companies started diversifying their business model by entering into complex generics, injectables and bio-similars, which have less pricing competition. As the US is the largest drug market in the world, there are huge scope of growth for injectables and bio-similars, while the pricing pressure will continue in generics business. Hence, it is believed that the next leg of growth will be driven by injectables and bio-similars. Further, as the equity market turns volatile, the investors prefer defensive sector like pharma, which has a stable business model and healthy balance sheet to withstand any type of fi nancial shocks. Further, as the pharma sector didn’t participate in the rally in last 2 years, the valuation also appears to be compelling given the earnings growth potential.
Pharma Peer SetCompany Name Mcap
(Rs crs)Revenue (Rs crs)
EBITDA (Rs crs)
PAT (Rs crs)
EBITDA Margin
(%)
PAT Margin
(%)
ROE (%)
1 Yr Forward P/E (x)
1 Yr Forward
P/Bvps (x)
1 Yr For-ward EV/
EBITDA (x)Sun Pharmaceutical Industries 219,659.1 33,139.2 8,467.7 2,284.7 25.6 6.9 5 25.9 3.7 17.7 Aurobindo Pharma 32,686.6 24,558.0 5,333.4 5,389.2 21.7 21.9 23 10.0 1.2 6.0 Cipla 78,958.9 21,623.4 4,552.8 2,559.5 21.1 11.8 12 20.5 2.9 12.2 Dr. Reddy's Laboratories 70,669.4 20,514.4 3,767.7 2,112.2 18.4 10.3 11 18.1 2.8 11.2 Lupin 29,015.5 16,192.8 218.8 (1,509.7) 1.4 -9.3 -12 16.3 1.9 9.2 Glenmark Pharmaceuticals 11,495.5 10,806.0 2,084.4 970.1 19.3 9 11 8.5 1.0 5.3 Divi's Laboratories 114,326.7 8,959.8 3,881.9 2,960.5 43.3 33 25 31.6 6.3 22.0 Ipca Laboratories 25,091.4 5,420.0 1,544.4 1,148.8 28.5 21.2 22 20.2 3.7 15.0 Abbott India 38,190.1 4,919.3 1,087.7 798.7 22.1 16.2 28 35.7 N/A 25.2 Gland Pharma 50,528.3 4,400.7 1,510.2 1,211.7 34.3 27.5 17 25.5 4.5 19.2 Sanofi India 15,159.8 2,956.6 762.5 944.4 25.8 31.9 42 N/A N/A N/APfi zer 19,909.4 2,611.0 835.7 612.6 32 23.5 21 N/A N/A N/A
Source: Ace Equity & Bloomberg
Number of biosimilar approvals in FY21
Source: Industry report
0
20
40
60
80
100
120
140
Indi
a
Germ
any
USA
Russ
ia UK
Fran
ce
Italy
Chin
a
Spai
n
Japa
n
Braz
il
In US there has been shortage in injectables (%)
Source: Industry report
45%63% 58% 55%
39%50%
66%
55%37% 42% 45%
61%50%
34%
CY15 CY16 CY17 CY18 CY19 CY20 CY21
Injectables Non-injeinjein ctables

35 June 2022INSIGHT
Q4FY22 Management Earning Concall
MANAGEMENT CONCALL
State Bank of India State Bank of India (SBI) clocked
highest ever profi t in FY22.
Retail personal book stood at Rs.10,000 crore, clocking a 3-year CAGR of 16%.
The bank was to contain credit cost at 0.55% in FY22, and clocked improvement of 57bps YoY.
As the bank remains focused on maintaining asset quality, and quality of loans with 89% of corporate book remaining investment grade its book continues to remain healthy.
More than 95% of transactions routed through alternative channels. Adoption of Yono has signifi cantly increased. SBI moving towards Yono 2.0 across multiple geographies.
The bank aims to increase market share in advances with focus on current account deposits in order to improve CASA ratio.
About 74% loan book is linked to MCLR (41%), EBLR mainly repo (23%) or T-Bills (11%).
Smaller loan book improved in terms of slipping to NPA. Even for restructured book, SMEs have Rs.12,000 crore outstanding out of Rs.30,000 crore in total book and the NPA level at Rs.721 crore is much
better than the general trend. The bank witnessed net decline in NPAs across all retail segments. Even for SMEs, the NPA run-rate is better than pre-COVID levels and bank hasn’t witnessed any geographical concentration.
Restructured book: OTR 1 and 2 stand at Rs. 30,960 crore and another Rs. 7,000 crore pertains to earlier book and there is no overlapping. For Rs. 15,000 crore(50% of book), moratorium has ended and repay-ment has started. In home loans, the people are paying as per original repayment schedule without availing restructuring.
Slippages from ECLGS are <2% and outstanding stand at Rs. 32,000 crore.
Working capital unutilized limit stands at Rs. 2,76,000 crore, while unutilized limit stands at 46%. Situ-ation improved on sequential basis, with which unutilized limit declined from Rs. 3,20,000 crore. There is some visibility on proposals pro-cessed by the bank. Un-availed term loans, which was >Rs. 2,10,000 crore, declined to Rs. 2,00,000 crore.
Slippages break-up of Rs. 2,845 crore: Corporate: Rs. 1,200 crore, Agriculture: Rs. 1,200 crore and rest Retail &SMEs. One large corporate account has been fully provided.
Yield on advances is stable and going forward, it will improve as 74% is linked to benchmarks. Loan book linked to T-bills stands at 11%. Yield will improve as re-pricing happens.
Investment depreciation: Part of this was on security receipts (SRs) and the bank has fully provided for the outstanding amount of Rs. 7,980 crore. Rs. 2,000 crore is on account of SRs and also NPAs have been provided with. Out of Rs. 14 lakh crore of treasury, AFS book stands at Rs. 5 lakh crore with duration of 2.08 years and majority of the rest is HTM, which will be benefi ted by increasing yields. There was no MTM provision-ing as of 31st March 2022.
State Bank of India: The bank aims to increase market share in advances with focus on current account deposits in order to improve CASA ratio.

36June 2022 INSIGHT
The bank will endeavor to keep credit cost at 1%. It operates in a macro scenario, which is uncertain. However, eff orts are onto minimize it.
Fee income: One important lever is forex income, which has come up and cross-selling income is expected to be higher by 32% and the bank will utilize this opportunity, going ahead. While processing fee was tepid in FY22, the bank hopes to see better numbers with pick-up in credit.
Loans sold to ARC: In 4QFY22, there were 8 accounts and recovery was Rs. 297 crore. In FY22, there were 23 accounts and recovery was Rs. 1,188 crore and cash stood at Rs. 1,105 crore. Much of these accounts are provided for.
Contingent provisioning has now been made available to restructured book for prudential provisioning. Additional provisioning for restruc-tured accounts stands at Rs. 7,122 crore.
The bank disbursed Rs. 1,54,000 crore in 4QFY22, which was spread out.
Co-lending: These are early days and perhaps the bank will see upside in FY23. SBI has entered into part-nerships in last quarter and made technical collaborations. It aims business to the tune of Rs. 10,000 crore in FY23.
Future group: 100% provision-ing already made on debt and investments.
SME book: The bank witnessed strong YoY growth of 30% and will see growth, going ahead. The bank is upgrading delivery process in SME, which will help it on credit growth front. The management doesn’t see any pressure on pricing.
Margin outlook: Deposit interest rates move up with a lag. As 74% book is linked to benchmarks, the bank is expected to see improvement in NIM.
US$1bn loan to Sri Lanka: As this is guaranteed by the Government of India, there is no inherent risk.
AUCA recovery: The bank sees recovery run-rate of Rs. 8,000 - 10,000 crore.
Yono: 26,000 savings accounts opened on daily basis, MF sales Rs 1548 cr, Rs 11.36 lakh insurance policies sold. Loan book stands at Rs. 25,000 crore.
Express credit is a product, which is on revolving basis. Target universe stands at 1.72 crore customers and still growing. Current penetration stands at 27%, but there are unex-plored customer segments.
Asian Paints Ltd. Volume growth was aff ected in
Jan’22 due to Omicron COVID wave. High double-digit volume growth was witnessed in Feb’22 and Mar’22. The company is satisfi ed to have regis-tered 8% volume growth in 4QFY22 on a high base.
Tier-I and Tier-II cities registered double-digit volume growth much better than the rest of the country. Regionally, Western and Eastern India did better.
Tier-III and Tier-IV cities wit-nessed down-trading due to price hike in the excess of 20%. Tier-III and Tier-IV cities have a larger share of revenue contribution compared to Tier-I and Tier-II.
In 1QFY23, the company witnessed 5-7% QoQ rise in input cost, for which it took price hike of 1.8-2%. In contrast, increase in raw material cost was small in 4QFY22.
The company plans to use alter-nate RM (especially for Titanium
Dioxide) to mitigate infl ationary pressures.
Super economy emulsions will help in transition of customers to organized market from unorganized.
The management expects Sleek business to become profi table in FY23.
International business was aff ected due to currency devaluation in Sri Lanka, Egypt and Ethiopia, which is likely to continue. These three countries account for 40-45% of the company’s international business, which accounts for 11-12% of its consolidated numbers.
New products contributed 14% to total sales. Most new products are based on technological superiority.
Asian Paints aims to aggressively foray into several home improvement categories.
The company targets for 70 ‘Beau-tiful Homes’ stores by the end of FY23 from the current count of 29 stores.
‘Beautiful Homes’ services are being executed for 900-1,000 customers across India till date.
Home décor forms 4% of its overall decorative business and the manage-ment targets to increase the same to 8-10% in next few years.
Kitchen equipment/bath business posted >Rs.1bn sales each for third consecutive quarter/second consec-utive quarter, respectively. While the former is still a loss-making business, the latter has become profi table. The management expects the kitchen equipment business to turnaround in FY23.
For Home Improvement business, the company has recruited mid and senior level management across functions (sales, marketing, designers and architects).
The management stated that near-term demand conditions remain challenging given the macro-eco-nomic factors. However, the manage-ment is enthused by its performance in Feb-Mar’22.
Asian Paints will use dual selling
Asian Paints: The company plans to use alternate RM (especially for Titanium Dioxide) to mitigate infl ationary pressures.

37 June 2022INSIGHT
strategy for Home Improvement segment: (1) Beautiful Homes stores will sell 12-16 categories of products; (2) Dealers and distributors will sell 1-2 category of products particularly for Kitchen and Bath. The company sells fabrics through 500 retail touch points.
In FY22, Tier-I and Tier-II cities (40-45% revenue) grew faster (driven by customer migration from rural to urban) compared to Tier-III and Tier-IV cities (60-65% revenue).
In Home Improvement busi-ness, the company looks forward to increase backward integration through acquisitions.
Going forward, the company targets to maintain gross margin and EBITDA margin in the range of 41-42% and 18-20%, respectively.
Lakshmi Machine Works Ltd. Order book stands at Rs. 6,800
crore, which is to be executed in next 16-20 months.
A lot of end-to-end projects are getting matured, which is resulting in higher order infl ows.
The company witnessed 100% increase in exports, as overseas markets are doing well.
As the company experienced huge increase in input cost, it hiked the price.
While there was cost stabilization in 3QFY22, logistics and raw materials cost increased in 4QFY22.
PLI scheme has been published for textiles and there is traction in textile space.
Cotton prices are getting higher, which is a challenge for the textile industry. However, the management doesn’t believe it as a long-term shift. Moreover, the government has also taken initiatives to lower duties. Further, the customers are also planning for the long-term, which can be understood from their strong interest in PLI scheme.
Currently, the company is operat-ing at full capacity.
The management is ensuring more deliverables to continue in future.
China turnover stood at Rs. 221 crore, while margin reached break-even.
In 4QFY22, the company opened LMW Middle East assembly unit and will begin full operations by Jun’22.
MTD division has done well and sold 3,250 machines.
After compression in order booking over the last 3 years, the company saw surge in order intake in last one year. The management is unsure whether it will continue. However, as most customers have committed, the company expects will see moderate growth in orders in current year albeit repeat orders will be lower. PLI scheme is positive and will support order booking on consistent basis, while higher cotton prices remains a challenge, which will ease after new cotton hit the market place.
As margin declined to single-digit, the company hiked the prices in Oct’20and Dec’21, the full impact of which will be felt in 2QFY23.The scenario has changed in last 2-3 months. Though the commodity prices are higher and it is diffi cult
to put timeline when it will ease, the management is working on either to pass on or absorb or a combination of both. Further, as currency has also weakened, some part of cost infl ation needs to be passed on to customers.
Order book mix: 10% of order book is exports (including LCs) and 90% is domestic.
3 Risks: (1) supply chain issues in electrical electronics owing to shut-down in China; (2) higher logistics cost;(3) raw materials unavailability. The company aims to plan better but there are certain issues diffi cult to overcome albeit the company is man-aging the situation well as of now.
TMD division: It sold 2mn spindles in FY22.Spindles sale in FY21 was 42-45% lower than FY22.
Order book of Rs. 680 crore belongs to exports (10%).
Capex: As the management sees rise in orders on MoM basis, it has set out capex plans for future growth.
Machine Tools: Operational fl oor space increased last year and there is legroom for another 25% through capex. The company is prepared with manpower and space to meet the increased demand from PLI scheme
Textile industry is at infl exion point and best is yet to come. The industry underwent challenges in last 4-5 years with regard to customer funding, raw material availability, markets. from the government schemes like ROTP and aligning of GST rates are encouraging along with China+1 factor. Demand has come back to India because of all these factors and the spinning industry is gaining stability. Customers remain committed, which is refl ected in order book. FTAs with Australia and the UAE will also support the indus-try in future. As long as the industry is doing well, the company will be on strong footing.
Order execution cycle remains at 18 months after an order is placed.
Advance Technology Center: Order book on exports side is for 4-5 years. The company was able to bring
Lakshmi Machine Works: Cotton prices are getting higher, which is a challenge for the textile industry. However, the management doesn’t believe it as a long-term shift. Moreover, the government has also taken initiatives to lower duties.

38June 2022 INSIGHT
down the loss in 4QFY22 and targets to reach breakeven. Its order book stands at Rs. 350 crore. COVID has taken a toll, owing to which orders got pushed back.
Spinning machines have long lifespan of 10-15 years and sometimes 20 years.
The company enjoys a strong 73% market share in India.
New products: The company has pipeline of products, which will commercialize in the current year.
PLI focuses on man-made as well as technical textiles. The company’s machines are capable of handling both.
Titan Company Ltd. The company has delivered
encouraging set of numbers despite lockdown owing to COVID third wave and ongoing geo-political issues, which started on February 24 aff ecting oil and gold prices.
The company ended FY22on a good note and its preparation is very ambitious forFY23.FY22 was an exceptional year for the company in multiple ways including profi t.
During the quarter, the company came up with voluntary retirement scheme for employees with a charge of Rs.51 crore on standalone basis and Rs. 54 crore on consolidated basis made in P&L.
An ex-gratia totaling to Rs. 72 crore was announced in 4QFY22 for rewarding everyone working in Titan ecosystem (employees, off -roll workers and karigars etc.) for their achievement during the quarter.
Both the items i.e., VRS and ex-gratia cost of Rs. 123 crore has been charged on employee expenses overhead.
As Fastrack store format is in the process of revamping, the company didn’t open new stores. However, the new store design has been fi nalized. Fastrack does well in both offl ine and online. The company plans to open 10-11 stores in FY23.
Omicron onset aff ected the Titan Eye+ in January 2022.As the channel partners witnessed slowdown in March 2022, the company witnessed channel correction along with a muted performance.
The company has very vibrant EMI plan for gold purchase, which was launched in Bangalore on pilot basis.
With healthy enrollment numbers, contribution of golden harvest increased to 18% in FY22 from 15% in FY21.
While 4QFY22 was not conducive for overall demand, the company continued to remain strong on categories it operates.
Gold price volatility aff ected the business in March 2022, mainly the big-ticket wedding jewellery. However, it has improved lot from April 2022 onwards. The company is very positive that the demand will rebound in the upcoming marriage season.
The company sees huge opportuni-ties in every category it operates. It is the leader in 3 categories with huge headroom for other categories.
As watches have high share of manpower and resources, it absorbed high portion of ex gratia. Excluding
ex gratia, the watch EBIT margin could have been 6.7% in 4QFY22 and 6.9% in FY22.
The company incurred Rs. 10 crore for business associates meet, which occurs every 2 years.
The company has dividend payout ratio in the range of 25%-40%, which translates to 31% this year.
The company is working on big revival plan on Fastrack, on the back of huge growth potential, as India has the largest pool of young population in the world.
Hallmarking as a process has been stabilized across the districts. It should be modifi ed so that it can be rolled out across the country.
The company sees migration to organized retail, which prompts the organized players to expand their stores. There has been certainly migration from family jewelers to organized jewelers.
The ex gratia was equitable to every employees of the organization.
Desire of natural diamond is very high amongst the Indian middle class. Household penetration of natural diamond is very low in India, which is high in the US.
As the opportunity for natural diamond jewellery business is high in India, no single company has been able to capitalize on the same.
The standalone jewellery accounts for ~89-90% of total revenue.
The buying will be typically in the range of 50% in terms of kgs and spot buying will be smaller quantity and 40% would be exchange buying. The company also purchased jewellery directly from the vendors.
Excluding the exceptional item, EBIT margin of Jewellery segment could have been ~13.1%. There are few costs in 4QFY22, which are not recurring in nature. Otherwise, the segmental EBIT margin is likely to have remained healthy.
The company does hedging in order to reduce the impact of volatile gold price and insulate from price
Titan Company: Gold price volatility aff ected the business in March 2022, mainly the big-ticket wedding jewellery. However, it has improved lot from April 2022 onwards. The company is very positive that the demand will rebound in the upcoming marriage season.
39 June 2022INSIGHT
risk only and not for making money.
As all future VRS liabilities have been charged in FY22, no further charge will come in FY23.
The company reported diamond inventory gain to the tune of Rs. 190 crore in FY22, which is split between 3QFY22 and 4QFY22.
Geographic-mix has an impact on the gross margin. The company wit-nessed dilution in gross margin due to higher contribution of Southern markets.
Organized jewellery market sees intense competition, as they have been expanding their presence. The investment that the company makes in form of gold rate, off ers, marketing spend and product-mix has dilutive eff ect on its margin. However, higher operating leverage will off set the impact.
Zensar Technologies Ltd. The company has registered
another strong quarter with revenue of US$153mn (up 28% YoY and 4.2% QoQin CC terms (up 27.4% YoY and 4.1% QoQin reported currency terms).
The company ended FY22 on a strong note with revenue registering 15.3% YoY growth to US$569mn.
Notably, growth was broad-based across verticals and across geogra-phies. The US region posted 28.8% YoY and 3.4% QoQ growth.
Europe region registered its high-est ever quarterly revenue with 29.7% YoY and 9.8% QoQ growth, driven by strong deal win momentum.
South Africa posted 15.7% YoY growth (down 0.1% QoQ).
BFSI reported 35.4% YoY and 5.3% QoQ growth.
Consumer Services grew by 34.1% YoY and 3.9% QoQ.
Hi-Tech & Manufacturing regis-tered 13.7% YoY and 3.2% QoQ growth.
The company continued to grow in emerging vertical (up 148% YoY).
Its gross margin stood at 30.1% of revenue in4QFY22 (up 50bps QoQ).
PAT stood at US$17.2mn or 11.2% of revenue (up 300bps QoQ). Total deal wins stood at US$165.6mn(up 32% QoQ) supported by multiple win across verticals. The company added 3 clients in US$5mn+ category in FY22, taking the total number of clients to 27.
Despite decline in quarterly attrition rate, LTM attrition increased to 27.9% in 4QFY22 due to scale eff ect. The management believes situation will gradually stabilize in the next few quarters.
In order to stick to client com-mitment, the company has done the hiring and in Q4FY22, the hiring increased by 11.3% QoQ. With gross addition of 2,331 associates, its total headcount stood at 11,839.
The company will continue its hiring programme in FY23 also.
Its strategic focus areas are scaling up and are in line with the initial expectations.
Advance engineering services are scaling high, while 4QFY22 was good for data engineering. The company’s teams are effi ciently providing services on Cloud.
Digital foundation services have been contributing high to bottom-line.
The company continues to increase its wallet share with global specialty chemical companies providing product development services for connected product platform.
The company plans to become zero
carbon emission company by 2040.
FY22 proved to be a turnaround year for the company and over the years, the company has seen multiple green shoots.
In 4QFY22, US Dollar realization stood at US$75.2 vs.US$74.9in 3QFY22. Gross margin stood at 30.1% in 4QFY22 vs. 29.6% in 3QFY22, due to improved utilization and healthy vol-ume-mix. Exchange rate also helped the company albeit partially, which was off set by higher cost of delivery to the extent of 0.6%.
EBIT margin stood at 14.1% in 4QFY22 vs. 14.3% 3QFY22. Eff ective tax rate stood at 27% in 4QFY22 vs. 26.9% in 3QFY22.
In 4QFY22, DSO (including unbilled) increased by 12 days QoQ to 90 days from 78 days in 3QFY22, due to delay in payment by few clients. However, the company expects the situation to normalize in 1QFY23.
Cash and cash equivalent during Q4FY22 decreased to US$155mn in 4QFY22, from USD 168 million mainly due to dividend payment and higher receivables.
Other income increased in 4QFY22 due to foreign exchange gain, write-back of provisioning and reversal of certain costs related to South Africa JV.
Improvement in gross margin can be attributed to better utilization, improved operational effi ciency, cost optimization initiatives and lower cost of delivery. The company will continue to hire freshers.
The company is confi dent on the outcome of last 2 quarters. The com-pany’s franchises are strengthened and are in good place.
The company is watching global economy and geopolitics and believes that strong secular growth will sustain.
Over the past few quarters, the company has been increasing from reactive mode to proactive mode. It is putting enormous eff ort in making organic talent.
Zensar Technologies: The company is watching global economy and geopolitics and believes that strong secular growth will sustain.

40June 2022 INSIGHT
The company’s hiring is ahead of the curve only to ensure timely delivery and proper service to the clients.
Attrition rate exceeded the man-agement’s expectation and company is planning to manage it effi ciently. The company has brought new lead-ership in various service lines, which is expected to yield positive outcome.
The company added 43 new clients in FY22, which was a record. In each client category, there has been improvement in client addition. Overall, there has been growth in client-mix and revenue-mix.
The company’s endeavor is to reach mid-teen margin in FY23. It is working on multiple levers, which will result in high-teen margin, going ahead.
FY22 was a turnaround year for the company, which delivered 27% growth. All geographies are deliver-ing strong growth, which will drive the momentum.
The company is expanding over-all sales eff ort to catch the wider demand and that has paid strong dividend last year. The proportion of Top-5-10 clients in overall revenue declined, which albeit increased in absolute term. Thus, it indicates that the growth has been broad-based.
The company continues to do hiring in FY23, though it would not be at same pace as seen in FY22.
The company is a part of transfor-mation for all top clients.
The company is watching the margin carefully. The margin levers are ramp-up organic talent, contin-ued focus on right shoring (increase in off shore) and expansion of delivery location. The company has expanded delivery location in India and other geographies.
There will be wage hike, which will hit the company in 2QFY23. The company’s eventual goal is to be on the top quartile in this space.
Deal win pipeline is in the ratio 40:60, out of which 40% is new deal
and 60% is renewal. Deal win pipeline is broad-based and strong across verticals and geographies.
The company is stronger in insurance space, while banking segment is doing extremely well in last 18 months. The company has strengthened leadership position across segments.
Off shore-mix rose by 200bps to 43.6% in 4QFY22. On attrition front, the company has done some improvement in 4QFY22.
Navin Fluorine Interna-tional Ltd. The company’s wholly owned
subsidiary, Navin Fluorine Advanced Sciences Ltd. (NFASL) plans to incur capex of Rs.540 crore to manufacture and supply a new fl uoro specialty molecule, which has ability to deliver revenue of Rs. 600 crore.
The new capacity is expected to come on stream by the end of CY23.
This will also help enhance the company’s product off erings, strengthen customer relationship and provide building blocks for future growth.
Navin Fluorine Advanced Sci-ences Limited (‘NFASL’), a wholly owned subsidiary of the Company, has entered into a multi-year agreement of Rs. 800 crore with a large MNC for manufacturing and
supplying key agro-chemical i.e., fl uoro-intermediate.
The company witnessed strong traction in business in FY22 with the highest growth coming in from high-value business.
CRAMS business reported highest revenue growth in FY22.
All projects are progressing well and are on schedule. The company has managed to secure all required raw materials for the new plants.
The company has also approved the debottlenecking of the plants to improve the effi ciency.
Its high value business grew by 18% in FY22, while legacy business grew by 35%.
All projects except MPP (Multi Purpose Plan) project is based on cost pass through model. The company fi rst estimated the cost for the full year and then set the price for the molecule. But now, the company conveyed to the clients that instead of 1 year, it will estimate the cost on quarterly basis to mitigate the cost increase. Hence, the projects are now based on 100% cost pass through model.
In MPP, though the price mech-anism is little bit diff erent, it also follows the same model.
On several occasions, the company doesn’t get impacted by the price rise in key sorting materials. The key raw material is hydrochloride acid. The company is holding larger invento-ries, which insulates it from volatility in raw material prices.
The company has taken Rs. 500 core debt for the project, and it mulls taking additional debt of Rs. 200 crore for its new planned project which will cost Rs. 540 crore.
The company’s margin got impacted in the short-term. Its mate-rial cost, as a percentage of revenue, remains same which suggests that company has successfully pass on the increased cost. In 4QFY22, its EBITDA margin was impacted by substantial increase in energy cost. Employee
Navin Fluorine: All projects except MPP (Multi Purpose Plan) project is based on cost pass through model. The company fi rst estimated the cost for the full year and then set the price for the molecule.

41 June 2022INSIGHT
cost has also gone up, which also impacted its margin. Employee cost, as a percentage of revenue, is expected to remain higher in FY23.
On gross margin front, the com-pany believes that it would be able to pass on the higher cost. However, the employee cost will be higher in FY23, which is expected to normalize in FY24.
For new project, the plant will start from December 2023 and manufacturing will start from thereafter. The company continues to look for the growth opportunity in each segments. The management will consider new project, when it will be convinced about the fi nancial viability.
The company supplies intermediate and advance intermediate to the clients.
The company sees relatively good growth in industrial chemical segment. It is currently evaluating opportunities in MPP and HPP (High Performance Product) projects.
Asset turnover is one of the parameters that the company looks at for project evaluation, but it is not the only parameter for the same purpose.
For upcoming plant, the company has signed multiyear contract for 50% of volume on cost+ basis, while-the rest 50% will be on project of economics.
Currently, the company’s receiv-ables stand at 90 days, while the inventory days stand at 60. The company expects the working capital cycle to remain at similar level, going forward.
All 3 projects will start commercial-ize from next fi nancial year.
The upcoming project is very strategically important for Navin Fluorine, as it will manufacture critical molecules, which will be used in important value chain.
For Navin Flurorine, the basic building block is hydrochloride.
The company is looking at inno-vative pharma companies, which
are into CRAMS. The company has identifi ed some molecules, which it can grow.
The company sees very good growth opportunities in CRAMS business. It sees very strong order book in 2023.
The company will continue to provide opportunities, ecosystem and higher compensation to the employ-ees in order to retain talent.
Cash outfl ow for capex is seen at ~Rs. 300 crore in FY23.
The China issue has impact on demand. But the company doesn’t see any impact in demand due to current Russia-Ukraine war, which albeit has some impacts on supply side.
As the company has not gone aggressively on borrowing, its debt equity ratio stands at <1 and it doesn’t see any challenge in maintaining this ratio, going forward. On consolidated level, the debt equity ratio stands at 0.5%.
Sona BLW Precision Forg-ings Ltd. Since December quarter, the com-
pany has been witnessing gradual improvement.
In FY23, the company is going to be far more conservative in terms of expectation.
Continued rise in material prices will impact its EBITDA margin in FY23.
The company expects more orders in FY23, which will strengthen its order book.
It expects substantial progress in technology roadmap especially in motor segment.
The company focuses on motor technology from electric 2W motor to electric bus motor.
There are 5 important KRAs for the company such as: fi nancials, elec-trifi cations, business development, diversifi cation and new product development.
Being a global company, where most of the revenue comes from light vehicles, the company reported strong growth especially organic growth.
Revenue in electrifi cation segment grew by 2.5x to Rs.500 crore. The company added 6 new EV pro-grammes during the quarter. There are total 30 EV programmes awarded by 19 customers as of 4QFY22.
Revenue share from EV increased from 14% in FY21 to 25% in FY22. Cumulative number of EV pro-grammes increased by 2x from 15 in FY21 to 30 in FY22.
All EV transmissions are in the skill set of the company. 21 out of 30 programmes are yet to be realized.
In last 3 quarters, the company won 143 new programmes and added 10 new customers. It serves Top-7 out of Top-10 global car manufacturers.
The company has 3 new EV pro-grammes for CVs and tractors, which indicate that it has moved to heavy vehicles segment from electric 2W.
EV revenue share increased from 1% in FY19 to 25% in FY22, which shows how fast the company is moving in EV space.
Due to higher disruption in customer-mix in the US and Europe, there has been marginal change in geographical-mix, which albeit remains balanced among 4 major markets.
As CV demand has started to recover, the company expects more
Sona BLW Precision: In last 3 quarters, the company won 143 new programmes and added 10 new customers. It serves Top-7 out of Top-10 global car manufacturers.

42June 2022 INSIGHT
traction in this segment. Currently, E2W and E3W account for 1.5% of total revenue and the company expects to report strong growth in FY23.
The company focuses on electrifi -cation and automation. In FY22, the company introduced 3 new products in technological development space i.e., fi nal drive diff erential assembly, spool gear and epicycllic geartrain.
For EV drivetrains, the company now has products/solutions for most architecture.
The company’s proven ability to commercialize new products contin-ues to increase content per vehicle.
The company sees massive oppor-tunity in traction motors both in industrial and large electric buses.
The company is partnering with other companies to strengthen its technology.
The company will off er traction motors to entire EV space.
BEV revenue, which grew by 104%,accounts for 29% its total revenue. Non-BEV revenue declined 14% in line with decline in automo-tive sales in key markets of North America and Europe. Semiconductor shortage and confl ict in Europe impacted the revenue during the quarter.
Margin got impacted due to higher RM prices.
While PAT for 4QFY21 has been adjusted for IPO expenses, one-time tax impact has been adjusted in 4QFY22.
RoCE and RoE continue to remain above 30% over past 3 years. Fixed asset turnover ratio declined from 5x in FY21 to 4.7x in FY22 due to asset capitalization.
Growth from motor segment will be higher on low base, as it represents 1.5% of revenue. In driveline space, there will be signifi cant ramp-up led by vehicle electrifi cation.
With the spool gear launch, the company believes that it can manu-facture EV transmission technology.
Driveline business will contrib-ute higher to overall growth. The company has delivered 35-36% growth over last 3 years and expects to sustain same pace of growth, going ahead.
In next few months, demand might cool down led by the central bankers’ focus to tame infl ation. Semiconduc-tor shortage is likely to ease in the coming months.
The company doesn’t expect semiconductor shortage to be worse due to war in Europe. Regardless of all macro problems, it expects strong revenue growth in FY23.
Despite adversities, the company continues to maintain 26% EBITDA margin. Forex gain stood sequentially lower at Rs.2 crore in 4QFY22.
In non-EV segment, the company added 2 large auto makers. In 4QFY22, the company received most orders in EV space.
Around 90-95% of EV will go for 1 or 2 motor architecture. Spool gear architecture will go for high torque EVs. The company expects the spool gear volume to be low, as this is for high-end vehicles.
Aluminum and Copper contracts are done in lag of 3 months.
March was the bad month for the company due to China’s stringent lockdown policy.
I-T refund interest for full year is Rs.16 crore. The company will incur ~Rs900-1,000 core capex in the next 3 years.
The demand remains robust for E2W, and E4W. The company is manufacturing 10,000 motors per month.
Laurus Labs Ltd. The industry faced challenges in
terms of raw materials in 4QFY22, while the current geo-political issues and rising COVID cases in China are the new challenges.
Overall, operation was resilient inFY22, as profi tability was main-tained despite headwinds.
The company strengthened R&D capabilities and made partnership in CDMOs space. In FY22, the company forayed in new segments.
The company is on the line to achieve US$1bn revenue in FY23.
FDF business generated Rs.1,880 crore revenue in FY22 (up 13%), while revenue increased to Rs.491 crore in 4QFY22 (14% YoY).
The company is waiting for few more product approvals in the coming quarter, which will drive the growth.
The company fi led 2 product dossiers in 4QFY22 taking total fi lings to 9 in FY22.
The company has received 3 approvals in 4QFY22, taking the total approval to 5 in FY22. The company has cumulatively fi lled 31 ANDAs in the US with 15 PARA-IV fi lings and 10 FTF opportunities.
On the back of healthy order pipeline, the company is investing on infrastructure and R&D.
On R&D front, the company is investing on product-specifi c depending on the complexity of products. There are 62 products in R&D pipeline.
The company’s focus continues to remain on product specifi c and not market-specifi c.
Laurus Labs: The company has received 3 approvals in 4QFY22, taking the total approval to 5 in FY22. The company has cumulatively fi lled 31 ANDAs in the US with 15 PARA-IV fl ings and 10 FTF opportunities.

43 June 2022INSIGHT
There has been improvement in ARV API business. The company is optimistic in demand recovery in the coming quarters. Laurus Labs has one of the largest API capacities in India.
Apart from ARV and oncology, the company reported Rs.171 crore sales in 4QFY22.
In CDMO business, the company doubled its revenue growth in 4QFY22. Synthesis business main-tained its robust growth momentum with >105% YoY growth in 4QFY22 to Rs.360 crore. In FY22, CDMO business witnessed solid growth of over 77% (accounting for 19% of total revenue vs. 11% in FY21).
Expansion in CDMO capability is on the track to include new opportu-nities and extended services.
The company is gradually ramp-ing-up the 180KL fermentation capacity with its large scale CDMO partners. Full operational benefi ts of new capacities are expected to refl ect in FY23.
The company is in process to acquire additional land parcel to cre-ate ~1mn liter fermentation capacity in Phase-I.
Gross margin was on the lower side in 4QFY22 due to rise in sol-vent prices. In FY22, gross margin expanded by 40bps to 55.6% on the back of better business-mix.
Capex reached 19% of sales in FY22, which has been supporting long-term plan to deliver healthy margin through de-risking growth investments.
The company is investing in back-ward integration and also investing in non-ARV front. It is taking all steps to mitigate the challenges emerging from lockdown in China due to rise in COVID cases.
ARV sales of most companies were lower in FY22 due to high inventory holding. Both API prices and ARV prices were down by 10%.
The management expects mar-gin improvement on the back of
softening of solvent prices. The prices of ARV and API are in new base and the company doesn’t expect any further decline in the prices.
The company sees opportunities in FY23 and FY24. It is adding capacities and receiving orders from and adding new clients also.
Its 180LK fermentation capacity is fully operational and the company is doing some de-bottlenecking to improve operational effi ciency.
Most of the company’s fermenta-tion capacity utilization is towards food protein and not therapeutic protein.
As the company see slots of oppor-tunities in CDMO space, it is setting up separate capacity for CDMO.
Other liabilities increased due to higher purchase, as the company is gearing up for higher revenue growth in FY23.
In FY22, ARV API business stood at20%, while CDMO synthesis business stood at 20%. In FY23, the growth will be driven by ARV formu-lation, API and CDMO. ARV business accounts for 55% of total revenue.
In FY25, the ARV formulation and API revenue will come down and
will be one third of total revenue. The company is focusing on diversi-fi cation and is in process to reduce dependency from ARV business.
The company expects growth to come from non-ARV formulation and API business. It expects revenue contribution of ARV segment to come down in the coming years.
The company’s focus and commit-ment on CDMO business is yielding positive outcome.
There will be no one-off item in the aspirational revenue target of US$1bn in FY23.
The company is increasing capex guidance every year and now expects the capex could be in the range of Rs. 2,000-2,500 crore in next 2 years. The company has increased the capex guidance by Rs. 500-600 crore, as it is seeing large opportunities, going ahead.
Margin declined sequentially in 4QFY22 due to challenges in solvent prices, logistics issues, unfavourable product-mix and lower ARV prices. As the company will increase the revenue contribution from non-ARV business, its margin will improve from the current level.
The company expects solvent prices and raw material prices to soften in the coming quarters, which will aid in margin recovery.
The price erosion happens both in formulation and API segment. ARV price reduction and higher solvent prices were the main reasons for lower gross margin.
Gross margin will improve from 52% only when the revenue contri-bution from non-ARV segment will increase.
As the current capacity will not contribute to revenue growth in FY23, the company is adding capacity for future growth, which will start refl ecting from CY23 onwards.
In API segment, the company is operating at optimum utilization rate.
Laurus Labs: The company is increasing capex guidance every year and now expects the capex could be in the range of Rs. 2,000-2,500 crore in next 2 years. The company has increased the capex guidance by Rs. 500-600 crore, as it is seeing large opportunities, going ahead.

44June 2022 INSIGHT
Economy review
ECONOMY REVIEW
The Reserve Bank of India (RBI) in a surprise move hiked repo rate by 40bps along with 50bps increase in the cash reserve ratio (CRR), signaling a hawkish tilt to its policy. Many are however, bewildered over sudden change stance by the RBI, more importantly within days after it maintained status quo in April. The RBI could very well have pressed the pedal on rate hikes in April itself when the signs were telltale with regard to infl ationary trend. Global central bankers have now started to accept that they were slow to anticipate infl ation, which has been persistent, while the general rhetoric had been of ‘transient’. Such statements have been made by the US Fed Governor, as well as the ECB Chairman and all have turned hawkish for the time being. The central banks are making an attempt to frontload the rates to tackle the burgeoning price pressures, which is albeit caused by supply side issues. Clearly, nobody knows for how long the Russia-Ukraine confl ict will continue or more pertinently when the COVID-19 infections would stop spreading? Global supply lines could very well be snapped forever or there could be clusters/blocs within the world that would trade among themselves. There are whole sets of permutations and combinations possible, however some could come true, since harsh sanctions on Russia has led to many MNCs leaving Russia like for Renault, for which Russia now wants to resurrect defunct Soviet-era Moskvich car brand. However, the central banks have to keep interest rates aligned with the infl ation albeit they have little infl uence over the same. According to a Financial Times article, monetary policymakers and participants would ideally try to fi nd the neutral
level of rates or ‘Goldilocks’, where the economy is neither overheating nor being held back. Probably, the US Fed will take baby steps of 50bps each time so that infl ation doesn’t get out of control, while not triggering a recession. Unfortunately, the elusive neutral rates where infl ation cools and output nears optimal capacity cannot be measured but be estimated. The US Fed offi cials see the rate anywhere between 2% and 3% when infl ation rules near 2%, while others believe that the rate could be in the excess of 5%.
However, the question remains whether monetary policies are the right approach in taming infl ation from supply side. We do know that monetary policies were redundant in taming infl ation between 2010-2012 in India when food infl ation was the usual culprit and yet it was a domestic supply side factor. Moreover, nominal credit growth was in higher teens at that point of time and hence, infl ation and growth was fueled by credit. This is the best scenario, when aggressive rate hikes by the RBI would have worked wonders and the monetary policies work best in this kind of scenario. Else, the RBI has been majorly unsuccessful in lowering infl ation expectations through monetary policy or even through interlink between forex reserves and bond market as an implication of higher interest rates given lower participation of foreign players in domestic bond markets. Moreover, this time, it is a combination of domestic as well as external supply side factors (majorly the food items). While the government could arrest domestic supply side infl uences on infl ation, it is diffi cult to tame imported infl ation, which is true for

45 June 2022INSIGHT
every country. Moreover, credit growth has remained anaemic amid weak economic growth. The policymakers around the world are worried and discussions behind the closed doors reveal their concerns over economies, which are running hot and infl ation could be stickier than expected and thus, forcing the economies to slip into deep recession just as Fed Chair Paul Volcker did in the early 1980s by raising Fed rates to 20%. However, not many are prepared today to keep raising rates beyond the neutral rate. As far as regards India is concerned, while nobody has accepted so far whether Monetary Policy Committee (MPC) of RBI was late in acting against infl ation, the recent minutes of the off -cycle policy highlights uneasiness among few MPC members. At least two members were of the opinion that the sharp surge in infl ation in India will require front-loading of interest rate increases. Jayant Varma, an external member of the MPC was hawkish of the lot and stated that infl ation risks have become more pronounced since April both in terms of magnitude and in terms of persistence. “It appears to me that more than 100 basis points of rate increases needs to be carried out very soon,” he added.” In view of a reasonable recovery and sharp rise in infl ation, which will also raise infl ation projections, frontloading of rate hikes is required to prevent the real rate becoming too negative,” Ashima Goyal, another external MPC member, said in the meeting. The central bank also wants to remove the overhang of liquidity in the system over 2-3 years.
CPI-based infl ation rose more than expected to 7.79% YoY in April, remaining above the RBI’s tolerance band of 6% for the fourth month in a row. Annual wholesale price infl ation, a proxy for producers’ prices, climbed
to 15.08% in April, remaining in double-digit for the 13th month in a row. Experts believe the RBI would raise rates again in next policy meet in June and follow it up again in next policy meet in August as well. Few economists also believe that once the RBI reaches pre-pandemic neutral monetary conditions, further tightening will depend on incremental growth-infl ation trade-off . Experts believe that once the RBI reaches pre-pandemic repo rate (of 5.15% in Feb’20), it might take a pause to assess the impact of rate hikes on economic growth. Over-tightening will hinder domestic growth, as infl ation has been driven by global supply side factors. Nonetheless, infl ation has broadened out with ~70% of the CPI sub-components rising above the RBI’s 4% target and experts expect the RBI to raise its infl ation projection for the ongoing fi scal. After all, it is now widely accepted that infl ation is unlikely to correct anytime soon. In a recent report by State Bank of India (SBI), the authors expect the RBI to take repo rates to pre-pandemic level of 5.15% by August. Moreover, the report made interesting observations with regard to the Russia-Ukraine confl ict and its infl ationary impact on India. According to the SBI research report, on account of the war alone, Food and Beverages (assuming that vegetable price increase was mostly because of seasonal factors that are largely domestic) and Fuel, Light & Transport contributed 52% to the increase in overall infl ation since February. Adding the impact of input costs over personal care and eff ects (on FMCG sector), the total impact at all India level comes to 59%, purely because of war, states the SBI research report. The report further states that while the impact of infl ation on rural areas was disproportionately high for food prices, it is fuel prices and second order eff ects which has been disproportionately high for urban areas.
Impact of Russia-Ukraine Confl ict on CPI infl ation
Change in CPI Infl ation (Apr over Feb), in %CPI Rural CPI Urban CPI All India
2.0 1.3 1.7Share of various items in CPI increaseFood and beverages, of which 65% 52% 58% Cereals and products 12% 9% 10% Milk and products 6% 7% 6% Oils and fats 3% 6% 4% Fruits 4% 6% 5% Vegetables 31% 23% 28% Spices 8% 5% 7%Prepared meals, snacks, sweets etc. 3% 3% 3%Pan, tobacco and intoxicants 1% 0% 0%Clothing and Footwear 5% 8% 6%Housing 0% -2% -1%Fuel and Light 10% 6% 8%Miscellaneous, of which 18% 34% 23% Transportation and Communication 8% 21% 13% Personal care and eff ects 7% 7% 7%
Source: SBI Ecowrap, Issue No. 10, FY23

46June 2022 INSIGHT
While the infl ation is usually perceived notorious, they are less inhibitive to growth if it is demand-pull infl ation, while cost-push infl ation is a by-product of supply-side challenges. The government played its part as well with continuous increases in fuel taxes, which eventually fed in second order eff ects thus leading to increase in cost of production and transportation of goods and services. However, the real eff ect of global supply challenges is refl ected in the WPI, which has been recording double-digit numbers for several months now. Nevertheless, there is a wide divergence between WPI and CPI infl ation, which has been typically ascribed to the diff erential weights in the indices. These issues have been highlighted by economists, C.P. Chandrasekhar and Jayati Ghosh in an article i.e., ‘So what’s the Actual Rate of Infl ation?’. The authors state that the WPI index excludes services altogether and thus covering only produced goods, while the services accounts for 27% in CPI index. Further, within goods, CPI basket has a weight of 46% allocated to food articles as against just 15% in WPI. In fact, Food & Beverages segment has a bigger share of 54% in CPI-rural index, while it is 36% for CPI-urban index, states the article. Fuel & Power, which is the major driver in WPI infl ation, has much lower weight of 6.84% in CPI basket, while it is nearly double in the WPI. Authors of the article state that
the reasons for divergence could be even more complex since even within food price index, WPI index increased at a much faster rate than CPI food index. Apart from the diff erence in weights and composition, the other aspect which has resulted in lower infl ation at CPI levels is the retail price of food (and especially cereals), which has been held down on account of Public Distribution System (PDS), which plays a major part in providing food grain at subsidized prices and the government also provided free food grains during the pandemic. Economists have also opined that ~50% of input cost has been passed on over the last six months, while generally it is ~80-90%. Corporate houses haven’t passed on the cost entirely due to fear of demand slowdown. However, eventually they will pass on the same in case the input cost continues remain
higher. Economists C.P. Chandrasekhar and Jayati Ghosh however, believe that this needs further investigation ‘but it is possible that retail prices have not risen so much because mass consumption demand still remains hugely suppressed. Consumption was down even before the pandemic; since then, the collapse in livelihoods, the uneven and unequal recovery and the continuing lack of employment opportunities have further reduced the ability of the bulk of households to increase spending.’
Annual infl ation rates- April 2022
Source: RBI
15.10%
7.73% 8.80% 8.03%
38.70%
10.87%
WPI CPI WPI Food CPI Food WPI Fuel &Power
CPI Fuel & light
Weights for WPI
Source: C.P. Chandrasekhar and Jayati Ghosh
Fuel & Power, 13.15%
Manufactured Food and Bev,
11.76%
Textiles, 4.88%Chemical Products,
6.47%
Basic Metals, 9.65%
Other manufactures,
31.47%
Cereals, 2.82%Other food
articles, 12.44%
Non-food primary, 4.12%
Minerals, crude pertoleum &
natural gas, 3.24%
However, the real eff ect of global supply challenges is refl ected in the WPI, which has been recording double-digit numbers for several months now. Nevertheless, there is a wide divergence between WPI and CPI infl ation, which has been typically ascribed to the diff erential weights in the indices.

47 June 2022INSIGHT
Few media articles have also highlighted the outdated nature of CPI and WPI baskets and the need for change. An article in The Mint highlighted that the prices of cassettes and CDs are part of 299 items included in CPI basket. The article quoted an anonymous statistics ministry offi cial, who confi rmed that at least 10-12% items in CPI basket are defunct and there’s not much justifi cation for using this basket. The government still collects the prices of Nokia mobile phones as a proxy for the prices of a number of smart phones available in the market considering Nokia was the market leader. when the CPI basket was last revised which is apparently a decade ago and presently account for less than 2% market share. The CPI basket needs to be periodically updated to refl ect the typical shopping list of a resident and to capture the consumption pattern, in contrast India’s CPI basket is a decade old with base year as 2012. Other countries like Spain and UK included face masks, hand sanitizers as well as home exercise kits to get a better measure. “For instance, there is a need to raise the weight of healthcare services in the CPI (from 5.89% now), especially after the pandemic,” said the offi cial. Similarly, the weight of cooked meals may have to be revised up from 2.62% now, thanks to the likes of Zomato and Swiggy that have made home delivery of food very convenient, he added. The infl ation basket was initially planned to be updated based on the Consumer Expenditure Survey 2017-18 but the survey was junked in 2019 citing “data quality issues”, while the policy-watchers called it a move to hide adverse results. Sakshi Gupta, senior economist at HDFC Bank is of the view that “if we remove food, fuel and transport and compare with private consumption data in nominal terms, the share of other items is signifi cantly higher than what the CPI data is suggesting,” Economists believe that that a new CPI index should have been constructed by
2019-20 itself. While the Ministry of Statistics originally planned to conduct consumer expenditure surveys back to back in 2020 and 2021, it was shelved due to COVID-19 restrictions. The Ministry now plans to start constructing surveys from July 2022 to June 2023 and even if everything goes as per plan, the CPI basket is unlikely to be revised before 2024 or even 2025, opines the economist. However, by then the CPI basket will be 15 years old and can hardly capture the recent consumption patterns.
However, it is not only the CPI, the WPI basket is old as well with base year 2011-12 and the Department for Promotion of Industry and Internal Trade (DPIIT) will soon launch a new WPI with 2017-18 base year and a revamped product basket to better capture the structural churns in the economy, as communicated by DPIIT Secretary, Anurag Jain to Financial Express. An expert group, set up to submit technical recommendations on new WPI series, has suggested inclusion of 479 products, on top of the current 697 products, in the revamped index. Of course, some products in the current WPI series (with 2011-12 base year) will also be dropped and few more new items will likely be added before the index
is fi nalised. The new index is set to assign more weight to food items in the primary articles segment and that of fuel and power may go down almost proportionately. The weight of primary food articles will be raised to 17.46% from the current level of 15.26% and that of the fuel and power segment will be reduced to 11.24% from 13.15%, according to the expert panel’s recommendations. Thanks to the food items, the weight of the primary article segment will rise to 24.83% from 22.62%. The weight of manufactured products will ease by 30bps to 63.93%. Since the WPI is used to estimate real GDP growth, an updated index is crucial for computation of real growth of national income.
Sakshi Gupta, senior economist at HDFC Bank is of the view that “if we remove food, fuel and transport and compare with private consumption data in nominal terms, the share of other items is signifi cantly higher than what the CPI data is suggesting,”
Annual infl ation by category-April 2022
Source: RBI, C.P. Chandrasekhar and Jayati Ghosh
7.80
%
16.1
0%
10.8
9%
23.2
4%
3.99
%
38.6
6%38
.66%
5.96
%
17.2
8%
4.86
%
14.9
3%
9.51
%
10.8
7%
Cereals Oil seeds/Oils Fruitsuitsui Vegetables Clothing Fuel and Light
WPI CPI
Weights for CPI
Source: C.P. Chandrasekhar and Jayati Ghosh
Cereals, 9.67%
Other miscelleneous ,
10.76%
Education, 4.46%
Transport and communication,
8.59%Health, 5.89%Fuel and Light, 6.84%
Housing, 10.07%
Clothing and footwear, 6.53%
Other food products, 37.19%

48June 2022 INSIGHT
While relief from technical construction of index is still some years away, the present problem is largely on account of rising food infl ation levels in CPI. As can be seen from the chart, although, there are concerns over the imported infl ation, the same is majorly refl ected in Oils and fats, which has actually remained elevated even before Russia-Ukraine war, while cereals and sugar infl ation remained under control, despite global prices shooting higher. India being a surplus producer of cereals and sugar, higher global prices didn’t impact infl ation until recently when cereal infl ation has picked up on the back of lower crop yield caused by sudden heat wave from mid-March. Hence, a lot depends on monsoon and food grain production. According to 3rd advance estimates, Rabi crop production declined by 0.4% in AY 2021-22 compared to 4.2% rise last year. Within Rabi, production of wheat (106.41 mn tonne for AY2021-22) is estimated to have registered sharp decline by 2.9% and is much lower than the target level (110 mn tonne).
Lower output has been attributed to early onslaught of summer and extreme heat wave. In a bid to control infl ation, the government announced few measures on 21st May’22, which include: (a) central excise duty cut on petrol by Rs8/litre and on diesel by Rs6; (b) waving of customs duty on import of some raw materials, including coking coal and ferronickel, used by the steel industry; (c) hike in duty on iron ore exports by up to 50% and a few steel intermediaries to 15% to improve domestic availability; and (d) reduction in customs duty on raw materials and intermediaries for plastic products i.e., naphtha and propylene oxide. According to Devendra Pant, chief economist, India Ratings and Research, “The step is likely to have an impact of ~20-25bps from June onwards, while in May, the impact may be limited to ~7-8bps.” Nevertheless, the journey will be painful for the government owing to lower revenue and thus, the borrowings will be revised higher.
Consumer food infl ation components (% YoY)
Source: RBI
-30
-20
-10
0
10
20
30
40
Jan-
21
Feb-
21
Mar
-21
Apr-2
1
May
-21
Jun-
21
Jul-2
1
Aug-
21
Sep-
21
Oct-2
1
Nov
-N
ov-
No
21
Dec-
21
Jan-
22
Feb-
22
Mar
-22
Apr-2
2
Food and beverages Cereals Milk & ProductsOils and fats Vegetables PulsesSugar
Wheat output (mn tonne)
Source: Ministry of Agriculture, 3rd advance estimate: AE for AY2021-22
108
110110
106
2019-20 2020-21 Targets 3rd Adv. Est.

49 June 2022INSIGHT
START-UP CORNERAt Ashika Capital, we are extremely passionate about fostering symbiotic relationships that are aimed at building and sustaining high-growth founder led businesses. We strongly believe that fi nancial capital is the fi rst stepping stone to build a scalable, sustainable and impactful business. Therefore, our endeavour is to identify great entrepreneurs in pursuit of building businesses that carry magnanimous investment potential. Here is an INSIGHT into businesses that we have worked/working with –
These are the top three business opportunities that interested stakeholders can pursue from an investment standpoint. If you are interested to know more about these companies from the perspective of business operations, investment thesis, exit opportunities and more, please drop in a line to us at [email protected].
ClearDekhoClearDekho is India’s Leading Aff ordable Eyewear Brand.
Fueled by a vision to revolutionize the eyewear industry, two young entrepreneurs started ClearDekho to deliver high-quality aff ordable eyeglasses to the masses in small towns/cities across India.
Driven by a highly passionate, experienced, and determined team, the brand has already sold 400k+ eyeglasses delivered through their 100+ stores across 30+ cities of India.
Lo! FoodsLo! Foods are helping millions of Indians transition to a low-carb diet through aff ordable and tasty low-carb alternatives, for everyday vegetarian food needs.
The team focuses on innovation, by going back to the fi rst principles of nutrition, & dissecting Indian traditional recipes. The result is a range of products that includes atta, namkeens, cookies, sandwiches, rolls, etc. which are authentically Indian.
Backed by leaders in the FMCG space, they have already impacted 1.5 lakh+ customers & are aiming to reduce the incidence of Obesity, Cardiac, and Diabetes-related diseases by 5 million by 2023.
SheruSheru is building an innovative Energy Storage system that can store energy that is generated during the day to be used at night when the load is higher. They are working on eliminating the high storage costs of energy by aggregating using their platform. Sheru is India’s fi rst startup solving this.
They have wonderfully created a way to reduce power transfer costs by storing energy at the last mile. They are actively working towards adding more EV categories to the platform. Building for the vast spectrum of geographical and socio-economic challenges in India is preparing Sheru to provide a robust solution for the world.
Sheru

50June 2022 INSIGHT
State of Capex Cycle The Indian economy is at the cusp of an industrial capex cycle, as corporate balance sheets witnessed deleveraging and the health of banking system has been restored. Consumer demand is also expected to get a fi llip with pandemic related restrictions are being relaxed. Street expects the momentum in private capex to pick up in the coming months. Sustained pick-up in the end-demand trends will mean a continued improvement in capacity utilization, which bodes well for the capex outlook. Capital goods imports are yet to recover, but over the next 6-9 months, the country should see further improvement in capex momentum. The country’s private corporate investment to GDP ratio declined sharply to 9.2% in FY21from the peak of 17.8% of GDP in FY08 on account of impaired banking system and lack of end-market demand.
India’s capex cycle has been muted for the last 10 years, as private capex remains fl at despite 1.7x rise in corporate profi t. It was only the government capex that had supported infrastructure spending with 13% CAGR over FY10-FY20. It is expected that the investment cycle has bottomed out, as investment contribution to GDP reduced to 26.7% in FY21 from the peak of 36% in FY07. It is expected that all building blocks of the new investment cycle are in place like at the beginning of previous cycle namely reduction in NPAs in banks’ balance sheets, low-cost of funds and globally competitive corporate tax rate at 15% for new manufacturing companies. Reforms also played an important role in revival of capex cycle. Some of the reforms done in the past such as GST, RERA and IBC etc. have started to show results. Incremental implementation of reforms like corporate tax rate, PLI, labour reforms and increase in FDI limit will strengthen the capex cycle further. Also, the government’s key initiatives of “Make in India” or “Aatmanirbhar Bharat” would require reasonably-priced high quality capex, which will be possible by implementation of these reforms. Government spending to revive in any capital cycle gives confi dence to the private companies to expand. The government has announced National Infrastructure Pipeline (NIP), which gives confi dence on spending for next 3-5 years with expected spending of Rs. 111 lakh crore over FY20-25, which is 2x of spending of Rs. 56.5 lakh crore over FY13-19. Capex is expected to scale up across power (specifi cally renewables), roads, railways and water segments. The government is exploring multiple sources of fi nancing to fund this
Quarterly Gross Fixed Capital Formation (GFCF) as % of GDP
Source: MOSPI
19.0
21.0
23.0
25.0
27.0
29.0
31.0
33.0
35.0
37.0
FY12 FY13 FY14 FY15 FY16 FY17 FY18 FY19 FY20 FY21 FY22

51 June 2022INSIGHT
mega infrastructure pipeline either through increased borrowing, fi nancing from multi-lateral funding agencies like World Bank and a dedicated infrastructure fi nancial institution. Indian manufacturing sector is getting once-in-life-time opportunity to attract the manufacturing fi rms to relocate operations out of China (China+1 strategy). For decades, the companies have
looked at China for their supply chain, which is changing and COVID-19 has accelerated this move. The Indian government is keen to benefi t from this opportunity and has implemented various policy measures such as imposition of import bans, tariff hike and PLI. The PLI started with the mobile segment, now has 15 sectors covered with a total investment of ~Rs. 1.4 lakh crore.
Investment Rebounded in FY22New projects worth Rs. 5.1 trillion were announced in the March quarter, a 54% increase from the preceding three months and more than double from a year ago, as economic activities continued to recover, as per the
provisional data compiled by the Centre for Monitoring Indian Economy (CMIE). Project announcements also ended on a high note for the entire fi scal year, picking up by 70% to Rs. 14.3 trillion after plummeting to a 17-year low in 2020-21 due to the pandemic. However, the capex momentum is yet to reach the pre-pandemic levels, as
The government will not cut capex in the current fi scal year, said the fi nance secretary, TV Somanathan amid suggestions by experts that fi scal policy should aid monetary policy in managing infl ation. Capital investment is needed for long-term growth of the economy and short-term developments should not distract from that
goal. The government has budgeted Rs. 7.5 lakh crore capex for FY23 compared with a revised Rs. 6.03 lakh crore capex in FY22. It will impact committed projects in multiple sectors such as roads, railways,” Somanathan said, adding that there will be no budgetary constraints on capital spending.
Percentage contribution to GFCF by key institutions in nominal terms2012 2013 2014 2015 2016 2017 2018 2019 2020 2021
Private corporates 33% 35% 37% 37% 41% 39% 36% 35% 38% 35%Pvt. corporates - industrial sector 21% 22% 20% 18% 19% 18% 16% 15% 16% 14%Pvt. corporates - services sector 11% 14% 17% 19% 22% 21% 20% 20% 22% 20%Household Sector 46% 44% 40% 40% 33% 36% 40% 41% 39% 39%Household real estate 37% 35% 36% 34% 25% 26% 26% 27% 25% 25%Household other capital assets 8% 9% 4% 6% 7% 11% 14% 14% 14% 14%General Government 10% 10% 11% 12% 13% 13% 13% 12% 12% 16%Public corporates 11% 11% 11% 11% 13% 11% 11% 12% 11% 11%
Source: MOSPI, National accounts statistics 2022
Private corporates industrial sector GFCF trends (Rs. Trillion)2012 2013 2014 2015 2016 2017 2018 2019 2020 2021
Private industrial sector GFCF 6.4 7.2 7.1 6.7 7.5 7.8 7.6 8.2 9.1 7.5% of overall GFCF 21.3% 21.6% 20.2% 17.9% 19.0% 18.0% 15.8% 14.7% 15.8% 14.3%% of private corporate sector GFCF 65% 61% 54% 49% 46% 46% 44% 42% 42% 41%Pvt. Industrial sector GFCF break upManufacturing 4.01 4.39 4.39 5.02 5.79 5.71 5.75 6.00 6.94 5.54Electricity and other utility services 1.48 1.42 1.37 1.09 1.13 1.18 0.94 1.08 0.87 1.07Construction 0.76 1.16 0.65 0.46 0.50 0.80 0.73 0.72 1.07 0.70Mining & quarrying 0.15 0.21 0.67 0.14 0.12 0.13 0.21 0.36 0.22 0.22
Source: MOSPI, National accounts statistics 2022
Quarterly Capex Aggregate(Rs. trillion) Jun-21 Sep-21 Dec-21 Mar-22New projects 2.89 3.22 3.47 4.95Completed projects 0.73 1.28 2.76 1.09Stalled projects 0.33 0.28 0.06 0.29Revived projects 1.14 0.39 2.06 0.28Implementation stalled projects 0.64 0.25 0.65 0.07
Source: CMIE Capex; Updated on: 25 May 2022

52June 2022 INSIGHT
annual project announcements averaged at ~Rs. 19 trillion over 2016-2019. Even before the pandemic, growth in new investments remained subdued, as it dropped in 2016-17 and 2017-18 and rose by 5-6% in subsequent 2 years.
In FY22, both private and public sector companies announced signifi cant capex plans. While the capex of private fi rms doubled, public investment grew by 18%. The momentum could only pick up further from here. The Union Budget 2022, with its focus on government capex, has set the trend for crowding in private capex.
A sharp rebound was witnessed across industries. New investments in the manufacturing sector grew by 89% from a year earlier in 2021-22 after remaining fl at in the preceding year. The Top-10 projects, including RIL’s Jamnagar Dhirubhai Ambani Green Energy Giga Complex Project and Bhushan Power and Steel’s Rengali integrated steel plant expansion project, jointly accounted for 47% of new capex announcements by the private sector. In manufacturing capex, there are signs of a pick-up in metals, cement, renewable energy and pharmaceuticals segments etc.
New proposals in electricity space nearly trebled, while the services sector saw 10% rise. However, investments by the companies in mining and construction/real estate sectors are yet to revive, as they were down 27% and 44%, respectively. The real estate sector can join the party over the medium-term, as the unsold inventory of residential property units is down >40% from the peak.
On quarterly basis, the progress was led by electricity sector in January-March period, which alone saw projects worth Rs. 3.3 trillion being announced (up 4.5x QoQ). Meanwhile, a stronger project completion rate also indicates an improving investment climate in the country. Overall project completion, in terms of value, rose by 59% in FY22 after declining over the previous two years. The value of private projects being concluded jumped from Rs. 1.1 trillion to Rs. 2.3 trillion, while it improved from Rs. 2.2 trillion to Rs. 3 trillion for government-owned projects. However, much of it was achieved in the October-December quarter, with not much progress made in the March quarter.
Project stalling rates, calculated as the value of stalled projects as a proportion of total projects under implementation, also off ered some respite. Moderating
New projects have more than doubled over March last year New project announcements (Rs. trillion)
Source: Livemint, CMIE Capex
1.2 2.
4
1.1 2.
5
3.4
2.6
1.3
1.3
1.3
0.3
0.3
0.3
0.3 0.8
0.8 0.6
0.6
0.6
0.6
1.0 2.
2
2.5 2.
0
0.7
0.7
1.1
1.1
4.3
2.3
0.6
0.6
0.6 1.4
1.2
1.2 1.
6
2.2 2.
5 2.3
2.93.
7 4.4
1.8
3.6
7.7
4.9
1.9 2.
7
1.5 2.
4 2.8 3.
1 3.3
5.1
0.01.02.03.0
4.05.06.0
7.08.09.0
Dec-
18
Mar
-19
Jun-
19
Sep-
19
Dec-
19
Mar
-20
Jun-
20
Sep-
20
Dec-
20
Mar
-21
Jun-
21
Sep-
21
Dec-
21
Mar
-22
Government Private
Investments in all sectors rebounded sharply barring mining and construction New project announcements (Rs. trillion)
Source: Livemint, CMIE Capex
0.0
5.0
10.0
15.0
20.0
25.0
30.0
FY09
FY10
FY11
FY12
FY13
FY14
FY15
FY16
FY17
FY18
FY19
FY20
FY21
FY22
Construction & real estate Services (oth(oth(o er than financial)
Mining Manufacturing
Project completion remained strong in FY22Project completions (Rs. trillion)
Source: Livemint, CMIE Capex
1.0 1.3
1.3
1.4
1.5
1.4
1.4
3.2
2.7
2.7 3.
6
2.1
2.2 3.
02.0 2.
7
2.3 2.
9
2.3
2.2 2.
7
2.7
3.8
2.2
2.9
3.1
1.1
2.3
3.0
4.0
3.6
4.3
3.8
3.6 4.
1
5.9 6.
5
4.9
6.5
5.2
3.3
5.3
0.0
1.0
2.0
3.0
4.0
5.0
6.0
7.0
FY09
FY10
FY11
FY12
FY13
FY14
FY15
FY16
FY17
FY18
FY19
FY20
FY21
FY22
Government Private
Capex mood rebounds in 2021-22, but still short of pre-pandemic level
New project announcements (Rs. trillion)
Source: Livemint, CMIE Capex
9.9 12
.0
9.1
7.9
5.7 6.7
14.5
13.9
11.7
7.8
8.0 9.
5
3.7 4.4
17.2
12.4
16.4
8.9
5.2 3.9
9.3
10.1
8.1
8.3 8.9 8.
4
4.7 10
.0
27.1
24.4 25
.5
16.8
10.9
10.6
23.8
24.0
19.8
16.1 16
.9 17.9
8.4
14.4
0.0
5.0
10.0
15.0
20.0
25.0
30.0
FY09
FY10
FY11
FY12
FY13
FY14
FY15
FY16
FY17
FY18
FY19
FY20
FY21
FY22
Government Private

53 June 2022INSIGHT
by ~70bps 9.7%, the stalling rate returned to single-digit after 9 years, largely driven by private projects, where the stalling rate declined by ~5% to 21.8%, while public sector stalling rates inched upwards to 4.1%, as per the latest data.
Project Insight As against 2,719 new projects worth Rs. 4,14,415 crore
announced in 3QFY22, the last quarter of FY22 saw announcement of 2,467 new projects worth Rs. 5,46,674 crore. Fresh investment increased by 31.9% on QoQ basis.
5,700 new projects worth Rs. 5,99,650 crore were announced by the government-owned agencies. On YoY basis, fresh investment in the central government segment increased by 22.8% and the same increased by a meager 6.4% in the state government segment.
The manufacturing sector attracted the highest fresh investment in FY22. In all, 2,759 new projects with an aggregate investment of Rs. 8,08,159 crore, which accounts for 41.9% of total fresh investment announcement in FY22. Its share in total fresh investment was just 13.3% in FY20.
FY22 saw announcement of 10,445 new projects entailing a total investment of Rs. 19,27,214 crore. Compared with the similar fi gures for FY20, this indicates an increase of 77.5%.
Among the core sectors, cement attracted 83 new projects worth Rs. 39,478 crore, while iron and steel sector saw 281 projects worth Rs. 2,65,495 crore, machinery sector got 203 projects worth Rs. 1,19,670 crore and automobiles and auto-ancillary sector attracted 103 projects worth Rs.
42,677 crore. The dominance of solar-based power projects
continued in FY22. Out of 222 new projects announced in non-conventional power sector, 187 projects worth Rs. 63,213 crore were solar power projects.
Nearly half of the total fresh investment seen in roadways sector by the NHAI, which announced 183 new projects entailing total investment of Rs. 1,19,557 crore.
Construction sector – comprising of Real Estate, Commercial Complexes and Industrial Parks – saw 34.6% growth in terms of fresh investment over FY20.
Real Estate sector, which was badly hit by the nationwide lockdown and is saddled with huge unsold inventories, saw announcement of 1,540 new projects worth Rs. 1,62,235 crore and registered a growth of 49.4%.
FY22 saw a surge in investment proposals in the sunrise sectors like EVs, Lithium Ion Batteries, Data Centres and Warehousing etc.
Private sector continued its investment binge in 4QFY22. In all, the sector announced a record 4,745 new projects with a total investment commitment of Rs. 13,27,564 crore. Compared with FY20 statistics, this indicates a growth of 144.4%.
Thrust on Capex in Manufacturing in FY22 The India private capex cycle is turning at a high speed. A report by Goldman Sachs highlights that the private sector capex in manufacturing surged by ~150% YoY in FY22, backed by mega project announcements in steel, cement and auto sectors. New investment/capex announcements and ordering activity have seen a sharp pick-up in FY22 (both on YoY comparison and over
pre-COVID levels). Manufacturing sector was the clear outlier with a 210% growth in terms of new investment announcements. While the increase was aided by mega project announcements, especially in steel sector, traditional sectors like petrochemicals, cement, automobiles and new age sectors like electronics, EVs and data centers also made a signifi cant contribution. Further, the number of projects announced increased by 80% and 140% in FY22 compared to FY21 and FY20. Contract awarding saw an overall 55% YoY rise in FY22, while the manufacturing sector witnessed 135% YoY growth.
PLI to Boost Capex Since introduction in March 2020, PLI scheme has been announced for
Overall project stalling rates back to single-digit after 8 yearsValue of stalled projects as a proportion of total projects under
implementation (in %)
Source: Livemint, CMIE Capex
0.0
5.0
10.0
15.0
20.0
25.0
30.0
35.0
FY96
FY98
FY00
FY02
FY04
FY06
FY08
FY10
FY12
FY14
FY16
FY18
FY20
FY22
Govt Private Overaleraler l
Private sector capex in manufacturing surged by ~150% YoY in FY22, backed by mega project announcements in steel, cement and auto sectors. Further, the number of projects announced increased by 80% and 140% in FY22 compared to FY21 and FY20.

54June 2022 INSIGHT
15 sectors, involving government incentives to the tune Rs. 1.93 lakh crore. Out of this, 50-60% is to be spent on sectors with domestic manufacturing and export focus, and the rest on import localization. Implementation of PLI scheme will lead to a potential capex of Rs. 2.5-3 lakh crore over the scheme period and will account for 13-15% of average annual investment spending in key industrial sectors over the next 3-4 years and could translate into an incremental revenue addition of Rs. 30-35 lakh crore over the scheme period. The scheme will have many fi rsts in terms of bringing integration across supply chains, reducing import dependencies and propelling exports. PLI is now poised for rapid on-the-ground execution, with ~60% of capex approved already and major spending is set to occur over FY23-FY26 period. The capex has been approved for 10 sectors. While capex in mobile, pharma and telecom has already kicked off , it will kick off from 1QFY23 in capital-intensive sectors such as automobile and solar PVs, which form 70% of committed investment.
Capacity Utilization Set to Improve A recovery in capacity utilization and a rise in order books appear to suggest revival in private capex. According to the RBI ’s quarterly Order Books, Inventories and Capacity Survey (OBICUS) statement, capacity utilization for manufacturing sector at aggregate level picked-up to 72.4% in 3QFY22 from 68.3% recorded 2QFY22, refl ecting improved manufacturing activities. Capacity utilization has surpassed the pre-COVID levels of 69.9% (recorded in 4QFY20). Investment activity may gain traction with improving business confi dence, pick-up in bank credit, continuing support from government capex and congenial fi nancial conditions. Rise in investment activity would also lead to comeback of private capex, as the companies look to improve utilization further following demand pick-up in the wake of ease in pandemic restrictions. Growing order book of capital goods players points to traction in private capex in FY23, according to a report by ICRA. Some key industries, which are showing healthy capex include: Energy (power generation, predominantly RE and Storage), Transmission, Oil & Gas, Green Hydrogen), Digitalization (including Date Centers), core industries (Cement and Metals) and corporate sectors (Automotive, Mobility, Pharmaceuticals, Chemicals and Textiles among others), ICRA report added.
According to ICRA, capacity utilization in India is expected to dip in 1QFY23 and gradually recover thereafter, which indicates that the economic recovery will be hurt by the Russia-Ukraine tensions. ICRA expects capacity utilization to reach the critical threshold of 75% required to trigger broad-based capacity expansion, only by the end of CY22. ICRA expects capacity utilization to remain to dip in 1QFY23 and rise gradually to 74-75% in 3QFY23. ICRA said at present, expansion is being announced, but in a narrower set of sectors such as power and metals, and in sectors related to PLI scheme. Moreover, the rating agency highlighted that while some green shoots are visible in private investments, protracted geo-political tensions and elevated commodity prices could constrain the profi tability of corporate sector, imparting some caution to private sector capex in the near-term. In such a scenario, the government capex, especially by the states, will be critical to support investment demand and boost economic activities over the next 2-3 quarters.
BS CEO Survey Shows Bigger Capex Push in FY23A poll of ~19 chief executive offi cers (CEOs) conducted by Business Standard showed that with consumer demand showing signs of revival after 2 years of slowdown due to pandemic and lockdowns, the companies are looking forward to boost investment to add new capacities in FY23. 58% CEOs opined that they plan to hike investment by >25% in FY23 compared to FY22, while 10.5% CEOs stated that they would invest less than what they invested in FY22. Recently, the Reserve Bank of India (RBI) had forecast investment was likely to gain traction with improving business confi dence among investors, a pick-up in bank credit and continuing support from the government’s capex on roads and highways. Capacity utilization in manufacturing recovered further to 72.4% in 3QFY22 from 68.3% in 2QFY22, surpassing the pre-COVID level of 69.9% in 4QFY20. Corporate India usually starts planning projects when capacity utilization crosses 75% of installed capacity. Reliance Industries, Tata Group, JSW and Adani Group are among the top companies that have announced plans to invest in renewable energy, steel plants, and semiconductor businesses. “Demand has gone up and that brings with it supply-side constraints as a lot of small and medium enterprises have shut shop and the large ones are fi nding it diffi cult to meet manpower constraints,” said the CEO of a manufacturing company. T.V. Narendran, Tata Steel CEO and MD and the CII President, said ~70% of the CII’s members plan to spend more on capex in FY23 and also would hire more than what they did in the past. But rising cost of raw materials due to global spike in commodity prices remains the main worry of the CEOs.
In the aforementioned survey, ~36.8% respondents said Source: RBI

55 June 2022INSIGHT
there would not be any impact on their earnings, while 26.3% were of the view that the eff ect on their costs would be in the range of 1-2.5%. When asked about the rising interest rates, both in India and overseas, 36.8% respondents said they were not much worried about it,
while a similar number said otherwise. Though the rest were apprehensive about the matter, they were not very much anxious. When asked about the war in Ukraine, 47.4% respondents said it had no impact, while a similar number said it had moderately aff ected their businesses.
How are company’s capex plans for FY23 vs. FY22?
Source: Business Standard
10.5
31.6
0.0
36.8
21.1
0 10 20 30 40
Lower
Similar
Higher by 1-25%
Higher by 26-50%
Higher than 50%
What are the impacts of high commodity price infl ation on EBITDA margin in FY23?
Source: Business Standard
36.8
21.1
26.3
10.5
5.3
0 10 20 30 40
No imNo imNo pact
Less than 100 bps
Between 101-250 bps
Between 251-500 bps
Over 500 bps
Capex: Projects Monitored (in Number)Major Industries Total
ProjectsLive Projects Projects Under
ImplementationCompleted
ProjectsStalled
ProjectsNon-fi nancial 71,342 25,505 15,051 40,120 5,717
Manufacturing 23,988 5,127 2,396 16,606 2,255Food & agro-based products 3,787 681 306 2,776 330Textiles 2,690 248 87 2,221 221Chemicals & chemical products 7,279 2,558 1,449 4,180 541Consumer goods 1,019 143 68 779 97Construction materials 1,827 272 107 1,311 244Metals & metal products 2,788 630 198 1,798 360Machinery 2,071 273 89 1,592 206Transport equipment 1,749 219 62 1,364 166Miscellaneous manufacturing 778 103 30 585 90
Mining 2,077 1,079 634 666 332Electricity 6,843 1,922 824 4,267 654Services (other than fi nancial) 26,366 10,972 6,371 13,380 2,014
Hotels & tourism 2,981 887 401 1,549 545Wholesale & retail trading 1,910 476 360 1,248 186Transport services 10,475 4,948 3,014 5,066 461Communication services 326 41 23 254 31Information technology 2,056 404 172 1,340 312Miscellaneous services 8,618 4,216 2,401 3,923 479
Construction & real estate 12,068 6,405 4,826 5,201 462Irrigation 898 543 443 345 10
All industries 72,240 26,048 15,494 40,465 5,727Source: CMIE Capex; Updated on: 25 May 2022

56June 2022 INSIGHT
Technical view From technical parlance, Nifty started the month with a surprising gap down to test sub-16,900 levels on the back of weak global cues and nosedived to test the Mar’22 low of 15,671. The velocity at which the market fell has certainly dented the sentiment. Global macro factors have weighed down heavily on fi nancial markets across the globe and we certainly were not immune to it. A surprising rate hike by the RBI triggered massive sell-off in our markets sending Nifty below the key support zone of 16,800. Mostly, global factors tend to trigger such substantial selloff s but, during the month it was initiated due to domestic developments as well. The recent low of 15,671 is not far from current levels now and the moment we slide below it, it will create a panic kind of situation. Despite this, one should avoid going short aggressively rather should avoid aggressive trading. However, amidst present hiccups, Indian market undoubtedly will strengthen in the longer term, as there have been several instances where the equity market has outperformed several other asset classes during an infl ationary environment.
Nifty continued its downward trajectory for 7 consecutive weeks in a row and according to Dow Theory such development changes the present stance in Index to negative. In case, the previous swing low (Mar’22) of 15,671 is breached, the theory would set the ball rolling in favour of the bears in medium-term. During the month,
broader markets indices relatively underperformed the benchmark, as Nifty Mid-cap and Small-cap lost 9.5% and 16.1%, respectively. Sectorally, all major indices ended in the red weighed by underperformance of Metal, Realty and Energy indices. Foreign funds continue to pull out, as the FIIs were the net sellers to the tune of Rs. 51,847 Cr while DII remained net buyers by Rs. 44,738 Cr during the month. Infl ation in April came in at 7.79% ahead of the RBI target range of 2%-6% for four consecutive months, while Federal Reserve Chair reaffi rmed that the Fed is likely to raise rate by 50bps each at next two meetings and not actively considering 75bps hike.
Selling pressure was sharp in the recent period compared to previous two corrections seen in Nov’21 and Jan’22. Hence, the reactionary pull-back or short covering can also be expected to be of same valor. On the larger time frame i.e. since Oct’21 onwards, the Index had been trading amidst the downward sloping channel line with upper panel of the pattern being draw adjoining the highs of Oct’21 (18,604), Jan’22 (18,350) and Apr’22 (18,114). During the month, the lower panel of the pattern was breached but fi nally was able to close above it, which (if sustains) would be recognized as an end of 5th wave and the chances remain high of Index attaining higher target projected from the upper panel of pattern at ~18,000 in the medium-term. In the longer time frame i.e. since 2020 onwards, the prices are on the formation stage of a bullish
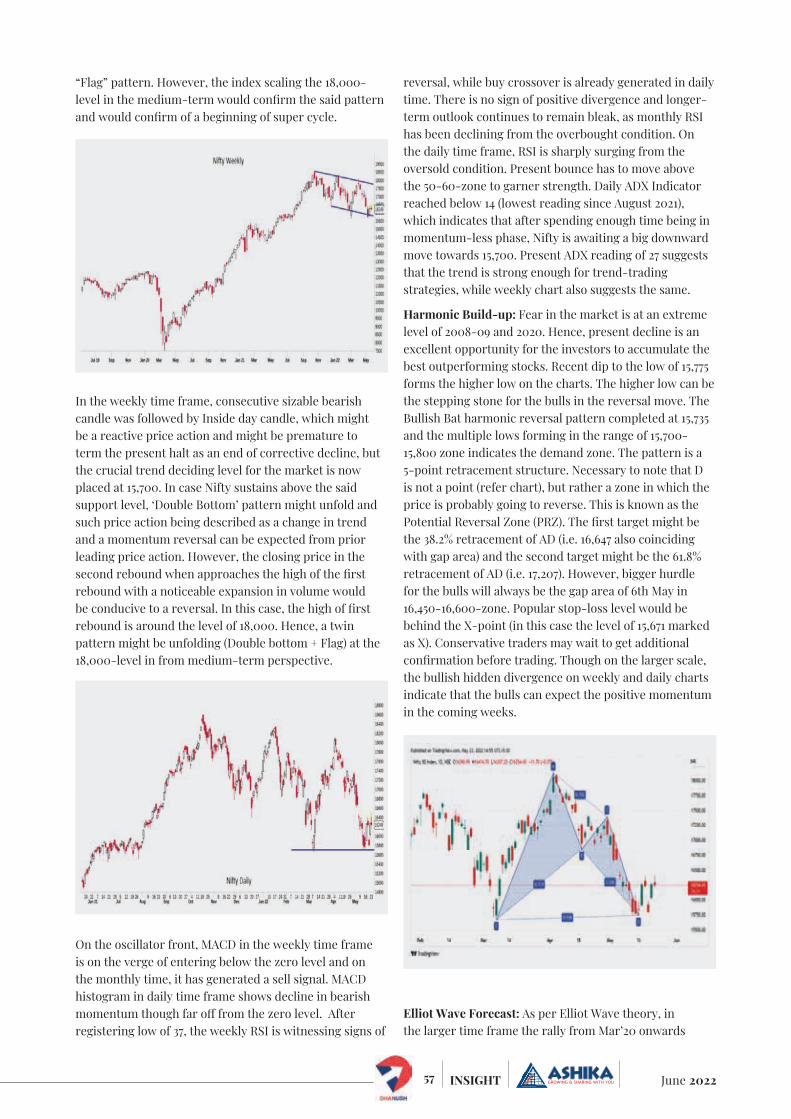
57 June 2022INSIGHT
“Flag” pattern. However, the index scaling the 18,000-level in the medium-term would confi rm the said pattern and would confi rm of a beginning of super cycle.
In the weekly time frame, consecutive sizable bearish candle was followed by Inside day candle, which might be a reactive price action and might be premature to term the present halt as an end of corrective decline, but the crucial trend deciding level for the market is now placed at 15,700. In case Nifty sustains above the said support level, ‘Double Bottom’ pattern might unfold and such price action being described as a change in trend and a momentum reversal can be expected from prior leading price action. However, the closing price in the second rebound when approaches the high of the fi rst rebound with a noticeable expansion in volume would be conducive to a reversal. In this case, the high of fi rst rebound is around the level of 18,000. Hence, a twin pattern might be unfolding (Double bottom + Flag) at the 18,000-level in from medium-term perspective.
On the oscillator front, MACD in the weekly time frame is on the verge of entering below the zero level and on the monthly time, it has generated a sell signal. MACD histogram in daily time frame shows decline in bearish momentum though far off from the zero level. After registering low of 37, the weekly RSI is witnessing signs of
reversal, while buy crossover is already generated in daily time. There is no sign of positive divergence and longer-term outlook continues to remain bleak, as monthly RSI has been declining from the overbought condition. On the daily time frame, RSI is sharply surging from the oversold condition. Present bounce has to move above the 50-60-zone to garner strength. Daily ADX Indicator reached below 14 (lowest reading since August 2021), which indicates that after spending enough time being in momentum-less phase, Nifty is awaiting a big downward move towards 15,700. Present ADX reading of 27 suggests that the trend is strong enough for trend-trading strategies, while weekly chart also suggests the same.
Harmonic Build-up: Fear in the market is at an extreme level of 2008-09 and 2020. Hence, present decline is an excellent opportunity for the investors to accumulate the best outperforming stocks. Recent dip to the low of 15,775 forms the higher low on the charts. The higher low can be the stepping stone for the bulls in the reversal move. The Bullish Bat harmonic reversal pattern completed at 15,735 and the multiple lows forming in the range of 15,700-15,800 zone indicates the demand zone. The pattern is a 5-point retracement structure. Necessary to note that D is not a point (refer chart), but rather a zone in which the price is probably going to reverse. This is known as the Potential Reversal Zone (PRZ). The fi rst target might be the 38.2% retracement of AD (i.e. 16,647 also coinciding with gap area) and the second target might be the 61.8% retracement of AD (i.e. 17,207). However, bigger hurdle for the bulls will always be the gap area of 6th May in 16,450-16,600-zone. Popular stop-loss level would be behind the X-point (in this case the level of 15,671 marked as X). Conservative traders may wait to get additional confi rmation before trading. Though on the larger scale, the bullish hidden divergence on weekly and daily charts indicate that the bulls can expect the positive momentum in the coming weeks.
Elliot Wave Forecast: As per Elliot Wave theory, in the larger time frame the rally from Mar’20 onwards
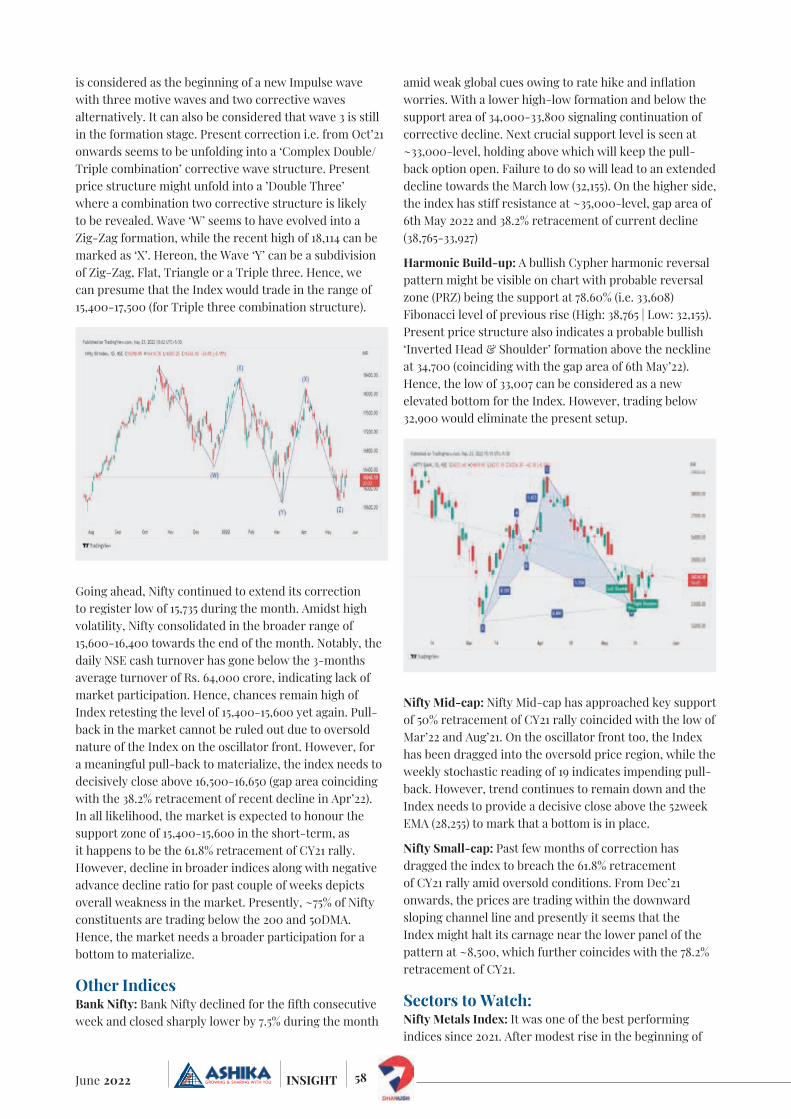
58June 2022 INSIGHT
is considered as the beginning of a new Impulse wave with three motive waves and two corrective waves alternatively. It can also be considered that wave 3 is still in the formation stage. Present correction i.e. from Oct’21 onwards seems to be unfolding into a ‘Complex Double/Triple combination’ corrective wave structure. Present price structure might unfold into a ’Double Three’ where a combination two corrective structure is likely to be revealed. Wave ‘W’ seems to have evolved into a Zig-Zag formation, while the recent high of 18,114 can be marked as ‘X’. Hereon, the Wave ‘Y’ can be a subdivision of Zig-Zag, Flat, Triangle or a Triple three. Hence, we can presume that the Index would trade in the range of 15,400-17,500 (for Triple three combination structure).
Going ahead, Nifty continued to extend its correction to register low of 15,735 during the month. Amidst high volatility, Nifty consolidated in the broader range of 15,600-16,400 towards the end of the month. Notably, the daily NSE cash turnover has gone below the 3-months average turnover of Rs. 64,000 crore, indicating lack of market participation. Hence, chances remain high of Index retesting the level of 15,400-15,600 yet again. Pull-back in the market cannot be ruled out due to oversold nature of the Index on the oscillator front. However, for a meaningful pull-back to materialize, the index needs to decisively close above 16,500-16,650 (gap area coinciding with the 38.2% retracement of recent decline in Apr’22). In all likelihood, the market is expected to honour the support zone of 15,400-15,600 in the short-term, as it happens to be the 61.8% retracement of CY21 rally. However, decline in broader indices along with negative advance decline ratio for past couple of weeks depicts overall weakness in the market. Presently, ~75% of Nifty constituents are trading below the 200 and 50DMA. Hence, the market needs a broader participation for a bottom to materialize.
Other IndicesBank Nifty: Bank Nifty declined for the fi fth consecutive week and closed sharply lower by 7.5% during the month
amid weak global cues owing to rate hike and infl ation worries. With a lower high-low formation and below the support area of 34,000-33,800 signaling continuation of corrective decline. Next crucial support level is seen at ~33,000-level, holding above which will keep the pull-back option open. Failure to do so will lead to an extended decline towards the March low (32,155). On the higher side, the index has stiff resistance at ~35,000-level, gap area of 6th May 2022 and 38.2% retracement of current decline (38,765-33,927)
Harmonic Build-up: A bullish Cypher harmonic reversal pattern might be visible on chart with probable reversal zone (PRZ) being the support at 78.60% (i.e. 33,608) Fibonacci level of previous rise (High: 38,765 | Low: 32,155). Present price structure also indicates a probable bullish ‘Inverted Head & Shoulder’ formation above the neckline at 34,700 (coinciding with the gap area of 6th May’22). Hence, the low of 33,007 can be considered as a new elevated bottom for the Index. However, trading below 32,900 would eliminate the present setup.
Nifty Mid-cap: Nifty Mid-cap has approached key support of 50% retracement of CY21 rally coincided with the low of Mar’22 and Aug’21. On the oscillator front too, the Index has been dragged into the oversold price region, while the weekly stochastic reading of 19 indicates impending pull-back. However, trend continues to remain down and the Index needs to provide a decisive close above the 52week EMA (28,255) to mark that a bottom is in place.
Nifty Small-cap: Past few months of correction has dragged the index to breach the 61.8% retracement of CY21 rally amid oversold conditions. From Dec’21 onwards, the prices are trading within the downward sloping channel line and presently it seems that the Index might halt its carnage near the lower panel of the pattern at ~8,500, which further coincides with the 78.2% retracement of CY21.
Sectors to Watch:Nifty Metals Index: It was one of the best performing indices since 2021. After modest rise in the beginning of

59 June 2022INSIGHT
the calendar year, it turned negative and felt the heat to come closer to 5,290-level. However, technically the Index is presently trading at crucial support of horizontal trendline placed at 5,200-level and historically also, the Index has a record of reversing from the said level for multiple times. As most commodity prices trending bullish with higher high formation, the Index is expected to honour the support level and might off er an excellent buying opportunity in Metal stocks in the near-term. However, a close below 5,150 would change the trend back to negative.
Nifty Energy Index: Energy Index fell in sync with the benchmark Index and corrected by ~14% from the high of 29,304 to register low of 25,155. Technically, the Index is presently at a demand zone. Historically, in the period of Oct’21 and Jan’22, the said level of 25,155 acted as major resistance which now acting as support. Hence, present price structure of ‘resistance-turned-support’ provides an excellent opportunity to enter into the energy stocks. Daily 100DEMA also coincides at around the said level followed by RSI trending at the demand zone. However, a close below 25,000 would alter the present setup and would continue to maintain a negative outlook.
Global MarketDow Jones: The US equity index extended losses for seventh consecutive week. Dow Jones slipped 4.5% to settle the month at 31,490. The weekly price action formed a bear candle, indicating corrective bias, with presence of long upper shadow, which signifi es selling pressure at higher levels. Index is now at the vicinity of 50% retracement of Oct 2020-Jan 2022 rally 26,501-36,952 placed at 31,600. Going ahead, the downward momentum in the index needs pause, and the index needs to decisively close above previous weeks high i.e. above 32,800, which would open the door for a meaningful pull-back.
Commodity Gold: Gold prices declined for fourth week in a row amid strong US dollar, which rose to 2-decade high. The weekly price action formed indecisive Doji and breached the intermediate psychological support level of 1,800 indicating further weakness. Going forward, recent high of 1,885 remains strong resistance and technical bounce is likely to be short-lived. Immediate support is placed at 1,770, which happens to be the swing low in January 2022.
Brent Crude: Brent prices eased amid growth concerns. The commodity has been on an extended consolidation within the price band of 98-120. Hence, a breakout in either direction will indicate directional bias in the absence of which consolidation would continue. Brent prices have bounced from 98 on fi ve occasions over past two months making it a key support above which overall trend remains positive.
LME Copper: LME Copper price witnessed a halt in decline after fourth consecutive week and closed near seven month low, on account of demand worries due to ongoing lockdowns in top consumer China and USD rising to two decade high. The commodity has breached the 23.6% retracement of March 2020-March 2022 rally of 4,462-10,719 placed at 9,325. Price closed below December 2021 low of 9,270 signals extended correction towards June 2021 lows of 8,680. On the higher side, stiff resistance is placed at 9,400-9,500 levels.
CurrencyUSDINR: The INR closed at a new low amid fi scal concerns and strengthening USD. The currency formed a Bullish candle in weekly time frame and closed above past two year highs, which indicates weakness in INR to continue. Going ahead, follow through weakness above 78 would lead the currency towards 80 in the medium-term, while the key support is placed at previous swing resistance of 76.60-level.

60June 2022 INSIGHT
Mon
day
Tues
day
Wed
nesd
ayTh
ursd
ayFr
iday
12
3
IN: S
&P
Glo
bal I
ndia
PM
I Mfg
US: I
SM M
anuf
actu
ring
CH: C
aixi
n Ch
ina P
MI M
fgJN
: Jib
un B
ank
Japa
n PM
I Mfg
EC: S
&P
Glob
al E
uroz
one M
anuf
actu
ring
PMI
US: I
nitia
l Job
less
Cla
ims
US: D
urab
le G
oods
Ord
ers
US: A
DP
Empl
oym
ent C
hang
eUS
: Fac
tory
Ord
ers
EC: P
PI Y
oY
IN: S
&P
Glo
bal I
ndia
PM
I Ser
vice
sUS
: Cha
nge
in N
onfa
rm P
ayro
llsUS
: Une
mpl
oym
ent R
ate
US: I
SM S
ervi
ces I
ndex
EC: S
&P
Glob
al E
uroz
one
Com
posi
te P
MI
67
89
10
CH: C
aixi
n Ch
ina
PMI S
ervi
ces
US: T
rade
Bal
ance
UK: S
&P
Glob
al/C
IPS
UK S
ervi
ces P
MI
JN: L
eadi
ng In
dex
CIJN
: Hou
seho
ld S
pend
ing
YoY
JN: C
oinc
iden
t Ind
ex
IN: R
BI R
epur
chas
e Ra
teJN
: GD
P SA
QoQ
EC: G
DP
SA Q
oQUS
: Who
lesa
le In
vent
orie
s MoM
UK: S
&P
Glob
al/C
IPS
UK C
onst
ruct
ion
PMI
US: I
nitia
l Job
less
Cla
ims
EC: E
CB M
ain
Refi n
anci
ng R
ate
CH: T
rade
Bal
ance
JN: M
achi
ne T
ool O
rder
s YoY
UK: R
ICS
Hou
se P
rice
Bal
ance
IN: I
ndus
tria
l Pro
duct
ion
YoY
CH: C
PI Y
oYUS
: CPI
MoM
US: U
. of M
ich.
Sen
timen
tJN
: PPI
YoY
1314
1516
17
IN: C
PI Y
oYUK
: Ind
ustr
ial P
rodu
ctio
n M
oMUK
: Tra
de B
alan
ce G
BP/M
nUK
: Ind
ex o
f Ser
vice
s 3M
/3M
IN: E
xpor
ts Y
oYIN
: Who
lesa
le P
rice
s YoY
JN: I
ndus
tria
l Pro
duct
ion
MoM
UK: J
oble
ss C
laim
s Cha
nge
US: P
PI F
inal
Dem
and
MoM
US: F
OM
C Ra
te D
ecis
ion
(Upp
er B
ound
)US
: Ret
ail S
ales
Adv
ance
MoM
JN: C
ore
Mac
hine
Ord
ers M
oMJN
: Ter
tiary
Indu
stry
Inde
x M
oMCH
: Ind
ustr
ial P
rodu
ctio
n Yo
Y
UK: B
ank
of E
ngla
nd B
ank
Rate
US: I
nitia
l Job
less
Cla
ims
US: H
ousi
ng S
tart
sUS
: Phi
lade
lphi
a Fe
d Bu
sine
ss O
utlo
okJN
: Tra
de B
alan
ce
EC: C
PI Y
oYUS
: Ind
ustr
ial P
rodu
ctio
n M
oMUS
: Lea
ding
Inde
xUK
: Ret
ail S
ales
Inc
Auto
Fue
l MoM
JN: B
OJ P
olic
y Ba
lanc
e Ra
te
2021
2223
24
UK: R
ight
mov
e H
ouse
Pri
ces M
oMJN
: Tok
yo C
ondo
min
ium
s for
Sal
e Yo
YUS
: Exi
stin
g H
ome
Sale
sUS
: Chi
cago
Fed
Nat
Act
ivity
Inde
xEC
: ECB
Cur
rent
Acc
ount
SA
UK: C
PI Y
oYUS
: MBA
Mor
tgag
e Ap
plic
atio
nsEC
: Con
sum
er C
onfi d
ence
UK: R
PI M
oMUK
: Hou
se P
rice
Inde
x Yo
Y
US: I
nitia
l Job
less
Cla
ims
UK: P
SNB
ex B
anki
ng G
roup
sUS
: Cur
rent
Acc
ount
Bal
ance
UK: P
ublic
Fin
ance
s (PS
NCR
)
US: U
. of M
ich.
Sen
timen
tUS
: New
Hom
e Sa
les
JN: N
atl C
PI Y
oYUK
: GfK
Con
sum
er C
onfi d
ence
JN: P
PI S
ervi
ces Y
oY
2728
2930
US: D
urab
le G
oods
Ord
ers
US: P
endi
ng H
ome
Sale
s MoM
US: D
alla
s Fed
Man
f. Ac
tivity
JN: L
eadi
ng In
dex
CIUS
: Cap
Goo
ds O
rder
s Non
def E
x Ai
r
US: C
onf.
Boar
d Co
nsum
er C
onfi d
ence
UK: N
atio
nwid
e H
ouse
PX
MoM
US: W
hole
sale
Inve
ntor
ies M
oMUS
: Ric
hmon
d Fe
d M
anuf
act.
Inde
xUS
: FH
FA H
ouse
Pri
ce In
dex
MoM
US: G
DP
Annu
aliz
ed Q
oQJN
: Ret
ail S
ales
YoY
EC: C
onsu
mer
Con
fi den
ceUS
: Per
sona
l Con
sum
ptio
nJN
: Ret
ail S
ales
MoM
IN: E
ight
Infr
astr
uctu
re In
dust
ries
JN: I
ndus
tria
l Pro
duct
ion
MoM
US: I
nitia
l Job
less
Cla
ims
UK: G
DP
QoQ
US: P
erso
nal I
ncom
e
IN: I
ndia
, US:
Uni
ted
Stat
es, E
C: E
urop
ean
Unio
n, U
K: U
nite
d Ki
ngdo
m, C
H: C
hina
, JN
: Jap
an
Wor
ld ec
onom
ic ca
lend
ar
June
202
2

61 June 2022INSIGHT
For institution business please contactMr. Dilip Minny (Co-founder- Institution); Mobile: +91 90070 66096; Email: [email protected]
Products Products Contact
• Dhanush (Mobile App & Web base)• Online Equity, Derivative,
Currency and Commodity Trading Facility
• DhanushMF (Mobile App & Web base)• A One Stop Solution to all
your Mutual Funds needs online.
• Back Offi ce Reports on WhatsApp. Ashika BOT on Whatsapp / Telegram.
• Ask ACIRA -• Online Customer service for
clients on our website.
• Margin Trading Facility (MTF)• With this MTF facility client
can trade inspite of debits beyond T+7.
• EKYC • It now takes just 30 mins to open an
Account.
• ReKYC • Hassle-free & paperless modifi cation
without stepping out.
• Research Services• A galaxy of potential research team
to provide the best equity research reports, ideas, solving queries and many more.
• Online Fund Transfer Facility
• Securities Lending and Borrowing (SLB)• Provide securities lending and
borrowing at a market competitive rate
• Depository Services (CDSL/NSDL)• Provide one roof solution wherein
seamless trading could be ensured through DP maintained with Ashika
For Business Opportunity please contact
Mr. Amit Jain (Executive Director)Mobile: +91 90070 66000E-mail: [email protected]
Mr. Niraj Sarawgi (CEO - PCG) Mobile: +91 91676 16989Email: [email protected]
For Services please contact Mr. Nand Kishore Jajoo(Head - DP & KYC) Mobile: +91 90070 66028Email: [email protected]
Services at Ashika Stock Broking Limited
For start-up investing please contactMr. Chirag Jain (CEO); Contact: +91 22 66111700; E-mail: [email protected]
Capital Markets Fund Raising Advisory Contact
• Issue Management • IPO / FPO• Right Issue• Qualifi ed
Institutional Placement
• Open Off er • Takeover • Buyback • Delisting
• Overseaslisting
• Underwriting
• Private Equity• Venture / Growth
Capital• Pipe
• Debt Syndication• Project Finance• Team Loan• Working Capital
Loan• Acquisition
Funding• Construction
Finance
• M&A• Merger / Acquisition /
Disposal• Management buy-outs /
buy-ins• Leveraged buy-outs• Joint Ventures• Strategic Partnership• Spin-Off s• Divestment
• Corporate restructuring• Capital Restructuring • Finance Restructuring
• Business Valuation• ESOP Valuation • Fairness Opinion
For Debt Fund Raising / Mergers & Acquisition / Business Opportunity please contact
Mr. Yogesh ShetyeContact: + 91 22 6611 1770E-mail: [email protected]
Services at Ashika Capital Limited

62June 2022 INSIGHT
Ashika Global Securities Pvt. Ltd is the holding company of Ashika Group, a RBI-registered non-deposit taking NBFC engaged in providing long term and short-term loans & advances to individual & body corporate and Investment in shares and securities. It has 6 subsidiaries and 1 associate company i.e. Ashika Credit Capital Ltd.
Ashika Global Securities Pvt. Ltd.
It is the Flagship company of the group and incorporated in the year 1994. RBI registered Non-banking Financial Company carrying on NBFI Activities i.e. investment in shares & securities and providing Loan to Individuals, corporates HNI etc. The company fl oated its shares to public in 2000 and got listed with CSE. Thereafter, in 2011, the shares were traded on BSE under permitted category and in 2014 got listed with MSEI. It has a registered FII as one of its investors.
Ashika Credit Capital Ltd.
Ashika Investment Managers Private Limited, a private limited company incorporated on July 13, 2017, is a wholly owned subsidiary of Ashika Global Securities Private Limited. It is acting as the Investment Manager to Ashika Alternative Investments, a Trust being registered as a Category III Alternative Investment Fund (Registration Number: IN/AIF3/20-21/0811) with the Securities and Exchange Board of India (“SEBI”) under the SEBI (Alternative Investments Funds) Regulations, 2012 (“AIF Regulations”).
Ashika Investment Managers Pvt. Ltd.

63 June 2022INSIGHT
AWARDS
Helping Clients Reach for Better Via SIP – National from Franklin Templeton Investments, 2018NSDL STAR PERFORMANCE AWARD 2018
NSE Market Achievers Award 2018REGIONAL RETAIL MEMBER OF THE YEAR 2018 -
EASTERN INDIA
NSE Market Achievers Award 2017REGIONAL RETAIL MEMBER OF THE YEAR 2017 -
EASTERN INDIA
NSDL Stock Performer Awards of the Year 2019
BTVI Emerging Company of the Year 2019
CDSL Excellent Performer in Depository Services
BTVI Young Business Leader of the Year 2019

64June 2022 INSIGHT
Ashika Stock Broking Ltd.Ashika Stock Broking Limited (“ASBL”) started its journey in the year 1994 and is presently off ering a wide bouquet of services to its valued clients including broking services, depository services and distributorship of fi nancial prod-ucts (Mutual funds, IPO & Bonds). It became a “Research Entity” under SEBI (Research Analyst) Regulations 2014 in the year of 2015 (Reg No. INH000000206).
ASBL is a wholly owned subsidiary of Ashika Global Securities (P) Ltd., a RBI registered non-deposit taking NBFC Company. ASHIKA GROUP (details enumerated on our website www.ashikagroup.com) is an integrated fi nancial service provider inter alia engaged in the business of Investment Banking, Corporate Lending, Com-modity Broking, Debt Syndication & Other Advisory Services.
There were no signifi cant and mate-rial disciplinary actions against ASBL taken by any regulatory authority during last three years except routine matters.
DISCLOSUREResearch reports are being prepared and distributed by ASBL in the sole capacity of being a Research Analyst under SEBI (Research Analyst) Regu-lations 2014. The following disclosures and disclaimer are an essential part of any Research Report so being distributed.
1) ASBL or its associates, its Research
Analysts (including their relatives) may have fi nancial interest in the subject company(ies). And, the said fi nancial interest is not limited to having an open stock market position in /acting as advisor to /having a loan transaction with the subject com-pany(ies) apart from registration as clients.
2) ASBL or its Research Analysts (including their relatives) do not have any actual / benefi cial ownership of 1% or more of securities of the subject company(ies) at the end of the month immediately preceding the date of publication of the source research report or date of the concerned public appearance. However, ASBL’s associates may have actual / benefi cial ownership of 1% or more of securities of the subject company(ies).
3) ASBL or its Research Analysts (including their relatives) do not have any other material confl ict of interest at the time of publication of the source research report or date of the concerned public appearance. However, ASBL’s associates might have an actual / potential confl ict of interest (other than ownership).
4) ASBL or its associates may have received compensation for investment banking, merchant banking, broker-age services and for other products and services from the subject compa-nies during the preceding 12 months. However, ASBL or its associates or its
Research analysts (forming part of Research Desk) have not received any compensation or other benefi ts from the subject companies or third parties in connection with the research report/ research recommendation. Moreover, Research Analysts have not received any compensation from the companies mentioned in the research report/ recommendation in the past twelve months.
5) The subject companies in the research report/ recommendation may be a client of or may have been a client of ASBL during the twelve months preceding the date of con-cerned public appearance for invest-ment banking/ merchant banking / brokerage services.
6) ASBL or their Research Analysts have not managed or co–managed public off ering of securities for the subject company(ies) in the past twelve months. However, ASBL’s associates may have managed or co–managed public off ering of securities for the subject company(ies) in the past twelve months.
7) Research Analysts have not served as an offi cer, director or employee of the companies mentioned in the report/ recommendation.
8) Neither ASBL nor its Research Analysts have been engaged in market making activity for the companies mentioned in the report / recommendation.
DISCLAIMERThe research recommendations and information are solely for the personal information of the authorized recipient and does not con-strue to be an off er document or any investment, legal or taxation advice or solicitation of any action based upon it. This report is not for public distribution or use by any person or entity, where such distribution, publication, availability or use would be contrary to law, regulation or subject to any registration or licensing requirement. We will not treat recipients as customer by virtue of their receiving this report. The report is based upon the information obtained from public sources that we consider reliable, but we do not guarantee its accuracy or completeness. ASBL shall not be in anyways responsible for any loss or damage that may arise to any such person from any inadvertent error in the information contained in this report. The recipients of this report should rely on their own investigations.

65 June 2022INSIGHT
Gyanada e-learning initiative launching soon!Ashika Group supports charitable foundation to fuel the aspirations of young girls in India.With our vision to develop essential 21st century capacities, computational thinking and working with computer-based systems, we will be launching our e-learning module by September,2020.It has been designed as two sub-initiatives: Every Child Can Code (ECCC) and Makers in the making (MIM).
Updates on the Gyanada Labs In-School program Our updates for the month of May 2022:
• We have completed our year 1 of in-school computer program in 2 schools in the academic year 201-22. We will continue with the program in year 2.
• Teachers have been reviewed we will be adding 2 new computer teachers in the coming academic year.
Help us change computer education for children in low income schools. Support us set up 10 Gyanada labs in to low-income schools in the coming academic year. In the coming academic year, we aim to set up 10 Gyanada labs in 10 schools. In every school we want to set up 15 low cost Raspberry pi computers. Every Gyanada lab will impact the lives 800-1000 children every year. The labs will enable the schools to provide quality computer education that is open source and aff ordable.
The cost of 1 Raspberry pi enabled system is INR 12000.
The cost of 5 Raspberry pi enabled system is INR 60000
The cost of 1 child receiving computer education for a year is INR 225
Please support our mission to enable the lives of more than 8000 school children in the coming academic year. To support kindly click here https://tinyurl.com/58tsr29a
We, at Gyanada Foundation, engage students in practical learning. For this we provide kids with Gyanada Lab Kits. To help us fund these kits, visit: https://gyanada.org/donate.html. You can also write to us at [email protected] or connect with us at 9819044922. Our bank details are:
GYANADA FOUNDATION HDFC Bank, Stephen House Branch, Current A/c No. 50200002885400
IFSC CODE: HDFC0000008
MICR CODE: 700240002

66June 2022 INSIGHT
A
PR
OD
UCT
| in
fo@
tris
ysco
m.c
om
Registered Offi ceTrinity226/1, A.J.C. Bose Road7th Floor, Kolkata-700020Phone: 033-4010 2500Fax No: 033-4010 2543
Toll Free No.: 1800 212 2525For any research related query: [email protected]
Corporate Offi ce1008, Raheja Centre,214, Nariman Point, 10th FloorMumbai-400021Phone: 022-6611 1700Fax No: 022-6611 1710
Group CompaniesAshika Stock Broking Ltd.
(Member: NSE, BSE, MSEI, MCX, NCDEX, ICEX Depository par-ticipant of CDSL / NSDL, Research Analyst, AMFI- Registered
Mutual Fund Distributor)
CIN No. U65921WB1994PL217071SEBI Registration No: INZ000169130
SEBI Registration No: INH00000006 (RA)
Ashika Credit Capital Ltd.(RBI Registered NBFC)
CIN No. L67120WB1994PLC062159
Ashika Capital Ltd.(SEBI Authorised Merchant Banker)CIN No. U30009WB2000PLC091674SEBI Registration No: INM000010536
Ashika Investment Managers Pvt. Ltd.(Investment Manger to Ashika Alternative Investments, a Category III AIF registered with SEBI)CIN number – U65929MH2017PTC297291SEBI Registration No: IN/AIF3/20-21/0811
Ashika Global Securities Pvt. Ltd.(RBI Registered NBFC)CIN No. U65929WB1995PTC069046
www.ashikagroup.com
Copyright © 2022 FDOKUMEN