IBRD-Financial-Statements-June-1981.pdf - World Bank ...
214
WORLD BANK ANNUAL REPORT 1981 o k f. 1, VA0)00'4; N S~~~~~~~~~~~~~~~~~~~~~~~~~~~~~~~~~~~~~~~~~~~~~~~~~~~~~ Public Disclosure Authorized Public Disclosure Authorized Public Disclosure Authorized isclosure Authorized
-
Upload
khangminh22 -
Category
Documents
-
view
0 -
download
0
Transcript of IBRD-Financial-Statements-June-1981.pdf - World Bank ...

WORLD BANK ANNUAL REPORT 1981
o k f. 1, VA0)00'4;
N S~~~~~~~~~~~~~~~~~~~~~~~~~~~~~~~~~~~~~~~~~~~~~~~~~~~~~
Pub
lic D
iscl
osur
e A
utho
rized
Pub
lic D
iscl
osur
e A
utho
rized
Pub
lic D
iscl
osur
e A
utho
rized
Pub
lic D
iscl
osur
e A
utho
rized


WORLD BANKANNUAL REPORT 1981
ll=i World Bank1818 H Street, NW.
IM Washington, D.C. 20433

2
Cover: One of three experimental windmills on Lake Photo CreditsVictoria that supply energy to nearby villages. The Cover: Kay Chernushwindmill was manufactured by a small-scale Frontispiece: Yosef Hadarmetalworks factorv that has been assisted by the Page 33: James PickerellKenya Industrial Estates, a beneficiary of a $10 Page 39: Ivan A. Andrewsmillion IDA credit. Page 51: Kay Chernush
Page 57: Tomas SennettPage 63: Giuseppe Franchini
Frontispiece: An agricultural extension agent Page 68: Ray Witlinchecking a farmers millet crop in Gusau, Nigeria. Page 72: Philip Boucas

3
The World Bank
The World Bank is a group of three to date. The funds used by IDA, called creditsinstitutions, the International Bank for to distinguish them from Bank loans, comeReconstruction and Development (IBRD), mostly in the form of subscriptions, generalthe International Development Association replenishments from IDA's more industrialized(IDA), and the International Finance and developed members, special contributionsCorporation (IFC). by IDA's richer members, and transfers from
The common objective of these institutions the net earnings of the World Bank. The termsis to help raise standards of living in develop- of IDA credits, which are made to govern-ing countries by channeling financial resources ments onlv, are 10-year grace periods, 50-yearfrom developed countries to the developing maturities, and no interest. An annual serviceworld. fee of 0.75 percent is charged on the disbursed
The World Bank, established in 1945, is portion of each credit. Although legally andowned by the governments of 139 countries. financially distinct from the Bank. IDA isThe Bank, whose capital is subscribed by its administered by the same staff.member countries, finances its lending opera- The IFC was established in 1956. Its functiontions primarily from its own borrowings in the is to assist the economic development of lessworld capital markets. A substantial contribu- developed countries by promoting growth intion to the Bank's resources also comes from the private sector of their economies and help-its retained earnings and the flow of repay- ing to mobilize domestic and foreign capitalments on its loans. Bank loans generally have for this purpose. Membership in the Bank is aa grace period of five years and are repayable prerequisite for membership in the IFC, whichover 20 years or less. They are directed toward totals 115 countries. Legally and financially, thedeveloping countries at more advanced stages IFC and the Bank are separate entities. Theof economic and social growth. The interest Corporation has its own operating and legalrate the Bank charges on its loans is calculated staff, but draws upon the Bank for administra-in accordance with a guideline related to its tive and other services.cost of borrowing. While the World Bank has traditionally
The Bank's charter spells out certain basic financed all kinds of capital infrastructure suchrules that govern its operations. It must lend as roads and railways, telecommunications,only for productive purposes and must stimu- and ports and power facilities, its presentlate economic growth in the developing coun- development strategy places a greatlytries where it lends. It must pay due regard to increased emphasis on investments that canthe prospects of repayment. Each loan is made directly affect the well-being of the masses ofto a government or must be guaranteed by the poor people of developing countries by makinggovernment concerned. The use of loans can- them more productive and by integrating themnot be restricted to purchases in any particular as active partners in the development process.member country. And the Bank's decisions to This strategy is increasingly evident in thelend must be based only on economic agriculture and rural development projects thatconsiderations. the Bank and IDA help finance. It is also evi-
The International Development Association dent in projects for education and family plan-was established in 1960 to provide assistance ning and nutrition, and in the Bank's concernfor the same purposes as the Bank, but pri- for the urban poor, who benefit from projectsmarily in the poorer developing countries and designed to develop water and sewerageon terms that would bear less heavily on their facilities, as well as "core" low-cost housing,balance of payments than Bank loans. IDA's and to increase the productivity of smallassistance is, therefore, concentrated on the industries.very poor countries-mainly those with an At the same time, lending for traditionalannual per capita gross national product of less projects continues, but it is being redirectedthan $681 (in 1979 dollars). More than 70 coun- towards becoming more responsive to the newtries are eligible under this criterion. strategy of deliberately focusing on the poorest
Membership in IDA is open to all members segments of society in the developingof the World Bank and 125 of them have joined countries.

4
Contents
The World Bank 3
The Executive Directors and Alternates 9
The Record for Ten Years, 1972-1981 10
Chapter One: The World Bank: Fiscal 1981, in Brief 11Presidential Succession 11Patterns of Lending 11Disbursements 15Currency Pooling 15IDA: The Sixth Replenishment 15Bank Staff 16Membership 17ICSID 17IFC 17
Chapter Two: The Economic Scene: A Global Perspective 19
Chapter Three: 1981 Regional Perspectives 31Eastern Africa 31Western Africa 37East Asia and Pacific 43South Asia 49Europe, Middle East, and North Africa 55Latin America and the Caribbean 60
Chapter Four: Bank Policies and Activities, Fiscal 1981 67Bank Policies
Energy 67Structural Adjustment Review 69Agricultural Research 71
Bank ActivitiesEconomic Development Institute 73Technical Assistance 75Inter-Organizational Cooperation 76Economic Research and Studies 80Operations Evaluation 82Internal Auditing 83

Contents 5
Chapter Five: Borrowings and Finance 84
Chapter Six: Executive Directors 95
Executive Directors 95Joint Audit Committee 97
Projects Approved for Bank and IDA Assistance in Fiscal 1981, by Sector 99
Projects Approved for Bank and IDA Assistance in Fiscal 1981, by Region 120
Projects Approved for Bank and IDA Assistance in Fiscal 1981, by Purpose 122
Statistical AnnexIndex 127General Notes to Annex Tables 128Tables 1-10 130
Bank AppendicesIndex 151Financial Statements 152
IDA AppendicesIndex 169Financial Statements 170
Bank/IDA AppendicesIndex 185Appendix 1: Bank and IDA Cumulative Lending Operations,
by Major Purpose and Region, June 30, 1981 186Appendix 2: Bank and IDA Cumulative Lending Operations,
by Borrower or Guarantor, June 30, 1981 188Appendix 3 Statement of Loans 4pproved during Fiscal Year 1981 191Appendix 4: Statement of Credits Approved during Fiscal Year 1981 196Appendix 5: Budgets of the Bank and IDA 200Appendix 6: Governors and Alternates of the Bank and IDA 202Appendix 7: Executive Directors and Alternates of the Bank and IDA 205Appendix 8: Officers and Departnment Directors of the Bank and IDA 206Appendix 9: World Bank Offices 208

6 Contents
Text Tables
Chapter One
Distribution of Bank and IDA Commitments, by Sector-Amounts 12Distribution of Bank and IDA Commitments, by Sector-Percentages 13Distribution of Bank and IDA Commitments, by Income Group 13IDA: Advance Contributions to the Sixth Replenishment 16
Chapter Two
Table 1. Real Growth of GNP and GNP per Capita, 1966-80 19Table 2. Industrial Countries: Real Growth and Inflation, 1977-80 20Table 3. Current-Account Balances, 1970-80 21Table 4a. Balance-of-Payments Financing of Oil-Importing
Developing Countries, 1978 and 1980 22Table 4b. BaLance-of-Payments Financing of Low-Income Oil-Importing
Developing Countries, 1978 and 1980 23Table 4c. Balance-of-Payments Financing of Middle-Income Oil-Importing
Developing Countries, 1978 and 1980 23Table 5. Public and Private Debt of the Developing Countries 24Table 6. Debt and Debt-Service Indicators of Public Debt 25Table 7. Net Disbursements of Official Development Assistance, 1976-80 26Table 8. Total Merchandise Exports, 1965-80 26
Chapter Three
Borrowers, Fiscal 1979-8 1: Population and per Capita GNP, 1979Eastern Africa 31Western Africa 37East Asia and Pacific 43South Asia 49Europe, Middle East. and North Africa 55Latin America and the Caribbean 60
Lending to Borrowers. by Sector, 1972-81Eastern Africa 32Western Africa 38East Asia and Pacific 44South Asia 50Europe, Middle East, and North Africa 56Latin America and the Caribbean 62
Bank and IDA: Trends in Lending, by Sector, 1979-81-Amounts and Percentages 66

Contents 7
Chapter Four
Cofinancing of Bank- and IDA-Assisted Projects, by Region, 1978-1981 80
Chapter Five
Bank Borrowings in Fiscal 1981 86Outstanding Obligations of the Bank 86Cost of the Bank's Average Outstanding Borrowings 86World Bank Borrowings, Fiscal Year 1981 87Increases in Subscriptions in the Bank's Subscribed Capital 88Borrowing in International Capital Markets 89
FiguresChapter One
Bank and IDA: Lending to Countries with Annual per Capita Incomebelow $371, 1972-81 14
Chapter Two
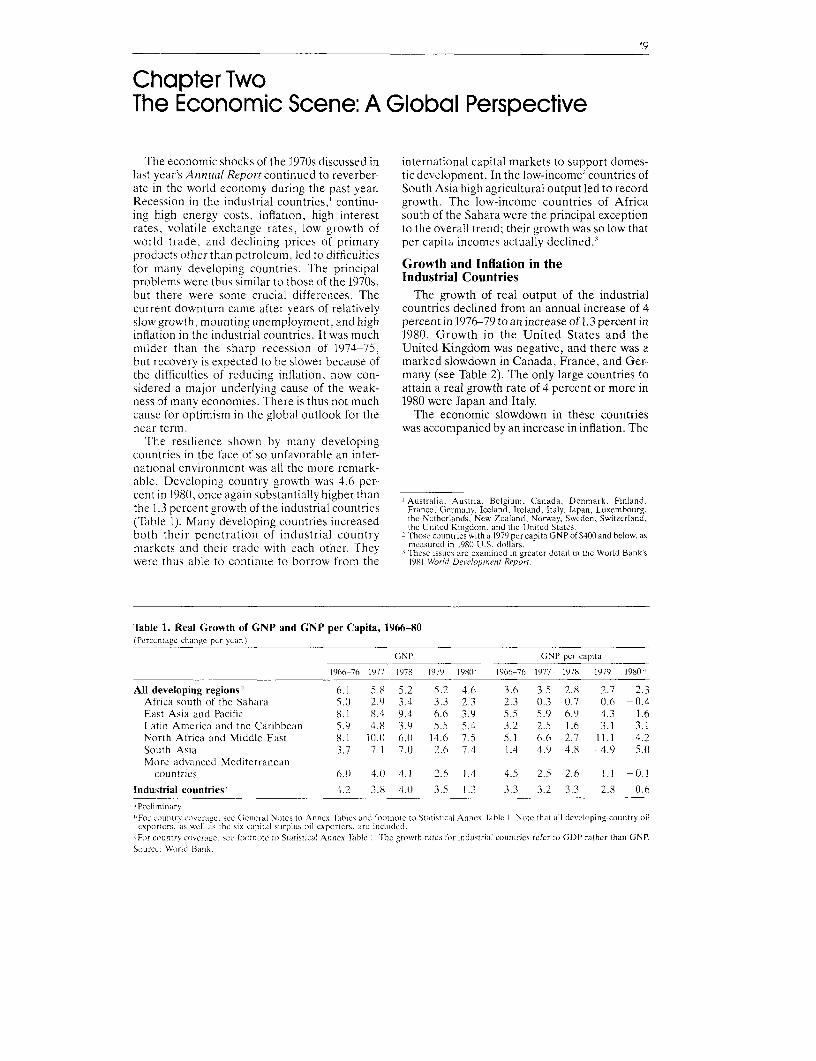
Petroleum Export Prices 27
Chapter Three
Trends in Lending, 1972-81Eastern Africa 31Western Africa 37East Asia and Pacific 43South Asia 49Europe, Middle East, and North Africa 55Latin America and the Caribbean 60
Chapter Five
World Bank: Gross Borrowings, 1972-81 85


9
The Executive Directors and Alternates
Executive Directors Alternates
Y. S. M. Abdulai William SmithJohn Anson Derek F. SmithDavid Blanco Alberto SolaJacques de Groote Turan Kivan,Earl G. Drake Reno J. BrownSaid E. El-Naggar Saleh A. Al-HegelanJaime Garcia-Parra Jose G. CardenasIsmail Khelil Saad ZerhouniEberhard Kurth Norbert Schmidt-GerritzenAnthony IJ. A. Looijen Miodrag M. StojiljkovicHans Lundstrom Ole L. PoulsenS. A. McLeod Anthony S. ColePaul Mentre de Loye Marthe ParentSeiji Morioka Kimiaki NakajimaJoaquin Muns Roberto Mayorga-CortesGiorgio Ragazzi Rodrigo M. GuimaraesH. N. Ray M. Syeduz-ZamanArmand Razafindrabe Nicephore SogloWang Liansheng Chen HuiZain Azraai Aung Pe
The Executive Directors of the thoughtful leadership as Chairman ofInternational Bank for Reconstruction the Board of Directors of the Bankand Development and the and IDA and for his dedication to theInternational Development interests of the Bank and IDA andAssociation have had prepared this their member countries.Annual Report for the fiscal year July The Directors also express their1,1980 to June 30, 1981 in accordance appreciation to the more than 5,000with the By-Laws of the two men and women staff members of theorganizations. A.W. Clausen, who Bank for their dedication to thesucceeded Robert S. McNamara as institution's ideals. They note that thePresident of the Bank and the continued professionalism of the staffAssociation and as Chairman of the has made it possible for the Bank toBoards of Executive Directors on July increase its operations without1. 1981, has submitted this Report, decreasing the attention paid totogether with accompanying economic analysis and projectadministrative budgets and audited appraisal supervision and evaluation.financial statements, to the Board of aGovernors. The Annual Reports of the
International Finance Corporation andThe Directors wish to take this the International Centre foropportunity to thank Mr. McNamara Settlement of Investment Disputesfor his thirteen years of dynamic and are published separately.
August 4, 1981

10
The Record for Ten Years, 1972-81
Fiscal year
1972 1973 1974 1975 1976 1977 1978 1979 198(1 1981
World Bank
US$ millions
Loan amounts 1,966 2,051 3,218 4,320 4,977 5,759 6,098 6,989 7,644 8,809
Disbursements 2 1,182 1,180 1,533 1,995 2,470 2,636 2,787 3,602 4,363 5,063
Total income 646 758 929 1,157 1,330 1,617 1,947 2,425 2,800 2,999
Net income 183 186 216 275 220 209 238 407 588 610
Total reserves 1,597 1,750 1,772 1,902 1,916 2,026 2,245 2498 2,893 2,859
Borrowings: total 1,744 1,723 1,853 3,510 3,811 4,721 3,636 5,085 5,173 5,069
Borrowings: net 1,136 955 990 2,483 2,530 3,258 2,171 3,235 2,382 2,347
Subscribed capital 26,607 30,397 30,431 30,821 30,861 30,869 33,045 37,429 39,959 36,614
number
Operations approved 72 73 105 122 141 161 137 142 144 140
Borrowing countries 40 42 49 51 51 54 46 44 48 50
Member countries 117 122 124 125 127 129 132 134 135 139
Professional staff(number) 1,516 1,654 1,752 1,883 2.066 2,203 2,290 2.382 2,474 2,552
IDA
US$ millions
Credit amounts 1,000 1,357 1,095 1,576 1,655 1,308 2,313 3,022 3,838 3,482
Disbursements 261 493 711 1,026 1,252 1,298 1,062 1,222 1.411 1,878
Usable resources,cumulative 4,204 7,019 7,433 11,608 11,514 11,789 18,062 19,661 20,773 22,331
number
Operations approved 3 68 75 69 68 73 67 99 105 103 106
Borrowing countries 38 43 41 39 39 36 42 43 40 40
Member countries 108 112 113 114 116 117 120 121 121 125
l Excludes oars to IFs of $60 million in FY1972, $40 millor in FY1973, $110 million in FY1974, $50 million ir FY1975, $70 millnion FY1976,$20 mill on n FY1977, and $100 m lion in FY1981. Includes amounts in FY1976 and FY1977 lent on Third Wincow terms.
2 Excludes disbirsemerts on loans to IFC
3 Joint Bark/IDA operations are counted on y once as Bank operations

Chapter OneThe World Bank: Fiscal 1981, in Brief
In fiscal 1981' lending commitments by the Presidential SuccessionWorld Bank, credit approvals from the Interna- On June 30,1981, Robert S. McNamarational Development Association (IDA). and OnJun e nt1obe B amarainvestment commitments bv the International retired as President of the Bank Group.Finance Corporation (IFC) amounted to $13,102 Mr. McNamara had served as presidentmillion, up $940 million (8 percent) from the for thirteen years.previous year.2 On July 1,1981, A. W. Causen became
The Bank committed $8o(u9 million in sup- the sixth president of the Bank Group. Heport of 140 projects in fifty countries. In fiscal was elected to the position by the Bank's1980, financial assistance from the Bank totaled Executive Directors in December 1980).$7,644 million for 144 projects in forty-eightmeinber countries.
IDA credits approved during the vearamounted to $3,482 million equivalent; of that Patterns of Lendingamount, 75 percent was in the form of commit- Trends in the pattern of lending bv the Bankments. These credit approvals were in support of and by IDA have evolved as a direct result of106 projects in forty countries. In fiscal 1980. Bank policies as periodically reaffirmed inIDA commitments stood at $3,838 million, and numerous discussions by the Executive Direc-103 projects were assisted in fortv countries. tors over the past ten vears. Discernible changes
World Bank loans and IDA credits helped in the distribution of funds by country incomefinance about 35 percent of the cost of projects group and by sector have not come about,for which total amounts could be calculated. therefore, by accident. The distribution of Bank
IFC investments in fiscal 1981 were $811 and IDA funds in fiscal 1981 thus reflects deci-million, up $130 million over fiscal 1980. A total sions some of which were made years before.3of fifty-six investments were approved in thirty-four countries. Distribution by Income Group. The extent of
Other highlights in fiscal 1981 included: poverty in a member country is an important-Disbursements by the Bank and IDA of determinant in the allocation of Bank and IDA
$6,941 million, up $1,167 million (2() percent) resources. Low-income countries (those with aover fiscal 1980. Bank disbursements were per capita gross national product (GNP) below$5,063 million: IDA disbursements stood at $371 as measured in 1979 U.S. dollars) have$1,878 million equivalent. Fiscal 1980 disburse- received a steadily increasing proportion ofments by the Bank totaled $4,363 million; IDA Bank and IDA lending. The major source ofdisbursements for fiscal 198Swere $1.41t million; funds for these countries is IDA, and the severe
-A net transfer of resources (disbursements structural weaknesses of most of theirminus repayments of principal, interest. and economies, and thus their limited capacity toother charges) by the Bank and IDA to develop- service debt, imply continued reliance on IDAing member countries of $3,362 million, a figure for most of their funds for the foreseeable future.$73(0 million (28 percent) above that of fiscal1980:
-Cofinancing of Bank-assisted and IDA- Yhe fiscal Ycar oI the \Vorld Bank. as xncll as of its two affiliates.
assisted projects of $4.038 million, down $2.478 ruins from July I to Jtinc 30.
million, or 38 percent, from fiscal 1980W Siice the rQal value of loan conmrinitlnnts by the Bank and IDAtcrorLed( to tho extent that cost inflation occurs over the period ofi
-An increase in the Bank's net income of $22 disburscments, it is the practice of thc Ban11k to make illoaitcesfor itflatolt at the timc ofcomrnintmelntire lelaltOr row U>Cd tOmillion (4 percent) to $61t0 million; exprcss nciidinig in real tcrms is a weighted ascraigc of thc price
-Bank borrowings of $5,069 million, mostlv lcsels as,umed to hc prevailing ovcrthe period of the cxecution ot
in the capital markets of Europe and Japan. That exprolsst. iTI trnsal oif( Bank allnrd IthIvA woumdicn 1r4 w3rc to iie
amount does not include $646 million that had Stgunticint v,rr.ttortnsl iiccur. howcr. tre reyar ii rNear it thte
been borrowed in fiscal 1980 and credited to the pattern loi lcirtdng. Suclr sintelc-vear variitiorrs most ofteit rcfectonly a oinen,,car step int the Bankrs leaiding to it, hoirontig, mem.
fiscal 1981 borrowing program. her ciraritric., rather than a change iti its lendinrt program.

12 The World Bank: Fiscal 1981, in Brief
accomplished especially through lending forNote on Dollar Amounts structural adjustment. Increases in Bank lending
have been justified on the grounds thatDollar amounts used in the text of the availability of Bank resources could help these
Annual Report refer to current United States countries achieve a better allocation of their owndollars. Where special drawing right (SDR) resources, both through the careful selection ofamounts are used for the capital of the Bank pone SDR equals 1.15060 current United States projects for Bank financig and through thedollars at June 30, 1981 (one SDR equaled Bank's policy analysis and institution-building1.32438 current United States dollars at June advice. IDA funds do continue, however, to play30, 1980). an important though declining role for the
For a detailed discussion and the basis for "lower middle-income" countries, those with aSDR amounts used for IDA subscriptions andcontributions. see IDA Appendices: Appen- per capita GNP of between $371 and $680 asdix F-Notes to Financial Statements. measured in 1979 U.S. dollars.
Combined Bank and IDA lending to all mid-dle-income countries amounted to 57 percent of
In fiscal 1981, low-income countries received total commitments in fiscal 1981 (76 percent of35 percent of the combined commitments of the total Bank lending and 14 percent of alt IDABank and IDA compared with 27 percent commitments). In the period through fiscal 1968,through fiscal 1968. These countries accounted lending to such countries accounted for 37 per-for 87 percent of IDA commitments during the cent of combined Bank and IDA commitments.year as compared with 78 percent through fiscal In contrast, lending to the higher-income coun-1968. Low-income countries designated by the tries has declined from 36 percent of total com-UN General Assembly as being the least mitments in the period through fiscal 1968 to 8developed accounted for 10 percent of combined percent in fiscal 1981.Bank and IDA lending amounts in fiscal 1981(and 33 percent of IDA commitments) as com- Distribution by Sector. Before fiscal 1968, twopared with 4 percent through fiscal 1968. thirds of total Bank and IDA lending went to the
Efforts have been made in the past few years power and transportation sectors; agriculture,to expand Bank lending to all middle-income industry (including development finance com-countries (those with a per capita GNP of panies), and program lending accounted largelybetween $371 and $1,895). This has been for the rest. The main focus of Bank activities then
Distribution of Bank and IDA Commitments, by Sector-Amounts(In millions of current US dollars. Fiscal years.)
Amounts
ThroughSector 1968 1969-73 1974-78 1979 1980 1981
Agriculture andRural Development 1,089 2,586 10,019 2,522 3,458 3,763
Development Finance Companies 724 1,224 3,053 591 818 1,113Education 162 723 1,339 496 440 735Energy
Oil, gas, and coal 76 111 279 112 457 659Power 3,986 2,245 4,320 1,355 2.392 1,323
Industry 915 672 2,806 843 423 886Nonproject and
Structural Adjustment 1,743 722 1,556 407 522 1,012Population, Health,
and Nutrition - 66 188 114 143 13Small-Scale Enterprises 7 7 468 86 260 229Telecommunications 198 695 732 110 131 329Transportation 4,220 3,144 5,328 1,904 1.445 1,063Urbanization - 52 812 310 349 501Water Supply and Sewerage 130 589 1,329 1,019 631 535Other - 16 90 143 13 131
Total 13,250 12,849 32,320 10,011 11.482 12,291
NOTE: Details may not add to totals due to rounding.Includes nonfuel minerals and mining.
h Includes technical assistance and tourism.

Distribution by Sector 13
Distribution of Bank and IDA Commitments, by Sector-Percentages(Fiscal years.)
Percentages
ThroughSector 1968 1969-73 1974-78 1979 198() 1981
Agriculture andRural Development 8 20 30 25 30 31
Development Finance Companies 5 10 9 6 7 9Education 1 5 4 5 4 6Energy
Oil, gas, and coal 1 1 1 1 4 5Power 30 18 13 14 21 11
Industry 7 5 9 10 4 7Nonproject and
Structural Adjustment 13 6 5 4 5 8Population, Health,
and Nutrition - 1 1 1 1 -Small-Scale Enterprises - - 1 1 2 2Telecommunications 1 5 2 1 1 3Transportation 32 25 17 19 13 9Urbanization - - 2 3 3 4Water Supply and Sewerage 1 4 4 10 5 4Other b _ _ 1 _
Total 100 100 100 100 100 100
NOTE: Details may not add to totals due to rounding.Includes nonfuel minerals and mining.Includes technical assistance and tourism.
Distribution of the Bank and IDA Commitments, by Income Group(Fiscal years.)
Percentage of total
ThroughPler capita GNP' 1968 1969-73 1974-78 1979 1981' 19811
Group I Bank 18 9 15 15 10 14(up to $370) IDA 78 78 84 84 82 87
Total 27 30 32 36 34 35
Group II Bank 10 13 20 19 24 19($371-$680) IDA 8 12 14 16 18 14
Total 10 13 19 18 22 17
Group III Bank 9 14 14 17 18 16($681-$1,170) IDA 5 4 1 - - -
Total 8 11 11 12 12 11
Group IV Bank 21 38 35 35 32 41($1,171-$1,895) IDA 9 5 1 - - -
Total 19 28 26 24 22 29
Group V Bank 42 27 16 15 16 11(over $1,895) IDA - - - - - -
Total 36 18 12 10 10 8
NoTE: Details may not add to totals due to rounding.d No attempt has been made to allow for country movements from one income group to another ovcr tirne
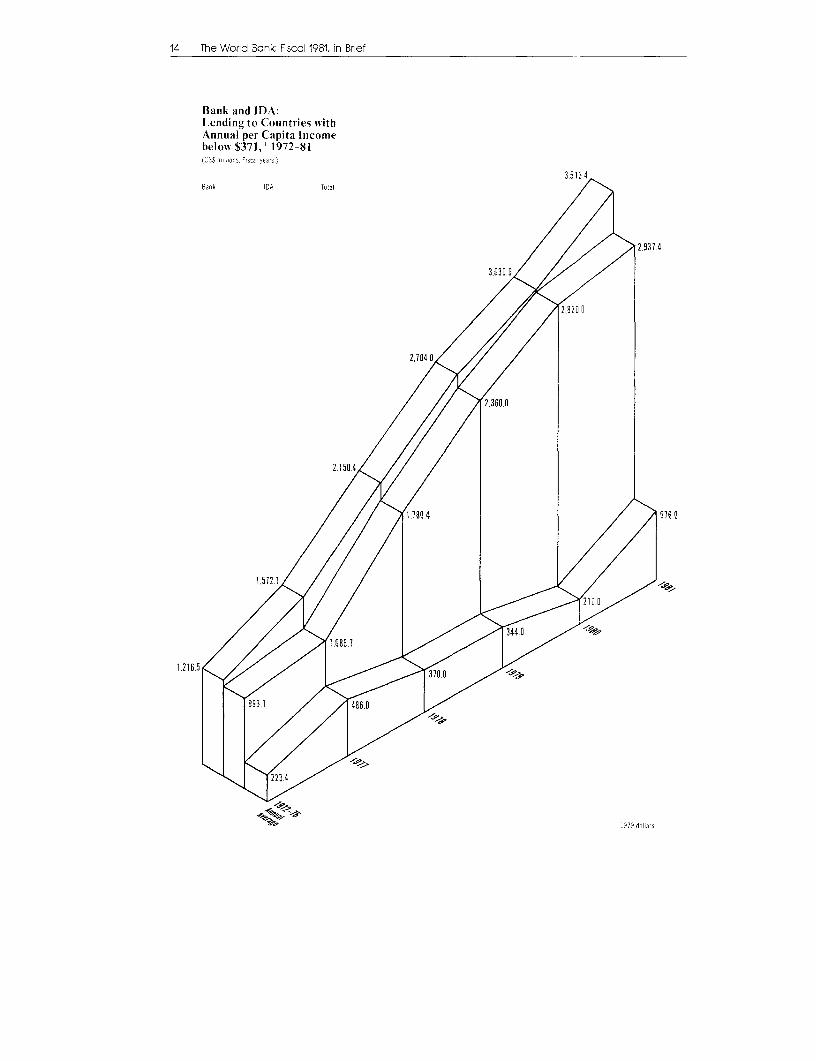
14 The Word Bank: Fiscal 1981, in Brief
Bank and IDA:Lending to Countries w^ithAnnual per Capita IncomebeloiN $371, 1972-81fLS$ m Os. F,sc2 years
35134Bank ICA TnaX
2.937.4
1~~~~~~~~~~~~~~~~~~~~~, 04.0
2.15N ~ ~~~~~~~.10
E!79 do iars

DA: The S xth Replenishment 15
was to assist member countries in strengthening Seventy-seven of the 222 loans have had dis-the basic infrastructure of their economies. bursements and, accordingly, the pool had
Subsequently, the sectoral composition of attained a value of $294.9 million equivalent bylending has shifted markedly in response to new the vear's end. There were twentv-five curren-perceptions about the development needs of its cies in the pool on June 30, 1981.member countries. Lending operations haveaddressed broader development objectives, IDA: The Sixth Replenishmentfocused on institution building, and aimed at The Sixth Replenishment of IDA, coveringprograms designed to improve the productivity fiscal years 1981-83 and providing funding in anof the rural and urban poor. amount totaling the equivalent of $12,000
million, can onlv become effective when mem-Disbursements bers. including at least 12 Part I (or developed
Disbursements on Bank loans to member countrv) members, deposit Instruments of Com-countries in fiscal year 1981 were $5,063 million, mitment and Qualified Instruments of Commit-an increase of 16 percent over the previous year. ment totaling $9,600 million (or 8() percent) withFor IDA credits. disbursements were $1,878 the Association. As of the end of the fiscal year,million equivalent, up 33 percent from fiscal this "trigger" amount had not been reached and1980. Part of the growth of disbursements was therefore the Agreement on the Sixthdue to recent increases in nonproject lending. Replenishment was not yet effective.
The volume of annual disbursements on proj- Notification of participation in the Sixthect lending is influenced by a variety of factors Replenishment by the United States is necessarysuch as the complexity of the projects, economic in order to trigger the effectiveness of the Agree-conditions in borrower countries, the size of the ment.; The United States administration isundisbursed balances on approved loans and working to ensure that its notification will becredits, and the sector and age composition of received as soon as possible. Congressionalthe undisbursed balances. There has been a authorization and appropriation is being soughtgeneral lengthening of the disbursement profile, for the full U.S. share, of $3,240 million, in thecaused by increased Bank lending to poorer three-year Sixth Replenishment period.member countries and to the more complex sec- However, the United States plans to rephase itstors to which lending increased beginning in the commitments to IDA in graduated appropria-early 1970s. As a result. the share of faster- tions of $540 million in fiscal 1981, $850) million indisbursing projects in the undisbursed balances fiscal 1982, and $1,850 million in fiscal 1983,dropped, affecting the growth of annual dis- rather than in three equal installments of $1,080bursements in the late seventies. In the last two million each year. As of June 30.1981, authoriza-years. however, disbursements on project lend- tion and appropriation measures in the twoing have resumed a moderate growth, reflecting houses of the U.S. Congress were in variousthe stabilization of the share of faster-disbursing stages of advancement.projects at a new level. Pending the effectiveness of the Sixth
Replenishment, the Association has been mak-ing credit commitments against advance con-
Currency Pooling tributions amounting to about SDR 1,837The currency pooling system, designed to million ($2,409 million) provided by twenty-two
equalize exchange rate risks among the Bank's countries. A meeting of IDA deputies, repre-borrowers, became operational on July 1, 1980, senting donor countries, was held in March tofor all new loans negotiated on or after that review the situation. The deputies expresseddate.4 In adopting this system. it had been concern at the delav in the effectiveness of theagreed that the undisbursed portions of loans Replenishment and at the serious implications ofapproved before July 1, 198(0 should also be eligi- this for development assistance to the world'sble for inclusion in the new system at the bor- poorest countries. They urged all donors whorower's option. Letters were sent to borrowers, had not yet done so to complete their notificationtherefore, recommending that they give con- procedures as soon as possible.sideration to the transfer of their undisbursed At that March meeting, the deputies recog-loan balances into the system. For those bor- nized the importance of minimizing thc interrup-rowers who indicated their intention to partici-pate. letters of agreement were signed to permitthe inclusion of such loans into the pool.
At the end of fiscal 1981, 222 loans were in the IFor furthcr dctails on thc currencv pooling systern. sce thic World' ~ ~ ~~~~~ ~Biank Antiti(/ Repoit (1979). pageCs 28 29 andle the World Bank
pool. of which 129 were loans negotiated on or .4nnual Repor ( 1980). paCes 71 - t71.
after July 1, 1981). The total commitments of the Vhe tU.. share in the Agrcincmint is 27 percent oi the total.Wlithout its notifi(ation onf participation therefore, the 80 percent
222 loans amounted to SI1,602 .5 million. "trigger" amount is unobtainable.

16 The World Bank: Fiscal 1981, ir Brief
IDA: Advance Contributions to the Sixth Replenishment(As of June 3). 1981. In millions.)
National USS SDR Unit ofCouuntrv currency equivalent equivalent obligation
Argentina $a 11,126.250 $ 7.500 SDR 5.721 US dollarAustralia $A 67.843 76.399 58.278 National currencyBrazil Cr$ 14.843 0.500 0.381 US dollarCanada Can$ 177.109 151.855 115.841 National currencyDenmark DKr 247.680 48.000 36.615 National currencyFinland Fmk 89.447 24.000 18.307 National currencyFrance F 445.500 107.609 82.086 National currencyGermany DM 880.350 500.002 381.410 SDRIceland IKr 1.370 0.359 0.274 National currencyIreland £lr 2.077 4.400 3.356 National currencyJapan Y 140,377.220 625.845 477.405 National currencvKorea, Republic of W 421.080 0.871 0.665 National currencyKuwait KD 18.400 66.666 50.853 National currencyLuxembourg LuxF 71.230 2.500 1.907 National currencyNetherlands f. 204.206 104.400 79.638 National currencyNew Zealand $NZ 2.900 2.908 2.219 National currencyNorway NKr 200.000 40.630 30.993 National currencySaudi Arabia SRls 407.421 121.800 92.913 US dollarSouth Africa R 0.826 1.000 0.763 National currencySweden SKr 460.000 110.604 84.370 National currencyUnited Kingdom £ 184.992 404.022 308.216 National currencyYugoslavia Din 127.047 6.667 5.085 National currency
TOTAL $2,408.537 SDR 1,837,296
NOTE: This table is based on IMF representative exchange rates and the SDR value of currencies published by thc IMF on October 5, 1979.
tion in IDA's operations due to a lack of similar levels. Of the remaining 265 recruited atcommitment authority. There was strong sup- higher levels, 114, or 43 percent, were fromport for the view that additional advance con- developing countries. By June 30, 1981, 2,552tributions would provide IDA with further staff at such higher levels represented 101commitment authority for a temporary period. different nationalities; 98 had been representedIt was suggested that these contributions should at the end of fiscal 1980. Thirty-four percent werebe forthcoming from the largest possible num- from developing countries; the percentage wasber of countries and should reflect donors' full 33.5 a year before.first installments. A special effort has been made to increase the
The deputies also recognized that the budge- representation of women and of African coun-tarv rephasing contemplated by the United tries in the Bank among these higher-level staff.States would create a major problem with Women at these levels now represent 12.6 per-respect to IDA's commitment authoritv even cent of staff; the percentage was 12.0 at the endafter the replenishment became effective. of fiscal 1980. The modest net increase isAccordingly, it was agreed that a meeting of attributable to a limited market from which todeputies would be held immediately following recruit women as specialists with technical skillsthe effectiveness of the Sixth Replenishment to and experience. While African staff are now wellconsider the steps that should be taken. consis- represented in a variety of disciplines, womentent with equitable burden sharing, to provide are found in fewer and are least represented inIDA commitment authority at an adequate technical positions. During the past five years,level. the increase in total staff of the Bank was about 5
percent, the increase of women was 14 percent,Bank Staff and of African staff slightlv more. During the
During fiscal 1981, the Bank continued its past fiscal year, the number of women increasedefforts to broaden the nationality distribution of 8.8 percent and African nationals 15.2 percent,staff and to increase the representation of while total specialist staff of the Bank grew onlywomen. During the year, 653 new members about 3 percent.joined the staff of the Bank. Of these, 388 were In carrving out its objectives in institutionalsecretarial. clerical, or other support staff at recruitment, the Bank is emphasizing the addi-

IFC 17
tion of younger staff members, especially economic development by encouraging thethrough the Young Professionals Program. Can- growth of productive private enterprises. Indidates selected through the program are highly addition to providing and helping raise loan andqualit'ied, professionally flexible men and equity capital, the Corporation works towomen thirty years old or younger, with strong strengthen the confidence of investors and pro-backgrounds in economics or finance. The Pro- mote investment opportunities in the developinggram has made a distinct contribution to increas- world. It uses its own resources to assist investorsing the representation of women, African assemble the necessary financing, technology,nationals, and the developing countries on the and management needed for the establishmentspecialist staff. In fiscal 1981, forty-nine Young of productive enterprises.Professionals reported for duty. Of these, 51 per- The expansion of the Corporation's activities,cent were nationals of developing countries and which began four years ago with an increase in its14 percent were from African countries. Women capital resources, continued in fiscal 1981 despiteaccounted for 33 percent of the Young Profes- the continuing economic difficulties throughoutsionals recruited, whereas they made up only 17 the world and the resultant pressures on thepercent of total recruitment by the Bank. balance of payments of the developing countries.
The World Bank Administrative Tribunal, an The Board of Directors of the IFC approvedindependent administrative tribunal established fifty-six projects with an equity and loan com-as an exclusive remedy for adjudicating staff mitment value of $811 million. This was angrievances, commenced functioning during the increase of 19 percent from the $681 millionyear. It heard and decided several cases involv- worth of commitments of the preceding yearing individual staff members as well as a case Operating income for the current vear increasedinvolving employment prciples applicable to more than 12 percent to $101 million, surpassing,the staff at large. for the first time, the $100 million mark. Svndica-
Another activity that affects the staff should tions, most of them in the form of participationsbe noted: the Hay Survey. A report of Hay in IFC loans, which are a measure of the Cor-Associates on the survey of comparator compen- poration's ability to attract the assistance ofsation levels and practices as of March 1, 1980, others in financing projeCtS with which it iswascompletedinfiscal 1981. Itprovidedthebasis involved, reached $374 million and involvedfor decisions on the changes in staff compensa- more than fifty financial institutions; $267tion that were agreed to by the Executive Direc- million in svndications had been completed thetors in June 1981. preceding year.
Membership The slowdown in worldwide economic
On July 21, 1980, Solomon Islands became a activity, however, combined with operatingmember of IDA, on September 29, 1980, difficulties in particular cases, had an adverseDominica and Zimbabwe joined the Bank and effect on net income of the Corporation. ThereIDA and Sevchelles joincd the Bank: on Octo- were also a leveling of capital gains, higherber 1. 1980. Djibouti joined the Bank and IDA, administrative expenses, and an increase inbringing the total membership of the Bank to 139 repame arrers with the result that netand that of IDA to 125. income was $20 million; $20.7 million in net
i.ncome had been reported for fiscal 1980.At the end of the fiscal vear, action was pend-ing on membership in the Bank for Antigua and Disbursements, which increased 88 percentSt. Vincent and the Grenadines. and in IDA for from the total of the preceding year, reachedthe United Arab Emirates. $587 million (including disbursements for par-
ticipants) as a result of the threefold increase inICSIID commitments during the past five years. At the
By June 30, 1981, 83 States had signed the end of the year, the Corporation's investmentConvention on the Settlement of Investment portfolio (including undisbursed balances) heldDisputes between States and Nationals of Other for its own account was $1,647 million. up fromStates, and 78 States had deposited their instru- the year-end balance of $1,404 million in fiscalments of ratification. 1980. In addition, $916 million was held for par-
The Annual Report of the International ticipants in IFC financing. The Corporation allo-Centre for Settlement of Investment Disputes cated $19 million to its Reserves Against Losses;(ICSID) provides details of its membership and $10.6 million was allocated the preceding year.activities. The total now in the Reserve is $61.5 million.
With respect to the investments approved byIFC the Board of Directors of the IFC, ventures in
The International Finance Corporation (IFC) agroindustry, hotels, cement, and pulp andis the World Bank affiliate established to further paper were more prominent than in the recent

18 The World Bank: Fiscal 1981, n Brief
past. Manufacturing made up about 46 percent cial banks for the most part-and S951 milion bvof the total projects approved, compared with 44 the sponsors and bv cash generation.percent in fiscal 1980. Member countries continued to take subscrip-
The Corporation continued to place greater tions in IFC's capital increase. By the end of theemphasis on its activities in some of the smaller, fiscal year, $373.2 million shares had beenlow-income countries, so that 29 ventures, or subscribed-about 80 percent of the $480)roughly half, were in countries in which per million allocated. Of this, S283 million had beencapita income is less than $626 a year.6 The Cor- paid in, increasing the Corporation's paid-inporation made investments in thirty-four coun- capital to $392 million-$85 million more thantries, in six of them for the first time. last vear.
The total cost of approved investments was During the vear, Djibouti. Dominica, the Peo-about $3,340 million for the year. up from $2,377 ple's Republic of the Congo, Seychelles,million the preceding year. Thus, IFC con- Solomon Islands, and Zimbabwe became mem-tributed about 24 cents-of which about half, 11 bers of the IFC, bringing the total number ofcents, was raised from other financial institutions members to 119.through svndications-of every dollar of projectcosts. Of the balance, $1,590 million was raisedthrough other financial institutions-commer- 6 Measured on per capita GNP in 1979 equivalents.
19
Chapter TwoThe Economic Scene: A Global Perspective
The economic shocks of the 1970s discussed in international capital markets to support domes-last year's A lnnual Report continued to reverber- tic development. In the low-income-countries ofate in the world economy during the past year. South Asia high agricultural output led to recordRecession in the industrial countries,' continu- growth. The low-income countries of Africaing high energy costs, inflation, high interest south of the Sahara were the principal exceptionrates, volatile exchange rates, low growth of to the overall trend: their growth was so low thatworld trade, and declining prices of primary per capita incomes actually declined.3
products other than petroleum. led to difficultiesfor manv developing countries. The principal Growth and Inflation in theproblems were thus similar to those of the 1970s, Industrial Countriesbut there were some crucial differences. The The growth of real output of the industrialcurrent downturn came after years of relatively countries declined from an annual increase of 4slow growth, mounting unemployment, and high percent in 1976-79 to an increase of 1.3 percent ininflation in the industrial countries. It was much 1980. Growth in the United States and themilder than the sharp recession of 1974-75. United Kingdom was negative, and there was abut recovery is expected to be slower because of marked slowdown in Canada, France, and Ger-the clifficulties of reducine inflation, now con- many (see Table 2). The only large countries tosidered a major underlying cause of the weak- attain a real growth rate of 4 percent or more inness of many economies. There is thus not much 1980 were Japan and Italy.cause for optimism in the global outlook for the The economic slowdown in these countriesnear term. was accompanied by an increase in inflation. The
The resilience shown by many developingcountries in the face of so unfavorable an inter-national environment was all the more remark-able. Developing country growth was 4.6 per-cent irn 198(), once a(yain substantiallv higher thancent n 198, onc agan susatalIhge hn Australia. Austria, Belgium, Canada, Denmark. Finland,the 1.3 percent growth of the industrial countries France. Germanr, Iceland.lrecland, Italy. Japan. Luxembourg,
(TIable 1). Many developing countries increased the Nethcrlands, New Zcaland. Norway, Ssseden, Switzerland,(Tbe1). Many eeoigcunre nrae the United Kingdom, and the Unitcd St'ates.both their penetration of industrial country 2 those countries with a 1979 percapita GNP ofS401and below. as
markets and their trade with each other. They measured in 19180 U.S. dollars.markets and ~~~~~~~~~~~~~These issues are examinied in greater detail in the World Bank's
were thus able to continue to borrow from the 1981 World Deilsopmnent Report.
Table 1. Real Growth of GNP and GNP per Capita, 1966-80(Percentage change per car. )
GNP (iNP per capita
1906-76 1977 1978 1979 1919 19606-76 1977 1978 1979 198t0
All developing regions' 6.1 5.8 5.2 5.2 4.6 3.6 3.5 2.8 2.7 2.3Africa south of the Sahara 5.( 2.9 3.4 3.3 2.3 2.3 11.3 0.7 0.6 -0.4East Asia and Pacific S.1 8.4 9.4 6.6 3.9 5.5 5.9 6.9 4.3 1.6Latin America and the Caribbean 5.9 4.8 3.9 5.5 5.4 3.2 2.5 1.6 3.1 3.1North Africa and Middle East 8.1 1(1.11 6.10 14.6 7.5 5.1 6.6 2.7 1l.t 4.2South Asia 3.7 7. 1 7.0 -2.6 7.4 L4 4.9 4.8 -4.9 5.0More advanced Mediterranean
countries 6.0 4.1) 4.1 2.6 1.4 4.5 2.5 2.6 1.1 -0.1
Industrial countries' 4.2 3.8 4.1) 3.5 1.3 3.3 3.2 3.3 2.8 0.6
, Prclim,. ars."Fur country coyvcrac. sce (icIQral Notc' to Ane11cx 'lablcs and tiotnotte to Statisticail Annex t,,blc 1. Note that all dceveloping-country oilcxportcrs, as well as the 1,i capital-surplus oil exporters. arc includcd.
'For country coicr.e,i. sce fuslnoic To Slatistical Annex l"ible I 'i'hc growth rates fo,r indastrial countries rcfer to GDP rather than GNP.
Sourcc: World Baiik.
20 The Economic Scene: A Global Perspective
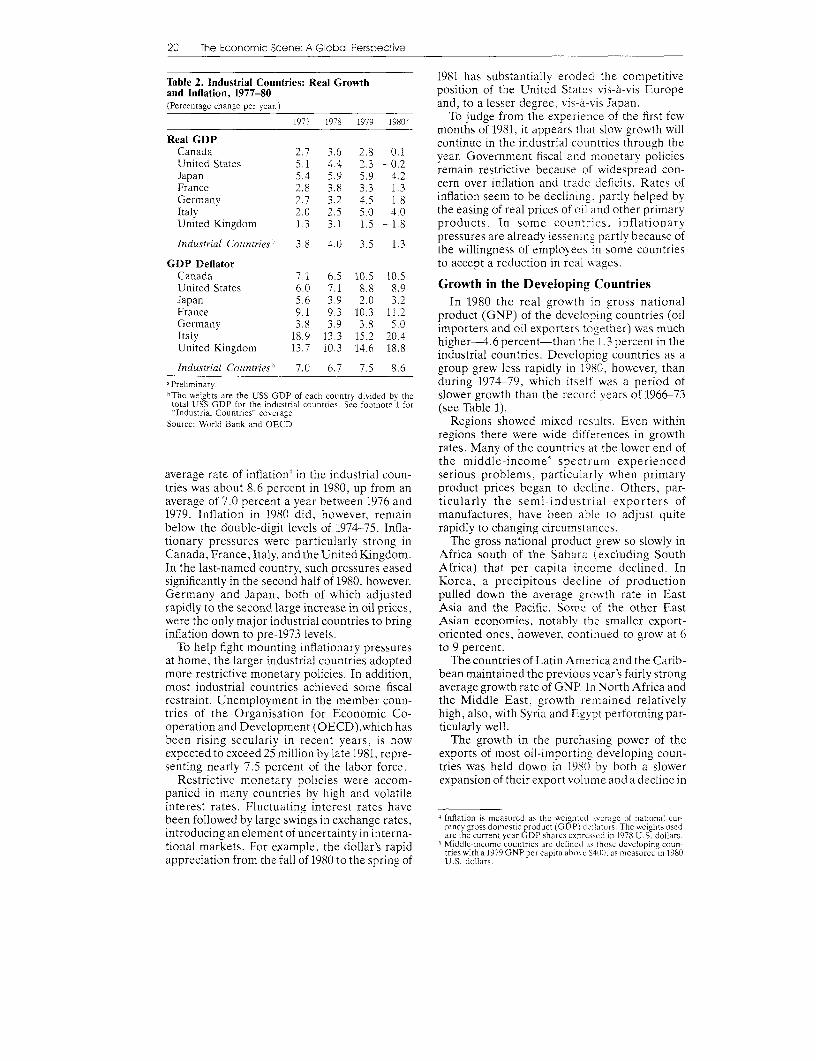
Table 2. Industrial Countries: Real Growth 1981 has substantially eroded the competitiveand Inflation, 1977-80 position of the United States vis-a-vis Europe(Percentage change per year.) and, to a lesser degree, vis-a-vis Japan.
1977 1978 1979 1980' To judge from the experience of the first fewmonths of 1981, it appears that slow growth will
Real GDP continue in the industrial countries through theCanada 2.7 3.6 2.8 0.1 year. Government fiscal and monetary policiesUnited States S. 1 4,4 2.3 -0.2Japan 5.4 5.9 5.9 4.2 remain restrictive because of widespread con-France 2.8 3.8 3.3 1.3 cern over inflation and trade deficits. Rates ofGermanv 2.7 3.2 4.5 1.8 inflation seem to be declining, partly helped byItaly 2.0 2.5 5.0 4.0 the easing of real prices of oil and other primaryUnited Kingdom 1.3 3.1 1.5 1.8 products. In some countries. inflationary
pressures are alreadv lessening partlv because ofIn,dustrial Coutnrries' 3.8 4.0 3.5 1.3 the willingness of employees in some countries
GDP Deflator to accept a reduction in real wages.Canada 7.1 6.5 10.5 10.5United States 6.0 7.1 8.8 819 Growth in the Developing CountriesJapan 5.6 3.9 2.0 3.2 In 1980 the real growth in gross nationalFrance 9.1 9.3 10.3 11.2 product (GNP) of the developing countries (oilGermany 3.8 3.9 3.8 5.0 importers and oil exporters together) was muchItaly 18.9 13.3 15.2 20.4 higher--4.6 percent-than the 1.3 percent in the
United Kingdom 13.7 10.3 14.6 18.8 industrial countries. Developing countries as a
Industrial Countries' 7.0 6.7 7.5 8.6 group grew less rapidly in 1980, however, than
'Preliminarv. during 1974-79, which itself was a period of'The weights are the USS GDP of each countrv divided by the slower growth than the record years of 1966-73total USS GDP for the industrial countries. See footnote I for (see Table 1).
Industrial Countries' coverage.Source: World Bank and OECD. Regions showed mixed results. Even within
regions there were wide differences in growthrates. Many of the countries at the lower end ofthe middle-income' spectrum experienced
average rate of inflation 4 in the industrial coun- serious problems, particularly when primarytries was about 8.6 percent in 1980, up from an product prices began to decline. Others, par-average of 7.0 percent a year between 1976 and ticularly the semi-industrial exporters of1979. Inflation in 1980 did, however, remain manufactures, have been able to adjust quitebelow the double-digit levels of 1974-75. Infla- rapidly to changing circumstances.tionary pressures were particularly strong in The gross national product grew so slowly inCanada, France, Italy, andthe UnitedKingdom. Africa south of the Sahara (excluding SouthIn the last-named country, such pressures eased Africa) that per capita income declined. Insignificantly in the second half of .1980, however. Korea, a precipitous decline of productionGermany and Japan, both of which adjusted pulled down the average growth rate in Eastrapidly to the second large increase in oil prices, Asia and the Pacific. Some of the other Eastwere the onlv major industrial countries to bring Asian economies, notablv the smaller export-inflation down to pre-1973 levels. oriented ones, however, continued to grow at 6
To help fight mounting inflationary pressures to 9 percent.at home, the larger industrial countries adopted The countries of Latin America and the Carib-more restrictive monetary policies. In addition, bean maintained the previous year's fairly strongmost industrial countries achieved some fiscal average growth rate of GNP. In North Africa andrestraint. Unemployment in the member coun- the Middle East, growth remained relativelvtries of the Organisation for Economic Co- high, also, with Syria and Egypt performing par-operation and Development (OECD),which has ticularly well.been rising secularly in recent years, is now The growth in the purchasing power of theexpected to exceed 25 million by late 1981, repre- exports of most oil-importing developing coun-senting nearlv 7.5 percent of the labor force. tries was held down in 198(1 by both a slower
Restrictive monetary policies were accom- expansion of their export volume and a decline inpanied in many countries by high and volatileinterest rates. Fluctuating interest rates havebeen followed by large swings in exchange rates , Inflation is measured as the weightel aseragc of national cur-
rency gross domnestic product (GDP, deflarors. T'he weights usedintroducing an element of uncertainty in interna- are the current vear GDP shares expresscld in 1978 U.S. dollars.tional markets. For example, the dollar's rapid 5 Nliddle-incomc countries are dcincd as those developing coun-
trles witha 1979 GNP per capita ahov S40ll. as measured in 1980appreciation from the fall of 1980 to the spring of u.s. dollars.

Current-Account Balances and The r Financing 21
their terms of trade. In the last two years, the oil- will be further damage to the developing coun-importing developing countries increased their tries and to the developed countries in the longerforeign borrowings (with a greater reliance on run; not only will their exports be hurt, but alsoshort-term borrowing and reserve-related the pattern of trade and the sectoral distributioncredit, primarily financing from the Interna- of investment in both developed and developingtional Monetary Fund (IMF)), and many drew countries will be distorted.down, or at least stopped accumulating, interna-tional reserves. At the same time, the growth Current-Account Balancesrate in the volume of their imports increased. and Their FinancingInterest payments on their larger external debt During the past two years, the disturbances inalso rose. the international economy-large increases in
Recovery from the previous year's bad harvest the price of oil, high rates of inflation, and slug-was the main cause of last year's 7.4 percent gish growth in the industrial countries and inincrease in the gross national product of South world trade-have been reflected in a wideningAsia, but there has also been a long-term of global surpluses and deficits in the balance ofimprovement of agricultural performance there payments. The wave of oil price increases in 1979that has boosted the region's income growth and 1980 produced a sizable gain in the terms ofdespite increases in the cost of imported oil. In trade for the oil-exporting countries. The conse-contrast, low growth in Southern Europe quent surplus of the six capital-surplus oil-brought down the total developing country exporting countries 6 on current account, exclud-average. ing official transfers, is estimated to have been
The problems of structural adjustment con- more than $100,000 million in 1980. By contrast,fronting the oil-importing countries remain in 1978, they had a surplus of only $19,000severe. These countries face a dilemma: if they million. The other oil-exporting countries7 wererely heavily on external borrowings-presum- able to eliminate a deficit of almost an equalably primarily from private sources-they may amount (Table 3).face problems in managing their debt, although The current-account deficit of the indus-continued prudent borrowing could help them trialized countries was $40,000 million in N980;avoid sharp economic downturns. On the other these countries had a surplus of $30,000 millionhand, if they rein in their import demand sharply in 1978. The current-account deficit of the oil-so as to make the necessary economic adjust-ments, they will almost inevitably reduce theirown growth rates, while contributing to the con- I Iraq, Kuwait, Libya. Qatar, Saudi Arabia, and the United Arab
traction of output in the industrial countries. If 7 Algeria. Angola, Bahrain. Bolivia. Brunei, Congo. Ecuador,protectionism against products from the Egypt, Gabon. Indonesia. Iran, Malaysia. Mexico. Nigeria.developing countries is permitted to rise, there Venezuela.
Table 3. Current-Account Balances. 1970-80(UJS$ billions, at current prices.)
Developing countries Centrall
Low-income Middle-income Capital-surplus Industrial planned Statisticaloil importers oil importers Oil exporters oil exportersO countries economies discrepancy
1970 -1.7 -7.0 -2.2 2.8 12.1 1.7 5.71971 -2.5 -8.2 -2.9 n.a. 15.5 n.a. n.a.1972 -1.5 -3.8 - 3.6 1.9 16.0 n.a. n.a.1973 - 3.1 - 4.2 - 2.6 6.7 18.9 n.a. n.a.1974 -6.0 -27.1 19.3 43.3 -8.5 n.a. n.a.1975 -5.4 -33.2 -2.5 30.8 22.0 -7.0 4.71976 -2.4 -24.4 -0.3 36.3 3.9 -3.5 9.61977 - 1.6 - 21.3 - 5.5 32.9 - 1.5 - 1.1 1.91978 -5.1 -20.4 -17.6 18.8 29.9 -0.2 5.41979 -7.2 -37.2 5.1 55.7 -9.5 -0.8 6.11980' - 10.9 -58.7 1.0 102.2 -39.7 -0.1 -6.2
"Excluding official transfers.bOnly Saudi Arabia. Libya, and Iraq are included for 1972.Estimatte.
Source: World Bank.
22 The Econom c Scene: A Global Perspective
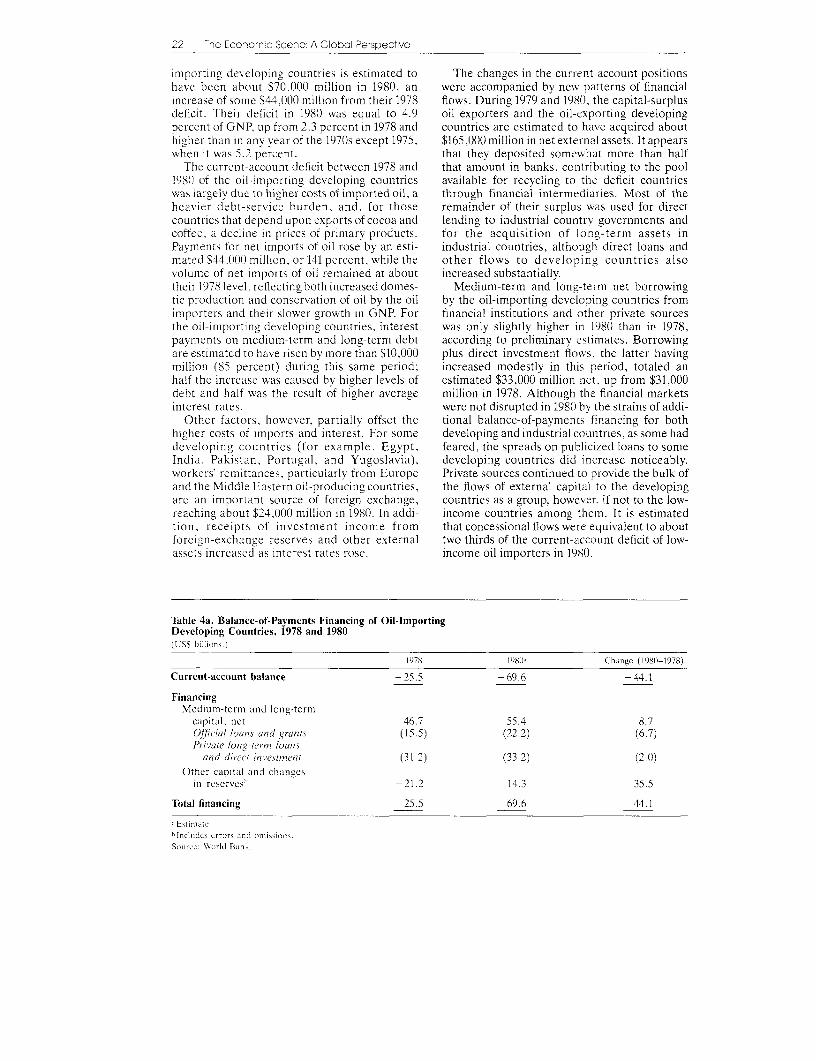
importing developing countries is estimated to The changes in the current-account positionshave been about $70,000 million in 1980. an were accompanied by new patterns of financialincrease of some $44,000 million from their 1978 flows. During 1979 and 1980. the capital-surplusdeficit. Their deficit in 198(0 was equal to 4.9 oil exporters and the oil-exporting developingpercent of GNP, up from 2.3 percent in 1978 and countries are estimated to have acquired abouthigher than in any vear of the 1970s except 1975, $165,000 million in net external assets. It appearswhen it was 5.2 percent. that they deposited somewhat more than half
The current-account deficit between 1978 and that amount in banks, contributing to the pool1980 of the oil-importing developing countries available for recycling to the deficit countrieswas largely due to higher costs of imported oil, a through financial intermediaries. Most of theheavier debt-service burden, and, for those remainder of their surplus was used for directcountries that depend upon exports of cocoa and lending to industrial countrv governments andcoffee. a decline in prices of primary products. for the acquisition of long-term assets inPayments for net imports of oil rose by an esti- industrial countries, although direct loans andmated S44,000 million, or 141 percent, while the other flows to developing countries alsovolume of net imports of oil remained at about increased substantially.their 1978 level, reflecting both increased domes- Medium-term and long-term net borrowingtic production and conservation of oil by the oil by the oil-importing developing countries fromimporters and their slower growth in GNP. For financial institutions and other private sourcesthe oil-importing developing countries, interest was only slightly higher in 1980 than in 1978,payments on medium-term and long-term debt according to preliminarv estimates. Borrowingare estimated to have risen by more than $10,000 plus direct investment flows, the latter havingmillion (85 percent) during this same period; increased modestly in this period, totaled anhalf the increase was caused by higher levels of estimated $33,000 million net, up from $31,000debt and half was the result of higher average million in 1978. Although the financial marketsinterest rates. were not disrupted in 1980 bv the strains of addi-
Other factors, however, partially offset the tional balance-of-payments financing for bothhigher costs of imports and interest. For some developing and industrial countries, as some haddeveloping countries (for example, Egypt, feared, the spreads on publicized loans to someIndia. Pakistan, Portugal, and Yugoslavia), developing countries did increase noticeably.workers remittances, particularly from Europe Private sources continued to provide the bulk ofand the Middle Eastern oil-producing countries, the flows of external capital to the developingare an important source of foreign exchange, countries as a group, however, if not to the low-reaching about $24,000 million in 1980. In addi- income countries among them. It is estimatedtion, receipts of investment income from that concessional flows were equivalent to aboutforeign-exchange reserves and other external two thirds of the current-account deficit of low-assets increased as interest rates rose. income oil importers in 1980(.
Table 4a. Balance-of-Payments Financing of Oil-importingDeveloping Countries. 1978 and 1980Us5 billions.)
1978 1980)t Changc (198)0-1978)
Current-account balance - 25.5 - 69.6 - 44.1
FinancingMedium-term and long-term
capital. net 46.7 55.4 8.7Official loans and grants (15.5) (22.2) (6.7)Private long-term loans
alnd direct investrent (31.2) (33.2) (2.0)Other capital and chanmes
in reserves -21.2 14.3 35.5
Total financing 25.5 69.6 44.1
t Estintate'Includes crrors dInd (fMISSl10lS.Sourcc: World Bank.

External Debt 23
Table 4b. Balance-of-Pavments Financing of Low-IncomeOil-Importing Developing Countries. 1978 and 1980(US$ billions.)
Change1978 198(1 (198(0-78)
Current-account balance - 5.1 -10.9 - 5.8Financing
Medium-term and long-termcapital, net 6.2 8() 1.8Official loans and grants (5.4) (7.3) (1.9)Private long-term loans
and direct investment (0.8) (0.7) (-0.1)Other capital and changes
in reserves" - 1.1 2.9 4.0Total financing 5.1 10.9 5.8
-Estimate.blncludes errors and omissions.Source: World Bank.
Table 4c. Balance-of-Payments Financing of Middle-IncomeOil-Importing Developing Countries, 1978 and 1980(US$ billions.)
Change1978 198( (1980-78)
Current-account balance -- 20.4 - 58.7 - 38.3Financing
Medium-term and long-termcapital. net 40.5 47.4 6.9Official loans and grants (10.2) (15.0) (4.8)Private long-term loans
and direct investment (30.3) (32.4) (1.9)Other capital and changes
in reserves -20.1 11.3 31.4Total financing 20.4 58.7 38.3
d Estimate.btncludes errors and omissions.Source: World Bank.
Net official flows to oil importers are esti- 13 percent, to approximately $416,000 million.mated to have been more than $22,000 million in The growth rates of 1979 and 1980 were well1980, an increase of almost $7,000 million from below the average annual growth of 23 percentthe 1978 level. Net concessional loans and between 1975 and 1978. This slowdown in thegrants, exclusive of technical assistance, growth of developing country debt, however, hasaccounted for about three quarters of total offi- apparently already begun to reverse itself. Bycial flows for both years. Short-term borrowing the last quarter of 1980, medium-term and long-and reserve transactions took on a larger role in term borrowing had stepped up, and grossfinancing the current-account deficits of the oil publicized borrowing in the international capitalimporters. markets during the first quarter of 1981 was dou-
ble that of the first quarter of 1980.External Debt The data on debt outstanding for 1979. the
The growth of the developing countries' latest year for which detailed figures are avail-medium-term and long-term debtm-from publicand private sources, in foreign currency-hasslackened. In 1979, that debt grew 17 percent, s See General Notes to Annex Tables for country coverage. Note.
however, that the discussion in the text includes privatereaching $369.00)) million, and in 1980 it grew by nonguaranteed debt, whereas the Annex does not.

24 The Economic Scene: A Global Perspective
able, indicate a continuation of the growing the developing countries. Debt service,importance of borrowing from private sources therefore, has absorbed a growing share of newand the consequent hardening of average terms borrowings. While gross disbursementsthat was particularly evident in the later years of increased only 8 percent in 1979, total debt-ser-the 1970s. Medium-term and long-term debt vice payments increased 30 percent. This meantowed to private creditors, principally commer- that there was an actual decline in net transfers ofcial banks, increased 20 percent in 1979; its resources; in contrast, annual growth of netannual growth between 1975 and 1978 had been transfers between 1975 and 1978 had averaged 1627 percent. By the end of 1979, 63 percent of all percent.debt was owed to private creditors; the percent- External debt and debt service remain con-age in 1975 was 56. The share owed to official centrated in a few developing countries, typi-bilateral sources declined from 33 percent in cally those with relatively strong export sectors,1975 to 25 percent in 1979, while that owed to large international reserves, or rapid growth.multilateral institutions remained more or less Most of the principal debtors are oil-exportingconstant, at 11-12 percent. countries-Algeria, Egypt, Indonesia, Mexico,
Partly as a result of domestic anti-inflationary and Venezuela-or are major exporters ofpolicies in the industrial countries, interest-rate manufactures-Brazil, Israel, Spain, andrises have spread worldwide. There has been a Yugoslavia.hardening of average terms of new borrowing Most low-income oil-importing countriesthat has increased the debt-service payments of depend heavily upon official sources for financ-
Table 5. Public and Private Debt of the Developing Countries(USS millions.)
End 1970 End 1975 End 1978 End 1979 End 1980 a
Disbursed debt outstanding,by regionMore advanced Mediterranean
countries 9,193 29,114 56,085 69,309 79,000Africa south of the Sahara 7,028 14,989 27,164 32,326 38,000North Africa and Middle East 4,263 13,884 35,677 42,202 46,000East Asia and Pacific 8,836 24,623 45,711 51,920 58,000South Asia 11,961 20,686 28,895 30,116 33,000Latin America and the Caribbean 21,163 64,843 123,362 143,308 162,000
Total 62,444 168,139 316,894 369,180 416,000
Disbursed debt outstandingOfficial sources 34.877 74,241 122,189 136,177 154,000Private sources 27.567 93,898 194,705 233,003 262,000
Total 62,444 168,139 316,894 369,180 416,000
1970 1975 1978 1979 1980
Debt serviceOfficial sources 2,519 5,481 9,168 11.480 14,000Private sources 5,329 18,712 42,723 55.704 62,000
Total 7,848 24,193 51,891 67.184 76,000
Net disbursementsOfficial sources 3,862 12,208 14,711 15J152 18,000Private sources 4,147 20,445 38,557 38,185 35,000
Total 8,009 32,653 53,268 53,337 53,000
NOTE: Details may not add to totals because of rounding.Estimate.Includes some lending by official sources that is not guaranteed by a public body in the borrowing country.
Source: World Bank.

Official Development Assistance 25
Table 6. Debt and Debt-Service Indicators of Public Debt
1970 1975 1979
Disbursed debt as a % of GNPOil importers 12 13 16
Low-income countries (17) (19) (20)Middle-income countries (11) (12) (15)
Oil exporters 14 16 25
Debt service as a % of GNPOil importers 1 2 2
Low-income countries ( 1) ( 1) ( 1)Middle-income countries ( 1) ( 2) ( 2)
Oil exporters 2 2 5
Debt service as a % of exportsof good and servicesOil importers 8 8 10
Low-income countries (14) (12) ( 9)Middle-income countries ( 8) ( 8) (10)
Oil exporters 11 9 19
Source: World Bank.
ing, since few of them qualify for significant the remainder being nonconcessional officiallevels of borrowing from private sources on com- lending.mercial terms. In 1979, their debt increased only Despite the general soundness of the debt6 percent, to $43,000 million. Of this, 87 percent position of most developing countries, severalwas owed to official creditors and fully 78 percent countries had to seek debt relief under thehad been obtained on concessional terms. auspices of the Paris Club." Countries that have
The debt of the middle-income oil-importing recently resorted to the Paris Club includecountries increased steadily, a trend consistent Liberia (1981). Madagascar (1981). Sudan (1980),with the expansion of their economies. By the Togo (1981), and Zaire (1980). Some countriesend of 1979, the total debt of these countries have also recently had agreements with commer-amounted to $212.000 million, 70 percent of it cial banks (Nicaragua, Sudan, and Zaire), whileowed to private creditors; 15 percent had been Pakistan arranged, through the Pakistan Consor-obtained on concessional terms. The significant tium, a rescheduling of its official debt to Consor-increase in their debt service in recent years is tium creditors. Generally, debt relief has beenthe result of the growth of their debt, some pre- extended for periods of twelve to eighteenpayments, and the harder average terms of new months, with repayment of rescheduled debtborrowing. due over a period of seven to ten years. Interest
Commercial banks now make most of their charges are usually set at the rate of new loans ofloans at variable interest rates. Although loans the type being refinanced.made in the financial market can have significantadvantages, those with variable interest rates dorequire careful debt management. During a time Official Development Assistanceof rapidly rising interest rates, as has been Net disbursements of Official Developmentexperienced in the past year, debt service can Assistance (ODA)-grants and concessionalincrease suddenly and dramatically. The con- loans-from member countries of the Develop-verse is, of course, true when interest rates fall.For those countries with reserves invested in thecapital markets, the effect of rising interest rates 9 The oil-exporting countries covered under the Bank's Debtorleast e pariallyoffse by vrtue f the Reporting System are : Algeria, Bahrain, Bolivia, Congo,can at least be partiallv offset by virtue of the Ecuador. Egypt, Gabon, Indonesia, Malaysia. Mexico. Nigeria,higher return they receive. Oman. Peru, Syria, Trinidad and Tobago, Tunisia, andhigher return they receive. ~~~Venezuela.
The oil-exporting developing countries9 have "'The Paris Club is the name given to the ad hoc meetings ofused their strong export bases to borrow heavily. Western creditor governments that. since 1956. have arranged.
when necessary, for the renegotiation of credlitor-guaranteedIn 1979, their total disbursed debt was $114,000 suppliers' credits. Since then, it has handled the majoritv ofmillion, 68 percent of it owed to private creditors renegotiations of official and officially guaranteed debt. More
than a dozen debtor countries have been involved through theand 21 percent obtained on concessional terms, years.

26 The Economic Scene: A Global Perspective
Table 7. Net Disbursements of Official Development Assistance, 1976-80(Current USS billions.)
1976 1977 1978 1979 198()
DAC countries 13.8 15.7 20.0 22.3 26.6OPEC countries 5.6 5.9 4.3 6.1 7.0
Centrallv planned economies ' 1.3 1.3 1.3 1.8 1.8
Preliminary.
Estimate.
c Estimate. Includes Bulgaria, Czechoslovakia. German Democratic Republic. Hungary. Poland, Romania. and USSR.
Source: OECD. For details, see Table 16 in the 1981 World Development Indicators.
ment Assistance Committee (DAC)" to the were in the form of grants. Their ratio of aid todeveloping countries reached an estimated GNP is much higher (1.36 percent in 1980) thanS26,600 million in 1980. This amount represents that of the DAC countries. The ratio of aid toa nominal increase of 19 percent from the 1979 GNP of the six capital-surplus members oflevel, reaching 0.37 percent of their aggregate OPEC was 2.68 percent in 1980. Kuwait, SaudiGNP. In the 1970s, the percentage of ODA to Arabia, and the United Arab Emirates were theGNP had remained fairly constant between 0.33 biggest OPEC donors in dollar volume, andpercent and 0.36 percent." t Denmark, the their aid accounted for 3.03 percent of theirNetherlands, Norway, and Sweden are the only GNP.members to have achieved the 0.7 percent targetas set by the UN for the Second and ThirdDevelopment Decades. In 1980, more than threequartersmof new commitments and more than tt Australia, Austria, Belgium. Canada, Denmark, Finland,quarters ofnwcm imnsadmr hn France, Germanv, Italy. Japan. tbc Netherlands, New Zealand,half of net disbursements were grants, and Norway, Sweden, Switzerland, the United Kingdom, the United
States, and the Commission of the European Communities.disbursements in 1980 appear to have continued 12 The improvement in 1980 was to some degree a result of thethe shift of the 1970s to the least developed coun- bunching of letters of ceedit so the mUltilateTal institutions; in
with a mre limied shifttoward he low- addition, some DAC members base been increasing their assis-tries,'3 with a more limited shift toward the low- tance in recent years.income developing countries. 13 Afghanistan. Bangladesh, Benin. Bhutan, Botswana, Burundi,
countries. ~~~~Cape Verde, Central African Republic. Chad, Comoros.In 1980, net disbursements of ODA by the Ethiopia, The Gambia, Guinea, Haiti. Laos, Lesotho. Malawi,
member countries of the Organization of Maldives, Mali, Nepal, Niger. Rwanda, Somalia, Sudan,r, r . . 14Tanzania, Uganda. Upper Volta. Western Samoa. Yemen ArabPetroleum-Exporting Countries (OPEC) 1
Republic, and People's Democratic Rcpublic of Yemen.amounted o S7,000 illion; i that sam year, t AlgeTia, Ecuador, Gabon. Indonesia, Iran. Iraq, Kujwait, Libya.amounted to $7,000 million; in that same year, Nigeria, Qatar, Saudi Arabia. the United Arab Emirates, and
an estimated four fifths of commitments of ODA Venezuela.
Table 8. Total Merchandise Exports, 1965-80(US$ billions at constant 1978 prices.)
Average annualgrowth rates (%)
1965 1970 1977 1978 1979 1965-70 1970 80h
All developing countries 138 169 235 252 261 4.2 4.6Low-income 13 16 24 27 26 4.2 5.5Middle-income 125 154 211 226 235 4.2 4.5
Industrial countries 301 512 795 840 878 11.2 6.2World ' 542 821 1,240 1,307 1,374 8.6 5.7World (current US$ billions) ' 186 314 1,131 1,307 1,668 11.0 21.1
Note: Oil-exporting developing countries 80 86 91 89 89 1.7 -0.3Oil-importing developing countries 58 83 145 163 173 7.3 8.1
a Preliminary.Estimate.Also includes countries having centrally planned economies and the capital-surplus oil exporters.
Source: World Bank.

World Food Stuotion 27
World TradeIn dollar terms, world merchandise trade Petroleum Export Prices
increased by nearlv 30 percent in 1980. In US$/Barrel (FOB)volume, the increase was less than 4 percent. First quarter 1918-first quarter 981The reduced growth in volume in 1980 was pri-marily a result of a decline in the amount ofpetroleum traded, although the growth of tradein manufactures also slowed.
The share of fuel in the total value of merchan- 41 Sdise trade rose from 17 percent in 1978 and 20 A
percent in 1979 to almost 25 percent in 1980; in /\ potcontrast, its share in the total volume dropped I e\ /from 17 percent in 1978 and 1979 to 16 percent in / \ O Average1980. in response to higher petroleum prices, / Saudiconservation, and recession in the industrial 30 A/ rabiancountries. / /Lght
Because of that recession and as a result of the /significant appreciation of the U.S. dollaragainst most other major currencies, prices (incurrent U.S. dollars) of both primary com-modities and manufactured goods, which had 20 -reached a peak in mid 1980, have recently /declined. The World Bank monthlv averageprice index of thirty-three commodities (exclud-ing petroleum) declined almost 10 percent (incurrent dollars) in the first five months of 1981.Fluctuations in the prices of such commodities as l 0 Isugar, copper, and tin have been severe. 1918 1919 1980 1981
Spot Weighted average ol spol price quotations for OPEC export
Petroleum petraleur gradesAverage OPEt Average price ef twenty-five grades or OPEC expert
The industrial countries entered calendar 1980 petroleum. orfic al srelilg prices to b loading ports
with record high inventories of petroleum. Oil Saud Arabian Light 33 4 ' API crude stream. official seling price
prices weakened and premiums charged above Iob,RasTanurathe official selling prices (OSPs) tapered offtoward the middle of the vear. The situationchanged in September 198(1 with the outbreak ofhostilities in the Persian Gulf. Damage to The supply situation facing the oil-importingpetroleum installations in both Iran and Iraq developing countries, however, remains pre-brought the combined exports of these countries carious. Since 1978, supplies of petroleumalmost to a standstill. Although several members imported by the developing countries have beenof OPEC increased their production to compen- under considerable strain. Before Decembersate for this, world petroleum production 1978, Iran and Iraq had supplied-on thedeclined about 3.8 percent in 1980-from 63.2 average-almost 30 percent of the crude oilmillion barrels a day (mbd) in 1979 to 60.8 mbd imported by the oil-importing developing coun-in 1980-as did consumption. Average OPEC tries. Some countries were even more dependentprices for crude oil rose by 63 percent in 1980 (46 upon them: supplies from Iran and Iraq had metpercent in real terms), as compared to the pre- about 70 percent of the import needs of Turkey:vious year. 60 percent of those of Cyprus, India, Kenya,
Aided bv conservation measures, reduced Morocco, and Tanzania: 50 percent of those ofeconomic activity, and favorable weather condi- Chile, Yugoslavia, and Zambia; and 40 percenttions, oil consumption in the industrial countries of those of Brazil and Spain. Many countriesfell about 7 percent in 1980. In the first quarter of were forced to purchase supplies from the signifi-1981. world consumption of oil (excluding the cantly higher-priced spot market.centrally planned economies) declined 4 percentfrom that in the first quarter of 1980. The decline World Food Situationwas even sharper in the industrial countries. World production of cereals has been main-Overall petroleum prices have softened, as pro- tained at about 1,500 million tons in recent years,duction remains relatively high and buyers seem but cereal consumption continued to increase, inreluctant to increase their stocks. line with population and income growth. In

28 The Economic Scene: A Global Perspectve
1980, as production declined somewhat, prices The Special Session agreed on a new IDS call-rose and world stocks of cereals were drawn ing for a growth rate of 7 percent for the develop-down. The below-trend production levels largely ing countries for the decade of the 1980s and aresulted from reduced outputs in the temperate "rapid and substantial increase" in Officialzone of the Northern Hemisphere, mainly in the Development Assistance by donor governmentsU.S. and China; the developing countries did "with a view to reaching, and where possible,better, with the countries of South Asia, in par- surpassing" the target of 0.7 percent of the GNPticular, producing record crops in 1980/81. Prices of the donor countries. The new strategy wasbegan to ease in the early months of 1981 as a endorsed by the 35th Session of the Generalresult of good crop forecasts in major producing Assembly, and the Third Development Decaderegions, lower livestock production, and higher was thus launched. On the issue of globalinterest rates. negotiations, however, agreement proved to be
Cereal imports of the developing countries more elusive.have risen rapidlv in recent years. Net imports of The delegates broadly agreed on negotiationsgrains by the developing countries totaled over to cover trade, energy, raw materials, develop-50 million tons in 1980/81, at a cost of about ment finance, and monetary issues. Questions of$10,000 million. This contrasts with their net procedure and agenda have not, however, beengrain imports of 20 million tons in 1970/71, at a fully resolved, particularly on the appropriatecost of $2,000 million ($5,000 million in 1980 relationship between the proposed centraldollars). Almost all of the increase was negotiating body and the specialized agencies.accounted for by middle-income countries,which have been increasing their feedgrain North-South Summits. In the meantimeimports by 10 percent per year. The low-income preparations have begyun for a North-Southcountries in South Asia improved their grain economicsummittobeheldinCancun,Mexicoproduction and reduced their imports substan- in October 1981 sponsored bv President Josetially in the 1970s. However, the food situation Lopez-Portillo of Mexico and Chancellor Brunothroughout much of sub-Saharan Africa has Kreisky of Austria. The meeting, it is expected,been deteriorating. will be attended by twenty-two heads of state and
Overall, the world food situation has governments from the developed and develop-improved substantially in comparison with theearly 1970s. However, it continues to be charac- ing countries.
teried y prduclioninsabilty n rnjor Other international fora are also givingterized by production instability in major attention to North-South issues. The problemsimporting countrles, especially the USSR, facing developing countries were among thetogether with lagging production and poor main subjects discussed at the Western economicmfrastructure and dlstributon capacities i summit of seven major industrialized countriesmany importing developing countries, held in Ottawa in July 1981. The Commonwealth
heads of governments also propose to focusNorth-South Dialogue attention on the problems facing developing
The North-South dialogue continued in countries at their meeting scheduled to bevarious international fora during the past year. held in Melbourne, Australia, in SeptemberThe publication of the Brandt Report by the 1981.Independent Commission on InternationalDevelopment Issues (the Brandt Commission) South-South Cooperation. The events of thecontained a number of suggestions, including an past year have given impetus to efforts at
action programme for the least developed cooperation among the developing countries.countries, special efforts to increase production Deamogi the developing countof food and energy in the developing world, and espe ideogia dferences differing coun-an economic summit of heads of state on North- -c c nees and the geogra SoltionSouth issues. of countries from one another, South-South
cooperation has become an important objectiveof the developing countries. Following earlier
The United Nations. The Eleventh Special meetings in Geneva and Vienna of developingSession of the UN General Assembly began in countries represented by the Group of 77August 1980 to consider a new International (G-77), the Foreign Ministers of the G-77 met atDevelopment Strategy (IDS) for the Third Caracas, Venezuela, in May 1981 to considerDevelopment Decade. The second major item measures to further the framework of economicof the Special Session was to reach agreement on cooperation among developing countries in thean agenda for a special UN conference on global areas of trade, technology, food and agriculture,negotiations to be held under UN auspices in energy, raw materials, finance, and industrializa-New York in 1981. tion. Agreement was reached on the need to

The Common Fund and Internationa. Commodity Agreements 29
increase efforts for a Generalized System of ing countries facing greatly enlarged current-Preferences for trade among developing coun- account deficits. In this context, the Committeetries. It was also agreed to establish a mechanism urged the Executive Directors of the Bank tofor the coordination, implementation, and continue their efforts to reach a consensus on themonitoring of programs for economic coopera- scale of World Bank activity appropriate to thetion. For this purpose. a small technical group circumstances of the early 1980s and to seekwould be established through special arrange- means for future financing of that activity. Thements with governments of developing Committee also decided, in principle, tocountries. establish a task force to carry forward and widen
the study of the continuing problems affectingThe Development Committee. During the the volume, quality, and effective use of conces-
past fiscal year, the Development Committee sional flows. The special problems of the oil-(the Joint Ministerial Committee of the Boards importing developing countries were par-of Governors of the World Bank and the Interna- ticularly noted. The Bank's initiative in expand-tional Monetary Fund on the Transfer of Real ing lending operations in the energy sector wasResources to Developing Countries) held three supported by the Committee as well as the needmeetings. The first was in September 1980 in to examine ways to mobilize additional rcsourcesWashington, D.C. At the second, in October for energy development, both through existing1980, also in Washington D.C., David Ibarra mechanisms and through a possible new affiliateMunoz, Secretary of Finance and Public Credit or facility.of Mexico, was elected Chairman to succeed At the'Libreville meeting. the Committee alsoCesar E. A. Virata, Minister of Finance of the reaffirmed its desire to plav an active role inPhilippines, whose term had expired. Hans E. regard to matters within its competence in theKastoft was selected Executive Secretary of the context of the United Nations global negotia-Committee. The third meeting was held in May tions on North-South issues.1981 in Libreville, Gabon.
At its September 1980 meeting, the Commit- Law of the Sea. There had been some hopetee reviewed the prospects of the developing that the UN Law of the Sea deliberations mightcountries in the light of the World Bank's World be successfully concluded on most issues of theDevelopment Report and other background proposed treaty. This was a natural expectationpapers. Consideration was given to the pro- following the lengthy negotiations that producedposals made by the Group of 24 in its Program of compromises in 1979 on a number of kev issuesImmediate Action and by the Brandt Commis- related to navigation rights: pollution control,sion. and maritime boundaries, but particularly to the
The Committee also reviewed a report of a regime of seabed mining beyond nationaltask force on private foreign investment. The jurisdictions. This covered the basis and limita-report recognized the significant role to be tion for the production of manganese nodules,played by private foreign investments in compensation to the developing countries ad-economic development of the developing coun- verselv affected by nodule mining, and arrange-tries. ments on the sharing of the "heritage of
The Committee focused attention on means mankind" between those with the expertise andfor financing the capital requirements of the the resources to exploit such wealth and thedeveloping countries by way of concessional and developing countries.nonconcessional flows and private foreign Resolution of all issues proved premature.investments. It urged an increased flow of con- however, when the new United Statescessional funds to the low-income countries, administration requested a delay so that it coulddrawing particular attention to the gravity of the reconsider its approach. The Conference issituation facing those countries with the delay in expected to reconvene later in the year.bringing the Sixth Replenishment of IDA intoeffect. A task force set up on nonconcessionalflows by the Development Committee has been The Common Fund and Internationalexamining the possible means of enlarging the Commodity Agreementsflow of nonconcessional funds to the developing The Agreement Establishing the Commoncountries, both through the medium of the inter- Fund for Commodities was adopted in June 1980national financial institutions and directly. The by the Fourth Session of the United Nationstask force expects to continue its work at a meet- Negotiating Conferencc on the Common Fund.ing of the Development Committee in Septem- Thirtv-four countries had signed the Agreementber 1981. by June 3(0. 1981 it will go into effect when it has
The Libreville meeting focused attention on been ratified by ninety countries that account forthe urgent and immediate plight of the develop- at least two thirds of the $470 million in capital
30 The Economic Scene: A Global Perspective
directly contributed. Although March 31, 1982, were reactivated, after a decline of 33 percent inis the deadline for approval and ratification of coffee prices during 1980. A global export quotathe Agreement, it is unlikelv to begin operations of 57.3 million bags was agreed upon, togetherbefore mid 1983. with an intervention price range of 115/120 to
The Common Fund has two accounts. 150/155 cents a pound. The Agreement willThrough the First Account (S400 million), it will expire in September 1982.contribute to the financing of internationally Release of the special stocks held under thecoordinated national stocks within a framework International Sugar Agreement had little effectof International Commodity Agreements on the sugar price rise of 1979-80. The effective-(ICAs). Through the Second Account ($350 ness of the Sugar Agreement. signed in 1978, ismillion), it will attempt to improve the export restricted because the European Economicearningspotentialofthedevelopingcountriesby Community (EEC), which has become anpromoting research and development of com- important exporter. has not vet signed it.modities and through improvements in produc- Discussions on an International Tea Agree-tivity, processing, and marketing. ment, which have been going on since 1978. have
The ultimate scope and size of the First made little progress. The sticking point has beenAccount will depend upon the number of cur- the allocation of the shares of the export marketrent International Commodity Agreements that and, hence, of export quotas. The potential forenter the Fund and on the number of new ones conflict between long-standing established pro-created under the Fund's aegis. Its effectiveness ducers and new, growing exporters whose costswilldependupontheusefulnessoftheobjectives are often lower-the source of many of theof the Agreements and upon their success in problems inherent in forging international com-meeting these objectives. Their primary objec- modity agreements-can be observed in thesetive is price stability. It must be recognized, discussions.however, that the attainment of price stability The successive tin agreements have been thedoes not always ensure income stability, the lat- most successful of all the International Com-ter being the main concern of both producers modity Agreements. Implementation of theand governments. Sixth International Tin Agreement has been
Little progress was made during 1980 in bring- held up, however, because of disagreements be-ing new Agreements into being. Following initial tween the United States and the producing coun-agreement in October 1979, the new Interna- tries on the size of the buffer stock and the extenttional Natural Rubber Agreement came provi- to which exports are to be controlled.sionally into force in October 1980. Its aim is to Discussions of an ICA for cotton have takenstabilize prices within a specified range through place under the UNCTAD Integratedthe operation of a buffer stock. So far, however, Programme for Commodities, but there hasthere has been no opportunity to stabilize prices, been no sign of agreement.for the price of rubber has been higher than theceiling price set under the Agreement. The Rub- Lome IIber Agreement is the first to provide for associa- The second Lome Convention came intotion with the Common Fund. Its novel feature is effect January 1, 1981. Under the new conven-its sharing of the costs of buffer stocks equallv tion. almost all exports of sixty countries ofbetween consuming countries and producing Africa, the Caribbean, and the Pacific (ACP)countries bv means of direct contributions from have free entry into the European Communitiestheir governments. (EC), somewhat more than under Lome I.
The basis for a new International Cocoa The "Stabex" arrangement for stabilizingAgreement was established in November 1980, export revenues by income transfers in the eventthe previous Agreement having ended in March of shortfalls in export earnings has been1980. The Ivory Coast, a major producer, has extended to cover forty-four products; onlybeen unwilling to sign, however, because of the thirty-four products were covered under the firstprovisions for automatic price adjustments. Convention. The amount of aid for the period
On October 1, 1980, the economic provisions 1981-85 was increased from S4,300 million toof the 1976 International Coffee Agreement $7,200 million.

31
Chapter Three 1981 Regional PerspectivesEastern Africa
The review of economic development in imported fuel. raw materials, and machineryEastern Africa during the 1970s in last year's disrupted transport and limited production forAnnuial Report painted a grim picture. A com- both the home market and the foreign market.bination of a setback in the trend of farm output, Gross domestic product (GDP) per capita fell indeterioration in the terms of trade. and institu- a number of countries and stagnated in severaltional weaknesses added up to a formidable others. The Bank and IDA continued theirarray of constraints. In this Annual Report, the efforts to assist members in facing up to tryingmain focus is on the region's severe shortage of circumstances by diagnosing policy problems,imports. the consequences on production and increasing the share of nonproject assistance,investment caused by the shortage. and the continuing emphasis on agricultural lending,measures governments and the Bank are taking increasing project lending to the energy sector,to secure recovery. and mobilizing external financial support
The scarcity of foreign exchange continued to through consultative groups. Member govern-plague many of the countries in the region, ments have become aware that the foreign-whose Bank membership now totals twenty-two. exchange constraint is likely to persist throughDjibouti, Seychelles, and Zimbabwe having the 1980s. Economic recovery will requirebecome members during the fiscal year. Drought stringent reforms in policies and institutions.in several countries, which made it necessary toimport food, aggravated the problem. Other Development of Importsimports were heavily constrained despite a sub- Imports tended to rise faster than real GDP instantial rise in the inflow of Official Develop- many countries in Eastern Africa during the six-ment Assistance (ODA). The shortage of ties and early seventies. Examples of this trend
Countrv Pcr czpi a Trend in Lending, 1972-81borrowers, Population GCiNP 1979 ' (US$ mil eons Fiscal years.)fiecal 1979-81 0(1x1) (1us$) (tO) Numberof Operations
Botswana 773 720Burundi 4,022 180Comoros 394 220Ethiopia 30,861 130Kenva 15,274 380Lesotho 1,309 340Madagascar 8.480 290Malawi 5.817 20((Mauritius 941 1.030(Rwanda 4.947 20(1Somalia 3,828 -Sudan 17.862 370Swaziland 541 650Tanzania 18.030 260Uganda 12,797 290Zaire 27,509 260Zambia 5,580 500Zimbabwe 7.146 47(0
Noi t: The 1979 estimates of GNP per cap ira preserted above aretrom the "World Development Indicators in the WorldDei eloprnent Report 1981.Estimales for mid 1979.
' World Bank Atris methodology, 1977-79 base pcriod.

32 1981 Regional Perspectves
are to be found in Kenya, Malawi, Somalia, and a virtual standstill in Malawi and Mauritius.Sudan, and Tanzania. Several structural features Preliminary, incomplete data for 1980 show noof the economies of these countries were respon- general improvement. Imports recoveredsible. First, the dependence of investment on somewhat in Kenya and Sudan, but theyimports of machinery and equipment was grow- declined in several other countries, such asing. The average ratio of imported capital goods Botswana, Burundi, Madagascar, and Somalia.to gross domestic investment rose from 32 per- It is unlikely that calendar 1981 will provide muchcent to 38 percent. The pattern of investment relief, for the region's foreign-exchange con-generally favored urban areas at the expense of straint can be expected to persist. It is also possi-rural development, necessitating a higher ble that a larger share of a depressed level of totalforeign-exchange component. Second, the proc- imports in 1981 will be absorbed by essentialess of production became more import-intensive purchases of about a million tons of cereals inas the output mix shifted toward modern indus- Ethiopia, Kenva, Somalia, Tanzania, andtry, transport, and other services and away from Uganda. The effects of the drought of the lasttraditional agriculture and other rural activities two years in large areas of these countries stillthat did not use foreign inputs to any significant continue to be felt, and the food supply remainsextent. The average ratio of imports of inter- precarious. Near-famine conditions prevail inmediate goods to GDP rose from 10 percent to 16 some areas of Uganda and in parts of northernpercent. Third, while most countries saved on Kenya. In several countries, the problem of foodimports of consumer durables, in some there was supply has been compounded by conflicts ina large offsetting increase in cereal purchases neighboring areas during recent years. Manyabroad, reflecting the failure of food production displaced persons and refugees still live in reliefto keep pace with a high and rising rate of growth camps in Djibouti, Ethiopia, Somalia, andof population. Sudan, requiring emergency assistance. To the
The stagnation or decline in the volume of extent that the imports of food are not financedimports during recent years must be evaluated by emergency external assistance, there will beagainst this background of an increasing trend in less foreign exchange available for imports ofthe import-intensity of investment and produc- intermediate or investment goods.tion. Calendar 1979 saw a substantial reduction Imports were constrained in 1979 and 1980in imports in Kenya, Sudan, Tanzania, and Zaire despite a substantial increase in the prices of
Lending to Borrowers in Eastern Africa, by Sector(USS millions. Fiscal year.)
Annualaverage1972-76 1977 1978 1979 198() 1981
Agricultural and RuralDevelopment $108.1 $235.8 S165.7 $198.6 $242.5 $254.3
Development Finance Companies 27.2 46.5 25.9 19.2 88.5 15.0Education 37.8 37.3 57.7 26.5 35.1 161.2Energy
Oil, gas, and coal 4.0 - - - 48.5 -
Power 51.1 55.0 48.0 9.0 115.0 10.0Industry 24.5 23.0 45.0 60.0 - 4.0Nonproject 18.0 45.0 - - 192.5 217.0Population, Health, and
Nutrition 2.4 - - - -Small-Scale Enterprises 0.8 - 10.0 - - -
Technical Assistance 2.3 - 3.0 7.5 4.5 40.4Telecommunications 20.4 - - 20.0 - 15.2Tourism - 17.0 - 14.0 - -Transportation 92.1 90.6 99.0 265.0 42.5 133.0Urbanization 9.5 - 70.0 - 21.0 15.0Water Supply and Sewerage 14.2 22.0 36.0 26.0 24.9 9.0
Total $412.3 $572.2 $560.3 $645.8 $815.0 $874.1
Of which: Bank $193.3 $311.7 $162.4 $266.0 $150.5 $304.0IDA $219.0 $260.5 $397.9 $379.8 $664.5 S570.1
NOTE: Details may not add to totals. due to rounding.

Eastern Africa 33
<>44
Women learning farming techniques at a one-weekseminar run by' a training center in Lilongwe,Malawi.
regional exports, because the volume of exports Annual Report. Superimposed on these trendsstagnated or declined. The composite export was the negative influence on the export sector ofprice index for the region rose 28 percent in 1979 the shortage of foreign exchange. In some coun-and 24 percent in 1980.' Copper prices rose to a tries, such as Sudan, Tanzania, and Zaire, thelevel two thirds higher than the low level of 1978, point had been reached at which severe rationingbut export tonnages have remained low in Zam- of imports had deprived the export sector of thebia and Zaire compared to levels reached in means-essential fuel, equipment, and inputs-earlier years. Cotton prices went up 29 percent in for normal operation and thereby compounded1980 from the 1978 level, but Sudanese exports the scarcity of foreign exchange in fiscal 1981.declined steeply, because accumulated stocks In addition to their inability to take advantagehad already been exported and current produc- of rising export prices. the countries of the regiontion was down as a result of poor weather, labor were adversely affected by increases in the costunrest, and lack of critical imported inputs. of imports. The composite import price index forSugar prices also skvrocketed in 1980, but the region increased 18 percent a year in bothMauritius could not benefit from the windfall 1979 and 1980. About a third of this increase wasbecause of heavy cyclone damage and the com- the result of movements in petroleum prices.mitment to sell most of the 1980 crop to the The remainder of the increase was due mainly toEuropean Economic Community (EEC) at set the rise in prices of manufactured goods, par-prices that were lower than world market prices. ticularly capital goods, imported from theCoffee prices increased 12 percent in 1979, but industrialized countries. Petroleum importsexports from Kenya and Tanzania declined; absorbed roughly 25 percent to 33 percent of thecoffee prices declined again in 1980 and 1981. 1979 export earnings of individual countries in
Quite apart from the effects of bad weatherand other exceptional circumstances, there werelong-run adverse trends in output that held downagricultural production and export supplies in 'These increases largely reflect the fact that, in 1978, priCcs Ofmagricoultural production us Inmajor exports, particularlv at copper, which has a large weight inmany countries, as discussed in last year's the index, were vcrv depressed.

34 1981 Regional Perspectives
the region, whereas they had absorbed only nesses and lack of trained personnel. This sectorabout 10 percent in 1970. This share rose further was hurt further by the inadequacy of foreignas a result of the steep increase in petroleum exchange for fuel, vehicles, and spare parts. Theprices in 1980. volume of oil imports had been growing briskly
Imports would have declined more than they at around 12 percent a year mn most countriesdid had it not been for a substantial rise in ODA. until the early 1970s. But after the oil price hike,Net disbursements from countries that are mem- the rate of growth was negative in all but a fewbers of the Development Assistance Committee countries. This decline caused a severeand from multilateral agencies to nineteen deterioration in transport and contributed to aEastern African countries amounted to about disruption of traffic in key commodities in$2,500 million in 1978, or 28 percent of the value Ethiopia, Sudan, Tanzania, and Zaire.of merchandise imports. In the following year, Altogether, the import constraint and othertotal aid amounted to S3,400 million, or 37 per- factors have combined to slow the expansion ofcent of the value of imports. Especially large GDP in the region. In 1979. per capita incomeincreases in inflows of aid were received by declinedagaininUganda. Zaire. andZambia. ItKenya, Malawi, Sudan, Tanzania, and Zambia. also declined in Kenya and Zimbabwe. InA predominant share of aid, however, is tied to Malawi, Mauritius, Sudan. and Tanzania, therespecific projects or currencies of donor countries was an increase of less than 1 percent in perand is thus not freely available to finance the capita income. Data for 198( that are available somost urgent items of imports, such as spare far suggest that adverse tr.nds in income per-parts. sisted in many countries.
Also, in some instances, the increase in official . .assistance merelv offset a contraction in the EffortstoAdjustandActvitiesoftheBankinflow of funds on nonconcessional terms; it did Member governments of the Bank realize thenot augment import capacity. urgent need to resolve the severe economic
In 1980, most countries of the region- problems that they face, for they recognize theEthiopia, Kenya, Madagascar, Malawi, extent to which these problems will adverselyMauritius, Sudan, Tanzania, and Zambia, for affect the implementation of their medium-termexample-incurred large deficits in the current and long-term plans for increasing investmentaccounts of their balance of payments, despite and welfare. The aim in the near term must be tothe depressed level of imports. Several countries reduce deficits in the balance of payments tofinanced part of the deficit by drawing down their levels that can be sustained through externalforeign-exchange reserves further. thereby assistance without recourse to excessive com-enhancing the vulnerability of their economies mercial financing. This objective can be securedto further shocks. These reserves now stand at through a combination of demand-managementlevels that represent less than two months' and supply-augmentation policies, especiallyimports. those concerned with the recovery of exports
and the output of food. Some decisions haveThe Effect of Lessened Imports already been made, but the situation varies fromon Economic Activity country to country. A number of policy areas-
In some countries constrained imports were pricing of petroleum products, tariffs onundermining exports, as mentioned earlier. In transport and power, exploitation of energymany more countries, the rationing of imports resources, removal of bottlenecks in thereduced supplies for agricultural and industrial development of infrastructure and skills-will beenterprises, including public firms, that cater to reviewed here in order to assess the presentthe domestic market. The reduction in imports status of adjustment policies and their relation toof intermediate goods sharply reduced the use Bank lending.made of existing production capacitv and The sharp increase in the price of imported oilincreased unemployment in the modern sector. has been passed on fully to the retail level inEven general government services such as Burundi, Kenya, Malawi. Mauritius, Rwanda.,agricultural extension, schools, and health and Tanzania, where the price of regularfacilities were deprived of critical imported items gasoline, including tax, in 1980-81 was aboutin many countries. Recurrent budgetarv alloca- $3.00 a gallon at the official rate of exchange. Intions to many agencies for maintenance and Botswana and Swaziland retail prices are at aoperations were cut as government tax revenues, comparable level and there may not be muchheavily dependent on foreign trade, failed to subsidy involved. By raisin, oil prices 56 percentkeep pace with requirements. in March 1981, Ethiopia has moved in the same
The state of maintenance and operations of direction. In several other countries, however,the modern transport sector was already poor in prices of gasoline remain far below bordermany countries owing to institutional weak- prices.

Eastern Africa 35
Partly because local prices of petroleum prod- cation of rail lines in Zimbabwe may alsoucts have lagged behind international costs and increase.partly for other reasons, transport and power In order to ease acute. economvwide short-tariffs also have not been adjusted fullv to reflect ages of skilled personnel that continue to pre-the central fact that energy has become much vent efficient operation of existing capacity. themore expensive. Some instances of sharp Bank has in recent years placed greatcr empha-increases should be noted, however. Railway sis on technical, commercial, and managementtariffs rose an average of 301] percent between curricula in education projects and on training1972 and 1980 in Sudan and 120 percent in Kenya. components of other projects. While such train-In Burundi, the official tariff for road transport ing components were included in about 50 per-rose 47 percent between 1977 and 1980. Between cent of the projects approved before 1974, the1974 and 1979 average tariffs on electricity proportion has risen to 75 percent in recentincreased 111 percent in Mauritius. 88 percent in years.Malawi, and 70 percent in Botswana. A number of governments have drawn up
The Bank has responded to the new energy economywide or sectoral adjustment policiessituation by mounting a program of energy that have been supported by nonproject lendingstudies and by apportioning a larger part of its by the Bank and IDA. Actions taken by Kenyaproject lending to this sector. A review of the and Sudan in this context were summarized incoal sector was completed in Madagascar. last year's Atnnual Report. They were joined inEnergy studies are under way in Burundi, fiscal 1981 by Malawi, Mauritius, and Tanzania.Kenya, Malawi, Mauritius. Rwanda, and Zim- The emphasis of the Malawi program is on thebabwe. More than 12 percent of project lending diversification of exports, the exploitation ofwas for energy in fiscal 1980 and 1981, while local energy resources, and the rationalization ofduring the preceding five years it had been less public expenditures. Similarly. the emphasis ofthan 9 percent. Predevelopment work in oil and the Mauritius policies is on restraining publicgas in Somalia and Madagascar is being sup- investment. reducing the capital/output ratio,ported by the Bank, as are exploratory oil drill- and stimulating the revival of manufactureding and consultant services for further engineer- exports. Finally, the aim of the Tanzania pro-ing and economic studies in Tanzania. A gram is to rehabilitate primary exports bypetroleum development and distribution project improving incentives to producers and earmark-is being prepared in Sudan. A geothermal proj- ing the limited supply of foreign exchange for theect has been initiated in Kenya, and hydro- purchase of critical imported inputs. In all theseelectric schemes in Madagascar, Sudan, and countries, policies recentlv initiated will have toSwaziland have been assisted. A further be sustained throughout a substantial period ifhydroelectric project in Kenya is under active they are to produce the desired results. It willconsideration. The Bank is also acting as the also be necessary to design supplementaryexecuting agencv for a United Nations Develop- policies in related fields to strengthen andment Programme (UNDP) project in which broaden the effects of the entire program.photovoltaic cells and solar-thermal power are Altogether. nonproject financing by the Bankbeing demonstrated and tested in small irriga- and IDA constituted 22 percent of total lendingtion pumps in Sudan. In fiscal 1980, the Bank to Eastern Africa during fiscal 1980 and 1981; thefinanced a rural development project in Malawi share had been only 4 percent in the precedingthat contained a component intended to meet five years. Although the International Monetarvthe requirements of the rural population for Fund (IMF) has made available substantial addi-firewood and charcoal through the establish- tional resources in support of structural-adjust-ment of community woodlots and homestead ment policies that governments have put intoplanting. Recent rural development projects in effect, the financial needs are considerablyBurundi, Madagascar, Rwanda, and Tanzania larger than can be met by the World Bank andalso had fuel-wood and energy components. the IMF. To help coordinate the use of resources
In the transport sector, the emphasis of Bank from external donors in the face of rapidlylending has been on the maintenance and changing circumstances, the Bank presided overrehabilitation of existing capacity rather than on meetings of Consultative Groups on Mauritiusadding to such capacity. In three fiscal years, (newlv founded in fiscal 1981) and Zaire during1979, 1980, and 1981, loans or credits were made the fiscal year.to eleven countries for the rehabilitation of roadsand motor vehicles and to five countries for the Bank and IDA Lending, Fiscal 1981rehabilitation of railway tracks, locomotives, Total Bank and IDA lending in the region inandwagons. The risingprice of oil should lead to fiscal 1981 amounted to $874.1 million, somediversion of some traffic from road to rail, since $59.1 million above the fiscal 1980 level. A totalthe latter can be more energy efficient. Electrifi- of 40 loans and credits was approvcd. LendingI

36 1981 Regional Perspectives
for agriculture and rural development and Disbursements on Bank loans to borrowingnonproject lending accounted for 29 percent and countries of the region were $126.0 million dur-25 percent, respectively, of total lending in the ing the fiscal year. Disbursements of IDA creditsregion in dollar terms. stood at $326.5 million for the same period. The
Funds committed under cofinancing arrange- figures for Bank and IDA disbursements in fiscalments with the Bank and IDA reached S179.8 1980 were $171.1 million and S208.9 million,million, or 59 percent below last year's level. respectively.Each cofinanced project attracted an average of$12 million in cofinancing during the year, com-pared with about $29.5 million in fiscal 1980.2 2
Cofinancingdatahavebecen compiled from World Bank reports ofprojects at the time of their Board approval and do not reflect(See table on page 80.) changes in amounts since that time.

37
Western Africa
The review in last year's Annual Report of Western Africa, excluding oil, have remainedmajor economic trends during the seventies depressed or have declined further; in most partsnoted that the turbulence that arose from sudden of the Sudano-Sahelian region, rains in 1980energy price increases, enormous fluctuations in were insufficient or irregular and, in severalcommodity prices, droughts, increases in prices countries, export crops, groundnuts in particu-paid for imported capital goods, and recession in lar, were poor or very bad; food crops-milletthe member countries of the Organisation for and sorghum-were generally mediocre. WithEconomic Co-operation and Development indications that in the 1980s prospects for sub-(OECD), combined with insufficient or mis- stantial Official Development Assistance flows,directed policy responses, had left many coun- particularly from countries that are members oftries of Western Africa in a condition of the Development Assistance Committee of theeconomic weakness: very large external deficits, OECD, are not bright, and that import pricesmounting external debt, and, on the whole, a would continue to increase, though at a slowerpoor growth record. pace than in the 1970s, and with a distinctly more
External factors during the first eighteen reserved attitude on the part of private sources ofmonths of the new decade have not been of a capital and only cautiously optimistic forecastskind to allay the fears that the eighties would be a of economic recovery in the industrial countries,difficult, perhaps a decisive period for the long- it has become clear to Western African govern-term future of African countries. During 1979 ments that serious efforts at domestic adjust-and 1980 the petroleum import bill of oil-import- ment have become necessary. Countries varying Western African countries jumped sharply; greatly in the magnitude of the internal andprices of most of the commodities exported from external imbalances that need to be corrected.
Country Pcr capita Trend in Lending, 1972-81borrowers. Population I GNP 1979 2 (USS millions. Fiscal years.)fiscal 1979-81 (011) (US$) (tO) Number of Operations
Benin 3.425 250Cameroon 8.245 560Central African
Republic 1,952 290Chad 4,365 110Congo, People's
Republic of the 1,497 630Gambia, The 587 250Ghana 11,313 400Guinea 5,275 280Guinea-Bissau 779 170Ivory Coast 8,227 1.040Liberia 1,797 500Mali 6.750 140Mauritania 1.588 320Niger51627Nigeria 82,603 670Senegal 5.518 430Sierra Leone 3,381 250Togo 2,420 350Upper Volta 5,642 180
NOTE; The 1979 estimates of GNP per capita presented abovc arefrom the "World Dcvclopment indicators" in the WorldDevelopment Report 1981.
' Estimates for mid 1979.World Bank Atlas methodology. 1977-79 base period.
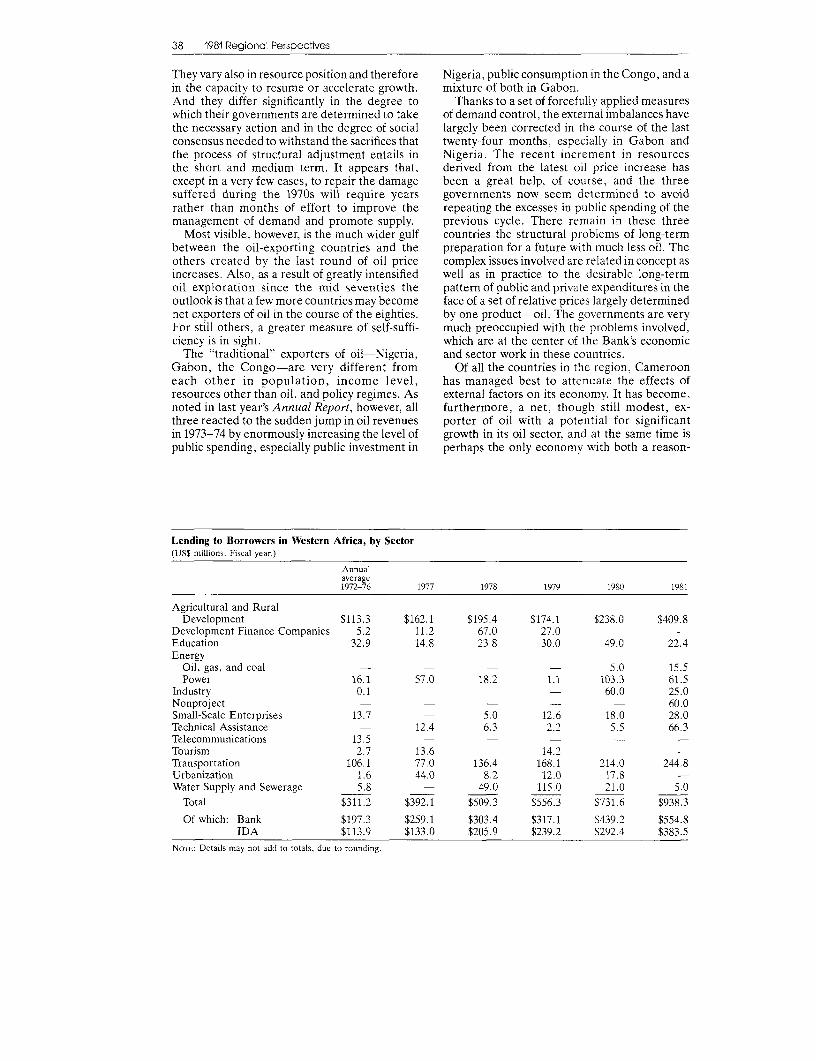
38 1981 Regional Perspectives
They varv also in resource position and therefore Nigeria, public consumption in the Congo, and ain the capacity to resume or accelerate growth. mixture of both in Gabon.And they differ significantly in the degree to Thanks to a set of forcefully applied measureswhich their governments are determined to take of demand control, the external imbalances havethe necessary action and in the degree of social largely been corrected in the course of the lastconsensus needed to withstand the sacrifices that twenty-four months, especiallv in Gabon andthe process of structural adjustment entails in Nigeria. The recent increment in resourcesthe short and medium term. It appears that, derived from the latest oil price increase hasexcept in a very few cases, to repair the damage been a great help, of course, and the threesuffered during the 1970s will require years governments now seem determined to avoidrather than months of effort to improve the repeating the excesses in public spending of themanagement of demand and promote supply. previous cycle. There remain in these three
Most visible, however, is the much wider gulf countries the structural problems of long-termbetween the oil-exporting countries and the preparation for a future with much less oil. Theothers created by the last round of oil price complex issues involved are related in concept asincreases. Also, as a result of greatly intensified well as in practice to the desirable long-termoil exploration since the mid seventies the pattern of public and private expenditures in theoutlook is that a few more countries may become face of a set of relative prices largely determinednet exporters of oil in the course of the eighties. by one product-oil. The governments are veryFor still others, a greater measure of self-suffi- much preoccupied with the problems involved,ciency is in sight. which are at the center of the Bank's economic
The "traditional" exporters of oil-Nigeria, and sector work in these countries.Gabon, the Congo-are very different from Of all the countries in the region, Camerooneach other in population, income level, has managed best to attenuate the effects ofresources other than oil, and policy regimes. As external factors on its economy. It has become,noted in last year's Annual Report, however, all furthermore, a net, though still modest, ex-three reacted to the sudden jump in oil revenues porter of oil with a potential for significantin 1973-74 by enormously increasing the level of growth in its oil sector, and at the same time ispublic spending, especially public investment in perhaps the only economy with both a reason-
Lending to Borrowers in Western Africa, by Sector(US$ millions. Fiscal year.)
Annualaverage1972-76 1977 1978 1979 1980 1981
Agricultural and RuralDevelopment $113.3 $162.1 $195.4 $174.1 $238.0 $409.8
Development Finance Companies 5.2 11.2 67.0 27.0 - -Education 32.9 14.8 23.8 30.0 49.0 22.4Energy
Oil, gas, and coal - - - - 5.0 15.5Power 16.1 57.0 18.2 1.1 103.3 61.5
Industry 0.1 - - - 60.0 25.0Nonproject - - - - 60.0Small-Scale Enterprises 13.7 - 5.0 12.6 18.0 28.0Technical Assistance - 12.4 6.3 2.2 5.5 66.3Telecommunications 13.5 - - - - -Tourism 2.7 13.6 - 14.2 -
Transportation 106.1 77.0 136.4 168.1 214.0 244.8Urbanization 1.6 44.0 8.2 12.0 17.8Water Supply and Sewerage 5.8 - 49.0 115.0 21.0 5.0
Total $311.2 $392.1 $509.3 $556.3 $731.6 $938.3
Of which: Bank $197.3 $259.1 $303.4 $317.1 $439.2 $554.8IDA $113.9 $133.0 $205.9 $239.2 $292.4 $383.5
NOTE: Details may not add to totals, due to rounding.
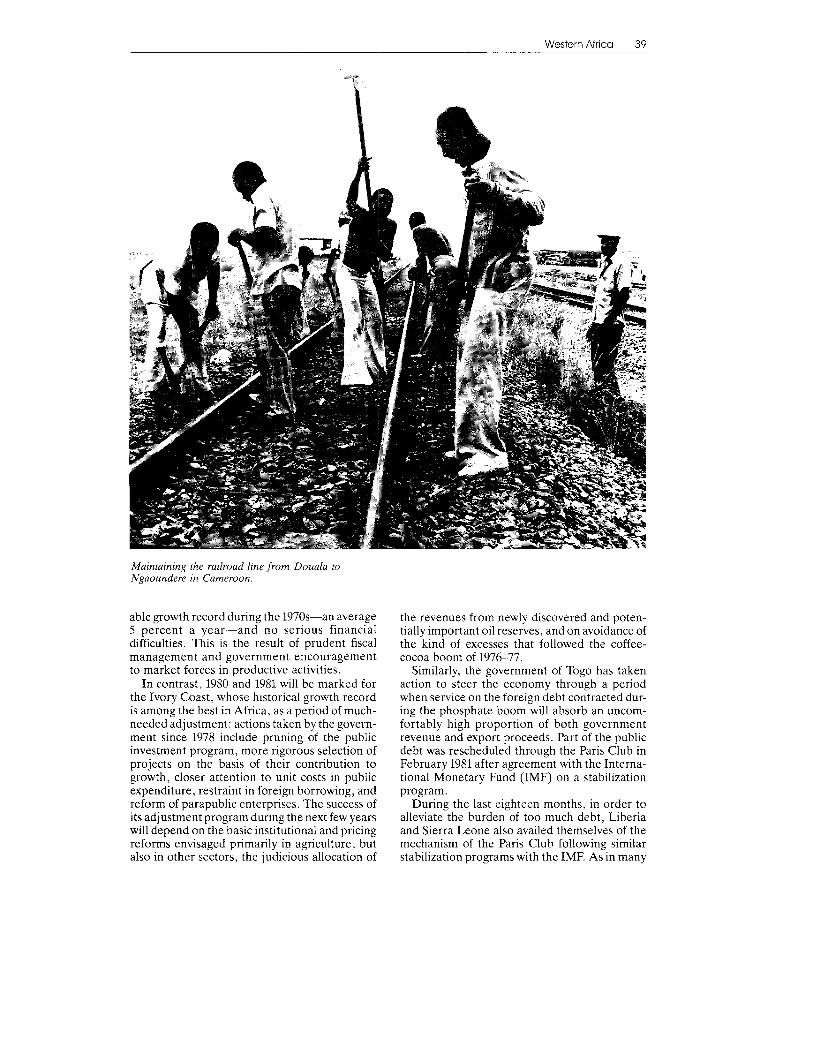
Western Africa 39
Maintaining the railroad line from Douala toNgaoundere in Cameroon.
able growth record during the 1970s-an average the revenues from newly discovered and poten-5 percent a year-and no serious financial tiallv important oil reserves, and on avoidance ofdifficulties. This is the result of prudent fiscal the kind of excesses that followed the coffee-management and government encouragement cocoa boom of 1976-77.to market forces in productive activities. Similarly, the government of Togo has taken
In contrast, 1980 and 1981 will be marked for action to steer the economy through a periodthe Ivory Coast, whose historical growth record when service on the foreign debt contracted dur-is among the best in Africa. as a period of much- ing the phosphate boom will absorb an uncom-needed adjustment: actions taken by the govern- fortably high proportion of both governmentment since 1978 include pruning of the public revenue and export proceeds. Part of the publicinvestment program, more rigorous selection of debt was rescheduled through the Paris Club inprojects on the basis of their contribution to February 1981 after agreement with the Interna-growth, closer attention to unit costs in public tional Monetary Fund (IMF) on a stabilizationexpenditure, restraint in foreign borrowing, and program.reform of parapublic enterprises. The success of During the last eighteen months, in order toits adjustment program during the next few years alleviate the burden of too much debt, Liberiawill depend on the basic institutional and pricing and Sierra Leone also availed themselves of thereforms envisaged primarily in agriculture, but mechanism of the Paris Club following similaralso in other sectors, the judicious allocation of stabilization programs with the IMF. As in many

40 1981 Regiono Perspectives
other cases, the governments have also under- In countries that are comiparativelv welltaken to make better use of funds from foreign endowed with natural resources, such as Ghanaborrowing in recognition of the fact that a prim- and Guinea, but that have suffered from pro-arv cause of the so-called debt problem had found and persistent weaknesses in organiza-been the allocation of such funds to unproduc- tion, politically difficult steps will be required totive projects. remove the deep-seated distortions that pervade
The program of structural adjustment under- the system of incentives and to move theirtaken bv Senegal since the middle of 1980, with economies away from the historical trend towardsupport from the Bank, the IMF, and bilateral stagnation.donors, illustrates the extent of the reforms that Faced with the imperative of rehabilitatingmav be needed when, as is frequently the case, their economies, the vast majority of Westernthe problem is rooted in an historic pattern of African countries are likely to take the criticalpolicies and institutions that were not alwavs internal policy measures needed, and the Bankappropriate. The program seeks to increase is prepared to assist them. As mentioned earlier,public savings. Expansion of credit is to be the Bank has provided support to the structural-severely limited, as is foreign borrowing. The adjustment program in Senegal; discussions arepublic investment program for 1981-84 is to be under way with a few other countries in thetrimmed and its composition tilted toward more region with a view to devising reform programsdirectly productive sectors, and projects will be at both the macroeconomic and sectoral levels.selected according to more rigorous cost-benefit It would be unrealistic to expect, however, thatanalysis. with the present level of external assistance
Major parts of the incentive system are to be domestic adjustment alone will accelerate therevised: higher and more nearly uniform import pace of growth throughout the region. In thetariffs and export subsidies are being introduced long term, inflows of public and private capital aton a limited scale; consumer prices are to be higher levels and a more favorable tradegradually decontrolled and producer prices environment are also essential ingredients.made more remunerative. The parapublic sectorhas undertaken to prepare "program contracts" Lending Focus on Rural Developmentdesigned to clarify objectives, internal struc- With respect to agriculture. the 1980-81 croptures, and financial relations with the govern- year in the region has not given any indicationment. that it will reverse the total food situation.
This comprehensive program of structural Imports of wheat and rice by all countries in theadjustment is meant to cut the external deficit on region probably exceeded the 3.2 million tonscurrent account and lay the foundations for sus- recorded in 1978-79 and could reach 5 milliontained growth. What may have been the worst tons by 1985. While weather has had somethinggroundnut crop since independence, however, to do with food production, two important rea-has greatlv compounded the difficulties. While sons for the deteriorating situation continue tothe government will need to remain committed be inappropriate pricing and support policiesto the objectives of the rehabilitation program, and resource constraints.more time than was foreseen will be needed to Pricing and import policies have channeledachieve them. demand toward consumption of wheat and rice,
In countries facing serious structural problems which are becoming more popular in urbanin other parts of the Sahel, it is often less clear areas, replacing locally produced foods that arewhat the governments' programs are. The situa- more expensive. Inadequate allocations oftion remains unsettled in Chad: in November foreign exchange and funds to meet subsidies1980 a new military government came to power elsewhere in the economy have caused inputs toin Upper Volta; in Niger the cereal crop was be insufficient, and thev are often delivered toorather good, but a decline in uranium prices and late by state corporations. These policies are alsouncertain prospects for the future required a encouraging poor use of land and are preventingreduction in the public investment program and the development of better techniques of landmade apparent the need for the government to management. In the drier areas and also in thestrengthen its financial management, especially more populous areas, soil and water conserva-with respect to foreign borrowing. In Mali. the tion problems are increasing with deforestation.government has determined that reforms are As more crop wastes are burned for domesticseriously needed in the public sector, especially purposes, less is available for feeding livestockliberalization of the marketing of cereal and and for retaining the fertility of the soil. Declinesmore stringent employment policies for the in agricultural production may also be attributedpublic sector as conditions for achieving a to the attitude of farmers who are reluctant tomeasure of internal and financial equilibrium risk growing crops that have perennially beenand for stimulating agricultural production. lost to drought and pests.

Western Africa 41
To help rectifv these problems, the focus of only one such project. in the Congo. in fiscalBank lending in Western Africa has continued to 1980. In addition, S2.8 million of Project Prep-be on rural development and on policy discus- aration Facility (PPF) advances were granted forsions with governments, particularly in Mali, the preparation of seven oil-exploration proj-Nigeria, Senegal. and Upper Volta. Lending for ects, while only $0.8 million, for three projects,agriculture, including food production. had been advanced in fiscal 1980. Bank lendingincreased 71 percent in fiscal 1981 and continues for technical assistance in the petroleum sectorto claim the largest share of total lending to the increased more than 400 percent in fiscal 1981.region. Afforestation, improved land use, and In the area of renewable energy, an IDA creditagricultural research are receiving more atten- of $9.3 million was approved in fiscal 1981 for ation in the planning of possible projects for the forestry project in Senegal featuring 5,000 hec-future. While rural development projects them- tares of rainfed tree plantations to renew andselves cannot turn the tide, there is evidence that expand natural sources of fuel wood and buildingthey are improving food supplies in the project poles. A similar project in Cameroon is in anareas and that their examples are encouraging advanced stage of preparation. as are a gasoholsome governments to consider more favorable project in Mali and hydroelectric projects inpolicies. Nigeria is a case in point as it attempts Benin, the Ivory Coast, Sierra Leone, and Togo.to implement its 1980 National Food Strategy. Hydroelectric projects in Ghana. Guinea,the main elements of which are to provide the Liberia, Niger, and Upper Volta are beingsmall-scale farmers with production inputs, such examined.as fertilizers, pesticides, seeds, and farm equip-ment; to offer critical services consisting, for During fiscal 1981, preliminary energy-sectorinstance, of rural feeder l oads, crop and input reviews were undertaken for Cameroon. Ghana,storage facilities, extension services, and so on; and Sierra Leone. In these, an attempt was madeand to adopt a package of incentives. such as to examine. to the extent possible, resources,crop-pricing policies, investment incentives, and supply, demand, investment, institutions, andimport tariffs that encourage food production policies. In addition to the preliminary iden-while minimizing the direct activities of the tification of project opportunities, policy issuesgovernment in food production. requiring consideration were flagged. and ways
and means, including technical assistance, ofimproving national energy planning and
Developing Energy Potential management were suggested. Similar studies ofWith respect to energy, the Bank's response is other countries are planned.
to help the oil-importing countries to explore In the transportation sector maintenance,and develop their own energy potential, par- rehabilitation, and upgrading of existingticularly in petroleum, but also including energy infrastructure, extending feeder road networks,from renewable sources, such as hydropower. and institution building have been given priorityfuel wood, biomass. and solar energy, and to set over new investments in high-standard roads. Inup comprehensive national planning and fiscal 1981 alone, seven road projects werepolicies for energy so as to ensure more efficient approved with those priority objectives in mind,use of this key resource. including a $100 million Bank sector loan to the
Bank strategy with respect to petroleum is to Ivory Coast that emphasizes rehabilitation andpromote exploration. Bank-assisted exploration construction; an $11.3 million IDA credit toprojects typically comprise reevaluation of exist- Benin for rehabilitation and maintenance; a $20ing data and the gathering of new geological and million IDA credit to Togo featuring institution-geophysical data and strengthening of national building components: and a $17 million IDAplanning capacity in the oil sector for carrying credit to Mali for maintenance. Further projectsout further collection and analysis of data, are being prepared along the same lines.negotiation of exploration contracts, and Transport ranked second in the overall distribu-monitoring of exploration activities. Bank- tion of Bank lending to the region and, in addi-assisted exploration activities are now being con- tion, was able to muster considerable amounts ofsidered or carried out in three basins: the cofinancing funds.onshore Taoudeni basin in Mali and Mauritaniaand two offshore basins-one involving TheGambia, Guinea, Guinea-Bissau, Mauritania, Bank and IDA Lending, Fiscal 1981and Senegal, the other Benin, Ghana, the Ivory Total Bank and IDA lending in the region inCoast, and Togo. During fiscal 1981, the Bank fiscal 1981 amounted to $938.3 million, someand IDA assisted petroleum-exploration proj- $207 million above the fiscal 1980 level. A total ofects in Guinea-Bissau. Liberia, and Mali. for a 35 loans and credits was approved. Lending fortotal of $15.5 million, whereas they had assisted agriculture and rural development and transpor-

42 1981 Regional Perspectives
tation accounted for 43 percent and 26 percent, Disbursements on Bank loans to borrowingrespectively, of total lending in the region in countries of the region were S245.5 million dur-dollar terms. ing the fiscal year. Disbursements of IDA credits
Funds committed under cofinancing arrange- stood at $183.2 million for the same period. Thements with the Bank and IDA reached $178.8 figures for Bank and IDA disbursements in fiscalmillion, or 71 percent below last vear's level. 1980 were $233.3 million and $142.0 million,Each cofinanced project attracted an average of respectively.$15 million in cofinancing during the vear, com-pared with about $34 million in fiscal 1980.' (See Cofinancing data have been conPiied from Wovalad Bank reports of
projects at the timen of their Board approval and do not reflecttable on page 80.) changes in amounts since that time~

43
East Asia and Pacific
With their rapidly growing and generally open substantial initial deficits in current accounts,economies, the countries in the region that bor- which meant that policies were needed to reducerow most heavily from the Bank have been these deficits, if not immediately, then at least indeeply affected by recent events in the interna- the medium term.tional economy, which are discussed elsewhere The deteriorating climate of world trade has,in this Annual Report. The changes were adverse however, made it difficult to effect the adjust-for the three large petroleum-importing coun- ment by increasing exports. In the case of Korea,tries: Korea, the Philippines, and Thailand. The a major exporting country, the efforts to diver-approximate doubling of nominal petroleum sify to a technologically more advanced mix ofprices between mid 1979 and mid 1980 cost these output and exports-such as automobiles andcountries some 4-6 percent of their real heavy machinerv-proved to be more difficultincomes. In contrast to the situation in 1974-75 than had been anticipated. These difficultiesthese losses were not compensated for by were exacerbated by the inflationary pressuresincreased prices of other commodities exported brought on by the high rates of growth in grossby countries in the region: although prices of domestic product (GDP), which averaged 11 per-sugar and grains increased, those of some metals cent a year during 1976-78, and rapidlv risingand vegetable oils declined. The net effect on the labor costs, which were caused by the tighteningbalance of payments was positive for Thailand labor market. The declining competitiveness inand mixed for the Philippines. The effect of the exports necessitated a 36 percent devaluation ofloss in the terms of trade for the three large the won in 1980, which, while improving thepetroleum importers came on top of already balance of trade, brought on another inflation-
( ounrsrr Plcr capit, Trend in Lending, 1972-81borrowscr. Populatulio (NP 197) (US$ mil ons Fisca years.)tilcul 1')S 'I (-)11(1) (JISS) (0t) Number of Operations
China 964.505 26(1Fiji 6 19 1. )8(1Indonesia 142.87(1 370Korea. Republic of 37.814 1,480(Lao People's
Democratic Republic 3,349 -Malaysia 13.137 1.37(0Papua New Giuinea 2.939 66(1Philippines 40.748 61(1lSolomon Islands 221 -T hailand 45.475 59(1Viet Nam 52.943 -Western Samoa 155
NIr E. Ishc 1979 csuirmat. of1 GNP pcr capit. prcscrstedl ahovc .accfrlim dc WbWrld D,,clapnmenn Indicatrorsr in thc War-l
t(le*zlrll R'I}>r I,,I \ /II \ \ Oocr c1olurrcrs Rq,ort /5,).Xi
Etiru,tcr tr mid Q1 /79.
'I! 'cap f/ask Arlas iicuthodoloecs\. 1)77-79 ac perio)d i

44 1981 Regional Perspectives
ary price push. With international inflation also persist for several years. Inflation is also anaccelerating, Korea's domestic inflation rate important constraint for Indonesia where thepeaked at 29 percent in 1980 before beginning to government has succeeded in bringing the rate ofabate in 1981. inflation down to about 15 percent a year from
In the Philippines and Thailand, domestic the rate of 30 percent reached in the wake of theinflationarv pressures were less strong, but still 1978 devaluation. The onlv larger country in thethe rate of inflation in these two countries region that has succeeded in keeping inflationaccelerated to 18 percent and 20 percent, respec- below the double-digit level during the lasttivelv, in 1980. Control of inflation-principally several years is resource-rich Malaysia, whichby means of tight monetarv policy and selective had an inflation rate of 7 percent in 1980 dueprice freezes in the Philippines and by means of partly to the conservative fiscal and monetarycuts in subsidies and other budgetary expendi- policies pursued by that country.tures in Thailand-and a reduction of balance- Of the countries of the region, the mostof-payments deficits therefore became impor- seriously afflicted by oil price increases were thetant objectives of policy in 1980 and 1981. The small, oil-importing countries such as land-deflationary policies that were adopted led to locked Laos. To avoid a worsening of itssome reduction in the growth momentum in economic situation and further deterioration inboth countries. In Korea. the effects of a very living standards, Laos introduced in fiscal 1981bad harvest, the political uncertainty and civil several sweeping measures, including partialunrest that followed the assassination of Presi- elimination of price and subsidv distortions anddent Park, and of restrictive policies for combat- an austere stabilization program. Devaluation ofting inflation worked together to reduce GDP the kip had occurred in the previous fiscal year.nearly 4 percent in 1980, and in the course of the In consultation with the Bank, more resourcesyear, the government resorted to measures by were committed to irrigated rice production,which it hoped to stimulate the economy, livestock, and forestry. As a result of thesealthough these were tempered by concern for measures, the economic situation in the countryresurgent inflation. improved markedly.
For Indonesia, as a petroleum exporter, the oil These various issues must be consideredprice increase has led to a large improvement in against the background of the continuing need toits balance of payments, and it is expected that redress poverty and to increase the welfare ofthe present surpluses in current accounts will large segments of the population, a task that will
Lending to Borrowers in East Asia and Pacific, by Sector(USS millions. Fiscal year.)
Annualaverage1972-76 1977 1978 1979 198(1 1981
Agricultural and RuralDevelopment $211.1 S 522.5 $ 794.2 $ 566.4 $ 786.4 $ 648.0
Development Finance Companies 86.0 232.5 290.0 150.0 90.0 431.5Education 57.9 83.0 40.0 164.0 138.0 363.0Energy
Oil, gas, and coal - - - 4.9 179.0 -
Power 100.6 196.0 259.0 255.0 588.5 350.0Industry 38.0 80.0 10.0 29.0 - 8.9Nonproject 35.0 - - - - 218.0Population, Health, and
Nutrition 8.6 37.5 33.1 57.0 65.0 -Small-Scale Enterprises 9.3 - 44.8 25.0 - 106.0Technical Assistance 4.4 - - 10.0 -
Telecommunications 16.0 - - 90.0 - -
Tourism 8.2 - - - - -Transportation 174.1 248.0 246.5 389.7 253.0 100.0Urbanization 22.8 52.5 8.6 102.0 166.0 133.0Water Supply and Sewerage 28.3 23.0 - 287.0 103.0 -
Total $800.3 S1,475.0 $1,726.2 $2,130.0 $2,368.9 $2,358.4
Of which: Bank $707.8 $1,452.0 $1,586.9 $1,791.6 $2.160.5 $2,227.9IDA $ 92.5 $ 23.0 $ 139.3 $ 338.4 $ 208.4 $ 130.5

East Asia and Pacific 45
A student learning welding techniquesat the Vocational Training Institute inPusan, Korea.
not be easy. Two countries, Korea and Thailand, dence of poverty in the Philippines probablyhave been successful in this respect since the declined a few percentage points toward the end1960s. But the situation may be changing for the of the 1970s. There is, however, a danger thatworse, for Korea may find new trade restraints in increasing poverty will assert itself in other coun-the path of its export-led strategy, Thailand can tries, unless governments can effectively counterno longer count on the availability of additional the less favorable economic conditions that pre-land reserves, and both countries are wrestling vail now and are expected to prevail in thewith scarcity of budgetary resources. future.
The absence of a foreign-exchange constraintcreated opportunities for the alleviation of Government Policies and Bank Assistancepoverty for the two petroleum exporters, Although at varying rates of intensity, allIndonesia and Malaysia. Those two countries countries are attempting to address thesehave manpower development programs under problems, and the Bank is assisting them in theirimplementation-programs supported with efforts. The three countries with the largest cur-external assistance, including that from the rent-account deficits-Korea, Thailand, and theBank-to meet the growing demand for skilled Philippines-especially are moving across amanpower so as to enable programs of poverty broad front to induce structural adjustments inalleviation to be designed and carried out. The their economies. Areas of special importanceskilled-manpower constraint is, of course, a are appropriate pricing policies and tradephenomenon common to many developing policies, mobilization of resources, monetarycountries. The same general problem exists in policy, conservation of energy, import substitu-copper-rich Papua New Guinea, where the criti- tion, industrial and financial reorganization,cal constraint is the shortage of skilled and rural development, alleviation of poverty, man-trained manpower. Judging from improvements agement of foreign debt, and improved publicin some economic and social indicators, the inci- administration. Within the space of the Annual

46 1981 Regional Perspectives
Report it is not possible to cover all these areas in ing-together with cofinancing by privateall countries, so a few examples must suffice. banks-through one institution, the Apex
With respect to energy, the government of Development Finance Unit, created by theThailand has moved rapidly for more than a year Central Bank of the Philippines in consultationto bring prices into line with international levels. with the World Bank; the funds are onlent toThis will not only tend to improve efficiency in other domestic banks according to criteria pre-the use of energy but will also reduce public- viously agreed upon, with industrial lending assector subsidies and budget deficits. The govern- the ultimate purpose.ment is also preparing a program for conserva- Industrial reorganization is also expected totion of energy bv the large industrial users of be included in the structural-adjustment loans toenergy. The transport sector was induced to Korea and Thailand that are now being pre-become more energy-efficient by means of pared. In Indonesia and Malaysia, where noseveral massive increases in excise taxes on structural-adjustment lending is contemplated,gasoline during 1979-80, in effect doubling its industrial and financial policy reform is also highprice within one year. In the field of energy- on the Bank's agenda for policy discussions withimport substitution, domestic gas and lignite the government.resources are rapidly being developed. On the In the interest of improving efficiency in theassumption that these resources will largely use of resources, several countries have beenreplace fuel oil, attention is also being given to looking to the Bank for assistance in planningan appropriate adjustment in Thailand's refinery and institutional reform. In Korea and Thailand,product mix. the Bank has managed planning-assistance proj-
In all these areas, the Bank is offering sup- ects financed by the United Nations Develop-port. Specifically, several loans have been made ment Programme, the results of which are beingfor a gas pipeline (fiscal 1979 and 1980), lignite used extensively in the analysis being carried outdevelopment (fiscal 1980), and power subsector for the preparation of structural-adjustmentdevelopment (fiscal 1978, 1980, and 1981). All lending. At the request of the Thai government,energy issues are being addressed comprehen- the Bank has also been advising on a number ofsively in the context of several possible loans that issues in the management of development,are now being discussed by the government and including functional and geographic decentral-the Bank. ization of decisionmaking and strengthening of
Similar approaches are being followed in the the links between the planning and budgetingwork on Korea, which has fewer domestic processes. The latter issue has also been dealtenergy supplv options than Thailand. In the with in the Philippines and Indonesia.Philippines, the Bank carried out an energy- Finally, in the general concern for alleviationsector survey in collaboration with the Asian of poverty, both rural and urban, and provisionDevelopment Bank (AsDB). In Indonesia, the of basic needs, the Bank has, as part of itsBank is assisting the government in undertaking research program, done significant analvticalan energy-sector survey, with a view to improv- work on povertv and its determinants ining the efficiency of domestic energy use. A coal- Indonesia, Malaysia, the Philippines, and Thai-mining project is in advanced stages of prepara- land. In addition, many special contributions totion; this coal will be used to fire power genera- the alleviation of poverty are being supported bytors, the construction of which is being financed the Bank. In Indonesia, for example, specialby the Bank. In fiscal 1980 the Bank helped to studies have been undertaken in the areas offinance a hydropower project in Fiji, which will transmigration and the training of manpower inmake possible substantial import substitution of agriculture. In the same country, projects havepetroleum products. A similar project is being been undertaken for agricultural research (fiscalprepared in Solomon Islands, to be cofinanced 1980), swamp reclamation (fiscal 1981), small-with the AsDB. holder tree-crops development (fiscal 1981),
In industrial and financial policy, sector small-enterprise development (fiscal 1981), slumstudies have been carried out for Thailand, improvement (fiscal 1981), and higher educationIndonesia, Malaysia, Korea, and the Philip- (fiscal 1981). In other countries projects that willpines, and the governments have given serious help to alleviate poverty have been undertakenattention to the recommendations. in fiscal 1981 for agricultural credit or support
In the specific case of the Philippines, the services (Malaysia, Papua New Guinea, theBank's structural-adjustment lending in fiscal Philippines, Solomon Islands, and Western1981 is based on a comprehensive set of industrial Samoa), watershed management (the Philip-and trade policy reforms being implemented by pines), and primarv education (Papua Newthe government. In that country the Bank has Guinea and the Philippines). In the case ofalso followed a new approach to the financing of Solomon Islands and Western Samoa, a newindustrial development by channeling its lend- initiative has been introduced to cofinance
East Asia and Pacific 47
selected projects with the Asian Development ceased to grow. In fact, excluding the first loan toBank in the lead. In the urban sector, where the China, the total lending program to the regionlending is focused specifically on the poor, loans for fiscal 1981 actually declined marginally fromwere approved for projects in Indonesia and the amount lent in fiscal 1980.
Korea. China and the Bank: the First Year
New Directions in Lending On May 15, 1980, the Executive Directors ofand Other Assistance the World Bank decided that the government of
the People's Republic of China would representTo varying degrees, the governments of the China pn p pe ese
countries in the region are recognizing to a grow-ing extent the importance not only of the invest- government and the Bank adopted for the firstment strategy but also of the policy framework year of the relationship a program having twofor economic development. The Bank is actively aspects. First, heavy emphasis was placed onsupporting this evolution. The new approaches economic and sector work, in an attempt toare perhaps most evident in the lending for struc- mned the sociaan ectonm develpenteotural adjustment, which is now firmly estab- mined the social and economic development oflished in the Philippines and for which prepa- China during the last decades. Some of theserations are now under way in Korea and Thai- factors are discussed briefly in this chapter.land. Even where structural-adjustment lending Second, preparation of a small group of high-is not being undertaken because the economic priority projects was started immediately, and anconditions for it do not exist, as in Indonesia and appraisal of a university development project,in Malaysia, the trend is in the direction of the approved by the Executive Directors in June,same type of verv specific analytical work in and preappraisal work on two other projects-
agriculture and ports-were completed.preparation for and support of policy adjust- Cghina and po pere codlted.ments that will benefit the country in the long China has a varied chlmate and terrain, largerun. This approach is now also being used in energy resources, a largely self-sufficient andareas of general policy, such as the alleviation of diversified production band a hig ter-poverty, where the Malaysian government, for ate, disciplined population. During the pastexample, is using price measures, such as sup- three decades, most of its development effortsport-price policy for small farmers' crops and have had two objectives: mdustrialization, withsubsidized basic inputs, and budgetarv support an emphasis on heavy industry, and eliminationof a variety of specific development schemes, ment pst asects opoyverty Chinesedevelop-such as land-development and settlement pro- trgrams, which are primarily for the benefit of the extreme shortage of cultivable land and a highpoor. These programs and policies are having degree of international isolation.substantial influence on the character of the Efforts directed toward alleviation of povertyeconomic and sector work, which is becoming began with an initial phase of land redistribu-more selective and is moving from the general to tion, followed by agricultural programs andthe specific. This work is being undertaken to an widespread provision of social services, for theincreasing extent in close cooperation with most part using local resources and initiatives.
reseachersin th borowingcounties.Despite slow growth of agricultural productionresearchers in the borrowing countries. in relation to population, the effects on humanRecognizing that the Bank can finance only a welfare have been impressive. At the same time,
relatively small part of the investment programs a massive infusion of centrally mobilized capitalof these countries, the trend in the design of led to rapid industrialization, using technologyprojects has been to make maximum use of the most of which dated from the 1950s. Growth ofBank's limited financial and technical resources gross national product (GNP) per capita was wellby ensuring that the investments are embedded above the average for low-income countries-in an effective policy framework. This can, but 2.7 percent a year from 1957 to 1979. Consump-does not necessarily have to be, accomplished tion has grown significantly, although morethrough sector lending. Recent examples of the slowlv than total output, owing to the emphasisuse of this approach are an education loan to given to investment growth. Nevertheless,Korea, a power loan to Thailand, and a financial China's most remarkable achievement has beensector loan and a primary-education loan to the to meet far more of the basic needs of low-Philippines. income groups than have been met of their coun-
Through these and similar approaches the terparts in most other poor countries. DuringBank hopes to make its assistance more effective the past decade, the country has also been quitein the socioeconomic development of the region, successful in reducing its population growth.as the resources that it can, at present, make In the last two years. the government has initi-available to the established borrowers have ated a wide range of economic reforms in the

48 1981 Regional Perspectives
system of economic planning and management. performance, its economic system, its medium-Most of those are meant to improve the effi- term prospects, and the development, perform-ciency of the use of physical and financial ance, and prospects of the energy, agriculture,resources and to effect a better match between education, transport, and industrv sectors, wassupply and demand, specifically with respect to completed in May 1981. The analysis was theconsumer goods, production of which is now basis for extensive discussions with the govern-given higher priority as a development objec- ment, during which general agreement wastive. The government has taken steps to increase reached on an operational country work pro-the share of consumption in the economy by gram that would address the critical constraintsreducing the share of investment in budget of lagging energy production, inefficient use ofexpenditures and to spend more on housing, energy in the industrial sector, limited agricul-education, health, agriculture, and light indus- tural land, lack of foreign exchange, and short-try. Urban wages and agricultural procurement ages of trained manpower.prices have been increased substantiallv.Agricultural production, light industrial output, Bank and IDA Lendig, Fiscat 1981and real consumption per capita rose sharply Total Bank and IDA lending in the regionbetween 1978 and 1980. in fiscal 1981 amounted to $2,358.4 million,
The new policies have been less successful in some $10.5 million below the fiscal 1980 level.other respects. Some unforeseen effects on the A total of 35 loans and credits was approved.budget and on the balance between aggregate Lending for agriculture and rural develop-demand and supply occurred, mainlv because ment and development finance companiesthe planned reduction in investment was not accounted for 27 percent and 18 percent, respec-entirely achieved. There were large unplanned tively, of total lending in the region in dollarbudget deficits in 1979 and 1980, coupled with terms.inflationary pressure that was only partly sup- Funds committed under cofinancing arrange-pressed by the price-control svstem. This led in ments with the Bank and IDA reached $1,027.7earlv 1981 to a switch in emphasis from medium- million, or 12 percent above last vear's level.term adjustment to short-term stabilization. Each cofinanced project attracted an average ofPrice controls were tightened, some recentral- $114 million in cofinancing during the year, com-ization of economic decisionmaking was intro- pared with about $70 million in fiscal 1980.' (Seeduced, and expenditures for capital construction table on page 80.)were to be cut 40 percent from 1980 to 1981, Disbursements on Bank loans to borrowingcausing the postponement of many large pro- countries of the region were $1,349.9 million dur-jects, including those financed from foreign ing the fiscal year. Disbursements of IDA creditssources. Efforts are being made to continue stood at $90.9 million for the same period. Theinvestment programs in high-priority sectors, figures for Bank and IDA disbursements in fiscalnotably energy, in order to ease critical con- 1980 were $1,052.0 million and $74.5 million,straints on further expansion of domestic pro- respectively.duction.
The Bank's introductory analysis of China's I Cofinancing data have been compiled from World Bank reports ofnprojects at the time of their Board approval and do not reflect
economy, covering China's past development changes in amounts since that time.
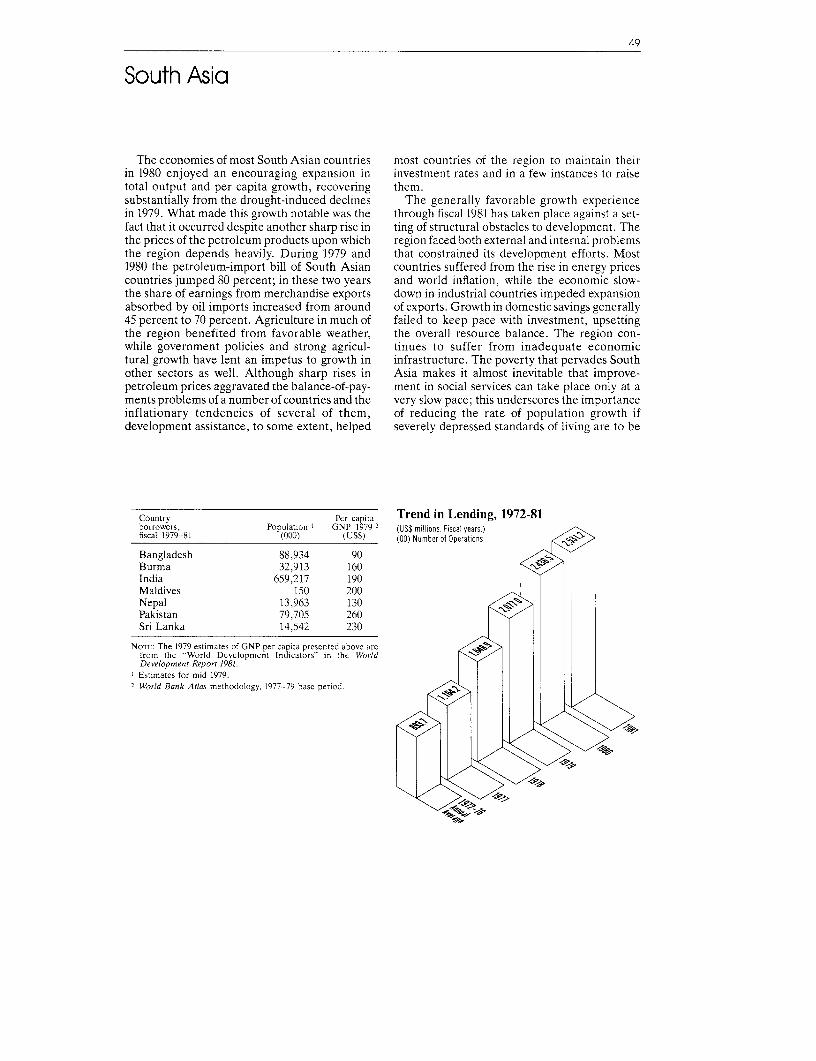
49
South Asia
The economies of most South Asian countries most countries of the region to maintain theirin 1980 enjoyed an encouraging expansion in investment rates and in a few instances to raisetotal output and per capita growth, recovering them.substantially from the drought-induced declines The generally favorable growth experiencein 1979. What made this growth notable was the through fiscal 1981 has taken place against a set-fact that it occurred despite another sharp rise in ting of structural obstacles to development. Thethe prices of the petroleum products upon which region faced both external and internal problemsthe region depends heavily. During 1979 and that constrained its development efforts. Most1980 the petroleum-import bill of South Asian countries suffered from the rise in energy pricescountries jumped 80 percent; in these two years and world inflation, while the economic slow-the share of earnings from merchandise exports down in industrial countries impeded expansionabsorbed by oil imports increased from around of exports. Growth in domestic savings generally45 percent to 70 percent. Agriculture in much of failed to keep pace with investment, upsettingthe region benefited from favorable weather, the overall resource balance. The region con-while government policies and strong agricul- tinues to suffer from inadequate economictural growth have lent an impetus to growth in infrastructure. The poverty that pervades Southother sectors as well. Although sharp rises in Asia makes it almost inevitable that improve-petroleum prices aggravated the balance-of-pay- ment in social services can take place only at aments problems of a number of countries and the very slow pace; this underscores the importanceinflationary tendencies of several of them, of reducing the rate of population growth ifdevelopment assistance, to some extent, helped severely depressed standards of living are to be
Country Pcr tapita Trend in Lending, 1972-81borrowers, Population I GNP 1 79 2 (US$ millions. Fiscal years.)fiscal 1979-81 (000) (US$) (tt) Number of Operatlions
Bangladesh 88,934 90Burma 32,913 160India 659,217 190Maldives 150 200Nepal 13,963 130Pakistan 79,705 260Sri Lanka 14,542 230
NOTE: The 1979 estimates of GNP per capita presented above arefrom the "World Development Indicators" in the WorldDevelopment Report 1981.Estimates for mid 1979.
2 World Bank Atlas methodology, 1977-79 base period.
4 /s<, ,- 0

50 1981 Regional Perspectives
improved. While it is alwavs hazardous to base problem as the current-account deficit increasedlong-term judgments on the events of a year or sharply. Imports rose more than 3 percent,two, it is clear that the profound deterioration in fueled primarily by sharp increases in thethe balance of payments of countries of the volume and prices of imported petroleum andregion calls for intensifying efforts for reorganiz- fertilizer. This situation was exacerbated by a falling their economies and stepping up support by in domestic production of crude oil owing tothe international community to facilitate the political agitation in Assam. Although exportnecessary process of change that has come to be performance improved somewhat, growth wascalled structural adjustment. insufficient to counter the deterioration in the
terms of trade.Country Developments Stepping back from these recent develop-
Following a poor monsoon and a generally ments and making a long-term appraisal sug-disappointing performance the previous year, gests that the Indian economy today is substan-the economy of India rebounded in fiscal 1981, tially stronger than it was a half decade earlier,with growing strength in the latter part of the and it should therefore be better able to weatheryear. Aided by a good monsoon, agricultural the effects of the harsher external environment.production more than recovered from the The country's agricultural and industrial basesdepressed level of the preceding year. Though are considerably broader and more diversifiedslower to recover, industrial output gained some than they were in the past; imports of food grainsmomentum, so that growth in gross national prod- have been gradually eliminated, while substan-uct (GNP) was expected to be between 7 percent tial buffer stocks of grain have been established;and 8 percent. Production of food grains in fiscal rates of gross investment and national savings1981 approximated the fiscal 1979 record of 132 have climbed to impressive levels, reachingmillion tons. Some easing of supply constraints about 22 percent of GNP; substantial foreign-occurred in coal production and port clearance. exchange reserves have been built up; and exter-Against these significant gains, several economic nal debt is at very low levels.indicators lagged: power and rail transport A number of difficulties of a structural natureremained in short supply; the annual rate of remain, however, that require sustained action ifinflation remained high at 16 percent; and the soundly based development is to be possible inbalance of payments presented a serious the future. The more serious problems include a
Lending to Borrowers in South Asia, by Sector(US$ millions. Fiscal year.)
Annualaverage1972 76 1977 1978 1979 1980 1981
Agricultural and RuralDevelopment $223.2 $ 451.0 $ 899.7 $ 541.7 $1,098.0 $ 918.7
Development Finance Companies 75.9 29.0 113.0 - 140.0 50.0Education 4.8 15.0 5.7 35.0 40.0 25.0Energy
Oil, gas, and coal 12.0 150.0 - 30.0 - 485.0Power 74.8 150.0 305.0 467.8 614.5 -
Industry 102.2 71.0 - 334.0 29.0 400.0Nonproject 240.3 75.0 75.0 100.0 50.0 115.0Population, Health, and
Nutrition 7.2 - - 32.0 78.0 -
Small-Scale Enterprises - - 7.0 16.0 20.0 65.0Technical Assistance 2.3 3.0 - 10.0 3.0 16.0Telecommunications 32.5 80.0 134.5 - 65.0 314.0Tourism 0.8 - - - - -
Transportation 84.7 70.0 22.0 206.5 113.0 73.5Urbanization 7.0 49.0 87.0 - 56.0 42.0Water Supply and Sewerage 25.9 21.2 - 304.0 130.0 27.0
Total $893.7 $1,164.2 $1,648.9 $2.077.0 $2,436.5 $2,531.2
Of which: Bank $154.2 $ 394.0 $ 330.0 $ 300.0 $ 125.0 $ 430.0IDA $739.5 $ 770.2 $1,318.9 $1,777.0 $2,311.5 S2,101.2
NoTL: Details may nor add to totals, due to rounding.

South Asia 51
r~~~~~~~~~~~~~~~
Learning about familyv planning in Bangladesh.
very low level of per capita income ($190) with an and small industrial enterprises. IDA assistanceattendant high incidence of poverty~ a severely in financing industrial raw materials and compo-strainied economic infrastructure; inadequate nents for selected sectors of high priority hasdomestic production of commodities, such as been instrumental in facilitating better use ofedible oils, fertilizer, cement, and steel; made- capacity in industry. The Bank has also con-quate growth of exports; and continuing popula- tributed to the alleviation of infrastructuraltion pressure. However, significant changes in bottlenecks through its support of the power sec-economic policies are taking place in India in tor, telecommunications, and railways. Theresponse to the changingy resource position and further development of India's reserves of oil andin preparation for another period of balance-of- natural gas has also received Bank support.payments difficulties. The ambitious sixth five- Following unfavorable weather and poor har-year development plan (fiscal 1981-85) addresses vests in 1979 and 1980, agricultural production initself to all these challenges. Bangladesh, under the stimulus of good weather,
During fiscal 1981, Bank assistance to India enjoyed a strong recovery in 1981, increasing hycontinued to emphasize agriculture. The Bank about 7 percent. and the country's position inhas been particularly active in supporting, minor food grains improved considerably. As a result,irrigation and other on-farm investments gross domestic product (GDP) also expandedthrough agricultural credit operations and in about 7 percent. Apart from the effects ofproviding direct support to major and minor favorable weather, the growth in agriculturalirrigation schemes. Marketing. seed develop- output was also attributable to governmentment, agricultural extension, and dairying are policies, reflected in increased investment inother agricultural activities supported bv the irrigation, better use of existing irrigationBank. The Bank has also been active in helping facilities, improved delivery of input's, and price-to finance the expansion of output in the fer- support measures. Progress was also made intilizer sector and, through its sizable assistance raising administered prices to reflect costs and into development finance institutions, in a wide containing current expenditures while maintain-range of geographically scattered medium-scale ing a high level of government investment.

52 1981 Regional Perspectives
Along with these favorable developments, of about 5 percent seemed within reach.however, fiscal 1981 witnessed a serious Agricultural output increased by between 3 per-deterioration in public finances and in the cent and4percent; in addition, industrial outputbalance of payments, continuing a situation that also revived as capacity and its use grew and ashad been aggravated in fiscal 1980. The budge- the availabilitv of imported inputs increased.tary difficulties were associated with large expen- The expansion was facilitated by good weather,ditures for food procurement and a reduced continued growth in exports and migrants'remit-inflow of commodity aid. Notwithstanding the tances, and favorable economic policies thatconclusion of an Extended Fund Facility agree- both encouraged the private sector and providedment with the International Monetary Fund general economic stability. The government has(IMF), the balance of payments deteriorated enjoyed considerable success in its efforts atbecause of declining jute prices, higher petro- management of demand: the general budgetaryleum prices, and a shortfall in commodity aid. situation, public and national savings, and infla-
Viewed in long-term perspective, Bangladesh tionary pressure improved considerably in bothhas made considerable progress in recent vears 1980 and 1981. Balance-of-payments pressures,in laving a foundation for the countrv's develop- which have been severe in recent years, werement. Among noteworthv aains that have been moderated through the conclusion of an agree-made are the rehabilitation and expansion of the ment with the IMF for an Extended Fundphvsical infrastructure, better use of capacity, Facility, the largest granted by the Fund so far,improved performance in public investment-all and an eighteen-month rescheduling agreementlaying the foundation for future agricultural and on external debt with bilateral creditors of theindustrial growth-and greater development Pakistan Consortium.activity on the part of the private sector. In industry, various incentives have begun to
This evidence of sustained recent progress stimulate private investment and exports, whilemust be seen, however, against the backdrop of a concerted attempt to introduce reforms,the massive development problems that the including greater flexibility of management andcountry faces: low food production, widespread tougher standards of financial performance, hasilliteracy, increasing pressure of population on a reduced inefficiency in the public manufacturingsmall land area, and shortage of energy. Indeed, sector. Agricultural production benefited from
a a dt einvestments in quick-vielding projects, improve-agricultural development, education, family ...
planning, and energy have been identified in the ents i support services, and higher cropX ' p rices. Some progress has also been made innew second five-vear plan as the countrv's top S p
development priorities, developing the country's energy capacitythrough new exploration, investments in genera-
Activities of the Bank are designed to help the tion and transmission facilities, and encourage-government address these problems. In agricul- ment of the use of domestic fuels by means ofture, IDA credits are helping the government to appropriate price adjustments.implement its ambitious, vet technically feasi- These recent achievements represent only theble, Medium-Term Foodgrain Production Plan, beginning of an attack on the country's principalthe aim of which is food self-sufficiency by 1985. development problems. These include low pro-Toward this end, credits have been provided for ductivity in agriculture, an inefficient publicminor irrigation, agricultural extension, agricul- industrial sector, slow growth in large-scale pri-tural credit, and the production and transport of vate industry, heavy dependence on importedfertilizer. With a group of other donors the Bank energy supplies, a low level of domestic savings,is continuing its support of the family-planning and a high rate of population growth. The Bankprogram and has been discussing with the has worked closely with the government ingovernment ways of improving the management attacking several of these problems. In agricul-of the program. In energy, the Bank IS support- ture, studies by the government and the Bank ofing both development of the country's natural water management in the Indus basin and othergas resources and the formulation of a national aspects of agricultural productivitv have beenenergy policy. To help broaden the industrial responsible for significant policy reforms,base and increase nontraditional exports, mem- including efforts to rationalize agricultural inputbers of the Bank staff have been aiding the and output prices and a redirection of agricul-government in developing the basis for a com- tural investment. Bank-supported projectsprehensive set of industrial policies along with include seed improvement, the introduction ofdirect lending for industrial projects. the training-and-visit extension system, and
In fiscal 1981, for the fourth consecutive vear, agricultural research. A program of joint Bank-the economy of Pakistan showed continued Pakistan investigations of the industrial sector isgrowth, although at a somewhat slower pace expected to improve efficiency in both privatethan in fiscal 1980. Indeed, an annual growth rate and public industry.

South As a 53
The economy of Nepal in recent years has public sector for the completion of importantexhibited little growth. Iargely reflecting the projects that require long gestation periods-inability of the agricultural sector to expand out- brought severe pressures on public finances andput. GDP and agricultural growth since fiscal the balance of payments, leading to rapidly ris-1976 have averaged less than population growth, ing prices and a reassessment, supported by theand per capita production of food grains has economic and sector work of the Bank, of thefallen steadily. While investment has expanded, government's development program. This reas-growth in productivity has lagged. Largely as a sessment has led to a decision to reduce generalresult of the slow growth in agriculture, the cur- expenditures and readjust spending priorities.rent-account deficit in the balance of payments The resurgence in the Sri Lankan economyhas increased sharply in recent years. and the accompanying pressures on resources
The obstacles to development in Nepal are se- had, by early 1981, reached the stage at whichvere; they include its difficult natural topog- major stocktaking and policy actions were essen-raphy, inadequate infrastructure, institutional tial in order to preserve the gains reached in theweakness, rapid population growth, and pro- period since 1977. The central problem wasgressive deterioration in the phvsical environ- excessive spending on long-gestation or low-ment as a result of steady deforestation and yielding projects, coupled with stagnation inerosion. exports of tree crops. A reversal of the deteriora-
The Bank has assisted in developing infra- tion in the overall economic situation requires astructure in Nepal through credits for highways, reform of public finances. including better per-power, and telecommunications. Now the assist- formance of corporations in the public sector,ance of the Bank is being directed toward the reevaluation of the public investment program.lagging agricultural sector through a number of improvements in the tree-crop sector, and rec-projects in irrigation, rural development and tification of the trade deficit by stimulatingfarming in the hills, grain storage. and credits for exports and containing imports.forestry and erosion control. The Bank rou- The Bank is working closelv with the govern-tinely incorporates technical assistance in vir- ment in attacking these problems. The Bank istually all its projects in the country in order to giving substantial support to the Mahaweli Pro-strengthen project implementation and institu- gram, which consists of ambitious, multiple-pur-tional capacity. pose projects for river-basin development.
Lending to expand productivity in the tree-cropResurgence in Sri Lanka sector is an important contribution to export
The principal policy reforms of 1977 in Sri development; joint studies of export-incentiveLanka were followed by dramatic improvements policies by the World Bank and the Sri Lankanin economic performance as import liberaliza- government have the same objectives.tion, external assistance, and a rationalization of Agricultural production in Burma recordedprices led to an upsurge of private and public steady progress in the late 1970s as investmentinvestment and large increases in production priorities shifted toward the primary producingand employment. sectors. Use of higher-yielding varieties of rice,
Although growth in GDP decelerated in 1980 coupled with favorable weather and attractiveto about 5.5 percent, this was still twice the rate fertilizer price incentives, led to rapid increasesthat had prevailed during the period 1970-77. in paddy output. Industrial performance,The slowdown was largely attributable to however, was less consistent. Real GDP,declines in tree crops, manufacturing, construc- nevertheless, increased 6 percent a year in thetion, and mining. Paddy production, however, late 1970s, in sharp contrast to performance ingrew more than 10 percent during 1979, reaching earlier years, and is expected to have increased 8a record high level and bringing the country percent in fiscal 1981.close to self-sufficiency in rice. While Burma has thus made substantial
A striking feature of Sri Lanka's recent growth economic progress in recent years, the level ofhas been a massive increase in capital formation. economic activity is far below the country'sImportant projects in the public sector include potential. There is substantial scope for furtherthe Accelerated Mahaweli Program and housing increases in production of paddy and other pri-and urban-renewal programs. Private invest- mary products, but this will require improve-ment has also increased sharply, with total gross ments in incentives to producers. An additionalinvestment increasing from 14 percent of GDP in major issue is the need to strengthen efforts at1977 to 35 percent in 1980. Foreign savings mobilization of resources. both because thefinanced most of this large increase in invest- politicoeconomic system of the country calls forment. the state to fulfill a pivotal function, and for
Beginning in 1980 and continuing into 1981, public investment in particular, and becauseclaims on resources-especially demands by the resources devoted to meeting needs in the social

54 1981 Regioncl Perspectives
sectors have been declining in real terms for a endeavored to assist the government bothnumber of years. through economic advice-on public investment
Through its economic work the Bank has programming and administration, for exam-advised the government on various aspects of the ple-and in its project financing, through assis-allocation of public investment and mobilization tance with modernization and expansion of theof public revenues. In addition, the Bank has fishing industry.tried to encourage a more vigorous export pro-gram. With respect to investment allocation the Bank and IDA Lending, Fiscal 1981Bank has analyzed the desirability of an Total Bank and IDA lending in the region inappropriate balance between quick-yielding fiscal 1981 amounted to S2,531.2 million, someagricultural and industrial investments and the $94.7 million above the fiscal 1980 level. A totalslow-maturing heavy industrv that has required a of 38 loans and credits was approved. Lendinglarge amount of investment and foreign for agriculture and rural development andexchange. In line with the government's own energy accounted for 36 percent and 19 percent,priorities, IDA lending to Burma primarily respectively, of total lending in the region inseeks to support directly productive sectors- dollar terms.agriculture and mining-and, thereby, growth in Funds committed under cofinancing arrange-export earnings. In addition, IDA credits aid in ments with the Bank and IDA reached $610.5the development of the country's infrastructure million, or 63 percent above last year's level.through lending for transport and telecom- Each cofinanced project attracted an average ofmunications, for example. $51 million in cofinancing during the year, com-
With earnings from fish production and tour- pared with about $29 million in fiscal 1980.' (Seeism doing very well and with the impetus of table on page 80.)favorable government policies, the economy of Disbursements on Bank loans to borrowingthe Maldives grew quite rapidly in 1979 and 1980. countries of the region were $200.5 million dur-Capital formation, including further develop- ing the fiscal year. Disbursements of IDA creditsment of capacity in the fishing industry, tourist stood at $1,091.1 million for the same period.facilities, and the shipping fleet, increased. The figures for Bank and IDA disbursements in
The country's development requires con- fiscal 1980 were $181.8 million and $866.5tinued expansion of foreign-exchange earnings, million, respectively.strengthening of the fishing industry, thegeographical diversification of economicactivity, solutions to the problem of supply andconservation of energy, and further strengthen- Cofinancing data have been compiled from World Bank reports ofprojects at the time of their Board approval and do not reflecting of the planning process. The Bank has changes in amounts since that time.

55
Europe, Middle East, and North Africa
ThedevelopingcountriesintheEurope,Mid- rates of growth in gross domestic productdle East, and North Africa region vary con- (GDP), consumption, and investment fellsiderably in both economic characteristics and noticeably. Poor export performance andsocial and political institutions. The underlying deteriorating terms of trade, together with aeconomic diversity is reflected in the develop- poor harvest and an earthquake in Montenegro.ments that have taken place in the countries of led to a significant increase in Yugoslavia's cur-the region during the past fiscal year. Yet there rent-account deficit in 1979. The country's short-has been a common denominator for most coun- term response was to adopt a stringent stabiliza-tries: an intensified emphasis on adopting tion program and a major devaluation. Despite apolicies and measures aimed at adjustment to further deterioration in terms of trade and athe international economic developments of sharp rise in interest costs, these actions signifi-1979 and 1980-sharply higher energy prices, cantly reduced imports, boosted exports, andhigher food prices, rising inflation and slower lessened the current-account deficit. For thegrowth in the industrial countries, a slowdown in medium term, both Yugoslavia and Romaniaexports, and significantly higher interest rates on are taking steps to conserve energy and reduceexternal loans. dependence on imported oil; both countries are
also stressing increased agricultural productionStructural Adjustment as a way of promoting agricultural exports.
Among the higher-income countries of the The Bank's economic work program for bothregion, Romania and Yugoslavia both expe- Yugoslavia and Romania includes a review of therienced a general slowdown in the past year, as two countries' adjustment policies and meas-
Countrv Pult= Pcr ca Ita Trend in Lending, 1972-81borrowers. Populatin I GNP 179 (US$ millions. Fisca years.)fiscal 1979-81 (111(U SS) (00) Nuom b er of O perat ions
Afghanistan 15,542 170Algeria 18,211 1.590Cyprus 618 3,110Egypt, Arab Republic of 38,868 480Greece 9,272 3,960Jordan 3,126 1,180.Morocco 19.538 740Oman 865 2,970Portugal 9,771 2.180Romania 22.()68 1.9()0Syrian Arab Republic 8,639 1.03(0Tunisia 6,194 1.120Turkey 44,237 1,330Yemen Arab Republic 5.693 420 /,>lYemen, People's Democratic
Republic of 1,855 480(Yugoslavia 22,139 2,43(0
NotlE. Thc 1979 cstimates of GNP per capita prcscnted abovc arcfront the "World Dcvelopment Indicators' in the WorldDevelopmeit Report 19H1.Estimates for mid 1979
2 World Bank Atda, methodology, 1977-79 hasc period.

56 1981 Regional Perspectives
ures. A special report on Yugoslavia's export In the late 1970s, Morocco faced a rapidlyperformance and policies, particularly as related deteriorating position in its external paymentsto manufactures, was completed in 1980 and pro- and its budget, largely as a result of a rapid in-vided a disaggregated analysis of Yugoslav crease in public investment after the phosphateexport performance in the seventies; a review of price boom of 1974-75 and because imports grewRomania's investment priorities and adjustment sharply while exports stagnated. In 1978 themeasures in the context of the country's Sixth government introduced a three-year stabiliza-Development Plan (1981-85) was started late in tion program with the aim, among other things,fiscal 1981. of reducing investment expenditures and
Portugal, another"higher-income" borrowing imports. Economic growth was impressive-country, experienced healthy growth-esti- about 6 percent-in 1980, in part because of themated at 5.8 percent in 1980-led bv recovery of recovery of the agricultural sector, and the cur-output of manufacturing and construction indus- rent-account deficit was held essentially to itstries, inventory accumulation, and export per- 1979 level. The International Monetary Fundformance. The country faces a higher current- (IMF) has supported a three-year program ofaccount deficit in 1981, however, primarily financial adjustment and growth starting in 1980.because of a significant decline in the rate of its The measures adopted in 1980 include adjust-export growth that stems from the weakness of ments in the exchange rate, in interest rates, anddemand in the countries of the European in controlled prices of foodstuffs, electricity, andEconomic Community (EEC). Portugal is petroleum products; limits on borrowing at com-developing proposals for reorganizing its indus- mercial terms; and a shift in investmenttry in preparation for entry into the EEC in the priorities in favor of energy, rainfed agriculture,mid 1980s. The measures being designed will export-oriented, labor-intensive industries, andhave the purpose of improving efficiency and the projects that require shorter gestation periods.quality of products in certain important subsec- The retrenchment in Morocco, however, as intors, such as textiles and engineering. The Bank several other countries of the region, is exacer-continues to assist this effort with the financing bating the unemployment problem.of some of the subsectoral studies under loans More than any other country in the region,for industrial development. Turkey has, in recent years, faced serious
Lending to Borrowers in Europe, Middle East, and North Africa, by Sector(USS millions. Fiscal year.)
Annualavera e1972-76 1977 1978 1979 1980 1981
Agricultural and RuralDevelopment $ 273.9 S 429.5 $ 559.2 $ 636.0 S 685.5 $ 609.0
Development Finance Companies 155.6 239.0 75.0 150.0 230.0 432.0Education 62.6 79.5 191.0 188.0 146.0 81.7Energy
Oil, gas, and coal 28.1 - - 77.5 146.0 132.0Power 193.0 142.5 118.0 276.0 263.0 203.5
Industry 118.3 126.8 247.0 234.0 246.0 192.6Nonproject 14.0 70.0 50.0 150.0 200.0 375.0Population, Health, and
Nutrition 4.3 4.8 - 25.0 - 12.5Small-Scale Enterprises 17.7 45.0 - 25.0 20.0 30.0Technical Assistance 0.6 1.5 - - - 6.9Telecommunications 33.5 - 53.0 - 22.0 -
Tourism 11.3 26.0 - 32.5 - -
Transportation 183.3 232.5 390.0 406.6 451.0 156.5Urbanization 12.5 - 32.0 19.0 - 57.0Water Supply and Sewerage 71.4 173.0 140.7 117.0 36.2 147.1
Total $1180.0 $1,570.1 $1,855.9 $2,336.6 $2,445.7 $2,435.8
Of which: Bank $1,044.8 $1,474.3 $1,660.5 $2,081.5 $2,174.0 $2,173.2IDA $ 135.2 $ 95.8 $ 195.4 $ 255.1 $ 271.7 $ 262.6
NOTE: Details may not add to totals, due to rounding.

Europe, M dd e East, and North Africa 57
Workers in thze Yemen Arab Repuiblic lasbzing steelreinforcements to the wooden forms before cement ispoured at a dam that is under construction.
econom-ic difficulties. The crisis in Turkey had its second structural-adjustment loan in the amountroots in both inadequate and long-delayed of $300 million was approved in May 1981.domestic policy responses to the external TurkevYs domestic adjustment efforts have alsodevelopments of the early 1970s and the diverse been strongly supported by assistance from theinternational developments of 1979 and 1980, IMF, a rescheduling of public debt by memberparticularly rising world prices for imports. countries of the Organisation for Economic Co-including oil, and declining migration oppor- operation and Development (OECD), and intunities for Turkish workers, caused by the 1981 the extension of official loans, totaling $960deepening recession in WeStern Europe. Faced million, from these countries and loans fromwith stagnant growth in GDP. a massive balance- Saudi Arabia. as well. Significant progress hasof-payments crisis, and high and accelerating been made in implementing structural reforms,rates of inflation that reached 65 percent in 1979 but in the face of the country's deep-rootedand topped out at 108 percent in 1980. Turkey in economic difficulties, continued domesticJanuary 1980 adopted a far-reaching program of efforts and sustained support from the interna-economic reforms, followed in the succeeding tional community will be necessary before Tur-months by additional measures, such as flexible key can return to a path of economic growth withexchange rates and deregulation of interest a sustainable balance-of-payments position.rates. The Bank has actively supported the The capital-importing. oil-exporting countriesefforts of the government through a series of of the region-Egypt, Syria, Tunisia, andstructural-adjustment loans, project lending, Algeria (which has significantly larger exportand economic and sector work. A supplement of revenues from oil and gas)-benefited in varying$75 million to the first struictural-adjustment degrees from the 1979-80 increases in oil prices.loan was approved in November 1980, and a The effect of increased oil revenues has been
58 1981 Regional Perspectives
particularlv significant for Egypt, which is the Turkey-and country economic and sectorpoorest country in the group. Reflecting a dou- work, the Bank is reinforc_mg the emphasis thatbling of petroleum-export revenues, higher most of the countries in the region, includingearnings from the Suez Canal. and sizable some of the oil exporters. such as Egypt, Syria,inflows of remittances, Egypt's foreign-exchange and Tunisia, are placing o01 appropriate pricingearnings have risen rapidly during the past two of energy. Too often domestic energy prices hadyears, and the growth in GDP has been about 10 fallen far out of line with international prices,percent a year since 1976. While continuing its giving rise to burdensome subsidies and toefforts to develop its natural-resource base distortions in relative prices. which encouragefurther, the favorable position of Egypt in exter- inefficient use of energy and impede thenal payments provides an opportunity for it to development of new sources of energy. In someintensify its efforts to improve its performance in cases the needed price adiustTnents are substan-agriculture and industry, which is essential for tial, requiring some time-phasing in view of thediversification of its productive base, and to far-reaching effects of higher energy prices, par-meet the basic needs of its population. In sup- ticularly on production costs in many areas ofport of such a strategy, the Bank is assisting the economic activity.government in a variety of fields. particularlyagricultural development, energy, and man- Increasing Food Productionpower development. In generation of emplox ment and in contribu-
In addition. the Bank's economic and sector tion to GDP, agriculture continues to be a princi-work, undertaken to an increasing extent in col-laboration with the country itself, is designed sectr in the magion. he borowngcountries in the region., in some instancesto address key issues of development strategy absorbinghalformoreofLhe respectivenationaland economic reform. An example of the recent labor forces. Nevertheless, with the exception ofeconomic work carried out is a study of mobiliza- Turkey, the low-iNncome anl d middle-incometion of domestic resources that was presented to countries continue to be defic'ent in the produc-the Aid Donors meeting in Aswan in January tion of food grains, while in several-Egypt,1981 under the auspices of theEgyptian govern- Syria, the Yemen Arab Republic, and thement. IMaghreb countries-food imports bulk large in
In Tunisia, the nearly twofold increases in the total imports. In the higher-income countries,value of petroleum exports between 1978 and particularly Cyprus, Romania, and Yugoslavia,1980 led to a substantial increase in the country's agricultural exports makc an important con-savings performance and allowed it to reduce tribution to foreign-exchange earnings. While inforeign borrowing by nearly half while maintain- a number of countries the dependence oning its investment rate at a high level. With a imports of food is primarily a reflection of poordecline in oil production, and consequently in natural resource endowment, in others it is thepetroleum exports, likely for the medium term, result of low productivity, inefficient use of re-there is renewed emphasis on improving the sources, and inappropriate producer-pricingcountry's export performance. Tunisia's efforts policies.to diversify its exports were assisted in June 1981 With an intensified need to reduce deficits inwith a Bank loan of $18.6 million for the reha- e l avmens, many o reduce s m
bilitation of export-producing textile industries, xternal payments, many of the countries i theregion are making greater efforts to remove orcorrect the impediments to more rapid agri-
Energy Development and Policies cultural growth. The Bank's lending programOil-importing countries in the region have re- and sector work in agriculture are supporting the
sponded in diverse ways to the higher energy efforts of these countries to increase food pro-prices they have faced during 1979 and 1980, duction. Thus, new irrigation projects in Egyptbroadening the variety of energy sources used and the People's Democratic Republic of Yemenand pursuing stricter policies toward manage- will expand the areas in which improved techni-ment of demand and conservation. On the sup- ques of farming can be promoted by the techni-ply side there has been intensi:fied exploration cal-assistance services included in these proj-for new oil and gas deposits in Evgypt, Portugal, ects. Production and processino of high-valueand Turkey and improved secondary-recoverv crops will be promoted under projects intechniques in Turkey. Concurrently, there has Cyprus, Turkey, and Yugoslavia, which includebeen continued expansion in the supply of components of agricultural credit and market-electrical power, supported by Bank loans, in ing. Under the structuraladjustment lendingJordan, Romania, Tunisia, and the Yemen Arab operations in Turkey, the authorities intend toRepublic. Within the context of its project-lend- improve policies for the pricing of farm productsing operations, structural-adjustment loans-in and to strengthen the extension system.

Europe, Middle East, and North Africa 59
Capital-Surplus Oil-exporting Countries exporting countries may encounter a significantExcept for Iran and Iraq. whose production slowdown in demand and perhaps even some
and exports of petroleum were sharplv reduced reverse flows in the future. This points to theduring the past vear because of war, the export need for designing the manpower-training pro-revenues of the principal oil exporters of the grams in the exporting countries not only to meetregion increased sharply in 1980. These coun- the evolving internal demand but also to meet
trie hae cntiuedthei masiv inestent the external demand for skills. Accordingly,trBes have contdgued their massive wrvestmentprograms in physical and social infrastructure as Bank lendgng for manpower development iswell as in directly productive activities in an addressmg vocational and technical training ineffort to achieve rapid diversification of their labor-exportingcountries such as Egypt. Jordan,effrt o ahiee api diersfiatin o thir the People's Democratic Republic of Yemen,economies. The scarcity of indigenous man- and the Yemen Arab Republic. Bank technicalpower and administrative and technical skills in assistance in the manpower planning field hasthese countries, however, continues to be a aslsobncm ved some labrmporting
serousobsacl totheeffctie pamano nd also been provided to some labor-importingserious obstacle to the effective planning and countres such as Oman. where, in fiscal 1981,implementation of investment policies and proj- . . .ects. The Bank is providing reimbursable tech- support was given to that country's Ministry ofnical assistance to some of these countries- Labor and Social Affairs. Furthermore, theSaudi Arabia and Kuwait in particular-to Bank recently completed a comprehensive pro-analyze these problems. Assistance has also jection of the demand for and internationalbeen provided in the form of sector planning, mgration of labor i the Middle Eastern andproject analysis, institution building, and train- North African countries of the region. The studying The technical assistance offered i auring fis- identified likely trends in the demand for variouscal 1981 included assistance with the preparation skills and provides a valuable background forcal 1981 included assistancepolcv diswithos the mpreparationesof the Third Development Plan in Saudi Arabia s polic scuso with membercountriesand a series of planning studies in Kuwait that A manpower study for the Yemen Arabare expected to be completed in the near future. Republic was also completed in 1980. This studyis expected to assist the countrv in formulating its
During the past decade, the principal oil manpower development strategy and policies inexporters of the region have emerged as major connection with its Second Five-Year Develop-donors of aid, both through regional financial ment Plan (1982-86).institutions and funds and from government togovernment. Total Official Development Assist-ance (ODA) from the capital-surplus, oil- Bank and IDA Lending, Fiscal 1981exporting countries of the region reached Total Bank and IDA lending in the region inapproximately $6,70() million in 1980; it had fiscal 1981 amounted to $2,435.8 million, somebeen about $5,700 million in the preceding year. $9.9 million below the fiscal 1980 level. A total ofAs in the past. a portion of the flows of aid was in 45 loans and credits was approved. Lending forthe form of cofinancing with the Bank; some agriculture and rural development and develop-twenty-four Bank-assisted projects were sup- ment finance companies accounted for 25 per-ported by cofinancing from bilateral and mul- cent and 18 percent, respectively, of total lendingtilateral agencies of the region's oil exporters in in the region in dollar terms.fiscal 1981. Their cofinancing amounted to S401 Funds committed under cofinancing arrange-million. ments with the Bank and IDA reached S510.9
The prosperity of these countries has had a million, or 66 percent below last year's level.favorable indirect effect on the economic Each cofinanced project attracted an average ofdevelopment of much of the region, particularly $28 million in cofinancing during the year, com-through remittance flows from expatriate labor, pared with about $80 million in fiscal 1980.1 (Seewhich are substantial and of crucial importance table on page 80.)to such countries as Egypt, Jordan, the People's Disbursements on Bank loans to borrowingDemocratic Republic of Yemen, and the Yemen countries of the region were $1,486.6 million dur-Arab Republic. (Remittance flows to many ing the fiscal vear. Disbursements of IDA creditscountries outside the region are substantial, as stood at $118.2 million for the same period. Thewell.) As noted in last year's Annueal Report, figures for Bank and IDA disbursements in fiscalhowever, migration does have its economic and 198( were $1,311.1 million and S83.9 million,social costs. The labor-exporting countries, in respectivelv.certain cases, have lost up to 30 percent of theirlabor force and an even higher proportion oftheir qualified manpower. As the pattern ofdemanid for labor in the host countries shifts c ofinin Jdta havc been coBmpocd trom Wodd otik rcpors ofprojocct mrt the tiJc of thcir Board apprlo al and do niot refiecttoward more skilled jobs, some of the labor- cheanges int amounts sincc that titTe.

60 1981 Regional Perspectives
Latin America and the Caribbean
In the face of a deteriorating international of the Caribbean and Central America are mostenvironment, the countries of the Latin America severely affected by the high cost of theseand the Caribbean region maintained the pace of imports, which in 1980 absorbed between aeconomic activity in calendar 1980; the rate of fourth and half of the value of their exports.growth in the region's gross national product To reduce this burden, the Brazilian govern-(GNP) remained at about the same level in ment has formulated a national energy-develop-calendar 1980 (5.4 percent) as in 1979 (5.5 per- ment program that includes an extensivecent). However in the first half of 1981 the rate exploration effort for fossil fuels, acceleration ofdeclined. This performance compares well with the development of hydroelectric projects, andthat of other developing regions and of the an aggressive and innovative effort to substituteindustrial countries. The relative resilience of other domestic energy resources for importedthe Latin American economies under adverse petroleum, while encouraging conservation ofconditions reflects in part the fact that, by and energy through fiscal incentives and appropriatelarge, governments are responding with realism pricing policies. The National Alcohol Programto the problems facing them. (PROALCOOL)-substitution of alcohol as
Although the region as a whole is a net export- automobile fuel-has already increased theer of petroleum, these exports are concentrated alcohol/gasoline average blend ratio from 1 per-in a few countries-Ecuador, Mexico, Peru, Tri- cent to 6 percent in the mid 1970s to about 20nidad and Tobago, and Venezuela. Most coun- percent in 1980. About 250,000 cars weretries, therefore, rely heavily on petroleum manufactured in Brazil in 1980 with modifiedimports. Brazil, Chile, and the smaller countries engines designed to run on straight alcohol. This
Countrv Per capitaborrowers, Population I GNP 1979 2fiscal 1979-81 ((11)°°) (US5) Trend in Lending, 1972-81
Argentina 27,313 2.230 (US$ millions. F scal years.)Bahamas 234 2.750 (00) Number of OperationsBarbados 248 2,440Bolivia 5.428 550Brazil 116.539 1.780Chile 10.917 1.690Colombia 26.122 1t010Costa Rica 2.162 1,820Dominican Republic 5.280 990Ecuador 8,081 1.050El Salvador 4,410 670Guatemala 6,811 1,020Guyana 834 580Haiti 4,921 260Honduras 3,563 530Jamaica 2,159 1,260Mexico 65.509 1,640Nicaragua 2.584 660Panama 1.794 1.400Paraguay 2.974 1,070Peru 17.149 730Trinidad and Tobago 1.150 3.390Uruguay 2,904 2.100
NoLE: The 1979 estimates of GNP per capita presented abovec are \ t>.from tlhc World Devclopment Indicators in the WorldDevelopment Report 1981.
l Estimates for mid 1979.
Worldl Bank Atlas methodology. 1977-79 hase period.

Latin America and the Caribbean 61
program, costing more than $5,000 million and intraregional trade, the eleven signatory coun-supported by a $250 million loan from the Bank tries of the Montevideo Trade Treaty of 1960in fiscal 1981, has the aim of replacing about 45 agreed, in 1980, on a new treaty and the replace-percent of Brazil's gasoline consumption with ment of the existing Latin American Free Tradealcohol by 1985. Practically all other countries in Association (ALALC) by a new intergovern-the region are also adopting energy-pricing and mental organization, the Latin Americanincentive policies for the purpose of conserving Integration Association (ALADI). The newenergy, accelerating the development of entity will have more flexible rules, in keepinghydroelectric and other sources of energy, and with the changing needs of the countries, andintensifying exploration for coal, oil, and gas. will rely on bilateral negotiations more than on
Fiscal 1981 saw the initiation of disbursements broad, multilateral agreements.from the oil facility of Mexico and Venezuela and The value of the exports from the region rosefrom a similar facility sponsored by Trinidad and by a third in 1980 to more than $94,000 million.Tobago. The former scheme, with potential The bulk of this increase was accounted for,assets set at 30 percent of the value of oil exports however, by the five oil exporters, whose exportsof the two countries to the oil-importing nations rose 49 percent in value and 3 percent in volume.of Central America and the Caribbean, was set The value of total exports of the other countriesup to provide loans at concessional rates to the reached almost $48,000 million, up 19 percentcentral banks of those countries. Whenever from 1979, or about 5 percent in real terms.these funds are used to finance development Brazil and Chile experienced the largest exportprojects, especially in the energy sector, the growth-more than 10 percent in real terms. Inmaturity of the loans is changed to a twenty-year contrast, Argentina's exports fell 15 percent inperiod with an interest rate of 2 percent. The oil volume. The volume of exports of Centralfacility of Trinidad and Tobago also provides American countries also declined or stagnatedloans on concessional terms to the oil-importing in 1980.countries of the Caribbean region. The worth of the imports of the oil exporters
Another response to the current economic cli- rose bv a third, well below export growth, lead-mate is the opening up and liberalization of trade ing to a doubling, to $1,700 million, of their tradein which several countries are now engaged. This surplus. The trade deficit of the countries that doprocess involves varying degrees of liberalization not export oil rose from $2,300 million in 1979 toin the financial markets of these countries and, $7,700 million in 1980, an increase caused moremore generally, growing reliance on the market by the higher cost of imports-24 percent-thansystem to set prices and allocate resources. Such by their increase in real terms, which was about 6measures have already begun to show positive percent. Except for the oil exporters. the termsresults. Higher energy prices are encouraging of trade of the region are estimated to haveconservation and development of alternative deteriorated by about 8 percent between 1979fuels, whereas more remunerative prices to and 1980.farmers are leading to greater and more diver- The Latin American countries as a group aresified agricultural production, notably in the continuing to make a strong effort at saving, andsouthern "cone" countries-Argentina, Chile, more than four fifths of the region's capital for-and Uruguay-of South America. The countries mation is financed out of domestic savings. Still,that have adopted a policy of positive real the requirements for external borrowing areinterest rates have increased domestic savings large in absolute amounts because of the heavythat are channeled through the financial system, burden imposed by expensive imports ofhave stemmed capital flight, and have petroleum and high service payments on theencouraged inflows of private capital from foreign debt. For example, the fifteen countriesabroad. In some cases, liberalization of trade is with the largest bills for imported oil are nowalready being reflected in more efficient spending, on the average, the equivalent of twoindustrial production and expansion of nontradi- thirds of their export earnings on debt servicetional exports. and fuel imports. The resultant external con-
Progress toward liberalization of trade in straint, combined with the inflationary effect ofLatin America is hampered, however, by the rising oil prices and the needed correctiverecession that has affected most of the industrial increases in the prices of food, public services,countries and by the threat of protectionist and energy-related goods and services in mostpressures in some of them. To some extent, the countries, makes internal economic manage-countries in the region are trying to compensate ment a difficult task.for these factors by intensifying efforts to expand Inflation, in particular, remains a seeminglyexports to other developing countries, both out- intractable problem in many countries. The con-side and within the region. In order to remove sumer price index is estimated to have risen at ansome of the obstacles to the progress of average rate of more than 50 percent in 1980,

62 1981 Regional Perspectives
with the lower inflation rates-between 10 per- tion of the region lived in towns and cities; incent and 25 percent-in the countries of Central 1980, the region's urban population of some 200America and the Caribbean and the most acute million made up almost 60 percent of the total.cases ranging from about 60 percent to about 100 By the end of the century, there may be nearlypercent in some countries of South America. 400 million urban dwellers, and the level of
As a result of massive urbanization and the urbanization may rise to more than three quar-increased attention given by the governments to ters. In the 1950s and 1960s, urban growth wasfamily planning and the provision of social ser- for the most part a function of migration fromvices, the rate of population growth has leveled rural areas, as the rural poor, frustrated in theiroff or is even beginning to decline; it is still high, attempts to secure a decent living, sought a bet-however. The annual rate of natural increase is ter life for themselves and their families in urbanestimated to be about 2.3 percent as of mid 1980. areas. In the 1970s, urban growth was primarilv aIn addition, 42 percent of the population are less result of the natural increase of an alreadythan fifteen years old. These young people con- urbanized population; nonetheless, the rate oftinue to enter the labor force at a rapid rate, urbanization in the 1970s showed little diminu-particularly in the urban areas, presenting multi- tion from the rate in earlier years, and itple challenges. The first challenge is to maintain exceeded 3 percent in most countries and 4 per-a fast pace in economic growth and job creation cent in several.so that, at least, the present levels of unemploy- Within this general framework, there arement and underemployment may be prevented important contrasts. The present level of urban-from increasing at a time of rising expectations ization, for example, exceeds 80 percent inand social tensions. A second challenge is cre- Argentina, Chile, and Uruguay, whereas it is stillated by the need for heavy expenditures to pro- less than a third in such countries as Bolivia,vide tolerable levels of housing and social Haiti, and Trinidad and Tobago. The degree toservices to the increasing population, the bulk of which the urban population is concentrated inwhich will be concentrated more and more in the the largest city also varies-from more than halfcities. This particular problem is analyzed in the in Costa Rica, the Dominican Republic,next six paragraphs. Jamaica, Panama, and Uruguay to less than 20
Latin America and the Caribbean is the percent in Brazil. Some of these cities are nowdeveloping region with the highest level of among the world's largest; Mexico City, whichurbanization. In 1950, less than half the popula- grew from a city of 3.6 million people in 1950 to
Lending to Borrowers in Latin America and the Caribbean, by Sector(USS millions. Fiscal year.)
Annualaverage1972-76 1977 1978 1979 1980 1981
Agricultural and RuralDevelopment S 233.2 $ 507.0 $ 655.5 $ 405.0 $ 408.0 $ 923.2
Development Finance Companies 64.6 183.0 230.0 245.0 269.0 184.0Education 34.3 59.0 33.7 52.5 32.0 82.0Energy
Oil, gas, and coal - - - - 78.5 27.0Power 177.3 351.0 398.0 346.0 708.0 698.0
Industry 128.0 241.0 85.0 185.5 87.5 255.0Nonproject 12.8 26.5 30.0 156.5 80.0 27.0Population, Health, and
Nutrition 5.2 5.0 25.0 - - -Small-Scale Enterprises 18.1 15.0 47.0 7.0 202.0 -Technical Assistance 2.7 - 11.0 - - 1.5Telecommunications 25.1 60.0 33.6 - 44.0 -
Tourism 8.6 42.0 50.0 52.5 - -
Transportation 270.9 329.5 199.0 468.5 371.0 355.0Urbanization 13.0 12.7 162.8 176.5 88.0 254.0Water Supply and Sewerage 51.8 61.5 149.5 169.8 316.0 346.5
Total S1.045.6 $1,893.2 $2,110.1 $2,264.8 S2,684.0 $3,153.2
Of which: Bank $1,009.1 $1,868.2 $2,054.5 $2,232.8 $2,595.0 $3,119.0IDA $ 36.5 $ 25.0 $ 55.6 $ 32.0 $ 89.0 $ 34.2
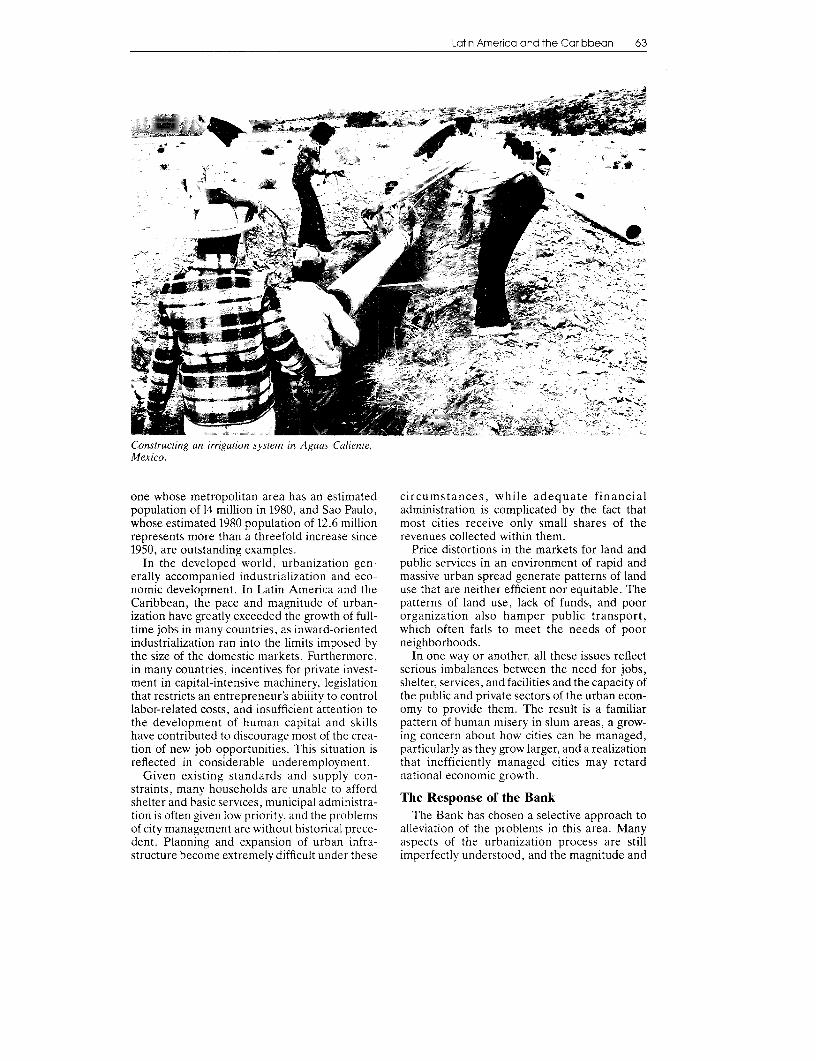
Latin America and the Caribbean 63
v ; ~~~~~~~~~~4
Constructing an irrigation system in Aguas Caliente,Mexico.
one whose metropolitan area has an estimated circumstances, while adequate financialpopulation of 14 million in 1980, and Sao Paulo, administration is complicated by the fact thatwhose estimated 1980 population of 12.6 million most cities receive only small shares of therepresents more than a threefold increase since revenues collected within them.1950, are outstanding examples. Price distortions in the markets for land and
In the developed world, urbanization gen- public services in an environment of rapid anderally accompanied industrialization and eco- massive urban spread generate patterns of landnomic development. In Latin America and the use that are neither efficient nor equitable. TheCaribbean, the pace and magnitude of urban- patterns of land use, lack of funds, and poorization have greatly exceeded the growth of full- organization also hamper public transport,time jobs in many countries, as inward-oriented which often fails to meet the needs of poorindustrialization ran into the limits imposed by neighborhoods.the size of the domestic markets. Furthermore, In one way or another, all these issues reflectin many countries, incentives for private invest- serious imbalances between the need for jobs,ment in capital-intensive machinery, legislation shelter, services, and facilities and the capacity ofthat restricts an entrepreneur's ability to control the public and private sectors of the urban econ-labor-related costs, and insufficient attention to omy to provide them. The result is a familiarthe development of human capital and skills pattern of human misery in slum areas, a grow-have contributed to discourage most of the crea- ing concern about how cities can be managed,tion of new job opportunities. This situation is particularly as they grow larger, and a realizationreflected in considerable underemployment. that inefficiently managed cities may retard
Given existing standards and supply con- national economic growth.straints, many households are unable to affordshelter and basic services, municipal administra- The Response of the Banktion is often given low priority, and the problems The Bank has chosen a selective approach toof city management are without historical prece- alleviation of the problems in this area. Manydent. Planning and expansion of urban infra- aspects of the urbanization process are stillstructure become extremely difficult under these imperfectly understood, and the magnitude and

64 1981 Reg onal Perspectives
complexity of the issues have made it necessary scarce and regular incomes are low there will beto proceed slowly while the lessons of experience many to whom these solutions are not accessi-are being absorbed. ble. Several Bank loans for urban development
The first element of Bank support in the have therefore incorporated componentsregion was the provision of electricity, water sup- intended to create employment opportunities.ply, and sanitation in low-income areas of cities In one project, for example, a Bank loan forthrough a variety of projects, followed, in fiscal housing and urban infrastructure was cofinanced1974, by an attempt to find direct solutions to the by a loan of $80 million from a private bank toproblems of increasing the availability of shelter expand industrial and commercial free zones,for the urban poor, such as in the First Urban thereby generating new employment. More fre-Development project in El Salvador. Despite quently, direct efforts to generate employmentmuch progress, however, a quarter of the urban opportunities have been incorporated in creditpopulation of the region still lack water supply, programs for small enterprises, commercial astwo thirds lack sewerage services, and nearly a well as industrial, and often on a very small scalethird lack adequate housing. There is much indeed.demand for low-cost solutions affordable by Experience with shelter, urban services, infra-those of the poor who can contribute labor and structure, and employment components inlimited cash pavments from earnings in the infor- urban lending has led to the conclusion that themal sector. But the public and private sectors development of urban institutions is critical tohave been slow to adapt their activities to help the successful efforts to adjust to the conse-meet this demand. The Bank, therefore, has quences of urbanization. Thus, the third loan tosought to assist governments in designing and Brazil for urban transport and the second urbanfinancing projects that would institutionalize development loan to Mexico focused on institu-and standardize solutions to the challenge of tional growth and development of capacity toproviding housing, services, and infrastructure. identify, appraise, and supervise urban infra-
Many of the urban projects assisted by the structure and paving programs in medium-sizedBank are designed to provide serviced sites- cities.lots with water, sanitation, and other facilities- While many Bank-assisted urban projectsand basic infrastructure that can be afforded by stress the search for direct ways of alleviatingthose whose incomes are low. One recent exam- poverty and the correction of market imperfec-ple, from fiscal 1980, was the provision of ser- tions, others emphasize improvement of the effi-viced plots at two sites as part of the Guayaquil ciencv of urban economies, notablv urbanUrban Development project in Ecuador, which transport, administration, and city manage-emphasized the use of realistic and affordable ment. In addition, some of the Bank's work indesign standards. Because of the scale of the the urban sector-most recently in Peru andproblem, most projects of this kind cannot hope Brazil-has been focused on the issues ofto reach more than a few of those in need. They national urban and spatial policy and on assistingcan, however, be considered pilots for large- governments to consider objectively the costsscale programs and help provide the institutional and benefits of alternative patterns of spatialframework necessary to operate on a larger organization.scale. Many of the Bank's urban operations in the
Serviced sites are a valuable means of provid- region of Latin America and the Caribbean areing shelter, but many families are too poor to complex and some have multiple objectives. Theafford even the modest solutions they offer. greatest challenge of project design is to createRecognizing this, the Bank has helped finance a balance between the need to resolve urgentseveral projects that are concerned with and interrelated problems and the need toareawide slum improvements, such as drainage strengthen many of the agencies that are respon-and paving, and has sought to reach the poor sible for urban operations.through financing construction-materials creditsor home-improvement loans. Following earlier The Caribbean Countriesprojects in several countries, a loan in fiscal 1979 The past decade has been a difficult one forto Colombia provided for such improvements in the nations of the Caribbean. Manv are newlythe Cartagena slums. independent and most are small islands, with
Direct efforts to improve living conditions fragile economies. The problems of adjustmentthrough sites-and-services and upgrading to being independent states in a world economyschemes have achieved some success, par- would have been immense even if the worldticularlv in establishing more realistic design economy of the 1970s had been as stable as thatstandards and housing norms and developing of the 1960s. Events since 1973-uncertain pricesnational or local institutions to expand the scale for the few primary products that they export,of such operations. Yet for as long as jobs are declines in earnings from tourism, dwindling

Latin America and the Caribbean 65
foreign investment, higher energy costs, global opment, export industries, and mobilization ofrecession, and hurricane-caused destruction- domestic resources.have served to exacerbate the situation. The Bank continues to preside over the Carib-
The magnitude of the problems facing these bean Group for Cooperation in Economiccountries grew in 1980. Eastern Caribbean coun- Development. This group, founded in 1977 as atries, struggling to recover from the worst storm response to the growing economic problems ofof the century, hurricane David, in 1979, were the subregion, provides a basis upon whichheavily hit by hurricane Allen in 1980. Oil prices external donors can understand the economiesescalated rapidly. A scarcity of foreign exchange and can consider, in a coordinated fashion, theduring the late 1970s has meant that applications appropriate financial and technical assistance toof fertilizers, insecticides, and fungicides have support the long-term economic programs of thebeen fewer than were needed; in 1980, producers countries in the area.of bananas and sugar, whose crops were not During the year, a subgroup meeting was helddevastated by hurricanes, suffered significant in Barbados to seek ways to meet the externallosses to diseases. Intensified recession in the financing needs of Dominica, St. Lucia, and St.industrial countries caused sharp drops in tour- Vincent and the Grenadines. A similar meetingism during the 1980-81 season, a drop exacer- was held in Kingston for Jamaica. In addition, abated by a sharp increase in air fares and, for subgroup meeting, held in Antigua, discussedsome islands, a decline in the availability of char- ways to further economic development andter aircraft. Although sugar prices were higher cooperation among the small islands that arethan usual, few countries had bumper crops, and members of the group.increased earnings were small compared withshortfalls in foreign exchange in other sectors.
Almost all Caribbean countries have ex- Bank and IDA Lending, Fiscal 1981tremely difficult development problems. With Total Bank and IDA lending in the region insome exceptions-the smaller islands of the fiscal 1981 amounted to $3,153.2 million, someEastern Caribbean are prime examples-well- $469 million above the fiscal 1980 level. A total ofdeveloped export sectors mean statistically high 53 loans and credits was approved. Lending forincomes per capita. The countries' small size, agriculture and rural development and energyhowever, limits their scope for increased produc- accounted for 29 percent and 23 percent, respec-tion and makes them, by necessity, heavy import- tively, of total lending in the region in dollarers. In most of the recently independent terms.countries their colonial heritage has left the peo- Funds committed under cofinancing arrange-ple with high levels of education but, paradox- ments with the Bank and IDA reached $1,530.3icallv, with relatively low levels of marketable million, or 42 percent below last year's level.skills in the labor force. Significant development Each cofinanced project attracted an average ofin this area of the world will of necessity take a $118 million in cofinancing during the year, com-long time and be quite difficult to achieve. pared with about $156 million in fiscal 1980.' (SeeForeign private investment, as well as Official table on page 80.)Development Assistance, will continue to be Disbursements on Bank loans to borrowingneeded. countries of the region were $1,654.6 million dur-
Perhaps the most promising trend during the ing the fiscal year. Disbursements of IDA creditsfiscal year has been the slow but clear movement stood at $68 million for the same period. Thetoward responsible economic management in figures for Bank and IDA disbursements in fiscalseveral countries of the Caribbean. Most coun- 1980 were $1,414.2 million and $35.3 million,tries are beginning to take steps toward signifi- respectively.cant structural adjustments to the realities of the After a hiatus of six years, the Bank convenedworld economy. While the overall economic a Consultative Group Meeting in Paris, France,situation remains difficult and shows little sign of during the year to help mobilize cofinancing forrapid improvement, the countries themselves the 1981-85 public investment program of Peru.seem willing and ready to undertake corrective At the government's request, the Bank alsomeasures. In response to one such change, the agreed to provide logistical and technical sup-Bank extended structural-adjustment assistance port for a meeting sponsored by the governmentof $22 million to Guyana in February 1981. This to enlist backing from private financial sourcessupport emphasizes the evolution of the econ- for the program.omy through the long term and the economicpolicies that must be followed if real develop-ment is to take place. Typicallv, the Bank istrying to help countries to concentrate on issues I Cofinancing data have been compiled from World Bank reports of
projects at the time of their Board approval and do not reflectsuch as energy conservation, agricultural devel- changes in amounts since that time.

66 1981 Regional Perspectives
Bank and IDA: Trends in Lending, by Sector, 1979-81-Amounts(US$ millions. Fiscal years.)
1979 1980 1981
Bank IDA Total Bank IDA Total Bank IDA Total
Agriculture and RuralDevelopment $1,568.1 $ 953.7 $ 2,521.8 $1,700.4 $1,758.0 $ 3,458.4 $2406.0 $1,357.0 $ 3,763.0
Development FinanceCompanies 559.0 32.2 591.2 743.0 74.5 817.5 1042.0 70.5 1,112.5
Education 245.5 250.5 496.0 360.1 80.0 440.1 374.6 360.7 735.3
Energy
Oil, gas, and coal 82.4 30.0 112.4 328.5 128.5 457.0 564.0 95.5 659.5
Power 872.5 482.4 1,354.9 1,584.5 807.8 2,392.3 1,282.5 40.5 1,323.0
Industry 721.0 121.5 842.5 393.5 29.0 422.5 475.8 409.7 885.5
Nonproject 301.5 105.0 406.5 280.0 242.5 522.5 789.0 223.0 1,012.0
Population, Health, andNutrition 17.0 97.0 114.0 65.0 78.0 143.0 12.5 - 12.5
Small-Scale Enterprises 69.6 16.0 85.6 222.0 38,0 260.0 157.5 71.5 229.0
Technical Assistance - 29.7 29.7 - 13.0 13.0 49.5 81.6 131.1
Telecommunications 110.0 - 110.0 66.0 65.0 131.0 - 329.2 329.2Tourism 66.7 46.5 113.2 - - - - - -
Transportation 1,430.9 473.5 1,904.4 1,205.0 239.5 1,444.5 763.0 299.8 1,062.8
Urbanization 297.5 12.0 309.5 249.8 99.0 348.8 459.0 42.0 501.0
Water Supply andSewerage 647.3 371.5 1,018.8 446.4 184.7 631.1 433.5 101.1 534.6
Total $6,989.0 $3,021.5 $10,010.5 $7,644.2 $3,837.5 $11,481.7 $8,808.9 $3,482.1 $12,291.0
Bank and IDA: Trends in Lending, by Sector, 1979-81-Percentages(Fiscal years.)
1979 1980 1981
Bank IDA Total Bank IDA Total Bank IDA Total(%) (%) (%) (%) (%) (%) (%) (%) (%)
Agriculture and RuralDevelopment 22.4 31.6 25.2 22.2 45.8 30.1 27.3 39.0 30.6
Development FinanceCompanies 8.0 1.1 5.9 9.7 1.9 7.1 11.8 2.0 9.1
Education 3.5 8.3 5.0 4.7 2.1 3.8 4.3 10.4 6.0
Energy
Oil, gas, and coal 1.2 1.0 1.1 4.3 3.3 4.0 6.4 2.7 5.4
Power 12.5 16.0 13.5 20.7 21.1 20.8 14.6 1.2 10.8
Industry 10.3 4.0 8.4 5.1 0.8 3.7 5.4 11.8 7.2
Nonproject 4.3 3.5 4.1 3.7 6.3 4.6 9.0 6.4 8.2
Population, Health, andNutrition 0.2 3.2 1.1 0.9 2.0 1.2 0.1 - 0,1
Small-Scale Enterprises 1.0 0.5 0.9 2.9 1.0 2.3 1.8 2.1 1.9
Technical Assistance - 1.0 0.3 - 0.3 0.1 0.6 2.3 1.1
Telecommunications 1.6 - 1.1 0.9 1.7 1.1 - 9.5 2.7
Tourism 1.0 1.5 1.1 - - - - - -
Transportation 20.5 15.7 19.0 15.8 6.2 12.6 8.7 8.6 8.6
Urbanization 4.3 0.4 3.1 3.3 2.6 3.0 5.2 1.2 4.1
Water Supply andSewerage 9.3 12.3 10.2 5.8 4.8 5.5 4.9 2.9 4.3
Total 100.0 100.0 100.0 100.0 100.0 100.0 100.0 100.0 100.0
NoTr: Details may not add to totals. due to rounding.

67
Chapter FourBank Policies and Activities, Fiscal 1981Bank Policies
In Chapter Six, "Executive Directors," men- a fourth, or by approximately $25,000 million totion is made of all those policy and operational $30,000 million (in 1980 dollars).issues examined and discussed by the Bank's The investment costs of a comprehensiveExecutive Directors during fiscal 1981. Some of energy program, including development of boththose issues, such as the Bank's lending rate, are nonrenewable and renewable energy sources,reviewed at least annually. On other issues, such for all the oil-importing developing countriesas the possible expansion of lending by the Bank during the decade (1981-90) would be at leastand IDA bevond levels now planned for fiscal $450,000 million (in 1980 dollars). The $45,000years 1982-86 and the valuation of the Bank's million-a-year average over the decade contrastscapital, the review is continuous (and oftentimes sharply with the approximately $25,000 millioninformal) and no decisions have been reached.' requirement estimated for 1980.On still other matters affecting the Bank's opera- Despite massive efforts by these countries totions, however, the Directors reached a general mobilize the necessary financial resources, theyconsensus, the consequences of which are likely still require external technical and financialto have an impact on the Bank's investment assistance. Many are constrained from obtainingportfolio in the years ahead. Three of those the needed assistance by lack of creditworthinessissues are discussed in the pages that follow. for commercial finance, uncertainty about theirThey concern energy, structural-adjustment domestic energy-resource bases, and inadequatelending, and agricultural research. domestic policies and institutions. Commercial
banks and oil companies, aware of these con-Energy straints, have further inhibitions of their own:
The energy work of the World Bank is the banks show little willingness to provide thedesigned to help developing countries maintain large sums needed to finance construction of theeconomic growth at a reasonable level of about 6 infrastructure that would be required forpercent a year and to ensure that their energy exploitation of indigenous reserves of gas, coal,demands are met without causing additional and hydroelectric power; the oil companies, par-strain in world markets. The main requirement ticularly the large ones, are often morefor accomplishing this aim is a combination of interested in oil for world markets, and they seekgreater indigenous energy production and more protection against political risks, includingeffective management of energy demand. nationalization. The Bank is well placed. as the
On the supply side, the increase in the real largest source of public support for the develop-price of oil has made attractive the exploitation ment of energy resources in developing coun-of reserves of oil, gas, coal, and hydroelectricpower that was formerly thought to be IOn the first-named issue, the Directors noted that changes in theuneconomical. Shortages of fuel wood are com- environment in which the Bank operated constituted a powerful
in many o the pooest oil-mporting case for expansion of lending. But many of the same factorsmon in many of the poorest oil-importing underlying the case for expanded lending had also served todeveloping countries, and for them rapid increase the pressurc on budgetary expenditures in many coun-
deforestaton is as svere a contraint to tries that were important suppliers of capital to the Bank. Thedeforestation is as severe a constraint to aconflict between evident needs and constraincd budgets was thedevelopment as dependence on imported oil; crux of the problem facing the Bank. It was a subject that could
reforestaion progrms are ths clearlyneeded. be dealt with conclusively neither in fiscal 1981 nor in the nearreforestation programs are thus clearly needed. future. Furthermore, it is a problcm that could likely preoccupyOn the demand side, rationalized pricing the Board for the decade of the
1980(s.
On the second issue, the Directors agreed that the Bankpolicies for energy supported by effective fiscal should, to an appropriatc extent, make use of the special drawingand regulatory measures could bring about sub- right (SDR) as its unit of account. A staff study is to be prepared
in fiscal 1982 on the steps that could be taken to this cnd~ thatstantial conservation of energy and increase the study will be submitted to the Dircctors for their considerationefficiency with which it is used. before July 11, 1982. so that appropriate changes in the Bank's
practices in this respect might he implemcnted beginining on thatThe Bank has estimated that the oil-importing date. The Directors also agreed to address promptly the question
developing countries, through a concerted pro- of the valuation of the Bank's capital with a vicw to achicving afinal solution by July 1. 1983. In the meantime, however, capital
gram of maximizing their production of energy subscriptions to the Bank will be accepted at 1.20635 currentand improvig efficienc in the useof energy, United States dollars equal to one 1944 gold dollar, subject to the
and improving efficiency in the use of energy, Possibility that adjustment may be required when the standard ofcould reduce their bill for imported oil in 1990 by value issue is settled.

68 Bank Policies and Activities, Fscal 1981
"Rapid deforestation is as severe aconstraint to development as dependenceon imported oil."
tries, to act as a catalyst for the mobilization of project in fiscal 1977-si150 million for develop-financial resources in addition to its own assis- ment of the Bombay High discovery in India-totance and to facilitate contracts between oil corn- twelve projects, for a total of S649.5 million inpanies and developing countries, loans duringy fiscal 1981.
Involvement of the Bank. The evolution of Strong interest in such lending has been shownBank policies designed to hielp assist the by member developing countries and by manydevelopment of energy resources in the Bank's oil companies, which value the presence of thedeveloping member countries has been detailed Bank as an objective party and appreciate thein the Annual Reports for 1978. 1979. and 1980. need for preparatory work. Eighteen private oil
In August 1980. a comprehensive review of the companies are now working with the Bank onenergy situationi in developing, countries was projects that have been approved or are in prep-discussed by the Executive Directors. The aration in seventeen mnember countries.Directors approved at that time a further broad- Electric power, a sector to which the secondening of the Bank's activities in the energy sector largest volume, after agriculture, of lending byto emphasize management of demand for energy the Bank has gone, will continue to dominate thein all sectors, to give creater attention to energyv Bank's lending for energy as it dominates theneeds in ruiral areas, to support the development public investment programs of developing coun-of renewable sources of energy. ar.d to increase tries. On the basis of the Bank's current esti-the use of aas to meet the eneray needs of mates of least-cost programs. hydroelectricitydeveloping countries, will receive strong emphasis, as will geothermal
Energy Subsector Lending. Lending by the energy, resources for which are promising, andBank for oil and gas has grownt rapidi from one the Bank will continue to stress cofinancing and

Structura Adjustment Revew 69
mobilization of internal resources through sound renewable sources other than hydroelectricfinancial management and rational tariff poli- power is unlikely to be more than 5 percent ofcies. In fiscal 1981. seventeen electric power pro- total lending for energy.jects were assisted with $1,323 million in Bank Trends through the 1980s. The S13,000 millionloans and IDA credits. lending program of the Bank for fiscal 1981-85
AcceleratedlendingbvtheBankforcoalmust for energy-related development of all kindsbe preceded by earlv emphasis on exploration reflects these factors and policies. The "desir-and preinvestment work, including substantial able" program, discussed by the Board intechnical assistance to familiarize the govern- August 1980-of some $25,000 million-couldments of the thirty or more developing countries not be financed by the Bank without upsettingthat have coal resources with the technical, the overall sectoral balance of its lending.economic, and managerial aspects of coal min- In June 1981, the Executive Directors of theing, handling, and use. Priority is therefore Bank met to discuss ways by which additionalgiven to exploration and preinvestment work, resources could be channeled by the Bank, orrehabilitation and expansion of existing mines, possibly, through an energy affiliate of the Bank,and the development of the production of coal to the oil-importing developing countries so thaton a small, medium, or large scale for domestic the production of indigenous energy suppliesconsumption and on a large scale for export. In might be expanded.all instances the Bank supports the development Discussion focused on aspects of the Bank'sof the associated transport infrastructure. In fis- role in support of expanded energv investments;cal 1981, one loan, for $10 million, was approved the need to mount a comprehensive program offor the development of coal. support for energy investment that was fully
Lending by the Bank for energy from renew- integrated into the reoriented developmentable sources-in addition to its lending for strategies made necessary by high-cost energy;hydroelectric power-is primarily to assist de- the need for the program to serve as a catalyst toveloping countries to meet their critical needs mobilize additional finance for this purpose fromfor fuel wood and to develop their potential for all sources and, in particular, private capital; andproducing alcohol from biomass as a substitute the need for the Bank to act as a lender of lastfor gasoline, and, possibly. for use as chemical resort to finance investments that are not attrac-feedstocks. It is estimated that a fivefold increase tive to private capital.in the present rate of planting would be needed There was agreement that the oil-importingto ensure a reasonable balance between the developing countries were faced with a seriousdemand for fuel wood and supplies of it in challenge in maintaining the pace of develop-developingcountriesbytheyear2000. The Bank ment at a time of persistently high energy costshopes to continue to expand its lending for fuel and that a major increase in their investments inwood so as to help the developing countries to at indigenous sources of energy is required. Theleast double the present rate of reforestation by Directors of the Bank also agreed that it was1985 and to create the technical and institutional essential that momentum be maintained ininfrastructure that larger planting programs in defining the role of the Bank in helping the oil-the future would require. Lending for fuel-wood importing developing countries overcome theirdevelopment has risen substantially in recent energy problems. The Directors thereforeyears: in fiscal 1981, total forestry lending agreed to continued discussions on the Bank'samounted to $114 million. Of that total. funds for program to assist the oil importers and thefuel-wood development accounted for about S50 means of financing that program.million. Lending for the production of alcoholwill be encouraged where it is economically Structural Adjustment Reviewpromising-that is, in countries, such as Brazil, In fiscal 1980, the Executive Directorsthat have the potential for producing low-cost approved the initiation by the Bank of struc-biomass or in those that have "surplus" biomass, tural-adjustment lending-that is, lendingusuallv molasses, that can economically be con- designed to support major changes in policiesverted to alcohol. (In fiscal 1981. a $250 million and institutions of developing countries thatloan was approved by the Bank to support would reduce their current-account deficits toBrazil's National Alcohol Program.) Such proj- more manageable proportions in the mediumects presage a more aggressive approach to other term while maintaining the maximum feasiblealternative and synthetic fuels as proven technol- development effort. They also agreed to reviewogy for producing them becomes avail- this initiative during the course of fiscal 1981 inable and appropriate and their economic the light of an evaluation of loans alreadyimplications are better understood. During approved and of possible changing circum-1981-85. however, lending for energy from stances in the world economy.
70 Bank Policies and Activities, Fiscal 1981
The review concluded that Bank operations in forms of program lending will reach 10 percent ofthis area can be helpful in accelerating policy the Bank's overall lending program in thereforms designed both to achieve a minimum immediate future.level of development and to restore balance-of- It has been recognized that structural-adjust-payments viability. This is because structural- ment lending by the Bank is complementary toadjustment lending consists of financial support support for adjustment programs provided byfor specified programs of monitorable and time- the International Monetary Fund, particularly inbound policy action by governments. It is those countries that have agreed upon a three-therefore unlike project lending, in which the year program with the Fund. This has requiredneeds of the project tend to dominate the timing the development of procedures for ensuringof preparation and appraisal of an operation and closer collaboration between the staffs of the twoin which disbursement of Bank funds is linked to institutions while they retain their independentproject implementation. Project lending, responsibilities. These procedures are now inhowever, must complement structural-adjust- effect.ment lending. Policy and institutional changes During fiscal 1981, seven structural-adjust-agreed to under structural-adjustment lending ment loans, totaling $717 million, or about 7operations, for example, have been supported percent of the lending program of the Bank andfurther by Bank loans for agricultural research in IDA, were approved. Recipient countries in-Senegal, loans to state economic enterprises in cluded Guyana, Malawi, Mauritius, the Philip-Turkey, and loans to the industrial sector of the pines, Senegal, and Turkey (two loans).Philippines. Because adjustment policies that are needed
Because structural-adjustment assistance is to support changes in the structure of the growthmeant to help developing countries reestablish of output in the medium term vary from oneworkable balance-of-payments positions in the country to another, the Bank's structural-adjust-medium term while maintaining the maximum ment lending policy has been designed to befeasible development efforts, it is, of course, still flexible, so that the content of structural-adjust-too early to draw any firm conclusions about the ment assistance can vary according to countryeffectiveness of the programs agreed upon for circumstances.achievement of these objectives. Fewer than a Most programs supported by assistance fromdozen and a half countries, moreover, have the Bank, however, have included policy changesadjustment programs that are either being sup- designed to initiate corrections of biases inported under already approved structural- incentive systems that deter exports and pro-adjustment loans or for which preparatory work mote uneconomical import substitution. Struc-and discussions have begun-a number far tural-adjustment lending to the Philippines, forsmaller than the number of countries that need instance, has provided support for the beginningto implement such programs. The difficulty that stages of a five-year program to correct suchgovernments find in gaining political acceptance biases. Import liberalization and export incen-for the adoption and implementation of struc- tives are features in the programs for bothtural-adjustment programs has been and con- Turkey and Kenya; a moderately higher andtinues to be the single most important obstacle to more nearly uniform rate of import duties and arapid progress by the Bank with structural- limited system of export subsidies form a part ofadjustment assistance. Often the need for struc- the policies of Senegal.tural adjustment is greatest in those countries Some of the schemes to reduce the bias againstthat find it most difficult to adopt effective pro- exports have been extended to agriculturalgrams. In some of these countries, the Bank has exports, as well. Country examples includesupported policy improvements on a more Senegal, where the government has increasedlimited sectoral basis in the hope that they could the price of groundnuts, the principal exportbe broadened gradually. The emphasis in these crop; Bolivia, where producers of beef, dairyoperations has been on reform of policies and products, and poultry are receiving higherinstitutions in priority sectors and subsectors of prices; and Guvana, where improvements inan economy-agricultural rehabilitation in incentive prices have been given to producers ofSudan and export rehabilitation in Tanzania, for rice and sugar.example. Most structural-adjustment programs sup-
Lending for structural adjustment programs ported by the Bank have also included appropri-must be found from within the total resources ate institutional changes. In Senegal, reforms ofavailable to the Bank and IDA. Thus, the the public-sector institutions responsible foramounts devoted to such programs inevitably agricultural development are at the heart of therestrict the amounts available for normal project program; improvement in the efficiency of statelending. It is not, however. expected that the economic enterprises is also an important fea-total lending for structural adjustment or other ture of Turkey's program. improvements in

Agricu tural Research 71
institutional support to nontraditional exporters tions. Whenever it can be done, the number ofare a part of programs supported by the Bank in staff should be increased in such cases, trainingGuyana, Kenya, the Philippines, and Turkey. programs should be expanded, and qualified
Other common features of structural-adjust- managers recruited. No less important arement operations include a review by govern- serious efforts to reduce the gap between labora-ments of the level and composition of public tory research and its extension to the farmers'investment expenditure and of government fields. Substantial progress in this directionrecurrent expenditure and measures to increase has been made through new approaches tothe mobilization of private savings in the face of agricultural extension.falling rates of growth of real national income. For more than a decade, the Executive Direc-
tors of the Bank have supported the efforts ofAgricultural Research member developing countries to build up their
As reserves of arable land that can be put to national research institutions. They have recog-the plow decline, much of the food for a growing nized that funds allocated for agriculturalpopulation will have to come from increases in research can be an efficient source of agriculturalyields on land that is now under cultivation. growth and can yield greater economic returns
In the mid 1960s, largely as a result of interna- than other possible investments in rural areas.tional research, several varieties of improved Consequentlv, research and extension have beenseeds were developed that, when combined with among the most rapidly growing activities in thefertilizer and appropriate water conditions, were agricultural and rural development portfolio ofcapable of increasing the yields of rice and wheat the Bank; in fiscal 1980, they accounted for aboutsubstantially. Despite these convincing advances $400 million, or roughly 9 percent of the nearlyin research, however, and the subsequent expan- $3,460 million in lending for agricultural andsion in the area under cultivation in these two rural development. An additional $11.7 millioncereals, many developing countries continue to was granted to the Consultative Group for Inter-attach low priority to agricultural research. Two national Agricultural Research (CGIAR) forsignificant indicators of this low priority are: support of international agricultural research.
-The money spent on agricultural research in Bank assistance for agricultural research hasAfrica, Asia, and Latin America, while increas- generally been of four types:ing steadily through the years, still accounts for -agriculture and rural development projectsno more than a fourth of the estimated $5,000 that have adaptive research and extension com-million now spent on agricultural research ponents;throughout the world. -national or statewide research and exten-
-The number of agricultural research scien- sion projects-by far the largest and fastest-tists in the developing countries is grossly inade- growing category;quate; their number-about 23,000, excluding -education projects that include agriculturalthose in China-corresponds roughly to the total components; andnumber in Japan alone. -grant funds for the CGIAR.
Partly because of inadequate funding and a In approving these projects-some thirty inlack of trained manpower, some research proj- number and $721 million in cost, between fiscalects, particularly in the low-income countries, 1971 and fiscal 1980-the Executive Directorsare poorly designed and slow to be imple- have tried to ensure that the principal objectivesmented. Many of the national programs are of research are the improvement of food cropslimited in scope and they are typically the and the development of simple technologies thatweakest links in the global research effort. small farmers can afford. Nevertheless, the
Despite wide diversity in research capabilities Executive Directors realize that betteramong countries, a number of those weaknesses technologies suitable for use by low-income pro-have been identified. There is a general lack of ducers, especially those living in agriculturallyappreciation by governments of the role that marginal areas, are still needed.effective research plays in agricultural growth As the need for food grows. many developingand development; deficient organizational struc- countries will be required to increase food pro-tures for research and extension result in frag- duction bv about 3 percent to 4 percent a vear.mentation of effort and weak linkages between Many of these countries will have to increaseresearch and extension and the generation of their investment in agricultural research sub-research results that have practical value to farm- stantially if these production goals are to beers; and training programs for research scientists achieved. An annual increase of about 10 per-and technicians are generally deficient. cent in investment for research would be
There is an urgent need, therefore, to appropriate in many countries. For these coun-strengthen the administrative and technical tries, an expenditure for research equal to aboutcapabilities of many national research institu- 2 percent of agricultural gross domestic product

72 Bank Policies ond Activit'es, Fiscal 1981
Scientists selecting high-yield corn seeds at UttarPradesh Agricultuiral University (Pant Nagur, India).
would not be unreasonable; the average for all The present emphasis of research on foodthe developing countries was 0.31 percent in crops, low-incomie groups, and low-cost1975. technologies will continue. T'he aim of projects
In preparing guidelines for the future, which supported by thie Bank will he to achieve aare outlined in the June 1981 publication, proper balance in funding between research andAgricultuiral Research Sector Policv Paper, the extension; an appropriate link-age betweenExecutive Directors have recognized that the national efforts and local activities and betweenWVorld Bank must take the lead among interna- the work of international reseatrch institutionstional institutions in supporti n- national and that of national oreatnizations will beresearch. They have approved steady increases encouragyed. While the emphasis will be onin the Bank's five-year lendinga program for applied research, support for miore basicagyricultural research and extension--from about research will be offered seleeti% elv whiere poten-S330 million in fiscal 1979 to miore than S550 tial benefits seem to warrant oiOfa lead time andmillion in fiscal 1984 (in constant U.S. dollars). commitmient of substantial resources.

Economic Development nstitute 73
Bank Activities
Economic Development Institute of national economic management, the other onthe design and implementation of projects for
The Economic Development Institute (EDI) meeting basic needs, gave an opportunity tohas been concerned for more than twentv-five explain Bank policies and discuss some recentyears with the training of senior officials of the Bank research. The EDI organized the first ofmember developing countries of the Bank, help- three seminars on preinvestment work for resi-ing them to improve the management of their dent representatives of the United Nationseconomies and to increase the efficiency of their Development Programme (UNDP) and theirinvestment programs. The target group for deputies and continued its collaboration with thetraining comprises officials of ministries of United Nations Institute for Training andfinance and planning, agencies dealing with Research on a bilingual (English and French)various sectors of development, and central seminar on economic development and its inter-banks and development-finance institutions A national setting for members of national delega-particular feature of the intensive courses and tions to the United Nations.seminars given by the EDI is that they draw on The EDI and the Association of Developmentthe working experience, policv analvsis. studies Financing Institutions in Asia and the Pacificof comparative development, and other empiri- (ADFIAP) offered a seminar in Washingtoncal research of the World Bank. for the training of directors of development
The training materials produced by the EDI banking institutions. Another seminar on train-are in English, French, and Spanish, and the ing methodologies, in Spanish, was also held.subjects that they cover range from macroeco- One course in Spanish, on rural developmentnomic planning, pricing, and development projects, and two courses in French, one onpolicy to the design. appraisal, execution, and national economic management, the other onevaluation of the effects of investment projects: education programs and projects. were held.most of the courses that deal with projects are Fiscal 1981 marked the beginning of participationnow organized sectorally. Since the mid 1970s by the EDI in the training of Chinese officialsthe EDI has greatly extended its training with a seminar on project planning for senioractivities in the developing countries, in col- officials held in Washington, followed by alaboration with selected regional and national course on general project planning in Shanghai.institutions. The aim is to make them able even- In Africa, the EDI cosponsored six regionaltually to continue and extend training courses of courses and one regional seminar, in addition tothe same type on their own. This is the main a railway course for francophone African coun-direction of the Institute's current growth. tries, organized with the International Center
Fiscal 1981 marked the third vear of the EDI's for Management Development in Romania, andfive-year program. which covers the fiscal years a seminar on regional development planning for1979-83. In keeping with the aims of the pro- francophone countries, held in France in coop-gram. reviewed annually by the Executive Direc- eration with the Agence Francaise Cooperationtors. the EDI continued its emphasis on giving et Amenagement. The EDI continued its pro-more short seminars, primarily in Washington, gram of regional courses given in cooperationfor senior officials, specialists, and trainers. The with the United Nations Center for Human Set-fiscal 1981 program in Washington included eight tlements with two courses on the design andcourses and nine seminars for more than 400 execution of urban projects, one in French,participants and twenty-five regional and eigh- given in Senegal. the other in English, given inteen national courses and seminars for more Kenya. Also as part of a continuing program inthan 1,200 participants. development banking in cooperation with the
The Washington program included a new African Development Bank and the Associationcourse on the management of rural development of African Development Finance Institutions,projects and a seminar on the design of rural two courses were given in the Ivory Coast, one inprojects. On the basis of this experience, courses English and the other in French. Two regionalon the organization and management of rural French-language courses in the rural sector wereprojects are expected to become a regular fea- held: a course on rural development projects inture of the program of the EDI. Two new the Sahel was cosponsored by the Communauteseminars, one on the monitoring and evaluation Economique de l Afrique de l'Ouest and the

74 Bank Policies and Activities, Fiscal 1981
Institut du Sahel in Senegal, and a course on BIDS, one on population and health, the othermanagement of rural projects, cosponsored with on project management; and two courses giventhe Pan-African Institute for Development and in Pakistan-project management and agricul-the African Development Bank, was held in tural project analysis, and a seminar on invest-Cameroon. The EDI conducted a regional ment analysis, decisionmaking, and implemen-seminar for senior transport officials in Kenya, tation-in cooperation with the Planning Divi-similar to seminars held earlier in Asia. In sion and other government departments. TheNigeria. the EDI and the Ministry of Water EDI, the government of India, and theResources conducted a workshop for Nigerian Administrative Staff College cosponsored aofficials on management of planning for water- seminar on development policy analysis as it issupply and waste-disposal agencies. The EDI related to investment decisions.also cosponsored, with the Bank's Africa depart- In Latin America and the Caribbean, the EDIments and the Commonwealth Secretariat, two continued its regional program in cooperationseminars in London on structural adjustment with the training unit of the Association ofpolicies in Africa. The EDI plans similar Argentine Banks (ADEBA) and the Centro deseminars in fiscal 1982 for francophone African Treinamento para o Desenxvolvimento Econ6-countries, proposed to be held in Yaounde, mico (CENDEC) in Brazil. The EDI cospon-Cameroon, and Dakar, Senegal. sored two courses with ADEBA, on develop-
In Egypt. the EDI and the Institute of ment banking and agroindustrial projects, andNational Planning continued their collaboration two with CENDEC, on national economicwith a senior seminar on agroindustrial project management and rural development projects. Aanalysis, a course on agroindustrial project fifth regional course, on education programs andanalysis, and a course on design and implemen- projects, given for officials from Latin Americatationofagriculturalprojects. AlsoinEgypt,the and Spain, was cosponsored by the Spanishseminar for senior transport officials and the Ministry of Finance. The EDI and the Centro detransportation projects course, cosponsored by Capacitaci6n y Desarrollo cosponsored twothe Transport Planning Authority of the Minis- national courses in Mexico, one on ruraltry of Transport, were repeated. development projects, the other on managing
In Asia, the first of a series of regional courses urban growth, of which the Ministrv of Humanon the organizational and financial aspects of Settlements and Public Works was also a cospon-power projects was held in Thailand in coopera- sor. The EDI helped to organize the third meet-tion with the Electricity Generating Authority of ing of representatives of Ibero-American train-Thailand. The regional program of training for ing institutions held in Barcelona, Spain.development banking officials requested by the The EDI also assisted with the design of cur-ADFIAP last year continued with four courses reIrincula and the identification of lecturers andtwo given in Tndia at the Management Develop- tann atogvn mIdaa h aaeetDvlp trainin- materials, and in some instances it pro-ment Institute and two given in the Philippines, vided oners an n w some tainstancesrt po- one at the Private Development Corporation of vddone to two weeks of teaching support for athe Philippines, the other at the Development number of regional and national courses con-the hlhplnes theothe at he Dveloment ducted by other institutions.Bank of the Philippines. The program is beingsupported by the UNDP, the United Nations Duringfiscal 1981, the EDl responded to moreIndustrial Development Organization, and the than 1,000 requests a month for trainingGerman Foundation for International Develop- materials such as case studies and course notes-ment. Other regional courses cosponsored by five times as many as in fiscal 1980. Approx-the EDI included a transportation projects imately 41,000 items were distributed during thecourse with the Bangladesh Institute of Devel- year. A number of manuscripts that have grownopment Studies (BIDS); two courses on out of teaching activities of the EDI were com-industrial projects with the International pleted, one was published, and two others haveDevelopment Center of Japan. to which partici- been accepted for external publication. Anpants were invited from selected countries in increasing number of teaching materials is beingAsia, the Middle East, and Latin America; and a produced in Spanish and French to meet thecourse on rural development projects with the expansion of the EDI's teaching program inUniversity of the Philippines at Los Banos and these languages.the Southeast Asian Regional Center for Gradu- The EDI continued its efforts to evaluate itsate Study and Research in Agriculture. A new effect on the training programs of institutionsseminar on metropolitan management, cospon- with which it is cooperating. In fiscal 1981, worksored by the Asian Development Bank, was on an evalution of the cooperative program ingiven for senior officials from Asian countries. Indonesia was completed and evaluation of two
National courses and seminars included two programs, one in Pakistan and one in Argentina,courses given in Bangladesh cosponsored by was begun.

Technical Assistance 75
Technical Assistance $25.1 million, up from $20.4 million in fiscal1980. In response to the increasing demand for
"The demand for Bank-supported technical assistance from the PPF, its commitmentassistance, especially for the development of authoritv was increased in October 1980 bv $30local capabilities, has grown in recent years, as a million to $87.5 million.result of the expansion and diversification of the The Bank continued to serve as executingBank's portfolio of projects, the intensification agency for projects financed ba the Unitedof institution-building efforts, and the increasingagec o rjcsfnne yteUieof mttonblngfotantemrsn Nations Development Programme (UNDP); thecomplexity of development tasks addressed by number of these that were in progress at the endthe Bank's operations. The Bank's approach to of the yearstood at 138. up from 97 a vear earlier.technical assistance needs has been both prag- The technical assistance being provided undermatic and flexible; there has been a wide variety these projects exceeds $149 million. Fifty-eightof approaches to meet the differing needs of indi- new projects, involving commitments of $41.7vidual countries." So reads, in part, a document million, were approved during the year; theprepared for the Executive Directors on the number in fiscal 1980 was 45, involving commit-volume and types of technical assistance pro- ments of $20 million.vided by the B~ank during the decade of thevided. by the Bank during the decade of the The new projects include a $3.4 million proj-1970s. ec oassist sixty participating countries in
Technical assistance has long been an integral ect tossistheixty forticipat in theirpart of World Bank operations, and the volume, assessing their needs for assistance in theirscope, and diversity of mechanisms used by the energy sectors, the first project of the Bank andBank in providing it to member governments the UNDP in the People's Republic of China-Bank in toviding it to 1981. Thernmarv an 'umbrella" project for the preparation ofcontinued to expand in fiscal 1981. The primary investment projects-and a technical-assistanceway of providing technical assistance continued projinBva,s a techmcallv ito neto be in loans made for specific sectors and in project i Bolvia, set up specifically to help thecomponents of loans made for other capital pur- government carry out the program for which theposes In fiscal 1981, the amount of this technical Bank has made a structural-adjustment loan.assistance, includin funds provided for supervi- Near the end of the year, the Bank also signed,assisanc, includeaiong fnds prvidedo suervi-es with the UNDP and the government of Pakistan,sion, implementation, and engineering services. aprjcdouetfresgwrknthtotaled $979 million, compared to $807 million a project document for design work on theallocated for this purpose in fiscal 1980. Loans Kalabah Dam. This project, for which thealloate fo ths prpoe i fical198. Lans UNDP will contribute $8 million, will be theextended for technical assistance in specific sec- UNDPwfune project for w hetors totaled $50 million in energy. $33 million in largest single UNDP-funded project for whichpower, $14 million in transportation, $17.7 in the Bank has served as executing agency.water supply and sewerage, and $14.7 in indus- One of the growing features of the Worldtry. Among the large technical assistance com- Bank's association with the UNDP is the fre-ponents were $30 million approved in the China quency with which borrowers from the Bank areUniversity Development loan and credit of $200 combining the proceeds of Bank loans and cred-million, $40.1 million of a $359 million loan to its with the grant funds of the UNDP for theColombia for hydroelectric power. $26.3 million financing of technical assistance. By the end ofof a $60 million loan to Brazil for agricultural the fiscal year there had been sixteen suchresearch, and $12.8 million of an $85 million loan arrangements in which the World Bank was theto Bangladesh for a gas development project. In executing agency and fifteen in which some otheraddition, the Bank extended thirteen free-stand- UN organization served as executing agency.ing technical assistance loans and credits for a Efforts to associate technical-assistance grantstotal of $131.1 million. These went to Bangla- from bilateral sources with Bank lending con-desh, Cameroon, Central African Republic, tinued. A new arrangement was worked out withEgypt. Guyana, Madagascar, Malawi, Nigeria. Norway whereby the Norwegian governmentSenegal, Sudan, Tanzania, Uganda. and Zaire. will set aside 5 million kroner (about $1 millionBy comparison, in fiscal 1980. four such loans equivalent) a year for financing technical assis-and credits totaling $13 million, were made. tance needed in connection with Bank lending.
A key stage in the project cycle at which the An arrangement with Japan for similar prein-Bank is called upon to assist its borrowers with vestment assistance to potential Bank borrowerstechnical assistance is during preparation. The was reaffirmed, and a review was undertakenBank has been responding to that need through with Japanese authorities of studies that might bea Project Preparation Facility (PPF), created in undertaken in the coming year.1975, under which the Bank advances funds to Demand for planning assistance has con-prospective borrowers to meet gaps in project tinued to grow. Specific objectives of planningpreparation and for institution building. During and projects range widely. from reorganizationfiscal 1981 advances from the PPF amounted to of national economies to strengthening of invest-

76 Bank Policies and Activties, Fiscal 1981
ment-preparation capacities in an individual years, at an estimated cost of $3.4 million. Forministry or at the provincial level. All projects, this purpose, the Bank made arrangements withhowever, have the general goals of promoting the Natural Resources and Energy Division ofself-sufficiency in trained manpower and the UN Department of Technical Cooperationimproving the efficiency of svstems for develop- for Development to obtain consultants to par-ment planning and implementation. ticipate in missions to seven countries. The Bank
During fiscal 1981 the Bank continued as and the UN also agreed to exchange informationexecuting agency for UNDP-financed planning on the assessments undertaken by each institu-projects in thirteen countries concentrated in tion. Exchange of information on the same sub-three regions. Projects were completed in the ject will take place between the Bank and theMaldives and Zaire; others were initiated in African Development Bank (AfDB) and as aComoros, Djibouti, Rwarida, and the Yemen result the AfDB may also participate in BankArab Republic. The Bank also supervised com- energy-assessment missions to Africa.ponents of several IDA credits that involved the The Bank has participated in the preparatoryuse of technical assistance in developing plan- work for the UN Conference on New andning capability. In Djibouti and Sierra Leone, Renewable Sources of Energy andwill attendthethe Bank supervised planning components of conference to be held in Nairobi, Kenya, inIDA and UNDP projects. August 1981. It will also participate in the Sep-
Training programs carried out in association tember 1981 UN Symposium on Energy Planningwith technical assistance were designed for to be held in Stockholm, Sweden.about 200 individuals, who represented twenty Energy was one of the principal subjects ofnationalities. Trainees participating in these pro- analytical work and policy discussions with thegrams improved their technical and managerial Organisation for Economic Co-operation andskills at institutions in both developed and Development (OECD) and its Developmentdeveloping countries. Assistance Committee. The Bank and the Euro-
The Bank also provides an array of technical pean Development Fund (EDF) also exchangedassistance outside conventional Bank opera- information on energy policy and investments.tions. Examples include short-term training; Cooperation between the Bank and certainsecondment of advisers; transfers of technology, other international organizations is based on for-such as computer expertise; service on evalua- mal agreements such as the Cooperative Pro-tion and monitoring panels; and demographic, grams (CPs) between the Bank and the Food andfinancial, and economic advice on project prepa- Agriculture Organization of the United Nationsration. Reimbursable technical assistance to (FAO), the United Nations Educational, Scien-capital-surplus, oil-exporting countries of the tific, and Cultural Organization (Unesco), theMiddle East is detailed on page 59 of this Annual World Health Organization (WHO), and theReport. United Nations Industrial Development Orga-
nization (UNIDO). These CPs continue to assist
Inter-Organizational Cooperation governments in the identification and prepara-tion of projects and to engage in sector survevs.
Because the activities of the Bank cover most The Bank bears 75 percent of the costs of theseof the sectors in development assistance, its rela- programs. Its aggregate share in fiscal 1981 wastions with other organizations concerned with $11,321,000.development, including those that specialize in The seventeen-year-old CP between the Bankparticular sectors or geographical areas, are and the FAO remains the largest of the four. Inextensive and varied. With the growing need to fiscal 1981 the program fielded 122 agricultureimprove coordination among aid-giving agen- and rural development missions in thirty-eightcies, the Bank's relations with other institutions countries. It assisted countries in the prepara-have continued to grow in volume and fre- tion of more than a fourth of all agriculture andquency. Only a fraction of this extended network rural development projects approved for financ-of contacts can be mentioned here. ing by the Bank during the year.
Like cooperation among sectors, cooperation The Bank-Unesco CP, also launched seven-with other organizations, both within and out- teen years ago, carried out analysis missions inside the United Nations, was particularly active the education sector or subsector in ten coun-in the energy field in fiscal 1981, in view of the tries and provided assistance with project prepa-importance of developments in that field within ration to twelve borrowers. In addition, itthe Bank's own programs. The United Nations assisted in the completion phase of project workDevelopment Programme (UNDP), for exam- and, to that end, organized missions to fourple, is providing financing for energy-sector countries in the course of the vear. Outside theassessments to be carried out by the Bank in CP, the Bank drew on the Statistical Office ofsixty developing countries during three to four Unesco, exchanged views with its Science Policy
Inter-Organizftional Cooperation 77
Division, and exchanged information with developed countries were initiated. Staff of theUnesco on population education and com- Bank-UNIDO CP carried out or took part inmunication work. missions in support of Bank-initiated sectoral
The CP with the WHO, initiated in 1971, con- studies and project work in various countries.centrated on sector work in its early years. In the They also provided support for activities in con-mid 1970s project preparation and specialized nection with the Investment Cooperation Pro-subsector work, such as tariff studies and man- gram of UNIDO and its consultations forpower-development programs, were added. fertilizer and petrochemical industries. TheDuring the past several years, the CP has Bank and UNIDO will review the CP toward theassisted governments by preparing rapid assess- end of calendar 1981 to identify outstandingments and sector digests in connection with the problems and consider possibilities for futureInternational Drinking Water Supply and cooperation.Sanitation Decade. So far, 105 rapid assess- The Bank also has an agreement with the In-ments, 116 sector digests, and 57 sector reports ternational Fund for Agricultural Developmenthave been prepared. As a member of the Decade (IFAD) that provides for assistance by the BankSteering Committee, the Bank is involved in in the preparation and appraisal of agriculturalpolicy development, promotion, and coordina- and rural development projects for financing bytion of Decade activities and undertakes special the IFAD and for cofinancing. In fiscal 1981 thetasks, such as the development of project prepa- Bank assisted in the appraisal and supervision ofration guidelines for use bv governments and sixteen projects; eleven projects involved Bankmultilateral and bilateral agencies, with the and IFAD cofinancing during the year.objective of easing the burden of project prepa- Finallv, among agencies with which the Bankration of governments suffering chronic staff has formal relations, mention must be made ofconstraints in the water and wastes sector. the UNDP. for which, as noted in the section on
To improve cooperation and to promote the Technical Assistance, the Bank acts as executinghealth effects of development projects in the agency for preinvestment projects.water-supply and sanitation sector, the Bank With the International Labour Organisationorganized a Basic Needs Workshop for agencies (ILO), the Bank continued to hold informal con-active in that sector, held in Easton, Maryland. sultations in the education sector, particularly inin October 1980. This workshop and others that the field of training, through visits to and fromare planned are designed to expand the coopera- ILO staff and staff of the International Centertion and joint project activities that already exist for Advanced Technical and Vocational Train-with the United Nations Children's Fund ing, in Turin, Italv. In addition, the Bank took(UNICEF) to appropriate nongovernmental part in the FAO-Unesco-ILO Inter-Secretariatorganizations that are better able than the Bank Working Group on Agricultural Education andto operate at the grass-roots level and that have Training.more experience in community organization, The Bank is considering with the ILO thehealth education, and the like. Where govern- possibility of developing or adapting ILOments agree, these organizations could become Modules of Employable Skills for use in Bank-executing agencies for Bank-assisted projects. assisted components of projects or sector-related
In further support of the Decade, and in an training. The two organizations have agreed toeffort to develop projects that are more cost collaborate in the evaluation of data concerningeffective, the Bank is executing a number of income distribution. Common definitions of in-UNDP-financed projects. The first one, begun in come and horusehold will be used, and the1978, involves the design of low-cost water sup- household will be the basic income unit in theseply and sanitation projects using appropriate data. Duplication of coverage of any country willtechnologies affordable even to low-income be avoided, and the findings of the countrygroups. Activities, including extensions of studies will be discussed periodically. By Julyapplied research earlier completed by the Bank, 1981. studies of fifteen countries had been com-are going on in fourteen countries. Total project pleted by the Bank. The staff of the Bank and thevalue is about $100 million; the first projects are ILO collaborated in the Living Standardsnow being accepted for financing by IDA and Measurement Study, which is part of the re-bilateral agencies. search program of the Bank's Development
The CP with UNIDO continued to emphasize Research Center.support of employment-intensive artisanal In the field of population. health. and nutri-activities and small-scale enterprises in manufac- tion, the Bank cooperated activelv with severalturing and construction industries. In addition, organizations. The Director of its Population,studies for small-scale hydropower equipment Health, and Nutrition Department is now chair-and of industrial policy issues in the least- man of the Sub-Committee on Nutrition of the

78 Bank Po icies and Actvities, Fiscal 1981
UN Administrative Committee on Coordination UNCTAD in providing economic and social data(ACC); twelve international and nine bilateral on certain of the least-developed countries asagencies are represented on the Sub-Committee. background for the thirty individual country-
As fiscal agent for and cosponsor with the review meetings leading up to the UN Con-UNDP and the WHO of the Special Program for ference on the Least Developed Countries, to beResearch and Training in Tropical Diseases, the held in September 1981.Bank continued its support of research into new Bank staff also participated activelv in theand better methods of treatment and control of deliberations of the UN Committee on Develop-six major tropical diseases. It will contribute ment Planning and the ACC ad hoc Task Force$2.48 million to the financing of the Special Pro- on Lono-Term Development Objectives.gram during calendar 1981. With the WHO, itparticipated in the desian of a research and Borrowers from the Bank are turning moredevelopment program for the control of diar- and more to UN agencies for assistance in therheal diseases through more effective methods preparation and implementation of Bank-sup-of preparation. dissemination. and use of oral ported projects. In fiscal 1981 total disburse-rehvdration therapy and by providing environ- ments to UN agencies through Bank loans anamental and personal health services. The Bank IDA credits amounted to approximately $16also participated in the meetings of the Hlealth million. Funds provided to borrowers through2000 Resources Group sponsored by the WIO, Bank loans allow governments to supplementthe aim of which is to monitorthe mobilization of UNDP financing for projects executed by otherresources and the use of resources in the li-ht of gencies of the United Nations. For two civlinvestment experience, aviation projects in Latin America, for example,
A Committee of International Development the Bank deposited approximately S2.3 millionAssistance Commituteeions Inther l Development W with the UNDP for activities to be undertakenAssistance Institutions on the Environment wats bv h nentoa ii vainOenztoestablished in 1981, with the United Nations ytheInternationalCivilAviationOrganizationEnvironment Programme (UNEP) as the Secre- as executing agency for those projects.tariat, to give effect to the Declaration of In line with efforts made in the past to developEnvironment Policies and Procedures Relating closer links with nongovernmental organizationsto Economic Development, which the Bank and (NGOs) engaged in development assistance, aother agencies adopted last year. Further harmo- program was initiated to systematize and expandnization of environmental policies, programs. cooperation with those organizations. Types ofand performance will be sought through linkage cooperation may include, with the approval ofwith bilateral development aid agencies. The borrowers, contractual participation of NGOs inBank's Office of Environmental Affairs also held Bank-assisted projects as consultants or asconsultations with other agencies on the Region- executing agents for project components,al Seas Programme of the UNEP, on control of exchange of information between the Bank anddesertification. and on such other subjects as the NGOs in the various phases of sector and projectmanagement of tropical forests and the use and work, and coordination when it may beregulation of pesticides. appropriate, between Bank and NGO projects
In the field of research. the Bank continued to already planned or under wav. A workshop wasexpand its already considerable relations with organized with selected NGOs from Europe,other multilateral and national institutions. It Japan, and the United States on assistance tocollaborates, for example. with the FAO, in small-scale enterprises, thrift institutions, andreassessing methodologies for estimating the institution building in developing countries. Inprevalence of nutritional deprivation. With the order to promote further cooperation. a Bank-International Food Policy Research Institute a NGO liaison committee was established.review of financial arrangements for food Cooperation in Agricultural Research. Soundsecurity is under wav. With the International long-term programs of agricultural research areDevelopment Research Centre in Ottawa. a vital part of efforts to improve agriculturalCanada, the Bank cooperates in and jointly productivity and increase the supply of food infunds a five-year program of evaluation of urban developing countries. The Bank's agriculturalshelter projects in selected developing countries; development projects includce ever greater pro-the evaluations are carried out in collaboration vision for the strengthening of the borrower'swith local institutions. national agricultural research capacity. At the
Members of the Bank staff seconded to the international level, the Bank joins with the FAOUN Conference on Trade anld Development and the UNDP in sponsoring the Consultative(UNCTAD) assisted in the drafting of the basic Grotip on International Agricultural Researchdocuments on policies and procedures required (CGIAR), an informal association of donorfor the operations of the Common Fund for countries, private foundations, internationalCommodities. Bank staff also collaborated with and regional developmcnt institutions, and

Inter-Organ zational Cooperat on 79
countries representing the various regions of the agricultural technology for the foreseeabledeveloping world. The Groups purpose is to future. Donors recognize the long-term naturesupport research to develop technology that will of their commitment. while remaining deter-make it possible for the developing countries to mined to ensure that the resources provided areproduce more food. Its thirty-three donor mem- used to achieve the maximum effectiveness.bers will be providing grants amounting to Cooperation in Aid Coordination. At thenearly $141) million in calendar 1981 to support request of both donor and recipient govern-thirteeni international agricultural research ments, the Bank has continued to take the leadinstitutions. 2 Followinig authorization by the in oruanizing various aid coordination mecha-Board of Governors in September 1980, the nisms for a number of developing countries thatBank is expected to contribute somc $14.6 receive assistance from bilateral and multilateralmillion of this amount during calendar 1981. sources. During the year. eleven aid coordinat-
The network of activities supported bv the ing groups held formal meetings that were spon-Group includes nine international research sored bv the Bank. These were the countryinstitutes, all based in developing countries and groups for Bangladesh. Burma, the Caribbeanstaffed and equipped to high international stan- nations, India (twice), Mauritius, Pakistan,dards. These institutes carrv out research on all Peru, the Philippines. Sri Lanka, Thailand, andimportant food crops, on livestock, and on farm- Zaire. The Bank also participated in a meetinging systems, and they also maintain an important of the Inter-Governmental Group for Indonesia.training function. In addition, the Group sup- sponsored by the Netherlands. and the Turkeyports a worldwide effort to collect, conserve, Consortium, chaired by the OECD.and use genetic materials and supports research The many projects that the Bank and IDAon rice by an association of Western African help to finance jointly or in parallel with othergovernments, research on food policy, and national and multilateral organizations is antechnical assistance to developing countries in indication of the close cooperation that existsthe design and implementation of their own among the various development-assistanceagricultural research systems. No additions to agencies. The numerous national and multilat-the svstem are envisaged for the coming year, eral orgamzations that Joined the Bank in help-but the Group, advised by its Technical Advisory ing to finance projects approved in fiscal 1981 areCommittee, remains alert to possible new noted in the project summaries, to he found onresearch activities of high prioritv that might pages 99 through 119.ontribute significantly to the fulfillment of its In an effort to strengthen its cooperation with
objectives, regional development banks, the Bank and theAsian Development Bank (AsDB) reached an
The CGIAR has grown rapidly since its for- understanding on cofinancing projects in threemation in 1971, and it is now an established and South Pacific islands that are members of bothsignificant part of the international development institutions, namely, Fiji, Solomon Islands, andcommunity. In the immediate future, it expects Western Samoa. For projects in these countriesthe rate of expansion to be moderate. though that the Bank and the AsDB have agreed tothere is no question as to the high prioritv that cofinance. the AsDB will act as the lead institu-donors continue to give to the research being tion and will carrv out project appraisal onsupported. Donors have accepted an indicative behalf of the Bank, taking responsibilitv forfinancial plan that envisages steady but conser- project implementation and supervision. In fis-vative growth. The Group is now engaged in a cal 1981, this cooperation agreement was appliedcomprehensive evaluation of the scope of itsactivities and its present policies and proceduresin orcder to define its objectives and plan its pro-gram for the next decade.
The Group's or(anization is unique in a num- 2Ccritri. tn- arcional de Agriculiur, Iropicill CIL). (CiallUolombini~,: (cnzro ItercriLicional de Mai,rirvricrrlo de NEroii v
ber of respects. It operates by consensus, with- ]ri0 o (CIVl r) El Biin. loxcico:th lS incrnaioiinllL Inhttute
out any formal legal framework. The flexibilitv 'iroc:l Agriculiuro lilA. ihad.ri. Nii. h litcrirrilRii e,ach fairjitutc ( iRRI ). i.ir.. Birn-, ibis Philippine,, tSo
thereby provided has been a source of strength Interriacional iNicstock (cncr)or Aficn.icl_(AJ. Addi, Albabi.
and has enabled the Group to move rapidly in l thioipi:. lo l lcrional laliu[briitirri for Rosccich oni Anim.ilDi,ca... ( ILRADJI Nairobi. Kema.. tihc liitirii.iiioiil Btoird liir
the establishment of its present array of 'i,iGiicn, n Rcsiorco, l(1PO'GR). Rorimc. lz,ik. Stic iitcriia
activities. Although the total resources chan- (i,n;il m( ciimrr Aoricicirturl Rccsci cli in Se ODr% Area.iIiARDA). Ocrl cio.and AIloppo 5N[rI,: hrl W\'rc
neled through the CGIAR are modest in rela- Alrican Rice D)cwlopmnicnt A\socintioni iWARRDA, M.oi,rosia.
tion to the investments being made in agricul- 1 rioInl ( mtCpiOR Ccnrchilr,con,titut, trp (Iith' cniiiA Pcro pic
tural research throughout the developing world. (IU(RISAI ) i'ldcrzLirhd. irAIn ,hc Inicr,i.rn.,l Food Polic'
the international centers will continue to per- .Tcrl tintiitict-li. VScmiccoiitigion.lE .A-iiai,ltrlc SRcicsr
form a critical function in the development of iSNAR . rl(lo HInI, the Ncilicrl,an,.

80 Bank Policies and Activities, Fiscal 1981
Cofinancing of Bank- and IDA-Assisted Projects, by Region(USS millions. Fiscal years.)
1978a 1979, 1980;' 1981'
Number Number Number Numberof Amount of Amount of Amount of Amount
Region projects cofinanced projects cofinanced projects cofinanccd projects cofinanced
Eastern Africa 14 $ 227.8 19 S 522.7 14 S 433.2 15 $ 179.8Western Africa 18 186.9 IS 107.3 19 630.4 12 178.8East Asia and Pacific 10 208.4 13 496.3 13 917.5 9 1,027.7South Asia 7 158.2 13 388.9 13 375.3 12 610.5Europe. Middle East,
and North Africa 19 946.8 28 949.9 18 1,508.2 18 510.9Latin America and
the Caribbean 13 698.3 21 683.8 16 2,651.7 13 1,530.3
Total 81 $2,426.4 109 $3.148.9 93 $6,516.3 79 $4,038.0
As a % oflending program 34 29 44 31 38 57 32 33
NOTE: Includes cofinancing from official and private sources, as well as suppliers' credits.Figures reflect revision in project finance plans subsequent to Board approval.Figurcs have been compiled from World Bank Appraisal and President's Reports at the time of Board approval.
to the Second Western Samoa Agricultural De- and project analyses, to provide the analyticalvelopment project and a credit to the Develop- bases for Bank policy statements, such as thement Bank of Solomon Islands, which were cofi- World Development Report, and to helpnanced by the two institutions. In the Caribbean strengthen indigenous research capacity inRegion, a similar technique has taken the form member developing countries. Research proj-of lending to the Caribbean Development Bank ects in progress are described in an annualfor onlending to some of the smaller states. Such publication, World Bank Research Program:informal arrangements are examples of the Abstracts of Current Studies. The results of com-Bank's efforts in recent years to explore ways of pleted research projects appear in a variety ofserving more effectively some of its smaller bor- formats, including articles in professional jour-rowers, and they represent a further step toward nals, books published under World Bank
appropriate division of labor. auspices or by independent publishers, and
On a regional basis, the Bank continued its World Bank Staff Working Papers. The Catalog
active participation in the country reviews spon- of World Bank Publications provides detailed
sored bv the Permanent Executive Committee of information on publications issued bv, or on
the Inter-American Economic and Social Coun- behalf of, the Bank.
cil. It also maintained close working relation- Research is undertaken by the Bank's own
ships with regional development banks and with research staff, usually in collaboration with out-
the Commission of the European Communities, side researchers. Except for such collaborative
which helped assure the coordination of de- projects, the Bank does not provide funds to
velopment-assistance activities. outside institutions or individuals for economic
and social research.
Economic Research and Studies During the past year, research activities haveevolved further in pursuit of three objectives
The World Bank devotes roughlv $12 million a recommended by the external advisory panel
year, or 3 percent of its administrative budget, to that evaluated the research program in fiscal
economic and social research. Since the formal 1979: more collaboration with institutions in
inception of the research program ten years ago, developing countries; closer links with Bank
about 110 research projects have been com- operations; and greater efforts to disseminate
pleted, while about the same number are in and apply the results of research. As the exam-
progress. Thirty new projects were started in ples presented here will show. these three objec-
fiscal 1981. tives have often been mutually reinforcing.
The program of research is shaped by the Collaborative Research. The Bank has been
Bank's own needs as a lending institution and as financing collaborative research with nationals
a source of policy advice to member govern- of developing countries for many years, but the
ments and by the needs of member countries. Its proportion of collaborative projects has recently
main purposes are to gain new insights into the increased. Of the research projects approved
development process, to introduce new tech- sincethebeginningoffiscall980,forexample,60
niques or methodologies into country, sector, percent include collaborative arrangements,
Economic Research and Studies 81
while only 46 percent of those approved between alternatives based on marginal-cost principles offiscal 1975 and fiscal 1979 included such arrange- pricing were developed, and case studies toments. Those recently approved include several demonstrate the practicability of the new meth-for which institutions in developing countries odology were conducted. As a consequence ofhave taken the initiative and are largely respon- this research and the vigorous dissemination ofsible for design and execution, examples are a its results, marginal-cost pricing principles arestudv of employment and sources of income at now routinely incorporated in power-tariffthe household level in Peru, a study of the evolu- reforms conducted by client public utilities intion of living standards of different socioeco- developing countries.nomic groups in Colombia. and a study of land A current example of applications at the coun-tenure in Indonesia. A separate allocation of try level is a study of trade policies and incentivefunds from the Bank's research budget to policies, to be undertaken as part of currentencourage this type of collaborative research is work on structural-adjustment lending tonow being made. Turkey. The Bank's research on the structure and
Links with Operations. Links between consequences of trade protection in developingresearch and operations of the Bank have been countries began in the late 1960s and has had astrengthened. This is partly through a natural powerful influence in favor of more open tradeprocess whereby as the research program policies and industrial policies in developingmatures, results are increasingly made available countries. This influence has been channeled in afor use in operations. In addition. more efforts variety of ways, including the assumption ofare being made to disseminate the results of advisory functions bv researchers in memberresearch to operating staff, and the latter are also developing countries, changes in the content andbecoming more involved in identifying issues for rigor of analyses of trade incentives and policies,research, deciding on the content of the research and discussion in public documents, notably theprogram, and managing research projects. Six World Development Report. In some instances.sectoral Research Steering Groups are now at the findings of case studies undertaken in Bankwork, defining research priorities, advising on research projects have influenced trade policiesthe design of new proposals, and evaluating com- and incentive policies directly; in others, region-pleted projects. The newest of these groups-on al offices of the Bank have mounted their ownPopulation and Human Resources and on studies of the incentive framework to provide theEnergy-were created in 1981. basis for discussions with governments.
An increasing proportion of research projects Application and Dissemination of Research.is being initiated by regional offices. Some of The Research Committee of the Bank nowthese projects address quite narrowly defined makes a separate provision for funds to supportproblems encountered in operations; others are the application of research results, quite apartbroader ranging and more speculative. Those from those applications that are made in theapproved in the last year include research on the context of operations and are funded from theeffects of Bank-assisted dairy projects for small- budgets of Bank operations. During fiscal 1981scale producers on incomes, agricultural produc- the Research Committee approved several proj-tion, household consumption, and nutrition and ects in which analytical techniques developed ina case study of the efficacy of the training-and- previous research are being transferred for usevisit system of agricultural extension-now in in other countries and are being developeduse in member countries on all continents-in further in the process. These projects will yieldpromoting innovations and increasing produc- information useful for policy planning and aretivity and incomes. Other new studies sponsored also designed to enhance local capacity forby regional offices include a project to evaluate analytical work. In the first of these. a comput-traditional and new technologies for animal- able general equilibrium (CGE) model of thepowered agriculture and the factors that encour- economy of Yugoslavia is being constructed forage or hamper their use and a study in Brazil to use in reviewing the 1981-85 plan and for subse-test the validitv of using the povertv line, or quent routine country analytical work bv Bankincome threshhold, to distinguish the poor from staff. CGE modeling techniques are already wellthe nonpoor in the planning of urban projects. known in the research literature, though there
Methods and findings derived from earlier are few instances of their application. Sponsor-research are being applied to an increasing ship by the Bank has been important in theirdegree in project operations and countrv development. A researcher in the Yugoslaviaeconomic analysis of the Bank. An example of project is one of the principal authors of a similarresearch that has supported project and sector model of the Turkish economy now in use in theanalvsis is the Bank's research on the pricing of Bank and being transferred to the Middle Eastand investment in electric power. In this research Technical University in Ankara. Two other newthe existing practices of the Bank were assessed, projects in which research results are being

82 Bank Po cies and Activ ties, -Fiscal 1981
applied one in Cyprus and one in Egypt- experience sector by sector and, through a proc-make use of social-accounting techniques and ess of review with operating staff, bringing thatassociated models as tools for economic plan- experience to bear on the designing of futurening. Much of the literature on the application of projects.these techniques to policy analysis and planning The Bank's evaluation svstem remains com-is the result of research done at the Bank or prehensive; all completed projects are covered.sponsored by it. By the end of fiscal 1981 a total of 658 projects
Efforts to make information on the Bank's had been reviewed: 94 were reviewed during theresearch program and its products more widely 1981 fiscal year. As reported earlier, the points ofavailable are continuing. The thrice-yearly speciaL interest noted on each project perform-bulletin "World Bank Research News" is now in ance audit report are maintained in a com-its second year. It is distributed to all operations puterized memory-and-search system to facili-staff within the Bank and to more than 5,000 tate prompt access to these elements of theindividuals in governments. research institu- project experience. An expansion of the systemtions, and other international institutions. In fis- to include a wider range of project information iscal 1981 a large set of staff working papers was to be initiated in fiscal 1982. It will greatlyissued in which up-to-date digests of research increase the range of easily accessible projectresults in a variety of fields were given, and a experience and will provide a means of makingreport was published on the scope of the more effective use of it.research program, its effectiveness, and the To supplement the performance audit report-issues being discussed for the future. ing system, OED has introduced a "second
look" series to review the experience of selectedOperations Evaluation projects some years after completion, when it is
Operations Evaluation possible to make a better assessment of theirDuring fiscal 1981 the World Bank's svstem for larger development effects. Several such reviews
evaluating its operations continued to develop were completed during fiscal 1981, and more arealong the lines set out in earlier annual reports. planned for the future.In particular, the objective of increasing the OED's "Sixth Annual Review of Project Per-involvement of borrowers in the postevaluation formance Audit Results," the fourth to beof their Bank--.ssisted projects has continued to distributed to the public, was published inbe pursued. The high proportion noted last year November 1980. The Review dealt with theof project-performance audits that include the experience of 130 operations supported by Bankcomments of borrowers has been maintained. loans and IDA credits. The total amount ofSignificant involvement of borrowers in the Bank finance in support of these projects waspreparation of project-completion reports has approximately $2,800 million: the total cost ofincreased. The Bank has also continued to the projects assisted was approximately $10,200encourage and support the establishment of bor- million. Like earlier reviews. the Sixth Reviewrowers' own evaluation capacities. Members of concluded that these projects were, with onlyborrowers' staffs have visited the Operations few exceptions, successful or on their way toEvaluation Department (OED), and sessions on being successful in achieving their main objec-evaluation have been incorporated into courses tives and that they had contributed substantiallygiven by the Economic Development Institute to the development of both material and human(EDI). The first EDI course devoted exclusively resources in the countries concerned.to monitorina and evaluation was given in This particular review provided the firstDecember 1980 with assistance from the OED opportunity to look at a significant number ofstaff. Efforts by operational staff to develop projects that originated in the early 1970s andmore effective systems for the monitoring and reflected the Bank's growing concern with theevaluation by borrowers of urban and rural distribution of benefits to poorer sections ofdevelopment projects were continued. society. The results reported were encouraging.
One of the most important objectives of Bank The fairly large number of agricultural proj-evaluation is to identifv and disseminate lessons ects in this group that were intended to benefitthat can contribute to improvements in the small farmers generally involved a greater-than-design and implementation of future Bank-sup- usual decentralization of effort and extensiveported projects. By bringing together expe- participation of individual farmers. Thev wererience with similar projects, lessons can be more implemented smoothly and on the wholereadily drawn and more effectivelv confirmed quickly, economic returns were comparable toand disseminated. The Annual Review of Proj- those of other agricultural projects, and it is esti-ect Performance Audit Results was, as in the mated that a larger number of farmers benefitedpast. a valuable mechanism for summarizino than had been expected. Some 4.5 million rural

Interna Audting 83
dwellers were estimated to have benefited from auditing and accounting education and practicesthe thirty-nine agricultural projects reviewed. in countries where they might be needed.The findings provide support for the Bank's pres- IAD's examination and evaluation of the ade-ent policy of concentrating its assistance on small quacy and effectiveness of the systems, pro-farmers. cedures, and internal controls used in the
The Joint Audit Committee of the Executive conduct and management of an activity includeDirectors maintains continuing oversight of the review and determination of the reliabilitv andOED work prograrni and of its effectiveness. The integrity of significant financial and operatingconclusions of the Joint Audit Committee, the data and the accounting and reporting of suchreport of the Director-General, Operations data; of the extent of compliance with variousEvaluation, on the status of the Bank's evalua- governing agreements, instruments and relatedtion system, and OED's Annual Review of Proj- decisions, regulations, policies, plans, and pro-ect Performance Audit Results were all reviewed cedures of the Board of Governors, Executiveby the Executive Directors. Directors, and Bank management; and of the
means of safeguarding Bank assets from varioustypes of losses and appraisal of the efficiency and
Intemnal Auditing economy with which resources are used.The audits of project supervision and elec-
The Internal Auditing Department (IAD) tronic data-processing systems (EDP) form anperforms an independent appraisal function important part of the Department's work pro-within the World Bank by examining and gram. Project-supervision activities are selectedevaluating the Bank's activities, with particular for audit on a sector/region basis and areemphasis on the maintenance of an effective reviewed in the light of existing policies andsystem of internal control, the quality of per- guidelines established by the Bank. The EDPformance in carrying out assigned respon- system audits include the review of controls,sibilities. and the adequacy of related systems security, and efficiency of computerfacilities andand procedures used in the conduct and manage- information systems in operation and thosement of Bank operations. The Department's under development.overall objective is to assist department direc- IAD has no direct responsibility for develop-tors and managers at other levels in the effective ing and implementing changes in svstems, pro-discharge of their responsibilities by furnishing cedures, and internal controls that it would bethem with periodic independent audits and expected to review in a subsequent audit.appraisals of activities within their areas of In carrying out each assignment, the Directorresponsibility and by identifying possible means and staff of the Department have unrestrictedof improving the efficiency and economy of access to all Bank records, documents, and per-operations and the use of resources. sonnel relevant to the activity under review.
The work program designed to achieve these Where relevant, the IAD coordinates its workobjectives covers a broad range of activities- with the Bank's external auditors and makes itsfinancial, accounting, administrative, and data working papers and reports available to assistprocessing-and the supervisory aspects of them in planning and conducting their examina-Bank loans under disbursement. Some of these tions of the annual financial statements of theactivities are reviewed annually, others bien- Bank.nially or less frequently, depending upon the The IAD reports to the Senior Vice President,materiality, volatility, or risk aspects of the Finance, but in order to enhance its indepen-activity. IAD is also requested by the manage- dence, the Director also has direct access to thement of the Bank to undertake special assign- President and to the Joint Audit Committee ofments from time to time. the Executive Directors. The results of each
In addition, the review work of the IAD has audit undertaken are reported to the depart-included visits to selected countries to review the ment directors, vice presidents. and others con-auditing standards applied by borrowers' exter- cerned as it is considered appropriate. Liaison isnal auditors, to review internal auditing and maintained with the Joint Audit Committee,financial reporting standards of selected bor- which also reviews selected reports of the IAD,rowers, and to recommend appropriate techni- reviews the Department's annual work program,cal-assistance programs to upgrade national and receives periodic briefings on its activities.

84
Chapter FiveBorrowings and Finance
Income, Expenditures, banks and financial institutions. In fiscal 1981,and Reserves: Bank they yielded an average realized rate of return of
The gross revenues of the Bank. which are 9.3 percent and generated $813 million of invest-generated primarilv from its loans and invest- ment income. This compared with an 8.8 percentments, reached a total of $2,999 million in fiscal rate of return in fiscal 1980. Additional revenues1981, up $199 million, or 7.1 percent, from the of $22 million were derived from other income.preceding year. Gross revenues have risen Total expenditures of the Bank, which includesteadily during the past decade as loan and administrative expenses, interest, and the costsinvestment balances have continued to expand. of issuance of borrowings, were S2,389 million,
The total of the outstanding loan portfolio up 8.0 percent from fiscal 1980; the increase dur-stood at $25,958 million at the end of the fiscal ing fiscal 1980 had been 10 percent. Costs associ-year. The average rate of return on outstanding ated with the increased borrowings of theloans, together with commitment charges on Bank-interest of $2.104 million, bond-issuanceundisbursed loan balances, vielded 8.1 percent charges, and other financial expenses of $30on the loan portfolio, producing income of million-were by far the largest expenditures.S2,164 million. The rate in fiscal 1980 was 8.0 Total administrative costs were $255 million, uppercent and the income was $1,945 million. $57 million, after deducting $180 million for the
The Executive Directors have approved a management fee charged to the Internationalpolicy, put into effect in Januarv 1980, according Development Association and $2.9 million forto which the lending rate would be determined the service-and-support fee charged to the Inter-on the basis of a general guideline rather than of national Finance Corporation.the strict formula that had been in effect since In fiscal 1981 the net income of the Bank wasJuly 1976. The guideline provides for a spread of $610 million, an increase of 3.7 percent over the0.5 percent above the cost of borrowing, which is $588 million earned the preceding vear.estimated for a twelve-month period, using the Of the net income of $588 million earned inactual cost of borrowing for the preceding six fiscal 1980, $118 million was allocated by themonths and the estimated costs for the succeed- Board of Governors as a grant to IDA; theing six months. According to this policy, the remaining $470 million was allocated to thelending rate is reviewed at least once a year, General Reserve.normallv at the middle of the fiscal year, and The Bank does not trade in the currencies ofmore often, if necessary. It rose from 9.25 per- its member countries for its own account.cent during the first half of fiscal 1981 to 9.60 Adjustments arising from translation of curren-percent on loans submitted to the Executive cies to U.S. dollar equivalents do not bringDirectors after January 12, 1981. realized gains or losses as would actual conver-
It is the aim of the Bank to maintain a liquid sions into U.S. dollars. The General Reserve,position in marketable short-term assets equal therefore, rather than net income, is charged orto 40 percent of estimated net cash requirements credited annually with the amount of adjustmentfor the subsequent three years. This liquidity made necessary by currency depreciations orpolicy is designed to permit the Bank to meet its appreciations. In fiscal 1981 the result of thatnet cash requirements adequately without bor- translation of currencies into U.S. dollarrowing new funds for prolonged periods, thus equivalents was a debit to the General Reservemaking it independent of temporary adverse of $582 million; in fiscal 198(0 there had been aconditions in the capital markets. On June 30, credit of $104 million. (A more detailed explana-198i, the Bank's liquid position stood at 40.3 tion is provided in Bank Appendices: Appendixpercent of estimated cash requirements for the G-Notes to Financial Statements.)next three years. When gold was abolished in 1978 as a common
At June 3(), 1981. aggregate liquid assets were denominator of the monetary system, the Bank$8,371 million net of commitments for settle- began expressing its capital stock, for purposesments. These assets are fulls invested, liquid, of its financial statements. on the basis of theand marketable: they are limited to obligations special drawing right (SDR). As a result, theof governments and of certain United States I percent paid-in portion and the 9 percent por-government instrumentalities and to time tion of the capital stock released by certain mem-deposits and other unconditional obligations of ber countries for lending in U.S. dollars are

Borrowings: Bank 85
revalued at the rate of exchange of the U.S.dollar to the SDR. The adjustment made neces- World Bank: Gross Borrowings, 1972-81sary bv this revaluation is also charged against or (LS$ mr ons. hsca 5ears
credited to the General Reserve. In fiscal 1981,the result of these adjustments was a credit of S79million to the General Reserve; in fiscal 1980 5there had been a debit of $16 million. 5 69
5,08/
Other Financial Operations: BankAs of June 30, 1981, the Bank held loans
valued at $54,090 million. This amount included$6,552 million in loans approved but not yeteffective and $528 million in loans to the Interna- 4,721tional Finance Corporation (IFC). The total ofloans disbursed and outstanding was $25,958million, including $474 million to the IFC.
Total disbursements on loans to countriesamounted to $5,063 million in fiscal 1981, up$700 million from last year. Since the Bankbegan operations, it has disbursed a total of$38,064 million to its borrowing member coun-tries.
Repayments of principal on the Bank's loans,based on exchange rates at the time of disburse-ment, amounted to $1,419 million in fiscal 1981.This included $147 million to investors who hadpurchased portions of loans. Cumulative loanrepavments as of June 30, 1981. were $12,466million-S9,571 million to the Bank and $2,895million to purchasers of loans.
Borrowings: BankThe World Bank's borrowings in international 2,528
capital markets constitute the principal source offunds for financing its lending operations. Theborrowings are supplemented by the other prin-cipal financial resources of the Bank, which areits paid-in capital, accumulated earnings, andloan repayments.
The Bank borrowed the equivalent of $5,068.8million in fiscal 1981. This does not include $646million that was borrowed at the end of fiscal1980 and credited in advance to the borrowingprogram for fiscal 1981. This amount wasincluded in the 1980 Annual Report. The advanceborrowings for fiscal 1981 included two issues,totaling S500 million, of Eurodollar notes, mark-ing the first borrowing by the World Bank in theEurodollar bond market, a public issue in theamount of SwF 100 million, equivalent to $61.3million, and a private placement in the amountof DM 150 million, equivalent to $84.8 million.During fiscal 1981, the Bank also considered bor-rowing operations that were subsequentlypostponed because of volatile market condi-tions.
The World Bank sells its securities in twocategories of market: First, it places bonds andnotes directly with its member governments,

86 Borrowirgs and F nonce
govcrnmcnt acencies. and central banks. Outstanding Obligations of the tiankSecond. it offers issues to investors and in the (As of Jlune 30),1981 )public markets through investment-banking Princip.l Percutagc of
firms, melchant banks, and cornmercial banks. ,mosio total outstanding
Of the fortv-four borrowing operations that the Country (Uss mrlilJos) aimotint
Bank conductod during tiscal 1981. twentv-eighlt Germanr $ 6.473.9 23.3were public issues or private placements United States 4.77.'.7 17.2throughout the world and accounted for Japan 4,5"S.() 16.3S3.32.06 millioni. or 66 percent of total funds Switzerland 4.155.3 14.9borrowed. The other sixteen issues, totaling OPEC 4(14).9 14.9
S1729.1 million, or 34 percent of the funds Other 3.718;.( 13.4raised, were placed with official sources- Total $27,797.8 1()().()namely, member governments of the WorldBank. central banks, and government institu-tions.
The basic borrowing policy of the Bank is todivcrsifv the markets for its oblioations in order gto avoid undLIe dependence on one particular The total cost of all borrowings by the Bank inmarkct. Its securitics have been placed with the fiscal year, weighted bv amount and maturity,invcstors in more than a hundred countries in averaged 9.1 percent the corresponding percen-Africa, Asia, Australia. Europe. the Middle tage in the preceding year had been 8.1. The costEast. and North and South America. The Bank in fiscal 1981, weighted by amount only, was 9.6is the largest nonresident borrower in virtually percent, compared to 8.2 percent in fiscal 1980.all countries in which its issues are held. The average cost of all funds to the Bank, includ-
The S5,(068.8 million borrowed bv the Bank in ing paid-in capital and accumulated earnings,fiscal 1981 consisted of the following currencies was about 6.1 percent. The cost of the Bank'sand included the Bank's first public borrowing in average outstanding borrowings was 7.4 per-sterlino since 1971, and the first public borrowing cent.in guilders since 1976. The cost of the Bank's average outstanding
borrowings for each of the past six fiscal years ishere summarized:
Bank Borrowings in Fiscal 1981(As of Juric 3'. I')1S )
C(urrency US dollar Cost of the Bank's Average Outstanding BorrowingsCurrencv amounl equivalcnt Ascrgecborrowved (millions) (millions) principal
outstasidille CostDeutsche mark DM 2.601 .8 $1,437.0 Fiscal scar (SS5 millions) (percentage)
Swiss francs SwF 1,731.8 962.5 1976 $13,482 7.32Japanese yen Y 234,000.0 1,(090.6 1977 16,809 7.53
Netherlands guilders f. 600.0 251.9 1978 2(0.948 7.45Pounds sterling £ 1(0.( 215.8 1979 25,6()( 7.21US dollars S 1,111.0 1,111.0 198(1 27,644 7.28
1981 28,81(0 7.41
Of these borrowings, S3.860.5 million repre-sented new funds and $1,208.3 million repre- Capitalizationsented refinancing of outstanding borrowings. The capital stock of the Bank and the sub-
A total of $2,722.0 million equivalent of bor- scriptions of its members to it are expressed,rowings was retired during the year, including underthe ArticlesofAgreement, in U.S. dollarsboth debt maturities and sinking-fund and of the weight and fineness in effect on July 1,1944purchase-fund operations. (1944 dollars). Until 1971, the current U.S. dollar
At June 3(1. 1981, outstanding obligations of had the same value as the 1944 dollar and thethe Bank amounted to $27,797.8 million. These SDR, which was instituted in 1969. In 1972, theobligations were denominated in 17 different current dollar value of the 1944 dollar and thecurrencies and were placed with investors, SDR increased to S1.08571. and in 1973 toincluding central banks and government institu- S1.20635, as the result of devaluations of thetions, in more than a hundred countries. A sum- dollar. Until mid 1974, both the 1944 dollar andmary classification of outstanding borrowings by the SDR continued to be valued in gold and hadprincipal source at June 30, 1981, is as follows: the same gold value. Thus on July 1, 1974, the

Wor d Bank Borrowings, Fisca Year 1981 87
World Bank Borrowings, Fiscal Year 1981(In millons.)
(urrecris of US dollarIssue issue equivalents
Public OfferingsGermany 8'% ten-year bonds, due 1990 DM 71(0.i) $ 398. 1
9.25%./s ten-vear bonds. due 1991 DM 251).() 128.710% ten-year bonds, due 1991 DM 1511.11 68.7
Japan 8.601% liftcen-scar bonds, due 1995 Y 30,0()0(.0 138.6820% fifteen-vear bonds, duc 1996 Y 3.00(.()0.0 142.2
Netherlands 11.25% ten-vear bonds, due 1987/91 i'. 2()0.1) 84.9Switzerland 6%.''( ten-vear bonds. due 1991) SwF 10().() 61.1)
6C% ten-vwar bonds, due 1991 SwF 1()().() 54.97% nine-year bonds, duc 19911 SwF 1()().() 52.37.375% ten-year bonds, due 1991 SwF 1()1).() 49.2
United Kingdom 13.511% fivc-year stock. due 1986 £ 1()().() 215.8Eurobond Market 14.375%s five-vear notes, due 19S6 S 5()(1.(1 50().0
8.75% ten-year bonds, due 1991 Y 201.10)0.10 98.(112%xi five-year notes, due 1986 f. 1()().() 41.1
Total Publie Offerings 52.033.5
Placements
with Central Banks and GovernmentsGermany 8.30c/e notes, due 1985 DM 151.8 5 87.4
9.80%) notes, due 1986 DM 250.1) 129.5Japan 8.50% yen obligations, due 1987 V 34,()()0.0) 163.9
8.14% yen obligations, due 1987 Y 30,00)0.0 139.1Other 7.75% seven-year notes, due 1987 DM 11)0.0 56.8
7% five-year notes, due 1986 SwF 2(0(0.0) 1(0(0.77.125% ten-year notes, due 1991 SwF 100.11 48.98% five-year notes. due 1986 SwF 45.1) 22.08°k five-vear notes, due 1986 SwF 35.1) 17.211.50%lc five-year bonds. due 1986 f. 20(0.0 83.911.50% five-year notes, due 1986 f. 1()(.( 42.08.50%.c five-vear bonds. due 1986 Y L(1,1)(10.0 44.5
International' 10.17% two-year bonds, due 1982 $ 299.0 299.(14% two-year bonds, due 1983 $ 294.9 294.95.875% four-vear notes. due 1984 SwF 200().0 122.96.875% three-year notes, due 1984 SwF 151.8 76.4
Total Placements with Central Banks and Governments $1,729.1
OtherGermany 8.125% loan, due 1990 DM 140.1) $ 8(.1
8.125% loan, due 1995 DM 11.0( 5.77.75% notes, due 1988 DM 200.0 114.28.10% loan, due 1992 DM 200.0 113.58.10% loan, due 1992 DM 200.0) 113.58% notes, due 1990 DM 150.0 84.58.25% loan, due 1986/90 DM 100.0 56.3
Japan 8.90% loan. due 1995/2(0()0 Y 40,000.0 183.68.90% loan, due 1996/20(01 Y 2(0,0()0.0 91.88.90% loan, due 1994/2001 Y 10.(00.0 44.58.70% loan, due 1991/1996 y 1(,1()().( 44.4
Switzerland 5.875°.'c notes, due 1987 SwF 15().() 94.56% loan, due 1986 SwF 200.0 120.76% notes, due 1985 SwF 2()0.0 115.67.25% notes, due 1986 SwF 5().() 26.2
Total of Other Placements $1,289.1
Add: Interest Subsidy Fund 8.50% loan, due 1977/2001 17.1
Total Borrowings, Fiscal 1981 $5,068.8
-Based on official rates at the time of borrowing.1Thiese short-term bond issues were placed with central banks, government agencies, and with international organizations.

88 Borrowings and Finance
value of the SDR. expressed in U .S. dollars, was imately $40,00( million. The r esolution providesS1.20635, which was the equivalent of one 1944 that the paid-in portion of the shares authorizeddollar. to be subscribed under it will he 7.5 percent; the
Since July 1. 1974, when a method of valuing paid-in portion of existing capital stock is 10 per-the SDR that was based on a number of major cent. Subscribing members will be required tocurrencies was adopted. the value of the SDR pay 0.75 percent of the subscription price in goldhas fluctuated daily. The current-dollar value of or U.S. dollars and 6.75 percent in their respec-the 1944 dollar, on the other hand. was deemed tive currencies. The Governors also adopted ato remain fixed at the rate established by the resolution that increases the authorized capitalU.S. par value legislation of 1973. stock by an additional 33,500 shares-represent-
Since April 1, 1978, when the Second Amend- ing a further increase of approximatelv $4,000ment to the Articles of Agreement of the Inter- million-and that authorizes each member tonational Monetary Fund (IMF) took effect, subscribe to 250 shares of this additional capital,currencies no longer have par values, and the none of which will be paid in. Subscriptionsbasis for translating the 1944 dollar into current authorized by these resolutions will be acceptedU.S. dollars no longer exists. after September 30, 1981.
For purposes of the financial statements, theBank has expressed the value of its capital stock Finances: IDAon the basis of the SDR in U.S. dollars as com-puted bv the IMF on June 30, 1981 ($1.15060 per The International Development AssociationSDR). (IDA) held a total of S23,842 million in credits
The subscribed capital of the Bank was on June 30, 1981, including $2,226 millionincreased by SDR 1.650.3 million in fiscal 1981. approved but not yet effective. Of the $21,616bringing the total of subscribed capital to SDR million of effective credits. S8,740 million was31,822.1 million as of June 30, 1981. The undisbursed at the end of the vear.increases in subscriptions during the vear came Total disbursements in fiscal 1981 were $1,878from the following countries: million; the fiscal 1980 totai was S1.411 million.
As of June 30, 1981, cumulative disbursementsby IDA were $13,076 million. The total
Increases in Subscriptions to the Bank's resources provided to IDA increased S1,684Subscribed Capital million during the period, primarily from
Barbados 2.8 million SDR advance contributions to the Sixth Replenish-Bolivia 5.4 million SDR ment, which totaled $2,187 million equivalent asBrazil 166.8 million SDR of June 30,1981. The value of resources providedChina 450.0 million .SDR by members in earlier fiscal years decreased byDjibouti 3.1 million SDR S981 million, mostly as a result of currencyDominica 1.6 million SDR depreciations. The World Bank granted $118Finland 17.3 million SDR million to IDA from its fiscal 1980 net income, ofGuatemala 4.4 million SDR which $98 million was for the general purposes ofItalv 159.5 million SDR the Association and $20 million was for grants byKuwait 250.9 million SDR IDA for agricultural research and control ofMalavsia 47.9 million SDR onchocerciasis and other tropical diseases.Mauritius 3.3 million SDR The total of other resources that becameMorocco 26.0 million SDR available to IDA during the fiscal year was $92New Zealand 4.0 million SDR million; these were derived from releases by PartParaguay 1.0 million SDR II countries and cancellations of and repaymentsPeru 20.3 million SDR on credits. For further information, see 'IDASeychelles 1.1 million SDR Appendices: Financial Statements."Spain 118.0 million SDRSri Lanka 13.4 million SDR Foreign and International Bonds:Lnited States 271.8 million SDR Calendar 1980Zimbabwe 81.7 million SDR alendar 1980
Fluctuating interest rates in the United StatesTotal 1,650.3 million SDR and in the Eurodollar markct and associated
movements in exchange ratcs were the maincauses of the unstable conditions that prevailed
On Januarv 4. 1980, the Board of Governors of in the bond markets durin- i980.the Bank adopted a resolution that increases the Total borrowing in the forcign and interna-authorized capital stock of the Bank by 331,500 tional bond markets durinn 198(0 was $38,259shares: this represents an increase of approx- million, somewhat higther than the $37,764

Foreign and International Bonds: Calendar 1980 89
Borrowing in International Capital Markets(US$ millions. Calendar vears.)
1979 198(1 1981,(P)
Foreign Foreign Foreignand inter- Euro- and inter- Earo- and inter- Euro-national cairrencv national currencv national currencybonds crcdits Total bonds credits Total bonds credits Total
Industrialized countries 24,554.2 19,041.8 43,596.0 26.269.4 29,867.8 56.137.2 14,134.0) 12,458.4 26.592.4Developing countries 4,014.5 46,255.2 50,269.7 2,867.5 37,673.0 411,540.5 1,579.3 19,181.0 20,760.3
Oil-exporting' (14.7) (811.0) (825.7) (-) (407.7) (407.7) (-) (149.6) (149.6)Middle-income (3,929.1) (41,095.4) (45,024.5) (2,791.7) (35,414.0) (38,2115.7) (1.532.8) (17.436.9) (18,969.7)Loss-income (711.7) (4.348.8) (4.419.5) (75.8) (1,851.3) (1,927.1) (46.5) (1,594.5) (1.641.0)Other developing (-1 (-) (-) (-1 (-) (-1 (-1 (-) (-
Centrally plannedcountries andorganizations 48.1 4,456.2 4.504.3 50.0 2,097 2 2,147.2 - 1,135.0 1,135.01
Internationalorganizations 8.670.4 310.0 8,980.4 8.876.8 530.4 9,407.2 3.687.9 - 3,687.9
Others 477.3 186.2 663.5 195.4 218.0 413.4 157.4 - 157.4
Total 37,764.5 70,249.4 108,013.9 38,259.1 70,386.4 108,645.5 19,558.6 32,774.4 52,333.0
First six months onlv.Oil-exporting countries include the following capital-surplus countries: Kunait, Libva, Oman, Qatar. Saudi Arabia, and theUnited Arab Emirates.
P Preltmiisary.
million raised in 1979.' Borrowing in the foreign tial offering yield for public offerings bybond markets declined from $19,965 million in industrial countries was 12.8 percent.1979 to $15,753 million in 1980 because of adecrease in activity in the Swiss and Japanese The Swiss Market. Foreign bonds issued in thecapital markets. International bonds, on the Swiss capital market totaled $7,441 million. 22other hand, increased during the same period percent less than the $9,517 million borrowedfrom $ 17,799 million in 1979 to $22,506 million in during 1979. About three fourths of total issues1980, primarily because of an increase in the in the Swiss market, $5,526 million, were raiseddollar-denominated sector of the market. by industrial countries. Japanese borrowers,
who raised $1,935 million, were the most active.Foreign Bonds. The total of foreign bonds About three fourths of all issues by Japanese
issued during 1980 was $15,753 million, 21 per- borrowers were private placements. Largecent less than the $19,965 million raised in 1979. amounts were also raised by borrowers fromTotal public offerings were $9,011 million and Austria ($884 million), Sweden (S493 million),private placements were $6,742 million. About Norway ($359 million), and France ($33455 percent of all foreign bonds, $8,700 million, million). Developing countries raised $517were issued by industrial countries, while million, of which $218 million was secured bydeveloping countries raised $1,205 million (8 Spain, $156 million by South Africa, $50 millionpercent), international organizations $5,797 by Argentina. $23 million by Morocco, and $12million (37 percent), and borrowers unallocated million each by Costa Rica and Yugoslavia.by country, $51 million (less than 1 percent). International organizations borrowed $1,344
million, of which $725 million was raised by the
7he U.S. Market. The total of foreign bonds World Bank and S259 million by the Europeanissued in the United States was $2,637 million. Investment Bank. The average initial offeringAbout two thirds of total borrowing in the yield on public offerings was 5.68 percent forUnited States market, $1,705 million, was com- industrial countries.pleted bv industrial countries. Canadian bor-rowers raised S1,220 million, while Swedish The Japanese Market. A total of $1,616 millionborrowers raised $485 million. Developing was raised in the Japanese capital markets duringcountries raised $382 million, of which $326 1980; the figure in 1979 was $3,055 million. Themillion was secured by Israel and S56 million by twelve issues completed were raised by theMexico. The European Investment Bank andthe Inter-American Development Bank werethe only two international organizations to bor-row in the U.S. market; they raised $450 million I The termsforeign and international in this contest refer to issues
sold outside the countr i of the borroiwer-foreign if sold in oneand $100 million, respectively. The average ini- national mnarket, international if sold in more than one.
90 Borrow[ngs and Finance
World Bank ($708 million), Sweden ($119 raised in 1979 had been $2,831 million. The mostmillion), France ($96 million), the Asian active borrowers were the World Bank ($1,493Development Bank ($95 million), Brazil ($92 million), the European Investment Bank ($736million), Argentina ($89 million), Canada ($84 million), and the European Coal and Steel Com-million), Finland ($82 million), the European munity ($532 million); other borrowers includedInvestment Bank ($70 million). Ireland ($70 the European Economic Community ($191million), Spain ($66 million), and Thailand ($46 million), the Asian Development Bank (S107million). million), and the Nordic Investment Bank ($20
million).The Germnan Market. The total of foreign The Nordic Investment Bank brought into
bonds issued in the German capital markets dur- being the Eurokrone bond market when iting 1980 was S3.496 million, up from $1,834 launched an international bond issue of NKr 80million in 1979. The principal borrowers were million in January 1980. A further issue forthe World Bank (S1,756 million), the European NKr 20 million was made in February 1980.Investment Bank ($742 million), Australia ($221 The volume of international bonds denomi-million), Sweden (S164 million), and the Euro- nated in United States dollars increased frompean Coal and Steel Community ($162 million). $10,615 million in 1979 to $13,664 million in 1980.Early in November, in a move to stem the capi- Because of high short-term interest rates in thetal-account outflow that accompanied the coun- United States at the beginning and end of thetry's growing deficit in current accounts, German vear, however, there was a noticeable decrease inbanks agreed to hold back temporarily on their new straight Eurodollar bond offerings duringlong-term lending to foreign borrowers. This these periods. Around the middle of the year,agreement supplemented the moratorium on nevertheless, there was a swift recovery in thisnew foreign bond issues in deutsche mark, after market. The change in sentiment was broughta rapid deterioration in the market caused by the about as short-term interest rates declined fromrise in U.S. interest rates and the weakness of the their previous high of 20 percent to the 13 per-mark. cent to 14 percent range. There was a boom in
new issues in floating-rate notes in 1980. This wasOther National Markets. During 1980 foreign the result of the disarrav in the fixed-rate dollar
bonds were also issued in the capital markets of markets and a general reluctance to enter intothe United Kingdom (S178 million), Luxem- long-term contracts with uncertainty attribut-bourg ($159 million), France ($94 million), able to the persistent high rate of inflation. TheAustria ($81 million), and the Netherlands (831 total of floating-rate notes issued by industrialmillion). countries was $3,370 million. Spreads for these
Original maturities of foreign bonds were con- countries ranged from the average of the three-centrated in the over seven- to ten-year range month London bid-and-offered rates to 0.25 per-($6,200 million), the three- to five-year range cent higher than the London Interbank Offered($3,282 million), and the five- to seven-year Rate (LIBOR) and original maturities from tworange ($3,004 million), to fifteen years. The total of floating-rate notes
issued by developing countries was $807 million.Spreads were from 0.25 percent to 0.875 percent
International Bonds. The total of interna- higher than LIBOR and original maturities weretional bonds issued during 1980 was $22,506 from five to ten years. The average initial offer-million, 26 percent more than the $17,799 ing yield on straight dollar-denominated publicmillion raised in 1979. offerings by industrial countries during 1980 was
Seventy-eight percent of all international 11.50 percent.bonds ($17,570 million) were issued bv industrial During 1980, the total of international bondscountries. The largest amounts were raised by denominated in deutsche mark was $4,254borrowers from the United States ($4,307 million, 9 percent less than the $4,654 millionmillion), France ($1,933 million), Japan ($1,746 issued in 1979. The largest amounts were raisedmillion), and Canada ($1,380 million). by borrowers from Austria ($710 million), Japan
Total borrowing by developing countries dur- ($538 million), and Sweden (S434 million). Theing 1980 amounted to $1,662 million, 17 percent average initial offering yield on public offeringsless than the S1,989 million raised in 1979. Eigh- denominated in deutsche mark by industrialteen developing countries raised funds during countries was 8.07 percent.the year; the largest amounts were obtained by Other currencies used in the internationalborrowers from Mexico ($265 million), Brazil market during 1980 were the Australian dollar(S224 million), and South Africa ($215 million). ($50 million), the Austrian schilling (8235
A total of S3,080 million was raised by six million), the Canadian dollar ($270 million), theinternational organizations in 1980; the amount French franc ($968 million), the Japanese yen

Syndicated Eurocurrency Calendar 1980 91
($416 million), the Kuwaiti dinar ($26 million), The distribution of Eurocredits between pri-the Luxembourg franc ($61 million), the Nether- vate and public sectors within industrial andlands guilder ($1,038 million), the Norwegian developing countries showed a oreater con-krone (S100 million), the British pound sterling centration in the public sector, albeit in varying($1,089 million), the Swiss franc ($236 million), proportions-60 percent in developing countriesthe European unit of account ($80 million), and and 55 percent in industrial countries. The pri-the special drawing right ($20 million). vate nonfinancial institutions accounted for 45
Original maturities of international bonds in percent of total credits in industrial countries1980 were concentrated in the seven- to ten-year and 21 percent in developing countries.range ($6,500 million) and in the five- to seven- The economic situation during 198(0 wasyear range ($5,650 million). marked by growing severity of the problems
faced by developing countries, principally thosethat are not exporters of oil. As interest rates
Syndicated Eurocurrency Credits: climbed, debt-service obligations also increased,Calendar 1980 compounding the balance-of-pavments
Publicized Eurocurrency credits amounted to difficulties caused bv high energy-import bills$70,386 million in 1980, a marginal increase from and reduced exports to industrial countries,the $70,249 million raised in 1979. whose own economies were beset bv recession
Although developing countries accounted for and wide balance-of-payments deficits.54 percent of the total, borrowing bv these coun- This situation was also of significant concerntries dropped 19 percent from last year's level. to bankers, whose lending behavior depicted theThe share of the industrial countries increased so-called flight into quality. The preference forfrom 27 percent in 1979 to 42 percent in 1980, and lending to the more creditworthy borrowersthese countries raised 57 percent ($10,826 brought into being a two-tiered market struc-million) more during the vear. Countries with ture, in which there was a borrowers' market forcentrally planned economies reduced their bor- prime debtors, most of them industrial coun-rowing 53 percent. tries, and a lenders' market for less creditworthy
Despite the increased requirements of the debtors. most of them developing countries thatdeveloping countries for external funding during do not export oil. Accordingly, two divergentthe year because of larger interest payments and sets of spreads were applied.deteriorating current accounts, the decline in The conditions upon which developing coun-their borrowing in the medium-term Eurocredit tries could borrow deteriorated as the yearmarket indicates the possibility that alternative progressed. Although average spreads increasedsources of financing were used. These include only slightly throughout the first three quar-privately arranged bank loans, short-term bor- ters-from 0.79 percent during the first quar-rowing, drawdown of international reserves, and ter-the average jumped to 1.04 percent in thepreviously arranged lines of credit. Among the final quarter. Average maturities shortened fromdeterrents to a high level of financing through 9.4 years during the first quarter to 8.1 yearsthe Eurocredit market were higher interest during the final quarter.rates, especially with the U.S. prime rate rising For industrial countries average spreads didto a peak of 21.5 percent, and generally stricter not vary substantially throughout the year; theconditions imposed upon most lending to increase was from 0.56 percent during the firstdeveloping countries that are not exporters of quarter to 0.57 percent during the final quarter.oil. Average maturities declined from 8.6 vears dur-
Countries with centrally planned economies ing the first quarter to 7.6 years in the fourthfaced not only economic problems but also quarter.political conditions that intensified the wariness Although the LIBOR has predominated asof international bankers in lending to them. the base upon which a spread is added to deter-
Activity among borrowers in the Eurocur- mine the interest on syndicated Eurocurrencyrency credit market was concentrated to a signifi- credits, the U.S. prime rate has had a growingcant degree among a relatively small group of influence on the pricing of Eurocredits.active participants. The ten largest borrowers,2
for example, accounted for 57 percent of all theEurocredits arranged during the year. The tenmost active borrowers among the industrialcountries' accounted for 91 percent of the United States, Italv, Mexico, Brazil. Spain. Canada. Venezuela.
$29,868 million raised by these countries. Of the Belgium, Argentina, and France.
$37,673 million raised by developing countries, 3 United States. Italy, Canada, Belgium, France. Australia, Den-mark, Sweden. Finland, and United Kingdom.
69 percent was accounted for by the ten largest Mexico. Brazil. Spain, Venezuela, Argentina, Korea.
borrowers.4 Yugoslavia, Greece, the Philippines. and Indonesia.

92 Borrow ngs and Finance
Unlike banks that must raise funds in the Syndicated Eurocurrencv Credits:Eurodollar market. banks that have deposit First Half, 1981bases in the United States have access to funds at A total of $32,774 million was raised in thea considerably lower cost. It is thus possible that Eurocurrency credit market during the first sixthe U.S. prime rate could provide a comfortable months of 1981. Industrialized countriesprofit margin to these banks. While loans based accounted for $12,458 million, developing coun-on the U.S. prime rate might offer an economic tries $19,181 million, and centrally plannedadvantage to some bankers, borrowers who economies $1,135 million. The aggregate level ofchose this rate over LIBOR might find that they borrowing during the first six months increasedwere payinginterest at a higher rate, evenit they by 13.2 percent over the comparable period inreceived the usual reduction of 0.125 percent in 1980. Industrialized and developing countriesspread from the U.S. prime rate. Historically the increased their borrowing bv 19.9 percent andU.S. prime rate has often been higher than .U.S. prme rat has ofen bee hgetan 15.1 percent, respectively, while centrally plan-LIBOR; consequently the reduction in spread ned economies decreased their borrowing byon the prime-based loan is in fact merely cosmet- 10.4 percent.ic. Actual costs of a prime-based loan could be The most active borrowers among thehigher, especially when the differential between most countries anceLIBOR and the U.S. prime rate widens. At one industrialzed countries (Italy, France,point in December. for example, when the U.S. Australia, Sweden, and the United States) andprime rate stood between 20 and 21.5 percent thedevelopingcountries(Spain.Mexico,Brazil,the six-month LIBOR was 17.25 percent. Argentina, and Nigeria) each raised more than
During the second half of 1980 several $1,000 million and accounted for 56 percent ofL_ ~~~~~~~~~~the total raised.
"jumbo" loans were arranged. Among them was Final ised.the $3,000 million credit package for Joseph E. dFuiancing fi the Eurocurrency credit marketsSeagram and Sons, Inc., which consisted of a during the first half of 1981 was characterized bylimited recourse facility of $1,625 million and a eclining spreads for several developing coun-revolving credit of $1,380 million. Both tranches tries, the introduction of SDR-denominated syn-carried a spread of 0.5 percent, with maturities dicated credits, the continued presence of the
carie a prad f .5 erent wthmaturities LIBOR/U.S. prime rate loan-pricing option,ranging from five and a half years to nine vears.The proceeds were to be used to finance the and the completon of several ;jumbo" loans.firm's takeover plans. The Province of Quebec During the first and second quarters of 1981,also signed a credit of $1,000 million, with an spreads on developing countries' Eurocredits0.375 percent to 0.5 percent split spread over ten averaged 0.72 percent and 1.09 percent, respec-years. One of the largest loans arranged for a tively. Actual spreads varied widely among thedeveloping country was the $1,800 million developing-country borrowers. Atone extreme,Eurocredit to the Republic of Venezuela. The Brazilian private banks' external financingproceeds were intended for consolidation of (Resolution 63 loans) carried margins of 2.25short-term debt. The loan carried a seven-year percent over LIBOR. At the other, some Asianmaturitv and a split margin of 0.625 percent and borrowers obtained significantly finer terms on0.75 percent. their loans. India's National Aluminum Com-
Zimbabwe initiated its entry into the Eurocur- pany's $680 million, ten-year credit at an 0.5rency credit market with an $11 million credit for percent-0.625 percent split spread over LIBORthe Air Zimbabwe Corporation and a $17.6 was followed by the Oil and Natural Gas Com-million loan for the National Railwavs Corpora- mission's $200 million, seven-year credit that car-tion of Zimbabwe. Both loans carried five-year ried an 0.375 percent-0.5 percent split marginmaturities and split margins of 1.125 percent and over LIBOR. Other borrowers in the region that1.25 percent and the guarantee of the Republic. were able to obtain similar spreads included the
The Eurocurrencv credit market seems likelv Federation of Malaysia ($300 million, ten years,to remain an important, although relatively cost- 0.375 percent-0.5 percent split margin), Bankly, source of financing for developing countries. Indonesia ($400 million, ten years, 0.5 per-Many countries will need to reduce their depen- cent-0.625 percent split spread), and thedence on energv imports and improve economic Kingdom of Thailand ($55 million, eight years,growth in addition to meeting their high debt- 0.5 percent-0.625 percent split margin). Coun-service obligations and bolstering their reserve tries outside Asia. such as Greece and Portugal,positions. Achievement of these ends will also saw an improvement of credit conditions onrequire development financing that will generate their Eurocredits.export earnings and improve domestic produc- These fine terms are similar to those obtainedtion of energy, which means a further recourse to by many borrowers from industrialized coun-the international capital markets. tries. The improvement in credit conditions in

Foreign and International Bonds: First Half, 1981 93
the Far East region has been attributed to a high second half of 1980. Borrowing in the foreignlevel of liquidity and competition. bond market increased from $7,930 million in
Several tax-spared loans were launched by the first half of 1980 to $8,212 million during thedeveloping countries. These included Malaysian same period in 1981. Similarly, borrowing in theAirline System's $30 million, ten-vear credit international capital markets increased frompriced at LIBOR (no spread), Cyprus Develop- $10,935 million in the first six months of 1980 toment Bank's $15 million, eight-year credit (0.25 $11,347 million during the first half of 1981.percent over LIBOR), and the Federation of Foreign Bonds. Foreign bonds issued in theMalaysia's $150 million, ten-year credit (0.03125 U.S. market during the first half of 1981 totaledpercent over LIBOR). $1,150 million. Borrowers from Canada were the
Average spreads on industrialized countries' most active, raising $850 million. Other bor-borrowing during the first and second quarters of rowers were from Sweden ($200 million) and1981 were 0.89 percent and 0.46 percent, respec- from Venezuela ($100 million).tively. The first quarter average was affected by Foreign bonds issued in Switzerlandthe $1,400 million project-financing loan for amounted to $3,868 million, or 47 percent of allWoodside Petroleum (Australia), which carried foreign bonds. Borrowers from industrializedspreads ranging from 1.25 percent to 1.875 per- countries raised $3,120 million, or 81 percent ofcent over a period of twelve years. Most of the all foreign bonds issued in Switzerland. TheFrench Eurocredits included an 0.25 percent largest amounts were secured bv borrowers fromspread, the lowest available on any Eurocredit. Japan ($1,044 million), Austria ($466 million),
The Kingdom of Sweden's SDR 500 million and France ($321 million).credit marked the introduction of the SDR- Borrowing in the Japanese capital marketsdenominated Eurocredits. This was followed by totaled $1,316 million. The largest amounts wereother SDR-denominated credits for Ivory Coast raised by borrowers from New Zealand ($165($50 million equivalent) and the Republic of Ire- million), France ($139 million), and Australialand ($90 million equivalent). ($126 million).
There continues to be an availability of the Foreign bonds were also issued in theseLIBOR/U.S. prime rate option as the basis of national markets: Germany ($687 million),loan pricing. Aside from being able to obtain a United Kingdom ($683 million), the Nether-spread over the U.S. prime rate that is usually lands ($175 million), Nigeria ($145 million), Lux-0.125 percent lower than a comparable one over embourg ($102 million), and Libya ($86 million).LIBOR, borrowers use this option to draw theparticipation of U.S. regional banks. Many bor- International Bonds. Over 70 percent of allrowers, including those from Chile, Mexico, and international bonds ($8,627 million) were issuedSpain, have been offering the LIBOR/U.S. by borrowers from industrialized countries. Bor-prime rate pricing option on their Eurocredits. rowers from the United States ($2,371 million).
Several "jumbo" loans were signed during the Canada ($1,889 million), France ($1,278first six months. Aside from the Woodside million), and Japan ($979 million) were the mostPetroleum $1,400 million loan, there were: active.Electricite de France's $1,200 million, ten-year Developing countries raised $1,027 million instand-by facility (0.5 percent-0.375 percent split the international capital markets during the firstmargin over LIBOR), the Kingdom of Sweden's half of 1981, or 42 percent above the $722 million$1,400 million loan package ($800 million and borrowed during the equivalent period in 1980.SDR 500 million, both of which carried an 0.375 Eight developing countries obtained funds; thepercent-0.5 percent split margin), and Italv's largest amounts were secured by borrowers fromCassa per il Mezzogiorno $1,000 million "earth- Mexico ($735 million) and Spain ($100 million).quake" loan' (ten years, 0.375 percent-0.5 per- International organizations borrowed $1,662cent split spread over LIBOR or 0.25 per- million in the first six months of 1981. The largestcent-0.375 percent over the U.S. prime rate). amounts were raised by the World Bank ($1,018
million) and the European Investment Bank($277 million).
Foreign and International Bonds: Eighty-two percent ($9,342 million) of allFirst Half, 1981 international bonds were denominated in U.S.
During the first half of 1981, borrowing in the dollars. This contrasts sharply with the last halfforeign and international bond markets totaled$19,559 million, a figure above the $18,865million raised in the first half of 1980 and also 5 To financc reconstruction work following the Novemher 1980
above the $19,394 million raised during the earthquakes.

94 Borrowings and Finance
of 1980. when U.S. dollar-denominated bonds million), the Japanese yen (i`167 million), theamounted to S6,788 million or 60 percent of all Euro composite unit ($97 million), the Swissinternational bonds. franc ($79 million), the Singapore dollar ($70
Other currencies used in the international million), the deutsche mark (S69 million), themarket during the first six months of 1981 were: Canadian dollar ($41 million). the European unitthe French franc ($517 million), the pound ster- of account ($40 million), the Norwegian kroneling ($326 million), the Netherlands guilder ($36 million), the Kuwaitl dinar ($26 million),(S309 million), the special drawing right (S206 and the Luxembourg franc (S22 million).
95
Chapter SixExecutive Directors
Executive Directors In fiscal 1981, the Executive Directors met onseventy-one occasions in formal session, during
Although the growing volume and complexity which they reviewed and approved 140 Bankof Bank operations have necessarily been loans totaling $8,809 million and 106 IDA creditsaccompanied bv detailed consideration and totaling $3,482 million. Thev also approved adetermination of an increasing number of policy Bank loan of $100 million to the IFC. The Direc-matters in recent years. the Articles of Agree- tors approved Bank borrowings of S6,100ment are general enough to give the Executive million. Also reviewed and approved were 20Directors sufficient flexibility to adjust Bank grants for international agricultural research, apolicies to the realities of a changing world. grant for the control of onchocerciasis in
With the exception of certain powers specif- Western Africa, and a grant to further the workicallv reserved to them by the Articles of Agree- of the Special Programme on Research andment., the Governors have delegated their Training in Tropical Diseases.powers for the conduct of the general operations There was general recognition by the Execu-of the Bank to a Board of Executive Directors tive Directors that the external financial require-that performs its duties on a full-time basis at the ments of the developing countries during theBank's headquarters. There are twenty-one fiscal years 1981-85 had changed since the for-Executive Directors: as provided for in the Arti- mulation of the "Future Role of the Bank" papercles of Agreement. five are appointed by the five in 1977, because of such factors as higher-than-members having the largest number of shares of expected rates of inflation, the substantialcapital stock and the rest are elected by the increase in the rates of return on domestic pro-Governors representingthe othermembers. The duction of energy in the oil-importing develop-President of the Bank is Chairman of the Board. ing countries, the addition of structural-adjust-
ment lending, and the representation of ChinaThe Executive Directors fulfill dual respon- by the People's Republic of China. In view of the
sibilities. They represent their constituents' complexitv and importance of the subject mat-interestsand concernsto the Board and manage- ter, they considered earlv in the fiscal year ament when determining policy or considering report from the President on energy in theindividual projects, as well as the interests and developing countries; they agreed that theconcerns of the Bank to the country or countries developing countries required additional techni-that appointed or elected them. The Directors, cal and financial assistance for energy invest-therefore, act as a two-way channel of com- ments, and they endorsed the proposal to studymunication between the Bank and the member the feasibility of providing additional financingcountries. Since the Bank operates on the basis for energy development in the developing coun-of a philosophy of consensus (formal votes are tries through an energy affiliate. It was alsorare), this dual role involves frequent com- agreed that the report would be published in amunication and consultations with governments suitable form. Separatelv. they approvedso as to reflect accurately their views in Board arrangements with the United Nations Develop-discussions. ment Programme for the financing of energy-
Policy is decided by the Executive Directors sector assessments in developing countries.within the framework of the Articles of Agree- Before the end of the fiscal year, the Directorsment. The Directors consider and decide on the had considered a further report from the Presi-loan and credit proposals made by the President. dent and agreed that discussions should be con-They are also responsible for presentation to the tinued on the Bank's program to expand theBoard of Governors at its Annual Meetings of an production of energy in the oil-importingaudit of accounts, an administrative budget. the developing countries and on ways by which thoseAnnual Report on the operations and policies of countries' requirements for capital might bethe World Bank, and anv other matter that, in financed. ( For further details, see page 67.)their judgment, requires submission to the In their examination of possible expansion ofBoard of Governors. Matters may be submitted lending by the Bank and IDA beyond the levelsto the Governors at the Annual Meetings or at now planned for fiscal years 1982-86 and theany timne between Annual Meetings. means of financing such expansion, the Direc-

96 Executive Directors
tors concluded that, because of the severity of agreements that were necessary to cover the cur-the financial problems facing the developing rency pooling system; grace periods and finalcountries, especially the poorest countries, there maturities on loans in fiscal 1980 and 1981 andwas a need for enlarged financial intermediation new amortization periods for engineering loansand that the Bank should take part in this pro- and credits; and an innovative arrangement withcess of intermediation. They also discussed the the Asian Development Bank (AsDB) for proj-policy issues that affect the basis for allocating ect cofinancing based on appraisal reports pre-the lending program of the Bank and IDA pared bv the AsDB.among member countries, according to per Major policy decisions that the Executivecapita income levels, sectors, and geographic Directors make annually, or more frequently asareas, separately from the annual review of the necessary, include those concerning the Bank'sBank's financial and operating programs. The lending rate, allocation of its net income, staffDirectors authorized IDA to accept advance compensation, and the research program.contributions from governments in order to Following the approval by the Board of Gover-assure that it will have commitment authority nors of the establishment of a World Bankpending the effectiveness of the Sixth Replenish- Administrative Tribunal to adjudicate staffment, which provides for $12,000 million grievances, the Directors approved the appoint-equivalent in additional funds to IDA, and ment of the candidates for members of the Tribu-which will be used to assist development of high nal, effective July 1. 1980, when it came formallypriority in the poorest developing countries, into being.with commitment authority for the three-year In a general amendment of the By-Laws of theperiod Julv 1, 1980, to June 30, 1983. Bank and of IDA, the Executive Directors
Following their decision that the government approved draft reports and resolutions to theof the People's Republic of China represents Governors, who voted affirmatively.China in the Bank and its affiliates, the Execu- Annual reports with which the Directors dealttive Directors approved a supplement to the fis- had to do with project implementation andcal 1981 administrative expense budget to sup- supervision, the activities of the Joint Auditport the work program for China and a draft Committee, the financial statements of the Bankreport and resolution to the Governors, who and IDA, the Economic Development Institute,voted affirmatively to increase China's subscrip- and the Staff Retirement Plan.tion to the Bank's capital. In addition to formal, regular Board meet-
Another important policy action dealt with ings, the Directors meet as the Committee of theinterim procedures on the valuation of Bank Whole for discussion of certain matters prior tocapital subscriptions. Also, with respect to the their submission to the Board for formal action.invitation of observers to attend the Annual They also meet informally as frequently asMeetings of the Board of Governors, the Execu- required. Periodically, the Executive Directorstive Directors advised the Board of Governors hold seminars that permit more informal discus-that they would report to it at the earliest possi- sion than can take place at regular Board meet-ble date, pursuant to Board of Governors ings. Topics discussed included consulting ser-Resolution No. 359. vices, World Bank technical assistance, possible
Reaffirming the need for greater efforts to courses of action on valuation of Bank capitaldevelop research capacity in developing coun- subscriptions, and the World Developmenttries, they considered a sector policy paper on Report, 1980.agricultural research systems and generally As a result of the structural changes in theendorsed the approach of establishing in the working of the Development Committee, thedeveloping countries national agricultural involvement of the Executive Directors in theresearch institutes that would be linked to inter- determination of the Committee's work pro-national research institutes and agreed that the gram, and in its work generallv, has continued tosector paper should be disseminated widely. increase greatly. In July and August they
In a broad variety of specific operational discussed the World Development Report, 1980,policy measures, the Directors examined the staff papers on concessiorary assistance and onissues concerning the existing guidelines on the prospects for capital flows to developing coun-use of consultants by borrowers and the need for tries, a progress report on those of the Brandttheir revision. They approved an increase in the Commission proposals that are of relevance tocommitment authority of the Project Prepara- the Bank, and a progress report on items con-tion Facility of the Bank and IDA by $30.0 cerning the Bank from the Group of 24 Programmillion to $87.5 million; modifications of the of Immediate Action, and they agreed that theBank's General Conditions to facilitate new report should be submitted to the Developmenttechniques of borrowing and also modifications Committee for its September 1980 meeting inapplicable to loan agreements and guarantee Washington, D.C. In April 1981 they completed

Joint Audit Committee 97
the review of structural-adjustment lending that lished accountants to conduct the annual auditsthey had called for in their 1980 discussions, and of the Bank, IDA, and the IFC, assured itselfthey also considered documentation, including that the Bank was getting the best possible ser-the report on selected issues by the Task Force vices from its independent accountants,on Non-concessional Flows, for the meeting of discussed with them the scope of their examina-the Development Committee in May in Gabon. tion, and reviewed with them the annual auditedThe Directors participated in these meetings as financial statements and the opinions thereon.on previous occasions. In accordance with a In addition, through meetings with the Bank'sresolution adopted by the Governors of the senior financial officers, the Committee soughtBank and the International Monetary Fund at to ensure that the Bank's financial affairs arethe 1979 Annual Meetings. to again review the properly conducted.performance of the Committee and take such The Committee is also charged with theactions as they deemed appropriate, taking into responsibility of satisfying itself that the Bank'saccount the views and recommendations of the internal audit and operations evaluation are ade-Executive Boards of the Bank and the Fund quate and efficient. It therefore reviewed theexpressed by June 30, 1981, the Directors pre- work programs of the Internal Auditing andpared a report, jointly with Fund Directors, for Operations Evaluation Departments, the workconsideration and action by the Boards of in progress, desirable standards, and proceduresGovernors at the 1981 Annual Meetings. of reporting. Through a subcommittee, it gaveBudgets of the Committee are submitted to the special attention to Project Performance AuditExecutive Directors for approval. Reports to determine how well the Operations
During the year, the Executive Directors con- Evaluation Department carries out its assess-sidered the fifth annual report of the Director- ment of individual projects. The CommitteeGeneral, Operations Evaluation, the sixth itself reviewed most other papers produced byAnnual Review of Project Performance Audit the Operations Evaluation Department andResults," and the fiscal 1981-82 operations identified those giving rise to policy issues thatevaluation work program and manpower may be considered by the Executive Directors.budget. The Director-General, Operations The Committee decided to establish a secondEvaluation, is directly responsible to the Direc- subcommittee to examine a number of reports oftors and is outside the regular staff structure of the Internal Auditing Department.the Bank but is linked administratively to the Of continuing concern to the Committee is thePresident. They continued to support the adequacy of the flow of financial information toOperations Evaluation Department in its efforts the Executive Directors in order for the Board toto enlarge the involvement of borrowers in the discharge its responsibilities properly withevaluation process. respect to the financial policies of the Bank.
A list of the Executive Directors and Alter- Accordingly, the system for providing financialnate Executive Directors, showing their voting information to the Board is reviewed peri-powers and the countries they represent, with odically by the Committee.notations of changes since the last regular elec- The Committee provides a continuous chan-tion of Executive Directors, appears on page nel through which the internal and external audi-205. tors can communicate with the Executive
Directors should the need arise. It meets as fre-
Joint Audit Committee quently as necessary, normally once a month.During the year the membership of the Commit-
The Joint Audit Committee was established in tee was increased from six Executive Directors1970, essentially to represent the shareholders of to eight in order to meet the Committee'sthe Bank in maintaining vigilance over the expandingworkload.Membersareappointedbysoundness of the Bank's financial practices and the Board for a term of two years after eachprocedures. In pursuing its responsibilities dur- regular election of Executive Directors. Sinceing fiscal 1981, the Committee nominated a firm December 1980, Anthony IJ. A. Looijen hasof private, independent, internationally estab- served as Chairman of the Committee.


99
Projects Approved for Bank and IDAAssistancein Fiscal 1981, by Sector
Acronyms Used in This Section GTZ--German Technical AssistanceCorporation
ADAB-Australian Development Assistance IDB-Inter-American Development BankBureau IFAD-- International Fund for Agricultural
ADF-African Development Fund DevelopmentAfDB-African Development Bank IsDB-- Islamic Development BankAGCD--Belgium Administration for KFAED--Kuwait Fund for Arab Economic
Development Cooperation DevelopmentAsDB--Asian Development Bank KfW--Kreditanstalt fur WiederaufbauBADEA-Arab Bank for Economic LAFB Libyan Arab Foreign Bank
D)evelopment in Africa NMDC--INetherlands Minister forCCCE Caisse Centrale de Cooperation Development Cooperation
Economique ODA-Overseas DevelopmentCDB-Caribbean Development Bank Administration, United KingdomCDC-Commonwealth Development OECF-Overseas Economic Cooperation
Corporation FundCIIDA-Canadian International OPEC-Organization of Petrolcum-
D)evelopment Agency Exporting CountriesDANIDA Danish International SDC-Swiss Development Corporation
D)evelopment Agency SFD-Saudi Fund for DevelopmentEDF-European Development Fund SIDA--Swedish International DevelopmentEIB-European Investment Bank AuthorityFAC Fonds d'Aide et de Cooperation UNDP United Nations DevelopmentFAO-Food and Agriculture Organization Programme
of the United Nations USAID-United States Agency forFINNIDA-Finnish International International Development
I)evelopment Agency WFP-World Food Programme
Agriculture and Rural Development by providing improved extension, training,
BANGLADESH: IDA-$40 million. This and social services, the production of cottonagricultural credit project-including funds and food crops in Borgou province will befor the installation of tube wells, grain- expanded, increasing the incomes and raisingstorage facilities, equipment, technical the standards of living of some 39,000 farmassistance, and training-will help establish a families. Cofinancing ($14 million) is beingreplicable long-term credit delivery system provided by IFAD. Total cost: $37.8 million.and increase agricultural production, BRAZIL: Bank-$60 million. To assist theincomes, and employment opportunities in country's national agricultural researchrural areas. Total cost: $62.4 million. agency in expanding its current research
BANGLADESH: IDA $18 million. Some programs and to support several new180,000 farm families will benefit from the programs, funds will be provided to trainincrease in agricultural production and scientific manpower and upgrade existingincomes made possible through the research facilities. Technical assistance isdevelopment of hand irrigation from tube included. Total cost: $150.1 million.wells. The project will also ensure a safer BRAZIL: Bank-$56 million. About 60,000domestic water supply and encourage the farm families and more than 1,000 small-local manufacture of irrigation equipment. scale entrepreneurs will benefit from aTotal cost: $30.1 million. second rural development project in the
BENIN: IDA-$20 million. By strengthening northeastern state of Ceara that includesand supporting agricultural institutions and agricultural extension services, development

I1C Projects Approved, Bank and IDA, by Sector
of cooperatives, assistance to small CHILE: Bank-$36 million. A secondenterprises, construction of feeder roads, agricultural credit project will providemarketing facilities, and irrigation systems, investment credit and technical assistance toand education, health, and sanitation small and medium-sized farmers andservices. Cofinancing ($25 million) is being ranchers and to ninety agroindustrialprovided by IFAD. Total cost: $163.2 million. enterprises to help increase agricultural
BRAZIL: Bank-$29 million. The incomes of output and earnings and to improve thesome 11,300 poor families living in rural and living conditions of some 3.000 farmer andcoastal areas of the state of Piaui will be rancher families. Total cost: $90 million.improved through a project that includes the COLOMBIA: Bank-S37 million. The projectacquisition and allotment of 200,000 hectares will provide for the rehabilitation andfor redistribution, land tenure, agricultural maintenance of irrigation and drainageresearch and extension services, basic systems in eight districts covering 47,000education, marketing facilities, small-scale hectares. Productivity, employment, andirrigation schemes, fisheries, feeder roads, incomes will be increased on about 4,700and improved water-supply systems. Total farms, including nearly 1,500 that arecost: $84.4 million. farmed by beneficiaries of land reform.
BURMA: IDA-$32 million. The use and Technical assistance is included. Total cost:efficiency of the country's forests and forest $86.3 million.industries sector will be enhanced through CYPRUS: Bank $14 million. A four-yearthe modernization and rehabilitation of two development program for the horticulturalteak sawmills and two plywood mills, and viticultural subsectors, including farmallowing for increased production of wood development, processing and marketingproducts, such as furniture, teak veneer, and facilities, improved extension service andflooring products. About $17 million in research, and the establishment of an exportannual revenues will be generated. promotion facility, will bc tinanced. TotalCofinancing ($1.9 million) is being provided cost: $32.9 million.by FINN IDA. Total cost: $63.8 million. DOMINICAN REPUBLIC: Bank-$24
million. Cocoa and coffee farms, affected byBlURMA: IDA---$23 million. By providing new a hurricane in 1979, will be rehabilitated,
permanent storage facilities for rice, crops will be replanted, nurseries will berehabilitating existing facilities, and established, and technical assistance will beimproving pest control and transport services, provided to the Ministry of Agriculture andrice storage losses-valued at about $6.3 the Agricultural Bank in order to improvemillion anrnually will be reduced, the the productivity and incomes of small-scalequality of the rice will be improved, and producers whose output is mainly for export.annual foreign-exchange earnings may Total cost: $40 million.increase by about $7 million. lotal cost: ECUADOR: Bank--$20 million. TheS39.1I million, productivity, incomes, and general living
BURUNDI: IDA-$19.3 million. Some 28,000 conditions of some 10,000 poor rural familiesfarm families will benefit from a project that living in the western foothills of the Andeswill increase the production of coffee and will be improved through the financing offood crops through the provision of agricultural support services and through theagricultural extension services, afforestation regularization of land tenure, theand erosion-control measures, improved road construction and improvemnrt of rural roads,and water-supply networks, and the and the provision of potable water, primaryconstruction and equipping of six coffee- health-care services, and school facilities.washing stations and twelve hand pulping Total cost: $57.1 million.centers. Totai cost: $21.4 million. EGYPT, ARAB REPUBLIC OF: IDA-$80
CAMEROON: Bank-$25 million; million. About 4,000 low-income farmIDA-$12.5 million. The incomes of 163,000 families living in West Nubariya will benefitfarm families living in Northern province will from the reclamation of desert land,be increased through improved rural including irrigation and drainage works,infrastructure, effective extension and credit construction of economic and socialservices, training, and research. In addition, infrastructure, and provision of farmfinancial and technical assistance will be machinery, consultant services, and training.extended to local agencies to plan, monitor, In addition, a bilharzia control program willand evaluate a wide range of rural be supported. Cofinancing is being provideddevelopment activities. Total cost: $66 by the ADF ($10 million) and the WFPmillion. ($3.1 million). Total cost: $193 million.

Agriculture and Rurc Development 101
EGYPT, ARAB REPUBLIC OF: IDA-$14 cooperative warehouses and cold storage andmillion. The aim of the project-which marketing facilities in nine states. More thanincludes fish-farm facilities, housing for 3.2 million farm families are expected toworkers, facilities and equipment for training benefit. Total cost: $267 million.and collection of mullet fry, fish-marketing INDIA: IDA-$83 million. Two barrages willand project-preparation studies, and technical be constructed in Orissa state across theassistance-is to increase fish production, Mahanadi and Birupa rivers to ensure thethereby improving nutrition and reducing continued irrigation of 167,000 hectares.dependence on imports, and to improve the The income of farmers and the employmentincomes and job opportunities of the rural of agricultural laborers will thus bepopulation and contribute toward institution safeguarded. In addition, a drainage masterbuilding in the fisheries sector. Total cost: plan designed to improve water-management$26.3 million. practices throughout the Mahanadi delta
ETHIOPIA: IDA-$40 million. About 1.6 area is included. Total cost: $110.3 million.million farm families are expected to benefit INDIA: IDA $54 million. About 8,000 farmfrom a second agricultural "minimum families will benefit from the construction ofpackage" project, the aim of which is to 1 20 to 160 tank-irrigation schemes on 25,000increase the productivity and incomes of hectares in Karnataka state. In addition, thesmall farmers by providing fertilizer, government will be assisted in creating animproved seeds, and other agricultural inputs, improved hydrological data base, and a studyand through an expansion of soil and water of ways to make more efficient use ofconservation efforts and assistance to the irrigation water will be conducted. Total cost:Ministry of Agriculture. Cofinancing is being $77.4 million.provided by IFAD ($18 million) and SIDA INDIA: IDA-$37 million. Agricultural($900,000). Total cost: $77.2 million. extension services will be reorganized and
GUINEA: IDA-$17.5 million. Through a strengthened in thirty districts of Madhyalivestock development project including Pradesh state to increase crop production andvaccinations, provision of drugs, medicines, the incomes of some 3.8 million farmand mineral licks, and upgrading of the families. Total cost: $60 million.livestock husbandry and veterinary support INDIA: Bank-$30 million. The incomes ofservices-milk and meat production will be about 23,000 farm families and owners ofincreased, nutrition improved, and the livestock who live in the foothills of thestandard of living of cattle owners upgraded. Himalayas will be increased throughIn addition, a planning unit for livestock reforestation and soil-conservation measuresdevelopment will be established. Total cost: and the development of agricultural land in$21 million. five watershed areas. Technical assistance is
HAITI: IDA--$3.2 million. By providing included Total$28ost:n Crop production isfertilizer, extending credit for labor and farm IDA D -2 ilo.Co rdciniferutilize, extending crffed forslabori and farm expected to increase throughout the fifteeninputs, expanding coffee nurseries, agricultural districts of Tamil Nadu statepurchasmg tools, and building regional farm- through the introduction of the training-and-development centers, food productiopa will be visit system of agricultural extension. Aboutrestored and part of the coffee crop affected 3.8 million farm families will benefit. Totalby the 1980 hurricane will be salvaged, cot: $45.6 millinAbout 10,000 farmers are expected to INDIA: IDA-$23 million. By providingbenefit. CoTtnancng ($1.6 millon) is being better agricultural extension services inprovided by USAID. Total cost: $5.2 million. Maharashtra state through the introduction
INDIA.: IDA---$140 million. During a five-year of the training-and-visit system, some 5.8period, production of food grains in Madhya million farm families will benefit fromPradesh state will be increased by more than increased crop production and higher200,000 tons and the standards of living of incomes. Total cost: $38.2 million.local farmers will be raised through the INDONESIA: Bank-$161 million. More thanirrigation of some 107,000 hectares and by 19,000 families will be resettled in West Javaimprovements in planning, design, and West Kalimantan with the intention ofconstruction, and operation of medium improving their livelihoods through theirrigation projects. Total cost: $232.1 million. establishment of about 53,000 hectares of
INDIA: IDA-$125 million. Funds will be tree crops. food crops, and home gardens.provided through the National Cooperative Total cost: $322 million.Development Corporation for relending INDONESIA: Bank-$46 million. Thethrough state cooperative banks for incomes of some 40,000 smallholder
102 Projects Approved, 3ark ard IDA, by Sector
families-20 percent of whom have incomes data base management syscm. Total cost:below the absolute poverty line-will be S14.2 million.increased by expanding coconut production to MADAGASCAR: IDA- s2.3 million.meet the rising domestic demand for coconut Preinvestment studies to dci.ne an integratedoil and reducing imports of it and by flood-control and developm-ent program forstrengthening the organization of the national the Antananarivo plain and improvement ofsmallholder coconut development program. the research stations for crosion and soilTraining and technical assistance are protection and the hydrological and flood-included. Total cost: $95.2 million. alarm network will be supported. Total cost:
INDONESIA: Bank-$22 million. Some 9,000 $2.9 million.hectares of swampland in South Sumatra will MALAYSIA: Bank-$5G million. Aboutbe reclaimed and new farms and associated 35,000 people will benefit from asettlements will be created for 3,200 development program in Perak state thattransmigrant families as a first step in includes the construction of irrigation andsupporting the government's swamp- drainage infrastructure, roads. housing,reclamation program. In addition, the loan community facilities, and palm-oil and cocoawill finance the preparation of future mills, the development of new land for riceinvestments in swamp reclamation, an and tree crops, and support services forecological impact study, and an investigation agriculture and community development.of the possibility of using groundwater for Total cost: $200 million.drinking and will support project monitoring. MALAYSIA: Bank-$40 rillion. The incomesTotal cost: $44.6 million. of about 24,000 smallholier rice farmers
KENYA: Bank-$25 million; IDA-$IO living in southeastern Pahang state will bemillion. The Agricultural Finance increased and their standards of living raisedCorporation, a primary source of medium- by developing new land and by providingterm and long-term credit to farmers, will be flood and salinity controi, irrigation andstrengthened and its performance improved drainage infrastructure, and integratedto enable it to serve the growing credit needs agricultural support services. Total cost: $141of the country's farmers more effectively. million.Total cost: S50 million. MALAYSIA: Bank-S37 mijiion. The incomes
KOREA, REPUBLIC OF: Bank $50 million. of about 12,000 low-income rural householdsThrough a four-year period, credit will be will be increased through land rehabilitationprovided to small farmers and agricultural and development schemes on some 34,000cooperatives for the construction of hectares. Two palm-oil mills will also be builtgreenhouses, a sprinkler irrigation system, and staff housing, vehicles, and equipmenton-farm storage facilities, spraying will be furnished. Total cost: $139.1 million.equipment, and related activities to help MALAYSIA: Bank-$30 million. The projectincrease the production of high-value fruits will make funds available for about 8,000and vegetables, increase farm productivity, medium-term and long-term loans toand provide opportunities for off-season farmers, fishermen, and enterprises in theemployment. Total cost: $114.2 million. rural sector. About 80 percent of these loans
MADAGASCAR: IDA-$20 million. A second will go to smallholders and will enable theforestry project includes the establishment poorest farmers to participate in a largeand maintenance of about 18,000 hectares of rubber-replanting program. Total cost: $79.4pine and 500 hectares of eucalyptus million.plantations in the Mangoro valley, the MALAYSIA: Bank-$25 million. The incomesmaintenance of 70,000 hectares of existing and living conditions of some 7,500 low-plantations. the construction of roads and income, rural families participating in thebuildings, and research, training, and project- land-settlement schemes of the Kelantanpreparation studies. Cofinancing is being Land Development and Rehabilitationprovided by BADEA ($4.2 million) and the Corporation (TAKDIR) will be improved byUNDP ($900,000). Total cost: $30.2 million. rehabilitating 10,530 hectares of existing
MADAGASCAR: IDA $11.5 million. The perennial crops and planting 11,340 hectarespolicy of the government to extend credit for of additional perennial crops, completingsmallholder agricultural development will be basic infrastructure on the schemes, andsupported by providing funds to the National strengthening TAKDIR through theBank for Rural Development (BTM) for provision of additional staff and facilities.onlending to farmers and cooperatives. Total cost: $70.2 million.Training for BTM staff is included, as is a MAURITANIA: IDA-$]5 million. Throughfeasibility study for the establishment of a the construction of a concrete dam, a
Agr culture ard Rura Deve oprrent 103
conveyance canal, irrigation and drainage enable year-round access to the project area.networks. servicc roads, and related Cofinancing ($850,000) is being provided bybuildings, some 3.620 hectares for the the UNDP. Total cost: $9.7 million.cultivation of rice, corn, sorghum. and NEPAL: IDA $6.2 million. Grain-storagevegetables will be developed. Cofinancing is facilities will be built and the managementbeing provided by the EDF ($15.8 million), and organization of the Nepal FoodIFAD ($10 million), the SFD (S$! million), Corporation and the rice export companiesLAI-B ($10 million), the KfW ($8.5 million), will be strengthened in order that thethe Abu Dhabi lund (S6.4 million), the government may be able to meetIsDB ($6 million), and the FAC ($5.4 requirements for the procurement,million). Total cost: $93.2 million. distribution, and export of food grains and
MEXICO: Bank -5325 million. About 140,000 reduce storage losses. Studies of marketingrural families will benefit from increased and pricing of food grains and of futureincome and employment opportunitics needs for facilities for storage and processinggenerated by an agricultural credit project of food grains will be undertaken. Technicalthat includes medium-term and long-term assistance is included. Total cost: $8.04credit for investment in crop development, million.livestock production, fisheries, and NEPAL: IDA--$3.5 million. The governmentagroindustries. Technical assistance and will be assisted in the preparation of finaltraining arc includcd. Total cost: $1,179 designs, tender documents, and evaluation of
MillICOn Bak-$8 ilo.B salsig tenders for a proposed irrigation project toMIEXICO: Bank -- S$280 million. By establishing cover 13,500 hectares in the Babai river area.
programs for agricultural research, extension The proposed project would provide farmersservices, soil and water conservation, forestry, with a more reliable supplv of water, reduceshort-term and medium-term credit, and a dependence on erratic monsoons, andrural works program, including thedeneceoeraimnsn,adconstruraltworks progfaram,includin t increase production of food grains. Total cost:construction of farm-to-market roads, $3.55 million.irrigation schemes, and drainage facilities,some 162,000 farm families living in rainfed NIGERIA: Bank-$142 million. Supportareas will benefit from increased agricultural services and physical infrastructure for farmsproduction and higher incomes. Total cost: will be financed to help increase the$797 million. production of food crops and the incomes of
MEXICO: Bank--$23 million. About 2,000 some 600,000 smallholder farm familiesfarm families will benefit from intensive living in Kano state. Total cost: $482.2irrigated agriculture on 10,000 hectares in mitlion.the Ocoroni valley. Studies for future NIGERIA: Bank-$132 million. Some 425,000development of irrigation and drainage in smallholder farm families living in BauchiOcoroni and in two other river basins will state will benefit from a package of supportalso be financed. Total cost: $54.6 million. services, including extension advice, better
NEPAL: IDA-$17.5 million. Agricultural seeds, and crop-protection measures and fromextension services will be strengthened and the construction of feeder roads and a ruralreorganized and adaptive research upgraded water-supply system. Total cost: $350.6to provide improved services to eight of the million.twenty districts of the Terai. By supporting PAKISTAN: IDA-$41 million. Thelow-cost, labor-intensive agricultural project-including civil works required forpractices, and by adopting improved varieties the renovation of about 2,000 watercoursesof seeds and providing fertilizer, the and heavy cleaning and minor improvementprocuction of food grains will increase for of 16,500 other watercourses, research onsome 360,000 farm families. Cofinancing integrated water-management activities,($650,000) is being provided by the UNDP. training, and technical assistance--isTotal cost: $20.85 million. designed to increase agricultural production
NEPAL: IDA $8 million. By providing and the incomes of some 800,000 families.extension services for undertaking low-cost Cofinancing ($12 million) is being providedfarming practices in four western hill by IFAD. Total cost: $111.58 million.districts, about 76,000 farm families will PAKISTAN: IDA $32 million. The projectbenefit from increased food production, will assist the government in thebetter animal-health services, increased implementation of its food-grain policy byavailability of livestock feed and fertilizer, an providing additional storage facilities andimprovement in irrigation services, and the improving the efficiency of provincial foodupgrading of local trails and bridges to departments. Technical assistance is

104 Pro ects Approved, Bank ard IDA, by Sector
included. Cofinancing ($7.7 million) is being foreign-exchange earnings. Total cost: $412.2provided by the SDC. Total cost: $68 million. million.
PAKISTAN: IDA-$24 million. The project is ROMANIA: Bank-$80 million. Through thedesigned to improve the institutional construction of irrigation and drainagearrangements for the national planning, systems and through control of soil erosionmonitoring, funding, and implementing of and reclamation of sandy land foragricultural research programs by providing agricultural use in the areas of Caracal andthe Pakistan Agricultural Research Council Titu. crop production will be increased onwith additional staff and facilities, by more than 130,000 hectares, and it issupporting subprojects conducted by other expected that annual farm incomes will moreresearch agencies, and by providing technical than double. Total cost: $379.3 million.assistance and training for research ROMANIA: Bank-575 million. Thepersonnel. Total cost: $40.05 million. construction of four irrigation and drainage
PAPUA NEW GUINEA: IDA--$15 million. systems and related facilities in theDuring a three-year period, a share of the southeastern part of the country is expectedPapua New Guinea Development Bank's to increase the average annual income fromplanned agricultural lending will be financed crop production from abourt S106.1 million toin order to improve the standard of living of about $242.8 million. Total cost: $375.3about 4,000 farm families. Total cost: $28.6 million.million. RWANDA: IDA-$15 million. About 75,000
PARAGUAY: Bank 30millin. Afarm families living near Lake Kivu willPARAGUAY: Bankg-$30 million. A benefit from an increase in the production of
countryide agicultual-creit andcoffee and food crops made possible by thetechnical-assistance program with the aim of ioveent of cr vice betteincreasing the production of livestock and planting methods and seeds, a program toagricultural crops will help improve the living i ng prods and soil, coffee-standards of small farmers and will assist the improve and protect the soil, coffee-
secto in mking ette use f itslandprocessing equipment, toe rehabilitation ofsector n makig better use of its land landing points on the lakc. and crop research.
Cofinancing ($600,000) is being provided byPHILIPPINES: Bank-$45 million. The the SDC. Total cost: $16.6 million.
government s policy of increasing the supply SENEGAL: IDA-$9.3 million. To meet theof animal protein through provision of steadily growing demand for fuel wood andmedium-term and long-term credit through forest products in Dakar and the surroundingthe Development Bank of the Philippines to rural areas, state-managed tree plantationsboth the livestock and fisheries subsectors will be established and maintained; rainfedwill be supported. Technical assistance tree plantations will be established; measuresdesigned to strengthen institutional capability to improve the productivity and managementfor planning and implementing the current of 10,000 hectares of existing natural forestsand future programs is included. Total cost: will be instituted; an applied forestry$140.66 million. research program will be financed; and a
PHILIPPINES: Bank-S38 million. The training center for forestry agents will beproject-including reforestation in two constructed. Cofinancing is being provided bywatersheds, construction and maintenance of the CCCE ($3.4 million), the FAC ($1.8forest roads, construction of charcoal ovens, million), and the UNDP/FAO ($800,000).pilot programs in range management and Total cost: $17.1 million.smallholder agroforestry, and the initiation of SIERRA LEONE: IDA--$12 million. Aboutpilot programs of forest protection in two 12,600 farm families who live in Easternprovinces-will help preserve and enhance province will benefit from a project thatthe productive capacity of the catchments includes the provision of agricultural inputs,and provide a permanent and better credit, extension services, feeder roads,livelihood for the local population. Total cost: village wells, and technical assistance.$75 million. Cofinancing is being provided by BADEA
ROMANIA: Bank-$80 million. The ($8.5 million) and the lNDP ($1.9 million).project-including the modernization of dairy Total cost: $25 million.farms, production farms, beef-fattening units, SIERRA LEONE: IDA-$8.5 million. Aboutpasture units, processing and storage 13,500 farm families living in Northernfacilities, and technical assistance-is part of province will benefit from the provision ofa five-year plan to increase the production of agricultural inputs, credit, extension services,milk and beef to meet the domestic demand feeder roads, village wells, and technicalfor these products and to generate additional assistance. Cofinancing is being provided by

Agr cu ture and Rural Deve opment 105
the ADF ($8.5 million), IFAD ($6 million), THAILAND: Bank-$57 million. A twelfthand the UNDP ($2 million). Total cost: irrigation project will assist the Royal$27.7 million. Irrigation Department in its continuing
SRI LANKA: IDA-S90 million. About program to improve and expand the country's28,000 farm families will benefit from the irrigation facilities. Some 6,800 farmdevelopment of some 28,000 hectares in the families, 40 percent of whose incomes areMahaweli river basin, including irrigation below the level of absolute poverty, willfacilities, the clearing of land, social and benefit directly from increased agriculturalmanagerial infrastructure, and fuel-wood and production, and jobs will be created for aboutcashew plantations. Technical assistance is 2,000 landless laborers. Total cost: $115included. Cofinancing is being provided by million.the OECF ($45 million) and the KFAED THAILAND: Bank-S30 million. Most of the($45 million). Total cost: $201.8 million. country's 5 million farm families will benefit
SRI LANKA: IDA $33.5 million. About from increased crop production and incomes130,000 farm families will benefit from a through the strengthening of the capacity ofsecond rural development project for the the Department of Agriculture (DOA) topurpose of increasing productivity, implement research programs and provideemployment, and incomes and raising new and improved technology. Included are astandards of living. Irrigation facilities, training program and the development ofagricultural credit, water-supply services, and nineteen research centers, reorganization andthe development of crops, forestry, livestock, decentralization of the DOA, andand fisheries are included. Total cost: $50.01 establishment of a stronger link betweenmillion. research and extension. Cofinancing is being
SRI LANKA: IDA-$30 million. Agricultural provided by IFAD ($15 million) and theproduction and farm incomes will be ADAB ($2 million). Total cost: $91.5 million.increased by rehabilitating some 1,200 village TUNISIA: Bank-$24 million. A five-yearirrigation schemes, strengthening the phase of the government's fifteen-yearprincipal government institutions that are development program to increase the incomesinvolved in village irrigation, initiating a and improve the nutrition, health, andsystematic program of water management, education of people living in the Northwestand establishing an evaluation program egion of beople he im of thedesigned to assist project implementation and region will be financed. The aim of thethe preparation of future village irrigation eprogram is to create jobs, develop loalschemes. Total cost: S43.7 million, energy resources, and increase agricultural
SUDAN: IDA-$35 million. During a five- productivity. Cofinancing ($1.7 million) isSUAN ID. 3 ilo.Drn ie being provided by the GTZ. Total cost: $61.5year period, some 174 pump schemes on the bein. pWhite Nile will be rehabilitated to increase mllion.crop production, expand cotton exports, TURKEY: Bank-$40 million. This first phaseincrease the incomes of some 28,000 tenant of a program to increase the production offamilies and help place the schemes on a fruits and vegetables for export includes thesound financial footing. Total cost: $54.7 establishment of seven nurseries, 2,000million. orchards, 100 vineyards, and 150
SUDAN: IDA-$32 million. Rehabilitation of greenhouses, the provision of credit tothe irrigation system in the Shasheina region existing farms and orchards, extensionand other areas along the Blue Nile will services, four regional marketing corporationsbenefit some 17,000 farm families through and a central marketing organization, andincreased production of cotton, peanuts, the preparation of a master plan for furthersorghum, and vegetables. Cofinancing ($10 horticultural development. Total cost: $107million) is being provided by the AfDB. Total million.cost: $67.3 million. UPPER VOLTA: IDA $16 million. More
TANZANIA: IDA-$6.8 million. A firm base than 200,000 poor people will benefit from afor the rehabilitation of the coconut industry second Bougouriba agricultural developmentwill be prepared during a five-year period by project, the aim of which is to consolidate thefinancing trials to determine the most experience of a first-phase project andappropriate varieties of coconut for each increase agricultural and livestock productionregion, a seed garden for the production of further. Extension services, a supply andhybrid seed nuts, soil and hydrological credit service, animal-health services, asurveys, the preparation of a feasibility study, forestry component, and technical assistanceand technical assistance, consulting services, and evaluation studies are included. Totaland staff training. Total cost: $8.5 million. cost: $17.5 million.

106 Projects Approved, Bank and DA, by Sector
WESTERN SAMOA: IDA-$2 million. A production is expected to increase about 70second agricultural development project will percent during the next four years. Inassist the government in increasing addition, the project provides for a data-agricultural production and export earnings, processing and management-informationsaving foreign exchange, and providing better system, staff training, and a number of pilotincomes and employment opportunities in the projects. Cofinancing ($27.4 million) is beingrural sector. Cofinancing is being provided by provided by the CCCE. Total cost: $80.4the AsDB ($3 million) and the ADAB ($2 million.million). Total cost: $7.8 million. ZAMBIA: Bank-$1I million. The incomes of
YEMEN ARAB REPUBLIC: 1DA-$17 about 26,000 smallholder farm families livingmillion. The incomes and quality of life of in Eastern province will be increased throughabout 60,000 rural families will be improved the establishment of agricultural researchby a project that includes expansion of and extension services and the construction ofagricultural extension services, social services, facilities for storage and processing of crops.and livestock-health and production services; In addition, technical assistance, a line ofprovision of credit for agricultural investment credit to smallholders, and a program for thethrough the Agricultural Credit Bank; control of the tsetse fly are included.technical assistance; construction of water- Cofinancing ($1 I million) is being providedsupply systems; extension of a bilharzia by IFAD. Total cost: $28.1 million.control program; and completion offeasibility studies for future agricultural Development Finance Companiesdevelopment projects. Cofinancing is being BANGLADESH: IDA-$50 million. Foreignprovided by IFAD ($14 million), the Abu exchange will be provided through theDhabi Fund ($10 million), and the SDC ($6 Bangladesh Shilpa Bank to finance the costsmillion). Total cost: $81.6 million. of capital goods and services for projects in
YEMEN, PEOPLE'S DEMOCRATIC the industrial sector in order to assist theREPUBLIC OF: IDA-$8 million. By government in expanding the activities of therehabilitating the irrigation network and private sector in industrial investment inimproving the groundwater irrigation system, nontraditional, export industries, efficientby providing technical assistance, farm import-substitution industries, and projects ininputs, and agricultural equipment, and by less developed areas.constructing feeder roads, agricultural HAITI: IDA-$7 million. Medium-term andproduction and incomes in the Beihan long-term credit will be made availablesubgovernorate will be increased. through the Fonds de DeveloppementCofinancing ($6 million) is being provided by Industriel to finance industrial projects. TotalIFAD. Total cost: $18.1 million. cost: $11 million.
YUGOSLAVIA: Bank-$90 million. Funds JAMAICA: Bank-$37 million. An increase inwill be relent through the Udruzena the resources available to the ExportKosovska Banka Pristina for agricultural and Development Fund Jamaica Ltd. andagroindustrial projects designed to increase financing of the import of raw materials,the productivity and incomes of farmers and intermediate goods, packaging materials, andlaborers living in Kosovo, the country's least spare parts will support the government'sdeveloped region. Total cost: $270 million. program to expand nontraditional
YUGOSLAVIA: Bank-$87 million. Funds manufactures and banana exports. Technicalwill be made available to Investbanka of assistance is included.Serbia for onlending to agricultural KOREA, REPUBLIC OF: Bank-$100enterprises and cooperatives, including about million. Funds will be made available to11,000 individual farm families. Agricultural cover the foreign-exchange requirements ofproductivity, employment opportunities, and industrial subprojects to be financed by thefarm income in the Morava region-one of Korea Development Bank during the nextthe country's poorest rural areas-are all two years.expected to rise as a result. Total cost: $288.4 KOREA, REPUBLIC OF: Bank-$90 million.million. As part of a comprehensive reform of the
ZAIRE: IDA-$26.4 million. Through the country's financial system, funds will berehabilitation and extension of an existing provided through the Korea Long-Termsugar plantation, as well as the provision of Credit Bank to support industrial projectsequipment for the transport of sugarcane, during the next two years.civil works to expand processing facilities and KOREA, REPUBLIC OF: Bank-$60 million.construct offices and staff housing, and the Funds will be made available to help coverimplementation of a research program, sugar the foreign-exchange requirements of

Educaton 107
subprojects to be financed by the Small and THAILAND: Bank-$30 million. Funds willMedium Industry Bank during the next two be made available to the Industrial Financeyears. Corporation of Thailand to cover part of the
MOROCCO: Bank-$100 million. The foreign-exchange costs needed for industrialproject-including the development of subprojects during the next two years.tourism, for the most part hotels financed by TURKEY: Bank-$70 million. Funds will bethe Credit Immobilier et H6telier (CIH) provided to the State Investment Bank forunder loans to be made through 1983, a cost- relending to three state economic enterprisesbenefit study of tourism investments, and a for the completion of six high-prioritytraining program for CIH staff-is expected projects for rationalizing and increasing theto generate net foreign exchange in the production of sugar, iron, and copper.amount of $128 million annually by 1987, Technical assistance is included. Total cost:create about 21,000 new jobs, and produce $187.4 million.net fiscal revenues of $37 million a year TURKEY: Bank $40 million. Foreignwithin five to ten years. exchange will be provided to the Sinai
NICARAGUA: Bank-$30 million. By Yatirim ve Kredi Bankasi to finance labor-financing raw materials, spare parts, intensive projects undertaken primarily byequipment, civil works, technical assistance, small and medium-scale enterprises forand training, industrial and mining imported and locally produced equipment.enterprises that suffered physical and The project, which will create about 5,000financial damage during the 1979 civil war jobs in twenty-three urban centers, iswill be able to regain prewar levels of output, expected to provide a model for replication,exports, and employment. Total cost: $43 on a larger scale, in other high-million. unemployment areas.
PANAMA: Bank-$20 million. Funds will be URUGUAY: Bank $30 million. Funds will beprovided through the Corporaci6n Financiera onlent through commercial banks forNacional (COFINA) to finance subloans for industrial, agroindustrial, and tourismprojects in the industrial sector and for projects and to help establish capacity fortechnical assistance, staff training, and the promotion and formulation of projects withinservices of consultants to strengthen the participating private intermediary banks.management of COFINA and improve its Technical assistance is included. Total cost:efficiency and promotional activities. $66.14 million.
PERU: Bank-$60 million. Funds will be YEMEN ARAB REPUBLIC: IDA-$12provided through the Corporaci6n Financiera million. Funds will be provided to thede Desarrollo to help finance projects in the Industrial Bank of Yemen (IBY) to coverindustrial, mining, and tourism sectors. about 50 percent of the resources that it will
PHILIPPINES: Bank-$150 million. Funds require through 1983. Technical assistance towill be onlent through the specially created help the IBY improve its capability inApex Development Finance Unit in the identifying, appraising, and supervising viableCentral Bank of the Philippines to accredited industrial projects is included.financial institutions for the financing of YUGOSLAVIA: Bank-$I 10 million. Fundsprojects in the industrial sector. Cofinancing will be provided to four local banks for($400,000) is being provided by the UNDP. onlending to small and medium-sizedTotal cost: $250.4 million. industrial enterprises to help promote
PORTUGAL: Bank-$100 million. Funds will economic development in four low-incomebe provided to the Banco de Fomento regions. About 1 1,000 jobs will be created.Nacional (BFN) to support the development ZAMBIA: Bank-$15 million. Funds will beof industrial projects, to assist the BFN in provided to the Development Bank ofstrengthening its export investment Zambia to support medium-scale and large-promotion and service capabilities, and to scale industrial, agroindustrial, andcontribute to the industrial reorganization of agricultural projects through March 1982.the country in preparation for its entry intothe European Economic Community. Education
SOLOMON ISLANDS: IDA-$1.5 million. ARGENTINA: Bank-$58 million. ThirtyFunds will be provided through the vocational training centers will beDevelopment Bank of Solomon Islands for constructed and equipped, five more will bemedium-term and long-term loans to support equipped, fifty mobile units will beprojects in the agriculture, manufacturing, purchased, and curricula will be developed inand transport sectors. Cofinancing ($2 order to improve the effectiveness ofmillion) is being provided by the AsDB. vocational training, increase the supply of

108 Projects Approvec, Bcnk cnd DA, by Sector
skilled labor, and improve the mobility of advice on curricula and teaching materials.labor. Technical assistance is included to help Total cost: $53.65 million.strengthen planning and operating INDONESIA: Bank-$45 million. This firstcapabilities of the National Council for phase of a long-term university developmentTechnical Education. Total cost: $149.5 program has the aim of increasing the outputmillion. of high-level manpower in the fields of
BAHAMAS: Bank-$7 million. The engineering, science, agriculture, andproject-including the construction, economics, improving the quality ofequipping, and furnishing of an industrial university education, and strengthening thetraining center, educational workshops and management of the whole university system.laboratories, facilities for the College of the Total cost: $65.2 million.Bahamas, a hotel-training college, and a KENYA: IDA-$40 million. A fifth educationdepartment of nursing education-will help project will provide training for staff inincrease the number of skilled graduates in school management and administration,technical and vocational fieids qualified to technicians in agriculture and development ofassist in the development of tourism and water resources, and skilled industrialother industries in the islands. Total cost: workers. In addition, the project will assist in$18.4 million. identifying the country's need for business
CENTRAL AFRICAN REPUBLIC: education and training. Total cost: $53.2IDA-$900,000. Supplementary financing is million.being provided for the completion of an LESOTHO: IDA $10 million. Some 150education project, approved in fiscal 1972. primary-school classrooms will be(The original credit was for $3.9 million.) constructed, 1.9 million textbooks and
CHINA: Bank $100 million; IDA-$100 workbooks will be provided, and permanentmillion. The initial phase of a program to facilities for trainees at two vocationalstrengthen higher education and research training centers will be built. Total cost:activities in science and engineering will be $13.1 million.supported by this first Bank operation in the MALAWI: IDA-$41 million. Through thecountry. Civil works, furniture, equipment, building and furnishing of five new secondarythe services of specialists, and fellowships will schools and the expansion of six existingbe financed to help increase the number of schools and through the provision of similargraduates and the volume of research work facilities for a training college for teachers,at twenty-six leading universities; improve secondary education will be expanded andthe quality of graduates and research work; improved. About 47 percent of the secondaryand strengthen management at universities school places will be made available to girls,and in the Ministry of Education. Total cost: thus providing better educational and$295 million. employment opportunities for women.
EGYPT. ARAB REPUBLIC OF: IDA-$40.1 Technical assistance is included. Total cost:million. Financial and technical assistance $51.3 million.will be provided to twenty-five new and NIGER: IDA-$21.5 million. This projectthirty-five existing vocational, agricultural, comprises a five-year program to improve theand handicrafts training centers to alleviate planning and preparation of educationacute shortages of skilled manpower in the projects and planning for civil serviceagricultural and industrial sectors, thereby upgrading and training of rural developmentimproving the employment prospects of the workers. Cofinancing ($2.5 million) is beingurban poor, increasing agricultural provided by the UNDP. Total cost: $27productivity and rural incomes, improving million.health services, and upgrading secondary and PAKISTAN: IDA $25 million. Vocationaluniversity teaching skills. Total cost: $56.9 training will be expanded in order to producemillion. the skilled manpower needed for industrial
ETHIOPIA: IDA-$35 million. This three- development and to overcome shortagesyear phase of the government's plan to caused by the emigration of skilled workers.provide primary education to all within a Construction, furniture, and equipment fordecade includes the construction of primary the National Training Development Instituteand secondary schools, the strengthening of and six new training centers are included, asthe Ministry of Education's capacity to are the rehabilitation of existing centers,coordinate project activities, and the training materials, and salary increments andestablishment of a school of veterinary training for staff. Cofinancing ($1.6 million)medicine and several district centers to is being provided by the lNDP. Total cost:provide in-service training for teachers and $47.3 million.

Energy 109
PAPUA NEW GUINEA: Bank-$6 million; materials, better training facilities forIDA-$12 million. Through the provision of teachers, and fellowships. Cofinancing ($20in-service training for 430 teachers, million) is being provided by DANIDA.administrative staff development, and Total cost: $55 million.educational materials to 150,000 children TUNISIA: Bank--$26 million. To help meetand through the improvement and expansion the need for skilled workers, craftsmen, andof physical facilities, the management of supervisors, seven new vocational centers willeducational resources will be improved and be built and furnished, thirty new sectionsprimary education will be upgraded and will be added to existing centers, five centersexpanded in the provinces. Total cost: $37.7 will be re-equipped, and technical assistancemillion. will be provided to help establish a long-term
PARAGUAY: Bank-$17 million. About strategy for the development of vocational80,000 rural students will benefit from the training and apprenticeships. Total cost: $47construction and equipping of about 500 million.schools, the establishment of better in-servicetraining programs for teachers, evaluation Energyand revision of curricula for primary and ARGENTINA: Bank-$10 million. Financingsecondarv education, and the upgrading of of a drilling program, seismic surveys.staff and facilities in the departments of geological reconnaissance, and prefeasibi]ityplanning and personnel of the Ministry of studies will enable evaluation of coal reservesEducation. Total cost: $30.23 million. in the Austral basin, and the government will
PHILIPPINES: Bank-$100 million. To be able to establish investment priorities forstrengthen policies, management, and the long-term development of the country'sinstructional programs in elementary eng-tor. Totah co untry'seducation, some sixty subprojects will be energy sector. Total cost: $20 mllion.undertaken during the next three years. BANGLADESH: IDA-$85 million. TheEducational materials, buildings, equipment, country will be assisted in reducing itstraining for managers, planners, and school dependence on imported oil in the course of astaff, and a revised curriculum are included. three-year period through the replacement ofTotal cost: $448.1 million. liquid hydrocarbons with indigenous natural
SOMALIA: IDA-$10.2 million. The project gas. Gas to use as a feedstock for productioncovers a five-year program designed to of fertilizer will also be made available,improve the quality and efficiency of thereby making possible substantial savingsteaching in primary and secondary schools by in foreign exchange. The project includes theupgrading teacher-training facilities and drilling of wells, facilities for the gathering,providing more equitable opportunities for transmission, and distribution of gas, andsecondary education in rural areas. Technical technical assistance. Cofinancing is beingassistance for the long-term planning of provided by the OECF ($26 million) and themanpower requirements and a review of the OPEC Fund for International Developmentcivil-service system are included. Total cost: ($21 million). Total cost: $164 million.$12.7 million. BARBADOS: Bank-$6 million. To help meet
SYRIAN ARAB REPUBLIC: Bank-$15.6 the country's needs for electricity throughmillion. The government will be assisted in 1984, the existing generation, transmission,expanding vocational and technical training and distribution systems will be expanded,for the agriculture, construction, and health plant efficiency and the institutionalsectors; extending current programs that capability of the Barbados Light and Poweroffer health services to school children; Company Limited will be improved, and animproving the quality of primary and energy-conservation program will besecondary education; and studying ways of undertaken. Cofinancing will be provided byupgrading management skills in the public the CDC ($11.7 million), the EIB ($7.1sector. Cofinancing ($2.7 million) is being million), and the CDB ($6 million). Totalprovided by the UNDP. Total cost: $48.1 cost: $121.7 million.million. BRAZIL: Bank-$125 million. Through the
TANZANIA: IDA-$25 million. Primary and construction of transmission lines,secondary education will be made available substations, and auxiliary facilities and theto students from remote areas of the country provision of the services and training of(about 24,000 new places), local school consultants, the Centrais Eletricas do Sul dobuildings will be constructed in some 2,000 Brasil S.A. will be able to expand its high-villages, and the quality of education will be voltage transmission system in the states ofimproved through the provision of teaching Parana, Santa Catarina, and Rio Grande do
110 ProJects Approved, Bank and IDA, by Sector
Sul during the period 1980-84. Total cost: management and operations of the Societe$265.31 million. Nationale d'Electricite. A training program,
BRAZIL: Bank-$54 million. A part of a technical assistance, and consulting servicesnational program for the supervision and are included, as are the rehabilitation of thecoordination of the country's interconnected power distribution network and constructionelectric power systems, the project consists of of related facilities. Total cost: $32.5 million.the provision of components for the system GUINEA-BISSAU: IDA-$6.8 million.that are at an advanced stage of preparation, Technical assistance will be provided to theincluding training and the construction of National Corporation for Petroleum andfacilities. Total cost: $140.3 million. Mineral Research and Exploration for
COLOMBIA: Bank $359 million. A 1,000- gathering and evaluating geological andmegawatt hydroelectric plant, the largest yet geophysical data, negotiating explorationto be constructed in the country, will provide contracts with oil companies, and devising anabout 15 percent of the country's need for accounting system for the petroleum industryelectricity by 1988. An environmental- and a system for monitoring the accounts ofprotection study and a training program for oil companies. Total cost:_$6.9 million.the staff of the Empresa de Energia Electrica GUYANA: Bank $8 million. A power-de Bogota are included. Cofinancing ($100 demand study, prefeasibility and feasibilitymillion) is being provided by the IDB. Total studies of various hydropower sites, andcost: $1,303 million. engineering studies will assist the country in
COLOMBIA: Bank-$85 million. A 65-meter meeting its future power requirementsearth-fill dam and spillway, a 200-megawatt through the development of renewableunderground power station, a substation, sources of energy that will substitute fortransmission lines, and related works will be imported oil. Technical assistance is beingbuilt in order to help meet the increasing provided the Guyana Electricity Corporationdemand for power in Medellin and its to improve its management. Total cost: $10.4surrounding areas and to expand the supply million.of electricity in rural areas of Antioquia and INDIA: Bank-$400 million. The developmentin the North Atlantic region, which are now of the southern and central areas of theentirely dependent on thermal generation. Bombay High offshore oil field will beCofinancing ($85 million) is being provided continued by drilling sixty-four wells andby the IDB. Total cost: $364.4 million. constructing fifteen production platforms, a
COLOMBIA: Bank-$36 million. The project processing platform, and a platform for livingrepresents the first stage of a fifteen-year quarters. The production potential isrural electrification program to bring expected to reach 12 million tons of crude oilelectricity to more than 43,000 rural a year by mid 1982. Cofinancing ($30households and to agroindustries in the million) is being provided by the OPEC Fundcountry's poorest region. Total cost: $68.7 for International Development. Total cost:million. $858.2 million.
COSTA RICA: Bank-$3 million. The project INDONESIA: Bank-$250 million. A 700-will support the efforts of the government to megawatt hydroelectric power facility andevaluate and explore its petroleum resources related works will be built in Java to helpand analyze future choices in the energy meet the island's growing demand forsector by conducting seismic surveys and electricity and reduce domestic consumptiongeological studies and by providing the of oil. Services of consultants to assist theservices of consultants to help develop a national electricity authority in carrying outnational energy data base and prepare a power-market surveys, analyses of powernational energy plan. Total cost: $3.9 million. systems, and management of civil works
EGYPT, ARAB REPUBLIC OF: Bank-$25 contracts are included. Cofinancing ($136.6million. Seismic surveys, exploratory drilling, million) is being provided by the OECF.and extensive testing and data processing in Total cost: $726.7 million.the western desert will be financed to assist IVORY COAST: Bank $33 million. Somethe country in developing petroleum 315,000 people will benefit from a projectresources to meet the increasing demand for that forms part of the country's 1981-84oil and natural gas. Technical assistance is rural electrification program, the aim ofincluded. Total cost: $40 million. which is to extend power to forty-three small
GUINEA: IDA-$28.5 million. The project is towns that are today supplied with electricitypart of a program to rehabilitate and expand by diesel stations, to 633 towns that nowpower facilities in Conakry and the have no electricity, and to new and existingsurrounding areas and to strengthen the agroindustries. Total cost: $46.5 million.
Energy 111
JAMAICA: Bank $7.5 million. The project plants, seventeen thermal power and heat-will enable the Petroleum Corporation of generation plants, twenty-seven transmissionJamaica to participate as an equity partner substations, six thermal generation plants,in offshore hydrocarbon exploration. In and 1,569 kilometers of transmission linesaddition, seismic surveys, technical will be built. An expansion of the existingassistance, and a feasibility study are distribution systems will be financed as well.included. Total cost: $8.4 million. Total cost: $3,011.5 million.
JORDAN: Bank-$25 million. The project is SWAZILAND: Bank-$10 million. A twenty-part of the 1981-84 program to provide megawatt hydroelectric generating facilityadequate facilities for transmission and will be built on the Little Usutu river as adistribution of power to five municipal and first step in a program designed to meet theindustrial centers, as well as to about fifty country's demands for power during the nextvillages and three low-cost housing areas, fifty years and to help reduce its dependencethereby benefiting some 51,000 people. on imports of electricity. Cofinancing is beingCofinancing ($18 million) is being provided provided by the EIB ($8.8 million), theby the KFAED. Total cost: $81.12 million. AfDB ($8.2 million), the KfW ($8.1
LIBERIA: Bank-$5 million. Offshore seismic million), and the CDC ($7.6 million). Totalsurveys will be conducted to help determine cost: $59.2 million.oil reserves, consulting services for the THAILAND: Bank-$100 million. Funds willnegotiation of new exploration permits will be provided the Electricity Generatingbe made available, and technical assistance Authority of Thailand to help finance itswill be provided in order to improve planning expenditures for selected subprojects duringin the energy sector and attract foreign the next three years. A program of energyinvestment in oil exploration. Total cost: $6 conservation and an environmental trainingmillion. program are included. Cofinancing is being
MALI: IDA-$3.7 million. Technical provided by the AsDB ($133 million), theassistance will be provided to the government OECF ($89.8 million), and the KFAED ($20to help evaluate the hydrocarbon potential of million). Total cost: $1,621.4 million.the Taoudeni basin and to strengthen TUNISIA: Bank $41.5 million. Electricinstitutional capabilities for energy planning. service will be extended, for the first time, toTotal cost: $4 million. more than be people firal areas
PANAMA: Bank-$6.5 million. The more than 30,000 people iving in rural areasgovernment will be assisted in accelerating and 2,100 pumping stations and 300oil exploration, improving energy planning, commerclal and small industrial consumersand investigating the potential for will also receive these services, and thedevelopment of alternative sources of energy quality of service will be improved forin an effort to attract investments in the 150,000 existing urban consumers. Total cost:energy sector by oil companies. Total cost: $8 $89.6 million.million. TURKEY: Bank-$62 million. The
PERU: Bank-$25 million. Prefeasibility project-including the testing of improvedstudies, feasibility studies, bidding techniques of oil recovery in a largedocuments, and final designs will be prepared producing oil field, the drilling of new wellsfor twelve hydroelectric projects, a proposed and installation of associated equipment in aproject that will provide power and irrigation, newly discovered oil field, evaluation of thea power-transmission line to serve the production potential of a gas field, andnorthern part of the country, and a thermal- technical assistance to the Turkish Petroleumgenerating plant for Lima. Technical Company-will expand recoverable oilassistance is included. Total cost: $40.7 reserves in operating fields and increasemillion. short-term production of crude oil in new
PORTUGAL: Bank-$20 million. The country fields. Total cost: $102 million.will be assisted in evaluating its petroleum TURKEY: Bank-$25 million. To accelerateand heavy oil prospects through seismic the exploration and development of thesurveys, exploratory drilling, laboratory country's petroleum potential and attractanalysis services, and the provision of investments in the sector by foreign oiltechnical assistance to the Petroleos de companies, geological studies and seismicPortugal to strengthen its technical geophysical surveys will be undertaken,capabilities. Total cost: $26 million. exploratory drilling will be financed,
ROMANIA: Bank-$125 million. As part of technical assistance and training will bethe country's 1980-85 power expansion provided, and a program of energy auditsprogram, thirty-one hydroelectric generation will help identify the areas with strong

112 Projects Approved, Bcnk cnd DA, by Sector
potential for efficiency and conservation of Siderurgica del Perti, a state-owned steelenergy. Total cost: $45 million. company, to enable it to install and manage
YEMEN ARAB REPUBLIC: IDA-$12 a two-stage 400,000 metric-tons-a-yearmillion. The project-including the extension expansion of an important steel mill. Totalof electricity to about seventeen villages and cost: $6 million.to three principal farmers' markets SENEGAL: Bank-$19.3 million. The safestrepresents the first phase of the country's and most economical solution foreighteen-year national electrification transporting raw materials, supplies, andprogram, the aim of which is to extend products to a major fertilizer plant will beelectric service throughout the country. An provided through the upgrading, renewal, andenergy-pricing study and an electricity-tariff construction of railway track, thestudy will also be financed. Cofinancing is procurement of locomotives, spare parts, andbeing provided by the KfW ($4 million) and equipment, and the construction andthe NMDC ($4 million). Total cost: $21.5 equipping of a maintenance workshop. Totalmillion. cost: $23.4 million.
Industry THAILAND: Bank-$8.9 million. A feasibilitystudy, including trial mining operations, will
BRAZIL: Bank-$250 million. This three-year be executed in order to determine thephase of the government's 1981-85 National feasibility of developing a potash project inAlcohol Program is designed to increase the country. Financial and legal assistanceannual production of alcohol for use in will be provided to assist the government ingasoline and chemical feedstocks to about negotiating with private investors in the10.7 billion liters by the end of 1985 sector, and the formulation of potash-(equivalent to 148,000 barrels a day of development policies will be supported. Totalpetroleum). Total cost: $5,115 million. cost: $10.4 million.
BURUNDI: IDA-$4 million. The aim of the TOGO: IDA $5.7 million. A feasibility studyproject which includes nickel exploration, and related geological, engineering, andtrial peat production, engineering studies, infrastructural studies will be undertaken inand technical assistance-is to analyze the order to evaluate the country's phosphatedata needed to establish an economically and deposits and determine the technical andfinancially sound project for developing the economic feasibility of developing anickel deposits at Musongati. Cofinancing is phosphate fertilizer project that wouldbeing provided by FINNIDA ($1.8 million) support the manufacture of phosphoric acidand DANIDA ($900,000). Total cost: $7.3 and fertilizers for export. Total cost: $8.9million. million.
EGYPT, ARAB REPUBLIC OF: Bank-$64 TUNISIA: Bank-$18.6 million. The project ismillion. The HADISOLB steelmaking the first phase of a program to rehabilitatefacilities-the country's largest producer of the country's textile industry by expandingsteel-will be rehabilitated by providing and improving production at the largestequipment and computer facilities to help operating company in the country and byremove technical bottlenecks in production completing preparatory work for theand by making substantial improvements in rehabilitation of three other large companies.operation and maintenance practices. Total Technical assistance is included. Cofinancingcost: $105.6 million. ($1.5 million) is being provided by
INDIA: IDA-$400 million. It is estimated Switzerland. Total cost: $32.9 million.that the construction of a fertilizer plant in TURKEY: Bank-$I 10 million. The provisionGujarat state that will produce 2,700 tons of of finance for rehabilitation andammonia and 4,400 tons of urea a day will rationalization investments in threecause foreign-exchange savings from reduced companies and four plants in the fertilizerimports of fertilizer to increase to more than industry and the training of staff, fulfillment$3,440 million during the next twelve years. of a marketing studv, provision of technicalCofinancing is being provided by the ODA assistance, and improvement of plant($104.5 million) and the OECF ($98.7 operations and management will make itmillion). Total cost: $1,276.9 million. possible to increase production of fertilizer
PERU: Bank--$5 million. Technical and allow the plants to become more energy-assistance including assistance with project efficient. Total cost: $236.6 million.management and operating practices,training of personnel, and the preparation of Nonprojecta feasibility study and other related BANGLADESH: IDA-$65 million. Foreignstudies-will be provided to the Empresa exchange will be provided for the import of

Nonoroject 113
raw materials, components, and equipment to with a view to improving their productionenable the industrial, construction, and capacity.agriculture sectors to reach their full PHILIPPINES: Bank $200 million. Aproduction potential. Government programs structural-adjustment loan will support theto increase the production and equity of implementation of a comprehensive programdistribution of food grains and thereby of industrial development designed toimprove the country's general economic accelerate industrial growth, expandcondition will also be supported. employment, maintain the rapid growth of
FIJI: Bank-$18 million. A thirty-two- nontraditional exports, and stimulate industrykilometer section of highway and drainage outside the metropolitan area of Manila.works that was damaged during the cyclone Proceeds of the loan will be used to financeof April 1980 will be reconstructed. the acquisition of industrial raw materials,Technical assistance is included. The UNDP intermediate and investment goods, and spareis providing grant funds for technical parts, in addition to technical assistance forassistance. Total cost: $31 million. implementation of the program.
GUYANA: Bank-$14 million; IDA-$8 SENEGAL: Bank-S30 million; IDA-$30million. Structural-adjustment assistance will million. Structural-adjustment assistance, tohelp stimulate economic growth in the be disbursed in two tranches, will support thecountry and restore balance-of-payments government in its efforts to carry out itsequilibrium by providing foreign exchange program of economic stabilization andfor critically needed inputs to industrial and rehabilitation for the medium term,agricultural operations in both the public and concentrating on four principal areas: moneyprivate sectors. and finance, prices and incentives, investment
MALAWI: Bank-S45 million. A structural- programs, and agricultural policies.adjutmet lon, o bedisurse intwoTANZANIA: IDA-$50 million. Funds will beadjustment loan, to be disbursed in two provided to cover the costs of essential
tranches, is designed to diversify the imports of agricultural machinery andcountry's export base, encourage efficient materials and spare parts for vehicles so as toimportsition, adjust incian improve the production and marketing ofIncome policies, Improve the financial principal export crops and food crops.performance of the pubic sector, and TURKEY: Bank-$300 million. This secondstrengthen the economic planning and structural-adjustment loan will give furthermonitoring capability of the government, support to the countrv's January 1980
MAURITIUS: Bank-$15 million. A stabilization program and will help restorestructural-adjustment loan will provide funds economic viability. Finance will be providedthrough the Bank of Mauritius to finance the for high-priority imports, such as fertilizerimport of essential goods mainly for the raw materials and intermediate products forindustrial and agricultural sectors. The loan agriculture and industry.provides balance-of-payments support while TURKEY: Bank-$75 million. Thisthe government implements an adjustment supplement to the first structural-adjustmentprogram whose main aims include developing loan will provide support for a program ofexport earnings, increasing the economic economic measures that the governmentreturn from the public sector investment plans to carry out to restore the viability ofprogram, and improving efficiency in key the economy. Measures include theareas of public expenditure. promotion of exports, efforts to improve
NICARAGUA: IDA $5 million. Funds will mobilization of domestic resources,be provided to the Financiera de Preinversi6n formulation and pursuit of rational publicfor relending for the services of consultants investment policies, and better managementto help identify and prepare high-priority of external debt. Foreign exchange is beinginvestment projects in key productive and made available to finance high-prioritysocial sectors. Technical assistance is imports for agriculture and industry.included. Total cost: $6.2 million. ZIMBABWE: Bank-$50 million; IDA-$15
PAKISTAN: IDA-$50 million. To help meet million. High-priority import requirementsthe demand for fertilizer, support various for raw materials, spare parts, and equipmentagricultural policy reforms, and thereby for the manufacturing sector will be financedincrease agricultural output, imports of to increase the production of manufacturedfertilizer will be financed and the services of goods, increase exports, and provide moreconsultants provided to review staffing and employment opportunities. Cofinancing ($10organization of the larger fertilizer million) is being provided by the OPEC Fundmanufacturing plants in the public sector for International Development.
114 Projects Approved, Bank ard IDA, by Sector
ZIMBABWE: Bank-$42 million. Funds will goods, support export promotion of selectedbe provided to help meet high-priority import handicrafts, and initiate project developmentrequirements of spare parts. track- activities in Baluchistan. Total cost: $60maintenance equipment, and tools for the million.railways. Technical assistance is included. SENEGAL: Bank-$6.5 million; IDA $2.5
Population Health andNumillion. Funds will be provided to the SocietePopulation, Health, and Nutrition F.acir .. &alieporFinanciere S6negalaise pour leTUNISIA: Bank-$12.5 million. The project Developpement de l'Industrie et du Tourisme
supports the efforts of the government to (SOFISEDIT) and the Soci6te Nationaleextend basic health care to the entire d'Etudes et de Promotion Industriellepopulation by 1990 by providing family- (SONEPI) to finance investments inplanning, nutrition, and health services to industrial, fisheries, and tourism projects andabout 2.25 million low-income residents and to improve the promotion of small andby strengthening the management capacity of medium-scale enterprises. Total cost: $17.9the Ministry of Public Health. Total cost: million.$41 million. TUNISIA: Bank-$30 million. The
Small-Scale Enterprises government program to assist smallindustries will be supported in an effort to
BANGLADESH: IDA $35 million. A third help them reach their potential in generatingsmall-scale industry project will help increase employment, improving intersectoralproductivity, employment, and exports of linkages, developing industrial managers andcottage industries and other small industries technicians, and alleviating regionalby providing both financial assistance and imbalances. Cofinancing ($900,000) is beingtechnical and marketing services to small provided by the UNDP. Total cost: $60.55industries and transport operations, exporters million.and manufacturers of handicrafts and lightindustrial products, and agricultural Technical Assistanceenterprises. Total cost: $50 million.
CAMEROON: Bank-$15 million. Technical BANGLADESH: IDA-$16 million. Technicaland financial assistance will be provided to assistance will be provided to help strengthenartisans and to small and medium-scale the government institutions that areenterprises during a four-year period to responsible for identification, preparation,promote industrial growth and encourage a and implementation of projects and tobetter geographical distribution of industrial develop a pipeline of projects suitable foractivities in the country. About 1,800 financing.permanent jobs will be created. Total cost: CAMEROON: IDA-$10 million. A second$21.3 million. technical-assistance project will support
INDONESIA: Bank-$106 million. About improvements in the organization and70,000 subloans will be extended through operation of the present systems of nationalBank Indonesia to small-scale enterprises planning and management of external debt,(SSEs) in several sectors, creating some help define policies and investment programs140,000 new jobs. Funds will also be in key sectors, and generate sound projectsprovided to the Ministrv of Industry for and improve project management. Total cost:strengthening technical support services to $13.8 million.SSEs. Total cost: $605.3 million. CENTRAL AFRICAN REPUBLIC: IDA-$4
LIBERIA: IDA-$4 million. Funds will be million. Technical assistance will be providedprovided through the National Bank of for project preparation, sector studies, and aLiberia to finance small and medium-scale review of the civil service, and funds will beenterprises (SMEs) and to make technical made available to pay for vehicles, residentassistance available to the National advisers, and further studies to help improveInvestment Commission to promote and assist the capacity of the country to financethe development of SMEs. Total cost: $5 development projects and to stimulate privatemillion. investment in key sectors of the economy.
PAKISTAN: IDA-$30 million. A line of Total cost: $4.2 million.credit will be onlent through the Industrial EGYPT, ARAB REPUBLIC OF: IDA-$6.9Development Bank of Pakistan for the million. Technical assistance will be providedrefinancing of subloans by five commercial for preinvestment planning, feasibility andbanks for the development of small-scale engineering studies, and related work towardindustries and to provide extension services to the creation of permanent institutionalenterprises in woodworking and leather capabilities for sector planning and project
Telecommun cations 115
preparation in the agricultural ministry. Total output, as well as studies to identify potentialcost: $9.4 million. export products and markets and develop a
GUYANA: Bank---$1.5 million. To support more export-oriented industrial sector.related financing for structural adjustment, Training to upgrade accounting and auditingtechnical assistance will be made available to skills is also included. Total cost: $14 million.establish an export development fund, to UGANDA: IDA-$8 million. Technicalcarry out export-market studies, to provide assistance will be provided to help theadvisory services in industrial development government prepare a series of rehabilitationand export promotion, and to strengthen the and development projects suitable for outsidemonitoring of the investment program of the financing. Prefeasibility, feasibility, and otherpublic sector and improve systems of studies are included, as are support to localexpenditure control. Total cost: $2 million. agencies and training for project planning
MADAGASCAR: IDA-$] 1.5 million. The and preparation.project will assist the government in ZAIRE: IDA-$2.9 million. Technicalestablishing an appropriate instructional assistance will be provided to establish aprogram to provide qualified professionals in subregional development authority to provideaccounting and auditing, to provide industrial the institutional framework needed for themanagement consulting and audit services, implementation of a long-term agriculturaland to create a suitable legislative framework development program designed to increasefor the sector. Total cost: $14.2 million. production of food crops, livestock, and fish.
MAIAWI: Bank--$1 million. For a period of Cofinancing ($1 million) is being provided bythirty months, a technical-assistance project the GTZ. Total cost: $5.9 million.will provide the services of consultants to Telecommunicationsstudy the livestock, meat, and dairyindustries, to review the financial position of BURUNDI: IDA-$7.7 million.the Malawi Development Corporation and Telecommunication services will be expandedstrengthen its export-marketing capabilities, through 1984 by means of an improvementand to undertake studies that are needed in in the long-distance transmission networks insupport of a related structural-adjustment Bujumbura and various provincial towns andloan. Total cost: $1.17 million. by extending coverage to about forty villages
NIGERIA: Bank-$47 million. Technical through the installation of public call offices.assistance will be provided to help establish Technical assistance and training andan administrative structure and organization vehicles, tools, and related equipment will bethat can coordinate the development and provided. Total cost: $9.1 million.implementation of the government's food- INDIA: IDA-$314 million. Through theproduction plan developed in an effort to ease provision of additional direct-exchange lines,the country's serious food shortage. Total public call offices, telex facilities, and relatedcost: $120.1 million. equipment and by upgrading and
SENEGAL: IDA-$5.3 million. Technical modernizing the production facilities of threeassistance will be made available to support major manufacturers of telecommunicationsand strengthen the ability of the government equipment, the country's telecommunicationsto identify, select, prepare, monitor execution network will be expanded in fourof, and evaluate in retrospect its portfolio of metropolitan areas and extended to about 40development projects and to improve the million people living in small towns andmonitoring of public finance. Total cost: $6.2 villages who have never had access to publicmillion. telephones. Total cost: $1,619.4 million.
SUDAN: IDA-$6 million. This project will RWANDA: IDA-$7.5 million. Expansion ofsupport a three-year program designed to the urban cable network in several towns, byimprove the ability of the government to installation of a new exchange atimplement its current strategy of economic Rwamagana and replacement of ten existingstabilization by providing technical assistance exchanges, and expansion of the telexin the areas of project preparation, project exchange at Kigali will reduce theimplementation, and macroeconomic geographical isolation of the country frommanagement. Total cost: $6.8 million. other African countries, improve the internal
TANZANIA: IDA-$I I million. Technical telecommunications network, and extendassistance will be provided to identify, plan, service to several additional rural and urbanand implement projects in areas where there areas for the first time. Cofinancing is beingis little expertise in the country. Special provided by the FAC ($1.95 million), thestudies will be undertaken to improve the use CCCE ($1.95 million), and CIDA ($4of production facilities in order to increase million). Total cost: $17.5 million.
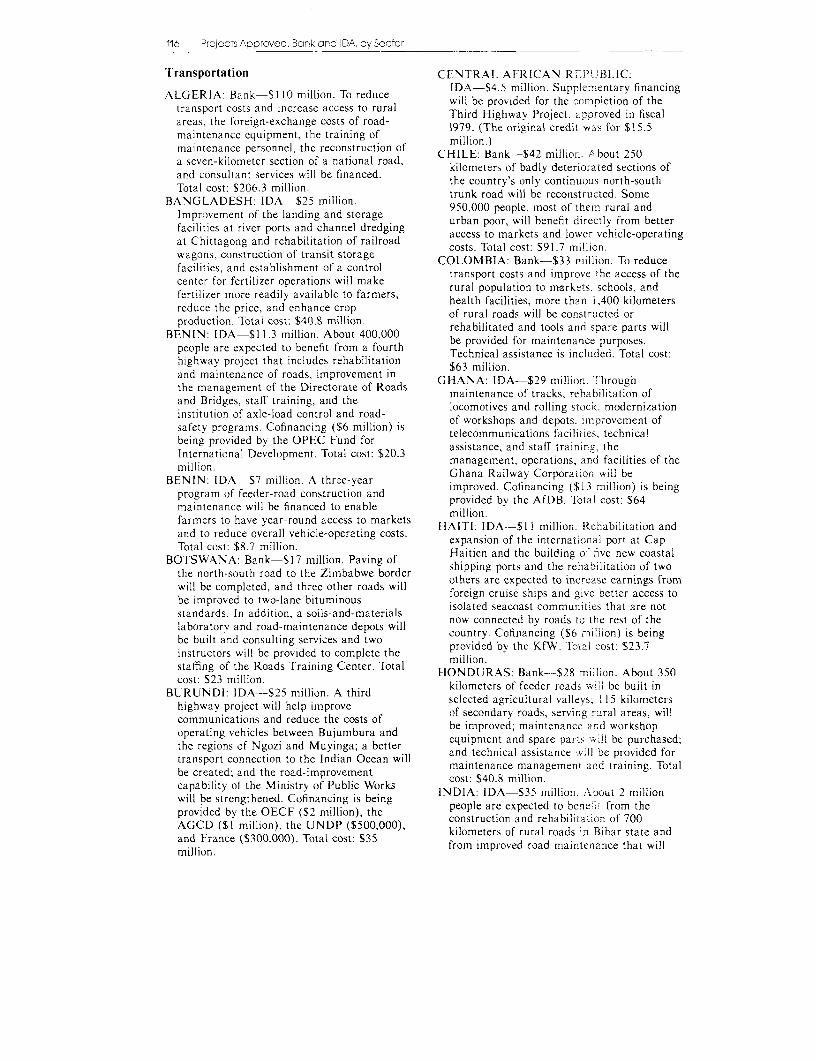
116 Projects Approved, Bark arc DA, by Sector
Transportation CENTRAL AFRICAN REPUBLIC:
ALGERIA: Bank-$I]10 million. To reduce IDA-$4.5 million. Supplementary financingtransport costs and increase access to rural Third Hi ghwav Projecth, cmppletdon of theareas, the foreign-exchange costs of road- 1979. (The original credit was for $15.smaintenance equipment, the training of 11maintenance personnel, the reconstruction of million.)a seven-kilometer section of a national road, CHILE: Bank-$42 milliorn.. About 250kilometers of badly deteriorated sections of
Total cost: $206.3 million. the country's only continuous north-southBANGLADESH: IDA $25 million. trunk road will be reconstructed. Some
Improvement of the landing and storage 950,000 people, most of them rural andurban poor, will benefit directly from betterfacilities at river ports and channel dredging access to markets and lower vehicle-operatingat Chittagong and rehabilitation of railroad costs. Total cost: $91.7 million.wagons, construction of transit-storage COLOMBIA: Bank-$33 million. To reducefacilities, and establishment of a controlcenter for fertilizer operations will make transport costs and improve the access of thefertilizer more readily available to farmers, rural population to markets. schools, andredue tlhe morie, reandl enhance rop farmershealth facilities, more than i,400 kilometersreduce the price, and enhance cropofralodswlbecntuedrproduction. Total cost: $40.8 million. of rural roads will be constructed or
BENIN: IDA $11.3 million. About 400,000 rehabilitated and tools and spare parts willpeople are expected to benefit from a fourth be provided for maintenance purposes.highway project that includes rehabilitation Technical assistance is included. Total cost:and maintenance of roads, improvement GHANA: IDA-$29 million. Throughthe management of the Directorate of Roads mAiNAn of tc,eili. Tatongoand Bridges, staff training, and the macmtenance of tracks, rehabolktatdon ofinstitution of axle-load control and road- gsafety programs. Cofinancing ($6 million) is telecommunipcationsfaipotis, mrovement ofbeing provided bv the OPEC Fund for . . .International Development. Total cost: $20.3 assistance, and staff trainng, themillion. management, operations, and facilities of the
BENIN: IDA $7 million. A three-year Ghana Railway Corporation will beimproved. Cofinancing ($13 million) is beingprogram of feeder-road construction and provided by the AfDB. Total cost: $64
maintenance will be financed to enable y .farmers to have vear-round access to markets million.
HAITI: IDA-$I I million. Rehabilitation andand to reduce overall vehicle-operating costs. expansion of the international port at Cap
BOTSWANA: Bank-517 million. Paving of Haitien and the building of five new coastalthe north-south road to the Zimbabwe border shipping ports and the rehabilitation of twowill be completed, and three other roads will others are expected to increase earnings frombe improved to two-lane bituminous foreign cruise ships and give better access tobe ~ ~ . imroe to twolated bituminoustG ha ae ostandards. In addition, a soils-and-materials isolated seacoast communities that are notlaboratory and road-maintenance depots will now connected by roads to the rest of thebe built and consulting services and two country. Cofinvancing (6 million) is beinginstructors will be provided to complete the provided b. the KfW. To.al cost: $23.7staffing of the Roads Training Center. Total million.
HONDURAS: Bank----S28 million. About 350cost: $23 million.kioeesofedrraswlbeultnBURUNDI: IDA-$25 million. A third seklcted agricultural vallesll be built in
highway project will help improve of secondarg roads servir;g rural areas willcommunications and reduce the costs of g . 'operating vehicles between Bujumbura and be improved; maintenance and workshopthe regions of Ngozi and Muyinga; a better equapment and spare parn s will be purchased;transport connection to the Indian Ocean will maintenance managemene aind be provided forbe created; and the road-improvement costenance man.capability of the Ministry of Public Works cost: $40.8 million.INDIA: IDA-S-35 million. About 2 millionwill be strengthened. Cofinancing is being a expecte tone f the
providd by he OEC ($2 illion, thepeople are expected to bene ........... from theprovided by the OECF ($2 million), the construction and rehabilitation of 700AGCD ($1 million), the UNDP ($500,000), kilometers of rural roads ;o Bihar state andand France ($300,000). Total cost: $35 from improved road maintenance that willmillion.

Transportation 117
permit all-weather transport between farms industries with access to internationaland markets and facilitate rural development. maritime transport. Total cost: $24 million.Total cost: $52.9 million. PANAMA: Bank-$19 million. During a four-
IVORY COAST: Bank-$100 million. Part of year period, some 400 kilometers of pavedthe foreign-exchange costs of the 1981-83 roads and 50 kilometers of gravel roads willhighway investment program will be be rehabilitated; a road-maintenancefinanced, including road construction and program will be established; and technicalrehabilitation of roads, the purchase of road assistance will be provided to the Ministry ofand laboratory equipment, and technical Planning and Economic Policy to strengthenassistance and training for various transport planning. Total cost: $31.7 million.directorates of the Ministry of Public PERU: Bank-$58 million. To increase theWorks.Total cost: $166 million. efficiency and security of civil aviation and
KENYA: Bank-$58 million. To increase the improve service to the eastern jungle andefficiency and reliability of the Kenya jungle highland regions, one airport will beRailways Corporation and to expand the use built, three others will be improved, andof rail transport, the purchase of essential communications, navigation, and aviationtrack rehabilitation equipment and equipment will be provided throughout theimprovements in operation will be financed. country. Technical assistance is included.Cofinancing is being provided by the KfW Cofinancing ($19 million) is being provided($16.7 million) and the AfDB ($7.5 million). by the KfW. Total cost: $127.6 million.Total cost: $133.8 million. SIERRA LEONE: IDA-$10 million.
MALAWI: IDA-$33 million. During a five- Equipment, spare parts, technical assistance,year period, large sections of the country's and training will be provided to strengthenprincipal north-south road will be constructed and improve the efficiency of the country'sor improved in order to achieve a more road-maintenance organization, to reducebalanced distribution of resources between transportation costs, and to increase thethe rural and urban areas, particularly the accessibility of remote agricultural areas.less-developed northern region. Consulting Cofinancing is being provided by the ADFservices and training are included. Total cost: ($8.2 million) and the OPEC Fund for$39.2 million. International Development ($7 million). Total
MALI: IDA-$17 million. To prevent the cost: $29 million.deterioration of the country's road- SRI LANKA: IDA-$13.5 million. To increasemaintenance capability, a two-and-a-half the supply of trained manpower and improveyear program of routine maintenance the level of technical management expertisecovering more than 6,000 kilometers of in the construction industry, training will benational, regional, and feeder roads will be provided to about 45,000 unskilled workers,undertaken. Periodic maintenance of about 9,600 skilled workers, 1,800 mechanical900 kilometers of paved and gravel roads and equipment operators, and 1,000 supervisorsa program of axle-load control will also be and managers. Equipment and technicalundertaken. Technical assistance is included. assistance are included. Total cost: $25Cofinancing ($10 million) is being provided million.by the SDC. Total cost: $43.3 million. THAILAND: Bank-$53 million. Development
MEXICO: Bank-$150 million. The of the inland waterways and coastal portsproject-including rehabilitation of tracks, that serve the country's north and centralthe provision of machinery, equipment, corridor will provide about II million peoplelocomotives, and freight cars, and the with cheaper transportation for the export ofinstallation of a central traffic-control rice and corn and for imports, such assystem-has the aim of enabling the petroleum products. Total cost: $80.4 million.National Mexican Railways to meet the THAILAND: Bank-$47 million. Portincreasing demand for railway transport. facilities at Bangkok and Sattahip will beCofinancing ($94 million) is being provided improved and expanded through theby the U.S. Export-Import Bank. Total cost: construction of freight stations and$1,527 million. warehouses, procurement of necessary
MEXICO: Bank-$14 million. The services of mechanical equipment, and civil works. Totalconsultants will be provided for the planning, cost: $109.2 million.study, and design of industrial development TOGO: IDA-$20 million. A fourth highwayat five principal ports in order to decentralize project includes a three-year trainingeconomic activity and growth to areas outside program for road-maintenance personnel, thethe central plateau and to provide local procurement of equipment and spare parts,

118 Projects Approved, Bank and IDA, by Sector
preinvestment studies, and technical INDONESIA: Bank-$43 million. Basicassistance to improve transport planning and infrastructure-including water supply,railway operations. Cofinancing ($7.4 sanitation, roads, footpaths, schools, andmillion) is being provided by the OPEC Fund health facilities-will be provided to aboutfor International Development. Total cost: 800,000 people who live in low-income areas$31.2 million. of nine cities, and training equipment and
UPPER VOLTA: IDA $46 million. During a materials will be made available to morefour-year period, more than 6,000 kilometers than 400 community health workers.of paved and gravel roads will be Technical assistance and consulting servicesrehabilitated and maintained and about are included. Total cost: $86.1 million.1,640 kilometers of feeder roads will be JORDAN: Bank $21 million. This first Bank-constructed and maintained to provide better assisted urban development project in theaccess to rural areas. Technical assistance is country includes a provision for housing onincluded. Cofinancing ($8 million) is being seven sites in the Amman region for 41,000provided by the NMDC. Total cost: $73 low-income residents and, in addition,million. community facilities, maintenance
YEMEN, PFOPLE'S DEMOCRATIC equipment, assistance to small businesses,REPUBLIC OF: IDA $12.5 million. To manpower training, and services ofpromote the social, economic, and consultants for project management,administrative integration of the country, a supervision, and related studies. Total cost:ninety-two-kilometer, two-lane paved road $57.6 million.will be constructed that will improve access KOREA, REPUBLIC OF: Bank-$90 million.to three towns in the isolated Shabwah About 380 hectares of urban residential landgovernorate. Cofinancing is being provided in ten cities will be developed, including theby the KFAED ($10.5 million) and the construction of 8,500 housing units andOPEC Fund for International Development communit and commercial facilities for low-($10.5 million). Total cost: $42.8 million. income households and technical assistance
YUGOSLAVIA: Bank-$34 million. The for staff training, professional services, andthree-year project-including reconstruction project preparation. Total cost: $240 million.of an important junction, installation of MAURITIUS: Bank-$15 million. Funds willmodern signaling and telecommunicationsMARTU:B k-lmiio.Fnswl
modern signaling and teeomnctos be onlent through four local institutions toequipment, procurement of rolling stock and beponlent through fou insin torelated equipment, and training and technical support land development for housig and
community facilities, housing credit for homeassistance-represents one phase of a plan ipoeetadcntuto,rhblttofor improving the capacity and efficiency of improvement and construction rehabilitationthe rail network in Kosovo, the weakest part of housing and urban services damaged byof the country's rail system. Total cost: $67.5 cylnes,r and teirem of pubicmillion, transportation and sewage facilities.
million. Cofinancing ($4.5 million) is being providedUrbanization by the SFD. Total cost: $24.5 million.BRAZIL: Bank-$90 million. By strengthening MEXICO: Bank-$164 million. Urban and
the Brazilian Urban Transport Company regional development will be supported inthrough institution building and technical three southeastern states through theassistance and by supporting transport- provision of shelter-related facilities, citywideinvestment progams and a low-cost paving infrastructure, municipal facilities andprogram, transport services will be improved services, credits to artisans and small-scalein the low-income areas of several cities. enterprises, industrial estates, and throughTotal cost: $257 million. various studies and support activities. Total
INDIA: IDA-$42 million. A second urban cost: $468 million.development project in Madras includes the MOROCCO: Bank-$36 million. The effortsdevelopment of about 15,000 residential and of the government to improve the standards200 industrial plots on two sites, the of living of some 66,000 low-income residentsprovision of basic infrastructure and land of the cities of Meknes and Kenitra will betenure to 50,000 slum households, home supported by upgrading squatter settlements,improvement loans and grants to 80,000 slum constructing serviced residential plots andhouseholds, the procurement of 550 buses, community facilities, providing credit forconstruction and maintenance of roads, and home improvement, providing technicalan improvement in management of solid assistance, and financing studies for thewastes. Technical assistance and training are preparation of new urban developmentincluded. Total cost: $84 million. projects. Total cost: $81.1 million.

Water Supply and Sewerage 119
Water Supply and Sewerage several of the larger towns and smaller
BENIN: IDA -$5 million. To help meet the centers will have better access to a safe waterwater-supply and sanitation needs of supply through a third water-supply projectCotonou----the largest city and economic that includes the construction of water-supplycenter of the country--master plans will be systems, a revolving fund to finance credit toprepared for water supply and sanitation and low-income households for house connections,urban development, the tariff and accounting a line of credit to the Office National desystems will be reviewed, bidding documents l'Eau Potable to expand water-supplywill be prepared, and the water-distribution facilities, and technical assistance andsystem will be extended by about eighty-two training. Total cost: $169 million.kilometers to low-income areas. Total cost: NEPAL: IDA--$27 million. About 720,000$6.3 million. people will benefit from a third water-supply
BRAZIL: Bank-$180 million. Piped water and sewerage project that is intended to helpwill be provided to some 2.5 million people meet the government's goal of providing safeand sewerage to 600,000 people living in five water to all the urban population by 1990.states and in the Federal district to help Water-supply and sewerage works initiatedimprove general health conditions and reduce by two earlier projects will be improved andthe incidence of disease. Total cost: $589 expanded, and water-supply systems in sixmillion. additional towns will be upgraded.
COSTA RICA: Bank-$26 million. To Cofinancing ($600,000) is being provided bvalleviate water shortages in San Jose and the UNDP. Total cost: $33.3 million.improve services throughout the country, a NICARAGUA: Bank-$3.7 million. Finaltwenty-seven-kilometer transmission pipe will designs, technical specifications, and contractbe constructed, water mains in low-income documents will be prepared for theareas of San Jose %kill be replaced, 30,000 development of a groundwater aquifer nearnew water meters will be installed, and a Managua to provide the least-cost solutionwater-supply master plan will be prepared for for meeting that city's needs for water duringSan Jose and three other cities. Technical the next two decades. Cofinancingassistance is included. Cofinancing ($13.8 ($100,000) is being provided by the IDB.million) is being provided by the CDC. Total Total cost: $5.06 million.cost: $55.3 million. PARAGUAY: Bank $11.8 million. Basic
EGYPT. ARAB REPUBLIC OF: IDA-$56.6 water-supply and sanitation services will bemillion. This project, the aim of which is to provided to some 73,000 people living inexpand and rehabilitate water-supply vided to somea73,00 people li nfacilities in Beheira, will lend support to the villages in the southeastern part of thegovernment's policy to decentralize country. Technical assistance and traiingresponsibility for basic services to the are icluded. Total cost: $20.8 millon.governorates. In addition to improving UGANDA: IDA $9 million. The governmentsupplies for more than the present 2 million will be assisted in completing preparation forconsumers, about 800,000 people-including urban water-supply investments in seven600,000 low-income residents-will be towns so that water and sanitation servicesprovided with safe drinking water. Total cost: can be extended to about 1.5 million people.$1 18.38 million. Feasibility studies, a tariff study, and a
MEXICO: Bank--$125 million. Water supply manpower training study will be undertakenwill be provided to about 1.2 million people and water meters, vehicles, and staff housingand sewerage to nearly 1.3 million people in will be provided. Total cost: $18 million.several cities through the construction of YEMEN, PEOPLE'S DEMOCRATICwater-distribution networks, sewage- REPUBLIC OF: IDA $3.5 million. Thetreatment plants, and related facilities. In existing water-supply system of Al Mukallaaddition, a technical-assistance program to will be rehabilitated and plans for new water-improve the operation and service capabilities production facilities will be prepared in orderof local companies is included. Total cost: to expand the water-distribution network into$318 million. the poorer sections of the city and to help
MOROCCO: Bank $87 million. Some 1.6 meet the demand for water through 1984.million people living in low-income areas of Total cost: $4.4 million.
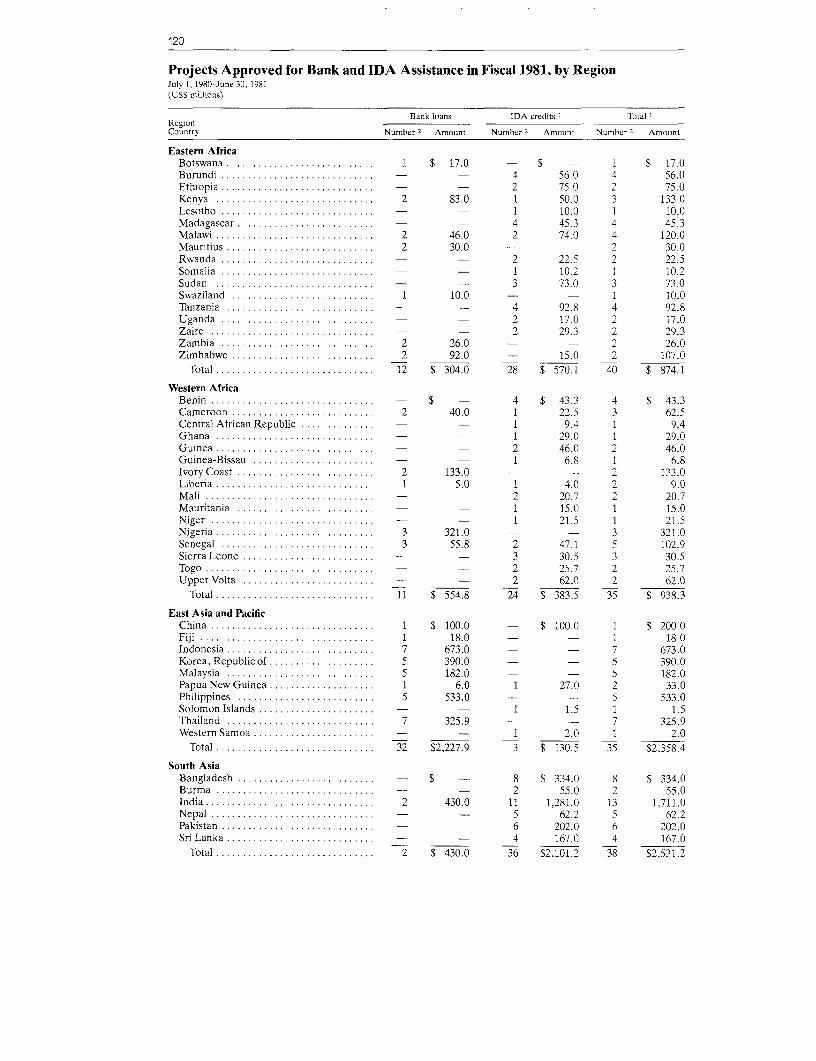
120
Projects Approved for Bank and IDA Assistance in Fiscal 1981, by RegionJuly 1,1980-June 30, 1981(USS millions)
Bank loans IDA credits : Total IRegionCountry Number 2 Amount Number 2 Amount Number 2 Amount
Eastern AfricaBotswana ............................ 1 $ 17.0 - $ - 1 $ 17.0Burundi ............................. - - 4 56.0 4 56.0Ethiopia ............................. - - 2 75.0 2 75.0Kenya . ............................. 2 83.0 1 50.0 3 133.0Lesotho 1............................. - - 10.0 1 10.0Madagascar . . ........................ - - 4 45.3 4 45.3Malawi ............................... 2 46.0 2 74.0 4 120.0Mauritius ............................ 2 30.0 - - 2 30.0Rwanda ............................. - - 2 22.5 2 22.5Somalia ............................. - - 1 10.2 1 10.2Sudan ............................ - - 3 73.0 3 73.0Swaziland .............. ............. 1 10.0 - - 1 10.0Tanzania ............................. - - 4 92.8 4 92.8Uganda ............................. - 2 17.0 2 17.0Zaire ............................... - - 2 29.3 2 29.3Zambia ............................. 2 26.0 - - 2 26.0Zimbabwe ........................... 2 92.0 - 15.0 2 107.0
Total ............................. . 12 S 304.0 28 $ 570.1 40 $ 874.1
Western AfricaBenin ............................... - $ - 4 $ 43.3 4 $ 43.3Cameroon ........................... 2 40.0 1 22.5 3 62.5Central African Republic ...... ........ - - 1 9.4 1 9.4Ghana ............................ .. - - 1 29.0 1 29.0Guinea .............................. - - 2 46.0 2 46.0Guinea-Bissau ....................... - - 1 6.8 1 6.8Ivory Coast ............... ........... 2 133.0 - - 2 133.0Liberia .............................. 1 5.0 1 4.0 2 9.0Mali ............................... - - 2 20.7 2 20.7Mauritania ................ ..........- 1 15.0 1 15.0Niger ............................... - - 1 21.5 1 21.5Niaeria .............................. 3 321.0 - - 3 321.0Senegal ............................. 3 55.8 2 47.1 5 102.9Sierra Leone ............. ............ - - 3 30.5 3 30.5Togo ................................ - - 2 25.7 2 25.7Upper Volta ............ ............. - - 2 62.0 2 62.0
Total .............................. 11 $ 554.8 24 $ 383.5 35 $ 938.3
East Asia and PacificChina ............................... 1 $ 100.0 - $ 100.0 1 $ 200.0Fiji ................................. 1 18.0 - - 1 18.0Indonesia ............................ 7 673.0 - - 7 673.0Korea, Republic of ........ ............ 5 390.0 - - 5 390.0Malaysia ............................. 5 182.0 - - 5 182.0Papua New Guinea ........ ............ 1 6.0 1 27.0 2 33.0Philippines ............... ........... 5 533.0 - - 5 533.0Solomon Islands ...... ............... - - 1 1.5 1 1.5Thailand ............................. 7 325.9 - - 7 325.9Western Samoa ....... ............... - - 1 2.0 1 2.0
Total .............................. 32 $ 2,227.9 3 $ 130.5 35 $2,358.4
South AsiaBangladesh .............. ............ - $ - 8 $ 334.0 8 $ 334.0Burma .............................. - - 2 55.0 2 55.0India ................................ 2 430.0 11 1,281.0 13 1,711.0Nepal ............... ............... - - 5 62.2 5 62.2Pakistan ............................. - 6 202.0 6 202.0SriLanka ............................. - - 4 167.0 4 167.0
Total .............. ............... 2 $ 430.0 36 $2,101.2 38 $2,531.2

Projects Approved, by Region 121
Bank loans IDA credits I Total IRcgionCountry Number
2Amount Number
2Amount Number
2Amount
Europe, Middle East, and North AfricaAlgeria .............................. 1 $ 110.0 - $ - 1 $ 110.0Cyprus .............................. 1 14.0 - - 1 14.0Egypt, Arab Republic of ....... ....... 2 89.0 5 197.6 7 286.6Jordan ............. ................ 2 46.0 - - 2 46.0Morocco . ........................... 3 223.0 - - 3 223.0Portugal ............................. 2 120.0 - - 2 120.0Romania . ........................... 4 360.0 - - 4 360.0Syrian Arab Republic ....... .......... 1 15.6 - - 1 15.6Tunisia .............................. 6 152.6 - - 6 152.6Turkey .............................. 8 722.0 - - 8 722.0Yemen Arab Republic ....... .......... - - 3 41.0 3 41.0Yemen, People's Democratic Republic of - - 3 24.0 3 24.0Yugoslavia . ......................... 4 321.0 - - 4 321.0
Total .............................. 34 $2,173.2 11 $ 262.6 45 $ 2,435.8
Latin America and the CaribbeanArgentina ............................ 2 $ 68.0 - $ - 2 $ 68.0Bahamas . ........................... 1 7.0 - - 1 7.0Barbados ............................ 1 6.0 - - 1 6.0Brazil ............................... 8 844.0 - - 8 844.0Chile ............................... 2 78.0 - - 2 78.0Colombia ............................ 5 550.0 - - 5 550.0Costa Rica ............................ 2 29.0 - - 2 29.0Dominican Republic ....... ........ 1 24.0 - - 1 24.0Ecuador ............................. 1 20.0 - - 1 20.0Guyana ........................ .. 3 23.5 - 8.0 3 31.5Haiti ................................ - - 3 21.2 3 21.2Honduras ............................ 1 28.0 - - 1 28.0Jamaica ............................. 2 44.5 - - 2 44.5Mexico .............................. 7 1,081.0 - - 7 1,081.0Nicaragua ............................ 2 33.7 1 5.0 3 38.7Panama ............................. 3 45.5 - - 3 45.5Paraguay . ........................... 3 58.8 - - 3 58.8Peru ................................ 4 148.0 - - 4 148.0Uruguay . ........................... 1 30.0 - - 1 30.0
Total ......................... .... 49 $3,119.0 4 $ 34.2 53 $ 3,153.2
GRAND TOTAL .......... ............. 140 $8,808.9 106 $3,482.1 246 $12,291.0
i All supplements are tncluded in the amounts, but are not counted as separate lending operations.'Joint Bank/IDA operations are counted only once, as Bank operations.

122
Projects Approved for Bank and IDA Assistance in Fiscal 1981, by PurposeJuly 1, 198(0-June 30. 1981(USS millions)
Purpose' Bank IDA Total
Agriculture and Rural DevelopmentBangladesh-Agricultural credit ....... ....................... s - $ 40.0 $ 40.0Bangladesh-Irrigation and drainage ...... .................... - 18.( 18.0Benin-Area development ......... .......................... - 20.0 20.0Brazil-Area development ......... .......................... 56.0 - 56.0Brazil-Area development ......... .......................... 29.0 - 29.0Brazil-Research and extension ....... ....................... 60.0 - 60.0Burma-Agroindustry .......... ............................ - 23.0 23.0Burma-Forestry ...-....................................... 32.0 32.0Burundi-Area development ........ ......................... - 19.3 19.3Cameroon-Area development ........ ....................... 25.0 12.5 37.5Chile-Agricultural credit ................................ 36.0 - 36.0Colombia-Irrigation and drainage ....... .................... 37.0 - 37.0Cyprus-Agricultural credit ........ .......................... 14.0 _ 14.0Dominican Republic-Perennial crops ...... .................. 24.0 - 24.0Ecuador-Area development ........ ........................ 20.0 - 20.0Egypt, Arab Republic of-Fisheries ...... .................... - 14.0 14.0Egypt. Arab Republic of-Irrigation and drainage ..... ......... - 80.0 80.0Ethiopia-Area development ........ ........................ - 40.0 40.0Guinea-Livestock ............ ............................. - 17.5 17.5Haiti-Perennial crops .......... ............................ - 3.2 3.2India-Agricultural credit ......... .......................... - 125.0 125.0India-Irrigation and drainage ........ ....................... 30.0 - 30.0India-Irrigation and drainage ............ .................. - 54.0 54.0India-Irrigation and drainage .............. ................ - 83.0 83.0India-Irrigation and drainage ........ ....................... - 140.0 140.0India-Research and extension ........ ....................... - 28.0 28.0India-Research and extension ........ ....................... - 37.0 37.0India-Research and extension ....... ........................ - 23.0 23.0Indonesia-Area development ......... ...................... 161.0 - 161.0Indonesia-Irrigation and drainage ...... ..................... 22.0 - 22.0Indonesia-Perennial crops ..... ............................ 46.0 - 46.0Kenya-Agricultural credit ........ .......................... 25.0 10.0 35.0Korea, Republic of-Agricultural credit ...... ................. 50.0 - 50.0Madagascar-Agricultural credit ....... ...................... - 11.5 11.5Madagascar-Forestry .......... ............................ - 20.0 20.0Madagascar-Irrigation and drainage ...... ................... - 2.3 2.3Malaysia-Agricultural credit ........ ........................ 30.0 - 30.0Malaysia-Area development ........ ........................ 25.0 - 25.0Malaysia-Area development ........ ..................... 37.0 - 37.0Malaysia-Irrigation and drainage ....... ..................... 40.0 - 40.0Malaysia-Irrigation and drainage ....... ..................... 50.0 - 50.0Mauritania-Irrigation and drainage ...... .................... - 15.0 15.0Mexico-Agricultural credit ................... ............. 325.0 - 325.0Mexico-Irrigation and drainage ....... ...................... 280.0 - 280.0Mexico-Irrigation and drainage ............................. 23.0 23.0Nepal-Agroindustrv ................ ...................... - 6.2 6.2Nepal-Agroindustrv ........... ............................ - 8.0 8.0Nepal-Irrigation and drainage ....... ....................... - 3.5 3.5Nepal-Research and extension ....... ....................... - 17.5 17.5Nigeria-Area development ....... ........................ 142.0 - 142.0Nigeria-Area development ........ ......................... 132.0 - 132.0Pakistan-Agroindustry .......... ............... ........ - 32.0 32.0Pakistan-Irrigation and drainage................... ...... - 41.0 41.0Pakistan-Research and extension ....... ..................... - 24.0 24.0Papua New Guinea-Agricultural credit ...... ................. - 15.0 15.0Paraguay-Livestock ............ ............................ 30.0 - 30.0Philippines-Agricultural credit ................ ............. 45.0 - 45.0Philippines-Irrigation and drainage ...... .................... 38.0 - 38.0Romania-Livestock ............ ............................ 80.0 - 80.0Romania-Irrigation and drainage ....... ..................... 75.0 - 75.0

Projects Approved by Purpose 123
Purposcl Bank IDA lotal
Agriculture and Rural Development (continued)Romania-Irrigation and drainage ............................ $ 80.0 - s 80.0Rwanda-Perennial crops ................... - $ 15.0 15.0Senegal-Forestry ....... .............. - 9.3 9.3Sierra Leone-Area development . .............. - 12.0 12.0Sierra Leone-Area development . . - 8.5 8.5Sri Lanka-Area development ................. - 33.5 33.5Sri Lanka-Irrigation and drainage . . - 90.0 90.0Sri Lanka-Irrigation and drainage . .............. - 30.0 30.0Sudan-Irrigation and drainage ................ - 32.0 32.0Sudan-Irrigation and drainage ................ - 35.0 35.0Tanzania-Perennial crops .......... ........ - 6.8 6.8Thailand-Irrigation and drainage . ............... 57.0 - 57.0Thailand-Research and extension . ............... 30.0 - 30.0Tunisia-Area development ................... 24.0 - 24.0Turkey-Perennial crops . . 40-0 - 40.0Upper Volta-Area development ................ - 16.0 16.0Western Samoa-Agriculture sector loan . ........... - 2.0 2.0Yemen Arab Republic-Area development . .......... - 17.0 17.0Yemen, People's Democratic Republic of-Area development .... - 8.0 8.0Yugoslavia-Agroindustry .................... 90.0 - 90.0Yugoslavia-Area development ................. 87.0 - 87.0Zaire-Agroindustry ..................... - 26.4 26.4Zambia-Area development ................... 11.0 - 11.0
Total ................................................... S2,406.0 $1,357.0 $3,763.0
Development Finance CompaniesBangladesh ................................................ $ - $ 50.0 $ 50.0Haiti ..................................................... - 7.0 7.0Jamaica ................................................... 37.0 - 37.0Korea. Republic of ......................................... 100.0 - 100.0Korea, Republic of ........................... ............. 60.0 - 60.0Korea, Republic of .............. , . . 90.0 - 90.0Morocco ............ ...................................... 100.0 - 100.0Nicaragua ................................................. 30.0 - 30.0Panama ................................................... 20.0 - 20.0Peru . ..................................................... 60.0 - 60.0Philippines ................................................ 150.0 - 150.0Portugal . .................................................. 100.0 - 100.0Solomon Islands ............................................. - 1.5 1.5Thailand .................................................. 30.0 - 30.0Turkev ................................................... 70.0 - 70.0Turkey ................................................... 40.0 - 40.0Uruguay .................................................. 30.0 - 30.0Yemen Arab Republic ............. .......................... - 12.0 12.0Yugoslavia ............. ................................... 110.0 - 110.0Zambia . .................................................. 15.0 - 15.0
Total ................................................... $1,042.0 $ 70.5 $1,112.5
EducationArgentina ................................................. $ 58.0 $ - $ 58.0Bahamas . .7.0 - 7.0Central African Republic' .- 0.9 0.9China .100.0 100.0 200.0Egypt, Arab Republic of .- 40.1 40.1Ethiopia .- 35.0 35.0Indonesia .45.0) - 45.0Kenya .- 40.0 40.0Lesotho .- 10.( 10.0Malawi .- 41.0 41.0
(continued)

124
Projects Approved for Bank and IDA Assistance in Fiscal 1981, by Purpose (continued)
July 1, 1980-June 30, 1981(US$ millions)
Purpose I Bank IDA Total
Education (continued)Niger ................................................... 21.5 21.5Pakistan ....... ......................................... - 25.0 25.0Papua New Guinea .................... ..................... 6.0 12.0 18.0Paraguay .................................................. 17.0 - 17.0Philippines ....................... ........................ 100.0 - 100.0Somalia ................................................... - 1(0.2 10.2Syrian Arab Republic ................... .................... 15.6 - 15.6Tanzania .................................................. - 25.(0 25.0Tunisia ................................................... 26.0 - 26.0
Total ........................................... S....... $ 374.6 $ 360.7 $ 735.3
EnergyOil, gas, and coalArgentina .............. ................................... S 10.0 S - $ 10.0Bangladesh ................................................ - S5.( 85.0Costa Rica ................................................. 3.0 - 3.0Egypt, Arab Republic of ................. .................. 25.0 - 25.0Guinea-Bissau ...................... .. ...................... - 6.8 6.8India .................................................... 400.0 - 400.0Jamaica ................................................... 7.5 - 7.5Liberia .................................................... 5.0 - 5.0Mali ........................... ........................... - 3.7 3.7Panama ................................................... 6.5 - 6.5Portugal .................................................. 20.0 - 20.0Turkey .................................................... 62.0 - 62.0Turkey .................................................... 25.0 - 25.0
Total .................................................... $ 564.0 S 95.5 $ 659.5
PowerBarbados .................................................. $ 6.0 S - S 6.0Brazil ................................................... 125.0 - 125.0Brazil ................................................... 54.0 - 54.0Colombia .................................................. 359.0 - 359.0Colombia .................................................. 36.0 - 36.0Colombia .................................................. 85.0 - 85.0Guinea ........ _ .28............. 28.5 28.5Guyana ................................................. 8.0 - 8.0Indonesia ................................. ................ 250.0 -- 250.0Ivory Coast ................................................ 33.0 - 33.0Jordan .................................................. 25.0 - 25.0Peru ................................................... 25.0 - 25.0Romania .................................................. 125.0 - 125.0Swaziland ......................... ......................... 10.0 - 10.0Thailand ................................................... 100.0 - 100.0Tunisia ................................................... 41.5 - 41.5Yemen Arab Republic .................... ................... - 12.0 12.0
Total ................................ .................. $1,282.5 S 411.5 $ 1,323.0
IndustryBrazil-Fertilizer and other chemicals ....... .................. $ 250.0 s - $ 250.0Burundi-Mining, other extractive ...... ...... ............. - 4.0 4.0Egypt. Arab Republic of-Iron and steel .... ................. 64.0 - 64.0India-Fertilizer and other chemicals ....... .................. - 4011.0 400,0Peru-Iron and steel .............. .......................... 5.0 - 5.0Senegal-Fertilizer and other chemicals ...... ................. 19.3 - 19.3Thailand-Fertilizer and other chemicals ...... ................ 8.9 - 8.9Togo-Fertilizer and other chemicals ....... .................. - 5.7 5.7Tunisia-Textiles ............ .............................. 18.6 - 18.6Turkey-Fertilizer and other chemicals ...... .................. 110.0 - 110.0
Total ....... S............................................ 5 475.8 $ 4119.7 $ 885.5

Projects Approved, by Purpose 125
Purpose' Bank IDA Total
NonprojectBangladesh .......... ..................................... $ - $ 65.0 $ 65.0Fiji ..................................................... 18.0 - 18.0Guyana ................................................... 14.0 8.0 22.0Malawi .................................................... 45.0 - 45.0Mauritius .................................................. 15.0 - 15.0Nicaragua ..................................... ........... - 5.0 5.0Pakistan ................................................... - 50.0 50.0Philippines ................................................. 200.0 - 200.0Senegal .................................................... 30.0 30.0 60.0Tanzania ................................................... - 50.0 50.0Turkey .................................................... 300.0 - 300.0Turkey .................................................... 75.0 - 75.0Zimbabwe ................................................. 50.0 15.0 65.0Zimbabwe ................................................. 42.0 - 42.0
Total .................................................... $ 789.0 $ 223.0 $ 1,012.0
Population, Health, and NutritionTunisia .................................................... $ 12.5 $ - $ 12.5
Total .................................................... $ 12.5 $ - $ 12.5
Small-Scale EnterprisesBangladesh ................................................ $ - $ 35.0 $ 35.0Cameroon ................................................. 15.0 - 15.0Indonesia .................................................. 106.0 - 106.0Liberia .................................................... - 4.0 4.0Pakistan ................................................... - 30.0 30.0Senegal .................................................... 6.5 2.5 9.0Tunisia .................................................... 30.0 - 30.0
Total .................................................... $ 157.5 $ 71.5 $ 229.0
Technical AssistanceBangladesh ................................................ $ - $ 16.0 $ 16.0Cameroon ................................................. - 10.0 10.0Central African Republic ................... - 4.0 4.0Egypt, Arab Republic of ................... - 6.9 6.9Guyana ................................................... 1.5 - 1.5Madagascar ................................................ - 11.5 11.5Malawi .................................................... 1.0 - 1.0Nigeria .................................................... 47.0 - 47.0Senegal ................................................... - 5.3 5.3Sudan ..................................................... - 6.0 6.0Tanzania ................................................... - 11.0 11.0Uganda ................................................... - 8.0 8.0Zaire ..................................................... - 2.9 2.9
Total .................................................... $ 49.5 $ 81.6 $ 131.1
TelecommunicationsBurundi ................................................... $ - $ 7.7 $ 7.7India ..................................................... - 314.0 314.0Rwanda ................................................... - 7.5 7.5
Total .................................................... $ - $ 329.2 $ 329.2
TransportationAlgeria-Highways ......................................... $ 110.0 $ - $ 110.0Bangladesh-Transportation sector loan . ............ - 25.0 25.0Benin-Highways ....................... - 11.3 11.3Benin-Highways ....................... - 7.0 7.0Botswana-Highways ....................................... 17.0 - 17.0Burundi-Highways ......... . ............................. - 25.0 25.0
(continued)

126
Projects Approved for Bank and IDA Assistance in Fiscal 1981, by Purpose (continued)
July 1, 198(0-June 30, 1981(us8 millions)
Purposce Bank IDA Total
Transportation (continued)Central African Republic-Highways 2. . 4.5 4.5Chile-Highways .42.0 - 42.0Colombia-Highways .33.0 - 33.0Ghana-Railways .- 29.0 29.0Haiti-PoTts and waterways .- 11.(0 11.0Honduras-Highwavs .28.0 - 28.0India-Highways.. - 35.0 35.0Ivory Coast-Highways .100.( - 100.0Kenva-Railways .58.0 58.0Malawi-Highways .- 33.0) 33.0Mali-Hihways.. - 17.0 17.0Mexico-Railways .150.0 - 150.0
Mexico-Transportation sector loan .14.0 - 14.0Panama-Highwvays .19.0 - 19.0
Peru-Airlines and airports .58.0 - 58.0Sierra Leone-Highways .- 10.0 10.0Sri Lanka-Transportation sector loan .- 13.5 13.5Thailand-Ports and waterways .47.0 - 47.0Thailand-Transportation sector loan .53.0 - 53.0Togo-Highways .- 20.0 20.0Upper Volta-Highways.- 46.0 46.0Yemen, People's Democratic Republic of-Highways .- 12.5 12.5Yugoslavia-Railways .34.0 - 34.0
Total .$ 763.0 $ 299.8 S 1,062.8
Urbanization
Brazil .$ 90.0 $ - $ 90.0
India ..- 42.0 42.0Indonesia .. 43.0 - 43.0Jordan .. 21.0 - 21.0Korea, Republic of .. 90.0 - 90.0Mauritius .. 15.0 - 15.0
Mexico .. 164.0 - 164.0Morocco .. 36.0 - 36.0
Total .$ 459.0 $ 42.0 $ 501.0
Water Supply and SewerageBenin .$ - S 5.0 $ 5.0Brazil .180.0 - 180.QCosta Rica .26.0 - 26.0Egypt, Arab Republic of .- 56.6 56.6Mexico .125.0 - 125.0Morocco .87.0 - 87.0Nepal .- 27.0 27.0Nicaragua .3.7 - 3.7Paraguay .11.8 - 11.8Uganda .- 9.0 9.0Yemen, People's Democratic Republic of .- 3.5 3.5
Total . 433.5 $ 101.1 S 534.6
GRAND TOTAL .$8,808.9 $3,482.1 $12,291.0
NOTE: For additional details. see Bank/IDA Appendices 3 and 4, Statement of Loans Approved during Fiscal Year 1981 and Statement ofDevelopment Credits Approved during Fiscal Year 1981, respectively.
I Operations have been classified by the major purpose they finance. Many projects include activity in morc thne one sector or subsector.
2 Supplementary financing to previous credits, not counted as separate lending operations.

127
Statistical Annex
PageGeneral Notes to Annex Tables ...................... 128
Table1 Selected Economic Indicators, Regional Summary, 1961-80 ................................ 130
2 External Public Debt Outstanding (Including Undisbursed),by Region, 1973-79 ............................................................ 132
3 External Public Debt Outstanding, by Country andType of Creditor, December 31, 1979 ............................................... . 134
4 Service Payments on External Public Debt as Percentage ofExports of Goods and Services, 1973-79 .................. .. .. .. .. .. .. .. .. .. .. .. .. . . 137
5 Projected Debt Service on External Public Debt Outstanding,by Region and Type of Creditor, as of December 31, 1979 ................................. . 140
6 External Resource Flows and Service Payments onExternal Public Debt, by Region, 1973-79 ........................................... . 142
7 Average Terms of Loan Commitments and Grant Element ofLoans and Grants, by Region, 1973-79 ................... .. .. .. .. ... .. .. .. .. ... .. . . 143
8 Foreign and International Bond Issues, byBorrower Entity, 1978-80 and First Half 1981 ............... .. .. . .. .. . .. .. . .. .. . .. .. . . 144
9 Publicized Eurocurrency Credits, by Borrower Entity,1978-80 and First Half 1981 ..... .............................................. . 147
10 Average Terms of Eurocurrency Credits forSelected Developing Countries, Third Quarter 1979 toSecond Quarter 1981 ......................................................... . 150

128 Statistica Annex
General Notes to Annex Tables
The tables of this Annex present data on selected Nicaragua, Panama, Paraguay, Peru, Trinidad andeconomic indicators, external public debt, and interna- Tobago, Uruguay, Venezuela.tional capital markets. As in past Annual Reports, mostof the tables are organized on geographic lines. North Africa and Middle East-Algeria, Bahrain,
In Table 1, the basic series on selected economic Egypt (Arab Republic of), Jordan, Lebanon, Morocco,indicators is based on data stored in the IBRD Socio- Oman, Syrian Arab Republic, Tunisia, Yemen Arabeconomic Data Bank, which are mainly obtained from Republic, Yemen (People's Democratic Republic of).World Bank country economic reports, supplemented bydata from national and other international publications. SouthAsia-Afghanistan,2 Bangladesh, Burma, India,The indicators presented in this table are the same as Maldives, Nepal, Pakistan, Sri Lanka.those of last year.
In Tables 2 through 7, the principal source of data on More advanced Mediterranean countries-Cyprus,external debt is information received by the World Bank Greece, Israel, Malta, Portugal, Spain, Turkey,from its member countries. These data are checked with Yugoslavia.and supplemented by information from several othersources, primarily reporting by creditor countries on their Not all of the 96 countries or other areas have beenlending and publicized Eurocurrency credits. The notes on reporting for their full historical period, 1973-79, coveredthe debt of the Philippines and Yugoslavia in Table 2 by the tables. Where individual reports are lacking forapply to all Tables 2 through 7. certain years, estimates have been made by the World
The 96 countries or other areas included in the debt Bank's staff in order to present a consistent series oftables are those for which reporting on external public data.debt is sufficient for a reliable presentation of debt For the purpose of these tables, external public debt isoutstanding and future service payments. The classifica- defined as debt repayable to external creditors in foreigntion by geographical region is as follows: currency, goods, or services, with an original or extended
maturity of more than one year, which is a directAfrica South of the Sahara-Benin, Botswana, Bu- obligation of, or has repayment guaranteed by, a public
rundi, Cameroon, Central African Republic, Chad, body in the borrowing country. Most military debts are notComoros, Congo (People's Republic of the), Ethiopia, reported, although a few countries have included suchGabon, Gambia (The), Ghana, Guinea, Ivory Coast, obligations in their data.Kenya, Lesotho, Liberia, Madagascar, Malawi, Mali, The World Bank continues to work in cooperation withMauritania, Mauritius, Niger, Nigeria, Rwanda, its member countries toward the improvement of debtSenegal, Sierra Leone, Somalia, Sudan, Swaziland, statistics. This effort results in many cases in aTanzania, Togo, Uganda, Upper Volta, Zaire, Zambia broadening of the coverage of the data for both current(and the East African Community). and past periods. Therefore, a comparison with debt
tables in the 1980 Annual Report will show changes inEast Asia and Pacific-Fiji, Hong Kong,' Indonesia, data given for past years. The current Annual Report
Korea (Republic of), Malaysia, Papua New Guinea, should be regarded as the more reliable. Users of thePhilippines, Singapore, Thailand, Taiwan (China).
Latin America and the Caribbean-Argentina, Bar- IHong Kong io a nonmetroclitan territory in respect of wnich the Unitesbados, Bolivia, Brazil, Chile, Colombia, Costa Rica, Kingdom has accepted tihe Bank's Articles of Agreement.Dominican Republic, Ecuador, El Salvador, Guate- 2 Note that n these tables Afghanistan s cassified under South Asia,
mala, Guyana, Haiti, Honduras, Jamaica, Mexico, uhile in the d:scussior of the year's activsiles by region, it is classifiedmala, Gyn,HiiHodrsJaac,Mxc, uerEurope, Middle East, und North Afr'ica.
Sttistilcal Annex 129
tables on external public debt should be particularly currency) contributions; they are on a disbursement basiscareful in making comparisons with past Annual Reports, in both tables. The grants included in these tablesas the coverage has changed over the years. comprise: (1) contributions by countries that are mem-
in Table 4, debt-service ratios represent service bers of the Development Assistance Committee (DAC) ofpayments (amortization plus interest) on external public the OECD; (2) grants by multilateral agencies as com-debt as a percentage of the exports of goods and all piled by OECD; (3) disbursements by IDB on loans re-services. The debt-service figures used in the present payable in local currencies. Grants for technical assis-table are those for actual debt service paid during the tance have been excluded. Data for grants do not includeyear. If the entire amount of contractual debt service was grants from bilateral donors other than DAC countries,not paid during a year, this is reflected in a lower debt- although grants from other sources may have been largeservice ratio than would have been the case had in some cases. However, debt data include obligations tocontractual debt service instead of actual service been creditors of all nationalities.used in computing the ratio. Likewise, the prepayment of Table 8 deals with foreign and international bonddebt service may result in a higher debt-service ratio. issues. "Foreign bonds" are those issued in a single
The debt-service ratio, by itself, is an inadequate and national market. "International bonds" are those whichincomplete indicator of the debt situation, and interna- are sold in two or more markets simultaneously. Duringtional comparisons of these ratios have only limited the period under review, foreign bonds have been issuedmeaning. Many other factors must also be considered, in the following national markets: Austria, Belgium,such as the stability and diversification of the export Finland, France, Germany (Federal Republic of), Japan,structure, the extent to which imports can be reduced Libya, Luxembourg, Netherlands, Saudi Arabia, Sweden,without adversely affecting the prospects for future Switzerland, United Kingdom, and United States.growth, the size of foreign exchange reserves and In Tables 9 and 10, "Eurocurrency credits" are creditsavailable compensatory financing facilities, and the granted by private banks out of funds on deposit withdebt-service record. Further, external public debt con- them or borrowed by them in the Eurocurrency market.stitutes only a part of the total indebtedness and, thus, The term "Euro" is used to refer to "offshore" marketsconsiderably understates the burden of indebtedness in outside, as well as inside, Europe. The term "credit" issome cases. Therefore, the debt-service ratio is only an used to refer to loans, lines of credit, and other forms ofindication of the importance of debt and debt service in medium-term and long-term credit.the total foreign exchange situation. Data on external public debt are converted to US
In Table 6, net flow is defined as disbursements on dollars at current market rates. Capital flows and serviceloans, grants, and grantlike loans minus amortization on payments are converted to US dollars at end-1978 rates.loans. Net transfer is net flow minus interest on loans. However, debts repayable in multiple currencies, goods, or
In Table 7, grant element is defined as the face value services, and debt which has a provision for maintenanceof loan commitments less thO discounted present value of value of the currency of repayment, are shown at theirof the future flow of repayments of principal and interest book values.expressed as a percentage of face value. The discount Information about foreign and international bonds andrate used is 10 percent, the conventional rate used by the Eurocurrency credits, denominated in national currencies,Organisation for Economic Co-operation and Development is converted to US dollars using monthly average market(OECD) in assessing terms. exchange rates of currency units per US dollar, series
In Tables 6 and 7, the source of data for grants is "af," from the IMF's International Financial StatisticsOECD. For grantlike loans, the data sources are OECD and (IFS) File. For loans denominated in composite currenciesthe Inter-American Development Bank (IDB). Grants con- (e.g., European unit of account), the conversion is madesist of grant and grantlike (loans repayable in local using rates derived by the World Bank.

130 Statistical Annex
Selected Economic Indicators, Regional SummaryAverage annual real growth and shares in Gross National Product (GNP)1961-65, 1966-76,1977, 1978, 1979, and 1980(Percentages)
RegionIndicator 1961-65 1966-76 1977 1978 1979 1980 (P)
All developing regionsReal rate of growthTotal GNP .................. 5.6 6.1 5.8 5.2 5.2 4.6Agricultural production ........ 2.8 2.9 3.3 4.0 0.6 3.6Manufacturing production ...... 7.7 8.3 7.1 6.7 6.3 n.a.Population ................. 2.4 2.4 2.3 2.3 2.4 2.4GNP per capita .............. 3.1 3.6 3.5 2.8 2.7 2.3Gross investment ....... ..... 7.8 8.9 8.1 6.0 6.0 n.a.
Share in GNPGross investment ....... .... 20.1 22.2 25.3 25.8 25.9 n.a.Gross national savings ........ 18.0 21.2 24.7 24.2 25.7 n.a.
Africa South of the SaharaReal rate of growthTotal GNP .................. 4.0 5.0 2.9 3.4 3.3 2.3Agricultural production ........ 2.7 1.6 0.6 2.8 1.6 2.2Manufacturing production ...... 9.4 7.1 3.4 7.9 5.5 n.a.Population a..i................... 2.5 2.6 2.6 2.7 2.7 2.8GNP per capita ........ ...... 1.5 2.3 0.3 0.7 0.6 -0.4Gross investment ....... ..... 7.6 10.9 9.2 1.2 3.5 n.a.
Share in GNPGross investment ....... ..... 16.4 19.1 25.4 24.6 23.9 n.a.Gross national savings ........ 11.7 15.2 18.6 17.6 19.9 n.a.
East Asia and PacificReal rate of growth
Total GNP .................. 5.8 8.1 8.4 9.4 6.6 3.9Agricultural production ........ 5.3 3.8 4.7 4.6 3.0 0.1Manufacturing production ...... 9.2 15.6 13.4 17.1 9.7 5.6Population ................. 2.5 2.4 2.3 2.3 2.2 2.2GNP per capita .............. 3.2 5.5 5.9 6.9 4.3 1.6Gross investment ....... ..... 12.3 12.3 14.1 17.5 11.3 0.9
Share in GNPGross investment ....... ..... 16.0 22.6 25.8 27.4 29.7 29.1Gross national savings ........ 12.4 18.7 25.2 25.2 27.2 25.1
Latin America and the CaribbeanReal rate of growthTotal GNP .................. 5.5 5.9 4.8 3.9 5.5 5.4Agricultural production ........ 3.7 2.9 5.2 4.2 3.5 3.3Manufacturing production ...... 5.8 7.0 3.9 3.4 7.9 n.a.Population ................. 2.8 2.6 2.3 2.3 2.3 2.3GNP per capita ........ ...... 2.5 3.2 2.5 1.6 3.1 3.1Gross investment ....... ..... 4.6 7.8 6.1 3.5 6.3 8.9
Share in GNPGross investment ....... ..... 20.7 22.3 24.9 24.9 24.9 24.1Gross national savings ........ 20.0 20.1 22.6 21.7 22.0 na.
North Africa and Middle EastReal rate of growthTotal GNP .................. 6.8 8.1 10.0 6.0 14.6 7.5Agricultural production ........ 1.5 2.4 -8.3 8.0 0.2 6.2Manufacturing production ...... 8.5 7.3 11.8 9.1 7.3 n.a.Population ................. 2.7 2.8 3.1 3.2 3.1 3.1GNP per capita ......... ..... 4.0 5.1 6.6 2.7 11.1 4.2Gross investment ....... ..... 0.4 16.1 19.5 15.3 7.7 n.a.
Share in GNPGross investment ....... ..... 22.4 23.2 30.3 33.5 30.7 n.a.Gross national savings ........ 23.9 36.8 45.3 42.1 46.9 n.a.

Statistical Annex 131
Table I
RegionIndicator 1961-65 1966-76 1977 1978 1979 1980 (P)
South AsiaReal rate of growthTotal GNP .................. 3.8 3.7 7.1 7.0 -2.6 7.4Agricultural production ...... .. 0.7 2.7 8.4 3.3 -5.0 7.4Manufacturing production ...... 9.1 4.5 2.6 3.9 2.8 -2.0Population ... ............... 2.3 2.3 2.1 2.2 2.5 2.3GNP per capita ......... ..... 1.4 1.4 4.9 4.8 - 4.9 5.0Gross investment ....... ..... 8.1 4.0 -0.7 13.5 -1.7 7.3
Share in GNPGross investment ....... ..... 17.3 18.1 19.2 21.5 21.6 23.2Gross national savings . ........ 14.2 15.9 18.0 19.7 18.6 18.7
More advanced Mediterranean countriesReal rate of growthTotal GNP .................. 7.5 6.0 4.0 4.1 2.6 1.4Agricultural production ..... .. 3.1 3.9 -0.6 4.0 1.0 3.2Manufacturing production ...... 10.5 8.4 10.1 5.6 3.1 2.3Population ................. 1.5 1.5 1.5 1.5 1.5 1.5GNP per capita .............. 5.9 4.5 2.5 2.6 1.1 -0.1Gross investment ....... ..... 12.7 6.4 4.1 -3.8 4.9 n.a.
Share in GNPGross investment ....... ..... 24.0 24.6 25.4 24.1 24.5 n.a.Gross national savings ...... .. 20.8 21.5 20.7 21.5 21.7 n.a.
Industrialized countriesReal rate of growthTotal GNP .................. 5.3 4.2 3.8 4.0 3.5 1.3Agricultural production ..... ... 1.8 2.8 2.7 3.5 0.0 -0.8Manufacturing production ...... 6.2 3.9 3.7 4.4 5.1Population ................. 1.2 0.8 0.6 0.7 0.6 0.7GNP per capita .............. 4.1 3.3 3.2 3.3 2.8 0.6Gross investment ........ .... 7.2 4.5 4.1 4.7 3.8 -1.9
Share in GNPGross investment ........ .... 20.5 21.2 22.1 22.3 21.6Gross national savings ...... .. 26.6 29.3 22.1 22.2 19.7
NOTE: A I the countries listed below have been included for the estimates of the real rates of growth of GNP and population. For other Indicators, somecountries or other areas have been omitted due to lack of data.
Industrialized countries-Australia, Austria, Belgium, Canada, Denmark, Finland, France, Germany, Iceland, Ireland, Italy. Japan, Luxembourg,Netherlands, New Zealand, Norway, South Africa, Sweden, Switzerland, Un ted Kingdom, United States
Developing countries or other areas-Those listed n the "General Notes to Annex Tables" and those below:
Africa South of the Sahara-Zimbabwe.
Latin Amer ca and the Caribbean-Bahamas, Grenada.
North Africa and Middle East-Iraq, Kuwait, L bya, Qatar, Saudi Arabia. United Arab Emirates.
(P) Preliminary.
Source: World Bank.

132 Statistical Annex
External Public Debt Outstanding(Including Undisbursed), by Region, 1973-79(US$ millions)
Africa Latin MoreSouth East Asia America North Africa advanced
Year of the and and the and MediterraneanTyrpe of creditor Sahara Pacific' Caribbean Middle East South Asia countrieS2 Total
Total debt outstanding end of year1973 ............. 14,515.9 17,678.2 37,136.1 12,176.9 21,293.9 16,599.1 119,400.01974 ............. 18,539.3 24,530.3 48,913.3 16,654.6 26,150.0 20,596.0 155,383.41975 ............. 21,584.7 30,652.2 58,785.3 25,006.2 28,371.1 23,333.6 187,733.01976 ............. 25,476.0 39,582.7 77,114.6 32,102.1 31,004.0 28,859.2 234,138.61977 ............. 31,066.6 47,478.8 96,995.4 43,382.4 35,535.6 34,392.2 288,851.11978 ............. 39,158.8 60,237.5 122,628.4 54,529.7 40,157.4 41,921.5 358,633.21979 ............. 46,023.4 67,833.5 145,393.8 61,602.1 42,439.6 51,349.5 414,641.8
Debt outstanding by type of creditorDecember31, 1973Bilateral official ...... 6,754.4 8,986.1 9,560.2 6,646.0 15,202.0 7,607.9 54,756.7Multilateral ......... 3,368.2 3,547.7 8,431.3 900.3 4,890.0 2,556.2 23,693.8PrivateSuppliers .......... 1,846.5 2,740.4 4,789.5 2,151.5 1,052.4 1,209.1 13,789.4Financial institutions . 1,839.8 1,934.7 12,114.0 2,313.2 135.6 2,915.2 21,252.4Other ............. 706.9 469.3 2,241.1 165.8 14.0 2,310.8 5,907.9Total ............ 14,515.9 17,678.2 37,136.1 12,176.9 21,293.9 16,599.1 119,400.0
December 31, 1974Bilateral official ...... 8,705.3 10,695.9 11,817.5 8,746.9 18,516.4 8,853.1 67,335.1Multilateral ......... 4,196.7 4,738.5 9,799.3 1,636.3 6,320.1 3,256.7 29,947.5PrivateSuppliers .......... 2,101.5 4,262.2 5,871.4 3,111.5 1,078.7 1,196.6 17,622.0Financial institutions . 2,844.8 4,276.0 18,438.7 2,933.8 220.8 4,789.4 33,503.6Other ............. 690.9 557.7 2,986.3 226.0 14.0 2,500.2 6,975.1Total ............ 18,539.3 24,530.3 48,913.3 16,654.6 26,150.0 20,596.1 155,383.4
December 31, 1975Bilateral official ...... 9,499.2 11,732.4 12,609.0 12,482.4 19,467.6 9,773.5 75,564.0Multilateral ......... 5,572.5 6,044.5 11,839.3 2,180.7 7,714.8 3,751.7 37,103.5PrivateSuppliers .......... 2,615.0 4,378.2 6,344.9 5,137.0 901.7 1,117.6 20,494.3Financial institutions . 3,408.8 7,973.8 24,920.6 4,964.4 285.1 5,980.0 47,532.7Other ........... 489.1 523.4 3,071.5 241.7 2.0 2,710.8 7,038.5Total ........... 21,584.7 30,652.2 58,785.3 25,006.2 28,371.1 23,333.6 187,733.0

Statistical Annex 133
Table 2
Africa Latin MoreSouth East Asia America North Africa advanced
Year of the and andthe and MediterraneanType of creditor Sahara Pacific I Caribbean Middle East South Asia countries2 Total
December 31, 1976Bilateral official ..... . 10,952.6 14,156.8 15,403.5 15,616.1 21,100.4 12,096.7 89,326.2Multilateral ........ . 6,769.9 7,789.9 14,357.6 3,188.8 8,662.4 4,301.8 45,070.3PrivateSuppliers ........ . 2,889.7 5,478.3 7,192.6 5,558.4 880.1 1,313.0 23,312.0Financial institutions . 4,656.8 11,097.2 35,659.5 7,439.7 359.1 8,247.9 67,460.2Other ............. 207.1 1,060.4 4,501.4 299.0 2.1 2,899.8 8,969.8Total ........... . 25,476.0 39,582.6 77,114.6 32,102.1 31.004.0 28,859.2 234,138.6
December 31, 1977Bilateral official ..... . 12,861.8 16,556.2 16,588.2 19,602.7 23,694.4 14,096.2 103,399.5Multilateral ........ . 8,334.0 9,645.2 16,627.8 6,220.9 10,484.7 5,115.2 56,427.7PrivateSuppliers ........ . 3,472.1 6,596.0 8,416.7 6,595.6 899.8 1,494.8 27,475.0Financial institutions . 6,208.1 13,192.7 48,480.9 10,527.1 454.6 10,218.6 89,082.0Other ............. 190.6 1,488.8 6,881.8 436.1 2.1 3,467.5 12,466.9Total ........... . 31,066.6 47,478.9 96,995.4 43,382.4 35,535.6 34,392.2 288,851.1
December 31, 1978Bilateral official ..... . 14,996.9 20,554.9 18,518.3 23,441.8 25,446.6 18,123.4 121,081.9Multilateral ........ . 10,193.8 12,522.4 19,978.0 7,214.4 13,290.7 6,474.1 69,673.4PrivateSuppliers ........ . 3,725.9 7,526.3 9,568.5 7,248.4 916.5 1,552.3 30,537.9Financial institutions . 10,086.0 17,498.8 65,314.0 16,034.3 501.4 11,891.5 121,326.1Other ............. 156.1 2,135.1 9,249.5 590.8 2.2 3,880.2 16,014.0Total ........... . 39,158.8 60,237.5 122,628.4 54,529.7 40,157.4 41,921.5 358,633.2
December 31, 1979Bilateral official ..... . 16,139.3 21,540.3 18,740.3 25,552.2 25,406.6 20,438.2 127,816.8Multilateral ........ . 12,261.0 14,890.4 24,180.1 8,711.3 15,508.3 7,465.0 83,016.1PrivateSuppliers ........ . 3,673.1 7,051.2 10,514.7 7,285.7 824.3 1,375.8 30,724.9Financial institutions . 13,824.3 22,193.2 82,460.0 19,317.6 698.2 17,832.4 156,325.7Other ........... 125.7 2,158.4 9,498.7 735.2 2.2 4,238.1 16,758.3Total ............ 46,023.4 67,833.5 145,393.8 61,602.1 42,439.6 51,349.5 414,641.8
NoTE: Information on the sources, definitions, coverage, and interpretation of the data is given n the "General Notes to Annex Tables." Items may not add tototals due to rounding.
I Does not include publiclyguaranteed private debtof the Philippinesestimated at $427 1 millton asof end of 1979.2 Does not include nonpubicly guaranteed debt of the "social sector" of Yugoslavia contracted after March 31, 1966.Source: World Bank.

134 Statistical Annex
External Public Debt Outstanding,by Country and Type of Creditor, December 31, 1979(USS millions)
External public debt outstanding
Including undisbursed
Region Disbursed Bilateral Multi- FinancialCountry or Dther area only Total official lateral Suppliers institutions Other
Africa South of the SaharaBenin ....................... 185.8 314.7 113.5 185.6 3.7 6.8 -Botswana .......... ......... 134.5 220.1 59.3 126.1 2.4 30.0 2.3Burundi ................ .... 103.0 201.2 78.5 110.3 5.5 6.9 -Cameroon .................... 1,633.6 2,622.4 944.4 691.6 148.5 838.0 -Central African Republic ....... ... 150.0 205.6 53.4 83.5 66.0 2.6 -
Chad ....................... 171.7 271.7 101.1 140.5 23.7 6.5 -Comoros ..................... 38.2 78.3 47.9 30.5 -- - -Congo, People's Republic of the ..... 798.6 945.1 559.6 141.6 137.7 106.3 -East African Community ..... .... 300.3 309.8 78.6 191.0 6.8 - 33.4Ethiopia ..................... 620.0 923.7 380.6 509.4 14.2 19.5Gabon ....................... 1,213.5 1,477.1 319.1 58.0 152.9 939.7 7.5Gambia, The .................. 44.8 153.0 57.0 81.2 14.8Ghana ...................... 976.9 1,246.4 610.2 400.9 213.7 21.5Guinea ............ ......... 990.4 1,342.0 845.7 227.8 241.9 26.5 -Ivory Coast ................... 3,546.9 5,573.5 842.3 782.5 774.4 3,156.7 17.5Kenya ............ ......... 1,427.5 2,688.5 773.4 1,190.4 124.0 591.0 9.8Lesotho ...................... 51.8 138.8 12.3 110.2 - 16.3 -Liberia .. .................... 454.3 703.5 292.5 257.1 23.0 130.9 -Madagascar .................. 347.7 718.8 290.2 314.7 7.5 104.4 2.0Malawi ...................... 423.3 605.8 170.5 294.9 17.4 120.8 2.1Mali ....................... 545.3 763.3 442.9 295.6 9.6 15.3 -Mauritania ................... 590.1 1,115.6 715.4 252.0 67.7 70.5 10.0Mauritius .................... 226.9 369.3 139.3 132.2 4.2 93.6 -Niger ...................... 234.0 528.2 181.4 235.8 8.6 102.6Nigeria ...................... 3,744.1 5,679.4 707.0 1,036.9 29.5 3,906.0Rwanda ..................... 124.0 218.3 58.9 158.7 0.8 - -Senegal ..................... 785.7 1,291.4 451.4 370.3 88.7 378.1 3.0Sierra Leone .................. 288.9 338.1 81.5 90.3 140.1 26.3 _
Somalia ..................... 545.7 906.1 617.9 287.1 - - 1.1Sudan .... .................. 2,114.1 3,515.1 1,763.2 853.2 353.3 545.3 -
Swaziland .................... 146.2 220.5 85.4 106.6 0.4 28.1 -Tanzania ..................... 1,153.4 1,836.3 857.1 881.3 18.2 68.2 11.6Togo ....................... 851.1 1,080.3 375.8 189.3 86.4 428.8 -Uganda ............ 245.0 319.7 231.3 86.6 0.2 1.5Upper Volta ................... 256.4 404.8 169.9 218.3 - 16.6 -
Zaire ...................... 3,779.6 4,571.0 1,572.4 626.8 692.3 1,672.0 7.5Zambia .1,558.6 2,125.8 1,058.5 512.1 205.3 333.4 16.5
Total .................. 30,802.1 46,023.4 16,139.3 12,261.0 3,673.1 13,824.3 125.7

Statistical Annex 135
Table 3
External public debt outstanding
Including undisbursed
Region Disbursed Bilateral Multi- FinancialCountry or ether area only Total official lateral Suppliers institutions Other
East Asia and PacificFiji ....................... 105.5 207.0 53.7 105.2 4.8 39.3 4.0Hong Kong .................... 405.1 1,130.2 - 65.8 295.1 769.2Indonesia .................... 13,325.6 20,840.2 9,862.2 4,263.0 1,710.5 4,613.0 391.4Korea, Republic of ......... ..... 14,694.1 20,036.4 5,063.0 3,499.7 3,699.1 7,574.4 200.2Malaysia ..................... 3,003.7 4,300.8 829.0 1,335.7 75,8 1,754.5 305.8Papua New Guinea ......... ..... 393.4 477.9 16.8 214.9 2.0 150.1 94.1Philippines ................... 5,180.4 8,964.2 1,737.2 2,997.7 457.5 2,988.1 783.7Singapore .................... 1,323.0 1,534.6 469.6 239.5 275.6 200.7 349.3Thailand ..................... 2,699.3 5,169.9 1,612.1 1,912.8 141.3 1,473.7 30.0Taiwan, China ............ ..... 3,082.4 5,172.2 1,896.7 256.0 389.3 2,630.2 _
Total ............... ... 44,212.4 67,833.5 21,540.3 14,890.4 1,051.2 22,193.2 2,158.4
Latin America and the CaribbeanArgentina .................... 8,715.9 10,963.2 962.4 2,436.6 2,009.3 4,639.3 915.6Barbados .................... 65.9 121.7 29.7 71.0 0.3 20.8Bolivia ...................... 1,834.9 2,759.0 908.4 770.6 158.4 857.3 64.3Brazil ....................... 35,092.2 47,521.6 5,012.6 5,740.0 5,013.1 28,624.9 3,131.0Chile ....................... 4,767.0 5,460.9 1,472.7 496.0 560.4 2,699.8 231.9Colombia .................... 3,426.2 5,418.8 1,250.9 2,537.1 272.6 1,316.6 41.6Costa Rica ................... 1,276.8 1,868.6 357.2 699.3 53.8 733.9 24.4Dominican Republic ........ ..... 828.3 1,533.0 525.8 562.4 2.3 442.5Ecuador ..................... 2,207.2 3,110.0 330.3 714.1 245.2 1,751.1 69.4El Salvador .... .............. 397.5 726.1 235.8 465.6 - 24.7Guatemala ................... 482.2 836.4 269.0 560.3 1.5 5.6Guyana ...................... 467.0 719.3 296.6 197.9 24.4 118.2 82.2Haiti ....................... 208.6 345.7 96.1 245.2 0.4 4.0Honduras .................... 745.9 1,186.0 275.9 698.6 18.3 193.2Jamaica ..................... 1,182.3 1,564.5 604.7 414.9 26.5 424.4 94.1Mexico ...................... 28,805.1 36,015.6 1,392.4 4,431.5 416.1 27.346.6 2,429.0Nicaragua .................... 1,100.7 1,403.9 447.6 529.7 23.2 395.1 8.3Panama ..................... 2,105.6 2,571.3 362.9 545.0 39.7 1,261.4 362.4Paraguay ..................... 490.5 1,111.2 344.7 489.0 119.3 158.1Peru ....................... 5,931.4 7,982.7 3,016.9 877.2 1,115.0 2,971.3 2.3Trinidad and Tobago ........ ..... 421.8 608.9 161.1 94.1 - 303.2 50.5Uruguay ..................... 913.7 1,326.7 153.4 343.7 37.0 523.7 268.9Venezuela .................... 9,797.3 10,238.7 233.5 260.5 377.9 7,644.3 1,722.6
Total ............... ... 111,264.0 14,393.8 18,740.3 24,180.1 10,514.7 82,460.0 9,498.7
(continued)

136 Staist.cal Annex
External Public Debt Outstanding, Table 3by Country and Type of Creditor, December 31, 1979 (continued)
(US$ millions)
External public debt outstanding
Including undisbursed
Region Disbursed Bilateral Multi- FinancialCountry or other area only Total official lateral Suppliers institutions Other
North Africa and Middle EastAlgeria ...................... 15,330.4 23,376.6 3,585.9 923.0 5,334.5 13,190.4 342.9Bahrain ..................... 91.6 172.2 153.9 18.3 - - -Egypt, Arab Republic of ...... ..... 11,408.7 16,037.1 9,871.9 3,786.1 1,201.6 1,041.0 136.5Jordan ...................... 1,047.4 1,946.4 1,227.4 261.0 61.3 396.7Lebanon .......... .......... 92.9 421.4 114.7 161.0 - 145.8 -
Morocco ..................... 6,227.3 8,493.8 3,238.0 1,525.1 314.4 3,174.7 241.6Oman ........... ........... 455.8 583.6 361.6 79.5 51.2 91.2 -Syrian Arab Republic ....... ...... 2,283.2 4,241.8 3,404.1 639.5 149.4 48.9 -Tunisia ...................... 3,056.9 4,809.4 2,548.8 844.9 172.5 1,229.0 14.2Yemen Arab Republic ....... ..... 466.4 920.0 613.5 305.6 0.9 -
Yemen, People's DemocraticRepublic of .................. 441.2 599.6 432.4 167.2 - -
Total .................. 40.901.8 61,602.1 25,552.2 8,711.3 7,285.7 19,317.6 735.2
South AsiaAfghanistan .................. 1,143.1 1,973.2 1,602.1 325.8 45.2 -Bangladesh ................... 2,841.6 4,351.6 2,113.6 2,012.6 163.6 61.7Burma ...................... 1,140.8 2,003.3 1,068.3 598.2 151.8 184.9 -India ...................... 15,640.9 21,287.9 11,856.1 9,182.5 169.1 78.1 2.2Maldives ..................... 6.2 23.4 17.9 5.5 -- -
Nepal ...................... 125.3 439.5 44.4 395.1 - - -
Pakistan ..................... 7,997.6 10,599.9 7,590.5 2,485.6 222.8 300.9 -Sri Lanka .................... 1,086.0 1,760.9 1,113.6 502.8 71.8 72.7 -
Total .................. 29,981.6 42,439.6 25,406.6 15,508.3 824.3 698.2 2.2
More advanced Mediterranean countriesCyprus ...................... 300.2 364.2 49.6 163.1 13.6 137.9 -Greece ...................... 3.531.5 4,746.0 881.0 792.2 131.9 2,807.9 132.9Israel ...................... 9,954.4 10,673.7 6,895.6 143.9 65.3 1,444.2 2,124.6Malta ...................... 68.7 108.7 95.0 12.3 - 1.3 -
Portugal ..................... 3,707.6 4,606.4 1,430.1 868.8 293.2 1,953.4 60.8Spain ..................... 8,656.0 11,442.5 2,078.9 546.4 77.0 6,881.1 1,859.1Turkey ...................... 10,971.6 14,652.4 6,838.2 2,736.5 768.9 4,260.0 48.8Yugoslavia ................... 3,699.8 4,755.6 2,169.7 2,201.8 25.9 346.4 11.9
Total .................. 40,889.6 51,349.5 20,438.2 7,465.0 1,375.8 17,832.4 4,238.1GRAND TOTAL ....... ..... 298,051.5 414,641.8 127,816.8 83,016.1 30,724.9 156,325.7 16,758.3
NOTE: rformation on the sources, def ni-ions, coverage, and irterpretat on of the data is given in the "General Notes tc Anrex Tables." tems may not add totota s due to rounding.
Source: World Bank.

Statistical Annex 137
Service Payments on External Public Debt as Percentage of Table 4Exports of Goods and Services, 1973-79
Region Service payments as percentage of exports of goods and servicesCountry or other area 1973 1974 1975 1976 1977 1978 1979
Africa South of the SaharaBenin ............................... 1.9 4.8 3.6 2.7 1.9 3.3 5.1Botswana I .............................. 2.6 2.7 3.1 1.5 1.8 2.4 1.6Burundi ............................... 2.5 2.7 5.6 4.4 2.9 3.5 3.1Cameroon ............................... 4.7 4.3 5.3 5.4 5.3 7.4 9.5Central African Republic ........... .......... 4.6 5.1 7.9 2.1 4.7 2.6 0.1Chad ............................... 3.5 3.3 5.9 4.1 10.0 11.8 14.4Comoros ............................... 2.1 1.1 4.6 5.7 7.0 10.8 n.a.Congo, People's Republic of the ...... ... -- 8,6 6.8 12.7 8.4 10.5 7.3 24.6Ethiopia ............................... 6.4 5.4 7.5 6.4 5.9 6.5 4.9Gabon ............................... 14.3 4.1 5.5 6.1 9.2 20.8 17.0Gambia, The ............................. 1.1 0.8 0.6 0.6 0.5 0.8 0.4Ghana ............................... 3.8 3.9 5.6 5.9 3.6 4.7 4.2Guinea ............................... 29.9 16.8 14.8 15.0 19.0 20.0 22.2Ivory Coast .............................. 7.2 7.9 8.8 8.8 10.4 13.0 15.2Kenya 2 ... .............................. 5.5 4.7 4.5 5.9 4.8 8.1 7.5Lesotho .............................. 3.2 2.1 2.4 4.4 3.3 1.9 0.6Liberia .............................. 5.3 4.9 5.5 4.5 6.0 5.8 13.8Madagascar ............................. 5.0 3.4 3.0 3.7 3.3 3.4 3.9Malawi .............................. 7.5 7.7 7.7 7.4 5.2 9.8 9.4Mali ............................ .. 5.8 2.3 2.4 2.8 3.8 7.1 8.5Mauritania .............................. 9.0 6.6 20.7 37.8 22.4 16.3 32.4Mauritius .............................. 1.3 0.8 1.6 1.0 1.6 2.4 3.7Niger .............................. 2.0 2.8 4.6 4.4 4.4 2.7 3.6Nigeria .............................. 4.0 1.7 2.7 3.4 0.8 1.2 1.5Rwanda .............................. 0.2 0.8 0.6 0.8 0.9 1.4 0.6Senegal .............................. 7.9 5.4 5.4 5.7 6.1 13.4 13.7Sierra Leone ............................. 8.7 8.5 10.3 15.6 10.6 18.2 22.2Somalia .............................. 3.6 4.2 3.4 2.6 3.6 3.1 1.1Sudan .............................. 11.9 14.2 21.7 14.1 7.6 9.5 33.0 3Swaziland ............................. 9.5 2.1 1.4 0.8 0.9 1.6 2.0Tanzania 2.. .. , ........ ,.,..... 8.6 6.6 7.4 6.6 7.2 7.4 7.4logo .............................. 6.9 3.4 9.8 6.7 11.4 14.5 24.4Uganda 2 ... . . . . ............ 8.3 4.5 3.7 2.9 3.0 2.2 7.4Upper Volta .............................. 3.3 2.8 3.5 3.0 2.2 3.9 3.8Zaire .............................. 8.5 12.4 15.1 7.5 8.3 8.2 9.1Zamnbia .............................. 30.9 7.3 10.2 10.2 18.7 20.8 19.7
(con0nued)
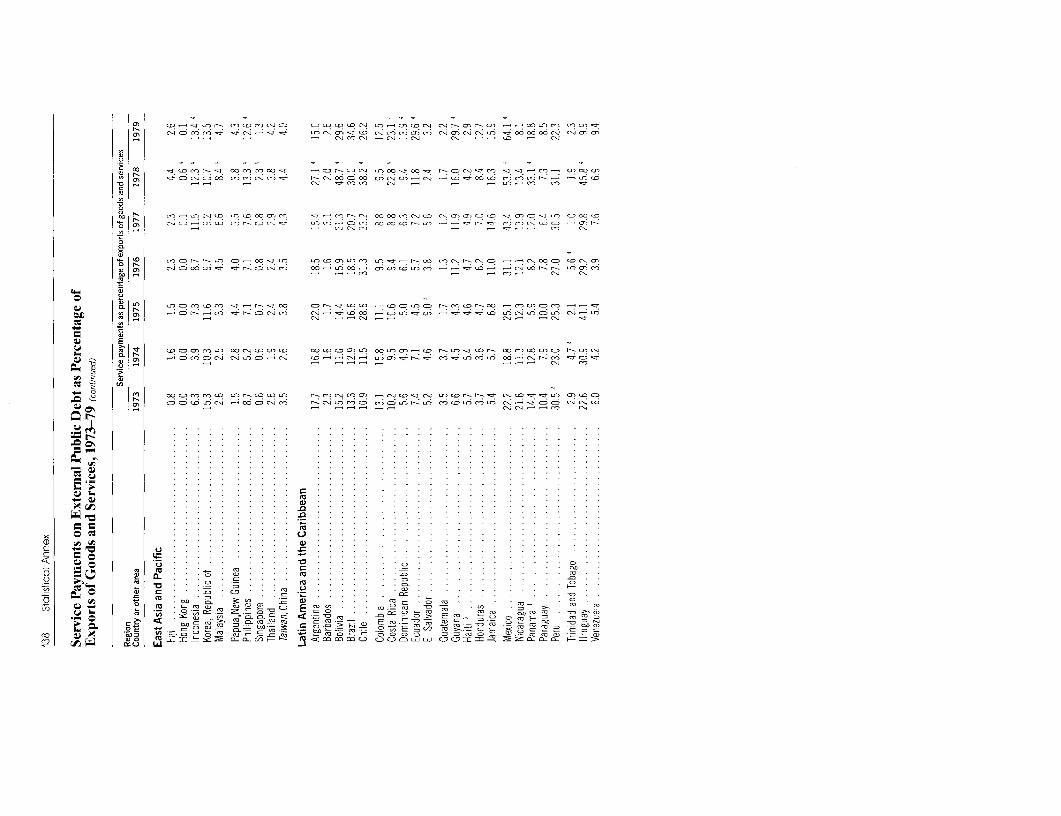
25 J) 050 040 Cf co0 0O05t CSCS 04 05 05 CO 04 04 4 50 0 .- 04 0 0405
m 0<0040 ll 'j 04f~ o00 S04445400000 000504000
- 1 -e 04O 0 0 40 0 O 4 . 00 05 - ) Ci rc ooooc , > 1o (041s 1)
SO N _4 >0 CS tDwi o ocn1rCS 0050 oo 0440 000445 4550 CX 050 Cl o5 00 > cS (
o 0n 0N o5 n5 <C r4 0 04 .C OC COC 00 CO L05 04 05 IC - ~CWI C0 04 00450 C054
t0
0 N ~ ~ ~ ~ ~ ~ ~ ~ ~ ~ ~ ~ ~ ~~~~~~~~~~~.
=~~~~ . cn -o . . . .x .o oo . .n cn . . . . . . . ._ .
ee<1>~ ~ ~ ~ ~ ~ ~~~~~~.. . . .. . .,:^ crn~~~~~~~d . . . . . . . . . . . . . . . . . . . . ........
X Q ~ ~~~ ~~~~~ . .. .. . . . .'. '. .', . .. '. '. . . .. .-. .. . .'.' 04 04 . .
C : . . . . . . . . , . . . . . . .. ,.... . .
<
x O a5~~~~~~~~~~~~= ... .. .. . .. . . ..........050040504 = .0 . . . ...0.0.04 0 . .0.5.0 . .4.0.4.0.0 . . -
- - 0405 0004 l - -
16 E V i
O ~~~~~~~a R ,Oe<<=X@F
2~~~~~~~~ZT2C., 'C 050500500005005 000055 0050-0 045 ~ 054 004005 0450
SON 7 - oc -)C- - c CICu W ~ ~ ~ ~ ~ ~ ~ ~ ~ ~ ~ ~ ~ ~ ~ ~ 00 444f

Statistica Annex 139
Table 4
Service payments as percentage of exports of goods and servicesRegionCountry or other area 1973 1974 1975 1976 1977 1978 1979
North Africa and Middle EastAlgeria ................................ 12.2 12.7 8.7 13.0 15.3 20.4 25.6Bahrain ................................ 0.1 0.1 0.1 0.3 0.3 0.3 0.3Egypt, Arab Republic of .......... ........... 40.2 21.7 22.5 18.5 24.2 22.3 15.8Jordan ................................ 4.9 4.0 3.6 2.7 3.2 4.1 5.3Lebanon ............................... 11 0.9 0.9 1.0 0.8 0.8 n.a.Morocco ................................ 8.3 5.5 5.7 7.2 10.8 18.7 21.8Oman ................................ n.a. n.a. 2.4 2.2 5.0 8.5 9.2Syrian Arab Republic ........... ............ 7.4 6.4 7.9 7.7 7.3 20.8 16.5Tunisia ................................ 10.6 6.7 6.9 7.0 9.5 10.9 11.8Yemen Arab Republic . ................. - 4.7 1.2 0.5 0.3 1.0 1.8Yemen, People's DemocraticRepublic of ............................. 0.1 0.1 0.2 0.0 0.1 0.5 2.8
South AsiaAfghanistan ........... ................ 18.1 16.0 9.2 7.9 8.4 13.7 n.a.Bangladesh ............................. 2.4 5.6 16.2 12.7 10.4 11.8 8.4Burma I ................................ 26.2 12.8 17.5 16.7 13.6 15.4 22.0India ................................ 18.7 16.4 12.4 10.3 9.3 9.6 9.5Maldives ............................... - - - 0.2 0.3 0.4Nepal ................................. 1.7 2.3 4.0 1.0 1.7 1.4 1.4Pakistan `. ... ................ 14.7 13.5 15.6 14.7 13.6 12.2 12.0Sri Lanka ............................... 12.8 12.0 21.8 20.1 14.5 9.2 6.5
More advanced Mediterranean countriesCyprus ................................ 1.9 2.2 3.2 3.1 3.1 3.8 4.4Greece ................................ 8.5 8.7 10.5 9.7 9.1 8.4 8.4Israel ................................ 16.0 15.5 18.3 11.4 11.0 7.8 10.3Malta ................................ 0.4 0.7 0.6 0.4 0.3 0.3 0.4Portugal ................................ 2.3 1.9 2.7 2.8 3.1 4.0 5.3Spain ................................. 3.3 2.4 2.7 3.3 4.5 10.1 5.6Turkey ................................. 6.8 6.7 7.9 8.1 10.2 10.7 12.9Yugoslavia .............................. 5.4 5.3 5.5 3.3 3.9 3.4 4.2
NOTE: Debt serv ce ratios are based on debt service actually paid and not on contractual serv ce due. Information on the sources, definitions, coverage, andInterpretation of the data is given in the "Genera Notes to Annex Tab es."
i Because of specia: monetary arrangements peculiar to countries such as this, the debt service ratio must be regarded with more than usual caution inconsidering the country's external finarcia situation.
2 ncludes a not onal share of debt service payments on oans to the East African Community: Kenya-50%. Tanzania-40%, Uganda-10%.3 Reflects contractua debt service due prior to rescheduling.o Service saymerts for these years reflect prepaymerts
Debt data are for fiscal years.6Includes figures up to 1974 relat ng to debt subsequentlytaken over by Bangladesh.n.a.: not ava ableSource Word Bankand IMF

Projected Debt Service on External Public Debt Outstanding, by Region and Type of Creditor, as of December 31, 1979 Table 5 AJ ~~~~~~~~~~~~~~~~~~~~~~~~~~~CD(US$ millions)
Debt out-standing (including Projected debt service _
Region undisbursed) P c e rType of creditor December 31, 1979 1980 1981 1982 1983 1984 1985 1986 1987 1988 1989 O
Africa South of the SaharaBilateral official . ......................... 16,139.3 1,064.0 1,249.1 1,295.5 1,383.2 1,371.6 1,325.6 1,286.7 1,131.7 1,065.8 990.3 oMultilateral ......... .................. 12,261.0 468.4 544.1 619.5 719.7 839.5 919.7 924.0 902.3 878.8 821.0Private
Suppliers .... 3,673.1 742.2 718.5 624.2 502.5 399.7 323.8 248.6 152.4 94.4 60.8Banks . .................... 11,824.3 2,418.7 2,707.2 2,753.6 3,004.3 2,669.1 2,127.1 1,621.4 1,127.1 642.4 363.6Other . ............................. 125.7 34.9 21.7 28.1 32.3 12.0 3.5 2.7 2.2 4.0 1.6
Total .................. ..... . . 46,023.4 4,728.2 5,240.6 5,320.9 5,642.1 5,291.8 4,699.7 4,083.5 3,315.7 2,685.4 2,237.3
East Asia and PacificBilateral official ...................... .. . 21,540.3 1,385.5 1,515.2 1,626.7 1,795.7 1,835.3 1,894.3 1,828.8 1,693.7 1,559.7 1,530.3Multilateral ........................... . 14,890.4 809.7 991.2 1,198.5 1,383.6 1,547.8 1,631.4 1,629.2 1,592.6 1,537.8 1,459.5Private
Suppliers ........................... . 7,051.3 1,819.6 1,306.4 1,247.5 1,157.4 1,010.5 877.2 615.8 456.5 376.4 268.6Banks ............................ . 22,193.2 3,725.8 4,240.7 4,593.1 4,403.8 4,119.2 3,635.5 3,178.2 2,379.7 1,729.8 1,028.4Other ............................. . 2,158.4 215.3 262.8 280.2 303.4 421.5 259.1 169.4 227.9 277.8 255.8
Total ....................... . . 67,833.5 7,956.0 8,316.3 8,946.0 9,043.9 8,934.3 8,297.4 7,421.3 6,350.4 5,481.6 4,542.7
Latin America and the CaribbeanBilateral official ............. .......... . 18,740.3 2,113.1 2,214.4 2,282.2 2,103.6 2,171.3 1,859.9 1,657.1 1,462.4 1,221.1 993.1Multilateral ..................... ... . 24,180.1 1,612.7 1,937.2 2,240.8 2,488.5 2,593.7 2,613.2 2,605.1 2,496.2 2,383.7 2,240.3Private
Suppliers ........................... . 10,514.7 1,884.0 1,801.3 1,749.6 1,496.4 1,293.3 1,057.1 849.2 702.1 554.9 463.3Banks ............................... 82,460.0 19,575.5 20,713.6 16,807.9 15,809.0 14,163.8 12,383.3 10,294.3 8,559.2 7,450.3 4,617.1Other ............................... 9,498.7 1,461.6 1,235.2 1,834.1 1,319.9 2,077.8 1,196.9 1,242.4 1,228.9 737.6 579.5
Total . ...... 145,393.8 26,646.9 27,901.6 24,914.7 23,217.3 22,299.8 19,110.5 16,648.2 14,448.8 12,347.5 8,893.4
North Africa and Middle EastBilateral official ..................... .. . 25,552.2 1,636.0 2,079.5 1,996.1 2,197.0 2,302.4 2,172.4 1,993.4 1,941.8 1,750.4 1,678.7Multilateral ......................... .. 8,711.3 433.5 514.0 850.8 914.7 999.0 1,038.9 1,015.8 984.7 666.8 609.6Private
Suppliers ............................ 7,285.7 1,905.7 1,529.9 1,334.0 1,116.1 904.5 720.4 507.1 326.9 200.6 130.0Banks . ............................. 19,317.6 3,427.2 3,804.1 4,038.7 4,016.3 3,593.9 2,892.3 2,164.7 1,620.5 1,280.8 914.3Other .............................. 735.2 109.9 129.8 195.1 167.9 122.0 96.5 68.8 55.0 66.9 27.8
Total ........................... 61,602.1 7,512.4 8,057.4 8,414.7 8,412.0 7,921.9 6,920.5 5,749.8 4,928.8 3,965.6 3,360.5

South AsiaBilateral official ..... .................. 25,406.6 1,427.4 1,481.9 1,550.7 1,617.3 1,586.0 1,610.2 1,611.3 1,574.3 1,498.9 1,446.8Multilateral ............................ 15,508.3 316.8 333.4 363.6 409.1 500.0 540.8 558.5 576.7 586.3 571.8PrivateSuppliers ............................. 824.3 199.4 172.3 153.4 120.3 86.3 68.7 50.7 33.7 29.9 25.3Banks ............................... 698.2 119.8 127.5 124.5 121.5 109.4 87.5 71.6 48.8 36.4 31.8Other ........... ................ . 2.2 0.1 0.1 0.1 1.2 1.1 0.0 0.0 0.0 0.0 0.0
Total ............. ............. 42,439.6 2,063.5 2,115.2 2,192.4 2,269.4 2,282.8 2,307.2 2,292.2 2,233.5 2,151.5 2,075.8
More advanced Mediterranean countriesBilateral official ..... ................... 20,438.2 2,566.2 2,623.5 2,457.0 2,474.3 2,197.3 2,034.8 1,733.9 1,388.9 1,221.0 1,053.1Multilateral ... ........................ 7,465.0 577.8 715.1 861.3 983.7 958.7 867.7 843.9 799.5 730.0 692.9PrivateSuppliers ............................. 1,375.8 262.6 272.5 255.2 188.1 160.7 140.7 122.1 102.1 91.5 61.0Banks ...... ........................ 17,832.4 3,533.3 3,717.9 3,758.9 3,968.8 3,699.1 3,230.7 2,258.1 1,370.9 1,095.8 661.2Other ............................... 4,238.1 485.7 557.2 713.9 517.5 515.8 311.8 370.4 358.9 533.3 326.9
Total ......................... . 51,349.5 7,425.5 7,886.3 8,046.3 8,132.4 7,531.6 6,585.7 5,328.5 4,020.2 3,671.6 2,795.1
All developing countriesBilateral official . . ..................... . . 127,816.8 10,192.2 11,163.5 11,208.2 11,570.9 11,463.9 10,897.2 10,111.3 9,192.7 8,316.9 7,692.3Multilateral .......................... . 83,016.1 4,218.9 5,034.9 6,134.6 6,899.4 7,438.8 7,611.7 7,576.6 7,351.9 6,783.4 6,395.2PrivateSuppliers ........................... . 30,725.0 6,813.6 5,801.0 5,363.9 4,580.7 3,855.0 3,187.9 2,393.5 1,773.7 1,347.8 1,009,1Banks ............................... 156,325.7 32,800.2 35,311.1 32,076.8 31,323.8 28,354.5 24,356.4 19,588.4 15,106.2 12,235.5 7,616.5Other . 16,758.3 2,307.5 2,206.8 3,051.5 2,342.3 3,150.1 1,867.7 1,853.7 1,872.9 1,619.6 1,191.7
Total . .414,641.8 56,332.4 59,517.3 57,834.9 56,717.1 54,262.3 47,921.0 41,523.4 35,297.4 30,303.2 23,904.8
NOTE Information on the sources, definitions. coverage. and interpretation of the data is given In the 'GeneraI Notes to Annex Tables!" tems may riot add to totals due to roinding.
Source: World Bank.
caa
ct
C

zc~~~~0 ,S 00 .4 0 CSt 00 C- 0 0C 40 CC0 - ,- 00 o 0- CX 00 0- , 0 40 ,- 04 0o 00 C)0 S0 40 0 .. 0 40C =~~~~~4 00 00U 0 o0 C-- 04 0 ) 0 000 ) CS 04s c0 67 6) CS 00 04) 0D 0 - -- 0o 00i 00 0000 - ^4 0 40 40 )0 00-C CS 0
;~~~~~~~0 E
or CO r CS 000 CSo CS 04 04 00 - CS .0 CS 00 _0 CS) 04 00 00 1) 0 CS 04000 00 0. 04 CS CSCS 0 CS CS CCC r400 000 .- 0) 00D oo r) C
Z~~~~~~~~~~~~~~~~~~1 ° OO 0 0~ r6 °6 O r
C < CS C- 4 C C C- .. CC 0-0 0-0 CC) C. 0- 4 0r _C 0r- C-CC - CC) 0D C CO CC C COC 0C- - - 0 0 - C
o4 oC 0) 0) CS C r4 . CC Cf -tl 0) 00 (DCS 00 000 00 - r 40) CSo? r 00 rt l-Cs 04D 0 04 04 D) ) . u 040) 0 ) 04 0- 0S 0fDt) CS) 00 CS 04D
00) 0 _ 0 00000. CSr \ Ct CSJ CS 04 CC 000 00 CS -OO400 CS 04OD 00_q ___.4_ CS 04044c00 J) CS 0004_ C c ro
_ X c ~~~~~~~~~~~u o Dr D rc O 9_c Oc_ o o °o Ct5 °o cti :5 (rc D rO
D0 CS _ 0 04 000 CS .4 00 0 00Coo 000-C0 S0 - 04 -t *4 r )0C 40 )C 0 )0 )0 S 0- oo 04oo0
e. . et 0 0. . 4 .. 00 .0 .) oo 0 . .0 . . 0 4 CS 04 - 4 00 0.4 . CS 0 . t 0. .D0 0. . . u . . .2 o. .? ct
cz cr 000CS S0 S' )00 S0 )0 - C.400 04 00 CSi CS 0400 CS CSj 00 -0 00 CS 00 000 oo 004 CS 00 0) 000C
0°4 0 0)ct CS04 D 04 CS CS c CS04 CS 00 0004 ° 0004 u oo 04 CS - 04 . j. 0.?4 o 2 0) u .4 ... 4.4. C .40 CS . 4 . 0 .
Q~~~~~~C 0 CS CC 9oS CC er) u j r_ oj C? Cj ccj r_C rC 0r -- °°^ CX _- 0n4 0cC CiuS CS 0) .4 c- cXC er 00 CCC CS CS .) -r er CS rDC 0- ojC 04 c4 0) er) CCC r_ r4 Q
-- - 00 0. ~0 040 0C -- C. C .S .CX . ... .0S000 .) C)-S0 0C .CS.. . C.C ~9)C .) .- .C CS CS .CX .0 0 -C )
.S E C uS er 00 r. . CX o .C. C.- X .-S 0C r 0c .OOD C. . S . . . . 0)j. 0O . 0 . . . . c . . . .u j .- r_ .c c. C .
Ct~~~~~~~~~~~~~~~~~~~~~ ._ . . .t .
e. CC O C C.D 0 EL . .) 00 C r .CS C - .04 0 °?. °? °CX C . .r 00 CC c) CS 0 04 ° C° C C C) 0 04. 00 00 CS 0 C C
~~.-CC--~-CC--C00-0) . . . . .C. . . . . .C.. L)-.0.C. --- C--CX)C-00.4 . .C. . . C. .
~~~~~CC 04000u4 0000r j. 4 eDO6r0)00 0 °? 04 000X1 .4 o0 000 00 CS 04 0 -? 0)00 0004 00 4 04 00000u4.404 0400. 04 CSr 0404 CSj _S CS 04 CS 00 ° °C° °
rr O(D u r_cC o CS o0 0r 04 00 o0 04 0 CS oo CS_ CS 0r rC 6r 0 ot cC cCC o 00 oo 0)0 04 CS CS cC ) oC 00 00 0) 0) OD C CS 00 004CS 00 00 04 0) 040r
CCa n ... 4.4 ... .4 CS 04 0 .40004 .40000)..00..04.0) .400.. . ... 4. 0000 CS 000000 CS 04 0).. .. ).0..0.0. ,0
r 0 Q 04 ., , 40,.,,,00 --0-004 . . 04 ,0 .4. .C. . ... S .O 0J0
uj e w °- O - X - . E . Cx cr~~~~~~~~~~~~~~~~~~~. . . . . . . . .
o Cc
C~~~~~~0.40 00 00 0000 00 .4 - 00 04 04 04 C0 CS j0 00 00 0 CS 00 CS CC 04 04 o00 C 00 0 0j 04 00 00 CS 00 00 00 0) jEr,j,,GrGr<r 00. C
-00 -40 -0 - - - - - -- C -)04 C - -- - -
- -00400004004 -- - - - -0 -0. 00.00 CS 00 - )4C 6 o. 0000000 -0.0000 S0000C~ 0 0 000 -0 4040.00)0 0 0 00 C 4 0040 00. S 00 0C O S0 0. S0CS00 )00 004-0z

a) 0~~~E
t Q '. E- a c-I - - - - - - - -o
---- -- - - - - --- --- -) -CI - .- - -a)00-C -I aI --a- -i-- -I- -c a -CCC I-)a--4cc -a-cc.--00.-aC 0--. Ca-Cc- a-a .- 0 0 )----Ia
C
t s ° 0~~~~~~~~0 cn o cn= _ o oO c n " oCn o cno
_C
CccC00Ca) ...4 . . ..40 0 a0 -.- .C . .C .0. .4c .4- C ) a. -.-. o. . . a) -0-0 . -. . .0 .4.4.0 )a. .
'4 Cr cc 000 -oi .o C o-00 0 cn- 0000cc oo 00 . n 0 cn.i 0 . . C . . . . O O . c .O CO a o o 0
c-i) -c~~~~~~~~~~~~~~~~) .....
C0 C C a) a). 00 r 00 o. oo cca. . .e . 0 cc 0 0. C C cc) a .° C . °° Cn 00 t cc
-E 5 Q oncx r n oS ocn n s zocxJqo cozz o 2. . o. o o o o . .Cd~~~~ ~ ~ 01 0 0z 0 C . ) 0 . C O ( 0 0 c c C) C O-i a ) C a ) C- C n °- ° - C C C - C s a ) C a ) oi C C o - t a-i C 0 0 .- 0 0I 0 z C o . 0 a ) 0 0 o D 0c
C~~~a a ) a ) a ) 0 c c n c n r 0 C D o 0 C o C q 0 0 0 0 r c 0 o a - o 0C a c c c c c c 0 0 a c o C c - a )r C C c -I c c 0 0 C o c c C D C C c c C c c c c 0 c
. E .i E c c o c c o cc .i cc ) C C cc a) cc 00 O a) a) C0 C < - C) C l C. 4 a) CO cc CO c _ o CO 00 .0 ..
l: cC a) a) a) 4o . cn 00 Co) 4r cr o 4 a) aCO CC) ar> e- cr> Cc a) 00. 0 O C O 00 C O00 0 00 00 cc cc Cn Oi Cc)L)a 0 . 4 4 4
Y ~ . . . . . . . . . . n . . . . . X . . . , . .. . . . . . . . . . . . . . . . . . . . . c
,1t~~ ,5 :. , . . . . . . . . . . . . . . . . . . . .. . . . . .c . . . . . . . . . . . . . ...
O~~~~~~~~~~~~~~ . . . . .. ., . . . .. . ., ....
g . . . . . ... ... .
,,, e O --U .E .cK .................... . . . . . . . . . . . . . . . . . . . . . . . . . .. . .°R
1 _; ct . ° C a ) ~~ o n 0 0 o i 0 0 0 L ) a ) 0 0 a ) a ) c n a ) C ° ° - 0 0 c 0 . o C C c c n 0 < C 0 0 < 0 C ) 0 < c c n C 0 0 c c o c c 0 0
t~~~ O 0 0D = _ c n cn c n c nc . cn a a) c n a) c . c n c n c n w cn c n c n 00 c nc n c n C cn) cn 00 c n c n . 4 0 . cn c nc n c nc n a) 0 0. 00 C cn) c .0 cncc nc c c nc nc n
2.- c-~~~~~~~~~~~~~~~~~~~~~~~~- ---- ;00 00 0) a)a) 0< 00 0. C 00.400 - 00 00 cc c a) a).4 a 000000 C C - -o 0000 0~-cOC a).C.0000000

Foreign and International Bond Issues, by Borrower Entity, 1978-80 and First Half 1981 Table 8 l(US$ millions)
Foreign and international bond issues 1: year and type of bond
1978 1979 1980 First half 1981 (P) _.i0
Inter- Inter- Inter- Inter- 0Foreign national Foreign national Foreign national Foreign national
Category of borrower entity bonds bonds Total bonds bonds Total bonds bonds Total bonds bonds Total >
Industrialized countriesAustralia . 989.8 476.9 1,466.7 595.3 140.0 735.3 235.6 278.9 514.5 127.0 60.0 187.0Austria ... 932.2 441.0 1,373.2 762.2 401.1 1,163.3 970.8 1,069.9 2,040.7 501.2 241,2 742.4Belgium 38.4 38.4 - 303.3 303.3 34.4 300.0 334.4 69.0 186.6 255.6Canada . 3,929.5 828.4 4,757.9 2,725.8 1,404.9 4,130.7 1,460.7 1,380.0 2,840.7 1,179.0 1,888.5 3,067.5Denmark h . . . 541.1 412.8 953.9 463.5 223.7 687.2 551.5 437.6 989.1 108.3 126.7 235.0
Finland .... 673.3 334.1 1,007.4 314.7 381.7 696.4 130.4 190.5 320.9 270.9 33.4 304.3France ... . . 528.7 774.6 1,303.3 739.7 1,309.7 2,049.4 429.7 1,933.1 2,362.8 596.7 1,278.2 1,874.9Germany 20.................... . 323.7 344.5 127.5 351.9 479.4 157.3 157.3 61.2 50.0 111.2Iceland .. .. .. 24.7 ... -- 24.7 - 10.0 10.0 -- - 36.1 - 36.1
Ireland . . . .. . 83.3 83.3 70.0 110.0 180.0 279.1 50.0 329.1 - 200.0 200.0
Italy .. 9 0 . 4 ............. 90.4 135.0 225.4 72.2 279.1 351.3 102.2 778.9 881.1 - 390.4 390.4
Japan ...... 3.. . ........... 1,294.3 1,499.6 2,793.9 2,781.9 1,404.0 4,185.9 1,955.7 1,745.8 3,701.5 1,045.1 978.9 2,024.0Liechtenstein . .13.1 13.1 21.5 . 21.5 - 15.6 15.6
Luxembourg .180.................. . 265.2 445.5 36.8 67.8 104.6 55.4 45.8 101.2 74.5 14.5 89.0Netherlands .173.................. 1. 228.3 401.4 502.2 512.1 1,014.3 257.5 1,127.6 1,385.1 143.2 198.0 341.2
New Zealand . .... ............ 313.1 425.4 738.5 330.6 221.8 552.4 122.4 168.1 290.5 208.8 -- 208.8Norway ...... 8.. . ........... 1,503.8 1,120.5 2,624.3 1,022.4 1,015.1 2,037.5 358.7 465.5 824.2 142.3 57.6 199.9Sweden .... 4.... . .......... 499.4 241.9 741.3 957.1 614.4 1,571.5 1,294.7 1,237.7 2,532.4 630.1 247.0 877.1Switzerland ................. .- 84.0 84.0 _ 314.9 314.9 368.4 368.4United Kingdom ............... 671.6 805.3 1,476.9 268.4 968.7 1,237.1 98.2 1,684.4 1,782.6 30.5 305.0 335.5
United States ................. 374.3 1,293.8 1,668.1 156.7 2,571.5 2,728.2 205.5 4,307.4 4,512.9 267.3 2,371.2 2,638.5Tota . .12,87 52 99 05 22,565.7 11,948.5 12,605.7 24,55 42 8,699.8 17,569.6 26,269.4 5,506.8 8,627.2 14134.0

Developing countries or other areasAlgeria ..................... 170.8 558.1 728.9 52.8 130.0 182.8Argentina ............. ...... 67.7 198.7 266.4 154.2 262.4 416.6 138.9 25,0 163.9 - 70.0 70.0Brazil ...................... 395.4 540.7 936.1 371.3 364.3 735.6 91.7 224.5 316.2 45.3 - 45.3Chile ...................... - 50.0 50.0 48.5 35.0 83.5 - 82.2 82.2 - 30.0 30.0Colombia .- .- - - 55.0 55.0
Costa Rica ................... - 20.0 20.0 - - 12.1 97.2 109.3Ecuador ..................... - 62.0 62.0 - - - -Egypt, Arab Republic of ....... ... - 25.0 25.0 - - - - 30.0 30.0El Salvador .................. - 25.0 25.0 - -
Haiti .- - - 8.0 8.0 -
Hong Kong ................... - - - -- - 20.0 20.0India ..................... - - -_ 30.0 30.0 -
Indonesia ...... ............. 50.0 54.2 104.2 37.3 25.4 62.7 45.8 -- 45.8 46.5 46.5Iran ..................... 43.2 25.4 68.6 - -Israel ..................... 306.0 120.0 426.0 237.4 200.0 437.4 325.5 130.0 455.5 - 7.0 7.0
Ivory Coast .- - - 14.1 - 14.1 -
Korea, Republic of .............. 56.0 56.0 - 43.6 43.6 4/.8 47.8 30.0 30.0Kuwait .... 61.6 61.6Malaysia .... ........ ..... 119.7 20.0 139.7 122.4 30.0 152.4Mexico ..................... 341.6 345.9 687.5 138.0 225.0 363.0 56.2 265.0 321.2 108.9 735.0 843.9
Morocco ... 91.5 91.5 - 21.8 21.8 23.2 - 23.2 _ -
Panama ..................... 43.2 171.9 215.1 60.7 50.0 110.7 - 25.0 25.0Philippines ............... ... 141.2 74.8 216.0 76.2 100.0 176.2 - 66.8 66.8Portugal ................... - - -- 30.0 30.0Saudi Arabia - -- 14.7 14.7
Singapore 25.0 25.0 -- 25.0 25.0 - - 34.9 34.9South Africa ..... . .......... 338.0 143.9 481.9 232.6 11.0 243.6 155.7 215.1 370.8 92.0 92.0Spain .... . .......... . 181.8 141.9 323.7 356.8 124.2 481.0 283.9 157.2 441.1 63.9 100.0 163.9Thailand ..... . .......... 44.2 24.6 68.8 46.2 130.0 176.2 45.9 - 45.9Trinidad and Tobago .u.... ...... . 113.1 36.9 150.0
Tunisia 25.7 25.7 -- - - -Venezuela .... . ........... 307.4 382.3 689.7 153.6 153.6 - 131.5 131.5 195.8 - 195.8Yugoslavia .............. .. 46.7 80.0 126.7 46.3 50.0 96.3 12.2 25.0 37.2 -
Talwan, China .............. . - 20.0 20.0 29.8 - 29.8 - 25.0 25.0 __ -Total .....................- 2,766.0 3,325.1 6,091.1 2,025.2 1,989.3 4,014.5 1,205.2 1,662.3 2,867.5 552.4 1,026.9 1,579.3 3
Centrally planned countries nHungary ................... - --- - - 50.0 50.0 - ->
Poland . . . .... ... .30.0 30.0 18.1 30.0 48.1 - - - ,Total ........... .. - 30.0 30.0 18.1 30.0 48.1 50.0 50.0 _- (
(contlnued) (cn

Foreign and International Bond Issues, by Borrower Entity, 1978-8() and First Half 1981 (continued) Table 8 <
(US$ millions)
Foreign and international bond issues 1: year and type of bond U)
1978 1979 1980 First half 1981 (P)
Inter- Inter- Inter- Inter- f 33
Foreign national Foreign national Foreign national Foreign nationalCategory of borrower entity bonds bonds Total bonds bonds Total bonds bonds Total bonds bonds Total >
(D
International organizations xAfrican Development Bank (AfDB) . - 40.0 40.0 - 108.3 108.3 -
Asian Development Bank (AsDB) . .. 162.1 197.9 360.0 115.5 124.7 240.2 219.9 106.8 326.7 108.5 69.7 178.2Central American Bank forEconomic Integration (CABEI) - - 12.5 20.0 32.5 - -
Council of Europe .103.5 126.5 230.0 118.6 122.4 241.0 136.8 - 136.8 79.3 - 79.3European Atomic EnergyCommunity (Euratom) 44.4 44.4 84.7 86.1 170.8 11.6 - 11.6 14.1 102.7 116.8
European Coal and SteelCommunity (ECSC) .363.0 492.2 855.2 262.1 425.9 688.0 274.2 532.4 806.6 169.2 40.0 209.2
European Economic Community (EEC) - - 125.0 125.8 250.8 - 191.0 191.0 - 90.0 90.0
European Investment Bank (EIB) . . 1,097.9 1,053.0 2,150.9 1,152.6 968.2 2,120.8 1,559.9 736.3 2,296.2 403.0 227.1 630.1International Bank for Reconstructionand Development (IBRD) 3,796.0 700.0 4,496.0 3,567.6 774.0 4,341.6 3,268.5 1,493.0 4,761.5 1,017.2 1,017.9 2,035.1
Inter-American DevelopmentBank (IDB) .139.3 74.0 213.3 370.9 - 370.9 326.0 326.0 233.8 50.8 284.6
Nordic Investment Bank (NIB) ..... _- 35.0 35.0 30.3 75.2 105.5 20.4 20.4 - 64.6 64.6Total.5,706.2 2,118.6 8,424.8 5,839.8 2,830.6 8,670.4 5,796.9 3,079.9 8,876.8 2,025.1 1 ,662.8 3,687.9
OthersEurofima I . 140.8 151.6 292.4 117.2 218.2 335.4 51.4 144.0 195.4 127.4 127.4Unallocated borrowers I 53.9 24.0 77.9 16.3 125.6 141.9 - - _30.0 30.0
Total .194.7 175.6 370.3 133.5 343.8 477.3 51.4 144.0 195.4 12/.4 30.0 157.4
RecapitulationIndustrialized countries .12,875.2 9,690.5 22,565.7 11,948.5 12605.7 24,5'4. 2 8,699.8 12,)569.6 26,269.4 5,506.8 8,621.2 14.134.0Developing countries or other areas. 2766.0 3,325.1 6,091.1 2 025.2 1989.3 4,014.5 1,205.2 1.662.3 2,867 .5 552.4 1.026.9 1,579.3Centrally planned couLntries 30.0 30.0 18.1 30.0 48.1 50.0 50.0 -
International organizations 5,706.2 2,718.6 8,424.8 5,839.8 2,830.6 8,670.4 5,796.9 3,079.9 8,876.8 2,025.1 1,662.8 3,687.9Others .194.7 175.6 370.3 133.5 343.8 477.3 51.4 144.0 195.4 127.4 30.0 157.4
GRAND TOTAl 21,542.1 15,939.8 37,4819 19,965.1 17,799.4 37,764.5 15,753.3 22,505.8 38,259.1 8,211.7 11,346.9 19,558.6
i Includes both puiblic offerings and private p acerferds.2 Societe EUropvenne pour le Financeoieit de Mater el Ferroviaire.3 Includes the following corporationis: Barico Latinoamericano de Exportac,olues S.A.; Iltershop Overseas Finance (Curayao) NV.; Megal Finance Co., Ltd.; Private Investment Co.. for Asia, SA.; Scandinavian, Anines System (SAS), TraoTs Austria
Gaslirie Finance Co., Ltd.(P) Preliminiary.Source; World Bank.

Statistical Annex 147
Publicized Eurocurrency Credits by Borrower Entity, Table 91978-80 and First Half 1981(US$ millions)
Publicized Eurocurrency credits
First halfCategory of borrower entity 1978 1979 1980 1981 (P)
Industrialized countriesAustralia ... .............................. 799.2 561.0 1,367.9 2,247.2Austria .................. ............ 150.0 - - -
Belgium .................................... 40.0 1,000.0 2,350.0Canada ................................... 9,580.6 946 0 3,287.8 200.0Denmark ................................... 2,334.6 1,210.7 1,324.5 982.8
Finland ................................... 550.5 42 0 1,090.0 236.8France ......... ........................... 2.475.0 2.735.0 1,959.5 2,250.0Germany .................................... - 149.0 33.0Iceland .................................... 70.0 154.8 35.0 60.0Ireland ........... ................. 676.2 739.6 386.6 551.9
Ita y . .................. 2,808.4 3,414.6 6,176.8 2,956.5Japan ..................................... 86.2 262.0 30.0Liechtenstein . ............................. 6.1Luxembourg ................................. - 55.8 30.0Netherlands ......................... ....... 1,090.0 303.3 288.0 13.4
New Zealand ................................. 460.0 15.0 715.0Norway ..................................... 1,175.4 1,174.6 852.7 137.8Sweden .................... ................ 1,861.0 1,318.6 1,298.7 1,400.0United Kingdom ....... 4...... . . 4,721.7 1377.0 954.3 271.1United States ................................. 2,464.7 3,844.8 7,489.0 1,081.8
Total ...... 31,343.5 19,041.8 29,867.8 12,458.4
Developing countries or other areasAlgeria ..................................... 2,068.4 1,708.3 303.0Angola ..................................... - - _ 30.0Antigua .................................... 10.0 - -
Argentina . ................................. 1,273.0 2,122.8 2,289.8 1,457.0Bahamas ................................... - - 35.0 15.0
Bahrain .................................... 60.0 70.0 328.5Barbados ................................... 10.0 - -
Bermuda .................................... - - 47.5Bolivia ..................................... 227.0 47.0Botswana ................................... 45.0 -
Brazil ..................................... 5,110.7 5,833.8 4,415.0 1,973.0Burma ..................................... 10.0 26.9 56.9 120.0Cameroon ................................... 9.0 58.8 -
Chile ..................................... 1,145.0 810.0 899.0 948.7China ..................................... - 2,995.0 480.9
Colombia .... .............................. 85.0 888.5 727.9 580.0Costa Rica ........... ....... ..... 220.8 172.0 157.0Cyprus ..... .............................. 85.0 - 141.1 15.0Dominican Republic ..... ...................... 60.0 195.0 160.0Ecuador ..... ............................. 252.1 935.5 711.6 260.0
Egypt, Arab Republic of .......................... 63.5 6.5 186.3 18.0Ethiopia .................................... - 14.0 -
Fiji ..................................... - 36.0 - -Gabon ..................................... 86.0 100.0 100.0Ghana ..................................... 21.5 - 4.2
Greece ..................................... 569.9 1,034.0 1,174.4 600.0Guatemala .................................. - - - 54.0Guinea ... ................................. 15.0 45.0 -
Honduras .... . . ............. . -- 93.0 - 24.2Hong Kong ................................. . 629.0 788.7 597.4 202.0
(continued)

148 Statistical Annex
Publicized Eurocurrency Credits by Borrower Entity,1978-80 and First Half 1981 (continued)
(US$ millions)
Publicized Eurocurrency credits
First halfCategory of borrower entity 1978 1979 1980 1981 iP)
Developing countries or other areas 'continued)
India .................................... 55.0 50.0 60.7 880.0Indonesia ................................... 1,622.7 670.4 1,079.5 442.5Iran .................................... 1,132.0 - - -Iraq ................................... 184.5 - - -Ivory Coast ................................. 159.4 137.3 350.0 427.7Jamaica ................................... - 126.0 - 173.0Jordan .............................. ..... 110.0 118.0 150.0 -
Kenya ................................... - 212.0 10.0 -
Korea, Republicof ........ot..................... 1,699.0 2,589.5 1,903.4 688.2Kuwait ................................... 186.0 19.4 72.3 141.6Lebanon ................. ...... ... 155.0 - - 70.0Lesotho ............. ..................... - 10.0 10.0 -Liberia ................................... 60.0 27.8 - -
Macao .................u... - - - 15.0Madagascar ................................. 29.6 26.3 5.5 -
Malawi ................................... 12.0 50.0 11.5 -Malaysia ............... ...... ...... 1,077.0 197.3 1,350.0 545.0Mauritania ........ ...... ...... 18.0 - - -Mauritius ................................... - 50.0 45.0 -
Mexico ................................. . 6,553.7 7,654.5 5,017.0 2,328.5Morocco ...... ............................ 620.0 450.0 450.0 40.0Mozambique ................................ - - 20.0 -
Nauru, Republic of ........... . ........... .. ...... 25.0-Netherlands Antiles ....................... .. - - 32.0 40.0Nicaragua .................................. 15.0 - - -
Niger ................................... - 37.0 13.0 -
Nigeria ................................... 1,750.0 1,116.1 632.6 1,114.0Oman ............................. - 150.0 - -
Pakistan ................................... 6.0 150.2 50.0 5.5Panama ................................... 553.5 155.0 225.0 145.0Papua New Guinea ............ .... 60.0 35.0 103.5 125.0Paraguay ................................... - 7.0 - -
Peru ................................... - 525.4 210.0 405.0Philippines .................................. 1,872.0 1,672.5 1,121.1 404.6Portugal ................................... 641.2 811.0 706.0 1,100.0Qatar ................................... 275.0 - - -
Saudi Arabia ...... ........ .. .... 179.9 258.0 242.9 -Senegal ...... ...................... 60.0 - - 7.5Singapore ................................... 100.0 149.3 50.0 70.0South Africa .................................. - 52.1 325.0 -
Spain .................................... 2,200.2 3,632.0 4.348.5 2,427.3Sri Lanka ................................... - 50.0 53.3 99.0Sudan .................................... 9.5Swaziland ................................... 28.0 -
Tanzania ............ ......... ...... - 12.0 - -
Thailand ................................... 205.5 200.0 824.6 330.0Trinidad and Tobago .......... .. .. .... .... - 39.0 301.0 -
Tunisia ................................... 195.0 154.2 11.7Turkey .................................... 350.0 532.0 - -
United Arab Emirates .................. ..... 706.2 383.6 92.5 8.0
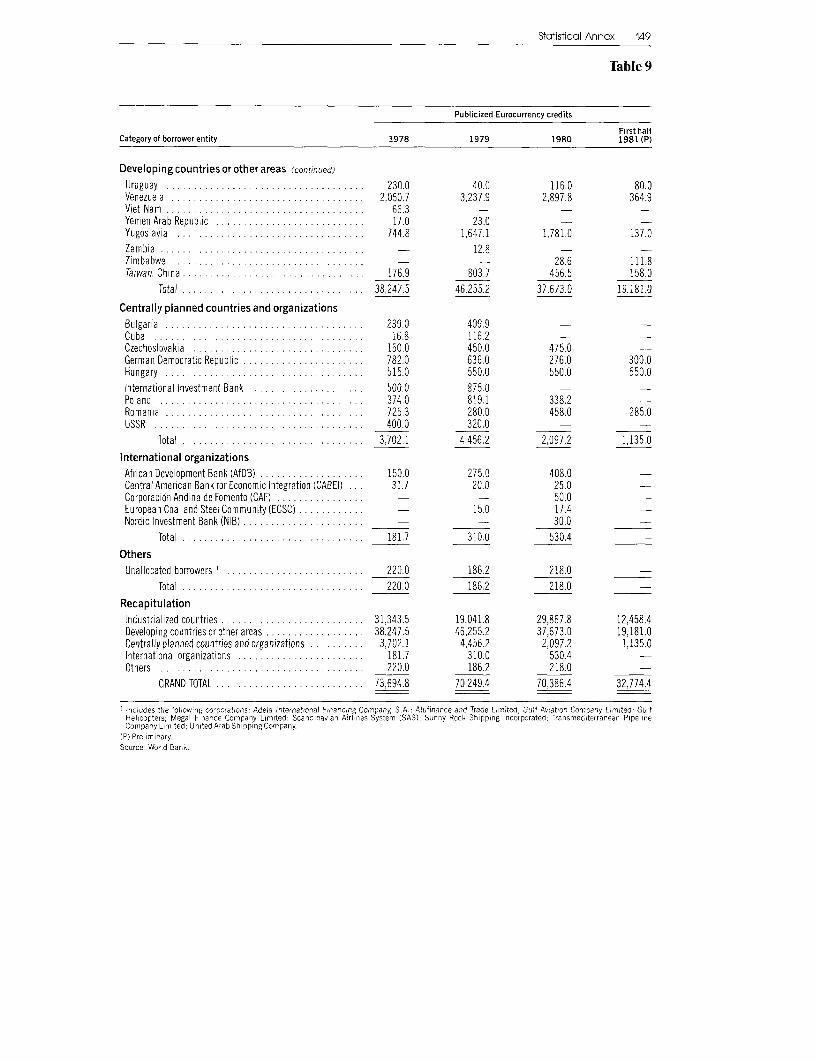
Statistical Annex 149
Table 9
Publicized Eurocurrency credits
First halfCategory of borrower entity 1978 1979 1980 1981 (P)
Developing countries or other areas (continued)
Uruguay .............................. 230.0 40.0 116.0 80.0Venezuela ............................ .. 2,050.7 3,237.9 2,897.8 364.9Viet Nam .................................... 66.3 - - -Yemen Arab Republic ............. .............. 17.0 23.0Yugoslavia .............................. 744.8 1,647.1 1,781.0 137.0Zambia .................. ............ - 12.8 -Zimbabwe ............................ .. - - 28.6 111.8Taiwan, China .......... .... ................ 176.9 803.7 456.5 158.0
Total .............................. 38,247.5 46,255.2 37,673.0 19,181.0
Centrally planned countries and organizationsBulgaria ............................... 239.0 409.9 -Cuba ................ .............. 16.8 116.2 -Czechoslovakia ............................ 150.0 450.0 475.0German Democratic Republic ............. ....... 782.0 636.0 276.0 300.0Hungary ............................... 515.0 550.0 550.0 550.0International Investment Bank .. . .............. . 500.0 875.0Poland .................. ............ 374.0 819.1 338.2Romania ............................ 725.3 280.0 458.0 285.0USSR ... ........................ 400.0 320.0 - -
Total 3,702.1 4,456.2 2,097.2 1,135.0
International organizationsAfrican Development Bank (AfDB) ................... 150.0 275.0 408.0CentralAmerican BankforEconomic Integration (CABEI) ... 31.7 20.0 25.0Corporaci6n Andina de Fomento (CAF) ................ - - 50.0European Coal and Steel Community (ECSC) ...... ...... - 15.0 17.4Nordic Investment Bank (NIB) ......... ............. - - 30.0 _
Total .............................. 181.7 310.0 530.4 -
OthersUnallocated borrowers I ................... ...... 220.0 186.2 218.0
Total .220.0 186.2 218.0 __
RecapitulationIndustrialized countries ........... ............. 31,343.5 19,041.8 29,867.8 12,458.4Developing countries or other areas ............... . 38,247.5 46,255.2 37,673.0 19,181.0Centrally planned countries and organizations ........ . . 3,702.1 4,456.2 2,097.2 1,135.0International organizations ...................... . 181.7 310.0 530.4Others.. ............................ 220.0 186.2 218.0 _
GRAND TOTAL ......................... . 73,694.8 70,249.4 70,386.4 32,774.4
Incduces the fol.ooAng coroorat;ons: Adela International Frnarcirg Company, S.A Alufinance and Trade L.m ted: Gulf Aviatior Company L m.ted; GultHelicopters; Megal F nance Company Lim ted; Scandinavian Airl nes System (SAS): Sunny Rock Sh pping Incorporated, Transmediterrarear PipelineCompany Limted; United Arab Soi ppingCompany.
(P) Prel minarySource World Bar,.
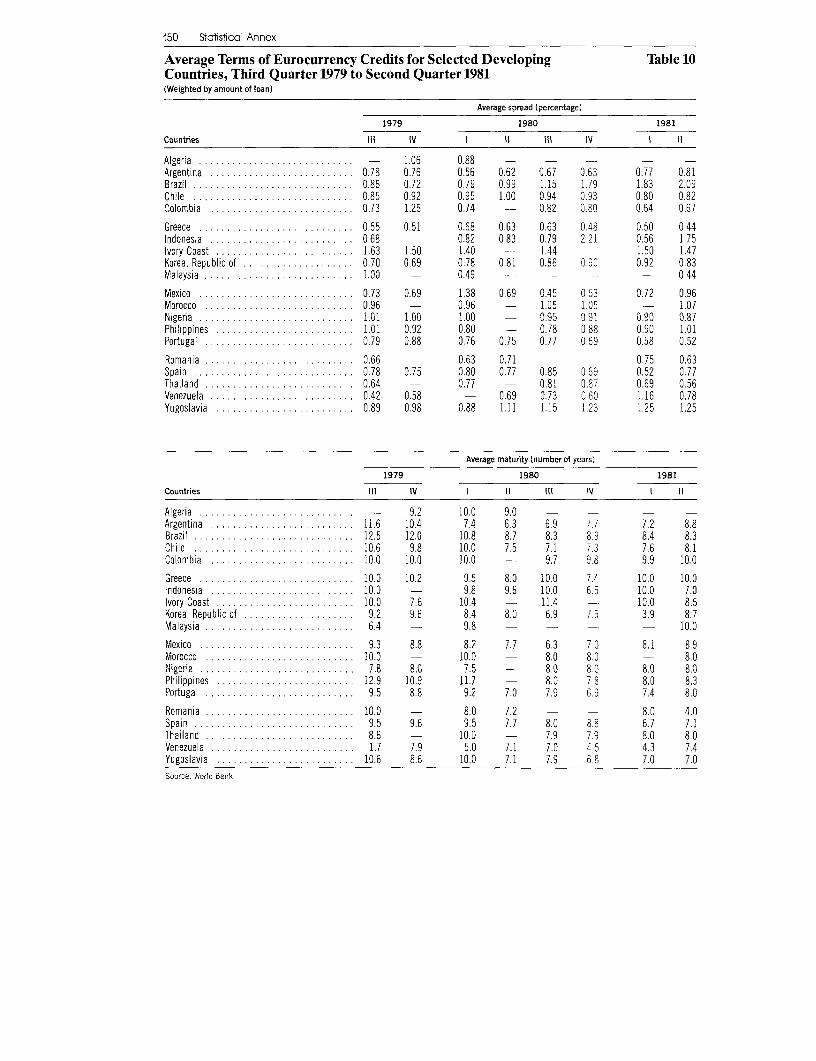
150 Statistica Annex
Average Terms of Eurocurrency Credits for Selected Developing Table 10Countries, Third Quarter 1979 to Second Quarter 1981(Weighted by amount of loan)
Average spread (percentage)
1979 1980 1981
Countries III IV I 11 III IV I II
Algeria ........................... - 1.06 0.88 - - - - -
Argentina .......................... 0.78 0.76 0.56 0.62 0.67 0.63 0.77 0.81Brazil ........................... 0.86 0.72 0.79 0.99 1.15 1.79 1.83 2.09Chile ........................... 0.85 0.92 0.95 1.00 0.94 0.93 0.80 0.82Colombia .......................... 0.73 1.25 0.74 - 0.82 0.80 0.64 0.67
Greece ........................... 0.55 0.51 0.68 0.63 0.63 0.48 0.50 0.44Indonesia .......................... 0.68 - 0.82 0.83 0.79 2.21 0.56 1.75Ivory Coast ......................... 1.63 1.50 1.40 - 1.44 1.50 1.47Korea, Republic of ............ ........ 0.70 0.69 0.78 0.81 0.86 0.90 0.92 0.83Malaysia ........................... 1.00 - 0.49 - - --- - 0.44
Mexico ............................ 0.73 0.69 1.38 0.69 0.45 0.53 0.72 0.96Morocco ........................... 0.96 - 0.96 - 1.05 1.05 - 1.07Nigeria ........................... 1.01 1.00 1.00 - 0.95 0.91 0.90 0.87Philippines ....................... . 1.01 0.92 0.80 - 0.78 0.88 0.90 1.01Portugal ........................... 0.79 0.88 0.76 0.75 0.77 0.69 0.58 0.52
Romania ........................ . 0.66 - 0.63 0.71 - - 0.75 0.63Spain ........................... 0.78 0.75 0.80 0.77 0.85 0.69 0.52 0.77Thailand ............ ....... 0.64 - 0.77 - 0.81 0.87 0.69 0.56Venezuela ........................ . 0.42 0.58 - 0.69 0.73 0.60 1.16 0.78Yugoslavia ....................... . 0.89 0.98 0.88 1.11 1.15 1.23 1.25 1.25
Average maturity (number of years)
1979 1980 1981
Countries III IV I II III IV I It
Algeria ............ . .......... . . - 9.2 10.0 9.0 - - - -
Argentina ........... ............. . 11.6 10.4 7.4 6.3 6.9 7.7 7.2 8.8Brazil ............................ 12.5 12.0 10.8 8.7 8.3 8.9 8.4 8.3Chile ............................ 10.6 9.8 10.0 7.5 7.1 7.3 7.6 8.1Colombia ........ 10.0 10.0 10.0 - 9.7 9.8 9.9 10.0
Greece ........................... 10.0 10.2 9.5 8.0 10.0 7.4 10.0 10.0Indonesia .......................... 10.0 - 9.8 9.6 10.0 6.5 10.0 7.0Ivory Coast ......................... 10.0 7.6 10.4 - 11.4 - 10.0 8.5Korea, Republic of ................ 9.2 9.6 8.4 8.0 6.9 7.5 3.9 8.7Malaysia ........................... 6.4 - 9.8 - - - - - 10.0
Mexico ........................... 9.3 8.8 8.2 7.7 6.3 7.0 8.1 8.9Morocco .............. ............ 10.0 - 10.0 - 8.0 8.0 - 8.0Nigeria ........................... 7.8 8.0 7.5 - 8.0 8.0 8.0 8.0Philippines ......................... 12.9 10.9 11.7 - 8.0 7.8 8.0 8.3Portugal ........................... 9.5 8.8 9.2 7.0 7.9 6.9 7.4 8.0
Romania .................... ...... 10.0 - 8.0 7.2 - - 8.0 4.0Spain ........................... 9.5 9.6 9.5 7.7 8.0 8.8 6.7 7.1Thailand ........................... 8.6 - 10.0 - 7.9 7.9 8.0 8.0Venezuela .......................... 1.7 7.9 5.0 7.1 7.0 4.5 4.3 7.4Yugoslavia ......................... 10.6 8.6 10.0 7.1 7.9 6.8 7.0 7.0Source: World Bank.

151
Bank Appendices
Financial StatementsPage
Appendix A Balance Sheet ............................... 152Appendix B Statement of Income . .......................... 154
Statement of Accumulated Net Income ........ ....... 154Statement of Changes in General Reserve ....... ...... 154
Appendix C Statement of Changes in Financial Position ....... ..... 155Appendix D Summary Statement of Loans ........... .......... 156Appendix E Summary Statement of Borrowings ........ ......... 159Appendix F Statement of Subscriptions to Capital Stock
and Voting Power .............................. 160Appendix G Notes to Financial Statements ........... .......... 163Report of Independent Accountants . .......................... 167

152 Bank Appendices
Balance SheetJune 30, 1981 and June 30, 1980
Expressed in United States dollars (in thousands)-See Notes to Financial Statements, Appendix G
Assets 1981 1-80
DUE FROM BANKSUnrestricted currencies (including interest-bearing demand deposits$165,088-1981, $213,140-1980) ........... .................... $ 276.394 $ 357,145
Currencies subject to restrictions-Note B .. 280,226 176,945$ 556,620 534,090
INVESTMENTS-Note CObligations of governments and their instrumentalities .................... $ 6,175,761 7,021,405Time deposits and other obligations of banks and financial institutions ....... . 1,932,010 2,655,435
8,107,771 9,676,840
RECEIVABLE ON ACCOUNT OF SUBSCRIBED CAPITAL-Subject to restrictions-Note BNon-negotiable, non-interest-bearing demand obligations ..... . . . . . . . . . . . $ 489,675 497,272Amount due on subscribed capital ........... .. .. . .. .. .. . .. .. ..- 81,428Amounts required to maintain value ot currency holdings ........ . ....... . 1,310 1,950
490,985 580,650
RECEIVABLES-OTHERSales of investment securities ................. .. .. .. ... . .. .. ... .. . $ 246 29,283Accrued income on loans .................... .. ... .... ... . . .. . , 534,977 540,158Accrued interest on investments ............... .. .. .. .. .. .. .. .. .. .. . 182,464 142,070
717,687 711,511
LOANS (See Appendix D) ................... ... .... .... ... .... ... . . $54,090,488 51,546,740Less-Loans approved but not yet effective .......... ........... . . . . . 6,551,900 6,742,600Effective loans (including undisbursed balance $21,580,777-1981,$18,110,545-1980) .......... ................ .... . 47,538,588 44,804,140
OTHER ASSETSLand and buildings-Less accumulated depreciation ($16,332-1981,$14,667-1980) ...................................... ....... .. $ 103,788 98,015
Unamortized issuance costs of borrowings ........... . . . . .. . . . . . . . .. . . . 157,131 146,503Notional amounts required to maintain value of currency holdings-Note B .... . 432,125 513,417Maintenance of value of capital subscriptions outstanding on loans,not yet due-Note B ....................... ... .... .... .... ... . . 1,276 1,384
Miscellaneous ...... .................. 182,168 116,076876,488 875,395
$58,288,139 .$57,182,626
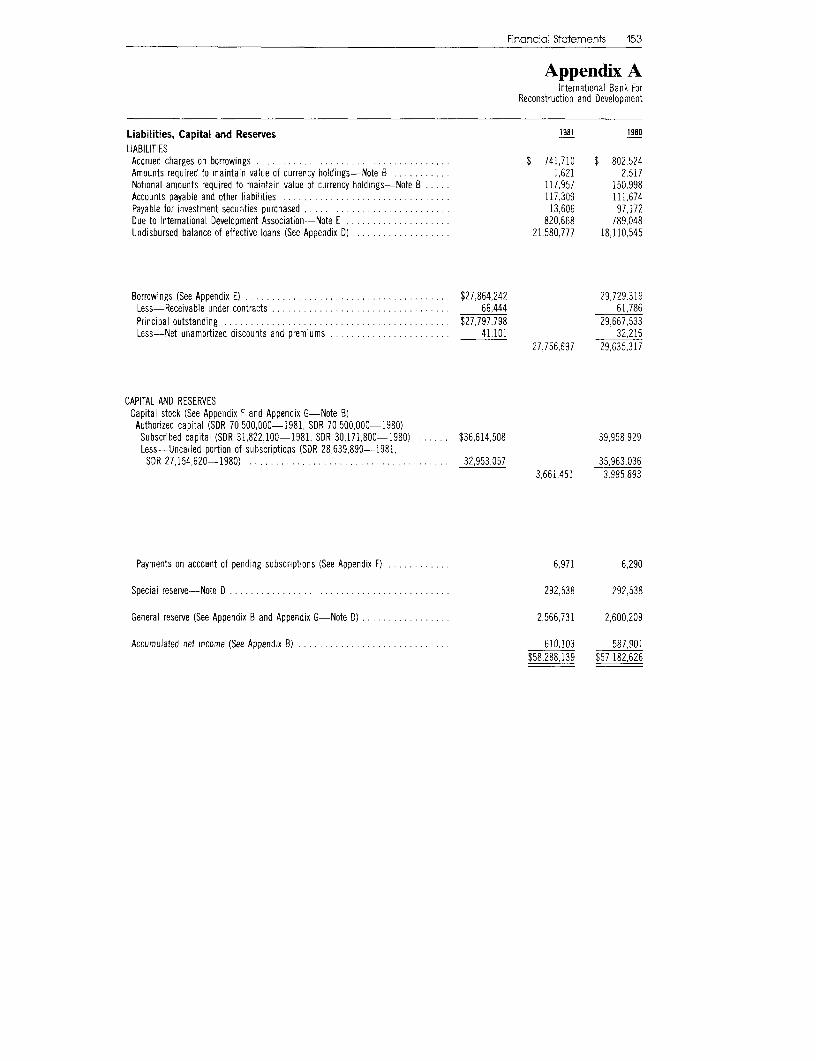
Financicl Statements 153
Appendix AInternational Bank For
Reconstruction and Development
Liabilities, Capital and Reserves 1981 1980LIABILITIESAccrued charges on borrowings ..................................... 741,710 $ 802,524Amounts required to maintain value of currency holdings-Note B . .. . 1,621 2,517Notional amounts required to maintain value of currency holdings-Note B ..... 117,957 150,998Accounts payable and other liabilities ................................ 117,309 111,674Payable for investment securities purchased .......... 13,606 97,172Due to International Development Association-Note E ........ ...... . 820,668 789,048Undisbursed balance of effective loans (See Appendix D) ......I........... 21,580,777 18,110,545
Borrowings (See Appendix E) ....................l.............. .. $27,864,242 29,729,319Less-Receivable under contracts . .... .. . . . . ... 66,444 61,786Principal outstanding ........................... $27,797,798 29,667,533Less-Net unamortized discounts and premiums ...... ..... ........... 41,101 32,216
27,756,697 29,635,317
CAPITAL AND RESERVESCapital stock (See Appendix F and Appendix G-Note B)Authorized capital (SDR 70,500,000-1981, SDR 70,500,000-1980)Subscribed capital (SDR 31,822,100-1981, SDR 30,171.800--1980) ...... $36,614,508 39,958,929Less-Uncalled portion of subscriptions (SDR 28,639,890-1981,SDR 27,154,620-1980) ......................... ... . 32,953,057 35,963,036
3,661,451 3,995,893
Payments on accoant of pending subscriptions (See Appendix F) ............ 6,971 6,290
Special reserve-Note D ......0................................. 292,538 292,538
General reserve (See Appendix B and Appendix G-Note D) . .......... 2,566,731 2,600,209
Accumulated net income (See Appendix B) ............................. 610,103 587,901$58,288,139 $57.182,626

154 Bank Appendices
Statement of Income Appendix BInternational Bank for
Reconstruction and Development
For the fiscal years ended June 30, 1981 and June 30, 1980Expressed in United States dollars (in thousands)-See Notes to Financial Statements, Appendix G
July 1-June 301980/81 1979/80
Income
Income from loans:Interest .1..... ...... ........ .. $L986,529 $1,800,996Commitment charges ......................... ............................... 177,133 143,787
Income from investments-Notes C and G ........................C............... 813,255 834,498Other income-Note G . .... .............. .. .....0.. .. ..... 22,135 20,249
Total Income 5..... .. ..... $2,999,052 $2,799,530
ExpensesInterest on borrowings . . ... $2,104,068 $1,975,469Administrative expenses-Notes F and G .............................. ....... .. 254,824 197,967Bond issuance and other financial experses ............................ ............. 30,057 38,193
Total Expenses $2,388,949 $2,211,629
Net Income-Notes A and D $ 610,103 $ 587,901
Statement of Accumulated Net IncomeFor the fiscal years ended June 30, 1981 and June 30, 1980Expressed in United States dollars (in thousands)-See Notes to Financial Statements, Appendix G
July 1-June 301980/81 1979/80
Accumulated net income at beginning of fiscal year .................................. S 587,901 $ 406,542Allocation to General Reserve. (469,901) (306,542)Transfer to International Development Association-Note D 1118.000) (100,000)Net income for fiscal year 610,103 587,901
Accumulated net income at end of fiscal year $ 610,103 $ 587,901
Statement of Changes in General ReserveFor the fiscal years ended June 30, 1981 and June 30, 1980Expressed in United States dollars (in thousands)-See Notes to Financial Statements, Appendix G
July 1-June 301980/81 1979/80
Balance at beginning of fiscal year $2.600,209 $2,205,577Allocation of portion of accumulated net income .... 469,901 306,542Translation adjustments-Notes A and D (503,379) 88,090
Balance at end of fiscal year $2 566,731 $2,600,209

F nancial Statemerts 105
Statement of Changes in Appendix Clinterratienal Bank solFinancial Position Recorstruction and Development
For the fiscal years ended June 30, 1981 and June 30, 1980Expressed in United States dollars (in thousands)-See Notes to Financial Statements, Appendix G
July 1-June 30
1980.81 1979,80
Funds Provided
OperationsNet income (See Appendix B) ..................... .................... 610,103 $ 587 901Items not requiring or providing cash:Accrued income on loans and investments ............. ....... (35,213) (120 319)Accrued charges on borrowings and administrative expenses ........ . . . . . . . . (6.633) 114.402Depreciation ...................... .......................... . 1.666 1,468Amortization of discounts, premiums and bond issuance expenses ...... . . . . . . 29,342 25,95 1
Cash provided by operations ..... . ........... ............. $ 599,265 5 609,403Borrowings (See Appendix E) .... ................. .l..... . . 4.969.189 5573 797Adjustments of borrowngs outstanding as a result of currency depreciationsand appreciations (See Appendix E) .................... . ... l. (4,111.291) 604.200
Repayments of loans to the Bank' . . . 1,440,710 1182.486Sales of loans .. 25,470 23.052Capital 2:
New subscriptions (16,503 shares-1981, 11,816 shares 1980) . . . . . . .5. .. .. . . 5 199.084 142,542Adjustments as a result of depreciations and appreciationsof the SDR in terms ot the United States dollar . ..... . ..... . . . (533 526) 110 426
Decrease (increase) in amounts required to maintain thevalue of currency holdings .. 48,104 140,083)Increase in restrcted currencies and receivables . ......... ........... . . (14 256) (89 951)
(Decrease) increase in lendable capital .......... . .. . . .. . .. . .. . .. . ... .. . . (300 594) 122.934Decrease in amounts receivable for investment securities traded .............. . . ..... 29,037 344 121Other.. . . . . . . .......... .... . . 681 54 824
Total Funds Provided . . . . . . .............. . 2 646,467 $8 514 817
Funds UsedDisbursements on loans .. .... .. ............ . . . . . .. $ 5,171.239 $4,369,045Adjustments of loans outstanding as a result of currency depreciations and appreciations. (4,440,843) 643,498Retirement of borrowings (See Appendix E. 2,721,633 2.790,958Translation adjustments-Notes A and D .0 ........ . ......... 503,379 (88,090)Decrease in amounts payable for investment securities traded 83 596 409,125Payments on transfers to International Development Association 86 382 103,230Other ...... . . ... ....... ... ..... . . .................. . . . .. 170.933 135.976
Total Funds Used .c......... .. .. .. .. .. .. .. . . . .. .. .. . . . . S 4,296 287 $8,363 742
(Decrease) Increase in Unrestricted Currencies and Investments. $(1.649,820) $ 151,075
'The doliar eqj va ents of loan pr<ic pa repayments are shown at the market rates o' exciange ir effect on the dates of repayments prey c s1, the,were showrn at te average of tie r storica rates of eaciange prevail ig at rhe time the funds were rrig na y d sbursec The dol a equiva er-s treseoarn pe nc pa repayments at average historica rates are $1,272,C97,CCO ($976 718.000- 1980).
2Coc udes uncalled por-ion of capital subscrirtions. Capital suicscript or items for the f sca year ended June 30, 198C fave ceel ricc ry ed tc,ccnform tr the presentation of cap tal subscr ption iterms dur ng the fiscal year ended June 3c, 1981

0)0) 5O 2! M! ZS) ))00 C-C 00 aaa 1a a C -00C n0
,0
c-C 0)0 D.,)0)CoCC
0 )a a fl' nCr-C :0)0 . . C. ~ ~ - - 0)0. . .- . . . . . ' . . . ."0 s
.n. . . . . . . .. ... .0. . . . .- ... . .C. . .. . . . . ) . . . . . . . ... ... . . .
. .. . . . . . . . . . . . . . . . . . . . . . . . . a .- . . . . . .a
. . . .. . . . . . .a
. . . . . . . . . . . .. . . . . . . . . . . . . . . . . . . . . . .~~~~~~~~~~~~~~~~~~~~~~~~~~~~~~~~~~~~~~~~~~~~~~~~~~~~~~~~~~~~~~~~~~~~~~~~~~~~~~~~~~~~~~~~~~~~~~~~~~~~~~~~~~~~~~~~~~~~~~~~~~~~~~~~~~~~~~~~-.. D
. . . . . . . . . . .a. . . a. .C . . .. . . 0In
CO - - - -- - - - - Om--
. . . . . . . .. . . . . . . . . . .

Firancia Statements 157
Appendix DInternational Bank for
Reconstruction and Develooment
June 30, 1981
Effective loans held by Bank Loans Percent ofapproved total effective
Disbursed Undisbursed but not yet and non-Borrower or guarantor' portion portion2 Total effective3 effective loans
Papua New Guinea .. .......... ........ 7,066 24.011 31,077 6,000 .07Paraguay ... .......... . .... . 87 681 124,596 212,277 58,800 .50Peru ......................... . . 373.107 219,718 592,825 158,000 1.39Philippines ........................... 1,079,733 1,321.848 2,401,581 250,000 4.90Portugal .................... ..... . 116.408 501,498 617,906 20,000 1.18Romania ....... .. . ..... . 871.088 719,225 1,596,313 155,000 3.24Senegal ..................... ........ 59,249 62,505 121,754 25.800 27Sierra Leone .............. . . . ..... . 13,646 173 13,819 - .03Singapore ........ . ..... . 122,696 271 122,967 - 23Spain . .. 230,989 20,321 251,310 - 46Sn Lanka ... . 32,451 - 32,451 - .06Sudan .................. . . . ... . 54,971 28,950 83.921 .15Swaziland .......... ..... 16,053 25,870 41,923 10,000 10Syrian Arab Republic .. . .. . 214,967 204,572 419.539 15,600 .80Tanzaniam a 5 . ... 212,536 96,923 309,459 - .57Thailand .......................... . 818,840 802,186 1,621.026 327,900 3.60Togo .............. .......... ...... 3,042 - 3,042 .01Tnnidad and Tobago ................ .. .. . 55,784 22,021 77,805 - .14Tunisia . .......................... . 280,759 319,494 600,253 189,600 1.46Turkey ....... ...... ..... ...... ..... 1,226,824 1.017,434 2,244,258 520,000 5.11Uganda5 . ..... 1.742 - 1.742 __
United Kingdom ........... ..... ....... ..... 11.844 - 11,844 - .02Uruguay ....... ...... ..... ..... .1.... 72.950 134,296 207,246 30,000 .44Venezuela ... .... 141,021 - 141,021 - .26Yugoslavia . . . 1,376,216 818,578 2,194,794 321,000 4.65Zaire ............ . 8 2,7 0 4. . ...... 82,704 - 82,704 - .15Zambia .................. .. . 347,232 88,874 436.106 11,000 .83Zimbabwe ................... .. .. . - 92,000 92.000 - .17
Sub-totals members' ... . ............. . $25,281,983 $21,526,777 $46,808,760 $6,551,900International Finance Corporation .. ...... . . 474,207 54.000 528,207 - .98Taiwan, China 13 . .... .. . . 201,621 - 201,621 - .37
Totals-June 30, 1981 .... ........ ..... $25,957,811 $21,580,777 $47,538,588 $6,551,900 100.00
Totals-June 30. 1980 " . . ............ . $26,693,595 $18,110,545 $44,804,140 $6,742,600
'In some instances loans were wade, with the guarantee ot a Loans made to the International Finance Corporation are notmember in territories which at the time were included in that guaranteed by members.member's membership but which subsequently became indepen-dent. In order to avoid double counting, liabilities for these loans 'These amounts include $4,380,000 ($6,663,000-1980) otare shown under the name ot the original member (whose effective loans, which the Bank has agreed to sell and grantguarantee continues unaffected). These loans are shown below participations of $3,736,000 ($8,552.000-1980). The grant par-together with an indication of the member under whose name they ticipations represent participations on a grant basis taken in aare listed. Papua New Guinea, Kenya, Mauritius, Singapore, Zam- number of loans under the terms of an aid cooperation agreementbia, Zimbabwe, Swaziland, and Trinidad and Tobago have become between a member country and the Bank. Of the undisbursedmembers of the Bank and have assumed liability on these loans balance, the Bank has entered into irrevocable commitments toas borrower or guarantor disburse $60,373,000 ($62,066,000--1980).
3 Loan agreements totaling $4,224,600,000 ($4,960,632,000Amounts -1980) have been signed, but the loans do not become effective
GUARANTORS 1981 1980 and disbursements thereunder do not start until the borrowersBorrowers (in thousands) and guarantors, if any, take certain actions and furnish certain
AUSTRALIA documents to the Bank, and agreements providing for loans totai-Papua New Guinea ... . ..... ..... $44,325 $48,167 ing $2,327,300,000 ($1,778,500,000-19801 have been approved
UNITED KINGDOM ~~~~~~~~~by the Bank but bane not been signed. Those amounts includeKenya 149 438 $Nil ($3,468,000-1980) which the Bank has agreed to sellMalta . ............ .......... 1 5 One loan equivalent to $11,708,000 ($14,351,000-1980) isMauritius . .......... ........ 530 1,197 shown under Bolivia (Guarantor) but is also guaranteed by Argen-Singapore ... . ............. 3,897 6,309 tina.
*Zambia and Zimbabwe . . . ...... . . 5.008 12,209Swaziland .1,692 2,573 'Loans made to the Caribbean Development Bank for theTrinidad and Tobago ... . . . ..... 567 725 benefit of the territories of the members listed (in the case of the
'Loans rnade for joint benef t of territories listed. (continied)

158 Bank Appendices
Summary Statement of Loans coeclded Appendix Dy ~~~~~~~~~~~~~~~~~~~~~International Bank forJune 30, 1981 and June 30,1980 Reconstruction and DevelopmentExpressed in United States dollars (in thousands)-See Notes to Financial Statements, Appendix G
United Kingdom, the territories are those of its Associated I Represents portions of loans made to corporations of the EastStates and Dependencies in the Caribbean region). The members African Community.will be severally liable as guarantors, to the extent of sub-loansmade in theirterritories.
Mebers are jointly and severally liable. Represents loans made at a time when the authorities onTaiwan represented China in the Bank (prior to May 15, 1980).
One loan equivalent to $19,601,000 ($13,913,000-1980) isshown under Ivory Coast (Guarantor) but is also partially guaran-teed by Upper Volta. 11 Commencing on July 1, 1980, receivables on account of effec-
tive loans agreed to be sold have been included with effectiveIncludes portions of loans made tc corporations of the East loans held by the Bank, and totals at June 30, 1980 have been
African Community. reclassified accordingly for purposes of comparison.
Summary of Currencies Repayable on Effective Loans
Currencies 1981 1980 11 Currencies 1981 1980 11
Australian dollars .... . . $ 153,511 $ 143,812 Saudi Arabian riyals ....... . $ 157,726 $ 163,535Austrian schillings ... ..... . 126,427 155,317 Singapore dollars .... ..... . 7,524 7,172Belgian francs ... ........ . 164,071 208,217 South African rand ... ..... . 76,160 82,229Brazilian cruzeiros . . 2,417 4,353 Spanish pesetas ........ . 49,240 63,364Burmese kyats .... ....... . 1,120 1,192 Sri Lanka rupees ......... . 43 50
Canadian dollars ......... . 208,162 190,821 Sudanese pounds ......... . 2,170 2,370Danish kroner ........... . 26,241 34,677 Swedish kronor .......... . 75,362 57,765Deutsche mark ......... . 6,811,536 8,404,025 Swiss francs ............ . 5,254,996 5,687,127Finnish markkaa ....... . 31,896 26,375 New Taiwan dollars ...... . 3,912 25,216French francs ........... . 199,527 156,571 Tunisian dinars ......... . 2,600 3,366
Ghanaian cedis .......... . 1,289 1,406 United Arab Emirates dirhams . 70,936 68,141Greek drachmas ........ . 2,043 2,406 United States dollars ...... . 5 681,022 5,260,345Indian rupees ........... . 78,564 79,734 Venezuelan bolivares ...... . 96,516 112,151Iranian rials ............ . 32,435 33,635 Disbursed portion ofIraqi dinars ............. . 4,135 3,836 effective loans held
Irish pounds ............ . 15,316 20,407 by Bank .............. . $25,957811 $26,693,595Italian lire. .453,644 58,207 Add-Undisbursed portionJapanese yen. ............ 4,851,388 4,123,490 of effective loans heldKuwaiti dinars ........... 266,309 323,889 b ak.............. 2,8,77 1,1,4Lebanese pounds .. 3.407 4,589 by Bank.21,580,777 18,110,545
Libyan dinars .117,337 117,556 ~~~~Effective leans heldLibyan denar s 117,5300 1 9,3016 by Bank . ......... .... . $47,538,588 $44,804,140
Malaysian ringgit ......... . 43,692 44,061Mexican pesos ...... ..... 30,924 27,449Netherlands guilders ...... . 704,999 676.469
Nicaraguan cordobas ..... . 164 164Norwegian kroner ......... . 62.089 68,645Portuguese escudos ...... . . 10.284 8,793Pounds sterling .......... . 468,725 230,520Rials Omani ............ . 852 847
Maturity Structure of Effective Loans
Periods June 30, 1981 Periods June 30, 1980
July 1,1981 toJune 30, 1982 ........ . $1,750,008 July 1,1980 to June 30, 1981 ............ . . $ 1,283,672July 1, 1982 to June 30, 1983 ..... ......... 2,217,191 July 1, 1981 to June 30, 1982 ..... . ..... .. .. 1,734,038July 1, 1983 to June 30, 1984 ....... .... . . 2,703,094 July 1, 1982 to June 30, 1983 ....... . ..... 2,199,534July 1, 1984 to June 30, 1985 .. ...... .. .... 3,158,033 July 1, 1983 to June 30, 1984 .... .2... . . .. 2.524,860July 1, 1985 to June 30, 1986 ...... ......... 3,412,063 July 1, 1984 to June 30, 1985 ...... .. ...... 2,763,977
July 1, 1986 to June 30, 1991 .1..... ......... 17,292,899 July 1, 1985 to June 30, 1990 ........ .. .... 14,025,246July 1, 1991 to June 30, 1996 ...... ......... 12,593,518 July 1, 1990 to June 30, 1995 ...... .. .. ... 10,851,825July 1, 1996 to June 30, 2001 ........ ... . . 4,442,315 July 1, 1995 to June 30, 2000 ........ .. ..... 4,455,711July 1, 2001 to June 30, 2006 ........ .. . . 208,727 July 1, 2000 to June 30, 2005 ... .. .......... 411,782July 1, 2006 to June 30, 2007 ..... . . 1,760 July 1, 2005 to June 30, 2007 ... . . 4,929
Undetermined. (241,020) Undetermined* .4,548,566
Total .$47,538,588 Total .. ..... $44,804,140
*Representscancellatiors, prepaymertsandexchanegeadjustmentswh chhavenotbeenallocatedtospecificmaturities.

Financial Stctements 159
Summary Statement of Borrowings Appendix EJune 30, 1981 and June 30, 1980 International Bank forExpressed in United States dollars (in thousands)-See Notes to Financial Statements, Appendix G Reconstruction and Development
Operations during the fiscal year endedJune 30, 1981
Repayments Weighted averagePrincipal and sinking Principal effective
outstanding fund and pur- outstanding interest rates Due datesat June 30, chase fund Translation at June 30, at June 30,
Currencies payable 1980 Borrowings purchases adjustments 1981 1981 1980 1981
Austrian schillings ... . $ 80,032 $ - $ (2,663) $ (20,429) $ 56,940 7.94% 7.95% 1982-1990Belgian francs ...... 80,693 - (9,167) (21,143) 50,383 7.13 7.12 1982-1986Canadian dollars ..... 59,865 - (883) (2,525) 56,457 6.08 6.08 1982-1993Deutsche mark ...... 8,809,726 1,410,684 (690,390) (2,513,487) 7,016,533 7.37 7.20 1981-1999French francs ....... 29,354 - (3,845) (7,494) 18,015 7.15 7.15 1982-1987Italian lire ......... 47,369 - (4,447) (12,708) 30,214 7.22 7.22 1981-1988Japanese yen ....... 4,133,684 1,101,033 (286,600) (199,156) 4,748,9612 7.71 7.49 1981-2001Kuwaiti dinars ....... 278,937 - (41,210) (12,979) 224,748 7.04 7.06 1981-1992Libyan dinars ....... 101,334 - - - 101,334 7.62 7.62 1983Netherlands guilders . . 426,657 253,001 (19,507) (142,190) 517,961 9.29 7.60 1981-1991Pounds sterling ...... 9,898 201,265 (869) (8,652) 201,642 13.33 5.26 1982-1986Saudi Arabian riyals . 150,164 - - (3,321) 146,843 8.00 8.00 1984Swedish kronor . ..... 30,139 - (2,073) (5,450) 22,616 6.52 6.55 1982-1992Swiss francs ........ 5,489,652 895,981 (276,337) (1,167,494) 4,941,802 22 5.41 5.32 1981-1995United Arab Emiratesdirhams .......... 72,953 - (8,172) 596 65.377 8.00 8.00 1982-1989
United States dollars . 9,819,392 1,111,024 (1,366,128) - 9,564.288 8.70 8.18 1981-2002Venezuelan bolivares . 109,470 - (9,342) - 100,128 7.92 7.92 1981-1989Principal atface value ......... $29,729,319 $4,972,988 $(2,721,633) $(4,116,432) $27,864,242 7.61 7.23Less-Receivable undercontracts ........ 61,786 3,799 - 859 66,444 2
Principal outstandingat face value ...... $29,667,533 $4,969,189 $(2,721,633) $(4,117,291) $27,797,798Less-Net unamortizeddiscounts andpremiums ........ 32,216 8,885 _ _ 41,101
Totals ......... $29,635,317 $4,960,304 $(2,721,633) $(4,117,291) $27,756,697I In addition, the Bank has subsequertny borrowed or entered Into agreements to borrow DM 450 million (US equivalent $188.2 m lion) and SwF 250
million (Us equ valent $123.1 milion).2 Includes the following contracts to borrow for settlement on the dates Indicated:
AmountsIssues (in thousands) Settlement dates
Swiss francs:8% Notes of 1981, due 1986 (Second Issue) (SwF 35,000,000) .................... $17.234 July 15, 1981
Issued under delayed delivery contracts:Japanese yen:8.90% Loan of 1981, due 2001, Tranche A (Y 5,000,000,000) ....... ............ 22,143 July 31, 19818.70% Loan of 1981, due 1996, Tranche B (Y 5,000,000,000) 22,143 July 31, 1981
Swiss francs:8% Notes of 1981, due 1986 (SwF 10.000,000) 4,924 July 3, 1981
Total .. $66,444
3 Includes $211 m lion borrowed from the Interest Subsidy Fund which is administered by the Bank. This Fund, which obtained its resources fromvoluntary contributions from member governments, was established to subsid ze the irterest payments to the Bank on selected oans made to poorerdeveloping countries.
Maturity Structure of Borrowings OutstandingPeriods June 30, 1981 Periods June 30, 1980
July 1, 1981 to June 30, 1982 ............ $ 2733,918 July 1, 1980 to June 30, 1981 ... ........ $2,713,680July 1, 1982 to June 30, 1983 ............ 3,001,139 July 1, 1981 to June 30, 1982 ............ 3,134,285July 1, 1983 to June 30, 1984 ............ 2,068,983 July 1, 1982 to June 30, 1983 ....... .. .. 2,993,588July 1, 1984 to June 30, 1985 ............ 3,414,326 July 1. 1983 to June 30, 1984 ....... .... 2,502,768July 1, 1985 to June 30, 1986 ............ 3.525,454 July 1, 1984 to June 30, 1985 ............ 3,739,575
July 1, 1986 to June 30, 1991 ............ 7,527,752 July 1, 1985 to June 30, 1990 ............ 9,048,404July 1, 1991 to June 30, 1996 ............ 3,752,151 July 1, 1990 to June 30, 1995 ............ 3,502,065July 1, 1996 to June 30, 2001 ............ 1,622,765 July 1, 1995 to June 30, 2000 ............ 1,793,250July 1, 2001 to June 30, 2003 ............ 151,310 July 1, 2000 to June 30, 2003 ............ 239,918Total . . ............ $27,797,798 Total ..... ....... ....... ...... $29,667,533

160 Bank Appendices
Statement of Subscriptions toCapital Stock and Voting PowerJune 30, 1981 and June 30, 1980Expressed in thousands of units of currency-See Notes to Financial Statements, Appendix G
Amounts paid in Amounts subjectSubscriptions (Note 81 to call (Note B) Voting Power
Amounts Expressed Expressedexpressed Expressed in Expressed in
Per- in in current in current Num- Per-cent special special United special U nited ber cent
of drawing drawing States drawing States Of ofMembers Shares total rights rights dollars rights dollars votes total
Afgh ani sta n........ 300 .09 SIR 30,000 SDR 3,000 $ 3,452 SIR 27,000 $ 31,066 550 .10Algeria.......... 1,109 .35 110,900 11,090 12,760 99,810 114,841 1,359 .39Argentina......... 4,701 1l48 470,100 47.010 54,390 423,090 409,007 4,951 1.40Australia......... 6.450 2.03 645.000 64.500 74,214 500,500 90 7 923 6,700 1.90Austria..... .... 2,696 .85 269.600 26,960 31,020 242,940 273.182 2,946 .83Bahamas......... 171 .05 17,100 1,710 1,967 15,390 17,708 421 .12Bahrain ..... .... 163 .05 16,300 1,030 1,875 14,670 16.879 413 .12Bangladesh........ 1,242 .39 124,200 12,420 14,290 111,780 120,014 1 492 .42Barbados ........ 139 .04 13,900 1,390 1,509 12,5110 14,394 389 .11Belgium ..... .... 7,268 2.28 726,800 72,680 83,626 654,120 752,030 7.518 2.13Benin.......... 100 .03 10,000 1,000 1,151 9,000 I10.355 350 .10Bolivis.......... 264 .08 26,400 2,640 3,038 23.760 27.338 514 .15Botswana......... 43 .01 4,300 430 495 3,870 4,453 293 .08Brazil, ..... ... 5.401 1.70 540.100 54,010 62,144 486.090 559 295 5,651 1.60Burma.......... 591 .19 59.100 5.910 6,800 53,190 01.200 841 .24Baraundi ..... .... 150 .05 15,000 1,500 1.726 13,500 15 533 400 .11Cameroor .... .... 200 .06 20,000 2,000 2,301 10,000 20.201 450 .03Canadaa...... ... 11,122 3.50 1,112,200 111,220 127,970 1,000,980 1,1 51,7220 11.372 3.22Caps Verde ... ..... 16 .01 1,600 100 184 1,440 1157 266 .08Central African Republic . ... 100 .03 10,000 1,000 1,151 9,000 10.3 55 350 .10Chad ........ .. 100 .03 10,000 1,000 1,151 9,000 13,3 55 350 .10Chile ....... ... 1,240 .39 124,000 12,400 14,267 11I1,000 128,407 1.490 .42Curas.......... 12,000 3.77 1.200.000 020,000 138,072 1.080.000 1,242,040 12,250 3.47Colombia......... 1.175 .37 1 17,500 11.750 13.519 105,750 121.676 1,425 .40Comoros......... 16 .01 1,600 100 184 1,440 1,0 57 266 .06Congo. People's
Republic of the . .... 100 .03 10,000 1.000 1.151 9,000 10 355 350 .10Coata Rica ... ..... 107 .03 10,700 1 070 1,231 9.630 1 1000 357 .10Cyprus.......... 270 .09 27,800 2,70 3,199 25,020 20.790 528 .15Dermark......... 2,524 .79 252,400 25,240 29,041 227,160 251.370 2,774 .79Djibouti..... .... 31 .01 3,100 3 10 357 2,790 3,210 281 .08Dominica......... 16 .01 1,600 160 184 1,440 1.057 266 .08Dominican Republic . ... 175 .06 17,500 1,750 2,013 15.750 10. 122 425 .12Ecuador ...... ... 368 .12 36.800 3,680 4,234 33.120 30. 108 618 .18Egypt. Arab Republic of . .. 1.650 .52 165,OC0 16.500 18.985 148.500 17 3.004 1,900 .54El Salvador .. ...... 120 .04 12.000 1,200 1,381 10,800 12,A,27 370 .10Equatorial Guinea . .... 64 .02 6.400 640 236 5.760 6,62 7 314 .09Ethiopia ..... .... 114 .04 11,400 1.140 1 312 10,260 010105 364 .10Fiji........... 147 .05 14,700 1,470 1,691 13,230 15.222 397 .11Finland ..... .... 2,140 .67 214.000 21,400 24,623 192,600 221,606 2.390 .68France.......... 17.567 5.52 1,756,700 175,670 202,126 1,581,030 L1.019.33 17,817 5.05Gabon.......... 120 .04 12,000 1,200 1,381 10.800 12.427 370 .10Gambia, TIhe........ 53 .02 5,300 530 610 4,770 5.400 303 .09Germanly... ... 17,612 5.53 1,761.200 176, 120 202,644 1.585.080 1.823.793 17,862 5.06Ghana.......... 856 .27 85,600 8.560 9.849 77.040 00 642 1,106 .31Greece......... 945 .30 94,500 9,450 10.873 05.050 97959 8,19 .34Grenada ..... .... 17 .01 1.700 170 196 1.530 1 700 267 .00Guatemala ... ..... 167 .05 16,700 1.670 1,921 15,030 17 204 417 .12Guinea ........ 200 .06 20,000 2.000 2.301 18,000 20 713 0 50 .03Guinea-Bissau . ..... 27 .01 2,700 270 311 2.430 2 790 277 .08Guyana. ...... 171 .05 17,100 1,710 1,967 15,390 J7.708 421 .12Haiti.... ... 190 .05 15,000 1,500 1,726 13.500 15.533, 400 .11Honduras......... 84 .03 8,400 840 966 7,560 0,699 334 .09Iceland ......... 222 .07 22,200 2,220 2,554 19,980 22.909 472 .13Inia ........ .. 11,333 3.50 1.133.300 113.330 130.397 11,019.970 18173,578 11,583 3.20Indonesia ........ 3.888 1.22 388.800 38.880 44 735 349.920 402,618 4,138 1.17Iran ........... 1,580 .50 150 000 15,800 10.179 142 200 103 915 1,830 .52Iraq ........... 698 .22 69,800 6.980 8.031 62.820 72 201 948 .27Ireland ...... ... 1,269 .40 126,600 12,660 14,507 113,940 131 099 1.516 .43Israel ........... 1.108 .35 110,800 11,080 12,749 99,720 114 730 1.358 .38Italy ...... ... 10 120 3.00 1,012.000 131,200 116,441 910,800 I.C47,996 10 370 2.94

Financia Statements 161
Appendix FInternational Bank for
Reconstruction and Development
Amounts paid in Amounts subjectSubscriptions (Note B) to call (Note B) Voting Power
Amounts Expressed Expressedexpressed Expressed in Expressed in
Per- in in current in current Num- Per-cent special special United special United ber cent
of drawing drawing States drawing States of ofMembers Shares total rights rights dollars rights dollars votes total
Ivory Coast ... ........ 365 .11 SDR 36,500 SDR 3,650 $ 4,200 SDR 32850 $ 37,797 615 .16Jamaica ..... .. 446 .14 44,600 4,460 5,132 40140 46,185 696 .20Japan. .. .... 17,539 5.51 1,753,900 175,390 201,804 1,578,510 1,816,234 17,789 5 04Jordan .. (............ 187 .06 18,700 1,870 2,152 56,830 19,365 437 12Kampuchea, Democratic ... . 214 .07 21,400 2,140 2,462 19,260 22,161 464 .13Kenya' . . ............ 400 .13 40,000 4,000 4,602 36,000 41,422 650 18Korea, Republic of ......... 1,393 .44 139,300 13,930 16,028 125,370 144,251 1,643 .47Kuwait ................ 3,203 1.01 320,300 32,030 36,854 288,270 331,683 3 453 .98Lao People's Democratic
Republic .... ....... 100 03 10,000 1.000 1,151 9 000 10,355 350 .10Lebanon ......... ..... 90 .03 9,000 900 1.035 8100 9,320 340 .10Lesotho ....... ..... 43 0) 4,300 430 495 3.870 4,453 293 .00Liberia ......... 213 .07 21,300 2,130 2 451 19170 22,057 463 .13Libya ................ 200 .06 20,000 2,000 2,301 18.000 20 711 450 .13Luxembourg ............. 297 .09 29,700 2,970 3,417 26 730 30,756 547 .16Madagascar ... ........ 219 .07 21,900 2,190 2,520 19 710 22,678 469 13Malawi ................ 150 .05 15,000 1,500 1,726 13,500 15,533 400 11Malaysia ........... ... 2,066 .65 206,600 20,660 23,771 185,940 213,943 2.316 .66Maldives ............ . 6 (2) 600 60 69 540 621 256 .07Mali ................ 173 .05 17,300 1,730 1,990 15,570 17,915 423 .12Mauritania ............ 100 .03 10,000 1,000 1,151 9,000 10,355 350 10Maurtius ............ 221 .07 22,100 2,210 2,503 19,890 22,885 471 .13Mexico .............. . 2,280 .72 2280000 22,800 26,234 205,200 236 103 2,530 .72Morocco . ............... 1.220 .38 122.000 12,200 14,037 109,800 126.336 1,470 .42Nepal .............. . 146 05 14.600 1,460 1,680 13,140 15.119 396 .11Netherlands .......... . 7,679 2.41 767,900 76.790 88.355 691,110 795 191 7,929 2.25New Zealand .. . .. ..... 1,887 59 188,700 18.870 21,712 169.830 195,406 2,137 61Nicaragua ............. 91 .03 9,100 910 1,047 8,190 9,423 341 .10Niger ................ 100 .03 10,000 1,000 1,151 3,000 10,355 350 .10Nigeria .. ... 1,152 .36 115,200 11,520 13,255 103,680 119,294 1,402 .40Norway . ...... ... 2,410 .76 241,000 24,100 27,729 216,900 249,565 2.660 .75Oman' ...... ........ 60 .02 6,000 600 690 5,400 6,213 310 .09Pakistan ......... .... 2,519 .79 251,900 25,190 28.984 226,710 260,853 2,769 .78Panama ................ 216 .07 21,600 2,160 2,485 19,440 22,368 466 .13Papua New Guinea .... .. 171 .05 17,100 1,710 1967 15,390 17,708 421 .12Paraguay ........... . 70 02 7.000 700 805 6,300 7,249 320 .09Peru ............ . 938 .29 93 800 9,380 10.793 84,420 97134 1,188 .34Philippmnes ............. 1.715 .54 171.500 17150 19 733 154 350 177 595 1,965 .56Portugal .. ..... 1,324 42 132,400 13.24C 15 234 119,160 137,106 1,574 45Qatar .. ........ .... 327 10 32 700 3,270 3,762 29.430 33 862 577 16Romania .... . . 1,621 .51 162,100 16 210 18 651 145,890 167.861 1,871 53Rwanda' .............. 150 .05 15,000 1,500 1,726 13,500 15,533 400 11St. Lucia .......... .... 29 .01 2,900 290 334 2,610 3,003 279 08Sao Tome and Principe ...... 14 (2) 1,400 140 161 1,260 1.450 264 07Saudi Arabia .... ....... 4,899 1.54 489.900 48,990 56,368 440,910 507,311 5,149 1.46Senegal ....... ....... 362 .11 36,200 3,620 4,165 32,580 37,487 612 .17Seychelles . .. .. 11 (2) 1,100 110 126 990 1139 261 07Sierra Leone ............. 150 .05 15,000 1500 1726 13,500 15,533 400 .11Singapore ........... . 320 .10 32,000 3.200 3 682 28,800 33,137 570 .16Solomon Islands ........ . 17 01 1700 170 196 1.530 1760 267 .08Sonmalia ..... ......... 189 06 18.900 1,890 2,175 17 010 19.572 439 12South Africa .. ......... 3,463 1.09 346,300 34.630 39.845 311.670 358,608 3,713 1.05Spain . .. ..... 4,551 1.43 455,100 45,510 52,364 409 590 471,274 4,801 1.36So Lanka ... ... 961 30 96,100 9,610 11,057 86,490 99,515 1,211 .34Sudan ... .... 600 .19 60,000 6,000 6,904 54 000 62.132 850 24Suriname . . ... 162 .05 16,200 1,620 1,864 14,580 16,776 412 .12Swaziland . . 68 .02 6,800 680 782 6,120 7,042 318 .09Sweden ............ .. 3,676 1.16 367,600 36,760 42,296 330,840 380,665 3 926 1.11Syrian Arab Republic ... ... 508 16 50,800 5,080 5,845 45,720 52,605 758 .21Tanzania ...... 350 11 35,000 3 500 4 027 31,500 36,204 600 .17Thaland . . ..... 1.478 .46 147 800 14,780 17,006 133,020 153.053 1,728 .49
(continued)

162 Bank Appendices
Statement of Subscriptions to Appendix FInternational Bank forCapital Stock and Voting Power (concluded) Reconstruction and Development
June 30, 1981 and June 30, 1980Expressed in thousands of units of currency-See Notes to Financial Statements, Appendix G
Amounts paid in Amounts subjectSubscriptions (Note B) to call (Note B) Voting Power
Amounts Expressed Expressedexpressed Expressed in Expressed in
Per- in in current in current Num- Per-cent special special United special United ber cent
of drawing drawing States drawing States of ofMembers Shares total rights rights dollars rights dollars votes total
Togo ................. 150 .05 SDR 15,000 SDR 1,500 $ 1,726 SDR 13,500 $ 15,533 400 .11Trinidad and TobagG ....... 535 .17 53,500 5,350 6,156 48,150 55,401 785 .22Tunisia ................ 373 .12 37,300 3,730 4,292 33,570 38,626 623 .18Turkey ................. 1,286 .40 128,600 12,860 14,797 115,740 133,170 1,536 .44Uganda ................ 333 .10 33,300 3,330 3,831 29,970 34,484 583 .17United Arab Emirates ....... 980 .31 98,000 9,800 11,276 88,200 101,483 1,230 .35United Kingdom .......... 26,000 8.17 2,600,000 260,000 299,156 2,340,000 2,692,404 26,250 7.44United States ............ 73,301 23.03 7,330,100 733,010 843,401 6,597,090 7,590,612 73,551 20.84UpperVolta .... ........ 100 .03 10,000 1,000 1,151 9,000 10,355 350 .10Uruguay ................ 411 .13 41,100 4,110 4,729 36,990 42,561 661 .19Venezuela ... 1,972 .62 197,200 19,720 22,690 177,480 204,209 2,222 .63Viet Nam ............... 543 .17 54,300 5,430 6,248 48,870 56,230 793 .22Western Samoa ........... 17 .01 1,700 170 196 1,530 1,760 267 .08Yemen Arab Republic ....... 85 .03 8,500 850 978 7,650 8,802 335 .09Yemen, People's Democratic
Republic of ............ 248 .08 24,800 2,480 2,853 22,320 25,681 498 .14Yugoslavia' ............. 1,170 .37 117,800 11,780 13,554 106,020 121.987 1,428 .40Zaire ................. 960 .30 96,000 9,600 11,046 86,400 99,412 1,210 .34Zambia ' .............. 648 .20 64,800 6,480 7,456 58,320 67,103 898 .25Zimbabwe .............. 817 .26 81,700 8,170 9,400 73,530 84,604 1,067 .30Totals-June 30, 1981 . 318,220 100.005DR31,822,100 SDR3,182,210 $3,661,451 SDR28,639,890 $32,953,057 352,971 100.00Totals-June 30, 1980 ... I. 301,718 SDR30,171,800 SDR3,017,180 $3,995,893SDR27,154,620 $35,963,036 335,468
I Amounts aggregating the equivalent of $6,971,000 have been received from members on account of increases in subscript crs, which are in processof completion Kenya $1,479,000, Malawi $275,000, Nigeria $2,158,000, Oman $125,000, Rwanda $29,000, Yugoslavia $2,298,000 andZambia $607,000.
2 Less than .005 percent.
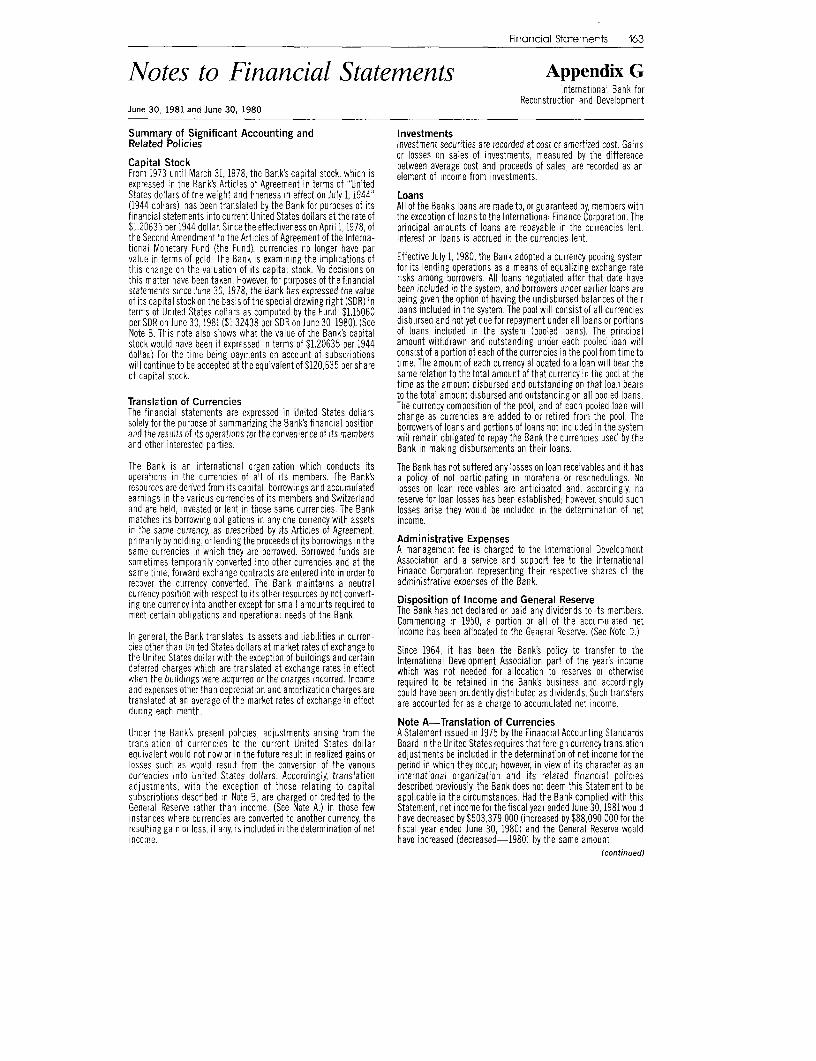
Financial Statements 163
Notes to Financial Statements Appendix GInternational Bank for
Reconstruction and DevelopmentJune 30, 1981 and June 30, 1980
Summary of Significant Accounting and InvestmentsRelated Policies Investment securities are recorded at cost or amortized cost. Gains
or losses on sales of investments, measured by the differenceCapital Stock between average cost and proceeds of sales, are recorded as anFrom 1973 until March 31,1978, the Bank's capital stock, which is element of income from investments.expressed in the Bank's Articles of Agreement in terms of "UnitedStates dollars of the weight and fineness in effect on July 1,1944" Loans(1944 dollars), has been translated by the Bank for purposes of its All of the Bank's loans are made to, or guaranteed by, members withfinancial statements into current United States dollars at the rate of the exception of loans to the International Finance Corporation. The$1.20635 per 1944 dollar. Since the effectiveness on April 1, 1978, of principal amounts of loans are repayable in the currencies lent.the Second Amendment to the Articles of Agreement of the Interna- Interest on loans is accrued in the currencies lent.tioral Monetary Fund (the Fund), currencies no longer have parvalue in terms of gold. The Bank is examining the implications of Effective July 1, 1980, the Bank adopted a currency pooling systemthis change on the valuation of its capital stock. No decisions on for its lending operations as a means of equalizing exchange ratethis matter have been taken. However, for purposes of the financial risks among borrowers. All loans negotiated after that date havestatements since June 30, 1978. the Bank has expressed the value been included in the system, and borrowers under earlier loans areof its capital stock on the basis of the special drawing right (SDR) in being given the option of having the undisbursed balances of theirterms of United States dollars as computed by the Fund, $1.15060 loans included in the system. The pool will consist of all currenciesper SDR on June 30, 1981 ($1 32438 per SDR on June 30, 1980). (See disbursed and not yet due for repayment under all loans or portionsNote B. This note also shows what the value of the Bank's capital of loans included in the system (pooled loans). The principalstock would have been if expressed in terms of $1.20635 per 1944 amount withdrawn and outstanding under each pooled loan willdollar.) I-or the time being payments on account of subscriptions consist of a portion of each of the currencies in the pool from time towill continue to be accepted at the equivalent of $120,635 per share time. The amount of each currency allocated to a loan will bear theof capital stock. same relation to the total amount of that currency in the pool at the
time as the amount disbursed and outstanding on that loan bearsto the total amount disbursed and outstanding on all pooled loans.
Translaton of Currenct es The currency composition of the pool, and of each pooled loan willThe financial statements are expressed in United States dollars change as currencies are added to or retired from the pool. Thesolely for the purpose of summarizing the Bank's financial position borrowers of loans and portions of loans not included in the systemand the results of its operations for the convenience of its members will rermain obligated to repay the Bank the currencies used by theand other interested parties. Bank in making disbursements on their loans.
The Bank is an international organization which conducts its The Bank has not suffered anylosses on loan receivables and it hasoperations in the currencies of all of its members. The Bank's a policy of not participating in moratoria or reschedulings. Noresources are derived from its capital, borrowings and accumulated losses on loan receivables are anticipated and, accordingly noearnings in the various currencies of its members and Switzerland reserve for loan losses has been established; however, should suchand are held, invested or lent in those same currencies. The Bank losses arise they would be included in the determination of netmatches its borrowing obligations in any one currency with assets income.in the same currency as prescribed by its Articles of Agreement,primarily by holding, or lending the proceeds of its borrowings in the Administrative Expensessame currencies in which they are borrowed. Borrowed funds are A management fee is charged to the International Developmentsometimes temporarily converted into other currencies and at the Association and a service and support fee to the Internationalsame time, forward exchange contracts are entered into in order to Finance Corporation representing their respective shares of therecover the currency converted. The Bank maintains a neutral administrative expenses of the Bank.currency position with respect to its other resources by not convert-ing one currency into another except for small amounts required to Disposition of Income and General Reservemeet certain obligations and operational needs of the Bank. The Bank has not declared or paid any dividends to its members.
Commencing in 1950, a portion or all of the accumulated netIn general, the Bank translates its assets and liabilities in curren- income has been allocated to the General Reserve. (See Note D.)cies otherthan United States dollars at market rates of exchange to Since 1964, it has been the Bank's policy to transfer to thethe United States dollar with the exception of buildings and certain International Development Association part of the year's incomedeferred charges which are translated at exchange rates in effect which was not needed for allocation to reserves or otherwisewhen the buildings were acquired or the charges incurred. Income required to be retained in the Bank's business and accordinglyand expenses otherthan depreciation and amortization charges are could have been prudently distributed as dividends. Such transferstranslated at an average of the market rates of exchange in effect are accounted for as a charge to accumulated net incomeduring each month.
Note A-Translation of CurrenciesUnder the Bank's present policies, adjustments arising from the A Statement issued in 1975 by the Financial Accounting Standardstranslation of currencies to the current United States dollar Board inthe United States requiresthatforeign currencytranslationequivalent would not now or in the future result in realized gains or adjustments be included in the determination of net income for thelosses such as would result from the conversion of the various period in which they occur; however, in view of its character as ancurrencies into United States dollars. Accordingly translation international organization and its related financial policiesadjustments, with the exception of those relating to capital described previously, the Bank does not deem this Statement to besubscriptions described in Note B, are charged or credited to the applicable in the circumstances. Had the Bank complied with thisGeneral Reserve rather than income. (See Note A.) In those few Statement, net incomeforthefiscal yearended June 30, 1981 wouldinstances where currencies are converted to another currency, the have decreased by $503,379,000 (increased by $88,090,000 fortheresulting gain or loss, if any, is included in the determination of net fiscal year ended June 30, 1980) and the General Reserve wouldincome. have increased (decreased-1980) by the same amount.
(continued)

164 Bank Appendices
Notes to Financial Statements (continued)
June 30, 1981 and June 30, 1980
Note B-Capital Stock, Restricted required to meet the obligations of the Bank created by borrowing orCurrencies and Maintenance of Value guaranteeing loans. As to $29,291,606,000 ($31,967,143,000-Capital Stock: In the Articles of Agreement, the capital stock of the 1980), the restriction on calls is imposed by the Articles of Agree-Bank is expressed in terms of "United States dollars of the weight ment and asto $3,661,451,000 ($3,995,893,000-1980) by resolu-and fineness in effect on July 1,1944" (1944 dollars). tions of the Board of Governors.
On April 30, 1976, the Board of Governors of the Fund approved Restricted Currencies: The portion of capital subscriptions paid inproposed amendments to the Fund's Articles of Agreement (the to the Bank is divided into two parts: (1) $366,145,000Second Amendment) which entered into force on April 1, 1978. ($399,589,000-1980) initially paid in gold or United States dol-Under the Second Amendment, currencies no longer have par lars, and (2) $3,295,306,000 ($3,596,304,000-1980) paid in thevalues, gold is abolished as a common denominator of the mone- currencies of the respective members. Of this latter portion antary system and all calculations for the purposes of the Fund's amount of $128,015,000 ($147,349,000-1980) was subsequentlyArticles are made on the basis of the special drawing right (SDR). converted by members into United States dollars, subject to theWhen the SDR was introduced intothe Fund's Articles in 1969, it was right of the Bank or the members to reverse the transactions. Theexpressed in terms of a specified weight of gold equal to the gold amounts paid in gold or United States dollars or subsequentlycontent of the 1944 dollar SinceJuly 1, 1974, the value of the SDR in converted by members into United States dollars are freely usableterms of United States dollars has been based on the weighted by the Bank in any of its operations; however, the remainingrelative values of a number of major currencies (the basket), amounts paid in the currencies of the members, hereinafter calledincluding the United States dollar The value of the SDR on July 1, restricted currencies, are usable by the Bank in its lending opera-1974, expressed in terms of United States dollars, was $1.20635, tions only with the consent of the respective members. Thewhich was the equivalent of one 1944 dollar On March 31, 1978, the equivalent of $2,042,101,000 t$2,289.419,000-1980) has beenFund made certain changes in the basket of currencies effective used with such consent.July 1,1978. On September 18, 1980, the Fund further revised thebasket, effective January 1, 1981, by reducing the number of Maintenance of Value: Article 11, Section 9 of the Articles of Agree-currencies from 16 to five, and a method of further adjustment at ment provides for maintenance of value, as of the time of subscrip-five-yearly intervals was established. These revisions have been, tion, of such restricted currencies, requiring (1) the member toand are to be, done in a manner that ensures that the value of the make additional payments to the Bank in the event that the parSDR in terms of any currency is the same immediately before and value of its currency is reduced or the foreign exchange value of itsafter the revision. currency has, in the opinion of the Bank, depreciated to a signifi-
cant extent in its territories, and (2) the Bank to reimburse theAs a result of the Second Amendment andthe simultaneous repeal memberin the eventthatthe parvalueof its currencyis increased.of Section 2 of the Par Value Modification Act (31 U.S.C. 449), the Following the establishment of central rates by several members inprovision of United States law defining the par value of the United lieu of existing par values in March 1973, the Executive DirectorsStates dollarin terms ofthe SDR and gold, the pre-existing basis for decided that, for all members that established central rates fortranslating the term "United States dollar of the weight and their respective currencies, pending the establishment of new parfineness in effect or July 1,1944" into current United States dollars values, maintenance of value obligations be settled on the basis ofor into any other currency no longer exists. those central rates. These obligations of the members and of the
Bank become effective immediately upon the happening of thoseThe General Counsel of the Bank has rendered a legal opinion events with respect to holdings of restricted currencies representedconcluding in substance that upon the entry into force of the by currency balances and demand obligations. With respect toSecond Amendment references in the Bank's Articles of Agreement restricted currencies out on loan, these obligations become effec-to the 1944 dollar should be read as referring to the SDR, as tive only as and when such currencies are recovered by the Bank,determined from time to time by the Fund, and the mutual obliga- except that in several cases the Bank and the members concernedtions of each member and the Bank, with respect to maintenanceof have agreed to make provisional settlements of such obligations, byvalue of certain currency holdings,will be measured by the value of means of one or more payments over periods not exceeding fivethe currency in question in terms of the SDR at any given time. years. At June 30, 1981, $696,000 ($1,280,000-1980) was
The General Counsel has however also stated that in the exercise of receivable and $1,621,000 ($2,517,000-1980) was payable by thetheir statutory power under Article IX of the Bank's Articles, the Bank on such provisional settlements. These amounts are includedExecutive Directors could conclude that the 1944 dollar would be in Amounts Required to Maintain Value of Currency Holdings undertaken to mean 1.20635 current dollars, with the consequence that the headings Receivable on Account of Subscribed Capital, andmaintenance of value would be measured by that standard. Liabilities, respectively.
A member government has raised the question whether the Prior to April 1, 1978, where market rates of exchange were notsubstitution of a new unit of value, insofar as it would give rise to related to par values or central rates, as in the cases of a majority ofany new obligations with respect to maintenance of value and members, and where there were differences between market ratescapital stock subscription payments, should be made only by of exchange and the rates at which capital subscriptions of mem-amendment of the Articles. It also raised questions as to the bers had been paid orwere payable such differences were shown asdesirability of retaining the principle of mairtenance of value, the Translation Adjustments on Capital Subscriptions under the head-form in which it is applied and the appropriateness of substituting ing Other Assets. These amounts represented notional receivablesa unit of value other than the SDR. Pending action on these and payables which would become maintenance of value obliga-questions, the financial statements have been drawn up in accor- tions if and whenthe provisionsof Article lI,Section 9of theArticlesdance with, the General Counsel's opinion, that is, the value of the of Agreement or the decision of the Executive Directors describedcapital stock is expressed in terms of the SDR. above could be applied. According to the legal opinion of the Bank's
General Counsel referred to in this Note B under Capital Stock,The Bank's capital comprised 705,000 (705,000-1980) maintenanceofvaluepursuanttoArticlell,Section9oftheArticlesauthorized shares of the par value of SDR 100,000 each, of which of Agreement would be determined on the basis of the SDR, and is318,221 shares had been subscribed (301,718-1980). Ten percent treated in the financial statements on this basis. Since the Bank isof the capital subscriptions has been called and paid in: the still considering the implications of the Second Amendment and inremaining ninety percent is subject to call by the Bank only when view of the questions referred to above, the timing of any establish-

Financial Statements 165
Appendix GInternational Bank for
Reconstruction and Development
ment and settlement of these notional maintenance of value items not traded in the market which were valued at their cost of$432,125,000 ($513,417,000-1980) receivable and $117,957,000 $982,178,000 ($1,225,588,000-1980). At June 30, 1980, the item($150,998,000-1980) payable are uncertain. Accordingly, they are Investments included securities purchased under agreements toincluded in OtherAssets, and Liabilities as notional maintenance of resell amounting to $1,715,000. Obligations of the United Statesvalue obligations. Government and its instrumentalities having a cost or amortized
cost of $292,537,000 ($292,538,000-1980) and a market valueEffect of Valuation in Terms of the SDR: Expressing the value of the of $276,199,000 ($290,329,000-1980), set aside in respect of theBank's capital stock in terms of the SDR rather than in terms of Special Reserve, as described in Note D, are included under this$1.20635 does not have a material effect on the fiancial position or heading.results of the operations of the Bank. If the value of the capitalstock were expressed in terms of $1.20635, the subscribed capital The annualized rate of return on the average investments heldwould have been $38,388,590,000 ($36,397,751,000-1980) during the period, based on the portfolio held at the end of eachinstead of $36,614,508,000 ($39,958,929,000-1980), the month and including realized gains and losses, was 9.30%uncalled portion of subscriptions $34,549,731,000 (8.76%-1980).($32,757,976,000-1980) instead of $32,953,057,000($35,963,036,000-1980), the paid-in capital $3,838,859,000 Note D-Reserves and Net Income($3,639,775,000-1980) instead of $3,661,451,000 In July 1981, the Executive Directors allocated $509,103,000 to the($3,995,893,000-1980) and the net maintenance of value obliga- General Reserve out of the $610,103,000 net income earned in thetions to the Bank would have been $466,650,000 ($59,484,000- fiscal year ended June 30, 1981 and have recommended to the Board1980) instead of $315,133,000 ($363,236,000-1980). Should the of Governors that the balance of $101,000.000 betransferned bywayExecutive Directors concludethatthe capital would be measured by of grant to the International Development Association.some standard other than tle SDR, any adjustment of the amounts In July 1980, the Bank allocated $469,901,000 to the Generalshown in the Balance Sheet as Notional Amounts Required to Reserve out of the $587,901,000 net income earned in the fiscalMaintain Value of Currency Holdings would require a corresponding year ended June 30, 1980 and in October 1980, authorized theadjustment of the capital. transfer of the balance of $118,000,000 by way of grant to the
General Capital Increase: On January 4,1980, the Bank's Board of International Development Association.Governors adopted a resolution (the General Capital Increase In accordance with the policies discussed in the Summary ofResolution) which increases the authorized capital stock of the n cco unt th Rte Pliciese A h
thi y33,50shre resentsuban t increstenof app esroimaely Reserve has decreased by $503,379,000 during the fiscal yearbelow); thsrpeet nices fapoiaey (increased by $88,090,000-1980); it has been charged with$40,000,000,000. The General Capital Increase Resolution author- $581,931,000 (credited with $103,857,000-1980) representingizes subscriptions by members to about 93% of these shares. The net translation adjustments as a result of currency depreciationspaid-in portion of the shares authorized to be subscribed will be and appreciations anld credited with $78,552,000 (charged with7.5% (in contrast to the 10% paid-in portion of existing capital 3nd 767,000-1980anderediting a (charged withstock); subscribing members will be required to pay 3¾% of the $15,767,000-1980) representing a compensating effect of thesubscription price in gold or United States dollars and 63/4% in their ppreciations and depreciaRt ons of the Unted States dollar, inrespective currencies. Under the Articles, each member is entitled terms of the SDR, on the one percent portion of the Bank's paid-nmto 250 mnembership votes plus one vote for each share subscribed, capntital and thendine pecni prin rntdSaesolears.(ed bycetaintembertoTo avoid dilution of the voting power of certain members which Coutres fno lendnl isn Uiee-Apd Stae d olars.e the Satem ofthwould otherwise occur as this increase in capital is subscribed, the Chage in Genral o crrese dllrseApn Bay Sineomda the valuyo thetBoard of Governors adopted another resolution on January 4, 1980 SoR in terms of current dollars may vary from day to day thatwhich increases the authorized capital stock by an additional portion of the Banks capital paid i or released In dollars will be33,500 shares (representing a further increase of approximately subject to further adjustment at the end of each month.$4.000,000,000) and authorizes each member to subscribe 250 The Special Reserve consists of loan commissions set aside pur-shares of this additional capital, none of which would be paid in. No suant to Article IV, Section 6, of the Articles of Agreement which aresubscriptions authorized bythese resolutions may be accepted prior to be held in liquid assets and to be used only for the purpose ofto September 30, 1981. meeting liabilities of the Bank on its borrowings and guarantees.
The General Capital Increase Resolution provides for a reduction The Special Reserve assets comprise obligations of the Unitedof the number of shares authorized by it If, as a result of deter- States Government and its instrumentalities and are includedminations on the valuation of the Bank's capital stock, the under the headl g Investments. As a result of a decision made in331,500 shares authorized represent an increase in authorized 1964, the allocaton of such commissions to the Special Reservecapital in excess of $40,000,000,000. calculated as of the time was discontinued in respect of subsequent loans and no furtherof such determinations on the basis of the standard of value deter- additions are being made to it.mined. In this casethe numberof sharesauthorized bytheGeneral Note E-Contributions to the InternationalCapital Increase Resolution will be reduced so that their aggregate Development Associationpar value at that time will be equivalent (to the nearest num- The Bank has authorized transfers by way of grants to the Interna-berof shares) te $40,000,000,000, the number of shares authorized tional Development Association totaling $1,543,000,000 from netto be subscribed by each member will be correspondingly reduced, income for the fiscal years ended June 30, 1964 through June 30,and adjustments will be made on account of any shares 1980. Of this amount $820,668,000 was payable at June 30, 1981.already subscribed by members in excess of their reduced ($1.425,000,000 had been authorized from net income through theauthorization. fiscal year ended June 30. 1979 and $789,048,000 was payable at
June 30, 1980.)Note C-InvestmentsThe market value of investment securities was $7,677,461,000 Note F-Staff Retirement Plan($9,628,803,000-1980) compared with a cost or amortized cost The Bank has a contributory retirement Plan for its staff, which alsoof $8,107,771,000 ($9,676,840,000-1980), and a face value of covers the staff of the International Finance Corporation. The staff$8,168,282,000 ($9,741,989,000-1980) including investments (continued)

166 Bank Appendices
Notes to Financial Statements (concluded) Appendix GInternational Bank for
Recorstruction and DevelopmentJune 30, 1981 and June 30, 1980
Note F (continued)contribute a fixed percentage of pensionable remuneration and the The assumed rate of return used in determining the actuarialBank contributes the remainder of the cost of funding the Plan. present value of the accumulated Plan benefits was 10 percent forEffective July 1, 1980, the Bank changed to an aggregate funding 1980 (10 percent for 1979).method for determining its contribution. This change will not have asignificant effect on the cost of the Plan to the Bank. Such cost isfunded as accrued. The cost of the Plan to the Bank for the fiscalyear ended June 30, 1981 was $51,043,000 ($38,065,000 for thefiscal year ended June 30, 1980). All contributions to the Plan andall other assets and income held for the purposes of the Plan are Note G-Income and Expensesheld bythe Bank separatelyfrom theotherassets and incomeofthe Income from investments includes net losses of $110,649,000Bank and Corporation and can be used only for the benefit of the ($103,415,000-1980) resulting from sales of investments. Otherparticipants in the Plan and theirbeneficiaries until all liabilitiesto income includes net gains of $20,427,000 ($11,903,000-1980)them have been discharged. The comparison of accumulated resulting from repurchases of obligations of the Bank prior tobenefits and net assets of the Plan is presented below: maturity pursuant to the terms of the respective borrowing agree-
ments. Administrative expenses are net of the management fee ofActuarial Present Value of $180,000,000 ($140,300,000-1980) charged to the InternationalAccumulated Plan Benefits Development Association and of the service and support fee of
December 31 $2,874,000 ($2,447,000-1980) charged to the International1980 1979 Finance Corporation.
(in thousands)
Vested ................... $331,176 $263,357 At June 30, 1981, principal instalments of $160,000 and, interestNonvested .22,538 18,933 and other charges of $1,642,000 payable to the Bank on loans were
overdue by more than 60 days. The principal disbursed and out-$353,714 $282,290 standing on these loans amounted to $187. 109,000. Of the princi-
Net assets available - pal, interest and other charges overdue by more than 60 days atfor benefits ............ . $481,330 $348,014 June 30, 1981, $22,835 remained urpaid at July 28, 1981. It is not
-__ __ _ __ _ __ _ __ _ anticipated that these delays will result in any loss to the Bank.

Financial Statements 167
Report of Independent Financial StatementsAccountants Covered by the
Foregoing Report1801 K Street, N.W.
WASHINGTON, D.C. 20006JULY 29, 1981
ToINTERNATIONAL BANK FORRECONSTRUCTION AND DEVELOPMENTWASHINGTON, D.C.
We have examined the financial statements (Appendices A Balance Sheet .......... Appendix Athrough G) of International Bank for Reconstruction and Develop-ment as of June 30, 1981 and 1980, and for the years then ended. Statement of Income.Appendix BOur examinations of these statements were made in accordance Statement of Accumulated Net Income . . ........ Appendix Bwith generally accepted auditing standards and accordingly in-cluded such tests of the accounting records and such other audit- Statement of Changes in General Reserve ...... .. Appendix Bing procedures as we considered necessary in the circumstances. Statement of Changes in Financial Position ....... Appendix C
Consistent with past practice, the Bank records currency transla- Summary Statement of Loans ............... . Appendix Dtion adjustments, except those pertaining to the nine percentportion of its capital stock, as charges against or credits to the Summary Statement of Borrowings ........... . Appendix EGeneral Reserve. Statement 8 of the Financial Accounting Stan- Statement of Subscriptions to Capital Stockdards Board requires that these adjustments, which are set forth and Voting Power ................ Appendix Fin the Statement of Changes in General Reserve, be included inthe determination of net income; however, in view of the Banks Notes to Financial Statements ................ Appendix Gcharacter as an international organization and its related financialpolicies, which are described in the Summary of SignificantAccounting and Related Policies (Translation of Currencies) and inNote A, the Bank does not deem the application of this accountingprinciple to be appropriate in the circumstances, and we concurwith this conclusion.
In our opinion, the financial statements examined by us presentfairly, in terms of United States currency, the financial position ofInternational Bank for Reconstruction and Development at June30, 1981 and 1980, and the results of its operations and thechanges in its financial position for the years then ended, inconformity with generally accepted accounting principles consis-tently applied.
PRICE WATERHOUSE & CO.


169
IDAAppendices
Financial StatementsPage
Appendix A Statement of Condition ................ .......... 170
Appendix B Statement of Income .................. ......... 172Statement of Transfers from International
Bank for Reconstruction and Development ........ . 172Appendix C Statement of Changes in Resources Available
for Commitment ............................ . 173Appendix 0 Summary Statement of Development Credits ......... . 174Appendix E Statement of Voting Power, and Subscriptions
and Supplementary Resources ............... . .. . . 176Appendix F Notes to Financial Statements ............... . .. . . 179Report of Independent Accountants ..... . .................... 183
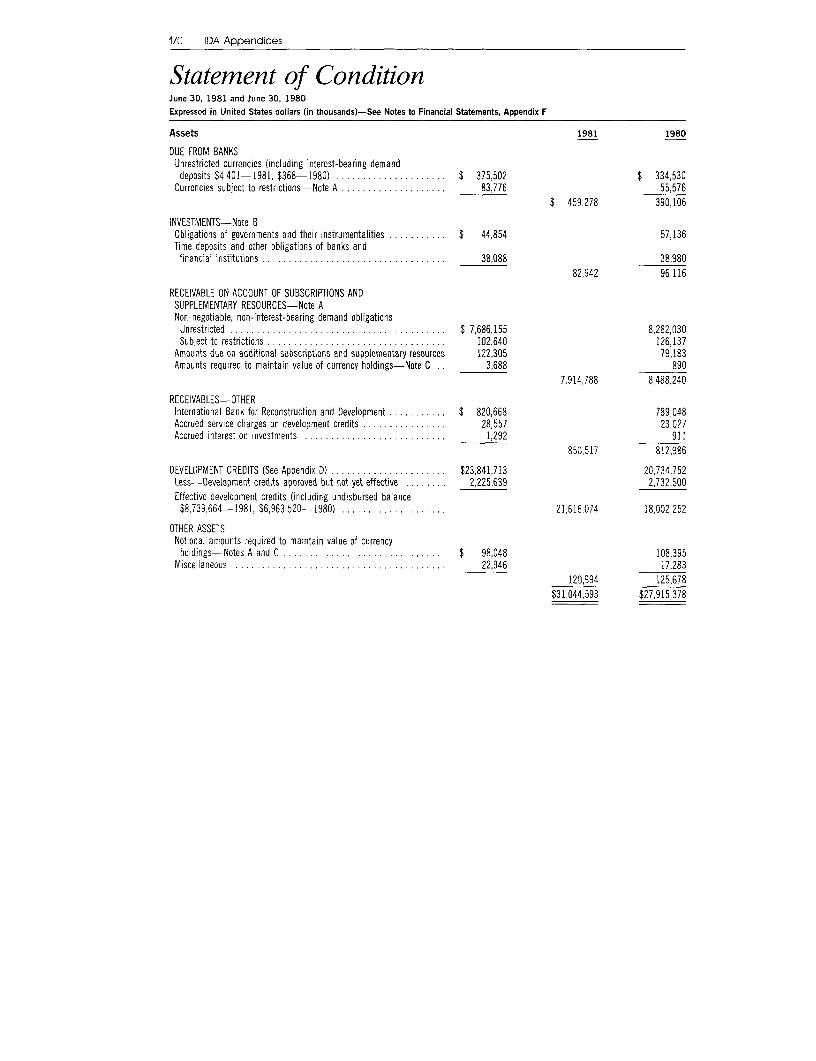
170 IDA Appendices
Statement of ConditionJune 30, 1981 and June 30, 1980Expressed in United States dollars (in thousands)-See Notes to Financial Statements, Appendix F
Assets 1981 1980
DUE FROM BANKSUnrestricted currencies (including interest-bearing demanddeposits $4,401-1981, $368-1980) ..................... $ 375,502 $ 334,530
Currencies subject to restrictions-Note A .................... 83,776 55,576$ 459,278 390,106
INVESTMENTS-Note BObligations of governments and their instrumentalities ........ $ 44,854 57,136Time deposits and other obligations of banks andfinancial institutions ................... ......... 38,088 38,980
82,942 96,116
RECEIVABLE ON ACCOUNT OF SUBSCRIPTIONS ANDSUPPLEMENTARY RESOURCES-Note ANon-negotiable, non-interest-bearing demand obligations
Unrestricted. $ 7,686,155 8,282,030Subject to restrictions .................................. 102,640 126,137
Amounts due on additional subscriptions and supplementary resources 122,305 79,183Amounts required to maintain value of currency holdings-Note C . 3,688 890
7,914,788 8,488,240
RECEIVABLES-OTHERInternational Bank for Reconstruction and Development ......... .. $ 820,668 789,048Accrued service charges on development credits ....... . 28,557 23,027Accrued interest on investments ............... 1,292 911
850,517 812,986
DEVELOPMENT CREDITS (See Appendix D) .. .................... $23,841,713 20,734,752Less-Development credits approved but not yet effective ........ 2,225,639 2,732,500Effective development credits (including undisbursed balance$8,739,664-1981, $6,963,520-1980) .................... 21,616,074 18,002,252
OTHER ASSETSNotional amounts required to maintain value of currencyholdings-Notes A and C ... ........................... $ 98,048 108,395
Miscellaneous 22,946 17,283120,994 125,678
$31,044,593 $27,915,378

Financial Statements 171
Appendix AInternational Development
Association
Liabilities, Subscriptions, Supplementary Resources, 1981 1980Transfers and Accumulated Net Loss
LIABILITIESAmounts required to maintain value of currency holdings-Note C $ 132 $ 289Accounts payable and other liabilities ....................... 138,158 58,166Notional amounts required to maintain value of currencyholdings-Notes A and C ............................... 13,864 15,034
Undisbursed balance of effective development credits(See Appendix D) ...... ............................. 8,739,664 6,963,520
Borrowings from Swiss Confederation-Note D ................. - 112,129
SUBSCRIPTIONS AND SUPPLEMENTARY RESOURCES(See Appendix E and Appendix F-Note E) ....... ............. 20,712,734 19,459,702Payment on account of pending subscription (See Appendix E) ..... 5,582 5,536
CONTRIBUTION BY SWITZERLAND-Note D ...0 ................. 51,173
TRANSFERS FROM INTERNATIONAL BANKFOR RECONSTRUCTION AND DEVELOPMENT(See Appendix B and Appendix F-Note F) ................... 1,468,765 1,367,075
ACCUMULATED NET LOSSBeginning of fiscal year .............. ................... $ (66,073) (13,530)Adjustment as a result of conversion of borrowings
into grant contributions-Note D ......................... 43,604(22,469) (13,530)
Fiscal year (See Appendix B and Appendix F-Note H) .... . (63,010) (52,543)(85,479) (66,073)
$31,044,593 $27,915,378
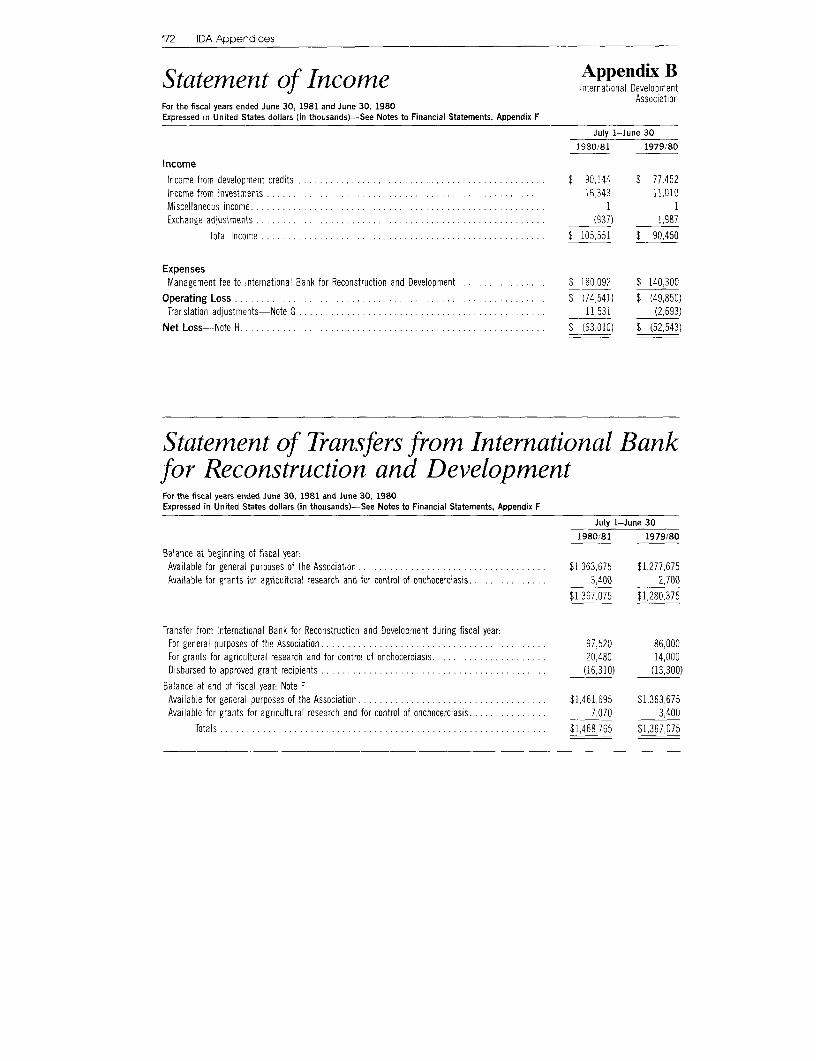
172 IDA Appendices
Appendix BStatement of Income Apnr Internatonal Development
For the fiscal years ended June 30, 1981 and June 30, 1980 AssociationExpressed in United States dollars (in thousands)-See Notes to Financial Statements, Appendix F
July 1-June 30
1980/81 1979/80
IncomeIncome from development credits ............. .................................. $ 90,144 $ 77.452Income from investments ................ ................................... 16,343 11,010M iscellaneous incom e ...................... 1................................. I 1Exchange adjustments 1....................................................... 937) 1,987
Total Income .............. ................. ................ $ 105,551 $ 90,450
ExpensesManagement fee to International Bank for Reconstruction and Development ...... ........... $ 180,092 $ 140300
Operating Loss ........................................................... $ (74,541) $ (49,850)Translation adjustments-Note G .................................... ..... 11,531 (2,693)
Net Loss- Note H ................................................ ......... $ (63,010) $ (52,543)
Statement of Transfers from International Bankfor Reconstruction and DevelopmentFor the fiscal years ended June 30, 1981 and June 30, 1980Expressed in United States dollars (in thousands)-See Notes to Financial Statements, Appendix F
July 1-June 30
1980/81 1979/80
Balance at beginning of fiscal year:Available for general purposes of the Association .................................... $1,363,675 $1,277,675Available tor grants for agricultural research and for control of onchocerciasis ............... 3,400 2,700
$1,367,075 $1,280,375
Transfer from International Bank for Reconstruction and Development during fiscal yearFor general purposes of the Association ........................................... 97,520 86,000For grants for agricultural research and for control of onchocerciasis ...................... 20,480 14,000Disbursed to approved grant recipients ........................................... (16,310) (13,300)
Balance at end of fiscal year: Note FAvailable for general purposes of the Association .... ............................... $1 461,695 $1,363,675Available for grants for agricultural research and for control of onchocerciasis ............... 7,070 3,400
Totals ........ ............................... ................. ... $1.468,765 $1,367,075

Financial Statements 173
Statement of Changes in Resources Appendix CA Z A37 S2 f 5 t f ~~~~~~~~~~~~~~~~~~~Interrnational Developm3entAvailable for Commitment Assoctation
For the fiscal years ended June 30, 1981 and June 30, 1980Expressed in United States dollars (in thousands)-See Notes to Financial Statements, Appendix F
July 1-June 30
1980/81 1979/80
Resources ProvidedNet loss (See Appendix B) .............. .. . ......... . . . . . .... .... (63,010) $ (52,543)Add-certain translation adjustments as a reslit of currencydepreciations and appreciations ..... ...... . .... . (17,35.) 3,013
Decrease in resources provided by operations ............................ $ (80,361) $ (49,530)Add net loss available for commitment' ........ ............................ 63,010 52,543
(Decrease) increase in resources .... ........... .................. ........ $ (17,351) $ 3,013From Members:Subscriptions, unrestricted ........ .. ........ ............... $ 3,748 172Supplementary resources--Subscriptions andcontributions to fifth (eplenis hment .304,303 680,615
Advance contributions to sixth replenishment-Note I .2,186,906Adjustment of resources provided in prior fiscal years as a result
of currency depreciations ard appreciations and adjustmentresulting from change in basis of valuation of certain subscriptionsand supplementary resources from 1960 dollar to SDR .1...... . . . . . (980,568) 368,771
Increase in resources provided by members . ............................. . 1,514,389 $1,049,558Transfers from International Bank for Reconstruction and Development . . ............. . 98,020 86,000Cancellations and refundings of development credits ........... . . . . . . . . . ......... . 50,078 26,278Repayments of development credits ........... .. ... .. ... .. . .. .............. . 33,643 26,760Grant participations in development credits2 .......... . .......... .. ....... . 4,999 2,220
Total increase in resources provided ... .................. .... . . . .... $ 1,683,778 $1,193,829
Resources UsedDevelopment credits approved3 ............ ... . . ... . . .. ... .. .. ... .. . ... . . $ 3,195,681 $ 3,837,500Retirement of borrowings-Note D ............... .......... . . . . . . . . . . ..... . - 312
Decrease in Resources Available for Commitment . .. ............. . .. . $ (1,511,903) $(2,643,983)
Resources Available for CommitmentBeginning of fiscal year' ...... .. .. ...... ....... .:...... ...... (181,416) 2,562,567
End of fiscal year ..................................... .................. . $ (1,593,319) 3 $ (81,416)
Composition of Resources Available for CommitmentUnrestricted currencies . ................................................ . . . $ 375,502 $ 334.530Investments ..... . 82,942 96,116Unrestricted receivables on account of subscriptions and supplementary resources ..... . . 7,810,881 8,325,380Receivables-Other. . .......................... 843,447 809,586Other assets ............. ........................................... ... 36,30 5 32,825Subscriptions and supplementary resources not yet due ........ . . .............. . . 246,868 22,220Add-Net loss available for commitment ............... . . ....................... . 115,553 52,543Less-Undisbursed development credits (including development credits not yet effective)and other liabilities . . . .................. .. . . ... . . . .... ........ .... (11,104,817) (9,754,616)
Totals ............................................. .. . . $ (1,593,319)3 $ (81,416)
'On August 9, 1979, the Executive Directors decided toat the Assoc atoon' commr tment authority not be reduced bythe amount ofdeficitsinfiscal year1980 or dur ng the period of the sixth rep erishnment of the Association's resources In order to reflect this decision, the resources ava lable forcommitment have been Increased by the amount of the accumulated oss for the period Ju y 1 1979 to June 30, 1981
2Commencing or July 1, 1980, undisbursed grant partic pations in development credits have been ncluded with development credits held by theAssociation. As a result of this change n accounting treatment, the resources availabie for commitment at the beginning of the fiscal year have beenreduced by $13,012 000 ($15.232.000-1980).
31ncludes fourteen development credits totaling $796,560,000 (s x development credits totaling $361,000,000-19800 approved by tne Associat onsubject to the avai ability of additiona commitment authority. The remaining $796,759,000 of the tota difference between resources availab e anddevelopment credits approved ($1,593,319,000) is attributable to exchange rate f uctuat ons during the fisca year ended June 30, 1981 in the valuein terms of cu,rent United Sta-es dol ars of resources expressed in other member currercies ard provided in prior fiscal years. The value of theseresoirces at any given time may be ereater or esser than the development credits committed against them, s nce these credits are denominated inUr ted States dollars If a shortfalI should make it necessary, the Association may use resources to be provided under the sixth rep enishment, once itis effective, to fund these development credits Repaymerts or earlier develooment credits would a so be available for this purpose.

174 IDA Appendices
Summary Statement of Development CreditsJune 30, 1981 and June 30, 1980Expressed in United States dollars (in thousands)-See Notes to Financial Statements, Appendix F
June 30,1981Percent
Development of totalEffective development credits held by Association credits effective nd
Disbursed Undisbursed but not yet developmentBorrower or guarantor portion I portion 2 Total effective 3 credits
Afghanistan .$ 83,290 $ 108,339 $ 191,629 $ 34,100 .95Bangladesh . .1.028,530 614,813 1,643,343 122,769 7.41Benin . . 57,763 10,813 68,576 49,811 .50Bolivia . .70,431 37,321 107,752 - .45Botswana . .15,579 - 15,579 - .07Burma . . 152.636 259,963 412,599 - 1.73Burundi . .41,159 51,622 92,781 46,024 .58Cameroon . .159,087 79,082 238,169 9,435 1.04Central African Republic 29,171 2,868 32,039 7.824 .17Chad . .36,140 21,129 57.269 - .24Chile 20,647 - 20,647 - .09China -- - 93,659 .39Colombia .21,191 - 21,191 - .09Comoros .5,199 5,001 10,200 - .04Congo, People's Republic of the 31,263 25,904 57,167 - .24Costa Rica .4,944 - 4,944 - .02Dominican Republic .20,572 1,464 22,036 - .09Ecuador .36,664 - 36,664 - .15Egypt, Arab Republic of .357,667 335,959 693,626 262,329 4.01El Salvador .26,935 164 27,099 - .11Ethiopia .264,614 75,068 339,682 69,266 1.72Gambia. The .18,118 9,329 27,447 - .11Ghana .101,307 78,138 179,445 26.809 .86Guinea .37,692 53,766 91,458 15,303 .45Guinea-Bissau .6,689 8,524 15,213 - .06Guyana .18,873 16,913 35,786 - .15Haiti .76,610 33,374 109,984 19,560 .54Honduras .71,706 11,980 83,686 - .35India .5,425,008 3,619,973 9,044,981 570,007 40.33Indonesia .593,224 346,032 939,256 - 3.94Ivory Coast .7,500 - 7,500 - .03Jordan .77,104 8,006 85,110 - .36Kenya. .227,826 179,646 407.472 45.564 1.90Korea, Republic of .112,964 - 112,964 - .47Lao People's Democratic Republic 8,502 23,498 32,000 - .13Lesotho ............... 28,124 32,605 60,729 9,435 .29Liberia .26,570 17,394 43,964 3,682 .20Madagascar .137,636 115,094 252,730 41,652 1.23Malawi .137,289 49,926 187,215 66,850 1.07Maldives .2.053 1,147 3,200 - .01Mali .129,306 46,193 175,499 18,985 .82Mauritania .40,010 6,863 46,873 13,117 .25Mauritius .20,419 - 20,419 - .09Morocco .39,909 11,930 51,839 - .22Nepal .92,840 152,032 244,872 48,401 1.23Nicaragua .45,976 13,802 59,778 - .25Niger .72,110 65,918 138,028 19,905 .66Nigeria .37,261 - 37,261 - .16Pakistan .857,610 415,273 1,272,883 140,948 5.93Papua New Guinea .59,462 23,193 82,655 24,968 .45Paraguay .46.558 1,575 48,133 - .20Philippines .37,891 84,325 122,216 - .51Rwanda .62,423 24,585 87,008 42.077 .54Senegal .123,782 95,917 219,699 10.816 .97Sierra Leone .30,010 3,927 33,937 27,845 .26Solomon Islands - - - 1,496 .01Somalia .... ............. 82,605 65.097 147,702 9,205 .66Sri Lanka .111,889 279,179 391,068 125,070 2.16Sudan .216,868 293,492 510,360 66,160 2.42Swaziland .7,503 555 8,058 - .03

Financial Statements 175
Appendix DInternational Development
Association
June 30,1981Percent
Development of totalcrdits effective and
Effective development credits held by Association approved non-effectiveDisbursed Undisbursed but not yet development
Borrower or guarantor portion I portion 2 Total effective 3 credits
Syrian Arab Republic.. $ 43,114 $ 4,827 $ 47,941 $ .20Tanzania . .278,835 304,069 582,904 43,000 2.63Thailand . .39,977 83,216 123,193 - .52Togo 468733 .......... 7...........4 37.693 84,566 24,393 .46Tunisia 6 7 , 6 5 2 ............ 67,652 1,941 69,593 - .29Turkey 188,855 - 188,855 - .79Uganda ........................ 49,478 77,243 126,721 8,169 .57Upper Volta ...... .............. 82,367 47,384 129,751 57,645 .79Viet Nam , . 31,074 28,926 60,000 - .25Western Samoa .......... ...... 6,874 5,526 12,400 1,841 .06Yemen Arab Republic ....... ....... 113,345 102,858 216.203 21,976 1.00Yemen, People's Democratic Republic of . 40,776 44,706 85,482 22,782 .45Zaire 1 6 6, 3 8 9 . .............. 166,389 135,166 301,555 2,761 1.28Zambia ..... .................. 2.776 34,474 37,250 - .16Zimbabwe . .10,860 3,062 13,922 - .06
Sub-totals members ........... $12,861,954 $ 8,729,802 $21,591,756 $ 2,225,639 99.90Regional development banks
Banque Ouest Africaine deDeveloppement I . . .... $ 138 $ 2,862 $ 3,000 $ - .01
Caribbean Development Bank 5 7,000 7,000 - .03Subtotals regional development
banks . . .............. $ 138 $ 9,862 $ 10,000 $ - .04Taiwan, China .................. $ 14,318 $ - $ 14,318 $ - .06Totals-June 30, 1981 .$12,876,41 $12,876,410 $ 8,739,664 $21,616,074 $2,225,639 100.00Totals-June 30, 19807 .$11,038,732 $ 6,963,520 $18,002,252 $ 2,732,500
I The disbursed portion includes adjustments to reflect the devaluations of the United States do lar in 1972 and 1973 except in respect of adevelopment credit for $9,000,000 wh ch is expressed and Is repayab e in legal tender dollars.
2 These amounts nc ude $25,512,000 ($13,012,000-1980) of grant part cipations. The grant partic pat ons represent part cipat ons on a grantbasis taken in a number of developmert credits under the terms of aid cooperation agreements between two member cocuntries and the Association. 0'the undisbursed balance at June 30, 1981 the Association has entered into irrevocable commitments to disburse $14,466,000 1$4,209,000--1980).
3Deve opment credit agreements totaling $1,110,132,000 ($1,831,600,000-1980) have been s gned but the developmert cred ts do not becoraeeffective and disbursements thereunder do not start unti the borrowers take certain act ons ass furnish certair documents to the Assoc at;on.Agreements providing for devebopment credits totaling $1,115,507,000 ($900,900,000-1980) [ ncludirg fourteen development cred ts for$796,560,000 (siX development cred ts for $361.000.000-1980) approved by the Assoc at or subject to the avaiiability of additional commitmertauthority] have been approved by the Associat on but have not been signed.
IThis development credit is for the benef t of Benin, Ivory Coast, Niger, Senega , Togo, ard Upper Vo ta5 This development cred t is for the benefit of Grenada and territories of the Un ted Kingdom (Assoc ated States and Deperdencies) n the Caribbear
Region.6 Represents development credits made at a time wher the authorities on Taiwan represented Cnina I tne Assocuatron tprior to May 15, 1980,7 Commencing on July 1, 1980, receivables on account of effective development cred ts agreed to be sold have been included with effect ve
development credits he d by the Associat on, and totals at June 30, 1980 have been reclass fied accord ng y for purposes of comparisor
Maturity Structure of Effective Development Credits
Periods June 30, 1981 Periods June 30, 1980
July 1, 1981 to June 30, 1982 . ...... . $ 44,529 July 1, 1980 to June 30, 1981 . .$ 33,466July 1, 1982 to June 30, 1983 . .......... . 58,841 July 1, 1981 to June 30, 1982 . .44,407July 1, 1983 to June 30, 1984 . .......... . 83,198 July 1. 1982 to June 30, 1983 . .58,635July 1, 1984 to June 30, 1985 . ....... . 105,570 July 1, 1983 to June 30. 1984 . . .78,500July 1, 1985 to June 30, 1986. ........ . 126,879 July 1, 1984 to June 30, 1985 . .100,771July 1, 1986 to June 30, 1991 .......... . 1,023,858 July 1, 1985 to June 30, 1990 .846,833July 1, 1991 to June 30, 1996 ............ . 1,740,191 July 1, 1990 to June 30, 1995 .1.420,832July 1, 1996 to June 30, 2001 ................ . 2,626.158 July 1, 1995 to June 30, 2000 2,197,020July 1, 2001 to June 30, 2006 .......... . 3,252,471 July 1, 2000 to June 30, 2005 2,671,391July 1, 2006 to June 30. 2011 ............ 3,253,280 July 1, 2005 tc June 30, 2010 ............ 2,671,811
July 1, 2011 to June 30, 2016 ........... . 3,150,446 July 1, 2010 to June 30, 2015 .2,607,163July 1, 2016 to June 30, 2021 ......... . .. 2,906,744 July 1, 20150to June 30, 2020 ..... . ...... 2,386,331July 1. 2021 to June 30, 2026 ...... ............ 2,269,911 July 1, 20200to June 30, 2025 . ........ . 1,876,420July 1, 2026 to June 30, 2031 ........... . 973,998 July 1, 2025 to June 30, 2030 .1,008,672Total ........................... $21,616,074 Total . ................. .... $18.002,252

176 IDA Appendices
Statement of Voting Power,and Subscriptionsand Supplementary ResourcesJune 30, 1981 and June 30, 1980Expressed in thousands of units of currency-See Notes to Financial Statements, Appendix F
Amounts ofsubsequent
Amounts of subscriptions subscriptionsand supplementary and Total subscriptions
resources through the supplementary and supplementaryVoting power third replenishment resources 2 resources 3
Expressed Expressed ExpressedExpressed in in in
in current current currentspecial United United United
Number Percent drawing States States States PercentMembers 1 of votes of total rights 4 dollars dollars dollars of total
Part I MembersAustralia ................ 52,652 1.46 SDR 111,980 $ 135,418 $ 311,504 5 446,922 2.13Austria .................. 21,822 .61 34,560 41,808 88,509 130,317 .62Belgium ......... ....... 42,397 1.18 77,700 93,876 207,100 300,976 1.44Canada ................. 0 137,025 3.80 304,530 368,161 789,361 1,157,522 5.52Denmarh ................ 34,353 .95 70.840 85,811 158,026 243,837 1.16Finland ................. 18,404 .51 22,448 27,163 79,896 107,059 .51France ......... ........ 138,669 3.85 362,032 437,519 693,938 1,131,457 5.40Germany ................ 236,831 6.57 476,560 575,850 1,893,333 2,469,183 11.78Iceland ................. 7,802 .22 550 664 1,228 1,892 .01Ireland ......... ........ 10,393 .29 7,030 8,496 18,428 26,924 .13Italy .................. 91,861 2.55 193,240 234,710 348,762 583,472 2.78Japan .................. 201,476 5.59 285,320 344,802 2,176,591 2,521,393 12.03Kuwait .................. 37,613 1.04 22,920 27,731 301,158 328,889 1.57Luxembourg .............. 8,363 .23 2,550 3,079 7,885 10,964 .05Netherlands .............. 70,182 1.95 141,080 170,534 446,563 617,097 2.95New Zealand .... , .... 10,413 .29 - - 24,152 24,152 .12Norway ........ ......... 30,464 .85 49,320 59,574 162,359 221,933 1.06South Africa .............. 12,445 .35 20,080 24,250 17,842 42,092 .20Sweden ................. 93,315 2.59 206,225 249,079 514,237 763,316 3.64United Kingdom ......... 263,576 7.32 694,300 839,611 1,717,235 2,556,846 12.20United States ............. 769,139 21.35 2,072,290 2,505,109 3,900,000 6,405,109 30.56Totals . ............ 2,289,195 63.53 SDR 5,155,555 $6,233,245 $13,858,107 $20,091,352 95.86
Part 11 MembersAfghanistan .............. 10,084 .28 SDR 1,049 $ 1,212 $ 59 $ 1,271 .01Algeria .................. 18,481 .51 4,186 4,839 187 5,026 .02Argentina ................ 59,655 1.66 19,720 22,806 7,825 30,631 .15Bangladesh .............. 22,239 .62 5,589 6,461 158 6,619 .03Benin .................. 600 .02 500 578 - 578Bolivia .................. 10,230 .28 1,101 1,273 45 1,318 .01Botswana ................ 7,747 .22 166 192 7 199 5Brazil .................. 59,655 1.66 19,720 22,795 609 23,404 .11Burma ................. 12,922 .36 2,099 2,426 81 2,507 .01Burundi ................. 9 407 .26 790 913 36 949 5Cameroon ................ 7771 .22 1,049 1,215 27 1,242 .01Cape Verde ............... 516 .01 80 92 -- 92 5Central African Republic ..... 6,685 .19 519 601 13 614 5Chad .................. 2,093 .06 519 601 - 601 sChile .................. 17,113 .48 3,667 4,241 25 4,266 .02China .................. 91,311 2.53 31,436 36,339 1,330 37,669 .18Colombia . ............. 17,132 .48 3,717 4,296 142 4,438 .02Comoros ................. 5,774 .16 83 96 2 98 5Congo, People's Republic of the 6,685 .19 519 601 13 614 5Costa Rica .............. 7,844 .22 208 241 6 247 5

Financial Statemerts 177
Appendix EInternational Development
Association
Amounts ofsubsequent
Amounts of subscriptions subscriptionsand supplementary and Total subscriptions
resources through the supplementary and supplementaryVoting power third replenishment resources 2 resources 3
Expressed Expressed ExpressedExpressed in in in
in current current currentspecial United United United
Number Percent drawing States States States PercentMembers I of votes of total rights 4 dollars dollars dollars of total
Part 11 Members (continued)Cyprus ................. 9,407 .26 SDR 790 $ 913 $ 33 $ 946 5Dijbouti ................. 532 .01 160 187 - 187 5Dominica ......... ...... 516 .01 80 93 - 93 5Dominican Republic ........ 8,426 .23 436 504 66 570 5Ecuador ................. 2,200 .06 676 877 - 877 5Egypt, Arab Republic of ...... 21,403 .59 5,277 6,100 148 6,248 .03El Salvador ............... 6,244 .17 331 383 11 394Equatorial Guinea .......... 1,967 .05 332 384 - 384Ethiopia ................. 8,691 .24 539 623 26 649Fiji ................. 2,130 .06 581 672 - 672Gabon ................. 2,093 .06 519 602 - 602Gambia, The .............. 8,044 .22 277 320 13 333Ghana ................. 10,711 .30 2,452 2,835 33 2,868 .01Greece ................. 14,288 .40 2,618 3,129 72 3,201 .02Grenada ................. 7,537 .21 94 108 4 112 5
Guatemala ............... 8,417 .23 415 480 21 501 5Guinea ...... 10,084 .28 1,049 1,211 51 1,262 .01Guinea-Bissau ............ 528 .01 140 162 - 162 5Guyana ................. 9,553 .27 842 973 32 1,005 .01Haiti .................. 9,407 .26 790 913 40 953 .01Honduras ................ 8,124 .23 311 360 18 378India .................. 119,375 3.31 41,919 49,524 1,943 51,467 .25Indonesia ................ 38,128 1.06 11,531 13,330 381 13,711 .07Iran ................. 15,455 .43 4,717 5,690 142 5,832 .03Iraq ................. 9,407 .26 790 913 40 953 .01Israel ................. 9,386 .26 1,745 2,102 296 2.398 .01Ivory Coast .............. 7,771 .22 1,049 1,212 28 1,240 .01Jordan ................. 6,242 .17 311 375 10 385 5Kampuchea, Democratic ..... 7,826 .22 1,060 1,225 6 1,231 01Kenya ................. 11,960 .33 1,745 2,021 73 2,094 .01Korea, Republic of .......... 10,932 .30 1,309 1,513 1,371 2,884 .01Lao People's Dem. Rep . ...... 8,688 .24 519 601 2 603 5Lebanon ................. 8,562 .24 467 540 15 555 5Lesotho ................. 7,747 .22 166 192 7 199 5Liberia ................. 9,407 .26 790 913 40 953 .01Libya ................. 7,771 .22 1,049 1,212 37 1,249 .01Madagascar .............. 702 .02 1,010 1,168 - 1,168 .01Malawi .................. 9,407 .26 790 913 37 950 .01Malaysia ................ 14,288 .40 2,618 3,026 134 3.160 .02Maldives ............... 7,382 .20 31 36 2 38 5
Mali .................. 7,479 .21 904 1.045 23 1,068 01Mauritania ............... 6,685 .19 519 601 16 617 5Mauritius ................ 9,702 .27 924 1,069 30 1,099 .01Mexico ................. 9,253 .26 8,740 10,266 123 10,389 .05Morocco ................. 17,113 .48 3,667 4,239 145 4,384 .02Nepal ................. 8,688 .24 519 601 24 625Nicaragua ............... 8,124 .23 311 376 14 390 5Niger ................. 6,685 .19 519 601 14 615 5
(continued)

178 IDA Appendices
Statement of Voting Power, Appendix Ed S b t ~~~~~~~~~~~~~~~~~~~~~International Developmentand Subscriptions Association
and Supplementary Resources (concluded)June 30, 1981 and June 30, 1980Expressed in thousands of units of currency-See Notes to Financial Statements, Appendix F
Amounts ofsubsequent
Amounts of subscriptions subscriptionsand supplementary and Total subscriptions
resources through the supplementary and supplementaryVloting power third replenishment resources I resources 3
Expressed Expressed ExpressedExpressed in in in
in current current currentspecial United United United
Number Percent drawing States States States PercentMembers I of votes of total rights I dollars dollars dollars of total
Part 11 Members (continued)
Nigeria ....... 4,057 .11 SDR 3,491 $ 4,059 $ - $ 4,059 .02Oman .................. 6,244 .17 331 384 11 395 5Pakistan .......... 35,355 .98 10,582 12,231 529 12,760 .06Panama ................ 5,o57 .16 21 25 1 26 5Papua New Guinea ......... 9,698 .27 894 1,033 48 1,081 .01Paraguay ................ 8,124 .23 311 360 15 375 iPeru .................. 854 .02 1,770 2,046 - 2.046 .01Philippines ............... 16,583 .46 5,296 6,122 254 6,376 .03Rwanda ................. 9,407 .26 790 913 36 949 .01Sao Tome and Principe ... 514 .01 70 81 - 81Saudi Arabia ............. 46,843 1.30 3,700 4,278 471,800 476,078 2.27Senegal .............. 11,960 .33 1,745 2,018 68 2,086 .01Sierra Leone ........... 9.407 .26 790 914 28 942 5Solomon Islands ........... 518 .01 90 105 - 105 5Somalia ...... ......... 7,246 .20 790 913 28 941 5Spain .................. 40,084 1.11 12,590 15,197 25,867 41,064 .20Sri Lanka ................ 15,705 .44 3,148 3,638 57 3,695 .02Sudan ......... ........ 10,084 .28 1,049 1,215 41 1,256 .01Swaziland ................ 8,193 .23 332 384 14 398 5Syrian Arab Republic ........ 7,651 .21 987 1.141 34 1,175 .01Tanzania ............... 11,960 .33 1,745 2,018 77 2,095 .01Thailand ............... 15,705 .44 3,148 3,638 152 3,790 .02Togo .................. 7,246 .20 790 913 21 934Trinidad and Tobago ........ 77C .02 1.350 1,561 - 1,561 .01Tunisia .................. 2,793 .08 1,569 1,814 - 1,814 .01Turkey ............ ..... 23,450 .65 6,086 7,034 56 7,090 .03Uganda - .............. 11,960 .33 1,745 2,017 83 2,100 .01Upper Volta ............ . 6,685 .19 519 601 13 614 5Viet Nam ................ 8,889 .25 1,569 1,814 25 1,839 .01Western Samoa ............ 7,537 .21 94 108 3 111 5
Yemen Arab Republic ....... 8,494 .24 446 516 23 539 5Yemen, People's Dem. Rep. of .. 10,591 .29 1,226 1.417 63 1,480 .01Yugoslavia .............. 20,711 .57 8,080 9,764 12,035 21,799 .10Zaire .................. 12,164 .34 3,138 3,627 10 3,637 .02Zambia ................. 1,038 .03 2,690 3,110 - 3,110 .01Zimbabwe ............... 1,324 .04 4,120 4,812 - 4,812 .02Totals .................. 1,313,912 36.47 SDR 292,237 $ 340,772 $ 527,478 $ 868,250 4.14Grand Totals-June 30, 1981 3,603,107 100.00 SDR 5,447,792 $6,574,017 $14,385,585 $20,959,602 100.00
Grand Totals-June 30, 1980 3,578,266 SDR 5,443,342 $6,609,350 $12,872,572 $19,481,922
i See Appendix F-Note A, for an explanation of the two categories of members.2Includes subscrlptins and supplementary resources urder the fourth and fifth replenishments ard tne advance cortributions to the sixth
replenishment.3 Incudes amounts aggregat ng 5369,173,000 ($101,403,000-1980) equiva ent ir current United States do lars rece vable from members, of
which at June 30, 1981 $122,305,000 ($79,183,000-1980) equivalent was past due and $246,868,000 ($22,220,000---1980) equivalert, wasnot yet due.
4 The Association has expressed its subscript ons and supplementary resources ir specia drawing rights with effect from Ap' I 1, 1978.; Less than .005 percent.General Theequva lenof $5,582,000 has been received from United Arab Em irateson accountof tssubscr ption pencirgcompleto of membership
formal ties.

Financial Statements 179
Notes to Financial Statements Appendix FInternational Development
AssociationJune 30, 1981 and June 30, 1980
Summary of Significant Accounting and by the value of the currency in question in terms of the SDR at anyRelated Policies given time. It would be consistent with this opinion also to
substitute the SDR for the 1960 dollar as the measure of theTranslation of Currencies development credit repayment obligation expressed in terms ofThe Association is an international organization which conducts its 1960 dollars, but this would require approval of the Executiveoperations in the currencies of all of its members and Switzerland. Directors and would involve other changes in the developmentThe Association's policy is to translate its assets and liabilities in credit agreements.currencies other than United States dollars at market rates ofexchange to the United States dollar at the end of each quarter The General Counsel has, however, also stated that in the exercise ofTranslation adjustments relating to subscriptions and supplemen- their statutory power under Article X of the Association's Articles,tory resources are accounted for as described in Note C; all other the Enecutive Directors could concludethat the 1960 dollarwould betranslation adjustments are included in the determination of net taken to moan $120635 current dollars, with the consequencethatincome. Income and expenses are translated at an average of the maintenance of value would be mneasured by that standard.market rates of exchange in effect during each quarter.
The subscriptions and supplementary resources provided through Pending action on this matter by the Association, the subscriptionsthe third replenishment are expressed in terms of "United States and supplementary resourcesthrough the third replenishment havedollars of the weight and fineness in effect on January 1, 1960" been expressed in SDRs on the basis that one SDR equals one 1960(1960 dollars) and from 1973 until March 31, 1978 have been dollar (However, as described in the following paragraph, this basistranslated by the Association, for purposes of the financial state- has not been applied to development credit repayment obligationsments, into current United States dollars at the rates of $1.20635 expressed in terms of 1960 dollars.) The value of such subscriptionsper 1960 dollar. The subscriptions and supplementary resources and supplementary resources has been expressed on the basis ofprovided under the fourth and fifth replenishments are expressed the SDR in terms of United States dollars as computed by the Fundand payable in members'currencies .The supplementary resources ($1.15060 per SDR) on June 30. 1981, for the amounts of subscrip-provided as advance contributions to the sixth replenishment are tions and supplementary resources undisbursed at June 30, 1981;expressed in members' currencies or special drawing rights (SDRs) at the daily SDR rate for amounts disbursed from the effective dateand are payable in members' currencies. Subscriptions and supple- of the Second Amendment to June 30, 1981, and at the rate ofmentary resources provided subsequent to the third replenishment $120635 per 1960 dollar for amounts disbursed prior to theare translated (1) at market rates of exchange at the end of each effective date of the Second Amendment. Expressing the value ofquarter for amounts receivable and for amounts received and not certain of the Association's subscriptions and supplementaryyet disbursed, and (2) at market rates of exchange on the dates of resources in terms of the SDR ratherthan in terms of the 1960 dollardisbursement in respect of those amounts which have been (translated at the rate of $1.20635) does not have a material effectdisbursed or converted into another currency, on the financial position or results of operations of the Association.
If the value of these subscriptions and supplementary resourcesThe Association's development credits funded from resources pro- were expressed in terms of $1.20635 the amount ofvided through the fifth replenishment are denominated in current $20,712,734,000 ($19,459,702,000-1980) shown in the State-United States dollars: the principal amounts disbursed on such ment of Condition would have decreased by $1,972,000 tocredits are repayable in amounts equivalent to the value of the $20,710,762,000 ($42,712.000 to $19,416,990,000-1980).currencies disbursed in terms of 1960 dollars. Development creditsapproved by the Executive Directors of the Association after August Pending clarification of the effect of the Second Amendment on1, 1980, funded from resources provided under the sixth replenish- development credit repayment obligations expressed in 1960 dol-ment. are denominated in SDRs; the principal amounts disbursed lars. the Association has continued to base these upon the parunder such credits are to be repaid in amounts equivalent to the value ($1.20635 per 1960 dollar) in effect immediately prior tovalue of the currencies disbursed in terms of SDRs. effectiveness of the Second Amendment. If the matter had been
resolved duringthe period endedJune 30, 1981, and theAssociationOn April 30. 1976, the Board of Governors of the International had expressed such repayment obligations in terms of the SDR atMonetary Fund (the Fund) approved proposed amendments to the June 30, 1981, the amount of $21,616,074,000 ($18,002,252,000-Fund's Articles of Agreement (the Second Amendment) which 1980) shown in the Statementof Condition would have decreased byentered into force on April 1, 1978. Under the Second Amendment, $807,593,000 (increased by $889,793,000-1980) as of June 30,currencies no longer have par values, gold is abolished as a 1981 representing the cumulative effect of the change sinceApril 1,common denominator of the monetary system and all calculations 1978. This would have resulted in a net loss for the period endedfor the purposes of the Fund's Articles are made on the basis of the June 30, 1981 of $870,603,000 (net income of $837,250,000-SDR. 1980) rather than a net loss of $63,010,000 ($52,543,000-1980).
As a result of the Second Amendment and the simultaneous repeal Investmentsof Section 2 of the Par Value Modification Act (31 U.S.C. 449), the Investment securities are recorded at cost or amortized cost. Gainsprovision of United States law defining the par value of the United or losses on sales of investments, measured by the differenceStates dollar in terms of the SDR and gold, the pre-existing basis for between average cost and proceeds of sales, are recorded as antranslating the term "United States dollar of the weight and element of income from investments.fineness in effect on January 1,1960" into current United States Development Creditsdollars or into any other currency. no longer exists. Development Credits
All of the Association's development credits are made to memberThe General Counsel of the Association has rendered a legal opinion governTments orto the government of a territory of a member (exceptconcluding in substance that upon the entry into force of the for two development credits which have been made to regionalSecond Amendment references in the Association's Articles of development banks for the benefit of members or territories ofAgreement to the 1960 dollar should be read as referring to the SDR, members of the Association). The Association has not suffered anyas determined from time to time by the Fund and the mutual losses on development credit receivables and no losses are antici-obligations of each member and the Association with respect to pated. However, should such losses arise they would be included inmaintenance of value of certain currency holdings will be measured the determination of net income.
(continued)

180 IDA Appendices
Notes to Financial Statements(continued)June 30, 1981 and June 30, 1980
Administrative Expenses The provisions of Article IV Section 2 have by agreement beenAdministrative expenses of the Association are paid by the Interna- extended to cover additional subscriptions and supplementarytional Bank for Reconstruction and Development (the Bank). The resources of the Association through the third replenishment butAssociation reimburses the Bank for such expenses by payment of a are not applicable to those of the fourth and fifth replenishmentsmanagement fee representing its share of the administrative and the advance contributions to the sixth replenishment. On Juneexpenses incurred bythe Bank. The management fee to the Interna- 19, 1972, the Executive Directors decided that for all members thattional Bank for Reconstruction and Development of $180,092 000 established central rates for their respective currencies, pendingshown in Appendix B includes $92,000 reimbursed by the Associa- establishment of new par values for their currencies, maintenancetion to a regional development bank under a development credit of value obligations be settled on the basis of those central rates. Itagreement wherebythe Association agreed to reimburse such bank was further decided that with respect to any member currencyfor the amount of $548,000 over a five-year period commencing functioning under a system under which the market rate was notwitt 1980 as compensation for the costs of administering sub- confined within announced intervention margins, maintenance ofloans and investments under such developnent credit agreement. value obligations would be determined on the basis of market rates
in effect on the respective dates of disbursement of such currency,Note A-Restricted Currencies but only for the amounts disbursed.The membership of the Association is divided into two categories:(1) Part I members, which pay all subscriptions and supplementary Prior to April 1, 1978, where market rates of exchange were notresources provided to the Association in convertible currencies related to par values or central rates as in the cases of a majority ofwhich may be freely used or exchanged by the Association in its the members, and there were differences between market rates ofoperations; (2) Part 11 members, which pay ten percent of their exchange and the rates at which undisbursed subscriptions andinitial subscriptions in freely convertible currencies and the supplementary resources of members through the third replenish-remaining ninety percent of their initial subscriptions and all ment of the Association's resources had been paid or were payable,additional subscriptions and any supplementary resources pro- such differences were shown as Translation Adjustments onvided to the Association in their own currencies. The Articles of Subscriptions and Supplementary Resources under the headingAgreement of the Association and subsequent replenishment Other Assets. The amounts $84,184,000 ($93,361,000-1980)agreements provide that the currency of any Part 11 member paid in established at that date and accordingly at June 30, 1981 repre-by it may not be used by the Association for projects financed by the sented notional receivables $98,048,000 ($108,395,000-1980)Association and located outside the territories of the member except and payables $13,864,000 ($15,034,000-1980). Maintenance ofby agreement between the member and the Association. The value obligations in respect of such indisbursed amounts areamounts of $83,776,000 ($55,576,000-1980) under the heading determined upon their disbursement. In accordance with the legalDue from Banks, $103,907,000 ($162,860,000-1980) included opinion of the Association's General Counsel referred to above,under the heading Receivable on Account of Subscriptions and maintenanceof value pursuanttoArticle IV, Section 2 oftheArticlesSupplementary Resources and $66,533,000 ($72,504,000-1980) of Agreement is being determined provisionally on the basis of theincluded in Notional Amounts Required to Maintain Value of Cur- SDR, and is treated in the financial statements on that basis. Sincerency Holdings under the headings Other Assets and Other the Association is still considering the implications of the SecondLiabilities respectively, were subject to such restrictions. Amendment, and in view of the questions referred to above, the
timing of any establishment and settlement of these notionalNote B-Investments maintenance of value items is uncerain. Accordingly, they areThe market value of investment securities was $81,034,000 included inOtherAssets,andLiabilitiesasnotional maintenanceof($95,618,000-1980) compared with a cost or amortized cost of value obligations.$82,942,000 ($96,116,000-1980) and face value of $83,846,000($98,067,000-1980), including investments not traded in the Note D-Contribution by Switzerlandmarket which were valued at their cost of $38,504,000($39,497,000-1980). Investments include securities purchased The Swiss Co ntederation, which is not a member of the Association,under agreements to resell armounting to $3,025,000 has made grant contributions to the Association ir,the amount ofunder agreemnts tr SwF 181,480,000. This amount represents the outstanding($5,682,000-19801. balances of loans to the Association totaling SwF 182,000,000,Note C-Maintenance of Value made by the Contederation in fiscai years 1967 and 1973. TheseArticle IV, Section 2 of the Associations Articles of Agreement outstanding balances were converted into grant contributions pur-provides for the maintenance of the value, as of the time of suant to agreements between the Confederation and the Associa-subscription, of the Association's currency holdings or demand tion which came into force on April 1. 1981. As a result of theobligations substituted therefor representing ninety percent of each conversion, the Accumulated Net Loss was reduced by $43,604,000member's initial subscription, only so long as and to the extent that representing the difference between the value of the loans at thesuch currency has not been initially disbursed or exchanged for the times the loans were drawn down and their value at the time ofcurrency of another member. This Section requires: (1) the member conversion into grant contributions. These agreements make provi-to make additional payments to the Association in the event that sion for converting these grant contributions into a subscription orthe par value of its currency is reduced or the foreign exchange supplemetary resources, if Switzerlard should become a memberofvalue of its currency has, in the opinion of the Association, depreci- the Association.ated to a significant extent in its territories and (2) the Associationto reimburse the member in the event that the par value of its Note E-Subscriptions and Supplementary Resourcescurrency is increased or the foreign exchange value of its currency Subscriptions and supplementary resources have been translatedhas, in the opinion of the Association, appreciated to a significant as set forth under the Summary of Significant Accounting andextent in its territories. Related Policies. At June 30, 1981 and 1980 these were as follows:

Financial Statements 181
Appendix FInternational Development
Association
Note E (continued)
1981 1980Expressed in United States Dollars
(ir thousands)
Initial subscriptions and first three replenishments:Subscriptions (SDR 1,069,788-1981,SDR 1,065,338-1980) ............ $.1.................... $ 1.278,706 $ 1,310.407
Supplementary resources (SDR 4.378,004-1981,SDR 4,378,004-1980) .1 ................................. 5,295,311 5,298.943
$ 6,574,017 6,609,350Fourth and fifth replenishments:Subscriptions . ................. .......... .............. $ 49,863 50,559Supplementary resources ........... ....................... 12,148.816 12,822,013
$12,198,679 12,872,572Less--Portion for which payment is due in next fiscal year . ........... - 22,220
12,198,679 12.850,352Advance contributions to sixth replenishment ......... ........... $ 2,186,906Less--Portion for which payment is due in next fiscal year ..... ... ... 246,868
1,940.038 -Totas.. $20,712,734 $19,459,702
Note F-Transfers from International Bank aration and implementation, The major portion of such expendi-for Reconstruction and Deveiopment tures is incurred before substantial amounts of the credits whichThe International Bank for Reconstruction and Development has finance the projects are disbursed Service charges on developmentauthorized transfers by way of grants to the Association totaling credits, which are levied only on amounts disbursed and outstand-$1,543,000,000 ($1,425,000,000-1980) from net income of the lng, are estimated to be more than sufficient to cover the costsBank for the fiscal years ended June 30. 1964 through June 30, incurred over the lives of the projects they finance. Because1980. Of this amount, $81,305,000 ($61,325,000-1980) may be administrative expenses are incurred considerably in advance ofused by the Association or had been disbursed for grants for receipt of incomefrom development credits the Association incurs aagricultural research and for the control of onchocerciasis. At temporary income deficit with respect to each such credit. TheDecember 31, 1980, $500,000 previously allocated for such grants present value of earnings from development credits approvedreverted to the Association for its general purposes. during fiscal year 1981, as estimated by the Association, exceeds
the management fee for that year The amount of the income deficitNote G-Translation Adjustments which may be incurred in any year will be influenced by a number ofIn accordance with the policies discussed in the Summary of factors including the scale of lending activities of the Association,Significant Accounting and Related Policies the Association has the amount of credits on which service charges are being earnedrecorded a credit of $11,531,000 (charge of $2,693,000-1980) and the income from other investments the Association may have.representing translation adjustments. This amount comprises a At June 30, 1981, principal instalments of $135,000 and servicecredit of $13,025,000 (charge of $2,655,000-1980) as a result of charges of $530,000 payable to the Association on developmentcurrency depreciations and appreciations [including a credit of credits were overdue by more than 60 days. The principal disbursed$17,351,000 (charge of $3,013,000 1980)on account of the Swiss and outstanding on these development credits amounted toConfederation borrowings which on April 1, 1981 became grant $41,657,000. Of these amounts $135,000 of principal and $512.000contributions (See Note DU], a credit of $207,000 (charge of of service charges were due from Chad in respect of development$38,000-1980) representing the effect of the valuation change to credits on which principal disbursed and outstanding amounted tothe SDR on that portion of the Association's subscriptions and $36,139,000. The arrears of Chad's service payments date from Junesupplementary resources paid in United States dollars and a 1979. Disbursements of development credits made to Chad havecharge of $1,701,000 (nil-1980) representing the adjustment of been suspended since July 1979. It is not anticipated that thesedevelopment credit repayment obligations expressed in SDRs. delays in payments, including those due from Chad, will result in
Since the value of the SDR in terms of current dollars may vary from any loss to the Association.day to day, the portion of the Association's subscriptions andsupplementary resources paid in dollars will be subject to further Note I-Sixth Replenishment of theadjustment at the end of each quarter Association's Resources
On March 26, 1980, the Board of Governors adopted a resolutionNote H-Net Loss authorizing the Association to accept additional resources fromThe Association pays a management fee to the Bank in respect of member countries, as a sixth replenishment of the Association'sadministrative expenditures incurred for projects during their prep- resources. Under the resolution the Association is authorized to
(continued)

182 IDA Appendices
Notes to Financial Statements(concluded) Appendix FInternational Development
AssociationJune 30, 1981 and June 30, 1980
Note I (continued) contribution of any member is subject to obtaining the necessaryaccept an aggregate of $12,000,000,000 equivalent, computed on appropriations. Countries whose contributions are so qualifiedthe basis of representative rates of exchange and the SDR value on would notify the Association from time to time when appropriateOctober 5, 1979 and payable in freely convertible or otherwise legislative action has been taken to permit payment of all or a partusable currency. The resolution provides that these paymentswould of their qualified contributions.be made in three equal instalments beginning on November 8 1980(unless that date is postponed as provided in the resolution The resolution further provides that, tor purposes of credit commit-because sufficient notifications as described below have not been ments by the Association, the subscriptions and contributionsreceived) The resolution further provides that the members have authorized thereunder shall be divided into three successivecertain options as to the amount and timing of payments. These tranches of at least 29%, at least 33% and 38% (or the remainingresources would be divided into amounts for subscriptions carrying balance) of the total. If and as long as unqualified contributionvoting rights and contributions not carrying voting rights, commitments have not been received from the United States for the
respective minimum amount of any said tranches of its subscrip-In connection with the replenishment and in accordance with past tion and contribution, the amount of such tranche of all subscrip-practice, arrangements have been made to permit Part 11 members tions and contributions which the Association may use for makingto maintain their relative voting power and for that purpose they new unqualified credit commitments will be reduced in proportionhave been authorized to make subscriptions carrying voting rights to such shortfall in unqualified contribution commitments,in the aggregate of $6,289,000 equivalent payable in the respectivecurrencies of the subscribing members. Pending the effectiveness of the sixth replenishment, a number of
governments indicated that they would be willing to provide com-None of the above-mentioned subscriptions and contributions mitment authority to the Association by maoing advance contribu-would become payable unless members, including at least 12 Part I tions on the condition that a majorityof Part I donors ora majorityofmembers, whose subscriptions and contributions aggregate not all donors collectively commit themselves to make advance con-lessthan the equivalent, computed on the basis described above, of tributions of at least the equivalent, computed on the basis$9,600,000,000 shall each have given the Association, on or before described above, of $1,200,000,000. On October 3, 1980, thisSeptember 30, 1981, or such later date as the Executive Directors condition was met and the advance contribution arrangement camemay determine, formal notification that they will make the total into effect. At June 30, 1981, formal notification had been receivedsubscription and the total contribution authorized for such mem- from seventeen Part I donors and five Pant 11 donors that they willbers in accordance with the terms of the resolution. These notifica- make such advance contributions in an aggregate amounttions may provide thatthe payment of a part of the subscription and equivalent to $2,186,906,000.

Financial Statements 183
Report of Independent Financial StatementsAccountants Covered by the
Foregoing Report
1801 K Street, N.W.WASHINGTON, D.C. 20006
JULY 29, 1981
ToINTERNATIONAL DEVELOPMENT ASSOCIATIONWASHINGTON, D.C.
We have examined the accompanying financial statements Statement of Condition . . .......... Appendix A(Appendices A through F) of International Development Associa- Stion as of June 30, 1981 and 1980 and for the years then ended. Statement ot Income . . Appendix BOur examinations of these statements were made in accordance Statement of Transferswith generally accepted auditing standards and accordingly in- from International Bank forcluded such tests of the accounting records and such other audit- Reconstruction and Development . .... Appendix Bing procedures as we considered necessary in the circumstances.
Statement of Changes in ResourcesAs described in the Summary of Significant Accounting and Available for Commitment. . .... Appendix CRelated Policies in the notes to these financial statements,management believes that it would be consistent with General Summary Statement ofCounsel's opinion with respect to the valuation of certain of the Development Credits. . .... Appendix DAssociation's subscriptions and supplementary resources, to also Statement of Voting Power,substitute the special drawing right (SDR) for the 1960 dollar as and Subscriptions andthe measure of the development credit repayment obligations of Supplementary Resources ..... Appendix Ethe Association's borrowers. However this would require approvalof the Executive Directors and involve other changes in the Notes to Financial Statements ..... Appendix Fdevelopment credit agreements. Accordingly, until these eventshave occurred, the repayment obligations will not be revalued.
In our opinion, subject to the effects, if any, which may result uponthe resolution of the matter referred to in the preceding para-graph, the financial statements examined by us present fairly, interms of United States currency, the financial position of Interna-tional Development Association as of June 30, 1981 and 1980, theresults of its operations and changes in resources available forcommitment for the years then ended, in conformity with generallyaccepted accounting principles consistently applied.
PRICE WATERHOUSE & CO.


185
Bank/IDAAppendices
Page1 Bank and IDA Cumulative Lending Operations, by Major
Purpose and Region, June 30, 1981 ......... ................ 1862 Bank and IDA Cumulative Lending Operations, by Borrower
or Guarantor, June 30, 1981 ........... ................... 1883 Statement of Loans Approved during Fiscal Year 1981 ........ . . . 191
4 Statement of Development Credits Approved during FiscalYear 1981 ... ................ .1......... .. .......... .196
5 Budgets of the Bank and IDA .......................... . 2006 Governors and Alternates of the Bank and IDA .............. . . 2027 Executive Directors and Alternates of the Bank and IDA ........ . 2058 Officers and Department Directors of the Bank and IDA ........ . 2069 World Bank Offices ............................... 208

186 Bank/IDA Appendices
Bank and IDA Cumulative LendingOperations, by Major Purposeand Region, June 30, 1981Expressed in United States dollars (in millions)
Bank loans to borrowers, by region I
Europe,East Middle LatinAsia East, and America
Eastern Western and South North and thePurpose2 Africa Africa Pacific Asia Africa Caribbean Total
AGRICULTURE AND RURAL DEVELOPMENTAgricultural credit 30.0 3.5 256.5 - 997.5 706.4 1,993.9Agriculture sector loan 5.6 ................... 9.0 4.3 26.3 2.3 22.7 70.2Agroindustry -......................... - 95.8 - 535.9 292.8 924.5Area development 155.5 604.9 880.0 197.0 405.0 915.6 3,158.0Fisheries -............................ - 45.8 14.0 48.0 16.2 124.0Forestry .............................. 48.5 49.0 8.5 - 186.0 22.0 314.0Irrigation and drainage 7 8 .2.............. .78.2 32.0 2,050.5 179.0 1,427.5 1,216.3 4,983.5Livestock 11.8 .... ....................... . 32.6 48.0 10.0 197.0 957.0 1,256.4Perennial crops 57.4 354.5 394.5 - 108.0 89.0 1,003.4Research and extension - - 259.0 25.0 12.7 259.0 555.7Total . .387.0 1085.5 4,042.9 451.3 3,919.9 4,497.0 14,383.6
DEVELOPMENT FINANCE COMPANIES . ...... 226.0 113.2 1,786.0 926.2 2,417.0 1,559.5 7,027.9EDUCATION 137.1 155.6 835.2 - 867.0 478.1 2,473.0ENERGYOil, gas, and coal ...................... .20.0 5.0 183.9 683.7 436.9 111.3 1,440.8Power 7 4 7 .0........................ 747.0 471.0 2,984.5 522.7 2,500.7 5,868.5 13,094.4Total 767.0 476.0 3,168.4 1,206.4 2,937.6 5,979.8 14,535.2
INDUSTRYEngineering ...........................- - 10.0 - 11.0 - 21.0Fertilizer and other chemicals ............. - 19.3 193.9 481.0 328.3 583.5 1,606.0Industry sector loan ................... - 0.6 272.4 - 646.4 97.5 1,016.9Iron and steel -......................... - - 189.0 347.5 667.0 1,203.5Mining, other extractive .................. 137.5 191.0 - - 158.3 228.0 714.8Paper and pulp 30.0 - - 4.2 204.0 20.0 258.2Textiles 63.0 .- - - 272.6 - 335.6
Total 230.5 210.9 476.3 674.2 1,968.1 1,596.0 5,156.0
NONPROJECT .3 1 .. ........... .312.0 110.0 701.5 - 1,819.6 362.0 3,305.1POPULATION, HEALTH, AND NUTRITION - - 149.5 - 29.0 60.8 239.3SMALL-SCALE ENTERPRISES . - - 99.7 165.8 - 206.0 361.5 833.0TECHNICAL ASSISTANCE .... 1.0 47.0 13.0 - 4.3 25.8 91.1TELECOMMUNICATIONS .12................... . 54.3 231.3 227.5 235.8 393.3 1,263.8TOURISM 1 7 .0......................... 17.0 37.5 25.0 - 96.6 187.5 363.6TRANSPORTATIONAirlines and airports 49.0.................... . 10.0 9.2 5.6 7.0 218.5 299.3Highways 3 4 5 .7...................... 345.7 621.7 1,711.1 39.9 1,727.6 2,565.1 7,011.1Pipelines -............................ - - 37.0 57.5 23.3 117.8Ports and waterways 84................... . 172.3 525.3 109.8 1,006.3 254.6 2,153.2Railways 4 5 0 .2...................... 450.2 164.5 748.4 555.1 742.5 1,261.5 3,922.2Transportation sector oan ... 28.0 25.0 53.0 - 12.0 44.0 162.0
Total 957.8 993.5 3,047.0 747.4 3,552.9 4,367.0 13,665.6
URBANIZATION 76.0 61.8 576.1 25.0 147.0 710.5 1,596.4WATER SUPPLY AND SEWERAGE ............. 127.0 185.5 569.1 - 862 G 1,472.7 3,216.7
GRAND TOTAL ........................ 3,360.0 3,630.5 15,787.1 4,258.0 19,063.2 22,051.5 68,150.3
Except for the total shown in footnote 4, no accourt is taken of cancel at ons and refundings subsequent to origiral comm tment. Amounts ofcancellations and refund ngs are shown by country and purpose ir the Statements of Loans and of Deve opment Cred ts, wh ch are availab e onrequest. Bank loans of $650 million to FC are exc uded.
2 COeraticns have been c ass fied by the roano purpose they finarce. Many projects include activity n more than one sector of subsector.

U2' at
2 '
�'o U (00 0 00 02 N) at - -D.�--- 0. oN) 4).-�
(0 -40 00 C-.00(0 0 �0102C�C�0 01 NCCr 0 01-0. 00 N) N)0100002N)0201.-.02 �¾0� O-� -� 0 C-.01 02 C') CO (0 -� N) 01 -� N) N) COON) 02 0 00 01 N) 01000C-.N)01CO(002
(Dan � - 01 C') 00 N) -. 0 002(00001 01 0001 0102 N) N) OC 00 OC.- 0) fl002' CC
3�023
*3t-� N)-1-02' - N) 0 - - - C�C)050 r� C') -aN) 01 N)-a -', a-a C') C') 00 020 CC'.C 02 C')0C')(0 N) N)
2' 01 C-CO 0 (DC') (001 -a.a01N) 0 01 01 N) 001 -0.-a - .- OOCOa-.0 -a02
0 (ON) (0�COC'jOO 0C-�001I0 01 I 01 0N)01 (00 C-I01OCDCOC')0101-a oo
0002'02'5�at� 3
3 at 2'- - - N) - N) - 0)
0'0 C � � 00 -0.- N) C-C--N)0100 (0 C') - (0N) 01 002'N) 0(0 02 00 )
>m02 0 0 (0 0 02 N) 010202 01 I 01 02 .0. N) 02 0 01 0 0 (0 00 � 0 0)
005 �, i,j �, I I I 00 0.01 �-. 00002 N) 0 C') 010 ��0.0)0- a 0(0 .0. 000001 C') 0 0 * -
U�
tm-U 0
a 2' o
5003C 0
N) '� 01 N) - 0.0 02N) N) 0,-. N) 0 -�-N) 00 00 (0 COC-. -'N) N) (0 .- a- 01(0-N) CA
2'- 0 01 02a (0 (00000 CO 024t,-.40(0 (0 - CO 0 01'-' 00 N) N)(0(0.0.00010-401(0 >0
0(0-a 0100.a(0 (0 .a(00100102 02 -ii I i��" � � 00S a 0 0 -0. 0 0. 01 N) (0 10. N) N) 01 01 N) 02 0 0 0 01 01 0 0 02 01 -< 0 0 (0 0 C- � a
00.2' (Clao� C
.-�2' 0to-'. C,300. m
000-(D N) L0
CC - N) N) N) 0 (0 _ � '0oCt 0 - - -at 0 (0 N) 0 (0 N) a 00 (0(0 -0. - N) (0 (001 N) (0 C-' .� (0 002 '2' �'o � 0.05
-o o N)(0 00 I 00(01 CON) 00(002 N) (001 -4 -4 00* C') -0.20 0CC') C�- 01(0011 00(0(0 02- -'(0 (0 I 01021 '-01 010(0(0020 - 01 I I 0i (0 (00 (00 N) I 00101 C-00 N) 0)0.CD- -.
00. 0
V�-t Y
1=0)>
3�(.4 01 - - -- -m
aS CCC 01 01 - N) N) a-CC-. -aN) 01 000 (00 N)
0200-N N) 10002 I CO N) .- )� -. C� CO N) 02 COo -a CCC-.C001
N) * C'-'
C�o 0 020 (0 I 001(0 I I I I 0 011 1011 I I I OOO 020) -. 4 I 2.40101 00 I 01 000)00.�,-a0
00-. 00 U-a� o5> 'C:-� - - C-. - - - C-.
U 0 0 -0. 0 (0 (0 (0 N) N) 02 0 (0 0 01 N) -a 0 .0. 01 N)N)C-0102C-'01
9.2' 01 - N) (0 01 00 02 - - CO (0 00 N) CO 01 -a N) (0 (0 - -a CO N) 01 N) (0 01 N) 02 (0 0 00(000 000020 - 02 0 00 (0 02 -1- 0 02 02 - (0 N) -0. 02 (0 0 N) 0 00 N) 0 02 .0. - (0 02 02 - 01 01 02 0 0 -
(0 01 0 01 01 C� (0 (001 000 00C�'-� 00 000 -. 4 - 0 Cc 0 C') -. 4 & !- �-a a� 02C- -0.020 0 _ P3�C0
- - - �-
0= N) -aN) 0 01N) CO N) - 01 02 C-ON) 0 01a-(00(000 CO -a- (0CC N) N) 0 - N) 0 01 - (0 (0 -0. - N) 0 01 CCC N) (0 N) 0 N) 0 01 (0 02 02 00 01 CC 01 0 - 01 N) 0 01 N) 01 0.0 2' 0 (0 N) OC-Oa--.---N).-- 01 (000 01 N) 02 0 02 (0 -0. 0 (0 N) - N) (0 (0N) (0 CO 02 01 00 (001 -a (0 -a 02- -I
0 N) (0 01 CO CO 0 CO 01 0010 01(00 01 N) 0 0. (001 CO - 01 0 -0. N) 0 N) 0 N) -a (0(0 01 0 -0. - 0N)N)C--0101C--' 00CC-CO (001000-aN) CO 02N)000102C-'0 N) -aoo oN) Cr .4o,boo,a-aoN)(0 _

188 Bank/IDA Appendices
Bank and IDA Cumulative LendingOperations, by Borrower or Guarantor,June 30, 1981Expressed in United States dollars (in millions)
Bank loans IDA credits TotalNumber I Amount Number I Amount Number 1 Amount
Afghanistan ...... ................. - $ - 20 $ 230.1 20 $ 230.1Algeria ............... ............ 25 1,201.0 - 25 1,201.0Argentina .............................. 19 1,418.3 - 19 1,418.3Australia ............................ 7 417.7 - 7 41 7.7Austria .. ... ......... .... .. .. 9 106.4 - 9 106.4
Bahamas .............................. 2 17.0 - 2 17.0Bangladesh 2 ........ .. 1 46.1 72 1,788.2 73 1,834.3Barbados .............................. 4 33.0 - - 4 33.0Belgium ............................... 4 76.0 - 4 76.0Benin ................................. - - 14 129.4 14 129.4
Bolivia ............................... 14 299.3 14 104.8 28 404.1Botswana .............................. 11 123.7 6 15.8 17 139.5Brazil ............................... 104 6,157.7 - -- - 104 6,157.7Burma ............................... 3 33.4 17 418.0 20 451.4Burundi .... .......................... 1 4.8 18 141.2 19 146.0
Cameroon .............................. 24 350.3 15 253.0 39 603.3Caribbean Region n ...... ............... 2 43.0 - 7.0 2 50.0Central African Republic .. ................... - - 6 39.8 6 39.8Chad 4 . .. .... . .... ..... ... - - 13 78.5 13 78.5Chile ............................... 26 477.2 - 19.0 26 496.2
China 1............................... 100.0 - 100.0 1 200.0Colombia ....... ...................... 92 3,311.4 - 19.5 92 3,330.9Comoros .. .. ........................ - - 2 10.2 2 10.2Congo, People's Republic of the ............... 3 76.0 7 57.6 10 133.6Costa Rica ............................. 27 382.2 - 5.5 27 38 7.7
Cyprus ............................... 18 157.6 - 18 157.6Denmark .............................. 3 85.0 - 3 85.0Dominican Republic ............ .......... 12 260.0 3 22.0 15 282.0East African Community 5 ................... 10 244.8 - 10 244.8Ecuador .......................... .. 27 425.1 5 36.9 32 462.0
Egypt, Arab Republic of ............ ........ 26 1,214.0 26 981.2 52 2,195.2El Salvador ............................. 18 216.1 2 25.6 20 241.7Equatorial Guinea ........................ - - 1 2.0 1 2.0Ethiopia .............................. 12 108.6 26 443.1 38 551.7Fiji ............................... 8 83.7 - - 8 83.7
Finland ............................... 18 316.8 - - 18 316.8France . ...................... 1 250.0 - 1 250.0Gabon I ............................... 6 69.3 - -- 6 69.3Gambia, The ...... .................. - - 8 27.4 8 27.4Ghana 7 , 9 207.0 15 208.0 24 415.0
Greece ............................... 17 490.8 - _ 17 490.8Guatemala ............................. 12 277.5 - _ 12 277.5Guinea ............................... 3 75.2 9 112.0 12 187.2Guinea-Bissau ...... ................ - - 2 15.8 2 15.8Guyana ............................... 12 80.0 3 36.5 15 116.5
Haiti ............................... 1 2.6 13 131.2 14 133.8Honduras ... .......................... 24 409.0 5 83.2 29 492.2Iceland ............................... 10 47.1 - - 10 47.1India ............................... 61 3,200.6 137 9,566.2 198 12,766.8Indonesia ............................. 57 3,729.0 46 931.8 103 4,660.8

Bank! DA Appendices 189
Appendix 2
Bank loans [DA credits Total
Number I Amount Number I Amount Number I Amount
Iran ...... ........ ... 33 $1,210.7 - $33 $ 1 210.1Iraq.... ......... . . . 6 156.2 - 6 156.2Ireland . .... ...... ..... 8 152.5 8 152.5Israe[ ..... ..... 11 284.5 - - 1 284.5Italy . . . . . ......... 8 399.6 8 399.6
Ivory Coast ............... 34 681 6 1 7 5 35 689.1Jarnaca ... ..... ....... . 25 344.0 - .- 25 344.0Japan ........... ..... 31 862.9 - .3 1 862.9Jordan . ... ........ .. . 6 125.0 15 85.3 2 1 210.3Kenya . . .. ....... ..... 37 8 72.3 25 458.3 62 1,330.6
Korea, Republic of. ......... 56 3,338.5 6 110.8 62 3,449.3Lao People's Democratic Republic . ...... - 3 32.0 3 32.0Lebanon ............. ... 4 116.6 - 4 1 16 6Lesotho.. ............. -- 12 2 02 12 20.2Liberia ................. 20 136.0 7 48.0 27 184.0
Luxembourg ...... ..... 1 12.0 - 1 12 0Madagascar .. ... .. ..... 5 32.9 20 300.5 25 333 4Malawi . . . ........ 5 75.2 22 257 8 27 333 0Malaysia . ................ 52 1,314.6 -- 52 1,314.6Maldives .... .. . ........... - 1 3.2 1 3.2
Madi'8................ 1.9 20 193.9 20 195 8Malta .......... ... . .. 1 7 5 _ 1 1.5Mauritania .. ..... .... 2 126.0 11 61.5 13 187 5Mauritius . . . ........... 12 110.3 4 20.2 16 130 5Mexico ................. 69 5,194.6 -- 69 5,19L 6
Morocco . . ......... ..... 45 1,660.3 3 50 8 48 1,711 1Nepal .. . . ............ -- - 26 297 9 26 2397 9Netherlands ................ 8 244. - - 8 244.0New Zealando . ........... 6 126.8 - - 6 126 8Nicaragua ... . .... ....... 26 217.6 4 60.0 30 227 6
Niger . ........ ....... - - 16 158.4 16 158 4Nigeria ............ . . 44 1,701.7 2 35.5 46 1,73 7 2Norway ... .. ........ ... 6 145.0 __- 6 145.0Oman ................. 5 47.0 - 5 4 7.0Pakistan . .......... ... . 38 884.0 52 1.446 9 90 2 3323.9
Panamra................. 23 361.7 - - 23 361.7Papua New Guinea ............. 9 94.0 8 108.2 17 202.2Paraguay . . .............. 21 288.7 6 45 5 27 334.2Peru . .. . .. ...... 43 956.0 - - 43 956.0Philippines ................ 75 2,922.9 3 122.2 78 3,045.1
Portugal . ............ . 19 695.5 -.- _ 19 695.5Rhodesia ........ ..... . .. 5 87.0 __- 5 87.0Rornan a . . .......... . 30 1,862.8 - - 30 1 862.8
Rwanda ... .. ..-... 15 13 2.2 15 132.2Senegal 4I .......a........ 19 164.9 23 234.8 42 399.7
Sierra Leone ............. .. 4 18.7 8 64.3 12 83 0Singapore ... ... ..... . .... 14 181.3 - 14 181.3Solomon Islands ....... ...... - 1 1.5 1 1.5Somal a ........... ... .. - 22 157.4 22 157.4South Africa ........ ...... 11 241.8 --. 11 241 8
(continued)
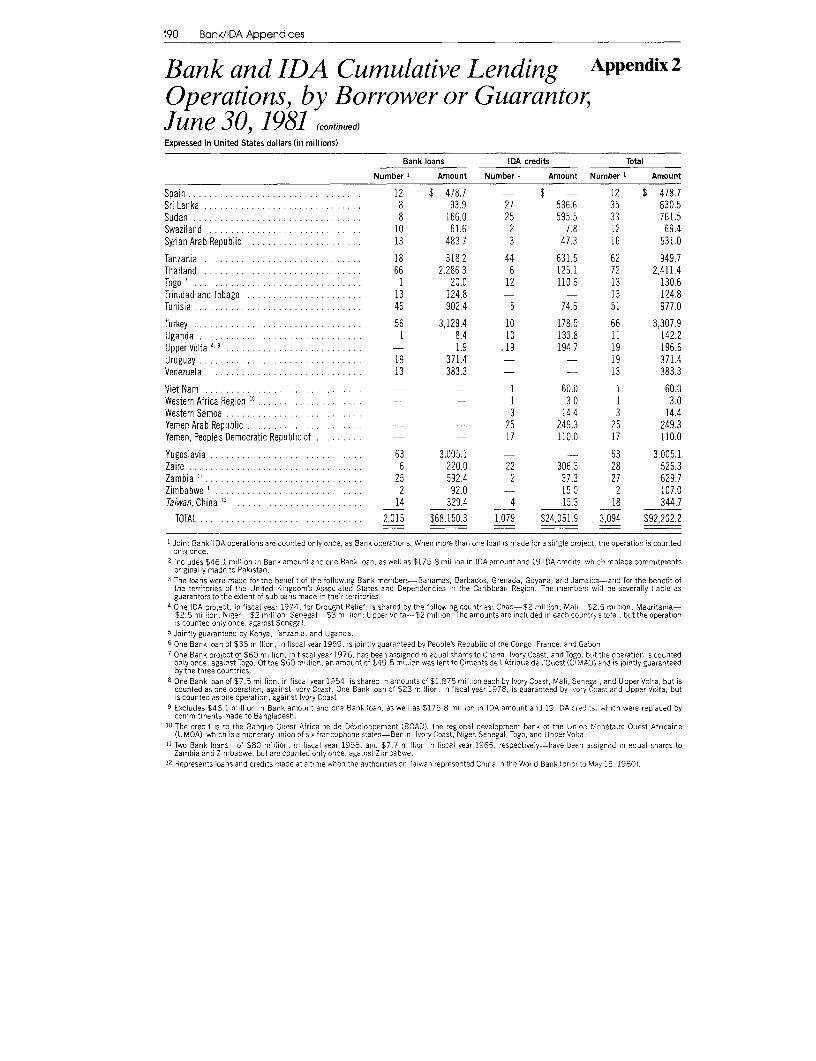
190 Bank/lDA Appendices
Bank and IDA Cumulative Lending Appendix 2
Operations, by Borrower or Guarantor,June 30, 1981 (continued)
Expressed in United States dollars (in millions)
Bank loans IDA credits Total
Number 1 Amount Number I Amount Number 1 Amount
Spain .............................. 12 $ 478.7 - $ - 12 $ 478.7Sri Lanka .............................. 8 93.9 27 536.6 35 630.5Sudan ....... 8 166.0 25 595.5 33 761.5Swaziland ............................. 10 61.6 2 7.8 12 69.4Syrian Arab Republic .......... . 13 483.7 3 47.3 16 531.0
Tanzania ............................ 18 318.2 44 631.5 62 949.7Thailand .. ........................... 66 2,286.3 6 125.1 72 2,411.4Togo 7 .............a........ .... 1 20.0 12 110.6 13 130.6Trinidad and Tobago ......... .......... 13 124.8 - - 13 124.8Tunisia .............................. 46 902.4 5 74.6 51 977.0
Turkey .............................. 56 3,129.4 10 178.5 66 3,307.9Uganda .............................. 1 8.4 10 133.8 11 142.2Upper Volta I I.. ...... - 1.9 .19 194.7 19 196.6Uruguay .. 19 371.4 - - 19 371.4Venezuela .............................. 13 383.3 - - 13 383.3Viet Nam .............................. - 1 60.0 1 60.0Western Africa Region ' .................... - - 1 3.0 1 3.0Western Samoa ......................... - - 3 14.4 3 14.4Yemen Arab Republic ............ .......... - - 25 249.3 25 249.3Yemen, People's Democratic Republic of .... .... - - 17 110.0 17 110.0
Yugoslavia ............................. 63 3,005.1 - - 63 3,005.1Zaire . .......................... 6 220.0 22 306.3 28 526.3Zambia ........................... 25 592.4 2 37.3 27 629.7Zimbabwe 1 . ....................... 2 92.0 - 15.0 2 107.0Taiwan, China 12 ......................... 14 329.4 4 15.3 18 344.7
TOTAL .. .......................... 2,015 $68,150.3 1,079 $24,051.9 3,094 $92,202.2
Jo nt Bank. IDA operations are courted only once, as Bank operations. When more than ore loan is made for a single project, the operation is countedonly orce.
2 Includes $46.1 m lion in Bark amount and ore Bank loan, as we I as $175. 0 il ior in IDAamountand 19 IDAcredits, whizh replace commitmentsoriginally made to Pakistan.
3 The loans were made for the benef t of the fo lcwing Bank members-Banamas, Barbados, Grenada, Guyara, and Jamaica-and for the benefit ofthe territories of the United Kingdom's Assoc ated States and Deperdencies n the Caribbean Region. The members wi1l be severa ly liable asguarantors to the extent of subloans made ir their territories.
a One IDA project, in fiscal year 1974, for Drought Relief, is shared by the following countries: Chad-$2 million; Mal -$2.5 milion; Mauritania-$2.5 million; N ger-$2 million; Senega -$3 m lion; Upper Volta-$2 mil ion. The amounts are included in each countrys tota , but the operations counted on,y once, against Senegal.
I Jointly guaranteed by Kenya, Tanzania, and Uganda.6One Bank loan of $35 m Illor, in fiscal year 1959, is jo nt y guararteed by People's Republic of the Congo, France, and Gabon.
DOne Bank project of $60 mi lion, in fisca year 1976, has been assigned in equa shares to Ghana, Ivory Coast, and Togo, but the operation is countedonly once, againstTogo. Of the $60 m llion, an amount of $49.5 millor was lentto Cimentsde 1'Afriquede l'Ouest(C IMAO) and is jointly guaranteedbythe three countries.
8One Bank oan of $7.5 mi lion, in f sca year 1954, is shared ir amounts of $10875 mi lion each by Ivory Coast, Mal , Senega , and UpperVolta, but iscounted as ore operation, aga nst vory Coast. One Bank loan of $23 mill on, n fiscal year 1978, is guararteed by vo'y Coast and Upper Volta, buts counted as one operatior, against Ivory Coast.
IExcludes $46.1 million in Bank amourt and one Bank loan, as we I as $175.8 mil ion in IDA amount and 19 DA zred ts. which were replaced bycomm tments made to Bang adesh.
10 The credit is to the Banque Duest Africaine de Developpement (BCAD), the regional development bank of the Union Mcnetaire Ouest Africaine(UMOA), which s a monetary union ofs x frarcopyone states-Ben n, voryCoast, Niger, Senegal, Togo, and UpperVolta.
11 Two Bank loans-of $80 mill on, in f scal year 1956, and $7.7 million n fiscal year 1965, respectively-have been ass gned in equa shares toZambia and Z mbabwe, but are counted on y once. agairst Zimbabwe.
12 Represents loans and credits made at a time when the authorities on Ta wan represented Ch na in the World Bank (prior to May 15, 1980).

Bank/IDA Appendices 191
Statement of Loans Approved Appendix 3
during Fiscal Year 1981July 1, 1980-June 30, 1981Expressed in United States dollars (in millions)
Guarantor Date of Interest PrincipalPurpose and borrower approval Maturities rate amount
AlgeriaTransportation: Fourth Highway ................. ........ Jul. 8. 1980 1985/1997 8.25% $ 110.0
ArgentinaEducation: Vocational Training and Technical Education .Oct. 7,1980 1984/1995 9.25% 58.0Energy: Cca Exploration .Dec. 9,1980 1985/1990 9.25% 10.0
BahamasEducation: Vocational and Technical Education .Mar. 26, 1981 1984-1996 9.60% 7.0
Barbados (Guarantor)Energy: Electric Power-Barbados Light and Power Company, Limited . . . Jan. 6, 1981 1984/1996 9.25% 6.0
BotswanaTransportation: Fifth Road .Jan. 6,1981 1985/1997 9.25% 17.0
BrazilAgriculture and Rural Development: Second Ceara Rural Development .... Dec. 2, 1980 1984/1995 9.25% 56.0Industry: Alcohol and Biomass Energy Development .May 12. 1981 1984/1996 9.60% 250.0Agriculture and Rural Development. Piaui Rural Development .Jun. 16, 1981 1985/1996 9.60% 29.0
Brazil (Guarantor)Energy: ELETROSUL Second Power Transmission-Centrais Eletricasdo Sul do Brasil, S.A .Jul. 22, 1980 1984/1995 8.25% 125 0
Energy: Electric Power System Coordination-Centrais EletricasBrasileiras, S.A .Dec. 23, 1980 1984/1996 9.25% 54.0
Urbanization: Third Urban Transport-Empresa Brasileira dos TransportesUrbanos .Mar. 31, 1981 1984/1996 9.60% 90.0
Water Supply and Sewerage. Banco Nacional da Habitag,o .Apr 21, 1981 1984/1996 9.60% 180.0Agriculture and Rural Development: Second Agricultural Research-Empresa Brasileira de Pesquisa Agropecuaria Jun. 16, 1981 1985/1996 9.60% 60.0
CameroonAgriculture and Rural Development: Northern Province Rural Development . Nov 18, 1980 1986/2001 9.25% 25.0Small-Scale Enterprises: Second Artisans and Small and Medium-ScaleEnterprise .Nov. 18. 1980 1984/1996 9.25% 15.0
ChileAgriculture and Rural Development: Second Agricultural Credit .Sep. 9, 1980 1984/1995 9.25% 36.0Transportation. Highway Reconstruction . ......... . ............ . Dec. 9, 1980 1984/1996 9.25% 42.0
ChinaEducation University Development.. Jun. 23, 1981 1987/2001 9.60% 100.0
Colombia (Guarantor)Energy: Playas Hydro Power-Empresas Publicas de Medellin .Mar. 3,1981 1985/1998 9.60% 85.0Transportation: Rural Roads-Fondo Nacional de Caminos Vecinales . . . Mar 31, 1981 1985/1998 9.60% 33.0Agriculture and Rural Development: First Irrigation Rehabilitation-Instituto Colombiano de Hidrologia. Meteorologia y Adecuacidn de Tierras May 19, 1981 1986/1998 9.60% 37.0
Energy: Village Electrification-Corporacion Electrica de la CostaAtlantica ... ................................. ....... .May 21, 1981 1985/1998 9 .60% 36.0
Energy: Guavio Hydro Power-Empresa de Energia Electrica de Bogota . May 28, 1981 1986/1998 9.60% 359.0
Costa RicaEnergy Petroleum Sector Technical Assistance . Jun. 23, 1981 1984/1996 9.60% 3.0
Costa Rica (Guarantor)Water Supply and Sewerage: San Jose Water Supply-InstitutoCostarricense de Acueductos y Alcantarillados .Dec. 23, 1980 1984/1995 9.25% 26.0
CyprusAgriculture and Rural Development: Fruit and Vegetable Export May 12, 1981 1984/1996 9.60% 14.0
Dominican RepublicAgriculture and Rural Development: Cocoa and Coffee Development Jun. 23, 1981 1986/1998 9.60% 24.0
EcuadorAgriculture and Rural Development: Puerto Ila-Chone Rural Development May 12, 1981 1985/1998 9.60% 20.0
Egypt, Arab Republic of (Guarantor)Energy: Western Desert Petroleum Exploration-General PetroleumCompany .Dec. 9,1980 1985/2000 9.25% 25.0
Industry. Egyptian Iron and Steel Company Rehabilitation-HADISOLB . . . May 26, 1981 1986/1996 9.60% 64.0(continued)

192 Bank/IDA Appendices
Statement of Loans Approvedduring Fiscal Year 1981 (continued)
July 1, 1980-June 30, 1981Expressed in United States dollars (in millions)
Guarantor Date of Interest PrincipalPurpose and borrower approval Maturities rate amount
FijiNorproject. Cyclone Reconstructior ............ ............ Nov. 25, 1980 1984 1996 9.25% $ 18.0
GuyanaEnergy: Technical Assistance for Power Development ............. Oct. 7. 1980 1985/1990 9.25% 8.0Norproject Structural Adjustment ........................... Feb. 3 1981 1986/2001 9.25% 14.0Technical Assistance: Second Technical Assistance .. ............. Feb. 3, 1981 1986.2001 9.25% 1.5
HondurasTransportatior: Eighth Highway .......... .................... Aug. 261980 1986/2000 9.25% 28.0
IndiaAgriculture and Rurai Development: Kandi Watershed and Area
Development ....... i.................................. Jul. 22, 1980 1986;2333 8.25% 30.0Energy: Second Bombay High Offshore Development ................ Dec. 9,1980 1986/2011 9.25% 400.0
IndonesiaAgriculture and Rural Development: Smallholder Coconut Development . . Aug. 8, 1980 1986/2000 9.25% 46.0Educatior: University Development .Sep ...................... Se p16, 1980 1986/2000 9.25% 45.0Energy: Tenth Power ...................................... Feb. 24, 1981 1986/2001 9.60% 250.0Agriculture and Rural Development: Swamp Reclamation ......... . . . . . Mar 19, 1981 1986/200' 9.60% 22.0Urbanization: Fourth Urban Development . ............... . . . . . . . . Apr. 21. 1981 1986.200' 9.60% 43.0Agriculture and RLral Development: Fifth Nucleus Estates andSmalIholders ..... .......... ...... . . ... ....... ... . . May 28, 1981 1986,2001 9.60% 161.0
Small-Scale Enterprises: Second Small Enterprise Development ....... . Jun. 2,1981 1986.2001 9.60% 106.0
Ivory CoastTransportation: Highway Sector ..... . . . . . . . . .Nov. 4. 1980 1985.,1997 9.25% 100.0
Ivory Coast (Guarantor)Energy: First Power Energie Electrique de la Cote d'lvoire . ........ . . Jul. 22, 1980 1985/1997 8.25% 33.0
JamaicaDevelopment Finance Companies: Second Export Development Fund .... . Apr. 30, 1981 1986/1398 9.60% 37.0
Jamaica (Guarantor)Energy: Petroleur Exploration--Petroieum Corporation of Jamaica .... . . Jun. 16, 1981 1986/1998 9.60% 7.5
JordanUrbanizat on Urban Development ...... . . . ....... . . .. Jul. 15, 1980 1985:i'997 8.25% 21.0Energy: FoLrth Power .......... ...................... May 7, 1981 1985/ 1998 9.60% 25.0
KenyaTransportat on: Ra lway . ....... . ........... ....... ...... .. Apr 23, 1981 1986/2001 9.60% 58.0Agriculture ard Rural Development: Fourth Agricultural Credit .. May 19, 1981 19871/2001 9.60% 25.0
Korea, Republic ofAgriculture and RLral Deve opment: Third Agricultural Credit ....... . . . Apr. 23, 1981 1984/1996 9.60% 50.0Urbanization: National Urban Land Development and Housing ...... . . . Apr 30, 1981 1984/,1995 9.60% 90.0
Korea, Republic of (Guarantor)Development Finance Comparies: Korea Long-Term Credit Bank .... . . Dec. 23, 1980 1984/1995 9.25% 90.0Devetopment Finance Companies: Fourtn Korea Development Bank ... . . . Dec. 23, 1980 1984,:l995 9.25% 100.0Developrent Finance Companies: Fourtn Small and Medium Industry Bank May 26, 1981 1984/1996 9.60% 60.0
LiberiaEnergy: Petro eum Exploration Promotion ........ . ............. Oct. 7, 1980 1986/2300 9.25% 5.0
MalawiNonproject: Structural Adjustment .J.o........... . ............. Jun. 25, 1981 1986/2012 9.60% 45.0Technical Assistance ........... .. ....... ... .......... . J.o. . . Jun. 25, 1981 1986.2201 9.60% 1.0
MalaysiaAgriculture and Rural Development Kelantan Land SchemesRehabilitat on .Aug. 26, 1980 19851597 9.25% 25.0
Agriculture and Rural Development: Rural Credit . Aug. 26, 1980 1985.1397 9.25% 30.0Agriculture and Rural Development. Rompir-Endau Area Development . . Mar. 19, 1981 1985/1998 9.60% 40.0Agriculture and Rural Development. Trans-Perak Area Development .. . Mar 26, 1981 1985!1998 9.60% 50.0Agriculture and Rural Deve opmenet: First Federal Land Consolidation andRehabilitat or Authority . . ...... .. . . . .J.o........ ........... Jun. 16, 1981 19861/1998 9.60% 37.0

Bank/IDA Appendices 193
Appendix 3
Guarantor Date of Interest PrincipalPurpose and borrower approval Maturities rate amount
MauritiusUrbanization: Urban Rehabi itation and Development ... .......... Dec 9,1980 1985/ 1998 9.259% 5 15.0Nonproiec. Structural Adjustment ...... i... .. . ..... . Jun 2,1981 1985/1998 9.60%V 15.0
Mexico (Guarantor)Agrculture and Rural Development: Seventh Agncultural Credit-Nac onal Fnanciera, S.A ........ .......... . . ...... Jul. 8, 1980 1985/1997 8 25% 325.0
Agriculture and Rural Developrment. Ocoron I rr[gation-Nacional F[nanciera, S.A .c. . . . . ............ . ct. 14. 1980 1984/1995 9.25% 23 0
Water Supply and Sewerage: Second Med um-Size Cities Water Supplyand Sewerage-Barco Nacional de Obras y Sevicios Publicos. S.A. Nev. 4, 1980 1984/1995 9.25% 125 0
Transportation. Fourth Railway--Banco Nacional de Obras y ServiciosPubicos, S.A ... .. ....... . .. . .... .. . .. . . . . Dec. 16, 1980 1984/1995 9.25% 150 0
Agriculture and Rural Development: Ranfed Agricultural Development-Nacional Financiera, S.A .. .......... . .. . .. . . . Jan. 22, 1981 1984/1996 9 25% 280.0
Transportation: Port Developmrent Preparation-Banco Nacional Pescluero yPortuarin. S.A. ...... . . . . ... I . . . Mar. 26, 1981 1985/1996 9 60% 14 0
Urbanization: Second Urban and Regional Development-Banco Nacionalde ebras y Servicios P6blicos, S A .... . . . . . .... May 12, 1981 1984/1996 9 60% 164.0
MoroccoUrbanizat on: Second Urban Development . . . .n...... . . . . Jan. 22, 1981 1985 1998 9.25% 36 0Water Supply and Sewerage. Third Water Supo . . . . . .. May 28, 1981 1985/ 1998 9.60% 87 0
Morocco (Guarantor)Development Finance Companies: Fourth Hotel Development-CriditInmobi ier et Hotelier ........... ... .. .......... Jan 22, 1981 1985/1998 9.25% 100.0
NicaraguaDevelopmrent Finance Companies: Industrial Rehailitation Credit ..... .h Jun. 25, 1981 1987/2001 9.60% 30.0
Nicaragua (Guarantor)Water Supply and Sewerage: Managua Water Sunply EngineeringInstitutoeNicaraguense de Acueductos y Alcantarillados . .. . . .. Apr 30, 1981 1987/2001 960% 3.7
NigeriaAgriculture and Rural Development. Bauchi State AgriculturalDevelopment .. Apr 30, 1981 1986/2001 9 0% 132 0
Agricu:ture and Rural Development. Kano Agricultural Development . . . Apr. 30, 1981 1986/2001 9 60%1 142.0Technica Assistance Agricultural Technical Assistance .Jun. 30, 1981 1986/2001 9.609% 47 0
PanamaEnergy. Energy Planning and Petro eurm Exploration Promotion . . . Mar 17, 1981 1985 1998 9 6000 6 5Transportation: Road Rehabilitation .Jun. 23, 1981 1986 1998 9 60.% 19 0
Panama (Guarantor)Deve opment Finance Comparies: Second Development Banking
Corporacidn F nanciera Nac[onal. . . . . . . Mar 19, 1981 1984, 1996 9 60% 20 0Papua New GuineaEducation Primary Education .Dec 23, 1980 1986r2000 9 25% 6.0
ParaguayAgriculture and Rural Development LuvestocK Deveopment Apr 30. 1981 1985/1998 9.60%b 300Educat;on. Rural Primary Education .. . May 12, 1981 1985/1998 9 60%" 17.0Water Supply and Sewerage: Second Rural '/1ater SUPDIY and Sanitation . . . Jun. 16, 1981 1986/1998 9.60% 11 8
Peru (Guarantor)Industry. Emrorsa Sidorirgica del PerdJ . . ....... ... ....... Jul. 15, 1980 1984/1990 8 25% 5.OTransportation Aviation Development Corporacidn Peruara deAeropuertos y Aviaci6r Comercial .Mar 26, 1981 1995:1998 960% 580
Deve opment Fnance Companies. Second Industrial Credit-Corporaci6n Financiera de Desarrollo .A.p.r.... . . ..... Apr 7, 1981 1986 1998 9 609. 60 0
Energy: Power Eng(neering Empresa de Electricidad del Peru, S.A. . Jun. 23, 1981 1986, 1998 9.60e% 25 0PhilippinesAgriculture ard Rural Development Watershed Management and
Eros[on Control ...... ....... . . Jul. 8, 1980 1986i2000 8.25% 38.0Agriculture ard Rural Development Third Livestock and Fisheries Credit Jul 15. 1980 1986/2000 8.25% 15.0Nonpronect. Structural Adjustmert ..... . . .... . ...... Sep. 16. 1980 1986i2000 9.25% 200.0Education: Sector Program for Elementary Educatior .Jun 30, 1981 198712001 9.60% 100 0
(continued)

194 Bank/IDA Appendices
Statement of Loans Approvedduring Fiscal Year 1981 (continued)
July 1, 1980-June 30, 1981Expressed in United States dollars (in millions)
Guarantor Date of Interest PrincipalPurpose and borrower approval Maturities rate amount
Philippines (Guarantor)Development Finance Companies: Industrial Finance-Central Bank of the Philippines ............................. May 7, 1981 1986/2001 9.60% $150.0
Portugal (Guarantor)Development Finance Companies: Second Banco de Fomento Nacional . .. Jan. 13, 1981 1984/1995 9.25% 100.0Energy: Petroleum Exploration Project-Petroleos de Portugal, E.P ...... Jun. 23, 1981 1984/1996 9.60% 20.0
Romania (Guarantor)Energy: Fourth Power-The Investment Bank of Romania ..... ....... Dec. 23, 1980 1983/1995 9.25% 125.0Agriculture and Rural Development: Fourth Livestock (Cattle)-Bank forAgriculture and Food Industry ........... .................... Dec. 23, 1980 1984/1996 9.25% 80.0
Agriculture and Rural Development: Bucsani-Buzau-Siret-PrutIrrigation- Bank forAgriculture and Food Industry ... ........... Dec. 23, 1980 1984/1996 9.25% 75.0
Agriculture and Rural Development: Caracal-Titu Irrigation-BankforAgriculture and Food Industry ........... .................... Apr 21, 1981 1984/1996 9.60% 80.0
SenegalNonproject: Structural Adjustment .......... .................. Dec. 18, 1980 1986/2001 9.25% 30.0
Senegal (Guarantor)Small-Scale Enterprises: Investment Promotion-Societe FinanciereSenegalaise pour le Developpement de l'lndustrie et du Tourisme ...... Apr. 21, 1981 1984/1999 9.60% 6.5
Transportation: SEFICS Rail Transport-Societe d'Exploitation Ferroviairedes Industries Chimiques du Senegal ........ ................. Jun. 23, 1981 1986/1999 9.60% 19.3
Swaziland (Guarantor)Energy: Third Power-Swaziland Electricity Board ...... ........... May 28, 1981 1984/2001 9.60% 10.0
Syrian Arab RepublicEducation: Second Education (Vocational and technical training) ....... Apr. 23, 1981 1985/1998 9.60% 15.6
ThailandTransportation: Inland Waterways and Coastal Ports ...... .......... Jul. 8,1980 1986/2000 8.25% 53.0Transportation: Bangkok and Sattahip Ports ....... .............. Nov. 18, 1980 1986/2001 9.25% 47.0Agriculture and Rural Development: National Agricultural Research ...... Nov. 25, 1980 1986/2001 9.25% 30.0Industry: Potash Engineering ................................ Jan. 28, 1981 1986/2001 9.25% 8.9Agriculture and Rural Development: Twelfth Irrigation ...... ......... Jun. 23, 1981 1987/2001 9.60% 57.0
Thailand (Guarantor)Development Finance Companies: Fourth Industrial Finance Corporationof Thailand ........................................... Mar. 19, 1981 1985/1996 9.60% 30.0
Energy: Power Subsector-Electricity Generating Authority of Thailand . .. May 21, 1981 1987/2001 9.60% 100.0TunisiaEducation: Fourth Education (Vocational education and skilled manpowertraining) ............................................ Mar 26, 1981 1985/1998 9.60% 26.0
Small-Scale Enterprises: Small-Scale Industry Development ..... ..... Apr 14, 1981 1985/1997 9.60% 30.0Agriculture and Rural Development: Northwest Rural Development
(Phase l) ............................................ May 19, 1981 1986/2001 9.60% 24.0Population, Health, and Nutrition: Health and Population ..... ........ May 28, 1981 1986/1998 9.60% 12.5Industry: Textile Rehabilitation ............ .................. Jun. 2, 1981 1985/1996 9.60% 18.6
Tunisia (Guarantor)Energy: Third Power-Societe Tunisienne de l Electricite et du Gaz ..... May 26, 1981 1986/1998 9.60% 41.5
TurkeyNonproject: First Structural Adjustment (Supplement)' ...... ........ Nov 18, 1980 1985/1998 9.25% 75.0Energy: Petroleum Exploration ........... .................... Nov, 18, 1980 1985/1998 9.25% 25.0Energy: Bati Raman Enhanced Oil Recovery Field Demonstration ..... ... Nov 18, 1980 1985/1998 9.25% 62.0Development Finance Companies: Labor-intensive Industry ..... ...... Mar 3,1981 1984/1996 9.60% 40.0Agriculture and Rural Development: Second Fruit and Vegetable ..... ... Mar 31, 1981 1985/1998 9.60% 40.0Industry: Fertilizer Rationalization and Energy Saving ...... ......... May 7, 1981 1986/1998 9.60% 110.0Nonproject: Second Structural Adjustment ........ ............... May 12, 1981 1986/1998 9.60% 300.0
Turkey (Guarantor)Development Finance Companies: State Industrial Enterprise Finance-Devlet Yatirim Bankasi (State Investment Bank) ...... ............ May 21, 1981 1984/1996 9.60% 70.0

Bank/IDA Appendices 195
Appendix 3
Guarantor Date of Interest PrincipalPurpose and borrower approval Maturities rate amount
UruguayDevelopment Finance Companies: Second Industrial Credit ........... Dec. 16, 1980 1984/1993 9.25% $ 30.0
Yugoslavia (Guarantor)Development Finance Companies: Fifth Industrial Credit-Kosovska BankaPristina; Privredna Banka Sarajevo; Investiciona Banka Titograd; andStopanska Banka Skopje .Oct. 28, 1980 1983/1995 9.25% 110.0
Agriculture and Rural Development: Second Morava RegionalDevelopment-Investbanka .Mar. 3,1981 1984/1996 9.60% 87.0
Transportation: Kosovo Railway-Pristina Railway Organization .Apr. 30, 1981 1984/1996 9.60% 34.0Agriculture and Rural Development: Kosovo Agricultural Development-
Udruzena Kosovska Banka Pristina .May 14, 1981 1984/1996 9.60% 90.0
ZambiaDevelopment Finance Companies: Second Development Bank of Zambia . Dec. 2, 1980 1984/1998 9.25% 15.0Agriculture and Rural Development: Eastern Province AgriculturalDevelopment .May 21, 1981 1986/2001 9.60% 11.0
ZimbabweNonproject: Manufacturing Rehabilitation Imports Program .Mar. 26, 1981 1986/2001 9.60% 50.0Nonproject: Transportation Rehabilitation Imports Program .May 19, 1981 1987/2001 9.60% 42.0
Total of Loans to or Guaranteed by Members . . . .$8,808.9
International Finance Corporation ...... ........... Jan. 22, 1981 1984/1995 11.00% 100.0
GRAND TOTAL . . . .$8,908.9
' Supplementary financing to a previous loan, counted as a separate operation.

196 Bank/ DA Appendices
Statement of Development CreditsApproved during Fiscal Year 1981July 1, 1980-June 30, 1981(in millions)
Principal amount
Expressed US dollarin special equivalents
Country Date of Service drawing orPurpose approval Maturities charge rights' US dollars'
BangladeshSmall-Scale Enterorises: Third Small-Scale Industry ........ Sep. 16, 1980 1991/2030 0.75% SDR 26.7 0 35.0Nonproject: Ninth Imports Program .. . ................... Oct. 14, 1980 1991/2030 0.75% 49.5 65.0Energy: Bakhrabad Gas Development ........... ........ Dec. 23, 1980 1991/2030 0.75% 64.7 85.0Transportation: Fertilizer Transport .. ............... . . . . Jan. 22, 1981 1991/2030 0.75% 19.1 25.0Development Finance Companies: Second Bangladesh ShilpaBank ........................................ Mar 19, 1981 1991/2030 0.75% 40.2 51.0
Technical Assistance: Fourth Technical Assistance ....... . . . Mar. 26, 1981 1991/2030 0.75% 12.9 16.0Agriculture and Rural Develooment: Hand Tubewells ...... . . . May7, 1981 1991/2031 0.75 % 14.8 18.0Agriculture and Rural Development: Agricultural Credit . ..... . May 21, 1981 1991/2031 0.75% 32.6 40.0
BeninIransportation: Se^ond Feeder Roads ................... . Dec.23 1980 1991/2030 0.75% 5.5 7.0Agriculture and Rural Development: Borgou Province RuralDevelopment .. Apr 7,1981 1991/2030 0.75% 15.7 20.0
Transportation: Fourth Highway ....................... . May 14, 1981 1991/2030 0.75% 9.3 11.3Water Supply and Sewerage: Cotonou Water/SanitationEngineering .... ....... .. ....... . .Jun 25, 1981 1991/2031 0.75% 4.1 5.G
BurmaAgriculture and RLral Development: Grain Storage ........ . . Jan. 6, 1981 1991i2030 0.75% 17.9 23.0Agriculture and RLral Development: First Wood Industries .... . Mar 17, 1981 1991/2031 0.75% 25.8 32.0
BurundiTelecommunications ........... . .......... ...... . . Jul. 29, 1980 1990/2030 0.75% 7.7Transportation: Th:rd Highway ........................ . Apr 21, 1981 1991/2031 0.75% 20.5 25.0ndustry: Nickel Exp oration/Engineering ......... . . . . . . . . May 28, 1981 1991/2031 0.75% 3.3 4.0
Agriculture and RLral Development. Kirimiro Rural Development . Jun. 16, 1981 1991/2031 0.75% 16.2 19.3
CameroonAgriculture and RLral Development: Northern Province RuralDevelopment .................................. . Nov. 18, 1980 1991/2030 0.75% 9.5 12.5
Technical Assistance: Second Technical Cooperation ....... . . Jun. 23, 1981 1991/2031 0. 75% 8.2 10.0
Central African RepublicTransportation: Third Highway (Supplement) ......... . . . Nov. 11, 1980 1991/2030 0.75% 3.5 4.5Education (Supplement) ................ Nov. 11, 1980 1991/2030 0.75% 0.7 0.9Technical Assistarce ............. . . . ....... ... . .... May 26, 1981 1991/2031 0.75% 3.3 4.0
ChinaEducation: University Development ..... . .. ......... .. . . Jun. 23, 1981 19911/2031 0.75% 81.4 100.0
Egypt, Arab Republic ofEducation: Third Education ............. .. .. . .. . .. .. . Oct. 7,1980 1991/2030 0.75% 30.3 40.1Agriculture and Rural Development: New Land Development . . . Dec. 16, 1980 1991/2030 0.75% 60.9 80.0Agriculture and Rural Development: Fish Farming Development . . Mar 17, 1981 1991/2030 0.75% 11.0 14.0Water Supply and Sewerage: Beheira Provincial Water Supply . . Jun. 2,1981 1991/2031 0.75% 46.1 56.6Technica Assistance .......... .............. Jun. 16, 1981 1991/2031 0.75% 5.7 6.9
EthiopiaAgriculture and Rural Development: Second Agricultural MinimumPackage .... ........ .... ........ .... ......... . Dec. 23, 1980 1991/2030 0.75% 32.0 40.0
Education: Fifth Education (Primary, seconcary, and nonformaleducation) .... ....................... May 14, 1981 1991/2031 0.75% 28.2 35.0
GhanaTransportation: RaAlway Rehabilitation ............ Jun. 25, 1981 1991/2031 0.75% 23.3 29.0
GuineaAgriculture and Rural Development Livestock Development . .. . Sep. 9,1980 1990/2030 0.75% 13.3 17.5Erergy: First Power .............. .. ... ... ... . Dec.18, 1980 1991/2030 0.75% 22.1 28.5

Bank/IDA Appendices 197
Appendix 4
Principal amount
Expressed US dollarin special equivalents
country Date of Service drawing orPurpose approval Maturities charge rights' US dollars'
Guinea-BissauEnergy: Petroleum Exploration Promotion .............. Jan. 13, 1981 1991/2030 0.75% SDR 5.4 $ 6.8
GuyanaNonproject. Structural Adjustment ......... .......... Feb 3. 1981 1991,'2030 0.75% 6.3 8.0
HaitiAgriculture and Rural Development Post-Hurricane AgriculturalRehabilitation . . Mar. 17, 1981 1991/2030 0 75% 2.6 3.2
Transporation: Port Development .. ........... ...... Mar 26, 1981 1991/2030 0.75% 8.7 11.0Development Finance Companies: Industrial Credits . ...... Apr 14, 1981 1991/2030 0.75% 5.7 7.0
IndiaTransportation: Bihar Rural Roads ........ . .. ........ Nov. 11, 1980 1991/2030 0 75% 26.7 35.0Agriculture and Rural Development Mahanadi Barrages ...... Dec. 2,1980 1991/2030 0 75% 63.3 83.0Urbanization: Second Madras Urban Development . . ....... Dec. 16, 1980 1991/2030 0 75% 32.6 42.0Agriculture and Rural Deveiopment: Madhya Pradesh MediumIrrigation .................. .. .......... Mar 17, 1981 1991/2030 0.75% 112.6 140.0
Telecommunications. Eighth Telecommunications .... . . . . Mar 17, 1981 1991/2030 0.75% 252 4 314 0Agriculture and Rural Development Karnataka Tank Irrigation . Mar. 19, 1981 1991.2030 0.75% 43.5 54.0Industry. Hazara Fertilizer .............. . ........ Mar. 31, 1981 1991/2030 0.75% 321.5 400.0Agriculture and Rural Development. Maharashtra AgriculturalExtension ...................... . . ....... . Apr 21, 1981 1991/2031 0.75% 18.9 23.0
Agriculture and Rural Development: Tamil Nadu AgriculturalExtension ............... . . ........ . . Apr 23, 1981 1991/2031 0.75% 22.9 28 0
AgricultLre and Rural Development. Madhya Pradesh AgriculturalExtension .................... ............. Apr 23. 1981 1991/2031 0.75% 30.3 37.0
Agriculture and Rural Development: Second National CooperativeDevelopment Corporation . ............ .. . . May 21. 1981 1991/2031 0.75% 101.8 125.0
KenyaEducation Fifth Education (Primary and secondary schoolmanagement training and training of middle- and higher-levelpersonnel) ........... ..... ... . . ....... . . Mar 17, 1981 1991/2031 0.75% 314 40.0
Agriculture and Rural Development Fourth Agricultural Credit . May 19, 1981 1991/2031 0.75% 8 2 10.0
LesothoEducation: Third Education (Primary school construction andtextbooks) ............. . ....... ... . . . . . May 21, 1981 1991/2031 0.75% 8.2 10.0
LiberiaSmall-Scale Enterprises Small and Medium-Scale Enterprise . . . Nov. 18. 1980 1991/2030 0.75% 3.2 4.0
MadagascarAgriculture and Rural Development: Agricultural Credit ...... . Sep 9, 1980 1990/2030 0.75% 8.7 11.5Agriculture and Rural Development. Study of the Plain ofAntanatiarivo Technical Assistance . . ....... ... .... . Dec. 18, 1980 1991/2030 0.75% 1.8 2.3
Techmcal Ass stance: Accounting and Audit Organization andTraining .............................. . Jun. 2,1981 1991/2031 0.75% 94 11.5
Agriculture and Rural Development: Second Mangoro Forestry . . . Jun. 16, 1981 1991/2031 0 75% 16.3 20.0
MalawiTransportation Fourtn Highway . .......... ......... Feb. 3,1981 1991/2031 075% 259 33.0Education: Fourth Education (Construction of secondary schools,trainig of secondary school teachers) ... . . .......... Mar 26, 1981 1991/2031 0.75% 32 2 41.0
MaliTransportation. Road Maintenance ............ . . Mar 3,1981 1991/2031 0 75% 13.4 17.0Energy Petroleum Exploration Promotion .... . . . . . . . . Apr 21, 1981 1991.2031 0.75% 3.1 3 7
(continued)
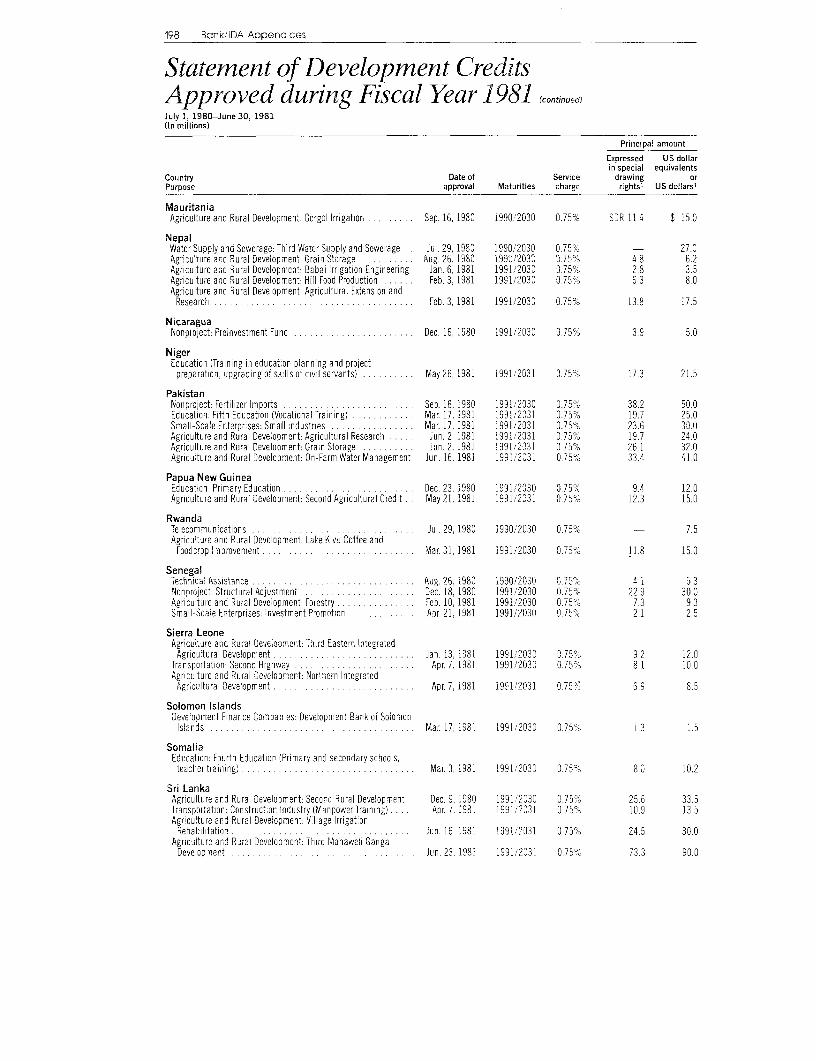
198 BanrkiDA Appendices
Statement of Development CreditsApproved during Fiscal Year 198],(ontinued)July 1, 1980-June 30, 1981(in millions)
Principal amount
Expressed US dollarin special equivalents
Country Date of Service drawing orPurpose approval Maturities charge rights' US dollars'
MauritaniaAgriculture and Rural Development: Gorgol Irrigation ..... .... Sep. 16, 1980 1990/2030 0.75°% SDR 114 $ 15.0
NepalWater Supply and Sewerage: Third Water Supply and Sewerage . Jul. 29, 1980 1990/2030 0.75% - 27.0Agriculture and Rural Development: Grain Storage ......... . Aug. 26, 1980 1990/2030 0.75% 4.8 6.2Agriculture and Rural Development Babai Irrigation Engineering Jan. 6,1981 1991/2030 0.75% 2.8 3.5Agriculture and Rural Development: Hill Food Production ...... Feb. 3,1981 1991/2030 0.75%, 6.3 8.0Agriculture and Rural Development: Agricultural Extension and
Research ..... ................................ Feb. 3,1981 1991/2030 0.75% 13.8 17.5
NicaraguaNonproject: Preinvestment Fund ........ ...........o... Dec. 16, 1980 1991/2030 0 75% 3.9 5.0
NigerEducation (Training in education planning and projectpreparation, upgrading of shills of civil servants) ....... . . May 26, 1981 1991/2031 0. 5% 17.3 21.5
PakistanNonproject: Fertilizer Imports ......... . .............. Sep. 16, 1980 1991/2030 0.75% 38.2 50.0Education: Fifth Education (Vocational Training) ........ . . . Mar. 17, 1981 1991X2031 0.75%"I 19.7 25.0Small-Scale Enterprises: Small Industries .M.a...... . . Mar 17, 1981 1991/2031 0.75% 23.6 30.0Agriculture and Rural Development Agricultural Research . j.. . Jun. 2,1981 1991/2031 0.75% 19.7 24.0Agriculture and Rural Development: Grain Storage ....... . . Jun. 2, 1981 1991/2031 0.75% 26.1 32.0Agriculture and Rural Development: On-Farm Water Management Jun.16. 1981 1991/2231 0.75% 33.4 41.0
Papua New GuineaEducation: Primary Education ...................... . Dec. 23. 1980 1991'2030 0.75% 9.4 12.0Agriculture and Rural Development: Second Agricultural Credit .. May 21, 1981 1991:2031 0. 75% 12.3 15.0
RwandaTelecommunications .................... ... ... ... . Jul. 29, 1980 1990/2030 0.75% - 7.5Agriculture and Rural Development: Lake Kivu Coffee andFoodcrop inprovement .......... . ................ Mar 31, 1981 1991/2030 0.75% 11.8 15.0
SenegalTechnica. Assistance ............ . ............... Aug. 26, 1980 1990/2030 0.75% 4.1 5.3Nonprcject: Structural Adjustment ........... . . . . . . . ... Dec. 18, 1980 1991/2030 0.75% 22.9 30.0Agriculture and Rural Development: Forestry ......... . . . . . . Feb. 10, 1981 1991/2030 0.75%5 7.3 9.3Small-Scale Enterprises: Investment Promotion ........ . . . . . Apr 21, 1981 1991/2030 0.75% 2.1 2.5
Sierra LeoneAgriculture and Rural Development: Third Eastern IntegratedAgricuitural Development . ... . ............ Jan. 13, 1981 1991/2030 0. 75% 9.2 12.0
Transportation: Second Highway ................. ...... Apr 7,1981 1991/2030 0.75% 8.1 10.0Agriculture and Rural Development: Northern IntegratedAgricu tural Develcoment ............. _.. .. .. .. .. . AprL 7,1981 1991/2031 0.75V 6.9 8.5
Solomon IslandsDevelopment Finance Companies: Development Banh cf SolomonIslands ....... ......................... Mar 17, 1981 1991/2030 0.75% 1.3 1.5
SomaliaEducation: Fourth Education (Primary and secondary schools,teacher traininrg) ........ .......... .......... .... . Mar. 3,1981 1991/2030 0.75% 8.0 10.2
Sri LankaAgriculture and Rura Development: Secord Rural Development . Dec. 9,1980 1991 2030 0.75% 25.6 33.5Transportation: Construction industry (Manpower Training) ... . Apr. 7,1981 1991/2031 0.75% 10.9 13.5Agriculture and Rural Development. Vil age Irrigation
Rehabilitation .................................. . Jun. 16, 1981 1991/2031 0.75% 24.5 30.0Agriculture and Rural Development Thirdn Mahaweli Ganga
Deve opnmert ... . . ..... . . . . .. . . . . Jun. 23. 1981 1991/2031 0.75% 73.3 90.0

Bank/IDA Appendices 199
Appendix 4
Principal amount
Expressed US dollarin special equivalents
Country Date of Service drawing orPurpose approval Maturities charge rightsl US dollars'
SudanAgriculture and Rural Development: White Nile Pump SchemesRehabilitadon ................................... Mar. 26, 1981 1991/2031 0.75% SDR 27.5 $ 35.0
Agriculture and Rural Development: Blue Nile Pump SchemesRehabilitation ................................... Mar. 26, 1981 1991/2031 0.75% 25.1 32.0
Technical Assistance: Second Technical Assistance ..... ... May 28, 1981 1991/2030 0.75% 4.9 6.0
TanzaniaEducation: Seventh Education (Education in underprivilegedareas, improvement of secondary education) ...... ....... Jul. 29, 1980 1990/2030 0.75% - 25.0
Technical Assistance: Second Technical Assistance ..... ..... Aug. 8, 1980 1990/2030 0.75% 8.4 11.0Agriculture and Rural Development: Coconut Pilot Project .... .. Oct. 7, 1980 1991/2030 0.75% 5.2 6.8Nonproject: Export Rehabilitation Program ...... .......... Apr. 21, 1981 1991/2031 0.75% 40.9 50.0
TogoTransportation: Fourth Highway ....... Ma. .y M a 7, 1981 1991/2030 0.75% 16.4 20.0Industry: Phosphate Engineering and Technical Assistance ..... Jun. 23, 1981 1991/2031 0.75% 4.8 5.7
UgandaTechnical Assistance .......... ................... Dec. 2, 1980 1991i2030 0.75% 6.4 8.0Water Supply and Sewerage: Water Supply Engineering ..... .. Mar. 17, 1981 1991/2031 0.75% 7.1 9.0
Upper VoltaAgriculture and Rural Development: Second BougouribaAgricultural Development ........... ................ Jan. 28, 1981 1991/2030 0.75% 12.4 16.0
Transportation: Fourth Highway ........ .............. Jun. 16, 1981 1991/2031 0.75% 37.7 46.0
Western SamoaAgriculture and Rurai Development: Second AgriculturalDevelopment ................................... Dec. 9,1980 1991/2030 0.75% 1.6 2.0
Yemen Arab RepublicAgriculture and Rural Development: Second Southern UplandsRural Development . .............................. Sep. 16, 1980 1990/2030 0.75% 13.0 17.0
Energy: Regional Electrification (Second Power) ..... ........ Feb. 10, 1981 1991/2030 0.75% 9.4 12.0Development Finance Companies: Industrial Development ..... Mar. 26, 1981 1991/2030 0.75% 9.7 12.0
Yemen, People's Democratic Republic ofAgriculture and Rural Development. Wadi Beihan AgriculturalDevelopment ..... . May 19, 1981 1991/2031 0.75% 6.6 8.0
Transportation: Third Highway .......... ........... May 19, 1981 1991 2030 0.75% 10.3 12.5Water Supply and Sewerage: Al Mukalla Water SupplyRehabilitation ................... .............. Jun. 2,1981 1991/2030 0.75% 2.9 3.5
ZaireAgriculture and Rural Development. Kwilu-Ngongo Sugar ...... Dec. 23, 1980 1991/2030 0 75% 20.2 26.4Technical Assistance . ........... . May 26, 1981 1991/2030 0.75% 2.4 2.9
ZimbabweNonproject: Manufacturing Rehabilitation Imports Program ... . Mar. 26, 1981 1991/2030 0.75% 12.1 15.0
TOTAL .... ............................. . . ........................... SDR 2,719.0 $3,482.1
'From August 1, 1980, IDA credits have been approved urder advance contributions to the S xth Replen shment of IDA and are expressed in Spec al Draw ng Rights (SDR). The first columnunder Pr nc pa: Amoent gives the SDR amourt the second column show the United States dollarequivalent Where no SDR amount but only a US dol ar amount appears the credit wasapproved under the F fth ReDienishment of (DA and the amount was expressed In United States doilars only
2SLpp ementary financing to prev ous c'ed ts, not counted as a separate overation.

200 Bank/IDA Appendices
Budgets ofthe Bank and IDAFor the fiscal year ending June 30, 1982
Actual expenses Budget1981 1982
(Thousands of US dollars)
BY ORGANIZATION UNITBoard of Governors ....................... ......... 1,934 $ 2,061Executive Directors ................................. 11,651 14,345Executive Offices . ................ ................ 2,361 2,263Regional Offices ....................... .......... 208,746 236,692Central Projects Staff ................ ............... 55,904 67,534Cooperative Programs: FAO, Unesco, WHO, and UNIDO ........ 10,275 12,733Development Policy Staff ............................. 27,699 31,686Financial Staff ................ .................. 29,917 33,732Operations Evaluation Staff ........................... 4,086 4,648Legal, ICSID, and Secretary's .......................... 10,669 12,355External Relations .................................. 12,918 15,475Economic Development Institute ........................ 10,752 12,504Administration, Organization, Personnel Management ..... 58,086 66,614Secretariat of the Consultative Group onInternational Agricultural Research ..................... 1,250 1,440
Administrative Tribunal ......... ................... 377 307Reimbursable Technical Assistance .......... ...... 5,749 8,671Contingency allowance .............. ................ - 4,200
Subtotal ............. ........................ $452,374 $527,260
Less: Reimbursements ............................... -14,686 -21,216IFC service and support fee ......... ............. - 2,874 - 3,344
Subtotal ....................... ............. $434,814 $502,700
Add: Contributions to Special Programs : . ................. - 22,800
TOTAL IBRD/IDA ................................ $434,814 $525,500
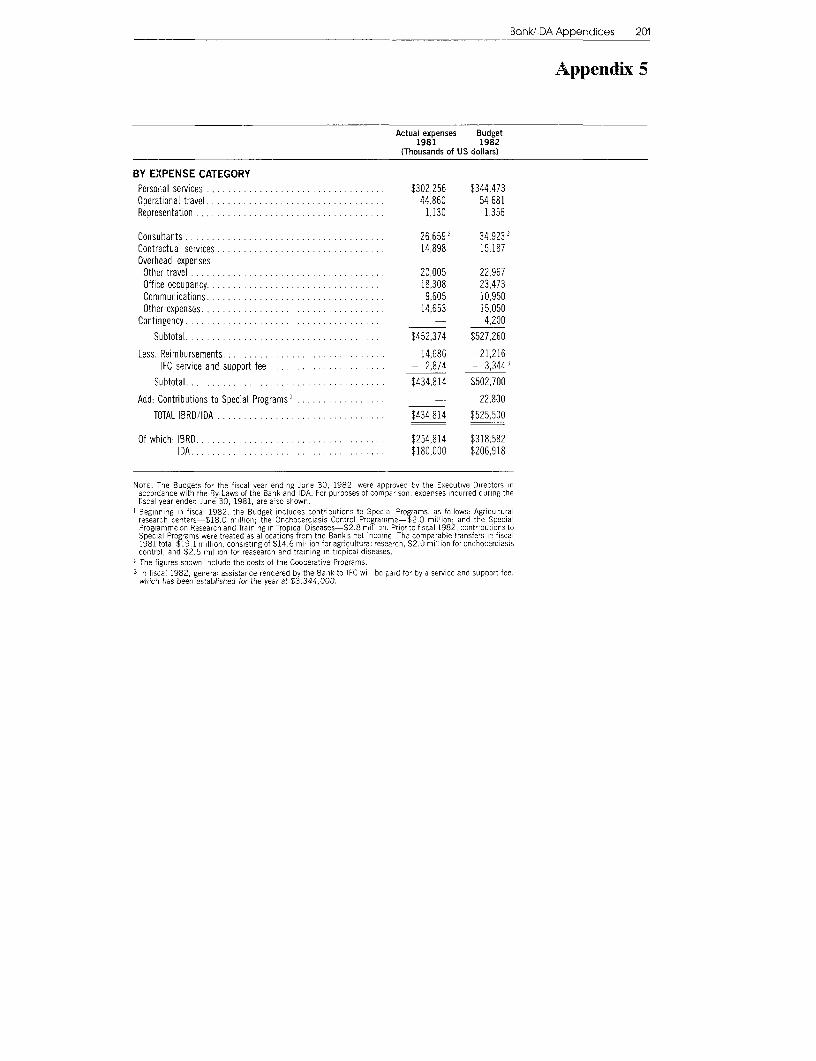
Bank/!DA Appendices 201
Appendix 5
Actual expenses Budget1981 1982
(Thousands of US dollars)
BY EXPENSE CATEGORYPersonal services ................................. $302,256 $344,473Operational travel ............. .................... 44,860 54,681Representation .... ............... ............... 1,130 1,356
Consultants ......................... 26,659 34,9232Contractual services ............................. 14,898 15,187Overhead expensesOther travel ..................................... 20,005 22,967Office occupancy ...... ........................... 18,308 23,473Communications .................................. 9,605 10,950Other expenses ................................... 14,653 15,050
Contingency .................................. - 4,200
Subtotal ...................................... $452,374 $527,260
Less. Reimbursements ......................r....... - 14,686 - 21,216IFC service and support fee . ..................... - 2,874 - 3,344
Subtotal. ,,... ............................... $434,814 $502,700
Add: Contributions to Special Programs .............. . . - 22,800
TOTAL IBRDOIDA . ............................. $434,814 $525,500
Of which. IBRD ...................O................ $254,814 $318,582IDA ..................................... $180,000 $206,918
NOTE: The Budgets for the fiscal year end ng June 30, 1982, were approved by the Executive Directors inaccordance w th the By-Laws of the Bank and IDA. For purposes of compar son, expenses incurred during thefisca year ended June 30, 1981, are also shown.
I Beginning in fiscal 1982. the Budget includes contributions to Specia Programs, as follows Agriculturaresearch centers-$18.0 miilion; the Onchocerciasis Cortro Programme-$2 0 milion; and the SpeciaProgramme on Research and Tra ning n Trop ca Diseases-$2.8 miDon. Pr or to fiscal 1982. contrmbut.ons toSpecia Programs were treated as a ocations from the Bank's ret ncome. The comparable transfers ir fiscal1981 total $19.1 m 11 on, consisting of $14.6 million for agricultural research, $2.0 mUilion for onchocerciasiscontrol, and $2.5 mi ion for reasearch and training ir tropical diseases.
IThe figures shown nc ude the costs of the Cooperative Programs.3 n f scal 1982 genera! assistance rendered by the Bank to IFC wi be paid for by a service and support fee,
w`uic has been estabiUshed for the year at $3,344,000.
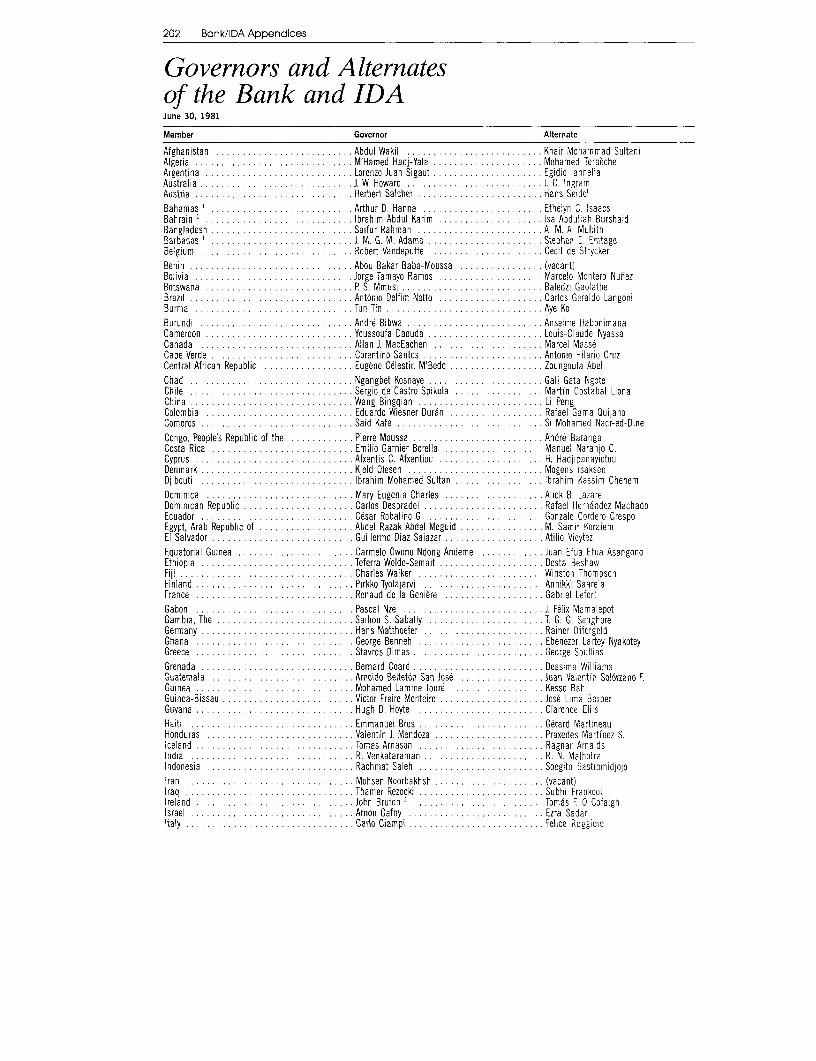
202 Bank/IDA Appendices
Governors and Alternatesof the Bank and IDAJune 30, 1981
Member Governor Alternate
Afghanistan .... ......... Abdul Wakil ..... ............. Khair Mohammad SultaniAlgeria ............. M'Hamed Hadj-Yala .................. Mohamed TerbecheArgentina ............ Lorenzo Juan Sigaut ................. Egidio lanneliaAustralia ............ J. W. Howard ..... ............ J. C. IngramAustria ............ Henbert Salcher .................. Hans SeidelBahamas .' ............ Arthur D. Hanna .................. Ethelyn C. IsaacsBahrain ' ..... ....... Ibrahim Abdul Karim ................. Isa Abdullah BurshaidBangladesh .... ........ Saifur Rahman ........... ...... A. M. A. MuhithBarbados .. ............. 1. M. G. M. Adams .................. Stephen E. EmtageBelgium ..... ....... Robert Vandeputte ................ . Cecil de StryckerBenin ............. Abou Bakar Baba-Moussa ............... (vacant)Bolivia ............. Jorge Tamayo Ramos .................. Marcelo Montero NutezBotswana P S. Mmusi .Baledzi GaolatheBrazil ............ Antonio Delfim Netto ................. Carlos Geraldo LangoniBurma .............................. Tun Tin ............. Aye KoBurundi ............ Andre Bibwa .... ......... Anselme HabonimanaCameroon ............ Youssoufa Daouda ...... ....... Louis-Claude NyassaCanada ............ Allan J. MacEachen ....... ...... Marcel MasseCape Verde .... ........ Corentino Santos ...... ....... Antonio Hilaric CruzCentral African Republic ........... . Eugene Cdlestin M'Bedo ............ Z. oungoula AbelChad ............ Ngangbet Kosnaye ...... ....... Gali Gata NgoteChile ............ Sergio de Castro Spikula ............. Martfn Costabal LlonaChina ............ Wang Bingqian ..... ........ Li PengColombia ............ Eduardo Wiesner Duran ............ . Rafael Gama QuijanoComoros . ........ .... Said Kafe .... ......... Si Mohamed Nacr-ed-DineCongo, People's Republic of the ............ Pierre Moussa ......... ........ Andre BatangaCosta Rica ....... .......... Emilio Garnier Borella ................. Manuel Naranjo C.Cyprus ................. Afxentis C. Afxentiou .................. H. HadjipanayiotouDenmark ...... ........... Kjeld Clesen .......... ........ Mogens isaksenDjibouti ...... ........... Ibrahim Mohamed Sultan ................. Ibrahim Kassim ChehemDominica ....... .......... Mary Eugenia Charles ................. Alick B. LazareDominican Republic ................. Carlos Despradel ................. . Rafael Hernandez MachadoEcuador .................. Ce sar Robalino G . ................ Gonzalo Cordoero CrespoEgypt, Arab Republic of ................. Abdel Razak Abdel Meguid .... M. Samir KoraiemEl Salvador ....... .......... Guillermo Diaz Salazar ................. Atilio VieytezEquatorial Guinea ............... .. Carmelo Owono Ndong Andeme ............. Juan Efua Efua AsangonoEthiopia ...... ........... Teferra Wolde-Semait ................. Desta BeshawFiji ..... ............ Charles Walker ........... ...... Winston ThompsonFinland ........ ......... Pirkko Tyolajarvi ................. . Annikki SaarelaFrance ....... .......... Renaud de la Geniere .................. Gabriel LefortGabon ...... ........... Pascal Nze ....... .......... J. Felix MamaoepotGambia, The. ................ Saihou S. Sabally. ................ T G. G. SenghoreGermany. . ............... Hans Matthoefer ................ . .Rainer OffergeldGhana. . ............... George Benneh ................. Ebenezer Lartey NyakoteyGreece. . ............... Stavros Dimas. ................ George Souf iasGrenada. . ................ Bernard Coard. ................. Dessima Wil iamsGuatemala. . ................ Arnoldo Beltet6n San Josd .o............. . Juan VUlentn Solrzano F.Guinea. . ............... Mohamed Lamine Tourd ................. Kesso BahGuinea-Bissau ................. Victor Freire Morteiro .................. Jose Lima BarberGuyana.H.. . ............ Hugh D. Hoyte. ................ Clarence EllisHaiti ... ............ . .Emmanuel Bros ............... . .Gerard MartineauHonduras. . ................ Valentin J. Mendoza .................. Praxedes Martinez S.Iceland. . ............... Tomas Arnason ................. Ragnar ArnaldsIndia.. ................ R. Venkataraman. ................ R. N. MalhotraIndonesia ................. Rachmat Saleh ............... . .Soegito SastromidjojoIran . ................ Mohsen Noorbakhsh .................. (vacant)Iraq ................. Thamer Rezooki. ................ Subhi FrankoolIreland ............. .... John Bruton 2. .............. . Tomas F. 0 CofaighIsrael ............. .... Arnon Gafny ................. Ezra SadanItaly . ................ Carlo Ciampi .................. Felice Ruggiero

Bank/IDA Appendices 203
Appendix 6
Member Governor Alternate
Ivory Coast . .................. Abdoulaye Kon ...................... Lon NakaJamaica I ..... .............. E. P G. Seaga .................... Horace BarberJapan ................... Michio Watanabe .................... Haruo MayekawaJordan ................... Hanna Salim Odeh ............ ... . Mohammad Saleh HoraniKampuchea, Democratic .................. (vacant) . ................... (vacant)Kenya ................... Mwai Kibaki .................... H. M. MuleKorea, Republic of ................... Seung-Yun Lee ................... . Joon Sung KimKuwait ................... Abdlatif Y Al-Hamad .................. . Faisal Al-KhaledLao Peoples Democratic Republic ........... Bousbong Souvannavong ................. (vacant)Lebanon ........ ........... Khattar Chebli .................... Sabbah Al-HalLesotho ................... E. R. Sekhonyana .................... M. P SejanamaneLiberia ................... Togba-Nah Tipoteh ................... John G. BestmanLibya . .................. Kasem M. Sherlala .................... Abdulla A. SaudiLuxembourg ................ ... Ernest Muehlen ................... . Raymond KirschMadagascar ................... Rakotovao Razakaboana .................. Rajaona AndriamananjaraMalawi ..... L. Chakahala Chaziya ....... S. M. KakhobweMalaysia .......... Tenghu Razaleigh Hamzah ................ Thong Yaw HongMaldives .......... Fathulla Jameel ........ ...... . Adam ManikuMali ........ . Ahmed Mohamed Ag Hamani .............. lbrahima Bocar BaMauritania .......... Dieng Boubou Farba .................... M'Rabih Rabou Ould Cheikh BounenaMauritius . ....... . Rabindrah Ghurburrun ................... Madhukarlall BaguantMexico ........ . David lbarra Munoz .................. Jorge Espinosa de los ReyesMorocco .......... Abdelkamel Rerhaye ...... Abdelkader BenslimaneNepal .......... Yadav Prasad Pant .................... Goraksha Bahadur Nhuchhe PradhanNetherlands ........ . . A. P J. M. M. van der Stee ................ J. de KoningNew Zealand . ....... . B. V. Galvin . ................... C. H. TerryNicaragua .......... Joaqu)n Cuadra Chamorro ................ Haroldo MontealegreNiger .......... Hamid Algabid .................... Brah MamaneNigeria ........ . . V. 1. Masi ......... ........... Ademola ThomasNorway .......... Ulf Sand ......... ........... Johan Joergen HoistOman .. . ......... Qais Abdul Munim Zawawi ................ Sherit LottyPakistan ......... Ghulam Ishaq Khan .................... Ejaz Ahmad NaikPanama . ....... . Ernesto Perez Balladares ................. Rogelio Fabrega ZarakPapua New Guinea . ....... . John Rumet Kaputin .................... Mekere MorautaParaguay . ....... . Cesar Romeo Acosta .................... Augusto Colman V.Peru . ....... . Manuel Ulloa Elias .................... Pedro Pablo KuczynskiPhilippines .... Cesar E. A. Virata . ........... .. Jaime C. LayaPortugal I .. . . Joao Ant6nio Morais Leitao ........... . Alberto RegueiraQatar ' . . . . Sheikh Abdul Aziz Khalifa Al-Thani ........ . Madhat Abdul Latif MasoudRomania . .. .Petre Gigea ......... . ....... . .Gheorghe PopescuRwanda .... ................... Denis Ntirugirimbabazi .. . Jean-Damascene MunyarukikoSt. Lucia . . . . . Winston Cenac ............... George C. GirardSao Tome and Principe ...... ..... Henrique Pinto da Costa ... .. ........ Victor Manuel Lopes CorreiaSaudi Arabia ......... .. . Sheikh Mohammed Abalkhail .. ........... Sheikh Hamad Saud Al-SayariSenegal . .......... . . Louis Alexandrenne ............... .Matar SeyeSeychelles ' .. . ..... . . Maxime Ferrari . . . .. Robert W. J. GrandcourtSierra Leone .. ......... Sama Siama Banya .............. . J. Amara-BangaliSingapore ' . . ........ Hon Sui Sen ........... . . J. Y M PillaySolomon Islands . . ..... ..... Benedict Kinika . . .. A. V. HughesSomalia . . ........ . Abdullahi Ahmed Addou .. . Mohamud Mohamed NurSouth Africa ........... . G. P C. de Kock .. . . . C. L. StalsSpain . . Jaime Garcia Anoveros ........ .... .Jose Ram6n Alvarez RenduelesSri Lanka . .. . ...... . . Ronnie de Mel .......... .. . . W. M. TilakaratnaSudan . ........ .. . Nasr Eldin Mustafa .............. . . Mirghani Mohamed AhmedSuriname ' .. . ..... . . A. E. Telting ........... . . H. S. AdhinSwaziland ......... .. . V. E. Sikhondze . . . .. Timothy M. J. ZwaneSweden . ....... .. . Rolf Wirten ........... . . Hans BlixSyrian Arab Republic ....... . . Hamdi Al-Sakka ......... . . . Mohammad Mouaffac TarabishiTanzania . .......... . . K. A. Malima ........... . . Fulgence Michael KazauraThailand . . ........ . Sommai Hoontrakool ............ .... Chanchai Leetavorn
(continued)

204 Bank! DA Appendices
Governors and Alternates Appendhx 6
of the Bank and IDA (continued)
June 30, 1981
Member Governor Alternate
Togo ......... .. .... ... Koudjolou Dogo ..... .................. E. K. AgbobliTrinidad and Tobago . ......... George Chambers ............. E BarscttTunisia ....... .. ....... Mansour Moalla ............. ....... Moncef ZaafraneTurkey ............ .............. Kaya Erdem ...................... .. Osman S o arUganda ...... ... I ... Apollo Milton Obote ............. Robert E. hinuUnited Arab Emirates . .................. Sheikh Hamdan Bin Rashid Al Maktoum ...... Ahmed Hurua d Al-layerUnited Kingdom .... .................. Gordon Richardson ......... ........... Sir Douglas WassUnited States ....... o..... Dnald T Regan ...................... Richard N. CooserUpper Volta ..... ............... Sanfo Mamadou .George GoongoungaUruguay - .......... .... . .... Valentin Arismendi ..................... Juan Jose AnichiniVenezuela ..... ...... ....... Ricardo Martnez .Hermorn LLar S SorianoViet Namn . ........ ............... Nguyen Duy Gia ............... Le HoangWestern Samoa ................. .... Vaovasamanaia R. P Phillips .............. Ma ava ula TomaYemen Arab Republic ......... ...... Fuad Kaid Mohammed ................ Ali A. KhcderYemen, People's Democratic Republic of ....... Farag Bin Ghanem ....... Yassin NasserYugoslavia ........................... Petar Kostic ......... Gavra PopovicZaire ........ ...... Namwisi Ma Keyi ............... ....... Bazundama Mbandanu LuzumbuluZambia . ............. Kebby K. S. Musokotwane ..... .... Fred KazungaZimbabwe .... .......... Enos Mzombi Nkala ... ...... Desond C. Krogh
I Member of the Bark or y.2 Appontmert ef'ec:ive after Jure 30, 1981.

Bank/lDA Appendices 205
Executive Directors and Alternates Appendhx 7
of the Bank and IDAJune 30, 1981
Total votes
Executive Director Alternate Casting votes of Bank IDA
AppointedUnited States 173,551 769,139
John Anson . ... ...... Derek F Smith ........... United Kingdom . . . . 26,250 263,576Eberhard Kurth . ...... Norbert Schmidt-Gerritzen . . .Germany 11........................... 17,862 236,831Paul Mentre de Loye ... Marthe Parent' . .. . ... France . .. . . 17,817 138 669Seiji Moriska . . Kimiaki Nakajima ......... Japan .................................. 17,789 201,476
ElectedSaid E. El-Naggar ........ Saleh A. Al-Hegelan ...... Bahrain,2 Egypt (Arab Republic of), Iraq, Jordan, Kuwait,
(Arab Repubi c of Egypt) (Saudi Arabia) Lebanon, Maldives, Pakistan, Qatar2
Saudi Arabia, Syrian Arab Republic, United ArabEmirates,2 Yemen Arab Republic .. 5. ... 18,565 188.952
Earl G. Drake ... ... Reno J. Brown ...... Bahamas,' Barbados,' Canada, Dominica, Grenada,(Canada) (Bahamas) Guyana, Ireland, Jamaica,' St. LuciaI .15.627 165,024
H. N. Ray .. . M. Syeduz-Zaman ... .... Bangladesh, India, Sri Lanka ....... ........... 14,286 157,319(India) (Bangladesh)
Giorgio Ragazzi . ...... Rodrigo M. Guimar3es ... . .Greece, Italy, Portugal2. 13,139 106,149(Italy) (Portugal)
Anthony IJ A Looijen ... .. Miodrag M. Stojiljkoviq . . .. .Cyprus, Israel, Netherlands, Romania,2 Yugoslavia . . . 13,114 109,686(Netherlands) (Yugoslavia)
Jacques de Groote .. l.o.... Turan Kivang .... . ... Austr a, Belgium, Luxembourg, Turkey .12,94 . 12,547 96,032(Belgium) (Turkey)
Joaquin Muns . ..... Roberto Mayorga-Cortes . . . .Costa Rica, El Salvador, Guatemala, Honduras, Mexico,(Spain) (Nicaragua) Nicaragua, Panama, Spain, Suriname,2 Venezuela 2 . . 12,250 93,747
Wang Liansheng ........ Chen Hui ........ China .................................. 12,250 91,311(China) (China)
Hans Lundstrdm ........ Ole L. Poulsen ........ Denmark, Finland, Iceland, Norway, Sweden ....... . 12,222 184,338(Sweden) (Denmark)
Zain Azraai . .. . Aung Pe. . . .Burma, Friy, Indonesia, Lao Peoples Democratic(Malaysia) (Burma) Republic, Malaysia, Nepal, Singapore,2 Thailand.
Viet Nam .......... .. .......... . 11,529 109,438S A McLeod ..... Anthony S. Cole ........ Australia, Korea (Republic of), New Zealand, Papua New
(New Zealand) (Australia) Guinea, Solomon Islands, Western Samoa . 11,435 91,750Y. S. M. Abdulai ....... William Smith ..... . Botswana, Burundi, Equatorial Guinea, Ethiopia, The
(Nigeria) (Liberia) Gambia, Guinea, Kenya, Lesotho, Liberia, Malawi,Nigeria, Seychelles,2 Sierra Leone, Sudan, Swaziland,Tanzania, Trinidad and Tobago, Uganda, Zambia,Zimbabwe .......... . . . . . . . . . . . . . . . . . . . . . 11,094 143,254
Jaime Garcia-Parra ..... . Jose G. Cardenas ......... Brazil, Colombia, Dominican Republic. Ecuador, Haiti,(Colombla) (Ecuador) Philippines . .... .. ......... . 10,484 113,403
Armand Razafindrabe ..... . Nicnphore Soglo ........ Benin, Cameroon, Cape Verde, Central African Republic,(Madagascar) (Benin) Chad, Comoros, Congo (People's Republic of the),
Djibouti, Gabon, Guinea-Bissau, Ivory Coast,Madagascar, Mali, Mauritania, Mauritius, Niger,Rwanda, Sao Tome and Principe, Senegal, Somalia,Togo, Upper Volta, Zaire .............. .. .. . . . 9,663 127,523
David Blanco . ......... .Alberto Sola ....... Argentina, Bolivia, Chile, Paraguay, Peru, Uruguay' . 9,124 95,976(Bolivia) (Argentina)
Ismail Khelil ..... . .Saad Zerhouni .Afghanistan, Algeria, Ghana, Iran, Libya. Morocco,(Tunisia) (Algeria) Oman. Tunisia, Yemen (Peoples Democratic
Republic of) ......... . . . . . . . . . . . . . . . . . . . . . 8.196 99.243
In addition to the Executive Directors and Alternates shown in the foregoing list. the following also served after October 31, 1980Executive Director End of period of service Alternate Director End of period of service
Guillermo Constain .. . . . .. .. ...... .. February 4, 1981 Sang-Chul Suh . ........... . February 28. 1981(Colombia) (Republic of Korea)
Colbert 1. King . . March 31. 1981 David S. King .March 31. 1981(United States) (United States)
Hans-Dieter Hanfland . . . March 31. 1981(Germany)
NOTE. Democrat c Kampuchea (464votes in BRDand 7,826votes in DA) and South Africa (3,713votes n BRDand 12,445votes In IDA)did not participatenthe 1980 Regu ar Election of Executive Directors.
Has res gred effective Ju y 31, 1981, to be succeeded by Robert Huddry2 Member of tne Bank only.

206 Bank/IDA Appendices
Officers and Department Directorsof the Bank and IDAJuly 1, 1981
President ................................................. A. W. ClausenSenior Vice President, Finance ................................................. Moeen A. OureshiSenior Vice President, Operations ................................................ Ernest SternRegional Vice President, Latin America and the Caribbean ............................. Nicolas Ardito BarlettaVice President, Projects Staff ................................................ Warren C. BaumVice President, External Relations ................................................ Munir P BenjenkRegional Vice President, Europe, Middle East, and North Africa ........ .................. Roger ChaufournierVice President, Development Policy ............................................... Hollis B. CheneryVice President, Programming and Budgeting, and Vice President, Pension Fund ............... K. Georg GabrielVice President and General Counsel .............................................. Heribert GolsongVice President and Controller ................................................ Masaya HattoriRegional Vice President, South Asia .............................................. W David HopperRegional Vice President, East Asia and Pacific ................ ...................... S. Shahid HusainRegional Vice President, Western Africa ............. ............................. A. David KnoxVice President, Administration, Organization, Personnel Management ..................... . Martiin J. W M. PaijmansVice President and Treasurer .............................................. . .Eugene H. RotbergVice President and Secretary .............................................. . .Timothy T ThahaneRegional Vice President, Eastern Africa .......................................... . Willi A. WapenhansDirector-General, Operations Evaluation ......................................... . Mervyn L. Weiner
Director, Projects Department, Eastern Africa ...................................... . Hans A. AdlerDirector, Country Programs Department 1, Western Africa ............... .. .. . .. . .. .. . . . Bilsel AlisbahDirector Country Programs Department 11, Europe, Middle East, and North Africa ............ . Maurice P, BartDirector, International Relations Department ............................ .... .... .. . Shirley BoskeyDeputy Controller and Director, Accounting Department ................ .. .. . .. .. . .. .. . Victor C. ChangDirector, Urban Development Department ..................................... . ... Anthony A. ChurchillDirector, Compensation Department ............................................. .R. A. ClarkeDirector, Cashier's Department .............................................. . .Jean B. d e BoeckDirector, Country Programs Department 11, Western Africa .................. ...... . Xavier de la RenaudiereDirector, Development Research Center .......................................... . John H. DuloyDirector, Projects Department, Western Africa ......................... ... .... ... .. . A. Sani El DarwishDirector, Population, Health, and Nutrition Department .. ............................. John R. EvansDirector, Industrial Projects Department ......................................... . Hans FuchsDirector, Country Programs Department 11, Eastern Africa ............... .. .. . .. . .. .. . . . Andre GuCDirector, Education Department .................. ............................. Aklilu HabteDirector Policy Planning and Program Review Department ............ .. . .. . .. . .. . .. . . Mahbub ul HaqDeputy Treasurer and Director, Treasury Operations .................... .. ... .. ... .. . . Hans C. HittmairDirector, Staff Retirement Plan Department ....................................... . Bernard J. HoliandDirector, Economic Analysis and Projections Department .............................. . Helen HughesDirector, Country Programs Department, East Asia and Pacific . Edward V. K. laycox

Bank/IDA Appendices 207
Appendix 8
Director, Operations Evaluation Department ......................................... Shiv S. KapurDirector, Country Programs Department I, Europe, Middle East, and North Africa ..... ......... Attila KaraosmanogluDirector, Projects Department, East Asia and Pacific ............ ...................... Syed Salar KirmaniDirector, Country Programs Department I, Eastern Africa .......... ..................... Jochen KraskeDirector, Country Programs Department 1, Latin America and the Caribbean ......... . . . . . . . Eugenio F LariEnvironmental Adviser, Office of Environmental Affairs ............................... . James A. LeeExecutive Secretary, Consultative Group on International Agricultural Research .............. . Michael L. LejeuneDirector, Country Programs Department 11, Latin America and the Caribbean ......... . . . . . . . Enrique LerdauDirector, Information and Public Affairs Department ................................. . John E. MerriamDirector, Economic Development Institute ................................... ..... . Ajit MozoomdarDirector, Computing Activities Department ................................ ...... . . Mervin E. MullerDirector, Tokyo Office ............................................... .Se igo NozakiAssistant Controller and Director, Loan Department ........ ......................... Stanley J. PerchDirector, Projects Department, Europe, Middle East, and North Africa .......... . . . . . . . . . . . Robert PicciottoDirector, Personnel Management Department ............. ......................... Hans PollanDirector, Projects Advisory Staff ................................................ Visvanathan RajagopalanDirector, Internal Auditing Department .......................................... . Lawrence N. RapleyDirector, Organization Planning Department ........................................ .Bruce W. RohrbacherDirector, Energy Department .............................................. . .Y ves RovaniDirector, Investment Department ................................................ Hugo J. H. SchielkeAssociate General Counsel ............................................... .Hugh N. ScottDirector, European Office ............................................... . Rainer B. SteckhanDirector, Development Economics Department . -.... .... ... .... .... ... ... ...... Everardus 1 StoutjesdijkDirector, Projects Department, South Asia ........................ . ............. Wilfried P ThalwitzDirector, Industrial Development and Finance Department .............. .. . .. . .. . .. . .. . Stokes M. TolbertDirector, Administrative Services Department ...................................... . James E. Twining, JrDirector, Financial Operations .............................................. . .Josep h P UhrigDirector, Projects Department, Latin America and the Caribbean ........................ . Suitbertus M. L. van der MeerDirector, Projects Staff ............................................... .H erman G. van der TakDirector, Programming and Budgeting Department .................................. . Heinz VerginDirector, Development Policy .............................................. ..E. Bevan WaideDirector, Country Programs Department, South Asia ................................. . Michael H. WiehenDirector, Transportation, Water, and Telecommunications Department ..................... . Christopher R. WilloughbyDirector, Financial Policy and Analysis Department ................... ... .. .. ... .. .. . D. Joseph WoodDirector, Agriculture and Rural Development Department ........... .. .......... . Montague Yudelman

208 Bank/IDA Appendices
World Bank OfficesJuly 1, 1981
Headquarters: 1818 H Street, N.W, Washington, D.C. 20433, U.S.A.New York Office Julian P Grenfell World Bark
Special Representative for c/o United NationsUnited Nations Organizations Room 2435, Secretariat Bu.ding
New York. N.Y. 10017, U.S.A.European Office Rainer B. Steckhan World Bark
Director 66, avenue d'Idna75116 Paris. FranceLondon OfficeNew Zealand House (15th foor)London SWI Y4TE, England
Geneva Office Mahmud Burney World BankWorld Bank Representative to ITC Building
UN Organizations-Geneva 54 Rue de MontbrillantGeneva, Switzerland
(mailing address: PO. Box 104,1211 Geneva 20 CIC, Switzerland)
Tokyo Office Seigo Nozaki World BankDirector Kokusai Build ng
1-1, Marunouchi 3-chomeChiyoda-ku, Tokyo 100, Japan
Regional Mission G. David Loos World Bankin Eastern Africa Director Extelcoms House
Ha le Selassie AvenueNairobi, Kenya
(mailing address: PO. Box 30577)Regional Mission Serge Guetta World Bank
in Western Africa Chief Immeuble Shell64 Avenue LamblinAbidjan, Ivory Coast
(mailing address: B.P 185C)Regional Mission Hendrik van der Heijden World Bank
in Thailand Chief Udom Vidhya Building956 Rama IV RoadSala DaengBangkok 5, Thailand
Afghanistan Resident Representative c/o UNDPPC. Box 5Kabu , Afghanistan
Bangladesh Alexander Storrar Resident Mission, World BankChief 222 New Eskaton Road
Dacca, Bangladesh(mailing address: G.PO. Box 97)
Bolivia Mahmood A. Ayub Banco MundialResiden. Representative Edificio Banco Nacional de Bu/via (43 Piso)
Avenida Camacho Esq. Ca le ColonLa Paz. Bolivia
(mailing address: Casil a 8692)Burundi Jerome F Chevallier World Bank
Residen, Representative 45, Avenue de la PosteBujumbura, Burundi
(ma ling address: B.P 2637)Cameroon Raymond Rabeharisoa World Bank
Resident Representative Immeuble ConcordeAngle Avenue El Hadj Ahmadou Ahidjo
et Avenue J. F KennedyYaounde, Cameroon
(mailing address: B.P 1128)Colombia Alfredo D. Gutierrez Banco Mundial
Resident Representative Edifciio "Aseguradora del Valle"Carrera 10, No. 24-55 (Piso 17iBogota D.E., Colombia
(mailing address: Apartado Aereo 10229)

Bank/IDA Appendices 209
Appendix 9
Ethiopia Resident Representative World Bank Resident Missionl.B.TE. New Telecommunications
Building (First Floor)Churchill RoadAddis Ababa, Ethiopia
(mailing address PO. Box 5515)Ghana Resident Representative World Bank Resident Mission
c/o Royal Guardian ExchangeAssurance Building, Head Office
High StreetAccra. Ghana
(mailing address: PO. Box M27)India Jean-David Roulet World Bank Resident Mission
Chief New Delhi, India(mailing address: PO. Box 416)
Indonesia Russell J. Cheetham World Bank Resident Staff in IndonesiaDirector Arthaloka Building (8th floor)
2 Jalan Jendral SudirmanJakarta, Indonesia
(mailing address: PO. Box 324/JKT)Mali Michael J. Furst World Bank
Resident Representative Quartier du Pontrue Square LumumbaBamako, Mali
(mailing address. B.P 1864)Nepal Richard G. Abbott World Bank
Resident Representative R.N.A.C Building (First Floor)Kathmandu, Nepal
(mailing address: PR. Box 798)Nigeria Ronald H. S. Fennell World Bank
Resident Representative 30 Macarthy StreetLagos, Nigeria
(mailing address: PO. Box 127)Pakistan Wolfgang E. Siebeck Resident Mission, World Bank
Chief Islamabad, Pakistan(mailing address. PO. Box 1025)
Peru Elkyn Chaparro Banco MundialResident Representative Avenida Centrai 643 (1° Piso)
San IsidroLima, Peru
(mnailing address: Apartado 4480)Rwanda Jerome F Chevallier World Bank
Resident Representative Kigali. Rwanda(mailing address: PO. Box 609)
Saudi Arabia Guy de Lusignan World Bank Resident MissionDirector Riyadh, Saudi Arabia
(mailing address: PR. Box 5900)Senegal Resident Representative World Bank
Immeuble S D.l H.3, Place de lI'ndependanceDakar, Senegal
(mailing address B.P 3296)Somalia Ali N. Memon World Bank
Resident Representative c/o Somali Commercial & SavingsBank Building (4th Floor)
Mogadishu, Somalia(mailing address: PO. Box 1825)
Sri Lanka David Thomas World BankResident Representative People's Bank, Head Office (lOth Floor)
Colombo 2, Sri Lanka(mailing address: PR. Box 1761)
(continued)

210 Bank/IDA Appendices
World Bank Offices (continuedJ Appendix 9
July 1, 1981
Sudan Shawki Farag World BankResident Representative 28 Block 2H, Baladia Street
Khartoum, Sudan(mailing address: PO. Box 2211)
Tanzania Robert H. Nooter World BankResident Representative N.I.C. Building (7th Floor, B)
Dar es Salaam, Tanzania(mailing address: PO. Box 2054)
Upper Volta Mamadou Dia World BankResident Representative Avenue Monseigneur Thevenoud
Ouagadougou, Upper Volta(mailing address: B.P 622)
Zaire Roberto Chadwick World BankResident Representative Building UZB, Avenue des Aviateurs
Kinshasa 1, Republic ot Zaire(mailing address: PO. Box 14816)
Zambia Resident Representative World BankKulima Tower (13th Floor)Katunjila RoadLusaka, Zambia
(mailing address: P.O. Box 35410)


World BankHeadquarters:1818 H Street, NW.Washington, D.C. 20433, USA.Telephone: (202) 477-1234
Cable address: INTBAFRADWASHINGTONDC
European Office:66, avenue d'lena75116 Paris, FranceTokyo Office:Kokusai Building1-1 Marunouchi 3-chomeChiyoda-ku, Tokyo 100, Japan