I S 1 50 - World Bank Documents
146
I S 1 50 Latini Anmerica in (I the Caribbean Technic' 4 l Departmiienlt Regional ZTM!iies Prograiii Report No. 29 The Design and Administration of Intergovernmental Transfers by Donald R. Winkler Advisory Group July 1993 Papers in this series are not formal publications of the World Bank. They present prelimninary and unpolished results of country analysis or research that is circulated to encourage discussion and comment; any citation and the use of this paper should take account of its provisional character. The findings, interpretations, and conclusions expressed in this paper are entirely those of the author(s) and should not be attributed in any manner to the World Bank, its affiliated organizations, members of its Board of Executive Directors or the countries they represent. Public Disclosure Authorized Public Disclosure Authorized Public Disclosure Authorized Public Disclosure Authorized
-
Upload
khangminh22 -
Category
Documents
-
view
2 -
download
0
Transcript of I S 1 50 - World Bank Documents
I S 1 50Latini Anmerica in (I the Caribbean
Technic'4 l Departmiienlt
Regional ZTM!iies Prograiii
Report No. 29
The Design and Administrationof Intergovernmental Transfers
by
Donald R. Winkler
Advisory Group
July 1993
Papers in this series are not formal publications of the World Bank. They present prelimninary and unpolished results of country analysis or research that
is circulated to encourage discussion and comment; any citation and the use of this paper should take account of its provisional character. The findings,
interpretations, and conclusions expressed in this paper are entirely those of the author(s) and should not be attributed in any manner to the World Bank,
its affiliated organizations, members of its Board of Executive Directors or the countries they represent.
Pub
lic D
iscl
osur
e A
utho
rized
Pub
lic D
iscl
osur
e A
utho
rized
Pub
lic D
iscl
osur
e A
utho
rized
Pub
lic D
iscl
osur
e A
utho
rized
Abbrevialtions and Acronyms
CAC Cifizen Advisory CommitteeCOPLADES State Committees of Planning for Development/
Comites Estatales de Planeaci6n para el DesarrolloCUD Single Development Agreements/
Convenios Unicos de DesarrolloEDUCO Education with the Participation of the Community/
Educaci6n con Participaci6n de la ComunidadFAPEM Fee-for-Searvice System for Reimbursing Municipal
Health Clinlics/Facturaci6n por Atenci6n Prestada en EstablecimientosMunicipalizados
FMS Municipal Solidarity Fund!Fondo Municipal de Solidaridad
FNCV Rural Roads National Fund!Fondo Nacional de Caminos Vecinales
GAO General Accounting Office of the U.S. CongressHSAS Health Service AreasIVA National Sales Tax/
Impuesto de Valor AgregadoLO Local OrgarzationLSC Local School CouncilMOH Ministry of HealthNGO Non-Governmental OrganizationOMB Office of Management and the Budget of the U.S.
PresidentSIF Social Investment FundSUDS Unified and Decentralized Health System!
Sistema Unilicado e Decentralizado de SaudeSUS Single Health System/
Sistema Unificado de SaudeUSGAO United States General Accounting Office
Contents
Excutive Summary ... . .. i
Chapter E Introduction ...... 1.. IA. Efficiency. . . . ... . . 1. . . 2B. Equity ;.. 4C. The Implementation Chalenge. 5
Chapter II: Finance and Provision Assinments .. 7A. General Principles.. 7B. The Decentrlization Process. 9C. Assignments in Education, Health, and Rural Roads. 12D. Central Governmental Objectives in Intergovenimental Finance. 17E. Cases in Sectoral Decentralization .21
Chapter m: LAC Experience With Intergovernmental Transfers . .25A. Principles of Grant esign .25B. Formula Grant for Primary Education. 31C. Cost Reimbursement Grants for Primary Health Care. . 34D. Competitive Grants for Rural Road Projects. ... 37
Chapter IV: Grant Design: Simulations for Education, Health, and RuralRoads .. 39A. Generl Principles ................ 39B. Education ........ 41....... . . 41C. Pimary Health Care .46D. Rural Roads ... 50E. Summary .56
This report was prepared by Donald R. Wmnkler. Significant contibutions on background work for the study weremade by Hernando Garzon, Edward Gnmich, Bejyl Radin, Alec Gershberg, Taryn Rounds, and James Wesbery.The study has benefitted grey from the guidance siod comments of Gary Reid, Maureen Lewis, Wlliiam Diliinger,James Hicks, Jerry Silverman, Tim Campbell, Waleed Malik, Juan Prawda, and James Fems. Andrea Guedes andLeena Mangrulkr assisted in prepaing the final version.

Improwng the Quliy of Pwiaiy Educatin in Lain Ammea and the Canibbea Towards the 21st Centwy.
Chapter V: Administration of Fiscal Transfers ......................... 59A. Administrative Punctions: Grantor ..................... 59B. AdminisaiveFunctions: Grantee ...................... 66C. StngtheningGrantAdministration ..................... 69D. Assessing Administrative Capacity ...................... 72
Chapter VI: Accountability in Fscally Decentrlized Sytems . .77A. Introduction . 77B. Accountabilityto Whom 777C. AccountabEityforWhat? . 78D. What Mechanisms? .79E. Facflitating Conditions . 81F. Recommendations for Accountability to the Local Electorate .88
Chapter VII: Conclusions and Recommendations .89
Bibliography: .93
Background Studies:
X R. Hemando Garzon, Intergovernmental Fscal Transfers forHighway Construction and Maintenance: The Case of Colombia
* Alec Ian Gershberg: Highway Finance and IntergovernmentalTransfers: A Comparative Study.
* EEdward M. Gramlich, Decentralization and Grants: Strategiesfor Organizing the Public Sector to Promote Development.
* Beryl A. Radin, Institutional Issues in Grants Design andAdministration.
* Taryn Rounds, Education Fnance in Chile.
* Donald R. Wmkler, Educational Grant Design andAdministration in the U.S.

Contzs
Annexes
Annex A: Primary Education: CbileTable A.1: Variable DefinitionsTable A.2: Central Government Trasfers For Education: Implicit FonnulaeTable A.3: Municipal Finance of Education in Chile
Annex B: Primary Health Care: ChileTable B. 1: Variable DescriptionTable B.2: Characteristics of the Population in Public and Private Health Systems in ChileTable B.3: Municipal health finance per beneficiaryTable B.4: Distribution of FAPEM per Capita Based On Actual Service Use and Service
CostTable B.5: Distribution of FAPEM per Beneficiary Based on Measures of Demand for
ServicesTable B.6: Public Health UsersTable B.7: Health Expenditures per CapitaTable B.8: Determinants of Zone Classification WeightsTable B.9: Demand For Child Services
Annex C: Rural Roads: ColombiaTable C. 1: Central Government Transfers to Municipalities for Rural Roads: Implicit
FormulaeTable C.2: Municipal Government Matching Rates (%) for Expenditures on Rural Roads:
Implicit FormulaeTable C.3: Municipal Government Matching Expenditures on Municipal Rurl RoadsTable C.4: Variable Means by Municipal Classification
Annex D: Simulations for Education GrantsTable D. 1: Alternative Grant Designs for Increasing Education ExpenditureTable D.2: Distribution of Education Finance by Altemative Grant DesignTable D.3: Leverage of Central Government FinanceTable D.4: Total Cost of Alternative G3rant Designs for EducationTable D.5: Effects of Altemative Grant Designs on Expenditure and Finance: Low vs. High
Poverty RatesTable D.6: Effects of Alternative Grant Designs on Expenditures and Finance: Low vs.
High Fiscal CapacityTable D.7: Effects of Alternative Grant Designs on Expenditures and Finance: Low vs.
High Educational Achievement

Improving the Qualay of Primary Education in Latin America and the Canibbean Towards the 21st Centuy.
Annex E: Simations for Health GrantsTable E.1: Alternative Grant Designs for Health Transfers to Municipalities
Table E.2: Distribution of Health Finance by Alternative Grant DesignTable E.3: Effects of Altemnative Grant Design on Expenditure and Finance: Low vs. High
PovertyTable E.4: Effects of Altemnative Grant Design on Expenditures and Finance: Low vs.
High Fiscal CapacityTable E.5: Effects of Altemnative Grant Design on Expenditures and Finance: Low vs. High
Biological/Physiological Health Need
Annex F: Simulations for Rural Road GrantsTable F. 1: Distribution of Rural Road Grants by Altemative Measures of Need

Contents
Text Tables
Table 2.1: Education: Finance and Provision Assignents .................s 13Table 2.2: Primary Health: Finance and Provision Assignments ............. 14Table 2.3: Rural Roads: Finance anid Provision Assignments ............... 15Table 3.1: Typology of Categorical Grants with Examples ................ 27Table 4.1: Policy Choices for Additional Education Grants ................ 41Table 4.2: Policy Options for Health Transfers ........................ 47Table 4.3: Effects of Altemative Grant Designs on Central Government Transfers
to the Departments for M[unicipal Rural Roads ................. 52Table 4.4: Simulation Results for Municipal Matching Rates in Tolia .... ..... 55Table 5.1: Grant Administration: Functions and Responsibilities ............ 61Table 5.2: U.S. State and Local Grant Administration Responsibilities ... ...... 67Table 5.3: Grant Administradon Requirements: The Grantor .70Table 5.4: Grant Administration Requirements: The Grantee .72Table 5.5: Checklist to Assess Grant Administration Capacity .73
Trex Figures
Figure 3.1: Average Grants and Expenditures for Education inChile Municipalities .3.2. 32
Figure 3.2: Average Grants and Expenditures for Primary Health CareIn Chile Municipalities .35
Figure 3.3: Municipal Share (%) for 196 Municipalities .................. 37Figure 3.4: Grants for 196 Municipalities .38Figure 4. 1: Percentage Equalizing Grant ............................ 42Figure 4.2: Changes in Municipal Firance .................. ......... 43Figure 4.3: Changes in Education Finance for Low and High
Fiscal Capacity Municipalities .......... ................. 44Figure 4.4: Change in Education Finance for Low and High Poverty
Municipalities ................... 45Figure 4.5: Municipal Share of Total Primary Health Care Finance 48Figure 4.6: Low and High Fiscal Capacity Municipalities .48Figure 4.7: Low and High Poverty Municipalities ...................... 49Figure 4.8: Average FNCV Grants and Municipal Expenditures for
Rural Roads in Colombia, Aggregated by Departnent .... ......... 53Figure 4.9: Index of Extent to Which Evaluation Criteria Satisfied
for Central Government Grants to the Departnents .... ........ 54Figure 4.10: Index of Extent to Which Evaluation Criteria Satisfied for
Department of Tolima Gr;nts to Municipalities ..... .......... 56
hIprovzng the Qualiy of Pimiy Education in Lauin Ametica and the Caribbean. Towards the 21st Ceawy.
Text Boxes
Box 2.1: Decentralization Gridlock in Venezuela ..................... 10Box 2.2: Municpaliztionof Health Care in Brazil .................... 11Box 3.1 Colombia's Block Grants to Regional Governments for Social Services . . 28Box 3.2 Municipal Finance of Primary Education in Chile ..... .......... 33Box 3.3 Municipal Finance of Primary Health Care in Chile ..... ......... 36Box 5.1 Administration of U.S. Government Grants ................... 60Box 6.1 School Advisory Boards in Mexico and El Salvador .... .......... 80Box 6.2 Participation as Grant Conditionality in Social Funds .... ......... 82Box 6.3 Community Participation in Panama Health Clinics ..... ......... 83Box 6.4 Local School Councils with Broad Powers ................... 85Box 6.5 Effectiveness of LocalOrgazations . ...................... 87

Execuitive Summary
1. Historically, government in the Latin America and Caribbean Region has been highlycentralized. In the past decade, a few countries have legislated devolution and sharing ofimportant responsibilities to subnational govemments, and, currently, most countries are eitherimplementing that legislation or plannirLg new decentralized arrangements. Paradoxically,decentraliztion, which reduces the powers of the central government, requires that the centralgoveniment play a strong role in ensunng an appropriate enabling environment for its success.An important characteristic of decentralized government almost anywhere in the world is asystem of intergovernmental transfers fromn the center to regional and local jurisdictions. Thesetransfers serve many functions, including that of being a central government policy tool toensure that decentralized services with important national public good characteristics orsubstantial interjurisdictional spillovers are provided and distributed efficiently and equitably.
2. This study reviews the principles and practice of designing and administering sector-specific intergovernmental transfers. ResDurce constraints have required that the scope of thestudy be limited to selected issues and sectors. Thus, some important intergovernmental issues-such as contributions of subnational governments to fiscal deficits, administrative difficultieslocal governments face in producing services, and strategies for implementing decentralization--are not treated in depth. Also, the study treats only intergovernmental policies and does notconsider pnvatization as a policy option. The design of transfers and the resulting behavior oflocal governments is analyzed in three sectors-primary education, pnmary health care, and ruralroads. Cross-sectional data on local governments in Chile and Colombia were assembled andanalyzed for this analysis.
3. The scope of this study has also been constrained by the paucity of scholarly literatureon the topic, especially as related to developing countries. While there is a general publicfinance literature on grant design, it offers few practical insights for the design of grants in adeveloping country context, and, indeed, developed country transfer systems bear littleresemblance to the recommendations of this literature. The relatively small number ofcategoncal grant designs in LAC combined with limited information on subnational governmentshas resulted in very few published analyses of LAC experience; the most useful assessments ofLAC grants is found in World Bank sector work completed over the past couple of years. Theadministration of intergovernmental transfers has, also, received very little attention in theliterature; the most useful analyses of this topic were generated by the U.S. General Accounting

a The Design andAnhhiradon of lnergovennaTrasfems
Office in the 1970s in response to administrative problems found in the large and complex U.S.federal grant system. The administrative problems of grants are rrely the focus of studies byLAC scholars.
The LAC Context.
4. The effort to decentralize in LAC confronts serious obstacles both at the central and thesubnational levels. Revenue-raising is highly centralized, and subnational governments havevery little discretionary authority to raise revenues and do a poor job of collecting revenues fromthe few sources they control. Expenditure assignments are often not clear and are poorlyimplemented. Central government sectoral ministries have not been restructured to supportdecentralization. Intergovernmental transfers tend to either take the form of revenue-sharngor ad hoc, negotiated block grants, neither of which provide adequate incentives for efficiencyand accountability. Information on the finance and performance of subnational governments iseither lacking or out-of-date. Financial monitoring and review of subnational governments iseither nonexistent or so intrusive as to seriously constrain their autonomy.
Finance and Provision Assignmens.
5. Central governments have an important continuing role to play in a decentralized system.Wihin idecentralized services, there are some normative, policy-setting, informational, andtechnical assistance functions which central government ministries should continue to perform;thus, decentralization requires a restructuring of central government ministries towards improvedcapacity in these areas and away from direct service provision.
6. For decentalized public services with significant national public good characteristics orwhere the benefits spill over jurisdictional boundaries, the central government has an additionalrole of ensunng the efficient and equitable provision of decentalized public services. Theseobjectives can be pursued either through mandates and regulations on subnational governmentsor through intergovernmental grants, which combine incentives and grant conditionality.
7. Neither mandates nor incentive-based grants will function well if the finance andprovision assignments across governments of specific services are not well-defined; if theinformation system does not generate timely reports on the financial and output performance ofjurisdictions; and if there is no mechanism by which this performance can be systematicallyreviewed and penalties assessed in the case of deficient performance or rewards given forexceptional performance.
LAC Experience with Intergovernmental Transfers
8. The functioning of sector-specific intergovernmental transfers is evaluated for primaryeducation, primary health care, and rural roads. There are three reasons for selecting thesespecific services. First, they are among those most frequently being decentralized to subnationalgovernments in current LAC decentralization efforts. Second, when they are decentralized to

Eecadve Szwmary iu
subnational governments, education and health alone often represent over half the totalsubnational government budget. Third, these are services where there are often importantcontinuing central government objectives; even after decentralization.
9. Examples of innovative sector-specific grant designs are identified for each of these threesectors, and the effects of these designs are analyzed. The lessons learned from this review areof general applicability to the Region. The cases selected for review are: primary education inChile, pIimary health care in Chile, and rural roads in Colombia. All three gralts areestablished by law and are reasonably' transparent in their allocation. The formula fordistributing primary education cash grants in Chile is set by law. In addition, municijpalitiesreceive less transparent, rn-kind central government grants in the form of textbooks and schoollunches for poor children. The procedure for reimbursing primary health care expenditLtres bymunicipalities in Chile is also set in law, but the allocation of total allowed reimbursements permunicipality has untl recently been determined at the discretion of central government regionaladministrators. Finally, the procedures for selecting projects and setting cost-sharingcontnbutions for grants to municipalities for rural road construction and maintenance mColombia are set in law, but the implementation details are left to the Rural Roads NationalFund.
10. In primary education, Chile provides a per student grant to municipal schools, which onaverage covers 90 percent of costs. This grant establishes the national minimum educationexpenditure per pupil, and its high level results in a relatively high degree of equality inspending. But the high estimated elasticity of municipal education finance with respect tomunicipal general revenues results in significantly higher per pupil spending in municipalitieswith high fiscal capacity and a significant worsening in expenditure equality. The design of thegrant provides an effective incentive for schools to minimize student absenteeism from class.
11. Chile reimburses municipalities for the cost of providing primary health care whichmiainly covers preventative and maternal and child health care. When this grant was firstintroduced, municipalities responded by rapidly expanding the delivery of health services. Theconsequent budget pressure on the central government led to reductions in reimbursement ratesand ceilings on total transfers to each murnicipality; the result is that the central government onaverage covers 75 percent of total municipal health care spending. As with education, arelatively high elasticity of municipal health finance with respect to their general revenuesgenerates inequalities in spending per capita or per beneficiary. The fact that reimbursementrates are smaller than the cost of providinrg services provides an incentive for municipalities tominimize service costs; this incentive is to) some extent offset by the ability of municipalities toappeal to regional health administrators for an increase in transfers beyond the establishedceiling.
12. In Colombia, municipalities prare project proposals for rural roads, which aresubmitted to the Rural Roads National Fumd for evaluation; the winning proposals are fundedbased on a matching grant rate established by formula. The matching rate is very low, andmunicipalities with high fiscal capacity receive larger grants on a per capita basis, in part due

iv The Design and Admodstraion of itergovernmeaal Transfers
to the fct that a municipality's fiscal capacity is used to determine what size project it couldfinance and maintain. The low matching rate means municipalities have litde incentive topropose cost-effective projects, aside from competing successfully in the Fund's evaluationprocess. The fact that municipalities receive grants for construction but not routine maintenanceprovides an incentive to municipalities to under-maintain roads.
Alternative Grant Designs.
13. Central governments have multiple and conflicting objectives concerning the servicesprovided by subnational governments in decentalized systems. The design of intergovernmentalgrants affects the degree to which these objectives are attained. The effects of grants in tumdepend on the institutional context and the behavior of the grant recipients, the regional or localgovernments. Hence, grant effects, including tradeoffs between central government objectives,can only be analyzed in a country-specific and sector-specific context. A variety of alternativegrant designs are simulated for primary education, primary health care, and rural roads, usingdata sets on municipalities in Chile and Colombia. These grant designs are defined inChapter m.
14. For education, the design alternatives include a percentage equalizing grant where the sizeof the grant varies inversely with a municipality's fiscal capacity and a variable matching grantwhere the municipality's matching rate varies positively with its fiscal capacity; these alternativesare simulated with and without a minimum per pupil expenditure condition.
15. For health, the grant design altematives include a health grant per capita similar to theexisting education grant and an open-ended matching grant; again, both designs are simulatedwith the addition of a minimum per capita expenditure or maintenance of existing municipalhealth expenditure requirements.
16. For rural roads, the simulation is consistent with current decentralization legislation inColombia which would require the regional governments to act as a pass-through agency to themunicipalities. First, the size of the per capita grant to the regional govemment is simulated,using a number of different criteria. Second, the size of the matching rate to be applied on theproject grants awarded municipalities by the regional governmental is simulated for one region;one formula uses only municipal fiscal capacity to determine the matching rate, while anotherformula includes poverty rates and fiscal effort in addition to fiscal capacity.
17. The simulations demonstrate that central govenmment objectives are often conflicting, anddetermination of the single best grant formula requires that priorities be set on those objectives.In addition, the simulations provide evidence in support of several other conclusions: (1) asimple grant design can often attain central government objectives as well as a complex design;(2) price incentives, especally in the form of variable matching grants, can work as well asmandates in raising expenditures and contributions by grant recipients; (3) when using priceincentives, the average matching rate has to be significant to realistically attain spending andfinance objectives; (4) in the absence of appropriate incentives, regulations in the form of either
Eaccdve Swnma,y v
minimum ependiture mandates or mainltnance of expenditure effort requirements are nieededto prevent grant recipients from reducing their own financial effort; and (5) a central governmentcan best leverage the effect of its transfers on total expenditures by including some measure ofthe local jurisdiction's ability to finance, or fiscal capacity, in the grant formula.
Grant Administation.
18. Grant administration by the central govenment requires the capacity to design the grantfor efficiency and equity; to write transparent implementing regulations; to monitor and reviewfinancial flows and related grant conditionality; to provide operational control and review ofgrant-funded programs; and to evaluate ihe distribution and impact of grants on performance.Most of these activities fall under the purview of the sectoral ministry, and some could becontracted if in-house capacity does not exist, but the important task of ensuring financialaccountability to the central government typically lies outside the sectoral ministies and piovidesa serious constraint to both appropriate grant design and to decentralization. Strong publicfinancial management is at least as imzportant for decentralized as centralized systems ofgovernment.
19. The regional or local government receiving the grant also has important administrativeresponsibilities, especially in preparing proposals and keeping accurate and timely financialaccounts that provide the information required for review and audit. Steps which could iraprovesubnational government administrative aLpacity include: revised public administration laws torequire modern financial accounting and auditing; earmarked portions of grant funds to coveradministrative costs; the establishment of separate legal entities to receive funds and administergrant-funded programs; creation of central government-financed centers to administer theaccounts of several small jurisdictions; and establishment of effective incentives for the provisionof timely information.
Accountabili.
20. One advantage of a decentralizecd system is the potential it offers for using the localbeneficianes or local citizenry to help monitor the finance and performance of grant-financedservices provided by the subnational jurisdiction, including NGOs and community organizations.This requires an adequate govemance mechanism at the local level and institutionalized citizenparticipation.
21. Cost-sharing and information play important roles in the relationship between citizenparticipation and accountability. Cost-sharing provides the stimulus for ciizens to demandaccountability from service providers, while information on financing, costs, and outputs providethe basis for objectively evaluating performance. In addition, case studies of effective citizencouncils shows that they must have real ciecision-making authority, and they require taining asto their appropriate roles and functions. The accumulated evidence to date suggests thatrequiring citizen participation as grant conditionality could improve accountability to

n The Desgn and A&niiration of Intergovro_nenu Traofers
beneficiaries and could complement central govemment grant administration in helping malizethe efficiency potential of decentrliztion.
Conchlsions.
22. Decentralization offers the potential for efficiency gains and the danger of worsenedequity. The central government can play an important role in establishing the enablingconditions for efficiency and in avoiding worsened equity through the appropriate assignmentof expenditure and finance responsibilties and the appropriate design of intergovernmentaltransfers, especially for those locally-provided goods and services having national public goodcharacteristics or large spillovers of benefits to other jurisdictions. Implementation ofdecentralization, including intergovemnmental transfers, requires improvements in centralgovernment capacity, especially regarding financial management and the supply of publicinformation on subnational government performance. In a decentralized system, accountabilityto the central government for the use of grant funds must be complemented by accountabilityby service providers to the community; cost-sharing and the establishment of citizen groups withreal decision-making authority can strengthen local institutional accountability.
23. The Bank is financing a number of efforts important for the success of decentralizationefforts: strengthening public financial management, encouraging the collection and publicreporting of perfornance indicators, and encouraging citizen participation and the establishmentof community organizations to provide services. The Bank has also in its policy dialogues withgovernments advocated the establishment of predictable and transparent intergovenmentaltransfers with incentives for sound financial management.
24. For the Bank to play its role in supporting government decentalization policies willrequire more of these same efforts, with increased attention to the design and administration ofintergovernmental transfers at the sector level. Country decentralization policies andimplementation strategies and the adequacy of the enabling environment for decentralizationshould be assessed when the country assistance strategy is formulated. Sector studies shouldassess decentralization policies and strategies of the sector, identify factors in the enablingenvironment outside the sectoral ministry's control, and develop alternative means ofstrengthening sectoral accountability at the level of the jurisdiction providing the service.Sectoral projects which support decentralization should include an assessment of the design andadministation of intergovernmental transfers. The Bank should contnue to strongly encouragegovernments to adopt transparent, formula-driven intergovernmental grants.

Irntroduction
1. In recent years a number of countries in the Latin America and the Caribbean Region(LAC) have, often with World Bank supAort, initiated encouraging reforms of the state. Thesereforms seek to improve public sector effectiveness and efficiency, including redefining the roleof the state. An important reform element in many countries of the Region is governmentdecentralization. Subnational governmenits in LAC now account for 28.5 percent of total publicsector expenditures, and this share contnmues to grow. While lower than the 47.6 percentaverage found in federal systems (e.g., Australia, India, U.S.), it is higher than that of strongunitary systems (e.g., 17.8 percent in Fiance).
2. Decentralization includes a redefinition of the role of the central government withincreased emphasis on setting policy, firancing, and ensuring efficient and equitable provisionof services by regional and local government.1 Decentralization offers the potential forimproved public sector efficiency and accountability, but the lack of appropriate policies andweak intergovernmental institutions can lead to fiscal mismanagement, resource misallocation,and inequity in service provision. The principal instruments available to the central governmentto tackle these problems are fiscal transfer policies and strong financial management of thedecentralized system.
3. To be successful, decentralization must improve public sector efficiency and, at leaLst, notworsen equity. For some publicly financed goods and services, this can be accomplished byallowing subnational jurisdictions autonomy in determining expenditure levels and resourceallocation. But other goods and services with significant interjurisdictional spillovers or nationalpublic good characteristics are unlikely to be provided either efiiciently or equitably in theabsence of central government sector-specific financing and policy setting. Primary education,prinary health care, and rural roads are services which arguably fall in this category and whichare examined in some detail in this study.
This paper is only concerned with the type of decmtralizaion where finnce and provision responsibilitiesare sbared by two or more levels of government.
2 The Design and A&Wnisiraoion of Insergovermmal Transfers
4. Some of the institutional requirements for successfiul decentralization for this categoryof goods and services are: (1) clear, stable revenue and expenditure assignments; (2) transparentand predictable service-specific intergovernmental transfers; (3) public infornation (i.e.,available and accessible) on the finances, cost, and performance of the sector; and (4)governance structures which permit citizens to hold local or regional government officialsaccountable for sector performance. Paradoxically, decentralization, which reduces the powersof the central government, requires that the central government change the nature of itsresponsibilities and play a strong role in ensuring that these institutional requirements are met.
5. This study examines these requirements for selected sectors and countries in LAC.Chapter I concludes with a review of the possible efficiency and equity consequences ofdecentralization. Chapter II examines finance and provision assignments in primary education,primary health care, and rural roads. Chapter m defines alternative grant designs and evaluatesselected LAC experience with categorical grants for these services. Chapter IV simulatesalternative grant designs and their distributional impacts. Chapter V assesses the administrativerequirements for categorical grants in aid. And Chapter VI looks at the role of governancestructures, especially citizen participation, in ensuring accountability. Finally, Chapter VII3ummarizes the findings and recommendations of the study.
6. Resource and time constraints result in several important issues in decentralization andthe role of government which are not treated in this paper, including: the impact ofdecentralization on fiscal deficits, the capacity of subnational governments to deliver services,the political economy of implementing decentralization policies, and transferrng responsibilityfor financing and providing govemment services to the private sector. The design andadministration of intergovernmental transfers can clearly affect fiscal deficits, modes of servicedelivery, and the political feasibility of the transfer of financing and service provisionresponsibilities, but each of these issues requires its own study.
A. Efficiency.
7. The promise of decentraliztion is improved efficiency in the delivery of those goods andservices which can be provided and financed by subnational governments. This promise has fouraspects. First, local (or subnational) provision and finance can make government moreresponsive to individual preferences. Second, local decision-makers can use information aboutjurisdiction-specific conditions and prices to deliver services more efficiently. Tird, increasingthe number of providers can result in innovations that reduce costs or improve service delivery.And, fourth, citizen perception of the opportunity costs of inefficient government can result indemands for accountability from the providers.
8. While the potential of decentralization for efficiency improvements appears large, anumber of factors must exist for it to be realized. There must exist some governance structureor public choice mechanism (e.g., voting for local officials) by which local citizens can expresstheir preferences. Three options are possible: (1) election of general government officials whomake taxing and resource allocation decisions on behalf of the populace; (2) election of a

bhroduclion 3
service-specific board which makes taxing and resource allocations for that service only; and (3)direct democracy in which citizens vote an specific tax-expenditure referenda. All three optionsentil some degr of competition for votes on the basis of cost and performance in deliveringpublic services. The central government can encourage the strengthening of public choicemechanisms through the use of grant conditionality which requires citizen review and input tothe administrators of grant-financed services.
9. Given the public choice mechanism, the ability of citizens to hold locally-elected officialsaccountable depends on the public in^fom2ation they have regarding cost and performance in thedelivery of local public goods and services. If citizens cannot inspect the financial statementsof the jurisdiction, they cannot make informed inquiries regarding the use of funds. If theycannot observe the cost and performance of their jurisdiction's services relative to otherjunsdictions, they cannot effectively challenge local officials to do better. And if they cannotinspect the local tax rolls, they cannot question arbitrary tax exemptions. The centralgovernment has an important continuing role to play in producing and disseminating publicinformation and ensuring that citizens haNe access to the information required for accountability.
10. If the potential for satisfying local citizen demands is to be satisfied, local govemmentofficials must have the authonty to raise local revenues and, thus, determine local expenditurelevels. In the absence of this authority, local citizens must press their demands for increasedservices at the level of the central (or regional) government; local authorities cannot be heldaccountable for decisions they cannot make. Also, in the absence of this authority, citizens donot fully perceive the linkage between increased services and the cost of providing thoseservices. They may perceive that, within an overall revenue constraint set by the centralgovernment, increasing one service has an opportunity cost in terms of other services foregone,but the linkage to their own tax bill is absent.
11. If local officials are to be held accountable for the efficiency and effectiveness with whichgovernment services are delivered, they must have budgetary discretion, including therecruitment and pay of personnel, the contracting of goods and services, and the compositionof local expenditures. While the legislation governing local public administration may setoverall guidelines for civil service protection, procurement and contracting, and minimumservice levels, the accountability of local officials and their potential to efficiently provideservices based on local conditions diminishes as budgetary discretion is reduced. If the potentialinnovation benefits of decentralization are to be fully realized, local officials must also have thediscretion to choose to directly deliver services or to contract with private, non-govemmental,or other government organizations for their delivery.
12. Also, if local officials are to be held accountable, there must be clarity regardingexpenditure assigrnents. Lack of clarity provides an easy escape for any official called uponto defend the performance of an agency as well as an opportunity for the local jurisdiction tolimit its own financial contribution in hopes of shifting the burden to some other level ofgovernment.

4 The Desgn and Adidration of Intrrgovenemal Trwers
13. Finally, if jurisdictions are not in some way compensated for benefits which spill overtheir boundanes, they will not provide a socially efficient amount of the public serviceconcerned. Thus, efficiency requires that the central govermment compensate subnationaljurisdictions for spillovers; this is typically done through matching grants for the affectedservice.
B. Equity.
14. hust as the promise of decentralization is improved efficiency, the danger ofdecentralization is worsened equity, both between jurisdictions and between individuals. To theextent a jurisdiction's revenue is determined by its own tax or revenue base, interjurisdictionaldifferences in that base (fiscal capacity) generate interjunsdictional differences in revenues andgovernment services.2 The result may be both inefficient and inequitable. Individuals ofsimilar circumstances may receive very different treatment (in terms of services received relativeto taxes paid) depending on their jurisdiction of residence; this generates an incentive forindividuals (and sometimes firms) to locate in favored jurisdictions, resulting in a possible lossin economic efficiency.3 Differences in fiscal capacity can also adversely afect equity if thepoor are heavily concentrated in jurisdictions with low fiscal capacity and, as a result, receivelower service levels.
15. These potential efficiency and equity effects of decentralization provide arguments forcentral government grants to equalize partally fiscal capacity between jurisdictions. Severalcountries in LAC use revenue sharing funds for this purpose. Bmzl, for example, has both astate revenue sharing fund and a municipal revenue sharing fund which equalize pardally fiscalcapacity. Chile has a municipal common fund which redistibutes property tax revenue amongmunicipalities. Despite these attempts at fiscal equalization, there remain significant disparintesin fiscal capacity and government expenditures between jurisdictions.
16. The effects of disparities in fiscal capacity on service levels are especially important forthose services with important national public good characteristics (e.g., primary education andprimary health care) where the central government wishes to ensure some miIimum level ofexpenditures. One solution, simulated in Chapter IV, is to design service-specificintergovernmental transfers, the size of which is contingent on a jurisdiction's fiscal capacity.
17. In addition to the effects of decentralization on fiscal equity, the devolution of decision-maling power to lower levels of government can alter the distribution of services betweengroups in society. While it is difficult to predict whether or not the resulting distribution willbe more or less equitable, the central government is likely to play a continuing role in ensuring
2 Ajuisdiction's fisal capacity is geneally defined as the potential revenues that it could raise for a given setof rates; constraints on most subnational juriscictions authoity to set tax rates in LAC means fiscal capacity iseffectively the general revenues of the jurisdiction.
3 This efficiency argument for fiscal equity dates froM Buchanan (1950).
baroducion 5
against discmmination of minonties at the subnational level and ensunng that the poor and theespecially needy receive some minimurn level of services.4 This role requires regulation,possibly in the form of grant conditionality, and operational monitonng of subnationalgovernments to ensure minorities and the poor receive equal treatment. It also requirescategorical grant programs targeted on the poor and needy, who otherwise may not receiveadequate resources from subnafional authiorities.
C. The Implementation Challenge.
18. Decentralization offers rich potentlal in terms of improving efficiency and accountability,and it entails the danger of worsened equity. The potential can be realized and the dangeraverted if policies are designed and implemented appropnately. As noted above, these policiesinclude the right revenue and expendituire assignments, govemance institutions that permitbudgetary decisions to reflect citizen preferences, financial and performance information foraccountability, adequate capacity to administer policies and programs, and grants in aid to ensurean efficient and equitable supply of some services.
19. These conditions are not at present generally satisfied in Latin America. Most countriesare clearly in the beginning or middle of a transition to decentralized government and have notyet defined all the rules of the new intergovernmental arrangement; among other things,expenditure assignments are uncertin and unstable in several countries. Furthermore, theevidence to date is not promising that these conditions will be satisfied in the near future. Iftrue, decentralization efforts will soon be rejected as a failed experiment.
20. In most countries, subnational governments have extremely limited capacity to raise theirown revenues. Most own-source revenues are derived from shared taxes, but local authoritiescan almost never alter tax rates. This conistraint on the subnational government's revenues andaggregate expenditures translates into a continued dependence by local cidtzens on centralgovernments for revenue increases and service improvements. Aside from the overall budgetconstraint, subnational governments do k]ave a significant amount of budgetary discretion insetting wages and allocating monies across functions.
21. One area where significant progress has been made is in the election of officials at thesubnational level. In most countries, elections have preceded the effective decentralization ofresponsibilities. Chile is an exception because decentralization was implemented during anondemocratic regime. On the other hand, public information is woefully lacking. With veryfew exceptions, local governments fail to produce timely financial statements, and when they areproduced, their distribution is often limited to the central government. In any case, deficienciesin financial accounting and reporting mabk it difficult for experts, much less citizens, to interpretand evaluate results. Similarly, citizens have access to very little fonnal information regardingthe performance of their local agencies and how it compares to other communities.
4 Of course, there are red world examqles of centra governments themselves carying out explicitdiciinatory policies; in this discussion, we prsume the central government desires to protect minonty nghts.

6 Ihe Design and AdMniSraion Of ntergOeMena Transfers
22. Finally, the grants-in-aid found in LAC most often take the form of shared revenues, adhoc project grants, and negotiated block grants for particular sectors; even after distnbution ofthese grants, wide disparities in subnational govemment fiscl capacty often remains. Little useis made of formula-driven sector-specific grants which are transparent, provide predictablerevenues, and provide incentives or mandates to provide adequate spending on locally-providedservices in which there is a national interest. While cost-sharing is often used in project grants,matching grants for the finance of current services are not common.

II
Finance and Provision Assignments
1. Most countries in LAC are decentralizing government. The logical decentralizationprocess would, first, reassign expenditure authority and responsibility; second, reassign revenueauthority consistent with expenditure requirements; and, third, design a system ofintergovernmental grants to cover local government fiscal gaps between expenditures andrevenues and to correct the efficiency and equity problems inherent in a decentralized system.This chapter reviews the general principles of expenditure and revenue assignments; comparesrecent LAC decentralization experience vith these principles; demonstrates the complexity offinance and provision assignments for spxcific services in decentralized systems; describes theimportant role of the central government in a decentralized system and specifies its objectivesfor selected services; and provides the background for the three LAC cases which are analyzedin detail in the following chapter.
A. General Principles.
2. Both economic and administrative considerations are important in the analysis of theappropriate role and organzation of government. Government has three major responsibilities-macroeconomic management, ensuring efficiency in resource allocation (the allocative function),and the redistribution of income. OF these, macroeconomic management and incomeredistribution are typically seen as being primarily central government responsibilities, whileboth the central and subnational governments are responsible for allocative efficiency. If, forexample, local governments were to redistribute income, higher income residents would havean incentive to locate in those jurisdictions with few poor people, resulting in segregation bysocial class and seriously limiting the amount of income redistribution that could occur.
3. As with the private market place, allocative efficiency is attained when consumerspurchase goods up to the point where the value they assign to a marginal increase inconsumption equals the marginal costs of provision. The extension of this analysis to the marketfor government services is made difficult by the collective nature of the decision-making process.Consumers express their demand for government services through some governance mechanism,

8 Fmwace and Provision Assimnems
and they typically pay for those services through general taxes. If consumers have homogeneoustastes, all consumers will be satisfied by this arrangement. To the extent tastes areheterogeneous, few consumers will be exactly satisfied by the collective decision.
4. This imperfect (relative to the pnvate market) means of determining the supply ofgovernments services is furither complicated if the benefits of some government services arereceived by non-residents of the jurisdiction. In this case, the decision makers of a localgovernment, for example, would include only those benefits internal to the junsdiction in theirdecision-malang calculus, resulting in a socially inefficient underprovision of services. Ruralroads are one example of a publicly-provided good which generates this sort of inter-jurisdictional spillover. When government services generate large spillovers, there is anargument for moving responsibility for service provision to a higher level of government.Socially inefflcient provision also results if some portion of the tax burden is shifted to non-residents.
5. This analysis results in some general principles for the organization of government:
* Expenditure responsibilities should be assigned consistent with the spatial distribution ofbenefits.
* The spatial incidence of revenue sources should be consistent with the spatal incidenceof program benefits.
* Other things equal, services should be financed and revenues raised by the smallest unitof government possible (i.e., that minimum size which permits service costs and benefitsto be internalized) in order to provide the best possible match between the supply anddemand for public services.
* The responsibilities for income redistribution and economic stabilization should primarilylie with the central government.
6. Separate from the decision of how much to spend on a government service is how bestto produce that service. The options facing the central government are: (1) self-production, (2)contracting with private producers, (3) contracting with public producers, and (4) delegatingproduction to subnational governments. Each of these options entails principal-agent informationasymmetries, which affect production costs.'
7. Any rigorous application of these general principles is difficult. In particular, there isless than perfect information on the spatial distribution of benefits and taxes, and economies ofscale in both revenue collection and the production of services may partly negate the efficiencyadvantages of a decentralized system; and the costs of alternative options for service productionare often not known. Evaluating these options is difficult and beyond the scope of this paper,
5Tese are analyzed in greater detail in Feis and W er (1991).

The Design and Admhnration of Iraegoverneat Transfers 9
but the geneal principle is that the production of services should be armged so as to realizescale economies and minimize costs. This analysis is fuirter complicated when consideringpublic goods or services where some beniefits are national in nature and others are captured atthe regional or local level. In a decentralized system, the responsibility for the finance andprovision of these goods is typically shared by two or more levels of government. Primaryeducation and primary health care are two examples where governments often shareresponsibilities.
B. The Decentralization Process.
8. Decentralization processes in LAC vary widely across countries. They vary in terms ofthe clarity with which revenue and expenditure authority and responsibilities have beenreassigned; the rules established to govern the process; the level of subnational governmentwhich is given enhanced authority; and the use of community organizations or non-governmentorganizations (NGOs).
9. In some countries, such as Brazil, Colombia, and Venezuela, revenue assignments havebeen precisely defined, while expenditure assignments remain ambiguous. Thus, subnationalgovernments have received additional revenues, while central government expenditures remainrelatively unchanged. This result, of course, can contribute to the central govemment's fiscaldeficit. In other countries, such as Chile, expenditure assignments are clear, but theresponsibility for finance of some services has evolved over time and has been affected bychanges in the size of the central government deficit.
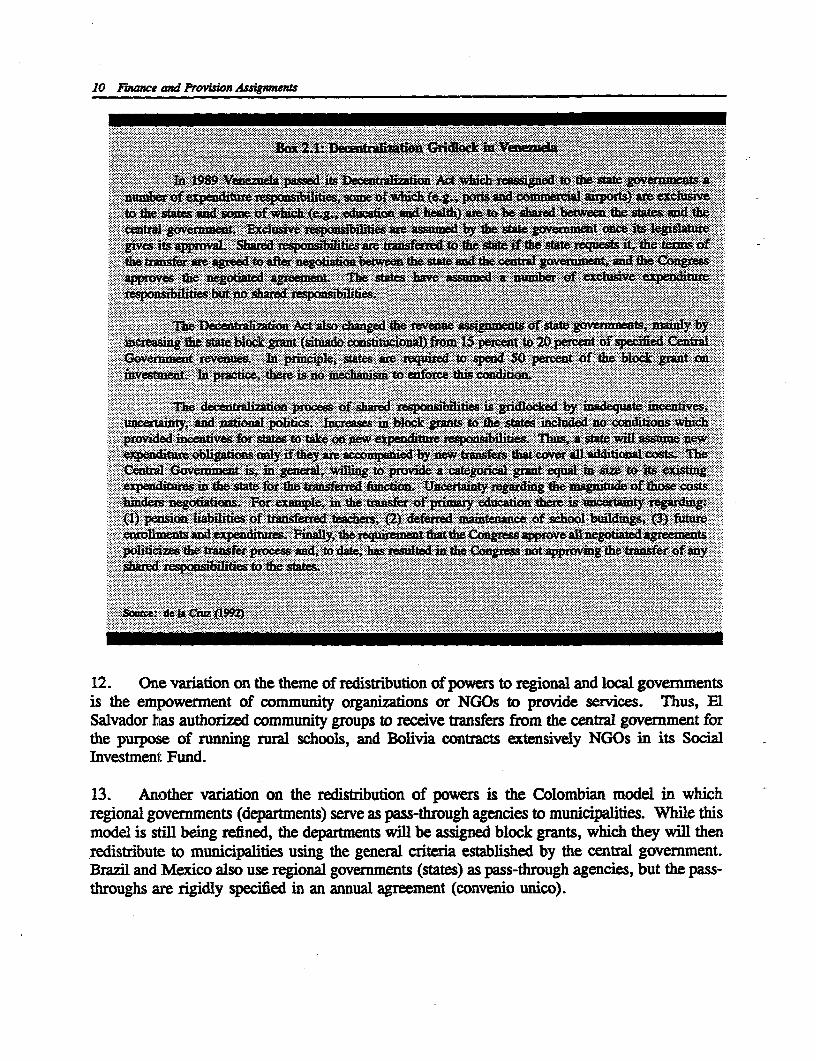
10. The rules of the game by whichi reWonsibilities are decentralized also differ betweencountries. Argentina, for exmmple, allocated additional revenues to provincial governments,which the central govenment could cut if the provinces failed to assume certain responsibilities(e.g., primary education). The result is that all provinces assumed the responsibilities.Venezuela, on the other hand, allocated additional revenues to state governments and promisedfurther revenues if the states would assume greater responsibilities, such as primary andsecondary education. The states, of course, win agree to assume those responsibilities only ifthe central government provides revenues which at least cover all additional costs of serviceprovision; the central government, on thde other hand, presumes that states should finance someportion of those additional costs from the new revenues already assigned to then. Thepredictable result, as described in Box 2.1, is decentralization gridlock.
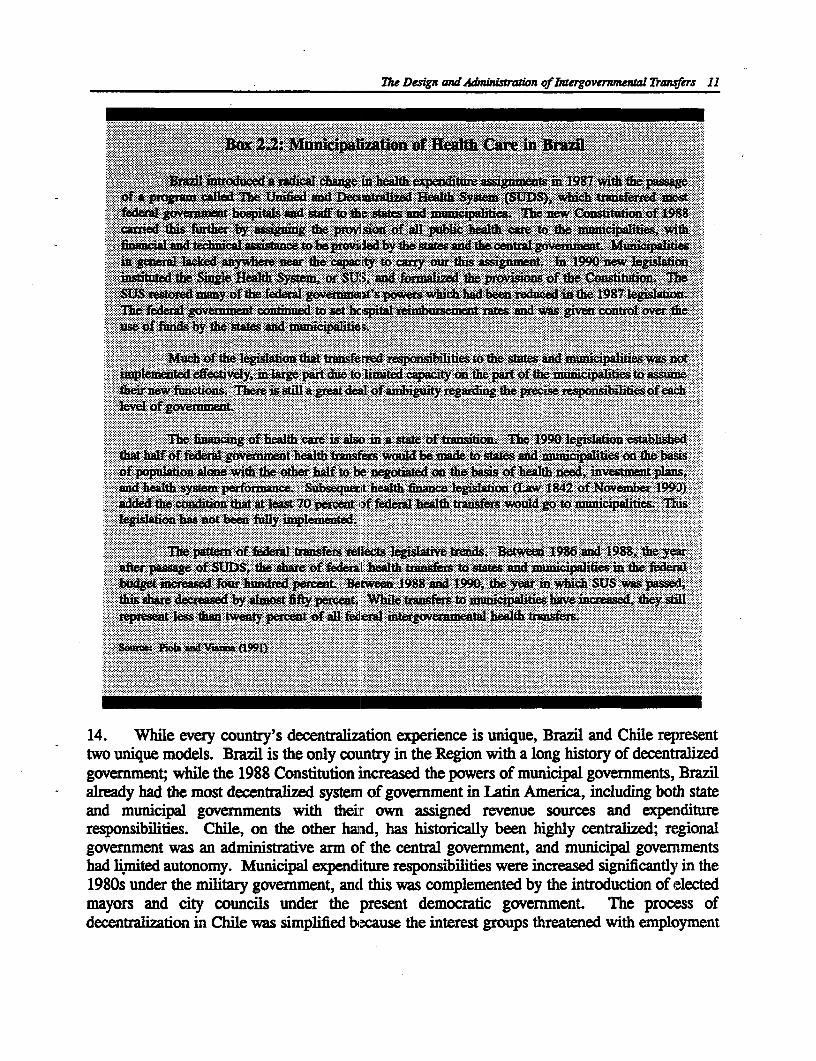
11. Decentralization varies, also, in terms of the level of subnational government assignednew powers. In some countries (Argentina, Colombia, Mexico, Venezuela) it is the regionalgovernment which has been given additional powers. In other countries (Brazil, Chile)municipal govemments have been assigned new powers. Sometimes the politics of the processdominate other considerations, resulting in powers being assigned that municipal governmentsare unprepared to assume; as discussed in Box 2.2, such is the case with health care in Brazil.
10 Finance ond Ptvision Asin uw
.~~~~~~~~~~~~~~~~~~~~~~~~~~~~~~~~~~~~~~~~~~~~~~~ ~~~~~~~~~~~~~~~~~ ~ ~ ~ ~ ~ ~ ~ ~~~~~~~o5'5''Z W _~~ _ _ _ _=ll 13III llV_U
In 1989 Veeul asdisIeetufainM hc esindt i tt oenet
n*er of e~eim~rsbLts oe fubc(egLprs rdo. ectarprs
pnbites hu n shre bili - Hvff.-
12 Dee vaitmionion Ahethm aof rhnedistrieutevn of apowners to staegoaanlcl governments, anybinrheasn empow taten bocf comuntsityjd ognsintcional fom15pr cents to 2(pronece s. Ious spcfe E1tSalvadrxmhas auhriedeus. comnity~le grup to received transfers 5m percent o heol~ grvmmnt for
Investment. Fundp. tc,teei n ehns oefrc hscniin
13. Another deefa]izatio on theroedssrbto of saersponswlters is thdled boloinanmdelut incenhivesreinalgoernmenty,ai sta (dpolrticns) seneassinbokgat pas-h ou th sateces itoue m nicipalities. Whiechi
provde d incenti v ein re stated, tohae ovarmnt nw enitul beasposigned bls. graus, ahc state y will assu ener~edistibute tobmuigiations uslyifg they geonerlciteisalsed by wtasesIa ctherl cetadilgovernmetb.
Bu1 andeioaso us reionali, tove renmrients (thatethe Cangress-through allenes,obtathdrenpass
Stladrou has authorizil seed cmuitya groups togreeiventracnsfersifomh un c). lgoenen o
7he DesignA nd A mnin of binovermnenT Tran!fers 11
_-~~~~~~~~~~~~~~1
_1~~1ox2 iehzat=-on or ifatliC lit Bri fietLEW ga
_B' ' r~~~~~~~~~~~~~~. . ... .i.. ., , , .
14. Whraile evriontry'se rdecetaliczangion heatexpenrience isuiqe Bail n19 4da Chie rpaesaen
t eoerqu models.t Brazital in sta the onlc titry aindt Reio ith. T lne histion of der d
govearnent whise the 1988 Constnin utionincrease the powero of .- i pll e -B B gt vernmnts, Brazilah nandia hand technicaldacentanzed sytoeprtofie ytesae n eta govermnnmLtL mena mcudnicbthasttieand mueipal lavemed ny~ts wiah the aaitr tow cassotisne revepnuet so90urces Isanexndturerepnsibtiued. Cheigle, oealthe oytheor hSUd, hand hisoricalize beepons oihl he ntualized; Thegoa
giemest an m i of the cenu al g e dcd mith l .gosve.m:nt
had Thite auetonveromuyntr Munticipal eentiztature responsibisnties andres sienicantly in the
government; ohil t&e legiCosla ttion tht insfrre brte the states aof municipalite weas notsBaiiaplreadhdthedmostecelyntrgpalizded sytemof liovedrcapacty on Ithepro Ameda m incipluitne to assame
1980t under the military govemment, ancd this was complemented by the introduction of electedmayors and city councils under the present democratic gove9nment. The process ofdecengahlation in Chble was simplmfied b.ause the interest groups threatened with employment

12 F,ance and Provuion MIsignmw
or income loss were unable to fully express their opposition. The institutionalizaton ofdecentraliztion was facilitated by relatively strong adminisative capacity at all levels ofgovernment and by effective public financial management and control at the center.
C. Assignments in Education, Healfth and Rural Roads.
15. The finance and delivery of primary education, primary health care, and rural roads areanalyzed in some detail in this study. For our purposes, primary education is defined as thedelivery of teaching services to children; primary health care is principally the delivery ofpreventative and matemnal and child health care and does not include hospital care or emergencyservices; rural roads is the construction and maintenance of terdary roads serving rural, mainlypoor, communities. Three factors determined this selection of services: (1) these are amongthose services which are most frequently devolved to subnational governments; (2) whendevolved to subnational governments, education and health expenditures often represent morethan half the total government budget; and (3) these are services where there are often importantcontinuing central government objectives even after decentralition. Finally, the lessons learnedfrom the analysis of these social service and infrastructure services are generaliable to otherservices provided by subnational governments.
16. The delivery of any service comprises a number of discrete activities. For example, asshown in Table 2.1, delivering primary education services requires: financing recurrent andcapital expenditures; specifying and implementing the core curriculum; specifying textbookrequirements and providing texts; specifying nutrition standards and providing school meals;setting teacher accreditation standards and training teachers; employing and paying teachers;designing and implementing evaluation instruments and disseminating the results; supervisingand providing technical assistance for school personnel; constructing and maintaining schools;managing and auditing finances; and developing plans and budgets.

The Design and A iraszon of Itergovernmwn Transfers 13
Table 2.1: Education: Finnce and Provision ignments
Fbiawe Irms.ry Of E an Lc Go,sma
Fuiance of Recarrnt EDnuu a specified minmm klvel of spnding per pupil and FiwAnca education an a cost-sharig basi and haa theExpendituns finaning to reduce inequti in educaional spending ad to autbority to finane e _endie beyond the tpecified
capenste for differea in need; depi ad adnisters minirmgramt in aid.
Finane of Capital Pronides financing or bach local govemment borrowing, due Sham in the financing of achool consuction aidExpenditu to comaints on cal gsermet borrowwng caity; designs rehabilitaon.
ad adminits gran in aid.
Provii
Curniculum DeiP and Specifies the Conten of the core ureiulum to ensure common Iplemue the oe curriculum and adapts the basicContent valuea and mtnunum leaming. It also prmvides a basic curriculum design to local requirements.
curiculum design which local governments can use.
Texabooks and Prepar inimum text specifications rdiecting the core Selects textbooks from an approed lit and complies withTeaching Materials curnicuamn i may evalbue privately-supplied textbooks and mandates on textbook provision.
teaching materials; it may also mandate a minimum spply oftextbooks.
TeacherTraining Esur an adequate upply of pr-servi teacher tining, Deternines iervice training needs and contraets for itsestblih teacher areditatio n sndadis, and may ofer in- provision.semce training.
Teacher Reronitmeat Estblishes m-umum conditions of employment for teacher, Negotiates pay levels with teachers; and recuita, hires, andand Pay including civil sevice protection. dismisss teachers.
Testing and Evaluation Dsigns and approves testg instrumes, ensu esting akes May conact for testng rices (if not diectly provided byplace and dissminate the reults to the schools; it also the Ministy), and disseminates resu to pant. It alsoevalaes educational progamm for coat and effectvenes maintain an information sym to provide the data required
for program evalution.
Progrm Supervision Supervis school perOmanoce and prwoides technical May conact for speciaized technical asstancw.asisae to remedy problem.
School Construction Sets minum shol construction and cmaintene sandads Contc for and monitor school consuction andand Mainteace and monitors their complance maintenance.
Faancial and Sets the accouning sndards required ifor audit, determines Manti accounts requd for audit, may con t for auditMangement Audit audit ne c,ithr direcly provdes audit or monat is by approed firms, and comples with any requied corrective
performance, trevies th results, and termines coretive actions.actions.
Planning and Budgeting Does planng and budgctg for ceunnilly-finaned Does planning and budgeting for loily-financed expendituresexpendirs, setS budgeting sandards for local governments, and may conract for specilzed techmial asstace.and provides technical assistance to lotal govements.
School lunch Specifie utritional and health andar* may finance luches Contracts for or direy provids school mea.tagetd to poor stu.

14 Fommce and Provio Assigmnes
Table 2.2: Primary Health: ;nance and Provsion An s
F Snance Miisty of HeIth Loc Govenett
Fna nce of Recurrent Ensue a minimm lvel of spending to provide preventive Establishes and collects uer fees and finances primary healthExpendiues and cunative cae and finncing to compensate for differences care on a coat-sharing basis, with the authority to spend
in need as weflected in epidemiological and socioeconomic beyond the specified mininmm established by the MOH.charaterties; establishes the norms for cost-recovery bym il clnics; detrmines financing mebanisms and thealgorithm for transring resources to local governments.
Finance of Capital Provides fnancing for clinics and equiprent or backs bcal Shaes im the fincing of clinic ad health post constructionExpenditures goverament bonowing for this purpose, due to contraints on ad the purchase of medical equipment.
local goverment borrowing authority; designs andadminisrs granu in aid.
Provision
Basic Package of Specifies the basic heath care services which every citizen Delivers the basic package of ervices, adapting it accordingServices should receive nd regulateslspecifies the technology for to locsl epidemiological and demographic needs as well as
service delivery; defines the norms and procedurs which local demand.guide the delivery system, inluding referral patterns; and
________ __ monitors; enforces compliance.
Supplies of Sets stndards for minimmt technical specifications of Prioriies and selects supplies and either contracts for theirPharmaceutical, spplies nd procurement procedures; may mandate prxourm or procures from loal firms.Medicines, and Food minimum supply quantties; facilates procedures thatSupplemnts rmnimize costs of procuring supplies, including emblishment
of cooperatives or direct provision by the MOH.
Medical Equipment Regulates mimum technical specifications of equipment; Prioritizes and elects equipment nd contracts for theirplays 'gate keepee role for the acquisition of new medical procurm or direcy prourestechnology.
Statistical InformAtion, Defines the epidemiological performance data needed to Assign staff to carry out the responsibiliti dictated by theEpidemniological monitor the prnmary health cre sytem; defines the information system, inchlding data on finance, expenditures,Surveillance and information system to be used for data collection. and services provided by program; contracts for technicalQuality Control assisane if necessary.
Evaluates the ability of PHC progrmn to achieve stated___________ objectives.
Planning and Budgeting Defines program budget casificatios for both central and Does planing and budgeting for health expenditur bylocal government expendiue, sets finncial reporting program and source of finance (fiud accounting) ad mayrequirements, and provides technical assance to local codact for specialized technica assitnce.
________ ______ overnment.
Training of Medical Ensur an adequate supply of pre-ervice medical trainiDg; Identifies in-vice tainin requiems, selects candidatesPersonnel establishes cerification sandards for health care workers; for training progrms, and corct for its proion.
defines minimum in-sevice training requiremei.
Recruitment and Establishes the minimum condiions of empkhmment for Negotiaes pay vels wvih media and adminitiveRemuneration of Medical medical and non-medical pennel, inchding civil srvice perel; rects, his, and dimses staffPe e protection. _ _
Fancial Magemeant Sets the _aunting sandards required for audit, deteamines Mita acounts requited for audit, roiws results withand Audit audit content, either decdy provides udit or monitors its te central level, and complies with required corrective
perfoma nce of third party auditor, reviews the result and actios.dete_uine corrective actions.
Construction of Clinics Sets mininum clinic construction and maintenane standards ConUacts for nd monitors clinic construction andand Maintenance and ensures their compliance, maintenane. Conacts with either MOH or third parties to
repar and mintin medical and office equipment.

1e Design and A&sraion of atrgovmwnmenl Tranffers 15
Table 2.3: Rural Roads: Finance and Provision Agnts
Finance bMiabty of Traimsprt Lca Gvnment
FinanCe of Recmrrent Co t and allocates uwer fes and taxes and provides Fnane road maintenance fro own-source revenues nd itsExpenditures financial and other incetvs to enmr adequate allocad share of user fee revnues.(Maintenance) rod m nc; desig administ grants in aid.
Face of Capal Diry finances, mae repayabl loe i ;, or bcks lal Share in the financing of road constuction adExpenditures goverament borowng for this purpose, due to capitl market ehabilation, dther from curnt mues or by borrowig(Construction) deficimecs for this pupxe; designs and adminiser grt against futr revenues.
in ad.
Provi__
Road Design Detnnines the inimum specifications for road Provides informtion on rod use surveys, topographical, andcharcteristics, basd on road uns, topography, climate, etc. climatic conditions levant to road design.
Rehabilitation and Specifies minimum technology standards and adminisrtive Manages rod construction and ensres its implementationConruction procer including reporting requierments, for ether through forc account or contrcting, monitors
constucio; carries out periodic inspecions to ensure conrction to enmre it follows quired sandarls andcompliance. proceeds according to planned timeable.
Maintenance Specifies mi-ini maintenace requixreents; carries out Mages road m*intenanc, monitors road conditions, plasperiodic inspections to casure compliance. and impleents ainut ce schedules; provides reports
equird by M(Yr.
Statistical Informatio Manags an information ystem on the condiion of the Mangs the local information system and preaes periodicand Quality Control nstional road sytem, constucDo and mannce activity, reports to the MC.
finance and expenditures, and qecified information to beprovided by lob governments to the MC1T.
Plannig and Budgeting Defines prorm budget cssifications fbr both cental and Does planing and budgeting for rural road expenditures bylocal goemrmeot expenditrs sets finacial repoding program and source of finance (fund accoun6tig) and mayrequirments, and provides technical aisance to local consact for speciazed technical astance.govent; specifies any reed comnmty puaticipin seting investment prioities.
Procurement and Sets required procedures for procement and contactig for Resnible for procurng equimet and upplies andContracting road coaruction and maintenne; conracting for design, constron, and miten nC
consistent with MOT standards.
Employment and Pay of Esabishes minium condition of employment for lcal Negotintes py levels with local govenmnr« transportationPersonnel gVwernment workers, iclhuding civil sIce protcion,; eployees; and recrIu, hire, and dimis&s peronnel;
fwcilates worker training through its dect finace and/or determints traning requiremn and conrcts for suchprovision or by providing tenical assitnce to lcal training.
_ _ _ _ _ _ _ gsov ernm ns. _ _ _ _ _ _ _ _ _
Fancial Management Sets the accountig stndards required fir audit, determis Mintains accounts required for audit, review results withand Audit audit content, eithr directly provides audit or monit is the centrl level, and complies with requird corrective
perfor of third party auditors, review the rsul and actions.determines corective actions.
16 Fiaunce and Provsion Assignents
17. Tables 2.1 - 2.3 provide models for primary education, primary health care, and ruralroads, respectively, of how the responsibilities within each sector's activity might be allocatedbetween central and local governments in an efficiently-operated intergovemental system. Therole of regional governments as a middle tier in an integovenmental system is ignored here forpurposes of exposition. What each government's role should be for any service depends on anumber of factors: the public good characteristics of the service; the spatial distribution ofservice benefits and costs; possible economies of scale and costs in producing an activity;society's desire for homogeneity and consistency regarding that activity; and fiscal,administrative, and technical capacity.
18. Which level of govenment makes finance and resource allocation decisions is, of course,quite different from which level of government or which type of organization provides theservice. Thus, the health ministry may have responsibility for defining norms and proceduresfor the delivery system, but the actual work to carry out this activity may be contracted toprivate consultants. Also, the local government may have responsibility for delivering the basicpackage of services, but the actual delivery may be contracted out to NGOs or private healthproviders.
19. One would expect that the models given in Tables 2.1 - 2.3 to be adapted in a numberof ways for any particular country depending on political, constitutional, administrative, andtechnical factors. In practice in decentralized countnes, cental governments still carry out someactivities which could be given to local governments. For example, in education, one finds thecentral governments of Brazil and Mexico directly providing textbooks to schools, and thecentral govemment of Chile bypasses the municipalities and the schools and directly contractswith private providers for school lunches.
20. Furthermore, in practice, the norms and procedures which are set by the centralgovernment (or, in some cases, the regional government) result in defacto assignments whichare different from de jure assignments. For example, if central government regulations on theemployment and compensation of personnel are sufficiently detailed, the local govemment mayhave very limited autonomy for negotiating pay or dismissing personnel. This is a particularproblem in the U.S., where federal and state government mandates, grant conditionality, andcross-conditionality has in some cases seriously constrained local government expenditureautonomy.6
6An extm cae of this is fod m Calforia where the Stae Govement prohibits hgh-spending schooldistricts from increasing expendiurs; the State Constitution requires a tv-third positive popular vote for districttax increases; and the State directly finamces some seventy education programs, each of which has its own set ofconditions and regulations. The topic of regulatory federalism is examined further in Fix and Kenyon (1990).
The Design and Admiratin of legovermane ran#srs 17
D. Central Government Objectives in Intergovernmental lance.
21. The central government has a very important role to play in a decentralized system ofgovernment. At a minimum, this role co:mprises:
(1) provision of financing to ensure fufillment of national policy objectives amd tocorrect inter-jurisdictional spillovers at the subnational level;
(2) setting the minimum national norms and standards for decentralized service delivery,financial management (including government accounting), and governance at thesubnational level;
(3) producing and disseminating; the public information required for accountabilitymechanisms to function effectively; and
(4) supervising and providing technical assistance to subnational governments to ensureefficient operations in compliance with national guidelines.
22. National policy objectives play a crucial role in determining the extent and nature ofcentral government involvement in the finance of services delivered by subnational governments.In what follows, the principal central government objectives in the finance of primary education,primary health care, and rural roads are enunciated more fully. These objectives provide thecriteria by which alternative means of financing these services can be evaluated in Chapter IV.For ease of exposition, the terms local and subnational governments are used interchangeably.
23. Education. The role of education in determining income distribution and social mobilityis what distinguishes it from many other services often provided by subnational governments andwhat constitutes its principal national public good characteristic.7 More specifically, aneducation ministry can be seen as having four principal national objectives: (1) provide aminimum level of educational services to all students; (2) provide approximate equality ofeducational opportunity; (3) encourage oFerational efficiency; and (4) leverage scarce ministryresources.
24. The education ministry is responsible for ensuring that all citizens acquire some minimuneducational attainent, which is operationally defined in terms of years and quality of schooling.While quality would best be measured in terms of schooling outcomes (e.g., gains in cognitiveachievement), in practice it is measured by school inputs. Minimum inputs are in part specifiedin regulations (e.g., maximum class size or minimum teacher qualifications) and in part ensuredthrough minimum per pupil expenditures. The Ministry has three principal options for ensunngthe per student expenditure minimum: (1) provide a per pupil grant equal to the desired levelof minimum expenditures; (2) mandate that local governments spend at least as much as the
7 Other swh characterstics include the effective function of democratic government and facilitating technologicalchange.

18 Fmance and Provision Asigmes
specified minimum expenditure irrespective of any intergovernmental aid; and (3) provideincentives to municipalities to increase their educational spending.
25. Because education plays such a key role in determining future economic success, thedegree of equality of educational opportunity is closely related to a society's distribution ofearned income. For this reason, educational equality is an important societal goal andresponsibility of the central government. As with educational attainment, educationalopportunity is best measured by educational outcomes, but difficulties in measuring outcomesleads in practice to it being defined by the distribution of school inputs, not outcomes. Toensure approximate equality in spending, the education ministry can: (1) provide a large perpupil grant; (2) impose a cap on finance from local government sources; and (3) equalize fordifferences in local government spending or fiscal capacity.
26. In addition to inequalities across local governments, there are significant inequalities ineducational outcomes between socioeconomic groups in society. Due to the large role the homeplays in prepanng children for schooling, equality in school inputs is unlikely to be a good proxyfor equality in school outcomes for the educationally disadvantaged. Hence, an educationministry interested in reducing educational inequalities between socioeconomic groups musttarget additional monies to students from low socioeconomic homes, especially those who attendschools with low spending levels. This can be done either through targeted categorical grantsor by changing the distributional formula of the general student grant to provide a larger grantto municipalities with high poverty rates.
27. The education ministry could conceivably reduce its outlays on education, were it to bnngabout greater efficiency, or larger outputs relative to costs. This could be accomplished through:(1) increasing learning or gains in educational achievement; (2) reducing the rate of graderepetition; or (3) reducing costs, including encouraging school consolidation to realize scaleeconomies or encouraging educational innovation. To provide an incentive for efficiency,measures of cost-effectiveness could be used to, in part, determine the size of education ministrytransfers. On the other hand, the use of such measures introduces moral hazard in the form ofteaching to tests and lowering grade promotion standards. Incentives to encourage specific costreductions or educational innovations are best provided through separate, categoncal grants.'
28. Finally, other things equal, the education ministry would typically like to leverage itsadditional grant funding. At a minimum, this means requiring local governments to not reducetheir transfers (maintenance of effort) as a result of receiving additional ministry funding.Alternatively, the government may provide incentives in the form of matching grants tomunicipalities to increase their funding for education. The size of the incentive could beconstructed to vary inversely with municipal fiscal capacity in order to avoid increasing spendingdisparities.
s An example of such a gnmt is the program to provide Ministry of Education tnsfers to schools proposingeducaional innovations to improve learning under a Chile Basic Education Project financed by the World Bank.

7he Design and A&,hustration of bItegovernent Trasfens 19
29. Health. Prmary health care differs from primary education in its clientele. Publichealth care is mainly used by those who do not have access to private care, whereas publiceducation is typically used by most of the population. As with education, the effects of healthcare on the poor is its principal national public good characteristic. However, in addition, thefact that local jurisdictions do not receive all the benefits from preventative care provided to thepoor (since if they did not receive the care another jurisdiction or level of government might endup paying the resulting curative costs), provides another economic rationale for centralgovernment finance. The health ministry is likely to reflect these interests in more specificobjectives: (1) satisfy minimum health needs of those using local health clinics; (2) providerelative equity in service provision; (3) improve efficiency in the provision and the mix of healthservices offered by the clinics; and (4) improve health care as much as possible given healthministry budget constraints.
30. The health ministry has a concern that all clinic users, who are typically the poor, haveaccess to some minirnwn quantity and quality of health services. Neither quantity nor qualitycan be easily measured at the level of the health clinic or the local government. Services differin terms of their cost and their health benefits, which makes aggregation difficult, while healthcare quality is neither easily defined nor easily measured. Given these difficulties, one proxyfor quantity and quality is health care expenditures per user, adjusted for differences in inputprices and case mix between jurisdictions.9 Thus, the Ministry may wish to ensure that anygrant design results in some minimum expenditure per health clinic user. Furthermore, it hastwo basic options for ensuring minimum expenditures: (1) provide a health ministry transfer peruser at least equal to the desired minimLum expenditure amount or (2) mandate that localgovernments spend at least as much as the specified minimum expenditure irrespective of aidfrom the Central Government.
31. In addition to ensuring minimum service levels, the health ministry may also beconcerned about the degree of equality in total health expenditures per user of the municipalpublic health system.'0 As with education, to ensure approximate equality in spending, thehealth ministry can: (1) provide a large per beneficiary grant; (2) impose a cap on finance fromlocal government sources; or (3) equalize iFor difFerences in local government spending or fiscalcapacity.
32. Efficiency in delivering municipal health care services is the maximtion of the healthstatus of users given resources. Given the difficulty in measuring health status or determining
9 Obviously, there are some critical health services (e.g., vacciations), the provision of which the Ministryof Health may not wih to leave to municipal discretion. Mandated cntical senrices may be included in theregulations that accompany the health finance legsulation. An alternative, commonly used in LAC, is centralgovernment vaccination campaigns.
0 Of course, there are numerous other possible definitions, including equality in health status or equality inimprovements in health stus resulting from health care, but the simplest and most basic definition is equality inhealth care inputs. We do not consider here the financial incentives and cost implications associated witL referringclinic patients to non-municipal hospitals or with their counter-referrals to clinics.
20 Fiunwe anid Prevsion Asigrnents
the contribution of municipal health services to improvements in status, efficiency is best proxiedby measures of the municipal clinic's cost-effectiveness in service delivery and provision ofservice mixes consistent witi professional opinion. In addition, imposition of nominal usercharges for some services is likely to reduce the unnecessary consumption of health services.These measures are not easily incorporated into an intergovenmental grant, although the centralgovernment could reqire the provision of some services or the levymg of minimum usercharges as conditions for receiving the grant.
33. The health ministry wishes to attain its objectives at the lowest budget outlay. This canbe accomplished by either mandating that municipal expenditures not decrease (maintenance ofeffort) or providing incentives (matching grants) for local government finance. The size of theincentive can be tied to the inverse of the municipality's fiscal capacity to minimize total grantcost.
34. Rural Roads. The national interest in the construction and maintenance of rural roadsis mainly justified on the basis of inter-jurisdictional spillovers and income distributional effects.The fact that non-residents of the locality cannot be easily prevented from using the roads meansthere is the potential for inter-jurisdictional benefit spillovers that would result in under-investment by local governments. In addition, the fact that rural communities are often poormeans that rural road investments have the potential to better their economic status by improvingaccess to markets. This general rationale for central govemment finance is translated into morespecific transportation ministry objectives: (1) ensure that subnational governments with largerural areas have an adequate feeder road network; (2) ensure that municipalities (which have noaccess to capital markets) with severely constrained general revenues can finance high priontyroad projects; (3) alleviate rural poverty; (4) prevent subnational governments from using grantfinancing to lower their taxes; and (5) ensure adequate maintenance of the existing road network.
35. The establishment of adequate rural roads entails construction of new roads, pavingexisting dirt roads, and rehabilitation of roads suffering from deferred maintenance. To ensurethat subnational governments have adequate financing for this purpose requires that grant sizevary with need, which can be measured in a variety of ways. In Japan, two criteria used todistribute Central Government secondary road grants to the regional governments (prefectures)are total kldometers of roads and total road surface area. In the U.S., Federal Government ruralsecondary road grants to the states are determined using a formula that gives equal weights toland area, rural population, and mileage of rural mail routes.
36. The capacity of goverments tofance road projects and road maintenance varies withtheir general revenues. Low capacity to finance rural road projects can be compensated byvarying the cost-sharing required of the government receiving the project grant.
37. The construction and improvement of rural roads is one means of attempting to improvethe welfare of the rural poor by providing better access to markets for their products and toeducation and health services for their families. This objective can be addressed either through

The Design and Admiiation of Irtergovernmenwl Tranwfcrs 21
a general rural roads program or through a more focused program that is tightly targeted on therural poor.
38. Subnational governments receiving sector-specific grants would like to use the resultingrevenue as if it were an addition to general revenues with no stings attached, which it woulduse to partly finance other services and partly to reduce the tax burden on its own citizens. Thecentral government, on the other hand, wishes to see the sector-specific grant spent only on theintended sector with no reducton in the overall fiscal effort of the government receiving thegrant. It can encourage such response on the part of the grantee by: (1) providing an incentiveto increase the grantee's own-source revenues, (2) requiring cost-sharing on the part of thegrantee, and/or (3) requiing maintenance of effort (no reduction in the grantee's own sector-specifc expenditures).
E. Cases in Sectoral Decentralization
39. Decentralization is a world-wide phenomenon in the 1980s and 1990s; recent LACexperience has been surveyed elsewhere and won't be repeated here."' In addition to repordngthe decentralization experience, there is a growing literature on the difficulties and failures inimplementing decentralization policies.'2 This study complements the literature through casestudies of LAC expenence with the decentralized delivery of three services-pnmary education,primary health care, and rural roads. Since the purpose of these case studies is to draw lessonsfrom LAC experience with sector-specific grants, cases were selected on the basis of innovationn grants and the potential for applying variations of these models to other countries in theRegion. Two of the cases come from Chile, while the third is from Colombia. In order to putthe following chapter's analysis of these cases in pespective, it is important to first brieflyreview the decentralization process in these two countries.
40. Education. Chile initiated its decentralization efforts in 1974 with the creation of thirteenregional governments to serve as adminIistrative arms of the central government. This wasfollowed in the mid-1970s with laws establishing the major municipal revenue sources(especially, the Municipal Common Fund) and expenditure responsibilities. In 1981, the processof devolving responsibility for providing primary-secondary education and primary health carewas initiated; this process was interrupted by a severe recession and not completed until 1988.Finally, elections of mayors and city coumcils were carried out in 1992.
41. Until 1981, the Ministry of Education in Chile made all decisions concerning educationprovision and finance. The thirteen regional governments (departnents) were charged with
" See, eey, Campbell, Peterson, and EraIarz (1991), who review recent experience with decentraizaionto local goverments in LAC
12 See W er (1988) for a review of experience with education decntraliion; difficulties in decentralizationiplementation have been analyzed by McGinn and Street (1982), Hansen (1984), Stromquist (1986), Gonzalez-Block, et.al. (1989), and Rojas (1991), among others.

22 Fmance and Proswon Asignens
supervising and evaluating school performance. All teachers were public employees, andsalaries were deermined by the central government. In 1981, Chile initiated efforts todecentralize the provision of education to municipalities, while retaining central control overfinancing. The decentraliation reform also included a novel plan to permit a larger role forprivate sector provision of education.
42. 'The reform was expensive to implement because the central government offered financialincentives to municipalities to accept the obligation to pay teachers and maintain buildings andgave severance pay to teachers. The transfer of responsibilities to municipalities was notcompleted until 1988, although 80 percent of schools were transferred in the first two years ofthe reform. As a consequence of realigned responsibilities, employment in the Ministry ofEducation was cut by more han two-thirds, from 23,149 in 1980 to 8,550 in 1990. (Reid, 1992)
43. Since non-profit private schools were also made eligible to receive the capitation grant(but not the capital grants that municipal schools could also receive) and parents were free tochoose the school their child would attend, pnvate supply rapidly grew. By 1990, more thanone-third (36%) of all capitation grants went to non-profit, private schools, despite their lowerexpenditures and significantly lower teacher pay.
44. While the capitation grant initially covered the full recurrent costs of education, it quicklydecreased from its 1981 value of $6577 (in 1990 pesos) to only $4133 in 1990, a 37 percentchange. In response, municipalities increased their own financial contributions to the schools,which by 1990 represented percent of total education recurrent spending in the municipalschools. Non-profit schools were also permitted to charge tuition to supplement the capitationgrant, but a 40 percent tax on the resulting revenue means few schools do so; however, they doreceive donations from businesses and parent's associations.
45. The capitation grant is supplemented by other Ministry of Education, in-kind transfers,including textbooks, school lunches for students from low-income homes, and capital projectgrants for school facilities, the latter available only to municipal schools. The schools areneither heavily supervised nor tightly regulated, although a teacher's statute approved in 1991establishes a national miunum teacher pay scale applicable to all schools receiving the capitationgrant. Reduced capitation grants combined with the tuition tax and teacher minum pay arelikely to slow the growth in non-profit private school enrollment.
46. Healh. Prior to 1979, the financing and provision of public health care in Chile washighly centrized. In 1979, public health administation was deconcentrated to 26 regionalHealth Service Areas (HSAs), and in 1981 the process of decentralizing pnmary health care tothe municipalities was initiated. By 1988 this decentraliztion process was largely completed.
47. The principal users of the municipal health clinics are those families and individuals whoeither lack private health insurance or elect to participate in the public system. In general,participants in the public system have less than half the per capita income of participants in theprivate system (Annex B, Table 2). The percent of inhabitants in a municipality who participate

The Design and Admini of Ireirgovernental Tran#jrs 23
in the public system is negatively related to average family income in the municipality andpositively associated wnth the poverty rate, the percent of young children, and the percent ofelderly in the population (Annex B, Table 6).
48. In principle, the municipal health clinics are financed under a fee-for-service plan underwhich the clinics submit evidence of services provided to the regional HSA which authorizespayment by the Ministry of Health. Once this plan was initiated in 1981, the Ministry foundmunicipalities responded by sharply increasing the quantity of services provided, resulting inlarge demands on the central government's treasury. In addition, municipalities increased mostthose services where reimbursement fees exceeded the costs of provision. The resultingbudgetary pressures resulted in two changes: (1) the fee-for-service schedule was not allowedto keep pace with rising costs; and (2) each municipality was given an annual fixed ceiling fortotal health service reimbursements ftom the Ministry of Health. The ceiling is primarily basedon histoncal expenditure data, which discriminates against those municipalities which dlid notquickly respond to the incentives under fee-for-service to expand health care provision.
49. In addition to cost reimbursement, some municipalities were given central governmentfiunds beyond the cap at the discretion of the administrator of the regional HSA. Thecombination of all these factors results in an average 75/25 cost-sharing division between thecentral and municipal governments. Analysis of the resulting distribution of transfers tomunicipalities (see Annex B, Table 4) shows the per capita level of transfers to be positivelyrelated to the number of child services provided, the percent of population that is elderly, andhealth personnel wages and negatively related to the percent of municipal health clinics that arerural (and which provide a less costly and less varied set of services than urban clinics).
50. Rual Roads. Columbia initiated its decentralization efforts in 1983 with the passage ofa law (Law 14) granting municipalities greater revenue raising powers. Subsequently, in 1986,another law (Law 12) was passed to increase the municipal share of the national sales tax (IVA),with a formula that explicitly rewards fiscal effort and favors small municipalities, whichtypically have low fiscal capacity; municipalities are also mandated to spend their increasedtransfer revenues resulting from the 1986 law on investments, including roads. Finally, in 1987yet another law (Law 77) was passed decxntralizing responsibilities for service provision to themunicipalities. The central governmenl; was given responsibility for national roads, regionalgovernment (departamentos) responsibility for regional secondary roads, and local governmentresponsibility for the construction and maintenance of municipal secondary and tertary roads.A national highway survey was undertablm in 1989 to implement the 1987 reform. This resultedin the central, regional, and local govemments having responsibility for 23.5 %, 39.1%, and37.4%, respectively, of total highway kilometers in the country.
51. Fiscal decentralization in Colombia was accompanied by political decentralization, witha 1986 law (Law 78) requiring that municipal mayors who were appointed by departmentgovernors henceforth be elected by their citzens, which was done through elections held inMarch 1988. The new Constitution of 1991 carried popular rule one step further by authoringthe direct election of governors, who were formerly appointed by the central government.
24 Fisance and Provion ass4nena
52. The decentralization process in Colombia is not yet completed. Prior to 1987, the RuralRoads National Fund (FNCV) both financed and constructed rural roads, mostly through forceaccount. The 1987 reform required that the FNCV co-finance with the municipalities all suchconstruction, although the agency continues to execute projects on behalf of the municipalities.Finally, legislation recently introduced into the Congress (Proyecto de Ley de Transporte) wouldeliminate the national FNCV, give the department governments responsibility for carrying outFNCV's functions, and substitute block grants to the departments for the matching grants tomunicipalities. The departments would, in turn, establish their own co-financing mechanismwith their municipalites.

m
LAC Experience With Intergovernmental Transfers
1. In this chapter, we first review the principles of intergovernmental grants, including grantobjectives, alternative grant designs, amd administrative discretion in determining grantallocations. Since these principles have been described and applied in several Bank documentsand in the public finance literature, our r eview is cursory and intended only to set the contextfor a more detailed analysis of categorical grants. Second, we review and evaluate LACexperience with three innovative sector-specific grant designs, from which we can derive lessonsfor the Region regarding grant design anid administration.
2. The focus of this paper is the design and administration of sector-specific transfers; sinceit is more common to refer to these transfers as categorical grants, the two terms are usedinterchangeably here. The permitted usIS of sector-specific transfers range from unrestricted(aside from being spent in the sector) tc highly restricted. When permitted uses are largelyunrestricted, these transfers are often called block grants. The municipal funds found in manycountries are block grants which must be spent on infrastructure; Box 3.1 provides an exampleof a block grant for social services. When permitted uses of sector-specific transfers arerelatively restricted, the transfers are often labeled categorical or conditional grants. Irn whatfollows, we analyze three categorical grants: Chile's fornnula grants for the finance of primaryeducation, Chile's cost reimbursement gramts for primary health care, and Colombia's matchingcompetitive grants for rural road projects.
A. Principles of Grant Design.
3. Objectives. Intergovernmental grants have three principal objectives: (1) correct fiscalgaps between revenues and expenditures of subnational governments; (2) ensure fulfillment ofnational policy objectives; and (3) compensate for interjurisdictional spillovers resulting fromservices provided by subnational governments. In Latin America, subnational govemmentstypically have expenditure responsibilities larger than revenues from their own sources; inaggregate, state and local governments in LAC generate 17.5 percent of total revenues andaccount for 28.5 percent of total government expenditures. Hence, correcting the fiscal gap isthe top priority of grants in aid. In LAC this is often accomplished through revenue sharing

26 The Design and Admruralton ofntcrovenmntal Transfers
arrangements, which are well documented in the literature.13 A preferred solution would beto increase the own-source revenues of subnational governments.
4. As noted in the previous chapter, the central government often has national policyQbjectives for goods and services provided by subnational govemments. These objectivesinclude minimum expenditures on some services which generate public good extenalities andequity in spending across jurisdictions for services which affect strongly the welfare of the poor.
5. To some extent, inadequate expenditures and high vanance in spending are the result ofdispanties in fiscal capacity, which in turn are largely due to unequal own-source tax bases. Asa result, most LAC central governments have instituted block grants to subnational governmentswhere the amount of the grant is to some extent inversely related to a jurisdiction's fiscalcapacity. As noted above, an example in the Region is the use of municipal common funds.
6. While reducing disparities in fiscal capacity, these grants neither elhminate disparities nordo they efficiently attain the central government's objectives. Block grants may ensure minimumrevenues but do not ensure either minimum ecpenditures on specific services or improvedequality in spending for services which affect poverty and income distribution. These objectivescan be more efficiently achieved through a service-specific grant, the size of which is inverselyrelated to fiscal capacity and directly related to poverty rates.
7. Even where there is no fiscal gap and no significant fiscal disparities betweensubnational jurisdictions, interjirisdictional spillovers from programs run by subnationalgovernments could lead to their suboptimal provision and, hence, require the central (orregional) government to devise corrective measures. In principle, the corrective measure issimple-alter the affected program's price to the jurisdiction through an open-ended matchinggrant, where the matching percentage equals the percent of marginal benefits which spillover.In practice, the magnitude of benefit spillovers can seldom be quantified, and centralgovernments fear the uncertainty of expenditures of open-ended matching grants. The result isthat matching grants found in practice are almost always closed-ended (i.e., the price on themargin is unchanged for many governments receiving the grant), the matching rates are decidedarbitrarily, and junsdictions are mandated to maintain existing spending levels in order to ensurenet increases in spending on the service. Expenditure mandates typically take the form of eitherrequiring that the grantee spend some minimum amount on the service or requiring that thegrantee not reduce expenditures from its own-source revenues after receiving the grant. Bothof these measures are attempts to restrict gant fungibility, which is the ability of the grantee toshift the use of grant monies from the grantor's intended purpose.
8. While interurisdictional spillovers provide the economic rationale for matching rates,improved accountability provides an equally strong rationale. As wil be discussed in Chapter
1 See, for example, Campbell, Peterson and Brakarz (July 1991). There is some ambiguity regarding thedefinition of revenue sharing. In this paper, we follow the convention of defiing shared tax revemues asintergovermmental grants if the tax rate and the allocation of proceeds are demined by the central governmentalone.

LAC EWxpience Uth gowiteo enxel ransfrs 27
VI, cost-sharing provides an incentive for taxpayers and beneficiaries to more closely monitorgovernment programs financed with intergovernmental grants. Thus, one can make a generalargument for cost-sharing in service-specific intergovernmental grants.
9. Polickies for Allocating Table 3.1: Typology of CategoricalGrant Monies. A large number of Grants With Examplesintergovernmental grant typologiesexist.14 A useful typology of _ acategorical grants classifies them oadte G foi esby alternative policies for _allocating monies across Formula Chile: Primary education
subnational governments (ble e: Primary health3.1). Formula grants allocate Coit camrmonies on the basis of a formula, _
which usually includes variables Competition Colombia: Rural rodthat reflect vanations in need and cnstmetion_ cost across jurisdictions; less Ad Hoc large capital projectsfrequently, formula grantssometimes compensate for ajurisdiction's relatively low fiscalcapacity or reward jurisdictionsfor fiscal effort. While categorical formula grants are typicaly sector specific, Colombiaprovides a block formula grant for health and education combined (see Box 3.1). Theconstruction of formulas is constrained by the availability of current data on the variables whichmeasure need (e.g., cost variations, current population characteristics), fiscal effort (e.g. taxrates, user fees), fiscal capacity (e.g., actual or potential own-source revenues), and measuresof service performance.
10. Formula grants which weigh the population of citizens or beneficiaries very heavily areoften caUed capitaton grants; as discuss4ed in detail below, Chile's central govemment uses aper student capitation formula to transfer monies to municipal governments for primaryeducation. EntUlement grants are formula grants which specify the amount of monies which ajurisdiction is eligible to receive should it submit spending proposals which meet the centralgovernment's criteria.
11. Matching program grants have formulas which require the receiving jurisdiction toprovide evidence of their own spending on the program. If matching grants are open-ended,jurisdictions are in effect offered a per unit subsidy to increase services provided. If matchinggrants are closed-ended, jurisdictions are offered the per unit subsidy up to the constraint on themaximum grant which the jursdiction an receive; beyond that constraint there is no incentiveto increase services, but a minimum cost-sharing by the jurisdiction is ensured.
14 See, for example, the Rahl and Linn (1992) tpology of grants for developing nations and Mikesell's (1982)typology of U.S. grants in aid.

28 Th Design and Admstration Chflergoveunema Transfers
B-* 31= Cooba =e tiisW oaGemnusfroa =e
T n 191 oobapse a 6 * a lc at(iud ielt
for f'dca_io an hath fWblc gian ~ i $deatmns n i at Iz (7% ntebsseadpatutspplto.Acodn olw7 ecn
ofte rntks oj pnto eu atio an 6pret What;tisrqieethsntbe
eafre ad3pectotleratW=seto elhi 9OP~psdipemniglisatio Mo th 91Cuttto ol le h ltiuno
grnst roielre twmfe w_r a=do oet s ihadt rvieicnie o
departmet oices hi w-orervne n ord .amnittvcos.heppoe. ,=a,1e an wegt o itiuio ftebokgat rB;ullm o ec eatet(5)
_h nubro eeire/sr 2 %S temne fptnilLsei(5) sa fotb h
12. AsiUdefro theiprop igoenv.osed,lgsain h darme thn tnts wildtietedtalsoe tsevea forms:a fo )
matcinclueed inthes fomuaya wel as h f rited amon fmny which muiiaiisms aisf ofren egoiated btwseengovernments; (2)thdamatchpngvrde i anbcientive omncialte toinrease thesictons;ag and t3) tempascing
praevmatiy healry care.dn onthe chariablenstinclue in the dreftcaioinallgjuislaction.fo dearmnthablt ahigrantesar ty ucpiallytadjuste for dlaiffrncehsBI inumbrcal caacitye ousrid nend(eattended, umbesor t
povidetncetives cnulatin,gais in gatheinexo behdavir(fcienyo, n rbedction) in hspeial7 case for macinpravnte disease The ctitaeersia iggati which nicpltsmutee th ecie grant s or maodate so ealtimu
serves ofipnding~ (n) enstablsh thalt alnfgratioes sysemn,(d tadot amoeuntree topvalofathe,r fsand
12act. AIde doms their beroiing oae vs. cloed mamutohing grns cotangento fseveal formsci(y,
govethtrnmntes (2)the mathin raevmayues rcideagrntia foruall jrsitioson3 the manaepnigatching,
capacty th dozeso this bypovdngagant, the afe gamonteoehihi'cnigeto fiscal capacity,rssud t ece eo
LAC Experience WA legoerwwneal Tr msrErs 29
13. Cost reinbursement grants either parially or fully compensatejurisdictions for their costsin providing specified services. Cost reimbursement grants significantly differ from fonnulagrants in that they typically require juisdictions to document the expenditures prior toreceiving grant monies, although the central government can advance funds to special accountswhich are replenished as receiving gvernments document eligible expenditures. Costreimbursement can be used for either recurrent or capital exenditures, and reimbursement caneither be full or pardal. Full reimbursement provides no incentive to jurisdictions to monitorcosts and encourage program efficiency; hence, full reimbursement or near full reimbursementis typically accompanied by cost controls and a strict approval process or expenditure caps.'
14. Partial reimbursement grants require cost-sharing by the jurisdiction that receives thegrant. Even when cost-sharing is not legally required, the central government providing thegrant can determine the eligibility of cosits to be reimbursed in such a way as to impose a defacto requirement for jurisdictions to partly finance the service in question. As discussed below,Chile's primary health care grants to municipalities in principle fully reimburse costs, but inpractice municipalities finance almost one-quarter of total costs from their own revenues.
15. Competitive grants are used mostly for large capital expenditures or for one-timerecurrent expenditures. Jurisdictions typically compete against one another by submitting projectproposals which best meet the central government's funding critena. In contrast to competition,sometimes the receiving jurisdiction is granted an entitlement to a specified amount of funds andmerely needs to submit projects which satisfy minimum funding criteria for approval by thecentral government. Colombia's system of grants to finance rumral roads are evaluated telow;these grants are both competitive and xequire cost-sharing on the part of the municipalityreceiving the grant.
16. Finally, ad hoc grants are those which the central government may award to a specificjurisdiction or set of jurisdictions on the basis of subjective criteria. While politics determinesto some extent all grant designs, includingr the legislation of grant formulas, ad hoc grants oftenuse political considerations as the principal allocation criterion.
17. Adminitaive Procedures. Intergovernmental grants can also be categorized by theadministrative procedures used to deteirmine the grant allocation to be received by anyjurisdiction. These procedures differ in the discretion allowed grant administrators, be they line-level technocrats or ministry politicians, lo influence the distribution and size of grants.
18. All grants are authorized by sorme form of legal statute, but when the legal statutespecifies the precise allocation of grant monies, grant administrators are left with very littlediscretionary power. Legal statutes can slecify the formula, the cost-reimbursement procedure,the criteria to be used to evaluate and pnoritize projects, and even the specific dollar amountsto go to specified jurisdictions.
is The low percent (10%) of state cost-sharing in the U.S. grant program for interstate highway constructonhas been blamed for the frequent cost over-runs and over-design found in the state mnged constructon.

30 The Design and Admition of InteTgovernmenau Transfers
19. In contrast to legislated rules and formulas to deternine grant allocation, the distributionof grants is sometimes the result of fonmal negotation between levels of government. Suchnegotiation can result in a distibution formula; agreements regarding the definition and extentof costs to be reimbursed; decisions about the size, composition, and financing of investmentprograms; and the nature of ad hoc grants (e.g., the size and characteristics of a centralgovernment grant to enable a subnational government to provide services in response to somenatural disaster).
20. One of the best known examples of formal negotiation in LAC is Mexico's system ofcentral government grants (labeled CUDs for Convenios Unicos de Desarrollo) to state and localgovernments for infrastructure investments.16 State planning committees (called COPLADESfor Comites Estatales de Planeacion para el Desarrollo) usually headed by the governor with asupporting technical team and broad representation by sectoral public authorities and the privatesector negotiate with the central government to arrive at a CUD. The CUD specifies the size andcompositon of investment projects to be jointly financed by the local, state, and centralgovemments. The CUDs are not entitlement grants as each state's amount of centralgovernment transfers is itself subject to negotiation, depending on the quality of the state'sproposed investment program.'7 While the final CUD results from some combination of centralgovernment pnorities, state and local government demand, and technical and economicevaluations of project proposals, critics complain that politics can also play a large role in theallocation of both the size and composition of the CUD, especially in election years.
21. Under formal negotiation, the administrative discretion of the central government isconstrained by the rules which set out negotiation procedures and the roles to be played by eachlevel of government. If negotiation is only paid lip service by the central government, the resultis effectively an administrative decision for determining grant allocation, which gives the centralauthorities almost complete discretion. Almost all grants require some degree of administrativedecision, which often sets the regulations or rules of the game required to implement the legalstatute; these regulations also influence grant allocation but only on the margin. Administrativediscretion is greatest when central government authorities can make ad hoc grants withoutlegislation or negotiation. The process and the criteria for deciding such grants are almost nevertransparent, and political considerations are likely to be the dominant allocation criteria."'
16 See Campbell, Peterson, and Brakz (1991) for faiher discussion of the CUDs.
17 The CUDs have recently been complemented by and, to some extent, replaced by the cental govemment'sSolidarity Program, which is aimed at increasing infistictr investments in poor communities. Under Solidarity,the central govermnent identifies investment priorities, while communities identify projects. Once projects areidentified, the different levels of government negotiate the precise cost-sharing arrangements for project fimance.
5 While political considerations dominate, they can be constrained. Ministers can be allocated grant moniesto allocate at their discretion but with constraints as to the type of activities to be funded.

LAC Experexce Wth Inte1governmenta Tronfers 31
B. Formula Grant for Primary Education.
22. intergovenmental capitation grants are a transfer per capita or per program beneficiary.The total transfer to the subnational jurihdiction (or other legal entity) is the product of thecapitation amount and the jurisdiction's population (or number of beneficiaries). Capitationgrants are most commonly used where the beneficiary population is easily defined and measured.In education, for example, capitation grants may be provided for school lunches for poorchildren, for textbooks for all children, or for enrichment programs for students with specialneeds.
23. An innovative example of a capitation grant in LAC is Chile's primary-secondaryeducation grant, which transfers a formula-based amount of cash per student to legal entities,including municipalities and private providers, authorized to operate schools. However,municipalities are not prohibited from using their own general revenues to finance increases ineducational spending above the capitation grant. An evaluation of Chile's capitation grant foreducation yields the following conclusions: (1) educational finance in Chile is transparent; (2)the central govemment's large finance share, combined with a cost-based capitation grant,ensures a relatively high level of minimum expenditures per student'9; (3) municipal-financedadd-ons, which are largely determined by municipal fiscal capacity, create or exacerbateexpenditure inequaLitye; and (4) educational providers eligible for the capitation grants stronglyrespond to incentives to maximize enrollmnent and constrain costs.21
24. Distribu*ion of Gmnts. The distribution of central government grants to municipalitiesis summarized in Figure 3.1. This figure compares the lowest and highest decilLe ofmunicipalities ranked along three municipal characteristics: average poverty rate, fiscal capacityas measured by total general revenues per capita, and average school achievement as measuredby the Education Ministry's standardized test. Since education affects income distribution,which is a central government concern, the distribution of grants between low and high povertymunicipalities provides one means of assessing how well this concem is satisfied. Fiscalcapacity measures the municipality's ability to pay; other things equal, the central governmentcan better attain its educational objectives by adjusting grant size for ability to pay. Schoolachievement is a measure of educational need; other things equal, the central government couldbetter attain minimum learng standards bty distributing larger grants to the neediest schools.
19 The base of student capitation grant establishes the nimum per student expenditure. In Chile, this gmntaverage is 90 percent of per pupil expenditures in municipal schools. This minimrbum las declined considerably inreal terms since 1981.
X Of course, expenditure inequality in part reflects differences in cost and service mix.
2 See Wilder and Rounds (1993) for an assessmnt of municipd and private sector supply response.
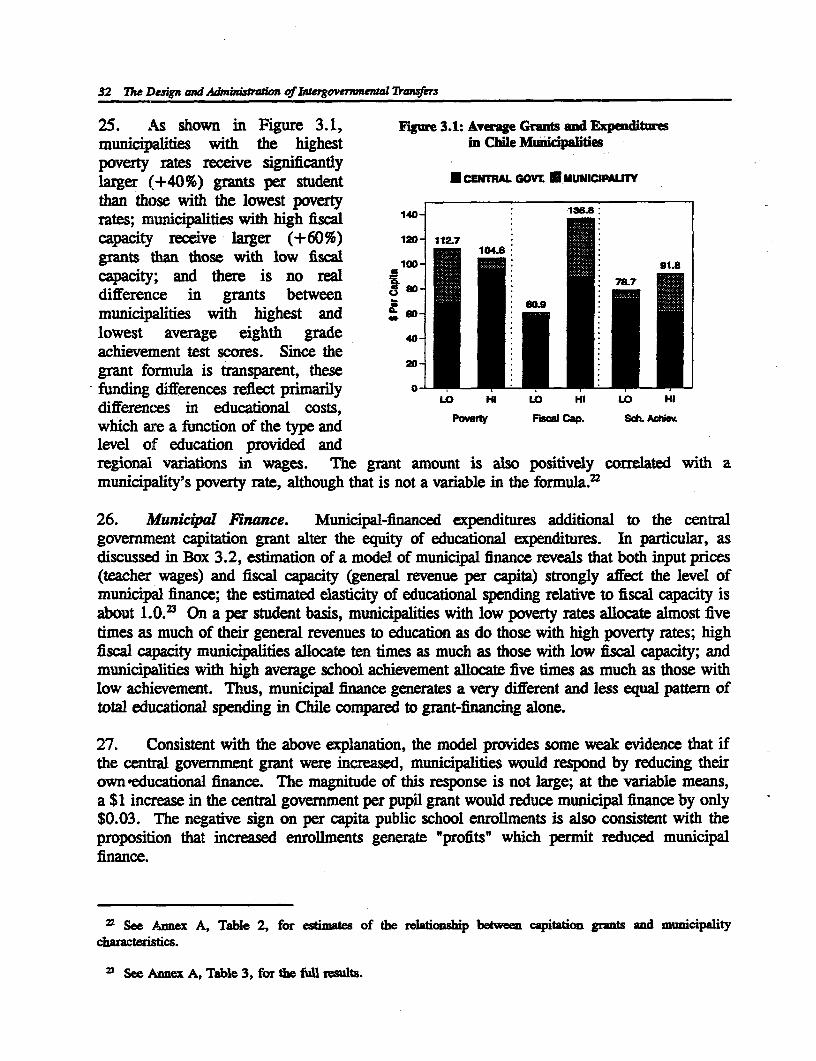
32 The Design and A&naioa of buergowvemmema Trnfers
25. As shown in Figure 3.1, Rue 3.1: Average Grants and Expendituresmnunicipalities with the highest in Chile Municipalitiespoverty rates receive significantlylarger (+40%) grants per stdent CENTL GO. UMUNICIPALITVthan those with the lowest povertyrates; muniities with high fiscal 140
capacity receive lager (+60%) 120- IZ7*grants than those with low fiscalcapacity; and there is no real 76 _difference in grants betweenmunicipalities with highest and solowest average eighth grade 40
achievement test scores. Since thegrant formula is transparent, thesefunding differences reflect primarily o- _ : . :differences in educational costs, LO H LO Hi LO Hi
which are a function of the type and Fiscap. Sh AChiev
level of education provided andregioal varations in wages. The grant amount is also positively correlated with amunicipality's poverty rate, although that is not a variable in the formula.?
26. Municipal Fnance. Municipal-financed expenditures additional to the centralgovernment capitation grant alter the equity of educational expenditures. In particular, asdiscussed in Box 3.2, estimation of a model of municipal finance reveals that both input prices(teacher wages) and fiscal capacity (general revenue per capita) strongly affect the level ofmunicipal finance; the estimated elasticity of educational spending relative to fiscal capacity isabout 1.0.? On a per student basis, municipalities with low poverty rates allocate almost fivetimes as much of their general revenues to education as do those with high poverty rates; highfiscal capacity municipalities allocate ten times as much as those with low fiscal capacity; andmunicipalities with high average school achievement allocate five times as much as those withlow achievement. Thus, municipal finance generates a very different and less equal pattern oftotal educational spending in Chile compared to grant-financing alone.
27. Consistent with the above explanation, the model provides some weak evidence that ifthe central government grant were increased, municipalities would respond by reducing theirown educational finance. The magnitude of this response is not large; at the variable means,a $1 increase in the central government per pupil grant would reduce municipal finance by only$0.03. The negative sign on per capita public school enrollments is also consistent with theproposition that increased enrollments generate 'profits" which permit reduced municipalfinance.
22 See Annex A, Table 2, for estimas of the relationship between capitation granxts and municipalitycharacteristics.
23 See Annex A, Tabe 3, for the full results.

-~~~~~~~~~~~~~~LAC Experiecec U1h Iiztergovenunema Tra,zsfr* 33
=-~~Bo 3.- _iia ianeo rnr duaini h
Muiial. .nc fedcto eEtsomuiyemn reucinadthcs tthRilciait f peidngth S I.en fice )aawer _oetd 0n20Cietmiiaite o h ert esimt £moe of uiial fzcefedcto.peicainf emdlisuddbyplcchieter i ro miia _ea _z slt ai loalpeig dt cosrand yteaiabl
reene .-. udnreu sari- an .od gants. gn addiion puli choc Rtheo ug.-ests tha votxr
inoeadtsesiol ulu ' uiia inac.Teeaemaue yfml vr
soieooi tts(E)adte ubro ulciho tdns e aia,wihrfet idiibtion "fpbi colbnft ntecznmt.Hge ot als 7iee 'mna fiacdeii -s _g hi e fcs nuaiia xeniue r neeriae ot meaue eeb
tece saaies.oa au rcs(rxelypplto est) n tdn-ece ais(hc t
coSS R aie 'n tR iot u) . :._ ... . ................ .., ............................ :.
.The reut shw tha a Ruiialt" .. c.cpct gnea eeus lysavr motnBol in R R aiRR niRnEg it edStoa BmuE (uipal fiane pe .td) th Rsiae elsict is
a:roiatl one whc is cosstn .it .,ixa ,eut fo the :US::h oiocnmc ttsociies snt infiud rltdtoeuatoa fnie n h number,.,',"'. ofpbi colsuet e
cait hs anuepce in ic ui~ldcso-aeswr lce ttetm fdtcolcin temcmim a eelng hiie .rfrne a reaiveywa,Bc fthecs aib
is fundto esut inhiger uniipa expndiure oneduati
Soiocoo P!b r 'sPplton Suet aiain WcpI apmie ink Smai _ coo Thhr Iasy tabr Oat icl T+fPmj, x au,.1 SaSr 3aXo Capac
S~~~~~ErCai
34 The Design and Adnbunraionf fltergoverwneal Transfers
28. Incentves. The mechanism for financing municipal schools in Chile provides incentivesfor the schools to increase attendance, especially given the excess capacity of some municipalschools. An increase in municipal enrollments would for many schools raise costs less than thecapitation grant, thereby generating a 'profit". Thus, increases in class size lead to reducedmunicipal finance.
29. - Municipalities also face incentives to reduce educational costs in order to limit municipalfinance. One means of reducing costs is to introduce greater flexibility in teacher employmentconditions, including total compensation. About one-fifth of all municipalities have elected toeliminate municipal departments and form corporations responsible for managing the schools,with a resulting change in employment regulations from the municipal code to the less restrictivecode for private employers.2' However, there is no evidence that those municipalities withcorporations have been able to reduce their level of finance for education.
30. Unless constrained by maintenance of effort provisions or minimum expenditurerequirements, municipalities can be expected to respond to increases in capitation grants byreducing their own outlays on the service. The resulting reduction can be used to either increasespending on other public services or to lower municipal revenues, both of which are likely tobe attractive to residents and voters. There is some evidence of this in the financing of Chileaneducation. Those municipalities receiving larger capitation grants have smaller municipal financeof education, although the magnitude of this effect is small. 5
C. Cost Reimbursement Grants for Primary Health Care.
31. Cost-reimbursement transfers require the subnational government to submit receipts andevidence of services provided in order to receive transfers from the central government. Whilecost-reimbursement procedures could conceivably be used to finance a wide variety ofgovernment goods and services, in practice they are most widely used to finance goods andservices which may be 'lumpy" in nature, requimng large outlays over a short period of time,or which vary widely between jurisdictions. The construction of large physical works is anexample of a lumpy good, while tertiary health care is an example of a service where thequantity and cost may vary widely between jurisdictions.
32. An example in LAC of the use of cost reimbursement is Chile's finance of municipalprimary health care costs on a fee-for-service basis. This case provides several conclusions:(1) full reimbursement of costs in the absence of cost and quantity controls provides a strongincentive to muicipalities to expand health services and thereby results in a very large growthin central government health transfers; (2) municipalities adjust their service mix in responseto profit (fee minus cost) incentives; (3) poorly designed cost controls can have adverse effectson equity; and (4) uniform cost-sharing can also adversely affect equity.
2A Subsequently, in 1992, a Teacher's Employment Statute was enacted which now regulates employment of alpublicly-financed teachers and, thus, eliminates this advantage.
25 See Annex A, Table 3, which shows a negative reationship between the size of the grant and municipalfinance.

LAC Expeawce WAhuigoveranemaal Tran#rirs 35
33. Distribution of Gants. TIhe igure 3.2: Average Grants and Expenditures for Primarydistribution of central government Health Care In Chile Municipalitesgants as of 1990 is summarized in *CENTRAL GOV. EMUNICIPALffYFigure 3.2. On a per capita basis, __
municipalities with the highest 8-concentration of poor residents 8.63received one-third more than didthose with the lowest poverty 6concentration; municipalitieswith the .lowest fiscal capacity received one- f.
84-quarter the amount of those with the 4highest fiscal capacity; and 4& 261_municipalities with the highest health 2.38 21 2.0needs received about the same asthose with the lowest health needs asproxied by a biologic/physiologichealth needs indicator developed by 0 10 H 10 HI LO HIUNESCO.LO H LO H LOi
Poverty Fiscal Cap. Health Needs
34. Municial Finance. Theexpenditure behavior of municipalities either create or exacerbate apparent inequities in thedistribution of central government transfers. For example, as shown in Figure 3.2 municipalitieswith the lowest poverty concentration transferred fewer resources from their general funds tohealth than did municipalities with high poverty rates; the overall result is lower healthependitures in high poverty municipalities where public health demand is arguably higher.Similarly, a high positive income (+0.67) elasticity of demand for health resulted in muchhigher municipal finance and expenditures on health in municipalities with high fiscal capacity(see Box 3.3).6 Finally, municipalities with low health needs provided larger transfers tohealth than did those with high health needs, although the latter still had higher expendituresper capita.
35. Incentives. While the equity effects of the Chile fee-for-service health transfer are clear,the efficiency effects are not so clear. In response to the incentives implicit in the fee schedule,municipalities adjusted their mix of health services and provided inadequate amounts ofpreventive services, which are usually highly cost-effective, but the size of the effects of thisservice mix on the health status of benefiliaries in unknown. Also, while municipalities havean incentive to minimize the costs of se rvice provision, the resulting efficiency in internalresource allocation is unknown.'
2 The complete estimated model is given in Table 3 of Annex B.
27 Furthemore, the fact regional health admitistrators have had the authority to make ad hoc health grants tomunicipalities facing financing difficulties reduce the incentives to reduce costs.
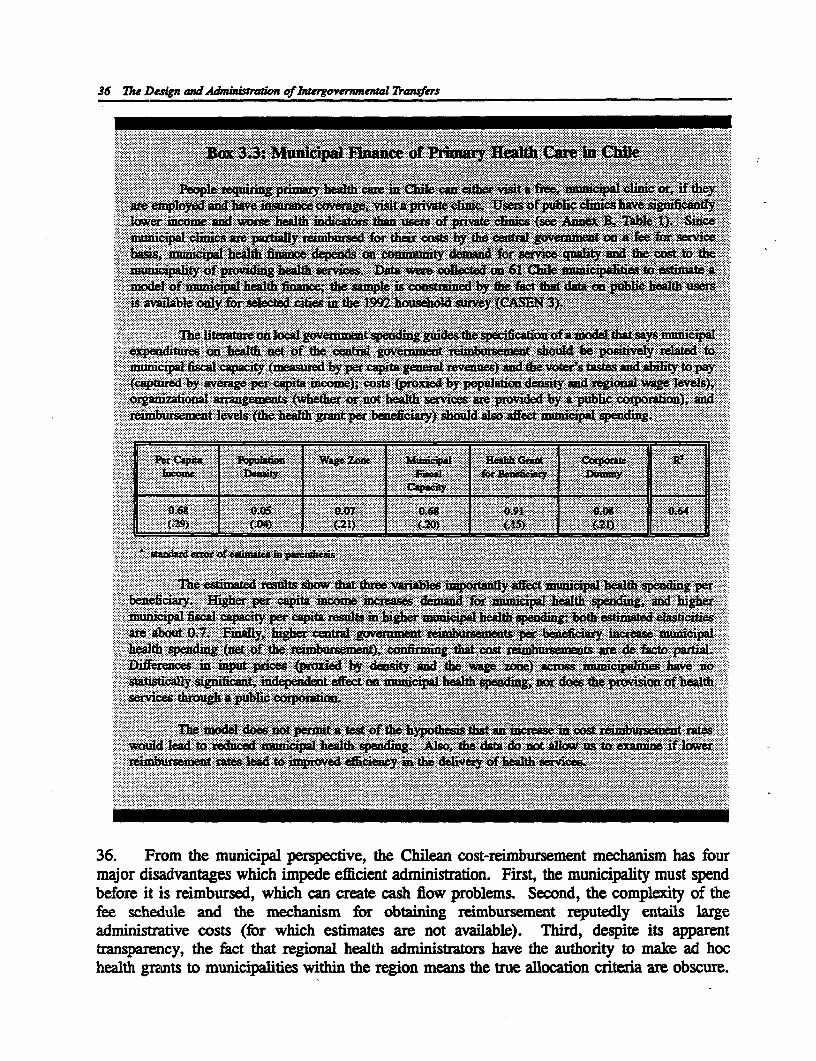
36 The Deign and Ad m of Intergomwnenta_ Transfers
.~~~~~.~ .*. .*.. .*. . . ~.......eppaha hl iri .ni.f
m enWloy*d and have insuuance c era*e. visitnpriv *cliuk= Usets ofpiiiiicshav* sig......t..
l =ncome aeaiit ettentwm
' .;. ... . :.,
a~~~~ ~ ~~~~~~~~ . ....... .. ;
36. is Fromca theat muniipal perpective the Chmui eman fort-reibrsemenalty mcand s the ast foutrmaodisadvantages wheich imp eade eftucient. Dadistaw ration.ee First t hle municipalityo mu stimapend
beodei is rembunrsida whea ch cancreathe capl sh flowcmproblesy eod the factaaaonmpuleity h oalth esfeeschealabe andlhy mcans for obtaininge i te 99 ~ remusmn reuelyetil)ag
admuns~thaie costesatfre wnlclgvnme ninchguestmaesae o ava ciiabe.Third, odespt ithaas appicrenltranpaencyithre fattanrgoa health nedmofstratcensralaveetherauthonty to pomtaly reatd hochengat omunicipal ls aaity(easuredtyhin aptah e nea regin eanes) n the tre scao maten an aret tobspaye
(atured9 by aErg 11111 cait inoe;css(rx y pvu o est ad rgoa aelvel)
36 roimbus n th es te hecial thve thrilant e befciy)holdlsoet-re mbursment pechndinmhagfu
majo zdiadvantageswhich imee fiietitgto. FieMm~pl roakst, Coqiemuiciaiyms.pn
before itis reimbu sedthc cncet c gasflo problem4s.eon,t he coEmplxtyo
fee sc ~hedues naned re b showchanis tore oabhlsimtainilg r amb fectmunica huealth sendaing lerg
administrativ (e t c ost fo. thec resimauseet)s aonre ta n o st ava iablre).t Th rd, desite iato aparetal
tranEparency,~~~efec thn mucnthtigioal health nspending, nave does atheporityo tof hae alho
wouldf leadt toreud municipalie wihealthe rendiong mals, the dat d.no alloca.tion exaitnare ilobscre

LAC E&prience Wih lergovermera Trasfers 37
Fourth, uncertainty as to the magnitucie of health transfers that will be receved by themunicipality during its fiscal year hinders budgeting and planning."
D. Competitive Grants for Rural Road Projects.
37. Competitive grants require objective criteria and transparent procedures for the selectionof projects to be funded. As is common in most LAC countries, the Colombian govemnmentfinances rual road construction and maintenance through a competitive grant program. Thisprogram, which is administered by the Rtral Roads National Fund (FNCV) finances the highestpriority projects proposed by local govemnments and recommended by the FNCV's regionaloffices. Priority is determined on the basis of cost-benefit ratios and the extent to which severalother criteria are met. For instance, ieeder roads cutting across several jurisdictions arepreferred to those that are strictly local; roads that connect with other segments of the regionalnetworks are favored over those that serve snaller areas; and repairs and maintenance workshave pnority over new construction.
38. Vaiable Matching Rates. Fgure 3.3: Municipal Share (%) for 16 MunicipalitiesWhat makes the FNCV programunique in principle is a system of * MATCHING RATEvariable matching rates whichdetermine cost-sharing. Once aproject is selected for finance by 0.
FNCV, a matching or cost-sharing 7.04 7.69
rate is determined for the 6.48 6.2 611
jurisdiction in which the project is 5.03located. The mechanism forsetting the matching rate is not -fully transparent, although it ismost strongly tied to population 2
size, which is thought to be agood proxy for fiscal capacity.
L0 HI [D Hl LO HI [D HI39. In practice, there is nostatistically significant relationship NEE FICAL CAP POVERT FISC. EFFORT
between a jurisdiction's fiscalcapacity and its matching rate (seeAnnex C, Table 2). Indeed, Figure 3.3 slhows that jurisdictions with the lowest fiscal capacity(as measured by per capita earmarked IVA transfers for investment) have slightly highermatching rates than those with the highest fiscal capacity. In addition, jurisdictions wilh lowpoverty rates have higher matching rates than those with high poverty rates; jurisdictions withhigh fiscal effort (as measured by own source tax revenue per capita) have slightly highermatching rates than those with low effort; and municipalities with low need (as measured by
' The government has introduced rect reforms to reduce the discretionaly authonty of regional administratorsand to provide minimum guarantees for the magn itude of health grants a municipality will receive.

38 7he Design andAdniustraton of e,govemmen 7)Wanfers
total meters of municipal roads per capita) face higher rates than those with high need. Perhapsthe most strildng finding from this analysis is the low average matching rate (only 6.2 percent)and the small differences in average matching rates between jurisdictions grouped lowest andhighest on any of these criteria.
40. Distaibu*ion of Grants. Figure 3.4: Grants for 196 MuicipalitiesWhile matching rates do not varygreatly among communities with CJTRAL GOYr NU MumcPAfunded projects, the per capita 14value of their grant does. Figure 12.49- 12.19:3.4 shows ftat, while there are 12-
small variations in matching ratesbetween jurisdictions, the 10- 9.33 934differences in per capita grantamounts are very large. C8Regression analysis (see Annex C, 5.59Table 3) further shows the percapita value of the grant is 4 3.66strongly and positively associated 2.48
with fiscal capacity. This largely 2
reflects (1) the constraintsmunicipalities face in financing 0their matching share for road LO HI LO HI LO HI LO HIconstruction and to ensure NEED FSCAL CAP. POVERTY FS. EFFORT
continued maintenance of thoseroads and (2) the fact that variations in matching rates in practice fail to adequately compensatefor differences in fiscal capacity. However, in interpreting these results, it is also important torecognize that the FNCV is just one of several programs to finance road construction inColombia. A sectoral review of road finance, which was beyond the scope of this study, shouldevaluate the FNCV program in light of the overall picture.
41. Incentives. The low municipal matching rate in Colombia's FNCV program providestrong incentives to municipalities to not use municipal revenues to undertake that roadconstruction which appear to meet FNCV criteria and, thus, may be financed by FNCVsometime in the future and, also, to propose over-engineered and overly-costly projects forfinance by the competitive grant program. It also provides a strong incentive to defer municipal-financed maintenance on those roads which, if sufficiently degraded, might be eligible for FNCVroad rehabilitation or maintenance grants. On the other hand, the implicit reward to higherfiscal effort provides an incentive to increase local revenues, especially since fiscal effort isexplicitly and positively rewarded in the formula that determines IVA tansfers to municipalities.
42. Municipal incentives could be improved through higher average municipal matching ratesfor new construction; matching rates for annual maintenance which are no higher than those forconstruction; and lower matching rates for jurisdictions that raise user fees on roads, in orderto both reward higher fiscal effort and to encourage cost-recovery.

IV
Grant Design: Simulations for Education,Health, and Rural Roads
1. The central government has multiple and oftentimes conflicting objectives concerning theservices provided by subnational govermments in decentralized systems. Its objectives forprimary education, primary health care, and rural roads were discussed in Chapter II, andexisting categorical grant programs were evaluated in Chapter m in light of these objectives.In this chapter, we consider how alternative grant designs affect these objectives. TIhe effectsof grants depend on the institutional context and the behavior of grantees. Hence, grant effects,including tradeoffs between central government objectives, can only be analyzed in a country-specific and sector-specific context. The results of simulations for alternative grants foreducation, health, and roads are presented in this chapter and provided in greater detail inAnnexes D-F.
A. Genera Princples
2. The grantor, typically the central government in Latin America, should select a grantdesign in light of its sectoral objectives, the institutional context, and the actual and anticipatedexpenditure and finance behavior of grantees, usually municipal or regional govemments. Inthis chapter, we consider how these actoirs might be used to evaluate alternative grant designs.While administrative and governance capacity to monitor program performance and enforceconditionality also constrain and influence grant design, discussion of these issues is left forChapters V and VI.
3. Sectoral Objectives. Central govermment objectives and their relative weighting varydepending on the sector. These objectives are most clearly defined and enunciated when theservices produced by the sector have strong national public good characteristics. Since incomedistribution and equity are usually viewed as public goods that are appropriate centralgovernment responsibilities, the national government often has a strong interest in the socialservices, irrespective of the level of government assigned the legal responsibilities for ensuringtheir provision. Similarly, the central government's unique national perspective gives it a rolein ensuring that public services are provided to ensure that national as opposed to parochialwelfare is maximized. Hence, it has a particular interest in seeing to it that interjurisdictionalspilovers resulting from the mobility of human capital, the production of environmental goods,

40 The Design and Adniuvadon of Intergoveirwntal Trasers
or the inability to exclude outside consumers do not result in suboptimal provision of governmentgoods and services.
4. Primary education, primary health care, and rural roads are all areas where the nationalor regional governments may have objectives which warrant a role in financing and influencingthe behavior of the local governments which actually provide the services. Primary educationaffects income distrbution and social mobility, and the fact that graduates are mobile means thepublic benefits of education are not fully captured by the local jurisdiction while a substantialportion of the costs of poor education are borne outside the junsdiction. Primary health careis similar to education in its effects on the earned income of health clinic beneficiaries, who areprimarily the poor, and the fact that filure to provide basic preventative services can result inhigher health care costs for society, with some of those costs borne by other governmentaljurisdictions. Finally, national and regional interest in the construction and maintenance of ruralroads is in large part tied to their effect on raising incomes of the rural poor through improvedaccess to markets and social services; in part due to the interjurisdictional spillovers resultingfrom the inability to exclude outside users; and in part due to capital market imperfections whichconstrain municipalities in financing road construction.
5. Instiutonal Context. Given a central government's specific interests and objectives ina sector, variations in community characteristics and the assignment of revenue and expenditureresponsibilities play a critical role in determining the design of intergovernmental transfers. Forexample, if revenue-sharing or block grants result in approximately equal fiscal capacity acrossjurisdictions, the central government need not concern itself with fiscal disparities in designinga sectoral grant. On the other hand, if local or regional governments vary widely in their fiscalcapacity, the central government might use fiscal capacity to in part determine the size of thegrant received by the subnational government. As another example, if poverty is equallydistributed across jurisdictions, there is no strong rationale to vary grant amounts with povertylevels. But if poverty is not equally distributed, those jurisdictions with high poverty rates mayface higher demand for some services (e.g., primary health care clinics) or higher costs ofservice delivery, which may wanrant higher central govenment grants. In general, disparitiesacross jurisdictions in demand or need, in capacity to provide services, and in the costs ofproviding services argue for grant designs which to some extent compensate.
6. The assignment of expenditure responsibilities also affects grant design. If the centralgovernment is required to use regional governments as pass-through agencies to municipalities,it is important to design the grants to the regions so as to influence the region's design of grantsto the municipalities. Also, in some cases, the central government is, in the name of provincialor local government autonomy, constrained in its authority to directly monitor the use of grantfunds; in this situation, an important part of the grant design is the provision of incentives todevelop adequate monitoring mechanisms at the subnational level.
7. Behaior of Grantees. National interests imply a potental financing role for the centralgovernment, but the size of this role and grant design depend on the current behavior ofsubnational governments. If an adequate quantity and quality of services is provided by local

Grant Design: Sbudaior Educaion, Heakh, and Rural Roads 41
governments, there is little justification for central government itervention. If localgovernments have very constrained capacity to raise additional revenues, including fiscal effortas a variable in the grant fornula hardly makes sense. Similarly, constraints to local-revenueraising may imply that a high cost-sharing or matching rate would distort expenditure patternsand adversely affect other central governmnent objectives by shifting expenditures out of sectorswhich do not require cost-shanng.
8. Grantee patterns in the use of funds also affect grant design. If the mayors ofmunicipalities view grant monies as a means to finance politically-visible landmarks, the centralgovemment may wish to impose stringent conditions on the use of funds. Such conditions arelikely to be different if municipalities tencl to allocate grant monies much the same as any otherrevenues. In general, incentives and regulations are required to elicit desired behaviors.
9. Sinula*ions. The central government typically has a number of objectives whendesigning its sectoral grants. While it is generally known which objectives conflict, the precisesize and nature of the tradeoffs involved can only be revealed by simulating alternative grantdesigns that include different allocation caritena that correspond to the government's objectives.In what follows, we present alternative grant designs consistent with the objectives discussed inChapter II for primary education, primary( health care, and rural roads, and simulate the grantsto determine how well the alternatives meet those objectives. The education and healthsimulations use Chile's 325 municipalities as the data base. The rural road simulations useColombia's departments and the municipalities of the Department of Tolima as the database.The variations in need, poverty, fiscal capacity, etc., found across municipalities in Chile andColombia are similar to those found in cther LAC countries. Hence, the conclusions derivedfrom these simulations are generally applicable in the Region.
o'able 4.1: Policy Choices for Additional Education GrantsK...... MI. . .......
10. The Value of the Chile C Governg; tMuinistry of Education capitation SJdn a1a1*grant to municipalities (and i p osubvened-pnvate schools) has i p. o_decreased by more tha one third w iacn since 198.1. In response, cBa:: ::::.p-.- with B B
municipalities have increased their da~ vrg lclcpctown financing of municipalschools, resulting in increased ~ aeEuizgwb &nasbo zctUdisparities in spending per pupil. " un4temade o The Miistry has responded to .this situation, in part, by .aci ~ S .... C......o~mumandating minimum teacher wages and providing additional mc_ A

42 The Design and Adtinianof aueirgovenmental Transfers
financing to municipalities to cover the costs of increased pay.' The Ministry should alsoconsider other alternatives. These alternatives should be evaluated in terms of the objectivesdiscussed in Chapter II: (1) increase the minimum level of educational services provided to allschool children; (2) improve equality of educational opportunity; (3) increase school performancethrough gains in efficiency; and (4) maximize the incrase in average per pupil school
penditures by increasing municipal finances.
11. Policy Choices. The Ministry has several options for ataining its objectives.O In thisanalysis, we assume the option adopted will be to increase the existing capitation grant or toadopt one of three alternative supplementary grants listed in Table 4.1; a larer set of optionsis defined and simulated in Annex D. These alternatives are all formula grants which base anymunicipality's transfer on its fiscal capacity, poverty rate, educational achievement, andmunicipal fiscal effort (finance per student) in education.
12. The first policy option is tosimply increase the base funding level
Figure 4.1: Percentage EqualizingoGrant of the existing student capitation35- grant by 15 thousand pesos per
student, which is about one-half the30o reduction in the real value of the
\44AW EVENWURE capitation grant since 1981; the5- MA EXPENDITURE current distributional formula is
E \ / assumed to remain unchanged. The,020- \ 1second option is to introduce a new,--> I percentage-equalizing grant whicha.15., - \............... .................. ............ pr cvides luger grna ts per student for
municipalities with low than high10- fiscal capacity. A third option is the
same as the second with the addition5 - \ of a mandate that every municipality
finance education expenditures of at0 least 15 thousand pesos per student.
a 05 I t.5 2 2.3 ]Figure 4.1 illustrates for this thirdFiscal Capaciy Ratio option how the Central Govemment
grant varies with the relative fiscalcapacity of the municipality (defined
9 This madateand assocted additional fumding applies m a modified form to subvened-pvate schools. Theydo not receive adcitional funding to cover the higher wages they may have to pay to compete with municipalschools.
30 These include m ng that municipal governments increase their spending, redoing the formul of theexisting capitation gat to better leverage central govenment transfers, and increasing the general revenues ofmunicipalities. As shown in Annex C, the latter is a particularly expensive (to the Central Government) means ofinreasing education spending.

GrantDegn. SinuonsjrEducafion, Heakh, andRuralRoads 43
as the non-earmarked revenues of the municipality compared to the national average for allmunicipalities); the expenditure mandate is constraining only for those municipalities havinggreater than average fiscal capacty. For example, a muniapality having twice the average fiscalcapacity would receive a Central Govermnent grant of zero but still be required to spend $15thousand per student. Finally, the fourth option requires cost-sharing or matching finance fromthe municipality, with the matching rate ietermined by fiscal capacity.
13. Simukions. The results 11w 4.2: Changes in Municipal Fiunaneof each of the four grant designsgiven in Table 4.1 were simulated 12
for all Chilean municipalities. 1* 10.4
The simulaions presume averageCentral Govemment education -
transfers per student increase by X15 thousand pesos, although the a'size varies by municipality; in .other words, each of the policyoptions simulated here does not 2 - 1.4
replace the existing capitationgrant but, instead, is -0.2
supplementary to it. The results __I.sof the simulations are evaluated in A B C D
terms of the presumed Ministry Amema _Curr saxdt rapiatn
objectives. The impact of grant Grant C: P Eqw h
options on minimum expenditures Designs Vabte catdhilnis reflected in the size of thetansfer and change in educationalspending in those municipalities which have the lowest fiscal capacity. The impact of grants onexpenditure equality can be seen by comparing the spending levels of municipalities at theextreme ranges of poverty rates and fiscal capacity.31 And the impact of grants on municipalfinance can be estimated using the model given in Box 3.2. The effects of grants on efficiencycan only be determined from the incentives implicit or explicit in grants.
14. Figure 4.2 summarizes the changes in municipal finance of education resulting from theincrease in Central Government grants for the four options. It shows that increasing the studentcapitation grant or introducing a percentage equalzing grant with no minimum expendituremandate both result in reduced municipl finance; this is consistent with the finding reported
31 TIs Means of mesrg equahty Is adoqted for conVeMence. Obviously, the ane superior wyays of
measuiing spending equality, including the computation of Gini coefficients and Theil statistics.

44 The Design and 4adiafion of lergovernentw Trmnsfe
earlier that, other things equal, municipalities tend to substitute additional education grantfumding for funding fmom their own general revenues. On the other hand, imposition of anexpenditme mandate dramatically increases municipal finance, and offering incentives formunicipal finance in the form of a matching grant increases municipal finance by a smalleramount.32
Figue 4.3: Changes in Educaton Finance 15. Figure 4.3 reports the simulationfor Low and High Fiscal Capaity Mumcipalities results of the four alternative grant
designs for the bottom and top decile ofECEBRLoGr. EMUNKPA municipadlties as ranked in terms of fiscal
capacity; for each alternative, both the25 - . .26.,additional government grant per pupil
and the change in municipal finance pert 15 15 , | * | ' | pupil are reported. For each option, the
15 ] * * ] * 0X ' s ~~Centra Govemment gTant is determxinedE9 lo x | . | , 11 . by formula (including, in the case of the
matching grant, the spending response of4 a0| | o . * oRil3i2 the municipality). For example, all
d -0.3-1. 4'*4 municipalities would receive the same. .: . . :.increase in capitation grant irrespective
, 8 UM Bt LO 5MF LO D Fll of their fiscal capacity, but high fiscal
.bnf _ capacity municipalities would not beGIn& r E_EmNug eligible for any increased grant under the
Gfflc: ew_" E_"f Wmfwff wDesigm D _, h percentage equalmng option or the
variable matching option.
16. The magnitude of the municipal response to the additional Central Govemment grantvaries with the amount of finance already provided and the existence of an expenditure mandate.In the case of an increase in the capitation grant, for example, municipalities with high fiscalcapacity reduce their educational finance more than those with low fiscal capacity because theireducational finance is large before introduction of the additional Central Government funding.The expenditure mandate increases the educational finance by both low and high fiscal capacitymunicipalities, but the amount is smaUer for those with high fiscal capacity because of theiralready high average financing of education.
32 Yet another policy option available to the Central Governmmt is to stimulate additional spending oneducation through increases in general revenue transfers to municipalities. Simulation of this result shows that itwould requ a increase in general revenue tansfors per pupil of 341 thousand pesos to bring about an averageincrease in education expenditures per pupil of 15 thousand pesos.

Grant Dgn Sinuduionsjfr Edwaion, Health, and Rural Roads 45
17. Figure 4.4 reports the FIgre 4.4: Change in Education Fioue for Lowchanges in education finance for and High PovertyMunipaliteslowest and highest municipalitiesin terms of poverty rates. High 2o
poverty municipalities receive 15
larer Central Government grants 3 15 151than low poverty municipalities in 11.8the case of pertage equalzing 2.'
grants but the reverse is true in Cthe case of variable matching sgrants, due to the smaller addition _*to municipal finance among those 0
with high povert rates. Furtier -0s 0.2 -01.
results reported in Annex D -6-
demonstrate that including the , , : , , _,poverty level in the grant formula L B C O
sharply increases the size of grantreceived by high poverty rate Aitemafive A.- Ctudent Capcatn
municipalities. As shown in 6rant Q Pwct EquaAE eMC: Prcn Equliin uh E _pnIb MadtAnnex D, the results are similar Dgns V mua dwhen comparing grant designs formunicipalities with low and higheducational achievement. Low achieving municipalities are favored by the percentage equalizngoption, while high achieving ones are favored by the variable matching grant. However, if theinverse of educational achievement is included in the grant formula, grants to low achievingmunicipalities increase siarply.
18. Conclusions. The simulations reported here and in Annex D permit the followingsummary and conclusions:
(1) Only expenditure mandates or adequate incentives (matching grants) successfullyleverage transfers into increases in municipal finance; an increase in the studentcapitation grant leads to the largest decrease in municipal finance.
(2) Expenditure mandates clearly serve to leverage Central Government financing, butit is the low spending districts tha-t are most affected by the mandates. These happen tobe municipalities with high poverty rates, low fiscal capacity, and low achievementscores. Percentage equalizing grants help offset these effects by targeting larger transfersto the municipalities with these characteristics.
(3) Per student expenditures prior to the grant are lowest in high poverty ($104.6) andlow fiscal capacity ($60.9) jurisdictions. A percentage equalizing grant with expendituremandate would increase spending the most (+$22.3) in high poverty municipalities,

46 lhe Design andrAzirtr4aon of hergementl Trantsfrs
while a variable matching grant would incrase spending the most (+$27.3) in low fiscalcapacity municipalitie&
(4) Prior to the grant, per student ecpenditures are least equal comparing jurisdictionswith low and high fiscal capacity; the spending difference is $75.9. Among the options,a variable matching grant would increase the spending of low fiscal capacity jurisdictionsthe most and, thus, reduce the spending difference the most. But, if instead of reducingspending differences, the goal were to increase the resources available to schools withhigh percentages of poor children, the preferred choice would be a percentage equalizinggrant with expenditure mandate.
(5) These findings demonstrate that the results of any simulation depend on the formulaand, especially, the weights attached to variables in the formula. Identifying the bestformula requires successive iterations of alternative formulas, in addition to sensitivityanalyses regarding likely behavior on the part of the grant recipient.
(6) Policy-makers with multiple objectives face tradeoffs in their choice of formula. Themagnitude of these tradeoffs depends on the grant formulas as well as the institutionalsetting. While this again indicates the importance of simulating grant designs, in the endpolicy-makers have to decide which objectives have highest priority.
19. These results suggest that, given presumed central government objectives, the optimalgrant to increase spending on primary education in Chile would be a formula-driven, percentageequalizng grant accompanied by a minimum expenditure mandate where the size of themaximum grant per pupil is directly related to the percent of the school age population inhouseholds classified as poor. This grant could be accompanied by regulations (e.g., specifyingextra school resources or additional teacher class time) to target additional spending on poorstudents.
C. Primary Health Care
20. Problems with the fee-for-service mechanism for reimbursing municipalities for the basichealth services they provide through their health clinics have led the Government of Chile toconsider altering the way it finances decentralized primary health care, with most attention beinggiven to adoption of a formula-based capitation grant. In making this change, the Governmenthas several objectives: (1) satisfy minimum health needs of those using municipal healthclinics; (2) create greater equity in service provision; (3) improve efficiency in the provision andthe mix of health services offered by the clinics; and (4) improve health care as much as possiblewithout increasing Central Govemment spending. The challenge facing the Ministry of Healthis to devise a capitation grant that meets these objectives.

GratDesign WSimojbr Educo, Hcaa, adRural Roadi 47
Table 4.2: Policy Options for Health Tranders
'. . ....
kg{N~~~~~~~~~~. .. .. , . . . .
M~~~~~~~~~~~~~~~~~~~~~~~~~~~~~~~~~~~~~~~~~~~~~~~~~~...... ....
.. v . -. :: R :.:: i - :: B. B @ j :X.m. . t : . ::: {:::: R: . :: :.:.::: :.::::.: ..
21. PoSUt Choices. A wide vanety of options are avlable to the Ministry of Health indesigning its new transfer system, including the five options waluated here and defined in Table4.2. An assessment of other options is given in Annex E. The options analyzed here are keptsimple in order to demonstrate their effects. One option is to retain the existing costreimbursement plan, perhaps with simplification of the fee schedule to reduce administmtive
-urdens and adjustments in reimbursement fees to provide incresed incentives for preventivehealth care. A second option is to substitute a formula grant per capita, where the transfer isweighted by each municipalmty's relative povaety rate and relative ratio of young ay d oldinhabitants.33 As evaluated here, this option also requires that each municipality not reduce itsurrent level of health finance (i.e., maitenance of effort). A WtMir option is identical to the
second accept mitnceof effort is replaced by the requirement that each municipalityp Mrovide adequate financing tD guarantee per capita expenditures at least equal tD the currentnational average. A fourth option would provide a matching gat for municipal health finance,with the rate itself vay idg iversely with the muaipavty's fiscal capacity. Feat y, a fiftioption is a variant on the fourth and requires the same minimum expenditure as specified foroption three, i.e., that each municipality provide adequate financing to guarantee expendituresequal to the cufent national average.
22. Sniaseons. The results of each of the giant designs given in Table 4.2 were sriulatedfor the fur set of 325 municipalities in Cmife. The simulations presume no increase in aggregateCentral Goveaument health transfers tD muftciparties, although its allocation among
h Ideally, the aggsegaco d o inved by any sbesth ci a or mulcipagty phould be detemed by the numbtn erof users. Such data are not available for Chile, bidt analysis of hlousehold survey data (Annex E, Table 6) indicatesthat th by eah ality'selatioe poverty rateon (iand 4 el over 60 yes ofug are goodpredictors of the number of chinc users. Until renable data ere devroped on the ntber of puibc i ealth cthmcusers, capitation fomulas ihould ncelude mefsfrt s of poverty and/or age drirtnbutit al

48 lhe Design and Adnuration Qf ltergovenenu Transfers
municipalities is allowed to Figure 4.5: Municipal Share of Totalvary as is the level of finance Primary Health Care Fnancefrom municipal generalrevenues. These simulations D. 0.50
furthermore presume that the 0040 -- _ --------------------
existng system would be fidlyreplaced by the atemiwves. 03------------- -------
Excepting the existing system, t oSoothe amount of the Central - o2o _ - --
Govemment grant is determinedby fonnula. The municipal 0.10 ---
response to each grant is determined using the elasticities ° ° -
for municipal health financeestimated earler. A: Existing system
AJtemative 8: Formul Grant with Maintenance at Effort Requirement
Gant C: Formula Grant with Minimum Expenditure Mandate
23. Figure 4.5 shows the Designs D: Variable Matching Grant
municipal health finance E: VirtablS Matchin Grant ith Expenditure
response to each of the fiveoptions. Under the exstingsystem, municipalities cover one-quarter of total primary health care expenditures. Replacingthis system with a formula based capitation grant and a maintenance of effort requirement isassumed to result in no change in municipal finance. Replacing the existing system with avariable matching grant that provides positive incentives for municipal finance would result invery litfle change from the existing system, while expenditure mandates options C and E) wouldsignificantly increase municipal health finance and, thus, the proportion of total healthexpenditures which they finance.
Fue 4.6: Low and High Fisa Capacty Municipaliies
24. Figure 4.6 gives the esimulation results of the fivealternative grant designs for the 5 *bottom and top decfle ofmunicipalities as ranked in termsof fiscal capaty. The existing 3 . '2.3 2.63
sstem provides sgnficmtly 2' 2 2..2
higher transfers per capita to 1.16 1.16
high than low fiscl capcities; z : 0.62'
this difference reflectsdifferences in costs and use of 0LO Hi LO Hi LO HI LO HI LO Hi
clinic services. In contrast, aA a C D Evariable matching grnt would A: Exi.ing8^ ystem
AUMd : Formula Grant with Maintemnanc of Effor RequIremepntprovide much larger transfers to Gra C: Frmula Grant wfth Minimum Expendiure Mandate
municipaities with low fiscal D 0 D: Varable Matching GraE.- VariaNo Mafthing Gr_n wil Expendlur Mandate
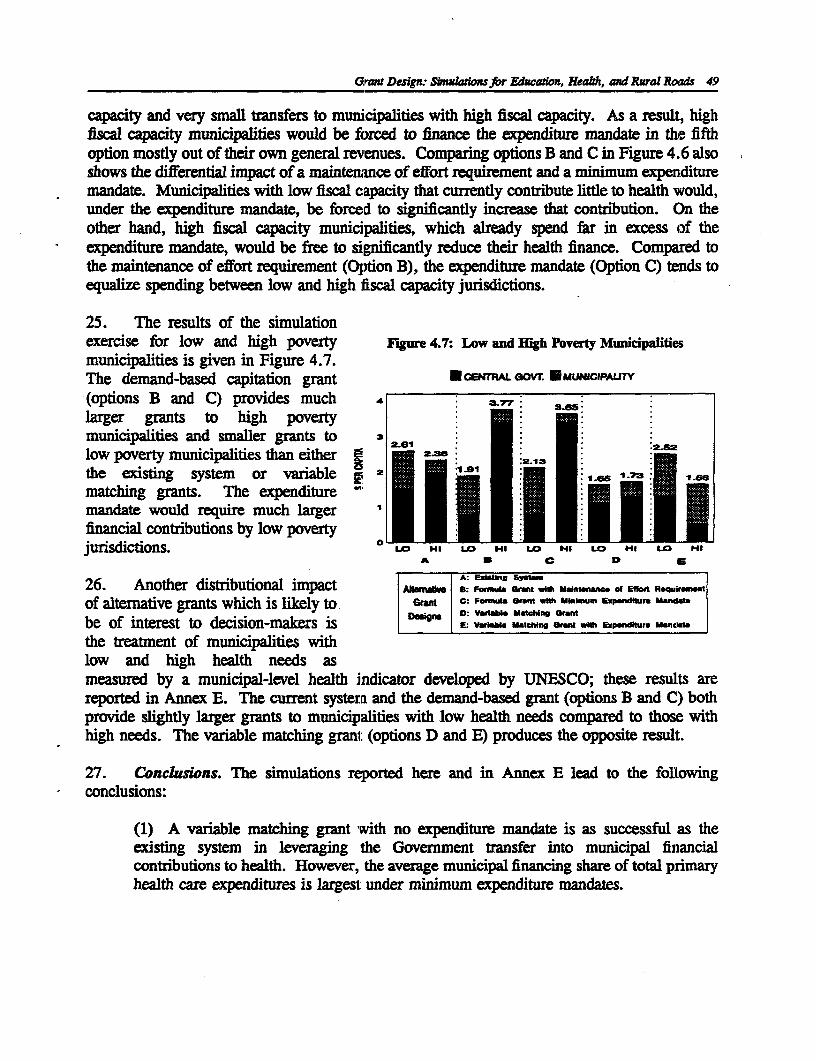
Graw Design Smulaosfor Fducaton, Health, and Rural Roads 49
capacity and very small transfers to municipalities with high fiscal capacity. As a result, highfiscal capacity municipalities would be forced to finance the expenditure mandate in the fifthoption mostly out of their own general revenues. Comparing options B and C in Figure 4.6 alsoshows the differential impact of a maintence of effort requirement and a minimum expendituremandate. Municipalities with low fiscal capacity that currently contribute little to health would,under the expenditure mandate, be forced to significantly increase that contribution. On theother hand, high fiscal capacity municipalities, which already spend far in excess of theexpenditure mandate, would be free to significantly reduce their health finance. Compared tothe maintenance of effort requirement (Option B), the expenditure mandate (Option C) tends toequalize spending between low and high fiscal capacity jurisdictions.
25. The results of the simulationexercise for low and high poverty Fgure 4.7: Low and Eigh Poverty Municipalitiesmunicipalities is given in Figure 4.7.The demand-based capitation grant U CERAL Gov. UI UNICIPAUTY
(options B and C) provides much 4 37-7 3s: 5
larger grants to high povertymunicipalities and smaller grants to 3
ow poverty municipalities than either t 236 *'
the exstng system or variable M, 2. se6 - I' '
matching grants. The expendituremandate would require much larger 1fimancial contributions by low poverty m _jurisdictions. LO Hl lo tD l LO Ml LO Hi
26. Another distnbutional impact A: EanD S o Ekt Heulo
of alternative grants which is likely to j c rat C: Forwta Grant with UMihiumn Expdblltu Mamdat
be of interest to decision-makers is D Egi 0: Vadabia Maing Grant re L
the treatment of municipalities withlow and high health needs asmeasured by a municipal-level health indicator developed by UNESCO; these results arereported in Annex E. The current systern and the demand-based grant (options B and C) bothprovide slightly larger grants to municipalities with low health needs compared to those withhigh needs. The variable matching grani: (options D and E) produces the opposite result.
27. Conclusions. The simulations reported here and in Annex E lead to the followingconclusions:
(1) A variable matching grant with no expenditure mandate is as successful as theexisting system in leveraging the Government transfer into municipal financialcontibutions to health. However, the average municipal financing share of total pnmaryhealth care expenditures is largesi under minimum expenditure mandates.

50 The Design andrAt urauion ofbagovnedT ransfers
(2) Among the grant options, a variable matching grant, with or without the expendituremandate, would result in the highest health spending in mcialities with low fiscalcapacity, while either the exsting system or the variable matching grant with theexpenditure mandate results in the highest health spending in municipalities with highpoverty.
(3) Spending in high poverty municipalities is highest under the formula grant, whichincludes poverty as one of the determining variables; all other grant options result inhigher spending in the low poverty municipalites. Since there is some evidence ofhigher use of health clinics in urban centers with high fiscal capacity, it is not appropriateto assume equity. would be improved by increasing transfers or spending onmunicipalities with low fiscal capacity.
(4) As with the education simulations, these findings demonstrate the need for successiveiterations of alternative fornulas and the fact that policy-makes will almost always facetradeoffs between conflicting objectives in deciding on the best grant formula. The bestformula in the case of health is likely to be a demand-driven formula grant with amatching rate that vanes with fiscal capacity.
28. Given the objectives which have been assumed on the part of the central govenment,these results suggest that the optimal grant for primary health care provided by municipalitiesin Chile would be a formula grant, the amount of which is determined by predictors (especiallymunicipal poverty rates) of clinic use and service cost and which requires cost-sharing by themunicipality (either in the form of minimum expenditures or a matching rate). To preventclinics from restricting use, the grant could be accompanied by regulations requiring them toprovide services of minimum quality to all users, or the grant for the subsequent year could beadjusted downward if actual use were less then predicted use.
D. Runal Roads
29. As part of its overall decentralization strategy, the Government of Colombia hasincreased the general revenues of departmental and municipal governments and authorized theelection of leaders for subnational governments to replace appointed officials. Consistent withthis strategy, the Government has devolved to the departmental and municipal governmentsresponsibility for constructing and maintaining secondary and teriary roads. Responsibility forrural roads is divided between the departments and the municipalities, but the CentralGovernment partly finances their constuction and rehabilihtation. Proposed legislation, however,would replace direct FNCV matching grant transfers to the municipalities with block grants tothe departments, which would be responsible for passing these monies on to the municipalitiesfor rural roads. Several policy options are consistent with the proposed legislation, and theeffects of these options are simulated here.

Gwut Designg Sbutiaorss for Education, Heafh, and Rural Roads 51
30. Central Government Objecives. The Central Government has several objectives infinancing municipal rural roads: (1) ensuire that subnational governments with large rural areashave an adequate feeder road network; (2) ensure that municipalities (which have no access tocapital markets) with severely constrained general revenues can finance high priority roadprojects; (3) alleviate rural poverty; (4) prevent subnational govemments from using grantfinancing to lower their taxes; and (5) ensure adequate maintenance of the existing road network.Policy alternatives for intergovernmental grants should be evaluated in terms of these objectives.
31. Poliy Choices for Departmental Block Grants. The Central Government can providethe departments with the additional resources required to operate the rural roads program eitherby increasing departmental general revenues (through new tax sources or revenue sharing) withmandates to maintain the rural roads program or through block grants to the departments to passthrough to the municipalities for rural roads. While departmental general revenues might beincreased as part of a more general reassigmment of revenue and expenditure authority, currentplans call for introducing a block grant, and that is the option simulated here.
32. The amount of money a given depertment would receive under a block grant could bedetermined by: (1) continuing to transfer dhe amount currently received by municipalities in thedepartment under the FNCV program or (2) using a formula to transfer revenues consistent withCentral Government objectives for rural roads. The first option would not entail redistributionof funding between departments and, thus, might be more politically feasible than a redistributivegrant, especially during the transition process; it would, however, in the long run not allow theflexibility to change funding with program size or the financing requirements of the departnents.
33. Six formula-based options for deternining block grants to the departments were simulatedhere: (1) the amount currently received by municipalities in each departnent; (2) need (asproxied by meters of municipal roads per capita); (3) municipal fiscal capacity (as proxied byIVA transfers to municipalities earmarked for investment per capita); (4) the department'sabsolute poverty rate; (5) fiscal effort (as proxied by municipal own-source revenues per capita);and (6) a formula giving equal weight to meed, fiscal capacity, poverty, and fiscal effort.34 Theexperience of other countries with transpmortation block grants suggests that need (option 2)should be the principal determinant of grants.
34. Simulaion Results for Deparment Block Gnints. Each of the six grant designs weresimulated for Colombia's 33 departments. The simulations presume no increase in aggregate
34 Fiscal capaqty and fiscal effort always have to be defined given the institutional context. In Colombia,municipalities can collect some own-source revenues and the size of this collection is defined as fiscal effort. Inaddition, municipalities finance most capital expenditures from IVA tnmsfers, which gives a measure of fiscalcapacity for runl roads.

52 7Te Design and AinWsradon of Iniergovernm Tranfrs
Cental Government transfers for rural roads. The results for the bottom and top quimitle ofdeptments in terms of need, fiscal capacity, poverty, and fiscal effort are given in Table 4.3.They show the following:
Table 4.3: Effects of Alternative Grant Designs on Central GovernmentTransfers to the Departments for Municipal Rural Roads
(US$ PER IOOK NHABITANTS)
____________ DEPARTMENTAL CLSSCATION
ALTERNATIVGRANT DESIGNS Ned Fic Capacity Pove(ty Y=2a Effort
|__________ High Low High Law High Law High Low
| projctagians (siNCV) 107.2 73.7 126.0 70.1 75.5 92.7 58.1 120.9
2. Formula grant based 150.1 33.9 104.9 84.7 107.4 56.2 58.3 109.3on need
3. Formula grant based 97.1 78.4 71.1 116.3 86.3 85.3 105.3 81.4on fiscal capacity
4. Formula grant based 105.3 56.1 90.7 82.8 125.2 54.9 59.8 112.2on poverty
5. Formula grant based 45.9 142.5 51.3 106.2 35.6 108.0 155.8 32.1on fiscal effort
6. Formula grant thatweighs all fictors 95.4 S5.4 79.7 98.9 88.8 78.3 97.2 84.2equally__ _ _ _ __ _ _ _ __ _ _ _ __ _ _ ___ _ _ ___ _ _ _
(1) All but one of the six alternatives favor high need over low need departments, theexception being a formula based solely on fiscal effort. Thus, all alternatives, includingthe existing FNCV system, are acceptable with respect to the single most importantcriterion. 3
(2) Aside from need, the existing FNCV system does poorly, favoring departments withlow municipal fiscal capacity, low poverty rtes, and low municipal fiscal effort (seeFigure 4.8).
35 This conclusionpresumes need is measuedby kdlometers of muicipal ds per capita; for siulionsusngdifferent need masures, see Annex F.

Gan Design. Smuins jbr EdCation, Heat, and Rural Roads 53
(3) The Central Flgue 4.8: Aveage FNCV Grants and Munidpal ExpendituresGovernment fices clear for Rural Roads in Colombia, Aggregated by Departmenttradeoffs in its objectives.Formulas solely based on CENTRAL Govt. U muNICIPAuTyfiscal capacity or fiscaleffort strongly favor 110 134.3:
departments with lowmunicipal fiscal capacity 120 114.1
and high municipal fiscal Jss
effort, while formulassolely based on need or 0 so 77.6 73.7
poverty strongly favor e 80.7
departments with high need L **and high poverty.
(4) A formula grant that 20
weighs all factors-need,fiscal capacity, poverty, LO Hi LO Hi LO Hi LO Hi
and fiscal effort-satisfies NEED FISCAL CAPACY POVERTY FISCAL EFFORT
aRl four criteria whilestrongly favonng none.Figure 4.9 demonstrates how well this formula grant satisfies the criteria compaxred tothe existing FNCV grants aggregrated at the department level; an index value of oneindicates neutrality, larger than oxne indicates the criterion is satisfied, and less than oneindicates the criterion is not satislied.
35. Based on the presumed central goverment criteria for distribution of block grants formral roads to the departments, an equaal weight fornula grant provides the best iresults.However, one could argue that need and poverty should be the principal determnants of suchgrants; in this case, a formula grant based on these two vanables would work best. In addition,a strong argument could be made for requiring the departments to contribute matching funds toprovide a larger incentive for departmenital oversight of the rural roads program.
36. PoNcy Choices for Departiment G;unms to Municipaliies. The assumption made here isfhat in its new legislation to devolve rural road grant management to states the /CentralGovernment will specify the broad criteria to be used in both project selection an/d cost-sharing.36 Furthermore, the relatively low level of central government funding for rural roads
I As a comparison in the U.S., the pass-through process is different for each federal aid program. For somegrants (e.g., Urban and Secondary Highways Cirnts), the state passes funds on to local governments using theformula by which they come to the state, while for others (e.g., Bridge Replacement Grants) the state sets its owncriteria and pziorities.

54 7he De8gn and AdinratiWn of haergelnwnua Transfers
rules out use of any kind of Fre 4.9: lndex of Extent to Which Evaluation Criteriacapitation grant to the Satisfied for Central Government Grants to the Departmentsmunicipalities.37 Instead,departments would continue theFNCV's current pcdtice of 1.45selecting a small number ofprojects to be funded and of 1. 124specfying the required municipal 1.1 1.13 1.15matching rate. 1 _ -----
37. As is the practice with the 0.81existing FNCV grants, the most 0548important determinant of a 0.48municipality's matching rateshould be its fiscal capacity, butmeasures of a municipality'spoverty rate and its fiscal effort a _ _ _ _ _could also be included as Need Fiscal Capacity Poverty Rscal Effortcriteria.3 8 Hence, three optionswere simulated here for thatdepartment (Tolima) having thelargest number of municipalities (45) in Colombia: (1) maintain the matching rates of theexistig FNCV system; (2) a formula that determines matching rate on the basis of fiscalcapacity (as proxied by eannarked IVA transfers); and (3) a formula that determines thematching rate by giving equal weights to the municipality's fiscal capacity, its absolute povertyrate, and its fiscal effort (as measured by municipal own-source tax revenues). The twoalternatves to the existing system were also simulated assumnig an increase in the existingaverage matching rate of 7.73 percent to a higher 33 percent. The results of the simulations arereported in Table 4.4.
' The average rural road grant per capita was $US 7.21 in 1990; at this level of finding, only the very largestmunvcipalities would receive enough funds to undertake even a small project
38 Some measure of need should be used in selecting prjects to be funded but is not a relevat cnterion fordetemining the municipal mathing rate.
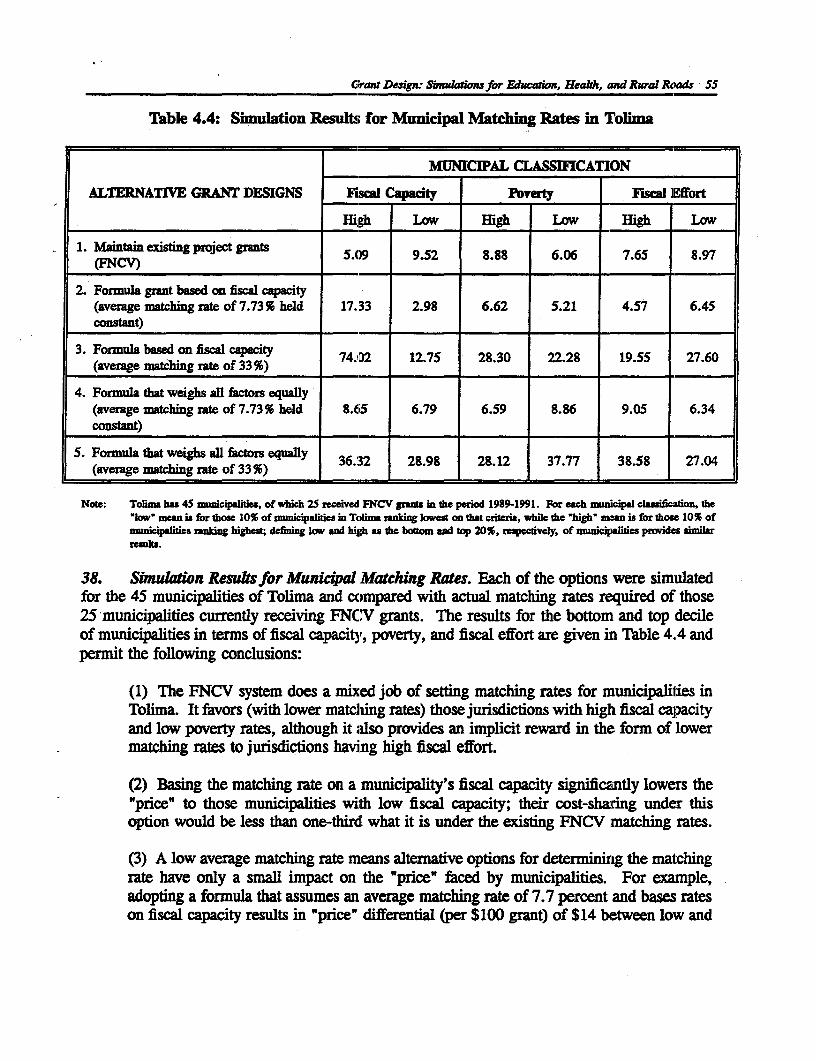
G;ra Desig Snmlationsffor Edacon, HeaMh, and Rural Roads 55
Table 4.4: Simulation Results for Municipal Matching Rates in Tolima
MNIMCIPAL CLASSJFCATION
ALTERNATIVE GRANT DESIGNS Fiscal Capaty rty Fl Effort
._________________ High LOW High LOW High LOW1. Maintain edsting project 5.ga9 9.52 8.88 6.06 7.65 8.97
(FNCV) 5_9__5 8 6_6__6 89
2. Fonrmda grant based on fisd capacity(average matching rate of 7.73% held 17.33 2.98 6.62 5.21 4.57 6.45constant)
3. Fornula based on fiscAd capacity 74.02 12.75 28.30 22.28 19.55 27.60(average matching rate of 33%) _
4. Formula that weighs all fictors equaly(average matching rate of 7.73% held 8.65 6.79 6.59 8.86 9.05 6.34constant)
5. Formula that weighs al factos equally 36.'32 28.98 28.12 37.77 38.58 27.04(average matching rate of 33%) I_I_ I
Note: Tolihm bh 45 municipalities, of which 25 received FNCV gms in the period 1989-1991. For ecch municipal clauification, the'low' mean i for those 10% of municipalities in Tolima ranking lowest on that criteri, while the lugh mean is for thosc 10% ofmunicipalhitis raning highest; defining low and hilh as the botm and top 20%, respectiely, of municipalities provides similar
38. Sinulaion Results for Municipal Matching Rates. Each of the options were simulatedfor the 45 municipalities of Tolima and compared with actual matching rates required of those25 municipalities currently receiving FNCV grants. The results for the bottom and top decileof municipalities in terms of fiscal capacity, poverty, and fiscal effort are given in Table 4.4 andpermit the following conclusions:
(1) The FNCV system does a mixed job of setting matching rates for municipalities inTolima. It favors (with lower matcling rates) those jurisdictions with high fiscal capacityand low poverty rates, although it also provides an implicit reward in the form of lowermatching rates to jurisdictions having high fiscal effort.
(2) Basing the matching rate on a municipality's fiscal capacity significantly lowers the'price" to those municipalities with low fiscal capacity; their cost-sharing under thisoption would be less than one-tirdu what it is under the existng FNCV matching rates.
(3) A low average matching rate means alternative options for determining the matchingrate have only a small impact on the "price" faced by municipalities. For example,adopting a formula that assumes an average matching rate of 7.7 percent and bases rateson fiscal capacity results in "price" differential (per $100 grant) of $14 between low and

56 The Design and Admvniuradon of itergowmemeu Tranfers
high fiscal capacity municipalities, respectively. Increasing the average matching rateto 33 percent increases this price differential to $61.
(4) As shown in Figure Fge 4.10: Index of Extent to Which Evaluation Criteria4.10, basing the matching Satisfied for Department of Tolima Grants to Mnicipalitiesrate on three equally-weighted factors satisfies 6 5.78
the evaluation criteria nobetter overall than basing 5
the rate on fiscal capacityalone; both alternatives, 4
however, satisfy thecriteria better than the srates established under theexisting system. 2
1.27 1.35 ~~~~1.4139. Overall, these results 1 os3 045 0.7
provide evidence in favor of a Oilhigh average matching rate FsCa Capacity Povery FiSca Effirt
determined by fiscal capacity OFNCValone. Instead of using a P.0 b fddan iscw cWad,
municipality's poverty rate to .d*I>d s 1hf fdetermine its matching rate, itwould be preferable to use theanticipated benefits to the poor as one of the criteria used to evaluate project applications. Fiscaleffort should probably be deleted from any matching rate formula; given the low probability ofhavng projects funded, the expcted returns from raising fiscal effort would be too small toaffect municipal behavior.
E. Summary.
40. Central governments have multiple objectives, and they face multiple options in thedesign of sector-specific intergovernmental grants. Since the effects of grant options dependson institutional conditions (e.g., the distribution of fiscal capacity among jurisdictions) and ongrantee behavior (e.g., the elasticity of municipal finance with respect to the government grant),the success of grants in attaining their objectives must be determined through country-specificand sector-specific simulations.
41. In this chapter, government objectives and altemative grant designs were specified forthree sectors-primary- education, primary health care, and rural roads. Municipal data basesfor Chile and Colombia were then used to simulate the grant designs. The simulation resultswere evaluated by (1) comparing mumcipal finance response in the case of education and healthand (2) companng the lower and upper decile of municipalities in terms of their fiscal capacity,poverty rates, and, in the case of rural roads, fiscal effort. This type of comparison is

Gwzant Dsig nudaosfjbr Educasion, Heakh, and Rwal Roads S7
satisfactory for the limited purposes of this paper, but any effort to find the single best grantdesign for a specific country and sector should look at the effects of alternatiLve grant designsacross the full distribution of jurisdictions and use more detailed measures of grant impacts (e.g.,use of Gini coefficients to measure equal]ity).
42. The simulations demonstrate thaLt government objectives are often conflicting, anddetermination of the single best grant fornula requires that priorities be set on those objectives.In addition, the simulations provide some evidence in support of the following conclusions:
(1) A simple grant design may att3in central government objectives as well as a complexdesign, and it has the further advantage of being easily understood by the grantor andgrantee alike. An overly comp)lex design, which is often the result of politicalcompromise, runs the risk of generating a seemingly random distribution of grantamounts.
(2) Price incentives, especially in the form of variable matching grants, can work as wellas mandates in raising expenditures and grantee contributions.
(3) When using price incentives, the average matching rate has to be significant torealistically attain spending and financing objectives.
(4) In the absence of price incentives, regulations in the form of either minimumexpenditure mandates or maintenance of expenditure effort requirements are needed toprevent grantees from using some part of grant funding to reduce their own financialeffort, including possibly reducing; overall fiscal effort.
(5) A central government can best leverage the effect of its transfers oni totalexpenditures by including some mieasure of the local jurisdiction's ability to finance, orfiscal capacity, in the grant formula.

I~~~~~~~~~~~~~~~~~~~~~~~~~~~~~~~~~~~~~~~~~~~~~~~~~~~~~~~~~~~~~~~~~ IE

v
Administration of Fiscal Transfers
1. Grants administration concerns 1he process by which intergovernmental grants aredesigned and implemented to ensure accountability to the grantor, which is typically the centralgovernment. In the case of unconditional revenue sharing or block grants the administrativeissues are relatively sinple, primarily conceniung the operational definition of revenues and themechanisms by which monies are transfearred from the central to lower levels of government.39
In the case of grants which carry conditionality, the administrative issues are complex andencompass all levels of government.
2. Surprisingly, there is no research literature on grants administration to complement theextensive literature on grants design. As a result, this chapter draws on related publicadministration literature and on country experience, both inside and outside LAC. The U.S.experience with grants administration merits special attention because conditional grants playsuch an important role in intergovernmental fiscal relations in the U.S., and that expeience hasbeen evaluated critically in a number of General Accounting Reports.' Box 5.1 summarizesthe structure of U.S. grants administrationi from the federal government side.
A. Administrative Functions: Grantor
3. The grantor, be it a central or regional government, has several administrative fuctions,beginning with the designing the grant and institutionalizing that design in legislation. Thesefunctions and typical institutional responsibilities are summarzed in Table 5.1. Afterestablishing the grant in law, implementing regulations are written and promulgated. Once thegrant begins operating, the grantor must idetermine whether or not grant funds are distributedand used consistent with all laws and regulations and must, also, determine whether or not theprograms financed by the grant are effectively and efficiently delivered. These analyses permit
3 However, even for unconditional grants, Isck of tran_rency in administrative processes may contribute tobudgetary uncertinty among the grant recipients. Loose definitions of the revenue base or loose specifications asto when monies should be transfered enable central government grant adminisat to arbitrarily alter the realvalue of tns. State Education S he in Brazil have complained that delays in ransfers during times ofhigh inflation serously erode the real value of revu-shrin transsfe made under the Education Salary Tax.
4 See USGAO (1975, 1979, 1980, 1983, 1985).

60 The Design and Admbiurazon of ngovermwntl Trangfers
- _ _ ~ 51= .tU.Sw Yede~aJ .....
XS~ ~ ~ ~ ~ ~ ~ ~~~~~~~~~~ ~~ ~~~~~~~~~~~~~~~~~~ .. ..........:. E..
|l ~~~~~~~~~~~~~~~~~~~~~~~~~~~~~~~~~~~. ....,,.|, .... . .,..... '= .
'~~~~~~~~~~. . . .. ...
. . ~ ~ ~~~~~~~~~~~~~~~~~~~~~~........._....
The UR g tederal govemmont aduinisteis over 500 . :*tegorical g':':t' to-stat lo
IB',,,'.'gg' gg'ant .md are:::::: use B.'en1y ief ::u'.:.:: 'n ''i ggom:. B'ceBwi-":gran ::::-ont a' e.pressed,; -B.'" i-
rgito. t:mta t~it sgnrlyma~e saetv u s lo ~iiie sipsn
exesv 3diitrtv cmt::ga=e,i pa u otecmleiyo euain adi atdet h
,.: , , .. ::::,.R...B.'.'''. .'............. :: z."s.:'. ''....... s:. : .sBB:.:

Admhuiuratiof QfFal Trwsfers 61
Table S.1: Grant Administraion: Functions and Responsibilities
Administrative Function Activiti_ _ _ Institutional Responsibilities
Legislation Grant deipgn and smulation. Sectoral Ministry, Minikstry ofFinance
Preae legstionSectoral Ministry, Legislative
. ~~~~~~CommitteeEnact legislation.
__ Leiltre
Regulaton Write draft regulations to Sectoral Ministry, Ministry ofimplemerit legislative mandates. Finance
Review and issue fnalregulati(os. Sectoral Miistry, Mnistry of
FinanceFinancial Control Assess capacity of grantee to keep Supreme Audit lIstitution
accounts and ensure proper use ofgrant fumds; impose sanctions ifnecessary.
Assess quality of grantee's auditsor provide direct audit of Supreme Audit Institutiongrantee's accounts.
Opeational Control Assess effectiveness of grantee's Sectoral Ministryprogram financed under grant andensure ccmpLiance withregulationis; impose sanctions ifnecessay.
Provide tecbnical assistance tograntee to improve effectiveness. Sectoral Ministry
Evaluation Evaluate grant design, Sectoral Ministryimplemenkting regulatons, adprogram effectiveness.
Propose and act changes in Sectoral Ministry, Legislativegant design and regulation Committee
62 The Degn and Admnsation f bIergovnnemal Tronfers
the grantor to later evaluate the grant program and, on the basis of that evaluation, either modifyor terminate the grant. For the grantor to effectively administer grants, it must have the legaland political capacity to sanction subnational governments for failure to comply with laws andregulations. Since grantors may find it politically difEicult to impose sanctions or penalties, thedesign of sanctions must be carefully considered when issuing the implementing regulations.
The Process of Grant Deign.
4. Grant design is determined by both technical analysis and political debate. Threeprncipal institutions are typically involved in the design of categorical grants: the sectoralministry, the finance ministry, and the legislature. While the design initiative may originate inany of these institutions, in LAC the sectoral ministry usually takes the lead role. Ministryanalysts and/or consultants propose alternative designs, analyze their impacts and estimate theircosts, and, data permitting, simulate their distribution across jurisdictions. Following thisanalysis, the sectoral ministry communicates its recommended alternative to the finance ministryfor review, especially regarding effects on the central government's expenditure. Once reviewedand approved, the government may direcdy propose legislation for legislative review andapproval.41
5. The principal problem in LAC analytic capacity lies with poor quality data at the levelof subnational governments. The lack of adequate measures of need, finance, fiscal capacity,etc., constrain grant design and makes it difficult to predict government fiscal behavior or tosimulate grant distribution. Colombia, for example, lacks detailed expenditure data at themunicipal level; Argentina lacks uniform accounting methods to permit fiscal comparisons acrosssubnational jurisdictions; and the most recent Brazilian fiscal data on municipalities under 50,000population is at best five years old.
6. In addition to the data problem, the limited exerience of most countries withdecentralized systems translates into a general lack of knowledge about grant design and poorunderstanding about the fiscal behavior of subnational governments. The result is sometimesunimaginative transfer design and naive predictions as to subnational government behavior.
7. Political considerations influence grant design at every stage of the process, but the natureof those considerations vary by institution. Thus, the sectoral ministry is concerned about theeffects of the grant on its principal constituencies; for example, in education, the teacher's unionwill be vocal in opposing any grant which has the potential to adversely affect teacher pay. Thefinance ministry is primarily concerned about the political implications of changes in the fiscaldeficit. Hence, it may argue for designs that constrain spending on the grant. The legislature,the members of which receive votes for delivering benefits to constituents, is principallyinterested in the distribution of the grant across jurisdictions and, thus, may argue for protectingjurisdictions from possible loss of revenues as a result of the grant program.
41 In some countries (e.g., Chile) only the executive branch may formally intrduce fiscal legislation of thissort to the Congress.

Ara&niation Qf FIscal Trinfers 63
8. The result of political influence may very well be a grant which is too complex fortransparency and accomplishes none of its purported objectives. A commonly cited emample isthe debate on the 1974 U.S. revenue sharing act, which resulted in two complicateddisaributional formulas.42 Subsequent empirical analyses could not find any relationshipbetween the distribution of revenue sharing funds and the diverse objectives of the grant.
Writing Grant Regulations
9. The language of laws typically requires more detailed specification prior to programimplementation. This regulation or implementing legislation converts legal principles intoprecise rules. Two types of regulations or rules apply to grants. The first type is generalregulations which apply to all grants or aLl govenment-financed programs; procurement rulesis an example of this type of regulation. The second type is regulations which are grant-specificand result from the specific legislation authorizing the grant program. These grant-specific rulesare in most cases drafted by the sectoral ministry, taking into consideration the legislation andthe administrative context within which the program will function. Thus, in Chile, a municipalschool wishing to receive a transfer from the central govemment must satisfy the followingrules: (a) teachers have the necessary credentials; (b) class size falls within minimum andmaimum numbers; (c) the school has adequate physical space for its number of students; and(d) no tuition or other charges are levied on' the student aside from authorized matriculation fees.
10. Drafting of regulations or implementing legislation is important and requires legal skills,which are in abundant supply in most LAC sectoral ministies, but enforcement depends on theavailability of data and the specification ol sanctions for noncompliance and the political will toimpose them. In practice, sanctions are raMely imposed because they could harm the intendedbeneficiaries of the grant program.
Financial Maagement of Iotergovernmental Transfers
11. The grantor has two roles with respect to the financial management of intergovernmentalgrants. One role is that of predicting grant outlays and including adequate funding iin thegovernment's proposed annual budget; usually, the sectoral ministry and the finance ministryjointly carry out this role. Another role is to ensure that grantees use transfers for their intendedpurposes and following the grantor's regulations on budgeting, accounting, budgeting,procurement, reporting, and auditing. In LAC, the supreme audit authority of the countrytypically plays this second role.43 However, other agencies play support roles in terms of
I The House and the Senate could not agree oni a common formula. Thus, ajurisdiction was permitted to selectthat formula vinch gave it a larger share of funds.
a However, the sectoral or finance ministy could play this role with the supreme audit authority simplyreviewing the procedur of the ministry to determine their credibility. In the case of grants to municipalities thatpass through regional governments, this second role could be delegated to the regional audit authorities, with reviewof their procedures by the supreme audit authority of the nation.
64 e Dgn wadAdnina onQfbitegovermne rantfm
setting the accounting rules, receiving financial statements and authorizing disbursements, andassessing penalties in the case of non-ompliance by the grantee.
12. The grantor typically sets the ground rles on the financial management practices to befollowed by subnational govemments wishing to accept grants." Several issues face thegrantor in setting these rules:
(1) The grantee can be required to produce periodic reports or simply maintainrecords which can be reviewed by the grantor. While regular reportng offinancial information is often necessary (e.g., to authorize further disbursements),lengthy operational reports are fiequendy neither read nor reviewed by thesectoral ministries. In general, reports should be kept simple, but the record-keeping to support them should be detailed.
(2) The supreme audit authority of the grantor can directly audit grantee accounts,contract for independent audits, or do a quality control review of independentaudits contractd by the grantee. The first alternative is the general practice inLAC, although regional audit authonties could be strengthened to perform thisfunction, with a quality control review by the supreme audit authonty.
(3) The supreme audit authority can emphasize prior review and control ofexpenditures (to ensure they are legally authorized) or can audit (usually bereviewing the integrity of accounting systems and the validity of financialstatements and reports) the ex post financial statements and accounts of agencies,which are then responsible for their own internal prior review and control ofspending.45 The practice in LAC is the former, which can delay spending andproject implementation, but the latter is more consistent with the development ofautonomy and responsibility of decentralized agencies." In its recentconstitutional reform, Colombia changed the function of the supreme auditauthority from prior review to a audits; Argentina and Bolivia have, withBank assistance, introduced similar reforms.
44 In some federal countries (e.g., Argentina, Vaezuel) the central governmet cannot impose its finmcialmanagement nhres on the regional athonties, but this tically does not preclude grat conditionality which, forexamwle, says the central govenment auditors can review the grntee's financial records related to the grant-fundedprogram and requires the grantee to maintain appropriate records for tat purpose.
4 A fimncial audit reviews financial stments, rviews the accountig system underlymg the statements, anddoes a test check of the documentation underlying the recorded transctions. The audit usually tests vulnerable areas(e.g., travel and public relatons spending).
46 Ideally, udits should be caried out annually in order to introduce discipline in the sytem, but constaintson audit capacity typically requie anual audits of large gnmts and selective audits of smaller gants.

Adi fFJ Trnrs 65
(4) The grantor's internal contrIl system should monitor the grant, disburse the grant,establish the management system (issue rules and receive and monitor/evaluatereports, prescribe the reports to be issued and the accounting principles to beused, and receive and review reports). Frequently, (e.g., Ecuador, Mexico,Peru) the internal control system includes an internal auditor at the agency level.
(5) The grantor can choose to expedite disbursement of grants through a letter ofcredit system which operates through the banlkng system. Under the letter ofcredit, the local government submits paid bills to the Bank to draw down theaccount. For larger letters of credit, the local office of the sectoral ministrycould be authorized to preaLpprove.
(6) The grantor can require that central government procurement procedures befollowed, which may be administratively costly and cause delays, or permit localprocedures to be followed.
Operational Control and Review of Proigrams
13. When the centrl government contributes financially to programs operated by subnationalgovernments, it has an important stake in the efficiency and effectiveness with which thoseprograms function. This requires that the grantor monitor program operations, identifyproblems, provide assistance to remedy those problems, and, when the grantee fails to complyfully with grant conditionality, take corrective steps.
14. Typically, the grantor develops guidelines or regulations for the operational requirementsof grant-funded programs. Since local ccnditions vary, these guidelines should be flexible, andprofessional judgement is required to detwrmine if guidelines are being followed adequately bythe grantee.47 The mechanism for monitoring and evaluating program operations can be formaloperational audits, process evaluations, or regularly-scheduled supervision visits. Whatevermechanism is used, it is important that problems be identified and a program of corrective actionbe agreed to, possibly including technical assistance from the sectoral ministry. To make suchoperational control and review effective, the sectoral ministry must have the authority andcapacity to provide sanctions for noncompliance, such as making additional funding contingenton grantee performance in implementing the agreed upon corrective measures.
Grant Evaluation
15. After the grant program has been designed and implemented, the grantor wants to knowhow well the gant has attained its objectives; the legislation authorizing the grant may in facthave mandated an evaluation to be carried out by a specified date. While the details of grant
47 Since the central govemment also has the function of disseminating information on finance and perfoirmance,opeaional review can include an assessment of each gratee's procedures for collecting and reporting suchinfonnation as well as identification of deficiencies and the technical assismce requred to remedy them.

66 The Design adAdmnsmmo f bzteovernme rl rafe
evaluation will be program and sector specific, the evaluation is like to include tree areas: (1)the distribution of funds across governments and individuals, according to their income andwealth; (2) the impact of the grant on program outcomes; and (3) the behavioral response ofjurisdictions receiving the grants. Such evaluations can be carried out in-house, contracted toexpert consultants, or mandated of the grantees; the complexity of the evaluation shoulddetermine whether it is done in-house or contracted, while grantee evaluations are of more useas a means of encouraging accountability an providing objective results. As a msult of thisevaluation, the central government may decide to keep the status quo, drop the grant programaltogether, or make marginal changes in the grant design (including conditionality).
16. Legislators are most likely to be interested in the regional distribution of grant funding,in order to have a basis for arguing for a larger distribution to their political constituents.Sectoral analysts of the ministry are more interested in the distribution according to the incomeand need status of program beneficiaries, in order to determine the accuracy with which theprogram reaches its target population. These evaluations typically require straightforwardstatistical analysis of the sort given in Chapter m and can usuaUy be done in the sectoral orfinance ministries.
17. In addition to the distribution of resources, the grantor is interested in the impact of thegrant financing on program outcomes. The difficulty in carrying out this evaluation depends onthe availability of good outcome measures and the knowledge about production processes. Thus,deternining the impact of gant financing on the miles of highway constructed may be relativelyeasy, while the impact on learning of a grant for supplementary textbooks targeted on poorchildren may be very difficult to analyze. In the latter case, approprie learning measures arenot always available or reliable, and knowledge as to the process by which supplementary textsaid leamning is known only crudely. This type of evaluation requires a large data collectioneffort as well as the kind of analytic expertise only found in research universities. The difficultyin carrying out impact evaluations often results instead in evaluations of the grant onintermediate outputs, e.g., the impact of spending on supplementary texts on the number oftextbooks. Whether or not impact evaluations are carried out should depend on an assessmentof the likely costs and benefits of doing so.
18. Finally, the grantor is interested in how the grant program has affected the behavior ofgrantees, especially as regards financing decisions. Grants provide incentives to thejurisdictionsreceiving them to alter their behavior. Does the grant result in increased or decreased spendingby the grantee from its own source revenues? Does the matching or cost-sharing rate result inover-engineered and costly projects, or does it result in decisions to not undertake neededprojects? This type of evaluation is feasible to do in most countries and may be based in parton operational review reports.
B. Administrative Functions: Grantee.
19. The government receiving grant funds must comply with grant conditions, includingprocuring, contracting, and preparing financial reports, and, in the case of competitive grants,

Admi ga of FTscal Tranfers 67
prepare proposals. In addition, once the grantee receives funding, it must manage theimplementation of the project or program, either through direct recruitment of personnel andprovision of the service or through the cantracting to third parties. Table 5.2 summarizes U.S.state and local govemment grant administration responsibilities.
Table 5.2: U.S. State and Local Grant Administration ResponsIilities
State G v r m n _ _ _ _ _ _ _ _ _ _ _ _ _ _ _ _
Dept. of Finance Alocates tamsfers to local government.
State Auditor Audits locad agencies or ensures quality of extealaudis. Submits reports to Federal Departmentgiving assurances that fiscal and other requirementshave been met.
Line Departmt Monitors and evaluates program operation andperformance.
Local Government
Line Agency implemens program in accordance with Federal andState program and general regulations; may berequured to monitor program effectiveness.
Finance Office Matais vaid sqeprt accounts; exerses inte lfinancial and managerial control; contracts forexternal audit
Preparing the Proposal
20. Proposals are required for competitive grants and for some entitlement grants, which canbe used only if the jurisdiction submits a satisfictory proposal. The grantor's guidelines forcompetitive proposals typically require a demonstration of need, a project design, an estimationof costs, capacity to procure equipment amid implement the project, an implementation timetable,and ability to comply with grant conditioinality, including finance of required cost-sharing anda financial management system which can generate the required reports and which can supporta financial audit. If the gantor permits the grantee to include indirect costs in the proposal, theoverhead costs of administering the project will also have to be estimated and justified.
21. The detail and complexity of project proposals depends on the size and nature of theproject. Small projects (say, under US$25,000) are usually not technically sophisticated and arerelatively easy to manage, even if the grantee's overall administrative capacity is weak. Largeprojects, on the other hand, may require hiring specialized consultants to design the project,estimate costs, and prepare an implemenltaion timetable.

68 7he Desgn and AnWstation of Ineovernent Trwznfers
22. The cost of preparing projects and the lack of in-house expertise are principally ofconcern to small and poor local jurisdictions. To avoid bias in the distribution of projectawards, the grantor could provide direct technical assistance or give cash grants for projectpreparation to those jurisdictions; alternatively it could allow non-governmental entities toprepare projects on behalf of communities. The Bolivia Emergency Socl Fund (ESF) and itssuccessor, the Social Investment Fund (SIF) provide an interesting example of ways to assistpoor communities. The ESF operated from 1986-1990 with financial assistance frominternatonal donors and relied on proposals from communities and NGOs to rapidly develop aportfolio of projects targeted on the poor. Despite the inclusion of NGOs, experience showedthat poor communities were under-represented in this process, because they lacked both the skillsto prepare proposals and the presence of NGOs which provide that ex)ertise. To avoid thisproblem, the SIF was charged with complementing community and NGO requests for projectswith an effort by SIP staff to use a poverty targeting methodology to identify needycommunities, assess their needs, and identify and support institutions that could serve asrequesting agencies for the community.
Fnacial Management
23. Grantees have the responsibility for budgeting, procurement and contracting, keepingfinancil and program records, preparing the financial statements and reports required by thegrantor, and submitting all related records and receipts for audit. Each of these elements offinancial management is critical to ensure financial accountability to the grantor. Bach of theseelements is seriously deficient in most regional and local governments of the region.
24. Budgeting is the process by which the government's financial resources are allocatedacross the functions and programs for which it is responsible. Efficient resource allocationrequires full information about resources, needs, and program outcomes and appropriateprocedures and trained personnel to analyze this information in developing a budget proposal tobe approved by the elected officials of the government. It is important that this process becomprehensive, on the one hand, and program-specific, on the other. When some portion offinancial resources are derived form intergovenmmental transfers, this requires: (1) budgetingby program as well as object of expenditure and (2) including intergovernmental transfers in thebudget. These requirements are not always satisfied. For example, in Colombia one finds
ummicipalities using line-item budgets, with the result that expenditures on programs (primaryeducation, health clinics, etc.) are unknown. And in Brazil some state governments fail toinclude the federal transfers received by public entities (called foundations) in their budget;consequently, state budget decisions are made not knowing either the size of federal transfersto the public entities or the magnitude of activities financed with those transfers.
25. Once aWroved, the budget needs to be executed according to the intemnal controlprocedures of the government. These procedures should be transparent and ensure fair andefficient procurement of goods and contracting of services. The most common intemal controlpractice in the region is prior review of all contracts by the country's supreme audit institution;this procedure often results in significant administrative delays. Where state or provincial
Adminstrato of Fzzcal Trnsfers 69
governments have fiscal autonomy, this function is performed by state level auditors (e.g., thestate Tribunal de Contas in the case of Bra:il). In the case of intergovernmental grants (or loansfrom multilateral agencies) it is not uncommon to require that the recipient of the monies followthe procurement and contacting procedures of the grantor (or lender); this may be costly to thesmaU governments as well as result in delays in project implementation.
26. Once expenditures have been made, grantors need to be able to ensure that grant ifundshave been used appropriately and that other grant conditions (e.g., maintenance of effort) havebeen satisfied. This requires the existence Df credible financial statements and a system of publicaccounts that include double-entry bookkeeping and an accounting system to track separately therevenues and expenditures of grant-funded programs.4 In most of Latin America, these basicrequisites of public financial management are often missing, especially among smaller municipalgovernments.49
27. Finally, the enforcement of grant conditionality requires a system of external control oraudit of financial statements and the accounts on which they are based. External control couldbe provided pnvately, with the regional or local government contracting independent auditorsto carry out audits. In Latin America, the shortage of qualified external auditors results inexternal control by the regional or central govemment supreme audit institution.
C. Strengthening Grant Adminitration.
nmproving Grantor Administrative Capalcity.
28. The capacity to administer grants is weak at all levels of government in Latin America.Even where this capacity is relatively well-developed (e.g., Chile), serious deficiencies rermain.At the level of the grntor, usualy the central or federal government, sectoral ministries oftenlack the capacity to carry out analyses of allernative grant designs, to prepare user-friendly grantrues and regulations, and to evaluate the effects of grants and the performance of grant-fundedprograms. However, the professional skills to carry out these activities exist in academicinstitutions and consulting firms in most countries, permitting ministries to contract for the scillsrequired to complement in-house capacities.
29. Weaknesses in the financial management of intergovermnental transfers and operationalreview of grant-funded programs are more difficult to address. Neither financial managementnor operational review are typically well suited to ensuring compliance with grant conditionality.To ensure compliance requires that the sectoral ministry have accurate, recent, and relevant
48 One possble solution is to use fumd accounting to separate out the financial activities of the grant-financedactivity. Ths is seldom used in LItin Ameica. A more common solution is to set up a legally separate entity tocarry out the relevant activity.
41 Wesbery (1990) argues that both public and private sector accouting systems are generally weak in LatinAmerica.

70 The Degn and Adnitration Qflrtergow'ental Trefers
information on the grant-related activities and expenditures of grantees and on the opeationalperformance of grant-funded programs. As discussed above, this requires modem systems ofaccounting, financial reporting, and auditing, on the one hand, and a system of supervisionwhich identifies program deficiencies and provides assistance to grantees in designing correctiveaction, on the other. To a large exent, the former lies outside the control of the sectoralministry, while the latter require additional resources and changes in behavior (from an emphasison enforcement to one of assistance) on the part of the ministry supervisors. Thus, there is astrong argument for significant efforts to reform and strengthen public financial managementgenerally and the technical support capacities of sectoral ministries more specifically as part ofany decentralization effort. Table 5.3 summarizes the functions and skill requirements for eachof the grantor's institutions responsible for grant administration.
Table 5.3: Grant Administration Requirements: The Grantor
istitutiOf/ Functions and Resp nsibic [ Required SkI
Legislature Prepams and approves legislation which specifies: (a) Staff capacity to andyze policiesprogram objectives, (b) general compliance requiremnts, and to clarly specify objectivesand (c) project-specific complianmc requirements. and requirmments.Legislation may also specify prcess for issuing andrevwing reguations. __
Finance Mrnistry/ Issues directives on general compliance requirements. Capacity to write easily understoodBudget Office regultions.
Disbures funds in accordance with fornula or followingrequest by line ministry.
Supreme Audit Audits line Ministries, evaluates the quality of audits E}ert in auditng financialinstitution submtted by grant rients, and may audit grant statements and legal requirements.
recipients.
LUe Minetry
Program Office Prepars regulations and reporting requiements consitent Ll aexpeise to intepretwith legislative intent. legislation and capacity to write
clear and enforceable regulations.
Program Office Monitors and evaluates program operation and Eetisc m designing and carryingperformance. out program evaluation.
Finance Office Authorizes disbursements. Capacity to design and delivertaining in accounting andpermance measurement.
Provide technical assistance to grnt ricpnt to ensurereliable financial audit and perfonnance evaluation.

A&Astnraton of Fscal Trasrs 71
Strengthening Grantee AdmInistrative Capacity
30. The limited administrative capacity of most subnational governments in Latin Americaseriously constrains the use of intergovernmental grants; Table 5.4 summarizes the requiredcapacity. The lack of capacity to prepare projects can lead to poor project selection and workto the disadvantage of smaller jurisdictions. This can be offset by providing direct technicalassistance (m-kind or cash gants) to needy jurisdictions and taining local managers to contractprivately for specalized technical assistance in proposal preparation. In addition, recentexperience with including beneficiaries and ciizen groups in proposal preparation has beensalutary in reducing the risk of poor project selecdon.
31. As with the grantor, the administrative area which is most difficult to strengthen isfinancial management. Budgeting policies are relatively easy to change to include program.budgets and -integrating intergovernmental grants in budgetary decision-making. However,budget practices are not so easily changed, and high inflation can render budgeting a mootexercise.?' It is more difficult to change accounting and financial reporting practices, whichare often set in national law. One solution is to change the law for regional and localgovernment administration, and another is to create separate legal entities to provide the grant-funded serice. In either case, technical assistance is required to strenghen financialmanagement. One option is to earmark a specfied percentage of the grant to cover theadministrative costs to the grantee, including improved financial management, systems to trackprogram or project activity and performance, and other overhead costs. A second option is toprovide a grantor-financed and operated financial administration center to maintain records andassemble information required for grant disbursement on behalf of several grantees. A thirdoption is to provide direct technical assistance to grantees to help strengthen their financialmanagement as related to the grant-funded program. A fourth option is to provide positive ornegative incentives for the provision of reluired information; for example, the grant couldmclude a rule which specifies that failure to provide a report containing the required informationvwitin fifteen days of the designated date would result in a ten percent reduction in the nexttranche. Which option is preferable depends in part on the types of conditions attached to Ikegrant and, thus, the kinds of information that must be maintained and reported.
As demonstaed by the case of Brazil, budgets whdich fail to accurately estimat the next year's inflatioa leadto supplemental budgets which create uncetainty for the implementing agencies and often have litde to do with theoriginal budget allocation.
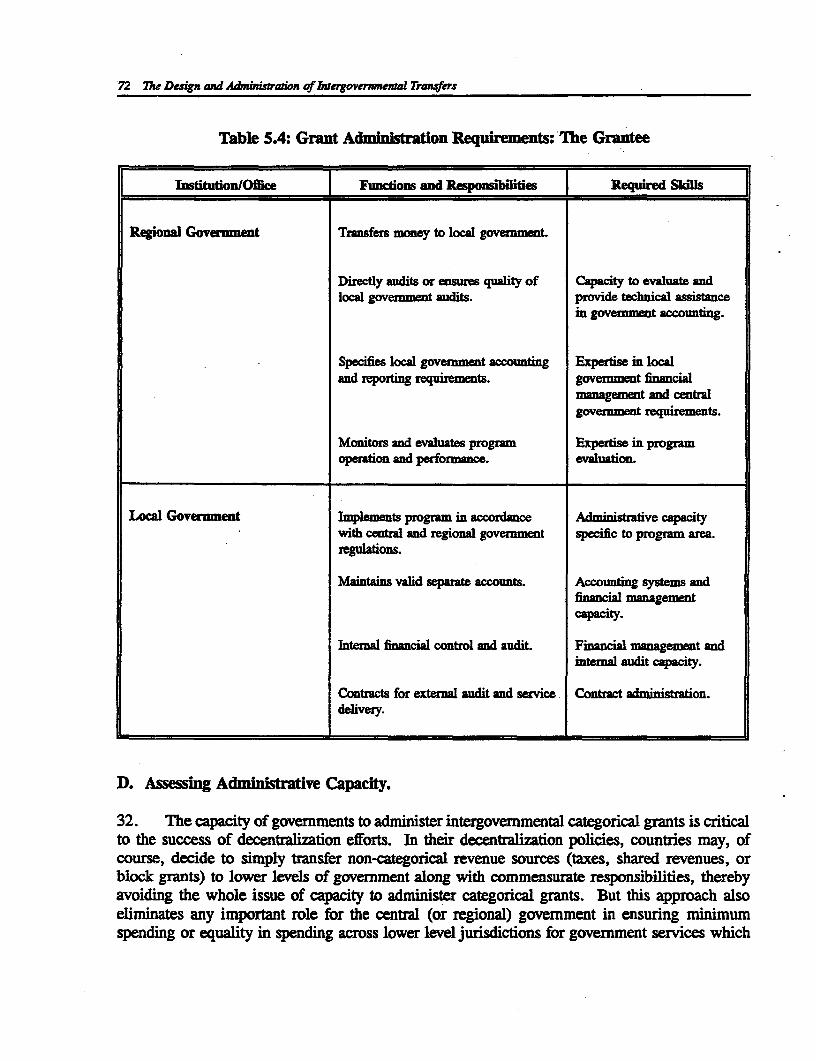
72 lTe Design and Adnation of huerovermnernal TrLfus
Table 5.4: Grant Administration Requirements: The Grantee
Institution/Office Functions and Responsibilities R d
Regional Government Transfers money to local govenmen.
Directly audits or ensures quality of Capacity to evaluate andlocal govenment awdits. provide tchnical assistance
in government accounting.
Specifies local govemment accounting Expertise in localand reporting requirements, goverment financial
management and centralgovenmet requiremts.
Monitors and evalates program Expertise in programopeaion and performnce. evaluation.
Local Government Implements progam in accordance Administrative capacitywith central and regional government specific to progrm area.regulafions.
Maintains valid sepat accounts. Accounting systems andfinancial managementcaPacity.
Internal financial control sad audit Financial management andinteal audit apacity.
Contacts for extenal audit and service Contra administbon.delivery.
D. Assessing Administrative Capacity.
32. The capacity of governments to administer intergovernmental categorical grants is criticalto the success of decentralization efforts. In their decentralization policies, countries may, ofcourse, decide to simply transfer non-categorical revenue sources (taxes, shared revenues, orblock grants) to lower levels of government along with commensurate responsibilities, therebyavoiding the whole issue of capacity to administer categorical grants. But this approach alsoeliminates any important role for the central (or regional) government in ensuring minimumspending or equality in spending across lower level jurisdictions for government services which

Adtnirdraion of Fwl Transfers 73
play an important role in detrmining income distribution and social mobility as well as thehuman capital of the nation. Of course, a country can attempt to mandate equity and minimumspending on the part of lower level governments for critical services, but the enforcement ofmandates presents many of the same adninistrative challenges as does the administration ofcategorical grants.
33. Since categorical grants typically accompany decentralization, it is important to assessthe capacity of the different levels of government in grant administration. Table 5.5 presentsa list of the questions one should have answers to in order to make an informed assessment ofthat admninistrative capacity.
Table 5.5: Checklist to Assess Grant Adminition Capacity
FUNCTION QUESTIONS TO BE ANSWERED
Legision Does the decentralizalion law, constitution, etc., clearly assign finance andexpendit responsibility by level of government?
Does the public administation law, municipal code, etc., permt the centralgovernment to requmre information on grant-financed progrms in a form thatpermits financial and perfomane audit?
Does the law permit subnational governments and decentaized entities toindqendtly contrat for external audit?
Does the grant law clearly communicate compliance requiments and reportngrequirements and establish credible sanctions for noncompliance?
Does the grant law clearly establish the authority and responsibilities of thesectoral ministry in reviewing grant-fimded programs?
Regulaflon Does the sectoral ministry have the capacity to prepare realistic regulaions tooperationalize the grant legislation?
Is there an administrative manual for each grant progranm? Do the grmntees havea copy of the manuarl?
Which are the most important general regulations vAich affect the spocific grantprogram?
Does the grantee sign a contract with the grantor specifying all compliancerequirements, stating how to determine costs, frequency and nature of financialreporting, etc.?

74 The Design and Anitration of Itergovernental Trwanfers
F[NCTION QUEMONS TO BE ANSWERED
Snandal Reporting Which agency prepares an annual report on the financial perfornance of thegmat program? How are such reports reviewed and audited?
Does some govemment agency or independent entity provide evaluative ratings oflocal govermment financial statements?
Budgeting & Do the grantor and the grantee have identical fiscal years?Spending
Is grant funding included in the grantee's budget? How are grant funds budgetedand reported in the case of decenttalized entities of the grantee?
How long does the grantee have to obligate funds? What evidence (purchaseorder, contract, etc.) is required to demonstate obligation?
Are grantee expenditures subject to pre-audit review? If so, who carries out thereview? How long does the review typically take?
Do local governments directly manage grant funds, or are there financialmanagement centers which manage funds for the local governments?
In the case of cost-reimbursement or matching grants where evidence ofexpeditures must be provided, are letters of credit used to permit commercialbanks to more quicldy transfer funds to grantees? If so, at what transaction valueis preapproval required from the grantor?
Accounting Which agency deterines the validity of the accountig system to ensure thegrantee keeps accounts in compliance with central goverment requirements?What remedial action is taken for noncompliance?
Does the grantor mandate a particular accounting system, or does it mandate thatany accounting system provide the information to assess compliance with grantorrequirements? When the regional goverment acts as a pass-through agency,does it prescribe local govermnent accounting?
Does the grantee's structure of accouts permit tracking of the grantor financing?Do grant funds enter the grantee's generl fund, or are special revenue fimdsused?
What are the grantor's rules regarding acconting for indirect costs? What isgrantee practice?
What is the accounting basis (accrual, modified accrual, cash)?
What technical assistance does the grantor provide the grantee to facilitatecompliance with accounting requiements? Which agency provides the technicalassistance, and what form does this assistance take?

Admiirof Fiscal Tramsfrs 75
FUNCTION QUESTIONS TO BE ANSWERED
Auditing In the case of states acting as pass-hrogh agencies, does the cent govenmentauit the state or the ltimate grantee? Does the state have the capacity to auditor review audits of the local govenments?
Which agency caries out the audit of the grantee's accounts? How frequetlyare audits cared out? How frequenty are the audits reviewed by the sectoralministry or the compoller geneal?
Are grant andits incluied in regular entity-wide audits or are they speciallyperformed for each grnt?
Wlich are the most commonly reported adverse findings? Do he auditors ofgrant-financed prograns fruently disallow expenditures? If so, what is theconsequece?
What types of sanctions (criminal liability, reduce subsequent year's grant, etc.)are most commonly imposed for non-compliance?
Does the audit include output reporting as well as financial reporting?
Does the sectoral mnistry receive and review audits? Which other agenciesreceive copies of the audit? Are audits of local governmet agencies made easilyavailable to local citizens?
Performance Does the grantee prepare anmal reports on the operational perfornance of theReportng grant program? If so, is a standardized mechanism or fonnat required?
Are results produced in quantified, measmrable terms? Are results only narrativein form?
Is the provision of reports enforced? Who receives the reports?
Is he validity of such reports subject to review by the sectoral ministry? If so,does the mnstry have the capacity to carry out such review?
Does the sectoral ministry establish adequate procedures to determe if theprogram is effective and efficient? Which agency evaluates these procedures andassesses the capacity of she sectoral ministry to determine the validity ofopational reprts?
.

76 The Design and Amnuratof nrgovenmna Irafrs
FUNCTION QWESTIONS TO BE ANSWERED
Compliance with Which agency is responsible for reviewing and enforcing grant conditionality?Conditionality
Do program auditors, conducted by independent auditors or by the ComptrollerGeneral, cover compliance with grant conditionality and report lack ofcompliance?
In the case of non-compliance, what corective actions or penalties are applied?Are grants withheld for compliance failure?
Evaluation Does the grant require performance evaluations of the program being financed?If so, which level of government arranges for and provides the evaluation?
Are the criteria and methodology for evaluation specified in the administrativemanual for the grant?
Citll Review Do citizen groups have a formal advisory and review function for the grant-financed program? If so, how is the citin group selected to emsure impartialrview?
What is the authority of the citizen review board to.bring about programmaticchanges?
Are the views of the citizen reiew board reflected in the grntee's annualprogram report or in the program audit? How does the sectoral ministry becomeinformed of the board's views?
VI
Accountability in Fiscally Decentralized Systems
A. itroduction.
1. The accountability problems associated with intergovernmental transfers are complex,and proposals for policies and institutions to ensure accountability depend on the answers toseveral important questions. Should local governments be held accountable to the cenltralgovernment or to local ciizens for their use of intergovernmental transfers? For what shouldlocal governments be held accountable? What mechanisms exist to hold local officialsaccountable? What conditions facilitate accountability, and which hinder it? There is very littleempirical research literature that directly addresses these questions, but working hypotheses canbe derived from country experience and qualitative evaluations.
B. Accountability to Whom?
2. In the decentralized systems of Latin America, central governments transfer funds to localgovemments, in part, to cary out central government objectives and, in part, to provide asource of local government general revenues. These dual objectives lead to the question, towhom should the local government be held accountable, the central government or the localelectorate? Of course, the answer to this question is "to both" but for somewhat differentoutcomes.
3. Central Government. Aside from pure revenue sharing, the central government makesintergovernmental transfers to encourage grant recipients to allocate resources consistent withcentral govemment objectives.51 In addition to the kdnds of sector-specific objectives notedearlier, the central government may impose a variety of general regulations on the grantrecipients. These may concem the recipients' practices in financial management, procurement,employment, etc. The central government wishes to hold grant recipients accountable in thesense of using their grants for intended purposes and complying with all regulations and grantconditionality.
5 The cental govement can also use mandates with revenue sbaring to attain its objectives, as demonstedin the case of Brzil's mandate that subnational governents allocate 25 percent of their revenues for education.
78 The Deign and Adiuistradon of Iaergolene Trwfers
4. The E:lectorate. The recipient's citizenry of taxpayers and consumers of localgovernment services have some divergent and common objectives. The taxpayers' objective isto reduce their local tax burden (be it in the form of local taxes or user fees). They have aninterest in using grant revenues to reduce tax burdens and in ensuring that revenues fromwhatever source are used efficiently. Consumers of local govemment services in general alsowish to see efficient use of resources, in order to maximize service output. In addition,consumers of the service receiving the grant have an interest parallel to that of the centralgovernment in ensuring that grant monies are used for their intended purpose, again to maximizeservice output. Finally, members of interest groups (consumers or producers) benefiting fromgrant regulations have an interest in the recipient's compliance with those regulations.
C. Accountability for What? 1
5. The central government and the electorate differ in terms of the decisions and actions forwhich they wish to hold local officials accountable. The central government has a primaryinterest in grant recipients (1) using funds in accordance with legislative intent and ministerialregulations and (2) complying with the various conditions and regulations which apply to thegrant. The electorate, on the other hand, is likely to be more concerned with programperformance and efficiency than with technical compliance issues.
6. Use of Funds. Sectoral grants are legislated by central governments in order to attainparticular program objectives. The legislation is typically precise in stating the purposes forwhich grant monies can be used. The legislation and/or its implementing regulations usuallycarry this funrther by speifying specific items which may be purchased with the grant. Theappropriate use of funds is typically given the highest priority by central government andindependent auditors who review local government financial accounts.
7. Compliance with Conditions and Regulations. In order to further ensure success inattaining central government program objectives, grant legislation typically includes conditions,which the appropriate ministry operationalizes in terms of written regulations. These conditionsand regulations include those specific to a particular grant and those applicable to all grants.
8. Prgrmn Performance. Aside from the appropriate technical use of funds andcompliance with conditionality, the central government wishes to also hold local officialsaccountable for the efficient use of grant monies in the attainment of its program objectives. Asargued above, the local government electorate is likely to share this interest in effective andefficient service delivery. Aside from grant regulations aimed at ensuring efficiency, mostcentral governments are constrained in this pursuit by limited capacity to monitor and evaluatelocal government operations and by constitutional guarantees of the autonomy and decision-making independence of local govemments. Indeed, the lack of central government capacity tomonitor and supervise the provision of local services is one of the major arguments fordecentralization in the first place.

Accowtabil in Fiscally Decentraized Sysums 79
D. What MaIsms?
9. Audit and Operational Review. Trhe central government has two principal tools forholding grant recipients accountable: (1) financial audit of the grant program and (2) operationalreview of grant-financed programs. As discussed in Chapter V, lack of central governmentcapacty often means these tools have limited efectiveness in many LAC countries. In suchcases, the role of the electorate in accountability is especialy important.
10. Rok of Cikens. The formal role of the citizen is on a continuum that includes votingfor local general government officials to commenting at public forums. In some cases,especially in agricultural water supply, citizens who are the beneficiaries of services elect leadersof local organzatons that finance and manage specific public services.52 In other cases, citizens(usually program beneficiaries) participate in service-specific organizaons, like a parent-teacheroanization, which complement general government by helping finance services and bymonitonng service delivery. Citizen organizations which are service-specific are not necessarilymore effective than those that oversee multiple purposes.53
11. Many virtues are often claimed for citizen participation, including (1) a better match ofservices to recipient demand, resulting from adaptation of standardized central governmentprograms to local conditions and reduced cost of communicating with service recipients,especialy in rural areas; (2) increased revenuies through local resource mobilization (both cashand in-kind); and (3) increased efficiency in service delivery, due to better-informed servicerepients, improved community cooperation, and a stronger sense of responsibility on the partof beneficiaries. Unfortunately, there are very few empirical studies which rigorously measutresuch benefits; most quantitative evidence comes from case studies of irrigation and water supplymanaged by local communities. In an example from education, El Salvador and Mexico usedtwo very different models of citizen participation to reduce teacher absenteeism in rural schools(Box 6.1).
52 The nchest expence vith ctize self-fiace and self-management of collective servces is in water supplyand irrigation; for exaple, see Tang (1992).
53 Uphoff (1992) concludes tha in rural commuities multi-purpose boards may be more effective tha single-purpose ones.

80 27w Dcsin ard Adkissratin of Imtcrgonmra Tranfrs
tg__ Zs~dvor oadsI M.ss ic an xn$ $B
ElSlao n exc ersn w alerntv oes o oan atcpto13 playeuain aMXC.hetaeovrmnsaersoilefrbtthfnacan eiyo rmr dcto.C PulCscoltahraeepoyeofhetteanthi erimn n a r eenidb h sae n18,i epnet ifclisi
.to mPnir eacherrr ttnac nd to snd qateryantten-admayc imporstohe sitazen eaducationasecretariatio oaifac loeachgoernatendac (reut NOfo ctinth sat gaut.horizingnaymen ofo tuhecoppiementalt inalarydTes supessdn lofa thits frlot hasd resowlteallocitsoexpacsion t 4Qschonleuingta onurer davantgd staes, pcartly hnanedalby atWorlsBn lhoan Preiminry datea shyinpowec
design; With ( he objctie o pning coveraggr e of acrosnaboolt and primcoare, espcially if the a
thvernce stutrs coverargno the reprelenauthoitytve.g lc col. eea

Accowuabilky s Fuscally Decentralized stciu 81
13. Tbe type of citizen participation required varies from simply public disclosure ofinformation to the creation of citizen boardls with decision-making authority. A study of U.S.federal govenment grant-financed progratms requiring participation found that 35 percentrequired public heanngs, 57 percent requared citizen boards, and 74 percent required publicmeetings, workshops and review and consultation processes; many grants require multiple modesof citizen parlcipation .5 The same study found the nature of participation to vary by sector.Education, health and human service programs typically require participation in the form ofcitizen representation on boards, most often functioning in an advisory role. In the case ofeducation grants, emphasis is on parental involvement, while in health and human service grantsvarious interest groups are represented, including program beneficiaries. In contrast,transportation grants usually require citizen involvement via public hearings. Finally, citizenparticipation is usually required at the planning and design stages of service delivery, rather lhanin the implementation and evaluation stages.
14. Latin American experience with grant conditionality is relatively recent, still notcommon, and primarily found in grants for rural development projects. Box 6.2 providesemples of such conditionality in two programs in Mexico and Bolivia; in the two programsreviewed, conditionality on citizen participation represents the result of earlier experience withciizen participation in similar programs.
E. Facilating Conditions.
15. Evidence on the determinants and benefits of effective citiz participation is mainlyderived from the large number of develocng and developed country experiences with it.Qualitative analysis of case studies in citizen participation provide several lessons of experience.One example is Panama's experience with citizen advisory boards for primary health clinics,which is reviewed in Box 6.3.
16. Assessment of the effectiveness of ciizen participation in U.S. intergovemment grantprograms have been elusive, if for no other reason than the lack of a systematic monitonngsystem. In general, grantees have complied with participation requirements, but there is litdeevidence that partcipation has a noticeable impact on the effectiveness of service delivery. Thedemonstrated impact is in the planning stages where participation appears to encourage rthethan deter local governments from seekdng grants.55 To the extent it has an impact,particpation seems to have been more effective early in the planning of projects, rather than inthe service provision.
4 Advisory Commison on Intergovernmenl Relalions (1980).
5 Advisoy Commission an nevnmmt Rdaios (1980).

0c
V
a I a B.
.11111111E1 tir us: 'tim: [ I.
!Q! ifl 'j�� 1 { irK1;i�� IlI�s�;t�s I
�0IIIIJj[I ��1:I� "liii _ �ikc�IiLtIII I nil' B i�iL
rauid' it �
*ilitIiIt 1111141 n!rh'd B'

Accowatabity in iscFacl Decmaizsd Systms 83
BX *_~ _omnt _ _ ~ atoif ?nm alhCi
Tntel7s nm: lit fXut (O)etbibdcmuiylvlhat
c=mteswt ie ucin:1 negaigtecmuiy novrushatpogm
copnns ie,editi ae=aiain,seZ2=o muiyvsavshat sus__poiigifrato n aao omuiyhat odiin orgoa hat etr,4
deemnngcmuit elh ed n conrn; *d5 akn oa adrgonlhatadiitrtr an fiil pbil coutbet hecmui
S~~TeMHetbihdlglpdlnafr h ~iute, glcinpoeue nterms oreeee.Aenalcm niyiSseyanal eet omte mmes h a
ber-lce oc.Tecmmte eet £lon fDietr n efnsisrspniiiis
aprvswokpas wihicld omuiyiptso oh ao n reorcs; st ee ocetanserie;addfnssacin.T-cmites aso amd infralWr Cmisi
to car u pcfc ak,sc shepha'hofcil odc ure,priiae nacIetfamo ml aia rjc," coriaecde o okr o hecntuto f.wtraudc
orltie,cndc _habg oleto apin,o raieaf indrisn event
Comitee fe tivees ees to vay oey .eion tha bycmuiy _Cmiteoften~~ une,oo hihl =iil =n Ccival *ak-sd acntucinpoecseryoni re
tohglgtterotnil hywr mo_ _ucssu incntuto. frlhat inf.sru. .e
17 mmAunizat fi e ieaJon camain eulry zcedue medicaliipts on isoatdevlpn r ounrlviaes)ad inditiated h
effectivens iorfacitieboards asscpaends with sparton xommtenos wctres suc aostctv rhelatypeonseripe
dorrdct nube,isnitr inspuectd and hh nnealt educateornomica caactverdistrict or regieommnal-evephyseral lattion of heat commitee hate) both concdnets thaomuitso thephealthse ond heialpswhc
indviua sujctgovmittees lobbcy. foAhi numeed-r aiton thesevainble mone litod healtommittase ton

84 The Degn andAmuisro of1mefuuovemwnenalTranfers
review of a number of qualitative analyses of citizn participation in both developing anddeveloped countries.'
18. Getting the Rules Right. Effective citin boards require as a necessary condition aclear legal framework which sets out the rules to be followed in selecting the boards and clearlyestablishes the authority and functions of the boards, including reporting requirements.Furthermore, communities and thewr boards nexpenenced in governance require education asto their roles and responsibilities.-Y In general, citizen boards without decision-maling powerare ineffective, but boards with only advisory powers can be effective if they have strongpolitical supportLs Box 6.4 gives an example of a school council with broad powers.
19. Selecting the Board. The composition of citizen boards plays an important role in theireffecuveness as monitonng agents. The empirical literature on regulatory boards in generalargues against allowing a majonty representation on the part of the parties being monitored.'9By implication, teachers and principals should not dominate school-based committees set up formonitoring purposes. On the other hand, other evidence suggests both consumers and producersshould be represented on boards.
20. Aanagement Organ:tion. As with any organization, the ability of a citizen board tomanage itself is critical to its effectiveness. An organization which diversifies managementresponsibilities among board members and rotates leadership among board members deterscorruption. If a citizen board is directly responsible for the provision of some service, studiesof water supply associations and of school boards suggest that the boards should contractprofessional managers and limit board activity to setting policy guidelines and hirng and firingthe managers.
56 For example, soe Esm and Uphoff (1984), Fi_srbuwh and Van Wicklin (1987, 1989), Tang (1992), andUphoff, et.al.(1990). Most of this literature studies cifti participation in development projects and in NGOs.We make the assumption that the findings of this research apply equally wel to ongoing government programs andto programs administered by local govermments.
37 This recommendation is not unique to developing countries. In the Chicago, Illinois, school detraiioncitizen participation was ineffective and reations between administrtors and presidents of school-level councils werehostile until the latter were required to participate in joint training activities.
"For example, the State of Illinois establisbed Citizen Advisory Committees to the schools in the 1960s. Whilethe CACs were stictly advisory; their power smmed from the political support they enjoyed at the state level.The CACs were geneally successfu, both in iciting commmuity participation and in intluencing school policy.The reasons for success are: (1) there were clear rules for the formation and operation of CACs; (2) there was ahigh degree of active conmmuity participation; (3) relations between the CACs and school officials were generallyvery cooperative; and (4) citizens were kept well-informed (Phipps and Knell, 1985).
5For example, Graddy and Nichol (1989) concluded that including citizen participation on occupationalregulatory boards for health professionals deters their capure by the regulatory professions.

Accowabili*y v han Fs Decararakzed Sywts 85
|::Ei,Zo j:.4tfl Loa b c rt.ra om
-~~~Wdeped m lsaisXco.ihth efrac o h aoIlios_ho ytmldi 99t ndina ~eui~o colgvrae~~cscoo is reirdt aeaLclSho o LCcaitn ~ ~ eetd
'btW O~yesiet .ita.eselce h
__~~ ~ so;in_pal Pa_t n omnt eiet nteCucl ant_ w .~j4~a ._cirsar b ~-~ertr
_Mg~~~I77 7 d
additionag eqiements o prga ioncals deiiblty ble)o st a to c ertiun ficatio. Tis stardulatnd,
exa}inansston prcufe csts thoug whrichpathn scool eyste, a histoizesalhgly cevfda laetiveiy timalmay mber les w ricplngei t hreen e on foard yil imsnears. e LSC egiciatin perfocdres.n As otac wisuth
tharprincipaotAtethesendlof four years, theof Se comnt,andcde ikebretourceallocaion theschol s
22. nSipaleo Asel a gnera oule,.h mle fesz facLciv raiain eese ti
.to. Ticohgefeerideshi bandw tenorageya deisi of reposbiiyimng pwr.FrtteitChls devbelop6 Onaherovfes hand scolmrgaemezatioan which aresto spell cnout bealthe chonolmil boos studeint
man hieement. chut thiaerei an 4roffu baesn acond Hi pe ar dntd forempioyntand furthner
2hic Managementie oergaistonlsehoug affects te coststoacitiznsgo parthiciptin inel board aoemnd
tu,affSectlso b1 oard copston. osm xet or ebr efsl on thes basisto

86 The Design and Adiraion of bntergovernent Tranisfrs
to prvide specialized services which have large scale economies.6" Decentralized systems ofgovenment may still have excessively large local govenments from the pewective ofaccountability.'2
23. Management Capty. Management capacty is critical in three respects. First, thecommunity members responsible for electing the board should have some minimumunderstanding of revenues, budgets, and their relationship to services. Second, the citizen boardresponsible for overseeing that organization must itself have a basic understanding ofmanagement, including ability to read budgets and financial statements; it must also have thecapacity to manage conflict and reach consensus. Third, the local organization directlyresponsible for providing services and collecting revenues must itself have some minimumcapacity to plan, budget, maintain financial accounts, provide financial and operational reports,manage and maintain assets, and recruit and manage personnel. One of the very few empiricalstudies of local organization effectiveness concluded that the single most important factor indetermining overall effectiveness is the capacity of the local organization to manage its financialresources (see Box 6.5).
24. Cost Sharing. The second most important factor in determining local organizationeffectiveness, according to the study reported in Box 6.5, is the performance of the localorganization in mobilizing resources. This finding is consistent with other, qualitative studiesshowing that cost-sharing and local contributions affect importantly both the degree of activeparticipation of community members and accountability; cost-sharing in project funding also hasthe advantage of ensuring some minimum degree of community commitment to the project.
25. Infonnation. Related to management capacity is the information available to cifizens andcitizen boards concerning the cost and peformance of their services compared to those producedelsewhere. The central government role in ensuring the availability and validity of suchinformation is especially important when beneficiaries cannot directly assess serviceperformance. For example, the performance of schools is difficult to determine in the absenceof standardized test scores, which permit comparisons with other schools having children withsimilar characteristics. On the other hand, fanners are quite capable of directly determining theperformance of irigation systems in delivering water.
61 The U.S. experience with school boards is relevant. During the 1950s, many rural school districts wereconsolidated in order to realized scale economies; in the 1990s, there is movement in the opposite direction, towardsindividual school boards, in the name of community responsibility and accountability.
a For example, many large city school disticts m the U.S. have as many students and teachers as somecountries. The City of Chicago, which has 430 thousand sudents and over 25 thousand teachers recentlydecntralized powers within its school district by creating school-level councils (comprsed of parents, citzens,teachers, and the school prncipal) with the power to appoint the primcipal and negotiate a four year performancecontrc In addition, the decentaliion law mandated annual school site budget heanngs in which citizens,parents, and teachers vote on the proposed school budget.

Accourmabilibr in FT5Ca1 Decearalized Systwns 87
ms;Sq~~Bx - 1JEfci~s rLoa raiain_ ~~Oeo tevr e em piia tde flca ike raiaios(O)aaye h
peonaceo 2 iffrn LO rud h ol. ahogniainwa ae it epc
(cnrlig orpit and _mrvn ...rk efot, ad(} irm;s-,,. ng {...ing .. ,
inlecn deiin kn).Sml orlainlaay is eosrte hta
oinzto' pefrac ntektlu ucin smr togyrltdt vrl
effectiveness~~~~.. tha isispromnei h atlirfnto
Em__slhnin _ ofi coweaeoi nieSic oto fCu
X=|X;=oa Mug- Mbl1- ===p eoi ap-Jzw sai
~~~ma ma ci ton m
Ovrl .7 7 7 O .9 .56
: = 5 =no
W~~&ews egesoanlssfoeal fctves eatdi tmadbt wgt,
whic sh_w th reaiei_rac f*ahidpnetvral.Tbe2rprsteb
wegt o hs orfntosfudt ems motn.1eoremngmn,tems
imotn 3ocin nldsbscacudgo anitfos anan ulig ne_i _et colcto of lons et.R uc oii_in h eodms motn,rfr

88 The Desgn and 4niniurawn of htergowrwental Trefers
F. Recommendations for Accountability to the Local Electorate
26. In a decentaized system, local governments are accountable to both the donor and thelocal community for the use of intergovernmental transfers. At a minimum this requires reportsto both cental govemment ministries and the community on the use of funds and theperformance of programs funded by transfers. Accountability is further enhanced if localcitizens have adequate incentives, authority, management capacity, and information. Thefindings from qualitative and quantitative research on citizen participation lead to the followingrecommendations:
* The central government should establish the legal framework required for citizenboards to function, including real decision-making authority.
* Citizen groups and their elected leadership should be given training on how tocarry out their roles and how to assess financial and program management.
* The central government should provide reliable and timely information to grantrecipients and local citizen groups on the finance, expenditure, and performanceof grant-funded programs.
* The central government should provide technical assistance to grant recipients todevelop the capacity to manage the finances and delivery of services funded bygrants in aid; financing for such technical assistance might be assured byearmarking a small percentage of total program funding for technical assistanceactivities.
In general, grants in aid should require cost sharing on part of the localcommunity to instill a sense of community ownership and to provide strongerincentives for communities to monitor costs and the use of funds and for serviceagencies to perceive a linkage between performance and local revenuecontributions.

VII
Conclusions and Recommendations
1. Most governments in the LAC Region have adopted policies to decentraleresponsibilities for service delivery to regional and local governments. Intergovemmentaltransfers play a large role in the finance of these new subnational expenditure responsibilities.Hence, the design and administration of intergovernmental transfers is critically important ininfluencing the supply decisions of subnational governments.
2. This study evaluated three examples of such sector-specific transfers in LAC. Chileprovides a per student grant for primary education which is both transparent and predictable andestablishes a relatively high minimum per pupil expenditure level. Chile also reimburses thecosts of municipal health care clinics with a system of fixed reimbursement rates and anaggregate reimbursement cap to constrain grant costs. Colombia provides a system ofcompetitive matching grants for rural roads vith matching rates ffiat vary according to the fiscalcapacity of the local government.
A. Conclusions
3. This study has reviewed LAC decentalization policies, evaluated selected LACexpenence with sector-specific transfers, sinulated alternative categoncal grant designs, andspecified the requirements for grant administration and accountability. Several broad conclusionsfollow.
4. Central governments have a very important role to play in establishing the enablingen'irornen for decentralization. This includes clearly specifying expenditure and revenueassignments; establishing transparent and predictable intergovernmental transfers; restructumigcentral government ministries consistent wilh their new responsibilities; providing technicalassistance to subnational govemments to develop adequate administrative capacity; authorizinggovemance structures, including citizen participation, which facilitate the expression of citizendemand for public goods and services; providing technical assistance to make the structuresfunction; and ensuning that citizens have the financial and performance information on publicservices required for accountability.
5. In addition to providing the enabling environment, central governments have a continuingoversight responsibility for the efficiency of the decentraze system. This includes the adequate

90 7Te Design and Adnsration oflhtergovemmental Transfers
subnational provision of goods with national public good characteristics and which haveinteiJunisdictional spillovers. This responsibility is typically exercised through the use ofcategorical grants with the appropriate incentives and conditions. Thus, the role of the centralgovernment includes the design and administration of sector-specific transfers which areransparent, predictable, and include incentives or conditions which facilitate the attainment ofcentral government objectives.
6. Centrl government policy objectives as reflected in intergovernmental grants aremultiple, and there are tradeoffs between conflicting objectfves. Simulations of alternative grantdesigns are required to determine the nature and magnitude of the tradeoffs and to determine thebest design. The simulations carried out for education, health, and roads show that: (1) otherthings equal, a simple grant design is more transparent and is preferred to one that is complex;(2) price incentives in the form of matching grants can work as well as mandates in raisingexpenditures and contributions by grant recipients, while interfering less with grantee autonomy;(3) when using price incentives, the average matching rate has to be relatively high to have asignificant effect on spending and finance objectives; (4) in the absence of appropriate incentives,conditionality in the form of either minimum expenditure mandates or maintenance ofexpenditure requirements are needed to prevent grant recipients from reducing their ownfinancial effort; and (5) a central government can best leverage the effect of its transfers on totalexpenditures by including some measure of the grantee's fiscal capacity in the grant formula,including the use of matching rates which vary with fiscal capacity.
B. Recommendations for the Bank.
7. The World Bank already plays a large role in financing fiscal decentralization in LatnAmerica. This role includes financing central government projects which provide grants or loansto local governments for several purposes (e.g., construction of urban infrastructure or ruralroads; improvmg the quality of primary education or primary health care clinics). In addition,it finances institutional development projects to strengthen local and regional governmentmanagement, central government financial management and audit capacity, and to restructureministries to develop functions consistent with their new roles in a decentralized system. Theseprojects frequently require citizen participation in the design and monitoring of nualinfrastructure and always include safeguards to ensure the appropriate use of funds. Several ofthese projects also have features which promote accountability to the electorate, including cost-sharing and the provision of technical assistance to community groups.
8. Future Bank lending in support of government decentralization policies will require moreof these same efforts to develop an appropriate enabling environment for decentralization as wellas supporting the development of transparent and predictable categorical grants to ensureefficiency of the decentralized system.
9. Country decentralization policies and implementation strategies and the adequacy of theenabling environment for decentralization should be assessed when the country assistancestrategy is formulated. Assessments of public sector management should identify institutional
LAC Exvpeanece With bitgoverarm Tranters 91
deficiencies, including financial managennent and public information systems important fordecentalization, and propose a strategy to strengthen that portion of the enabling environment.Sector studies should assess decentralization policies and institutions at the level of the sector,including finance and expenditure assignments; identify fictors in the enabling environmentoutside the sectoral ministry's control; where appropriate, specify and evaluate alternative grantdesigns; and propose institutional development strategies, including ministerial restructuring.Finally, projects which support governmenit decentralization policies should do so as part of along-term stategy and incorporate evaluation designs that give continual feedback to policy-makers and, by the end of the project, prcvide reliable results which permit learning as to thepolicies and strategies which work best.

I I
Bibliography
Alcayaga, Rony Lenz and Cesar Oyazo Mansilla 1991-Estudios de Financiamiento de Salud Publica: Sistemas de Recuperacion de Costos." Informede Avace No. 3. Santiago de Chile: Ministerio de Salud, March.
Austermmn, Winnefred 1980*A Legislator's Guide to Oversight of Federal Funds." Fiscal Affairs and Oversight Committee.Denver: National Conference of State Legislaures.
Bahl, Roy W., Jesse Burkhead and Bernard Jump Jr. 1980Public Employment and State and Local Government Finance. Cambridge: Ballinger PublishingCompany.
Bahl, Roy W. and Johannes F. Linn 1992Urban Public Finance in Deeloping Ciuntri. New York: Oxford University Press Publishedfor the World Bank.
Bahl, Roy W., Jerry Miner and Larry Schroeder 1984'Mobilizing Local Resources in Developing Countries." Public Administration and DevelopmentVol. 4: 215-230.
Bennett, Robert J., ed 1990Decentralization, Local Governents. and Markets. Oxford: Clareedon Press.
Beyna, Larry, et al. 1977Managing Decentralization: An Annotated Bibliograhy. Development Management ResearchSeries, Report No. 1. Syracuse: The Maxwell School of Citizenship and Public Affairs,Syracuse University.
Bhatnagar, Buvan and Aubrey Williams, eds. 1992Participatory Development and the WoIld Bank: Potential Directions for Change. World BankDiscussion Paper, No. 183. Washington, D.C.: World Bank.
Break, George F. 1980Financing Government in a Federal System. Studies of Government Finance. Washington D.C.:The Brookings Institution.
Buchanan, James M. 1950"Federalism and Fiscal Equity." American Economic Review. Vol. 40 (September): 583-599.

94 The Design wad Adimniuaon of elrgoveentmatl Transfers
Campbell, Tum, G. Peterson and J. Brakarz 1991Decentralization to Local Govermment in LAC: National Strateges and Local Response inPlanning. Spending and Management. World Bank Regional Studies Program. Report No. 5.Washington, D.C.: Technical Department, LAC, World Bank.
Carpenter, Vivian L. 1990"Improving Accountability: Evaluating the Performance of Public Health Agencies." Associationof Government Accountants Journal. Fall: pp.43-54.
Carrol, Thomas F. 1992"Capacity Building for Participatory Organization," in Bhatnagar, Buvan and Williams Aubrey,eds., Participatory Development and the World Bank: Potential Directions for Changfe. WorldBank Discussion Paper, No. 183. Washington, D.C.: The World Bank, pp. 109-121.
Carroll, Thomas F. 1992Intermediary NGOs: The Supporting Link in Grassroots Development. Connecticut: KumarianPress.
Castaneda, Tarsicio 1990Para Combatir la Pobreza: Politica Social y Descentralizacion en Chile durante los '80. Santiagode Chile: Centro de Estudios Publicos.
Clune, William H. and John F. Witte, eds. 1990Choice and Contrl in American Education Volume 2: The Practice of Choice. Decentraliztionand School Restructuring. New York: The Falmer Press.
Cooper, Terry L. 1983"Citizen Participation." Organizational Theory and Management. New York: Marcel Dekker.
COPRE 1993"Acuerdo Nacional Para la Descentralizacion." (Borrador para la Discusion). Venezuela:COPRE, March.
COPRE/UNDP 1992Decentralizacion. Gobernabilidad. Democracia Serie Venezuela, la reforma del futuro.Venezuela: COPRE/UNDP.
Danzberger, Jacqueline P., Michael W. Kirst and Michael Usdan 1992Governing Public Schools: New Times New Requirements. Washington, D.C.: The Institutefor Educational Leadership.
Darbera, Richard and Robert Hall 1992"Local Public Finance and Institutional Reform in Niger." Decentralization: Finance andManagement Project. Managed by Associates for Rural Development, Inc. Vermont: April.
Decentralization: Finance and Management Project 1989"Philippines Local Fiscal Integrity Analysis Report." Managed by Associates in RuralDevelopment, Inc. Vermont: August.

BiZbiography 95
Decentralization: Finance & Management Projject 1991"Rural Roads Maintenance Systems Project: Special Study on Local Resource Mobilization forRoad Maintenance, Volume I, Final Report." Managed by Associates for Rural Development,Inc. Vermont: March.
Else-Mitchell, R. 1986"Commonwealth Payments to the States" in Accountability in Intergovernmental Fiscal Transfers.Occasional Paper No. 38. Canberra: Centre for Research on Federal Financial Relations,Australian National University.
Else-Mitchell, R. 1987"Achieving Financial Accountability in a Federal System," Achieving Financial Accountabilityin a Federal System. Occasional Paper No. 43. Canberra: Centre for Research on FederalFinancial Relations, Australian National University.
Epstein, Joyce L. 1992"School and Family Partnerships." Encgylopedia of Educational Research: 1139-1151.
Esman, Milton J. and Norman T. Uphoff 1984Local Orgaaizations: Intermediaries in Rural Development. Ithaca: Cornell UP.
Ferris, James M. and Donald R. Winkler 1991"Agency Theory and Intergovernmental Relations," in Remy Prud'homme, ed., Public Fina_ncewith Several Levels of Government. The Hague: Foundation Public Finance.
Finsterbusch, K. and W.A. Van Wicklin IH 1987"The Contribution of Beneficiary Particiipation to Development Project Effectiveness." &iILCAdministration and Development 7, 1-223.
Finsterbusch, K. and W.A. Van Wicklin m 1989"Beneficiary Participation in Development Projects: Empircal Tests of Popular Theories."Economic Development and Cultural Chpage ??, 1-23, 573-593.
Fix, Michael and Daphne A. Kenyon, eds. 1990Coping with Mandates: What are the Alternatives? Washington, D.C.: The Urban InstitutePress.
Garms, Walter I., James W. Gutbrie, and Lawrence C. Pierce, eds. 1978School Finance: The Economics and Politics of Public Education. Englewood Cliffs: Prentice-Hall, Inc.
Gonzalez-Block, Miguel, et al. 1989"Health Service Decentraliztion in Mexico: Formulation, Implementation and Results of Policy."Health Policy and Planning 4 (4): 301-315.
Graddy, Elizabeth and Michael B. Nichol 1989"Public Members on Occupational Licensing Boards: Effects on Legislative RegulatoryReforms." Southern Economic Journal .55 (January): 610-625.

96 TJe DesgndAdinration f intergovernmental Transfers
Guarda, Gian Carlo 1989Financing Urban Services in Latin America: Spatial Distnbution Issues. World Bank DiscussionPaper, No. INtU 48. Washington, D.C.: World Bank, June.
Hale, George E. and Marian Lief Palley 1981The Politics of Federal Grants. Washington, D.C.: Congressional Quartely Press.
Jara, Jorge Jimenez de la, ed. 1991Sistema de Salud en Transicion a la Democracia. Santiago de Chile: Ministerio de Salud.
Jorgensen, Steen, Margaret Grosh and Mark Schacter 1991Easing the Poor Through Economic Crisis and Adjustment. The Story of Bolivia's EmergencySocial Fund. World Bank Regional Studies Program. Report No. 3. Washington, D.C.:Technical Department, LAC, World Bank.
Kenyon, Daphne A. and John Kincaid 1991Competition Among States and Local Governments: Efficiency and Eguity in AmericanFederalism. Washington, D.C.: The Urban Institute Press.
Ladd, Helen F. and John Yinger 1989America's Alinhz Cities: Fiscal Health and the Design of Urban Policy. Baltimore: The JohnsHopkins UP.
La Forgia 1985'Fifteen Years of Community Organiztion for Health in Panama: An Assessment of CurrentProgress and Problems." Social Science Med. 21 (1985): 55-65.
La Forgia, Gerard M. 1987'Health Committee Federations in Panama." Report for the Inter-American Foundation. NotPublished. Panama: November 30.Ministerio del Initerior 1991Las Tareas de la Descentralizacion. Subsecretaria de Desarrollo Regional y Administrativo.Santiago de Chile.
Lewis, Maureen A. 1993'User Fees in Public Hospitals: Comparison of Three Country Case Studies." EconomicDevelopment and Cultural Change. Vol 41 (April): 513-532.
Mikesell, J. 1982Fiscal Administration. 'm
Moore, Donald R. 1990"Voice and Choice in Chicago," in Clune, William H. and John F. Witte, eds., Choice andControl in American Education Volume 2: The Pratice of Choice. Decentralization and SchoolRestructuring. New York: The Falmer Press, 153-198.
Oates, W. 1972Fiscal Federalism. New York: Harcourt, Brace, Jovanovich.
Bibliopraphy 97
Olson, M. 1965The Logic of Collective Action. Camnbridge, MA: Harvard.
Ostrom, Elinor, Larry Schroeder and Susan Wynne 1990"Institutional Incentives and Rural Infrastructure Sustainbility." Decentralization: Finance &Management Project. Managed by Associates in Rural Development, Inc. Vermont: May.
Paul, S. 1991"Accountability in Public Services, Exit, Voice and Capture." Draft. CECPS, August.
Phipps, Lloyd and Kenneth Knell 1985"The how of successful Citizen Advisory Committee operation. A research and developmentproject: Citizen participation in policy making for public schools in Illinois." Urbana: IllinoisCitizens Education Council, Illinois University.
Piola S.F. and S.M. Vianna 1991."Politicas e Prioridades do Sistema Unico de Saude-SUS." Background Paper Commissioned bythe World Bank.
Presidencia de la Republica 1992Colombia: Descentralizacion y Federaismo Fiscal. Departamento Nacional de Planeacion.Under the direction of Eduardo Wiesner Duran. Colombia.
Quehl, Scott 1993"Reinforcing the Building Blocks for Poverty Alleviation in a Decentralized Public Environment.nColombia Poverty Assessment Report. Washington, D.C.: World Bank, February 10.
Raczynski, Dagmar 1986La Regionalizacion y la Politica Economico-Social del Regimen Militar: El ImDacto Regional.Notas Tecnicas No. 84. Santiago de Chile: Corporacion de Investigaciones Economicas ]paraLatinoamerica (CIEPLAN).Raczynski, JDagmar 1986
Reid, Gary J. 1992"Civil Service Reform in Latin America: Lessons from Experience." Prepared for UNDPRegional Workshop on Public Sector Management Development in Latin America and theCaribbean, Santiago de Chile, 23-25 March. Public Sector Management Division, LAC.
Reid, Gary and Donald R. Winiker 1991"Decentralization and Government Size in Latin America." Prepared for the 47th Congress ofPublic Finance in a Changing Political Environment. Leningrad, August 25-29. InternationalInstitute of Public Finance.
Robson, K.J. 1987"Achieving Financial Accountability in a Federal System, part 2," Achieving FinancialAccountability in a Federal System. Ozasional Paper No. 43. Canberra: Centre for Researchon Federal Financial Relations, Australian National University.

98 The Design and Adnwwration of Intergowmenmu Tranlfrs
Rojas, Eduardo 1991"Descentralizacion y Autonomia Local en la Asignacion de Recursos." Revista EURE (Santiago)51 (Vol. XVII): 7-21.
Rondinelli, Dennis A., John Nellis and Cheema G. Shabbir 1984Decentralization in Developing Countries: A Review of Recent Expenence. World Bank StaffWorking Papers No. 581. Washington, D.C.: World Bank.
Rosen, Harvey S., ed. 1986Studies in State and Local Public Finance. Chicago: Chicago UP.
Saunders, C.A. 1986"Accountability for Transfers of Funds Between Levels of Governemnt: Impressions of RecentDevelopments in the United States." Accountability in Intergovernmental Fiscal Transfers.Occasional Paper No. 38. Canberra: Australian National University.
Shah, Anwar 1991Perspectives on the Design of Intergovernmental Fiscal Relations. World Bank Working Paper,No. WPS 726. Washington, D.C.: World Bank, July.
Schroeder, Larry 1990"Managing and Financing Rural Road Maintenance in Developing Countries." Decentralization:Finance & Management Project. Managed by Associates in Rural Development, Inc. Vermont:May.
Silverman, Jerry M. 1992Public Sector Decentralization: Economnic Policy and Sector Investment Programs. World BankTechnical Paper No. 188. Washington, D.C.: World Bank.
Tang, Shui Yan, 1992Institutions and Collective Action: Self-Govemance in Irrinton. San Francisco: Institute forContemporary Studies.
Tang, Shui Yan 1993 (forticoming)"Integrating Local Participation and Institutional Development: A Transaction Cost Perspective,"in James L. Perry, ed., Research in Public Administration, Vol. 2. Greenwich: JAI Press.
United States General Accounting Office 1982"A Summary and Comparison of the Legislative Provisions of the Block Grants Created by the1981 Omnibus Budget Reconciliation Act." Study by the Staff of the U.S. General AccountingOffice, IPE-83-2, Washington, D.C., December 30.
United States General Accounting Office 1984"Community Services Block Grant: New State Role Brings Program and AdministrativeChanges." Report to the Congress, HRD-84-76, Washington, D.C., September 28.

Bibliography 99
United States General Accounting Office 1980*Federal Assistance System Should 'Be Changed to Permit Greater Involvement By StateLegislatures.' Report to the Congress, GGD 81-3, Washington, D.C., December 15.
United States General Accounting Office 1988"Federal-State Cooperation in Developing National Data Collection Strategies." Report toCongressional Requesters, HRD-89-2, Washington, D.C., November 29.
United States General Accounting Office 1975"Fundamental Changes are Needed in Federal Assistance to State and Local Governments."Report to the Congress, GGD-7575, MWashington, D.C., August 19.
United States General Accounting Office 1979"Grant Auditing: A Maze of Inconsistency, Gaps, and Duplication that Needs Overhauling."Report to the Congress, FGMSD-79-37, Washington, D.C., June 15.
United States General Accounting Office 1975"Improved Cooperation and Coordination Needed Among All Levels of Govermment - Officeof Management and Budget Circular A-95." Report to the Congress, GGD-75-53, Washington,D.C., February 11.
United States General Accounting Office 1983iImproved Standards Needed for Managig and Reporting Income Generated Under FederalAssistance Programs." Report to the Director, Office of Management and Budget, GGD-83-55,Washington, D.C., July 22.
United States General Accounting Office 1982"Lessons Learned From Past Block Grants: Implications for Congressional Oversight." Reportto the Chairman of the Subcommittee on Oversight of the Committee on Ways and Means, UnitedStates House of Representatives, IPE-82-8, Washington, D.C., 1982.
United States General Accounting Office 1986'Local Governments: Targeting General Fiscal Assistance Reduces Fiscal Disparities.' Reportto the Chairman, Subcommittee on Intergovernmental Relations, Committee on GovernmentalAffairs, United States Senate, HRD-86-113, Washington, D.C., July 24.
United States General Accounting Office 1984"Maternal and Child Health Block Grant: Program Changes Emerging Under StateAdministration." Report to the Congress, HRD-84-84, Washington, D.C., May 7.
United States General Accounting Office 1980"More Stringent Revenue Sharing Act Requirements are Upgrading State and Local Governments'Audits." Report to the Congress, GGD 80-35, Washington, D.C., May 16.
United States General Accounting Office 1980"Proposed Changes in Federal Matching and Maintenance of Effort Requirements for State andLocal Governments." Report to the Congress, GGD-81-7, Washington, D.C., December 23.

100 The Design and Admistration of Juergovernentar Troanfers
United States General Accounting Office 1984'States Fund an Expanded Range of Activities Under Low-Income Home Energy Assitance BlockGrant." Report to the Congress, HRD-84-64, Washington, D.C., June 27.
United States General Accounting Office 1984"States Have Made Few Changes in Implementing the Alcohol, Drug Abuse, and Mental HealthServices Block Grant." Report to the Congress, HRD-84-52,, Washington, D.C., June 6.
United States General Accounting Office 1984"States Use Added Flexibility Offered by the Preventive Health and Health Services BlockGrant." Report to the Congress, HIZD-84-41, Washington, D.C., May 8.
United States General Accounting Office 1984"States Use Several Strategies to Cope With Funding Reductions Under Social Services BlockGrant." Report to the Congress, HIZD-84-68, Washington, D.C., August 9.
United States General Accounting Office 1984"Statutory Audit Provisions Applicable to Federal Financial Assistance Programs." Report bythe Comptroller General of the United States, GGD-84-72, Washington, D.C., July 2.
United States General Accounting Office 1985"UMTA Needs Better Assurance That Grantees Comply With Selected Federal Requirements."Report to the Secretary of Transportation, RCED-85-26, Washington, D.C., February 19.
Uphoff, Norman 1988"Participatory Evaluation of Farner Organizations' Capacity for Development Tasks."Agricultural Administration & Extenision 30 (1988): 43-64.
Uphoff, Norman 1992"Monitoring and Evaluating Popular Participation in World Bank Assisted Projects," inBhatnagar, Buvan and Aubrey William, eds., Participatory Development and the World Bank:Potential Directions for Change. World Bank Discussion Paper, No. 183. Washington, D.C.:World Bank, 135-156.
Uphoff, Norman, M.L. Wickramsinghe and C.M. Wijayaratna 1990"'Optimum' Participation in Irrigation Management: Issues and Evidence from Sri Lanka."Human Organization. Vol. 49, No. 1: 26-40
US Executive Office of the President 1981Financial Management of Federal Aid. Washington, D.C.: Office of Management and Budget.February.
Wesbery Jr., James P. 19.."Government Accounting and Financial Management in Latin American Countries" in A.Premchand, ed., Government Financial Management. Washington, D.C.: InternationalMonetary Fund.

.. _ . .Php 101
Winlder, Donald R. 1988Decentralization in Education: An E,conomic Perspective. Working Paper prepared for theEducation and Employment Division, PHR Dept. Washington, DC: World Bank, November.
Winkler, Donald R. 1993'Fiscal Decentralization and Accountability in Education: Experiences in Four Countries," inJane Hannaway and Martin Carnoy, eds., Decentralization and School Improvement: Can WeFulfill the Promise? San Francisco, CA: Jossey-Bass Inc.
Winkler, Donald R. and Taryn Rounds 1993'Municipal and Private Sector Response to Decentralization and School Choice: The Case ofChile, 1981-1990.' Prepareed for the International Symposium on the Economics of Education,March. Technical Department, LAC.
Wohlstetter, Priscilla and Allen Odden 1992"Rethinking School-Based Management Policy and Research," Educational AdministrationOuarterly. Vol. 28, No.4, November: 529-549.
World Bank 1990Argentina: Provincial Government Finances. World Bank Country Study. Washington, D.C.:The World Bank.
World Bank 1992Brazil: The Challenge of MuniciRal Sector Development in the 1990s. Report No. 10161-BR.Washington, D.C.: Infrastructure Operations Division, Country Department I, LAC.
World Bank 1992Brazil: Issues in Health Care Deliverv and Finance. Draft. Washington D.C.: H:umanResources Division, Country Department I, LAC.
World Bank 1990Bolivia Social Investment Fund Project. Staff Appraisal Report No. 8248-BO. Washington,D.C.: Human Resources Division, Country Department m, LAC.
World Bank 1992Chile Subnational Government Financ. . Report No. 10580-CH. Washington, D.C.: Energy andInfrastructure Division, LAC.
World Bank 1993Colombia: Toward Increased Efficiency and Equity in the Health Sector. Can DecentralizationHelp? (Draft) Sector Study in Progress. LAC, March 8.
World Bank 1991Macroeconomic Policy Under Fiscal Federalism. Report No.9694-BR, Volume I. Washington,D.C.: Country Operations Division, iCountry Department I, LAC.

102 The Design and Adninidsraon of bite1rgov1munet Transfers
World Bank 1991Mexico Decentralization and Regional Dwelov ment Project for the DisadvanUged States. StaffAppraisal Report No. 8786-ME. Washington, D.C.: Agriculture Operations Division, CountryDepartment II, LAC.
World Bank 1992Public Sector Decentralization: Economic Poligy and Sector Investment Programs. World BankTechnical Paper No. 188. Washington, D.C.: Africa Technical Department Series.
World Bank 1992Venezuela Decentralization and Fiscal Issues. Report No. 11 160-VE, Volume I. Washington,D.C.: Infrastructure Operations Division, Country Department I, LAC.

Antmexes

Annex A1 of 3
Table Al: Variable Definitions
Nsme J Mean/Std. Dev. Definition
EDTRN 9.3 Municipal education finanrce per public school student 1990(26.8)
SES 1.8 Socio.economic level coded from 1 to 5 from SIMCE 1990(0.5)
CGRPBS 67.2 Cetml Goveunment transfer per public school student 1991(34.6)
NERPOPN 14.6 Non-earmarked municipal revenue per capita 1990(19.1)
NERPUBS 95.3 Non-earmarked revenue per public school student(54.6)
EDWAGES 1340.0 Public education expenditures on salaries divided by number of public school teachers 1990(639.0)
PBSTPOP 2.0 Public school students divided by population(0.1)
STICHR 26.7 Student-teacher ratio in public schools(19.2)
PERPUB 81.0 Students attenling public schools as percet of all students in public and private subsidized(18.0) schooks.
CORPORATION Equals one if the municipality has a municipal corporation for education and health
ZONA I1 Regional cost of living adjustment to wages as defined in Public Law 450 of 1974(0.2)
DENSITY 723.1 Population density of the municipality in 1990(2760.0)
POVERTY 16.9 Percent living in extreme poverty in 1987.(8.8)
REPRATE 10.67 Average repetition rate for the municipality.(4.5)
SPNCHG 1.07 Average 8th grade minus average 4th grade Spamish SIMCE score in publc schools of the(5.7) municipality.
Note: All Financial Figures are in thousands of 1990 pesos.N= 325
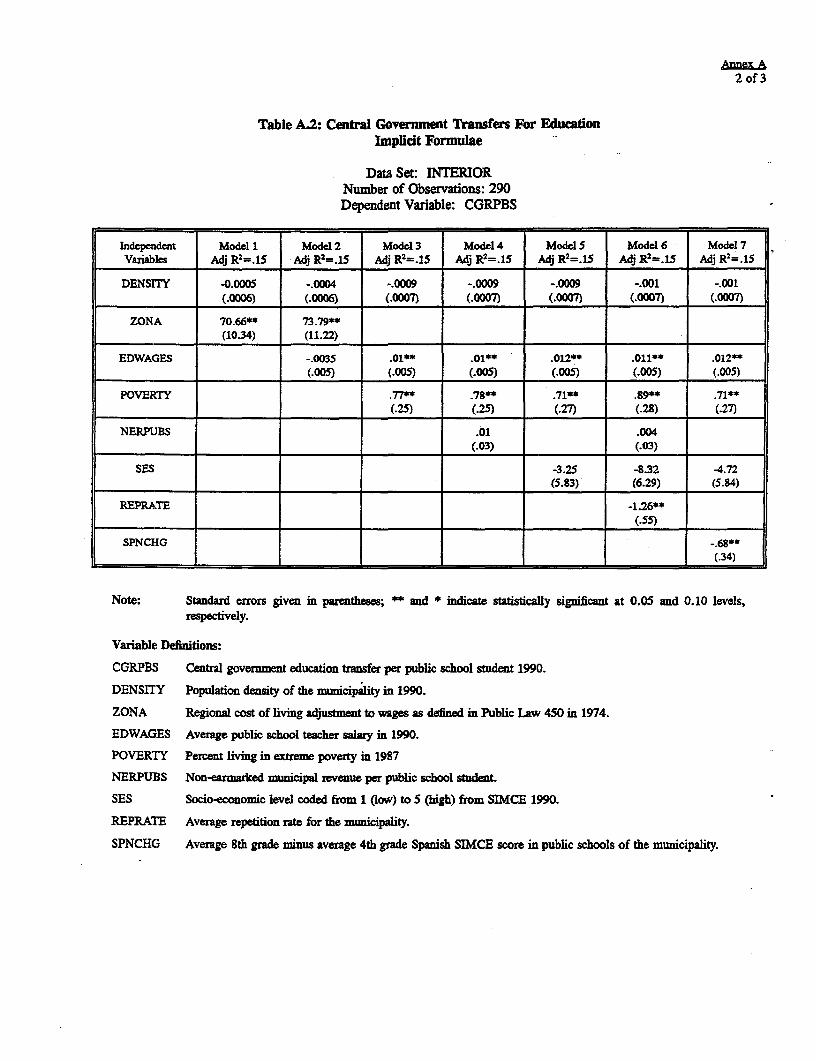
Annex A2 of 3
Table A.2: Central Government Transfers For EducationImplicit Formulae
Data Set: INTERIORNumber of Observations: 290Dependent Variable: CGRPBS
Independent Model 1 Model 2 Model 3 Model 4 Model S Model 6 Model 7Variables Adj R2=.15 Adj R2=.15 Adj R2=.15 Adi R2=.15 Adj R2 =.15 Adi R2=.15 Adj R=.15
DENSrrY -0.0005 -.0004 -.0009 -.0009 -.0009 -.001 -.001(.0006) (.0006) (.0007) (.0007) (.0007) (.0007) (.0007)
ZONA 70.66** 73.79**(10.34) (11.22)
EDWAGES -.0035 .01** .01** .012** .011** .012**(.005) (.005) (.005) (.005) (.005) (.005)
POVERTY .77** .78** .71** .89** .71**(.25) (.25) (.27) (.28) (.27)
NERPUBS .01 .004NERPUBS_______ 0(.03) (.03)
SES -3.25 -8.32 -4.72(5.83) (6.29) (5.84)
REPRATE -1.26**(.55)
SPNCHG -.68**__(.34)
Note: Standard errors given in parentheses; * and * indicate statistically significant at 0.05 and 0.10 levels,respectively.
Variable Definitions:
CGRPBS Central govemnment education transfer per public school student 1990.
DENSITY Population deusity of the municipality in 1990.
ZONA Regional cost of living adjustment to wages as defined in Public Law 450 in 1974.
EDWAGES Average public school teacher salary in 1990.
POVERTY Percent living in extreme poverty in 1987
NERPUBS Non-earmarked municipal revenue per public school student
SES Socio-economic level coded from 1 (low) to 5 (high) from SIMCE 1990.
REPRATE Average repetition rate for the municipality.
SPNCHG Average 8th grade minus average 4th grade Spanish SIMCE score in public schools of the municipality.

Annex A3 of 3
Table A.3: Munidp&l Finance of Education in Chile
Data Set: INTERIORDependenit Variable: EDTRNNumber of Observations: 290
OLS Log lTransformation Models
[ Inde ent Variables Model 1 Model 2 Model 3Adj R2 =.28 Adj R2 =.28 Adj R=.26
SES -.41 -.46 -.39______________________________ (.32) (.32) (.32)
CGRPBS -.27 -.28 -.32'(.18) (.18) (.18)
NERPOP 1.0- 1.0- .88-(.12) (.12) (.12)
DENSITY .11 .104 .13(.036) (.037) (.036)
EDWAGES .95 .94 .95-(.23) (.27) (.27)
PBSTPOP -.71 -. r(.19) (.19)
SlT1CHR -1.18- -1.1r -1.41-(.287) (.287) (.287)
PERPUB -.628(.25)
CORPORATION .14___________________ ~~~~~~~~~~~~~~~~(.17)_ _ _ _ _ _ _
Note: Standard errors given in parentheses; ** and * indicate statistically significant at 0.05 and 0.10 levels,respectively.
Variable Definitions:
EDTRN Municipal education finance per public school student 1990.
SES Socio-economic level coded fiom 1 to 5 from SIMCE 1990.
CGRPBS Cental Government trnsfr per public school stxdent 1991.
NERPOPN Non-earnarked municipal revenuwb per capita 1990.
DENSIrY Population density of the municipality in 1990.
EDWAGES Public education expenditure on salaries divided by number of public school teachers 1990.
PBSTPOP Public school students divided by population.
STrCHR Student-teacher ratio in public schLools.
PERPUB Students attending public schools as percent of all students in public and private subsidtized schools.
CORPORATION Equals one if the municipality has a municipal corporation for education and health.

Annex B1 of 9
Table B.1: Variable Description
Mean.- Day
Name Deimitio
NMnistry of Ministry of Intario Daa
Unweitdw Wegte
HTRNPUB 0.73 n.a. nu.a. Municipd health finanoe per beneficuiry.
HTRNPC 0.46 0.50 0.35 Municipal health finance per capita.
FAPEMPUB 1.70 n.a. n.a. Central Government heath transfers per beneficiary.
FAPEMPC 1.16 1.57 1.34 Central Government health transfers per capita.
NERPC 11.48 14.60 10.42 Non-eamarled municipal revenue per capita.
PERPUBHL 69.52 72.40 71.40 Percent of population in public health system.
ZONA 0.11 0.19 0.11 Region cost-of-livingadjustmentas definedby Law 450 in 1974.
DENSITY 3070.67 679.00 2602.30 Pbpulation density of the municipality in 1990.
POVERTY 10.23 16.90 12.77 Percent of population in extreme poverty.
PER0-4 11.12 11.82 1L.22 Percentofpopulationaged0-4.
PEROVR 60 8.65 9.42 S.89 Percent of population over age 60.
PERPOSTAS 38.72 71.14 4 L.19 Rural hedth posts as percent of total health clinics.
UNDRNOUR 5.34 n.a. ILA. Percent of children undernourished.
CHILDSER 5.75 6.99 S.S0 Number of health clinic child srrvices delivered per capita.
CORPORATION Equals one if the municipality has a health corporation.
AUXWAGE 0.42 0.13 0.33 Wage of auxiliary workerm in health clinics.
INCPC 62.41 65.47 L.53 Average per capita income.
INFMORT 23.68 21.76 ZL40 Infant mortality rate in 1989.
NURSWGE 5.65 6.27 5.89 Average wuge of nurse in health clinics.
EDWAGES 146.20 151.19 14B.58 Aveagcpublic school techer salaries.
SES 1472.60 1340.00 1462.39 Socio-economic Status of population scaled 1-5.
HLTHIND 2.19 1.80 2.16 Biologic/physiologichealth needs indicator.
Number ofObservations 72 325 325
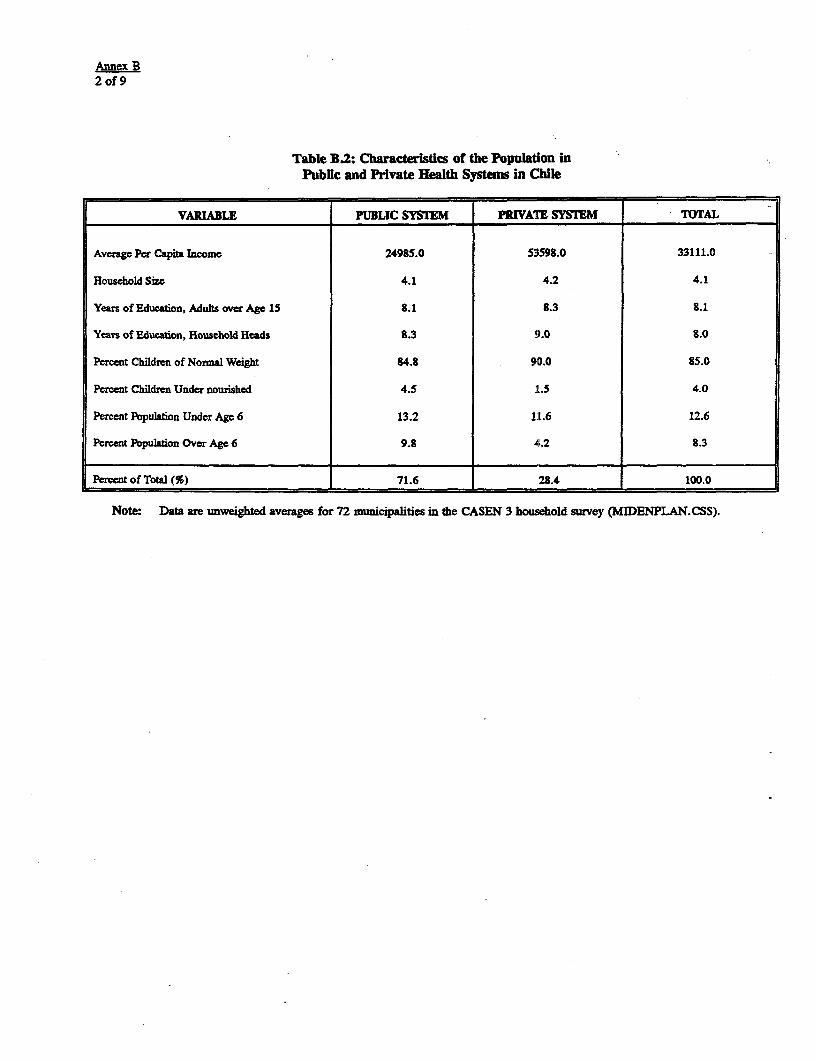
Annex B2 of 9
Table B.2: Characteristics of the Population inPublic and Private Health Systems in Chile
VARIABLE PUBLIC SYSTEM PRIVATE SYSTEM TOTAL
Average Pcr Capita Income 24985.0 53598.0 33111.0
Household Size 4.1 4.2 4.1
Years of Education, Adults over Age 15 8.1 8.3 8.1
Years of Education, Household Heads 8.3 9.0 8.0
Percent Children of Nonmal Weight 84.8 90.0 85.0
Percent Children Under nourished 4.5 1.5 4.0
Percent Population Under Age 6 13.2 11.6 12.6
Percent Population Over Age 6 9.8 4.2 8.3
Perct of Total (%) 71.6 28.4 100.0
Note. Data are unweighted averages for 72 mumicipalities in the CASEN 3 household survey (MIDENPLAN.CSS).

Amnex B3 of 9
Table B.3: Municipal health finance per beneficiary
Data set: MlDEPLANNumber of Observations: 61
Dependent Variable: HTRNPUBOLS Log Transformation Model
Variable Adj.R2 .65 Adj.R2 .65 Adj.R2 .64 Adj.R2 .64
INCPC .73 .34 .69 .68-(.24) (.47) (.25) (.29)
NERPC .6r .065- .6r .68-(.18) (.18) (.19) (.20)
FAPEMPUB .92- .93 .91- .91(.14) (.14) (.14) (.15)
DENSrTY .05 .03 .05 .05(.03) (04) (.04) (.04)
PERPUBHL -93________________ ~~~~~~~(.93)_ _ _ _ _ _ _ _
CORPORATION .07 .0T__________ _________ __________ ________ _ _________(.19) (.21)
ZONA .07
Note: Standard errors given in parentheses; ** ad * indicate statistically significant at 0.05 and 0.10levels, respectively.
Variable Defimitons:
HTRNPUB Municipal health finance per beneficnary.
INCPCP Average per capita income.
NERPC Non-earmaked municipal revenue per capita-
DENSllY Population density of the mumicipalily in 1990.
FAPEMPUB Cental government health transfers per beneficiary.
PERPUBBL Percent of populatito in public health system
CORPORATION Equals one if municipal has a health corporation.
ZONA Regional cost-of-living adjustment as defined by Decree Law 450 in 1974.
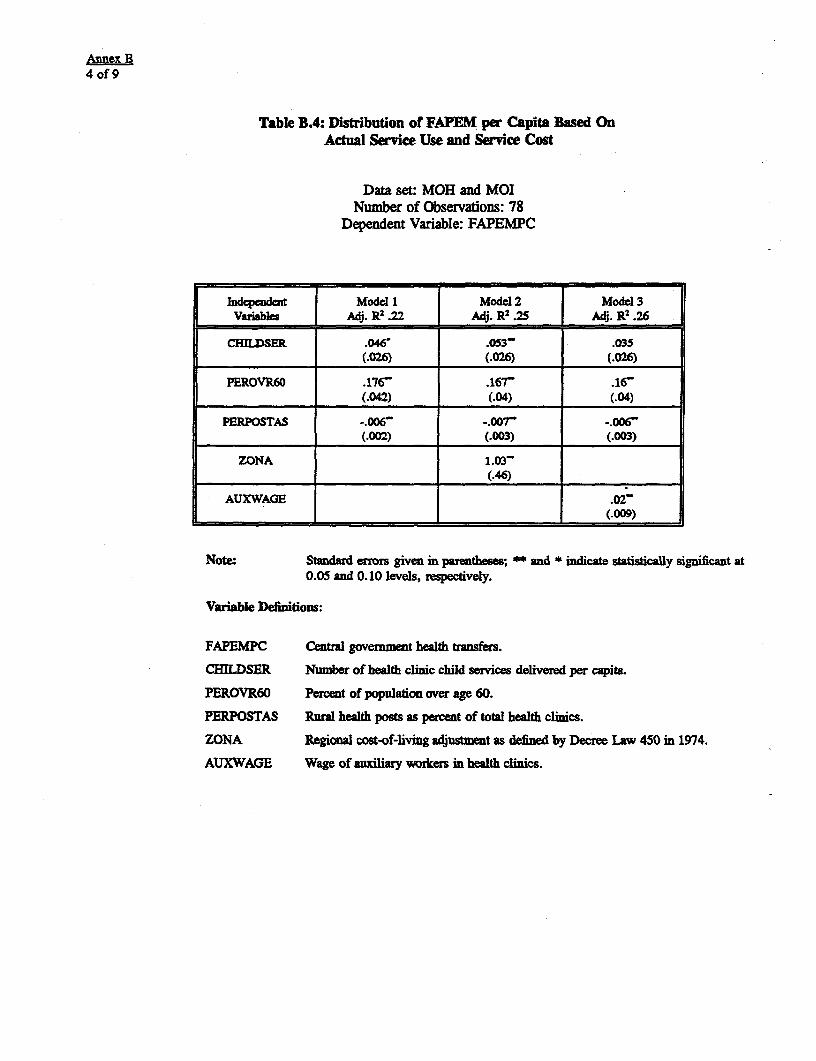
Annex B4 of 9
Table B.4: Distribution of FAPEM per Capita Based OnActual Service Use and Srvice Cost
Data set: MOH and MOINumber of Observations: 78
Dependent Variable: FAPEMPC
lidepcndent Model 1 Model 2 Mode 3Variabls Adj. R2 .22 MAdj. R2 .25 Adj. R2 .26
CHMLDSER .046' .053- .035_____ (.026) .026) (.026)
PEROVR60 .176- .167- .16-(.042) (.04) (.04)
PERPOSTAS -.006 -.oor -.006(.002) (.003) (.003)
ZONA 1.03-_ _ _ _ _ _ _ _ _ _ _ _ __ (.46)
AUXWAGE .02(.009)
Note: Stad errors givea in parentheses; ** and * indicate sttcally significant at0.05 and 0.10 levels, respectively.
Variable Definitions:
FAPEMPC Centml government health tansfers.
CHILDSER Number of health clinic child services delivered per capita.
PEROVR60 Percent of population over age 60.
PERPOSTAS Rural health posts as percent of total health clinics.
ZONA RegioDal cost-of-livng adjustment as defined by Decree Law 450 in 1974.
AUXWAGE Wage of auxiliaary oters m health clinics.

Annex B5 of 9
Table B.5: Distribution cof FAPEM per BeneficiaryBased on Measures orfDemand for Services
Data set: MIDEPLANNumber of Observations: 61
Dependent Variable: FAPEMPUB
[ Independent Model I Model 2 Model 3Variables Adj. R2 .13 _ Adj. R2 .21 Adj. R2 .2
POVERTY -.103- -.105- -.09-(.037) (.036) (.038)
PEROVR60 .095 .068 .15(.094) (.09) (.12)
PERAGEO-4 .33 .23 .19j_______ (.22) _(.22) (.23)
PERPOSTAS -.008- -.007 -.007'|(.004) (.004) (.004)
UNDROUR .12 .13-I _ _ _ _ _ _ _ _ _ _ _ _ _ _ _ _ _ _ _ _ _ _ _ _ (.05) (.05)
NATALlTY .002(.05)
INFMORT -.19(.178)
Note: Standard errors given in parentheses; ** and * indicate statistically significant at0.05 and 0.10 levels, respectively.
Variable Definitions:
FAPEMPUB Central government health transfers per beneficiary.
POVERTY Percent of population living in extrne poverty.
PER 0-4 Percent of population aged 0-4.
PEROVR60 Percent of population over age 60.
PERPOSTAS Rurd health posts as percent of tota1 health clinics.
UNDRNOUR Percent of children undernourishecl.
NATALITY Birth rate in 1988 per 1,000 women.
lNFMORT ifant mortality rate in 1989.
ZONA Regional cost-of-living adjustment as defined by Decree Law 450 in 1974.

Annex B6 of 9
Table B.6: Public Health Users
Data set: MIDEPLANNumber of Observations: 59
Dependent Variable: PERPUBHL
depent Variables 1 Model 1 Model 2|________ .Adj. R2 .58 Adj. R2 .61
INCPCP -.0004** -.0004**(.0001) (.0001)
POVERTY .511**I _ _ _ _ _ _ _ .(.24)
PERO-4 6.22* 5.79#(1.38) (1.35)
PEROVR60 2.11w 2.23*= =_______________ (.59) (.57)
Note. Standard errrs given in parentheses; and * indicatestatistically significant at 0.05 and 0.10 levels, respectively.
Variable Definitions:
INCPCP Average per capita imome.
POVERTY Percent of population in extreme poverty.
PERO-4 Percent of population aged 04.
PEROVR60 Percent of population over age 60.

Annex B7 of 9
Table B.7: Health lEpenditures per Capita
Data set: M;nistry of HealthNumber of CObservations: 72
Dependent Variable: HTRNPCOLS Log Transformation Model
Independent Variables Model 1 Model 2 Model 3Adj. R2 .27 | Adj. R2.27 Adj. R2 .28
NERPC .66- .66 .65(.27) (.25) (.25)
FAPEMPC .54 .56- .54-________________________ (.18) (.18) (-18)
CHILDSER -.07 -.13 -.07(.22) (.23) (.21)
AUXWAGE -.07i _ _ _ _ _ _ _ _ _ _ (.63) _
NURSWGE .53____________= = . (.7)
Note : Standard errors given in parentheses; and * indicate staistically significant at0.05 and 0.10 levels, respectively.
Variable Definitioas:
HTRNPC Municipal bealth finance per capita.
NERPC Non-earmarked municipal revenue per capita.
FAPEMPC Central government health transfers per capita.
CHDSER Number of bealth clinic child servces delivered per capita.
AUXWAGE Wage of uxiliry worers in health clinics.
NURSWGE Average wage of nurses in health clinics.

Annex B8 of 9
Table B.8: Determinants of Zone Classification Weights
Data set: Ministry of HealthNumber of Observations: 72Dependent Variable: ZONA
Indepndent Vaiables Model 1 Model 2 Model 3Adj. R2.09 Adj. R2 .16 Adj. RF .35
N=305 N=305 N=81
EDWAGES .0001 .00015(.00002) (.00002)
SES -.14-(.03)
NURSWAGE .00003_ _ _ __ (0007)
AUXWAGE .012(.002)
Note: Standard errors given in parentheses; " and * indicate stastically significant at 0.05and 0.10 levels, respectively.
Variable Definitions:
ZONA Regional cost-of-living adjustment as defined by Decree Law 450 in 1974.
EDWAGES Public school teacher salaries in 1990.
SES Socio-economic level of population.
NURSWAGE Average wage of nurses in health clinics.
AUXWAGE Wage of auxiliary workers in health clinics.
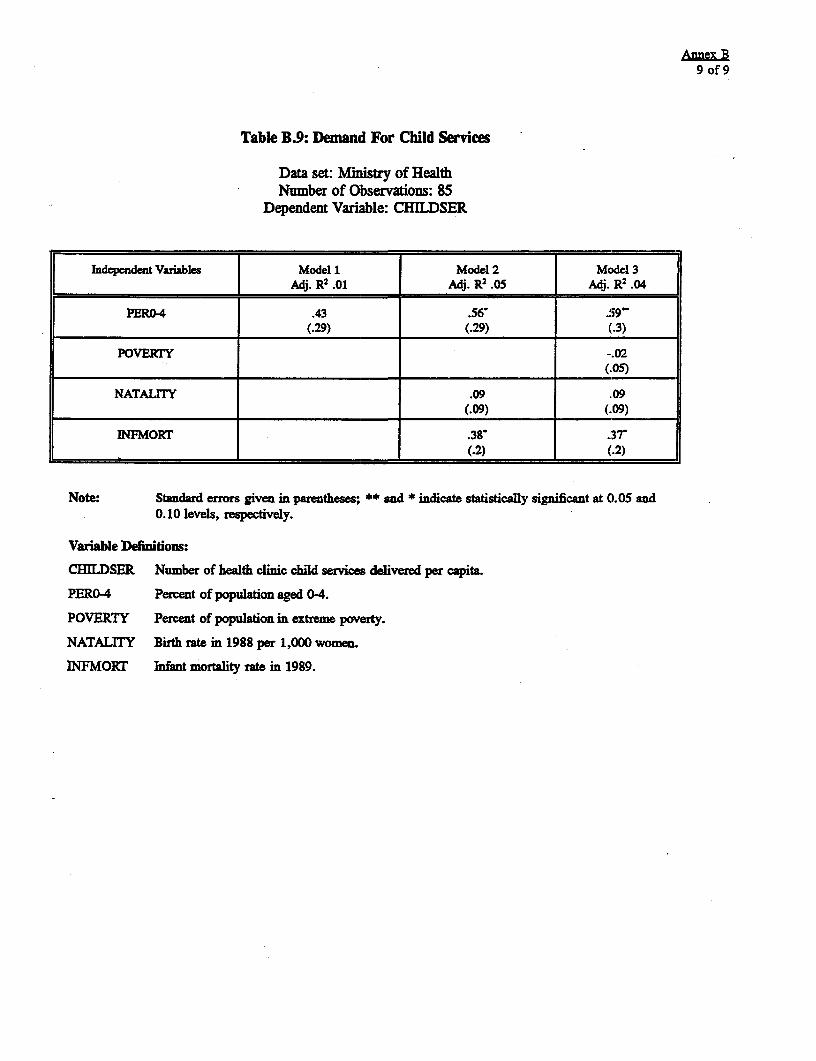
Annex B9 of 9
Table B.9: Demand For Child Services
Data set: Ministry of HealthNumber of Observations: 85
Dependent Variable: CHILDSER
Independent Variables | Model 1 Model 2 | Model 3L ____________________ j Adj. R2 .01 Adj. R2.05 Adj. R2 .04
PERO-4 .43 .56 .59l(.29) (.29) (.3)
POVERTY -.02I_ _ _ _ _ _ _ _ _ _ ._ _ _ _ _ _ _ _ _ _ _ _ _ (.05)
NATAL1rY .09 .09_ _ _ _ _ _ _ _ _ _ _ _ _ _ _ _ _ _ _ _ _ _ _ ~~~~~~~ ~~~~(.09) (.09)
INFMORT .38' .37'____ __ (.2) (.2)
Note: Standard efrors given in parentheses; ** and * indicate statistically significant at 0.05 and0.10 levels, respectively.
Variable Definitions:
CEnDSER Number of health clinic child services delivered per capita.
PERO-4 Percent of population aged 0-4.
POVERTY Percent of population in extreme poverty.
NATALITY Birth rate in 1988 per 1,000 women.
INFMORT Infant mortality rate in 1989.
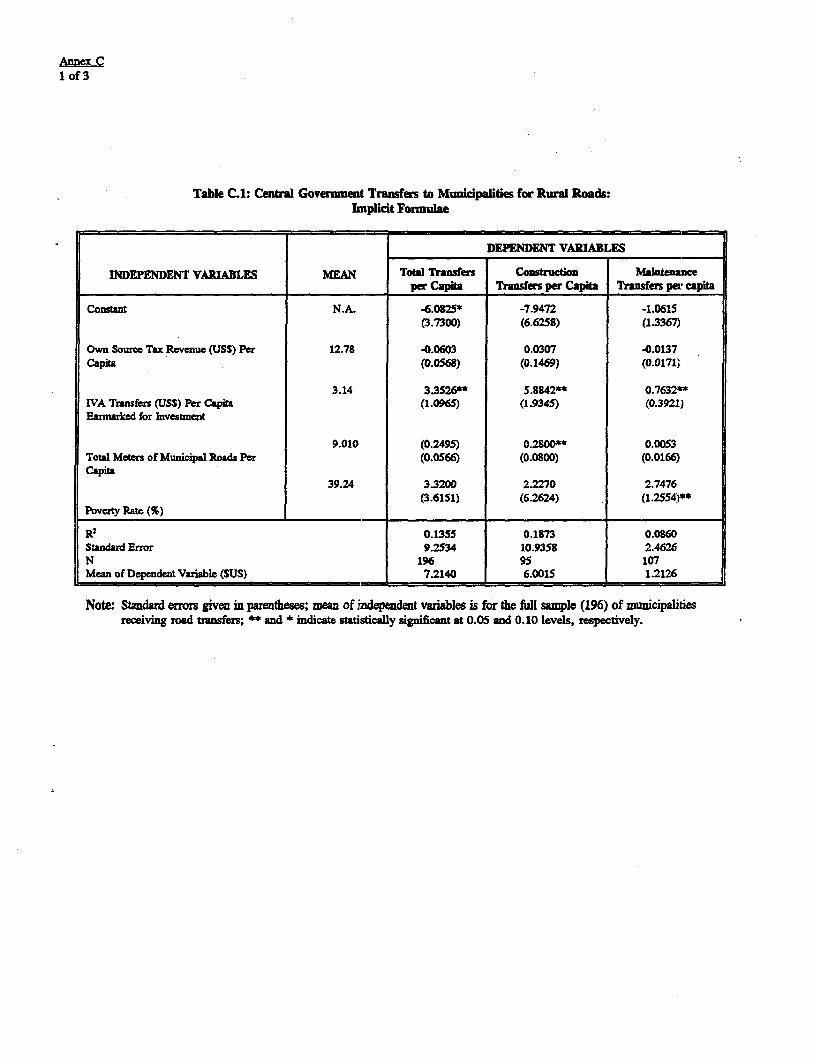
Annex C1 of 3
Table CA: Central Government Transfers to Municipalities for Rural Roads:Implicit Formuae
DEPENDENT VARIABLES
INDEPENDENT VARIABLES NEAN Tot Transfers Consfretion Maitenance__________ per Capita Transfers per Capita Transfers pe capita
Constant N.A. -6.085* -7.9472 -1.0615(3.7300) (6.6258) (1.3367)
Own Soure. Tax Revenue (USS) Per 12.78 -0.0603 0.0307 -0.0137Capita (0.0568) (0.1469) (0.0171)
3.14 3.3526** 5.8842** 0.7632wt*nA Transfers (USS) Per Capita (1.0965) (1.9345) (0.3921)Earmarked for Investment
9.010 (0.2495) 0.2800** 0.0053Total Meters of Municpal Roads Per (0.0566) (0.0800) (0.0166)Capita
39.24 3.3200 2.2270 2.7476(3.6151) (6.2624) (1.2554)**
Poverty Rate (%) _ ____
R2 0.1355 0.1873 0.0860Standard Error 9.2534 10.9358 2.4626N 196 95 107Mean of Dependent Variable (SUS) 7.2140 6.0015 1.2126
Note: Standard errors given in partheses; mean of independent variables is for the fill sample (196) of municipalitiesreceiving road tanfers; ** and * indicate statistically significant at 0.05 and 0.10 levels, respectively.
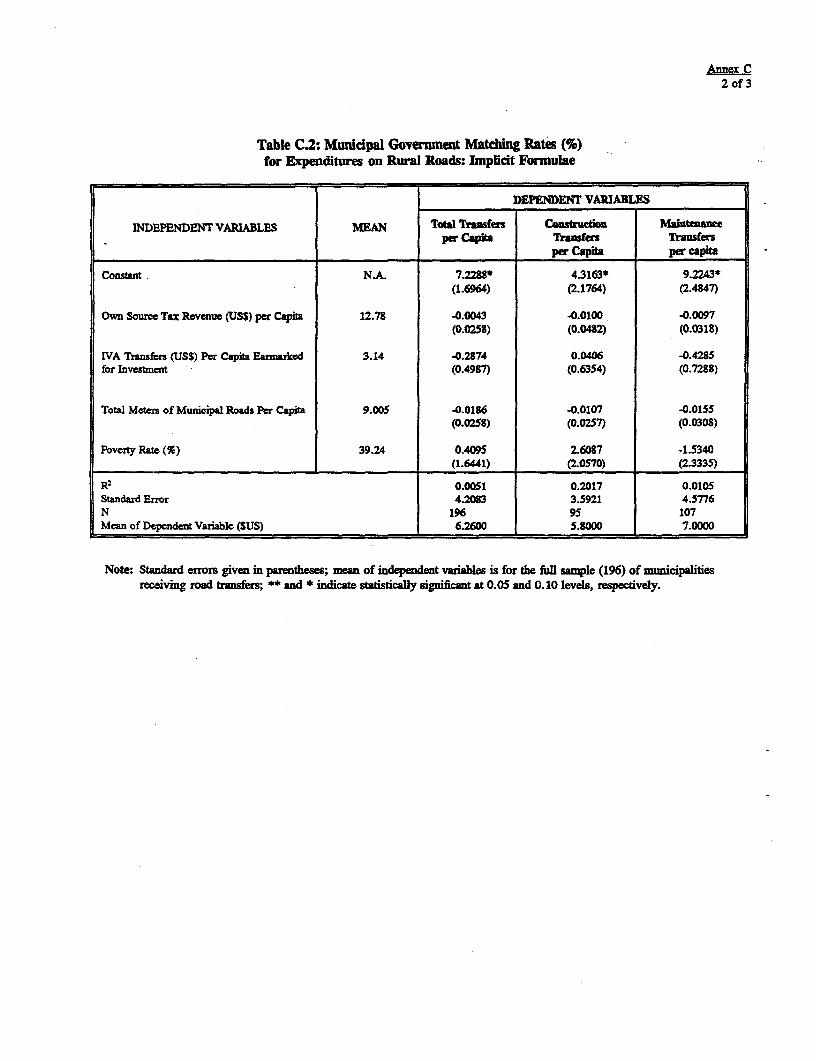
Annex C2 of 3
Table C.2: Municipal Government Matching Rates (%)for Expenditures on Rural Roads: Impficit Formulae
DEPENDENT VARlALES
INDEPENDENT VARLABLES MEAN TW T isfers Costructon aenanceper Capita Transfers Trnsfers
per Capita per capita
Consant NJA 7.2288* 4.3163* 9.2243*(1.6964) (2.1764) (2.4847)
Own Source Tax Revenue (USS) per Capita 12.78 -0.0043 -0.0100 -0.0097(0.0258) (0.0482) (0.0318)
IVA Transfers (USS) Per Capita Eannarked 3.14 -0.2874 0.0406 -0.4285for Investment (0.4987) (0.6354) (0.7288)
Total Metas of MunCipal Roads Per Capita 9.005 -0.0186 -0.0107 -0.0155(0.0258) (0.0257) (0.0308)
Poverty Rate (%) 39.24 0.4095 2.6087 -1.5340(1.6441) (2.0570) (2.3335)
R2 0.0051 0.2017 0.0105Standard Error 4.2083 3.5921 4.5776N 196 95 107Mean of Dependcnt Variable (SUS) 6.2600 5.8000 7.0000
Note: Standard errors given in parenheses; man of independent variables is for the full sample (196) of municipalitiesreceiving road tansfers; * and * indicate staistically significant at 0.05 and 0.10 levels, respectively.
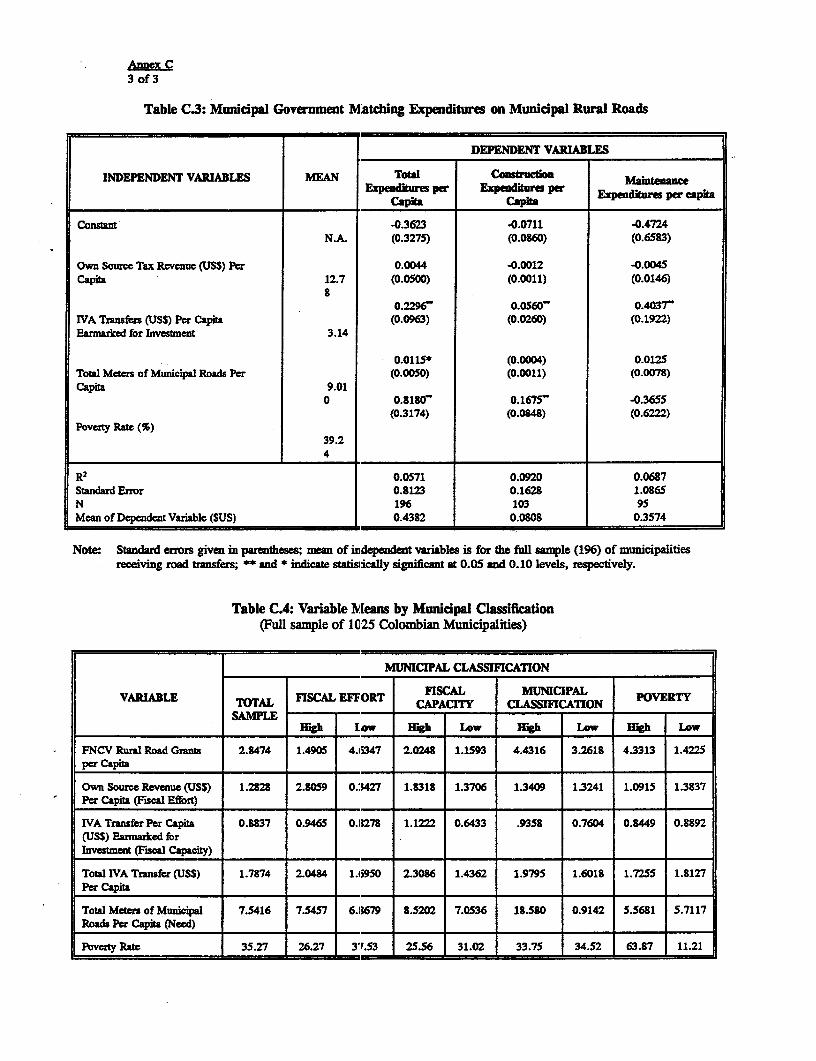
Amnex C3 of 3
Table C3: Municipal Government MAtching Expenditures on Muncipal Rural Roads
DEPENDENT VARIABLES
INDEPENDENT VARIABLES MEAN Total Cons_rcion mtenaceEpexdiur per Enpediturs per Exmdues per capita
_____________________________ _________c apita C apita _ _ _ __ _ _ _ _
Constant -0.3623 -0.0711 0.4724N.A. (0.3275) (0.0860) (0.6583)
Own Sour=c Tax Revenue (USS) Per 0.0044 -0.0012 -0.0045Capita 12.7 (0.0500) (0.0011) (0.0146)
0.229 0.0560" 0.4037IVA Transfers (USS) Per Capita (0.0963) (0.0260) (0.1922)Earmarked for InvestDent 3.14
0.0115* (0.0004) 0.0125Total Meters of Municipal Roads Per (0.0050) (0.0011) (0.0078)Capita 9.01
0 0.8180- 0.1675- 0.3655(0.3174) (0.0848) (0.6222)
Povety Rat (%) 39.24
R2 0.0571 0.0920 0.0687Standard Error 0.8123 0.1628 1.0865N 1% 103 95Mean of Dependent Variable (SUS) 0.4382 0.0808 0.3574
Note' Standard errors given m parentheses; mean of i.dependent vanables is for the ful sample (196) of municipalitiesreceiving road transfers; ** and * indicate statisaioly significant at 0.05 and 0.10 levels, respectively.
Table CA: Variable M!eans by Municipal Classification(Full sample of HC25 Colombian Municipalities)
_MUNICIPAL CLASSIFICATION
VARLABLE TAL FISCAL EFFORT FISCAL NICICPAL POVERr____ ~~~CAPACITY CLASSIFCATION
SAMPLEHigh Low High low lIgh LOW High Low
FNCV Rural Road Grants 2.8474 1.4905 4.1347 2.0248 1.1593 4.4316 3.2618 4.3313 1.4225per Capita
Own Source Revenue (USS) 1.2828 2.8059 0.S427 1.8318 1.3706 1.3409 1.3241 1.0915 1.3837Per Capita ffiscal Effort)
WVA Transfcr Per Capita 0.8837 0.9465 0.S278 1.1222 0.6433 .9358 0.7604 0.8449 0.8892(USS) Earmarked forInvestmcnt (Fisa Capat)
Totl IVA Transfer (USS) 1.7874 2.0484 1.l950 2.3086 1.4362 1.9795 1.6018 1.7255 1.8127Per Capita IbI
Total Meters of Munical 7.5416 7.5457 6.11679 8.5202 7.0536 18.580 0.9142 S.5681 5.7117Roads Per Capita (Need) .
Poverty Rate 35.27 26.27 37.53 25.56 31.02 33.75 34.52 63.87 11.21
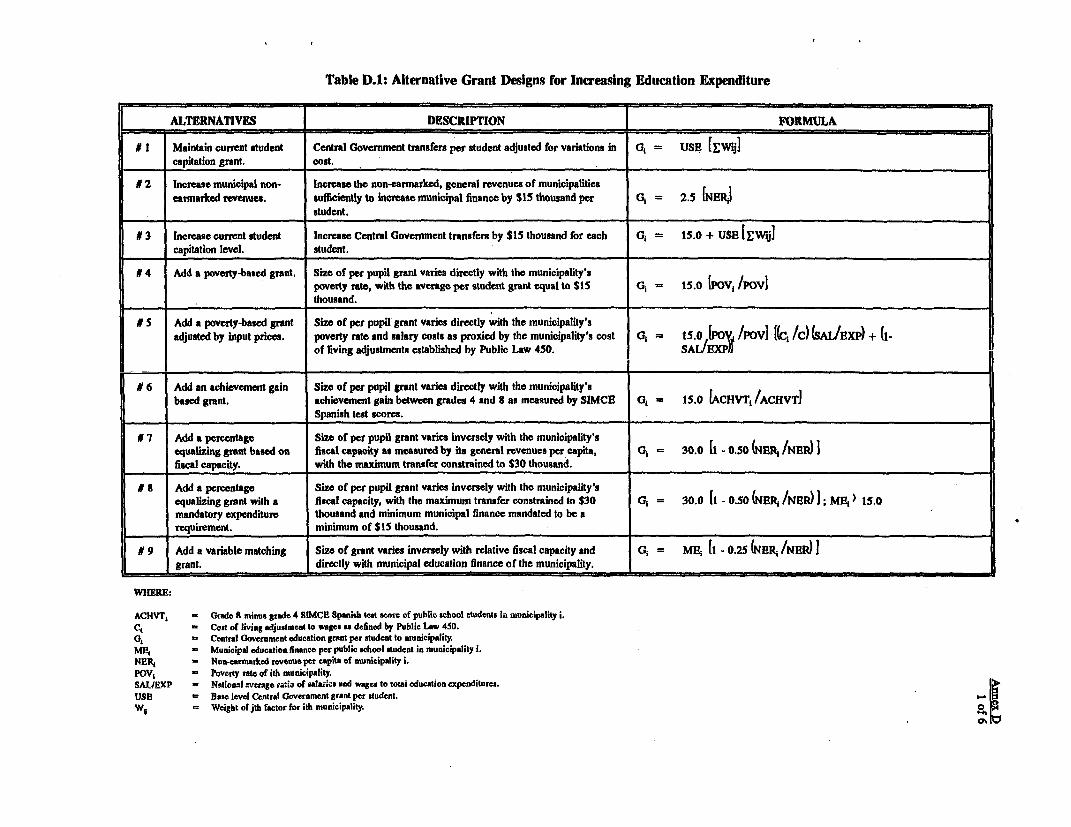
Table D.1: Alternative Grant Designs for Increasing Education Expenditure
ALTECRNATIVES DESCRIPTION FORMULA
# I Maintain current student Central Govemment transfers per student adjusted for variations in 0, = USE [Ewi]capitation grant. cost.
# 2 Inorease municipal non- Increase the non-earmarked, general revenues of municipalitiesearmarked revenues, sufficiently to inerease municipal finance by $15 thousand per G; = 2.5 INERJ
student.
#3 Increase current student Increase Central Government transfers by $15 thousand for each G1 = 15.0 + USE [Ewi]capitation level, student.
# 4 Add a poverty-based grant. Size of per pupil grant varies directly with the municipality'spoverty ate, with the average per student grant equal to $15 Gj = 15.0 IPOV1 /Pov1thousand.
# 5 Add a poverty-based grant Size of per pupil grnt varies directly with the municipality'sadjusted by input prices, poverty rate and salary costs as proxied by the municipality's cost a3 = 150 f}'oy1 /POVl [(C1/C) (SAI/EXP) + (1-
of living adjustments established by Public Law 450. SAL/BXPI1
# 6 Add an achievement gain Size of per pupil grant varies directly with the municipality'sbased grant. achievement gain between grades 4 and 8 as measured by SIMCE Gi = 15.0 [ACHVTY /ACHVT]
Spanish test scores.
# 7 Add a percentage Size of per pupil grant varies inversely with the municipality'sequalizing grant based on fiscal capaoity as measured by its general revenues per capita, Gi = 30.0 [1 - 0.50 (NERi /NEP)fiscal capacity. with the maximum transfer constrained to $30 thousand.
# 8 Add a percentage Size of per pupil grant varies inversely with the munioipality'sequalizing grant with a fiscal capacity, with the maximum transfer constrained to $30 GI = 30.0 [I - 0.50 (NERP /NBR) I; ME1) 15.0mandatory expenditure thousand and minimum municipal finance mandated to be arequirement. minimum of $15 thousand.
# 9 Add a variable matching Size of grant varies inversely with relative fiscal capacity and G, = ME; [I - 0.25 (NER1 /NER) Igrant. directly with municipal education finance of the municipality.
WHE1E:
ACHVT, - Grade S minus gr ade 4 SlCE Spanish test scor of public school students in municipality i.C, Cost of living adjustment to wages as defined by Public Law 450.G, - Central Government education grant per student to municipality.ME, = Municipal education finance per public school student in municipality i.NER, - Non-earmatked revenue per capita of municipality i.PoV, - Povetty rate of ith municipality.SAL/EXP - Notiongl average ratio of salar-es and *ages to total education expenditures.USE - Base level Central Government grant per student.W4 - Weight of jth factor for ith municipality. ii

Annex D2 of 6
Table DI2: Distribution of Education hnance by Altematve Grant Design
EXPENDITURESTUDENT
CENTRAL MUNICIPALALTERNATIVE GOVERNMENT GOVERNMENT TOrAL
# 1 Maintain current student apitatin 67.2 9.3 76.5grant. ______
#2 ncreaws municipal wn-earmad 341.2 23.5 90.7revenues.
#3 Increase current sudent capitation. 82.0 8.7 90.7
14 Add a poverty-based grantL 82.0 8.9 90.9
#5 Add a poerty-based grant adjusted 82.4 8.8 91.2. by input prices.
#6 Add an achievement gain-based 83.5 6.5 90.0___ grant
#7 Add a perceage equaliing gant 80.9 9.1 90.0based on fiscal capacity.
#8 Add a percenagc equwizing grnt 80.9 19.7 100.6with a mandatory expenditur_ _ _ _ requinement. __I
1 9 Add a variable matching Irant. 80.2 10.7 90.9
Table D.3: Leverage of Central Goverment Fbance
EXPENDITUREICENTRAL GOVERNMENT FINANCEALTERNATIVE
_______________________ ~~~TOTAL MARGINAL
# 1 Maintain curent student capitation gran 1.14 N.A.
# 2 Increase municipal non-earmarked revenues. 0.21 0.05
# 3 lncrea aent student capition. 1.10 0.95
# 4 Add a pvery-baed gant 1.11 0.96
t 5 Add a poverty-based grand adjusted by input 1.10 0.96prices._ _____
# 6 Add an achievement gain4bsed grnt. 1.07 0.81
#7 Add a percentage equalzing grant based on 1.11 0.97fisl capacity.
# 8 Add a percentage equalizing grnt with a 1.24 1.76mandatory expendiur requirment.
19 Add a variable matching grnt 1.13 1.11
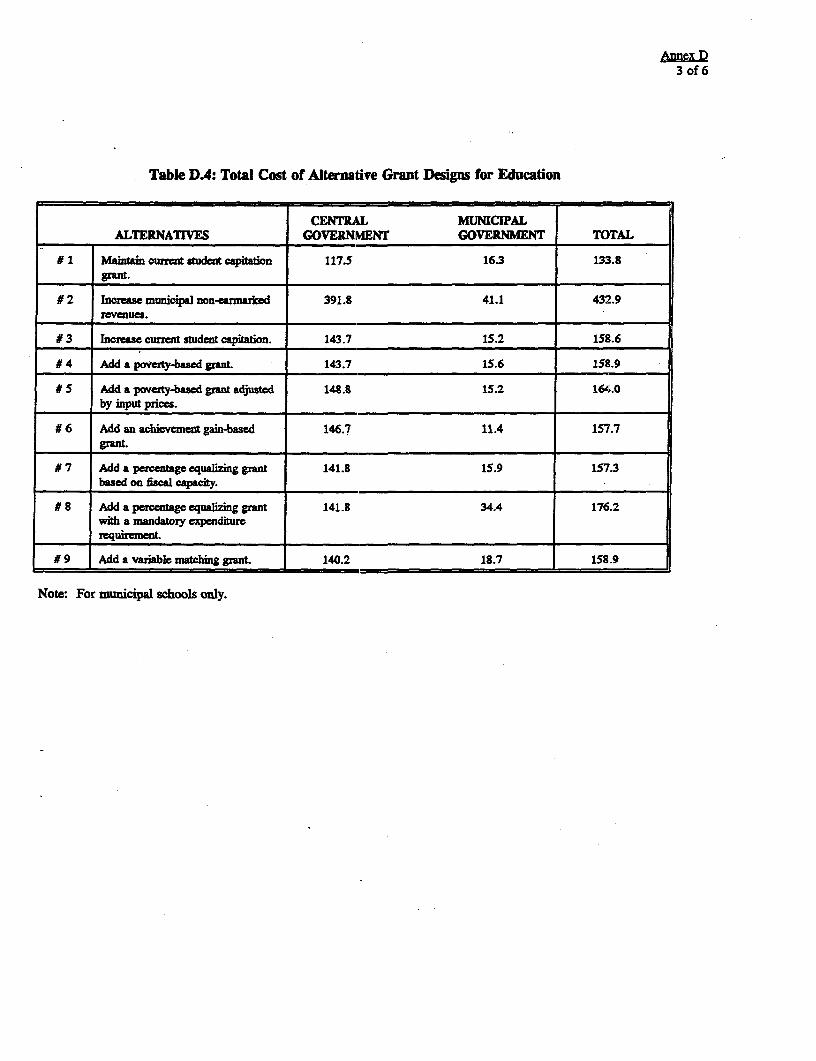
Annex D3 of 6
Table D.4: Total Cost of Alternative Grant Designs for Education
CENTRAL MUICIPALALTERNATIVES GOVERNMENT GOVERNMIENT TOTAL
# 1 Main cuncnt student capition 117.5 16.3 133.8grant.
#2 Incase municipal non-earmarked 391.8 41.1 432.9revenues.
#3 Incree current studen capitation. 143.7 15.2 15.6
#4 Add a povertyubased grant. 143.7 15.6 158.9
# S Add a poverty4based gmnt adjustd 148.8 15.2 164.0by input prices.
# 6 Add an achievement gain-based 146.7 11.4 157.7Wrant
# 7 Add a percentage equalizing grnt 141.8 15.9 157.3based on fiscal capacity. ._ _
# 8 Add a percentage equalizing grant 141.8 34.4 176.2with a mandatory expenditure
i_______ requirement.
| 9 Add a variable matching grant. 140.2 18.7 158.9
Note: For municipal schools only.

Table D.5: Effects of Alternative Grant Designs on Expenditure and Finance: Low vs. High Poverty Rates
MUNICIPALITIES WITH LOW MUNICIPALITIES WITH HIGHPOVERTY RATES POVERTY RATES
(BOTTOM DECILE) (TOP DECILE)
ALTERNATIVE Central Municipal Central Municipal (B)/(A)Government Govermnent (A) Government Govermment (B)
Finance Finance Total Finance Finance Total
If 1 Maintain current student capitation grant. 69.0 43.7 112.7 96.3 8.3 104.6 0.93
# 2 Increase municipal non-earmarked revenues. 69.0 87.3 155.7 96.3 16.7 113.0 0.73
# 3 Increase current student capitation. 84.0 40.7 124.7 111.4 7.7 119.1 0.96
# 4 Add a poverty-based grant. 72.6 43.4 116.0 127.8 7.4 135.2 1.17
#5 Add a poverty-based grant adjusted input 72.6 47.2 119.8 131.1 7.4 138.5 1.16prices. __ _ _
i6 Add an achievement gain-based grant. 84.6 26.0 110.6 113.3 6.2 119.5 1.08
Y7 Add a percentage equalizing grant based on 77.5 43.5 121.0 109.3 8.2 117.5 0.97fiscal capacity.
# 8 Add a percentage equalizing grant with a 77.5 53.0 130.5 109.3 17.6 126.9 0.97mandatory expenditure requirement.
#9 Add a variable matching grant. 84.8 45.9 130.7 108.1 9.8 117.9 0.90
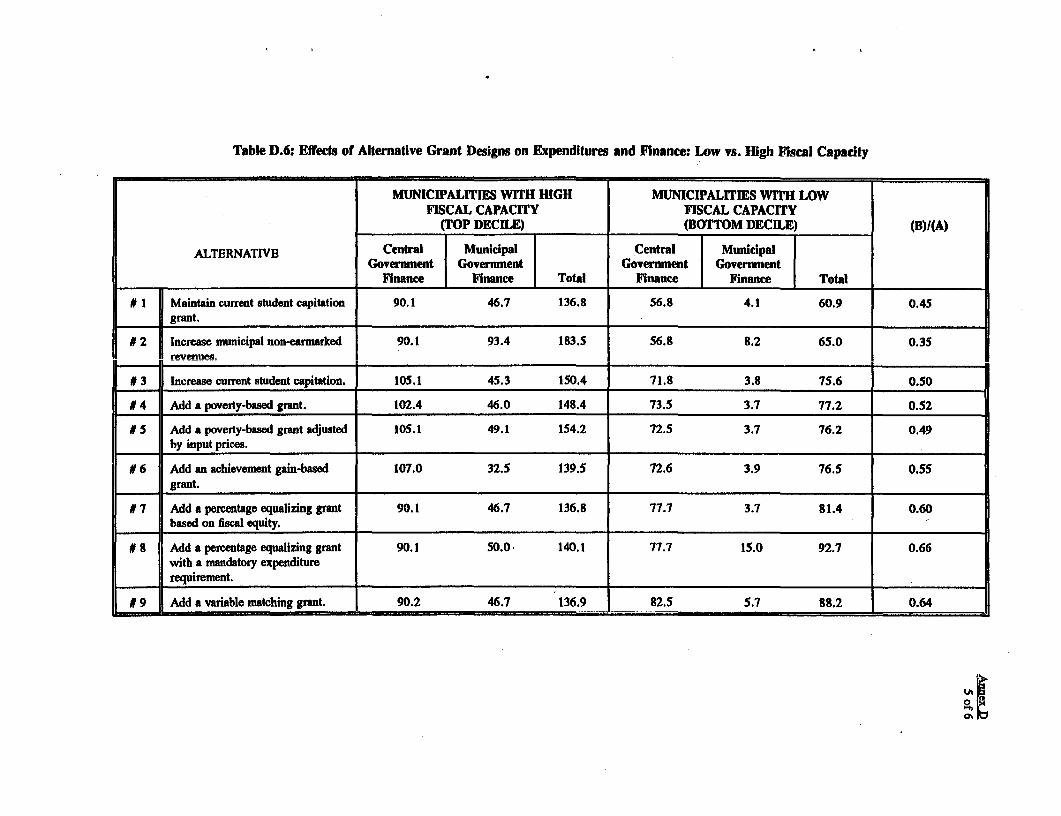
Table D.6: Effects of Alternative Grant Designs on Expenditures and Finance: Low vs. High Fiscal Capadty
MUNICIPALITEES WITH HIGH MUNICIPALITIES WITH LOWFISCAL CAPACITY FISCAL CAPACITY
(TOP DECILE) (BOTTOM DECILE) (B)/(A)
ALTERNATIVE Central Municipal Central MunicipalGovermnent Government Govermnent Governnent
Finance Finance Total Finance Finance Total
# I Maintain current student capitation 90.1 46.7 136.8 56.8 4.1 60.9 0.45grant.
# 2 Increase municipal non-earmarked 90.1 93.4 183.5 56.8 8.2 65.0 0.35revenues.
1 3 Increase current student capitation. 105.1 45.3 150.4 71.8 3.8 75.6 0.50
| 4 Add a poverty-based grant. 102.4 46.0 148.4 73.5 3.7 77.2 0.52
# S Add a poverty-based grant adjusted 105.1 49.1 154.2 72.5 3.7 76.2 0.49by input prices. _____
1 6 Add an achievement gain-based 107.0 32.5 139.5 72.6 3.9 76.5 0.55grant.
1 7 Add a percentage equalizing grant 90.1 46.7 136.8 77.7 3.7 81.4 0.60based on fiscal equity.
# 8 Add a percentage equalizing grant 90.1 50.0. 140.1 77.7 15.0 92.7 0.66with a mandatory expenditurerequirement.
# 9 Add a variable matching grant. 90.2 46.7 136.9 82.5 5.7 88.2 0.64
_ _ ._ .......... _ _ -wlrl..WR_i- - ----- 11 -~~~~~~~~~~~~~ -' ._ _ _ .._~~~0
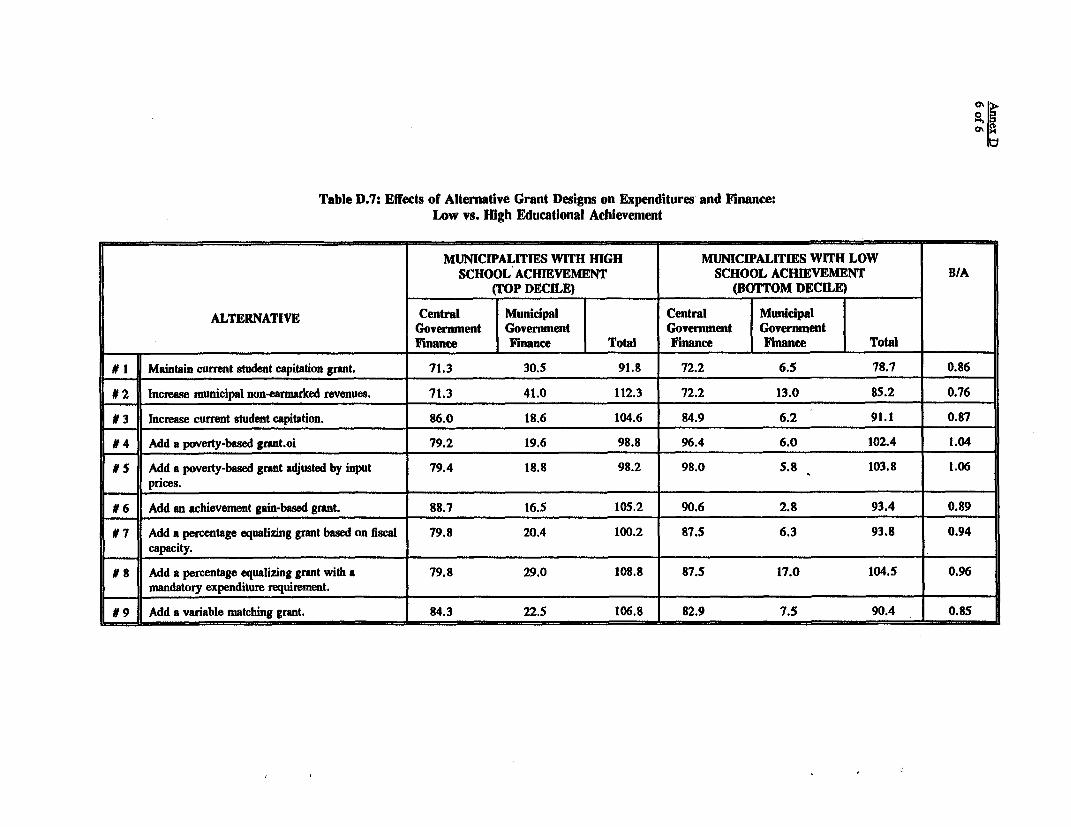
Table D.7: Effects of Alternative Grant Designs on Expenditures and Finance:Low vs. High Educational Achievement
MUNICIPALITIES WITH HIGH MUNICIPALITIES WITH LOWSCHOOL ACHIEVEMENT SCHOOL ACHIEVEMENT B/A
(TOP DECILE) (BOTTOM DECILE)
ALTERNATIVE Central Municipal Central MunicipalGovernment Govenmnent Government GovernmentFinance Finance Total Finance Finance Total
# I Maintain current student capitation grant. 71.3 30.5 91.8 72.2 6.5 78.7 0.86
#2 Increase municipal non-earmarked revenues. 71.3 41.0 112.3 72.2 13.0 85.2 0.76
# 3 Increase current student capitation. 86.0 18.6 104.6 84.9 6.2 91.1 0.87
# 4 Add a paverty-based grant.oi 79.2 19.6 98.8 96.4 6.0 102.4 1.04
# S Add a poverty-based grant adjusted by input 79.4 18.8 98.2 98.0 5.8 103.8 1.06prices. _
t 6 Add an achievement gain-based grant. 88.7 16.5 105.2 90.6 2.8 93.4 0.89
t 7 Add a percentage equalizing grant based on fiscal 79.8 20.4 100.2 87.5 6.3 93.8 0.94capacity.
t 8 Add a percentage equalizing grant with a 79.8 29.0 108.8 87.5 17.0 104.5 0.96mandatory expenditure requirement.
# 9 Add a variable matching grant. 84.3 22.5 106.8 82.9 7.5 90.4 0.85= .-

Table E.l: Alternative Grant Designs for Health Transfers to Municipalities
ALTERNATIVES | DESCRIPTION FORMULA
# 1 Maintain existing cost Cost-reimbursement to municipalities onreimbursement plan. the basis of MOH fee schedule and a, = E [PjSi]
number of services delivered.
# 2 Substitute a formula grant per Size of grant varies with derminants ofcapita. use (poverty and dependency rates). 0, = (FAPEM) [.5 (POV, /POV) + .5 (DEP, /DEP)]
# 3a Substitute a formula grant per Size of grant varies with determinants 0, = (FAPEM) [ .S (POV, /POV) + .5 (DEP, /DEP) ]capita adjusted for input prices of use and cost (zone classification).maintenance of effect (MOE) (C, /C) (SAL/EXP) + (I-SAL/lXP)]required.
# 3b Same as # 3a but munimum Size of grant varies with determinantsexpenditure madate replaces of use and cost (zone classification). Same as # 3a;: [0, + MHJ > 2.07MOIR
#4 Substitute a percentage Size of grant varies inversely with G- (FAPEM) [I-.0o(NER, /NER)Iequalizing grant based on relative fiscal capacity.fiscal capacity.
S 5a Substitute a closed-ended Size of grant varies inversely with -} = MH, [I/MI; ,1> 0;variable matching grant. relative fiscal capacity and directly with /
municipal health expenditures. Ml - [.25(NER, /NER)/ [1l-.2S(NER /NER)]# 5b Substitute a closed-ended Size of grant varies inversely with
variable nmtching grant; relative fiscal. capacity and directly with Same as # 5a; [GI + MHJ > 2.07niinimum expenditure municipal health expenditures.mandated.
WHERE:
C, = Cost of living adjustment to wages as defined by Public Law 450.DEP, = Persons aged 04 and over 60 as ratio of population of municipality i.Gi = Central Government healty grant per capita or benefioiary to municipality.PAPEMi = (PAPEM/POP), Initial average Central Government transfers per beneficiary under current program.MAL, = Malnutrition rate of municipality i.NER1 = Non-earmarked revenue per capita of municipality i.Pi = Ministry of Health reimbursement rate for service j.MH, = Municipal health finance per capita in municipality i.POV, = Poveity rate of municipality i.SAL/EXP = National average ratio of salaries and wages to total health expcnditures. t, li
s;; = Quantity of service j provided by municipality i.

Annex E2 of 5
Table E.2: Distribution of Health Finance by Alternative Grant Design
EXPENDITUREIBENEFICIARY
CENTRAL TOTALALTERNATIVE MUNICIPAL
GOVERNMENT GOVERNMENT
# 1 Maintain current existing cost 1.57 0.50 2.07 1.32reimbursement plan.
#2 Substitute a formula grant per 1.53 N.A. 90.7 N.A.capita.
# 3a Substitue a formula grant per 1.58 0.93 90.7 1.29capita adjusted for input prices;MOE required.
# 3b Substitue a formula grant per 1.58 0.93 90.9 1.56capita adjusted for input prices;minimum expenditure
#4 Substitute a percentage 1.55 N.A. N.A. 1.55equalizing grant based on fiscalcapacity.
# Sa Substiute a close ended variable 1.53 0.45 1.98 1.29matching grant.
# Sb Substitute a close-ended 1.76 0.91 2.67 1.52variable matching grant;minimum expendituremandated.
Note: Calculations based on all Chilean municipalities; simulation of alternative #5 assumes a price elasticity of -0.5

Table E.3: Effects of Alternative Grant Design on Expenditure and Flnance:Low vs. High Poverty
MUNICIPALITIES WITH LOW MUNICIPALITIES WITH HIGHPOVERTY RATES POVERTY RATES
(BOTTOM DECILE) (TOP DECILE)
ALTERNATIVE Central Munidpal Central MunidpalGovenunent Govenment (A) Govermment Goverunent (B)Finance Finance Total Finance Finance Total
I 1 Maintain existing cost reimbursement 1.52 1.09 2.61 2.00 0.36 2.36_plan. __
#2 Suostitute a formuia grant per capita. 0.78 N.A. N.A. 3.07 N.A. N.A.
# 3a Substitute a formila grant per captaadjusted for input prices; MOB 0.82 1.09 1.91 3.41 0.36 3.77required. _
N 3b Substitute a formula grant per capitaadjusted for input prices; minimum 0.82 1.31 2.13 3.41 0.24 3.65expenditure mandated.
#4 Substitute a percentage equalizing 1.08 N.A. N.A. 1.43 N.A. N.A.grant based on fiscal capacity.
# 5a Substitute a close-ended variable 1.14 0.51 1.65 1.32 0.41 1.73matching grant.
# Sb Substitute a close-ended variablematching grant; minimum expenditure 1.33 1.11 2.44 1.52 1.05 2.57mandated.
>F

Table E.4: Effects of Alternative Grant Design on Expenditures and Finance: tflLow vs. High Flscal Capacity
MUNICIPALITIES WITH HIGH MUNICIPALITIES WITH LOWFISCAL CAPACITY FISCAL CAPACITY(BOTTOM DECILE) (TOP DECILE)
ALTERNATIVE Central Municipal Central MunicipalGovernment Govermnent Government GovermnentFinance Finance Total Finance Finance Total
# 1 Maintain existing cost 3.79 1.84 5.63 0.94 0.22 1.16reimbursement plan.
# 2 Substitute a formula grant per 3.11 N.A. N.A. 0.99 N.A. N.A._ capita.
# 3a Substitute a formula grant percapita adjusted for input prices; 3.70 1.84 5.54 0.94 0.22 1.16
| MOB required.
# 3b Substitute a formula grant percapita adjusted for input prices; 3.70 0.54 4.24 0.94 1.18 2.12minimum expenditure mandated.
# 4 Substitute a percentage equalizinggrant based on fiscal capacity. 0.02 N.A. N.A. 2.03 N.A. N.A.
5 5a Substitute a close-ended variable 0.17 0.45 0.62 2.07 0.32 2.39matching grant.
# Sb Substitute a close-ended variablematching grant; minimum 0.17 1.90 2.07 2.07 0.69 2.76expenditure mandated.

Table E.S: Effects of Alternative Grant Design on Expenditures and Finance:Low vs. High Biological/Physiological Health Need
MUNICIPALITIES WITH HIGH MUNICIPALITIES WITH LOWINFANT MORTALITY INFANT MORTALITY(BOTTOM DECILE) (TOP DECILE)
ALTERNATIVE Central Municipal Central MunicipalGovermnent Government Goverunent GovernmentFinance Finance Total Finance Finance Total
I 1 Maintain existing cost 1.71 0.39 2.10 1.57 0.44 2.01reimbursement plan.
II 2 S-ubs.inba fGss-a1hgrau 01. N.A. N.A .1.60 W.A. A
capita.
# 3a Substitute a formula grant percapitation registered for input 1.82 0.39 2.21 1.55 0.44 1.99prices.
# 3b Substitute a formula grant percapitation registered for input 1.82 0.62 2.44 1.55 0.88 2.43pn_es.
#4 Substitute a perentage equalizinggrnt based on fiscal capacity. 1.54 N.A. N.A. 1.69 N.A. N.A.
# Sa Substitute a close-ended variable 1.51 0.49 2.00 2.30 0.58 2.88matching grant.
S 5b Substitute a close-ended variablematching grant; minimum 1.75 0.93 2.68 2.63 0.63 3.26expenditure mandated.
... .

Annex F1 of 1
Table F.1: Distribution of Rural RIBoad Grants by Alternative Measures of Need
Measure of Need
Totd kilometers of Total kilmeters of Total kibmeters ofAlternative Grant Designs road in tle monicipal road in the municipal dirt road in
dqetmet per department per capita the department percapia (N) capita (N,)
_______________ Higgh Law m Low High T L
1. Existing total cost- 102.6 90.3 107.2 73.7 72.1 74.7sharing project grants _
2. Existing cc 16.1 11.2 16.2 9.5 13.5 9.3grants _
3. Existing con 86.5 9.1 909 64.2 58.6 65.4and rehabilitation grants __.5__ 90,9 .2_8_64
4. Formula grant based on N.A. N.A. 150.1 33.9 N.A. N.A.
5. Formula grant formaintenance based on N.A. N.A. 21.2 4.8 N.A. N.A.N2
6. Formula grnt forconstruction and N.A. N.A. N.A. N.A. 160.0 9.8rehabitabon based onN= _I

No. 20: Getting Beyond the "National Institute Mdodel" for Agricultural Research in Latin America:A Cross-Country Study of Brazil, Chile, Colombia and Mexico, LATAG, August 1992.
No. 21: From Platitudes to Practice: Targeting Social Programs in Latin America, LATHR, September1992.
No. 22: State-Owned Monopolies: Horizontal and Vertical Restructuring and Private Sector Access Issues,LATAD, March 1993 (Revised).
No. 23: Housing Delivery System and the Urban Poor: A Comparison Among Six Latin AmericanCountries, LATIE, December 1992.
No. 24: Gaining Momentum: Economywide and Agricultural Reform in Latin America, LATAG,Forthcoming.
No. 25: Trade Facilitation and Transport Reform, LATIE, September 1992.
No. 26: Coastal Zone Management: Cases Studies from the Caribbean, LATEN, December 1992.
No. 27: Poverty and Income Distribution in Latin America: The Story of the 1980s, LATHR, December1992.
No. 28: Improving the Quality of Primary Education in Latin America: Towards the 21st Century,LATAD, May, 1993.
Ai

Other Reports in the Series
No. 1: World Bank Strategy for the Natural Gas Sector in LAC, LATIE, March 1991
No. 2: Women in Development: Issues for the Latin American and Caribbean Region, LATHR,April 1991
No. 3: Easing the Poor Through Economic Crisis and Adjustment: The Story of Bolivia's EmergencySocial Fund, LATHR, May 1991
No. 4: Direct Credit for Privatized Firms, LATTP, June 1991
No. 5: Decentralization to Local Government in LAC: National Strategies and Local Response inPlanning, Spending and Management, LATTE, July 1991
No. 6: Mexico Labor Retraining Program: Poverty Alleviation and Contribution to Growth,LATHR, August 1991
No. 7: The Evolution, Situation, and Prospects of the Electric Power Sector in the Latin American andCaribbean Countries, LATIE, August 1991
No. 8: Choice of Nutritional Status Indicators for Young Children in Public Health Programs, SeptemberLATHR, 1991
No. 9: Developing Educational Assessment Systems in Latin America, LATHR, September 1991
No. 10: Women's Employment & Pay in Latin America, LATHR, October 1991Part I: Overview and Methodology; Part II: Country Case Studies
No. 1I: Feeding Latin America's Children: An Analytical Survey of Food Programs, LATHR,November 1991.
No. 12: Incentive Structure & Resolution of Financial Institution Distress: Latin American Experience,LATTP, November 1991.
No. 13: Tax Administration in Latin America, LATPS, January 1992.
No. 14: Public Policies and Deforestation: A Case Study of Costa Rica, LATEN, February 1992
No. 15: Auctioning Credit: Vol. 1: Conceptual Issues; Vol. II: The Case of Chile;Vol. III: The Case of Bolivia, LATTP, January 1992.
No. 16: Economic Policies and Performance under Alternative Trade Regimes: Latin America During the -80s, LATTP, April 1992.
No. 17: Infrastructure Maintenance in LAC: The Costs of Neglect and Options for Improvement, Volumes1-5, LATIE, June 1992.
No. 18: Private Financing of Higher Education in Latin America and the Caribbean, LATHR, July 1992.
No. 19: Protecting Amerindian Lands: A Review of World Bank Experience with Indigenous LandRegularization Programs in Lowland South America, LATEN, July 1992.