
I lllllIl ItlIIlII lIIl 94 4 28 070 - Defense Technical Information ...
233
Report No. CG-D-02-94 AD-A278 796 EVALUATION OF SYNTHETIC APERTURE RADAR FOR OIL-SPILL RESPONSE G. L HOVER U.S. Coast Guard Research and Development Center 1082 Shennecossttn Road, Groton, Connecticut 06340-6096 AND G. A. MASTIN, R. M. AXUNE, and J. D. BRADLEY . DTIC Abuquerque, New Mexico 8718540643 S4LECTE B FINAL REPORT OCTOBER 1993 -0101 This document is available to the U.S. public through the National Technical Information Service, Springfield, Virginia 22161. F * Prepared for: (94- 12950 U.S. Department of Transportation I lllllIl ItlIIlII lIIl United States Coast Guard Office of Engineering, Logistics, and Development Washington, D. C. 20593-0001 94 4 28 070
-
Upload
khangminh22 -
Category
Documents
-
view
0 -
download
0
Transcript of I lllllIl ItlIIlII lIIl 94 4 28 070 - Defense Technical Information ...

Report No. CG-D-02-94 AD-A278 796
EVALUATION OF SYNTHETIC APERTURE RADAR FOROIL-SPILL RESPONSE
G. L HOVERU.S. Coast Guard Research and Development Center
1082 Shennecossttn Road, Groton, Connecticut 06340-6096
AND
G. A. MASTIN, R. M. AXUNE, and J. D. BRADLEY . DTICAbuquerque, New Mexico 8718540643 S4LECTE B
FINAL REPORT
OCTOBER 1993 -0101
This document is available to the U.S. public through theNational Technical Information Service, Springfield, Virginia 22161.
F
* Prepared for: (94- 12950
U.S. Department of Transportation I lllllIl ItlIIlII lIIlUnited States Coast GuardOffice of Engineering, Logistics, and DevelopmentWashington, D. C. 20593-0001
94 4 28 070

NOTICEThis document is disseminated under the sponsorship of theDepartment of Transportation in the interest of informationexchange. The United States Government assumes no liabilityfor its contents or use thereof.
The United States Government does not endorse products ormanufacturers. Trade or manufactuers' names appear hereinsolely because they are considered essential to the object ofthis report.
The contents of this report reflect the views of the Coast GuardResearch & Development Center. This report does not consti-tute a standard, specification, or regulation.
SD. L. Motherway
Technical Director, A:United States Coast GuardResearch & Development Center1082 Shennecossett Road"Groton, CT 06340-6096
iiS

DISCLAIMER NOTICE
THIS DOCUMENT IS BEST
QUALITY AVAILABLE. THE COPY
FURNISHED TO DTIC CONTAINED
A SIGNIFICANT NUMBER OF
PAGES WHICH DO NOT
REPRODUCE LEGIBLY.

Technical Report Documentation Page1. Report No. 2. Government Accession No. 3. Recipient's Catalog No.
CG-D-02-94 I4. Title and Subtitle 5. Report Dale
October 1993Evaluation of Synthetic Apertre Radar for Oil-Spill Response. 6. Performing Organization Code
8. Performing Organization Report No.7. Author(s) R&DC 27/93
G. Hover, G. Mastin, R. Axline, J. Bradley9. Performing Organization Name and Address t0. Work Unit No. (TRAIS)
USCG Research and Development Center Sandia National Laboratories1082 Shennecosseu Road P.0. Box 5800 11. Contract or Grant No.Groton, CT 06340-6096 Albuquerque, NM 87185 MIPR Z51100-2-E00467
12. Sponsoring Agency Name and Address 13. Type of Report and Period Covered
Department of Transportation Final Repo1tU.S. Coast Guard June 1992- Sept.1993Office of Engineering, Logistics, and Development 14. Sponsoring Agency CodeWashington, D.C. 20593-0001
15. Supplementary Notes
16. Abstract
"This report provides a detailed evaluation of synthetic aperture radar (SAR) as a potential technology improvementover the Coast Guard's existing side-looking airborne radar (SLAR) for oil-spill surveillance applications. The U. S.Coast Guard Research and Development Center (R&D Center), Environmental Safety Branch, sponsored a jointexperiment including the U. S. Coast Guard, Sandia National Laboratories, and the National Oceanographic andAtmospheric Administration (NOAA), Hazardous Materials Division. Radar imaging missions were flown on six daysover the coastal waters off Santa Barbara, CA, where there are constant natural seeps of oil. Both the Coast Guard SLARand the Sandia National Laboratories SAR were employed to acquire simultaneous images of oil slicks and other naturalsea surface features that impact oil-spill interpretation. Surface truth and other environmental data were also recordedduring the experiment. The experiment data were processed at Sandia National Laboratories and delivered to the R&DCenter on a PC-based computer workstation for analysis by experiment participants.
Upon completion of the experiment, the potential utility of SAR as a replacement for SLAR in Coast Guard oil-spillapplications was assessed during two data analysis workshops held at the R&D Center. Workshop participants includedU. S. Coast Guard operational personnel and research staff, a NOAA Hazardous Materials Division scientist, and severalSandia radar and image processing experts. SAR and SLAR experiment data were evaluated to determine key parametersand capabilities. Finally, a cost-benefit analysis between the existing Coast Guard SLAR and a conceptual SAR designtailored to Coast Guard requirements was performed.
17. Key Words 18. Distribution Statement
Synthetic Aperture Radar, Side Looking Airborne Radar, Document is available to the public through the NationalOil Slicks Technical Information Service, Springfield, VA 22161
19. Security Classit. (of this report) 20. SECURITY CLASSIF. (of this page) 21. No. of Pages 22. Price
UNCLASSIFIED UNCLASSIFIED
Form DOT F 1700.7 (8/72) Reprodction of form and completed page s authorized.
iii

00 §0' §
Sa
O*w a a .
- M
o 0>- -i CO >~~
0c-0 0-O it05-
0 1.-
0 0
C) CII( 0
a at 8t 7 6 5 4 3 2 mtm
C.0 le 6 ~EU
0 Ci, 71 6, 5 132 nhs
0l m a )!t
.2 6L J9; EE~ Ea .42= = c0
0 wC uoo 2qt *- VW =5.,
Z M0-M60 - 0c aci ii to 0 0 0 ) 0--
00
> Mb- IL U
0 0
0
oo UN
0. 0
iv

TABLE OF CONTENTS
EVALUATION OF SYNTHETIC APERTURE RADAR FOR OIL-SPILL RESPONSELIST OF FIGURES .......................................................... viiiLIST OF TABLES ............................................................. xEXECUTIVE SUMMARY ................................................... EX-1
INTRODUCTION .............................................. EX -1Background .............................................. EX -1Approach ................................................ EX -1
RESULTS AND CONCLUSIONS .................................. EX-IImage Analysis Results ..................................... EX- 1Parameters for a Conceptual Coast Guard SAR .................. EX-2Cost vs. Benefit of SAR .................................... EX -3
RECOMMENDATIONS ......................................... EX-3ACKNOWLEDGEMENTS ....................................... EX-5
CHAPTER 1INTRODUCTION
1.1 PROJECT BACKGROUND ....................................... 1-11.2 PROJECT SCOPE AND OBJECTIVES .............................. 1-11.3 TECHNICAL BACKGROUND ..................................... 1-2
1.3.1 Ocean Dynamics and Effects of Oil ............................ 1-21.3.2 Electromagnetic Scattering from Ocean Waves .................. 1-21.3.3 Sensor Descriptions (SAR/SLAR) ............................. 1-3
1.3.3.1 The AN/APS-131 SLAR ............................... 1-31.3.3.2 The SNL SAR ....................................... 1-5
1.4 EXPERIMENT DESCRIPTION .................................... 1-71.4.1 Participants ............................................... 1-7
1.4.1.1 Control ............................................ 1-71.4.1.2 Twin Otter SAR ..................................... 1-91.4.1.3 AIREYE ........................................... 1-91.4.1.4 Surface Truthing ..................................... 1-9
1.4.2 Summary of Field Test Operations ............................ 1-151.4.3 Summary of Data Collected ................................. 1-17
1.5 ANALYSIS TOOLS AND IMAGE DATA ........................... 1-171.5.1 Image Data Sets .......................................... 1-181.5.2 W orkstation .............................................. 1-231.5.3 Image Manipulation and Processing Software ................... 1-23
1.5.3.1 SNL-Provided Software .............................. 1-231.5.3.2 Commercial Software ................................ 1-28
1.6 DESCRIPTION OF IMAGE ANALYSIS ACTIVITIES ................. 1-291.6.1 Measures of Effectiveness Definition .......................... 1-291.6.2 ROI Selection and Analysis of Image Processing Methods ......... 1-30 01.6.3 Analysis of Required Image Resolutions ....................... 1-34
1.6.3.1 Evaluation of Methods for Simulating DegradedImage Resolutions ................................... 1-34 -
Ava-le 11blt"
bil %"%I
A i

1.6.3.2 Method for evaluating Full-Swath ImageResolution Requirements ............................. 1-49
1.6.3.3 Method for Evaluating Maximum SystemResolution Requirements ............................. 1-49
1.7 DESCRIPTION OF SAR PARAMETERS ANALYSIS ACTIVITIES ..... 1-501.7.1 Development of Requirements ............................... 1-501.7.2 Calculations and System Specifications ........................ 1-501.7.3 Trade-off Studies ......................................... 1-501.7.4 SAR Capabilities Survey ................................... 1-50
CHAPTER 2EVALUATION RESULTS
2.1 INTRODUCTION ............................................... 2-12.2 IMAGE DATABASE ............................................. 2-12.3 IMAGE ANALYSIS RESULTS .................................... 2-1
2.3.1 Results of Speckle Smoothing Evaluation ....................... 2-42.3.2 Results of SAR Resolution Study ............................. 2-33
2.3.2.1 Single-look vs. Multi-look Processing ................... 2-332.3.2.2 Maximum System Resolution Requirement ............... 2-342.3.2.3 Other Resolution Issues .............................. 2-342.3.2.4 Full-Swath Image Resolution Requirements .............. 2-45
2.4 SAR vs. SLAR: DISCUSSION OF TECHNICAL ISSUES .............. 2-452.4.1 Attributes That Need Not Be Used in the Comparison ............. 2-452.4.2 Attributes for Which SAR and SLAR Differ Significantly ......... 2-51
2.5 SAR PARAMETERS ANALYSIS RESULTS ........................ 2-552.5.1 Development of Requirements ............................... 2-552.5.2 Calculations and System Specifications ........................ 2-56
2.5.2.1 General Description of Recommended Design ............. 2-572.5.2.2 System Specifications ................................ 2-582.5.2.3 System Block Diagrams and Related Discussion ........... 2-63
2.5.3 Trade-Off Studies ......................................... 2-742.5.3.1 Squinted Operation Versus Antenna Steering ............. 2-742.5.3.2 Number of Bits Per Image Pixel ........................ 2-742.5.3.3 Slant-Range Resolution .............................. 2-752.5.3.4 Azimuth Resolution ................................. 2-752.5.3.5 Minimum ao of Noise Required ....................... 2-752.5.3.6 Choice of Operating Frequency ........................ 2-752.5.3.7 Multi-look Processing ................................ 2-762.5.3.8 Image-Formation Algorithm/Signal-Processing Approach ... 2-762.5.3.9 Pulse-Compression Issues ............................. 2-77
2.5.4 SAR Capabilities Survey Results ............................. 2-782.5.4.1 Listing of Responding Vendors ........................ 2-782.5.4.2 Overview of Vendor-Supplied Materials ................. 2-802.5.4.3 Summary of System Functional
Performance Characteristics ........................... 2-812.5.4.4 Interpretation of Data Provided on SAR Systems.......... 2-85
vi

2.6 DISCUSSION OF COST VS. BENEFIT OF SAR ..................... 2-872.6.1 Image Quality Benefits, SAR vs. SLAR ........................ 2-872.6.2 Identified Technical Benefits of SAR ......................... 2-1012.6.3 Rough Estimates of Coast Guard SAR Size, Power, and Cost ...... 2-1112.6.4 Discussion of Other Identified Costs of SAR ................... 2-114
CHAPTER 3CONCLUSIONS AND RECOMMENDATIONS
3.1 CONCLUSIONS ................................................. 3-13.1.1 Benefits and Cost Effectiveness Offered by SAR and SLAR ........ 3-23.1.2 Critical SAR Parameters ..................................... 3-23.1.3 Benefits of Image Processing Techniques ....................... 3-43.1.4 Comments on "Off-the-Shelf' SAR Technology .................. 3-5
3.1.4.1 New SAR Design .................................... 3-53.1.4.2 Existing SARs ....................................... 3-5
3.2 RECOMMENDATIONS .......................................... 3-53.2.1 If SAR, W hat SAR ......................................... 3-5
3.2.1.1 New SAR Design .................................... 3-53.2.1.2 Modification of an Existing SAR ........................ 3-6
3.2.2 Image Presentation, Manipulation, and Exploitation Algorithms ..... 3-73.2.3 Recommended Follow-On SAR Testing ........................ 3-8
REFERENCES .............................................................. R- 1APPENDIX ASLAR SENSITIVITY ......................................................... A-IAPPENDIX BSAR CONCEPTUAL REQUIREMENTS ......................................... B-1APPENDIX CSAR INFORMATION SURVEY ................................................ C-1APPENDIX DSAR DESIGN CALCULATIONS ............................................... D-1APPENDIX EMOVING-TARGET-INDICATOR MODE ........................................ E-1APPENDIX FREAL APERTURE RADAR MODE ............................................. F-IAPPENDIX GADDITIONAL SAR DESIGN CALCULATIONS .................................. G-1APPENDIX HINTERIM RESPONSE ........................................................ H-1APPENDIX IREGION-OF-INTEREST INFORMATION ........................................ I-1
vii

LIST OF FIGURES
Figure 1-1 The SLAR imaging process ......................................... 1-4Figure 1-2 The SAR imaging process .......................................... 1-6Figure 1-3 Multi-look imaging process ......................................... 1-8Figure 1-4 Photograph of the DOE DeHavilland DHC-6 Twin Otter aircraft. ......... 1-11Figure 1-5 Photograph of the Coast Guard Dassault-Breguet Falcon 20 jet aircraft ..... 1-13Figure 1-6 The experimental test areas ........................................ 1-16Figure 1-7 A 4-pass mosaic, downsampled by a factor of 5 for display .............. 1-21Figure 1-8 Coast Guard SAR image viewing station ............................. 1-24Figure 1-9 Relationship between the key image and region-of-interest (ROI) image .... 1-26Figure 1-10 SAR data processing flow for images selected for analysis ............... 1-27Figure 1-11 Schematic for sliding window averaging ............................. 1-32Figure 1-12 The subsampling process ......................................... 1-35Figure 1-13 Full-resolution ROI. Each pixel represents 2 m ......................... 1-37Figure 1-14 ROI downsampled to 10-m pixel resolution by
phase history interpolation ......................................... 1-39Figure 1-15 ROI subsampled to 10-m pixel resolution to simulate
phase history downsampling ....................................... 1-41Figure 1-16 Schematic for adjacent window averaging ("boxcar" filtering) ............ 1-44Figure 1-17 Multi-look version of the ROI, downsampled in the phase
history domain before noncoherent averaging to 20-m pixel resolution ...... 1-45Figure 1-18 Simulated multi-look image of ROI at 20-m pixel resolution .............. 1-47Figure 1-19 Flow of SAR Parameters Analysis Activities .......................... 1-51Figure 2-1 Photograph of oil entrained in the current off of Coal Oil Point,
during a Nov. 15, 1992, SAR imaging pass ............................ 2-5Figure 2-2 Small photomosaic created from several KS-87 frames captured
by the AIREYE off of Coal Oil Point, on Nov. 15, 1992 .................. 2-7Figure 2-3 2-m pixel resolution SAR region-of-interest (ROI) image off of
Coal Oil Point, captured by the SNL SAR on Nov. 15, 1992 ............... 2-9Figure 2-4 SLAR ROI just off of Coal Oil Point, captured by the AIREYE
SLAR on Nov. 15, 1992 .......................................... 2-11Figure 2-5 Oil slick extending from below the Holly platform diagonally
toward Coal Oil Point, Nov. 14, 1992 ............................... 2-13Figure 2-6 SAR image of oil slick seen in Figure 2-5 ............................ 2-15Figure 2-7 SLAR image of oil slick seen in Figure 2-5 .......................... 2-17Figuer 2-8 Photograph captured from the SNL Twin Otter on
Nov. 15, 1992, showing an oil slick just east of the Holly platformand just south of Naples, CA ...................................... 2-19
Figure 2-9 SAR mosaic of oil slick seen in Figure 2-8, but imaged 30 min.after the photograph .............................................. 2-21
Figure 2-10 Full-resolution ROI from the Nov. 12, 1992, south-looking data set. ....... 2-25Figure 2-11 Result of 5 x 5 sliding window average on original ROI ................. 2-27Figure 2-12 Result of 5 x 5 sliding window median on original ROI ................. 2-29
viii

Figure 2-13 Result of 3 iterations of the Crimmins morphological filteron original ROI ................................................. 2-31
Figure 2-14 Single-look ROI at full resolution (2-m pixels) ......................... 2-35Figure 2-15 Simulated 10-m pixel resolution multi-look ROI created from
the image in Figure 2-14 .......................................... 2-37Figure 2-16 Simulated 14-m pixel resolution multi-look ROI created from
the image in Figure 2-14 .......................................... 2-39Figure 2-17 Simulated 20-m pixel resolution multi-look ROI created from
the image in Figure 2-14 .......................................... 2-41Figure 2-18 Example of a SAR image where the antenna is looking across
the wave crests (up-wind or down-wind) ............................. 2-43Figure 2-19 Example of 20-m and 40-m full-swath display images from
the Nov. 12, 1992, data set. ........................................ 2-47Figure 2-20 Example of 20-m and 40-m full-swath display image from
the Nov. 15, 1992, data set. ........................................ 2-49Figure 2-21 High-level block diagram of the SAR system .......................... 2-64Figure 2-22 Block diagram of the SAR rf front-end assembly ....................... 2-66Figure 2-23 Block diagram of the phase history collector .......................... 2-67Figure 2-24 Recommended parallel processing architecture for the image former ....... 2-70Figure 2-25 Data recorder assembly ........................................... 2-71Figure 2-26 Image buffer for holding full-resolution images for ROI extraction
and operational display of downsampled, full-swath images .............. 2-72Figure 2-27 Full-swath SAR image from the Nov. 12, 1992, experiment .............. 2-89Figure 2-28 ROI extracted from the full-swath SAR image ......................... 2-91Figure 2-29 Wide-swath SLAR image from the Nov. 12, 1992, experiment. ........... 2-93Figure 2-30 ROI extracted from the wide-swath SLAR image ...................... 2-95Figure 2-31 Full-swath SAR image from the Nov. 12, 1992, experiment .............. 2-97Figure 2-32 ROI extracted from the full-swath SAR image ......................... 2-99Figure 2-33 Wide-swath SLAR image from the Nov. 12, 1992, experiment. .......... 2-103Figure 2-34 ROI extracted from the wide-swath SLAR image ..................... 2-105Figure 2-35 South-looking SLAR image from Nov. 12, 1992 ...................... 2-107Figure 2-36 West-looking SLAR image from Nov. 12, 1992 ...................... 2-109
ix

LIST OF TABLES
Table 2-1 SAR Data Summary .............................................. 2-2
Table 2-2 SLAR Data Summary ............................................. 2-3
Table 2-3 SAR System Specifications ....................................... 2-59
Table 2-4 Functional Performance Characteristics .............................. 2-82
Table 2-5 Rough Estimates for New Coast Guard SAR ......................... 2-112
Table 3-1 Advantages and Disadvantages of SAR and SLAR ...................... 3-3
Table I- 1 Regions-of-Interest ................................................ 1-2

EXECUTIVE SUMMARY
INTRODUCTION
BacgrondThis report provides a detailed evaluation of synthetic aperture radar (SAR) as a potential
technological improvement over the Coast Guard's existing side-looking airborne radar (SLAR)for oil-spill surveillance applications. The U. S. Coast Guard Rtsearch and Development Center(R&D Center), Environmental Safety Branch, sponsored a joint experiment including the U. S.Coast Guard, Sandia National Laboratories, and the National Oceanographic and AtmosphericAdministration (NOAA), Hazardous Materials Division. Radar imaging missions were flown onsix days over the coastal waters off Santa Barbara, CA, where there are constant natural seeps ofoil. Both the Coast Guard SLAR and the Sandia National Laboratories SAR were employed toacquire simultaneous images of oil slicks and other natural sea surface features that impact oil-spill interpretation. Surface truth and other environmental data were also recorded during theexperiment. The experiment data were processed at Sandia National Laboratories and delivered tothe R&D Center on a PC-based computer workstation for analysis by experiment participants.
Upon completion of the experiment, the potential utility of SAR as a replacement for SLARin Coast Guard oil-spill applications was assessed during two data analysis workshops held at theR&D Center. Workshop participants included U. S. Coast Guard operational personnel andresearch staff, a NOAA Hazardous Materials Division scientist, and several Sandia radar andimage processing experts. The methods of evaluation provided a systematic framework forevaluating SAR experiment data to determine key parameters and capabilities. These included:
1. The optimal resolution for oil-spill image analysis.2. The feasibility of locating oil-slick boundaries.3. Sensitivities to environmental conditions and oil slick thickness.4. Radar design parameters that impact Coast Guard applications.
Furthermore, the methods of evaluation provided a framework for assessing cost/benefittrade-offs between the existing Coast Guard SLAR and a conceptual SAR whose design istailored to U.S. Coast Guard oil spill surveillance requirements. The cost effectiveness of such asystem was evaluated by considering the availability and applicability of commercial systems orcomponents; size, power, and weight constraints; operational requirements, and the expectedquality and utility of the image products. This was a concept feasibility study. No attempt wasmade to identify a final point design, a specific manufacturer, or detailed costs for integrating aspecific system into the existing Coast Guard HU-25B aircraft.
RESULTS AND CONCLUSIONS
Image Analysis Results
Participants in the two data analysis workshops identified an optimal spatial resolution foroil-spill image interpretation and recommended a specific method for acquiring, cueing, andanalyzing SAR images in an operational scenario. The optimal spatial resolution for detailed
EX-1

image analysis is 10 m (pixel spacing and impulse response width). This resolution is coarser thanthe resolution acquired by the Sandia SARI, but significantly finer than the resolution of theexisting Coast Guard SLAR. Wide-swath coverage (25 nautical miles) at 10-m pixel resolutionprovides more data to an operator than can realistically be displayed and interpreted. Theworkshop participants, therefore, recommended:
1. A wide-swath mode where images are displayed to the operator at 20-m to 30-mresolution for cueing regions-of-interest.
2. A 10-m resolution display capability for detailed analysis, and potential down-linking ofregion-of-interest images that depict probable oil-spill sites.
Analysts agreed that several SAR capabilities were superior to the existing SLAR, and thatSAR introduced some difficulties that are not inherent in SLAR. The benefits of SAR are:
1. Finer resolution and better image acuity for identifying oil-slick boundaries.
2. Sensitivity to surface features with minimal radar scattering cross section is better thanthat of the existing Coast Guard SLAR.
3. Spatial resolution that does not degrade with increasing range to the surface, as is thecase with SLAR. This improves the interpretability of radar data by presenting auniform acuity over the entire area being imaged.
SAR difficulties are:
1. Single-look SAR images at 10-m resolution have adequate resolution, but speckle canreduce acquity. Multi-look SAR imaging at 10-m resolution, however, alleviates thisproblem.
2. Ocean waves whose motion includes a significant directional component orientedtoward (or away from) the radar antenna cause acuity degradation in the SAR image.Using higher aircraft speeds and transmitting perpendicular to the direction of dominantwave motion can mitigate this effect.
3. Images of rigid moving targets (such as ships or boats) can show the targets displacedfrom their actual locations. The amount of displacement depends upon target speed andradar parameters. This can affect a SAR image of, for example, moving ships dumpingwaste. A dual-mode (real and synthetic aperture) radar design or special dopplerprocessing of the SAR data could alleviate this problem.
Analysts saw no significant difference in the sensitivity of SAR and SLAR to low-windconditions or to oil slick thickness.
Parameters for a Conceptual Coast Guard SARResults of the SAR image analysis; including optimal resolutions for region-of-interest and
wide-swath images, benefits of multi-look imaging, dual-image display strategies, and
EX-2

requirements for imaging rigid moving targets, were used to set some basic design parameters fora conceptual Coast Guard SAR. Should the U. S. Coast Guard decide at a future date that itsexisting oil-spill surveillance capabilities should be upgraded to include SAR systems, theparameters defined in this report should provide a foundation for the acquisition. Topics such asantenna size, transmitter power, image formation processor architecture, special methods toaddress the rigid moving target issue, and image display buffering are addressed in detail. Insummary, the parameters required for a SAR to meet Coast Guard mission requirements:
1. Define a system that might be purchased commercially and slightly modified.
2. Define a new product that can be assembled from a combination of commercially-available subsystems and commercially-available components integrated intosubsystems by a SAR vendor.
A vendor survey of commercially-available systems, subsystems, and components was performedto substantiate these alternatives.
Cost vs. Benefit of SAR
SAR offers a distinct benefit in image quality when compared to SLAR. SAR provides finerresolution, constant (not a function of range to the surface) resolution, excellent acquity in multi-look mode, better sensitivity in terms of the minimum-detectable target-cell radar cross section,and a smaller, steerable (if desired) antenna. All but the last of these quality benefits are generic toSAR and cannot be achieved by replacing the existing Coast Guard SLAR with a newertechnology SLAR. There are several areas where SAR and SLAR are similar. These include size,weight, power consumption, maintenance time, and operator training. SAR, however, incurs somecosts that are not encountered in SLAR. A SAR.requires a high-accuracy inertial navigation unit,precise aircraft motion compensation of acquired data to prevent image blurring, antenna gimbalswith multiple degrees of freedom and control for image acquisition (if a steerable antenna isdesired), and a sophisticated image formation computer. These subsystems add complexity andadditional hardware and software costs above and beyond the cost of a SLAR. These costs couldbe as high as an additional $2 to $3 million for developing a new system configured fromcommercially available subsystems and components. Even if a new SAR development were notpursued and an existing commercial SAR system were procured, an additional cost of $400thousand to $500 thousand per installed unit would be expended for a SAR vs. a SLAR.
RECOMMENDATIONSI. Based on the analysis performed during this study, the U.S. Coast Guard should
seriously consider moving to SAR as a future replacement for the AN/APS-131 SLAR.This recommendation is made on the basis of the superior image acuity and uniformitythat SAR technology can provide. This should not be construed as a endorsement ofSAR over SLAR at any cost; the cost of upgrading to SAR technology would besignificant. The balance among mission priorities, anticipated useage, and budgetaryconstraints could sway the decision toward either technology.
2. Should the Coast Guard choose to procure a SAR capability, the system should includethe following characteristics:
EX-3

"* 10-m pixel resolution and a 25-nmi image swath.
"* X-band radar.
"* Real-time motion compensation.
"* Real-time multi-look image formation.
"* Image and auxiliary radar data recording.
"* Full-swath and region-of-interest displays.
"* Moving target indication.
3. The recently-initiated AIREYE upgrade program which will likely provide the APS-131SLAR with digital image storage, digital image enhancement/display, and an imagedownlink capability, should be monitored closely to determine if a modernized SLARcan adequately meet spill surveillance requirements without incurring the additionalcosts of SAR.
4. The Coast Guard should explore the possibility of simultaneously imaging a series of oilslicks with the modernized APS-131 SLAR and an available contractor SAR whosecapabilities approximate those of the conceptual system defined in this study. Theresultant SAR and SLAR images should be compared directly to evaluate the potentialbenefits of replacing SLAR with SAR when the APS-131 system reaches the end of itssupportable life early in the next century.
EX-4

ACKNOWLEDGEMENTS
The authors wish to express appreciation for the project contributions made by numerousindividuals from the Coast Guard, Sandia National Laboratories, NOAA, and the private sector.Special thanks to the Coast Guard and contractor aircrews for safely and successfully flying thedata collection missions in Santa Barbara. The pilots of Ross Aviation (Sandia Twin Otter);numerous Coast Guardsmen from Air Stations Cape Cod (AIREYE) and Los Angeles (HH-65helicopter); and pilots from ERA Aviation (NOAA helicopter flights) all provided outstandingsupport to the experiment. Dr. Jerry Gait of the NOAA Hazardous Materials Response Divisionand numerous members of the HAZMAT staff provided invaluable advice, data collectionsupport, and analysis insights throughout the course of this project. CDR Ross Tuxhom andMSTI Chris Weiller of the USCG National Strike Force provided essential perspective asoperational Coast Guard users in addition to their surface truth data and analysis inputs. Specialthanks are extended to several groups at Sandia; the radar operations crew, the data formation andreformatting team, the Radar Viewing Workstation integration and testing team, and the otherindividuals who created special image products for analysts. Mr. Jeff Mason, in particular,contributed significantly to all of the Sandia activities. Finally, thanks to Mr. Jeff Plourde ofAnalysis & Technology, Inc. for his efforts in producing the hundreds of processed SAR andSLAR images required for the analysis workshops.
EX-5

(This page intentionally left blank.)
EX-6

CHAPTER 1INTRODUCTION
1.1 PROJECT BACKGROUNDThe Coast Guard Research and Development Center (USCG R&D Center) is evaluating
sensor technologies that could significantly enhance the Coast Guard's oil-spill remote sensingcapabilities by the mid-1990's. Part of this evaluation is specifically aimed at identifying sensorsthat could replace elements of, or be added to, the existing HU-25B AIREYE spill reconnaissanceaircraft suite. Sensor technologies that could supplement the AIREYE capability on differentaircraft (Coast Guard or otherwise) are also being examined.
In January of 1991, the R&D Center hosted a multi-agency workshop to discuss oil-spillsurveillance requirements, to identify sensor technologies that could meet those requirements, andto identify potential research and development initiatives. Synthetic aperture radar (SAR)technology was identified by workshop participants as holding promise for reducing the numberof "false positives", or non-petroleum slicks, reported by sensor operators during spillsurveillance missions. SAR images can provide finer and more uniform spatial resolution withinthe radar image of an oil slick than can the current AIREYE side-looking airborne radar (SLAR).Workshop participants postulated that image interpreters might be able to exploit finer-resolutionSAR images to distinguish features that are characteristic of petroleum oil slicks. The workshopproceedings are listed in reference [1].
In May of 1992, Sandia National Laboratories (SNL), as an internal effort and incooperation with the Coast Guard, applied its resources and expertise in SAR technology andimage processing toward an exploratory imaging exercise over the Santa Barbara Channel.Results of this exercise confirmed that Sandia's SAR was capable of successfully imaging thenaturally-occurring oil seeps in that area.
In June of 1992, the Department of Energy (DOE) accepted a Military InterdepartmentalPurchase Request (MIPR) from the Coast Guard funding SNL to conduct the research andanalysis work reported in this document. SNL was tasked to conduct literature research on theapplication of SAR and SLAR sensor technologies to the oil-spill surveillance mission; to plan,conduct, and analyze a joint SAR/SLAR sensor evaluation over the Santa Barbara oil seeps; todetermine the system requirements for a conceptual Coast Guard SAR; and to conduct a cost/benefit analysis of the two sensor technologies relative to the Coast Guard's oil-spill surveillancemission.
1.2 PROJECT SCOPE AND OBJECTIVES
The primary objective of this project was to evaluate, relative to oil-spill remote sensingrequirements, the cost-effectiveness of supplementing or replacing the AIREYE system's real-aperture, AN/APS-131 side-looking airborne radar (SLAR) with a lightweight, state-of-the-art,fine-resolution SAR that is capable of producing imagery in near real-time.
1-1

The first step was to determine whether a fine-resolution SAR offered an oil-spill detectionperformance comparable or superior to that of the existing AIREYE SLAR. A coordinated oil-spill reconnaissance experiment involving the Coast Guard AIREYE SLAR and the SNL SARwas conducted over the Santa Barbara Channel in November of 1992 to address this issue.Analysis of the experimental data led to basic performance and preliminary design specificationsfor a future Coast Guard SAR system. The cost-effectiveness of such a system was evaluated byconsidering the availability and applicability of commercial systems or components; size, power,and weight constraints; operational requirements, and the expected quality and utility of the imageproducts. This was a concept feasibility study. No attempt was made to identify a final pointdesign, a specific manufacturer, or detailed costs for integrating a specific system into the existingCoast Guard HU-25B aircraft.
1.3 TECHNICAL BACKGROUND
The effectiveness of radar as a sensor for monitoring oils spills depends on 1) ocean wavedynamics and effects of oil on those dynamics; 2) interaction of electromagnetic waves with themoving ocean surface; and 3) the particular design of the sensor.
1.3.1 Ocean Dynamics and Effects of Oil
Ocean waves are caused by the conversion of energy, primarily from the wind, into watermotion. Significant energy inputs include gravitational forces of celestial bodies, distant winds,and local winds. Primary wave components of interest for radar imaging of the ocean are so-called long waves and capillary waves [2]. Long waves have wavelengths of the order of tens ofmeters or longer and are produced by energy sources other than local winds. Capillary waves,which have shorter wavelengths, are produced by local winds and can appear and disappear inshort periods of time. Capillaries comprise a spectrum of wavelengths; however, they havesignificant energy in wavelengths of the order of cm. The capillary waves ride atop the longer-wave motion; therefore, the long waves are said to modulate the movement of the capillarywaves.
Oil on the surface of the ocean damps, or attenuates the capillary waves, thereby smoothingthe surface of the long waves. It is this damping that allows oil to be discriminated from openocean in radar images. Oil-covered areas, because they are smoother, scatter back less energy toan illuminating radar than do the areas of open water. Of course, in order for discrimination to bepossible, there must be local winds present to generate the capillary waves.
1.3.2 Electromagnetic Scattering from Ocean Waves
Radars operate by illuminating the target area with radiated electromagnetic energy andreceiving and processing the resulting echoes. Most radars designed to image the ocean's surfaceoperate at cm wavelengths (C, X, or Ku bands). A perfectly smooth ocean will act like a mirror,scattering no energy back to radar, except at nadir (the radar looks straight down). Presence oflong waves causes echo from the ocean's surface at look angles off of nadir. Generally, themaximum slope of the surface will determine the angular width of the scattering response curve.This type of return is sometimes called quasi-specular. Significant echo out to 10° (of incidenceangle) or more wQuld be typical. Presence of capillaries on the surface greatly extends the widthof the scattering response curve. The scattering response is expressed in terms of 00, thescattering coefficient. a is a, normalized quantity, being equal to the surface's radar cross section
1-2

per square meter of surface area. do for ocean typically varies from around +10 dB at nadir to -40or -50 dB at incidence angles greater than 800 (3]. Although o° decreases monotonically withincreasing incidence angle, echoes from capillary waves at very large incidence angles (or smalldepression angles) can be detected. Therefore, in the presence of local winds, it is possible toperform wide-swath imaging of the ocean's surface.
Other factors aifect the amount of echo scattered back to the radar. VV polarizationprovides better return at small grazing angles than HH. Returns are also somewhat stronger whenthe radar looks either up- or down-wind, as opposed to cross-wind. Finally, the long-wavestructure tends to be more easily seen in radar images when the radar look direction is normal tothe wavefronts.
The contrast, at VV polarization, of returns from oil-covered ocean and open ocean varieswith look angle and frequency. Contrast appears to be best near 600 of incidence and decreasessomewhat with increasing incidence. Contrast is better at X band than at lower frequencies.Contrast at Ku band appears to be at least as good as at X band [4,5].
The fact that the ocean is moving complicates target/sensor interactions. When a radarimages a stationary scene, the Doppler spectrum of the echo arises only due to the motion of thesensor platform. When a radar images the ocean, the Doppler spectrum is determined partly byocean movement and partly by sensor-platform movement. Effects of the Doppler spectrum tendto be relatively unimportant when the sensor is a SLAR. However, because a SAR forms itsimage via Doppler filtering, significant target motion can affect the quality of the image.
1.3.3 Sensor Descriptions (SAR/SLAR)Two sensors have been analyzed and flown as part of this study: the Coast Guard AN/APS-
131 SLAR and the SNL Ku-band SAR.
1.3.3.1 The AN/APS-131 SLARThis SLAR is a component of the Coast Guard's AIREYE sensor suite that is carried aboard
the HU-25B aircraft. A detailed description of the AN/APS-131 is given in [6]. The SLARprovides broad-swath imaging to a maximum range of 80 nmi to either or both sides of theaircraft. The radar achieves 30-m range resolution via a 200-ns real pulse. Azimuth resolution iscontrolled by the SLAR antenna's azimuth beamwidth (0.80), which is about equal to theelectrical wavelength divided by the physical width of the antenna (A/WA). Therefore, azimuthresolution is coarse, being about 50 m at 2 nmi range and about 500 m at 20 nmi range, and onlythe near-range portion of the broad swath is normally useful for oil-spill monitoring. See FigureI-1, which depicts the SLAR imaging process.
The radar is a noncoherent-pulse real-aperture radar. Current AN/APS-131 image productsare photographic film hardcopy; however, a capability for digital output to 4-mm magnetic tapewas implemented for the joint sensor evaluation conducted as a part of this project. Thesemodifications were made by Motorola Government Electronics Group in Scottsdale, Arizona,under contract to SNL. In this digital-output version, echo pulse amplitudes are averaged in eachrange bin for the amount of time taken for the AIREYE to travel about 30 m along-track. This
1-3

line of flight
fla azimuth resolution determined'a by azimuth antenna beamwidth
resolution (-A/ WA)cell • __cell range resolution determined
by transmitted pulse width
Figure 1-1. The SLAR imaging process.
1-4

improves signal-to-noise ratio in the image and degrades azimuth resolution only slightly at near-range.
The SLAR operates in the X band (9.315 GHz). The transmitter is a 200-kW magnetron.The antenna is steered only over very small azimuth angles to account for short-term yawvariations. Image corrections for radar beam squint (due to aircraft drift angles of up to ±15degrees) are accomplished by manipulation of the CRT trace. The sensitivity (minimumdetectable scattering coefficient) of the AIREYE SLAR has been estimated to be about -41.9 dBat a range of about 29 nmi [7](Appendix A).
1.3.3.2 The SNL SAR
The SNL SAR is a state-of-the-art imaging SAR carried aboard a DeHavilland DHC-6Twin-Otter aircraft. The SAR provides relatively narrow-swath imaging capability (about 2 kmswath) at modest ranges (typically, about 7 km to the scene center-line). Achievable resolution ismuch finer than that of the AIREYE SLAR. Resolution settings used for the November 1992joint flight tests were 3 m in slant range and 3 m in azimuth1 . Resolution in range is achieved bytransmission of a frequency-chirped, long pulse of appropriate bandwidth, dechirping the pulse onreceive, and digitally compressing the pulse using FFT processing. Azimuth resolution isachieved using fully-focused, coherent, SAR processing of echo pulses.
The SAR operates in the Ku band (15 GHz). The transmitter is an 80-W traveling wavetube. This low peak power is possible because of the relatively long uncompressed pulse (24 ls)used by the SAR. The antenna is gimbaled and can move over a wide range of pointing angles.The antenna is always pointed at a right angle to the aircraft's desired flight path and along adirection so that the center of the antenna's beam lies on the desired scene center-line. Theestimated sensitivity of the SNL SAR at a range of 6400 m (as configured for the November 1992tests) was estimated at about -45 dB [8].
To form its image. the SAR collects echoes over a "synthetic" aperture, typically tens ofmeters long. The complex computational procedure by which distinct pulses are combined (toachieve finer azimuth resolution than can be obtained using a SLAR) is the distinguishingstrength of the SAR technique. In the azimuth processing, target cells are resolved based upontheir Doppler frequency. Cells in front of the aircraft yield positive Doppler; cells behind theaircraft exhibit negative Doppler. By combining pulses over the aperture, the SAR synthesizesthe equivalent of a very narrow virtual antenna beamwidth (typically a few hundredths of onedegree), which is about equal to A/(2LsA), where LSA is the length of the synthetic aperture. SeeFigure 1-2, which depicts the SAR processing scheme.
Digital image products are recorded, during flight, on a high-speed magnetic tape recorder.Raw, unprocessed radar echoes, called "phase histories", are also recorded, along with motion-compensation and other auxiliary data. Because phase histories are recorded, images can be
1. The term "resolution" has different meanings in different contexts. In this experiment, the radar was con-figured to produce 2-m pixels in the ground-plane in both the range and azimuth dimensions. The impulseresponse width in the ground-plane is 3.5 m in range and 3.0 m in azimuth. Unless otherwise specified, fromthis point on, resolution will refer to the ground-plane pixel spacing which is 2 m_.
1-5

Ine of flight
maximum patch size determinedby real azimuth antenna beamwidth
resolutioncell •range resolution determined by
' time-compressed pulse width
patch azimuth resolution determined bysynthetic (processed) beamwidth(A/ 2 .SA)
Figure 1-2. The SAR Imaging process.
1-6

reformed, using ground-based image-formation software, either to vary resolution or to performmulti-look processing.
SAR processing of a single synthetic aperture of echoes results in a "single-look" patch. Forthe SNL SAR, patches are 1200 to 1800 pixels in slant range (this is selectable) and severalhundred pixels in the azimuth (along-track dimension). In order for the SAR to form an imagepatch, all scattering cells in the patch must remain in the antenna beam over the entire syntheticaperture. In the event that the antenna's beam is much wider than necessary to meet thisrequirement, the SAR can use several closely-spaced apertures to form multiple "looks" at thetarget area. Each look is an image patch. Patches resulting from adjacent apertures can be formedin such a way that there is a significant amount of overlap in the patches. In this way, anyparticular target pixel can be seen in several overlapping looks (see Figure 1-3). The number ofachievable looks depends on the antenna's azimuth beamwidth, the patch size, and the desiredazimuth resolution.
Multi-look imagery is created by summing amplitudes or squared amplitudes of pixelvoltages (for a given pixel location) across all available looks. The effect of this averaging is toincrease signal-to-noise ratio in the image and to reduce speckle in the image.
A possible disadvantage of the multi-look technique for imaging of the ocean is the fact thattotal integration time over all looks may be so long that the ocean's movement during that timewill degrade the resulting multi-looked images [9]. Although this may be a factor when theimagery is to be used to study details of wave structure, experience with flight-test data indicatesthat integration times of the order of seconds do not cause a problem when the images are to beused for oil-spill discrimination.
1.4 EXPERIMENT DESCRIPTION
In support of the comparative analysis of SAR and SLAR capabilities, an at-sea experimentwas conducted during November 10-16, 1992. SNL's SAR and the Coast Guard's AIREYE SLARsystems were used to collect data simultaneously over naturally occurring oil seeps off the coastnear Santa Barbara, CA. The purpose of the exercise was to collect a comprehensive enough dataset to:
1. Evaluate the suitability of high-resolution SAR for oil-spill surveillance and
2. Support a cost/benefit comparison of SAR and SLAR sensor technology relative toUSCG oil-spill surveillance mission requirements.
1.4.1 Participants
Several organizations participated in the data collection. Participants and resources havebeen grouped in four categories: Control, Twin Otter SAR, AIREYE, and Surface Truth.
1.4.1.1 Control
The USCG R&D Center, Environmental Safety Branch, served as the overall controller ofthe experiment. The R&D Center arranged for participating USCG aircraft and personnel,
1-7

line of flight nI
adjacent syntheticapertures
antenna beam
pixel to beaveraged over
one image several looks
patchoverlapped
patches(looks)
I V
1234
Figure 1-3. Multi-look Imaging procesi.
1-8

obtained support from NOAA oil-spill response specialists, and provided a Test Director on-sitein Santa Barbara, CA, during the data collection. The R&D Center Test Director was responsiblefor coordinating the daily activities of the various Coast Guard, NOAA, and SNL participantsduring the test and for collating the USCG and NOAA data inputs to SNL.
SNL provided a Project Manager to coordinate SNL resources and activities with those ofthe USCG, NOAA, and Motorola. In Santa Barbara, the SNL Project Manager served as a singlepoint of contact for the SNL test team to communicate with the other test participants.
1.4.1.2 Twin Otter SAR
SNL provided personnel, an aircraft and a SAR system for the experiment. Sandia used theirinternally developed DCS (Data Collection System) radar. The SNL participants included theSandia Project Manager, two pilots, two logistics and aircraft support personnel, one differentialGPS ground station operator, three sensor operators, and several data analysts. The radar system isan R & D oriented, Ku-band SAR with built-in image formation capability. A differential GPSsystem is used for precise motion compensation. For this experiment, data were collected at 2 mresolution (ground-plane range and azimuth); images were formed by the on-board processor. Theantenna polarization was VV. For a near optimum depression angle of 30*, the swath width wason the order of 2.5 km. The testbed aircraft was a DOE owned DeHavilland DHC-6 Twin Otter. Itis shown in Figure 1-4.
1.4.1.3 AIREYE
USCG Air Station Cape Cod provided a seven-person aircrew and an HU-25B AIREYEsurveillance jet for the Santa Barbara data collection, The AIREYE platform, a specially-modifiedDassault-Breguet Falcon 20 jet, is a multi-mission remote sensing aircraft designed to detect,identify, verify, and document oil slicks in the marine environment. The AIREYE avionicspackage includes the AN/APS-131 SLAR (described in Section 1.3.2), an RS-18C infrared/ultraviolet (IR[UV) line scanner, and a KS-87 aerial reconnaissance camera. A hand-held, 70-mmAgiflite camera is also used on board the AIREYE aircraft to photograph features of interest. Theaircrew included two pilots, three sensor system operators, and two maintenance/supportpersonnel. Five crewmembers, including two sensor operators, flew on each data collection sortie.Figure 1-5 shows the Coast Guard Falcon aircraft.
The AIREYE platform was responsible for obtaining SLAR images of the test area and forproducing a geo-registered, KS-87 photo-mosaic of the test area each day.
1.4.1.4 Surface TruthingNOAA HAZMAT, (Seattle, WA), USCG Gulf Strike Team, (Mobile, AL), and USCG
Pacific Strike Team, (Novato, CA) provided personnei for the surface truth function. USCG AirStation Los Angeles provided helicopter support for surface truth operations. NOAA also leased acommercial helicopLer operator for this task.
1-9

(This page intentionally left blank.)
1-10

TV
LW
0 0c
C•
•N
CL
1-12

000
0 -j
C J-i
-~ ~ - -*'~~ .- *td
~ 1-13, 1-14

1.4.2 Summary of Field Test OperationsCoordination among the various USCG organizations, Sandia, NOAA, Motorola, and the
FAA began in July. These activities included temporarily upgrading the SLAR, obtainingfrequency clearances, locating a differential GPS base station site, defining mission parametersand test areas, taking care of aircraft and crew logistics, and briefing local control towerauthorities on the experiment. A detailed test plan containing all pertinent information on theexperiment was also written [10].
Four adjacent test areas were defined for use in the experiment, as shown in Figure 1-6.Each test area measured 5 by 10 nmi. Area 1 was to be used if the slicks were drifting westward.It contained a main source of oil (and natural gas) and the Holly Platform. Area 2 was to be usedif the main slick was drifting eastward, for imaging of kelp (false positives), or for other slicks ofopportunity. Area 3 was to be used for slicks of opportunity. It contained the Hondo Platform.Area 4 was to be used as an alternate to Areas 1 and 2.
In-field activities began on November 7th-8th, with the arrival on-site of the Twin OtterSAR, AIREYE, and all crews. The SAR was flown in the area to verify proper operation.November 9th was also used for an equipment checkout day and for the pre-experiment briefingfor all participants, which was delivered by the Test Director.
Data collections began on November 10th. The SAR and SLAR crews began this day, andall other mission days, with a 0700 hours briefing. Based on information from the NOAA surfacetruth observers, who had flown a "dawn patrol", Test Area 4 was chosen for this day's mission.Surface winds over the test area were 2-8 knots from the west at the Holly Platform; lookdirections were chosen to be north, east, and west. The sorties were flown between 0845 and 1200hours. The Twin Otter SAR was able to collect data over the entire test area from the north andwest look directions before having to terminate the sortie due to lack of fuel. The AIREYE wasable to complete patterns for all required look directions; however, the tape used to record theSLAR data was corrupted and the data were lost.
Test Area 4 was again selected for the November 11th mission. Surface winds were 5-10knots from the west at the Holly Platform; look directions were chosen to be south and east. Thesorties were flown between 0900 and 1200 hours. Both the Twin Otter SAR and the AIREYEcompleted all patterns. Surface truth sorties were flown by both NOAA and USCG personnel inthe charter helicopter and the Coast Guard HH-65A. The water in the test area was so calm thatthe reflection from the bright orange HH-65A could be seen from the Twin Otter flying 10,500 ftabove. The test area contained windrows of rough, weathered oil (which trapped flotsam) andrafts of sea birds.
For the November 12th mission, Test Area 1 was selected. The dawn patrol sortieindicated winds from the west, so look directions were chosen to be south and west. Wind speedswere 1-10 knots at the Holly Platform. All aircraft departed for their sorties at about l100 hoursand completed their patterns. The USCG HH-65A was used for surface truthing; a Coast Guardobserver was also carried on the Twin Otter.
1-15

moV 'Il 'L
Ic
~ -p' L_; ___m
40 S -it 1 nlem, ~ 1I A i
i _ _ _ _
~~\-. 8
I7
C6~
IW
\ICIS
1-1

After a day off, data collection missions were resumed on November 14th. Test Area 1was chosen. Winds were calm; east, south, and west look directions were selected. Sorties wereflown between 1300 - 1600 hours. The Twin Otter / SAR completed its south and west lookingpatterns before having to terminate the sortie due to lack of fuel. The AIREYE completed all itspatterns. The USCG HH-65A was used for surface truthing. A Coast Guard surface truth observerwas carried on the Twin Otter.
Test Area 1 was again selected for the November 15th mission. Surface winds were calm,blowing between 0 and 2 knots at the Holly Platform. North and east look directions were chosen.The sorties were flown between 1300 and 1600 hours. The Twin Otter / SAR and AIREYEcompleted all their patterns over the test area without incident. The USCG HH-65A and acommercial helicopter were used for surface truthing.
November 16th marked the last data collection day. Due to poor forecast data collectionconditions, ¢calm seas and windless), this day was to be used for training and for imaging targetsof opportumty. Sorties began at 0900 hours. However, once the aircraft got over the test areas, itwas observed that the conditions for imaging oil on the water might be better than anticipated. Anew plan was coordinated over the radio; Test Area 1 and south and west look directions wereselected. The AIREYE completed its patterns without incident. Unfortunately, the SAR datarecorder on the Twin Otter malfunctioned and could not be repaired in the air. No SAR data werecollected. AIREYE and its crew departed for home after the November 16th mission wascompleted. The Twin Otter and crew departed the next day.
1.4.3 Summary of Data Collected
A detailed summary of the collected SAR and SLAR image data will be presented inChapter 2. Besides the SAR and SLAR data, several other types of data were collected during theexperiment. AIREYE was used to collect IR and UV data over selected areas. Its KS-87 camerawas also used to photo-map the selected test area once each day. In addition, both the SAR andSLAR crews kept log sheets and mission notes during each data collection sortie. Surface truthand weather data were obtained from a number of sources. The primary source was helicopter-borne NOAA and Coast Guard observers who were on-scene during each data collection missionto document surface conditions within the test area. Wind speed estimates and sketches of surfacefeatures and oil slick positions were made by these NOAA and Coast Guard observers. Black andwhite 70-mm and color 35-mm photographs of noteworthy features within the test area were alsotaken by the observers during most of the missions. In addition, the USCG R&D Center obtainedrecorded wind conditions at the Holly platform (which resides in the middle of the experimentarea) from ARCO Oil and Gas Co. Information from the pilot's weather briefings were alsorecorded for each mission.
1.5 ANALYSIS TOOLS AND IMAGE DATASNL was tasked to provide the Coast Guard with SAR and SLAR image data from the
experiment and to deliver appropriate hardware and software tools for its analysis. Thesedeliverables included a computer workstation, customized and commercial software, SAR andSLAR image files, and auxiliary data files. Sections 1.5.1 through 1.5.3 will describe thesedeliverables in detail.
1-17

In developing these deliverables, certain data characteristics and analysis goals had to beconsidered. Key analysis goals were to establish whether SAR has benefits over SLAR forimaging oil on water and to evaluate the effectiveness of various image processing techniques. Toaccomplish this, side-by-side comparisons of full-resolution SAR and SLAR images showingcommon regions had to be made. It was not sufficient to simply lay prints of SAR and SLARimages side-by-side. The sheer size of the SAR mosaics at full resolution (up to 9400 by 4900pixels) would make image printing extremely difficult. Differences in the printed size of SAR andSLAR images depicting the full test area would make feature-to-feature comparisons difficult.Differences in contrast between SAR and SLAR prints could bias interpretations. Theselimitations were addressed by providing a capability to extract full-resolution regions-of-interest(ROIs) from the raw SAR and SLAR images. These smaller ROI images were sized to fit on theworkstation display monitor and on a single-page hardcopy from the Kodak high-resolution dye-sublimation printer. The ROIs could then be processed using techniques such as contraststretching, speckle smoothing, enlarging/reducing, simulated multi-look processing, andsimulations of various resolutions. These techniques enabled analysts to evaluate the informationcontent of the images in detail and to evaluate the effectiveness of the processing techniquesthemselves.
Another analysis goal was to determine the spatial resolutions required for SAR imagery toretain features of interest at the acuity desired by sensor operators and analysts. The besttechnique for evaluating SAR resolution is to resample the raw phase history data and form newimages from the resampled data. This is a very expensive post-processing task and was beyondthe scope of this study. Past SNL comparisons between reformed images made by resampling thephase history and simple subsampling of existing full-resolution images (followed by pixelreplication) indicated that this simpler method is a valid simulation of reduced resolution SARimaging. This simulation could be easily performed on the workstation and large volumes of datacould be processed by the USCG R&D Center at low cost when compared to phase historyresampling. Sandia developed software to support this reduced resolution simulation so thatanalysts could evaluate SAR resolution trade-offs. A validation of this simulation method wasperformed specifically for this project. This validation will be described in Section 1.6.3.1.
1.5.1 Image Data Sets
SAR data deliverables were in two formats: full-resolution mosaics and down-sampledmosaics. These products could be post-processed on the workstation supplied for data analysis(described below). Full resolution mosaics were required for detailed region-of-interest analysis,but they were too large to be displayed on the workstation monitor or printed as hardcopy. Down-sampled mosaics were supplied to give analysts full scene views that could be displayed on theworkstation monitor and used to locate regions-of interest. More will be said about the use of thefull resolution mosaics and down-sampled mosaics later in this section.
The SAR image data were processed at SNL to form detected image mosaics for distributionand analysis. Mosaics were required because the Twin Otter SAR images range swaths that aresmaller than the range swaths normally produced by the AIREYE. Comparable range coveragecould only be attained by mosaicking multiple strips of imagery. Each strip represented animaging pass by the aircraft, hence, each strip is called a "pass". Mosaics created from a south-looking or a north-looking antenna were composed of 4 "passes", while those created from an
1-18

east-looking or a west-looking antenna were composed of roughly 8 "passes". To conserveaircraft fuel, the Twin Otter flew a serpentine path, the antenna imaging on the left of the aircraftfor one pass, imaging on the right of the aircraft for the next pass, etc., until all passes for themosaic were completed.
The normal SAR processing creates linearly scaled image intensities, each pixel in thedetected image having 16 bits of dynamic range. The full 16-bit dynamic range of the detectedimage was not required since the sea return was faint compared to land return. To conservememory and to facilitate easy image display, the 16-bit data were rescaled to 8 bits of dynamicrange. The rescaling, a simple multiplication by a constant, was performed to enhance faint seareturns at the expense of saturating land returns from the coast. The same rescaling was performedon all passes from all days of the experiment. The noisy sea return in passes that included land,such as the one shown in Figure 1-7, is due to two factors: decreased receiver gain (to avoidsaturation of sea returns by land returns), followed by a compensating increase in signal processorgain. This technique amplified the thermal noise across all passes that intercepted land.
The 16-bit raw SAR image passes that were processed to create the 8-bit image mosaicswere also provided as a backup. Should there be a future interest in reprocessing the raw data andforming new mosaics, these data are available to the Coast Guard for processing with Sandia's"'Imview" software (provided with the computer workstation).
SLAR data were also processed at SNL and delivered for exploitation on the workstation.This processing amounted to editing the SLAR data that were recorded on Digital Audio Tape(DAT). Scenes that corresponded to SAR mosaics were extracted from the DAT. These sceneswere also geometrically rectified so that land always appeared at the top of the image (north isupward) and so that all SLAR scenes had the same size (total number of bytes). Aside from thisgeometric registration, no additional processing was performed on the SLAR data. Data sampleswere kept at their original 8-bit dynamic range and no rescaling of intensities was performed.
Auxiliary files were supplied that contain information about imaging times, modes,environmental states, and mosaic identification. This information was included for the creation ofkey image and region-of-interest text banners, as will be discussed in Section 1.5.3. SAR andSLAR auxiliary files contained the following information:
1. Image or mosaic size, in pixels.
2. Downsampling factor for creating a key image (SAR only).
3. Flight date.
4. Flight times.
5. Antenna look direction.
6. Mosaic size, in meters (SAR only).
7. Wind direction, in degrees.
1-19

(This page intentionally left blank.)
1-20

04
0
04
o 0tC.)IN
1-21,1.22

8. Wind speed, in knots.
9. Master image identifier.
10. Pixel resolution, in meters (SAR only).
All data were supplied on computer-compatible laser disks.
1.5.2 WorkationSNL delivered to the Coast Guard a 486/66 PC-based workstation that enabled viewing,
manipulation, processing, annotation, and printing of SAR and SLAR images from the November1992 joint flight test. The workstation (see Figure 1-8) included a fine-resolution (1280 x 1024pixels) graphics monitor, high-capacity magnetic and magneto-optical read/write storage media,and a fine-resolution (2048 by 1536 pixels) color graphics printer. Delivered software includedboth commercial (DOS, Windows, Photostyler) and SNL-designed products (to be described inSection 1.5.3.1).
The fine-resolution, 20-inch monitor allowed high-fidelity display of large images inmultiple windows. Test data were transferred to the Coast Guard on 1-Gbyte optical cartridges.The 650-Mbyte fixed disk contained all system and application software and was used fortemporary storage of processed data. Memory for the system was sized to allow adequate RAMstorage for processing and simultaneous display of multiple SAR or SLAR images. This hardwareand software provided the USCG R&D Center with the processing power and software toolsnecessary to analyze the SAR and SLAR flight-test data.
1.5.3 Image Manipnulation and Processing Software
Software was developed at SNL to present the SAR and SLAR data in standardized formatsfor analysis, to display the SAR imagery at full and degraded resolutions, and to filter anyundesireable speckle that might degrade interpretability. This software was complimented bycommercial software providing standard image display and printing capabilities. Both the SNLsoftware and the commercial software were installed on the PC-based workstation discussed inSection 1.5.2.
1.5.3.1 SNL-Provided Software
SNL provided the USCG R&D Center with a general-purpose computer program and threecustomized computer programs for formatting, processing, and analyzing the SAR and SLARimage data. These programs and their capabilities are as follows.
IMVIEW - IMVIEW is a general purpose software package developed by SNL formanipulation of raw, 16-bit SAR strip-image data. It was provided to the USCG to facilitatemanipulation of the raw SAR image data, should the need arise. This software also providesa wide array of general-purpose image processing capabilities that were not required for thisanalysis. A detailed description of these capabilities is provided in reference [11] (theIMVIEW User's Guide).
1-23

Software-DOS 5.0WhidowsPhotodyle
S•L Customn SW (RCA)hnvbw
Iomega 1-GbyteOptical Disk Drive
Nanao 15601 __
FOxw/y Kod* XLT-7700
ALR 488/88 PC48 Mbytes RAM EV-3-1/2" dskette
5-1/4" HI daketteMaxtor 650-Mbyte fixed disk
Figure 1-& Coast Guard SAR image viewing stadon.
1-24

Swath_vu - Swathvu enables analysts to vary the spatial resolution of a SAR imagecontaining the full 5- to 10-nmi test area from 2-meter, square-pixel ground projection tolower resolutions that are more practical for real-time display. This software was used tosimulate various levels of full-swath SAR image resolution that a sensor operator might usefor real-time viewing/printing and ROI selection. The object of creating full-swath imageryat multiple resolutions was to allow an evaluation of trade-offs among the image resolution,the geographic dimensions of an image, and the pixel capacities of available video displaysand printers. A banner detailing the image processing accomplished is appended to thebottom of each output image.
ROI - The region-of-interest (ROI) software extracts image data, bounded by user-specifiedpixel coordinates, from a full-swath SAR mosaic and creates a new ROI image file. Themaximum ROI size was set to be a 3- by 4-km rectangle. This size was dictated by thenumber of pixels that can be prin',d by the Kodak XLT 7720 printer (1536 by 2048 pixels)and the 2-m maximum ground pixel resolution of the SAR images. Because knowledge ofthe location where regions have been extracted is important for analysis, a key imagecapability was included in the software. A key image is a reduced resolution (subsampled)version of the full mosaic with a region of interest border superimposed. A text banner isalso included at the bottom of the subsampled image that uniquely identifies the ROI andlists pertinent environmental information. A region-of-interest image, in conjunction with akey image, provides a mechanism for linking detailed features in a specific region with thefull-swath image.
This process is depicted in Figure 1-9. When the ROI file is extracted, the user has the
option of performing the following operation.
1. Any of three speckle smoothing routines (described below).
2. Down-sampling the image to a user-defined spatial resolution.
3. Down-sampling the image, then executing one of the speckle smoothing algorithms.
4. Down-sampling the image with a sliding window averaging ("boxcar") algorithm.
5. Simply extracting a full-resolution ROI without any additional processing.
Figure 1-10 provides a pictorial representation of the options provided in the ROIsoftware. Sections 1.6.2 and 1.6.3 describe these options in more detail. Each of theoptions that down-samples an image reduces the number of pixels in the image (andtherefore its size). The ROI software restores the image to its original size through pixelreplication to permit comparisons of printed images that are the same physicaldimensions. After executing any of the image processing algorithms, the user is asked toenter a file name and the processed image is saved. The user can then execute severalimage processing algorithms on the original image, select another ROI, or exit the ROIprogram. A text banner detailing the source of the image and any image processingperformed is appended to the bottom of each output image.
1-25

* I°
* I°
* 1°
*ia5i0
* S°
:- "S..........-Se * S I
.5 6
1-26

Region-of-Interest Software
Resolution SARMosaic
Extract ROI
No Poesn
Speckle Smoothing Subsample with/without "Boxcar" filterSpecle mootingDownsampling
PixelReplication
Figure 1-10. SAR data processing flow for images selected for analysis.
1-27

LUT - The look-up table (LUT) software operates on an existing ROI file and providesstandard brightness and contrast remapping functions. Adjustments for moderate andextreme contrast stretching and darker-than-average, average, and brighter-than-averagebrightness control are provided. The purpose of this software was to evaluate whether asmall number of preset contrast functions could reasonably be established to minimize theburden on an operator of an operational radar. During the analysis, USCG R&D Centerproject staff found that they preferred to have available the full range of brightness andcontrast control provided by the Photostyler software described in the following section. Atext banner detailing the source of the image and any image processing performed isappended to the bottom of each output image.
1.5.3.2 Commercial SoftwareSNL purchased and installed a commercial software package on the workstation to facilitate
image display and printing. A summary of this package follows.
ALDUS Photostyler@ - The ALDUS Photostyler@ software is a commercially-availableproduct that provides a wide array of image import/export, image processing, and imageenhancement capabilities. The capabilities used during the SAR/SLAR data analysis includethe following:
1. Import/Export - Raw format images created by the ROI and Swath_vu softwarewere imported into Photostyler@. When all image processing functions werecompleted, the image was exported to the Kodak XLT 7720 printer.
2. Area selection tools - The rectangular region selection tool was primarily used tomark and bound a region of interest from a full-swath image. The pixelcoordinates of the upper left and lower right corners were obtained for input to theROI software. This tool was also used for selecting features from different imagesto compare.
3. Tuning (brightness and contrast) - This function provided the ability to adjust theimage brightness and contrast to enhance image features. It replaced the LUTsoftware functionality by providing the USCG R&D Center analysts a wider rangeof brightness and contrast adjustments.
4. Resampling - The ability to alter the size and resolution of an original imagepermitted USCG R&D Center analysts to compare enlarged SLAR images withprocessed SAR ROI images of the same area. Both pixel replication and pixelinterpolation enlargements were supported.
5. Negative - The ability to tune an image to its negative permitted SAR and SLARimagery to be viewed in the same format that SLAR imagery is currently recordedon the AIREYE system's dry-silver film.
6. Zoom - The capability to increase and/or decrease image size permitted analysts toview the entire test area mosaic down-sampled or to magnify small windows of the
1-28

image to full resolution. The ability to magnify and scroll through parts of theimage facilitated the selection of some ROls.
1.6 DESCRIPTION OF IMAGE ANALYSIS ACTIVITIESFive scheduled tasks were performed as a part of the image analysis activities. The first was
a meeting in August of 1992 between the representatives from the USCG, NOAA, and SNL toidentify Measures of Effectiveness (MOEs). The role of the MOEs was to outline quantitative andqualitative techniques for answering specific questions about the oil-slick imaging capabilities ofSAR and SLAR. All analysis activities were to address the MOEs. The second task was to deliverthe computer workstation, with software and data, to the USCG R&D Center. The third task was aworkshop involving the Coast Guard, NOAA, and Sandia representatives in March of 1993. Thepurpose of this workshop was to compare SAR, SLAR, and photographic data from theexperiment, and select a number of regions-of-interest for analysis. These regions-of-interest werethen contrast enhanced, noise smoothed, and downsampled by USCG R & D staff in preparationfor the final task, a data analysis workshop. The final workshop was attended by Coast Guard,NOAA, and SNL representatives and was held at the end of June, 1993. Results from this finalworkshop form the basis for Chapters 2 and 3.
1.6.1 Measures of Effectiveness DefinitionIn order to provide a structured method for evaluating SAR for oil-spill response, several
Measures of Effectiveness (MOEs) were identified. Representatives from the USCG, NOAA, andSNL participated in the development of these MOEs. The meeting was held at NOAA-HAZMATin Seattle, WA, on August 20, 1992, and the participants were:
Gary Hover (USCG R&D Center - Environmental Safety Branch)
Jerry Galt (NOAA-HAZMAT Division)
Deborah Simicek-Beatty (NOAA-HAZMAT Division)
Jeff Bradley (SNL, Remote Sensing Field Test Organizer)
Bob Axline (SNL, Radar System Analyst)
At this meeting, the following questions were identified as being central to evaluating theoil-spill imaging capabilities of SAR and SLAR.
1. Do finer resolutions make it easier for image interpreters to differentiate false positivesfrom oil slicks?
2. At what resolution is the optimum benefit gained?
3. How well does SAR bring out edge details for the interpreter, relative to SLAR?
4. How is this "acuity" affected by wind speed, look direction, and apparent slickthickness/oil state?
1-29

5. How well does the SAR differentiate between ocean clutter and oil slicks?
6. How sensitive is the SAR to slick thickness?
7. What are the wind speed cutoffs for the SAR, relative to the SLAR?
Due to the nature of the oil-slick image interpretation problem, the MOEs developed to addressthese questions were more qualitative than quantitative, as follows:
1. Compare the slick edge details that are visible at several SAR resolutions (i.e. theoriginally collected 2-m resolution as well as several artificially degraded resolutions)with that available on the SLAR system. Acuity is the key parameter: how well doeseach system bring out edge details for the interpreter, and how is the acuity affected bywind speed, look direction, and apparent slick thickness / oil state?
2. Examine the contrast adjustments required to bring out slick edge details and gradientsin slick thickness, as a function of wind speed, look direction, and apparent slickthickness / oil state. Sensitivity is the key parameter.
3. Compare the high- and low-wind speed thresholds (cutoffs) at which each system iscapable of discriminating the full outline of a visible oil slick.
The "quantitative" approach to evaluating the MOEs was to select several slick features ofinterest from the surface truth data collected during the experiment and then to evaluate the abilityof each radar system to discriminate those features as a function of the parameters discussedabove. Quantitative wind, sea, and oil-slick information (described in Section 1.5.1) was used tohelp evaluate the MOEs.
1.6.2 ROI Selection and Analysis of Image Processing Methods
The first data analysis workshop was held at the USCG R&D Center in Groton, CT, March22-25, 1993. The purpose of the workshop was to review the SAR, SLAR, and surface truth dataacquired during the Santa Barbara experiment. The participants were:
Gary Hover (USCG R&D Center - Environmental Safety Branch)
Jerry Galt (NOAA-HAZMAT Division)
CDR Ross Tuxhorn (USCG Gulf Strike Team)
Jeff Plourde (contractor to USCG R&D Center)
Gary Mastin (SNL, Digital Image Processing Engineer)
Following the initial data overview, the participants examined SAR and SLAR scenes, inchronological order, to identify oil features of scientific interest that appeared in both the SAR andSLAR images for each day. Factors such as wind speed, wind direction, antenna look direction,and time differeftce between SAR and SLAR imaging passes were considered. Regions were
1-30

identified in the SAR and SLAR images that contained data of primary interest. The coordinatesof these regions were recorded for extraction and further analysis at a later time. Photographicimages were then reviewed that might show the same features that appeared in the SAR andSLAR scenes. Photographic images included KS-87 reconnaissance photos from the AIREYE,Agiflite photos captured out the window of the AIREYE, 35-mm slides captured out the door ofthe NOAA surface truth helicopter, and miscellaneous photographs taken by crew members of theTwin Otter. Surface truth maps drawn by NOAA observers during the experiment were also usedto help identify features of interest.
After this first workshop, USCG R&D Center analysts used the ROI software to extract full-resolution ROI images from their "parent" mosaic images. Each ROI image was then saved todisk as a raw data file suitable for further processing. As described in Section 1.5.3. 1, companionkey images were also formed to depict the location of each ROI within the test area. These keyimages were imported into Photostylerg and printed on the Kodak XLT 7720. Each ROI imagewas imported into Photostyler®. ROI images that were simple data extractions from the "parent"images were exported directly to the Kodak printer, as were negatives of these images (aftertuning for brightness and contrast to highlight ocean surface features).
The next step was to evaluate three image processing filters for their ability to reduce imagespeckle. SAR images can be corrupted by coherent speckle that obscures the interpreter's abilityto discern subtle detail. This speckle often looks like salt-and-pepper has been superimposed onthe underlying image, and its effect is to draw attention away from the fundamental underlyingfeatures of the image. Noise and speckle smoothing are common techniques employed in the fieldof digital image processing. Fine image detail is usually sacrificed in order create images that areeasier to interpret.
The three speckle filters used in this evaluation were the sliding window average [12], thesliding window median [13], and the Crimmins morphological filter [14]. The concept of thesliding window is simple. For a selected square window size of n x n pixels, the center pixel of thewindow is changed as a function of the pixels in the window. The sliding window averagereplaces the center pixel with the average value of the window pixels. The sliding window medianreplaces the center pixel with the median value in the window. The window is moved pixel-by-pixel to average the entire image. Only the original pixel values are used in the averaging ormedian calculations. (See Figure 1-11.) The sliding window average is one type of low-pass filterthat will smooth speckle, but it has the disadvantage of smoothing edge detail. The slidingwindow median smoothes speckle by eliminating abrupt noise spikes, resulting in better retentionof edge detail than in the sliding window average. The Crimmins filter is an iterative, nonlinearmorphological filter specfically designed to smooth speckle in SAR images. It was designed byTom Crimmins [14] to suppress speckle while retaining edge detail. The number of iterationsmust be specified. For the Santa Barbara images, one to three iterations were commonly applied.Too many iterations can destroy an image.
The sliding window average, sliding window median, and Crimmins morphological filterswere applied to the ROIs selected by participants of the first data analysis workshop. Thecomplete processing for each ROI included 3 x 3 pixel and 5 x 5 pixel sliding window averagesand medians (4 processed output ROIs) plus outputs from 1-, 2-, and 3-iteration Crimmins filters(3 processed output ROTs). The extracted, but unprocessed, ROI was also preserved, as was a key
1-31

Input Image A(kl) Output Image B(mn)
(a)
3 3
B(2,2) -= EA(i,j)
(b)
3 3
B(3,2) = E EA(i+1'j)
(c)
3 3
B(2,3) = E EA(ij+1)i lj- I
Figure 1-11. Schematic for sliding window averaging. (a) Starting in upper-left corner,computing an output pixel, then moving right one pixel (b) until the entire row is processed.
(c) Beginning the process again on the next row.
1-32

image for the ROI. This resulted in a total of 8 ROI files and a key image file for each of theselected regions-of-interest. Each image file was imported by Photostylere, tuned for creating abrightness- and contrast-balanced image (or negative), and exported to the Kodak printer. Theseprints were then assembled in order (key image, unprocessed ROI, unprocessed ROI negative, 3 x3 average, 5 x 5 average, 3 x 3 median, 5 x 5 median, then 1-, 2-, and 3-iteration Crimmins) andaugmented with a brief listing of the processing history and pertinent scene information. The setsof ROls for each radar antenna look direction on each day were compiled, then the daily imagesets were assembled in chronological order and sent to each participant in the workshop.Companion SLAR imagery was also printed and sent to workshop participants for directcomparison of equivalent areas.
The USCG R&D Center prepared for the second workshop by exploring the effects ofresolution degradation on selected SAR ROIs. The Center prepared example images forconsideration by the workshop participants where resolutions were degraded by two simulationmethods; subsampling and adjacent window averaging. (These techniques will be discussedfurther in Section 1.6.3.1.) In a related effort, SNL developed a sample set of SAR images tovalidate the simulation techniques. SNL down-sampled a SAR image in the "optimal" way byreprocessing the phase history returns to form reduced-resolution images. This reprocessing wasperformed for single-look SAR imagery and multi-look SAR imagery. The results were thencompared to the simulated down-sampled SAR images produced with the SNL software at theUSCG R&D Center to verify that the simulations were valid.
The second workshop was held at the USCG R&D Center in Groton, CT, June 28 - July 1,1993. The purpose of this workshop was to examine processed and unprocessed region-of-interestimages that were identified at the first workshop, assess the utility of speckle smoothingalgorithms for SAR images, determine SAR resolution requirements for identifying features ofinterest with acceptable acuity, consider whether SAR imagery exhibited clear advantages overSLAR imagery for oil-spill monitoring, and discuss system trade-offs and design issues for apossible oil-spill SAR. The participants were:
Gary Hover (USCG R&D Center - Environmental Safety Branch)
Jerry Galt (NOAA-HAZMAT Division)
AT2 Bruce Verfailie (USCG Air Station Cape Cod)
Jeff Plourde (contractor to USCG R&D Center)
Bob Axline (SNL, Radar System Analyst)
Gary Mastin (SNL, Digital Image Processing Engineer)
Results from the second workshop appear in Chapters 2 and 3 of this report. At the conclusion ofthe second workshop, several of the most interesting ROIs were selected for a final detailedanalysis of required SAR spatial resolution. These ROls depicted features that could be identifiedin the SAR, SLAR, and photographic surface truth images. The analysis of these images will bediscussed in the next section.
1-33

1.6.3 Analysis of Reouired Image ResolutionsThe question of the spatial resolution at which a SAR should image in order to resolve oil-
spill features with adequate acuity was central to the study. Too fine a resolution results inunnecessarily large volumes of data being acquired, stored, and managed. Too coarse a resolutionresults in the loss of information necessary to identify the oil and monitor its movement. SNL'sSAR acquired images for this study with 2-m pixel resolution. This resolution was judged to befiner than ultimately required for the oil-spill monitoring task.
The first resolution question, then, was to determine how fine a SAR resolution is necessaryfor detailed oil-spill image analysis. This determination would define the acuity level of full-resolution imaging that a Coast Guard oil-spill surveillance radar would be required to provide.The best evaluation of resolution would entail reprocessing the raw radar phase returns to formnew detected images. This method was beyond the scope of the project; however, validatedsimulations of resolution degradations (described below) were performed to aid in determiningthe necessary SAR resolution for oil-spill analysis. Both single-look and multi-look resolutiondegradations were performed for the data analysis workshops.
A second resolution question related to the real-time presentation of full-swath data to anairborne SAR operator. Analysts at the final workshop needed to determine how to downsample afull-swath SAR image that would be too large to display on a monitor, and to judge how muchdownsampling should be performed without losing important visual cues that could help theoperator identify regions-of-interest for further analysis at full resolution.
1.63.1 Evaluation of Methods for Simulating Degraded Image ResolutionsA key issue for this part of the evaluation was the question of how to cost-effectively
simulate SAR images at lower resolutions. As mentioned earlier, reprocessing the phase historydata to form new images is costly and not feasible given the volume of imagery and the range ofresolutions to be evaluated. The overriding goal was to simulate what an operational SAR system(not the SNL research system) could present to the operator and image analyst in near-real time.
The evaluation of degraded resolution imagery began by examining single-look SAR ROIimages that were produced at various resolutions by simple subsampling. Subsampling uniformlyreduces the number of pixels in an image by retaining only one of every n pixels (both verticallyand horizontally) from the original image, where n is the subsampling factor. This concept isillustrated in Figure 1-12. Experience at SNL has shown that simply subsampling pixels in thisfashion is a good approximation to phase history downsampling that one would ideally performon the raw radar returns. Unlike a smoothing or interpolation algorithm, subsampling retains thespeckled appearance of the downsampled image and preserves the edge detail in features.
A validation experiment was performed for workshop participants to confirm the integrity ofthis simulation technique. One single-look ROI was "optimally" downsampled in the phase his-tory domain and a new image was created. This result was then compared with the simulated(subsampled) resolution-degraded image. Figure 1-13 shows the full (2-m pixel) resolution, sin-gle-look ROI used in the validation simulation test. Figure 1-14 shows the result of downsamplingthe phase history and creating a new 10-m pixel resolution image. Figure 1-15 shows the result ofsimulating 10-m pixel resolution by subsampling the ROI shown in Figure 1-13 by a factor of 5.
1-34

(a)
13 15 17 (b2
25 27 29
Figure 1-12. The subsampling process. (a) Example of a full-resolution image. Pixelnumbers represent locations in the image matrix. (b) Example of downsampled image
created by subsampling, in this case by a factor of 2.
1-35

(This page intentionally left blank.)
1-36

6f- 1-37,1-38

45
Xý IF
4
tC
1-39,1-40

ills.,AF2
0O
ý Will
IL.
ML air

Note that the principal difference is in the character of the radar speckle, not in the ability to dis-cern features. This simulation was performed by subsampling the full-resolution image, then rep-licating (repeating) pixels so that the features in the subsampled image are the same size as thefull resolution image. Pixel replication allows downsampled images from different resolutions tobe compared side-by-side. Pixel replication can result in "blocky" images, but it is a more faithfulrepresentation of image content than magnification techniques that invoke smoothing.
After comparing these images, analysts agreed that although the characteristics of thespeckle were slightly different, the ability to discern features of interest was similar in both Figure1-14 and Figure 1-15.
While single-look SAR imagery at a fixed spatial resolution can resolve specific features,the speckled nature of SAR imagery can be distracting to analysts. One could say that the desiredacuity is missing;. One way of creating a reduced resolution image with better feature definition isto create multi-look images. Multi-look images are created by averaging multiple detectedimages, all of which were created during one aperture synthesis period. They have a smoother andless speckled appearance, and the improvement is not made at the expense of degrading fineimage detail. As with the single-look imagery, a true evaluation of spatial resolution reductionwould entail downsampling the multiple raw radar phase histories, forming multiple images, andaveraging the images. This was outside the scope of the project. A technique for simulating multi-look, phase history-downsampled images was implemented in the SNL software, but only after avalidity check was performed on the same region-of-interest as previously mentioned.
Again, a brief description of how the simulation of reduced resolution multi-look imagery isaccomplished is instructive. The concept of adjacent window processing is exploited here. Asshown in Figure 1-16, a window of a specific size, say 3 x 3 pixels, is visualized to overlay theupper left 3 x 3 pixel region of an image (input image). The mean (average) intensity of the imagewithin the window is computed and the central pixel of the window is assigned this meanintensity. This intensity is written into the upper-left pixel locat' on in a new image (output image),then the window is moved one window (3-pixels in this example) to the right, the mean valuecomputation is repeated, and the result is written to the pixel just right of the previous one in thenew image (output image). When an entire row of an image has been processed, the box is moveddown one window (3 rows in this example) and the same processing is performed, from left toright. The output pixels will be written to the second row of the new image. This process iscontinued until all of the input image has been processed. This technique is sometimes called"boxcar" filtering. The resulting output image will be smaller than the input image. In thisexample, it will be 1/3 the size of the input image. If an output image having features the samesize as the input image is required, the output image can be pixel-replicated (by a factor of 3 in ourexample) to form the desired size output image.
To validate this simulation method for degrading resolution, two new images were createdfor the same ROI shown previously. These are shown in Figure 1-17 and Figure 1-18. Figure 1-17 shows the 20-meter pixel resolution ROI image formed by phase history downsampling in the"optimal" way to create multiple images that were averaged to form a true multi-look product.Figure 1-18 shows the result of simulating 20-m resolution by "boxcar" filtering the raw image inFigure 1-13 using a 10 x 10 pixel window. As before, pixel replication was performed so thatfeatures in the simulated image have the same size as in the full-resolution image. Note that the
1-43

Input Image A(k,l) Output Image B(m,n)
(a)
3 3
B(O1) = E A3j)i - 1ju I
(b)
1 3 3
B(2,1) E E A(3 +ij)
in ljl-
(C)
3 3~
i - 1j - I
Figure 1-16. Schematic for adjacent window averaging ("boxcar" filtering). (a) Starting inthe upper-left corner, computing an output pixel, writing the output pixel. (b) Moving right
one window, computing an output pixel, and writing the output pixel. (c) Beginning theprocess again for the next row of output pixels.
1-44

U 1fzcD
-s-J
- -u
1-45. 1-46

E.f~4
40
40

principal difference is that isolated point scatterers in Figure 1-17 appear slightly dimmer in theFigure 1-18 simulation. Workshop participants agreed that the simulated result portrayedimportant image features in a manner similar to the optimally-created product. After examiningthe data processing requirements for a real-time SAR imaging system, SNL determined thatsimulating the multi-look images would provide a realistic representation of what could beproduced in real-time by an operational SAR if not better than 10-m pixel resolution wasrequired. To support the analysis of maximum required SAR resolution, the ROI program wasadapted to include an option for performing "boxcar" averaging. The program Swath-vu was alsocreated to permit "boxcar" averaging of full-swath images to support the analysis of full-swathoperator display resolution requirements.
1.6.3.2 Method for evaluating Full-Swath Image Resolution RequirementsA SAR with the necessary swath width for oil-spill monitoring could conceivably create
full-resolution images that are too large to display on an airborne video monitor. One means ofdealing with this problem is to provide to the operator two monitors, or two independent imagewindows on a single monitor, one showing the full swath at a reduced resolution and one showinga selected ROI at full resolution. A faithful representation of the full scene at a reduced resolutioncould be used to cue the operator to oil-spill returns, prompting the operator to downlink thesurface image to command centers, while a full-resolution view of an ROI could be used fordetailed analysis. What is the best means of presenting a faithful representation of the full swathat a reduced resolution?
Experience in other SAR activities at SNL has shown that an adjacent window-averaged,logarithmically-scaled detected image protrays full-swath data at a reduced resolution very well.The oil-spill application of SAR is primarily concerned with imaging ocean scenes as opposed tocultural scenes on land. The range of detected image intensities should be much lower over waterthan over land; therefore, adjacent window averaging ("boxcar" filtering) of the linearly-scaled(as opposed to logarithmically-scaled) intensities in image mosaics provides an excellentoverview of the full-swath data, as demonstrated in the preceding section.
To support the evaluation of full-swath resolution requirements, selected mosaics of the fulltest area were downsampled to 10-m, 20-m, and 40-m pixel resolutions using the "boxcar"filtering simulation, and were printed for further analysis. These images were not magnified bypixel replication because the objective of the full-swath downsampling was to fit a large-swathSAR image on the operator's monitor. This produced the added benefit of eliminating the adverseeffects of pixel replication (i.e. blockiness). Results of the analysis of these images aredocumented in Section 2.3.2.4 of this report.
1.6.3.3 Method for Evaluating Maximum System Resolution RequirementsThe purpose of this evaluation was to determine a design point for the maximum SAR
system resolution required to support Coast Guard oil-spill surveillance missions. The resolutionof the system should facilitate discrimination of oil slicks from false positivies based on slickedge detail and drift patterns.
1-49

To support this analysis, images were produced at 10-, 14- and 20-m pixel resolutions forselected ROIs. ROI images were provided with pixel replication and without pixel replication.The images without pixel replication resulted in smaller images, but the adverse effects of pixelreplication did not appear. These images sere sent to the participants of the second working groupfor review and comment. Results obtained as a result of the analysis by the working group appearin Section 2.3.2 of this report.
1.7 DESCRIPTION OF SAR PARAMETERS ANALYSIS ACTIVITIESThe objective of this part of the project was to arrive at a set of specifications and a design
approach for a conceptual Coast Guard SAR for oil-spill monitoring and with an added capabilityfor imaging moving ships in a target area. The approach taken in this study is shown in the flowdiagram of Figure 1-19.
1.7.1 Development of Requirements
Using Coast Guard and NOAA inputs, SNL collected and documented conceptualrequirements for a Coast Guard SAR capability. Results of this portion of the study aredocumented in Reference [15](Appendix B).
1.7.2 Calculations and System Suecifications
Using (principally) the above-mentioned requirements as input, SNL developed preliminarysystem specifications for the Coast Guard SAR. This was done using both manual and SAR-design spread-sheet calculations to arrive at numerical values for key radar parameters (pulselength, prf, transmitter power, and so on). When appropriate, calculations were performedparametvically so that the impact on system performance and complexity of changing certainparameters could be determined. For example, design calculations were performed at a numberof assumed range/azimuth resolution settings and various assumed antenna sizes.
Results of an early literature search and more recent analyses of November 1992 flight-testdata also helped in the development and refinement of system specifications.
1.7.3 Trade-off StudiesFor a number of the system parameters (e.g., resolution and antenna size), trade-off studies
were conducted to examine options, costs, and benefits. Results of these studies were then fedback to the system definitions.
1.7.4 SAR Capabilities SurveyIn order to determine current state-of-the-art capabilities of SAR vendors, SNL conducted a
"SAR Capabilities Survey" [ 16](Appendix C). The survey was sent to twelve vendors, along witha copy of the conceptual requirements document [15](Appendix B). The survey consisted of twoparts: a) a request for specific numerical tabulated data on vendor systems, and b) a request for amore free-form textual discussion of the vendor's capabilities as they might relate to meetingCoast Guard requirements. Seven of the twelve vendors responded, each at varying levels ofdetail. Results of the survey are summarized in Section 2.5.4 of this report.
1-50

gather'operationalrequirements
documentconceptualrequirements
to cost/performbenefit
Sparametric >befi
calculations analysesdevelop SAR
system >specificat
conductcapablitiessurvey )
perform_ _trade-off
perform analysesliteraturesearch
factor-inflight-testanalyses
Figure 1-19. Flow of SAR Parameters Analysis Activities.
1-51

(This page intentionally left blank.)
1-52

CHAPTER 2EVALUATION RESULTS
2.1 INTRODUCTION
This chapter presents the results of evaluating the SAR and SLAR data obtained during theNovember 1992, Santa Barbara experiment, identifies important SAR parameters that could affecta Coast Guard-specific SAR design, and discusses the costs and benefits of a SAR system relativeto the existing Coast Guard AIREYE SLAR system. The information presented here provides thecornerstone for a mission-tailored system design should the Coast Guard determine that a SARcapability would benefit its operations. The image analysis activities have been performed by ateam of experts representing operational and scientific interests in order to assure as unbiased anassessment as possible. Likewise, the expertise of a variety of SAR design and manufacturingfirms has been solicited in identifying SAR capabilities that are currently available to beintegrated into operational systems. The knowledge obtained from this diverse pool of expertisehas been evaluated to objectively identify cost/benefit trade-offs for a SAR system vs. theexisting, or slightly modified, Coast Guard SLAR system.
2.2 IMAGE DATABASEThe image data acquired by both the USCG AIREYE SLAR and the SNL SAR are
summarized in Table 2-1 and Table 2-2. The test area number listed in the tables can be referencedto the chart shown in Figure 1-6. Any problems in data acquisition are cited, as are the generalenvironmental conditions.
As will be mentioned in the next section, the database was pruned to identify subsets ofparticular interest for specific analysis tasks. One subset of the data was identified for region-of-interest study by participants during the first data analysis workshop. Table I-1(Appendix I) liststhese images. A further subset of this data was identified by participants in the second dataanalysis workshop to be used in a detailed SAR spatial resolution study. These images arehighlighted in Table 1-1 with an "" in the "Date" column heading. Note that in several cases theregion-of-interest dimensions were expanded for the resolution study. The expanded dimensionsare also marked with an "".
2.3 IMAGE ANALYSIS RESULTSThe image analysis task began with an image-by-image review of all the SAR and SLAR
data acquired during the November flight tests. Participants at the first data analysis workshop(see Section 1.6.2) compared and contrasted SAR and SLAR images with each other and withKS-87 aerial reconnaissance photographs, Agiflite, and other available photographs. Thecomparison of SAR and SLAR data showed that the best oil and sea returns occurred on the Nov.12 and Nov. 15 tests. The majority of the analysis activities concentrated on regions-of-interestextracted from data acquired on these days. When features that were of interest to the analystsappeared in both SAR and SLAR scenes, an attempt was made to identify the same features in theavailable photographs. The USCG R&D Center created very large photomosaics from the KS-87frames and these mosaics were the primary source of photographic comparison. Voids between
2-1

Table 2-1. SAR Data Summary
Date Test Area& Passes Flown Comments
Nov. 10 4 north-looking low wind, some con-trast
Nov. 10 4 west-looking low wind, some con-trast
Nov. 11 4 east-looking calm, low contrast
Nov. 11 4 south-looking calm, low contrast
Nov. 12 1 west-looking low wind, good con-trast
Nov. 12 1 south-looking low wind, good con-trast, waves visible
Nov. 14 1 south-looking very, very calm onepass
Nov. 14 1 west-looking very, very calm
Nov. 15 1 north-looking calm, some contrast
Nov. 15 1 east-looking calm, some contrast
Nov. 15 1 south-looking calm, variable contrast
Nov. 16 1 south-looking no data
Nov. 16 1 west-looking no data
1. All SAR passes were flown at an altitude of 10,500 ft
2-2

Table 2-2. SLAR Data Summary
Date Test Area Passes Flown Comments
Nov. 10 4, altitude - 5500 ft east-looking Low wind, some contrast.north-looking Technical problem, data werewest-looking unrecoverable.
Nov. 10 4, altitude - 9500 ft east-looking Technical problem, data werenorth-looking unrecoverable.west-looking
Nov. 11 4, altitude - 5500 ft east-looking Calm, low contrast. West-look-north-looking ing data very good.west-looking
Nov. 11 4, altitude - 9500 ft east-looking West-looking shows linearnorth-looking emulsified oil feature.west-looking
Nov. 12 1, altitude - 5500 ft south-looking Low wind. Good contrast.east-looking West-looking and south-look-west-looking ing data very good.
Nov. 12 1, altitude - 9500 ft south-looking South-looking and west-look-east-looking ing data very good.west-looking
Nov. 14 1, altitude - 5500 ft south-looking Very, very calm.east-lookingwest-looking
Nov. 14 1, altitude - 9500 ft south-lookingeast-lookingwest-looking
Nov. 15 1, altitude - 5500 ft north-looking Calm, but increasing contrasteast-looking with time. North-looking andwest-looking west-looking data very good.
Nov. 15 1, altitude - 9500 ft north-looking North-looking data very good.east-lookingwest-looking
Nov. 16 1, altitude - 5500 ft south-looking Medium wind, very j •-,. con-east-looking trast. Very good data.west-looking
Nov. 16 1, altitude - 9500 ft south-looking Very good data.east-lookingwest-looking
2-3

frames and sun glint made some feature identification difficult, but workshop participants wereable to correlate many features in both radar and optical images.
Before beginning a discussion of specific issues investigated by the workshop participants,such as speckle smoothing techniques, single-look and multi-look resolution, and operational datapresentations, it is helpful to present a brief synopsis of the SAR, SLAR, and photographic datareviewed by the participants. This will give the reader a sense of what can be seen in SAR, SLAR,and photographic data and how differently similar features are portrayed by the various sensors.
A representative set of images (Figure 2-1 through Figure 2-4) comes from the Nov. 15tests. These images concentrate on the region just offshore (south) from Coal Oil Point where oilis entrained in the near-shore current. Kelp beds are also visible in the SAR and SLAR images.Figure 2-1 is a photograph of the region taken by a crew member aboard the SNL Twin Otteraircraft. Figure 2-2 is a small photomosaic created from several frames of the KS-87reconnaissance camera aboard the AIREYE. Figure 2-3 is a SAR region-of-interest correspondingto the area of the photographs. Figure 2-4 is a region-of-interest extracted from a SLAR image ofthe same area. Pixels have been replicated to create this image. All of these images were capturedwithin roughly 30 minutes of each other. Despite differences in illumination wavelength andspatial resolution between the radars and between radar and optical sensors, the same basicstructure of the oil can be perceived. In particular, note the ability of the radars to identify theedges of the slicks.
Surface oil can, after a period of time, take on physical properties similar to partially driedlatex paint and can entrap flotsam. This drastically changes the radar signature of the oil frombeing a flat, mirror-like reflector (deflecting the radar signal away from the receiver) to becominga roughened surface reflector, many parts of which return a significant portion of the incidentsignal directly back to the antenna. In these cases, the edge of the oil slick appears bright in radarimages. Figure 2-5 is a photograph of this type of oil slick extending from below the Hollyplatform diagonally upward toward Goleta Point. The same feature is visible in both the SAR (seeFigure 2-6) and SLAR (see Figure 2-7) images of this area.
The final example shows an extensive oil slick just east of the Holly platform. Figure 2-8 isa photograph of the slick taken from the SNL Twin Otter. Figure 2-9 is a SAR mosaic of the samearea. During the final two imaging passes (bottom two mosaic strips), the surface wind picked upenough to provide excellent sea return where the water surface was not damped by oil. Thephotograph was captured 30 min. before the SAR image, so there is some difference in the oilboundaries.
2.3.1 Results of Speckle Smoothing EvaluationThe three speckle smoothing algorithms described in Section 1.6.2 were applied to the 2-m
resolution ROI images listed in Appendix I. The resulting images were analyzed during thesecond data analysis workshop held June 28 through July 1, 1993, at the USCG R&D Center. Theworkshop participants, representing the USCG R&D Center, the USCG Air Station Cape Cod,NOAA-HAZMAT, and SNL, examined roughly 250 raw and processed images selected from 32ROIs. A typical set of data for a region-of-interest included the following:
2-4

nU
-,
*2z,ý
-J ,Al
~* -~*'it
~ **~ 7 *424
~ 7P
~ *1

Figure 2-2. Small photomosaic created from several KS-87 frames
captured by the AIREYE off of Coal Oil Point, on Nov. 15, 1992.
2-7, 2-8

;?l
7t-7
imC
-P 3
2 ',A-1t

coal OilPoint
Figure 2-4. SLAR ROT just off of Coal Oil Point, captured by the AIREYE SLAR on Nov. 15, 1992.
2-11, 2-12

�,i.Y�i�
C
±11
CU
2L0
C'
0
'I
0
0
6..0
C.C'1.
00
Liif44
I-
2-13, 2-14

t-n
Q.
0.
0
o.5
o
00tO 51
0•'I
Cu
I-
Ino43o
'U.z°
2-15, 2-16

CIO
-18-

it
C.,',
4. * CsWi = .c
r � -
' ..
0c S1�CL
.- p.
- - C,
>o CL �z2cz
0 CL0 0
C-.-,...*- 0-- C-
C-
o .0C-
-� 0CsL. -
2-19, 2-20

CC0. .
CL
0 o0
d .!d
(A02
kc A
2-21, 2-22

1. Raw image file.
2. Sliding window average, 3 x 3 pixel window.
3. Sliding window average, 5 x 5 pixel window.
4. Sliding window median, 3 x 3 pixel window.
5. Sliding window median, 5 x 5 window.
6. Crimmins morphological filter, I iteration of 3 x 3 pixel window.
7. Crimmins morphological filter, 2 successive iterations of 3 x 3 pixel window.
8. Crimmins morphological filter, 3 successive iterations of 3 x 3 pixel window.
Figure 2-10 through Figure 2-14 show some of the results selected from the list above for oneregion-of-interest.
Speckle smoothing reduces the objectionable effect of coherent speckle in radar images, butit does so at the expense of visual acuity. This is most obvious in the sliding window averageexample, Figure 2-11. The averaging process not only smooths speckle, it also smooths edges.The edges at the oil/water interface in Figure 2-11 (central box) are smoothed to such a degreethat workshop participants felt important detail that can occasionally be used to characterizepetroleum oil, as opposed to plant or animal oils, were lost Notice also that point-like specularreflectors (upper box in Figure 2-11) appear to be smeared as a result of sliding windowaveraging. Median filtering is an alternative to the edge-smoothing criticism of average filtering.By replacing the central pixel of the sliding window with the median, speckle is reduced sincespeckle is characterized by exceedingly bright or dark single pixels within the window. Theadvantage of the median over the average is that edge contrast is better maintained. Edgeintensities tend to have gray ,' ' closer to median intensities within the window than dospeckle intensities, hence, edge -ireserved. This benefit is easily observed by comparing theoil/water interfaces in Figure 2-: and Figure 2-12 (central boxes). A radical departure fromeither average or median filtering is the Crimmins morphological filter. The Crimmins filterattempts to find and reduce the intensity of isolated bright scatterers (or, alternately, to find andincrease the intensity of isolated dark pixels). By attempting to alter only speckle pixels, edges arepreserved. A comparison of the Crimmins-filtered image (Figure 2-13) with the average- andmedian-filtered results (Figure 2-11 and Figure 2-12) shows that sea returns are smoothed less(central box) and isolated scatterers retain their structure (upper box).
Any type of speckle filtering has the distinct disadvantage of destroying information. Nomatter how the filtering algorithm is tailored, it is impossible to distinguish speckle pixels fromother pixels. As a result, potentially important information is lost at the same time that speckle isreduced. It is generally not a good idea to incorporate a process that destroys information into thedata acquisition and image formation process. It is better to reserve speckle smoothing as a post-processing step to be invoked only when required.
2-23

(This page intentionally left blank.)
2-24

4 -
4.
fL.
4 -�. 5
�1
�. ---. 7 - 'A
V f-I
I
4 I.� p �2 2�, 2 26

o 4R W--
2-27 2 28

4,.L
Of,.
2-21), 2-361

AC'
Lv ILI
It--
**t:~ *YqJ
2-31. 2-E

The consensus of the workshop participants was that speckle smoothing should not beincluded as a part of an on-board SAR processor. The majority of the SAR images resulting fromthe Santa Barbara experiment were of a high enough quality that any type of speckle smoothingresulted in a poorer quality product than the original. A similar performance is expected in anoperational SAR for oil-spill reconnaissance. The workshop participants did, however, recognizethat there could be situations where ground-based post-processing of regions-of-interest would beappropriate. Any ground-based exploitation system for detailed analysis of images should includespeckle smoothing capabilities. The participants recommend the median or the Cnmminsmorphological filter (or both). The mean filter smooths edge detail to too great a degree.
2.3.2 Results of SAR Resolution StudyThe same workshop participants that evaluated the speckle smoothing filters also
investigated the selection of the "optimal" SAR resolution. As explained in Chapter 1, theanalysis of required SAR resolution addressed three issues:
1. Single-look versus multi-look processing
2. Required maximum system resolution
3. Required full-swath display resolution.
The maximum system resolution study determined the finest spatial resolution required fordiscerning subtle image features within an ROI that are necessary for identifying oil spills. Thiswas the primary study. The full-swath resolution study attempted to identify the amount and typeof downsampling necessary to reasonably present full swath imagery to the system operator. Thisstudy was necessary because the display hardware cannot present a full swath of data that wasoriginally acquired with the same resolution required for ROI analysis. Because the operationaldata presentation study depended upon the results of the ROI study, the data presentation studywas secondary.
2.3.2.1 Single-look vs. Multi-look Processing
A subset of the 32 raw regions-of-interest used in the speckle smoothing study was used inthe resolution study. Simulated resolution degradation was performed by subsampling and pixelreplicating some of the 32 single-look ROI images to create 10--m, 20-m, and 40-m pixelresolution products. While examining the region-of-interest shown in Figure 2-14 through Figure2-17, several participants commented that 10-m pixel resolution was quite adequate foridentifying subtle image features, but that fine detail was obscured by image speckle. (See oval-shaped return in center of image that is crossed by thin oil streaks.) Rather than sacrifice acuity byperforming a speckle smoothing operation, the participants investigated the possibility ofexploiting multi-look processing. As explained in Section 1.6.3.1, multi-look processing resultsfrom averaging multiple independent looks at a common scene which were gathered at the sametime. The averaging process reduces the effect of speckle (improves acuity) while preserving thepixel resolution of single-look imagery. Workshop participants judged the multi-look imagery tobe superior to single-look imagery at the same spatial resolution. The decision was made torecommend multi-look imaging for any future Coast Guard SAR.
2-33

2.3.2,2 Maximum System Resolution Requirement
As stated in Chapter 1, reprocessing all of the raw SAR data from the experiment to createmulti-look images was beyond the scope of the project, so a high-quality simulation of multi-lookimages was performed by post-processing the existing single-look data. A reduced set of ROIswas identified by the participants for this processing to support a detailed analysis of the requiredCoast Guard system maximum resolution. These regions are listed with a "*" in Appendix I.Downsampled pixel resolutions of 10-m, 14-m, and 20-m were presented for the regions inAppendix I marked with an "*"
A representative set of simulated multi-look ROls is presented in Figure 2-14 throughFigure 2-17. Figure 2-14 shows the ROI at full resolution (2-m pixel). Figure 2-15 shows thesame ROI after a 5 x 5 "boxcar" filtering followed by pixel replication, as discussed in Section1.6.2. This figure simulates 10-m multi-look imagery. Figure 2-16 shows the result of 7 x 7"boxcar" filtering to simulate 14-im multi-look imagery. Finally, Figure 2-17 shows the result of10 x 10 "boxcar" filtering to simulate 20-m multi-look imagery. When comparing the images,attention is directed to detail in the emulsified oil (brightened linear return) entrained near the kelpbed below and lelt of the pr'-nt of land. Attention is also directed to the water/oil interface near thebright point scatterer in the lower left of the image, which is the Holly oil platform, and to thenatural gas upwelling in the lower right comer of the image. The loss of fine detail withdegradation in resolution is obvious.
Pixel replication was used to create downsampled images having the same size as the fullresolution image, but this can create an objectionable "blocky" appearance in the downsampledimages. This is especially true for the 20-m pixel images. Several workshop participants wereconcerned about this artifact, so some of the ROIs were downsampled and printed without pixelreplication. This resulted in substantially smaller images. These smaller images were examinedwith optical loupes to verify that important features could be visualized at reduced resolutions.
Workshop participants studied the reduced resolution multi-look simulated imagesindependently and reported their conclusions. A few of the participants were willing to accept14-m pixel resolution, but all agreed that 10-m resolution was preferred. The consensus of thegroup was that 10-m multi-look images were preferred for ROI analysis.
2.3.2.3 Other Resolution IssuesAn important issue arose during the resolution study regarding SAR imaging look
directions. There can be a distinct difference in perceived resolution of SAR images of the samescene when looking across wave crests (up-wind or down-wind) and along wave crests (cross-wind). This difference is evident when comparing Figure 2-18 (looking across the wave crests,up-wind/down-wind) and Figure 1-13 (looking along the wave crests, cross-wind). The pooreracuity in Figure 2-18 is due to the radial motion of waves along the antenna look direction. Thiscreates a doppler signal that is interpreted by the SAR as a change in the horizontal location of thewaves in the image. (See Section 1.3.2 and Section 2.4.2 for further discussions.) This lookdirection anomaly is not tied to resolution. Higher spatial resolutions, however, provide moreinformation and higher acuity to the analyst even in the presence of motion degradation.
2-34

Point ~ .
Fiure 2-14. Single-look ROI at full resolution (2-rn pixels).
-35, 2-36

-A Point
'I A-
Figure 2-15. Simulated 10-rn pixel resolution multi-lookROI created from the image in Figure 2-14.
2-37, 2-38

- ~~~Point .U -.
*'4
Figure 2-16. Simulated 14-rn pixel resolution multi-look
ROI created from the image in Figure 2-14.
2-39,2-40

coal ONB~ 3 Point
Figure 2-17. Simulated 20-mn pixel resolution multi-lookROI created from the image in Figure 2-14.
2-41,2-42

4iTa w1
'14
iL ..
C.9L.Oom
,- t" t
-. a: 0 c-- *~~ C/)f -
CIE
cr
Kcc Ic .

Workshop participants felt that 14r-m resolution was adequate, but that 10-m resolution waspreferred when motion degradation was present.
2.3.2.4 Full-Swath Image Resolution Requirements
The operational resolution investigation was the second part of the resolution study.Participants examined full swath images with reduced pixel resolutions of 10 m, 20 m, and 40 m.Two of the mosaics for this investigation came from the Nov. 12, 1992, test and two came fromthe Nov. 15, 1992, test Downsampling was performed by adjacent window averaging, asdiscussed in Chapter 1. Pixel replication was not performed following adjacent window averagingsince the task was to produce a smaller image of the full swath for display on an airborne monitor.
Several significant comments were made by the workshop participants who examined theresolution-degraded full-swath images. Figure 2-19 shows one of the Nov. 12, 1992, images at20-m and 40-m pixel resolution. Notice that the windrows to the right of Goleta and Coal OilPoints are retained at 20-m resolution, but lost at 40-m pixel resolution. Figure 2-20 shows one ofthe Nov. 15, 1992, images at 20-m and 40-m pixel resolution. Kelp texture (just below Coal OilPoint) is lost at the 40-m pixel resolution. Narrow fingers of oil in the lower-left corner of theimage are also lost at 40-m resolution. The 20-m resolution image clearly shows continuity ofsmall linear features that are lost in the 40-m resolution image.
The consensus that resulted from the operational resolution study was that full swath imageswith pixel resolutions reduced to between 20-m and 30-m by adjacent window averaging("boxcar" filtering) was sufficient. Most agreed that 20 m resolution was preferred, but there wasan understanding that monitor size and cost constraints might make 30-m pixels a more attractivealternative. One analyst made an important point, however, that should be considered whendeciding upon monitor size and pixel resolution for full-swath display. Eye strain becomes asignificant issue in an operational scenario. A high-resolution (20-m pixel) display on a smallmonitor may provide all the necessary information, but fatigue from examining a small monitorwill ultimately negate the advantage of the higher resolution. Participants all agreed that 40-mpixel resolution was too coarse for identifying regions needing detailed analysis at full resolution(10 m).
2.4 SAR vs. SLAR: DISCUSSION OF TECHNICAL ISSUESSection 2.3.2 dealt with the determination of appropriate resolution for a Coast Guard SAR
by comparing AIREYE SLAR images with SNL SAR images from the November 1992 SantaBarbara flight tests. The purpose of this section is to discuss technical advantages anddisadvantages of SAR vs. SLAR. Portions of the discussion will compare generic strengths ofSAR with the current AIREYE SLAR. However, as appropriate, SAR attributes will be comparedto those of a more generic SLAR.
2.4.1 Attributes That Need Not Be Used in the Comparison
There are a number of attributes of modern SAR that the AIREYE SLAR does not currentlypossess but that could be incorporated into a new-design SLAR or into the AIREYE SLAR as anupgrade. It is important to at least list these capabilities; however, it is not proper to use them in a
2-45

(This page intentionally left blank.)
2-46

Goleta PointNaples
cdOI point
(a)
Figure 2-19. Example of 20-rn (a) and 40-mn (b) full-swathdisplay images from the Nov. 12, 199 data set
2-47, 2-48

Napes cdO1' - Point
(a)
(b)
Figure 2-20. Example of a 20-m (a) and a 40-m (b) full-swathdisplay image from the Nov 15, 1992 data, set.
2-49,2-50

SAR/SLAR comparison, because either type of radar could use these features. These attributes
are listed below.
Pulse Compression and Range Resolution
The use of pulse compression to trade pulse width for peak transmitter power is not peculiarto SAR. The AIREYE SLAR does not employ pulse compression; however, some SLARs do.Also, ignoring the issue of system sensitivity for the moment, either SAR or SLAR can achievethe same levels of range resolution, since this resolution is determined only by bandwidth of thetransmitted pulse.
Digital Representation. Storage. Manipulation. and Display of Srip-Map Data
Modern technologies for acquisition and handling of digital data could be applied in thedesign of a SLAR as well as that of a SAR. This issue is expected to be addressed as part of theAIREYE system upgrade project recently initiated by the Coast Guard's AeronauticalEngineering Division (G-EAE).
Automatic Registration of Images with Standard Charts
One strong feature of the AIREYE SLAR is its ability to produce hardcopy image productsthat can be laid-over standard aeronautical charts for the purposes of image interpretation andspill-response planning. An equivalent capability should be incorporated into any new CoastGuard SAR design.
2.4.2 Attributes for Which SAR and SLAR Differ SignificantlyThere are a number of intrinsic differences between SAR and SLAR that can be compared
and contrasted in terms of the advantages and disadvantages they offer. This section describesthese basic differences.
Advantage of SAR: Achievable Azimuth Resolution
The principal benefit of SAR is its ability to use a synthetic aperture to synthesize extremelyfine beamwidths. This allows the SAR to obtain resolution of the order of 10 m (or better) at 54-km range. SLAR uses a real antenna beam; airborne antennas cannot be made large enough toachieve azimuth resolutions that can be achieved by the SAR technique. In particular, theAIREYE SLAR's 0.80 beamwidth supports azimuth resolution of about 750 m at 54-km range.As explained in Section 1.3.3. 1, the SLAR azimuth resolution grows progressively coarser asrange from th,ý aircraft increases and the beam spreads. This means that, in the SLAR image,definition of along-track features in the target area is not uniform and can become unusable for oilslick identification at medium to long ranges.
Advantage of SAR: Constant Azimuth Resolution Over the Swath
Because the length of the synthetic aperture can be changed as a function of range, it ispossible to keep azimuth resolution reasonably constant over a very wide swath using the SARtechnique. As shown in [ 17] (Appendix D), it is also possible, in the SAR processing, to keep the
2-51

number of looks approximately constant across the wide swath. A SLAR's azimuth resolutionmust degrade in proportion to the target range; therefore, if range increases 6:1 across the swath,resolution will be 6 times as coarse at far range as at near range. For example, the AIREYESLAR's azimuth resolution degrades from about 120 m at 8.5-km range to about 750 m at 54-kmrange.
Advantage of SAR: System Sensitivity
When sensitivities of SAR and SLAR are compared in terms of aOmin, the minimumdetectable distributed-target cross section that the radar can detect at a stated signal-to-noise ratio(SNR) and range-to-pixel, the resulting SAR and SLAR numbers may be comparable, given thataverage transmitter power and other critical parameters (particularly antenna beamwidth andrange resolution) are similar. For example, estimated AIREYE sensitivity at 54-km range is about-42 dB [7](Appendix A) and, by design, sensitivity of the SAR proposed in Section 2.5 of thisreport is about -45 dB. However, when sensitivity is viewed in terms of the minimum detectableradar cross section (in m2) of a single pixel (either of a point target or of a distributed target), SARsensitivity will normally be much better (other factors being equal). This is because the SAR'sclutter-cell area will normally be one or more orders of magnitude smaller than the SLAR'sclutter-cell area. The improved sensitivity of the SAR is due to its ability to coherently integrateenergy across the aperture, whereas a SLAR only integrates energy noncoherently. This improvedsensitivity carries over to the case of imaging moving targets, in the event that the SequentialDoppler-Frequency Translation SAR Moving Target Indicator (SFT/SAR MTI) mode [18](Appendix E) is implemented.
Advantage of SAR: More Precise Image Registration Knowledge
Although not an attribute exclusive to SAR, The SAR's ability to determine thegeographical coordinates of the imaged patch should be better than for SLAR because of thepresence of a more accurate navigation system (required for the SAR image-formation process[19]). Further, the better azimuth resolution of the SAR contributes to improved accuracy indetermination of relative locations of image features.
Advantage of SAR: Smaller. Steerable Antenna
A SAR can, in principal, use a very small antenna (wide azimuth beamwidth) and stillsynthesize a very narrow synthetic beam. In practice, it is prudent to limit azimuth beamwidth tokeep transmitter power requirements under contro;. As will be concluded later in this report, itshould be possible to make the SAR's antenna of the order of one meter long and maintaintransmitter power at a reasonable level. This means that the SAR antenna could be steered so thatit always points at a right angle to the desired flight path (no squint). This makes imagerectification automatic. In contrast, the current AIREYE SLAR rectifies the image bymanipulation of the CRT trace. Further, any image rectification performed in an AIREYE SLARupgraded for recording of digital data would require additional digital signal processing of imagedata.
2-52

Advantage of SAR: Superior Performance of MTI Mode
As discussed in detail in [18](Appendix E), SLAR's signal-to-clutter performance for pointtargets (either moving or stationary) against an ocean clutter background is not very good, andany MTI mode added to either SLAR or SAR radars will greatly enhance performance againstfast movers. If an SFT/SAR [18] MTI mode is implemented with a SAR, very significantperformance increases can be had. For detection of a fast moving point target in ocean clutter,SFT/SAR mode sensitivity is estimated to be about 37 dB better than a simple RAR mode thatmight be added to an operational SAR and about 42 dB better than AIREYE SLAR performance[18].
Disadvantage of SAR: Azimuth Defocusing Due to Ocean Movement
November 1992 flight test images provided evidence of a shortcoming of SAR in imagingthe ocean. Because the SAR image is formed based upon the Doppler frequency of echo fromeach point in the scene and based upon the assumption that nothing in the scene is moving,movement of elements of the target scene radially toward or away from the radar can cause localdistortions in the SAR image. In particular, elements moving toward the SAR will be translated,in the SAR image, along-track, in the direction of motion of the aircraft. Elements moving awaywill be translated in a direction opposite the motion of the aircraft. This effect only degrades thesystem's effective azimuth resolution capability; range resolution is not affected.
The west-looking SAR image from November 12, shown in Figure 2-18, shows that motionof the long waves can cause significant rending of cross-track linear features in the image. Theeffect is most pronounced when the SAR look direction is normal to the wave fronts of the longwaves. As the long wave propagates, water molecules on the front of the wave move toward theradar; molecules on the back of the wave move away. Therefore, the front of the wave is movedone way in the image and the back of the wave is moved the opposite way. This defocusing effectcaused by motion of the long waves is not strongly dependent on the aperture time and is moredetermined by wave velocity, aircraft speed (faster is better), and imaging geometry.
The effects of wave motion are obvious upon examination of narrow, linear, cross-track(east-west) features visible in the Figure 2-18 image. Half of the linear features appear to havebeen combed forward (along-track), the other half backward. Azimuth defocusing of tens ofmeters is apparent in the subject image.
By contrast, south-looking SAR images of the same test area and on the same day (see, forexample, Figure 1-13) show no such effects. This is because for these images, the look directionof the SAR is very nearly along the wave crests, and there is no significant motion of the waterradially toward or away from the radar.
The amount of displacement (in the SAR image) of a radially-moving target cell will beproportional to the range from the SAR to the target, so significant defocusing (many tens ofmeters) must be expected in the worst-case scenario (high wave-front velocities, look directionnormal to the wave-fronts, far side of the range swath).
2-53

Although not apparent from the flight-test images, some azimuth smearing should beexpected due to more-or-less random movement of capillary waves that ride on the long waves.Radial velocities of water molecules due to capillary wave motion appear to be significantlysmaller than velocities due to long-wave motion. This effect, were it observable, could beexpected to be most pronounced when the SAR looks either down-wind or up-wind. Thissmearing effect due to capillary-wave movement should also become more pronounced at longerranges.
One can conclude from the discussion above that minimum azimuth smearing of the SARimage will occur when the SAR looks in a direction normal to the direction of wave propagationand normal to the direction of the wind (wind and wave directions often coincide).
Defocusing of the SAR image due to long-wave motion must be recognized as afundamental limitation of SAR for oil-spill monitoring. This effect implies that, while the SAR'srange resolution capability can be realized in all cases, its azimuth resolution capability will be astrong function of look direction and wind/wave conditions, with optimum performance occurringat a look direction parallel to the long-wave wave-fronts and poorest performance occurring whenthe SAR looks normal to the wave-fronts. A detailed analysis of this phenomenon is provided in[21] (Appendix H).
Advantage of SLAR: Same Mode for Moving and Stationary Targets
All moving targets appear in the SLAR image, their resolution and crispness depending ontheir range and speed. The basic SAR mode only images stationary and slowly moving targets(radial velocities less than about 2 knots). Either a real-aperture radar (RAR) or moving-targetindicator (MTI) mode would need to be added to an operational SAR to image fast movers (radialvelocities between about 2 knots and 40 knots).
Advantage of SLAR: Simplicity
One of the primary advantages of SLAR is its simplicity in relation to SAR. It is importantto identify and compare the major components and/or functions for which SAR complexity issignificantly greater than for SLAR. Then cost/benefit considerations can concentrate on theseareas, and the costs of added complexity of the SAR can be weighed against the primary SARbenefits of finer azimuth resolution and better sensitivity.
- Inertial Measurement Unit (IMU). Motion measurement for SAR must be more preciseand support higher update rates than for SLAR. GPS aiding will also be requued [19].
* Gimbal Mounting and Control. Under the assumption that it would not be feasible togimbal-mount an antenna for an oil-spill monitoring SLAR, this item should be identifiedas an extra expense in a comparison of SAR and SLAR complexity. Note, however, thatany SLAR would require some pointing control and movement of the antenna to accountfor short-term yaw variations, so a proper approach would be to attempt to compareestimated costs of the AIREYE SLAR's antenna- mounting and control system with thosefor a SAR gimbal implementation.
2-54

"* rf Circuit Linearity. Phase and amplitude linearity of rf circuits is more important for SARthan SLAR; however, we believe that, because of the relatively narrow bandwidths (lessthan 15 MHz) of the proposed SAR system, these added requirements do not translate to asignificant cost difference.
"• IF Processing and Digital Prefiltering. SAR processing requires that matched in-phase andquadrature (I & Q) video channels be created at the output of the final IF mixing stage.Both channels are then digitized and pre-filtered using a dual-channel presummer/high-pass filter combination. SLAR requires only one video channel, this being a magnitude-only channel, followed by an accumulator that is simpler than the SAR pre-filter.
" Image Former. This component is the greatest single contributor to incieased complexityin the SAR. For the SLAR, the image comes directly out of the relatively simpleaccumulator. Image formation for SAR requires that many computations be performedvery rapidly in order to "compute" the SAR image. More detail on the image former isprovided in Section 2.5.2.
" Operator Training. There will be some increased operator training burden for a SARsensor system; however, we believe that radar and navigator initialization and operationcan be largely automated and that the primary need for increased operator training will Nzin the area of ROI selection, processing, and disposition. Some of this increased trainingwould also be needed for operators of any new-build SLAR or upgraded AIREYE SLARhaving similar data-manipulation capabilities.
" Sensor System Maintenance. The IMU, gimbal, and phase-history collector are likely torequire more periodic maintenance and alignment than their counterpart assemblies in thecurrent AIREYE SLAR. Further, the image former will increase the maintenance burdensomewhat. This is because the image former is only required for the SAR (as pointed outbefore, the SLAR's image former is really just an accumulator) and because it is arelatively complex module.
2.5 SAR PARAMETERS ANALYSIS RESULTSA SAR parameters analysis study conducted by SNL resulted in a detailed set of
specifications for a conceptual Coast Guard SAR that would be capable of both oil-spillmonitoring and imaging moving vessels at sea. This section summarizes the results of thisanalysis. Where specific components and architectures are called out, they have been selectedbased on proven, currently-available technology. Future developments may provide alternativedesigns and components that are more desireable.
2.5.1 Development of RequirementsConceptual requirements for a Coast Guard SAR are documented in Reference
[15](Appendix B). This section describes the major requirements identified during the study.Other requirements will be evident from Section 2.5.2. Primary requirements are as follows.
"* Aircraft Type: Falcon 20 or HC-130; typical velocity 125 m/s.
"* Missions: ocean imaging for oil-spill monitoring ice reconnaissance, and imaging ofmoving ships. Moving-target imaging may require either a RAR or MTI mode.
2-55

"* Resolution: approximately equal range and azimuth resolution, values to be determined by
analysis of flight-test data.
"* Technologies: emphasize "off-the-shelf' components.
"* Current systems: consider use or modification of existing SARs to meet Coast Guardrequirements.
"* Data availability: real-time.
"* Operators: enlisted Coast Guard airmen.
"* Swath: 20-25 nmi minimum.
"* System sensitivity: 0' < -40 dB at 6-dB SNR and maximum range.
"* Operating frequency: (C-Ku bands), to be determined.
"* Polarization: VV.
"* Image requirements: magnitude-only, rendered as square pixels in the ground plane.
"* Image calibration: no requirement.
"* Image annotation: latitude/longitude, date, time, altitude, speed, pitch/yaw/roll, heading,comments, and other mission support symbology.
"* Data recording: all real-time imagery, navigation, and auxiliary radar data. Requires"engineering evaluation" capability for recording of phase histories. Media to be ofremovable type.
"* Image display: one display for decimated, full-swath real-time imagery and one fordisplay/processing of regions of interest (ROIs) and for radar control.
"* Image processing: capability to select and extract full-resolution regions of interest (ROIs)and process these ROIs (decimation, replication, contrast stretching, preparation fordownlinking).
"* Telemetry: SAR system must prepare files for downlinking via third-party telemetry (TM)
link.
"* Printing: must provide capability to print coarse-resolution imagery in-flight.
2.5.2 Calculations and System Specifications
By interpreting requirements identified in [ 12] and by performing SAR design calculations,SNL engineers arrived at system specifications detailed below.
2-56

2.5.2.1 General Description of Recommended DesignThe recommended design is a wide-swath, relatively coarse-resolution (10-30 m), SAR
operating in the X band. The system could operate from 2.5 - 6 km altitude with little change inperformance. The imaged swath would extend from 8.5-km near-range to about 54-km far range(about 25 nmi swath). The SAR employs a relatively long chirped pulse and uses surface-acoustic-wave (SAW) technology for compression of the received echoes. Use of pulsecompression allows peak power out of the TWT transmitter to be only about 200 W (for a 10-mresolution system'). Motion compensation derived from precise navigation information will berequired in order to accurately image the target area. All processing after analog-to-digital (AID)sampling of compressed pulses is digital.
Sequential, fully-focused, overlapping SAR patches would be formed in a digital signalprocessor, and combined to form real-time, multi-looked images at the required resolution. Up tonine looks could be obtained within the constraints of the maximum 10-m resolution systemdefined here. Because of the extremely wide swath, the image-formation processing will need topartition echo pulses into a number of adjacent range channels, and sub-image patches for eachchannel will be formed, resampled, and multi-looked separately; then multi-look images from thevarious channels can be merged to assemble the full-swath image. An advantage of this approachis that azimuth resolution-cell size and the number of looks can be kept nearly constant across theentire swath, even though the antenna's azimut' footprint changes by a factor of 6:1 from near-range to far-range.
Because of the relatively coarse resolution of this system, tape recorder requirements aremodest; a 4-mm tape unit can meet the requirement. Several approaches to the antenna design arepossible: either rigid-mounted or gimbal-mounted (see Section 2.5.3.1 for more information).
The basic SAR design proposed is not capable of imaging ships moving at radial velocitiesgreater than a few knots. Two basic approaches to meet the moving-target requirement arepossible.
"Alternlatil.1: A real-aperture radar (RAR) mode could be added to the radar. In thismode, the radar would provide performance slightly better than that of the AIREYESLAR. Assuming a 10-m SAR system, RAR range resolution would be 10 m, and azimuthresolution would be about the same as the AIREYE SLAR (about 50 m at 2-nmi range).Although the RAR implementation is conceptually simple, it requires added hardware andsoftware to implement. The RAR mode would exhibit performance against moving shipsin clutter that is about 5 dB better than that of the AIREYE SLAR. Neither SLAR nor theRAR mode provide any filtering to reduce stationary background clutter, and this clutterusually limits detection performance against discrete targets such as vessels. Reference[20](Appendix F) provides a detailed description of RAR-mode implementation andperformance estimates.
",All tnali.Ve2: A moving-target-indicator (MTI) mode could be added to the radar. Asdocumented in [18](Appendix E), two candidate MTI modes were analyzed: 1) "High-Pass Filtering with RAR" (HPF/RAR), and 2) "Sequential Doppler-Frequency Translationwith SAR" (SFT/SAR). The HPFIRAR approach is more traditional, and although itsperformance against point targets is much better than RAR or SLAR, its performance is
2-57

inferior to that of SFT/SAR. SFT/SAR takes advantage of the SAR's ability to "tune" itsreceiver to any of a number of Doppler bands; each band corresponding to a different bandof target radial velocities. For each tuning setting, a full-resolution patch (or look) can beformed that shows movers as more-or-less focused entities. For all tuning settings exceptzero Doppler, stationary clutter will be greatly reduced in intensity; this allows smallerdiscrete targets to be seen. The SAR would image the target swath with overlapping looks.Sequentially, look-by-look, the Doppler tuning setting would be varied to allow a differentvelocity band to be imaged with each look. The radar can be configured to cover thedesired range of velocities (e.g., ±20 knots radial) in the number of looks available. Asshown in [18], performance of SFT/SAR against discrete targets would be up to 40 dBbetter than SLAR. About 20 dB of this improvement is due to clutter-rejection filtering,and the other 20 dB is due to SFTISAR's smaller clutter-cell area.
SNL's recommendation is that, if a future Coast Guard SAR is produced by modifying anexisting SAR, and if that SAR doesn't have the flexibility to easily implement the SFT/SARapproach, then the RAR approach should be implemented to satisfy the requirement of imagingmoving vessels. However, if the SAR is a new design, the SFT/SAR approach should beimplemented because of its far superior performance for detecting discrete targets in a clutterbackground.
2.5.2.2 System Specifications
Table 2-3 contains quantitative specifications for the conceptual SAR design resulting fromthis study. The specifications deal mainly with the radar proper. More description of the image-formation processing and post-formation image processing approaches will be given later.Reference [17](Appendix D) provides more detailed information on how most parametercalculations were performed. Reference [21](Appendix G) gives results of corrected calculationsfor required peak transmitter power.
As can be seen, in some cases, calculations have been made at several different values of aparticular parameter. For example, the effect of resolution on required peak transmitter power isshown, antenna size is estimated at several azimuth beamwidths, and the relationship betweenazimuth beamwidth and Doppler spectral width is given. Each of these special parameters will bediscussed later in the section relating to system trade-off analyses.
It is interesting to note that, in order to keep azimuth resolution and the number of looksconstant over the wide swath, the number of azimuth pixels per patch increases from 18 at near-range to 116 at far-range. Likewise, the required length of the synthetic aperture for a single patchincreases from 14 m at near-range to 87 m at far-range. This latter increase in aperture length isdue to the need to have a narrower synthetic beamwidth at far-range to obtain the same syntheticfootprint (the azimuth resolution) as at near-range.
Results show that, even with the reasonably narrow 10 beamwidth, a good number of lookscan be obtained if adjacent synthetic apertures for the looks are spaced as closely as possible.Table 2-3 also shows that the number of available looks increases in proportion to the azimuthresolution desired. Although it is not shown in Table 2-3, the number of looks is alsoapproximately proportional to azimuth beamwidth.
2-58

Table 2-3. SAR System Specifications
Parameter or Attribute uni Value or DescriptionAgency Name -- US Coast GuardSystem Name SAR for oil-spill responsePrime Usage of System -- oil-spill imagingSecondary System Usage imaging of moving targetsAircraft Platform ---- Falcon 20
platform velocity m/s 90-124Radar Supported Modes _- side-looking strip map
real-time multilook imaging;either RAR or MTI mode for ships
Real-Time Image Attributesreal magnitude recordedcomplex data available, not recorded# bits per pixel 8 or 16slant-range resolution p, m 10/30 (ROI/full-swath display)azimuth resolution p. (@ 25 nmi) m 10/30 (ROI/full-swath display)IPR maximum sidelobes dB -30image slant-range swath rimi 25
km 46# pixels, range dimension pixels 6950 (25 nmi swath; 10-m op)
(assuming 1.5 oversampling) pixels 2315 (25 nmi swath; 30-m p,)# pixels (per patch), azimuth pixels 18 near-range; 116 far-range
(10 ft., 10-m resolution)
pixels per resolution cell 1.5 (range and azimuth)maximum pass length nmi 200
Geometryaltitude kft 8-20
km 2.5-6slant range (near range) km 8.5slant range (far range) km 54 (@ 25 nmi swath)depression angle (near range) a 17-45depression angle (far range) 0 2.6-6.4 (ignoring curvature)squint angle 0 ±90 nominalnear-range az. antenna footprint m 148 (1 0 az. beamwidth, ft)far-range az. antenna footprint m 942 (1 °)
Typical Aperture Length m 87 (10-m p. @ 54-km range)m 14 (10-m p. @ 8.5-km range)
Typical Aperture Time s 0.7 (10-m p. @ 54-km range)s 0.1 (10-m P. @ 8.5-km range)
2-59

Table 2-3. SAR System Specifications, continued ....
Minimum-detectable oo Required dB -45 (@ 25-nmi., SNR = 6 dB)Amplitude Calibration - pre- or post-mission
mean error dB -3 < , < 3standard deviation dB a_< 3
Multilook Processing (real-time)temporal, I VIj.k I IN looks 9 @ 10-m resolution(maximum number of available looks 21 @ 20-m resolutionlooks, assuming 0. = I*) looks 31 @ 30-m resolution
pixel averaging, Ejk I V'ijk /N pixels noFrequency Generator and Transmitter
operating frequency GHz - 9.3operating wavelength, X cm = 3.2transmitter bandwidth MHz = 15 @ 10-m p0,
MHz = 5 @ 30-m p,pulse duration Fs < 57 ps (near-range constraint)waveform intra-pulse modulation - LFM chirpprf kHz < 2.4 kHz (far-range constraint)interpulse modulation 0/v PN phase coding (for
ambiguous range abatement)microwave transmit losses dB 0.8peak tx power (at antenna) W 173 (10-m resolution, #. = 1°)
W 57 (20-m resolution, P. = 10)W 31 (30-m resolution, 0. = 1*)
maximum duty factor % 13 (based on maximum pulselength and maximum prf)
maximum average tx power W [22, 7.4, 4] @ [173, 57, 31 peak]Antenna
polarization - verticalelevation pattern - csc2(0); 0 = depression(roughly 6° equiv. beamwidth) angle
azimuth beamwidth, ft. 0 10, 20, or 3° (choose one)length (controls az. pattern) m 1.83,k = 1 *
In 0.92,8= 20
m 0.62,= 3"height (controls elev. pattern) m 0.3 (about 1 foot)
2-60

Table 2-3. SAR System Specifications, continued ...
Antenna, continued ....antenna gain (rough estimate) dB 35 (3 = 1*; 50% efficiency)radome losses, two-way dB 1.5vertical rotational steering yesazimuthal steering - either gimbaled. wide-angle or
- near-rigid, short-term yaw steeringReceiver
front-end noise figure (& losses) dB 2rf bandwidth MHz = 15 @ 10-mnPr
MHz = 5 @ 30-mpi,IF bandwidth M-Hz same as rf bandwidthsensitivity time control - selectable curvesIF pulse compression - SAW filtergain @ 10-in p, - 855 (29.3 dB)gain @ 30-mp --- 285 (24.5 dB)
video bandwidth - same as rf bandwidthA/D converter and presum filter
# A/D bits bits 10 (I) + 10 (Q), minimumA/D Sample Rate MHz 22.5 @ 10-m p,
(1.5 oversampling) MHz 7.5 @ 30-m p,number of video samples -= 6900 @ 10-m p,
(25-nmi swath) = 2300 @ 30-m p,Doppler spectral width Hz 136 (10 t. @ 125 m/s)(assume nominal 0. is 10) Hz 273 (20 13• @ 125 m/s)
Hz 409 (3° -. @ 125 m/s)presum integer (approximate) pulses [12, 6, 4] @ [10, 20, 3°]
beamwidths(assuming spectral widths above & 2.4-kHz prf)
antenna oversampling factor - 1.5typical azimuth sample rate Hz 200 (presummer output rate)
Real-Time Image Formernumerical precision bits minimum of 16 (1) + 16 (Q)algorithm type - channelized in range; azimuth FFT
with interpolationestimated floating point op's Gop/s 0.35integration gain - 1650 (32.2 dB)windowing and other losses dB 1.2elevation antenna correction yesazimuth antenna correction - optional
2-61

Table 2-3. SAR System Specifications, continued ...
Real-Time Image Former, continued ....ground-plane projection - yes (vary A/D rate)range-law correction - yessensitivity-time-control correction - yesvideo filter correction - probably not neededpresummer correction - optionalauto-focus - no
Data Handlingrate to tape (8-bit images only) Mbits/s 1.1 @ P, = P. = 10 m
Mbits/s 0.12@p, = p. = 30mnumber of tape units 1candidate tape-unit data-rate Mbits/s 1.6 (8-mm cartridge tape)limits (approximate) Mbits/s 4-8 (4-mm cartridge tape)
candidate tape-unit capacities Gbits 40record-time capacity hours 5-10 hours (8-bit images)phase histories for engineering evaluationradar auxiliary data yes
Image Displayhorizontal display size pixels 2048vertical display size pixels 2048dynamic range bits/pixel 8
Navigation Accuraciesnavigator type ---- inertialattitude accuracy ° < 0.05, all axesposition accuracies @ pass start m _< 30 in, all axesvelocity accuracies m/s S 1 m/s, 1-a, all axesGPS aiding (Y/N) yes
Motion Compensationapproach - real-timeupdate rate to SAR, Hz 200
Mechanical Characteristicstotal power to system kW 2.3physical volume of system M3 1.4
2-62

Range resolution, of course, determines receiver bandwidth, bandwidth requirementsdecrease as resolution coarsens; this, in-turn, decreases peak transmitter-power requirements.Transmitter power estimates at each resolution were made under the assumption that themaximum available number of looks was used in the processing and that required transmitterpower is inversely proportional to the square root of the number of looks combined.
Corrections listed in the "Real-Time Image Former" section of the Table require someexplanation. In single-look systems that have patch widths very nearly equal to the antenna'sazimuth footprint, the effect of azimuth antenna-pattern shape and presumrnmer transfer functioncan cause significant amplitude roll-off near the edges of the image patch; therefore, in thesesystems, corrections are often used to spatially normalize the image across azimuth. In a multi-look system of the type specified here, these effects will be nearly eliminated by the multi-lookaveraging process. Therefore, these corrections are specified as optional. Corrections applied tothe range dimension, however, are very important, even in multi-look systems. Effects of theelevation antenna pattern, range-law fall-off, sensitivity-time-control, and, perhaps, IF-filter/SAW-device transfer functions should be implemented to spatially normalize the image intensityin the range dimension.
An SNL analysis has shown that auto-focus processing will not be needed for the proposedSAR [19]. For projection of the image from the slant plane into the ground plane, we recommendimplementing nonlinearly-spaced A/D sampling. This eliminates a processing step that wouldotherwise place an additional burden on the image-formation processor.
2.5.2.3 System Block Diagrams and Related DiscussionFigure 2-21 is a high-level block diagram of the SAR system. Block diagram entities are
representative of how we recommend the system be partitioned for any new-design Coast GuardSAR. This partitioning is consistent with a modular design approach that SNL will be using on itsown future SAR development programs. Major signal paths are shown; however, manyinterconnecting control and data paths are omitted for clarity. A brief description of the SARimaging process is given below.
The phase-history collector generates the X-band chirp waveform that is routed to the TWTto be amplified. The TWT output is then routed to the antenna for transmission. Echoes collectedby the antenna are amplified by a front-end, low-noise amplifier and routed to the microwavereceiver in the phase-history assembly. The phase-history assembly contains all receiving,mixing, digitizing, and prefiltering circuitry. Its output is a stream of in-phase and quadrature(I,Q) digital video samples. If the RAR mode is implemented, the phase-history assembly alsooutputs RAR magnitude data. The primary output of the phase-history collector is video destinedfor the image former. Although not indicated by the diagram, the system must be designed so thatphase histories can be fed directly to the tape recording for use in system prove-in, engineeringevaluation, and trouble-shooting. The image former forms fully-focused, multi-look, strip-mapSAR images. Image-former outputs are recorded to magnetic tape and simultaneously routed to afull-resolution image buffer for display processing. The image buffer provides decimated data to adedicated, full-swath image display. It also provides full-resolution ROI data to the host computerfor processing and display.
2-63

>% Co
Go 0
00
cr.)
S 0
00
2-6

The host computer provides low-speed configuration and control for all elements of theradar. It is also the operator's interface to the radar. It provides the ability to manipulate andprocess ROls for display, disk storage, printing, and downlinking (via the TM interface). Thefollowing sections describe the SAR design in more detail.
Transmitter
The X-band TWT amplifier will have its own power supply and should be mounted as nearthe antenna as is feasible to reduce transmitter losses.
Antenna. Front End. and IMU
If the smaller antenna option (about I in length) is chosen, the antenna can be affixed to agimbal and steered over a wide range of angles. If the larger antenna option is used, only steeringto compensate for short-term yaw variations will be performed. In either case, the radar's rf front-end components will be co-located with the antenna. The front end contains a circulator thatroutes the transmitter output to the antenna. Ferrite latching switches provide isolation to protectthe transmitter and receiver. The front end also contains a low-noise amplifier (LNA). which setsthe receiver noise figure. The LNA would be a high-electron-mobility transistor (HEMT) device.Figure 2-22 shows a block diagram of the if front-end assembly. Also shown are an isolator andwaveguide sections that carry high-power if from the TWT to the front end.
Phase-History Collector
Schematically, the phase-history collector (PHC) is the most complex part of the radar, sinceit contains much of the if circuitry as well as a good deal of high-speed logic circuitry. Refer toFigure 2-23 for a block diagram of the PHC. The PHC contains the following majorsubassemblies.
"Frequency Generator. The frequency generator subassembly generates a stable, high-speedclock (the SNL SAR employs an 800-MHz clock) that is the master clock for the entireSAR. In the event that the transmit chirp is synthesized, this subassembly translates thechirp signal to X- band for input to the TWT and develops the local oscillators used in thetwo-stage mixing process. In the event that a SAW device is used to generate the chirp,that SAW would reside in the frequency generator subassembly.
" Timing and Control. This subassembly contains logic circuitry that provides all high-speedtiming and control for the PHC assembly. In the event that the chirp is synthesized, thissubassembly would also perform that synthesis.
" X-band Receiver. The receiver amplifies and filters the echo signal.
"*rf/IF Mixer. Here, X-band echo is mixed to an IF.
"* Pulse Compressor. rf video (fast-time) pulses are compressed to provide ultimateresolution in the range dimension.
2-65

antenna
from rigid flexible --.....transmiter wave guide wave guide
circulator •
front-end •partition
S]LNA
coaxial to phase-cable history
assembly
Figure 2-22. Block diagram of the SAR rf front-end assembly.
2-66

X-band chirp from rf
to transmitter front endradar-control& mocornp
ht con I power
IX-bandIr I , clck - frequency rx
, conto chr o I generator 1s LOI
I .] . h|i '1s t L• 2nd LO - 7IF/
to image formerd I A'R
O -filter STC • -
ccr
LNpre- A/ -" det .,
summer (RAR) de. (AR)
Figure 2-23. Block diagram of the phase history collector.
2-67

" Sensitivity Time Control (STC). STC may be required to reduce A/D converter dynamic-range requirements. Depending upon the transmit-pulse length, the STC may either goafter the compressor, as shown, or before it.
"• IF Amplification and Filtering. (Not shown).
"* Quadrature Mixer. A quadrature mixer translates IF video pulses to baseband frequency tocreate in-phase (I) and quadrature (Q) video channels.
"* A/D Converters. Dual 10-bit A/D converters digitize the I and Q channels separately.
" SAR Prefilter. The SAR prefilter module performs two functions: 1) high-pass filtering toremove any long-term dc bias introduced by the A/D converters and 2) presumming tocoherently combine (in each separate range bin) a number of adjacent pulses. This latterpresumming function is essentially a low-pass Doppler filter, which filters out extraneousDoppler components prior to image formation and significantly reduces the data rate to theimage former. The rate at which the prefilter feeds data to the image former is called the"azimuth-sample rate" (equal to the prf divided by the presum integer).
" RAR A/D and Presummer. Blocks required for implementation of the RAR mode areshown. If the SFT/SAR MTI scheme is used, the RAR blocks can just be removed; that is,the block diagram for SAR and SFT/SAR are identical. RAR presummer outputs would befed to the image former at the same rate as the SAR azimuth sample rate.
" Radar/Mocomp Computer. A microprocessor-based control computer controls the radar,performs motion-compensation (mocomp) computations, and provides pointing data tothe gimbal.
" Image-Data I/O. One principal feature of the modular design approach is to maximize useof a standardized, high-speed, serial data link for movement of phase-history and imagedata. The PHC contains an interface for such a link to pass phase-history data to the imageformer.
"* Power Supply. Consistent with the modular design approach recommended, the PHCwould have its own integral power supply.
A number of interconnections within the phase-history collector are not shown explicitly inFigure 2-23. For example, both the radar-control computer and the timing and controlsubassembly must interface to nearly all logic subassemblies and to a few points in the if
subassemblies.
Image Forme
The image former must contain a powerful computational capability in order to form imagepatches and combine these patches in real-time. Range compression of video pulses at IF andreduction of the data rate by presumming in the SAR prefilter reduce computational requirementsof the image former somewhat; however, the image formation task is still fairly formidable.
2-68

Using currently available technology, the recommended approach for implementation of theimage former is to use an i860-based parallel processing architecture like that shown in Figure 2-24. The i860 arrays are commercially available in VME packaging. The control processor wouldprobably be a 68040-type microprocessor. Complete 68040-based microcomputer cards suitablefor this control task are commercially available in VME packaging. Software for the i860s and thecontrol processor would be new-design. Phase histories and associated data originating in thePHC are input to the image former via the high-speed serial link. Commercially-available Fibre-ChannelTM I/O cards (VME format) appear to be a good choice for this task. The array of i860processors performs the bulk of the computations associated with image formation. The controlprocessor controls and steers data to the i860s. The output image is formatted and multiplexedwith other radar and mocomp data for transmission to the image buffer and the data recorder. Asis the case for the other major assemblies, the image former would have an interface to the hostcomputer as well as its own integral power supply.
If RAR or SFT/SAR modes are implemented, the image former must accommodate thesemodes as well. Detailed descriptions of implementation of these modes are presented inReference [18](Appendix E) and are not repeated here.
Data Recorder
The data recorder assembly is shown in Figure 2-25. Image data arrive at this assembly overa high-speed serial link. The modular concept implies that nearly all data to be recorded(including image, mocomp, and radar auxiliary data) be embedded in the high-speed serial linkfrom the image former. Some additional ROI (image) and configuration data can be written to therecorder via the host interface. The basic tape recorder will be a commercial, 4-mm unit. The datarecorder assembly would have its own power supply.
The data recorder assembly must also support an image-playback mode, wherein image andother data are communicated either to the image buffer for processing and display or to a groundcomputer for processing and distribution. In this mode, the data recorder should simulate theimage former in providing input images; that is, the interface between the data recorder and theimage buffer (both in terms of hardware and software) should look just like the interface betweenthe image former and the image buffer.
Although not shown in the diagram, the data recorder must have an "engineeringevaluation" capability to record phase histories and associated data directly from the PHC forpurposes of system prove-in and trouble shooting.
Ima~e Bffcr
The image buffer (Figure 2-26) receives image data and other information over its high-speed serial interface from the image former (or from the data recorder in image-playback mode).The image buffer must be capable of providing a decimated image to the full-swath display.Mission symbology relating to geographical information, platform motion, date, time, etc., mustalso appear on the full-swath display. This annotation information should be assembled in thedecimated-image buffer. Both the host computer and the high-speed serial link can be sources forthe annotation information.
2-69

COaLmI
am a
C.2
C) >-O 0.
I
"0 CL
E
coo LP.~.cc E~
2-70

E
I ca
to0 7
2-71

cc o
000
00
I.-.
2-72

In order to allow the operator to select ROls on the full-swath display, the operator's mousemust be able to drive a cursor on the that display. Once the operator has indicated an ROI, the hostcomputer will down-load the ROI data from the full-resolution image buffer for furtherprocessing, storage, printing, or TM. While the ROI is being selected, the full-swath display mustbe frozen temporarily. Because of the low image data rates, (only about 10 full-resolution azimuthcolumns per second), the image buffer should easily be able to support the freeze frame forseveral seconds and still be able to return to continuous scrolling without any loss of data.
It may be possible that the image buffer assembly could be one or more adapter cards in thehost computer chassis.
Full-Swath Display
The full-swath display presents to the operator the decimated, full-swath image. Fine-resolution monitors that can display 2048 pixels vertically and 2560 pixels horizontally arecommercially available. For a 10-m system (6.7-m pixel spacing), for example, that requires 6950pixels to cover the 25-nmi swath (see SAR specifications Table 2-3, given earlier in this chapter),decimation by four (new pixel spacing of about 27 m) would result in about a 1740-pixel swath,which could all be displayed on such a monitor.
Host Computer
The host computer and its associated display are the operator's primary interface to the SARsensor system. The host computer performs the following functions.
" Creates radar configuration files based on operator inputs and default values of parametersand downloads these configuration files to the appropriate radar assemblies (principally,the phase-history collector, image former and data recorder assemblies).
"* Provides high-level, low-speed monitoring and control of the radar.
"* If software for microprocessors in major radar assemblies is down-loaded for eachmission, this task is performed by the host computer.
"* Down-loads ROIs from the image buffer to host RAM for full-resolution ROI inspection
and processing.
"* Performs processing operations (contrast stretching, decimation, etc.) on selected ROIs.
"* Formats ROI files for output to a) host magnetic media, b) the data recorder assembly, c)an on-board printer, and d) a telemetry link.
"* Provides the operator with a windowing, mouse-driven environment, within which anumber of configuration, processing, and control windows can be displayedsimultaneously.
The minimum host computer requirements could be met by a -486 or Pentium"M basedpersonal computer under windows. The following components should be included in the hostcomputer definition.
2-73

"* monitor: super-VGA, 19", 1024 (vertical) x 1260 (horizontal) pixels
" 64 Mbytes of RAM
"* 250-Mbyte removable-cartridge magnetic drive (e.g., PassportlM or MegaDriveTM) forsystem, application, and radar-assembly software.
"* 150-Mbyte MicroBernouUiTM for storage of real-time images, radar configuration files,and radar log files.
"* parallel printer port
"• serial port for I/O to telemetry (IM) link.
"* Printer
The printer would be a laser-type printer to be used for printing ROI images and miscellaneoustext files.
2.5.3 Trade-Off Studies
A number of trade-off issues were identified and analyzed during the course of the SARparameters analysis [17](Appendix D) and [21](Appendix G).
2.5.3.1 Squinted Operation Versus Antenna SteeringThe present AIREYE SLAR actually operates in squint mode; that is, the antenna doesn't
point along a line that is perpendicular to the flight path. The antenna's pointing direction is,instead, 900 away from the aircraft's centerline, averaged over the pass. Because the plane willcrab to counter the wind, the antenna actually squints away from 900 by an amount equal to theaverage drift angle of the aircraft. Short-term yaw variations are electromechanicallycompensated by moving the antenna as much as ±30 to assure that the antenna always points atthe same squint angle with respect to the average drift angle. An alternative would be to usenavigator information to drive a gimbal so as to always point the antenna at 900 with respect tothe ideal flight path. However, the current SLAR antenna, presumably because of its size (8'long), is not steered in this way. Operating at squint angles away from 900 complicates dataprocessing; however it eliminates the problem of having to steer a large antenna over angles oftens of degrees. Like the SLAR antenna, the antenna for a wide-swath SAR need not be very largein the elevation dimension (height); however, like the SLAR's antenna, it needs to be long inorder to form a narrow azimuth beam. Doubling the nominal 10 beamwidth of the proposed CoastGuard SAR would probably make the antenna short enough to mount on a steerable gimbal. Thisapproach also doubles required transmitter power; however, such doubling is feasible withoutundue expense. This is the recommended approach.
2.5.3.2 Number of Bits Per Image Pixel
Estimated data rates to tape are fairly modest (1.1 Mbits/s) under the assumption of 10-mimage resolution, 125 m/s velocity, and 8-bit magnitude image data. Because of the 4-8 Mbitls
2-74

data-rate capability of 4-mm tape, recording of 16-bit image data does not appear to present aburden at these resolutions. This option should be considered.
2.5.33 Slant-Range Resolution
Initial SAR design calculations assumed range resolutions of 10 m and 30 m. Improvedrange resolution directly increases transmitter power as well as image-former input data rates,computational complexity, and output data rates. Discussion given later in this report will shedmore light on the transmitter-power issue. The benefits of finer resolution in oil-spill monitoringhave been assessed in the joint SNl.2oast-Guard/NOAA data analyses, and results are presentedin Section 2.3.2 of this report.
2.53.4 Azimuth ResolutionInitial SAR design calculations considered azimuth resolutions of 10 m and 30 m.
Improving (reducing) azimuth resolution directly increases image-former input data rates,computational complexity, and output data rates. The relationship between azimuth resolution andrequired transmitter power is more complicated and depends on whether the target being imagedis a point target or a distributed target (like the ocean). For the latter target type, reducing azimuthresolution increases the aperture time, allowing more pulses to be integrated; however, it alsoeither reduces maximum allowable real antenna gain or the number of looks achievable, or both.The net result is to increase transmitter power for this case. There are several aspects of SARimaging of the ocean that cause the pursuit of fine azimuth resolution to be imprudent. Theseaspects are the azimuth defocusing and smearing that can occur due to radial motion of both longwaves and capillary waves on the ocean's surface [22R(Appendix H).
2.5-3.5 Minimum co° of Noise Required
Based on data from several sources (see References [3,23]), we have chosen to require theradar to be sensitive enough to develop a 6-dB signal-to-noise ratio for a distributed ocean targetarea having a scattering coefficient, 00, of -45 dB at 54-kmn range. This should providemeasurable signal return under conditions between sea state zero and sea state one.
2.5.3.6 Choice of Operating FrequencyA number of factors affect the choice of operating frequency.
1. Contrast between oil-covered and open ocean varies with frequency. From literature wehave reviewed in the course of the Coast Guard study [5,24], it appears that good contrastcan be obtained at X and Ku bands; however, data are lacking at Ka band, and contrast isreduced at C and L bands. Contrast at Ku band may be a little better than at X band.
2. Increasing the operating frequency increases transmitter power. At a given resolution,required power increases as 0-. High-power rf sources are less plentiful and moreexpensive at Ku band than at X band.
3. Attenuation due to atmospheric absorption becomes significant for broad-swath systemsoperating at Ka band. Rain attenuation is significant at Ku and Ka bands.
2-75

Based on these factors, we recommend an X-band SAR for the Coast Guard.
2.5.3.7 Multi-look ProcessingAnother important issue is multi-look processing. As explained in Chapter 1, noncoherent
averaging of multiple images or "looks" of the same scene reduces the effects of speckle(amplitude variability in a region of the image containing a more-or-less homogeneous assemblyof distrbuted scatterers). Two different multi-look sch,•.mes could be applied to a broad-swath,Coast Guard SAR: 1) temporal multi-look, and 2) pixel averaging.
Temporal Multi-Look
In temporal multi-look, a number (N) of looks at a pixel are noncoherently averaged. In thistechnique, each look is produced by a distinct synthetic aperture, so looks are statisticallyuncorrelated, both in terms of signal and noise. Normally, pixel amplitudes are averaged toproduce the multi-look image. This technique preserves the spatial resolution of the originalsingle-look images. It also provides a modest improvement in image signal-to-noise ratio.
Pixel Averaging
In the pixel-averaging technique, an image patch is formed at a resolution that is finer thanthat required in the multi-looked output image. Then amplitudes of adjacent pixels are averaged.This averaging reduces speckle and also improves image signal-to-noise ratio. But becauseadjacent pixels are somewhat correlated (due to the choice of 1.5 oversampling in the azimuthdimension), the effective number of looks, N, is somewhat less than the number of pixelsaveraged.
Both techniques can be looked at as effective ways of using all available echo energy whenthe azimuth antenna pattern is wider than it really needs to be to achieve the desired azimuthresolution. The use of temporal multi-look is recommended in any future Coast Guard SARsystem.
2.5.3.8 Image-Formation Algorithm/Signal-Processing Approach
In the design implied by Table 2-3, range compression is performed at an IF frequency by ananalog device, such as a surface-acoustic-wave (SAW) filter. This is feasible for the Coast GuardSAR because of the relatively coarse range-resolution requirement (ten meters or so). At theserange resolutions pulse bandwidth is narrow enough that A/D circuitry can directly digitize thesampled echo, and no special bandwidth-reduction technique (such as stretch processing, which isused on the SNL Ku-band platform) is required.
A detailed algorithm approach has not been worked out; however, the general approachwould be to perform patch processing to form single-look patches and then combine the patchesusing temporal multi-look. Because of the large variations in aperture time and in azimuthantenna footprint from near-range to far-range (about 6: 1), the full range swath will need to bedivided into overlapped channels, and each channel will be processed somewhat differently.
2-76

A detailed analysis documented in Reference [17](Appendix D) showed that azimuthresolution and the number of achievable looks could be kept approximately constant across theentire swath using the channelized approach mentioned above.
Another ai .lysis documented in Reference [191 has addressed motion-compensation issuesassociated with image formation; therein, the following conclusions are reached.
" For the SAR design proposed here, range and Doppler frequency of the return signal needto be stabilized before an image can be formed.
" A phase shift must be applied to each return pulse before the A/D to keep the Dopplerspectrum from the middle of the swath in the presummer passband. Achievable presuminteger may be slightly smaller than the number specified in Table 2-3.
"* Autofocus is unnecessary because of the coarse azimuth resolution required for thissystem.
The basic image formation process could be performed as follows.
" An azimuth focus vector will be applied to each azimuth row (corresponding to aparticular range bin). The same focus vector can be applied to a TBD number of adjacentrange bins.
"* Because of the small azimuth patch sizes and the relatively coarse resolution, no range-walk correction will be required.
" An FFT is then performed on each azimuth row. The FFT length will depend upon therange bin number, but the phase history should be channelized so that the FFT length isthe same for a TBD number of adjacent rows.
"* FIT outputs are then interpolated to provide the desired sample location and samplespacing in each range bin.
"* Magnitudes of common pixels in overlapping looks are summed to produce the multi-lookimage.
A rough estimate of required processing power for this problem is 0.35 Gop/s. This estimate wasmade under the conservative assumption that Chirp-Z transform processing would be used insteadof FFTs followed by image-domain interpolation.
2.5.3.9 Pulse-Compression Issues
The conceptual design given in Table 2-3 recommends pulse compression implementedusing a SAW filter. There are a number of issues here.
2-77
pp

Peak Transmitter Power
Use of a pulse-compression technique reduces the peak transmitter power requirement by afactor equal to the time-bandwidth product of the uncompressed transmitter-output pulse. For thisconceptual design, this factor is about 855 at 10-m resolution and about 285 at 30-m resolution.
Use of a SAW Device for Compression
Using a surface-acoustic-wave (SAW) device for pulse compression appears to be attractive.This technique eliminates computational requirements that would be present if the pulsecompression were done digitally. The SAW approach should be more cost-effective whencompared to digital compression, and reliability should be better than the digital approach byvirtue of the fact the SAW is a passive device.
A/D Dynamic Range Considerations for the SAW Pulse Compression Technique
Use of a SAW device for pulse compression will increase dynamic range requirements at theA/D input. Therefore, it will likely be necessary to use A/Ds having ten bits in each channel (I &Q).
Length of the SAW Filter
The pulse length specified in the conceptual design is fairly long (57 4s). If SAWcompression of such a long pulse is problematic, the pulse length may need to be shortenedsomewhat at the expense of higher peak power. It appears that, even if the pulse length had to beshortened by a factor of 4, peak power would still not be excessive.
2.5.4 SAR Capabilities Survey ResultsThe SAR Capabilities Survey [16](Appendix C) and conceptual requirements
[15](Appendix B) documents were sent to twelve vendors. The purpose of the survey was toobtain information on current capabilities of SAR vendors for use in the Coast Guard study. Thesurvey consisted of two parts: a) a request for specific numerical tabulated data on vendorsystems, and b) a request for a more free-form textual discussion of the vendor's capabilities asthey might relate to meeting Coast Guard requirements. Survey instructions also stated thatexisting vendor brochures and specification sheets could serve instead of the requested tabulateddata. Seven of twelve vendors responded, each at varying levels of detail. Results of the surveyare summarized in this section.
2.5.4.1 Listing of Responding VendorsResponding vendors are listed in alphabetical order, by agency. In each case, name and
mailing address of the agency point of contact are listed. Telephone numbers of responding-vendor points of contact have also been provided to the US Coast Guard.
2-78

Dale A. Ausherman, Vice President, ERIM Director, Sensor Systems Division
P. 0. Box 134001Ann Arbor, MI 48113-4001
In= Information Technoloees (Canada) Ltd.
Ed KrakowskiManager, Radar Engineering SupportSuite 1000645 Seventh Avenue, SWCalgary, Alberta Canada T2P4G8
LORALBob DuboisLORAL Defense Systems-ArizonaP. 0. Box 85Litchfield Park, AZ 85340-0085
MacDonald DttwilerPaul EllisProject Manager, Space and Defence Systems13800 Commerce ParkwayRichmond, British Columbia, Canada V6V2J3
Norden Systems. Inc. (United Technologies)Dr. Marshall GreenspanDirector of Technology10 Norden PlaceP. 0. Box 5300Norwalk, CT 06856-5300
Harold J. GellerProgram Manager180 Hartwell RoadBedford, MA 01730
Westinghouse Electric CorporationGeorge BendorManager, Radar Systems EngineeringP. 0. Box 746Mail Stop 550Baltimore, MD 21203
2-79

2.5.4.2 Overview of Vendor-Supplied Materials
Vendor responses varied in amount and level of detail. Only unclassified information wasrequested from vendors. This section summarizes materials supplied by vendors in response to thesurvey.
ERIM"* Completed Functional Performance Characteristics (FPC) sheets describing the ERIM/
USAF (Wright Laboratories) (SAR) Data Collection System.
"• FPC sheets describing the ERIM/Navy (NAWC) P-3 SAR.
"* FPC sheets describing the ARPA/ERIM Interferometric SAR (to be operational July1994).
Lnte r
"• Completed FPC sheets describing Intera's STAR-I SAR.
"* Completed FPC sheets describing Intera's STAR-2 SAR.
"* A 13-page document entitled "Response to Conceptual Requirements for a SyntheticAperture Radar System for Oil-Spill Response."
"* An 18-page brochure entitled "Intera-The Integrated Solution."
"* A 10-page brochure entitled "Comprehensive Real-Time Surveillance Services, AirborneRadar: A Key Tool," describing STAR-2 and STAR-VUE, a ground-based receiving/processing station.
"* A one-page flyer entitled "Radar Services and Products."
LORAL
"* A letter containing 1) a high-level summary of SAR assets including UPD-8, UPD-6,CAPRE, and ASARS-I systems; 2) brief tables of characteristics of UPD-6 and UPD-8systems, and 3) a table, entitled "SAR Parameters", summarizing high-level data on anumber of LORAL- developed systems, including those mentioned above.
"* A brochure describing the RMW-900 Reconfigurable Modular Workstation, a workstationto be integrated into mobile, real-time systems.
MacDonald Dettwiler
* A four-page brochure entitled "IRIS: Tactical & Strategic Radar Reconnaissance,"describing their Integrated Radar Imaging System (IRIS).
2-80

* An 86-page brochure entitled "IRIS Reconnaissance Radar". Sections of the brochure are1) An Introduction to Imaging Radar, 2) Applications of Synthetic Aperture Radar; 3)Features and Advantages of the IRIS; 4) The IRIS Technical Description; 5) IRISConfigurations; and 6) Integrated Logistics Support.
NordenSystems
• A completed FPC sheet for Norden's AN/APG-76 Multimode Radar System (MMRS).
- Cover letter identifying AN/APY-3 Joint STARS radar and AN/AGP-76 MMRS radar asNorden products and recommending that the USCG explore an integrated-mission sensor(one having both coarse-resolution, broad- swath capabilities and fine-resolution, narrow-swath capabilities) to meet Coast Guard requirements.
- A two-page textual addendum addressing the conceptual requirements in [15].
* A 37-page ring-bound hardcopy of Norden presentation materials entitled "Norden SARand MTI Radar Systems," relating to both the Joint STARS and MMRS radars.
- A >100-page ring-bound hardcopy of Norden presentation materials entitled "Presentationof Norden System Advanced Technology Radar and Research and DevelopmentActivities."
Raytheon
"* A completed FPC sheet for Raytheon's Millimeter Wave Attack Seeker (MAS).
"* A one-page letter and attached two-page textual description of the MAS with suggestionson how the MAS might be used for oil-spill phenomenological data collection.
"* Completed FPC sheets describing the Westinghouse MODAR MR4000 radar system.
"* A brief textual description of how the MODAR MR4000 might be modified for oil-spillmonitoring.
2.5.4.3 Summary of System Functional Performance Characteristics
As mentioned previously, the amount and level of detail available on the surveyed systemsvaries from vendor to vendor. In one case, even though significant detail is available, not all of thedetails could be released publicly. The approach we have taken in summarizing systemcapabilities is to provide comparative information on only a subset of the performancecharacteristics and to attempt to do it in such a way that 1) system capabilities are fairly presented,2) vendor requests for restricting disclosure of full details are honored, and 3) emphasis is placedon potential relevance of the capabilities to the p-,imary oil-spill monitoring mission. Results aresummarized in Table 2-4.
2-81

so
4--
00 <
060C .6
0 .. C a --w..a
0.~~ P~ 6)6 U2 0 . *. * 2;. 06
0 . C 6 00 4 1Id o ~0.'~'9 & m
Z ~ ... ~U U <'-~~~0 .' V.))~0 .~ .U .2
Idc 0 . 0. 0L.) .3C~d~ '~~ U U U U 0L
'- j;... 2 2 2 2 ~ ZtCi0.~. .J.~~ C0L0 06 06. C 0. . '
0 -b0
40) go 03
c U 6. 0
U ~ ~0
Ce mn U 4)
o4 go -a. uUx 2 060
CO 0 ,- ACA -
U 54 U . I U~cc0 ! 0 0 6.
im 6)
> co>6 0 >604
- ~gU
Cd0 0 - U
Cd < a I< - S I
<n- I. in ~<
2-82

Al1
0~~I 014 ?
Iid.. 9-4 1- 00iI
Llo N Dct -4 t-A0@
co
tn~ V 0 !z c"-4 V4 %A
Al A - G . -
X *0O @w
- 1-4
c~EL - 02-83

1!1
N 0
;Iom. 0W4.c.
8 *6
2-8

2.5.4.4 Interpretation of Data Provided on SAR Systems
The vendor and system capabilities can be compared and contrasted in a number of differentways.
One-of-a-Kind SARs Versus Multi-Unit SAR Production
For the ERIM and Intera SAR data collection systems, only one or perhaps two systems ofeach type have been built. The other systems surveyed appear to have been designed for multi-unit production. UPD-8 is an early-'80s, second-generation modification of the UPD-4 (early '70svintage). ASARS-1 production runs were completed in the late '80s. MacDonald Dettwilerliterature indicates that the IRIS system is now being adapted to a number of different aircraft.Norden's MMRS and Westinghouse's MODAR MR4000 are being built to fill existing orders.One unit of Raytheon's MAS systems has been completed; however, no current productionapplications are identified.
Data Collections Versus Production SAR Systems as Products
Both ERIM and Intera routinely perform large data collections. Norden's Gulfstream 11 hasalso been used for data collections; however, it appears that Norden's primary (SAR) business isas an integrator and provider of SAR systems. ERIM's platform, being multi-mode, is likely usedfor a wider variety of different types of experiments and collections than is Intera's.
Intera's platform is more designed for a specific set of mission types, the emphasis being onbroad-swath, coarse-resolution imaging of land or ice. Other vendors appear not to be in the data-collection business in any significant way and appear to focus more on the SAR system as theproduct. Of course more production-oriented vendors do conduct field tests, as is evidenced byRaytheon's mention of a November flight test of MAS along with the suggestion that MAS mightbe used for phenomenological studies of oil-on-ocean.
Broad-Swath, Narrow-Swath and Multi-Mode Systems
Intera's STAR-i and STAR-2 systems appear to be configured principally and perhapssolely for broad-swath, coarse-resolution imaging. For example, STAR-2 can map at either 18- or30-m resolution and can cover up to a 104-km swath. STAR-2 also provides two-sided mappingcapability at 63-km swath. By contrast, the MAS and ERIM's WL-ERIM DCS are relativelynarrow-swath, fine-resolution systems. Most of the other systems appear to support operationacross a range of selectable resolutions and with variable swaths up to 10 or 20 km in most cases.MacDonald Dettwiler's IRIS system, which has selectable resolution from 3-18 m provides agenerous 60-km swath.
Real-Time Image Formation
Most of the systems provide real-time imaging; however, the real-time images are notalways the primary output product of the system. For example, for ERIM's P-3/SAR system,extensive ground processing capability extends the range of resolutions available (selectabledown to 1.5 m), in contrast to more moderate real-time values (4.5-12 m). Number of range pixelsprocessed in real-time varies significantly across the systems, as well. Some systems provide
2-85

about 400-500 pixels in range (MODAR MR4000, WL-ERIM DCS, and MMRS), while othersprovide thousands of range pixels in real time (P-3/SAR, 2023 pixels; STAR-i, 4096 pixels;STAR-2, 2x4096 pixels; and IRIS, estimated from available information to be between 3000 and4000 pixels).
While the survey did not request information on specific technologies being used for imageformation, discussions with several vendors indicate that parallel processing implementations(e.g. i860-based systems) are being pursued.
Systems Having Multiple Modes
A number of the systems stand out because of the number of modes they support. ERIM's P-3/SAR and WL-ERIM DCS employ a variety of cutting-edge modes, including full polarimetrics,spotlight, circle, 3-D interferometry (for height measurement), and DPCA for velocitymeasurement. MacDonald Dettwiler's IRIS boasts a true-position MTI mode that puts movers intheir proper position on the SAR map. IRIS literature explains that this is done using a uniqueDoppler processing technique that provides an accurate estimate of a moving target's position. Itis not stated whether a single antenna phase center or multiple phase centers are used. Norden'sMMRS employs a three-phase-center interferometric MTI technique to put the movers back totheir true positions. These true-position MTI techniques are certainly relevant to the Coast Guardmission of imaging moving ships.
System Size
Although not tabulated above, numbers on estimated system volume, in in3, were obtainedfrom five of the seven vendors. The smallest numbers (less than 0.1 m3) were for MAS and theMODAR MR4000; however, these numbers did not include volume for operator control, display,or recording equipment. MMRS is about 0.25 m3; ASARS-I is about 1 m3; UPD-8 is about 1.3in 3; STAR- I is about 1.5 m3; STAR-2 is about 2.4 m3; and ERIM's P-3/SAR and WL-ERIM DCSare estimated to be about 4 m3 each. These numbers are very rough, but there is a clear trendtoward larger volume for systems that either cover larger swaths, possess multiple modes, or aretestbed svstems as opposed to production systems.
System input Power Required
Estimates of required input power for some of the systems were also obtained. MAS inputpower is about 800 W; MODAR MR4000 is 1.2 kW; STAR-1 is 4 kW; UPD-8 is 4.8 kW;ASARS-1 is 5.7 kW; STAR-2 is 9 kW; and MMRS is 7 kW.
System Replication Costs
The survey requested estimates for cost of replicating existing systems, includingfabrication, laboratory integration, and testing of radar and motion compensation subsystems, butnot including any platform integration. Rough order-of-magnitude estimates varied from as littleas $1 M for to as high as $30 M. It is understandable that several of the vendors did not feel theycould adequately respond to this question without a more complete statement of systemrequirements.
2-86

System Sensitivity Data
Although the survey requested data on minimum detectable scattering coefficient for thesystem, evaluation of the information revealed that it would be difficult to compare the systems onthis basis.
2.6 DISCUSSION OF COST VS. BENEFIT OF SARAny discussion of cost vs. benefit for a SAR system will be based on both quantitative and
qualitative information. Specific technical issues such as component cost, benefits of size andweight, and maintenance cost can generally be quantified. Issues such as "image quality" or"image acuity" are based on the judgement of human experts and are much more qualitative. Inthis section, we strive to assess both qualitative and quantitative costs and benefits. We alsosummarize issues previously discussed in Section 2.4.2 that are important when comparing andcontrasting SAR and SLAR.
2.6.1 Image Ouality Benefits. SAR vs. SLARThe most fundamental question is whether SAR imagery provides benefits to oil-spill image
analysts that SLAR imagery cannot. The answer seems to be based primarily on the issue ofspatial resolution. Do increased spatial resolution and constant (not a function of range to thescatterer) spatial resolution, help the analyst? The consensus of the workshop participants is thatincreased spatial resolution, beyond that of the existing SLAR resolution, would be a benefit. If afiner spatial resolution, i.e. finer than the best (near-range) SLAR resolution the AIREYE iscapable of producing, is perceived as a benefit, then it stands to reason that SAR imagery wouldbe a benefit compared to SLAR imagery. Several comparison SAR and SLAR images have beenincluded to make this point. Figure 2-27 shows a SAR image from the Nov. 12, 1992, experimentwith a ROI designated just off Coal Oil Point. The ROI is shown in Figure 2-28 at full resolution.Note the clear definition of wind rows (upper portion of Figure 2-28), the detail in the emulsifiedoil forming an arc (upper-left portion of Figure 2-28), and the distinct texture of kelp in the sameregion. Now, examine Figure 2-29 and Figure 2-30. Figure 2-29 shows the SLAR image fromwhich the ROI in Figure 2-30 was extracted. The SLAR image was captured roughly 1 hourbefore the SAR image]. The ROI in Figure 2-30 was also magnified by a factor of 10 (with pixelreplication) so that features in the SLAR image have roughly the same size as features in the SARROI (Figure 2-28). Note the absence of detail in the wind row region (upper portion of Figure 2-30). The arc of emulsified oil has moved right in the SLAR image so that it is positioned againstthe left edge of the wind row region. It is barely resolved in the SLAR image. The kelp does nothave a texture distinct from the sea returns near shore.
Another SAR/SLAR comparison example is shown in Figure 2-31 through Figure 2-34.Figure 2-31 shows the SAR image from which the ROI in Figure 2-32 was extracted. Note theclear definition of the wishbone-shaped return from emulsified oil (bottom of Figure 2-32). The
1. A better point-by-point comparison of ocean features can be made between this SAR image (Nov. 12,south-looking) and the Nov. 12, west-looking SLAR image. These images differed in time by only 30 min.This comparison was not used here because it portrays an optimal SAR imaging geometry (antenna lookingalong wave crests) against a suboptimal SLAR imaging geometry (poor azimuth resolution due to far-rangeimaging) which could unfairly bias the reader in favor of SAR imagery.
2-87

(This page intentionally left blank.)
2-88

4-C
p.m
4-Ei
C,
2
C)
ri
-i
'.4
ez
'U2
z
&'.4'.4
T0
(U
z
2-89, 2-90

kA
7 ;e
AE
-La
pr V
C7
rowAf
vk

0 1W
2-93, 2-94

Gac 4
IL*
2-95,2-9

ICC
FS7 vvý q
2-97,2-9

Ts 4 k , i;"
N1.
v
A
... .... .. .
n.4-A
76 Z'4*
14. ý,.4
ot
M7A6
w3, r
WAOl
, 7'

same feature is visible in the SLAR ROI. Figure 2-33 shows the full scene from which the SLARROI was extracted, and Figure 2-34 shows the ROI magnified (by pixel replication) so thatfeatures are roughly the same size in both the SAR and SLAR ROls. The wishbone-shaped returnhas changed some in the time between the SAR and SLAR images, but the wishbone is still quitevisible in the SLAR ROI. Detail in the wishbone structure and details in the vicinity of theisolated point scatterers near the wishbone are much better defined in the SAR ROI (Figure 2-32)than in the SLAR ROI (Figure 2-34).
The disadvantage of azimuth resolution being a function of range in SLAR images can alsobe emphasized by looking at two SLAR images from Nov. 12, 1992. Figure 2-35 is a south-looking SLAR image of the test area. Near-range is at the top of the image. Figure 2-36 is a west-looking SLAR image of the same test area. Near-range is on the right edge of the image. In Figure2-35, one can see 4 bright isolated scatterers (ships) near the bottom of the image, all at roughlythe same range. The azimuth side-lobes actually overlap. In Figure 2-36, the same 4 brightscatters are visible on the upper-right edge of the image. Notice that the width in azimuth(measured vertically) of the brightest parts of the 4 scatterers (the main lobes) is greater for thescatterer farthest in range (left-most) than for the scatter nearest in range (right-most). Thesescatterers are actually about the same size, but the degradation in azimuth resolution as a functionof range makes the far-range scatterers appear larger than the near-range scatterers. In Figure 2-35, these 4 scatterers are all at the same range, but they are far away in the range dimension, sothey are all 4 poorly resolved in azimuth (measured horizontally).
It is also beneficial to compare the south-looking and west-looking SLAR images globallyto assess the impact of azimuth resolution degradation with increased range. These two imageswere captured within a few minutes of each other, so the ocean features remain essentially thesame in both images. Begin with the west-looking SLAR image. Note the detailed sea return onthe southeast (lower right) side of this image. Now, compare this with the south-looking SLARimage. All this detail is lost due to spatial resolution degradation with increasing range. Thiseffect does not occur in SAR images. Also, compare the west (left) side of the west-lookingSLAR image to the west (left) side of the south-looking SLAR image. Near-range features in thesouth-looking image are retained, but these same features are absent in the west-looking image.
The benefit in image quality with SAR is clear, but this benefit is bought at a nontrivial cost.Most of the trade-offs have already been mentioned in detail, but to summarize, the SAR costs area more complex hardware and software system, greater volumes of data to be processed andarchived, and artifacts due to motion within the scene during aperture synthesis. The followingsubsections present a detailed look at those costs and benefits that can be quantified.
2.6.2 Identified Technical Benefits of SAR
A number of technical benefits of SAR have been identified and discussed, in detail, inSection 2.4.2. We list those benefits below
Improved azimuth resolution (up to a factor of about 75 at 54-km range). It must be notedthat, as discussed, in detail, in Section 2.4.2, ocean-wave movement can significantlydefocus the SAR image in the azimuth dimension.
2-101

(This page intentionally left blank.)
2-102

4V
3f
3k.

V4
ont

Goleta PointAPI
Figure 2-35. South-looking SLAR image from Nov. 12, 1992.
2-107, 2-108

Holy;lffr
Aivy - b
Four pinScatterer
Figue 236.Wes-looingSLA imge rom ov.12,199.X7

"* Constant azimuth resolution achievable over a wide swath (not possible with SLAR),
ignoring azimuth defocusing effects due to wave motion.
"* Constant number of looks achievable over a wide swath.
"* Better sensitivity in terms of minimum-detectable target-cell radar cross section.
"* More precise image-registration knowledge.
* Smaller (about I m long), steerable antenna is feasible.
"* Superior performance, in SAR MTI mode, against moving ships (10's of dB betterperformance than SLAR).
2.6.3 Rough Estimates of Coast Guard SAR Size. Power. and Cost
Table 2-5 gives rough estimates of physical volume, input power, and development andreplication costs for a new-design Coast Guard SAR. Cost estimates are for SAR hardware andsoftware only and do not include costs for aircraft integration, flight testing, ground processing, ordata analysis. The estimates have been made under the assumption that significant miniaturizationof radar circuitry is not required. The following paragraphs discuss notable information that canbe derived from Table 2-5.
Physical Volume
The largest components of the SAR will be the antenna/gimbal/front-end assembly, theimage displays, and the image former. Even with modular design, cabling will occupy significantvolume. Total estimated system volume, discounting radome volume, is about 1.4 m3 . For thisestimate, the antenna is assumed to have 20 azimuth beamwidth (therefore the antenna is onlyabout 1 m long).
Based upon these estimates and the known size of the AIREYE SLAR, the followingobservations can be made.
1) A new SAR can be economically designed to be about the same size as the AIREYESLAR.
2) Although portions of the SAR could be further miniaturized (e.g., the phase-historyassembly and the image former), many of the larger system components could not beeasily miniaturized. Miniaturization of the identified components would increase costssignificantly. Therefore, it does not appear to be cost effective to further miniaturizebeyond the size estimates given in Table 2-5.
The conclusion is that there is no significant difference, proposed SAR vs. AIREYE SLAR, withregard to physical volume occupied by the radar.
2-111

ace
it"2 Of, R
*8 t
* _ to
2-112

Required Input Power
Major power dissipation will occur in the transmitter, phase-history collector, image former,and gimbal. Total estimated power dissipation for the system is about 2.3 kW.
Based upon these estimates and inspection of the AIREYE SLAR specifications, it appearsthat required input power for the proposed SAR would be very similar to that of the AIREYESLAR.
The conclusion is that there is no significant difference, proposed SAR vs. AIREYE SLAR,with regard to estimated input power requirements.
First-Unit Development Cost
Major contributors to SAR development cost are the phase-history collector ($3M) and theimage former ($1M), identified earlier in this report as the most complex portions of the SAR.Other major items include the gimbal, the data recorder, host software, transmitter, antenna, andgimbal. Total estimated first-unit development cost is about $15M
Replication Costs
Replication cost estimates are, in most cases, between 10% and 30% of development costs.For example, the major cost of the image former will be software, which is a non-recurring cost,so replication cost is about 25% of development cost in this case. On the other hand, for thetransmitter, the combined replication costs of the TWTA and the power supply by themselvesrepresent a significant fraction of the transmitter's development cost. Therefore, replication costof the transmitter is a higher percentage of development cost, being about 50%. Total estimatedreplication cost for the SAR is about $2.5M.
Costs of SAR vs. Costs of SLAR
As pointed out in Section 2.4.2, the SAR brings added complexity (in comparison with theSLAR) is the following modules.
- IMU: higher accuracy required
* Gimbal mounting and control: more degrees of freedom.
• IF processing and digital prefiltering (in PHC).
* Navigational computations for motion compensation and antenna pointing control (notidentified previously as an item of added complexity).
* Image former (not required for SLAR).
From the items costed in Table 2-5, it is clear that the additional costs associated with developinga Coast Guard SAR (vs. developing a SLAR) number into the millions of dollars. For example,assuming the costs of the five items listed immediately above are in excess of what would be
2-113

required to develop a SLAR, this additional development cost is estimated to be between $2M and$3M.
Also, replication costs for the SAR will be higher. For example, doing the samecomputation, but this time using corresponding replication costs, leads to the conclusion thatreplication costs of these "additional" capabilities, which are necessaiy for SAR, amount tobetween $400k and $500k per system, or roughly 20% of the replication cost of the completeSAR system.
2.6.4 Discussion of Other Identified Costs of SAR
Additional costs will be incurred in operator training and system maintenance. To minimizetraining and system maintenance costs, SNL recommends that certain philosophies, discussedbelow, be embraced in the design and implementation of any new SAR system. The followingdiscussion also presents, where appropriate, estimates of costs (either absolute or relative)associated with training and maintenance.
Design for Operability. The SAR could and should be designed to maximize ease ofoperation. The number of options available to the operator should be minimized to a small,necessary set. Unlike the case of an R&D SAR system, for which nearly all parameters(resolution, geometry, swath width, etc.) can be varied under the direct control of the operator, aCoast Guard SAR system should be optimized to a point design. Major SAR parameters(resolution, prf, etc.) should be fixed, and necessary changes in parameters due to changes inimaging geometry should be automatically computed by the host computer or the radar-controland mocomp computer in the phase history collector assembly. Reconfiguration and self-test ofthe radar should be automated to avoid complicating the operator interface. The operator interfacefor control of the radar and display and processing of ROIs should be windows-driven and builtatop a standard commercial operating system.
.Operator Training Costs. It is SNL's assessment that the SAR and its operator interface canbe designed in such a way that the system can be effectively operated by enlisted Coast Guardairmen who undergo a classroom training program of the order of 2 to 4 weeks followed by in-flight training amounting to the equivalent of about 5 to 10 missions. Periodic (perhaps yearly)abbreviated retraining should be conducted for SAR system operators. Classroom training couldinclude experience with a SAR simulator that could use a number of components of theoperational SAR. At a minimum, the simulator should include the full-swath display, hostcomputer, printer, and data recorder. This minimal simulator would allow images to be viewedand ROIs extracted and manipulated. In summary, given that the system is designed properly, easeof operability should not be a weak point of a new Coast Guard capability. Estimates of systemdevelopment cost presented in Table 2-5 include costs for implementing the above-describedsystem design features that would minimize training costs. Table 2-5 does not include costs of asimulator or costs for training of Coast Guard personnel.
Design for Testability. The SAR should also be designed to include a significant number ofself-test and diagnostic functions. It is possible to design the SAR with a built-in test capabilitythat allows radar circuit inputs to be stimulated using internally generated test signals and circuitoutputs to be sampled and monitored by the radar control and mocomp computer. Results of
2-114

diagnostic testing could be reported to the operator or technician on the host computer screen.Basic built-in test functions could be exercised at the beginning and end of a mission, and moreextensive and detailed test functions could be used during trouble-shooting operations when thesystem is known to be malfunctioning.
It is SNL's assessment that the SAR could be designed so that a large percentage of potentialfault conditions could be detected during routine self-test and that trouble-shooting down to theboard level could be done using built-in-test hardware and software designed into the system.This built-in functionality would allow troubleshooting operations that otherwise may not havebeen feasible to be efficiently performed by Coast Guard personnel. Use of the built-in testphilosophy should lower long-term maintenance costs by cutting trouble-shooting time andreducing the need for open-setup type diagnostic equipment (scopes, logic analyzers, etc.). Thiswould result in maintenance procedures that are simpler and more automatic than those now usedto maintain the AIREYE SLAR.
Design for Maintainability. In addition to incorporating the built-in test features describedabove, designing for maintainability involves prudent decisions about how modules are designedand built; which components, subassemblies, and assemblies will be spared; and where (e.g., airstation, prime SAR contractor, SAR subcontractor, or component vendor) repair and replacementof components will occur.
Maintenance Technician Training Costs. Maintenance personnel should first undergo the 2to 4 weeks of operator training specified above. SNL estimates that approximately 4 weeks ofadditional training would be required for a technician to become proficient at installing/de-installing SAR equipment in the airplane; using system diagnostics; disassembling andassembling line replaceable units (in most cases, to the board level); and performing any requiredmanual or open-setup testing at either the system, line-replaceable-unit, or board levels. Periodic(perhaps yearly) abbreviated retraining should also be conducted.
A Suggested Approach to Maintenance Schedules. As stated above, power-up and pre-power-down diagnostics should be designed into the SAR system. A reasonable approach toperiodic maintenance would be to have a technician perform detailed, on-plane diagnostic testsonce every 20 hours of system operation or at least once every two weeks, whichever comes first.The entire system might be removed from the plane once every six months for visual inspectionand ground-based testing at either the system or subsystem level.
Mean Time Between Operational Failures. The proposed periodic diagnostic checks shouldhelp reduce the number of failures that occur during a mission. It is difficult at this point toestimate reliability of a new SAR. Certainly, this should be one of the design requirementsspecified at the time of acquisition of the system.
2-115

(This page intentionally left blank.)
2-116

CHAPTER 3CONCLUSIONS AND RECOMMENDATIONS
3.1 CONCLUSIONSSeven fundamental questions were posed by the U. S. Coast Guard and NOAA HAZMAT at
the beginning of this project. The goal of this project has been to answer as many of thesequestions as possible. Here are the questions and their best answers as a result of this study.
" Do finer resolutions make it easier for image interpreters to differentiate false positivesfrom oil slicks?
Yes. (See Section 2.3.2.)
"* At what resolution is the optimum benefit gained?
A spatial resolution of 10 m per pixel is adequate, or slightly better than adequate. Thisspatial resolution provides a nice trade-off between resolution for detailed feature analysisand full-swath coverage (25 nmi) that can be achieved practically. Full-swath data setswill be large, but manageable with current technology. (See Section 2.3.2.)
"* How well does SAR bring out edge details for the interpreter, relative to SLAR?
Edge sensitivity, from the perspective of the scattering cross-section, is slightly higherwith the SAR, but for the most part it is comparable to that of the SLAR. Increasedresolution in the SAR, however, provides more edge detail. (See Appendix A, AppendixD, and Section 2.3.2.)
"* How is this "acuity" affected by wind speed, look direction, and apparent slick thickness/oil state?
There was not enough variation in wind speed during the experiment to measure the effectof wind speed on acuity. Acuity is degraded somewhat when the SAR images across wavecrests (up-wind or down-wind) as opposed to along wave crests (cross-wind), but thisdegradation can be minimized by using higher aircraft speed and/or flying passes thattransmit perpendicular to the dominant wave fronts. This degradation only affects rapidlymoving objects such as waves, but can indirectly affect detail at wavelslick boundaries.Acuity does not appear to be a function of oil-slick thickness. Changes in acuity as afunction of oil state are similar in SAR and SLAR. For example, emulsified oil createsisolated specular returns when imaged against a calm sea. It can also trap flotsam thatreturns more energy to the radar antenna. (See Sections 1.3.1 and 2.3.2.3.)
"• How well does the SAR differentiate between ocean clutter and oil slicks?
As well, if not better, than SLAR. (See Section 2.4.2, Appendix A, Appendix D, andAppendix G.)
3-1

"• How sensitive is the SAR to oil thickness?
There appears to be no correlation between oil thickness and SAR returns. The behavior ofa SAR is identical to a SLAR regarding oil thickness. Compare SAR and SLAR images inChapter 2 for confirmation.
"* What are the wind speed cutoffsfor the SAR, relative to the SLAR?
This question remains unanswered. There was not enough variation in wind speeds duringthe Santa Barbara experiments. We have no reason to believe that there should be asignificant difference in wind speed cutoffs between the SAR and the SLAR.
3.1.1 Benefits and Cost Effectiveness Offered by SAR and SLAR
The benefits and cost effectiveness offered by SAR and SLAR are summarized in Table 3- I.Cells of the table having a "(+)" in them signify a positive attribute while cells having a "(-)" inthem signify a negative attribute. Notice that there are two columns for SLAR. The first SLARcolumn (column 2) identifies attributes that apply to SLAR in general. Some attributes may applyto generic SLAR systems, but are not applicable to the existing AIREYE SLAR. For this reason,the column heading is "Generic SLAR or Modified AIREYE SLAWR. The second SLAR column(column 3) identifies attributes applicable to the existing AIREYE SLAR.
3.1.2 Critical SAR Parameters
Our analysis has shown that it is feasible to design and build a SAR using existingcomponent technology that has 10-m resolution and that covers a broad, 25-nmi swath. Thereappear to be no insurmountable technical barriers; however, some prudent trade-offs are requiredin order to achieve the desired system characteristics. The following critical SAR parameters wereidentified during the SAR parameters analysis. For each critical parameter, we summarize theconclusions of the SAR parameters analysis.
Antennuasze
The analysis showed that, for a SAR, if the azimuth beamwidth is set at about 20, theantenna can be made small enough that it can be steered. The advantage of this is that the antennacan always be pointed at 90' squint. Therefore, no geometrical rectification of the image will berequired to correct for squint-mode operation.
Transmitter 2ower
With the shorter antenna (azimuth beamwidth of 20) and with 10-m resolution, requiredpeak transmitter power will be between 300 and 400 W (average power will be between about 40and 50 W). These power levels are readily achievable and are very close to levels specified forseveral of the surveyed vendor systems. Attempting to push peak transmitter power above severalkW would significantly increase cost of the transmitter and drive up overall power requirementsfor the system.
3-2

Table 3-1. Advantages and Disadvantages of SAR and SLAR
Generic SLAR or Current AIREYEAttribute SAR Modified AIREYE
SLAR
az. resolution (+) superior (10 m) (-) inferior (by factor of (-) inferior (by factor of>50) >50)
az. resolution (+) constant over (-) coarsens over swath (-) coarsens over swathswath
az. defocusing (-) yes (+) no (÷) no
sensitivity (+) superior (-) infenror to SAR, (-) inferior; 15-20 dBamount unspecified worse than SAR
registration (+) superior (-) inferior (-) inferiorknowledge
steerable (+) yes (-) no (-) noantenna
images movers (-) MTI mode req'd (+) yes; SLAR MTI (+) yes; but no MTImode possible mode
signal/clutter (+) SAR/MTI is (-) SLAR MTI inferior (-) real-beam modeon movers superior to SAR MTI by 15-20 inferior to both SAR
dB MTI & SLAR MTI
complexity (-) most complex (+) least complex (+) least complex
physical size 1.4 m3 about the same about the same
input power several kW > several kW several kW
development (-) about $15M (+) about $12M (++.) easy modificationcost up to lab to obtain digital dataintegration
replication cost (-) about $2.5M (+) about $2M (-) sunset technologyup to lab inte-gration
3-3

Image-Resolution
Desired resolution for a future Coast Guard SAR is 10 m. Coarser resolution hinders theimage interpreter's ability to see detail in the image. Refining resolution further increases systemcost and/or impacts system sensitivity. For example, asking for the same 25-nmi swath at 3-mresolution would drive required transmitter power to an unacceptably high level. Further, at thisrefined resolution, data recording requirements would be placed well beyond the capabilities of acommercial 4-mm tape unit.
Operating Frequency
Operation in the X band appears to be best. Oil/open-ocean contrast may be slightly better atKu band than at X band; however, at Ku band, required transmitter power would be higher, andhigh-power sources are not generally available at Ku band. Further, atmospheric absorption andrain-attenuation effects are more limiting at Ku band.
Pulse-Compression Technique
Pulse compression using a SAW device is recommended, because this eliminates the need toperform digital compression. If it is not feasible to compress the relatively long transmitted pulse(57 Jts), the transmitter pulse can be shortened, and the peak transmitter power can be increasedaccordingly to maintain system sensitivity while keeping average transmitter power constant.
Image-Formation Algorithm
The general image-formation algorithm approach described in Section 2.5.3.8 varies thesize of the synthetic aperture as a function of range in order to allow azimuth resolution to remainapproximately constant across the wide swath. Also, Section 2.5.3.7 describes how multi-lookprocessing can be performed while keeping the number of looks approximately constant acrossthe swath. These features appear to be important and desirable, and these general approachesshould be applied to any new SAR design for the Coast Guard.
3.1.3 Benefits of Image Processing Techniques
Some of the full-resolution SAR regions-of-interest may benefit from speckle smoothing asmall percentage of the time, but, based on the sea state encountered during this experiment, theneed is not significant enough to build speckle smoothing into an airborne SAR system. Thosefew cases where smoothing is needed should be processed on the ground as a post-flight step.There are cases where, even at 10-m resolution, speckle in single-look SAR images can obscurefine detail that is important to an analyst. Multi-look SAR images provide speckle reductionwithout the resolution degradation effects that result from digital filters for speckle smoothing.These results arc discussed in Section 2.3.
Image processing offers benefits for real-time airborne display and manipulation. Fineresolution (10 m) in conjunction with wide swaths (25 nmi) creates very large images. Theseimages are too large to display on a conventional video monitor. Full-resolution images can beloaded into a large buffer memory from which the data can be manipulated for presentation. Oneoption is to provide two standard video displays on the aircraft, one showing the full swath at
3-4

reduced pixel resolution (20 m/pixel or 30 m/pixel), and one showing a user-selectable region-of-interest at full resolution (10 m/pixel). The best approach for displaying the full-swath images isto perform adjacent window averaging ("boxcar" filtering) on the data in the buffer memory.Regions-of-interest identified by the operator upon examining the full-swath images can beextracted and, if needed, down-linked to users on the ground or sea swuface. Section 2.3 discussesthese issues.
3.1.4 Comments on "Off-the-Shelr' SAR TechnologyAs a result of the SAR parameters analysis and the SAR Capabilities Survey, we have
learned the following.
3.1.4.1 New SAR Design
A new-design SAR cannot be constructed by simply and cleanly putting togethercommercially available modules and software. As pointed out previously in this report, some ofthe modules will be or may be available. For example, almost all hardware for the image formerwill be available for purchase. An existing antenna may be compatible with Coast Guard SARrequirements. The IMU could probably be purchased. Host computer requirements can readily bemet by a commercial PC. However, a considerable amount of custom hardware will have to bedeveloped. For example, the phase-history collector will contain a number of custom rf and high-speed logic circuits. Further, a large software investment will be required, particularly in the areasof the host computer, the image former, and the phase-history collector.
Having stated this, we must note that the design, development, and production of a SARmeeting the requirements defined in this report appear to be well within the capabilities of anumber of existing SAR vendors. So, the technology to develop such a SAR exists; however, thedevelopment can't be done simply by piecing together existing hardware and software modules.
3.1.4.2 Existing SARs
Most of the SAR systems surveyed operate in the X band. Some have steerable antennaswith characteristics similar to those recommended in the conceptual SAR design of Section 2.5.2.The resolutions and swath widths of some of the systems are also compatible with what isrequired (about 10-m pixel resolution and 25 nmi swath width). It may be that an existing systemcould meet or be readily modified to meet Coast Guard requirements.
3.2 RECOMMENDATIONS
3.2.1 If SAR, What SARAs explained above, two primary approaches for developing a SAR to meet Coast Guard
requirements are possible: a) design and build a new SAR, and b) modify an existing SAR.
3.2.1.1 New SAR DesignIn the event that a new SAR is developed, we recommend that, as a minimum, it meet the
performance specifications detailed in Section 2.5.2. Those specifications are for a 10-m, X-band
3-5

system with real-time motion compensation and real-time multi-look image formation, providingan imaged swath of about 25 nmi. Digital image data and auxiliary radar data would be recordedto 4-mm tape as the images are formed. The operator would have two displays on which to viewimages: one for decimated-image, full-swath viewing; and a second, the host computer display,for viewing of full-resolution regions of interest. The operator would also be able to performvarious post-processing operations on regions-of-interest (contrast stretching, resizing, etc.), aswell as store regions-of-interest to disk or tape, print hardcopy images of regions, and formatregion-of-interest image files for output to a telemetry downlink. The conceptual SAR design,described in Section 2.5.2 and detailed in a number of the References, can serve as a starting pointfor the design of a new system.
We further recommend inclusion in the design of a SAR MTI mode (herein called SFT/SAR), a detailed description of which is given in Reference [12](Appendix E). This mode allowsfull SAR processing of moving targets over a number of velocity sub-bands (for example, 10-each5-knot sub-bands over a total velocity band of +20 knots). In this mode, moving targets would bethreshold-detected and displayed as synthetic-video icons over a normal SAR look showingstationary and slow-moving clutter.
Two other enhancements to the conceptual design presented in Section 2.5.2 appear to bedesirable.
"Two-sided imaging could be implemented by modifying the antenna, adding if switching,and enhancing the capabilities of the digital pre-filter, image former, and data handlingsoftware. Each side would be illuminated at one-half the one-sided prf rate, so the SARwould be desensitized by 3 dB in this case at any given range. Processing the full swath onboth sides would, of course, double requirements for formation, handling, and storage ofthe image data; however, costs could be controlled by cutting the swath size in two-sidedmode.
" As suggested by several vendors who responded to the SAR Capabilities Survey, a dual-mode system could be developed. In one mode, this system would provide broad-swathimaging at coarse resolution to meet requirements for oil-spill monitoring defined inSection 2.5.2. A coarse-resolution, broad-swath SAR/MTI capability would also berequired in order to image moving ships. In a second mode, the SAR could provide fine-resolution, narrow-swath images of the target area. Implementation of a dual-modecapability would increase overall cost of the system; however, it appears that performanceof the SAR in its primary mode (i.e., broad-swath oil-spill monitoring) would not have tosuffer as a result of the dual-mode approach. A distinct disadvantage, however, of a dual-mode system is that a second flight pass at a shorter range would be required for fine-resolution imaging. Conceptual design and costing of a dual-mode SAR for the CoastGuard was beyond the scope of this study.
3.2.1.2 Modification of an Existing SARModification of an existing SAR to meet Coast Guard requirements may be a viable option.
As noted above, results of the vendor survey give cause for optimism. A number of existingsystems operate in the X band, and some have design parameters that are similar to those desired
3-6

for a Coast Guard SAR. It is not the purpose of this study to recommend that a particular vendor'ssystem be modified in the development of a possible future Coast Guard SAR. Instead, we willdiscuss below what appear to be optimal circumstances under which an existing system could bemodified to obtain a SAR compatible with Coast Guard requirements.
A large portion of the expense of the SAR development will be in the antenna/ginbal/rf/IF/video-processing portion of the SAR. These parts constitute the classical "radar" portion of thesystem. If it were possible to find an existing system, developed using reasonably currenttechnology (say, < 5 years old), that exhibited appropriate characteristics (with regard to the radarportions identified above) or that could be easily modified to obtain the desired characteristics, agreat savings over a new-design development could likely be realized. Even if the antenna had tobe redesigned, such a system would still be a good candidate for modification.
It should be noted also that a Ku-band system (or a system operating in another frequencyband) could be modified to X band by replacing the transmitter, antenna, and rf front end. Theexpensive portion of the radar that we refer to as the phase-history collector would not necessarilyrequire extensive modification in order to go from Ku (or another band) to X band.
Given that the system to be modified had the appropriate "front-end" characteristics, orsome major subset of those characteristics, major modifications would be limited primarily to thedigital portions of the system: the image former, host computer, displays, and data recorder. It is inthese digital portions that existing systems are least likely to match up to Coast Guard needs. It isalso in these portions that today's technology is making the most rapid advances, so it makes goodsense to completely redesign most of these portions.
The ease with which the newly-developed digital portions of the SAR can be interfaced tothe existing SAR will depend on the degree of modularity exhibited by the existing SAR. If allportions of the SAR are tightly integrated, it will be difficult to split the design apart to add thenew modules. On the other hand, if the existing SAR architecture exhibits modularity, replacingportions of it with upgraded modules is easier.
3.2.2 Image Presentation. Manipulation. and Exploitation AlgorithmsWe recommend a SAR design that acquires full-resolution images and loads them into a
large buffer memory from which full-swath, reduced resolution images can be displayed on onevideo monitor and from which full-resolution, region-of-interest images can be displayed on asecond monitor. The resolution of the full-swath images should be no finer than 20 m/pixel and nocoarser than 30 m/pixel. User selectability of this resolution may be advantageous. A mechanismfor selecting and displaying regions-of-interest (trackball, mouse, pen, etc.) from the full-swathimages is needed. We recommend that some means of archiving and/or down-linking regions-of-interest be provided. Where possible, other pertinent flight or environmental information shouldbe incorporated with this image data.
Some means of viewing and post-processing SAR images on the ground is required. Amodem PC-based computer system should be adequate. This system should include software toperform simple image manipulation techniques such as speckle smoothing, region-of-interestextraction, image annotation with symbols and text, data archiving, and data display. This system
3-7

should also include a high-quality printer for producing hardcopies of important images.Dedicated hardware for receiving down-linked images and porting them to the PC is also anattractive option.
3.2.3 Recommended Follow-On SAR TbstlngShould the Coast Guard decide to actively pursue the acquisition of a SAR system, an
informative first step would be a set of test flights with a commercially available SAR whosecapabilities most closely match those of the conceptual design specified in this document. A jointexperiment with simultaneous imaging of oil-slicks using both the modernized APS-131 SLARand the commercial SAR would be ideal. Images could then be compared in a similar fashion tothe comparisons made between the AIREYE and TWin Otter in this report. A study where thecommercial system is contracted for use only during a joint expeiment would provide anotheropportunity to verify that the resolution and swath-width values specified in this report continueto meet Coast Guard requirements. The advantage of such a study is the elimination of anyfinancial risk that would be entailed in designing and acquiring a dedicated SAR system. In theevent that a commercial SAR would not have a multi-look capability, the multi-look simulationdiscussed in Section 1.6.3.1 could be employed to make realistic comparisons.
3-8

REFERENCES
1. Report: U.S. Coast Guard Oil Spill Remote Sensing Workshop. (Prepared by theEnvironmental Research Institute of Michigan, Ann Arbor, MI), Report 213259, March1991. Workshop held January 28-29, 1991, Avery Point. Groton, CT.
2. K. Hasselmann, et al, "Theory of Synthetic Aperture Radar Ocean Imaging: A MARSENView,"J. Geophys. Res., Vol. 90, C3, May 20, 1985, pp. 4659-4686.
3. Lyle C. Shroeder, et al, "The Relationship Between Wind Vector and Normalized RadarCross Section Used to Derive SEASAT-A Satellite Scatterometer Winds," J. Geophys.Res., Vol. 87, April 1982, pp. 3318-3336.
4. "Choice of Incidence Angle for November Santa Barbara Tests," SNL memorandum fromRobert M. Axline, Org. 2344, to Jeffery D. Bradley, Org. 9134, September 11, 1992.
5. Werner Alpers, et al, "The Damping of Ocean Surface Waves by Monomolecular Sea SlicksMeasured by Airborne Multi-frequency Radars During the Saxon-FPN Experiment," inProc. IGARS '91, (Espoo, Finland, June 3-6, 1991), pp. 1987-1990.
6. "Operator's and Unit Maintenance Manual, Radar Surveillance Set AN/APS-131," U.S.Coast Guard Document No. 68-PO3879U, March 15, 1981.
7. "Estimated Sensitiv1Ly of AIREYE SLAR for the Case of a Distributed Target," SNLmemorandum from Robert M. Axline, Org. 2344, to Distribution, June 24, 1993.
8. "Suggested Flight Scenarios for November Santa Barbara Flights," SNL Memorandumfrom B. L. Remund, Org. 2345, to Jeffery D. Bradley, Org. 9134, September 17, 1992.
9. H. Johnsen, "Multi-look Versus Single-look Processing of Synthetic Aperture Radar ImagesWith Respect to Ocean Wave Spectra Estimation," Int'l. J. Remote Sens., Vol. 16, No. 9,1992, pp. 1627-1643.
10. Jeffery Bradley, Evaluation of Synthetic Aperture Radar for Oil Spill Response, TestPlan, SNL departmental document, Dept. 9134, Revision 1.0, October 16, 1992.
11. Jeffery Lunsford, "ImView Release II: User's Guide," SNL departmental document, Dept.2344, Jan. 7, 1992.
12. Azriel Rosenfeld and Avinash Kak. Digital Picture Processing. Academic Press, NewYork, NY, first edition, 1976, pp. 197-200.
13. William Pratt. Digital Image Processing. John Wiley and Sons, New York, NY, 1978, pp.330-332.
14. Thomas R. Crimmins, "Geometric Filter for Reducing Speckle," in Proc. SPIE Int'l. Conf.Speckle, Vol. 556, (San Diego, CA, Aug. 1985), pp. 213-222.
R-1

15. "Conceptual Requirements for a Synthetic Aperture Radar System for Oil-Spill Response,"SNL Coast Guard Project Document, April 28, 1993.
16. "Information Survey Relating to Synthetic Aperture Radar Capabilities", SNL Coast GuardProject Document, April 28, 1993.
17. "Coast Guard SAR Design Calculations and Identification of Key Issues," SNLmemorandum from Robert M. Axline, Jr., Org. 2344, to Distribution, June 2, 1993.
18. "MTI Mode for the Coast Guard SAR", SNL memorandum from Robert M. Axline, Jr., Org.2344, to Distribution, June 21, 1993.
19. "Motion-Compensation Requirements for Coast Guard SAR", SNL memorandum from J. T.Cordaro, Org. 2344, to Robert M. Axlne, Jr., July 19, 1993.
20. "RAR Mode for the Coast Guard SAR," SNL memorandum from Robert M. Axline, Jr.,Org. 2344, to Distribution, July 17, 1993.
21. "Additional Coast Guard SAR Design Calculations," SNL memorandum from Robert M.Axline, Jr., Org. 2344, to Distribution, June 24, 1993.
22. "Interim Response to Gary Hover's Comments on My Memorandum of March 15, 1993 andTransmittal of SAR Capabilities Survey Information," SNL memorandum from Robert M.Axlne, Jr., Org. 2344, to Distribution, May 4, 1993.
23 D. E. Fraser and G. V. Morris, "Performance of Coherent-on-Receive Synthetic ApertureSide Looking Airborne Radar," Report No. CG-D-109-76, Motorola, Inc., prepared for theU.S. Coast Guard and the U. S. Army, October, 1976.
24 T. Kozu, et al, "Observation of Oil Slicks on the Ocean by X-Band SLAR,"in Proc.IGARSS '87 Symposium, (Ann Arbor, MI, May 1987), pp. 735-740.
R-2

APPENDIX ASLAR SENSITIVITY
This appendix contains a copy of a memo on AIREYE SLAR sensitivity prepared by RobertM. Axline, Jr., June 24, 1993. It is included here for completeness.
(The remainder of this page intentionally left blank.)
A-I

date: June 24, 1993 Abuqu.qu,. Now Mexico 87185
to: Distribution
from: Robert M. Axline, Jr., Radar Analysis Department, 2344
subject: Estimated Sensitivity of AIREYE SLAR for the Case of a Distributed Target
References
[1] "Operator's and Unit Maintenance Manual, Radar Surveillance SetAN/APS-131," U.S. Coast Guard Document No. 68-PO3879U, March 15,1981.
[2] "Coast Guard SAR Design Calculations and Identification of Key Issues,"SNL memorandum from Robert M. Axline, Jr., 2344, to Distribution,June 2, 1993.
[3] "Additional Coast Guard SAR Design Calculations," SNL memorandumfrom Robert M. Axline, Jr., 2344, to Distribution, June 24, 1993.
[4] D. E. Fraser and G. V. Morris, "Performance of Coherent-on-ReceiveSynthetic Aperture Side Looking Airborne Radar," Report No. CG-D-109-76, Motorola, Inc., Government Electronics Division, prepared forthe U.S. Coast Guard and the United States Army, October 1976.
[5] "Target Detection Predictions for AN/APS-131 and AN/APS-135 RadarSystems," Peter D. Kennedy, Motorola Inc., Government ElectronicsDivision, prepared for the U.S. Coast Guard, May 19, 1982.
The purpose of this study is to determine the approximate sensitivity of theAIREYE SLAR [1] so that its performance can be compared to performance ofa conceptual SAR system described in Reference [2]. Herein, system sensitivitywill be measured in terms of estimated minimum distributed-target scatteringcoefficient, oon., that can be detected by the AIREYE SLAR at a range of 54km (maximum SAR range considered in [2] and [3]). Results show that, at thisrange, estimated omw, is about -41.9 dB for this SIAR.
A-2

Distribution -2- June 24, 1993
Equation for o.o
Minimum detectable scattering coefficient can be computed approximately from radarand geometrical parameters using equation (1).
oo_. - (S/N).,j(4iR)SkTBF.L cos#/[PG.2X2Mp.J N.J. (1)
vow has units of m2/m 2 . This quantity is more commonly expressed in decibels; thisrepresentation is just 10loglo(oo,.). The assumption that minimum scattering coefficientis improved as I/I N. is a only an approximation. Parameters of (1) are defined in Table1, below.
Table 1. Radar and geometrical parameters in (1).
SyM li Value Definition(S/N).,, W/W 4 minimum detectable signal-to-noise ratioR m 5.4 E3 range to target pixel [2]k J/K 1.38 E-23 Boltzmann's constantTO OK 288 ambient temperatureB Hz 6 E6 rf receiver bandwidth [1]F, W/W 6.3 not specified in [1]; value of 7.96 dB inferred from
[5] and used here; value of 13 dB maximumspecified in COR report [4] probably notrepresentative of AN/APS-131
L W/W 2.5 all rf and propagation losses; assumes 2.44 dB txloss and 1.5 dB atmospheric loss; receiver lossincluded iin F.; radome loss included in G.
0 0 6 depression angle [5]Pt W 200 E3 peak transmitter power [5]G. W/W 2.51 E3 average antenna gain over the beam; taken to 34
dB (35.9 dB from [1], derated by 1.9 dB)X m 0.032 electrical wavelengthAO rad 0.014 antenna azimuth beamwidthPr m 30 range resolution [1] and [5]N. - 180 number of pulses averaged noncunerently in
November '92 digital SLAR implementation (seediscussion below)
(Note: Table entry for receiver bandwidth, B, corrected on August 15, 1993.)
A-3

Distribution -3- June 24, 1993
Equation (1) optimistically assumes that the antenna is pointed so that peak gaincorresponds to the direction from the SLAR to the pixel of interest (at 54-km slant range).In fact, the antenna is normally pointed at a nominal 1 * depression angle, and the patternat the pixel of interest (54-kmn range and 6° depression) would be down by at least about3.5 dB from its peak value. The quantity No has been estimated using the followingequation.
N. = (XMf,/V). (2)
Here, X. is the along-track distance over which averaging takes place, The assumed valueof X. for these calculations is 30 m (this information came from Colin Odom, MotorolaInc., Government Electronics Division). fp is the SLAR's prf, taken here to have anaverage value of 750 pulses per second (the SLAR transmits out just one side of theaircraft). In (2), V. is aircraft velocity. The value used was 125 m/s. The resulting valueof N. is 180. These computations and estimates of N. apply only to the digitalconfiguration of the SLAR that was fielded for the November 1992 Santa Barbara tests.Ordinarily, raw (unaveraged) video pulses are fed directly to the SLAR's film recorderand integration occurs on the film. The rate of advance of the film is tied to theinstantaneous aircraft velocity, therefore, more integration occurs at lower velocities, lessat higher velocities.
The estimated value of o%,i. resulting from evaluation of (1) is 0.000064 m2/m2, or -41.9dB. This estimate should probably be looked at as a slightly optimistic bound on ooW.because of the uncertainty of the appropriateness of the use of I/I N. in equation (1).
Azimuth Resolution Cell Size for the SLAR
The range resolution, pr, of the SLAR is 30 m, independent of range; however, theazimuth resolution, p., increases with increasing range. p. can be computed asapproximately
p. = ReAO, (3)
where R is slant range to the target pixel and AiO is the antenna's azimuth beamwidth.Table 2 shows the result of evaluating (3) at various ranges.
A-4

Distribution -4- June 24, 1993
Table 2. Variation of p, Versus R.
R . I a - W A
10 13920 27930 41840 55950 698
Therefore, for the SLAR, the clutter cell is quite wide, and the cross-sectional area it
covers is large.
Distribution:
Gary L HoverUSCG R&D Center, Environmental Safety Branch1082 Shennecossett RoadGroton, CT 06340-6096
Christopher Allen D/852 MG39Allied-Signal Aerospace CompanyP. O. Box 419159Kansas City, MO 64141-6159
2344 J. T. Cordaro2344 J. J. Mason9134 J. D. Bradley9134 G. A. Mastin2344 R. M. Axline, Jr.
A-5

(This page intentionally left blank.)
A-6

APPENDIX BSAR CONCEPTUAL REQUIREMENTS
This appendix contains a copy of a project document discussing conceptual requirements fora future synthetic aperture radar system for oil-spill response prepared by Robert M. Axline, Jr.,April 28, 1993. It is included here for completeness.
(The remainder of this page intentionally left blank.)
B-I

Conceptual Requirements for aSynthetic Aperture Radar System for
Oil-Spill Response
Prepared for:
The U.S. Coast Guard R&D Center1082 Shennecossett RoadGroton, CT 06340-6096
Prepared by:
Sandia National LaboratoriesP. 0. Box 5800
Albuquerque, NM 87185
April 28, 1993
SNL Points of Contact:
J. D. Bradley, SNL/Coast Guard Project ManagerRemote Sensing Systems Applications Department, 9134Phone: (505) 844-2441; FAX: (505) 844-5767
Robert M. Axline, Jr., line Manager,Radar Analysis Department, 2344Phone: (505) 844-5064; FAX: (505) 844-1599
B-2

Conceptual Coast Guard SAR Requirements Page 2
Introduction
To fulfill its role in oil-spill response, the Coast Guard currently operates the AIREYEsensor suite, carried aboard a Falcon 20 aircraft. One element of that suite is an X-band side-looking airborne radar (SLAR). While the SLAR provides broad-swathcoverage and timely image products, the azimuth resolution of that system degrades tohundreds of meters at a range of 20 miles. The Coast Guard's R&D Center isinvestigating the possible benefits of employing a synthetic aperture radar (SAR) as oneof its next-generation sensors. Achievable improvements in the next-generation radarmay include improved azimuth resolution; decreased latency of image products; andincreased functionality in viewing, manipulation, geo-registration, and annotation ofreal-time imagery.
This document contains high-level, conceptual requirements for a synthetic apertureradar (SAR) system for oil-spill response. Sandia and the Coast Guard have developedthese requirements in a cooperative effort funded by the Coast Guard. At this time, theCoast Guard has no plans to develop a SAR for oil-spill monitoring. These conceptualrequirements have been developed only as a tool for use in the joint Sandia/Coast-Guard study.
Scope of Requirements DescriptionAlthough the next-generation Coast Guard platform will likely use multiple sensors,requirements given here deal only with the SAR portion of the system. Somecomponents of the SAR system would be usable by other sensors. For example, ahardcopy printer would be used to print outputs of multiple sensors. In these cases,standard devices and interfaces are desired. Any components required for ground-based processing of SAR data are beyond the scope of this requirements document;however, important characteristics of the SAR sensor that will affect ground-processingrequirements are relevant here (e.g., volume of data, any requirements for mosaicing orcorrection of data, etc.)
Aircraft Platform
These preliminary requirements have been written in a manner that is largelyindependent of the aircraft platform. Typical velocity of the aircraft should be assumedto be in the range of 90-124 m/sec. It should be assumed that the SAR for oil-spillmonitoring would be integrated into a multi-sensor platform owned or leased by theCoast Guard. The current AIREYE aircraft is a Falcon 20. Do not assume that thenext-generation platform would have the same constraints on weight, volume, andpower as are now placed on the AIREYE SLAR.
B-3

Conceptual Coast Guard SAR Requirements Page 3
Primary SAR Usage and MeasurementsThe primary usage of the SAR will be for oil-spill detection and monitoring. In this
mission, the SAR will create broad-swath images of ocean areas. The imaging mode
will be broadside (900 squint) strip-map imaging. Image pixel values will be magnitude-only (see comments relating to image phase, below). Number of quantized data bits isTBD. The possibility of using the SAR for other missions (marine pollution, e.g.,against bilge pumpers; or law enforcement, e.g., against smugglers) is of secondaryinterest. A capability for fine-resolution (meter or sub-meter) spotlight SAR foradverse-weather and standoff identification of vessels is desired for this latterrequirement.
"Off-the-Shelf" TechnologyFor any recommended new SAR development or significant modification to an existingSAR system, hardware/software recommended should be of high reliability, be readilyavailable, and be standard in some sense. The system must be maintainable by enlistedCoast Guard personnel. The Coast Guard is willing to let the system grow in size,weight, and power in order to achieve these goals.
Consideration of Existing SystemsBecause of the high cost of development of a new SAR, the feasibility of using existingSAR platforms, or modified versions of those platforms, is of primary interest to theCoast Guard.
Real-Time Data AvailabilityThe real requirement is that full-resolution images be available for viewing within a fewminutes after the plane lands. In cases where the aircraft can't land near the spilloperations center, some means of high-speed data transfer from the aircraft to the spillsite would be required. Real-time image-formation capability must be available on theplane. Real-time imagery must be available for immediate on-board viewing, region-of-
interest (ROI) selection, recording, and/or downlinking to a ground station near thespill site.
QperatorsThe operators will have technical skills equal to those of enlisted Coast Guard sensor-
suite operators. Two operators will man the multi-sensor suite. The operators will bephysica.'y separated from the aircraft's pilots, and there will be voice communications
betwetn the operators and the pilots. The operators will have a duplicate ControlDisplay Unit at their sensor control panel.
B-4

Conceptual Coast Guard SAR Requirements Page 4
Installation ConfigurationsNo specific requirements have been determined. Specifications and information oninstallation configurations should be limited primarily to issues concerning overallsystem power, size, and weight, including the antenna. System cooling requirementsshould also be defined. Specification information collected on existing platforms shouldinclude brief descriptions, and possibly sketches of mounting configurations (e.g.,internal versus external or (pod) mounting).
Stabilization and Navigation RequirementsThe SAR system will not control the aircraft's trajectory; however, the system designmay place requirements on allowable deviation of the aircraft from an ideal straight-line trajectory in order to assure proper SAR operation. Accuracy of the SAR'sintegrated navigation and motion compensation system must be sufficient to allow thesystem meet its stated requirements relating to impulse-response mainlobe width andsidelobe levels.
Required SwathThe baseline requirement is that the SAR be able to image out of one side of theaircraft. The imaged swath must be more than 10 miles in extent for the system to beuseful. The AIREYE SLAR routinely images a 27-mile swath. If the SAR can achievea 20-25 mile swath, this will best meet the requirement. It is highly desirable that theSAR image both sides of the aircraft simultaneously with a minimum 10-mile swath perside.
Required Resolution (Oil-Spill Monitoring Only)The required resolution of the SAR system is TBD. Recommendations for desiredrange and azimuth resolutions will result from an ongoing study being performed jointlyby the Coast Guard and Sandia.
Range Resolution. Range resolution of the existing AIREYE SLAR is about 30 m(200 ns real pulse). Improved range resolution may be of interest, depending on theoutcome of data analyses and priorities of other uses for the system. For this reason,bounds on slant-range resolution for oil-spill monitoring should be considered to bebetween 3 and 30 meters.
Azimuth Resolution. Azimuth beamwidth for the AIREYE SLAR antenna isabout 10, which yields an azimuth resolution of about 55 m at a range of 2 statute milesand an azimuth resolution of about 550 m at a range of 20 statute miles. SAR promisesto provide significantly better azimuth resolution than that of the AIREYE SLAR. Atthis time, bounds on azimuth resolution should be considered to be between 3 and 30meters. Required resolution for the SAR should be specified at the range defining the
B-5

Conceptual Coast Guard SAR Requirements Page 5
maximum swath of the SAR. Azimuth resolution will improve as range decreases in theswath.
System Sensitiviloo of noise will need to be < -40 dB.
SAR OQerating Freo~uenaStudy of the literature has indicated that contrast between oil and open ocean isachievable across a fairly wide range of frequencies. SARs having frequencies betweenC and Ku bands, inclusive, are of interest.
SAR PolarizationSAR must be like polarized. Optimum polarization at small depression angles is W.
Image RequirementsRecorded and displayed images will be in digital, magnitude-only form, with pixelsquantized to a TBD number of bits. There is no specific requirement for phase data;however, if an existing platform has the capability to produce complex imagery, this factwill be of interest.
Image Rendering. It is desired that images be projected into the ground plane, sothat the image will represent a rectangular map of ocean surface reflectivity. One axisof the map will be parallel to the flight path of the plane, and the other axis will beperpendicular to the flight path and in the plane of the ocean's surface. The desiredrendering should result in square pixels (equal azimuth and cross-track dimensions)after projection onto the ocean's surface.
Image Calibration. It is desired that gross radar effects, such as antenna patternand range-law trends be removed in real-time images available on the aircraft. Relativeamplitude variation due to spatial location of a target in the corrected image should beless than +_TBD dB. Absolute amplitude calibration, in terms of radar cross section orscattering coefficient is not required for every mission; however, it is desirable that thesystem be so designed that it can be calibrated for particular missions, and the systemshould be required to hold that calibration specification over the duration of themission. Also, the calibration scaling factor could probably be computed either in realtime or post-mission.
Image Annotation RequirementsThe system must provide a means of annotating images for display and printing.Annotation should include latitude and longitude reference marks, date, time, altitude,speed, pitch/yaw/roll, heading, operator comments, target symbols, ROI boxes, andother mission support symbology. Ideally, the image annotation would be inserted byreconfigurable software that could be selected according to mission requirements.Geographic ties to the imagery are the key issue here.
B-6

Conceptual Coast Guard SAR Requirements Page 6
Data Recording RequirementsThe SAR should provide a capability to continuously record all real-time digitalimagery produced by the system. The SAR should also be able to record any navigationand/or radar data required for post-mission geo-registration and image-processingoperations. Recording media should be of a removable cartridge type. In addition, theSAR system should provide for recording of raw phase histories or other data for thepurpose of occasional diagnostic evaluation or maintenance of the system. Equipmentrequired for phase-history recording need not be on the plane on all missions. Aprovision should be made to record operator comments during and after a mission.
Image Processing Requirements
A number of different types of image processing operations are possible:
1. Real-time, continuous operations on real-time imagery.
2. On-board processing of selected (captured or retrieved) real-time images(either during an imaging operation, or afterward).
3. Post-mission processing of any or all imagery.
Real-time Image Processing. These functions, which are performed automaticallyby the radar and its signal processor, will be limited to what can be economically donein real-time hardware. Desired functions should include antenna-pattern and range-lawcorrections, geo-registration, look-up table and mapping-function application. Otherfeatures may include temporal multilook or pixel-averaging for speckle reduction.
On-Board Processing of Selected Images. Operations may include pixeldecimation and replication (zoom-out and zoom-in), annotation, file preparation forprinting on a hardcopy device, and file preparation for downlinking. It is envisionedthat on-board processing capabilities will be a subset of post-mission ground-processingcapabilities. All image-processing functions must be operator-friendly and easy to trainto. Operators must be able to understand tradeoffs associated with the use of anyavailable image processing tools and understand when and when not to use them.
Post-Mission Processing. Post-mission processing will include all capabilities listedabove for on-board processing; however, it will likely include additional imageenhancement and filtering techniques. Further, post-mission processing will providethe capability to process any and all image data, not just selected images.
B-7

Conceptual Coast Guard SAR Requirements Page 7
Image Display RequirementsThe SAR system should include a high-resolution display capable of displaying all real-time imagery produced during a mission. It may be necessary to decimate the real-timeimagery in order to provide a full-swath display to the operators. The operator shouldbe able to either display imagery continuously, as it is formed, or to freeze selectedframes of imagery for more detailed and lengthy inspection. The image display shouldbe linked to a workstation capable of performing the on-board processing of freeze-frame or retrieved images, as described above. Therefore, the image display shouldalso be able to display the results of this processing. The image display will almostcertainly be required to display multiple sensor outputs, with a windowing capability todisplay data from more than one sensor simultaneously. The primary use of this displaywill be real-time sensor and aircraft data monitoring and image/target selection by theoperator. The interface to the display must be a standard one (RGB, NTSC, etc.).
Other Operator Display RequirementsAn operator control display will be required to allow the operator to interactivelyprocess, annotate, and downlink selected images. The Coast Guard currently envisionsthat this display would be separate from the image display; however, integration of anyor all of the control-display functions with the image display would be acceptable.
Telemetry Interface RequirementsThe SAR should provide an interface that will allow either a raw or aprocessed/enhanced image to be passed to either a system-control processor or a datatelemetry link for transmission of selected image data to a ground station. Northrop'sSeaView software will be the product used to format, compress/decompress, andtransmit/receive the image data.
Printe•d HardccThe SAR system. .,,st be capable of being interfaced to an on-board printer forproduction of image hardcopies. The Coast Guard has suggested that the airbornesensor system be equipped with an HP Deskjet-type printer for this purpose. Theprinter should be standard to the extent that it can also be used to print image datafrom other sensors in the suite.
Uses of Printed ImagesThe Coast Guard and NOAA will use the images to determine where oil is and is not,to locate the boundaries of the slick, and to monitor slick movement over time. The on-scene commander will want to see a ground-plane rendering of the SAR image. Likely,he would want to be able to overlay the SAR image with an existing chart or map of thespill area. Images that can be scaled to match standard NOAA nautical charts would behighly desirable, particularly on the ground station, where transparencies could beprinted. In addition, the image data should be formattable for porting to computer-based geographic information systems used by NOAA and the USCG (possible futurecapability).
B--8

APPENDIX CSAR INFORMATION SURVEY
This appendix contains a copy of the survey of SAR capabilities prepared by Robert M.Axline, Jr., April 28, 1993. It is included here for completeness.
(The remainder of this page intentionally left blank.)
C-i

Information Survey Relating toSynthetic Aperture Radar Capabilities
Requesting Agency:
Sandia National LaboratoriesP. 0. 5800
Albuquerque, NM 87185
April 28, 1993
Please direct questions and written survey responses to:
Robert M. Axline, Jr., Radar Analysis Department, 2344Sandia National LaboratoriesP. O. Box 5800Albuquerque, NM 87185Phone: (505) 844-5064; FAX: (505) 844-1599
Alternate SNL point of contact for this survey:
Jeff Bradley (SNL/Coast Guard Project Manager)Remote Sensing Systems Applications Department, 9134Phone: (505) 844-2441; FAX: (505) 844-5767
C-2

SAR Capabilities Survey Page 2
Introduction
Sandia National Laboratories is a non-profit corporation operated by AT&Tunder contract to the United States Department of Energy. Sandia's goal is toprovide exceptional service in the National interest. In recent years, Sandia hasdeveloped capabilities in the area of synthetic aperture radar. We currentlyoperate a state-of-the-art Ku-band strip-mapping SAR and have developedsignificant capabilities in miniaturized microwave components, high-speeddigital processing, precise navigation, image-formation algorithms, and auto-focus techniques.
The Coast Guard's AIREYE multi-sensor suite is the principal U.S. sensorplatform for oil-spill response. AIREYE employs an X-band side-lookingairborne radar (SLAR). We are currently performing work under contract tothe U.S. Coast Guard. The purpose of this work is to assess the potential ofSAR (versus SLAR) for use in oil-spill monitoring. Our role in this contract isthat of an independent advisor. In November of 1992, Sandia collected Ku-bandSAR imagery of naturally occurring oil seeps near Santa Barbara, CA. TheAIREYE platform simultaneously collected SLAR data of common test areas.Since that time, Sandia, the Coast Guard, and the National Oceanographic andAtmospheric Administration (NOAA) have been jointly analyzing flight-testimages to determine effects of radar resolution, wind speed, wind direction, andother factors on an image interpreter's ability to distinguish oil from open ocean.More recent efforts have been aimed at developing preliminary high-levelrequirements for a possible future Coast Guard SAR sensor.
Currently the Coast Guard has no plan to develop a SAR sensor for oil-spillmonitoring. However, that agency is interested in performing exploratorystudies, like the one in which we are engaged, to determine what improvementsmight be possible with a SAR sensor.
The Information Survey
Purpose of the SurveyOne of the objectives of our study is to obtain information from other agenciesrelating to existing SARs and their capabilities. This information will then allowthe Coast Guard to understand the current state-of-the-art and to determinehow that state relates to the sensor performance features they desire for oil-spillmonitoring. To this end, we have prepared an information survey, which wehave included in this package.
C-3

SAR Capabilities Survey Page 3
Requested Response DatePlease complete the survey and return it in the self-addressed envelope thataccompanies this package. All responses are to contain only unclassifiedinformation. We ask that your response be mailed by MU2,2L.1993. If yourresponse is belated, we would still appreciate receiving it, provided you mail itno later than July 1, 1993.
DiscaimerConsistent with information stated above concerning the purpose of this survey,we emphasize that this survey does not constitute a request for quotation or aformal request for information relating to any planned development activityeither on behalf of the Coast Guard or of Sandia National Laboratories.
Participation is on a Voluntary BasisYour participation in this survey is being requested on a voluntary, no-cost basis.Thank you for your help in this work.
Completing and Returning the Survey
Information sought consists of two types:
1. Please provide functional performance information on system(s) youcurrently own or operate. The attached "Functional PerformanceCharacteristics" can be used as a template or guideline for thisinformation. Alternatively, available brochures or specification sheetsyou may have in-hand could serve as well.
2. Please review the document entitled "Conceptual Requirements for aSynthetic Aperture Radar System for Oil-Spill Response," which isincluded in this package. In a free-form response format, please brieflycomment on similarities or differences between your system and theconceptual requirements described in the document. You need onlydeal here with those aspects of your system that are not evident fromthe information in item 1. Information on imminent upgrades to yoursystem and on new systems you are now developing is also of interest.
Please return the completed survey in the self-addressed envelope provided withthis package. If possible, mail your response by My 20, 199a. An advance FAXcopy of your completed survey would be greatly appreciated. Belated surveyresponses mailed by July 1, 1993 will also be welcomed. Information providedby you will be included, in summary form, in a Sandia report to the Coast Guard.That report will be distributed publicly after approval by Coast GuardHeadquarters.
C-4

SAR Capabilities Survey Page 4
Functional Performance Characteristics
"* Agency Name" System Name"* Prime Usage of System"s Aircraft Platform (specify type)"* platform velocity, m/s* Supported Radar Modes"* strip map (Y/N)
other modes (squint, spotlight, interferometry, etc., describe)"* real-time imaging (Y/N)* Real-time (or Ground Processed) Image Attributes (if both, please list
separately)real or complex (specify)
* # of bits per pixel"* surface cross-track resolution, m* azimuth (along-track) resolution, m
IPR maximum sidelobe levels (cross-track and azimuth), dB"* # of pixels, range dimension"* # of pixels (per patch), azimuth dimension"S maximum pass length, km
pixels per resolution cell (cross-track and along-track)"* image cross-track swath (on the surface), km
azimuth patch width, kmGeometry
"altitude, km* slant range (to scene center-line), km"* antenna pointing angles (depression),
squint angles (+ 900 is right side-looking), °5 Noise-equivalent oe at Stated Resolution, dB
Amplitude Calibration
can be calibrated (Y/N)calibrated in real-time (Y/N)absolute accuracy, p and a, dB
Note: If it is not feasible for you to supply all data, please try to supplyinformation on key parameters highlighted with "". If parameters varyover a range of values, indicate range limits.
C-5

SAR Capabilities Survey Page 5
Functional Performance Characteristics, continued, ....
* Multilook Processing (Y/N)* temporal: # of looks at stated azimuth resolution* range-dimension: # of looks at stated range resolution
pixel averaging: effective # of independent samples at stated resolutionFrequency Generator and Transmitter
* operating frequency, GHz* polarization of antenna(s)
transmitter bandwidth, MHzpulse duration, As
* waveform intra-pulse modulation (chirp, PN code, etc.)* prf, kHz
interpulse modulation type, if any* peak transmitter power (at antenna input), W* maximum duty factor, %
maximum average transmitter (at antenna input) power, WAntenna
antenna orthogonal beamwidths (3 dB one-way), °number of phase centerslength and height, mpeak antenna gain, dB
Receiverfront-end noise figure, dBrf bandwidth, MHzif bandwidth, MHzderamp (stretch) processing (Y/N)video bandwidth, MHz
A/D Converter and Bandpass FilterS # of A/D bits
A/D sample rate, MHznumber of video samplespresum integerazimuth antenna oversampling factor
* typical azimuth sample rate, HzReal-Time or Ground-Based Image Former (specify which)
algorithm type (2-D FFT, polar reformatting, etc.)* elevation antenna correction (Y/N)
C-6

SAR Capabilities Survey Page 6
Functional Performance Characteristics, continued,
Real-Time or Ground-Based Image Former, continued,* azimuth antenna correction (Y/N)* ground-plane projection
range-migration correction (Y/N)range-law correction (Y/N)presummer correction (Y/N)video-filter correction (Y/N)auto-focus (Y/N)geo-referencing (Y/N)
Data Handlingmaximum data rate to tape (phase history and images), Mbits/smaximum data rate per tape unit, Mbits/sunber of tape units online
* recording capacity per unit (Gbytes)Image Display
* horizontal display size, pixels* vertical display size, pixels* dynamic range, bits/pixel
Navigation Accuracies
* navigator typeattitude accuracy,position accuracies, mvelocity accuracies, m/s
GPS aiding (Y/N)Motion Compensation
* real-time compensation (Y/N)update rate to SAR, Hz
Mechanical Characteristicstotal power consumption of SAR, kWphysical volume of SAR hardware, m3
Rough Order of Magnitude Cost to Replicate System, $kincluding fabrication, laboratory integration, and testing, of radar and motioncompensation subsystem, but not including any platform integration.
C-7

(This page intentionally left blank.)
C-8

APPENDIX DSAR DESIGN CALCULATIONS
This appendix contains a copy of a memo on Coast Guard SAR design calculations preparedby Robert M. Axline, Jr., June 2, 1993. It is included here for completeness.
(The remainder of this page intentionally left blank.)
D-1

Sandia Nation Laboratoiesdate: June 2, 1993 Albuquerque. Now Mexico 87185
to: Distribution
from: Robert M. Axline, Jr., Radar Analysis Department, 2344
subject: Coast Guard SAR Design Calculations and Identification of Key Issues
References
[1] "Conceptual Requirements for a Synthetic Aperture Radar System for Oil-SpillResponse," SNL CG-Project Document, April 28, 1993.
[2] "Notes on Motorola Report CG-D-109-76," memorandum fromR. M. Axline, Jr., 2344, to Distribution, May 19, 1993.
[3] "Interim Response to Gary Hover's Comments on My Memorandum of March15, 1993, and Transmittal of SAR Capabilities Survey Information,"memorandum from R. M. Axline, Jr., 2344, to Distribution, May 14, 1993.
[4] "Choic• of Incidence Angle for November Santa Barbara Tests," memorandumfrom R. M. Axline, Jr., 2344, to J. D. Bradley, 9134, September 11, 1992.
Introduction
This memorandum documents design calculations and tradeoffs for a Coast Guard
SAR for imaging of ocean-borne oil spills. The approach taken was as follows.
1. Gather conceptual requirements (see [1]).
2. Translate conceptual requirements into a "starting-point" table of performancecharacteristics (Table 1).
3. Identify areas of uncertainty and key issues to be resolved.
4. Analyze tradeoffs on key issues to further refine and quantify information givenin Table 1.
D-2

Distribution -2- June 2, 1993
Conceptual Requirements Summary and Starting-Point Characteristics
Reference [1] defines conceptual requirements for a Coast Guard SAR for oil-spill response.Those requirements dictate a broad-swath SAR (20 to 25 nautical-mile swath) with real-timeimage formation capabilities. The prime use of the system is to be oil-spill monitoring. In thismemorandum, I consider only this mission. Reference [1] contains discussions relating torequired swath, range and azimuth resolution, system sensitivity, operating frequency, imagecharacteristics, annotation, data recording, image processing and display, telemetry, andprinting. Via interpretation and computational estimates, I have translated these high-levelrequirements into the "starting-point" performance characteristics given in Table 1.
Table 1. SAR Characteristics Starting Point
Parameter or Attribute Units Value or DescriptionAgency Name ---- US Coast GuardSystem Name ---- SAR for oil-spill responsePrime Usage of System ---- oil-spill imagingAircraft Platform ---- Falcon 20
platform velocity m/s 90-124Radar Supported Modes ---- strip map; squint angles TBD
----. real-time multilook imagingReal-Time Image Attributes
real magnitude ---- recordedcomplex data ---- available, not recorded# bits per pixel ---- 8 or 16 (TBD in analysis)slant-range resolution pr m 10-30 (TBD in analysis)azimuth resolution p, (@ 25 nmi) m 10-30 (TBD in analysis)IPR maximum sidelobes dB -30image slant-range swath nmi 20-25
km 37-46# pixels, range dimension pixels 6950 (25 nmi swath; 10-m Pr)
(assuming 1.5 oversampling) pixels 2315 (25 nmi swath; 30-m pr)azimuth patch width km TBD# pixels (per patch), azimuth ---- TBDpixels per resolution cell .--- 1.5 (range and azimuth)maximum pass length km TBD
Geometryaltitude, km kft 20
km 6slant range (near range) km 8.5slant range (far range) km 54 (@ 25 nmi swath)
D-3

Distribution -3- June 2, 1993
Table 1. SAR Characteristics Starting Point, continued .-
Geometry, continued ....depression angle (near range) 0 45
depression angle (far range) 0 6.4 (ignoring curvature)squint angle 0 +90 +TBD variationnear-range az. antenna footprint m 148 (1 az. beamwidth, 0.)far-range az. antenna footprint m 942 (1 Oa)antenna steering - approach TBD
Typical Aperture Length m 87 (10-m p. @ 54 kn)In 14 (10-m p. @ 8.5 kin)
Typical Aperture Time s 0.7 (10-m p. @ 54 kIn)s 0.1 (10-m p. @ 8.5 kin)
Noise-Equivalent a* Required dB -45 (@ 25-nmi., TBD wind)Amplitude Calibration pre- or post-mission
mean error dB -2 It.< 2standard deviation dB *. < 2
Multilook Processing (real-time)temporal, Ei I Vij.k I /N looks number of looks, N is TBDpixel averaging, Ej~k I V'jk I /N pixels # of pixels averaged is TBD
Frequency Generator and Transmitteroperating frequency GHz =93 (see discussion)operating wavelength, X cm = 3.2transmitter bandwidth MHz = 15 @ 10-m o,
MHz = 5 @ 30-m p,pulse duration )AS < 57 jus (near-range constraint)waveform intra-pulse modulation --- chirp or PN code
prf kHz < 2.4 kHz (far-range constraint)interpulse modulation 0/," PN phase coding (for
ambiguous range abatement)
microwave transmit losses dB 0.8peak tx power (at antenna) W TBDmaximum duty factor % 13 (based on maximum pulse
length and maximum prf)
maximum average tx power W TBDAntenna
polarization - verticalelevation pattern - csc2(,); 0 = depression
(roughly 60 equiv. beamwidth) angleazimuth beamwidth, 0. ° >0.1, 10-mn p, one look
0 >0.030, 30-m p,, one look
length (controls az. pattern) m 1.83, 0. = I*In 0.92, 0 f= 20in 0.62, O, = 30D-4

Distribution -4- June 2, 1993
Table 1. SAR Characteristics Starting Point, continued ....
Antenna, continued ....height (controls elev. pattern) m 0.3 (about 1 foot)antenna gain (rough estimate) dB 35 (s = 1%; 50% efficiency)radome losses, two-way dB 1.5vertical rotational steering yesazimuthal steering TBD
Receiverfront-end noise figure (& losses) dB 2 (rough estimate)rf bandwidth MHz = 15 @ 10-mp.
MHz = 5 @ 30-m o ,IF frequency MHz TBDIF bandwidth MHz same as rf bandwidthsensitivity time control selectable curvesIF pulse compression SAW filter (suggested)gain @ 10-m p, 855 (29.3 dB)gain @ 30-m p, 285 (24.5 dB)
video bandwidth same as rf bandwidthA/D converter and presum filter
# A/D bits bits 8 (I) + 8 (Q), minimumA/D Sample Rate MHz 22.5 @ 10-m. P,
(1.5 oversampling) MHz 7.5 @ 30-m p,number of video samples ---- =6900 @ 10-m p,
(25-nmi swath) = 2300 @ 30-m p,Doppler spectral width Hz 54 (0.40 0. @ 125 m/s)
(assume nominal'& is I) Hz 136 (10 *. @ 125 m/s)Hz 273 (20 0, @ 125 m/s)Hz 409 (3 * @ 125 m/s)
presum integer (approximate) pulses 30, 12, 6, or 4(assuming spectral widths above & 2.4-kHz prf)
antenna oversampling factor ---- 1.5typical azimuth sample rate Hz 200 (assumptions as above)
Real-Time Image Formernumerical precision bits minimum of 16 (I) + 16 (Q)algorithm type TBDintegration gain --- 1650 (32.2 dB)windowing and other losses dB 1.2elevation antenna correction -. yesazimuth antenna correction -- yesground-plane projection - yes (might vary A/D rate)range-law correction -- yessensitivity-time-control correction - yespresummer correction - TBDauto-focus - no
D)-5

Distribution -5- June 2, 1993
Table 1. SAR Characteristics Starting Point, continued ....
Data Handlingrate to tape (8-bit images only) Mbits/s 1.1 @ p, = p. = 10 m
Mbits/s 0.12 @ p, = o, = 30 mnumber of tape units I-candidate tape-unit data-rate Mbits/s 1.6 (8-mm cartridge tape)limits (approximate) Mbits/s 4-8 (4-mm cartridge tape)
candidate tape-unit capacities Gbits 40record-time capacity hours 5-10 hours (8-bit images)phase histories - for engineering evaluationradar auxiliary data - yes
Image Displayhorizontal display size pixels TBDvertical display size pixels TBDdynamic range bits/pixel 8
Navigation Accuraciesnavigator type --- TBDattitude accuracy 0 TBDposition accuracies m TBDvelocity accuracies m/s TBDGPS aiding (Y/N) -... yes
Motion Compensationapproach -- real-timeupdate rate to SAR, Hz .... TBD
Mechanical Characteristicstotal power to system kW TBDphysical volume of system m3 TBD
Identification and Discussion of Key Issues
Squinted Operation vs. Antenna SteeringThe present AIREYE SLAR actually operates in squint mode; that is, the antenna doesn't pointalong a line that is perpendicular to the flight path. The antenna's pointing direction is, instead,900 away from the aircraft's centerline, averaged over the pass. Because the plane will crab tocounter the wind, the antenna actually squints away from 900 by an amount equal to the averagedrift angle of the aircraft. Short-term yaw variations are electromechanically compensated bymoving the anten-a as much as +30 to assure that the antenna always points at the same squintangle with respect to the average drift angle. An alternative would be to use navigatorinformation to drive a gimbal so as to always point the antenna at 900 with respect to the idealflight path. However, the current SLAR antenna, presumably because of its size (8' long), is not
D-6

Distribution -6- June 2, 1993
steered in this way. Operating at squint angles away from 900 complicates data processing;however it eliminates the problem of having to steer a large antenna over angles of tens ofdegrees. Like the SLAR antenna, the antenna for a wide-swath SAR need not be very large inthe elevation dimension (height); however, like the SLAR's antenna, it needs to be long inorder to form a narrow azimuth beam. The 8-foot SLAR antenna forms a I* beam. It may bepossible to develop a scheme for mechanically steering a physically long antenna (6-8'). Otherpossible methods of beam steering would be: 1) steering by changing the SAR's centerfrequency, and 2) steering using an antenna array and phase shifters. These issues need to belooked at further.
Number of Bits Per Image PixelEstimated data rates to tape are fairly modest (1.1 Mbits/s) under the assumption of 10-m p,,10-m p,, 125 m/s velocity, and 8-bit magnitude image data. Because of the 4-8 Mbit/s data-ratecapability of 4-mm tape, recording of 16-bit image data does not appear to present a burden atthese resolutions.
Slant-Range Resolution. o.The choice of slant-range resolution is at issue. In this study, I have looked at values of 10 mand 30 m. The ultimate choice for Pr will result from cost/benefit considerations. The analysisgiven here can contribute mainly to the cost data. Improved range resolution directly increasestransmitter power as well as image-former input data rates, computational complexity, andoutput data rates. Calculations given later in this memorandum will shed more light on thetransmitter-power issue. The benefit of finer resolution in oil-spill monitoring will be assessedin ongoing joint SNL/Coast-Guard data analyses.
Azimuth Resolution. p.
The choice of azimuth resolution is at issue. In this study, I have considered values of 10 m and30 m. The choice of p. will also depend on results of ongoing analyses. Improving (reducing) p,directly increases image-former input data rates, computational complexity, and output datarates. The relationship between p. and transmitter power is more complicated and depends onwhether the target being imaged is a point target or a distributed target (like the ocean). Forthe latter target type, reducing p. increases the aperture time, T., allowing more pulses to beintegrated; however, it also either reduces maximum allowable real antenna gain or the numberof looks achievable, or both. The net result is to increase transmitter power for this case. Thereare several aspects of SAR imaging of the ocean that cause me to believe that seeking extremelyfine azimuth resolution is not prudent. These aspects are the azimuth defocusing and smearingthat can occur due to radial motion of both long waves and capillary waves on the ocean'ssurface [3].
D-7

Distribution -7- June 2, 1993
Minimum o. of Noise RequiredI have borrowed data from Motorola's Report CG-D-109-76. These data, which describescattering coefficient, a, in dB, are given in Table 2, below. I have only included data for VVpolarization.
Table 2. Scattering Coefficient of Open Ocean
Depression Sea State Sea State Sea State Sea StateAngls Zero One TwO Three
1 -60 -50 -44 -393 -56 -45 -41 -3810 -49 -42 -36 -32
Initial calculations for transmitter power will require a 6-dB signal-to-noise ratio for a targetarea having aoo = -45 dB at 54-km range.
SystemLosseAssumed system losses are tabulated below in Table 3. Atmospheric loss has been estimated atthe 54-km range. The transmitter loss number assumes use of an isolator, 10' of rigid waveguidewith a short section of flexible waveguide, and a low-loss circulator. The noise figure numberassumes the use of protective, low-loss latching ferrite switches before the low-noise amplifier(LNA) and an LNA noise figure of about 1.5 dB (HEMT technology).
Table 3.
Factor Loss in dB Commentsatmosphere 1.5 oxygen absorption, two-waytransmitter 0.8radome 1.5 two-way lossnoise figure 2.0 includes rf lossessignal processor 1.2 A/D & windowing
D--8

Distribution -8- June 2, 1993
Choice of Operating FrequencyA number of factors affect the choice of operating frequency.
1. Contrast between oil-covered and open ocean varies with frequency. From literature Ihave reviewed in the course of the Coast Guard study, it appears that good contrastcan be obtained at X and Ku bands; however, data are lacking at Ka band, andcontrast is reduced at C and L bands. Contrast at Ku band may be a little better thanat X band.
2. Increasing the operating frequency increases transmitter power. At a given resolution,required power increases as X,-. In this case, the decrease in X2 is offset by an increasein G2 (azimuth beamwidth is narrowed); however, T. is reduced in proportion to X,therefore increasing Pt in (1,. High-power rf sources are less plentiful and moreexpensive at Ku band than at X band. Therefore, X band appears to be a good choice.
Peak Transmitter Power RequiredThe equation for required peak transmitter power, Pt, is
Pt = (S/N)(4,r)SR4kT0 FnL/[oG2;X2rfpT.p~prsec(4) j N.]. (1)
In (1), (S/N) is signal-to-noise ratio (a value of 4 W/W was used), R is slant range from theradar to the pixel of interest (R = 54 km was used here), k is Boltzmann's constant (1.38 E-21J/*K), T. is the temperature (288 *K), F. is the receiver's front-end noise figure (a value of 1.4W/W was used; this number includes all receiver losses), L is all combined losses (transmitter,signal-processor, atmosphere, etc.; a value of 3.2 W/W was used), a- is scattering coefficient(10-4.5 was used), G is peak antenna gain (103.5 was used; 1V f. was assumed), X is electricalwavelength (0.032 m) , r is uncompressed transmit-pulse length (57.10-6 s), fp is prf (2.4. 103Hz), T. is aperture integration time (0.7 s), 0 is depression angle (6°), and N. is the effectivenumber of temporal looks at the target cell (values of N. of {5.7, 13.4, and 19.7) were used for
p. values of { 10, 20, and 30) m; see related discussion below). Substitution of appropriatevalues into (1) results in a value of about 15 kW for 10-mi Pr and p., about 5 kW for 20-m pr andp., and about 3 kW for 30-m p, and p,. We believe that an X-band traveling-wave tube (TWT)amplifier having about 10-kW peak output power at about 10% duty ratio could be purchased intoday's market.
Elevation Antenna PatternThe elevation pattern called out in the starting-point specifications of Table 1 is proportional to
(Note: value for Boltzmann's constant above is in error, as are estimates for P,. Seememorandum of June 24, 1993 for revised estimates of Pt. RMA, 8-16-93)
D-9

Distribution -9- June 2, 1993
csc2o, where 0 is the depression angle. The choice of this pattern variation is driven by imaginggeometry and by estimated variation of echo power versus slant range, R, to the target pixel.The csc2o variation removes the R4 variation (as R is varied) in power received at the radar dueto a point scatterer at range R. In the case where a distributed target is imaged, the R4 term isnot the only quantity affecting P, that varies with R. Two other effects also change P,: 1) thevariations with R of aperture time, T., for fixed p., and 2) the variation of scattering coefficient,a-, versus depression angle, €, as R changes.
Variation of L. With R. Let us assume that p. is fixed and independent of range. Then therequired aperture time, T,, is given approximately by
T", = XR/(P.V.), (2)
where V. is aircraft velocity. Therefore, T, is directly proportional to range. Because (seeTable 1) far range is about 54 km and near range is about 8.5 km, required T. will vary fromabout 0.7 s at far range to about 0.1 s at near range. Therefore, from (1), the range-lawvariation obtained after combining R4 and T. terms is really only R3.
Variation of oo With 6. and Therefore. With R. Table 2 shows data extracted from theMotorola report. Other data reported in [4] indicates that at 10 = 450, 0* varies from about -35dB at 5 m/s wind velocity to -20 dB at 15 m/s wind velocity. And at 4 = 30%, o- varies fromabout -40 dB at 5 m/s wind velocity to -25 dB at 15 m/s wind velocity. The Motorola data implythat, in the region of small depression angles, oo is, to first order, proportional to 1/R at a givenwind speed. This would imply that, at least approximately, the effects of T. and 0o tend tocancel one another at small depression angles. The data of [4] show a stronger variation of o-with R in the region of moderate depression angles (300 and 45*). Taking into account theangular region from 60 to 450 of depression, an increase of the order of 10 to 20 dB should beexpected in o, as 46 increases. Since the variation in T. over this same angular range is only10*loglo(54/8.5) dB, or about 8 dB, the increase in oo at near range will dominate, and with acsc20 pattern, we can still anticipate significant brightening in the image at near range. Thispoints to the possible need for a sensItivity time control in the SAR to further equalize echopower versus R.
The other issue in relation to the elevation pattern in the following. Because we really onlyneed the csc 2,0 variation over a depression angle range of 60 to 450, what is the requirement forthe pattern at other angles? The answer is probably that we would like the peak gain of theantenna to occur at maximum range (54 kin) and then fall off very rapidly at smaller depressionangles. Also, at depression angles larger than 450 and in the rear quadrants of the antenna'spattern, we would ideally want the gain pattern to be zero.
D-.10

Distribution - 10- June 2, 1993
Azimuth Antenna PatternThe azimuth antenna pattern is driven by a variety of factors, and a number of tradeoffs arepossible. There is an advantage to making the azimuth beamwidth 13 as narrow as possible.This increases antenna gain, which reduces Pt. However, reducing (3 also reduces the numberof separate looks that can be obtained for each target pixel; therefore, for a system requiringmultilook, there exists a lower limit on 3. that cannot be violated. Finally, 3. determinesantenna length, L The relation is, approximately,
L = 180X/(..3t.), (3)
where L and X are in like units, and 0. is in degrees. For example, beamwidths of (0.40, 10, 20,and 30) translate to antenna lengths of (4 m, 1.8 m, 0.9 m, and 0.6 m), which lengths areapproximately equivalent to (15', 6', 3', 2'). As mentioned before, if antenna length were smallenough, it would be feasible to steer the antenna tens of degrees in azimuth, which wouldsimplify signal processing.
Multilook ProcessingAnother important issue is multilook processing. Noncoherent averaging of multiple images or"looks" of the same scene reduces the effects of speckle (amplitude variability in a region of theimage containing a more-or-less homogeneous assembly of distributed scatterers). Twodifferent multilook schemes could be applied to a broad-swath Coast Guard SAR: 1) temporalmultilook, and 2) pixel averaging.
Temporal Multilook. In temporal multilook, a number (N) of looks at a pixel arenoncoherently averaged. In this technique, each look is produced by a distinct syntheticaperture, so looks are statistically uncorrelated, both in terms of signal and noise. Normally,pixel amplitudes are averaged to produce the multilook image. This technique preserves thespatial resolutions (p, and p.) of the original single-look images. It also increases image signal-to-noise ratio by approximately 59log(N), where N is the number of looks.
Pixel Averaging. In this technique, an image patch is formed at a resolution that is finerthan that required in the multilooked output image. Then amplitudes of adjacent pixels areaveraged. This averaging reduces speckle and also improves image signal-to-noise ratio. Butbecause adjacent pixels are somewhat correlated (due to the choice of 1.5 oversampling in theazimuth dimension), the effective number of looks, N, is somewhat less than the number ofpixels averaged. The applicability of this technique in the Coast Guard SAR design is still beingconsidered.
D-11I

Distribution - 11 - June 2, 1993
Image-Formation Algorithm/Signal-Processing ApproachIn the design implied by Table 1, range compression is performed at an IF frequency by ananalog device such as a surface-acoustic-wave (SAW) filter. This is feasible for the CoastGuard SAR because of the relatively coarse range-resolution requirement (ten meters or so).At these range resolutions pulse bandwidth is narrow enough that A/D circuitry can directlydigitize the sampled echo, and no special bandwidth-reduction technique (such as stretchprocessing, which is used on the SNL Ku-band platform) is required.
A detailed algorithm approach has not been worked out; however, the general approach wouldbe to perform patch processing to form single-look images having resolution P.OP, Single-lookimages would then be combined noncoherently to form multilook images. This amounts totemporal multilook (discussed above). Because of the large variations in aperture time and inazimuth antenna footprint from near range to far range, the full range swath will need to bedivided into overlapped channels, and each channel will be processed somewhat differently.Figure 1 demonstrates the approach.
Suppose we define a particular range channel having near-range equal to R, as shown in Figure1. Then, the azimuth extent of the illuminated area on the ground at any time is approximately
0&*R. It is implied, but not shown, that the range channel consists of many range bins, perhapsas many as 1000 bins for the case of 10-m p,. The relative sizes of near-range and far-range forthe total swath of the SAR (25 nmi.) are shown approximately to scale; however, the antennabeamwidth shown is exaggerated in comparison to the actual beamwidth (1 0 nominal in thisstudy). Within the indicated range channel, a focused patch of pixels will be formed using thephase-history aperture shown at left. The length L4 of this aperture is roughly to scale incomparison with the illuminated area at the near-range side of the range channel. After a patchis formed, it is assumed that the image former throws away, or skips, an aperture of pulseshaving length L,. With these definitions, we can now write some quantitative expressionsrelating various quantities to one another. First, the spacing A between boundaries of patchescoming out of the image former can be expressed as
A-- L+ L
= XR/(2.p.) + 1, (4)
Further, the number of looks N than can be obtained is approximately
N = Pa/A, (5)
D-12

Distribution - 12- June 2, 1993
-20
I oCO
0
L._
r CO
GoC
D0-13
i . i i

Distribution - 13- June 2, 1993
where the constraint must be met that, for any given patch,
1P8 < O.RS-L, (6)
Combining (5) and (6) produces
N < (0R - L4)/A. (7)
In the special case that no phase history data are discarded between imaging apertures (I, = 0),A just equals L., and (4) and (7) can be combined to produce
N <, 0.R/A- 1
= 2p.80/X - 1. (8)
Interestingly, the constraint on N is not a function of R. Table 4 shows the results of evaluating(8) at different values of p. and 0,.
Table 4. Entries are maximum values of N vs. p. and (,.
M B. =0.4' a. = 1° 0. = 2_ B. 30
5 1 4 9 1510 3 9 20 3120 7 21 42 6430 12 31 64 97
Notice also from (5) that azimuth patch size, P., is just NA, or NL, under the assumptions ofTable 4, and because the number of azimuth pixels per patch is just Pak./p., where k. is theoversampling factor (1.5 assumed), the number of azimuth pixels, N., is thereforeapproximately NkL/p., and because
L, = XR/(2p.), (9)
D-14

Distribution -14- June 2, 1993
then
N, = Nk.XR/(2p.2). (10)
So, for example for the two cases of smallest choices of P. in Table 4, the following values of N.result at far-range (Table 5) and near-range (Table 6).
Table 5. Entries are the number (N..) of azimuth pixels per patch vs. $. and p. assumingmaximum number of looks and 54-km range.
_ m_ 8- = 0.4°a.=5 51 20710 38 11620 22 6830 17 44
Table 6. Entries are the number (N..) of azimuth pixL.'s per patch vs. 3. and p. assumingmaximum number of looks and 8.5-km range.
-., M 8- = 0.4° a- = P5 8 3210 6 1820 4 1130 3 7
It is important to realize that, due to azimuth roll-off of the antenna's radiation pattern, not alllooks at a target pixel will have equal signal strength. This effect makes the "effective" numberof looks, denoted here as N., somewhat smaller than the actual number of looks, N. Under theassumption that the antenna's two-way pattern has a cos20 shape (0 being the azimuth angle),the following approximate relationship holds:
N. = 2N/Tr. (11)
(Note: "one-way pattern" modified to "two-way pattern" in sentence above on August 16, 1993.)
D-15

Distribution - 15- June 2, 1993
Pulse-Compression IssuesThe conceptual design given in Table 1 recommends a pulse-compression techniqueimplemented using a SAW filter. There are a number of issues here.
Peak Transmitter Power. Use of a pulse-compression technique reduces the peaktransmitter power requirement by a factor of Tp,*B,, where Tp, is the length of theuncompressed transmitter-output pulse and Bt is the transmitter bandwidth. For thisconceptual design, this factor is about 855 at 10-m p, and about 285 at 30-m p,.
Use of a SAW Device for Compression. Using a surface-acoustic-wave (SAW) device forpulse compression appears to be attractive. In this approach, the SAR would be used first togenerate the transmitted modulation and, upon receive, to compress the echo pulse. Thistechnique eliminates computational requirements that would be present if the pulsecompression were done digitally.
Dynamic Range Considerations for a SAW Pulse Compressor. Use of a SAW device forpulse compression will increase dynamic range requirements at the A/D input. Therefore, itwill likely be necessary to use A/Ds having ten or more bits in each channel (I & Q).
Navigator AccuraciesTBD
Motion Compensation RequirementsTBD
Mechanical CharacteristicsTBD
Distribution: per attached sheet.
D- 16

APPENDIX EMOVING-TARGET-INDICATOR MODE
This appendix contains a copy of a memo on moving-target-indicator (MTI) mode for theCoast Guard SAR prepared by Robert M. Axilne, Jr., July 21, 1993. It is included here forcompleteness.
(The remainder of this page intentionally left blank.)
E-1

Sancla Natlo aberatiesdate: July 21, 1993 Albuquerque,. Now Mexico 87185
to: Distribution
g-JhK'&4from: Robert M. Axline, Jr., Radar Analysis Department, 2344
subject: MTI Mode for the Coast Guard SAR
References
[1] "Coast Guard SAR Design Calculations and Identification of Key Issues,"SNL memorandum from Robert M. Axline, Jr., 2344, to Distribution,June 2, 1993.
[2] "Additional Coast Guard SAR Design Calculations," SNL memorandumfrom Robert M. Axline, Jr., 2344, to Distribution, June 24, 1993.
[3] "Operator's and Unit Maintenance Manual, Radar Surveillance SetAN/APS-131," U.S. Coast Guard Document No. 68-PO3879U, March 15,1981.
[4] "Estimated Sensitivity of AIREYE SLAR for the Case of a DistributedTarget," SNL memorandum from Robert M. Axline, Jr., 2344, toDistribution, June 24, 1993.
[5] "RAR Mode for the Coast Guard SAR," SNL memorandum fromRobert M. Axline, Jr., 2344, to Distribution, July 17, 1993.
[6] "Motion Compensation for Coast Guard SAR," SNL memorandum fromJ. T. Cordaro, 2344, to Distribution, July 16, 1993.
The purpose of this memorandum is to 1) describe two potential moving-target-indicator (MTI) modes that could be implemented in the Coast Guard SARdesign [1,2], 2) analyze implementation and performance issues for the twoschemes, and 3) compare complexity and performance of these MTI modes tothose of RAR [5] and the AIREYE SLAR [3,4]. All calculations are performedunder the assumption of a 10-m SAR design.
E-2

Distribution -2- July 21, 1993
Summary of Results
" The Coast Guard mission requires radar imaging of sea-borne moving targets.Two potential MTI modes for the Coast Guard SAR are presented: a) "High-PassFilter with RAR" (HPF/RAR), and b) "Sequential Doppler-Frequency Translationwith SAR" (SFT/SAR). Either mode would meet the above-stated requirement.Both MTI modes would yield an image exhibiting reduced clutter (in comparisonto RAR or SLAR) and having 10-m range resolution. The HPF/RAR methodyields azimuth resolution similar to that of the AIREYE SLAR (140 m @ 8.5-kmrange and 920 m @ 54-km range). The SFT/SAR method yields 10-m azimuthresolution; however, positioning uncertainty of point targets is much coarser, beingequal to the antenna's real azimuth foot-print, RAO, at a slant range of R m. Theproposed SFT/SAR system could image movers over a velocity band of about +20kn.
" Implementation of the HPF/RAR MTI approach would require significantadditional hardware and software for implementation of the approach given here,regardless of whether concurrent or non-concurrent SAR/MTI functions weredesired. Implementation of the SFT/SAR MTI approach would require noadditional hardware; however, it would add some to processing and softwarecomplexity if thresholding of individual looks were performed in order to detectmovers, particularly if synthetic icons were generated and displayed. In theHPF/RAR approach, MTI data could be displayed to the operator separately fromor as an overlay (either synthetic icons or actual video) of the normal SAR or RARimage. In the SFT/SAR approach, one of the available looks will be a normalsingle-look image of the stationary clutter. Synthetic icons from the other lookscould be laid over a dim rendition of the single look of stationary clutter.Alternatively, all SFT/SAR clutter-reduced looks could be multilooked in one of anumber of ways and displayed, either separately from or as an overlay of thenormal SAR single-look of stationary clutter.
" At the maximum 54-km range and low-to-moderate sea states, minimum-detectable point-target radar cross section, o, for both MTI modes will likely becontrolled by thermal noise, as opposed to being controlled by clutter returnedfrom the distributed ocean target surface. Minimum detectable o for HPF/SARwould be about 0.8 m2 (-0.8 dBsm). For the 10-m SFT/SAR system, performancewould be much better, about 0.008 m2 (-21 dBsm) under the assumptions that 1)scattering coefficient (o-) of the ocean at 6° depression angle does not exceedabout -24 dB and 2) clutter reduction for both MTI modes is 20 dB or better. Inland-clutter environments, clutter return will likely dominate thermal noise, andminimum-detectable point-target or will be higher.
E-3

Distribution -3- July 21, 1993
Summary of Results, Continued,....
" Again, assuming 20 dB of clutter rejection, estimated HPF/RAR minimum-detectable point-target cross section against moving targets (for an assumed oceano- of -30 dB) is about 16 dB better than for a 10-rn RAR [5] and about 21 dB betterthan for the AIREYE SLAR [3,4]. Estimated SFT/SAR performance under thesame assumptions is about 37 dB better than for a 10-m RAR and about 42 dBbetter than for the AIREYE SLAR.
"* I recommend that the SFT/SAR scheme be implemented, in any newly-developedCoast Guard SAR, as an MTI mode for detection and display of moving targets. If,instead of a new SAR, the Coast Guard chooses to modify an existing SAR, theease and cost of implementing this MTI mode could very widely, depending on thatSAR's capabilities. In this latter case, the RAR mode described in [5] can beviewed as a fall-back position.
The Role of an MTI Mode
As explained in Reference [5], the AIREYE SLAR can image stationary or movingtargets on the ocean's surface. However, the conceptual SAR design described inReferences [1,2] can only image stationary or slowly-moving sea-borne targets. Therefore,an additional mode must be added to the Coast Guard design to allow imaging of morerapidly moving targets (>. 2 kn radial velocity). A RAR approach to imaging of movingtargets was presented in [5]. RAR shows movers but also shows all stationary and slow-moving clutter as well; therefore, it doesn't do a very good job of distinguishing movers forbackground clutter. As alluded to in [5], several other, perhaps more complex,approaches are possible for imaging moving of targets with SAR. Some of theseapproaches also provide clutter reduction while providing strong returns from movers.This memorandum describes two such approaches. Both techniques are single-antenna,moving-target-indicator (MTI) schemes. Brief descriptions of the two schemes follow.
Two Possible MTI Approaches
High-Pass Filter with RAR (HPF/RAR)This scheme adds a digital, high-pass, phase-history filter (running at the prf rate) justafter the A/D converters. The high-pass filter output is then magnitude-detected. Fromthis point on. processing is identical to that of the RAR mode [5]. The high-pass filterprovides significant rejection of slow-moving and stationary clutter (e.g., land, most oceanwaves, and stationary or slowly-moving point targets). Like the RAR, this scheme wouldprovide fine resolution in range (say 10 m), but the azimuth resolution would bedetermined by the physical beamwidth of the antenna; therefore, azimuth resolution
E-4

Distribution -4- July 21, 1993
would be coarse (about 140 m @ 8.5 kin, as in RAR mode). The principal advantage ofthis approach over RAR is its clutter-rejection feature.
Sequential Doppler-Frequency Translation with SAR (SFT/SAR)Motion compensation for SAR processing will require that the radar employ a low-frequency motion-compensation oscillator at IF to keep the Doppler spectrum ofstationary-target echoes within the presummer passband (about 130 Hz) [6]. This sameoscillator could be used to shift the Doppler spectrum of the echo to move echo fromstationary and slow-moving targets out of the presummer passband and move echo fromfaster-moving targets into the passband for a particular processed SAR patch. This wouldallow a number of sequential "looks" to be gotten of the target area, each look at adifferent oscillator-frequency setting. In this way, the SAR could sweep a fairly wideDoppler band (> 1 kHz) in order to image moving targets. Processing required to formSAR patches in this MTI mode would be identical to processing in normal SAR mode;only the motion-compensation oscillator setting would be changed. Ignoring accelerationeffects, moving targets would be reasonably well focused in the patch in which theyappeared. Again, range resolution of this system would be the same as for the SAR (say10 m). Apparent azimuth resolution of the output patches would be equal to the SARresolution (say 10 m). However, the true position of the moving target would only beknown to within an uncertainty interval equal to the RAR azimuth resolution. This isbecause of an unresolvable ambiguity between the moving target's exact position in thescene and its true radial velocity.
Analysis of Complexity and Performance Issues
Processing ComplexityHEFLAR. This scheme adds quite a bit of hardware complexity: banks of high-
speed, high-pass filters and digital magnitude detectors (one for each range bin) must beadded. Additional software complexity required to obtain the MTI image is about equalto that of RAR mode (whatever is required to perform the needed noncoherentintegration). If the HPF/RAR MTI image is displayed just like the RAR image, display-function complexity would be the same as for RAR mode. If the MTI image werethresholded to create icons for display as an overlay to the normal SAR or RAR image,some additional complexity would be introduced. As in the case of RAR mode, the imagesize (if thresholding is not used) need only be about 10% of the size of a normalmultilooked SAR image. Use of thresholding would make the output image size muchsmaller.
SEIL5AR. This scheme adds no hardware complexity to the either the radar analogsections or to the image-formation hardware. Single-look image patches are formed inthe same way, regardless of whether the radar is operating in SAR mode or SFT/SARmode. Some additional computational burden arises if each of the "looks" is to beseparately thresholded in order to detect movers on the basis of their strength relative tothe total power in the patch. An advantage of this approach, however, is that the amountof image data remaining after the thresholding should be very small; only coordinates of
E-5

Distribution -5- July 21, 1993
detections need be stored. Icons from separate looks could be assigned different colors.This would give the operator/interpreter an indication of how fast the target is movingand whether it is approaching or receding. This latter feature is an advantage that theHPF/RAR mode does not exhibit.
If thresholding is not used, another technique must be used to essentially "multilook" theSFT/SAR patches together for display. Each SFT/SAR image patch will have equalresolution in range and azimuth (say 10 m). However, the true position of a moving targetin the SFT/SAR image can be determined only to within the azimuth resolution affordedby the physical azimuth beamwidth of the antenna. Therefore, in multilooking theSFT/SAR patches, decimation in the azimuth dimension should be used (e.g., from 10-mto 100-m pixel spacing) to reduce the size of the image. Two possible multilooktechniques are:
" Registration and summing of magnitudes (identical to the technique used fornormal multilook SAR). This has the disadvantage of reducing signal-to-clutterand signal-to-noise ratios.
" In each patch, choose the largest pixel value in a 10 x 10 submatrix and decimate toa patch 1/100 as large by retaining only this largest value. Combine looks byretaining only the largest value (over all looks) at each common, registered pixellocation. This technique retains the largest returns from targets of interest, fromnoise, and from clutter. It would probably be preferable to summing magnitudes.
I recommend that thresholding be used. This should maintain signal-to-clutterperformance and reduce the amount of MTI target data to be displayed.
Performance of MTI Modes Against Point Targets in Thermal Noise (No Clute)HPFIRAR. Assuming that processed noise bandwidth for RAR and HPF modes are
nearly the same, minimum detectable target radar cross section, an,, in thermal noise(clutter is neglected in this computation) can be estimated for the HPF/RAR mode byusing the minimum-detectable scattering-coefficient-estimate, oo,,, for the 10-m RAR,which, from [5], is about 0.00009 m2/m2. The relevant equation for HPF/RAR is
O'ndn= O~munPrRAO/cosO, (1)
where p, is taken to be 10 m, R is 54 E3 m, AO is 0.17 rad, and 0 is 60. The result ofevaluating (1) is about 0.8 m2, or about -0.8 dBsm for HPF/RAR mode.
E-6
V'

Distribution -6- July 21, 1993
SFISAR. In this mode, minimum detectable target radar cross section againstthermal noise (no clutter) can be estimated using the minimum-detectable scattering-coefficient-estimate for SAR, which, (by design) from [1], is -45 dB [2]. The governingequation for SFT/SAR is
O - oopPJ NO/cos. (2)
Here, p, = p. = 10 m, and No is the effective number of looks for a 10-m system (taken tobe 5.73 from [1]). The effect of multiplying by J N, derates the minimum detectable crosssection of SAR by accounting for the fact that in SFT/SAR mode, only one look isobtained of each moving point-like target. The result of evaluating (2) is about 0.0076 m2 ,or about -21 dBsm. This is a very small target!
A few words about the number of available looks are in order. In Table 4, page 13 of [1],I showed that the number of available looks for a system having 10-m p. and 1V azimuthbeamwidth is 9 looks, independent of range. For such a system, assuming a 136-Hzpresummer bandwidth [1] and assuming that the Doppler-frequency oscillator is tuned to9 discrete settings spaced 136 Hz apart, the SFT/SAR mode could image movers withradial velocities within the range of about + 20 kn. An SFT/SAR operating at coarserazimuth resolution (say 20 m) could obtain more looks and image a wider velocity band ofmovers (± 40 kn).
Performance of MTI Modes Against Point Targets in Clutter (No Thermal NoiseQ)For both MT1 modes, their performance against point targets in clutter (the ocean'ssurface) will depend upon their ability to reject the clutter in favor of faster-movingtargets. It is beyond the scope of this memorandum to quantitatively estimate rejectionratios for the two MT! modes described. For the sake of discussion, however, let's assumethat the same amount of rejection can be achieved in both HPF/RAR and SFT/SARmodes. In fact, in SFT/SAR mode, rejection will improve as the Doppler frequency offsetis increased from zero; this is because of increasing attenuation of stationary and slow-moving clutter due to the presummer's transfer function.
HPF/RAR Performance Against Point Targets in Ocean Clutter. For HPF/RARimaging of a point target against an ocean background, the minimum detectable targetcross section, am• (in units of m2) can be calculated approximately as
ami, = A,(S/C)ooRAkp,/cos46, (3)
E-7

Distribution -7- July 21, 1993
where A, is the clutter power rejection factor (less than one; typically 10log10(A) <. -20dB or better), (S/C) is the signal-to-clutter ratio required for point-target visibility(assumed here to equal 4), oe is the ocean's scattering coefficient, R is target range (takenhere to be 54 km), AO is the azimuth antenna beamwidth (0.0 17 rad or 1 *), p, is the rangeresolution (10 m), and , is depression angle (taken here to be 60). Evaluation of (3) atvarious assumed values of o- and p, and at an assumed value of A, = 0.01 yields Table 1.These numbers ignore thermal noise, taking into account only the effects of residualstationary and slowly-moving clutter.
Table 1. Clutter-Limited Minimum Detectable HPF/RAR Radar CrossSection (in m2) @ 54 km
Range Ocean Ocean Ocean Ocean OceanResolution 00 V0 00 00 00
.. • -30 dB -35 dB -40 dB. -45 dB -50 dB
10 0.37 0.12 0.04 0.01 0.004
20 0.74 0.23 0.07 0.02 0.007
30 1.11 0.35 0.11 0.043 0.01
It is interesting to note that in the case of HPF/RAR, 20 dB of clutter rejection is enoughto cause thermal noise to control the actual minimum detectable cross section for mostexamples calculated. That is, the 0.8-M2 minimum detectable cross section againstthermal noise (from (1)) is larger than every entry in Table 1 except the lower-left entrycorresponding to p, = 30 m and o- = -30 dB. Of course, at high sea states, oo may exceed-30 dB at 60 depression, and clutter would limit system sensitivity.
SFT!SAR Performance Against Point Targets in Ocean Clutter. For SFT/SARimaging of a point target against an ocean background, the minimum detectable targetcross section umi (in units of M2) can be calculated approximately as
- A,(S/C)oopp,/cos9S, (4)
where k%, (S/C), and , as defined above for the case of HPF/RAR, and p, and p. arerange and azimuth resolution, respectively. Evaluation of (4) at various assumed values ofp., po, and &0 and at an assumed value of Ac = 0.01 yields Table 2. These numbers ignorethermal noise, taking into account only the effects of residual stationary and slowly-moving clutter.
E-8

Distribution -8- July 21, 1993
Table 2. Clutter-Limited Minimum Detectable SFT/RAR Radar CrossSection (in M2) @ 54 km
Ocean Ocean OceanResolutions 00 00 IVIn =-A- ý30 dB -35rdB 40dB
10 0.004 0.001 0.0004
20 0.016 0.005 0.0016
30 0.036 0.011 0.0036
Note that for most cases shown in Table 2, minimum detectable cross section is controlledby thermal noise (0.0076 m2, from evaluation of (2) above).
Summary of SLAR, RAR, HPF/RAR and SFT/SLARComplexity and Performance Comparisons
Table 3 summarizes complexity and performance comparisons for the four modes withregard to moving-target imaging.
Table 3. Comparison of SLAR, RAR, HPF/RAR, and SFT/SAR1
relative addedshows shows clutter sensitivity processingslow moving cell in dB, point complexity
Mode clutter clutter area.m trge n wrt SAR degnSLAR yes yes 22,600 0 N/A
RAR yes yes 9,180 5 moderate(HW & SW)
HPF/RAR no yes 9,180 21 high(HW & SW)
SFT/SAR 1 look yes 100 42 moderate-high(SW only)
'Assumes -30 dB ocean a* at 6° depression angle.
E-9

Distribution -9- July 21, 1993
Distribution:
Gary L HoverUSCG R&D Center, Environmental Safety Branch1082 Shennecossett RoadGroton, CT 06340-6096
2344 D. L Bickel2344 J. T. Cordaro2344 W. H. Hensley2344 J. J. Mason2344 R. C. Ormesher2345 B. C. Walker2345 B. L Burns2344 A. W. Doerry9134 J. D. Bradley9134 G. A. Mastin2344 R. M. Axline, Jr.
E-10

APPENDIX FREAL APERTURE RADAR MODE
This appendix contains a copy of a memo on a real aperture radar mode for the Coast GuardSAR prepared by Robert M. Axlne, Jr., July 17, 1993. It is included here for completeness.
(The remainder of this page intentionally left blank.)
F-i

Swda Nati Labraoedate: July 17, 1993 Albuquerque. New Mexico 87185
to: Distribution
from: Robert M. Axline, Jr., Radar Analysis Department, 2344
subject: RAR Mode for the Coast Guard SAR
References
[1] "Coast Guard SAR Design Calculations and Identification of Key Issues,"SNL memorandum from Robert M. Axline, Jr., 2344, to Distribution,June 2, 1993.
[2] "Additional Coast Guard SAR Design Calculations," SNL memorandumfrom Robert M. Axline, Jr., 2344, to Distribution, June 24, 1993.
[3] "Operator's and Unit Maintenance Manual, Radar Surveillance SetAN/APS-131," U.S. Coast Guard Document No. 68-PO3879U, March 15,1981.
[4] "Estimated Sensitivity of AIREYE SLAR for the Case of a DistributedTarget," SNL memorandum from Robert M. Axline, Jr., 2344, toDistribution, June 24, 1993.
The purpose of this memorandum is to 1) discuss the need for a real-aperture-radar (RAR) mode in the design of a future Coast Guard SAR [1,2], 2) describehow the RAR mode would be implemented, 3) estimate the sensitivity of theradar in RAR mode against distributed- and point-target types, and 4) compareRAR-mode sensitivity to the sensitivity of the AIREYE side-looking airborneradar (SLAR) [3,4].
F-2

Distribution -2- July 17, 1993
Summary of Results
e The Coast Guard mission requires radar detection of sea-borne moving targets. ARAR mode in a future Coast Guard SAR would meet this requirement. Such amode would yield an image having 10-m range resolution and azimuth resolutionsimilar to that of the AIREYE SLAR (140 m @ 8.5-km range and 920 m @ 54-kmrange).
* Implementation of simultaneous SAR and RAR would require significantadditional hardware and software for implementation in the approach given here.Exclusive, or non-concurrent SAR and RAR modes (one mode is selected for aparticular pass) would require little additional hardware; however, some additionalflexibility in the A/Ds, presummer, and image-formation software would berequired. In either case, the RAR should be displayed to the operator as aseparate, and perhaps optional, image.
e Sensitivity of a 10-m (p,) RAR to an ocean target is -40.5 dB (ac,,,) at 54 kmrange.
* Sensitivity of the RAR would be similar to that of the AIREYE SLAR. Sensitivityof the 30-m (p,) AIREYE SLAR @ 54 km is about -42 dB, or a little better thanthe 10-m RAR. A 30-m RAR would, however, have about -50 dB sensitivity, quitea bit better than the SLAR. With an assumed ocean cross section of -40 dB, the10-m RAR can detect a point target having cross section of about 3.7 m2 with asignal-to-clutter ratio of 6 dB. At this same range and ocean cross section, the 30-m AIREYE system requires a point target cross section of about 11.1 m2 ;therefore, the 10-m RAR would be about 5 dB more sensitive for this function.
The Need for a RAR Mode
The AIREYE SLAR can image stationary or moving targets on the ocean's surface. Theconceptual SAR design described in [1,2] can image stationary and slowly-moving sea-borne targets; however, targets having radial velocity greater than about 2 kn would lie (inthe Doppler frequency domain) outside the presummer passband; therefore, they wouldbe severely attenuated and likely would not be discernable in the image. Speeds of 10-15kn for large boats are typical, and speeds of smaller craft could be 25-40 kn. Several fairlycomplex approaches are possible for imaging moving targets with SAR, including a) use ofmultiple antennas, receiver, and processing channels, b) use of a single antenna andreceiver with multiple Doppler processing channels, c) use of a single antenna andreceiver with short-time spectral analysis with averaging, and d) use of a single antennaand receiver with a high-pass filter (for stationary-target removal) and post-detectionintegration. Although these more complex techniques would provide enhanced systemsensitivity, a simpler approach is to implement a RAR mode in the Coast Guard SAR toallow moving targets to appear on the radar display.
F-3
V'

Distribution -3- July 17, 1993
Implementation of the RAR Mode
Req~uired ProcessingReferences [1,2] describe a conceptual design for a Coast Guard SAR for broad-swath (25nmi) oil-spill monitoring. A RAR mode could be implemented in this design in thefollowing way.
"* Basic system timing, pulse length, prf, and other key radar parameters areunchanged.
"• In RAR mode, coherent presumming is not used. Instead, a magnitude detectionof the echo pulse is performed in the IF band (after pulse compression). Thedetected video is then A/D sampled.
"* A number (about 500) of adjacent echo magnitudes in each range cell are addedtogether to achieve noncoherent integration. This was exactly the approach usedin the AIREYE SLAR fielded at Santa Barbara in November '92.
Option: Simultaneous SAR and RAR --or- Either SAR or RARThe system could be designed to allow both SAR and RAR functions to operateconcurrently. In this case, both SAR and RAR information would be available to theoperator on any imaging pass. Alternatively, the modes could be exclusive of one another.In this latter case, a pass would either be a SAR pass of a RAR pass.
True simultaneous SAR and RAR requires a third A/D converter and an integratorsimilar in complexity to the presummer filter. Non-simultaneous implementation of themodes could be achieved using a switchable A/D and a single, more flexible presummercapable of handling either (I,Q) coherent presumming or magnitude non-coherentintegration.
If the modes were exclusive of one another, the same image-formation processor could beused to form both SAR and RAR images. In RAR mode, the presummer output could befed to the image former at the same rate as the (I,Q) samples are fed to it in SAR mode;then the image formation processor could complete the remainder of the required non-coherent integration, a fairly simple task. The RAR image output data rate need only beabout 10% of that of the SAR image due to the RAR's much coarser azimuth resolution(about 144-m p. at the 8.5-km minimum range)
Option: Actual or Synthetic RAR DisplayIn the event that simultaneous SAR/RAR processing were performed, the zrAR datacould be displayed in either of two ways.
* A separate RAR image could be made available for display. SAR and RARimages could be displayed simultaneously or alternately, at the option of theoperator.
F-4
7,

Distribution -4- July 17, 1993
The RAR image could be threshold-detected and coordinates of bright scattererscould be stored. At the option of the operator, icons (synthetic video) at thesecoordinates could be overlaid upon the SAR image display. This approach isproblematic when the imaged swath contains bright return from land; therefore,this approach is not recommended for the RAR display.
RAR Mode Sensitivity
Distributed. or Extended Scattering TargetFor an extended scattering target, such as the ocean's surface, the radar competes withthermal noise. In this case, minimum detectable scattering coefficient for RAR mode canbe computed approximately from radar and geometrical parameters using equation (1).
omi, = (S/N),,(4I-R)3kToBF L cosO/[PtNcG,2X2ApJj Ni]. (1)
In (1), oo, has units of m2/m 2. This quantity is more commonly expressed in decibels;this representation is just 1Ologlo(acj.). The assumption that minimum scatteringcoefficient is improved as I/J Ni is a only an approximation. Parameters of (1) are definedin Table 1, below.
Table 1. Radar and geometrical parameters in (1).
symbol Uniti Value Definition(S/N),Wn W/W 4 minimum detectable signal-to-noise ratioR m 5.4 E3 range to target pixel [1]k J/K 1.38 E-23 Boltzmann's constant [2]TO OK 288 ambient temperature [1]B Hz 15 E6 rf receiver bandwidth [1] (10-rn p,)F, W/W 1.58 receiver front-end noise figure [2]L W/W 3.2 transmitter, signal-processor, atmospheric, and
radome losses [1]S°6 depression angle [1]
Pt W 173 peak transmitter power [2] for 10-m prNc- 855 range pulse compression factor [1]G. W/W 2.51 E3 average antenna gain over the beam; taken to 34
dBSm 0.032 electrical wavelength [1]A0 rad 0.017 antenna azimuth beamwidth [1]Pr m 10 range resolution [1]Ni -- 576 number of pulses averaged noncoherently over
30-m interval @ 125 m/s and 2.4-kHz prf(probably more could be averaged)
F-5

Distribution -5- July 17, 1993
The result of evaluating (1) using values from Table I is that oe. for RAR mode is about0.00009 ma/m 2, or -40.5 dB. Note that this system has 10-m range resolution, whereas theAIREYE has 30-m range resolution. Reevaluation of [1] for a 30-m resolution systemrequires use of p, - 30 m and B = 5 MHz. The result is that ow,, is about 0.00001ma/m2, or - 50 dB.
RAR Performance Against Point Targets in ClutterWhen the RAR images point targets, point-target echoes must compete with resolution-cell clutter (from the distributed ocean or land target area) in order to be visible in theimage. For a RAR (or a SLAR) imaging a point target against an ocean background, theminimum detectable target cross section, uvie (in units of m2) can be calculatedapproximately as
Gr,, = (S/C)oQRA0Pr/CoS0, (2)
where (S/C) is the signal-to-clutter ratio required for point-target visibility (assumed hereto equal 4), a- is the ocean cross section, R is target range (taken here to be 54 kin), A6 isthe azimuth antenna beamwidth, 0.017 rad (10), P, is the range resolution, and 0 isdepression angle (taken here to be 6°). Evaluation of (2) at various assumed values of ooand p, yields Table 2.
Table 2. Minimum RAR Detectable Radar Cross Section (in mi) @ 54 kIn
Range Ocean Ocean Ocean Ocean OceanResolution 00o 0o 0o 0o
,D. -30dB -35dB -40dB -45dB -50dB
10 36.9 11.7 3.7 1.2 0.4
20 73.8 23.4 7.4 2.3 0.7
30 110.8 35.0 11.1 3.5 1.1
F-6
F,

Distribution -6- July 17, 1993
Comparison of RAR and AIREYE SLAR Sensitivities
Results above show that the RAR and SLAR have similar sensitivities. A 30-m RAR hasabout -50 dB sensitivity against distributed targets @ 54 kmi, as opposed to about -42 dBfor the AIREYE SLAR [4]. However, a 10-m RAR has about -40.5 dB sensitivity, similarto the SLAR. Table 2 shows that, in terms of detection of point targets in clutter, the 10-m system generally has a factor-of-three (5 dB) advantage over a 30-m system because ofthe former's smaller clutter-cell area. The conclusion can be drawn that the 10-mr RARsystem would show improved performance for this function.
Errata for Reference [4]
I made a typographical error in Table 1, page 2 of [4]. The receiver bandwidth, B shouldbe 6.E6 Hz, not 6.E3 Hz. Spreadsheet calculations were made with the correct value ofbandwidth, so the error does not affect estimates of AIREYE SLAR sensitivity given in[4].
Distribution:
Gary L HoverUSCG R&D Center, Environmental Safety Branch1082 Shennecossett RoadGroton, CT 06340-6096
2344 D. L Bickel2344 J. T. Cordaro2344 W. H. Hensley2344 J.J. Mason2344 R. C. Ormesher2345 B. C. Walker2345 B. L Burns2344 A. W. Doerry9134 J. D. Bradley9134 G. A. Mastin2344 R. M. Axline, Jr.
F-7

(This page intentionally left blank.)
F-8

APPENDIX GADDITIONAL SAR DESIGN CALCULATIONS
This appendix contains a copy of a memo on additional Coast Guard SAR designcalculations prepared by Robert M. Axline, Jr., June 24, 1993. It is included here forcompleteness.
(The remainder of this page intentionally left blank.)
0-I

S-andh Nato 8abara-onesdate: June 24, 1993 Aibuquorque. Now Mexico 87185
to: Distribution
from: Robert M. Axline, Jr., Radar Analysis Department, 2344
subject: Additional Coast Guard SAR Design Calculations
References
[1] "Coast Guard SAR Design Calculations and Identification of Key Issues,"SNL memorandum from Robert M. Axline, Jr., 2344, to Distribution,June 2, 1993.
[2] "Estimated Sensitivity of AIREYE SLAR for the Case of a DistributedTarget," SNL memorandum from Robert M. Axline, Jr., 2344, toDistribution, June 24, 1993.
[3] "Operator's and Unit Maintenance Manual, Radar Surveillance SetAN/APS-131," U.S. Coast Guard Document No. 68-PO3879U, March 15,1981.
The purpose of this memorandum is to 1) correct an error in a calculation givenin [1], 2) to discuss possible SAR system design tradeoffs, and 3) to compare thepredicted performance characteristics of the X-band SAR design presented in[1] to the predicted [2] and known [3] characteristics of the AIREYE SLAR.
New Estimates of SAR Required Transmitter Power
On page 8 of [1], I estimated required transmitter power for a conceptual CoastGuard SAR. I used an incorrect value of Boltzmann's constant, k, in thatcalculation. The correct value is 138 E-23. The value of noise figure used was1.4 W/W. In new calculations, I have increased that value slightly to 138 W/W.Other parameter values and assumptions defined in [1] are unchanged. Therevised estimates of required transmitter power are much lower than those givenin [1]. These estimates are for a minimum detectable scattering coefficient,oomi, of -45 dB at a slant range of 54 kmn. The resulting values of P, versus SARresolutions are given in Table 1.
G-2

Distribution -2- June 24, 1993
Table 1. Required transmitter power for conceptual SAR.
Range Resolution Azimuth Resolution Required Transmitteror In a-I Power, W
10 10 17320 20 5730 30 31
Discussion in [1] pointed out that a TWT having as much as 10 KW could be procured atX band. More recent discussions with Rick Knudson, Department 2345, have revealedthat 600-W units would be quite readily available, that 600-W TWTs and 100-W TWTswould not differ greatly in price, but that the power supply for the 600-W TWT would besomewhat more expensive than the power supply for the 100-W unit.
Possible Tradeoffs for SAR Design
There are a number of directions one could go from the baseline SAR design defined in[1] and refined above.
Configuration A: Low Rower. nominal sensitivity, large antenna One could settle for a-45 dB system (at 54 km range) and select the trnsrmitter power from Table 1corresponding to the desired resolution. The 2-m long antenna (I3* = 10) may not besteerable.
Configuration B: High power, improved sensitivity, large antenna One could increasepeak transmitter power to, say, the order of 1 kW. If the antenna were not changed,system sensitivity at 54 km would be improved accordingly. The other advantage of thissystem would be that operating range of the system could be extended somewhat. Theincreased range would require longer integration time (T.), and the prf, fp, would have tobe reduced accordingly. The resulting increased range achievable would vary about as the1/4 power of excess transmitter power. So, for example, for the 20-m system, if we used a600-W transmitter but only needed 57 W at 54 km for -45 dB system sensitivity, systemsensitivity at 54 km would improve to about -55.5 dB, and we could achieve a -45 dBsensitivity at a maximum range of about
(600/57)1/4 * 54 km = 97 km. (1)
However, the integration time T, would now be about 1.23 s instead of the 0.7 s requiredat the 54-km range. Again, this system would use the 2-m long antenna.
G-3
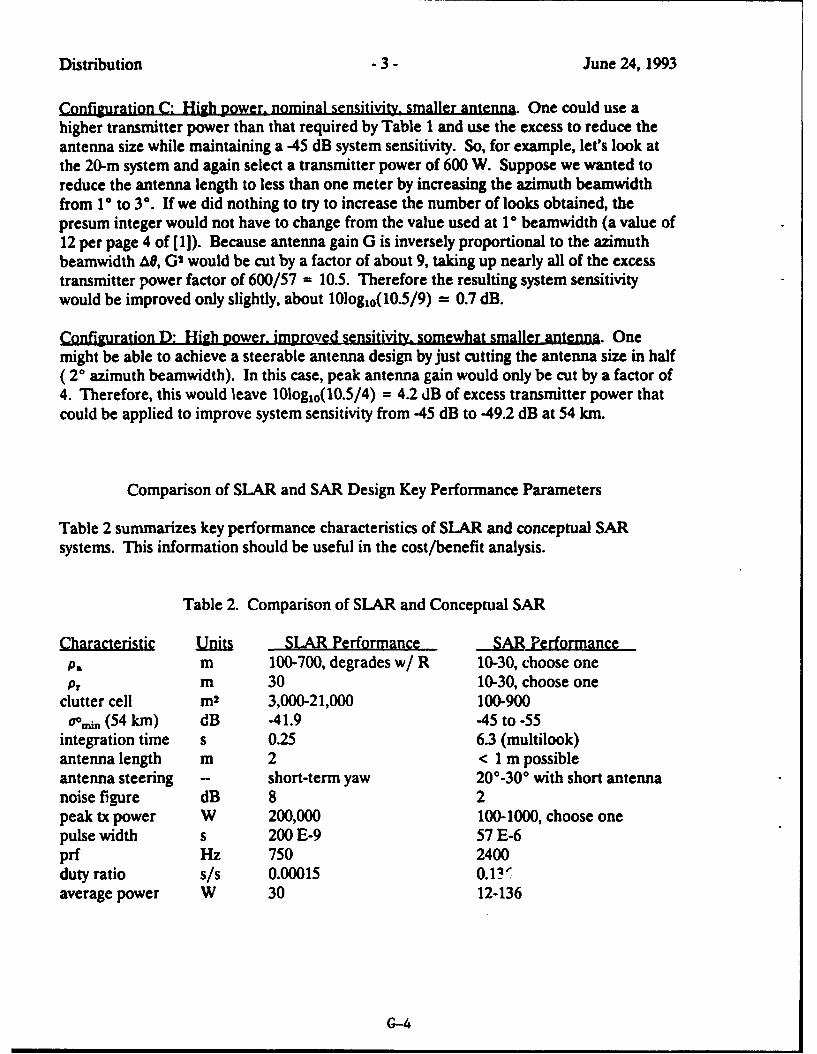
Distribution -3- June 24, 1993
Configuration C: High power. nominal sensitivity, smaller antenna. One could use ahigher transmitter power than that required by Table 1 and use the excess to reduce theantenna size while maintaining a -45 dB system sensitivity. So, for example, let's look atthe 20-m system and again select a transmitter power of 600 W. Suppose we wanted toreduce the antenna length to less than one meter by increasing the azimuth beamwidthfrom 1* to 3 *. If we did nothing to try to increase the number of looks obtained, thepresum integer would not have to change from the value used at 10 beamwidth (a value of12 per page 4 of [1]). Because antenna gain G is inversely proportional to the azimuthbeamwidth AO, G2 would be cut by a factor of about 9, taking up nearly all of the excesstransmitter power factor of 600/57 = 10.5. Therefore the resulting system sensitivitywould be improved only slightly, about 101ogl 0(10.5/9) = 0.7 dB.
Configuration D: High power, improved sensitivity, somewhat smaller antenna. Onemight be able to achieve a steerable antenna design by just cutting the antenna size in half( 20 azimuth beamwidth). In this case, peak antenna gain would only be cut by a factor of4. Therefore, this would leave 101oglo(10.5/4) = 4.2 dB of excess transmitter power thatcould be applied to improve system sensitivity from -45 dB to -49.2 dB at 54 km.
Comparison of SLAR and SAR Design Key Performance Parameters
Table 2 summarizes key performance characteristics of SLAR and conceptual SARsystems. This information should be useful in the cost/benefit analysis.
Table 2. Comparison of SLAR and Conceptual SAR
Characteristic Units SLAR Performance SAR Performancep& m 100-700, degrades w/ R 10-30, choose onePr m 30 10-30, choose one
clutter cell m2 3,000-21,000 100-900Oomin (54 kin) dB -41.9 -45 to -55
integration time s 0.25 6.3 (multilook)antenna length m 2 < I m possibleantenna steering - short-term yaw 20*-30° with short antennanoise figure dB 8 2peak tx power W 200,000 100-1000, choose onepulse width s 200 E-9 57 E-6prf Hz 750 2400duty ratio s/s 0.00015 0.13Uaverage power W 30 12-136
G-4

APPENDIX HINTERIM RESPONSE
This appendix contains a copy of a memo re,.ponding to comments by Gary Hover, USCG R& D Center, prepared by Robert M. Axline, Jr., May 14, 1993. It is included here forcompleteness.
(The remainder of this page intentionally left blank.)
H-I

Sand National Labratiesdate: May 14, 1993 Albuquerque. New Mexico 87185
to: Distribution
"fromý Robert M. Axline, Jr., Manager, Radar Analysis Department, 2344
subject Interim Response to Gary Hover's Comments on My Memorandum of March 15, 1993and Transmittal of SAR Capabilities Survey Information
References
[1] "High-Level Requirements for Coast Guard SAR Capability," memorandumfrom R. M. Axline, Jr., 2344, to Distribution, March 15, 1993.
[2] "CG R&D Center Comments on Bob Axline's Memorandum of 15 March '93,"memorandum from Gary Hover, Coast Guard R&D Center, to Bob Axline,April Z 1993.
[3] "Information Survey Relating to Synthetic Aperture Radar Capabilities," SNLCG-Project Document, April 28, 1993.
[4] "Conceptual Requirements for a Synthetic Aperture Radar System for Oil-SpillResponse," SNL CG-Project Document, April 28, 1993.
[5] "A Comparison of Ku-Band Doppler Measurements at 200 Incidence WithPredictions from a Time-Dependent Scattering Model," D. R. Thompson, JohnsHopkins University, APL, et al, preprint of journal article that had beensubmitted for publication in JGR-Oceans circa 1991.
[6] "Doppler Spectra from the Ocean Surface With a Time-Dependent CompositeModel," D. R. Thompson, JHU/APL, in Radar Scattering from ModulatedWind Waves, G. J. Komen and W. A. Oost, eds., pp. 27-40, Kluw-:r AcademicPublishers, Dordrecht, Boston, and London (1989).
[7] "Theory of Synthetic Aperture Radar Ocean Imaging: A MARSEN View," K.Hasselmann, et al, Journal of Geophysical Research, vol. 90, no. C3, pp. 4659-4686, May 20, 1985.
H1-2

Distribution -2- May 14, 1993
Introduction
The purpose of this memorandum is two-fold: 1) to provide interim responses to GaryHover's recent comments [2] relating to Reference [1]; and 2) to provide the R&D centerwith a copy of survey documentation we have recently sent to vendors of existing SARs.
Responses to Gary Hover's Comments [2]
Paragraph headings in this section are consistent with Gary's headings in Reference [2].
Scope of Systems StudyI have recently contacted LCDR Bill Paradise to discuss SeaView and obtain a NorthropPOC. The POC Bill gave me is Bob Whiteman in Hawthorne, CA, phone: (213) 600-1276.I have since talked by phone with Doug Burger, who works with Mr. Whiteman. Dougdescribed what Northrop is doing for the Coast Guard. I will send Doug a copy ofReference [4] and talk with him further after he has had a chance to study that information.
Aircraft PlatformThe velocity range of 90 to 124 m/s has been incorporated into our conceptualrequirements document [4].
Primary SAR UsageYour desire that we consider a fine-resolution spotlight capability is reflected in [4]. I havesome comments and questions regarding this desired capability.
I
" One's ability to positively identify a vessel will, of course, be a function of theSAR's resolution. Positive identification, if feasible, would require extremely fineresolution. I am assuming that classification and/or identification of targets at seawould be performed by human operators or interpreters. Do you (Gary) concur?
" Our experience with the target recognition and ID problem has shown that this is acomplex and, perhaps, a costly problem to solve. It may not be feasible, giventoday's technology, to ID vessels with high confidence.
" However, even if positive ID were not achievable, certain classificationinformation could be obtained. Of course, the SAR image would yield theapproximate position of the vessel. Radial motion of the vessel would cause it tobe displaced in the image in the along-track dimension. This displacementamounts to about 50 m of displacement per nautical mile/hour for the case of an
H-3

Distribution -3- May 14, 1993
aircraft velocity of 100 m/s, and a detection range of 5 nautical miles (a reasonablerange for a fine-resolution SAR capability). Further, with resolution of the orderof one meter, for example, the approximate length and width of the vessel could bedetermined from the SAR image. My question is: would this type ofcharacterization of the target be useful to you (Gary)? Please comment.
Off-the-Shelf TechnologyThe SAR survey [3] is one method we are using to examine this issue. Also, during thecost/benefit study, the results of task 8 will be used, along with our knowledge ofcommercially available components, to determine feasibility of developing a SAR for oil-spill response using off-the-shelf technology.
Near-Real-Time Data AvailabilityGary's comments have been incorporated into Reference [4].
Installation ConfieurationInstallation configuration tradeoffs and motion compensation issues will be addressed inthe final report.
Required SwathThe statement relating to swath has been modified in [4].
Required ResolutionYour desire to have square pixels on the ocean's surface is reflected in Reference [4].Because range-dimension resolution and cross-track resolution (on the ocean's surface) arenearly equal for shallow depression angles, and because pixels over most of the swath ofthe SAR will be viewed from these shallow angles, the SAR's baseline resolutionrequirement will be that range and azimuth resolutions be the same and that the image besampled in the range dimension in such a way that image pixels will be square on theocean's surface.
We have not concluded our investigation relating to a possible "practical limit' on imageresolution imposed by wave motions produced by wind speeds of 5 to 25 knots. We arenow examining one ROI from November 12 (SAR, west-looking) that appears to showazimuth smearing for a SAR look direction along the wind vector. At this point, we canoffer the following observations.
Swell Action. We have evidence from the Santa Barbara November 12 west-looking datathat long-wavelength swell action can significantly affect the SAR image. These effectsoccur predominately when the SAR is looking in a direction normal to the wavefront of thelong waves. The phenomenon (for a wave approaching the SAR) is that the front edge ofthe wave moves upward and forward, with a portion of this motion toward the SAR, whilethe back side moves downward and away from the SAR. This motion is often called orbital
H-4

Distribution -4- May 14, 1993
motion of the long waves [5]. The effect is that the front of the wave will be diiaceforward (along the flight path) in the image, and the back side will be displaced aft. Theamount of displacement D (in the image) of the front side of the wave, for example, will beapproximately
D = VfR/V.. (1)
where Vt is the radial velocity of the wavefront material toward the SAR, R is the rangefrom the SAR to the pixel containing the wavefront, and V. is the aircraft scalar velocity(speed). Aircraft velocity for the SNL SAR at the Santa Barbara test was about 55 m/s.Range to scene center-line was about 6400 m. So, for example, a radial velocity of 0.2 knot(about 0.1 m/s) would produce an azimuthal displacement of about 11.6 m. Largerwavefront radial velocities will cause proportionately larger displacements (e.g., 1 knotcauses 58 m of displacement!). Because of the relatively long period of these long waves,the SAR's resolution cell (3 m x 3 m) doesn't contain both the front and back sides of thewave. From study of the November 12th west-looking (approximately along the windvector and perpendicular to the long-wave wave-fronts) and south-looking (approximatelyperpendicular to the wind vector and along the long-wave peaks and troughs), it appearsthat the horizontal (east-west) motion of the long waves is the dominant contributor to theocean's radial velocity with respect to the SAR. The southlooking pass shows tens ofmeters of displacement of the wave-fronts, apparently caused by radial motion.
Wind-Induced Capillary-Wave Scatterer Velocities. Significant image smearing (asopposed to a displacement) in the azimutli (along-track) dimension could also result fromradial velocity of capillary waves (that is, movement toward and away from the radar) thatare induced by local winds. The motion of interest here is the differential motion of thecapillaries with respect to a coordinate frame of reference that moves with the orbitalmotion of the long waves. A given SAR resolution cell can contain capillary waves movingat different velocities, relative the radar. The result of many differently moving scatterersis to produce a "spectrum" of radial velocities within the resolution cell. The width of thisspectrum maps directly to an azimuthal width over which the SAR's image will bedefocused, or smeared. The effective width, X. of the smearing will be approximately
x. = V.R/V.. (2)
where V. and R are as defined above, and V, is the two-sided effective width of the radialvelocity spectrum of the scattering cell. So, for example, if the velocity spread of thespectrum is 0.2 knot (about 0.1 m/s), the smearing width, X., would be about 11.6 m. If the
Ht-5

Distribution -5- May 14, 1993
spectral width were 1 knot (0.5 m/s), X. would be about 58 m, and so on. Thompson'sresults reported in [5] imply that at 20-knot wind speeds, 20* incidence, and with a Ku-bandradar looking directly into the wind, the estimated effective velocity spread is about 1 knot.Thompson's results would imply that under the same wind conditions and at the same lookangle, significant azimuth smearing (58 m of it!) should be evident in 3-m images SAR foreither down-wind or up-wind look directions. Examination of the south-looking November12 pass shows no smearing of the order of 58 m; however, some smaller amount ofsmearing may well be present. It is most likely that apparent radial velocity spread varieswith both depression angle and wind speed.
Another fact that seems apparent is that the principal direction of travel of capillary wavesshould be along the vector of the local wind. Therefore, the effect of radial scatterervelocities should be most pronounced when the radar is looking either up-wind or down-wind. In cases where the SAR is looking cross-wind, these effects should be minimized.What we are missing at this point is information relating to how the Ku-band Dopplerspectrum caused by capillary-wave motion in the resolution cell relates to wind speed anddepression angle and how much movement of capillaries occurs in directions that deviatefrom the direction of the local wind vector. I'm confident that we can quickly obtain moreinformation from literature we have in-hand [6,7]
Bulk Flow Effects. A bulk average velocity of the ocean surface being imaged will cause anazimuthal shift of the entire scene over which the bulk flow applies uniformly. Thisphenomenon should not be a major concern for oil-spill imaging.
A separate phenomenon, image smearing in the range dimension, can result from a bulkflow or movement of the target-cell material through SAR resolution cells during the timethe synthetic aperture is being constructed. The ideal application of this model requiresthe unrealistic assumption that the surface of the moving material remains rigid as itmoves. With this assumption, the dimension X, of this smearing should be approximately
X- = T.Vb, (3)
where T. is the aperture time and Vb the bulk target-cell velocity. The aperture time, T,,for the November 1992 Santa Barbara data collection can be calculated as
T. = XR/(2Vp.), (4)
H-6

Distribution -6- May 14, 1993
where k, R, and V. are as defined above, and p. is the azimuth resolution (3 m).Combining (3) and (4) produces
X, - XRVb/(2Vp.). (5)
The aperture time T" resulting from evaluation of (4) is about 0.4 s. So, from (3) forexample, a bulk velocity of the one knot would produce a range smearing of only about 0.2m. Larger bulk velocities would cause proportionately larger range smearing. This samephenomenon would also result in smearing in the azimuth dimension if the SAR werelooking normal to the direction of bulk flow. Although, as in the cases mentioned above,we lack detailed information, at this point, on the physics of the ocean's dynamics, the bulk-flow phenomenon appears to be a minor player in defocusing of the image.
Comments on the Above Observations. One interesting point to note is that equations (1)and (2) are not functions of k, the electrical wavelength, while (5), which depends onaperture time, is proportional to X. A common element of equations (1), (2), and (5) is thepresence of the characteristic scatterer velocity in the numerator and the aircraft velocity,V., in the denominator of the equations. These facts imply that the practical limit ofresolution for ocean imaging can be extended somewhat by increasing aircraft velocity. Ofcourse, increasing V. increases the rate at which data enters the real-time image former;this also increases the rate at which image data must be stored to tape. The availableaircraft will also place limits on velocity. Another way to counter the effects ofdisplacement of the long-wave wave-fronts is to image along the peaks and troughs of thelong waves. And the potentially significant effects of differential radial motion of capillarywaves could probably be reduced by imaging cross-wind. In any event, none of the abovediscussion implies that range resolution of the SAR is significantly affected by "motion ofthe ocean".
Image RequirementsGary had asked that I explain a number of comments I made in the like-titled paragraph of[1]. The comments, which related to the possible need for complex data, were probablyconfusing, because they do not appear to relate to any of the other requirements. Let meexplain. At this time, we see no requirement for complex data to meet the Coast Guardoil-spill response mission. However, the real-time image former will "compute" the imageby performing arithmetic operations that produce a complex image (both magnitude andphase data are produced). My intent in the "Image Requirements" paragraph was to saythat although we cannot identify a reason now for retaining the phase information, it is agood idea (assuming that the cost is not excessive) to design any new system to retain thephase and provide it as an optional output data stream. If in the future, it is determinedthat complex data could be exploited in the oil-spill response mission, the SAR couldperhaps be modified at reduced cost. Complex image data have been used previously byJPL to map scatterer velocities on the ocean's surface. Complex data are also being used
H-7

Distribution -7- May 14, 1993
at Sandia to measure height (topography) of terrain and man-made structures. It may bepossible to measure ocean wave heights and vertical size of vessels using the topographicSAR scheme. In any event, these techniques amount to interferometry, which, for oceanimaging, requires multiple antennas and, at a minimum, a separate receiver front end foreach antenna. These techniques are beyond the scope of our investigations; however, ourexperience has shown that it isn't a good idea to design out a phase-data spigot if it ispossible that spigot might be useful in the future.
Image CalibrationMost modem SARs are capable of being calibrated to plus or minus 2 or 3 dB, so thiscapability is not necessarily going to cost a lot. But even if calibration is not required, weshould at a minimum require that the noise level in the output image be known. Thiswould give the image interpreter a way to know when he is just seeing noise and notmeaningful echo.
Likely, calibration for different missions that require different system sensitivities wouldamount to adjustment of receiver gain and, possibly, transmitter power. Probably the bestoperator interface would be one that allowed the operator to specify the class of target tobe imaged. Then the SAR would translate this class into the proper SAR control settings.
Likely, fine-resolution imaging would be done at a fixed depression angle, say at 45 *, and atshorter range, for example, at a few nautical miles. The imaging altitude may be lower, aswell. The ROI in wide-swath mode would have to be identified and designated by anoperator. Then the coordinates of the ROI could be used to compute the aircraft'strajectory for a fine-resolution imaging pass. This would probably be the most complicatedoperation for switching from wide-swath to fine-resolution modes. Other necessaryreconfiguration of the SAR could be automatic, including repointing of the antenna,adjustment of transmitter power, receiver gain, and other parameters.
I
Image Annotation RequirementsGary's comments on this subject have been incorporated into [4].
Image Processing RequirementsReal-time functions mentioned would be automatically performed by the real-time signalprocessor and would require no operator actions. Other comments have beenincorporated into [4].
Image Display RequirementsYour points regarding two separate displays are well taken and have been incorporatedinto [4].
Telemetry Interface RequirementsSee "Scope of System Study" section, above.
H1-8

Distribution -8- May 14, 1993
Printed Hardcoies
Please relate more about your experiences with the HP Laserjet HI printer in our nexttelephone conversation.
Use of Printed Ima=esGary's comments have been incorporated into [4].
Additional CommentsI want to thank recipients of this memorandum in advance for their comments and inputs.
SAR Capabilities Survey
I have solicited responses from a number of SAR vendors by sending them copies ofReferences [3] and [4]. 1 am sending Gary Hover a copy of each of these documents. Weexpect to start getting some responses in late May.
Gary L Hover (1 FAXed, 1 mailed)USCG R&D Center, Environmental Safety Branch1082 Shennecossett RoadGroton, CT 06340-6096FAX: (203)441-2792Note: include copies of References [3] and [4] for Gary.
2344 J. J. Mason9134 J. D. Bradley9134 G. A. Mastin2344 R. M. Axline, Jr.
H-9

(This page intentionally left blank.)
H-10

APPENDIX IREGION-OF-INTEREST INFORMATION
This appendix contains a table of regions-of-interest (ROls) extracted from SAR and SLARimagery for resolution studies. It is included here for reference should additional data exploitationbe necessary.
(The remainder of this page intentionally left blank.)
1-1

Table I-W. Regions-of-Interest
Date Sensor Region-of-Interest Coord.b CommentsDesignator8
Nov. 10 SAR NIOWTA4_RI (1208,120) E. of Goleta Point(1498,510)
Nov. 10 SAR NIOWJTA4_R2 (53,320) W. of Holly(440,610)
Nov. 10 SAR NiOWTA4_R3 (615,210) S. of Goleta Point(905,600)
Nov. 10 SAR NIONTA4_RI (1208,120) E. of Goleta Point(1498,510)
Nov.10 SAR NIONTA4_R2 (50,320) W. of Holly, Ship(440,610) wake
Nov. 10 SAR NI10TA4_R3 (615,210) S. of Goleta Point(905,600)
Nov. 11 SAR NilE_TA4_R1 (472,258) S. of Goleta Point,(860,546) incl. Holly
Nov. 11 SAR NI1E_TA4_R2 (216,42) NW of Holly(504,430)
Nov. 11 SAR NI IE_TA4_R3 (1256,54) E. of Goleta Point,(1646,344) kelp
Nov. 11 SAR N11E_TA4_R4 (952,256) S. of Goleta Point(1242,646)
Nov. 11 SAR NilE_TA4_R5 (1216,316) SE of Goleta Point(1606,606)
Nov. 11 SAR NI1STA4_R2 (8,208) W. of Holly(298,598)
Nov. 11 SAR NI IS_TA4_R5 (1029,400) SE of Goleta Point(1419,690)
Nov. 11 SAR NI1S_TA4_R6 (210,545) S. of Holly(600,835)
Nov. 11 SLAR HN1IN_TA4_RI (1,2292)(1000,3192)
1-2

Table M-1. Regions-of-Interes
Date Sensor Region-of-Interest Coord.b CommentsDesignator&
Nov. II SLAR HNI E_TA4_RI (111,1) Poor quality(1011,1000)
Nov. 11 SLAR HN1IW_TA4_RI (1953,1)(2853,1000)
Nov. 11 SLAR LN11N_TA4_R 1 (1,2292)(1000,3192)
Nov. I I SLAR LNIIE_TA4_Ri (72,1) Poor quality(972,1000)
Nov. 11 SLAR LNI1W_TA4_RI (1990,1)(2890,1000)
* Nov. 12 SAR N12WTAI_Ri (862,425) SW of Holly, bro-
(1252,715) ken patches of oilon water, wavemotion effect
Nov. 12 SAR NI2WTAI_R2 (35,246) SW of Naples(325,639)
* Nov. 12 SAR N12WTAlR3 (1661,44) E. of Goleta Point,(1951,434) oil (and biomass?).
The region was*(1400,180) expanded left past(1809,469) Goleta point for
resolution study
Nov. 12 SAR N12W_TAI R4 (40,465) S of(330,855) N12WTAlR2,
some overlap
* Nov. 12 SAR N12STAI_Ri (862,425) SW of Holly, com-
(1252,715) pare w/N12W_TAI_Ri
Nov. 12 SAR N12S_TAI_R2 (35,246) SW of Naples,(325,639) compare with
N12WTAI_R2
1-3

Table 1-1. Regions-of-Interest
Date Sensor Region-of-Interest Coord.b CommentsDesignatora
* Nov. 12 SAR NI2S_TAl_R3 (1558,48) E. of Goleta Point,(1848,438) prime study region,
excellent example.*(1331,246) The region was(1740,535) expanded left past
Goleta point forresolution study.
Nov. 12 SAR NIS_TAIR4 (40,465) S of(330,855) N12STAI_R2,
compare w/N12WTAlR2
Nov. 12 SLAR HN12STAI_Ri (1,330)(1000,1220)
Nov. 12 SLAR HN12ETAI_RI (15,1) Poor quality(909,1000)
Nov. 12 SLAR HN12WTAIRI (1962,1)(2862,1000)
* Nov. 12 SLAR LN12STAl_RI (1,330) Compare with(1000,1220) SAR,
N12W_TAl_R3and area just westto Goleta Point.
Nov 12 SLAR LN12ETAI_RI (15,1)(909,1000)
*Nov. 12 SLAR LN12WTAIRI (1962,1) Wishbone emul-
(2862,1000) sion outline S. ofNaples
Nov. 14 SAR N14STAI_RI (1300,159) S. of Goleta Point,(1590,549) incl. gas bubble
Nov. 14 SAR N14S_TAl_R2 (676,381) W. of Holly, long(1066,671) diag. emulsion line
Nov. 14 SAR N14S_TAI_R3 (974,217) N. or Holly, long(1364,507) diag. emulsion line
Nov. 14 SAR N14WTAIR2 (660,382) W. of Holly, long(1050,672) diag. emulsion line
1-4

Table 1-1. Regions-of-Interest
Date Sensor Region-of-lnterest Coord.b CommentsDesignatora
Nov. 14 SLAR HN14STAIR1 (1,260) Long diag. emul-(1000,1160) sion line
Nov. 14 SLAR HN14ETAIRI ((20,1)(920,1000)
Nov. 14 SLAR HNI4WTAIR1 (2000,1)(2900,1000)
Nov. 14 SLAR LN14STAIR1 (1,260)(1000,1160)
Nov. 14 SLAR LN14ETAIR1 (20,1)(920,1000)
Nov. 14 SLAR LN14WTAIRI (2000,1)(2900,1000)
"* Nov. 15 SAR N15E_TAI_Ri (852,334) W. of Holly
(1242,624)
"* Nov. 15 SAR N15E_TAl_R3 (1154,120) S. of Goleta Point,
(1444,520) incl. Holly and gasbubble
Nov. 15 SAR N15E_TAl_R4 (1456,130) E. of Goleta Point,(1746,520) kelp
Nov. 15 SAR N15S_TA1_Ri (798,358) Holly and W.,(1188,648) excellent example
Nov. 15 SAR Ni5STAl_R2 (11,430) S. of Naples, excel-(401,648) lent example
* Nov. 15 SAR N15S_TAI_R3 (1128,166) S. of Goleta Point,,(1418,556) incl. Holly and gas
bubble, kelp, com-pare w/SLARLN15WTAI_Ri
Nov. 15 SLAR HN15NTAIRI (1,2300)(1000,3200)
Nov. 15 SLAR HN15ETAIR1 (1,1) Poor quality
1 (900,1000)
I-5

Table I-M. Regions-or-Interest
Region-of-Interest Coord.bDate Sensor Designator& Comments
Nov. 15 SLAR HN15WTAI_Ri (2140,1)(3040,1000)
* Nov. 15 SLAR LN15NJTAI R1 (1,2300)(1000,3200)
Nov. 15 SLAR LN15E_TAI_Ri (1,1)(900,1000)
Nov. 15 SLAR LN15WTAI.RI (2140,1) Compare w/SAR(3040,1000) NISS_TAIR3,
kelp off Goleta Pt.
Nov. 16 SLAR HN16STAIRI (1,320)(1000,1220)
Nov. 16 SLAR HN15ETAI_Ri (57,1) Poor quality(957,1000)
Nov. 16 SLAR HN15WTAI_Ri (1944,1)(2844,1000)
Nov 16 SLAR LN15STAI_RI (1,320)(1000,1220)
Nov. 16 SLAR LN15ETAI_Ri (57,1)(957,1000)
Nov. 16 SLAR LN15WTAI_RI (1990,1)1(2890,1000)
a. SAR image region-of-interest designator interpretation: NISS_TAlIRI means Nov. 15 (N15),antenna is south-lookng (S), experiment test area I (TAI), the first region-of-interest extractedfrom the data set (RI). SLAR image region-of-interest designator interpretation: Same as for SAR,except that the designator is prefixed with H or L. H means high altitude imaging (9500 ft) and Lmeans low altitude imaging (5500 ft). SLAR images are not as large as SAR mosaics, so only 1region is designated per SLAR pass, all of which can be displayed at one time.b. Coordinates are specified as they would be entered into the SNL region-of-interest extractionprogram. In the case of SAR images, these coordinates are the "key image" coordinates which is asubsampled version of the entire mosaic, subsampled by a factor of 5. For SLAR images, these arethe actual coordinates of the full resolution image.
1-6