434-1-94.pdf - Water Research Commission
117
REPORT TO THE WATER RESEARCH COMMISSION EVALUATING THE LONG TERM USE OF POLYPROPYLENE FOR HOT AND COLD WATER PIPING by D r W W Focke M Buchinger O G Del Fabro O Schmid Polymer Programme Mattek, CSIR P O Box 395, Pretoria, 0001, RSA WRC REPORT NO. ISBN NO. 1 86845 090 2
-
Upload
khangminh22 -
Category
Documents
-
view
4 -
download
0
Transcript of 434-1-94.pdf - Water Research Commission
REPORT TO THE WATER RESEARCH COMMISSION
EVALUATING THE LONG TERM USEOF POLYPROPYLENE FOR HOT
AND COLD WATER PIPING
by
D r W W FockeM Buchinger
O G Del FabroO Schmid
Polymer ProgrammeMattek, CSIR
P O Box 395, Pretoria, 0001, RSA
WRC REPORT NO.ISBN NO. 1 86845 090 2

1
EVALUATING THE LONG TERM USEOF POLYPROPYLENE FOR HOTAND COLD WATER PIPING
EXECUTIVE SUMMARY
Polypropylene pipes are currently used for domestic hot and cold water installations.Polypropylene will also be the system of choice for low cost housing applications. Despitethe widespread use of this piping not enough is known about the long term behaviour andageing of such pipes, especially in hot water applications. This study used laboratorytechniques to explore the quality of locally produced pipes in comparison to an imported pipe(from Germany). The objectives of this investigation were to evaluate failure mechanismsexperienced in practice; evaluate the long term thermal stability and creep properties of thesepipes, and to generate performance data required for quality control or acceptance tests.
Material Characterization
Block copolymer pipe grades (PPH 4122 and PPH 2222) are currently manufactured locallyarid "pipe grade" material (Tipolene) is imported from Hungary. Analysis of some pipesclearly indicated that converters have also used non-pipe-grade materials. Also, in manyinstances insufficient or no stabilizer was added to the polymer. Such pipes can not beexpected to provide trouble free service over the required lifetime.
Failure Analysis
Approximately 60 samples of field failures were investigated. The major failure modes, theirfrequency and proposed remedial actions are given in Table 1. Despite the evidence ofdefective raw materials being used (18%), the most frequent reason for field failures wasincorrect installation procedures (32%). Poor quality processing or incorrect manufacturingprocedures caused 21% of the failures investigated. Problems were also encountered withgas or oil pollution of water inside pipes (14%) and failure of fittings (8%). These resultsindicate that a comprehensive approach will be required to remedy this situation.
Thermal Stability
Many field samples failed by embrittlement due to oxidative degradation. In all these casesit was shown that very little or no stabilizer was present. For well stabilized pipes,extrapolation of Differential Scanning Calorimetry (DSC) data and oven ageing tests indicatesthat the pipes should have excellent dry heat stability. Predicted service life in air is muchhigher than specified requirements of >30 years at 25°C and >3 years at 80°C.
Creep Life
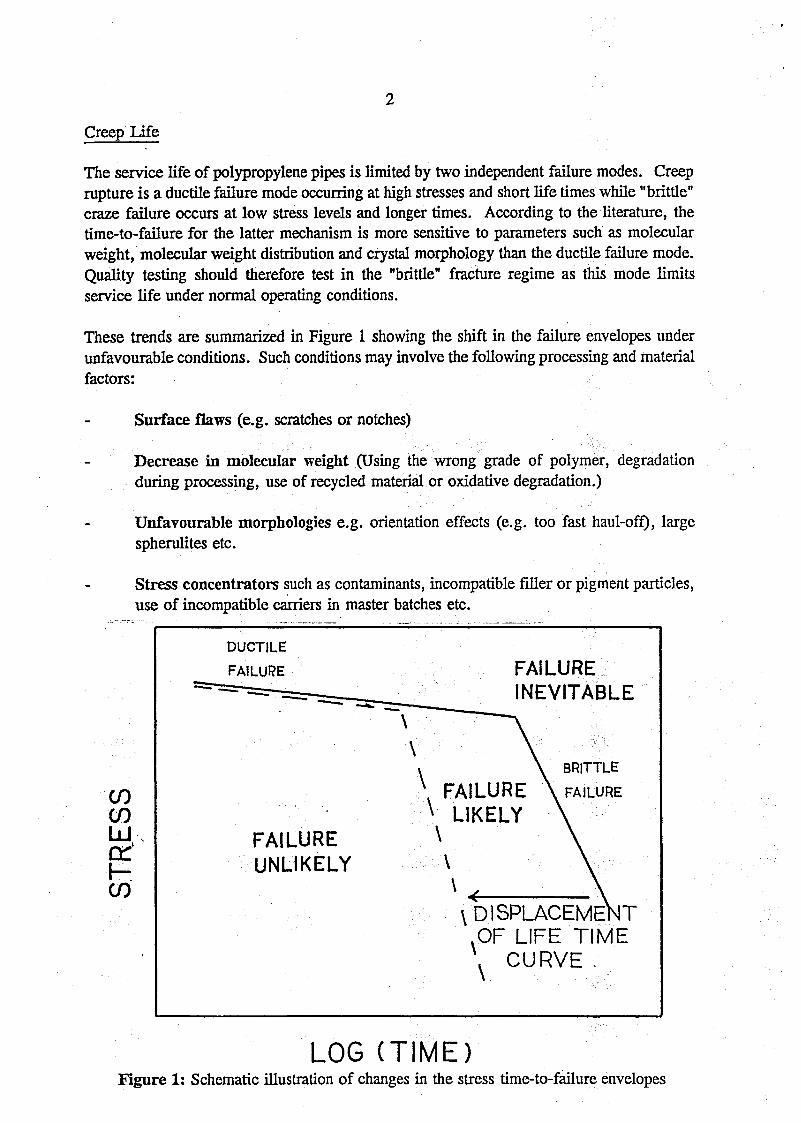
The service life of polypropylene pipes is limited by two independent failure modes. Creeprupture is a ductile failure mode occurring at high stresses and short life times while "brittle"craze failure occurs at low stress levels and longer times. According to the literature, thetime-to-failure for the latter mechanism is more sensitive to parameters such as molecularweight, molecular weight distribution and crystal morphology than the ductile failure mode.Quality testing should therefore test in the "brittle" fracture regime as this mode limitsservice life under normal operating conditions.
These trends are summarized in Figure 1 showing the shift in the failure envelopes underunfavourable conditions. Such conditions may involve the following processing and materialfactors:
Surface flaws (e.g. scratches or notches)
Decrease in molecular weight (Using the wrong grade of polymer, degradationduring processing, use of recycled material or oxidative degradation.)
Unfavourable morphologies e.g. orientation effects (e.g. too fast haul-off), largespherulites etc.
Stress concentrators such as contaminants, incompatible filler or pigment particles,use of incompatible carriers in master batches etc.
COCOLLJmC/D
DUCTILE
FAILURE FAILUREINEVITABLE
»
FAILUREUNLIKELY
FAILUREV LIKELY\
BRITTLE
FAILURE
\ DISPLACEMENTOF LIFE TIME
\ CURVE
LOG (TIME)Figure 1: Schematic illustration of changes in the stress time-to-failure envelopes
Actual performance of locally produced pipes was inferior to that of pipes obtained fromGermany. With few exceptions, they all fail prematurely relative to the relevant creep curvepredictions. The available information suggests that poor processing techniques areresponsible for this situation. Locally produced pipes show excessive orientation effects andproperties vary anisotropically along the hoop directiomin some cases.
Quality Control Testing
To ensure high quality of locally produced pipes as well as adequate service life, thefollowing requirements must be met:
Raw Material. The raw material must be a suitable pipe grade material. Thisrequires a very high molecular weight (Mw « 500 000) and nucleating agents whichwill ensure a sufficiently fine spherulitic crystal morphology. Under practicalconditions the polymer identity may be verified using Infrared (IR) spectroscopy andthe molecular weight checked using Melt Flow Index (MFI) measurements.
Stabilization of Raw Material. The raw material must be adequately stabilizedagainst oxidative degradation (exacerbated by elevated temperatures) and UVradiation. The level of antioxidants in the material can be determined by isothermalor dynamic oxidation induction techniques using Dynamic Scanning Calorimetry(DSC). If the identity of the stabilizer is known, IR can also be used to quantify theantioxidant level.
Quality of Extruded Pipe. The pipe should be free from internal (Hfrozen-in")stresses and conform to the appropriate dimensional requirements. Unfortunately theonly way to unambiguously demonstrate acceptable quality requires a long term creeptest sampling in the knee region or lower (See Figure 1) of the creep curve (e.g.95°C with hoop stress of 2,65 MPa). Results obtained to date showed that the failuremechanism in dynamic fatigue tests approximates the creep craze failures expectedat long life times for PP pipes. In addition, failure can be induced within days atelevated temperatures. The dynamic fatigue of pipes could therefore provide a qualitydiscriminator for a pipe acceptance test. A large number of such tests need to beconducted to construct a calibration curve.
Packaging, Storage and Distribution. Pipes should not be stored in direct sunlight.Care should be taken that pipes are not mechanically abused during transit andinstallation. Rolling of pipes into small coils may be sufficient to cause yielding (theyield strain for PP is 5-15%). This nucleates defects which will initiate cracks duringservice and will ultimately result in premature failure.

TABLE 1.: FAILURE MODES FOR POLYPROPYLENE PIPES
Failure Type(Frequency)
1. IncorrectInstallation(32%)
2. Poor QualityProduct/Processing(21%)
3. Defective RawMaterial (18%)
Description
Mechanical Damage to pipes during orbefore installation
- Sharp rocks dropped on pipes during trenchfilling.
- Sharp rocks deforming pipes during heavyduty compaction or when traffic passes overburied pipes.
- Installation of pipes that were mechanicallyflattened (probably by a vehicle driving overpipe).
Connection of misaligned pipes- Misalignment resulted in a very small gap at
which a water jet was created. This led tosevere erosion of the brass olive andeventually a major leak.
Puncturing of pipes with a sharp object- This led to rapid crack growth.
- Weld lines from spider die not properlyhealed.
- Insufficient melting and mixing of material.
- Pipe deformation by haul-off system.- Longitudinal stresses in extruded pipe.
- Wall damage due to severity of embossingprocess.
- Uneven wall thickness.
- Incorrect wall thickness.
Premature pipe failure:- Mechanical.
- Thermal oxidative.- Presence of polyethylene in pipe material
(use of PE based masterbatch or PEcontamination).
Remedial Action
Create awareness that plastic pipes used forpressure applications are not damagetolerant like metal pipes.- Use soft backfill to cover pipes in
trenching applications.- Avoid direct contact between large rocks
and pipes.
- Do not install pipes that were deformedbeyond their yield point. This isdetectable by visual inspection: the pipewill show stress whitening at the point ofdeformation if it has been stressedbeyond the yield point. (Apparently onesupplier claimed in his advertising blurbthat one can drive with a caterpillaracross the polypropylene pipes).
- Avoid bending of polypropylene pipes.Use straight sections only.
- Use recommended melt and dietemperature profile.
- Use longer barrels and appropriate screwdesign.
- Better cooling of extruded pipe.- Reduce haul-off speed, extrude at a
slower rate and use correct die size.- Use correct extrusion die for each pipe
size (some manufacturers use the samedie to produce pipe diameters for IS, 22and 54 mm!)
- JASWIC should specify a fixedminimum wall thickness per nominalpipe diameter.
- Use only correct and approved pipegrade material.
- Avoid the use of recycled material.- Use PP based masterbatch only.

Failure Type(Frequency)
4. Pollution (14%)
5. Fittings (896)
6. Other (8%)
Description
- Smell of gas in potable water.
- Smell and taste of oil/tar in water.
Mechanical fittings- Slippage and pull-out of fitting due to:
• Thermal expansion and contraction.• Pipe shrinkage due to stress relief.
- Premature circumferential cracks due toexcessive tightening of fittings or oxidativedegradation.
- Poor sealing.- Olives made by stamping have a sharp edge
which cuts pipe.
Welded fittings- Poor weld bond due to low gas flame.- Blocking of fitting (e.g. T-piece) by plastic
melt.- Overheating of fusion fitting causes
degradation.
- Reason for failure not identified
Remedial Action
- Choose location of pipes away from gaspipe lines
- Mechanical fittings should be regardedas temporary fittings only.
- Use stainless steel insert (with ashoulder) and torque limited tools.
- Ensure proper pipe alignment.
- Use correct fusion time and temperature(work according to procedure DVS 2207Part II)
ACKNOWLEDGEMENTS
The research in this report emanated from a project funded by the Water ResearchCommission and entitled:
"Evaluating the Long Term use of Polypropylene for Hot and Cold Water Piping."
The Steering Committee responsible for this project, consisted of the following persons:
Mr H C Chapman Water Research Commission (Chairman)
D r H M Saayman Water Research Commission
Mr R P Donovan Cape Town Municipality
Prof R D Sanderson Stellenbosch University
Mr I Hollander Sandton Town Council
MrJJKeuler SABS
Mr D Huyser SABS
Mr P Schirmer Plastomark
The financing of the project by the Water Research Commission and the contribution ofthe members of the Steering Committee is acknowledged gratefully.
This project was only possible with the co-operation of many individuals and institutions.The authors therefore wish to record their sincere thanks to the following:
Municipality of Cape TownMr Roy Donovan for samples of pipe failures, the detailed data on these and hiscontinued enthusiastic support of the project.
Durban CorporationMr Barry Pollecutt and Mr Roy Pinkerton for samples and Mr Robin Bissett for hiscontribution in the development of the Infrared analysis for antioxidant concentration.
Sandton Town CouncilMr Ivan Hollander for reports on the failure of pipe fittings.
University of StellenboschProf Ron Sanderson for two copies of application notes on measuring oxidativedegradation rates with DSC.

PlastomarkMr Peter Schirmer and Mr Rob Patmore for assistance with technical information,thermal and mechanical testing, measurement of melt flow indices and assisting withthe failure analysis.
Municipality of Port ElizabethMr Dave Raymer for samples of pipe failures and documentation.
SABSMr Bohus Zahradnik for various mechanical tests, suggestions and solutions toproblems encountered during this study. He also contributed results on waterabsorbtion, melt flow index (MFI) and the anisotropy in the mechanical properties ofring specimens.
EVALUATING THE LONG TERM USE OF POLYPROPYLENEFOR HOT AND COLD WATER PIPING
TABLE OF CONTENTS Page
1. INTRODUCTION 1.1
2. PHYSICAL AND MATERIAL CHARACTERIZATION 2.1
2.1 Optical Microscopy 2.12.2 X-Ray Diffraction 2.12.3 Tensile Testing 2.42.4 Melt Flow Index (MFI) 2.52.5 Gel Permeation Chromatography (GPC) 2.62.6 13C NMR and IR Spectroscopy 2.62.7 Dynamic Mechanical Thermal Analysis (DMTA) 2.92.8 Differential Scanning Calorimetry (DSC) 2.92.9 Ash Analysis 2.112.10 Water Absorbtion and Desorbtion 2.112.11 Discussion and Conclusions 2.122.12 References 2.13
3. EVALUATION OF FAILURE MECHANISMS 3.1
4. THERMAL STABILITY 4.1
4.1 Introduction 4.14.2 The Mechanisms of Oxidative Degradation 4.14.3 The Stabilization Mechanisms of Antioxidants 4.44.4 Oxidative Degradation of Polypropylene 4.54.5 Characterization of Oxidative Degradation 4.74.6 Estimation of Service Life 4.84.7 Theoretical Model for Antioxidant Consumption 4.104.8 Experimental 4.13
4.9 Results 4.134.9.1 High Temperature Results 4.134.9.2 Low Temperatures 4.184.9.3 Water Immersion Ageing 4.204.9.4 Prediction of Oxidation Life-Times 4.214.9.5 Thermal Analysis of Controlled Film Samples 4.25
4.10 Discussion 4.284.11 Estimation of Antioxidant concentration from
Infrared Spectra (IR) 4.304.12 Conclusions 4.304.13 References 4.32
Page
5. CREEP PROPERTIES 5.1
5.1 Introduction 5.1
5.2 Failure Mechanisms 5.65.2.1 Deformation Mechanisms * 5.65.2.2 Ductile Creep Failure 5.65.2.3 Brittle Failure 5.85.2.4 Parameters Influencing Service Life 5.11
5.3 Criteria for Residual Life Assessment 5.14
5.4 Experimental 5.165.4.1 Internal Pressurization of Pipes 5.165.4.2 Mechanical Testing 5.19
5.5 Crazing of Polypropylene 5.305.6 Conclusions 5.305.7 References 5.33
6. CONCLUSIONS 6.1
6.1 Pipe Failure Modes 6.16.2 Material Characterization 6.16.3 Thermal Stability 6.26.4 Creep Life 6.26.5 References 6.3
7. RECOMMENDATIONS 7.1
7.1 Recommendations for Further Research 7.17.2 Suggestions for the Implementation of a
Comprehensive Quality Control System 7.17.3 References 7.4
APPENDIX A: Draft Modifications to Acceptance Test for RawMaterial and Pipe made from Polypropyleneblock Copolymer Al
APPENDK B: Extrusion of Polypropylene Pipes Bl
APPENDIX C: Evaluation of Failure Mechanisms:Record of Pipe Failure Reports Cl

1.1
1. INTRODUCTION
Polypropylene pipes are currently used for domestic hot and cold water in-stallations. In South Africa, the annual consumption of polypropylene raw materialfor this application amounts to approximately 600 tons. Raw material suppliersexpect that this volume could increase to 2 000 tons/year should large scale masshousing projects get underway.
Plastic piping for the transportation of potable water potentially offers the followingadvantages:
flexibility and the use of long lengths which makes installation easier andreduces the number of fittings;
low weight with associated ease of transportation and storage, and
relatively low cost of manufacture and installation.
Potential disadvantages include increased contraction and expansion duringtemperature cycling, failure modes which differ greatly from those of moreconventional piping such as copper and steel, flammability, increased creep underhigh pressures and temperatures, etc.
Experience in Western Europe has shown that polypropylene piping can besuccessfully applied for under-floor heating applications. Provided that appropriateguidelines are followed in the choice and selection of the polymer grade duringmanufacture, acceptable service life should be attainable in practice. However, thisraises the cost of manufacture which in today's competitive world leads to thetemptation to take short-cuts. Enforcement of appropriate specifications willprotect both the consumer and the reputable manufacturer.
Despite widespread use of polypropylene pipes, not enough is known about thelong term behaviour and ageing tendencies of such pipes, especially in hot waterapplications. Because of these uncertainties, many authorities have expressedreservations regarding the use of polypropylene pipes. This implies a need for asound scientific investigation of the long term performance properties of locallyproduced polypropylene pipes. The major objectives of this study were:
the provision of relevant performance data on which criteria for a standardspecification could be based;
to develop or select appropriate test procedures for quality control that willguarantee satisfactory performance over the required service life.
In order to achieve these goals, it was decided to focus on locally produced pipesand to conduct tests which would indicate their long term properties. It was hopedthat the data generated would aid the drafting of appropriate specifications as wellas routine quality control procedures to be implemented by manufacturers.
1.2
In the interest of economy, tests were limited to the most commonly used pipediameter (OD 22mm). Products from three major suppliers were investigated. Abatch of pipes from each supplier was procured from reputable retail suppliers toensure that a representative sample was obtained and bias excluded. Each suppliersubsequently confirmed, in writing, that the product did in fact originate from hisfactory. In addition, virgin raw material was obtained from Plastomark and servedas a reference standard.
The project was executed in four separate phases:
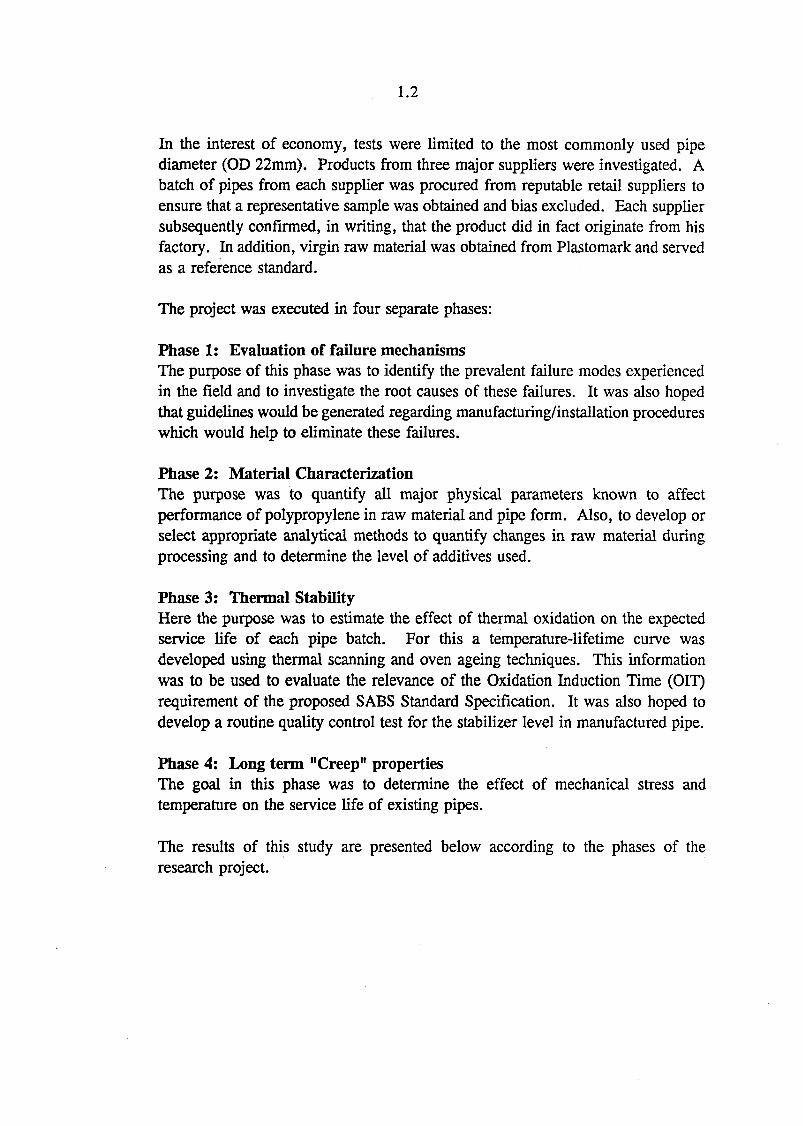
Phase 1: Evaluation of failure mechanismsThe purpose of this phase was to identify the prevalent failure modes experiencedin the field and to investigate the root causes of these failures. It was also hopedthat guidelines would be generated regarding manufacturing/installation procedureswhich would help to eliminate these failures.
Phase 2: Material CharacterizationThe purpose was to quantify all major physical parameters known to affectperformance of polypropylene in raw material and pipe form. Also, to develop orselect appropriate analytical methods to quantify changes in raw material duringprocessing and to determine the level of additives used.
Phase 3: Thermal StabilityHere the purpose was to estimate the effect of thermal oxidation on the expectedservice life of each pipe batch. For this a temperature-lifetime curve wasdeveloped using thermal scanning and oven ageing techniques. This informationwas to be used to evaluate the relevance of the Oxidation Induction Time (OIT)requirement of the proposed SABS Standard Specification. It was also hoped todevelop a routine quality control test for the stabilizer level in manufactured pipe.
Phase 4: Long term "Creep" propertiesThe goal in this phase was to determine the effect of mechanical stress andtemperature on the service life of existing pipes.
The results of this study are presented below according to the phases of theresearch project.
2.1
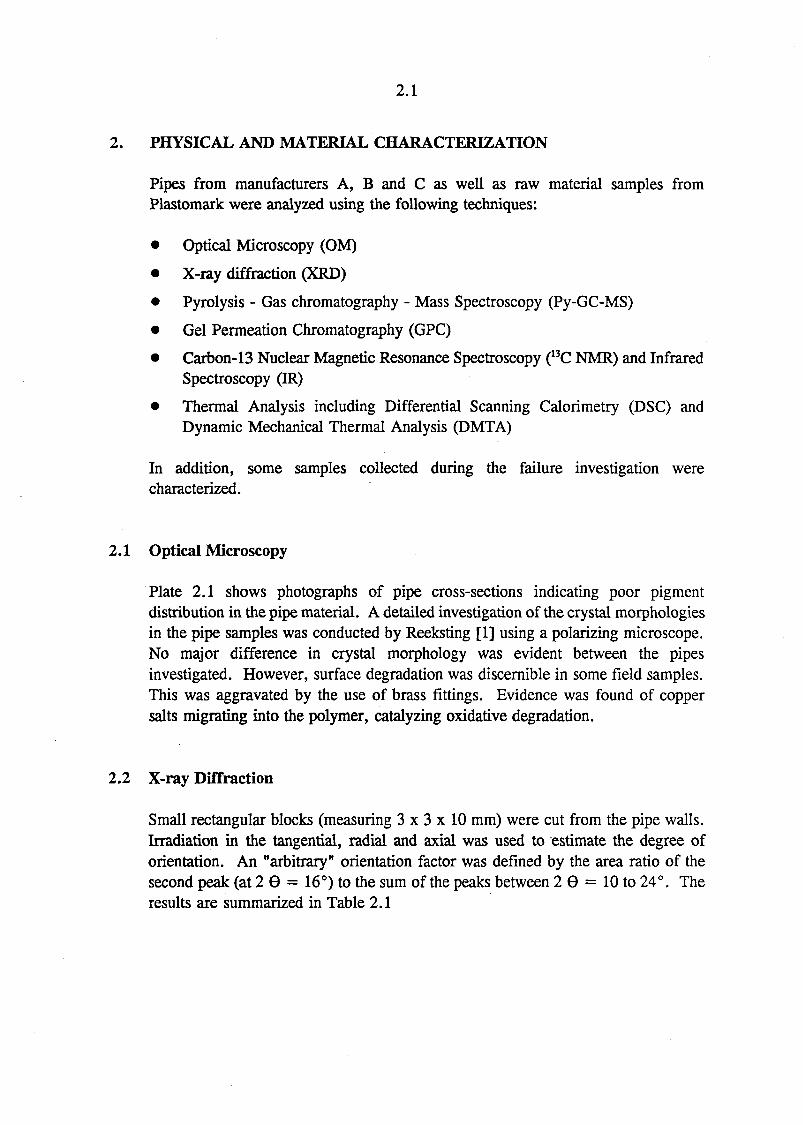
2. PHYSICAL AND MATERIAL CHARACTERIZATION
Pipes from manufacturers A, B and C as well as raw material samples fromPlastomark were analyzed using the following techniques:
• Optical Microscopy (OM)
• X-ray diffraction (XRD)
• Pyrolysis - Gas chromatography - Mass Spectroscopy (Py-GC-MS)
• Gel Permeation Chromatography (GPC)
• Carbon-13 Nuclear Magnetic Resonance Spectroscopy (13C NMR) and InfraredSpectroscopy (IR)
• Thermal Analysis including Differential Scanning Calorimetry (DSC) andDynamic Mechanical Thermal Analysis (DMTA)
In addition, some samples collected during the failure investigation werecharacterized.
2.1 Optical Microscopy
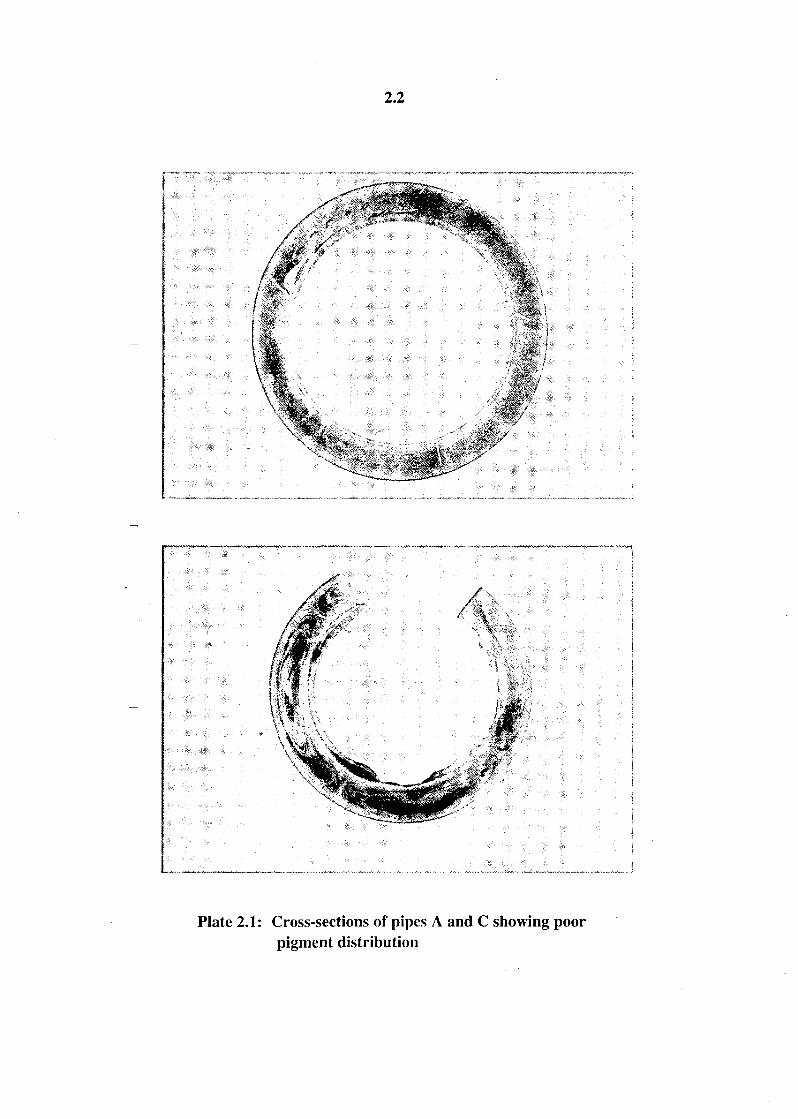
Plate 2.1 shows photographs of pipe cross-sections indicating poor pigmentdistribution in the pipe material. A detailed investigation of the crystal morphologiesin the pipe samples was conducted by Reeksting [1] using a polarizing microscope.No major difference in crystal morphology was evident between the pipesinvestigated. However, surface degradation was discernible in some field samples.This was aggravated by the use of brass fittings. Evidence was found of coppersalts migrating into the polymer, catalyzing oxidative degradation.
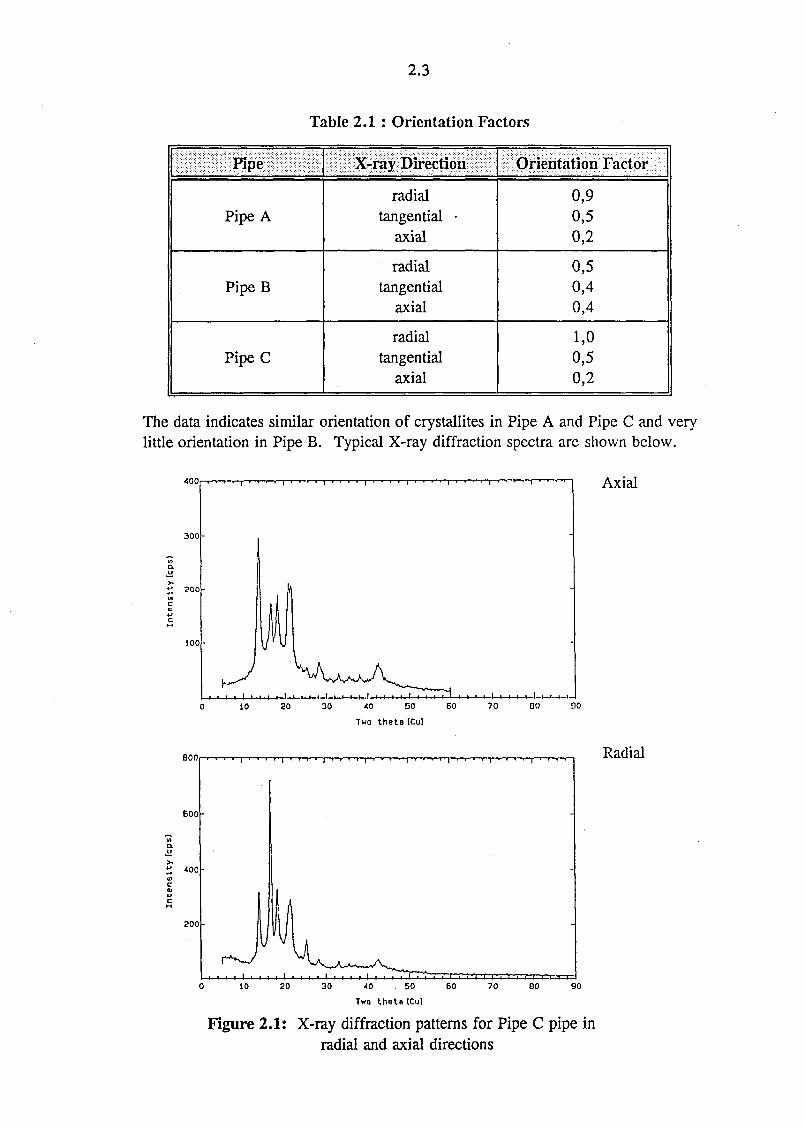
2.2 X-ray Diffraction
Small rectangular blocks (measuring 3 x 3 x 10 mm) were cut from the pipe walls.Irradiation in the tangential, radial and axial was used to estimate the degree oforientation. An "arbitrary" orientation factor was defined by the area ratio of thesecond peak (at 2 6 = 16°) to the sum of the peaks between 2 9 = 10 to 24°. Theresults are summarized in Table 2.1
2.2
Plate 2.1: Cross-sections of pipes A and C showing poorpigment distribution
2.3
Table 2.1 : Orientation Factors
Pipe
Pipe A
Pipe B
Pipe C
X-ray Direction
radialtangential •
axial
radialtangential
axial
radialtangential
axial
Orientation Factor
0,90,50,2
0,50,40,4
1,00,50,2
The data indicates similar orientation of crystallites in Pipe A and Pipe C and verylittle orientation in Pipe B. Typical X-ray diffraction spectra are shown below.
400
300-
Axial
10 40 50
Two theto (Cu)
B00; Radial
10 20 30 40 50 60
Two thato (Cu)
70 80
Figure 2.1: X-ray diffraction patterns for Pipe C pipe inradial and axial directions
2.4
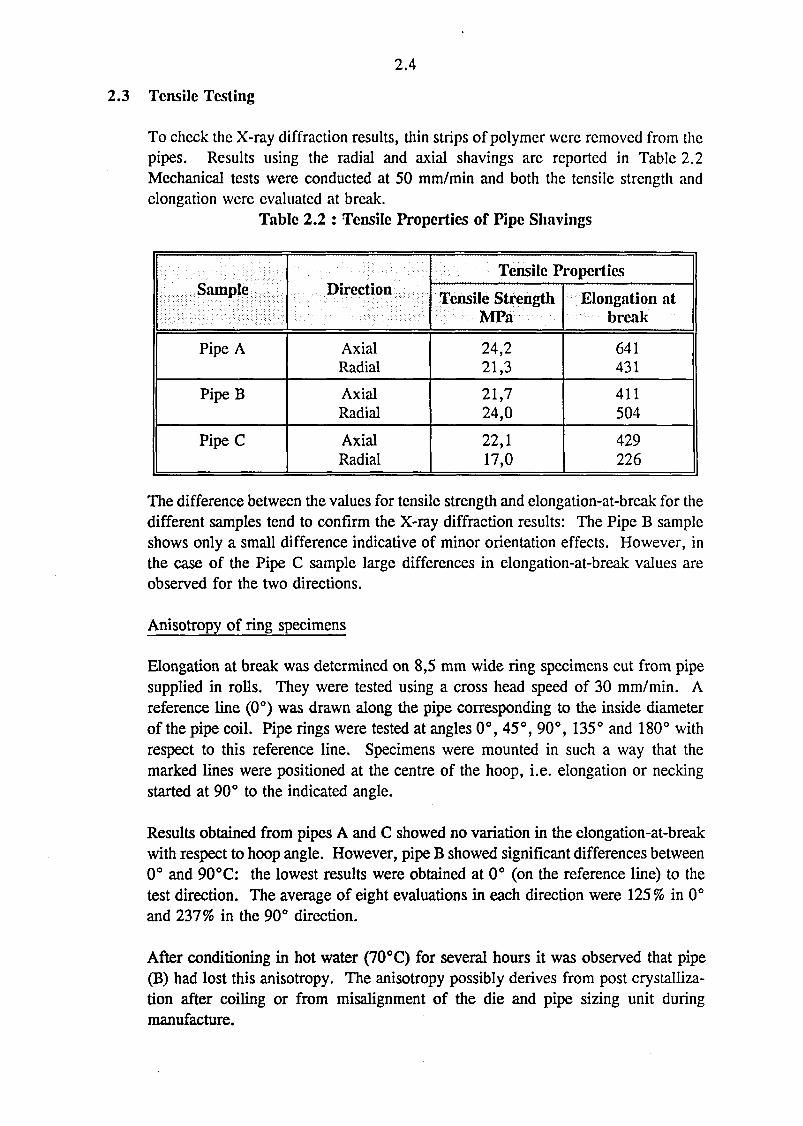
2.3 Tensile Testing
To check the X-ray diffraction results, thin strips of polymer were removed from thepipes. Results using the radial and axial shavings are reported in Table 2.2Mechanical tests were conducted at 50 mm/min and both the tensile strength andelongation were evaluated at break.
Table 2.2 : Tensile Properties of Pipe Shavings
Sample
Pipe A
PipeB
PipeC
Direction
AxialRadial
AxialRadial
AxialRadial
Tensile Properties
Tensile StrengthMPa
24,221,3
21,724,0
22,117,0
Elongation atbreak
641431
411504
429226
The difference between the values for tensile strength and elongation-at-break for thedifferent samples tend to confirm the X-ray diffraction results: The Pipe B sampleshows only a small difference indicative of minor orientation effects. However, inthe case of the Pipe C sample large differences in elongation-at-break values areobserved for the two directions.
Anisotropy of ring specimens
Elongation at break was determined on 8,5 mm wide ring specimens cut from pipesupplied in rolls. They were tested using a cross head speed of 30 mm/min. Areference line (0°) was drawn along the pipe corresponding to the inside diameterof the pipe coil. Pipe rings were tested at angles 0°, 45°, 90°, 135° and 180° withrespect to this reference line. Specimens were mounted in such a way that themarked lines were positioned at the centre of the hoop, i.e. elongation or neckingstarted at 90° to the indicated angle.
Results obtained from pipes A and C showed no variation in the elongation-at-breakwith respect to hoop angle. However, pipe B showed significant differences between0° and 90°C: the lowest results were obtained at 0° (on the reference line) to thetest direction. The average of eight evaluations in each direction were 125% in 0°and 237% in the 90° direction.
After conditioning in hot water (70°C) for several hours it was observed that pipe(B) had lost this anisotropy. The anisotropy possibly derives from post crystalliza-tion after coiling or from misalignment of the die and pipe sizing unit duringmanufacture.
2.5
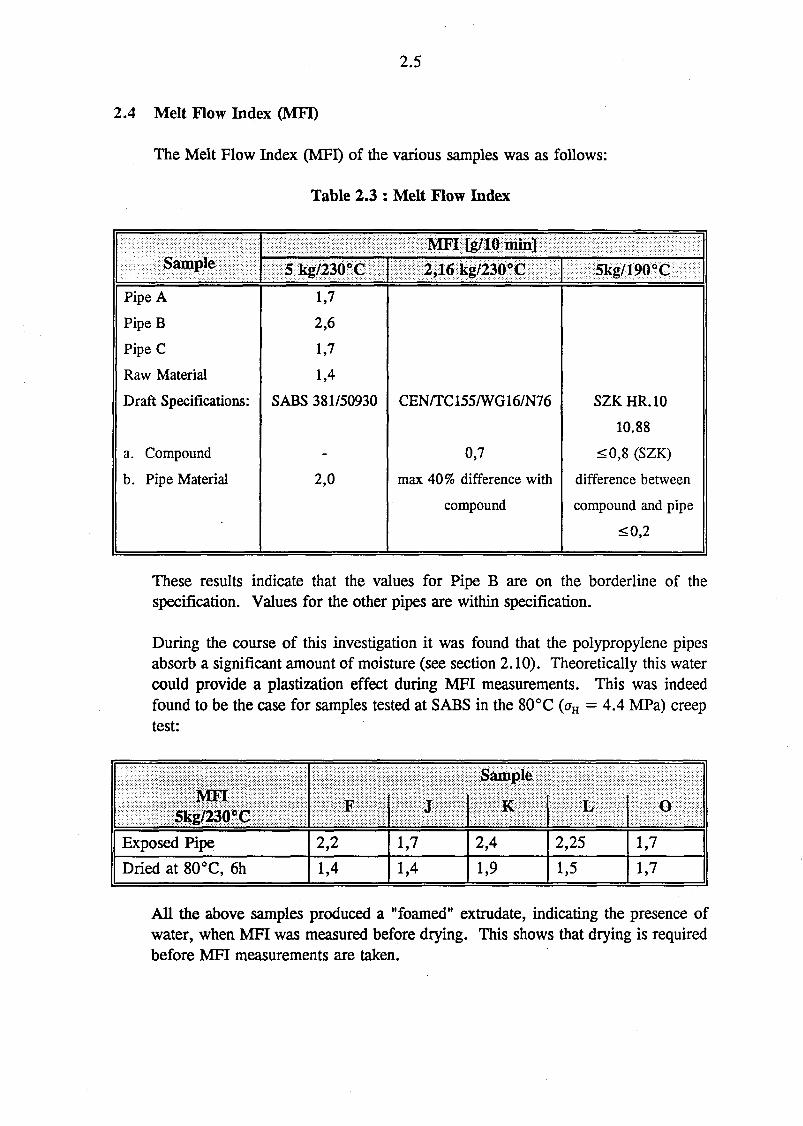
2.4 Melt Flow Index (MFI)
The Melt Flow Index (MFI) of the various samples was as follows:
Table 2.3 : Melt Flow Index
Sample
Pipe A
PipeB
Pipe C
Raw Material
Draft Specifications:
a. Compound
b. Pipe Material
MFI [g/10 min]
5 kg/230°C
1,7
2,6
1,7
1,4
SABS 381/50930
-
2,0
2,16kg/230°C
CEN/TC155/WG16/N76
0,7
max 40% difference with
compound
5kg/190°C
SZKHR.10
10.88
<0,8 (SZK)
difference between
compound and pipe
<0,2
These results indicate that the values for Pipe B are on the borderline of thespecification. Values for the other pipes are within specification.
During the course of this investigation it was found that the polypropylene pipesabsorb a significant amount of moisture (see section 2.10). Theoretically this watercould provide a plastization effect during MFI measurements. This was indeedfound to be the case for samples tested at SABS in the 80°C (aH = 4.4 MPa) creeptest:
MFI5kg/230°C
Exposed Pipe
Dried at 80°C, 6h
F
2,2
1,4
J
1,7
1,4
Sample
K
2,4
1,9
L
2,25
1,5
O
1,7
1,7
All the above samples produced a "foamed" extrudate, indicating the presence ofwater, when MFI was measured before drying. This shows that drying is requiredbefore MFI measurements are taken.
2.6
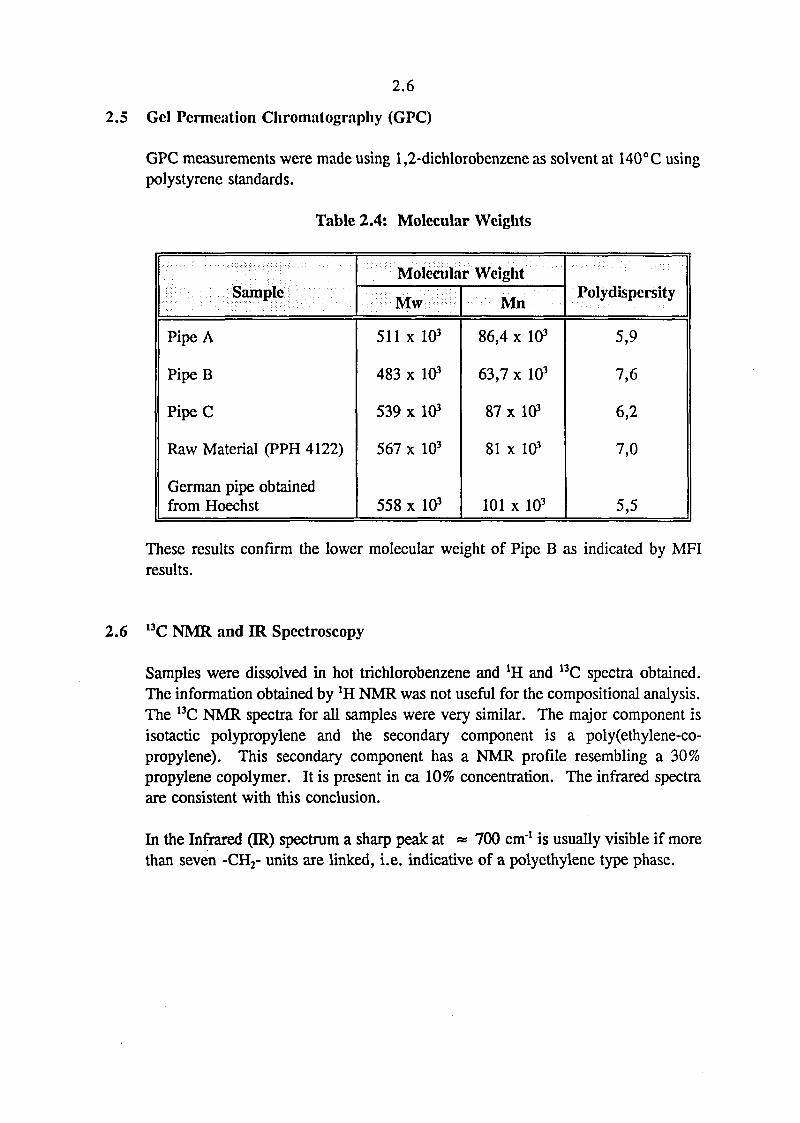
2.5 Gel Permeation Chromatography (GPC)
GPC measurements were made using 1,2-dichlorobcnzene as solvent at 140°C usingpolystyrene standards.
Table 2.4: Molecular Weights
Sample
Pipe A
PipeB
PipeC
Raw Material (PPH 4122)
German pipe obtainedfrom Hoechst
Molecular Weight
Mw
511 x 103
483 x 103
539 x 103
567 x 10'
558 x 10'
Mn
86,4 x 10³
63,7 x 10'
87 x 103
81 x 103
101 x 10'
Polydispersity
5,9
7,6
6,2
7,0
5,5
These results confirm the lower molecular weight of Pipe B as indicated by MFIresults.
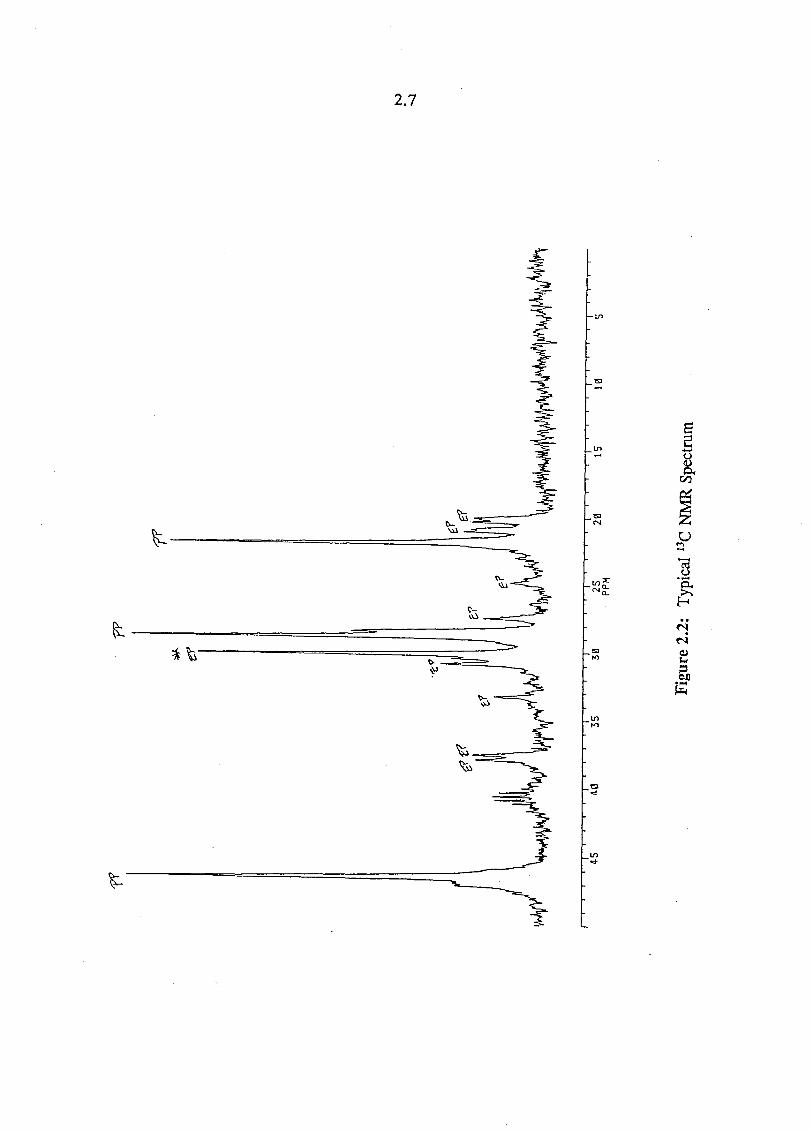
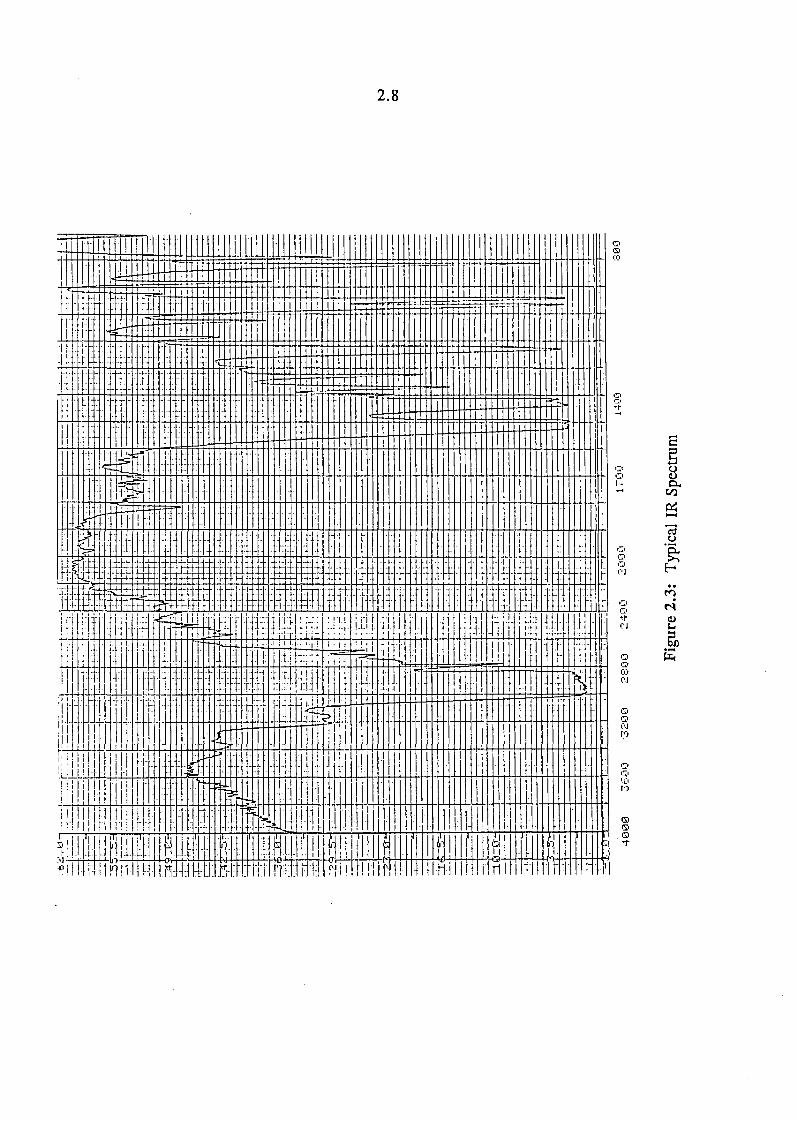
2.6 13C NMR and IR Spectroscopy
Samples were dissolved in hot trichlorobenzene and *H and 13C spectra obtained.The information obtained by *H NMR was not useful for the compositional analysis.The 13C NMR spectra for all samples were very similar. The major component isisotactic polypropylene and the secondary component is a poly(ethylene-co-propylene). This secondary component has a NMR profile resembling a 30%propylene copolymer. It is present in ca 10% concentration. The infrared spectraare consistent with this conclusion.
In the Infrared (IR) spectrum a sharp peak at « 700 cm"1 is usually visible if morethan seven -CH2- units are linked, i.e. indicative of a polyethylene type phase.
2.7
in
2.8
in
13
2.9
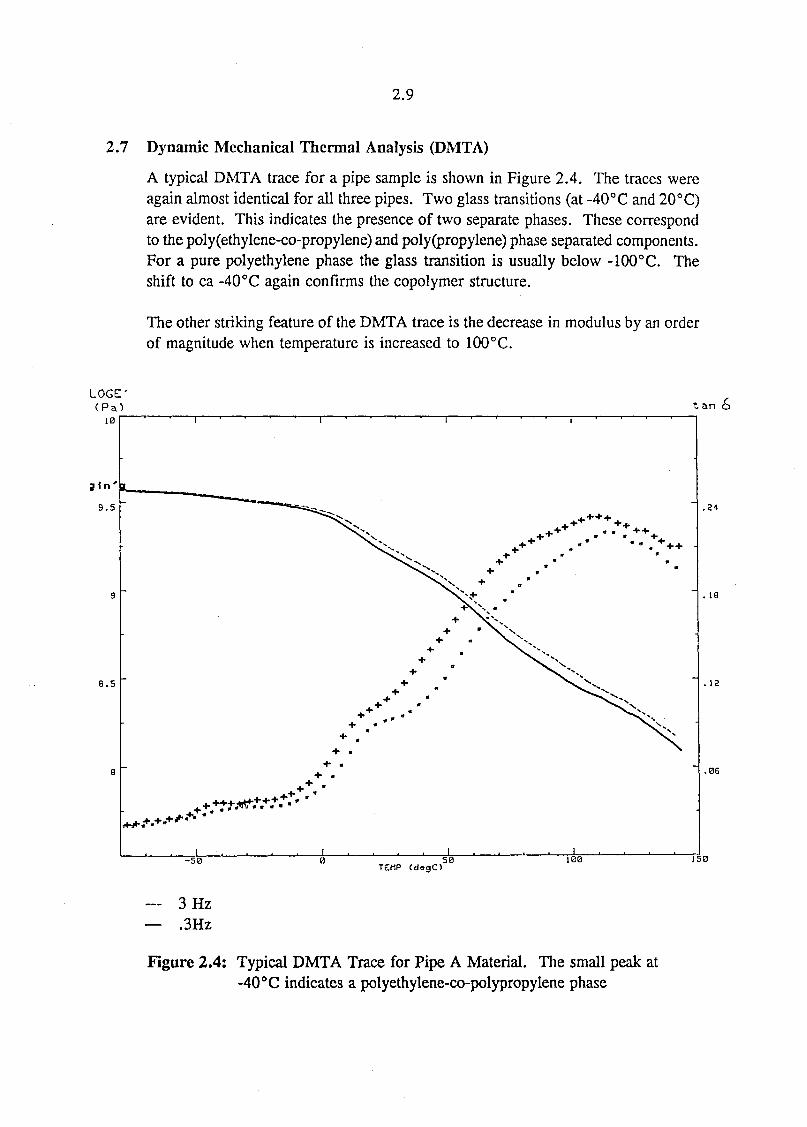
2.7 Dynamic Mechanical Thermal Analysis (DMTA)
A typical DMTA trace for a pipe sample is shown in Figure 2.4. The traces wereagain almost identical for all three pipes. Two glass transitions (at -40°C and 20°C)are evident. This indicates the presence of two separate phases. These correspondto the poly(ethylene-co-propylene) and polypropylene) phase separated components.For a pure polyethylene phase the glass transition is usually below -100°C. Theshift to ca -40°C again confirms the copolymer structure.
The other striking feature of the DMTA trace is the decrease in modulus by an orderof magnitude when temperature is increased to 100°C.
t an 6
. 12
. 0 6
- 5 0TEMP CdogC)
100 150
— 3 Hz— .3Hz
Figure 2.4: Typical DMTA Trace for Pipe A Material. The small peak at-40 °C indicates a polyethylene-co-polypropylene phase
= PP pipe B (ppb2)
o
<UJX
Fri'A'K from: 12t c: 1 6
Gnsa1:- 145.54J/g » 60.44
11
too
doo ifcooTemperature (C)
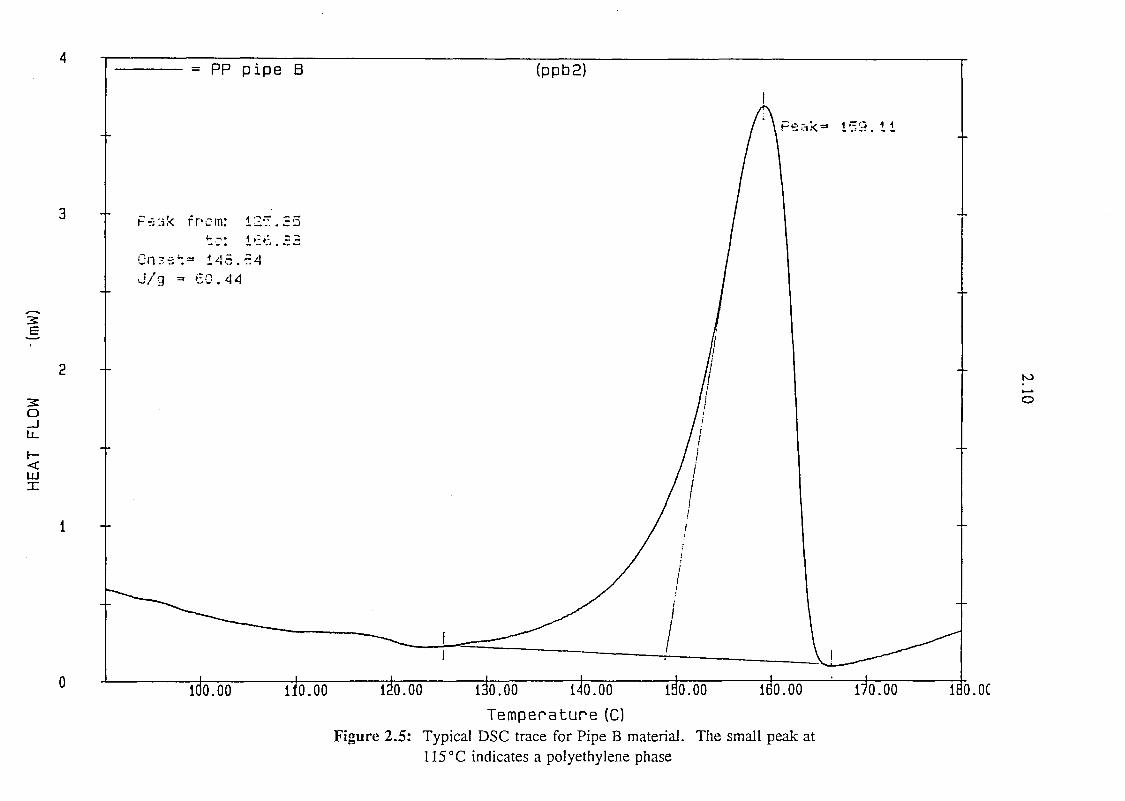
Figure 2.5: Typical DSC trace for Pipe B material. The small peak at115°C indicates a polyethylene phase
170.00 180.0C
2.11
2.8 Differential Scanning Calometry (DSC)
A typical DSC scan is shown in Figure 2.5. It shows the normal polypropylenemelting endotherm at ca 160°C. There is only a hint of a polyethylene meltingpoint at ca 115°C. This again confirms the structure interpretation obtained by 13CNMR.
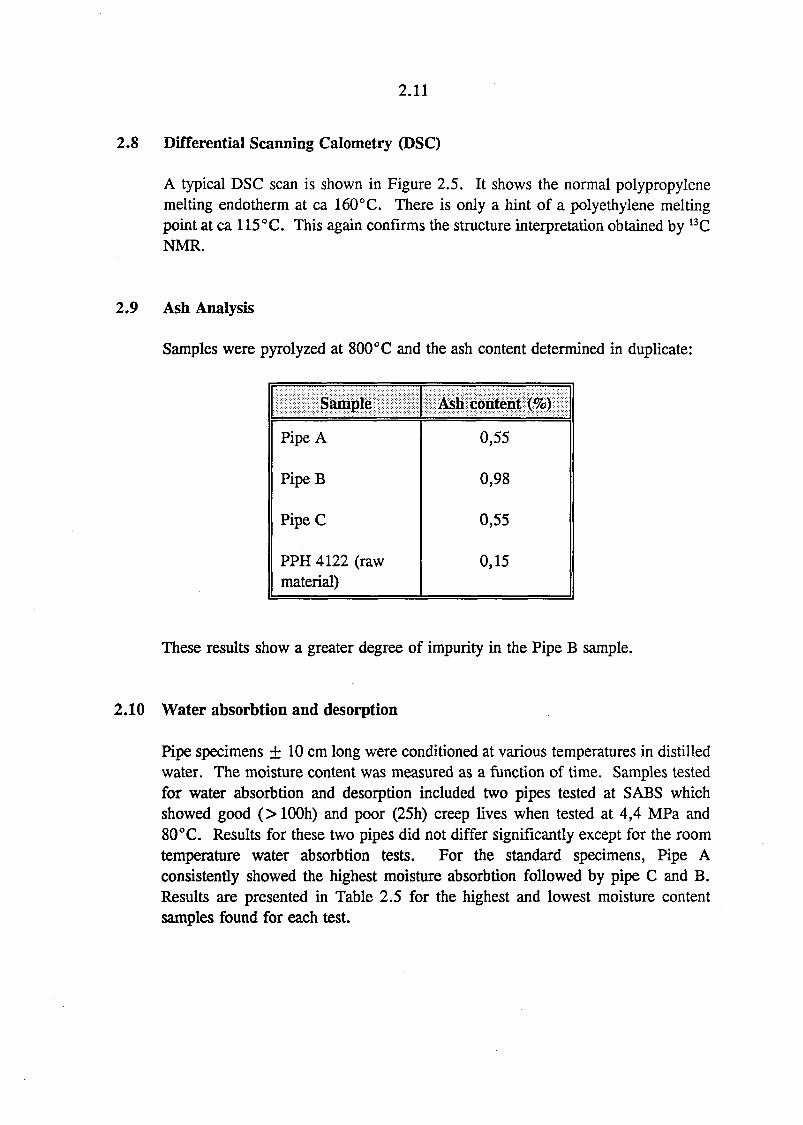
2.9 Ash Analysis
Samples were pyrolyzed at 800°C and the ash content determined in duplicate:
Sample
Pipe A
PipeB
PipeC
PPH 4122 (rawmaterial)
Ash content (%)
0,55
0,98
0,55
0,15
These results show a greater degree of impurity in the Pipe B sample.
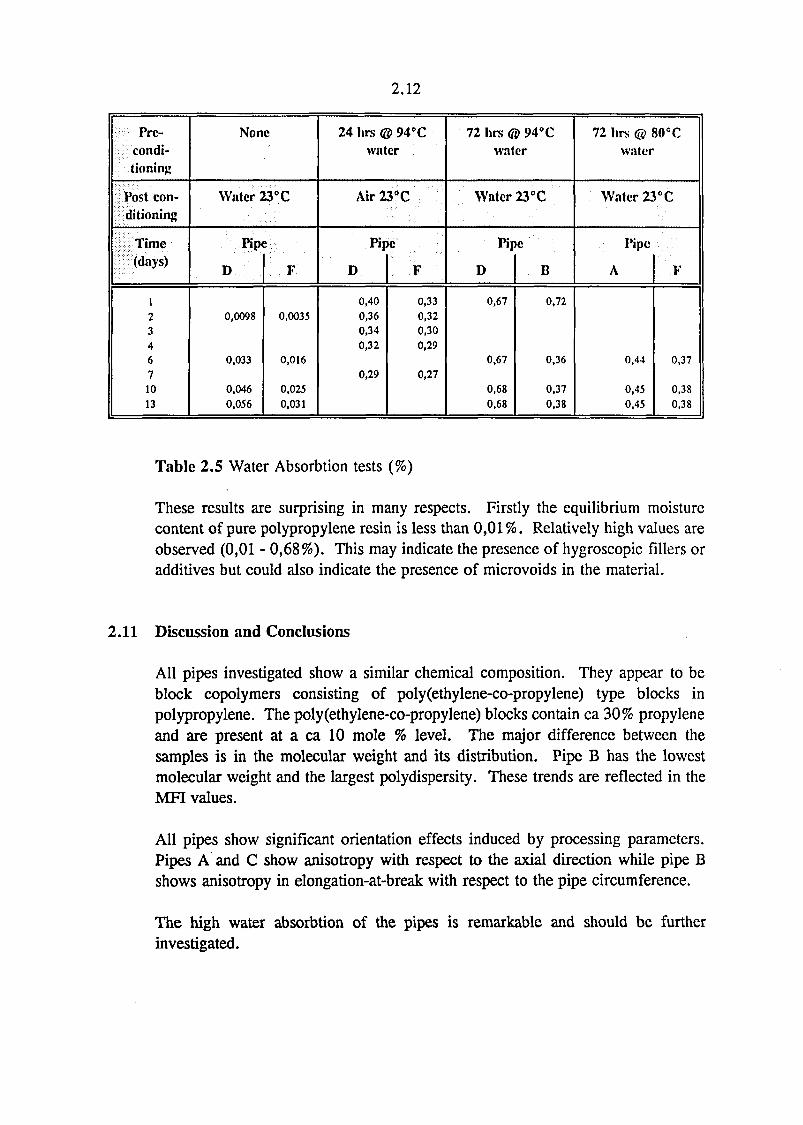
2.10 Water absorbtion and desorption
Pipe specimens ± 10 cm long were conditioned at various temperatures in distilledwater. The moisture content was measured as a function of time. Samples testedfor water absorbtion and desorption included two pipes tested at SABS whichshowed good (> lOOh) and poor (25h) creep lives when tested at 4,4 MPa and80°C. Results for these two pipes did not differ significantly except for the roomtemperature water absorbtion tests. For the standard specimens, Pipe Aconsistently showed the highest moisture absorbtion followed by pipe C and B.Results are presented in Table 2.5 for the highest and lowest moisture contentsamples found for each test.
2.12
Pre-condi-tioning
Post con-ditioning
Time(days)
l234671013
None
Water 23°C
Pipe
D
0,0098
0,033
0,0460,056
: F
0,0035
0,016
0,0250,031
24 hrs @ 94°Cwater
Air23°C
Pipe
D
0,400,360,340,32
0,29
F
0,330,320,300,29
0,27
72 hrs © 94°Cwater
Water 23°C
Pipe
D
0,67
0,67
0,680,68
B
0,72
0,36
0,370,38
72 hrs © iwater
Water 11
Pipe
A
0,44
0,450,45
we
°c
F
0,37
0,380,38
Table 2.5 Water Absorbtion tests (%)
These results are surprising in many respects. Firstly the equilibrium moisturecontent of pure polypropylene resin is less than 0,01 %. Relatively high values areobserved (0,01 - 0,68%). This may indicate the presence of hygroscopic fillers oradditives but could also indicate the presence of microvoids in the material.
2.11 Discussion and Conclusions
All pipes investigated show a similar chemical composition. They appear to beblock copolymers consisting of poly(ethylene-co-propylene) type blocks inpolypropylene. The poly(ethylene-co-propylene) blocks contain ca 30% propyleneand are present at a ca 10 mole % level. The major difference between thesamples is in the molecular weight and its distribution. Pipe B has the lowestmolecular weight and the largest polydispersity. These trends are reflected in theMFI values.
All pipes show significant orientation effects induced by processing parameters.Pipes A and C show anisotropy with respect to the axial direction while pipe Bshows anisotropy in elongation-at-break with respect to the pipe circumference.
The high water absorbtion of the pipes is remarkable and should be furtherinvestigated.
2.13
2.12 References
1. OB Reeksting, Technikon Pretoria Report on: "Investigation:Polypropylene pipes", September 1992.
3.1
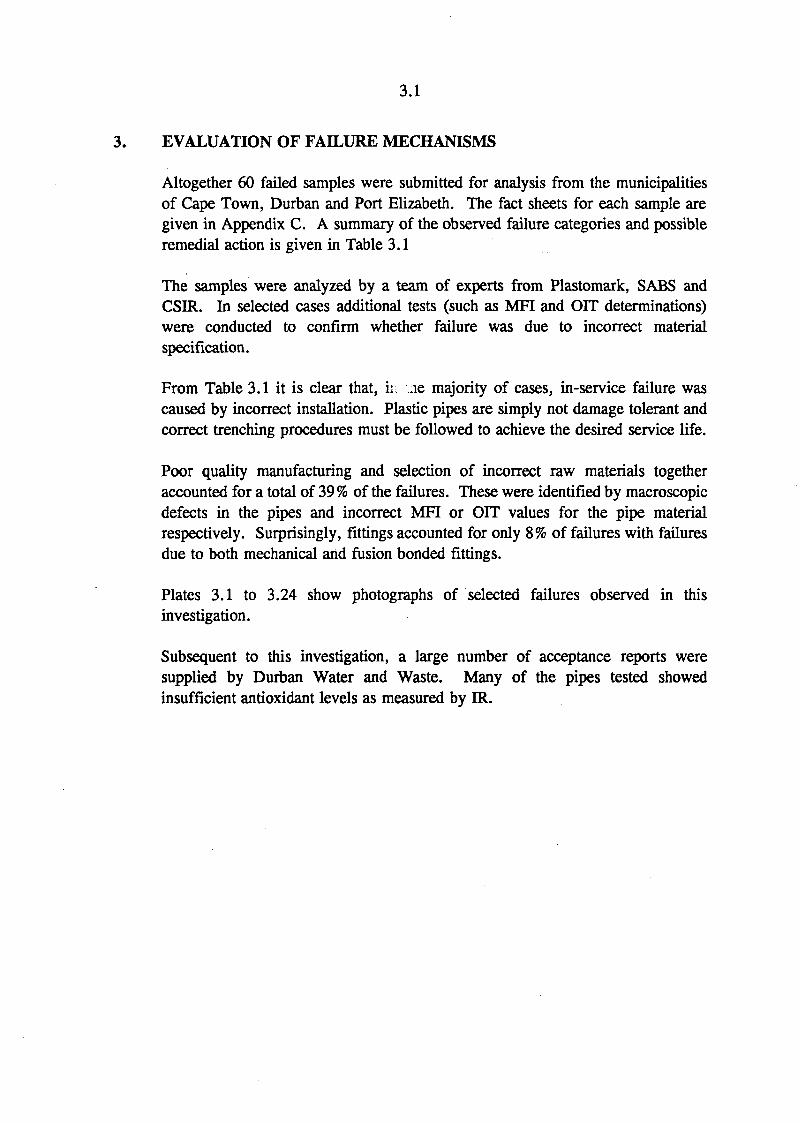
3. EVALUATION OF FAILURE MECHANISMS
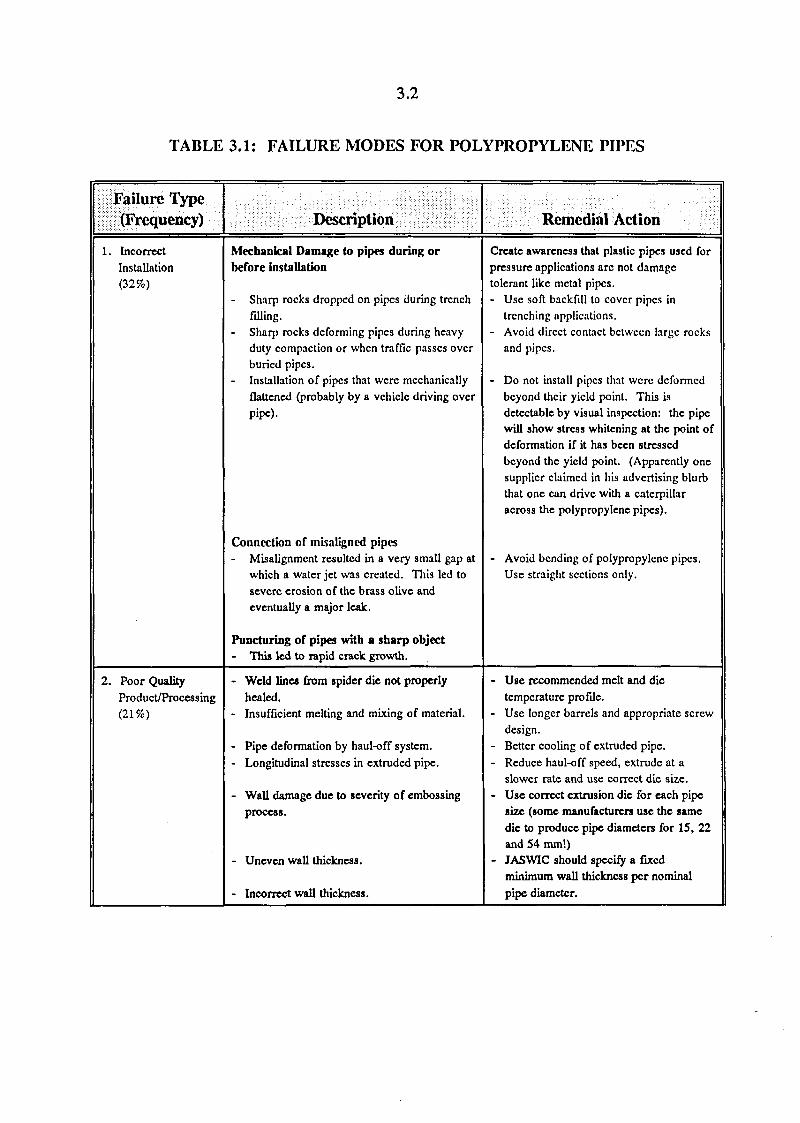
Altogether 60 failed samples were submitted for analysis from the municipalitiesof Cape Town, Durban and Port Elizabeth. The fact sheets for each sample aregiven in Appendix C. A summary of the observed failure categories and possibleremedial action is given in Table 3.1
The samples were analyzed by a team of experts from Plastomark, SABS andCSIR. In selected cases additional tests (such as MFI and OIT determinations)were conducted to confirm whether failure was due to incorrect materialspecification.
From Table 3.1 it is clear that, in ne majority of cases, in-service failure wascaused by incorrect installation. Plastic pipes are simply not damage tolerant andcorrect trenching procedures must be followed to achieve the desired service life.
Poor quality manufacturing and selection of incorrect raw materials togetheraccounted for a total of 39% of the failures. These were identified by macroscopicdefects in the pipes and incorrect MFI or OFT values for the pipe materialrespectively. Surprisingly, fittings accounted for only 8% of failures with failuresdue to both mechanical and fusion bonded fittings.
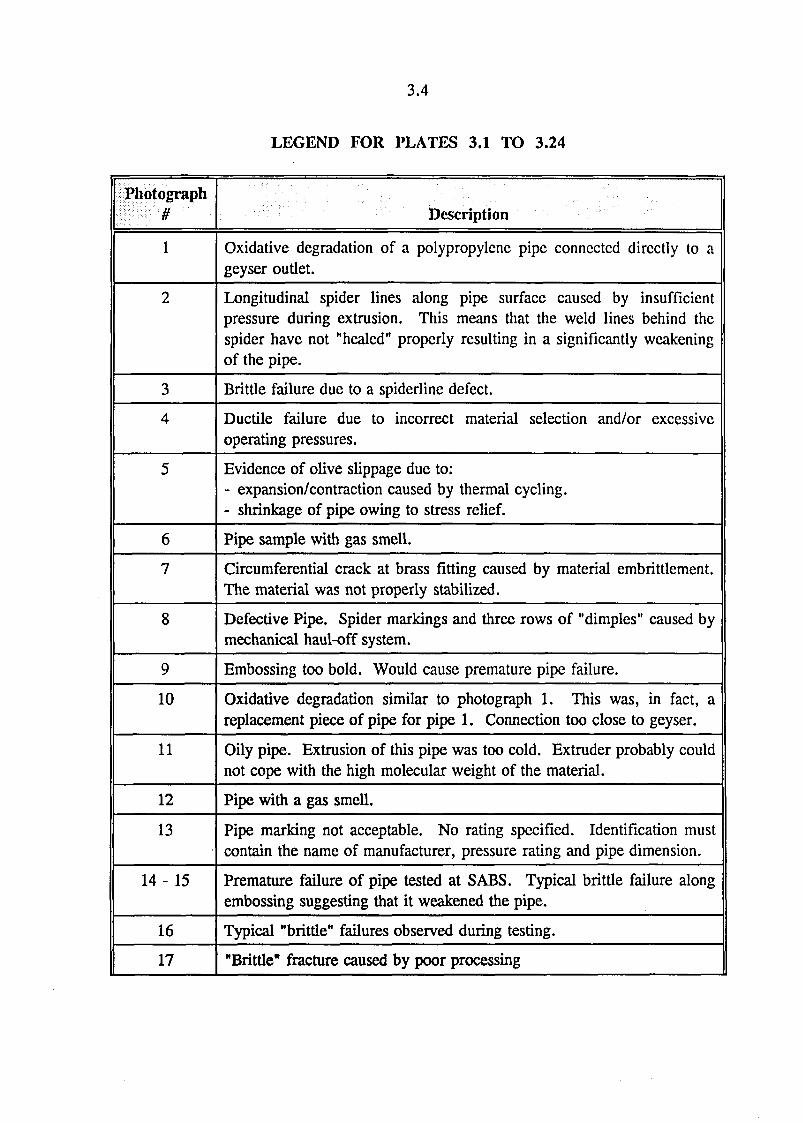
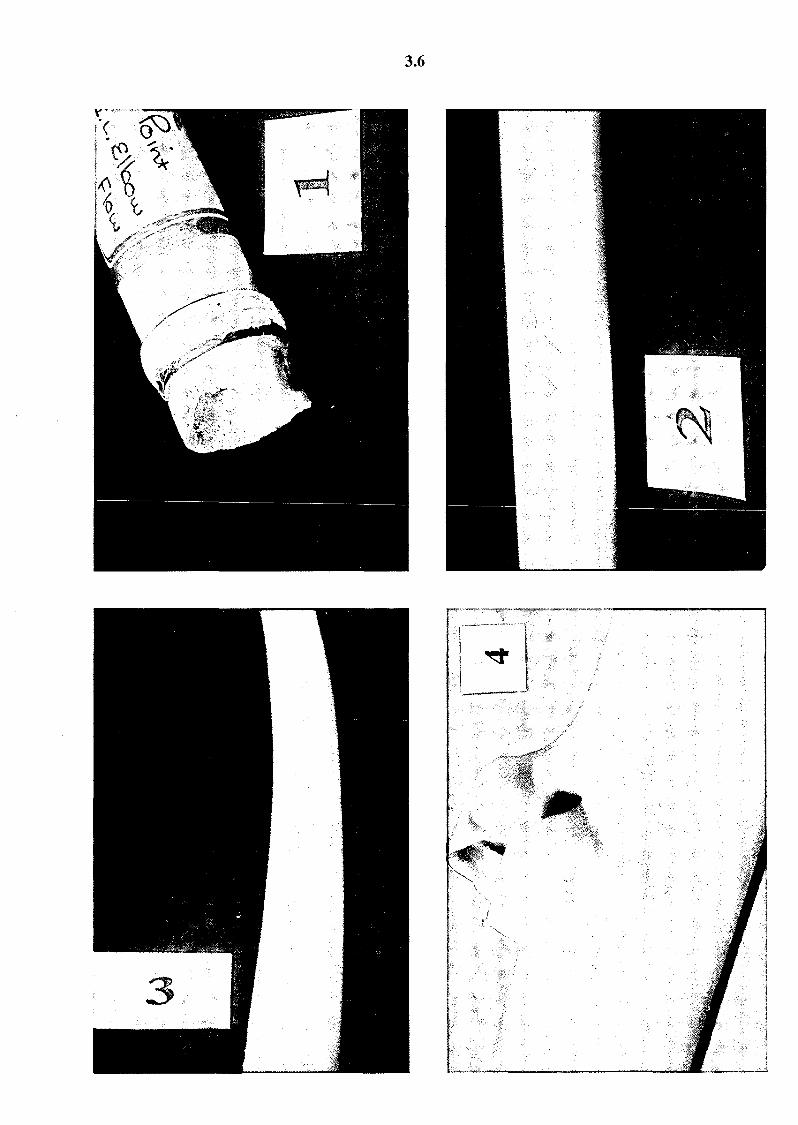
Plates 3.1 to 3.24 show photographs of selected failures observed in thisinvestigation.
Subsequent to this investigation, a large number of acceptance reports weresupplied by Durban Water and Waste. Many of the pipes tested showedinsufficient antioxidant levels as measured by IR.
3.2
TABLE 3.1: FAILURE MODES FOR POLYPROPYLENE PIPES
Failure Type(Frequency)
1. IncorrectInstallation(32%)
2. Poor QualityProduct/Processing(21%)
Description
Mechanical Damage to pipes during orbefore installation
- Sharp rocks dropped on pipes during trenchfilling.Sharp rocks deforming pipes during heavyduty compaction or when traffic passes overburied pipes.
- Installation of pipes that were mechanicallyflattened (probably by a vehicle driving overpipe).
Connection of misaligned pipes- Misalignment resulted in a very small gap at
which a water jet was created. This led tosevere erosion of the brass olive andeventually a major leak.
Puncturing of pipes with a sharp object- This led to rapid crack growth.
- Weld lines from spider die not properlyhealed.
- Insufficient melting and mixing of material.
- Pipe deformation by haul-off system.- Longitudinal stresses in extruded pipe.
- Wall damage due to severity of embossingprocess.
- Uneven wall thickness.
- Incorrect wall thickness.
Remedial Action
Create awareness that plastic pipes used forpressure applications are not damagetolerant like metal pipes.- Use soft backfill to cover pipes in
trenching applications.- Avoid direct contact between large rocks
and pipes.
- Do not install pipes that were deformedbeyond their yield point. This isdetectable by visual inspection: the pipewill show stress whitening at the point ofdeformation if it has been stressedbeyond the yield point. (Apparently onesupplier claimed in his advertising blurbthat one can drive with a caterpillaracross the polypropylene pipes).
- Avoid bending of polypropylene pipes.Use straight sections only.
- Use recommended melt and dietemperature profile.
- Use longer barrels and appropriate screwdesign.
- Better cooling of extruded pipe.- Reduce haul-off speed, extrude at a
slower rate and use correct die size.- Use correct extrusion die for each pipe
size (some manufacturers use the samedie to produce pipe diameters for 15, 22and 54 mm!)
- JASWIC should specify a fixedminimum wall thickness per nominalpipe diameter.
3.3
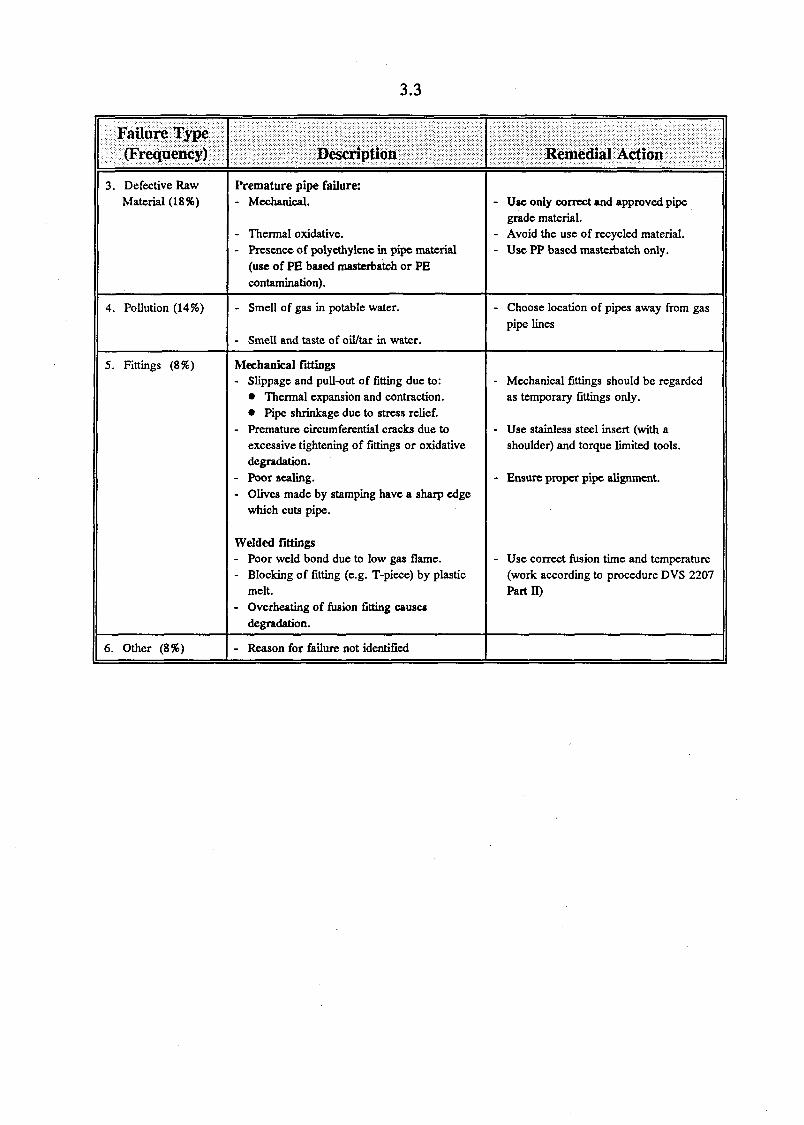
Failure Type(Frequency)
3. Defective RawMaterial (18%)
4. Pollution (14%)
5. Fittings (8%)
6. Other (8%)
Description
Premature pipe failure:- Mechanical.
- Thermal oxidative.- Presence of polyethylene in pipe material
(use of PE based masterbatch or PEcontamination).
- Smell of gas in potable water.
- Smell and taste of oil/tar in water.
Mechanical fittings- Slippage and pull-out of fitting due to:
• Thermal expansion and contraction.* Pipe shrinkage due to stress relief.
- Premature circumferential cracks due toexcessive tightening of fittings or oxidativedegradation.
- Poor sealing.- Olives made by stamping have a sharp edge
which cuts pipe.
Welded fittings- Poor weld bond due to low gas flame.- Blocking of fitting (e.g. T-piece) by plastic
melt.- Overheating of fusion fitting causes
degradation.
- Reason for failure not identified
Remedial Action
- Use only correct and approved pipegrade material.
- Avoid the use of recycled material.- Use PP based masterbatch only.
- Choose location of pipes away from gas
pipe lines
- Mechanical fittings should be regardedas temporary fittings only.
- Use stainless steel insert (with ashoulder) and torque limited tools.
- Ensure proper pipe alignment.
- Use correct fusion time and temperature(work according to procedure DVS 2207Part II)
3.4
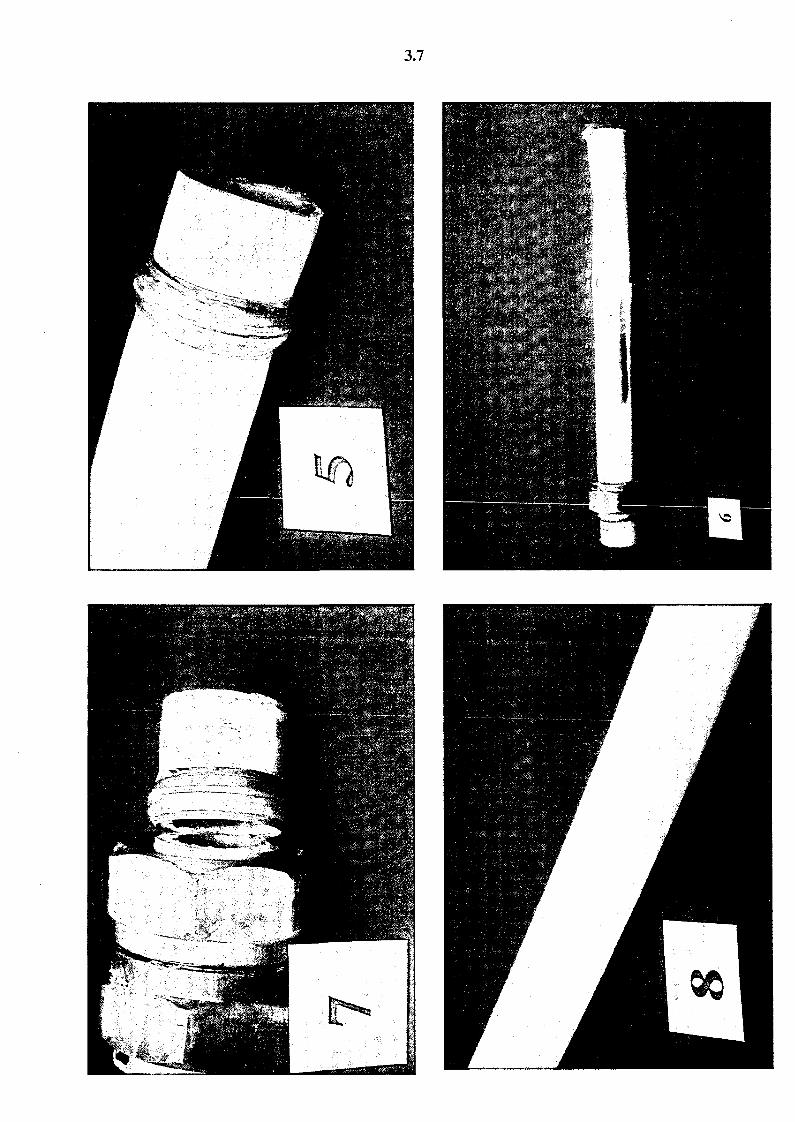
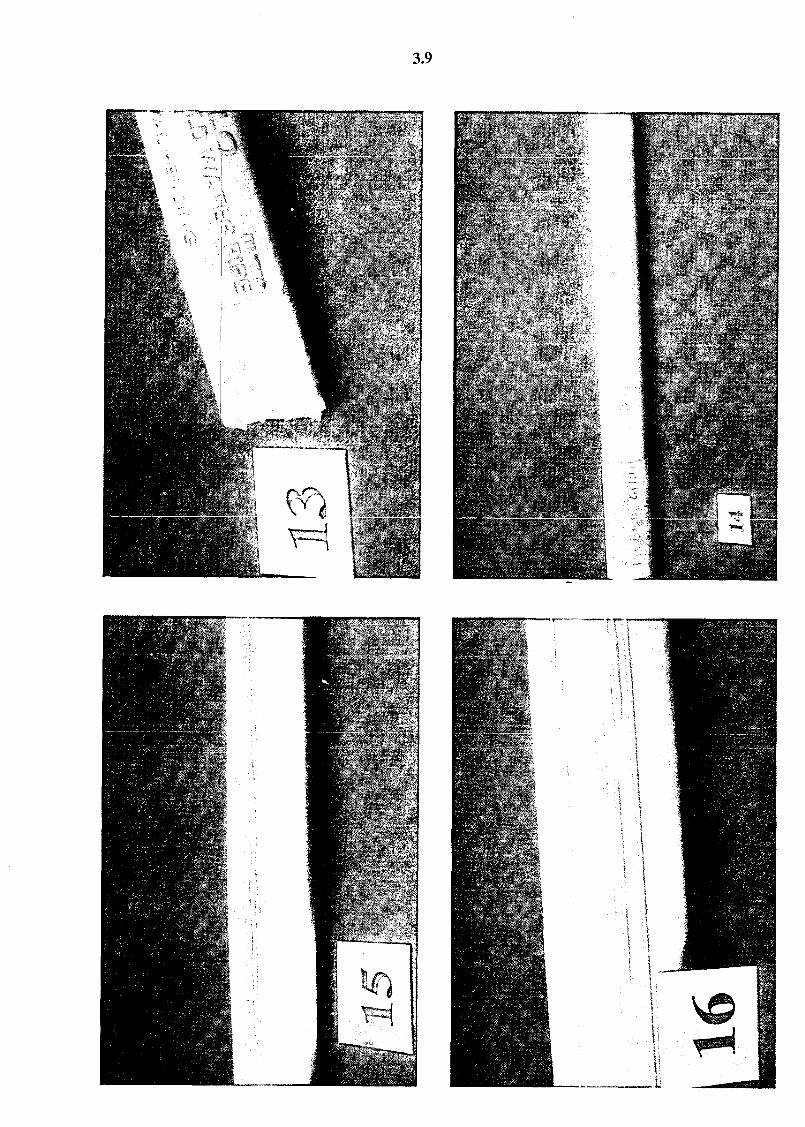
LEGEND FOR PLATES 3.1 TO 3.24
Photograph
i
2
3
4
5
6
7
8
9
10
11
12
13
14- 15
16
17
Description
Oxidative degradation of a polypropylene pipe connected directly to ageyser outlet.
Longitudinal spider lines along pipe surface caused by insufficientpressure during extrusion. This means that the weld lines behind thespider have not "healed" properly resulting in a significantly weakeningof the pipe.
Brittle failure due to a spiderline defect.
Ductile failure due to incorrect material selection and/or excessiveoperating pressures.
Evidence of olive slippage due to:- expansion/contraction caused by thermal cycling.- shrinkage of pipe owing to stress relief.
Pipe sample with gas smell.
Circumferential crack at brass fitting caused by material embrittlement.The material was not properly stabilized.
Defective Pipe. Spider markings and three rows of "dimples" caused bymechanical haul-off system.
Embossing too bold. Would cause premature pipe failure.
Oxidative degradation similar to photograph 1. This was, in fact, areplacement piece of pipe for pipe 1. Connection too close to geyser.
Oily pipe. Extrusion of this pipe was too cold. Extruder probably couldnot cope with the high molecular weight of the material.
Pipe with a gas smell.
Pipe marking not acceptable. No rating specified. Identification mustcontain the name of manufacturer, pressure rating and pipe dimension.
Premature failure of pipe tested at SABS. Typical brittle failure alongembossing suggesting that it weakened the pipe.
Typical "brittle" failures observed during testing.
"Brittle" fracture caused by poor processing
3.5
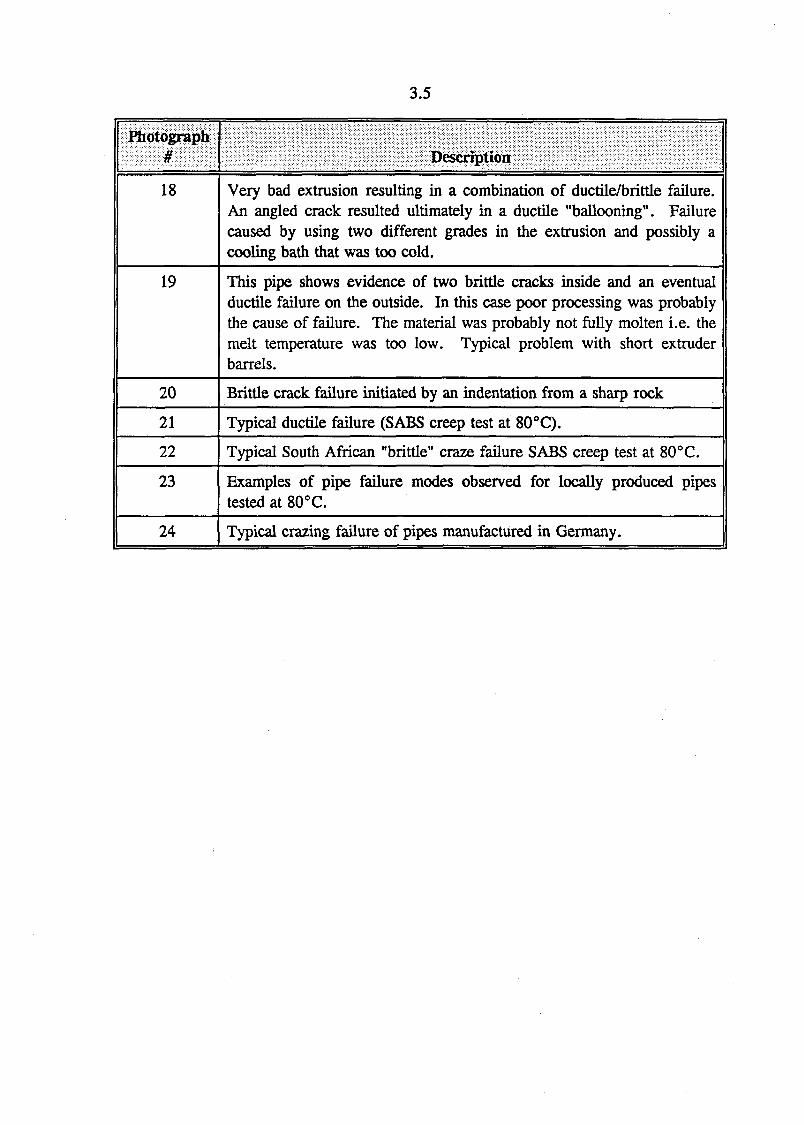
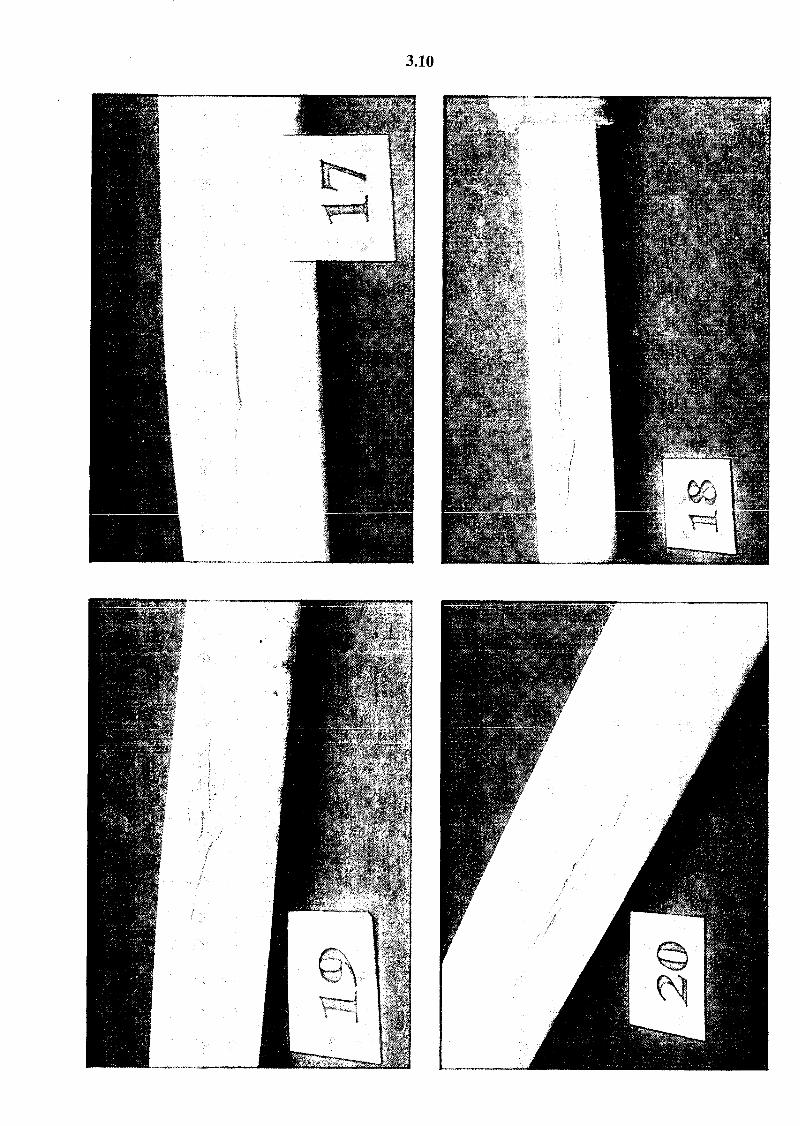
Photograph#
18
19
20
21
22
23
24
Description
Very bad extrusion resulting in a combination of ductile/brittle failure.An angled crack resulted ultimately in a ductile "ballooning". Failurecaused by using two different grades in the extrusion and possibly acooling bath that was too cold.
This pipe shows evidence of two brittle cracks inside and an eventualductile failure on the outside. In this case poor processing was probablythe cause of failure. The material was probably not fully molten i.e. themelt temperature was too low. Typical problem with short extruderbarrels.
Brittle crack failure initiated by an indentation from a sharp rock
Typical ductile failure (SABS creep test at 80°C).
Typical South African "brittle" craze failure SABS creep test at 80°C.
Examples of pipe failure modes observed for locally produced pipestested at 80°C.
Typical crazing failure of pipes manufactured in Germany.
3.6
3.7

3.9
3.10
• * * .
A.'-- , -
BgaT
IBE?*ml
1'.
G-—.
— • .
-
•
\
J
1
y
J J

3.11
4.1
4. THERMAL STABILITY
4.1 Introduction
The service life of polymer products (e.g. plastic pipes) depends on environmentalfactors such as temperature, mechanical stress, exposure to UV radiation etc.Organic polymers are very susceptible to oxidative degradation by molecular oxygeneven at ambient temperatures. The degradation process is slowed down by theaddition of catalytic amounts (0,1 to 0,5%) of antioxidants and other stabilizers[1 - 3].
4.2 The Mechanism of Oxidative Degradation
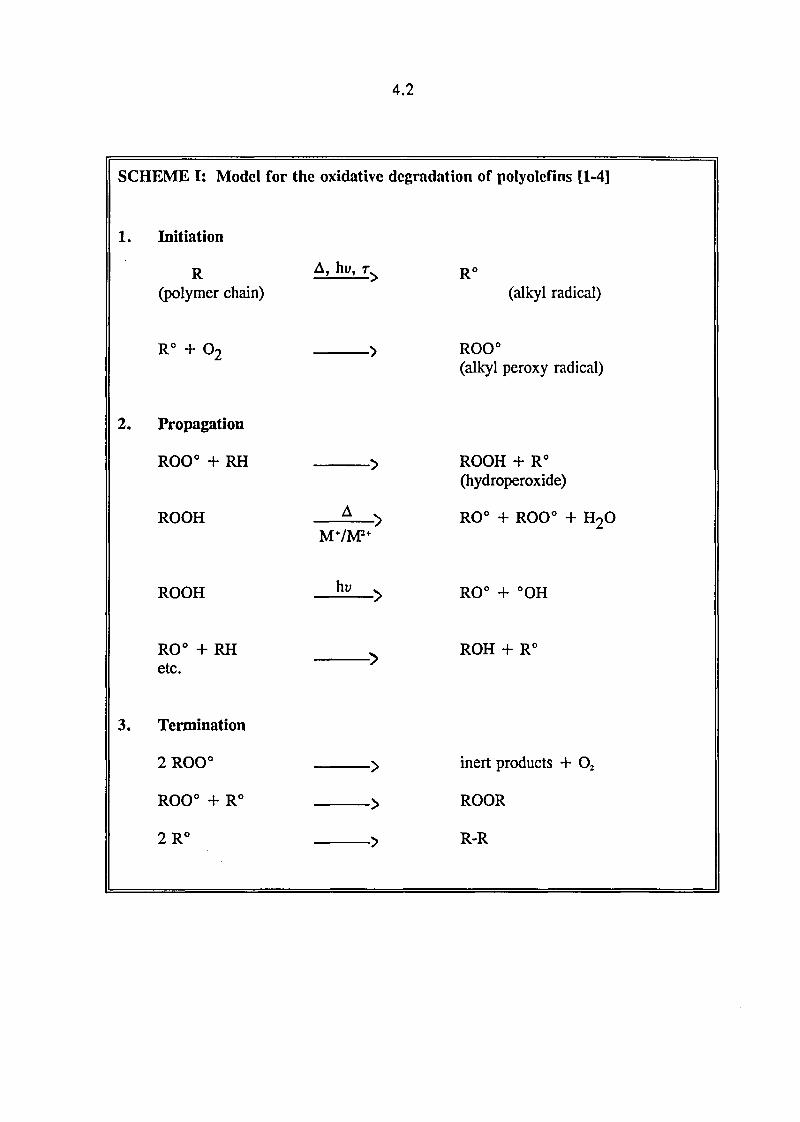
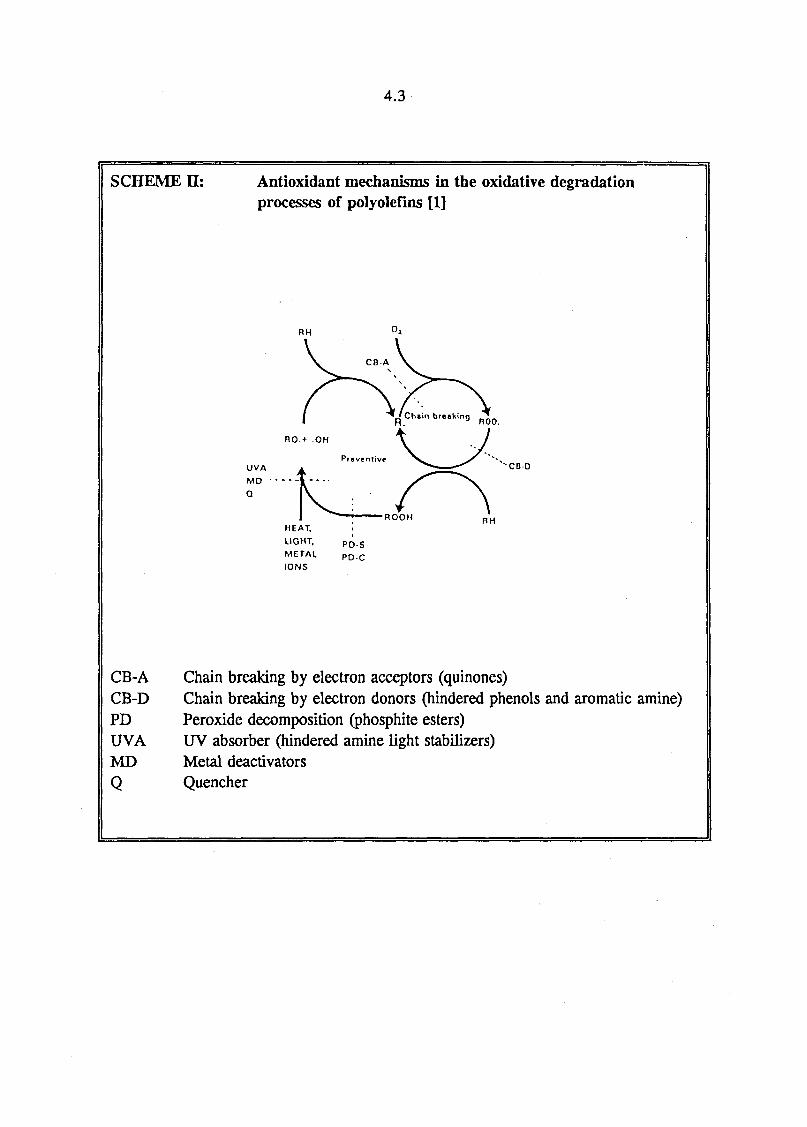
An understanding of the mechanism of degradation helps to clarify the role ofantioxidants. Plastics degradation usually starts with the formation of free radicalson exposure to heat, UV radiation or mechanical shear. Free radicals have a highaffinity for oxygen and react to form unstable peroxy radicals. These in turn formunstable hydroperoxides by hydrogen abstraction from nearby chains [1-4]. Thisprocess regenerates a new alkyl radical. At the same time, further free radicalspecies are formed by the decomposition of the hydroperoxides (by heat, shearstresses or UV light etc.). This reaction is often catalysed by impurities such asmetal ions or catalyst residues. This leads to a cyclic process resulting in an everincreasing number of reactive free radical species i.e. an autocatalytic degradationprocess. The cycle can only be broken when inert products are formed from theradical species. The chemical reactions involved in the auto-oxidative degradationcycle process are summarized in Scheme I. The cyclic nature of the process andpossible mechanisms for stabilization are given in Scheme II.
4.2
SCHEME I: Model for
1. Initiation
R(polymer chain)
R° + O2
2. Propagation
ROO° + RH
ROOH
ROOH
RO° + R Hetc.
3. Termination
2ROO°
ROO° + R°
2R°
the oxidative
A, hv, T\
\
hv v
Ns
N
degradation of polyolefins [1-4]
R°(alkyl radical)
ROO°(alkyl peroxy radical)
ROOH + R°(hydroperoxide)
RO° + ROO° + H2O
RO° + °OH
ROH + R°
inert products + O2
ROOR
R-R
4.3
SCHEME H: Antioxidant mechanisms in the oxidative degradationprocesses of polyolefins [1]
R00.
HEAT,LIGHT. p o . s
METAL P D C
IONS
"CBD
RH
CB-A Chain breaking by electron acceptors (quinones)CB-D Chain breaking by electron donors (hindered phenols and aromatic amine)PD Peroxide decomposition (phosphite esters)UVA UV absorber (hindered amine light stabilizers)MD Metal deactivatorsQ Quencher
4.4
4.3 The Stabilization Mechanism of Antioxidants
In the technical literature antioxidants are classified as primary antioxidants andsecondary antioxidants [2], Primary antioxidants interrupt the oxidation cycle byscavenging the free radicals while secondary antioxidants or synergists reduce thehydroperoxides into inert products (see Scheme III). More scientific classificationsare based on the auto-oxidative degradation cycle and the mechanism whereby thiscycle is broken [1].
The effectiveness of antioxidants depends on additive volatility, solubility,diffusivity, polymer morphology, orientation and the surface-to-volume ratio of theproduct. The efficiency of stabilizer systems should therefore be evaluated underpractical conditions wherever possible. For example, oxidative inductionexperiments may indicate a high intrinsic activity of an antioxidant system but thesetests are conducted with the polymer in a molten state with complete antioxidantsolubility and limited loss to the environment. In a practical application antioxidantsmay be lost through: (a) "blooming" (where the additives migrate to the surface);(b) volatilization due to low solubility of the antioxidant in the solid state; or (c)loss due to harsh environments such as exposure to solvents or hot water. Loss ofantioxidants may have a detrimental effect on service life [1]. Also, antioxidantstend to be present in the amorphous regions only as they are excluded from thecrystallites.
In practice there is usually a dual need for protection against oxidative degradation.During processing the polymer chains are exposed to high temperatures and shearstresses but usually for relatively short periods only. In these situations free radicalsare formed via mechanically induced bond scission and the issue of antioxidant lossand solubility are not that important. In end-use applications, temperatures aremuch lower but UV exposure is possible and long service life is required.

4.5
SCHEME HI: Antioxidant mechanisms [2-4]
1. Inhibition of the Propagation Reaction of ROO°
ROO° + AH :> ROOH + A°
Examples of AH include hindered phenols and secondary arylamines. They actas primary antioxidants by donating their reactive hydrogen to the peroxyradicals. In turn a highly stabilized free radical is formed through electrondelocalization (resonance) and steric hinderance.
2. Suppression of the Regeneration of ROOH
ROO° + S > RO° + SO
Synergists reduce ROO° to RO°.
3. Decomposition of ROOH by Non-Radical Processes
ROOH + A > ROH + AO
Phosphites, amines and thioesters decompose hydroperoxides by two electronredox processes or via catalytic pathways.
4. Metal Deactivators
R O O H + M*+ > R O ° + M (n+1)+ + H O
R O O H + M (n+1)+ >> R O O ° + M 1 + + H +
Chelating agents reduce the catalytic activity of metal ions such as copper ions.
4.4 Oxidative Degradation of Polypropylene
Polypropylene is thermally stable up to approximately 230 °C in the absence ofoxygen. In the range 230 °C to 300 °C the molecular weight decreases via arandom chain scission process. Degradation rates are strongly affected by residualpolymerization catalysts and hydroperoxides formed during storage. Above 300 °Cvolatilization commences and rapidly increases with temperature.

4.6
In general polypropylene is more susceptible to oxidative degradation than otherpolyolefins such as polycthylcncs or polybutylenc. This is a direct result of thechain microstructure of this polymer. The hydrogen on the tertiary chain carbonsis more labile and therefore easier to abstract by radical attack. In addition,abstraction generally leads to chain scission as shown in Scheme IV. This leads toa rapid decrease in molecular weight and a concomitant loss of mechanical propertiessuch as tensile strength.
Stabilization of polypropylene is commonly achieved using high molecular weightphenolics in combination with a phosphite or thioesters at concentrations of0 , 1 - 1%.
SCHEME IV: Chain Scission in Polypropylene [1]
CH3 CH3
-cucn2cncii2-CII;
0 2 ciccss O2 deficiency
CH:
CII2=C-CH2-
on
OOH
(d)
cn, en,-cncn2c-cn2-
0
cn3 cn3
-cncn2c-o * cn2-
Life expectations may necessitate the use of less volatile antioxidants and UVstabilizers featuring better compatibility with the polymer matrix.
As already indicated, polypropylene suffers oxidative degradation in the presence ofoxygen especially at high temperatures [5-7]. Characteristic of this process is atemperature dependent induction period during which the mechanical properties ofthe material remain virtually unchanged. At the end of this oxidative induction time(OIT) a sharp deterioration of mechanical properties sets in.
4.7
The OIT may be taken as a measure of the effective service life at the representativetemperature. The oxidative degradation of poly(l-butene) and cross-linkedpolyethylene pipe extrusion compounds were studied by Kramer [8-11]. Steiner andKoppelman [12] also investigated the thermal degradation of polypropylene at 90 °C.At the OIT, a strong correlation was found in rapid changes of the followingphysical properties:
Carbonyl absorbtion in the infra-red spectrum;- dielectric loss factor (tan5);
tensile strength and elongation-at-break; and- oxidative induction time (OIT) measured by DTA.
While, ideally, the oxidative stability of polypropylene pipes should be measured insitu, i.e. in the actual end use application, this is not practical in view of the longservice life (>20 years) required. The degradation processes in the solid state aredifficult to measure and the kinetics complex. This makes it very difficult toestimate service life from accelerated tests as extrapolations may be unreliable [12].
Steiner [11] has shown that, for polybutylene pipes, pipe failures at 110 °C, lowhoop stresses and long testing times were exclusively caused by oxidativedegradation due, in the greater part, to leaching of stabilizer by the hot water.Broutman [13] has found that surface embrittlement, due to oxidative degradation,was sufficient to shorten expected service life of polyethylene pipes significantly viabrittle failure. Removal of less than 0,03 mm of the pipe surface restored ductilebehaviour. It was concluded that surface embrittlement may aid premature crackinitiation at relatively low stresses.
4.5 Characterization of Oxidative Degradation
The oxidative degradation of polypropylene can be followed by a wide variety oftechniques including:
- Oven ageing [5,12,14,15,37]Thin samples are aged in recirculating ovens at a pre-set temperature. Theeffectiveness of residual antioxidants is determined periodically using DSC orDTA. Alternatively the time to mechanical embrittlement is taken as the OIT.
- Oxygen uptake [5,16,17]The oxygen uptake of polymer samples at a given temperature is followed as afunction of time. It was found that the OIT corresponds to an oxygen uptake ofless than 10 cnr/g of polymer.
4.8
Differential thermal analysis (DTA) and differential scanning calorimetry(DSC) [8,12,18,25]These techniques are commonly used owing to their convenience and ease ofautomation. Both modes of analysis can use either isothermal or temperaturescanning techniques. These techniques report the induction time (temperature)to an autocatalytic degradation exotherm.
Thermogravimetric analysis (TGA) [20,26]Both isothermal and temperature scan procedures are used to determine aninduction time (temperature). The induction time is usually indicated by a rapidloss of sample mass but this is often preceded by a weight gain due to oxygenuptake.
Pyrolysis [27-31]Volatilization of the polymer occurs beyond the oxidative induction time (OIT)and this can be detected by mass spectrometry, infra-red spectroscopy or evena thermal conductivity detector.
Decrease in molecular mass [8,25,32]The molecular mass of polypropylene decreases rapidly during oxidativedegradation via a variety of chain scission mechanisms. This decrease inmolecular weight can be followed by gel permeation chromatography (GPC),viscosity (e.g. MFI measurements) decrease in glass transition temperature (Tg),etc.
4.6 Estimation of Service Life
The specified service life of polypropylene pipes is typically in the order of yearsto several decades. This implies that oxidative degradation must proceedexceedingly slowly at service temperatures. However, there is a need to estimateexpected service life from measurements conducted within reasonable time. Thisusually necessitates experiments at elevated temperatures, often at temperaturesabove the melting point of the polymer [16].
Oxidative induction times (OIT's) measured over a range of temperatures often obeyArrhenius kinetics [16]. This means that a plot of log (OIT) versus the reciprocalabsolute temperature obtains a straight line with slope proportional to the activationenergy. In some studies no change in slope is observed when traversing the meltingrange e.g. for polyethylene [16,26] and in polypropylene [17]. However, in otherinvestigations a change in slope is observed, e.g. for polybutylene [9], or the datashows two regimes separated roughly by the melting point, e.g. for polypropylene[12,14]. It is therefore clear that extrapolation of results obtained at hightemperatures may be misleading if interpreted in terms of oxidative stability undernormal conditions [5]. The following factors each play a role in this regard:
4.9
- In the solid state the polymer assumes a semi-crystalline morphology. It isusually assumed that oxygen and stabilizers are constrained to amorphousregions.
Solubility and diffusivity of oxygen is strongly influenced by the degree ofcrystallinity and the morphology of crystallites.
- Sample thickness plays a role: the oxidation rate becomes diffusion controlledfor thicker samples [24,31,33,34]. It has been stated [35] that sample thicknessshould be less than 120 /zm in DSC or DTA studies to ensure kinetic control ofdegradation.
Orientation (and therefore built-in stresses) may affect oxidative stability.Surprisingly it has been found that oriented material shows an improvedoxidative induction time and maintains a greater proportion of mechanicalproperties at comparable degrees of degradation [32],
Some synergistic stabilizers are only effective at higher temperatures (e.g. thoseexperienced during processing or testing) and do not contribute to stabilizationat service temperatures [36].
Volatilization of stabilizers at elevated temperatures and leaching or bloomingof antioxidants at services temperatures may also impact estimated and actualservice life times [6,11].
Degradation by mechanical stress during processing results in reduced OIT'scompared to virgin material [19]. This has obvious significance for the use ofre-grind material.
While accelerated tests such as those described above usually employ testing atelevated temperature, it is also possible to increase the rate of degradation throughthe use of high oxygen pressures [33]. While this could represent a useful qualitycontrol technique, it is difficult to see how this technique could be used in apredictive mode in view of the complex dependence of reaction kinetics on oxygenconcentration and the complications of diffusion and solubility limitations.
The residual life of oven aged samples can also be assessed using mechanical testing.In this regard it should be noted that tensile strength does not provide a suitablecriterion [7]. However, elongation-at-break does provide a useful indication ofthe state of ageing. Here it should be mentioned that Underwriters Laboratoryregards failure to have occurred when physical property values have dropped below50% of their initial value.
4.10
4.7 Theoretical Model for Antioxidant Consumption
In this approximate analysis we make the following simplifying assumptions:
Reaction rate controlled - no diffusional limitations.
Stabilization is essentially due to the level of antioxidant present.
Antioxidant is consumed during the inhibition reactions.
- The induction time corresponds to the point where complete depletion of theantioxidant has occurred.
- The consumption of antioxidant is dominated by a rate limiting step with anassociated Arrhenius temperature dependence.
- Temperature and concentration effects are separable and the antioxidantconcentration effect can be modelled in terms of n"1 order reaction kinetics.
Concentration refers to an effective lumped concentration of all antioxidantspresent.
In terms of this model:
kBERf(c)c
dcdt
===
—
where k = is the pre-exponential factor,E/R is the activation temperature withthe activation energy andthe gas constant while the functioncn represents the rate dependence onthe concentration of antioxidant.
From equation (1) one obtains the integral:
{ f®
(2)
k
4.11
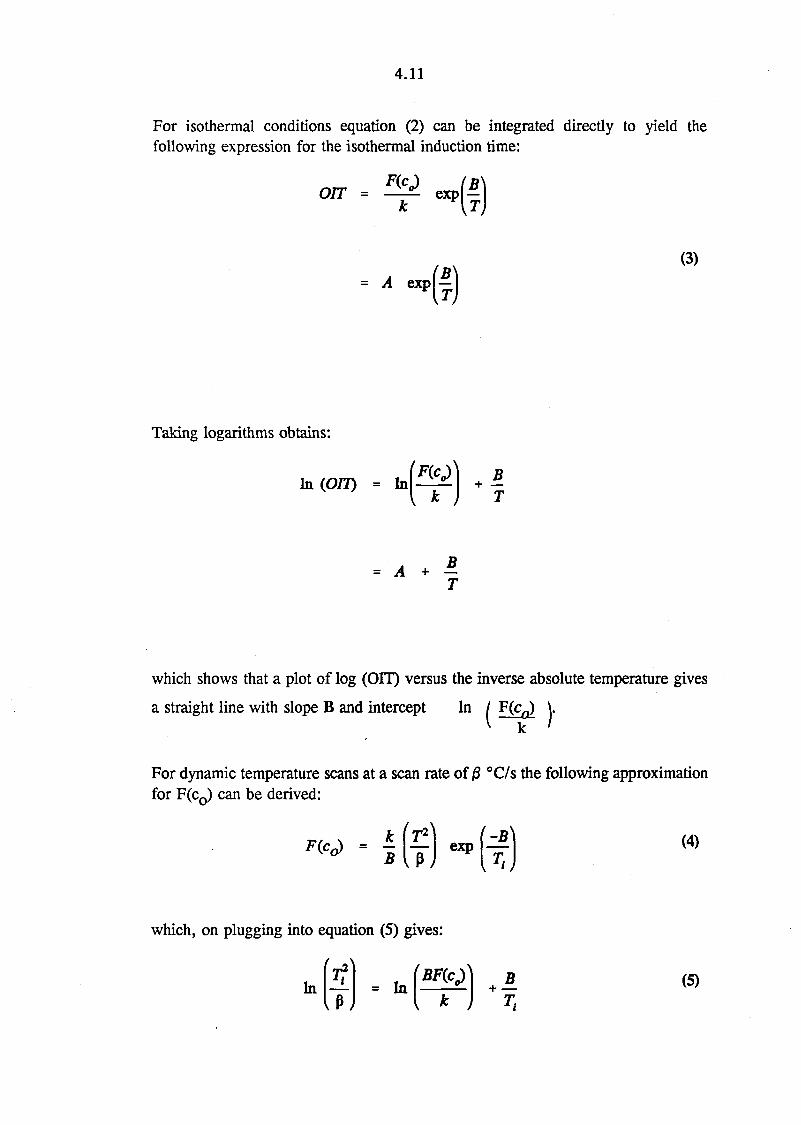
For isothermal conditions equation (2) can be integrated directly to yield thefollowing expression for the isothermal induction time:
orr -
(3)
«P f)(?)
Taking logarithms obtains:
- A + *T
which shows that a plot of log (OIT) versus the inverse absolute temperature gives
a straight line with slope B and intercept In / F(cp) \.k '
For dynamic temperature scans at a scan rate of /S °C/s the following approximationfor F(c0) can be derived:
i(?Mf)which, on plugging into equation (5) gives:
4.12
This shows that a plot of In [ Tf/&\ versus the inverse of the induction tempera-
ture should give a straight line with slope B and intercept In (
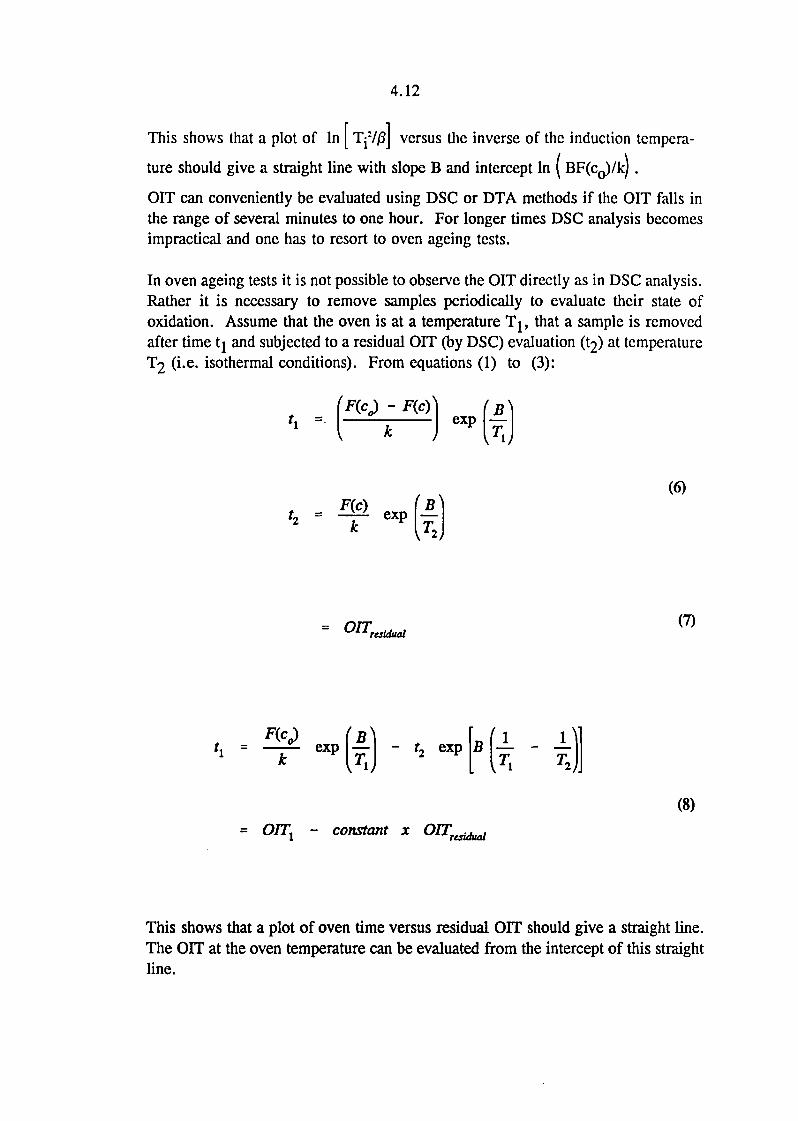
OIT can conveniently be evaluated using DSC or DTA methods if the OIT falls inthe range of several minutes to one hour. For longer times DSC analysis becomesimpractical and one has to resort to oven ageing tests.
In oven ageing tests it is not possible to observe the OIT directly as in DSC analysis.Rather it is necessary to remove samples periodically to evaluate their state ofoxidation. Assume that the oven is at a temperature Tj, that a sample is removedafter time tj and subjected to a residual OIT (by DSC) evaluation (t2) at temperatureT2 (i.e. isothermal conditions). From equations (1) to (3):
(6)
(7)
(8)
= Orrx - constant x OITresUbial
This shows that a plot of oven time versus residual OFT should give a straight line.The OIT at the oven temperature can be evaluated from the intercept of this straightline.
4.13
4.8 Experimental
Three different locally manufactured pipes were evaluated for oxidative stability.Small samples were ground to a fine powder using a laboratory mill. Thin (0,2 mm)shavings were also machined off the end of the pipes. For control purposes thinfilms of the raw material containing different antioxidant levels were prepared by theraw materials supplier using a laboratory film blowing machine.
The oxidative stability of the different pipe samples were measured as follows:
- High temperatures (>180 °C) The OIT was measured in an oxygenatmosphere using DSC and TGA techniques. Both dynamic scanning andisothermal runs were conducted.
- Low temperatures (150 °C - 90 °C) Samples were oven aged in air and thestage of ageing assessed using tensile tests with elongation-at-break being usedas the failure criterion (50% of initial elongation at break). A set of experimentswere also conducted using shavings aged in boiling water to determine the effectof antioxidant leaching.
4.9 Results
4.9.1 High Temperature Results
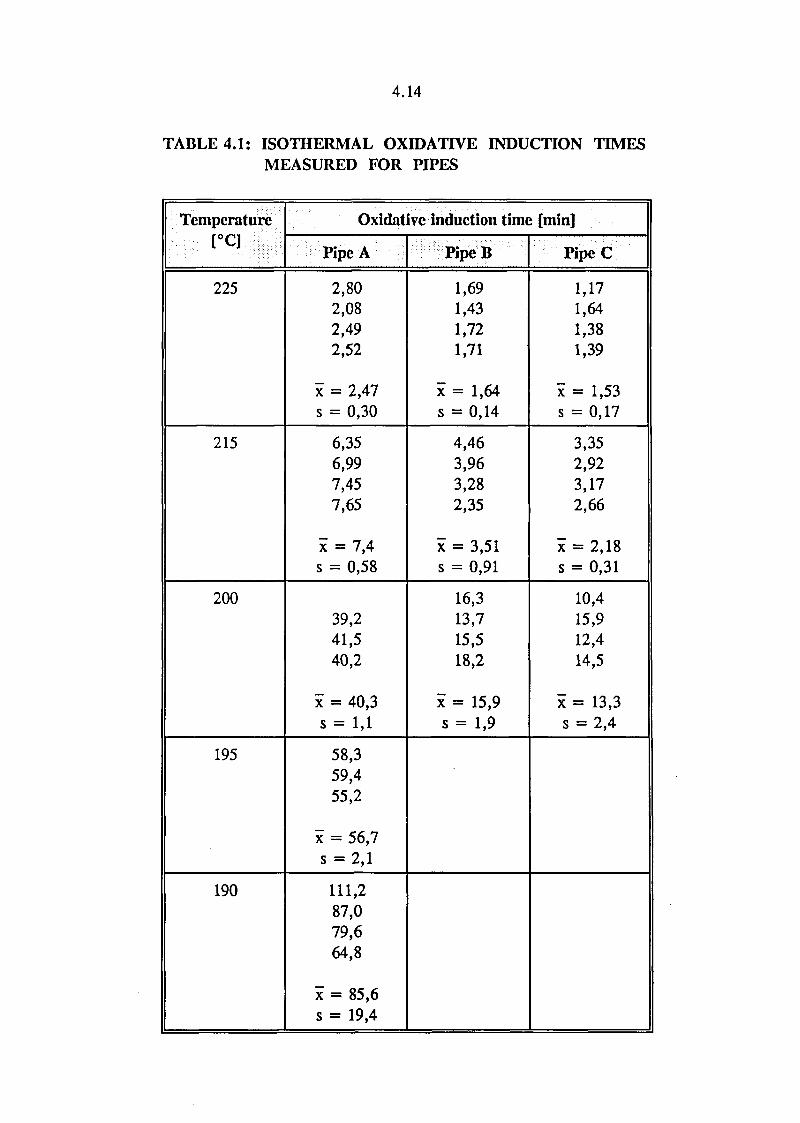
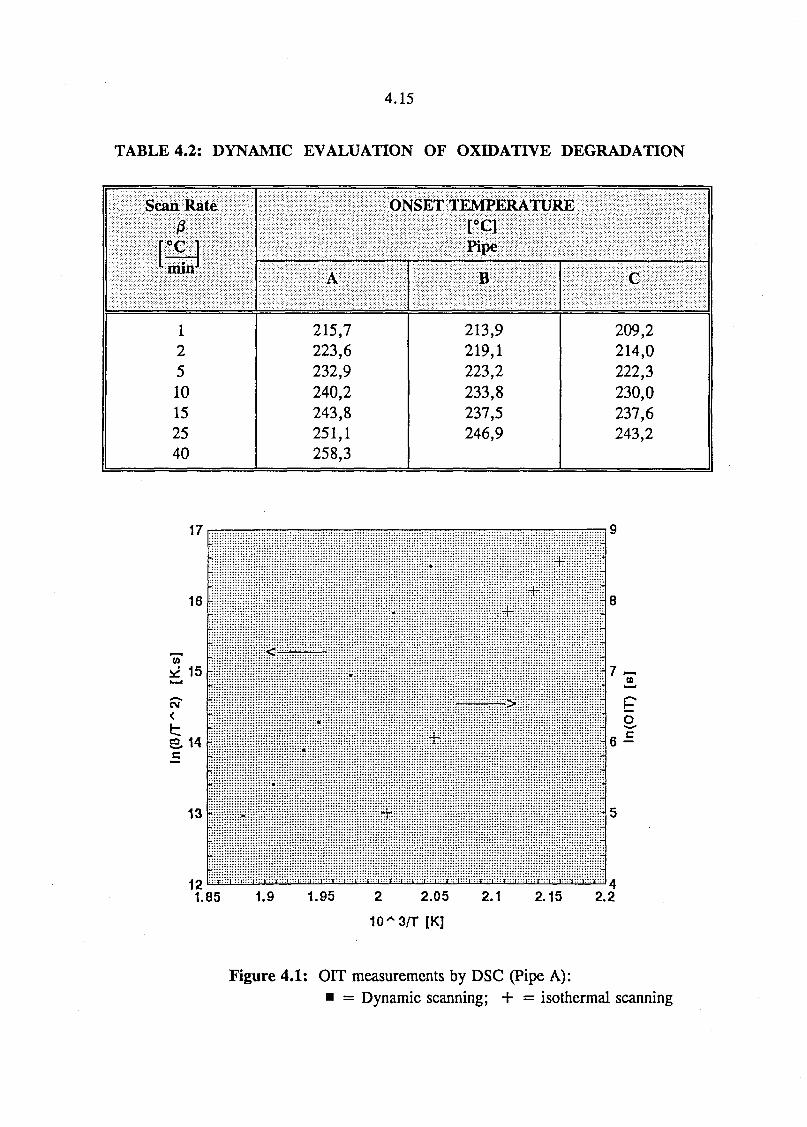
The isothermal oxidative induction times for the three pipes were measuredbetween 190 and 225 °C in oxygen. The results are shown in Table 4.1.Reproducibility decreased with decreasing temperature. The standarddeviation for four determinations varied between ca. 8-15%. The oxidativeinduction temperature was also evaluated dynamically. The results for scanrates between 1 and 40 °C/min are shown in Table 4.2.
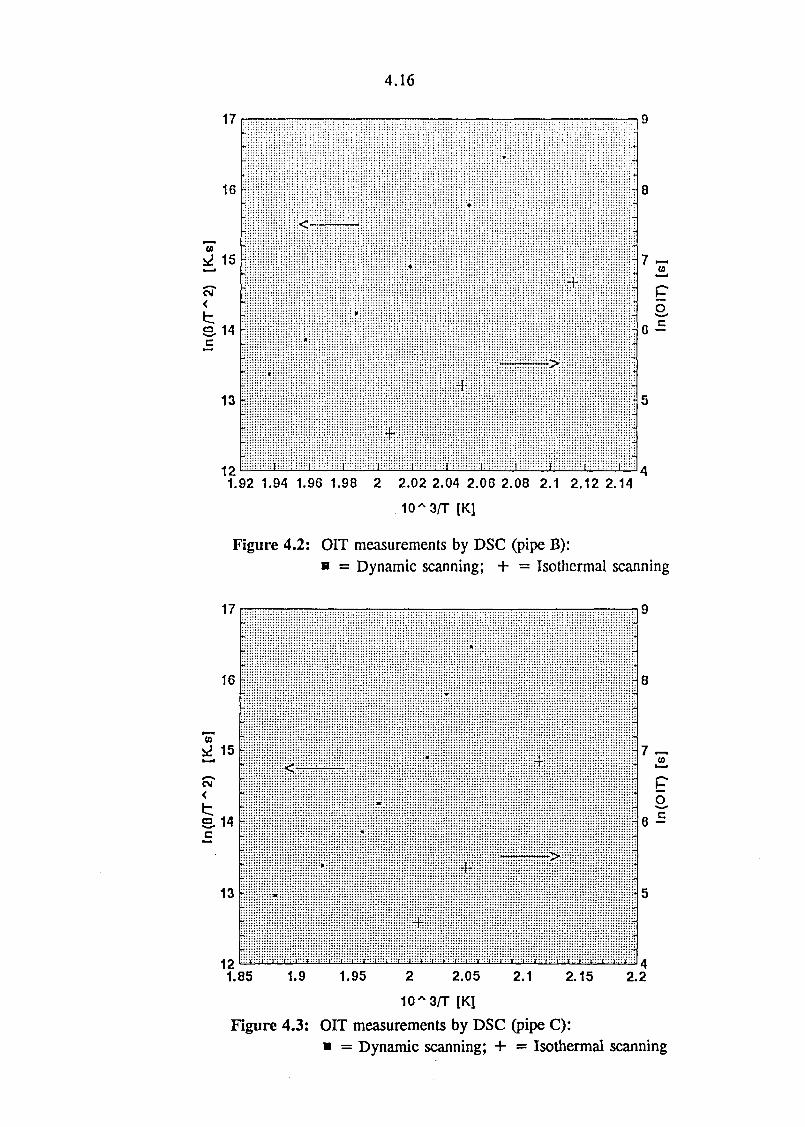
For both isothermal and dynamic evaluations it was found that the results forthe pipes B and pipes C showed considerably more scatter than those of pipesA. This is evident in Figures 4.1 to 4.3 in which the data is plottedaccording to equations (3) and (4). The larger scatter is attributed to theinhomogeneity of the pipe material (this was visually observable). Withinexperimental error, the slopes of the isothermal and dynamic curves wereidentical as predicted by equations (3) and (5). In a sense, the dynamic dataprovides estimates for OIT at higher temperatures than practically possibleby the isothermal technique.
4.14
TABLE 4.1: ISOTHERMAL OXIDATTVE INDUCTION TIMESMEASURED FOR PIPES
Temperaturera225
215
200
195
190
Oxidative induction time [min]
Pipe A
2,802,082,492,52
x = 2,47s = 0,30
6,356,997,457,65
x = 7,4s = 0,58
39,241,540,2
x = 40,3s = 1,1
58,359,455,2
x = 56,7s = 2,1
111,287,079,664,8
x = 85,6s = 19,4
PipeB
1,691,431,721,71
x = 1,64s = 0,14
4,463,963,282,35
x = 3,51s = 0,91
16,313,715,518,2
x = 15,9s = 1,9
Pipe C
1,171,641,381,39
x = 1,53s = 0,17
3,352,923,172,66
x = 2,18s = 0,31
10,415,912,414,5
x = 13,3s = 2,4
4.15
TABLE 4.2: DYNAMIC EVALUATION OF OXIDATTVE DEGRADATION
Scan Rate9
•̂ min3
12510152540
ONSET TEMPERATUREraPipe
A
215,7223,6232,9240,2243,8251,1258,3
B
213,9219,1223,2233,8237,5246,9
C
209,2214,0222,3230,0237,6243,2
17
16
CO15
CM
e. 14c
13
a:Tr:i:::i::::c:::i:::i:::i:::i::::i:::i:"i:::r::<::::i:::i:::j:::i:::i!:::t:::i:::r:::t:::i:::i:::r":Ti::i:::i:::iT:ii::-i::"i:::i:::i:
m
7 ~
^2 ^1.85 1.9 1.95 2 2.05 2.1 2.15 2.2
[K]
Figure 4.1: OIT measurements by DSC (Pipe A):• = Dynamic scanning; + = isothermal scanning
4.16
17
16 jj
15
<
a 14c
13
12
• • • ; : : ; • ; ; : ; : ; ; • * ; • • • ; • • ; : : : : ;
H :','.'.'.'.'.'.'.'. y.',',', ','•'•'.'.',',',','. y.',;',;::::;;;:::;;;;:
illii
::•.:•!••••
) " • • ' • !
iiiiii^ii!
11
I::'::;:*;::;:;;;::::;:
iiiiiiii^iiili
pljjjIjjljjijylillpiH
• : : : ; : : : : : • : ; • : . -
I:;;;;;::::;;;::*
; ! - i ! ! - ! ! f l : : ! : : :
H 8
poc
1.92 1.94 1.96 1.98 2 2.02 2.04 2.06 2.08 2.1 2.12 2.14
10^3/T [K]
Figure 4.2: OFT measurements by DSC (pipe B):• = Dynamic scanning; + = Isothermal scanning
17
16
CO15
<
a 14c
13
m7 —
Po
1.85 1.9 1.95 2 2.05 2.1 2.15 2.2
10^3/T [K]
Figure 4.3: OFT measurements by DSC (pipe C):• = Dynamic scanning; + = Isothermal scanning
4.17
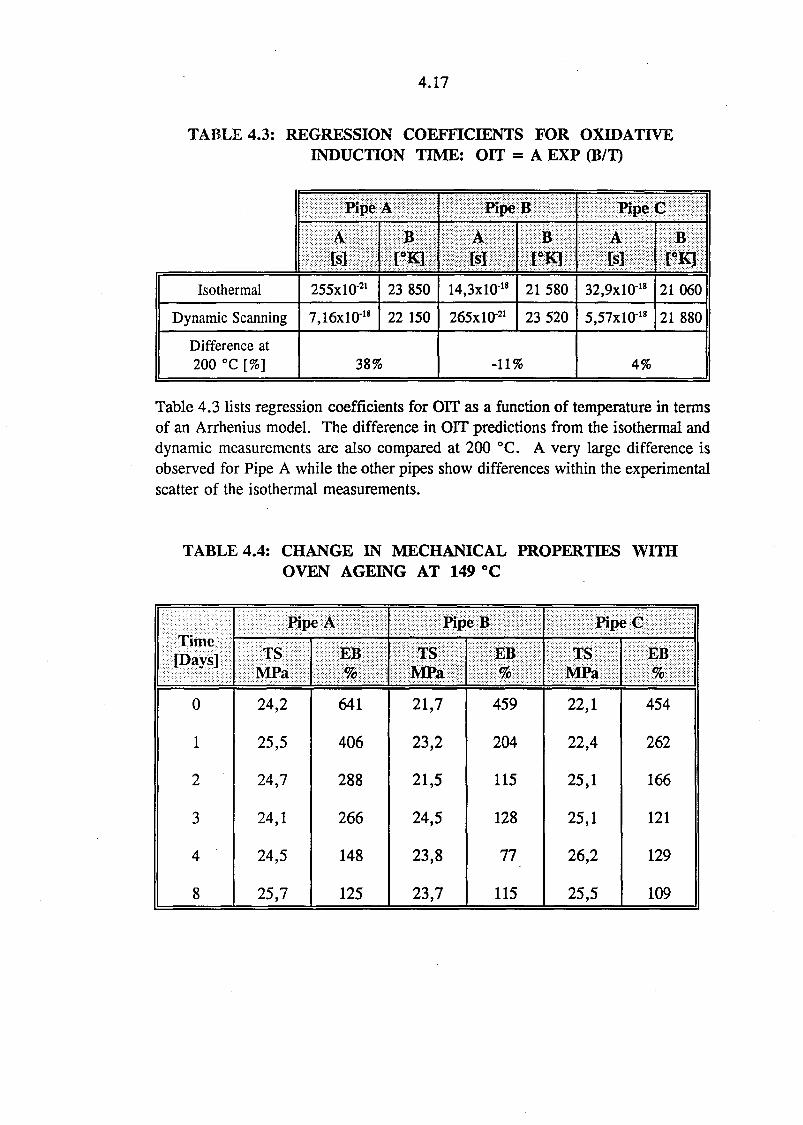
TABLE 4.3: REGRESSION COEFFICIENTS FOR OXIDATTVEINDUCTION TIME: OIT = A EXP (B/T)
Isothermal
Dynamic Scanning
Difference at200 °C [%]
Pipe
ACs]
255xlO"21
7,16xlO18
389!
A
r23
22
B
850
150
PipeB1111!14,3xl018
265xlO"21
r21
23
-11%
K]
580
520
Pipe C
A
32,9xlO18
5,57xlO"18
r21
21
4%
%
060
880
Table 4.3 lists regression coefficients for OIT as a function of temperature in termsof an Arrhenius model. The difference in OFT predictions from the isothermal anddynamic measurements are also compared at 200 °C. A very large difference isobserved for Pipe A while the other pipes show differences within the experimentalscatter of the isothermal measurements.
TABLE 4.4: CHANGE IN MECHANICAL PROPERTIES WITHOVEN AGEING AT 149 °C
Time[Days]
0
1
2
3
4
8
Pipe A
TSMPa
24,2
25,5
24,7
24,1
24,5
25,7
EB
641
406
288
266
148
125
PipeB
TSMPa
21,7
23,2
21,5
24,5
23,8
23,7
EB
459
204
115
128
77
115
PipeC
TSMPa
22,1
22,4
25,1
25,1
26,2
25,5
454
262
166
121
129
109
4.18
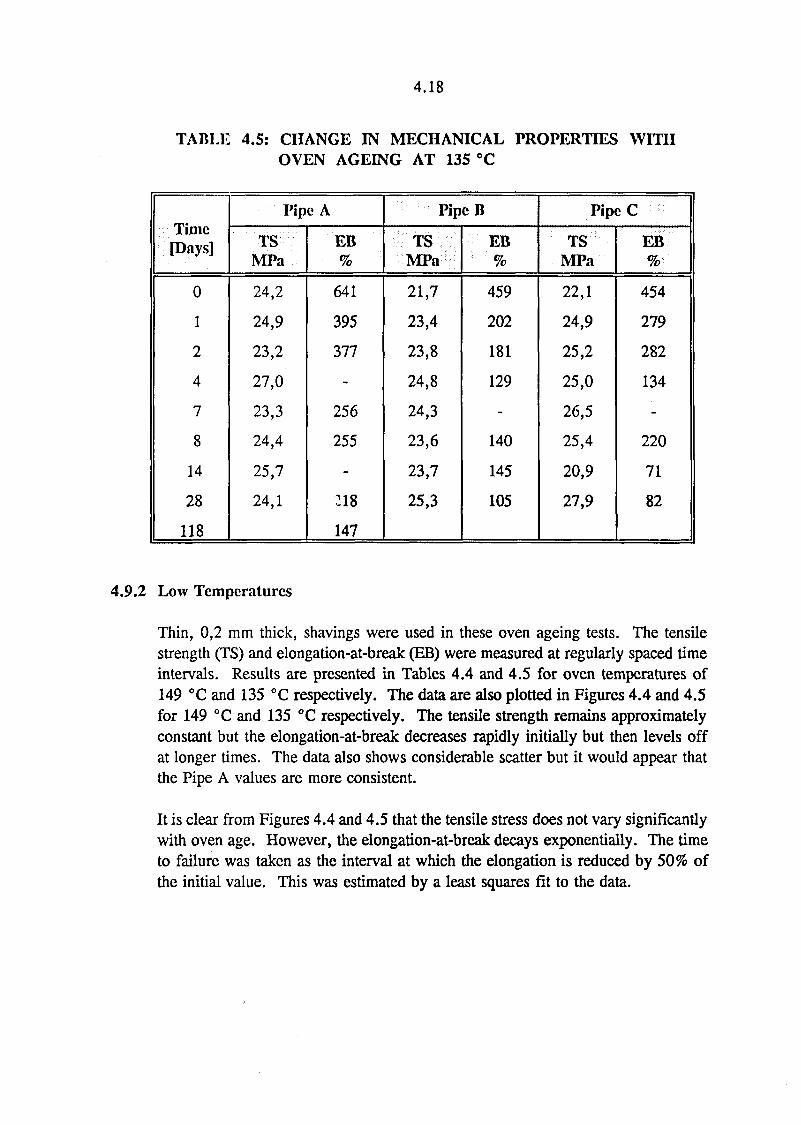
TABLE 4.5: CHANGE IN MECHANICAL PROPERTIES WITHOVEN AGEING AT 135 °C
Time[Days]
0
1
2
4
7
8
14
28
118
Pipe A
•TTCTvMPa
24,2
24,9
23,2
27,0
23,3
24,4
25,7
24,1
EB%
641
395
377
256
255
: i8
147
PipeB
TSMPa
21,7
23,4
23,8
24,8
24,3
23,6
23,7
25,3
EB%
459
202
181
129
140
145
105
PipcC
TSMPa
22,1
24,9
25,2
25,0
26,5
25,4
20,9
27,9
EB%
454
279
282
134
220
71
82
4.9.2 Low Temperatures
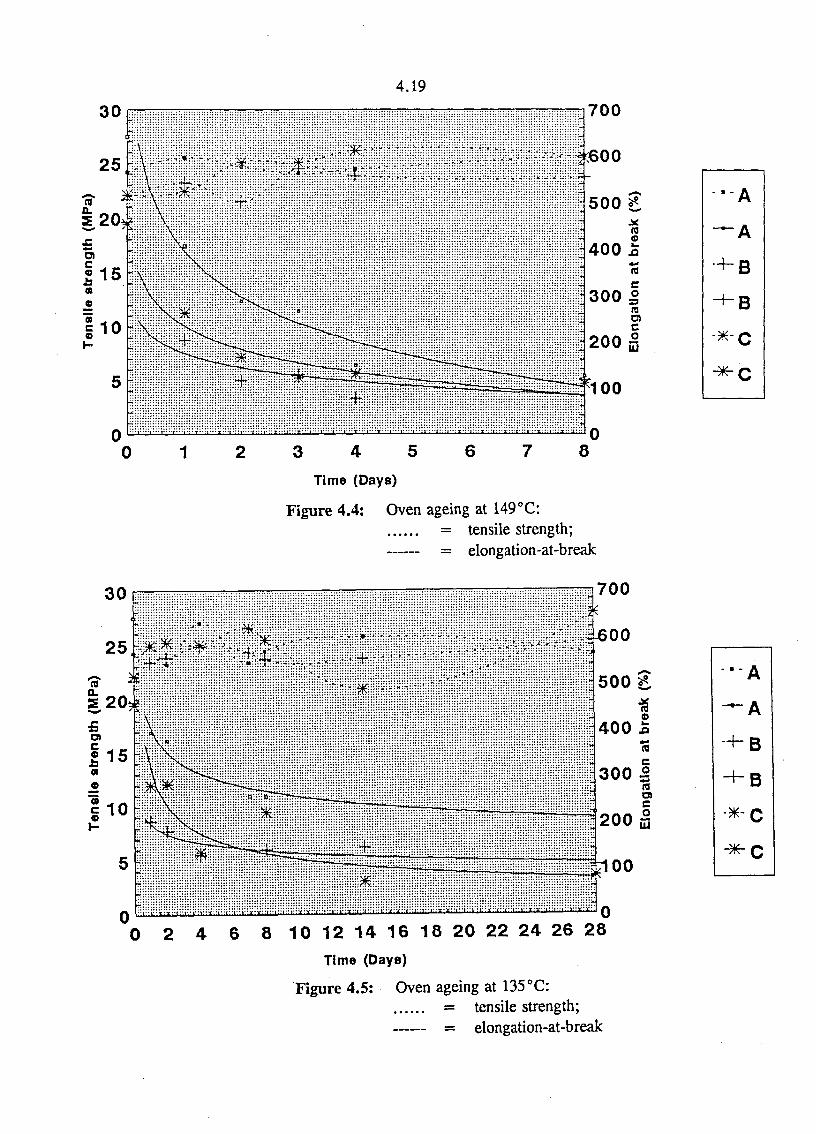
Thin, 0,2 mm thick, shavings were used in these oven ageing tests. The tensilestrength (TS) and elongation-at-break (EB) were measured at regularly spaced timeintervals. Results are presented in Tables 4.4 and 4.5 for oven temperatures of149 °C and 135 °C respectively. The data are also plotted in Figures 4.4 and 4.5for 149 °C and 135 °C respectively. The tensile strength remains approximatelyconstant but the elongation-at-break decreases rapidly initially but then levels offat longer times. The data also shows considerable scatter but it would appear thatthe Pipe A values are more consistent.
It is clear from Figures 4.4 and 4.5 that the tensile stress does not vary significantlywith oven age. However, the elongation-at-break decays exponentially. The timeto failure was taken as the interval at which the elongation is reduced by 50% ofthe initial value. This was estimated by a least squares fit to the data.
4.19
700
•••• • • • • • > T . . . , . . . T . . . . . . . . . . . . . . . . . • • • T — i — T " ' I — I - " - I — • • • • T — i ; " T " : i - " i : : : - i v : r : " i : : : i - : i " - i : : : r - : : i : : - L - : : : i — i — T — i ••••,•••,•••
Time (Days)
Figure 4.4: Oven ageing at 149°C:= tensile strength;= elongation-at-break
700
1 t . I . . I . . I . . I * . I I . . I I . . I . I . . I . I < t i l . . l . . l . . l . . » . 3 C
2 4 6 8 10 12 14 16 18 20 22 24 26 28
Time (Days)
Figure 4.5: Oven ageing at 135°C:= tensile strength;= elongation-at-break
4.20
700
00 10 20 30 40 50 60 70 80 90 100 110
Time (Days)
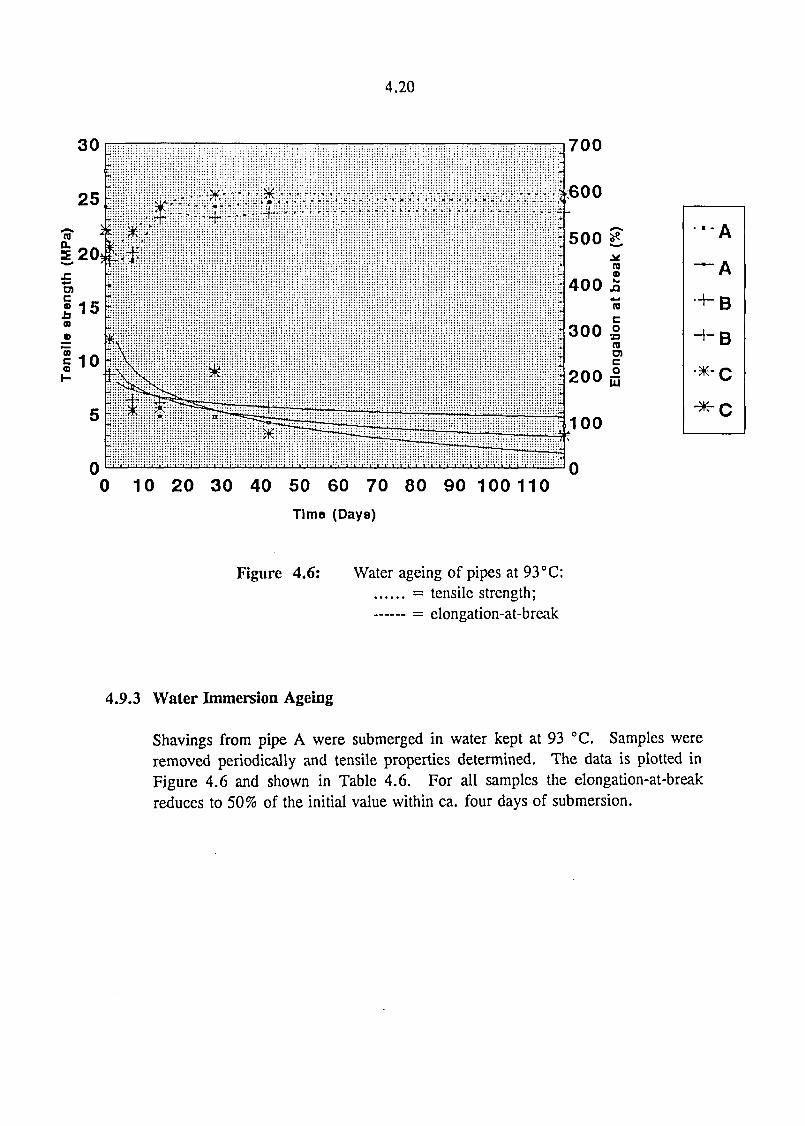
Figure 4.6: Water ageing of pipes at 93 °C:= tensile strength;= elongation-at-break
4.9.3 Water Immersion Ageing
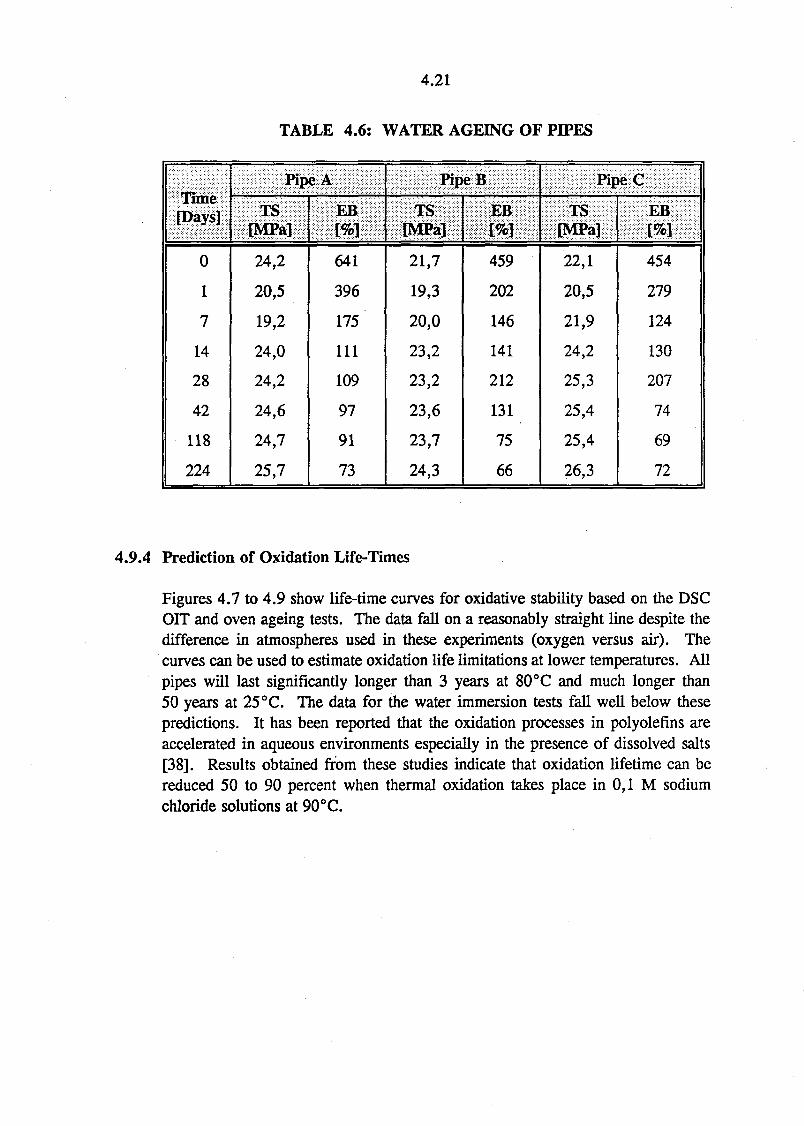
Shavings from pipe A were submerged in water kept at 93 °C. Samples wereremoved periodically and tensile properties determined. The data is plotted inFigure 4.6 and shown in Table 4.6. For all samples the elongation-at-breakreduces to 50% of the initial value within ca. four days of submersion.
4.21
TABLE 4.6: WATER AGEING OF PIPES
Time[Days]
0
1
7
14
28
42
118
224
Pipe A
TS[MPa]
24,2
20,5
19,2
24,0
24,2
24,6
24,7
25,7
EB[%]
641
396
175
111
109
97
91
73
PipeB
TSIMPa]
21,7
19,3
20,0
23,2
23,2
23,6
23,7
24,3
EB£%]
459
202
146
141
212
131
75
66
PipeC
TS[MPa]
22,1
20,5
21,9
24,2
25,3
25,4
25,4
26,3
EB[%]
454
279
124
130
207
74
69
72
4.9.4 Prediction of Oxidation Life-Times
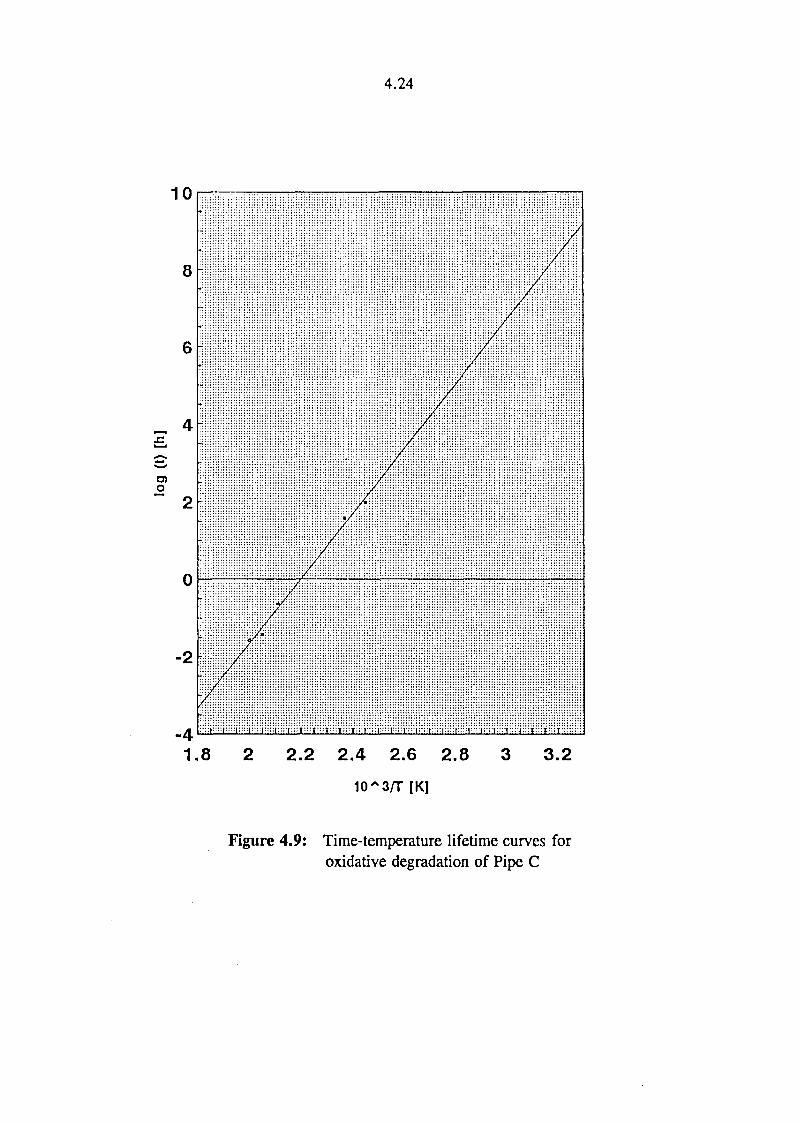
Figures 4.7 to 4.9 show life-time curves for oxidative stability based on the DSCOIT and oven ageing tests. The data fall on a reasonably straight line despite thedifference in atmospheres used in these experiments (oxygen versus air). Thecurves can be used to estimate oxidation life limitations at lower temperatures. Allpipes will last significantly longer than 3 years at 80°C and much longer than50 years at 25°C. The data for the water immersion tests fall well below thesepredictions. It has been reported that the oxidation processes in polyolefins areaccelerated in aqueous environments especially in the presence of dissolved salts[38]. Results obtained from these studies indicate that oxidation lifetime can bereduced 50 to 90 percent when thermal oxidation takes place in 0,1 M sodiumchloride solutions at 90°C.

4.22
-2
1.8 2 2.2 2.4 2.6 2.8 3 3.2
10^3/T [K]
Figure 4.7: Time-temperature lifetime curves foroxidative degradation of Pipe A

4.23
l l l f f l l T T T T T I I I I I I I I I I I I I T T T
-2
1.8 2 2.2 2.4 2.6 2.8 3 3.2
10~3/T [K]
Figure 4.8: Time-temperature lifetime curves foroxidative degradation of Pipe B
4.24
1 1 1 I I I I I I I 1 I I I I I I I I I I I I !
1.8 2 2.2 2.4 2.6 2.8 3 3.2
[K]
Figure 4.9: Time-temperature lifetime curves foroxidative degradation of Pipe C

4.25
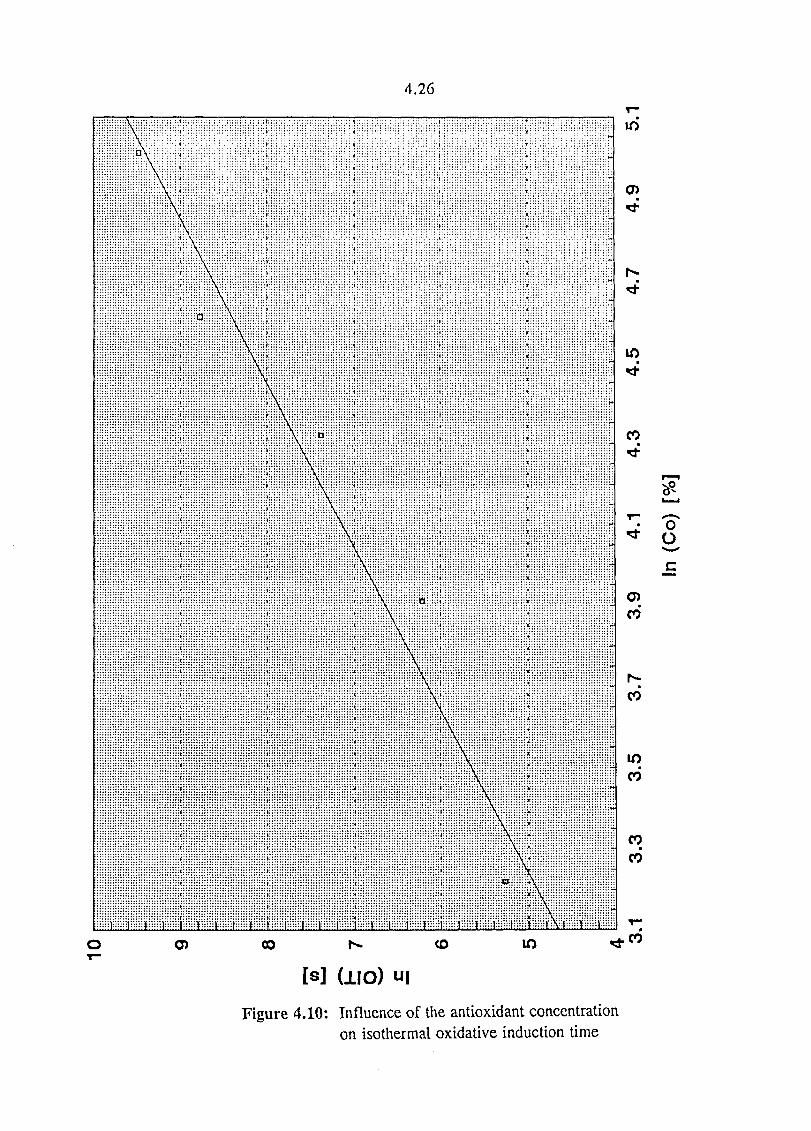
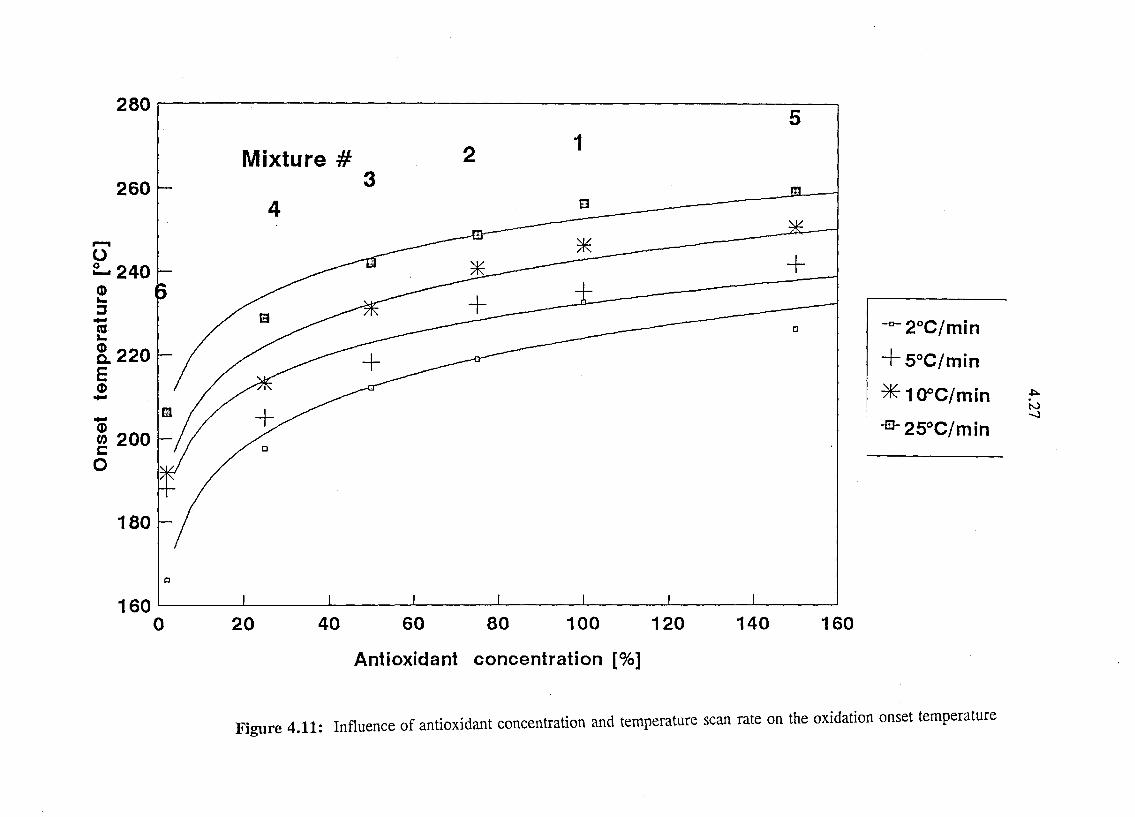
4.9.5 Thermal Analysis of Controlled Film Samples
The effect of antioxidant concentrations on both isothermal and dynamic oxidationinduction was measured using the polypropylene film samples. Results arepresented in Tables 4.7 and 4.8.
TABLE 4.7: INFLUENCE OF ANTIOXIDANT CONCENTRATION ONISOTHERMAL OXIDATION INDUCTION TIMES AT200°C
Mixture#
6
4
3
2
1
5
Antioxidant Concentration[%1
0
25
50
75
100
150
orr[min]
0,2
3,23
8,29
26,80
108,00
219,00
TABLE 4.8: INFLUENCE OF CONCENTRATION ON DYNAMIC OIT
Scan Rate0
tmin J
2
5
10
25
1100%
226,2
235,2
246,2
256,2
Mixture(Antioxidant concentration
275%
218,9
232,0
240,7
248,7
350%
212,0
218,2
231,2
242,0
425%
197,5
205,0
213,2
228,8
5150%
237,6
241,7
250,6
259,3
60%
166,1
188,0
191,8
206,2
The results are also plotted in Figures 4.10 to 4.11.
4.26
] J 1 1 I I L 1 I I I J l ...I I...
IO
O
CO
(S
G)CO
co
1 0CO
CO
CO
o 00 CO
[s] (HO) "I
Figure 4.10: Influence of the antioxidant concentrationon isothermal oxidative induction time
280
16020 40 60 80 100 120
Antioxidant concentration [%]
140
2°C/min
°C/min
-s-25°C/min
160
Figure 4.11: Influence of antioxidant concentration and temperature scan rate on the oxidation onset temperature
4.28
4.10 Discussion
The oxidative stability of polypropylene can be determined using DSC by two basictechniques:
Oxidation Induction Time (OIT) (ASTM D 3895)
The time from the beginning of exposure to an oxygen containing atmosphere upto the start of auto oxidation is measured in an isothermal mode.
Oxidation Induction Temperature (ASTM D 3350)
The temperature is scanned dynamically and the onset temperature of oxidationdetermined. Typical heating rates are 10°C and oxygen or air is used.
The dynamic method has the following advantages:
- Convenience
It is not necessary to switch from an inert gas to an oxidizing gas.
- Speed
The OIT can vary tremendously depending on the level of stabilization. Thismeans that the temperature must often be adjusted in order to obtain meaningfulresults with the isothermal method.
- Reproducibility
Studies by Koski and Saarela [23] have shown that the dynamic method is morereproducible. The current investigation has confirmed this.
Fitting equations (3) and (5) to the data, in Tables 4.7 and 4.8 respectively, resultedin:
OIT = 4,17 x 10"24 C2-5 exp ( ^ 2 ) (9)
for isothermal oxidation; and
= 1,465 x 10"18
for dynamic oxidation. The differences in the observed concentration dependencesmay indicate that the model used for the anti-oxidation, equation (1), is inadequateor, alternatively, the difference results from the data scatter.
Assuming that the pipes contain the same antioxidant, we can estimate theremaining concentration.
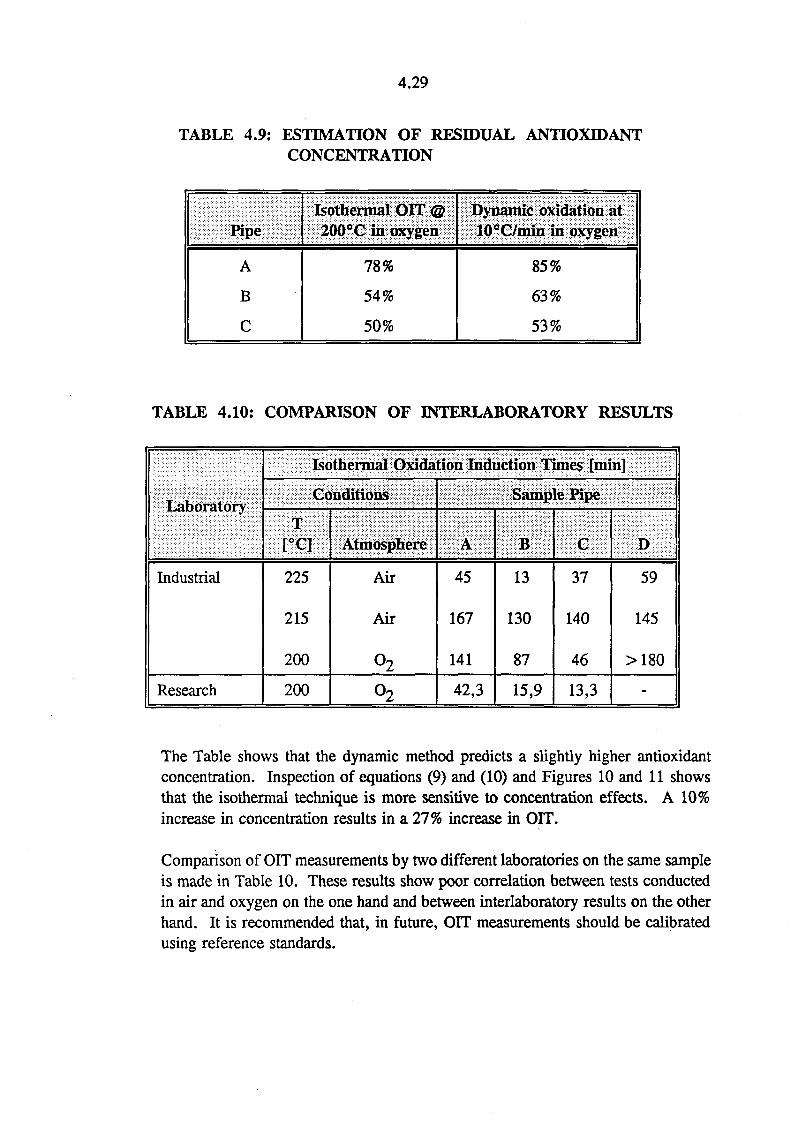
4.29
TABLE 4.9: ESTIMATION OF RESIDUAL ANTIOXIDANTCONCENTRATION
Pipe
A
B
C
Isothermal OIT @200°C in oxygen
78%
54%
50%
Dynamic oxidation at10°C/min in oxygen
85%
63%
53%
TABLE 4.10: COMPARISON OF INTERLABORATORY RESULTS
Laboratory
Industrial
Research
Isothermal Oxidation Induction Times [min]
Conditions
T[°C]
225
215
200
200
Atmosphere
AD-
AM-
o2
o2
Sample Pipe
A
45
167
141
42,3
B
13
130
87
15,9
C
37
140
46
13,3
D
59
145
>180
-
The Table shows that the dynamic method predicts a slightly higher antioxidantconcentration. Inspection of equations (9) and (10) and Figures 10 and 11 showsthat the isothermal technique is more sensitive to concentration effects. A 10%increase in concentration results in a 27% increase in OIT.
Comparison of OIT measurements by two different laboratories on the same sampleis made in Table 10. These results show poor correlation between tests conductedin air and oxygen on the one hand and between interlaboratory results on the otherhand. It is recommended that, in future, OIT measurements should be calibratedusing reference standards.
4.30
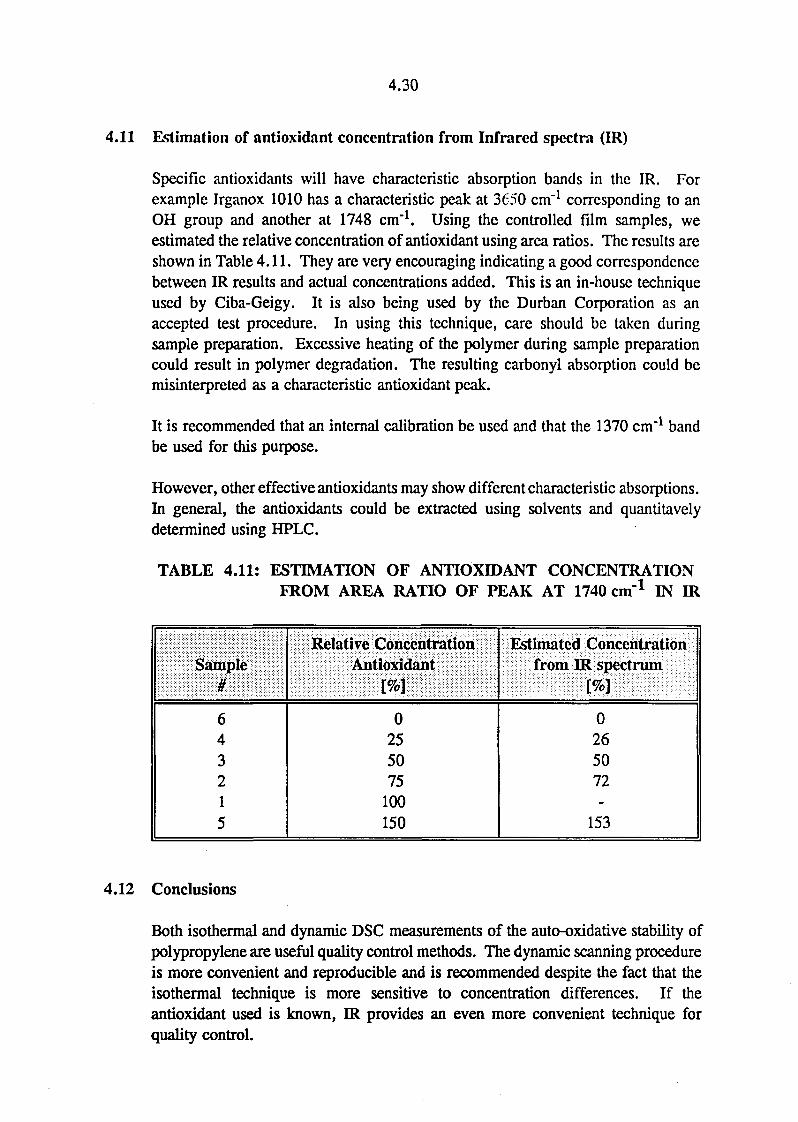
4.11 Estimation of antioxidant concentration from Infrared spectra (IR)
Specific antioxidants will have characteristic absorption bands in the IR. Forexample Irganox 1010 has a characteristic peak at 3650 cm'1 corresponding to anOH group and another at 1748 cm"1. Using the controlled film samples, weestimated the relative concentration of antioxidant using area ratios. The results areshown in Table 4.11. They are very encouraging indicating a good correspondencebetween IR results and actual concentrations added. This is an in-house techniqueused by Ciba-Geigy. It is also being used by the Durban Corporation as anaccepted test procedure. In using this technique, care should be taken duringsample preparation. Excessive heating of the polymer during sample preparationcould result in polymer degradation. The resulting carbonyl absorption could bemisinterpreted as a characteristic antioxidant peak.
It is recommended that an internal calibration be used and that the 1370 cm"1 bandbe used for this purpose.
However, other effective antioxidants may show different characteristic absorptions.In general, the antioxidants could be extracted using solvents and quantitavelydetermined using HPLC.
TABLE 4.11: ESTIMATION OF ANTIOXIDANT CONCENTRATIONFROM AREA RATIO OF PEAK AT 1740 cm"1 IN IR
Sample
643215
Relative ConcentrationAntioxidant
[%]
0255075
100150
Estimated Concentrationfrom IR spectrum
0265072-
153
4.12 Conclusions
Both isothermal and dynamic DSC measurements of the auto-oxidative stability ofpolypropylene are useful quality control methods. The dynamic scanning procedureis more convenient and reproducible and is recommended despite the fact that theisothermal technique is more sensitive to concentration differences. If theantioxidant used is known, IR provides an even more convenient technique forquality control.

4.31
The expected service life of three commercial polypropylene pipes were estimatedusing data obtained by DSC (oxygen atmospheres) and oven ageing tests.Elongation-at-break was chosen as the indicator of residual service life. Failurewas defined at the point when the elongation-at-break corresponded to 50% of theinitial value. The fact that different atmospheres were used at high and lowtemperature measurements provides a "safety factor". Predicted service life in airis much higher than specified requirements of >30 years at 25 °C and >3 yearsat 80°C.
4.32
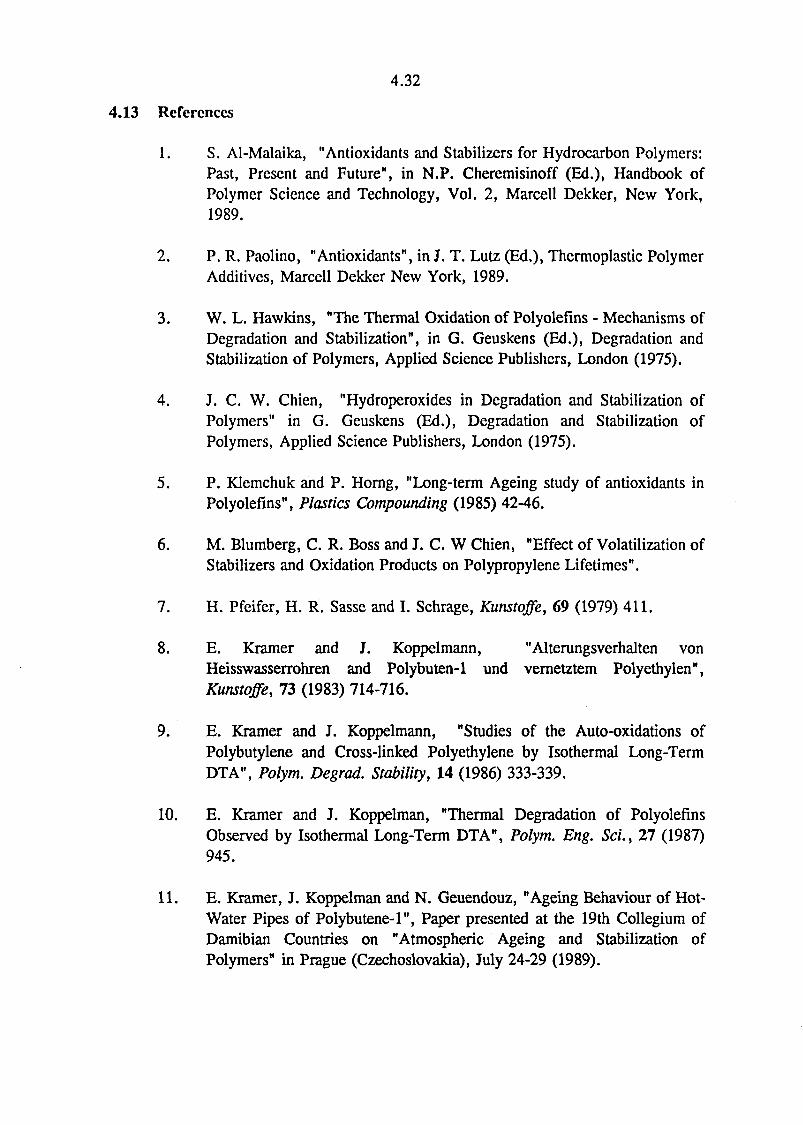
4.13 References
1. S. Al-Malaika, "Antioxidants and Stabilizers for Hydrocarbon Polymers:Past, Present and Future", in N.P. Cheremisinoff (Ed.), Handbook ofPolymer Science and Technology, Vol. 2, Marcell Dekker, New York,1989.
2. P. R. Paolino, "Antioxidants", in J. T. Lutz (Ed.), Thermoplastic PolymerAdditives, Marcell Dekker New York, 1989.
3. W. L. Hawkins, "The Thermal Oxidation of Polyolefins - Mechanisms ofDegradation and Stabilization", in G. Geuskens (Ed.), Degradation andStabilization of Polymers, Applied Science Publishers, London (1975).
4. J. C. W. Chien, "Hydroperoxides in Degradation and Stabilization ofPolymers" in G. Geuskens (Ed.), Degradation and Stabilization ofPolymers, Applied Science Publishers, London (1975).
5. P. Klemchuk and P. Horng, "Long-term Ageing study of antioxidants inPolyolefins", Plastics Compounding (1985) 42-46.
6. M. Blumberg, C. R. Boss and J. C. W Chien, "Effect of Volatilization ofStabilizers and Oxidation Products on Polypropylene Lifetimes".
7. H. Pfeifer, H. R. Sasse and I. Schrage, Kunstoffe, 69 (1979) 411.
8. E. Kramer and J. Koppelmann, "Alterungsverhalten vonHeisswasserrohren and Polybuten-1 und vernetztem Polyethylen",Kunstoffe, 73 (1983) 714-716.
9. E. Kramer and J. Koppelmann, "Studies of the Auto-oxidations ofPolybutylene and Cross-linked Polyethylene by Isothermal Long-TermDTA", Polym. Degrad. Stability, 14 (1986) 333-339.
10. E. Kramer and J. Koppelman, "Thermal Degradation of PolyolefinsObserved by Isothermal Long-Term DTA", Polym. Eng. ScL, 27 (1987)945.
11. E. Kramer, J. Koppelman and N. Geuendouz, "Ageing Behaviour of Hot-Water Pipes of Polybutene-l", Paper presented at the 19th Collegium ofDamibian Countries on "Atmospheric Ageing and Stabilization ofPolymers" in Prague (Czechoslovakia), July 24-29 (1989).
4.33
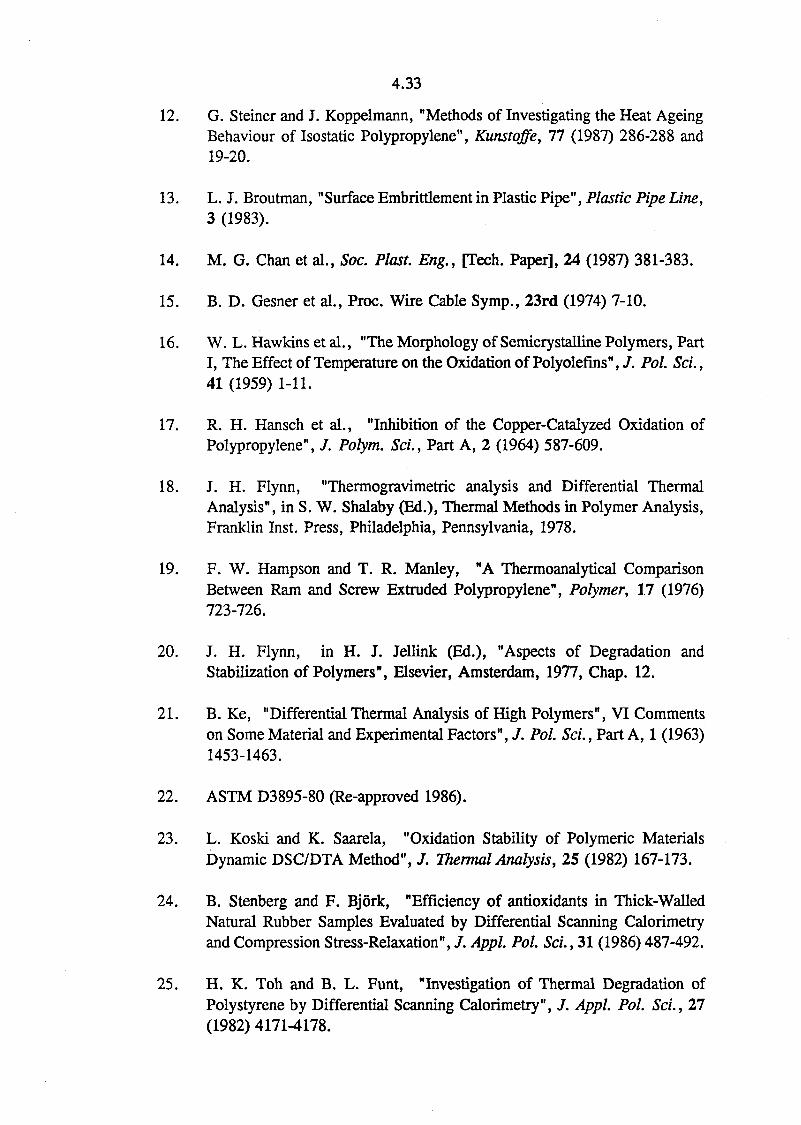
12. G. Steiner and J. Koppelmann, "Methods of Investigating the Heat AgeingBehaviour of Isostatic Polypropylene", Kunstoffe, 77 (1987) 286-288 and19-20.
13. L. J. Broutman, "Surface Embrittlement in Plastic Pipe", Plastic Pipe Line,3 (1983).
14. M. G. Chan et al., Soc. Plast. Eng., [Tech. Paper], 24 (1987) 381-383.
15. B. D. Gesner et al., Proc. Wire Cable Symp., 23rd (1974) 7-10.
16. W. L. Hawkins et al., "The Morphology of Semicrystalline Polymers, PartI, The Effect of Temperature on the Oxidation of Polyolefins", / . Pol. Sci.,41 (1959) 1-11.
17. R. H. Hansch et al., "Inhibition of the Copper-Catalyzed Oxidation ofPolypropylene", J. Polym. Sci., Part A, 2 (1964) 587-609.
18. J. H. Flynn, "Thermogravimetric analysis and Differential ThermalAnalysis", in S. W. Shalaby (Ed.), Thermal Methods in Polymer Analysis,Franklin Inst. Press, Philadelphia, Pennsylvania, 1978.
19. F. W. Hampson and T. R. Manley, "A Thermoanalytical ComparisonBetween Ram and Screw Extruded Polypropylene", Polymer, 17 (1976)723-726.
20. J. H. Flynn, in H. J. Jellink (Ed.), "Aspects of Degradation andStabilization of Polymers", Elsevier, Amsterdam, 1977, Chap. 12.
21. B. Ke, "Differential Thermal Analysis of High Polymers", VI Commentson Some Material and Experimental Factors", J. Pol. Sci., Part A, 1 (1963)1453-1463.
22. ASTM D3895-80 (Re-approved 1986).
23. L. Koski and K. Saarela, "Oxidation Stability of Polymeric MaterialsDynamic DSC/DTA Method", / . Thermal Analysis, 25 (1982) 167-173.
24. B. Stenberg and F. Bjork, "Efficiency of antioxidants in Thick-WalledNatural Rubber Samples Evaluated by Differential Scanning Calorimetryand Compression Stress-Relaxation", / . Appl. Pol. Sci., 31 (1986) 487-492.
25. H. K. Toh and B. L. Funt, "Investigation of Thermal Degradation ofPolystyrene by Differential Scanning Calorimetry", / . Appl. Pol. Sci., 27(1982) 4171-4178.

4.34
26. H. E. Bair, Pol. Eng. Sci., 13 (1973) 435-439.
27. E. Kiran and J. K. Gillham, J. Macromol. Sci. Chem., A8 (1974) 211.
28. E. Kiran and J. K. Gillham, J. Appl. Polym. Sci., 20 (1976) 2045.
29. J. Ogaard Madsen et al., "Effectiveness of Antioxidants: Suppression ofEvaluation of Gaseous Degradation Products from Low-DensityPolyethylene During Thermo-Oxidation", Polym. Degrad. Stability, 12(1985) 131-140.
30. L. Costa and G. Camino, "Rdle of Thermal Oxidation of the Polymer in theBurning Process", Polym. Degrad. Stability, 12 (1985) 297-301.
31. G. Andisio and A. Silvani, "Pyrolysis of Polypropylene in the Presence ofHalogenated Paraffin and Bismuth Salt: Some Aspects of the DegradationMechanism", Polym. Degrad. Stability, 11 (1985) 243-249.
32. N. Ya et al., "Changes in Molecular Mass Characteristics in the Auto-oxidation of Isotropic and Oriented Isostatic Polypropylene Films: PrimaryInitiation of the Kinetic Chain", Polym. Degrad. Stability, 12 (1985) 191-202.
33. D. L. Faulkner, "Ageing of Polypropylene Using High Oxygen Pressure:Influence of sample thickness and Stabilization", J. Appl. Pol. Sci., 31(1986) 2129-2138.
34. S. P. Fairgrieve and J. R. MacCallum, "Diffusion-Controlled Oxidationof Polymers: A Mathematical Model", Polymer Degrad. Stability, 11(1985) 251-265.
35. M. Iring et al., In I. Buzas (Ed.), Thermal Analysis, Vol. 2, Heyden,London (1974) p. 127.
36. J. Rotschova" et al., "Antioxidants and Stabilizers: Part C - Decompositionof tert-Butylhydroperoxide by Polyolefin Melt Stabilizer l,r-Thiobis(4,6-di-tert-butylphenol)", Pol. Degrad. Stability, 12 (1985) 181-190.
37. J.P. Forsman, "Oven ageing of polypropylene", SPE Journal, (1964) 729-737.
38. A. Garton, J. L. Henry, P. D. McLean and T. K. Stevenson, "LaboratorySimulation of Space and Salt Water Environmental Effects on Polymers",Pol. Eng. Sci. 29 (1989) 23.
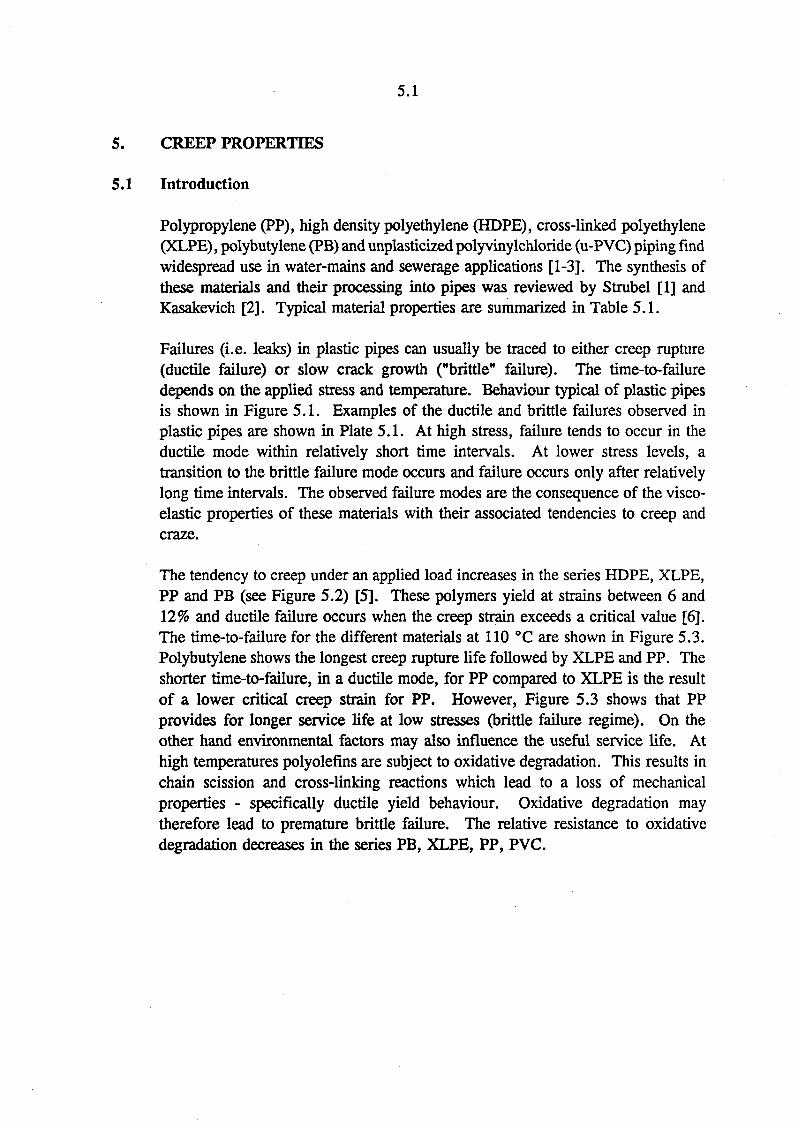
5.1
5. CREEP PROPERTIES
5.1 Introduction
Polypropylene (PP), high density polyethylene (HDPE), cross-linked polyethylene(XLPE), polybutylene (PB) and unplasticized polyvinylchloride (u-PVC) piping findwidespread use in water-mains and sewerage applications [1-3]. The synthesis ofthese materials and their processing into pipes was reviewed by Strubel [1] andKasakevich [2]. Typical material properties are summarized in Table 5.1.
Failures (i.e. leaks) in plastic pipes can usually be traced to either creep rupture(ductile failure) or slow crack growth ("brittle" failure). The time-to-failuredepends on the applied stress and temperature. Behaviour typical of plastic pipesis shown in Figure 5.1. Examples of the ductile and brittle failures observed inplastic pipes are shown in Plate 5.1. At high stress, failure tends to occur in theductile mode within relatively short time intervals. At lower stress levels, atransition to the brittle failure mode occurs and failure occurs only after relativelylong time intervals. The observed failure modes are the consequence of the visco-elastic properties of these materials with their associated tendencies to creep andcraze.
The tendency to creep under an applied load increases in the series HDPE, XLPE,PP and PB (see Figure 5.2) [5]. These polymers yield at strains between 6 and12% and ductile failure occurs when the creep strain exceeds a critical value [6].The time-to-failure for the different materials at 110 °C are shown in Figure 5.3.Polybutylene shows the longest creep rupture life followed by XLPE and PP. Theshorter time-to-failure, in a ductile mode, for PP compared to XLPE is the resultof a lower critical creep strain for PP. However, Figure 5.3 shows that PPprovides for longer service life at low stresses (brittle failure regime). On theother hand environmental factors may also influence the useful service life. Athigh temperatures polyolefins are subject to oxidative degradation. This results inchain scission and cross-linking reactions which lead to a loss of mechanicalproperties - specifically ductile yield behaviour. Oxidative degradation maytherefore lead to premature brittle failure. The relative resistance to oxidativedegradation decreases in the series PB, XLPE, PP, PVC.
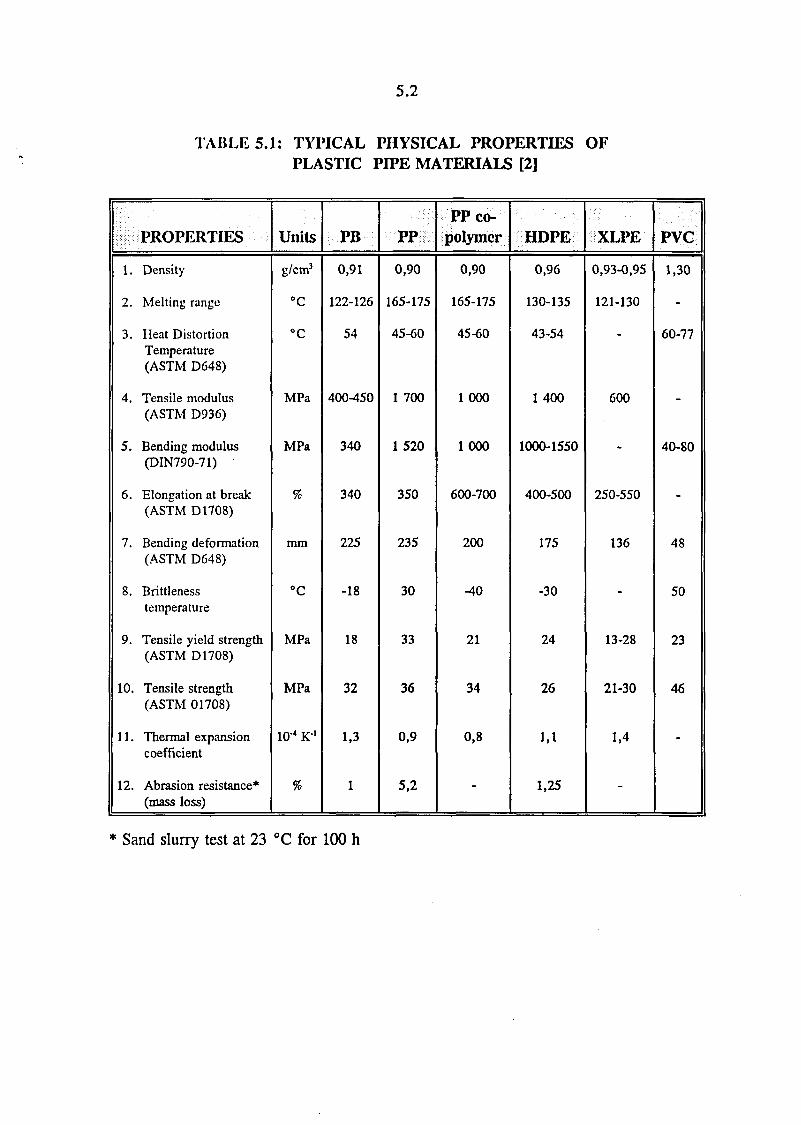
5.2
TABLE 5.1: TYPICAL PHYSICAL PROPERTIES OFPLASTIC PIPE MATERIALS [2]
PROPERTIES
1. Density
2. Melting range
3. Heat DistortionTemperature(ASTM D648)
4. Tensile modulus(ASTM D936)
5. Bending modulus(DIN790-71)
6. Elongation at break(ASTM D1708)
7. Bending deformation(ASTM D648)
8. Brittlenesstemperature
9. Tensile yield strength(ASTM D1708)
10. Tensile strength(ASTM 01708)
11. Thermal expansioncoefficient
12. Abrasion resistance*(mass loss)
Units
g/cm3
°C
°C
MPa
MPa
%
mm
°C
MPa
MPa
10-4 K1
%
PB
0,91
122-126
54
400-450
340
340
225
-18
18
32
1,3
1
v;;PPtt0,90
165-175
45-60
1700
1 520
350
235
30
33
36
0,9
5,2
PPco-polymcr
0,90
165-175
45-60
1000
1000
600-700
200
-40
21
34
0,8
-
HDPE
0,96
130-135
43-54
1 400
1000-1550
400-500
175
-30
24
26
1,1
1,25
XLPE
0,93-0,95
121-130
-
600
-
250-550
136
-
13-28
21-30
1,4
-
PVC
1,30
-
60-77
-
40-80
-
48
50
23
46
-
Sand slurry test at 23 °C for 100 h
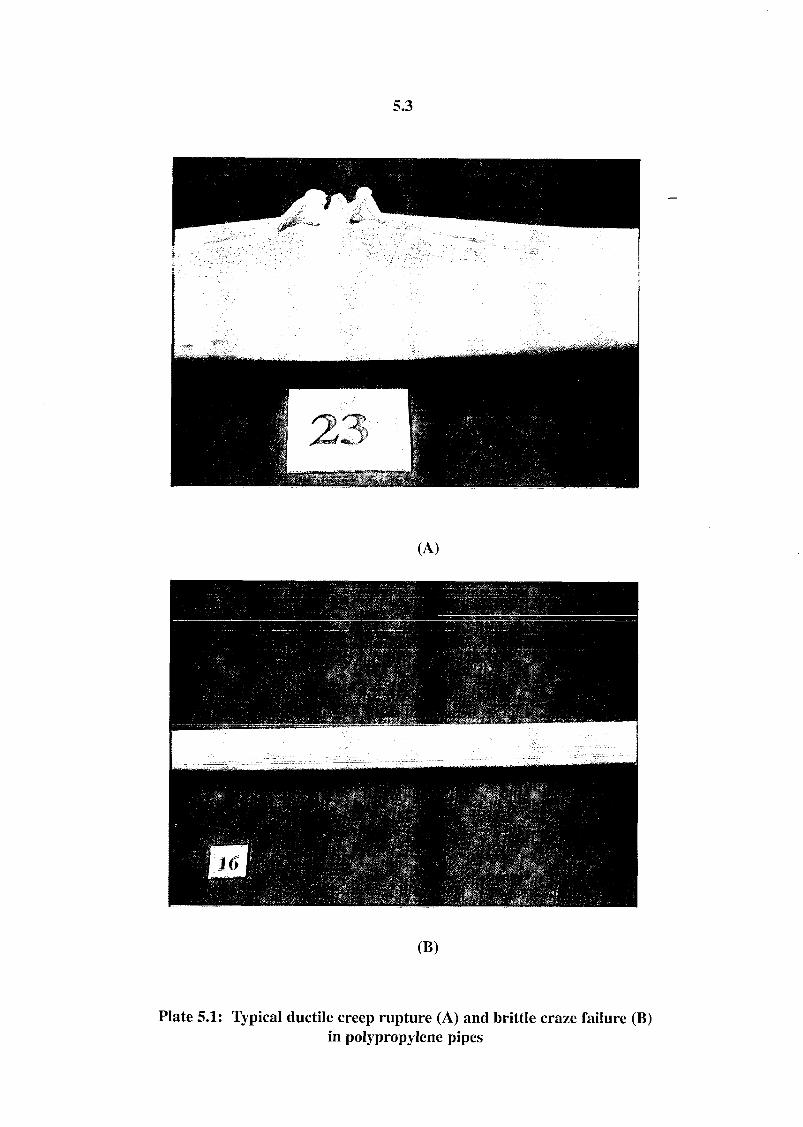
5.3
(A)
(B)
Plate 5.1: Typical ductile creep rupture (A) and brittle craze failure (B)in polypropylene pipes

5.4
Expected strength of PP blockcopolymer
50
30
1LJ TTWmill i i n n
mini 11 urn
| I I I I H I M
I I i I 1 1 1 1 | | ) '• , 1 1 1 1 I I I ! I i • ' i : : i I | 1 1 I I I I I i T i T i I M i l l
I I ! Hill i rTi |n:i I I I I i[l'i ! i I I Hill I I I I Mill I I ; I |l
20
109 F
1
1 HIM11 HIIMINI
11i i11
_ U o i ~~
i
* • —
inn imi! iMilIlli
ii
4ii!L 'Tt cjji ~j—F444HIL i T i4WP i+ $ •
i f —
IHII 1 1 HIM 1 1 1i i n n i i i l i n n i > inun iiiiiiHill
Illllll 1 1 1UUl'l i i iIllilll 1 1
Titr i f--—LJL!II ! !H I I !
iTirM-i 1! lliiprf^lif-Uiiliiirrrf
11 IIIIIIIIIIIIIMil
III 1Illi
1111 II
mil
IIIIIII IIII l l i !
Ii4tL[Tit!
II
I
—.
i i N
i iii|!l
l lHIHimII II.
IIi 11 mil
a&tr^i I MUM
-J ' i "
i 7nfJ_L
I M i l l :
- H * T T iiff
11 iiI [ mill "P
IIIIIII i
ni t
11
ro 5
c 4
inin
oa
i i 11.imil rrsmii i I I! I I llTll—*—LJ
IIIIIII JUTI T Mill
rn i|K^iTHuii
i ; i i i iI I I INI i i i - r i i i i
I Mili I n I I I
nunI i SJJJ
11\ iI M INN
Ii XTTT
m\\\vMIX
N I I I l \ ! I
Mil Hill X J III\I I
I \I I N I I I
I I!I I I i i i i i i l T i [ T > ^ I I T T H J T I X i I N i l i l l i \ i i i l K j i j
I I I I I i 11 nun i 11I I I I I I I I I I MM
nun
. 7 rI I
I I IITT i
i i
inHi: J : IN
IIHIMNIIIifHTN\ 11 mil i \ l I Mill
KIfHtlk
i ; I ii M i l
I I I 11II
• i 11 if M i t I'll
_LU LMil I M I
I I I I II
mill 11 HIM I i iI I MM III
iI ! I
5 10 25 501001
Years I
I I I l l i i l l j | M I H I I i I I | l | i | l i l i l
0 . 1 10 10 10 10
Time to fracture in h ->
10 10
Figure 5.1: Time-to-failure as a function of operating pressure andtemperature for a polypropylene pipe.Curves for ductile (I) and brittle (II) failure modes are indicated
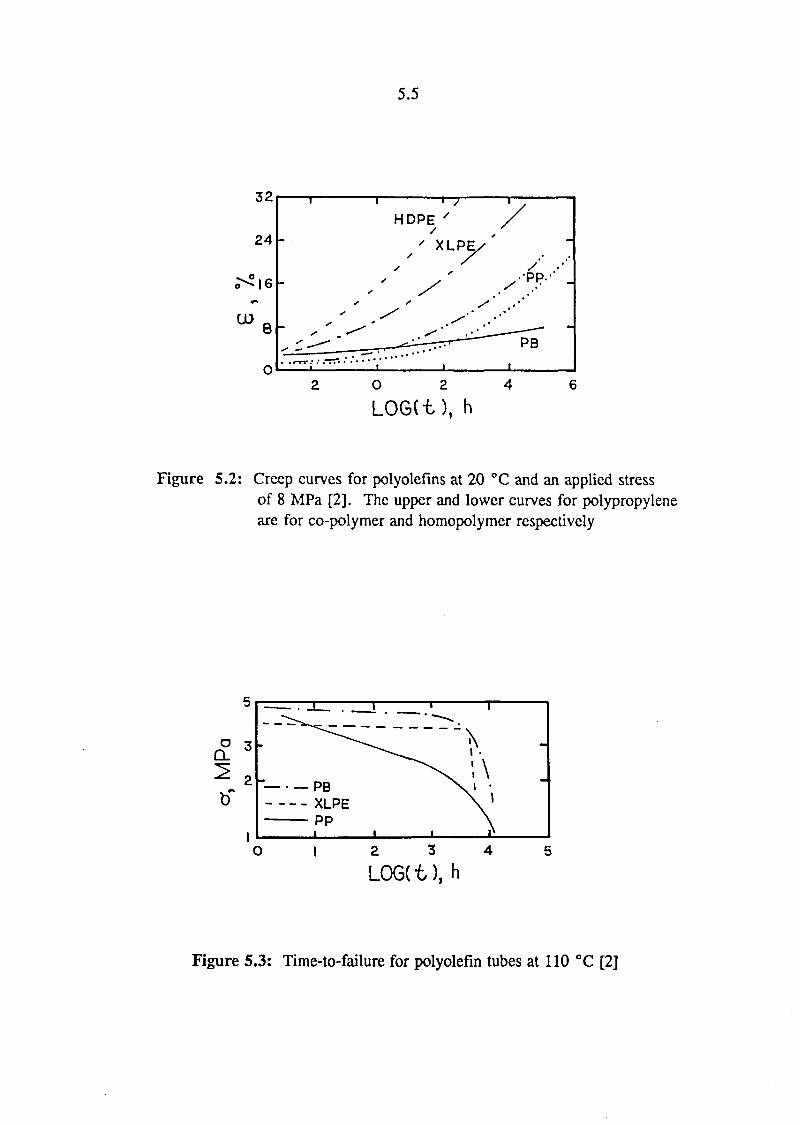
5.5
32
24
1 1 1 /
HDPE '
' XLPE/
1 t 1
1
/
• ^ . • • '
re" "1
2 0 2 4
LOG(t), h
Figure 5.2: Creep curves for polyolefins at 20 °C and an applied stressof 8 MPa [2]. The upper and lower curves for polypropyleneare for co-polymer and homopolymer respectively
2 3 4
LOG(t), h
Figure 5.3: Time-to-failure for polyolefin tubes at 110 °C [2]
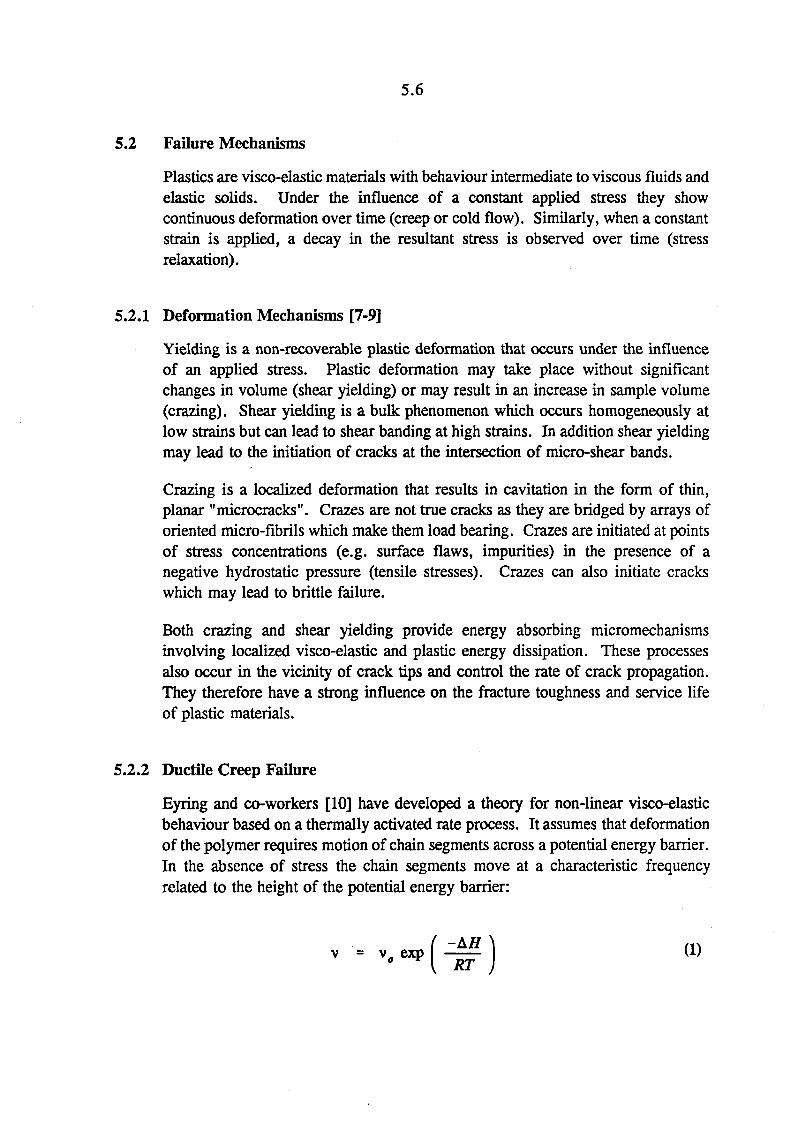
5.6
5.2 Failure Mechanisms
Plastics are visco-elastic materials with behaviour intermediate to viscous fluids andelastic solids. Under the influence of a constant applied stress they showcontinuous deformation over time (creep or cold flow). Similarly, when a constantstrain is applied, a decay in the resultant stress is observed over time (stressrelaxation).
5.2.1 Deformation Mechanisms [7-9]
Yielding is a non-recoverable plastic deformation that occurs under the influenceof an applied stress. Plastic deformation may take place without significantchanges in volume (shear yielding) or may result in an increase in sample volume(crazing). Shear yielding is a bulk phenomenon which occurs homogeneously atlow strains but can lead to shear banding at high strains. In addition shear yieldingmay lead to the initiation of cracks at the intersection of micro-shear bands.
Crazing is a localized deformation that results in cavitation in the form of thin,planar "microcracks". Crazes are not true cracks as they are bridged by arrays oforiented micro-fibrils which make them load bearing. Crazes are initiated at pointsof stress concentrations (e.g. surface flaws, impurities) in the presence of anegative hydrostatic pressure (tensile stresses). Crazes can also initiate crackswhich may lead to brittle failure.
Both crazing and shear yielding provide energy absorbing micromechanismsinvolving localized visco-elastic and plastic energy dissipation. These processesalso occur in the vicinity of crack tips and control the rate of crack propagation.They therefore have a strong influence on the fracture toughness and service lifeof plastic materials.
5.2.2 Ductile Creep Failure
Eyring and co-workers [10] have developed a theory for non-linear visco-elasticbehaviour based on a thermally activated rate process. It assumes that deformationof the polymer requires motion of chain segments across a potential energy barrier.In the absence of stress the chain segments move at a characteristic frequencyrelated to the height of the potential energy barrier:
= v exp I —— I (1)
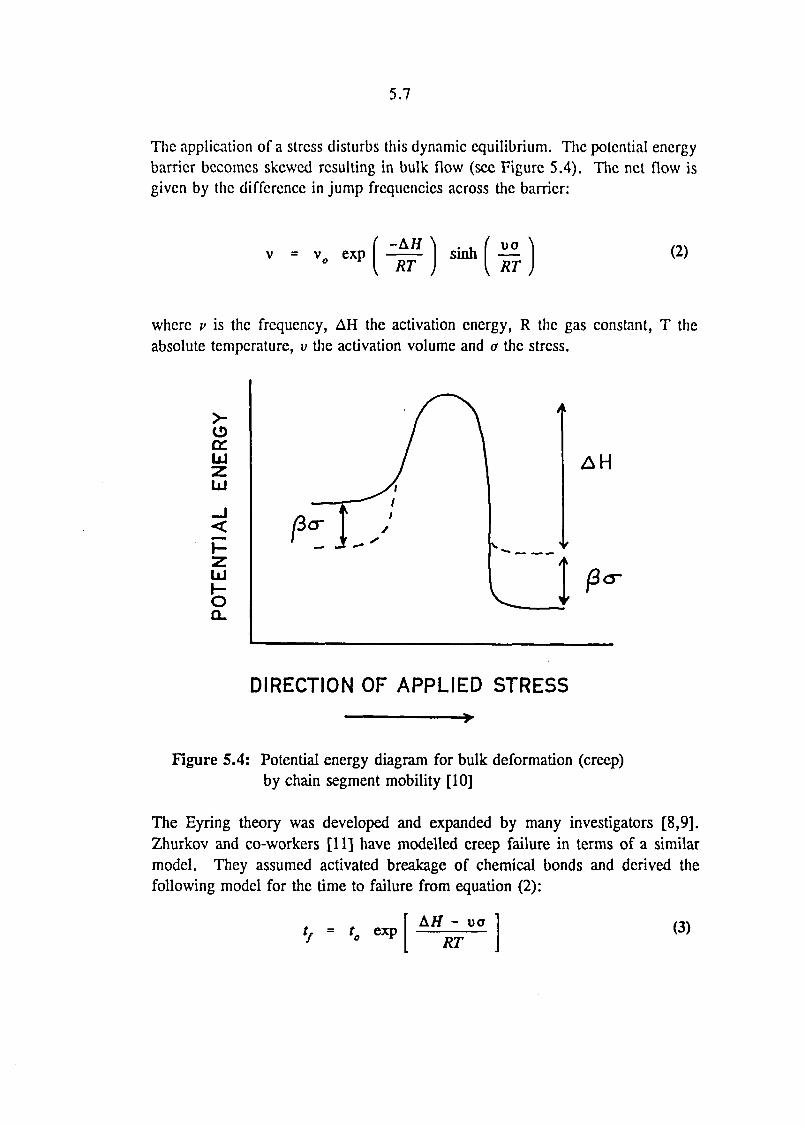
5.7
The application of a stress disturbs this dynamic equilibrium. The potential energybarrier becomes skewed resulting in bulk flow (sec Figure 5.4). The net flow isgiven by the difference in jump frequencies across the barrier:
v = sinh —I RT
(2)
where v is the frequency, AH the activation energy, R the gas constant, T theabsolute temperature, v the activation volume and a the stress.
Ld
LxJ
LJ
O
AH
DIRECTION OF APPLIED STRESS
Figure 5.4: Potential energy diagram for bulk deformation (creep)by chain segment mobility [10]
The Eyring theory was developed and expanded by many investigators [8,9].Zhurkov and co-workers [11] have modelled creep failure in terms of a similarmodel. They assumed activated breakage of chemical bonds and derived thefollowing model for the time to failure from equation (2):
Aff - uoRT
(3)
5.8
Zhurkov's [11] model predicts an Arrhenius type temperature dependence for tf ata constant applied stress, but predicts a linear dependence of log(tf) on a rather thanlogarithmic dependence.
Brown et al. [6,7] have developed an improved model based on an empirical creepequation:
e = A o" f» exp ( M ) (4)
Assuming that the critical creep strain is either constant or varies with stressaccording to a power law dependence one obtains the following equation for creeplife:
n
log fa = A + — - C log o (5)
where A, B and C are material parameters, with the parameter A also lumpingsome geometry factors. More detailed models based on shift functions from stressrelaxation tests were proposed by Popelar et al. [16]. However, models similar toequation (5) have proved adequate for experimental data presentation [12-17].
5.2.3 Brittle Failure
Static fatigue is the other main failure mechanism. It involves the initiation of amicrocrack and its subsequent propagation to the point of macroscopic brittlefailure. The time to failure in this case is given by [9]:
V = *i + *, (6 )
with tj the initiation time and tp the time taken for crack propagation.
Crack initiation may be caused by surface defects. These initially lead to crazingand eventually result in the nucleation of cracks [18,19]. Alternatively, high strainsmay lead to internal nucleation of cracks especially at defects such as impurities ormicrovoids. Large deformations may open up small voids throughout the bulk inmaterials such as PVC, PE and PP and give an overall white appearance (stress-whitening).

5.9
Figure 5.5 shows a schematic cross-section of a crack tip in a semi-crystallinepolymer. The crack tip tends to grow perpendicular to the principal stressdirection. At the crack tip the stress field is highly concentrated and this can bedescribed in terms of a stress intensity factor K. For simple geometries thefollowing relationship applies [8,9,20]:
K = Ya (7)
with Y a geometry constant, a the applied stress and a the crack length. Crackpropagation occurs when the stress intensity factor exceeds a critical valuecorresponding to a material constant [9]:
Klc
(8)
where E is the modulus and G1C the work of fracture. In the absence of energyabsorbing processes, GIC = 27 where 7 is the surface energy of the cracksurface. However, as indicated in Figure 5.5, cavitation occurs at the crack tipresulting in crazing and shear deformation. The plastic deformation of the zonearound the crack tip and the deformation of craze fibrils constitute large energyabsorbtion processes and GIC far exceeds the surface energy estimate.
CRAZEDMATERIAL
CRACKTIP
STRESS
Figure 5.5: Profile of a crack tip showing cohesive zone filled with crazed material
5.10
The deformation in the crack tip zone occurs in a visco-elastic fashion. Thissuggests a time dependence which is material and temperature dependent. Initialcrack growth usually proceeds in a stable manner with a power law dependence onKIC [9]:
KIC = Av d" (9)
Evans [21,22] has developed an expression for static fatigue life based on theassumption that the crack grows slowly and in a stable manner. He assumed thatthe above relationship between crack growth rate and KIC applies with a low valueof the exponent n:
t * 2nAv Kic (10)Y2 a] (l-2n)
This expression should allow an estimation of long term static fatigue life fromshort time fracture mechanics experiments. A quality control method based onthese concepts was indeed proposed for polyethylene pipes [20].
Further analysis [6] has shown that the time to brittle fracture should follow similarbehaviour to equation (5):
= R + | - <?lno (11)
where, as before, R contains material and geometry factors while S and Q arematerial parameters.
Experimental evidence [7,12-16] has confirmed that the failure envelopes in boththe ductile and brittle regimes are adequately described by functional dependencesof the form of equation (5) or equation (11). However, it should be noted [6] thatsome interaction between the two mechanisms has been observed in the vicinity ofthe ductile-brittle transition. In general brittle failure must be viewed as astochastic process. The time-to-failure is therefore a random variable whichdepends on parameters such as applied stress, temperature and geometry effects(e.g. flaw sizes and flaw distributions). As a result experimentally determinedfailure times scatter considerably.
5.11
Sometimes the shorter life times are used to construct failure envelopes.Preferably, the experimental data should be treated statistically and envelopescalculated from lower limit curves derived from weighted regression curves [37].In this regard it should be noted that the following modifications of equations (5)and (11) have been utilized in the literature [12-16]:
i A & C logolog t. = A + — + s _
recommended by ASTM D2837, and
log*, = A +
The scatter in the available data makes it difficult to distinguish between thesemodels. They all adequately describe the behaviour of polyethylene andpolypropylene pipes at elevated temperatures.
5.2.4 Parameters Influencing service Life
While ductile and brittle behaviours show similar functional dependences on stressand temperature, it is in ; ortant to note that the ductile behaviour is relativelyinsensitive to the actual morphology of the polymer [17]. In contrast, the brittlefracture mode is strongly affected by parameters such as molecular weight and itsdistribution, molecular branching and crystal morphology [15,23-26].
a) SpherulUe size [23-26]
The basic morphology of semi-crystalline polymers (e.g. polypropylene) is oneof spherulitic domains composed of lamellar crystals. The size, the sizedistribution and the structure of spherulites have a major influence on the crackpaths and the rate of crack propagation [24]. By using PP grades of differentmolecular weight and utilizing different cooling rates Friedrich [24] was ableto produce morphologies ranging from very fine (<20/un) to coarse(>500 nm). Cracks were found to propagate most easily along the interfacesof coarse spherulites. Way et al. [23] have also observed that the yield stressand deformation mode of PP are affected by spherulite size. Materialscontaining large spherulites are more brittle while those consisting of very finespherulites are highly ductile featuring strains as high as 700%. He alsoobserved a maximum in the tensile strength at a critical value of spherulitesize.
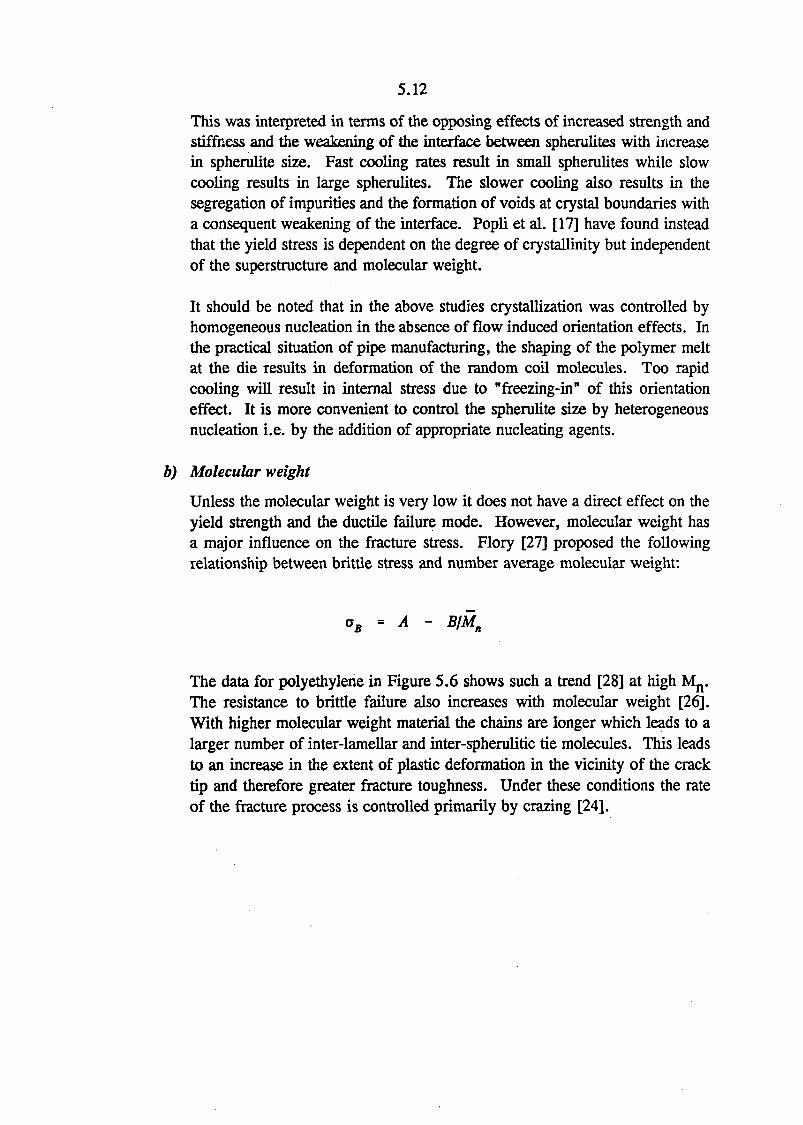
5.12
This was interpreted in terms of the opposing effects of increased strength andstiffness and the weakening of the interface between spherulites with increasein spherulite size. Fast cooling rates result in small spherulites while slowcooling results in large spherulites. The slower cooling also results in thesegregation of impurities and the formation of voids at crystal boundaries witha consequent weakening of the interface. Popli et al. [17] have found insteadthat the yield stress is dependent on the degree of crystallinity but independentof the superstructure and molecular weight.
It should be noted that in the above studies crystallization was controlled byhomogeneous nucleation in the absence of flow induced orientation effects. Inthe practical situation of pipe manufacturing, the shaping of the polymer meltat the die results in deformation of the random coil molecules. Too rapidcooling will result in internal stress due to "freezing-in" of this orientationeffect. It is more convenient to control the spherulite size by heterogeneousnucleation i.e. by the addition of appropriate nucleating agents.
b) Molecular weight
Unless the molecular weight is very low it does not have a direct effect on theyield strength and the ductile failure mode. However, molecular weight hasa major influence on the fracture stress. Flory [27] proposed the followingrelationship between brittle stress and number average molecular weight:
aB = A - B/Mn
The data for polyethylene in Figure 5.6 shows such a trend [28] at high Mn.The resistance to brittle failure also increases with molecular weight [26].With higher molecular weight material the chains are longer which leads to alarger number of inter-lamellar and inter-spherulitic tie molecules. This leadsto an increase in the extent of plastic deformation in the vicinity of the cracktip and therefore greater fracture toughness. Under these conditions the rateof the fracture process is controlled primarily by crazing [24].
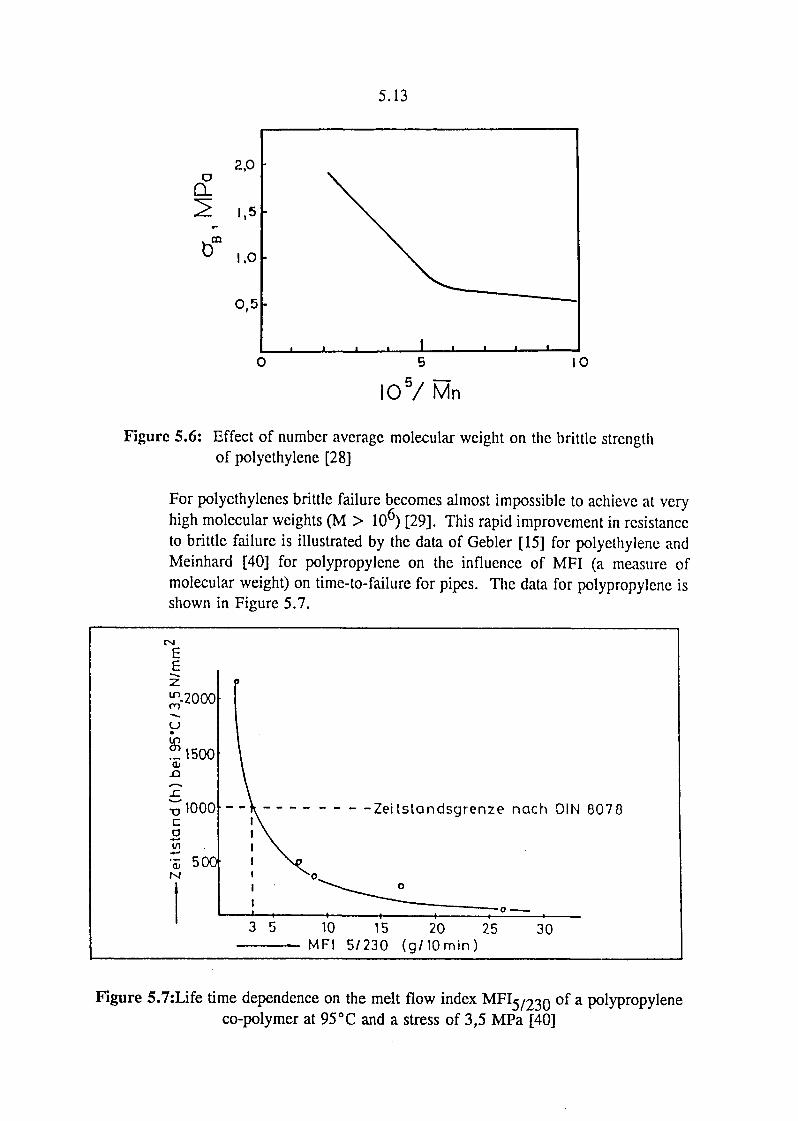
5.13
m
I .
I 0 5 / Mn
Figure 5.6: Effect of number average molecular weight on the brittle strengthof polyethylene [28]
For polyethylenes brittle failure becomes almost impossible to achieve at veryhigh molecular weights (M > 106) [29]. This rapid improvement in resistanceto brittle failure is illustrated by the data of Gebler [15] for polyethylene andMeinhard [40] for polypropylene on the influence of MFI (a measure ofmolecular weight) on time-to-failure for pipes. The data for polypropylene isshown in Figure 5.7.
Zeitstandsgrenze nach OIN 8078
3 5 10 15 20 25MFI 5/230 (g/ IOmin)
30
Figure 5.7:Life time dependence on the melt flow index MFI5/230 of a polypropyleneco-polymer at 95°C and a stress of 3,5 MPa [40]
5.14
A reduction in molecular weight during processing and under in-serviceconditions would have a detrimental effect on service life. Embrittlement byoxidative degradation is of particular concern as it takes place predominantlyin the amorphous interstices between crystallites. This leads to a loss of thebinding effect contributed by the tie molecules and results in embrittlement andpremature failure.
c) Molecular orientation
Brittle strength is more sensitive to alignment effects than the ductile failureprocess. Material is more likely to fail in a brittle mode when the stress isapplied perpendicularly to the orientation direction.
d) Surface flaws
Shrinkage during cooling of extruded parts can already lead to microcracks atspherulite boundaries [25]. In pipes exposed to sunlight or heat, surfaceembrittlement can trigger premature brittle fracture [30].
5.3 Criteria for residual life assessment
It is clear that plastics do age under service conditions. Prediction of the remaininguseful service life could therefore be valuable. However, it is unfortunately verydifficult to predict long term performance on the basis of short term tests. Theresidual service life is affected by a combination of many factors [33-36].
- Physical ageing corresponds to a relaxation from a non-equilibrium state towardsan equilibrium morphology [8,9]. In glassy polymers such as PVC this usuallyresults in an increase in density and therefore a reduction in "free volume". In thecase of polypropylene physical ageing involves decreases in the contour length oftie molecules [32]. Macroscopically this reduces the elongation-at-break andshould lead to reduced time-to-failure at low stresses (brittle fracture).
- Morphological changes e.g. recrystallization or secondary crystallization. Theformer is of particular relevance to polybutylene.
- Thermal degradation Some polymers are intrinsically unstable at elevatedtemperatures even in the absence of oxygen. Free radical initiateddepolymerization of polypropylene is possible at processing temperatures.
- Oxidative and photo-oxidative degradation [36] These are autocatalyticprocesses taking place in the presence of oxygen. The rate of degradation can becontrolled by the addition of suitable stabilizers (anti-oxidants and UV stabilizers).
5.15
Environmental stress cracking [20] corresponds to the action of extraneouschemicals in accelerating failure.
Physical damage (usually visible as stress whitening) due to yielding i.e. thehistory of stresses and strains experienced by the material. This may also be dueto mechanical abuse during installation.
A large number of physical tests are available for the characterization of the stateof a polymeric material [33]. Here we limit our discussion to "mechanical"measurements:
a) Bending stress
Bending tests are often used to evaluate the embrittlement time e.g. in ovenageing tests. For Pass/Fail evaluations thin samples are usually bent through180°. For polyethylene the embrittlement correlates well with loss inelongation while for polypropylene a strong correlation is observed withchanges in the IR spectrum. However, for thicker samples the bending stressat the point of failure varies only slightly with the state of ageing. Owing tothis poor sensitivity this method is not regarded to be of practical utility forthermoplastics such as polypropylene.
b) Impact resistance
Impact resistance correlates well with the state of weathering for HDPE and u-PVC but shows only a weak correlation for PP.
c) Tensile testing
Changes in the stress-strain behaviour of thermoplastics have been used asageing criteria [39]. Polymers that show plastic deformation initially show anincrease in tensile yield strength as the material embrittles. Later the abilityto yield is reduced and the yield and tensile strengths converge. At some pointfailure commences without plastic deformation and tensile strength decreaseswith age. The variations in yield or tensile strength are, however, insufficientto provide a useful criterion for the degree of ageing [35].
Corresponding to the change in tensile or yield strength, one finds that theelongation at break shows a rapid decrease and this material property thereforeprovides a useful criterion [35].
d) Fracture testing
It is clear that the "brittle" failure mode controls service life under actualservice stresses and temperatures for polyethylene pipes. The time-to-failurein this mode is determined by the fracture toughness which in turn controls therate of crack growth. Fleissner [20] proposed a quality control procedure
5.16
based on this principle of fracture mechanics. He found a strong correlationbetween the time-to-failure of a notched bar in tension with the time-to-failureof polyethylene pipes under pressure. At 80 °C and a stress of5MPathetest time was reduced by a factor of 30! The disadvantage of his test procedureis the fact that the tensile test specimens had to be cut from a pressed sheet.It would be advantageous to be able to utilize the pipe geometry directly.
e) Glass transition temperature
Ageing can also be followed by the change observed in the glass transitiontemperature as measured by dynamic mechanical thermal methods [35,36].
5.4 Experimental
5.4.1 Internal Pressurization of Pipes
The resistance of pipes (from manufacturers A, B and C) to internal pressure weremeasured at 80°C, 95°C and 120°C at SABS, Hoechst (Germany) and at the CSIR.At SABS pressurization occurred in a hot water bath at 80°C using gas pressure andwith the pipes filled with water. In the CSIR tests, a convection oven was used andpressurization was achieved by using nitrogen gas. The results of these test aregiven in Tables 5.2 and 5.3.
Table 5.2 summarizes the results for tests conducted at 80°C. Internal pressure wasvaried to achieve a given hoop stress in the pipe. The results obtained for the threepipes are compared with JASWIC and DIN specifications. Interestingly, all pipesexcept pipe B pass the DIN 8078 (1989) requirements, but fail the JASWIC test.All pipes tested at Hoechst also failed prematurely. It is not known why there isa discrepancy between the Hoechst and SABS test results.
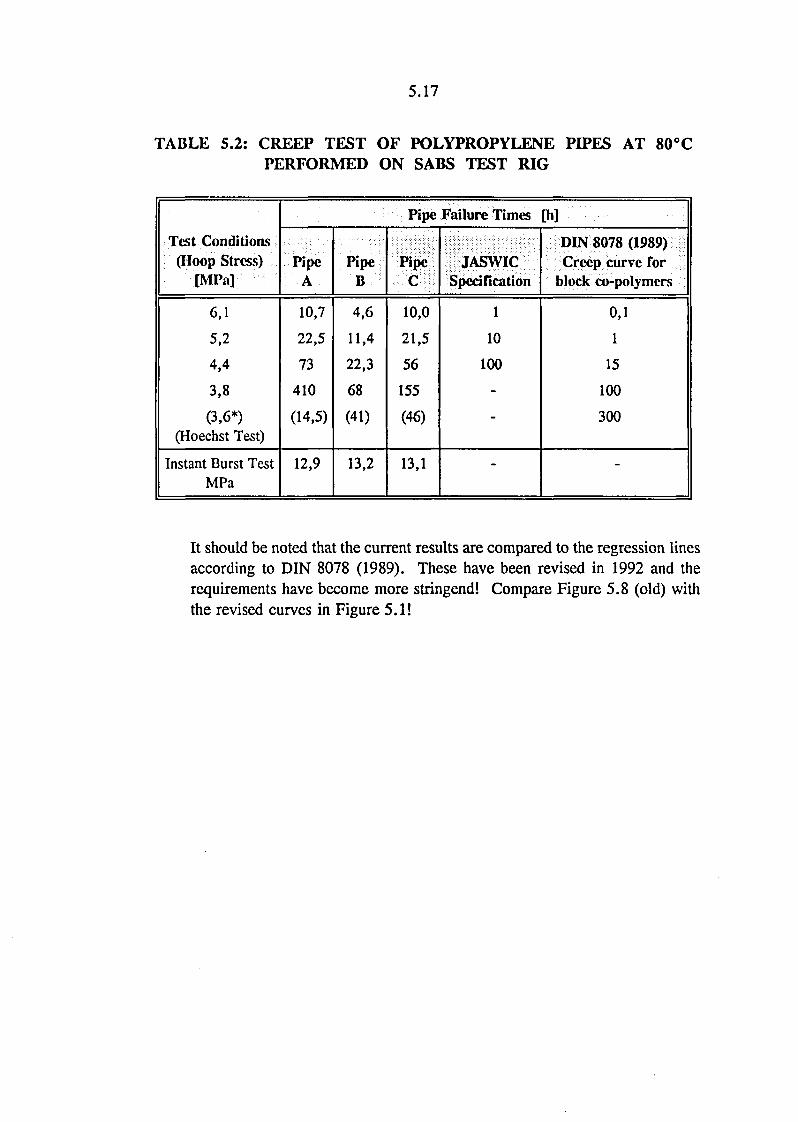
5.17
TABLE 5.2: CREEP TEST OF POLYPROPYLENE PIPES AT 80°CPERFORMED ON SABS TEST RIG
Test Conditions(Hoop Stress)
[MPa]
6,1
5,2
4,4
3,8
(3,6*)(Hoechst Test)
Instant Burst TestMPa
PipeA
10,7
22,5
73
410
(14,5)
12,9
PipeB
4,6
11,4
22,3
68
(41)
13,2
Pipe
PipeC
10,0
21,5
56
155
(46)
13,1
Failure Times
JASWICSpecification
1
10
100
-
-
-
DODIN 8078 (1989)Creep curve for
block co-polymers
0,1
1
15
100
300
-
It should be noted that the current results are compared to the regression linesaccording to DIN 8078 (1989). These have been revised in 1992 and therequirements have become more stnngend! Compare Figure 5.8 (old) withthe revised curves in Figure 5.1!
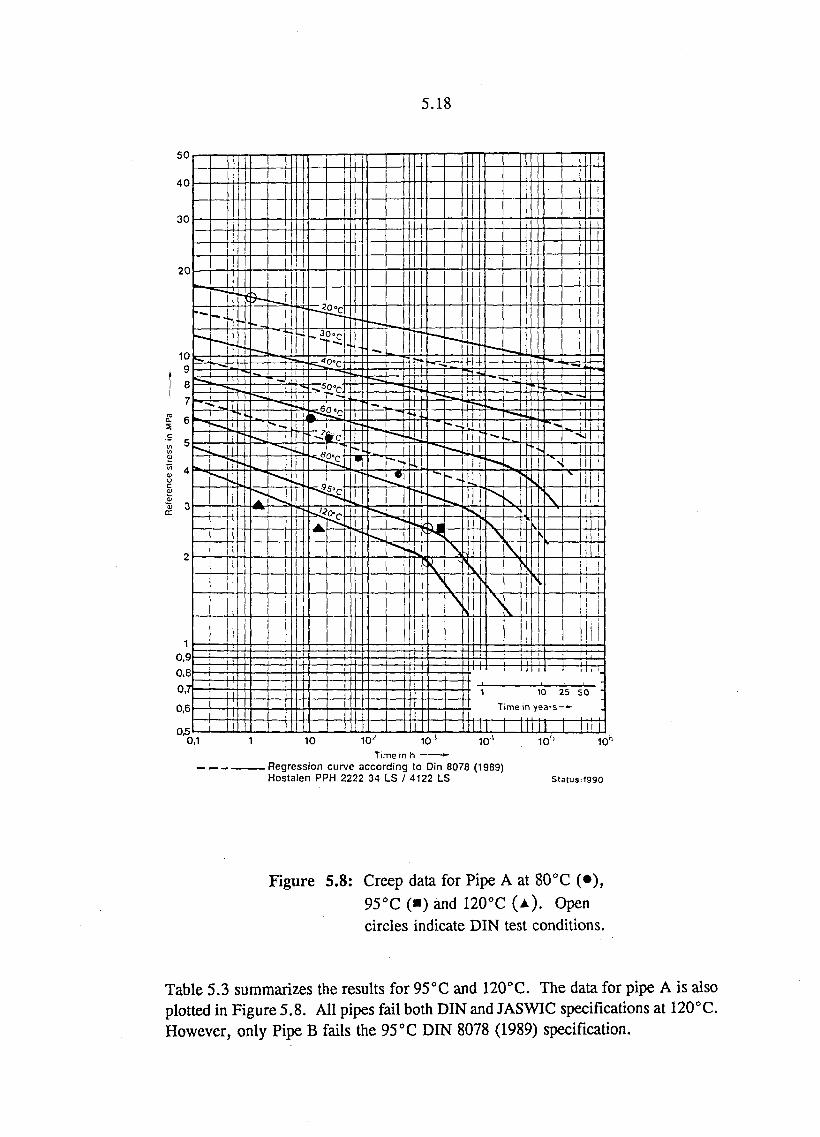
5.18
50
40
30
20
10,90,80,70,6
05
•—
*^
j
'"-—L- 1—-..
.i
f-
H
-~.
=*_
1 — - ^
j '
!
^ > s
s
-Site-* -
^ »
A ^L
i
— • • — .
; : -
— ~ .
• — .
L l
'• -Li
- • ^ ^ ^
T
1
1
4=Ti ,
rp111
s\
1—-H
-f —
i
i
l
N
s.
\
V
\
> . i*
\
s
1
1
4s
Si
>
-+I—l—u
1 10 25 5Time in years—*-
1 | | | |
I
i
1 -
0,1 10 10J 10- 10-' 1Ob
Time in h —.Regression curve according to Din 8078 (1989)Hostalen PPH 2222 34 LS / 4122 LS Status:1990
Figure 5.8: Creep data for Pipe A at 80°C (•),95°C (•) and 120°C ( A ) . Opencircles indicate DIN test conditions.
Table 5.3 summarizes the results for 95°C and 120°C. The data for pipe A is alsoplotted in Figure 5.8. All pipes fail both DIN and JASWIC specifications at 120°C.However, only Pipe B fails the 95 °C DIN 8078 (1989) specification.
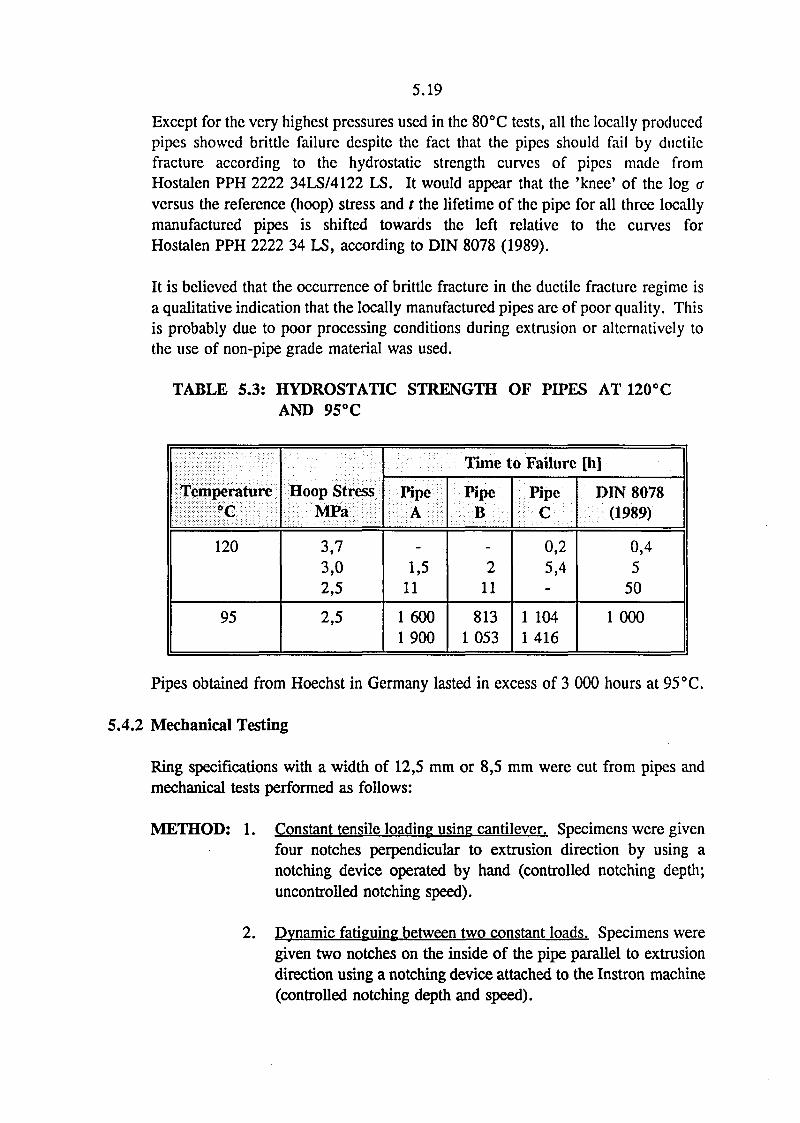
5.19
Except for the very highest pressures used in the 80°C tests, all the locally producedpipes showed brittle failure despite the fact that the pipes should fail by ductilefracture according to the hydrostatic strength curves of pipes made fromHostalen PPH 2222 34LS/4122 LS. It would appear that the 'knee' of the log aversus the reference (hoop) stress and t the lifetime of the pipe for all three locallymanufactured pipes is shifted towards the left relative to the curves forHostalen PPH 2222 34 LS, according to DIN 8078 (1989).
It is believed that the occurrence of brittle fracture in the ductile fracture regime isa qualitative indication that the locally manufactured pipes are of poor quality. Thisis probably due to poor processing conditions during extrusion or alternatively tothe use of non-pipe grade material was used.
TABLE 5.3: HYDROSTATIC STRENGTH OF PIPES AT 120°CAND 95°C
Temperature°C
120
95
Hoop StressMPa
3,73,02,5
2,5
Time to Failure [h]
PipeA
1,511
1 6001900
PipeB
211
8131053
PipeC
0,25,4
1 1041416
DIN 8078(1989)
0,45
50
1 000
Pipes obtained from Hoechst in Germany lasted in excess of 3 000 hours at 95°C.
5.4.2 Mechanical Testing
Ring specifications with a width of 12,5 mm or 8,5 mm were cut from pipes andmechanical tests performed as follows:
METHOD: 1. Constant tensile loading using cantilever. Specimens were givenfour notches perpendicular to extrusion direction by using anotching device operated by hand (controlled notching depth;uncontrolled notching speed).
Dynamic fatiguing between two constant loads. Specimens weregiven two notches on the inside of the pipe parallel to extrusiondirection using a notching device attached to the Instron machine(controlled notching depth and speed).
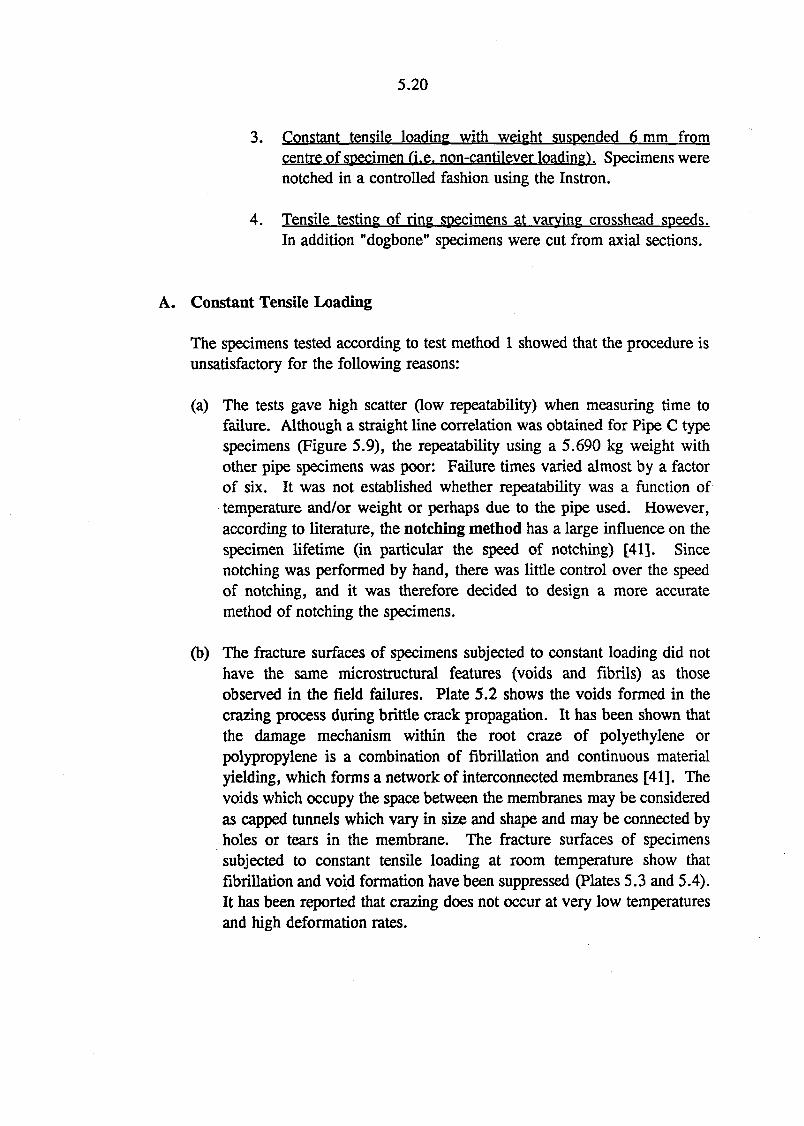
5.20
3. Constant tensile loading with weight suspended 6 mm fromcentre of specimen (i.e. non-cantilever loading). Specimens werenotched in a controlled fashion using the Instron.
4. Tensile testing of ring specimens at varying crosshead speeds.In addition "dogbone" specimens were cut from axial sections.
A. Constant Tensile Loading
The specimens tested according to test method 1 showed that the procedure isunsatisfactory for the following reasons:
(a) The tests gave high scatter (low repeatability) when measuring time tofailure. Although a straight line correlation was obtained for Pipe C typespecimens (Figure 5.9), the repeatability using a 5.690 kg weight withother pipe specimens was poor: Failure times varied almost by a factorof six. It was not established whether repeatability was a function oftemperature and/or weight or perhaps due to the pipe used. However,according to literature, the notching method has a large influence on thespecimen lifetime (in particular the speed of notching) [41]. Sincenotching was performed by hand, there was little control over the speedof notching, and it was therefore decided to design a more accuratemethod of notching the specimens.
(b) The fracture surfaces of specimens subjected to constant loading did nothave the same microstructural features (voids and fibrils) as thoseobserved in the field failures. Plate 5.2 shows the voids formed in thecrazing process during brittle crack propagation. It has been shown thatthe damage mechanism within the root craze of polyethylene orpolypropylene is a combination of fibrillation and continuous materialyielding, which forms a network of interconnected membranes [41]. Thevoids which occupy the space between the membranes may be consideredas capped tunnels which vary in size and shape and may be connected byholes or tears in the membrane. The fracture surfaces of specimenssubjected to constant tensile loading at room temperature show thatfibrillation and void formation have been suppressed (Plates 5.3 and 5.4).It has been reported that crazing does not occur at very low temperaturesand high deformation rates.
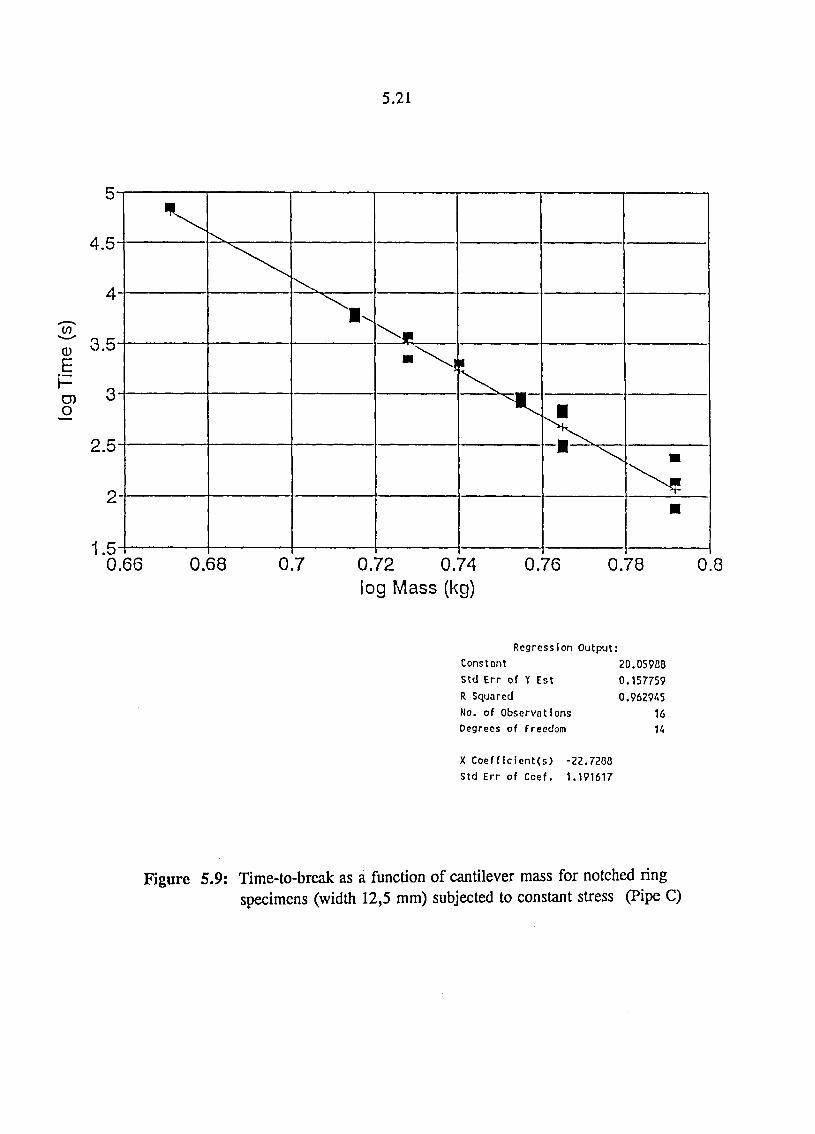
5.21
0)
E
4.5
4
3.5
3
2.5
1.5
1
•
0.66 0.68 0.7 0.72log Mass
0.74 0.76 0(kg)
Regression Output:ConstantStd Err of Y EstR SquaredNo. of ObservationsDegrees of Freedom
X Coefficient(s) -22.7200Std Err of Coef. 1.191617
.78
20.059000.1577590.962945
16H
0.8
Figure 5.9: Time-to-break as a function of cantilever mass for notched ringspecimens (width 12,5 mm) subjected to constant stress (Pipe C)
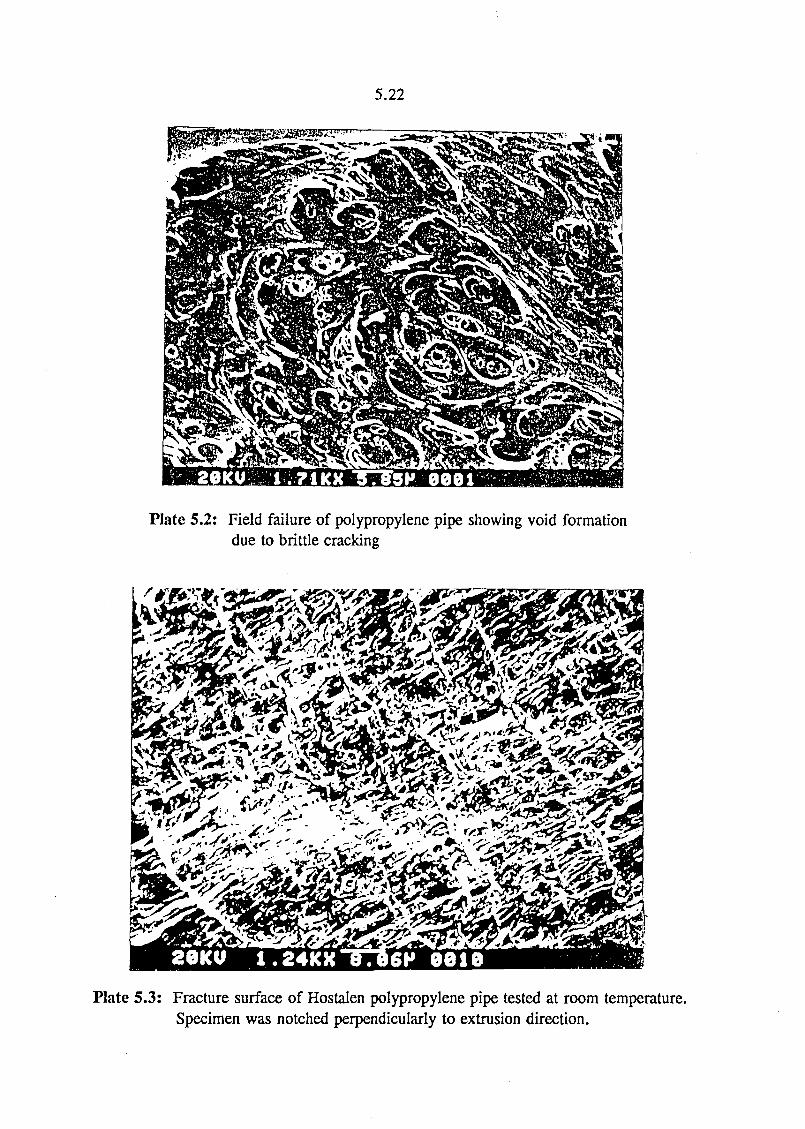
5.22
Plate 5.2: Field failure of polypropylene pipe showing void formationdue to brittle cracking
Plate 5.3: Fracture surface of Hostalen polypropylene pipe tested at room temperature.Specimen was notched perpendicularly to extrusion direction.
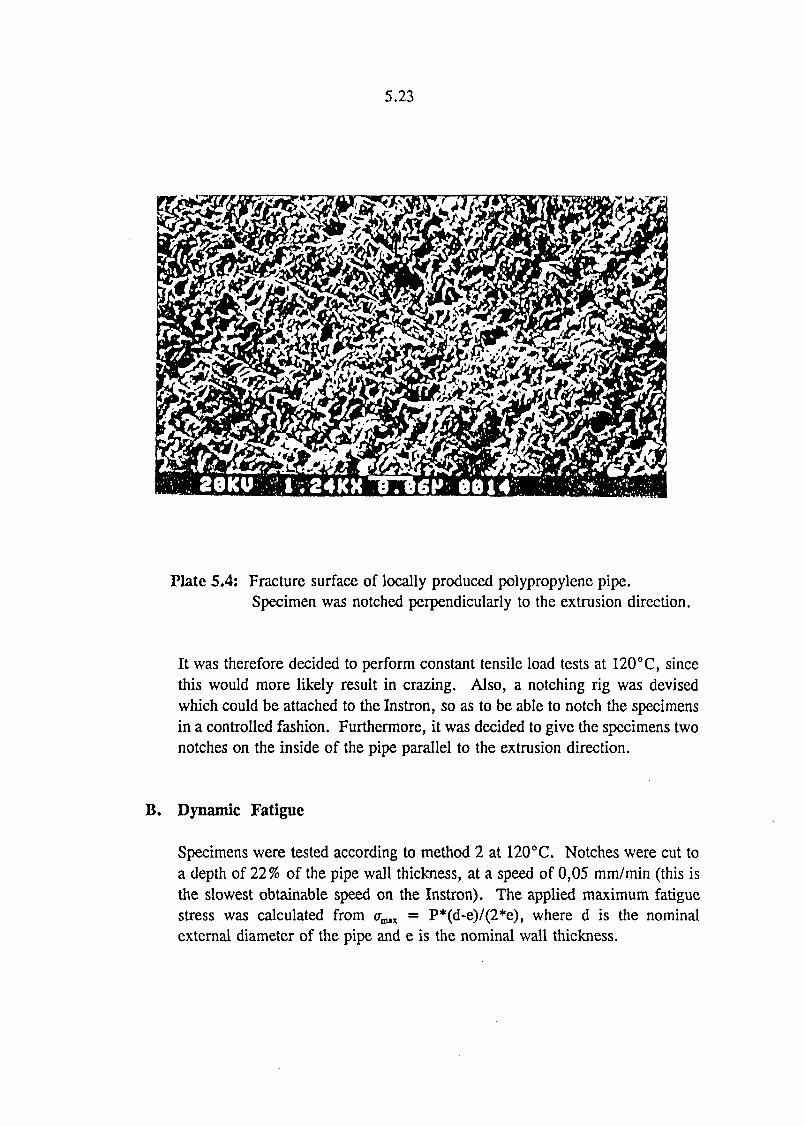
5.23
Plate 5.4: Fracture surface of locally produced polypropylene pipe.Specimen was notched perpendicularly to the extrusion direction.
It was therefore decided to perform constant tensile load tests at 120°C, sincethis would more likely result in crazing. Also, a notching rig was devisedwhich could be attached to the Instron, so as to be able to notch the specimensin a controlled fashion. Furthermore, it was decided to give the specimens twonotches on the inside of the pipe parallel to the extrusion direction.
B. Dynamic Fatigue
Specimens were tested according to method 2 at 120°C. Notches were cut toa depth of 22% of the pipe wall thickness, at a speed of 0,05 mm/min (this isthe slowest obtainable speed on the Instron). The applied maximum fatiguestress was calculated from o ^ = P*(d-e)/(2*e), where d is the nominalexternal diameter of the pipe and e is the nominal wall thickness.
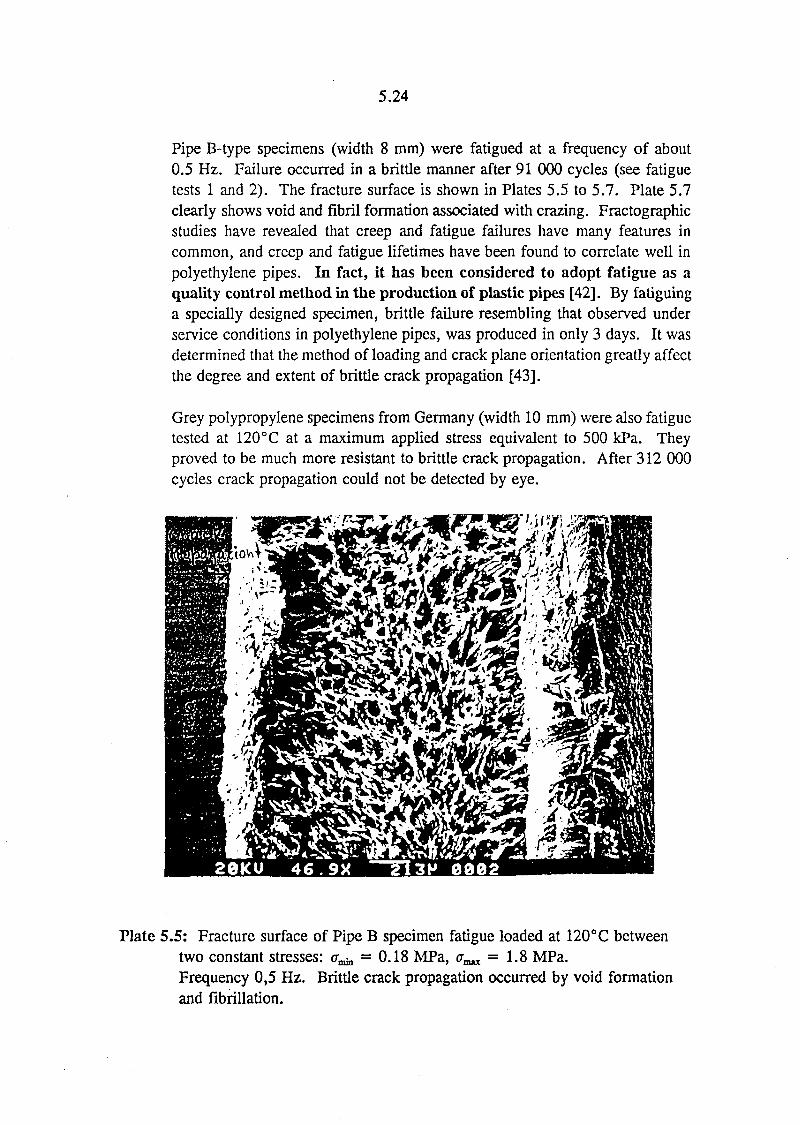
5.24
Pipe B-type specimens (width 8 mm) were fatigued at a frequency of about0.5 Hz. Failure occurred in a brittle manner after 91 000 cycles (see fatiguetests 1 and 2). The fracture surface is shown in Plates 5.5 to 5.7. Plate 5.7clearly shows void and fibril formation associated with crazing. Fractographicstudies have revealed that creep and fatigue failures have many features incommon, and creep and fatigue lifetimes have been found to correlate well inpolyethylene pipes. In fact, it has been considered to adopt fatigue as aquality control method in the production of plastic pipes [42]. By fatiguinga specially designed specimen, brittle failure resembling that observed underservice conditions in polyethylene pipes, was produced in only 3 days. It wasdetermined that the method of loading and crack plane orientation greatly affectthe degree and extent of brittle crack propagation [43].
Grey polypropylene specimens from Germany (width 10 mm) were also fatiguetested at 120°C at a maximum applied stress equivalent to 500 kPa. Theyproved to be much more resistant to brittle crack propagation. After 312 000cycles crack propagation could not be detected by eye.
Plate 5.5: Fracture surface of Pipe B specimen fatigue loaded at 120°C betweentwo constant stresses: o ^ = 0.18 MPa, a^ =1 .8 MPa.Frequency 0,5 Hz. Brittle crack propagation occurred by void formationand fibrillation.
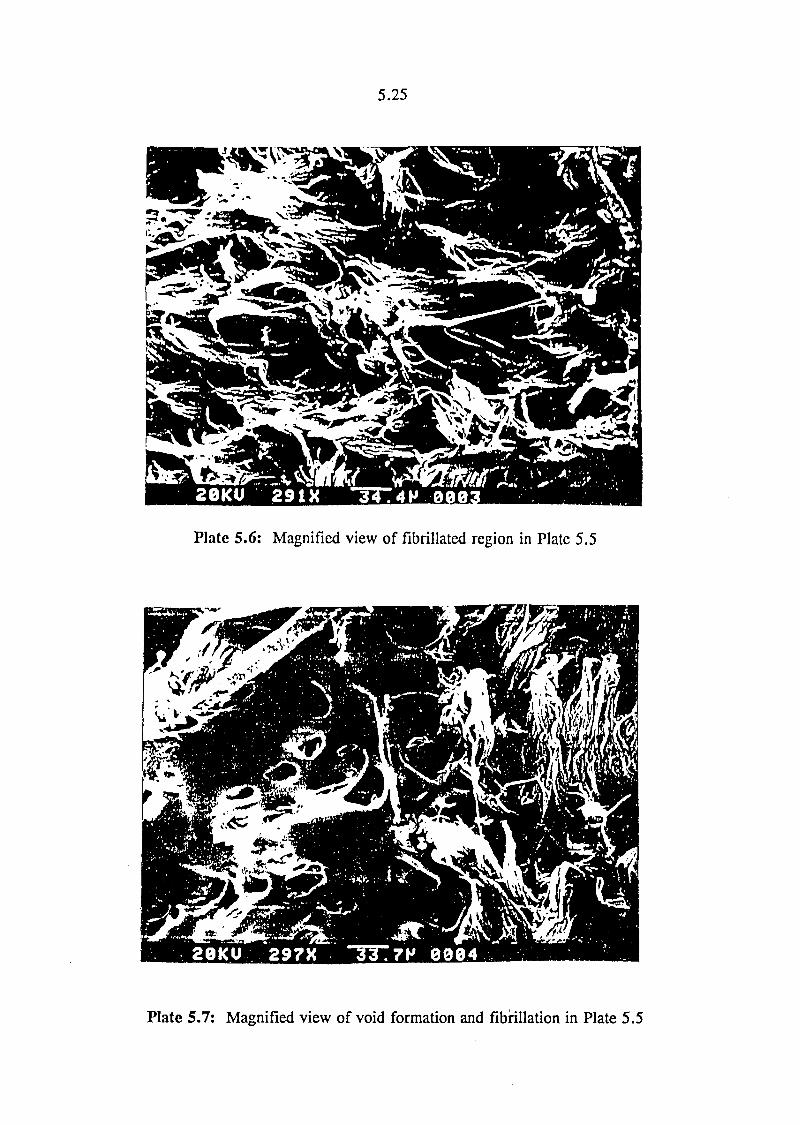
5.25
Plate 5.6: Magnified view of fibrillated region in Plate 5.5
Plate 5.7: Magnified view of void formation and fibrillation in Plate 5.5

5.26
A Pipe B-type specimen (width 8 mm) was tested according to method 3 at120°C. The time to failure was not monitored accurately since it was themode of failure that was of interest. The specimen failed in a brittle fashionand the fracture surface is shown in Plates 5.8 to 5.9. The time to failurewhich can be accurately monitored using a computer, is between 101-152hours. It can be seen that microstructural features do exhibit fibrillation buton a smaller scale compared to the fatigued specimen.
Plate 5.8: Fracture surface of Pipe B-type specimen subjected to constant tensileloading at 120°C: a = 1.8 MPa. Fracture occurred due to brittle cracking.
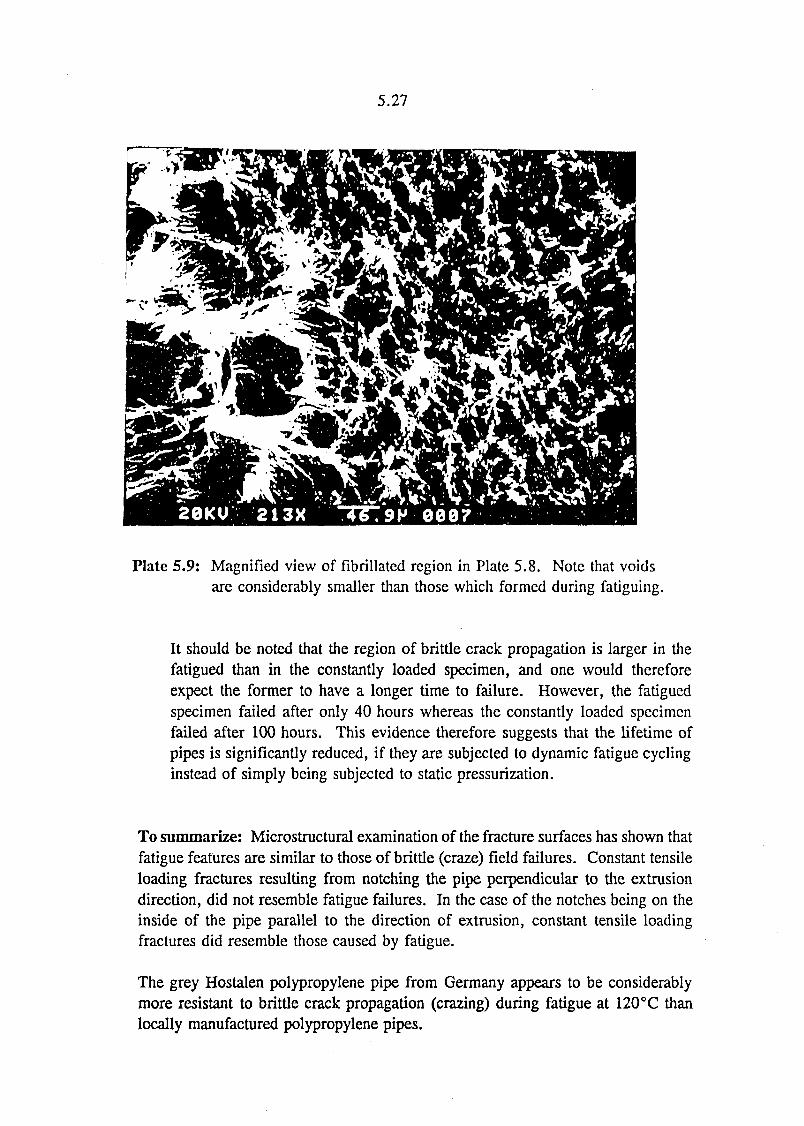
5.27
Plate 5.9: Magnified view of fibrillated region in Plate 5.8. Note that voidsare considerably smaller than those which formed during fatiguing.
It should be noted that the region of brittle crack propagation is larger in thefatigued than in the constantly loaded specimen, and one would thereforeexpect the former to have a longer time to failure. However, the fatiguedspecimen failed after only 40 hours whereas the constantly loaded specimenfailed after 100 hours. This evidence therefore suggests that the lifetime ofpipes is significantly reduced, if they are subjected to dynamic fatigue cyclinginstead of simply being subjected to static pressurization.
To summarize: Microstructural examination of the fracture surfaces has shown thatfatigue features are similar to those of brittle (craze) field failures. Constant tensileloading fractures resulting from notching the pipe perpendicular to the extrusiondirection, did not resemble fatigue failures. In the case of the notches being on theinside of the pipe parallel to the direction of extrusion, constant tensile loadingfractures did resemble those caused by fatigue.
The grey Hostalen polypropylene pipe from Germany appears to be considerablymore resistant to brittle crack propagation (crazing) during fatigue at 120°C thanlocally manufactured polypropylene pipes.
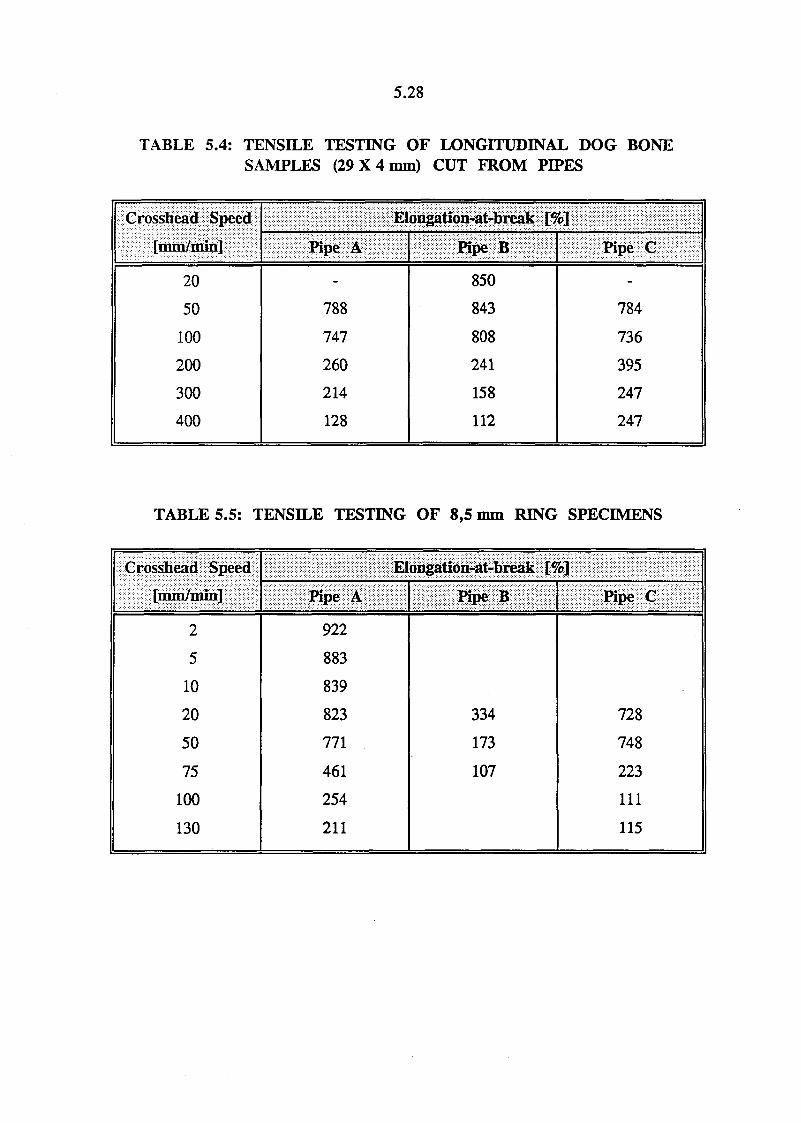
5.28
TABLE 5.4: TENSILE TESTING OF LONGITUDINAL DOG BONESAMPLES (29X4 mm) CUT FROM PIPES
Crosshead Speed
[mm/min]
20
50
100
200
300
400
Elongation-at-break [%]
Pipe A
788
747
260
214
128
Pipe B
850
843
808
241
158
112
Pipe C
784
736
395
247
247
TABLE 5.5: TENSILE TESTING OF 8,5 mm RING SPECIMENS
Crosshead Speed
[mm/min]
2
5
10
20
50
75
100
130
Pipe A
922
883
839
823
771
461
254
211
Elongation-at-break [%]
Pipe B
334
173
107
Pipe C
728
748
223
111
115
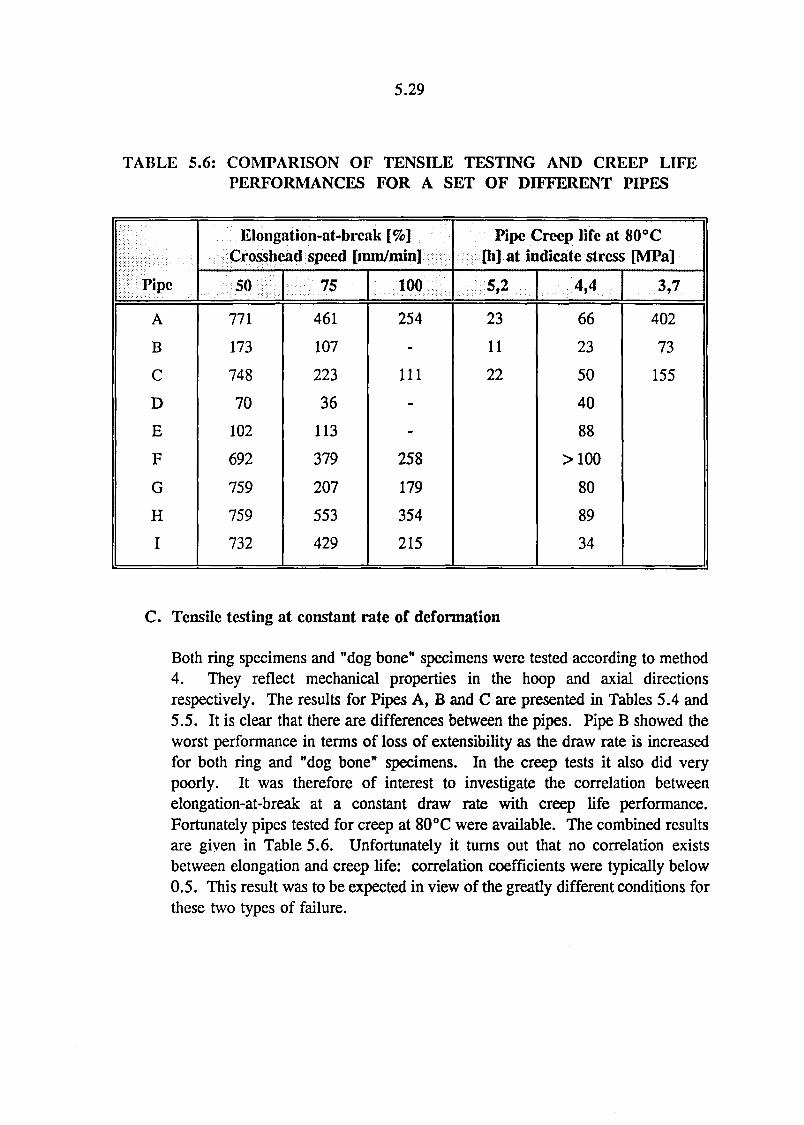
5.29
TABLE 5.6: COMPARISON OF TENSILE TESTING AND CREEP LIFEPERFORMANCES FOR A SET OF DIFFERENT PIPES
Pipe
A
B
C
D
E
F
G
H
I
Elongation-at-brenk [%]Crosshead speed [mm/min]
50
771
173
748
70
102
692
759
759
732
75
461
107
223
36
113
379
207
553
429
100
254
111
258
179
354
215
Pipe Creep life at 80°CPi] at indicate stress [MPa]
23
11
22
4,4
66
23
50
40
88
>100
80
89
34
3,7
402
73
155
C. Tensile testing at constant rate of deformation
Both ring specimens and "dog bone" specimens were tested according to method4. They reflect mechanical properties in the hoop and axial directionsrespectively. The results for Pipes A, B and C are presented in Tables 5.4 and5.5. It is clear that there are differences between the pipes. Pipe B showed theworst performance in terms of loss of extensibility as the draw rate is increasedfor both ring and "dog bone" specimens. In the creep tests it also did verypoorly. It was therefore of interest to investigate the correlation betweenelongation-at-break at a constant draw rate with creep life performance.Fortunately pipes tested for creep at 80 °C were available. The combined resultsare given in Table 5.6. Unfortunately it turns out that no correlation existsbetween elongation and creep life: correlation coefficients were typically below0.5. This result was to be expected in view of the greatly different conditions forthese two types of failure.
5.30
5.5 Crazing of Polypropylene
Following discussions with Dr Fleissner [44] it was established that Hoechst hadalready abandoned the mechanical testing route to a quick quality control method forpolypropylene pipes. The initial correlation established for polyethylene pipes [20]is still being used successfully for both quality control of existing pipes and fordeveloping improved raw materials at Hoechst. The Hoechst research on this topic[44] showed that no correlation existed between time-to-failure of notched specimensin tensile testing and the creep lifetime of polypropylene pipes under hydrostaticpressure. The reason for this is not clearly understood. It is believed that the crazing("brittle") failure mode of polypropylene is difficult to simulate in accelerated tensiletests.
During consultations with Dr Fleissner, it was decided that it could be useful toinvestigate ways to accelerate the crazing of polypropylene. It is well known thatpolyethylene is subject to solvent stress cracking failures. This failure mode is lessof a problem with polypropylene.
The most "promising" media for inducing stress cracking of polypropylene wereidentified in collaboration with Rapra as follows:
- Igepal detergent at 60°C
- Igepal/Ethylene glycol (50/50) at 115°C
- Chromic acid 20% at 40°C- Chloroform at 25 °C
Samples of polypropylene pipes were tested for environmental stress crack resistanceusing ASTM F1248-89. In this method ring specimens are notched in the hoopdirection. They are then clamped between parallel plates and submerged in thecrazing medium. In the present tests the gap between the calming plates adjusted to4 times the pipe wall thickness. Clamping of Pipe B resulted in craze formation evenbefore immersion. All the other pipes lasted for four weeks or more, the tests beingabandoned due to the long times to failure.
5.6 Conclusions
The service life of polypropylene pipes is limited by two independent failure modes.Creep rupture is a ductile failure mode occurring at high stresses and short life timeswhile "brittle" craze failure occurs at low stress levels and longer times. Accordingto the literature, the time-to-failure for the latter mechanism is more sensitive toparameters such as molecular weight, molecular weight distribution and crystalmorphology than the ductile failure mode. Quality testing should test in the "brittle"fracture regime as this mode limits service life under normal operating conditions.

5.31
These trends arc summarized in Figure 5.10 showing the shift in the failure envelopesunder unfavourable conditions [31]. Such conditions may involve the followingprocessing and material factors:
- Surface flaws (e.g. scratches or notches)
- Decrease in molecular weight (Using the wrong grade of polymer, degradationduring processing, use of recycled material or oxidative degradation.)
- Unfavourable morphologies e.g. orientation effects (e.g. too fast haul-off), largespherulites etc.
- Stress concentrators such as contaminants, incompatible filler or pigmentparticles, use of incompatible carriers in master batches etc.
- Environmental stress cracking agents such as hydrocarbons.
C/)
QJcrI -C/)
DUCTILE
FAILURE
_ .
FAILUREUNLIKELY
FAILUREINEVITABLE
^ ^ -v\ \
» \ BRITTLE
* FAILURE \ FAILURE\ LIKELY \\ \\ \\ c \\ DISPLACEMENT
OF LIFE TIME. CURVE
LOG (TIME)
Figure 5.10: Schematic illustration of changes in the stresstime-to-failure envelopes [31]
5.32
Actual performance of locally produced pipes were inferior to those of pipes obtainedfrom Germany. With few exceptions, they all fail prematurely relative to the relevantcreep curve predictions.
Mechanical tests typically did not correlate well with creep life performance. Thismay well be due to the poor correspondence in the failure process and the differencein morphologies that result. Fatigue testing showed a greater promise in that themorphology of failure surfaces corresponded roughly to the morphologies of craze-cracks generated during creep rupture experiments.
However, further work will be required to demonstrate that a correlation, useful forquality control purposes, actually exists.
Investigations into the possibility of generating solvent crazes using a variety ofenvironmental stress cracking agents proved futile. The high molecular weight pipegrade material apparently has an excellent resistance to this type of failure mode.
5.33
5.5 References
1. W Strobel, "Polypropylene (PP)\ Kunstoffe, 77 (1987) 967.
2. M L Kasakevich, "Polyolefine als Werkstoffe fur Rohre", Kunstoffe,80 (1990) 54.
3. S J Madox and S Manteghi, Plastics, Rubbers and Composites Processingand Applications, 17 (1992) 5.
4. C G Bragaw, Proc. 8th Plastic Fuel Gas Pipe Symposium, 44 (1981).
5. RBloor, Plast. TechnoL, 27 (19Z3) S3.
6. N Brown, J Donofrio and X Lu, Polymer, 28 (1987) 1326.
7. N Brown, "Creep, Stress Relaxation and Yielding", in EngineeredMaterials Handbook, Vol. 2, Engineering Plastics, ASM International,Metals Park, Ohio (1988).
8. I M Ward, Mechanical Properties of Polymers (2nd Ed.), John Wiley,Chichester (1974).
9. A J Kinloch and R J Young, Fracture Behaviour of Polymers, Elsevier,London (1983).
10. G Halsley, H J White and H Eyring, Text. Res. J., 15 (1945) 295.
11. S N Zhurkov, Int. J. Fract. Mech., 1 (1965) 210.
12. E Gaube et al., Kunstoffe, 75 (1985) 412.
13. C H Popelar, V H Kanner and J P Wooster, Pol. Eng. ScL, 31 (1991)1693.
14. H Gebler, "Langzeitverhaltenand AlterungvonVE-HD-Rohren", Kunstoffe79 (1989) 823.
15. H Gebler, Kunstoffe, 73 (1983) 73.
16. A Dorsch, Z. Werkstoffiech., 15 (1984) 172-176.
17. R Popli and L Mandelkern, J. Pol. Sci. Pol. Phys., 25 (1987) 441.
18. J I Kruschwitz (Ed.), Polymers: An Encyclopedic Source Book ofEngineering Properties, John Wiley, New York, (1987) p. 371.
5.34
19. HHKausch (Ed.), Adv. Pol. Sci., 52/53 (1983) Crazing in Polymers,Springer Verlag, Berlin (1983).
20. M Fleissner, Kunstoffe, 77 (1987) 45.
21. A G Evans, J. Mater. Sci., 7 (1972) 1137.
22. A G Evans, Int. J. Fract., 9 (1973) 267.
23. J L Way, J R Atkinson and J Nutting, J. Mater. Sci., 9 (1974) 293.
24. K Friedrich, Progr. Colloid & Polymer Sci., 64 (1978) 103.
25. G Menges and E Alf, Kunstoffe, 62 (1972) 259.
26. EHornbogen and K Friedrich, / . Material Sci., 15 (1980) 2175.
27. P J Flory, / . Amer. Chem. Soc, 67 (1945) 2048.
28. P Vincent, Polymer, 1 (1960) 425.
29. E Gaube, Kunstoffe, 63 (1973) 391.
30. L J Broutman, Plastic Pipeline, 3 (1983) 1.
31. S Turner, "Mechanical Testing", in Engineered Materials Handbook, Vol.2, Engineering Plastics ASM International, Metals Park, Ohio (1988).
32. BE Read, G D Dean and P E Tomlins, Polymer, 29 (1988) 2159.
33. H Weidner and R Tilger, "Alterungsvorhersagen bei Kunstoffen -Charaktensiening von Alterungszustaden" Kunstoffe, 70 (1980) 837.
34. R P Kambour and R R Russell, Polymer, 12 (1971) 237.
35. HPfeiffer, H R Sasse and I Schrage, Kunstoffe, 69 (1979) 411-415.
36. G Steiner and J Koppelmann, Kunstoffe, T7 (1987) 286-288.
37. B Kempe and J Hessel, Schweissen und Schneiden, 42 (1990) 182-185.
38. G C Marko and G Butters, J. Macromol. ScL-Chem., A12 (1978) 569.
39. G Steiner and J Koppelmann, Kunstoffe, 77 (1987) 286.
40. J Meinhard and H Gerber, Plastverarbeiter, 30 (1070) 766.
5.35
41. X Lu, R Qian and N Brown, J. of Mat. Sci., 26 (1001) 881.
42. P Reynolds and C Lawrence, J. of Mat. Sci, 26 (1991) 6197.
43. J Strebel and A Moet, J. of Mat. Sci, 26 (1991) 5671.
44. Meeting with Dr Manfred Fleissner (Hoechst) in Frankfurt on6 November 1992.
45. G Schoolenberg, Materialen 5 (1990) 9.
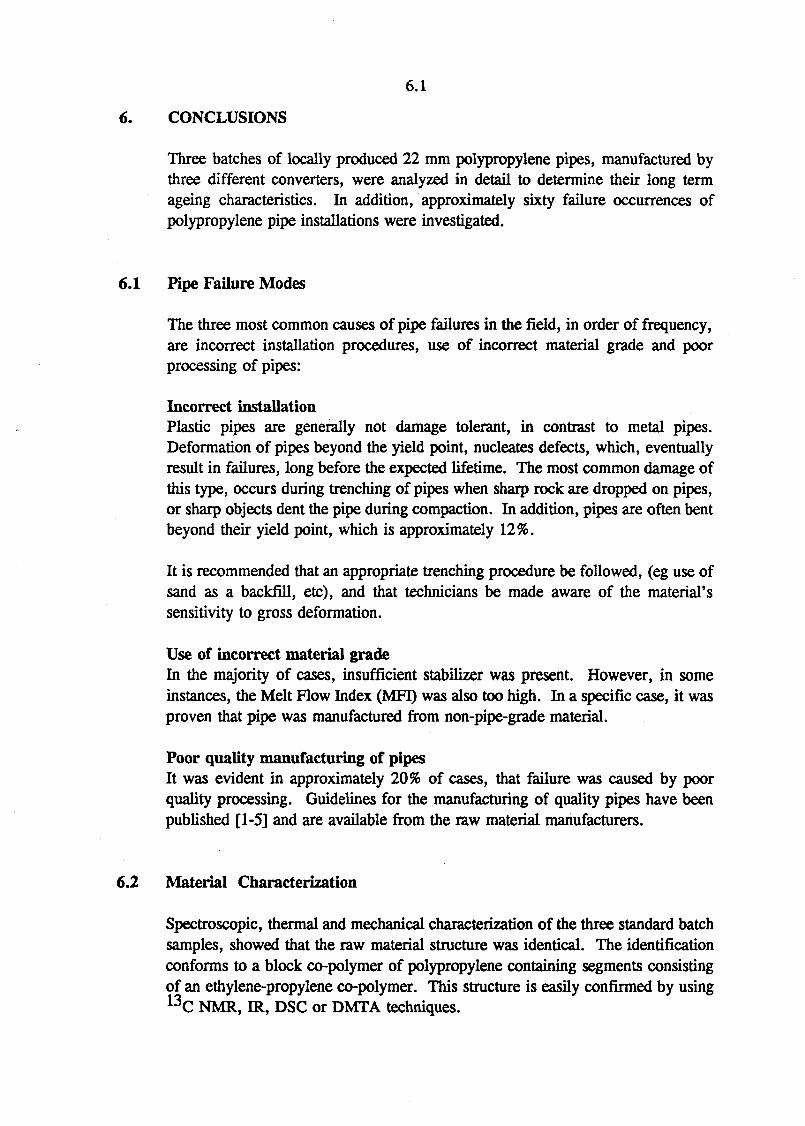
6.1
6. CONCLUSIONS
Three batches of locally produced 22 mm polypropylene pipes, manufactured bythree different converters, were analyzed in detail to determine their long termageing characteristics. In addition, approximately sixty failure occurrences ofpolypropylene pipe installations were investigated.
6.1 Pipe Failure Modes
The three most common causes of pipe failures in the field, in order of frequency,are incorrect installation procedures, use of incorrect material grade and poorprocessing of pipes:
Incorrect installationPlastic pipes are generally not damage tolerant, in contrast to metal pipes.Deformation of pipes beyond the yield point, nucleates defects, which, eventuallyresult in failures, long before the expected lifetime. The most common damage ofthis type, occurs during trenching of pipes when sharp rock are dropped on pipes,or sharp objects dent the pipe during compaction. In addition, pipes are often bentbeyond their yield point, which is approximately 12%.
It is recommended that an appropriate trenching procedure be followed, (eg use ofsand as a backfill, etc), and that technicians be made aware of the material'ssensitivity to gross deformation.
Use of incorrect material gradeIn the majority of cases, insufficient stabilizer was present. However, in someinstances, the Melt Flow Index (MFI) was also too high. In a specific case, it wasproven that pipe was manufactured from non-pipe-grade material.
Poor quality manufacturing of pipesIt was evident in approximately 20% of cases, that failure was caused by poorquality processing. Guidelines for the manufacturing of quality pipes have beenpublished [1-5] and are available from the raw material manufacturers.
6.2 Material Characterization
Spectroscopic, thermal and mechanical characterization of the three standard batchsamples, showed that the raw material structure was identical. The identificationconforms to a block co-polymer of polypropylene containing segments consistingof an ethylene-propylene co-polymer. This structure is easily confirmed by using13C NMR, IR, DSC or DMTA techniques.
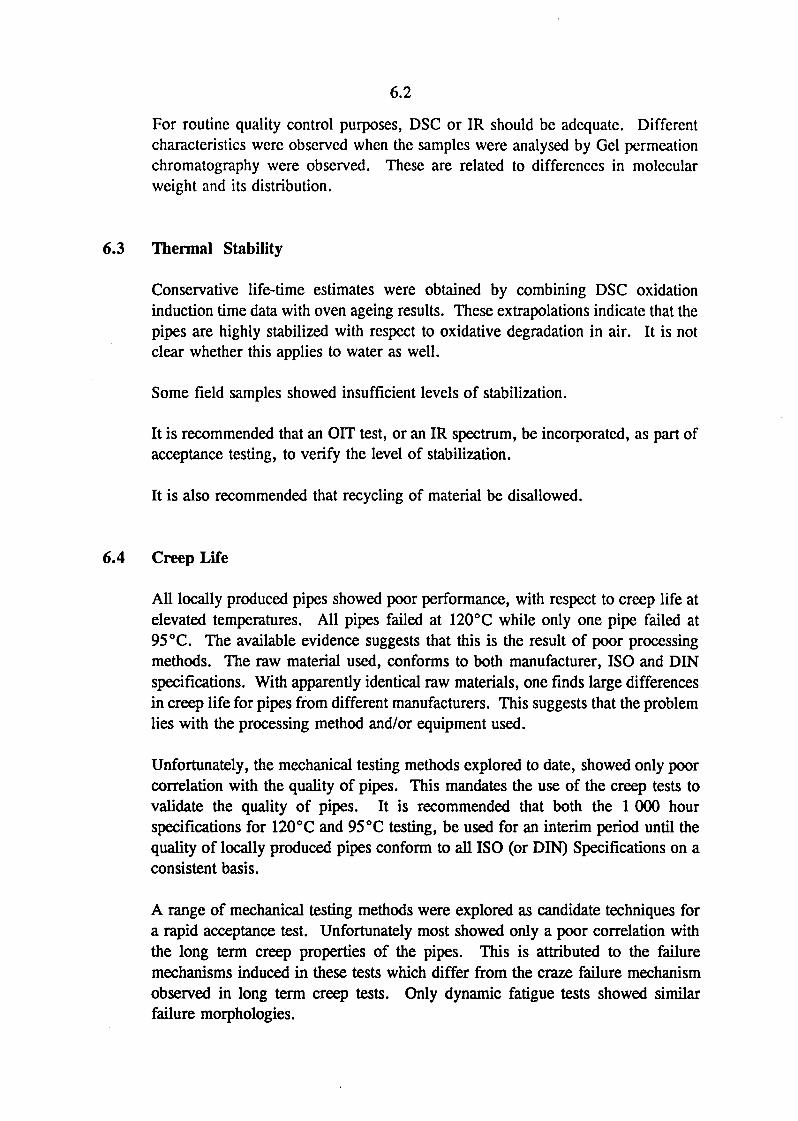
6.2
For routine quality control purposes, DSC or IR should be adequate. Differentcharacteristics were observed when the samples were analysed by Gel permeationchromatography were observed. These are related to differences in molecularweight and its distribution.
6.3 Thermal Stability
Conservative life-time estimates were obtained by combining DSC oxidationinduction time data with oven ageing results. These extrapolations indicate that thepipes are highly stabilized with respect to oxidative degradation in air. It is notclear whether this applies to water as well.
Some field samples showed insufficient levels of stabilization.
It is recommended that an OIT test, or an IR spectrum, be incorporated, as part ofacceptance testing, to verify the level of stabilization.
It is also recommended that recycling of material be disallowed.
6.4 Creep Life
All locally produced pipes showed poor performance, with respect to creep life atelevated temperatures. All pipes failed at 120°C while only one pipe failed at95°C. The available evidence suggests that this is the result of poor processingmethods. The raw material used, conforms to both manufacturer, ISO and DINspecifications. With apparently identical raw materials, one finds large differencesin creep life for pipes from different manufacturers. This suggests that the problemlies with the processing method and/or equipment used.
Unfortunately, the mechanical testing methods explored to date, showed only poorcorrelation with the quality of pipes. This mandates the use of the creep tests tovalidate the quality of pipes. It is recommended that both the 1 000 hourspecifications for 120°C and 95°C testing, be used for an interim period until thequality of locally produced pipes conform to all ISO (or DIN) Specifications on aconsistent basis.
A range of mechanical testing methods were explored as candidate techniques fora rapid acceptance test. Unfortunately most showed only a poor correlation withthe long term creep properties of the pipes. This is attributed to the failuremechanisms induced in these tests which differ from the craze failure mechanismobserved in long term creep tests. Only dynamic fatigue tests showed similarfailure morphologies.
6.3
6.5 References
1. H Gebler, H O Schiedrum, E Oswald and W Kamp, Kunstoffe 70 (1980)186.
2. H Gebler, H O Schiedrum, E Oswald and W Kamp, Kunstoffe 70 (1980)264.
3. H Gebler, H O Schiedrum, E Oswald and W Kamp, Kunstoffe 70 (1980)390.
4. W Kamp and H-D Kurz, Kunstoffe 70 (1980) 257.
5. O Lippi, PP Pipe extrusion, 19 April 1994 (Attached as Appendix B)
7.1
7. RECOMMENDATIONS
7.1 Recommendations for Further Research
During the course of this investigation the following topics worthy of further researchwere noted:
Dynamic fatigue as a predictor for long term life
Dynamic fatigue tests of ring specimens stressed at levels corresponding toDIN static fatigue levels showed failure morphologies similar to creep failureand resulted in failure times in the order of a few days. It is recommendedthat a dynamic test rig based on a low cost pneumatic system be devised toallow extensive testing of pipes. These results should be cross-correlated withstatic fatigue failure times obtained with the 1 000 hour 95 °C DIN 8078(1992) test (hoop stress: 2,65 MPa).
Validation of the IR test for antioxidant concentration
It is recommended that this test be conducted in conjunction with standard OITtesting for a period of one year. After this time, an assessment of theirrespective merits should be made.
Effect of locally produced iron/oxide based pigments on polymer stabilization
It is known that some metals catalyze the degradation of antioxidants andpolypropylene. Care should be taken that only pure iron oxide pigments beused.
High moisture absorbtion levels of pipes
It is not clear whether this phenomenon has an influence on pipe quality.
Effect of water and dissolved salts on thermal oxidation stability
Further work could provide an indication of the severity of this effect.
7.2 Suggestions for the Implementation of a Comprehensive Quality Control System
The varied reasons for polypropylene pipe failures indicates that a comprehensivesystems approach is required to remedy the situation. It is recommended that aquality control system be implemented as follows:
7.2
A. Quality raw material
Lingering doubts remain regarding the effect of the stabilizer systcm(s) usedlocally. It is recommended that pipe be manufactured both locally and abroadusing both locally and overseas raw materials under identical processingconditions. These pipes should then be qualified using the DIN 8078 (1992)quality control tests. The results from these tests should provide a goodindication of the raw material suitability vfs-a-vfs the adequacy of localmanufacturing techniques.
In addition, it is recommended that the replacement of the current block-copolymer grade with the more suitable random copolymer pipe grade beinvestigated. The latter provides better long term creep life at comparablehoop stress levels and is apparently also easier to process into pipes.
B. Implementation of Quality Manufacturing Techniques [1-5]
Locally produced pipes are often made using unsuitable machinery and/orinappropriate processing conditions. It is recommended that a completequality control system be implemented by manufacturers in terms of the ISO9000 system. This should include a raw material acceptance test as well asquality control tests on the final product. It is suggested that such a systembe phased in over a two year period after which time all pipes should conformto ISO or DIN specifications. Also, it would be advantageous to make use ofpipe manufacturing specialists from Europe to assist with the qualification ofmachinery and processing techniques. It is recommended that the ISO/DINquality tests be implemented to monitor quality improvements during thisperiod.
C. Implementation of a revised Pipe Acceptance Specification
It is recommended that the dynamic fatigue test be validated as a quick test forcreep resistance in the pipe acceptance test. This will require long termtesting of a large number of pipes with differing diameters and properties. Inaddition this test should include revised procedures to evaluate:
the level of antioxidants;the degree of temperature inversion as a measure of built-in stresses.
A draft acceptance specification is given in Appendix A.

7.3
D. Implementation of Codes of Practice for Installation (e.g. trenching) of Pipes[6,7]
It is recommended that appropriate installation procedures (inclusive ofapproved weld bonding techniques) be drafted or selected for implementationby plumbers. This will also require drafting of a suitable course and oftraining of operators over a period of time.
7.4
7.3 References
1. H Gebler, H O Schiedrum, E Oswald and W Kamp, Kunstoffe 70 (1980) 186.
2. H Gebler, H O Schiedrum, E Oswald and W Kamp, Kunstoffe 70 (1980) 264.
3. H Gebler, H O Schiedrum, E Oswald and W Kamp, Kunstoffe 70 (1980) 390.
4. W Kamp and H-D Kurz, Kunstoffe 70 (1980) 257.
5. O Lippi, PP Pipe extrusion, 19 April 1994 (Attached as Appendix B)
6. ASTMD-2774 (1972) Standard Practice for underground installation ofthermoplastic pressure piping.
7. SABS 1200 LD.
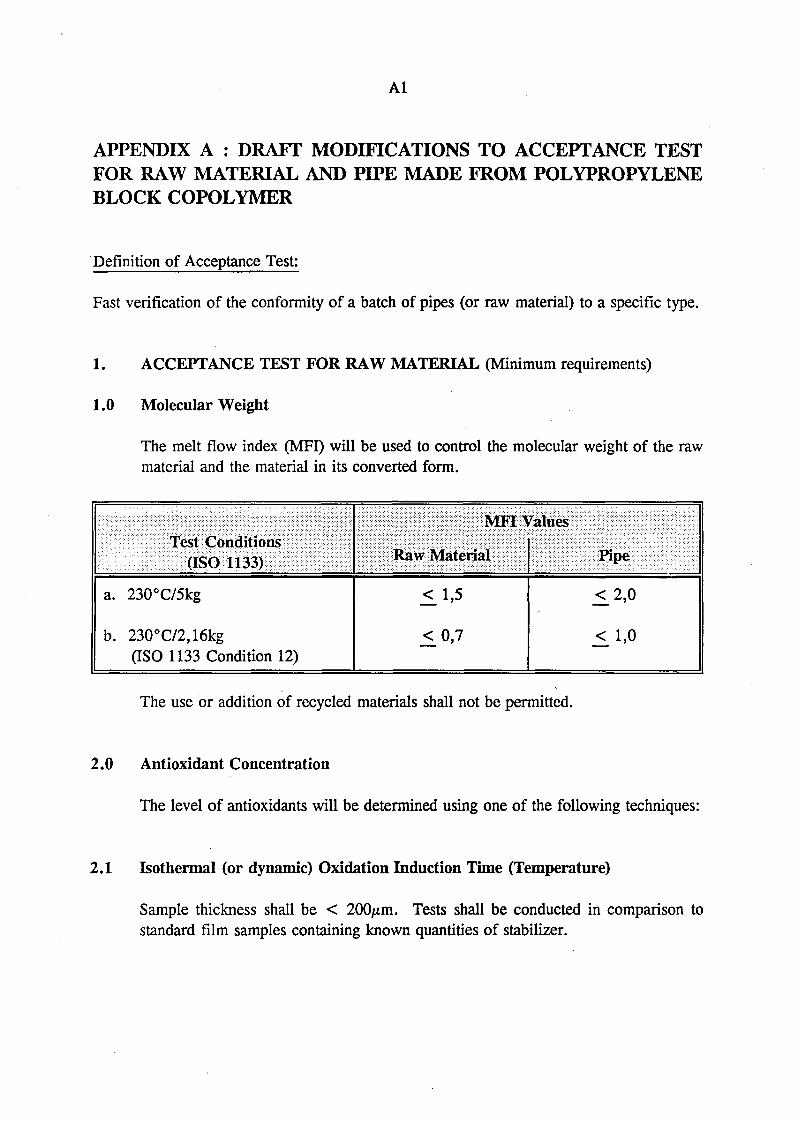
Al
APPENDIX A : DRAFT MODIFICATIONS TO ACCEPTANCE TESTFOR RAW MATERIAL AND PIPE MADE FROM POLYPROPYLENEBLOCK COPOLYMER
Definition of Acceptance Test:
Fast verification of the conformity of a batch of pipes (or raw material) to a specific type.
1. ACCEPTANCE TEST FOR RAW MATERIAL (Minimum requirements)
1.0 Molecular Weight
The melt flow index (MFI) will be used to control the molecular weight of the rawmaterial and the material in its converted form.
Test Conditions(ISO 1133)
MFI Values
Raw Material Pipe
a. 230°C/5kg
b. 230°C/2,16kg(ISO 1133 Condition 12)
< 1,5
< 0,7
<_ 2,0
< 1,0
The use or addition of recycled materials shall not be permitted.
2.0 Antioxidant Concentration
The level of antioxidants will be determined using one of the following techniques:
2.1 Isothermal (or dynamic) Oxidation Induction Time (Temperature)
Sample thickness shall be < 200/tm. Tests shall be conducted in comparison tostandard film samples containing known quantities of stabilizer.
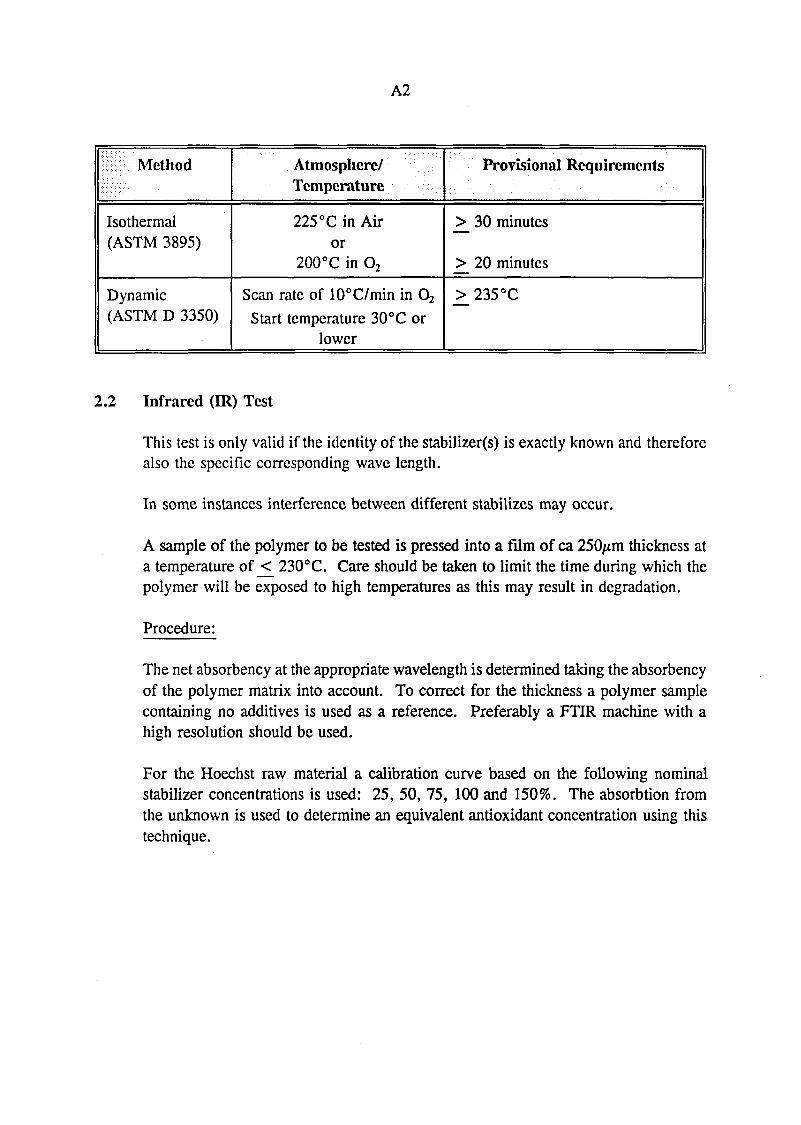
A2
Method
Isothermal(ASTM 3895)
Dynamic(ASTM D 3350)
Atmosphere/Temperature
225 °C in Airor
200°C in O2
Scan rate of 10°C/min in O2
Start temperature 30°C orlower
Provisional Requirements
> 30 minutes
> 20 minutes
_> 235°C
2.2 Infrared (IR) Test
This test is only valid if the identity of the stabilizer(s) is exactly known and thereforealso the specific corresponding wave length.
In some instances interference between different stabilizes may occur.
A sample of the polymer to be tested is pressed into a film of ca 250/xm thickness ata temperature of < 230°C. Care should be taken to limit the time during which thepolymer will be exposed to high temperatures as this may result in degradation.
Procedure:
The net absorbency at the appropriate wavelength is determined taking the absorbencyof the polymer matrix into account. To correct for the thickness a polymer samplecontaining no additives is used as a reference. Preferably a FTIR machine with ahigh resolution should be used.
For the Hoechst raw material a calibration curve based on the following nominalstabilizer concentrations is used: 25, 50, 75, 100 and 150%. The absorbtion fromthe unknown is used to determine an equivalent antioxidant concentration using thistechnique.
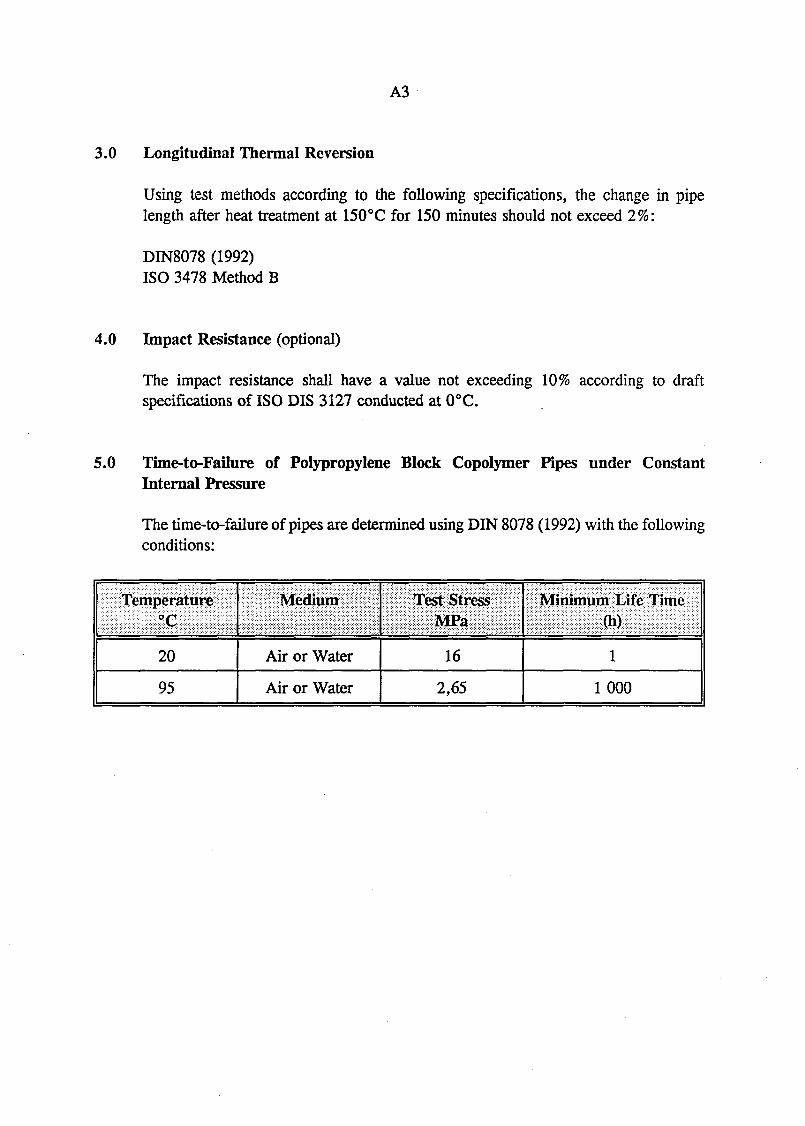
A3
3.0 Longitudinal Thermal Reversion
Using test methods according to the following specifications, the change in pipelength after heat treatment at 150°C for 150 minutes should not exceed 2%:
DIN8078 (1992)ISO 3478 Method B
4.0 Impact Resistance (optional)
The impact resistance shall have a value not exceeding 10% according to draftspecifications of ISO DIS 3127 conducted at 0°C.
5.0 Time-to-Failure of Polypropylene Block Copolymer Pipes under ConstantInternal Pressure
The time-to-failure of pipes are determined using DIN 8078 (1992) with the followingconditions:
Temperature°C
20
95
Medium
Air or Water
Air or Water
Test StressMPa
16
2,65
Minimum Life Time00
1
1000
Bl
APPENDIX B : EXTRUSION OF POLYPROPYLENE PIPES
PP PIPE EXTRUSION
by O Lippi
PLASTOMARK (PTY) LIMITEDTECH CENTRE
INFLUENCE OF COOLING
The heat dissipation of an extruded PP pipe is poor owing to the materials low thermalconductivity. As a result, the post cooling process of the pipe, after exiting from the die,takes longer (compared with PE-HD) and therefore requires a longer residence time in thecooling medium. This does not necessarily relate to reduced outputs, but necessitatesstretched cooling baths and an overall lengthened production lane, when recommendedcooling conditions are employed. In practice this problem is often overcome by theapplication of severe post cooling of the pipe, which allows for shorter cooling lanes andextruder outputs to be increased. This objective, however, is achieved at the expense of pipequality, as a result of internal stress being frozen into the pipe. The life expectancy of sucha pipe will be substantially reduced and evidence thereof will clearly be indicated incomparative hydrostatic pressure test results. Another important physical characteristicwhich will be negatively affected is the pipe's resistance to impact which will be markedlylower than a stress relieved pipe.
COOLING RECOMMENDATIONS
The cooling intensity of the water in the calibration and cooling baths should be accuratelymonitored to allow a degree of stress relaxation to occur after exiting of the pipe from thedie. This objective is achieved by regulation of the cooling medium at approximately 50°Cin both calibration and first cooling baths. Temperatures of subsequent cooling baths maybe reduced ideally to 30°C, but not lower than 20°C. This profile for the cooling mediumis of particular importance when producing small diameter, thin walled pipe at high outputrates, allowing a degree of stress relaxation to occur before the pipe wall solidifies.Molecular orientation is the prime cause of stress formation in a pipe during the extrusionprocess. Tests have shown that pipe exhibiting high levels of stress are generally producedunder compromised conditions of high extrusion speed coupled with excessively high haul-offrates and severe post cooling.
B2
It is also recommended practice to make use of intermittent cooling. This is achieved byintercepting the cooling by spacing water baths (allow 1,5 - 4,0m distance between baths,depending on pipe size and extrusion rate). In the uncooled sections the pipe is partlyannealed by its own remaining internal heat which is given the opportunity to be conductedto the cooled outer surface. In this way internal stresses are considerably reduced. Theimportance of intermittent cooling increases with increasing wall thickness and large diameterpipe should be given two or three such tempering steps. It has been established that the idealtemperature of an extruded pipe as measured on the inside wall of an extruded pipe after thehaul-off, should be approximately 85°C. This temperature provides the guide for the lengthof the entire production lane for a specific pipe type/class, when the recommended coolingconditions are employed.