I am not your Student-Athlete: An Investigation of Social ...
215
Georgia State University Georgia State University ScholarWorks @ Georgia State University ScholarWorks @ Georgia State University Communication Sciences and Disorders Dissertations Department of Communication Sciences and Disorders 5-17-2019 I am not your Student-Athlete: An Investigation of Social Identity I am not your Student-Athlete: An Investigation of Social Identity Complexity as a Stereotype Threat Mitigation Strategy and Complexity as a Stereotype Threat Mitigation Strategy and Individual Differences that may moderate the effect Individual Differences that may moderate the effect Jacob Alan English Georgia State University Follow this and additional works at: https://scholarworks.gsu.edu/epse_diss Recommended Citation Recommended Citation English, Jacob Alan, "I am not your Student-Athlete: An Investigation of Social Identity Complexity as a Stereotype Threat Mitigation Strategy and Individual Differences that may moderate the effect." Dissertation, Georgia State University, 2019. doi: https://doi.org/10.57709/14494431 This Dissertation is brought to you for free and open access by the Department of Communication Sciences and Disorders at ScholarWorks @ Georgia State University. It has been accepted for inclusion in Communication Sciences and Disorders Dissertations by an authorized administrator of ScholarWorks @ Georgia State University. For more information, please contact [email protected].
-
Upload
khangminh22 -
Category
Documents
-
view
2 -
download
0
Transcript of I am not your Student-Athlete: An Investigation of Social ...
Georgia State University Georgia State University
ScholarWorks @ Georgia State University ScholarWorks @ Georgia State University
Communication Sciences and Disorders Dissertations
Department of Communication Sciences and Disorders
5-17-2019
I am not your Student-Athlete: An Investigation of Social Identity I am not your Student-Athlete: An Investigation of Social Identity
Complexity as a Stereotype Threat Mitigation Strategy and Complexity as a Stereotype Threat Mitigation Strategy and
Individual Differences that may moderate the effect Individual Differences that may moderate the effect
Jacob Alan English Georgia State University
Follow this and additional works at: https://scholarworks.gsu.edu/epse_diss
Recommended Citation Recommended Citation English, Jacob Alan, "I am not your Student-Athlete: An Investigation of Social Identity Complexity as a Stereotype Threat Mitigation Strategy and Individual Differences that may moderate the effect." Dissertation, Georgia State University, 2019. doi: https://doi.org/10.57709/14494431
This Dissertation is brought to you for free and open access by the Department of Communication Sciences and Disorders at ScholarWorks @ Georgia State University. It has been accepted for inclusion in Communication Sciences and Disorders Dissertations by an authorized administrator of ScholarWorks @ Georgia State University. For more information, please contact [email protected].

ACCEPTANCE
This dissertation, I AM NOT YOUR STUDENT-ATHLETE: AN INVESTIGATION OF
SOCIAL IDENTITY COMPLEXITY AS A STEREOTYPE THREAT MITIGATION
STRATEGY AND INDIVIDUAL DIFFERENCES THAT MAY MODERATE THE EFFECT,
by JACOB ALAN ENGLISH, was prepared under the direction of the candidate’s Dissertation
Advisory Committee. It is accepted by the committee members in partial fulfillment of the
requirements for the degree, Doctor of Philosophy, in the College of Education & Human
Development, Georgia State University.
The Dissertation Advisory Committee and the student’s Department Chairperson, as
representatives of the faculty, certify that this dissertation has met all standards of excellence and
scholarship as determined by the faculty.
_________________________________
Ann Kruger, Ph.D.
Committee Chair
______________________________ _____________________________________
Rebecca Ellis, Ph.D. Daphne Greenberg, Ph.D.
Committee Member Committee Member
______________________________ ______________________________________
Robert Hendrick, Ph.D. Brian Williams, Ph.D.
Committee Member Committee Member
______________________________
Date
______________________________
Brendan Calandra, Ph.D.
Chairperson, Department of Learning Sciences
______________________________
Paul Alberto, Ph.D.
Dean
College of Education
& Human Development

AUTHOR’S STATEMENT
By presenting this dissertation as a partial fulfillment of the requirements for the advanced degree
from Georgia State University, I agree that the library of Georgia State University shall make it
available for inspection and circulation in accordance with its regulations governing materials of
this type. I agree that permission to quote, to copy from, or to publish this dissertation may be
granted by the professor under whose direction it was written, by the College of Education and
Human Development’s Director of Graduate Studies, or by me. Such quoting, copying, or
publishing must be solely for scholarly purposes and will not involve potential financial gain. It is
understood that any copying from or publication of this dissertation which involves potential
financial gain will not be allowed without my written permission.
Jacob Alan English
NOTICE TO BORROWERS
All dissertations deposited in the Georgia State University library must be used in
accordance with the stipulations prescribed by the author in the preceding statement. The author
of this dissertation is:
Jacob Alan English
Department of Learning Sciences
College of Education and Human Development
Georgia State University
Atlanta, GA 30303
The director of this dissertation is:
Dr. Ann Kruger
Department of Learning Sciences
College of Education and Human Development
Georgia State University
Atlanta, GA 30303
CURRICULUM VITAE
Jacob Alan English
ADDRESS: 30 Pryor Street SW Suite 700
Atlanta, GA 30303
EDUCATION:
PROFESSIONAL EXPERIENCE:
2018-present Director, Office of National
Scholarships and Fellowships
Honors College
Georgia State University
2013-2018 Research Program Coordinator
and Academic Advisor
Honors College
Georgia State University
2012-2013 Academic Advisor
College of Education and Human
Development
Georgia State University
UNIVERSITY TEACHING EXPERIENCE:
Online Instructor – Science of Learning – August 2016-Present
• Introduced undergraduate students to learning theories and research that support effective
learning and study strategies by engaging students in readings and activities that
encourage real-world application.
Ph.D. 2019 Georgia State University
Educational Psychology
Masters Degree 2012 Georgia State University
Sport Administration
Bachelors Degree 2008 Georgia State University
Exercise Science
PUBLICATIONS:
English, J.A., & Wan, C. (2018). Undergraduate research and student success: A model for
cultural competency as a mediator. Scholarship and Practice of Undergraduate
Research, 1(3).
English, J. A. (2016). A digital literacy initiative in Honors: Perceptions of students and
instructors about its impact on learning and pedagogy. Journal of the National Collegiate
Honors Council, 17(2), 125-156.
English, J.A., & Kruger, A.C. (2016). Appreciative advising: Six phases to mitigate stereotype
threat among student-athletes. Journal of Appreciative Education, 3(1), 18-29.
PRESENTATIONS:
Erazo, T., Khogali, M., & English, J.A. (2018, October). Discrimination in Our Communities:
Policing, Psychological Evaluation, and Education. Thematic Table at the 7th Annual
International Conference of Community Psychology, Santiago, Chile.
English, J.A., Erazo, T., Nguyen, P., & Harris, J. (2018, August). Black Male Collegiate
Athletes: Intersectional Identities and the Power of the Investigators’ Portrayal.
Accepted discussion session at the 126th Annual APA Convention, San Francisco,
California.
McCrary, V. & English, J.A. (2018, July). More buzzwords in higher education? Diversity and
Inclusion in Undergraduate Research. Accepted workshop session at the CUR Biennial
Conference 2018, Arlington, Virginia.
Coleman, J.K, Wan, C., & English, J.A. (2017, June). Supporting the intersectional identities of
college students. Concurrent workshop at the 30th Annual National Conference on Race
and Ethnicity in American Higher Education, Fort Worth, Texas.
English, J.A. (2016, April). A Digital Literacy Initiative in Honors: Student and Instructor
Perceptions on the Impact of Learning and Pedagogy. Poster presentation at the 11th
Annual Georgia Psychological Society Conference at Morehouse College, Atlanta,
Georgia.
PROFESSIONAL SOCIETIES AND ORGANIZATIONS:
2017-Present National Association for Fellowship Advisors
2017-Present American Psychological Association
2014-Present Council on Undergraduate Research
GRANTS AWARDED:
• English, J.A. (2018) National Collegiate Athletic Association Graduate Student Research
Grant. Funded: Spring 2019, Amount funded: $5,367.76
• English, J.A., Gibbs, A., & Coleman, J. (2018) University System of Georgia African
American Male Initiative at Georgia State University. Funded: Fall 2018-Spring 2019,
Amount funded: $15,000.00

I AM NOT YOUR STUDENT-ATHLETE: AN INVESTIGATION OF SOCIAL IDENTITY
COMPLEXITY AS A STEREOTYPE THREAT MITIGATION STRATEGY AND
INDIVIDUAL DIFFERENCES THAT MAY MODERATE THE EFFECT
by
Jacob Alan English
Under the Direction of Ann C. Kruger, Ph.D.
ABSTRACT
Collegiate athletes must contend with negative stereotypes during their academic career
(Comeaux, 2012). Such stereotypes depict student-athletes as unintelligent (Yopyk &
Prentice, 2005) and overlook the benefits and variability of the collegiate athletic experience.
Student-athletes are multifaceted and more than their sport. Unfair depictions can influence
student-athletes’ behavior, especially in the classroom. Research shows that student-athletes’
academic performance is affected by stereotype threat (Riciputi & Erdal, 2017); which is the
apprehension of confirming a negative stereotype about one’s social group (Steele & Aronson,
1995). Currently, there is no published evidence-based research on stereotype threat mitigation
strategies tailored to student-athletes. Expanding the work of Gresky et al. (2005), this study
explored a self-concept map activity, based on the social identity complexity theory, as one
potential strategy for collegiate athletes (exploring multiple social identities). Division I student-
athletes (N = 70) were randomly assigned to one of three experimental conditions: 1) threat-no
mitigation, 2) threat-mitigation, and 3) no threat-no mitigation (control). Factorial ANOVA was
employed to assess differences in participants’ scores on an SAT-style examination
(writing/language and mathematics) across conditions. Academic self-concept, gender identity,
and race/ethnicity served as grouping variables and potential moderators. Results showed no
significant differences in overall test performance across experimental conditions, or between
gender identity (female and male). Results revealed several main effects of academic self-
concept and race/ethnicity on components of performance, especially on difficult test items.
Specific to the main hypothesis, a marginally significant (p = .052) interaction effect of condition
by race/ethnicity was observed on the difficult math items. Post-hoc analyses showed that
African American student-athletes had significantly poorer scores in the control condition than
Caucasian student-athletes (p = .010), and in the threat condition than did Caucasian (p = .001)
and Hispanic (p = .004) student-athletes. There was no difference between these groups in the
mitigation condition. African American participants’ performance on difficult math items in the
mitigation condition was significantly better than their performance in the threat condition (p =
.02). These results suggest that stereotype threat mitigations may work, but strategies should be
culturally-specific and tailored to the challenge of the academic tasks.
INDEX WORDS: Stereotypes, Stereotype Threat, Social Identity Complexity, Mitigation
Strategy, Moderators, Student-Athlete
I AM NOT YOUR STUDENT-ATHLETE: AN INVESTIGATION OF SOCIAL IDENTITY
COMPLEXITY AS A STEREOTYPE THREAT MITIGATION STRATEGY AND
INDIVIDUAL DIFFERENCES THAT MAY MODERATE THE EFFECT
by
Jacob Alan English
A Dissertation
Presented in Partial Fulfillment of Requirements for the
Degree of
Doctor of Philosophy
in
Educational Psychology
in
Department of Learning Sciences
in
the College of Education and Human Development
Georgia State University
Atlanta, GA
2019

Copyright by
Jacob Alan English
2019

DEDICATION
I dedicate this work to my nephews - Zion and Pablo. Remember, you two - no goal is
too big, and no challenge is too mighty. When you live your life with intention, authenticity,
love, empathy, confidence, and an abundance mentality, anything is possible.

ii
ACKNOWLEDGMENTS
At the age of fifty, my mother, a special education teacher, decided to pursue a doctorate
in Education. It was on those car trips to interview participants for her study that my passion for
scientific research was realized. Dr. Vanessa English – I thank you for exposing me to a field
that has changed my life and for showing me that nothing is impossible for this Black boy.
Before I even started the program, I received nothing but support from the College of Education
and Human Development. Thank you, Dr. Thompson and Dr. Fredrick, for introducing me to the
field of Educational Psychology. Thank you, Dean Alberto, for your constant words of
encouragement. Once I started the program, Dr. Commander, you patiently guided me through
my first two years, and you were exactly what I needed as I entered the world of academia.
Thank you.
Once Dr. Commander retired, Dr. Kruger, you stepped in and served as more than an
advisor, but as a mentor. Dr. Kruger – I cannot thank you enough for the role that you have
played in both my growth as a researcher and a higher education professional. Additionally, I
would like to thank my committee for your flexibility and support. Thank you, Dr. Becky Ellis,
Dr. Daphne Greenberg, Dr. Robert Hendrick, and Dr. Brian Williams. Lastly, I would like to
thank a group of people who kept me uplifted through this process. I owe much of my
accomplishments in this program to the love, support, honesty, long phone calls, venting
sessions, and comic relief of Nicole Davis, Lesley Dickinson, Iman English, Dr. Johari Harris,
Kenya Johnson, Josephine Lindsley, Amy Salter, and Calvin Smith. Finally, Corey, thank you
for being you. To end, thank you to the NCAA Graduate Student Research Grant Program for
providing funding to support this project. Thank you to the Georgia State University Athletics
Department for your support.
iii
TABLE OF CONTENTS
LIST OF TABLES………………………………………………………………………………… IV
LIST OF FIGURES…………………………………………………………………………………V
1 THE DEVELOPMENT OF STEREOTYPE THREAT THEORY, AND THE
PHENOMENON’S IMPACT ON STUDENT-ATHLETES’ ACADEMIC
PERFORMANCE ......................................................................................................... 1
Review ............................................................................................................................ 5
References .................................................................................................................... 69
2 I AM NOT YOUR STUDENT-ATHLETE: AN INVESTIGATION OF SOCIAL
IDENTITY COMPLEXITY AS A STEREOTYPE THREAT MITIGATION
STRATEGY AND INDIVIDUAL DIFFERENCES THAT MAY MODERATE
THE EFFECT .............................................................................................................. 97
Methodology .............................................................................................................. 119
Results ........................................................................................................................ 132
Discussion ................................................................................................................... 154
References .................................................................................................................. 166
APPENDICES ............................................................................................................................. 177
iv
LIST OF TABLES
Table 1. Summary of Steele and Aronson stereotype threat experiments (1995) ........................ 17
Table 2. Student-Athlete (SA) stereotypes in empirically-based studies ..................................... 35
Table 3. Summary of Roccas and Brewer’s four identity structures (2002) ................................ 62
Table 4. Summary of Gresky, Eyck, Lord, and McIntrye study (2005) ..................................... 112
Table 5. Study participants by sport ........................................................................................... 122
Table 6. Frequencies of grouping variables by condition ........................................................... 122
Table 7. Level of engagement on mapping activities – descriptive statistics and ANOVA output
..................................................................................................................................................... 133
Table 8. Summary of series of ANOVAs of test performance by condition .............................. 134
Table 9. Mean scores - test performance by condition ............................................................... 135
Table 10. Summary of series of ANOVAs of test performance – condition by gender identity
..................................................................................................................................................... 136
Table 11. Mean scores of test performance – condition by gender identity ............................... 136
Table 12. Summary of series of ANOVAs of test performance – condition by academic self-
concept ........................................................................................................................................ 138
Table 13. Mean scores of test performance – condition by academic self-concept ................... 139
Table 14. Summary of series of ANOVAs of test performance – condition by race/ethnicity .. 141
Table 15. Mean scores of test performance – condition by race/ethnicity ................................. 142
Table 16. Analysis of variance summary (difficult math items) – condition by race/ethnicity .. 144
Table 17. Mean scores of moderate and easy math items – condition by race/ethnicity ............ 145
Table 18. Academic Self-Concept Scale-Short Form score - condition by race/ethnicity ......... 147
v
LIST OF FIGURES
Figure 1. Hierarchical self-concept model (Shavelson, Hubner, & Stanton, 1976) ..................... 29
Figure 2. Identity status theory model (Marcia, 1966) ................................................................. 34
Figure 3. Student-Athlete dialogue meme examples 1 ................................................................. 37
Figure 4. Alternate structures of multiple ingroup representations (Roccas & Brewer, 2002) .... 63
Figure 5. Federal graduation rate comparison between Division I student-athletes and general
student body (Hosick & Durham, 2017) ................................................................................... 102
Figure 6. Archie character description and comic cover featuring Marmaduke “Moose” Mason
(1949) .......................................................................................................................................... 103
Figure 7. Student-Athlete dialogue meme examples 2 ............................................................... 104
Figure 8. Concept map example about Raptors (Schroeder, Nesbit, Anguiano, & Adesope, 2018)
..................................................................................................................................................... 114
Figure 9. Research questions, hypotheses, and statistical tests ................................................... 116
Figure 10. Mean score of difficult math items - condition by race/ethnicity ............................. 144
Figure 11. Conceptual model of multiple correlation data ......................................................... 152

1
1 THE DEVELOPMENT OF STEREOTYPE THREAT THEORY, AND THE
PHENOMENON’S IMPACT ON STUDENT-ATHLETES’ ACADEMIC
PERFORMANCE
It may be easy for privileged groups to dismiss stereotypes as fallacies and make claims
that labels are only as powerful as the attention paid to them. However, words such as African
American, Jewish, gay, northerner, student-athlete, feminist, disabled, and Democrat have the
potential to provoke negative thoughts and beliefs about an entire social group. Stereotypes are
not harmless and can produce environments inundated with prejudice and discriminatory
practices. Stereotypes are promoted from simple labels to dangerous categorizations when they
disparage and eliminate opportunities for a person or a total group. In addition to external
consequences, stereotypes have the potential to cause internal conflict and threats. Claude Steele,
Steven Spencer, Joshua Aronson, and Diane Quinn (Steele and Aronson, 1995; Steele, 1997;
Spencer, Steele, & Quinn., 1999) coined the term stereotype threat and tested the stereotype
threat theory to explain the apprehension of confirming a negative stereotype about one’s social
group. The researchers established the theory as a possible explanation for the achievement
differences in both standardized test and academic performance between Caucasian and African
American college students (Steele and Aronson, 1995) and mathematics performance between
men and women (Spencer, Steele, & Quinn, 1999). The theory was a refreshing and less
stigmatizing alternative to studies citing genetic differences in intelligence among racial and
gender groups (Benbow & Stanley, 1980; Herrnstein & Murray, 1994; Steele, 2010).
Since that time, hundreds of studies have been published on the social-psychological
phenomenon to address the deleterious effects of stereotypes on a wide array of social groups.
2
For example, stereotype threat has shown to negatively affect the intellectual ability of university
students with physical disabilities (Desombre, Anegmar, & Delelis, 2017), immigrant students’
educational trajectories (Weber, Kronberger, & Appel, 2018), undergraduate female’s science
identity and subsequent academic motivation (Deemer, Lin, & Soto, 2016) and knowledge
acquisition and organizational effectiveness (Grand, 2017), mind-wandering among older adults
(Jordano & Touron, 2017a), cognitive test performance of preservice teachers (Ihme & Moller,
2015) and African American men’s encounters with the police (Najdowski, Bottoms, & Goff,
2015).
Stereotype threat research is prominently featured in collegiate settings to address causes
and barriers to student success with the goal of improving graduation and retention rates and
academic performance. Application of the theory is demonstrated at universities and colleges
nationwide in the form of online resources and on-campus workshops to support academic
persistence. For example, the American Physic Society’s webpage titled Effective Practices for
Recruitment and Retention of Graduate Women presents strategies to recruit and retain women in
graduate Physics programs. Number five in the list of twelve strategies states: “Have a
department diversity & inclusion committee that can provide a venue to discuss and educate
people about behaviors that can prevent students from underrepresented groups from persisting
or thriving in physics – topics could include stereotype threat, imposter syndrome, implicit bias,
and harassment” (American Physical Society, 2019, p. 1). Other universities and colleges have
taken similar approaches like the University of Michigan (Graduate Student Workshop on
Stereotype Threat and Impostor Syndrome; University of Michigan, 2018), the University of
California, Berkeley (Advisor Resources; University of California Berkeley, 2019), and
Washington State University (Faculty and Staff Workshop on Stereotype Threat and First-
3
Generation Students, Washington State University; 2015). Stereotype threat research is vast in
discipline, studied domain, and demographic, yet most of the research focuses on the impact of
stereotype threat on academic performance.
Collegiate athletes are one group in higher education whose academic performance is
affected by stereotype threat (Stone, Harrison, & Mottley, 2012). The threat affects academic
achievement and stems from negative stereotypes focusing on student-athletes’ intellectual
abilities — the most common stereotype labels student-athletes as dumb jocks. Division I
student-athletes in revenue sports (i.e., football and basketball) are most vulnerable to these
stereotypes because they receive the most negative media attention (Simons, Bosworth, Fujita, &
Jensen, 2007). Stories of academic fraud, when they occur at these institutions, are often the
number one trending news story. For example, in 2009, the National Collegiate Athletics
Association (NCAA) found the Florida State athletics department guilty of major violations in an
academic fraud case involving 61 student-athletes. The fraud included a learning specialist, an
academic advisor, and a tutor who completed tests and papers for student-athletes (Zinser, 2009).
In 2016, a former tutor at the University of Missouri-Columbia came forward stating that she
took courses for student-athletes and shared the story on Facebook (Sports Illustrated Wire,
2016). Most recently, the NCAA found the University of North Carolina-Chapel Hill guilty of
involving about 3,100 at-risk student-athletes, over two decades, in fake classes to maintain
academic eligibility (Tracy, 2017). The actions have a domino effect. The academic scandals
damage their universities’ reputation, increase the probability of negative perceptions of student-
athletes in academic settings, and lead to the most troubling potential consequence in this cycle –
identity-threatening situations in the classroom.
4
The academic underperformance of student-athletes is well researched (Levine, Etchison,
& Oppenheimer, 2014), and a steady amount of data has been collected about stereotype threat
as a possible explanation for it. However, no published research has tested viable strategies to
reduce the effects of stereotype threat among this group. Strategies exist to buffer stereotype
threat in classroom settings, yet none of those approaches specifically focus on student-athletes.
It cannot be assumed that everyone experiences stereotype threat in the same manner, and as
such, it cannot be assumed that mitigation strategies are equally effective (Shapiro, Williams, &
Hambarchyan, 2013). The purpose of this literature review is to answer the following questions:
1. What are the effects of stereotypes and stereotype threat on the academic performance of
collegiate athletes?
2. How does the duality of a student-athlete’s identity (academic self-concept and athletic
identity) interact with stereotype threat?
3. What are the empirically-based mitigation strategies available for modeling for student-
athletes in learning environments?
The literature review will start by thoroughly defining stereotype threat, providing a
comprehensive history of the development of the stereotype threat theory for context. The
section will create a strong foundation for the review of research on the impact of stereotype
threat on the academic performance of student-athletes. Then, the review will focus on research
about the collegiate-athlete population, specifically discussing academic self-concept and athletic
identity. Bong and Skaalvik’s (2003) and Shavelson, Hubner, and Stanton’s (1976) definitions of
academic self-concept, and James Marcia’s Identity Status Theory (1966) will serve as the
framework for this segment of the discussion to understand academic self-concept, athletic
identity, and identity foreclosure, three crucial concepts to explore when studying stereotype
5
threat and student-athletes. The complementary theories bolster research on the impact of
identity development on academic achievement and educational attainment (Hejazi, Shahraray,
Farsinejad, & Asgary, 2009; Sica, Sestito, & Ragozini, 2014). An examination of stereotypes
about student-athletes’ intellectual abilities and research describing their response to stereotype
threat in academic settings will be presented. Last, an examination of potential mitigation
strategies tailored to fit the needs of student-athletes will be presented. In this section, evidence
will be introduced regarding moderators and psychological mediators between stereotype threat
and academic performance. Although moderators and mediators are not the primary focus of this
literature review, a discussion about those mechanisms will be presented for a thorough
understanding of the theory and to promote an intentional process for selecting possible
mitigation strategies.
Due to the experimental nature of stereotype threat research, heavy emphasis will be
placed on research designs and methodology to provide a stronger understanding of the
phenomenon in multiple domains. The ancillary goal is to present a historical account of the
stereotype threat theory in one document to contribute to the field of study. The literature review
could be of interest to, athletic administrators (especially academic advisors and coaches), sports
psychologists, diversity and inclusion practitioners, graduation and retention specialist,
professors, academic advisors, and student affairs professionals.
Back to the Basics: Foundational Research on Stereotype Threat
Stereotypes (noun): Standardized mental pictures that are held in common by members of
a group and that represents an oversimplified opinion, prejudiced attitude, or uncritical
judgment” (Merriam-Webster).

6
Claude Steele, Steven Spencer, and Joshua Aronson are best known for introducing the
stereotype threat theory, but Irwin Katz conducted initial research on the concept in the 1960s.
Katz and his colleagues conducted experiments during the advent of educational desegregation.
The purpose of the studies was to understand the learning experiences of African American
students in a new academic environment. As history accounts, Katz’s research did not associate
his findings to what we define today as stereotype threat, but even Steele and Aronson (1995)
acknowledge Katz’s contributions to research about the potential limiting effects of stereotypes.
In addition to Katz’s work, Steele’s research design for his 1995 and 1999 studies was primarily
inspired by the work of Jane Elliott, a school teacher from Riceville, Iowa, who designed a
simulation to demonstrate the effects of discrimination. In the next sections, a review of the
relevant research of Irwin Katz and the contributions of Jane Elliott will be presented before
thoroughly summarizing the work of Claude Steele, Steven Spencer, and Joshua Aronson.
Dissecting these founding documents will increase understanding of the theory, current models,
research designs and methodology, data analysis, and interventions to address stereotype threat
among student-athletes.
Irwin Katz. Katz and Greenbaum (1963) evaluated the effects of stress on the
performance of 115 African American male college students from Fisk University. Study
participants were threatened with non-avoidance electric shocks and placed in either a high
voltage group (Strong Threat) or low voltage group (Mild Threat) and asked to complete a digit-
letter substitution task in the presence of either a Caucasian or African American test
administrator. No shocks were administered. Also, researchers included an individual pretending
to be a study participant of the same race as the test administrator in the study (respective of the
condition). The results show that African American students in the Caucasian-Strong Threat

7
condition performed worse than any other condition on the task. The researchers suggest that the
data confirmed their hypothesis that African American students would underperform in a high-
stress situation in which they felt that a Caucasian person judged their intellectual ability.
However, no direct measure was incorporated into the study to correlate the racial elements of
the test environment and task performance. It is important to note that the task was articulated to
the study participants as non-evaluative. Non-evaluative, in this context, refers to the task
presented as not evaluating intellectual ability.
In 1964, Katz continued his studies and directed his attention to the intellectual
performance of African American students when placed in a comparison condition. Katz, Epps,
and Axelson (1964) included 116 African American male undergraduates from Florida
Agricultural and Mechanical University and 96 Caucasian male undergraduates from Florida
State University in the study. The African American students were divided into either a control,
local, or national condition and asked to complete either an easy or hard digit-symbol task. The
researchers presented the task in the control condition as non-evaluative of scholastic ability, the
local condition as evaluative of mental ability with results compared to other African American
students, and the national condition as evaluative of mental ability with results compared to
students at other universities. Caucasian students received the same information (consistent with
race) before completing the task, but they were only administered the hard digit-symbol task.
Results indicated that African American students performed significantly better on the task when
competing with other African American students or not competing at all. The data suggest that
African American students’ academic performance could suffer (specifically threatening their
motivation) on a standardized test when “Caucasian standards” are implicit in the testing
situation. The results provided insight into the possible effects of stress in mixed-race
8
environments. However, again, there was no measure to demonstrate that the performance of
African American students was impaired by the fear of being compared to a Caucasian peer.
Integrating an identity threat manipulation would have strengthened the research design.
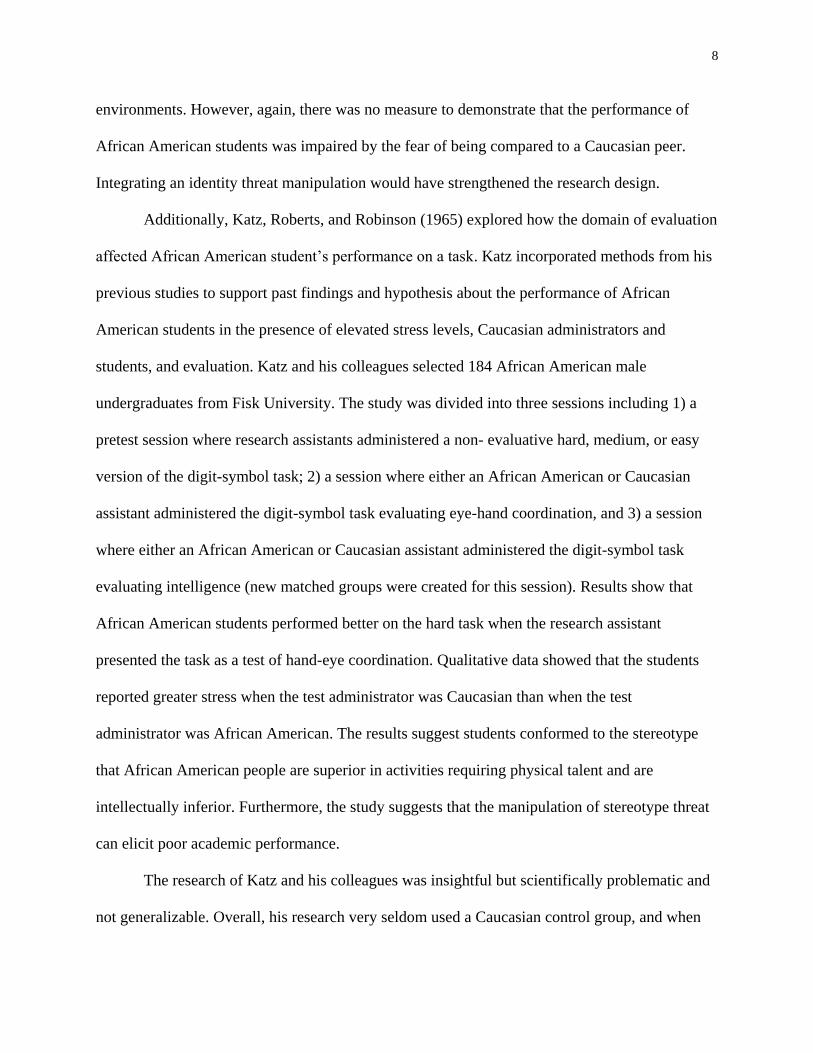
Additionally, Katz, Roberts, and Robinson (1965) explored how the domain of evaluation
affected African American student’s performance on a task. Katz incorporated methods from his
previous studies to support past findings and hypothesis about the performance of African
American students in the presence of elevated stress levels, Caucasian administrators and
students, and evaluation. Katz and his colleagues selected 184 African American male
undergraduates from Fisk University. The study was divided into three sessions including 1) a
pretest session where research assistants administered a non- evaluative hard, medium, or easy
version of the digit-symbol task; 2) a session where either an African American or Caucasian
assistant administered the digit-symbol task evaluating eye-hand coordination, and 3) a session
where either an African American or Caucasian assistant administered the digit-symbol task
evaluating intelligence (new matched groups were created for this session). Results show that
African American students performed better on the hard task when the research assistant
presented the task as a test of hand-eye coordination. Qualitative data showed that the students
reported greater stress when the test administrator was Caucasian than when the test
administrator was African American. The results suggest students conformed to the stereotype
that African American people are superior in activities requiring physical talent and are
intellectually inferior. Furthermore, the study suggests that the manipulation of stereotype threat
can elicit poor academic performance.
The research of Katz and his colleagues was insightful but scientifically problematic and
not generalizable. Overall, his research very seldom used a Caucasian control group, and when

9
they were used they were not equally involved in each condition (see Katz, Epps, and Axelson,
1964). Aronson and Steele (1995) discussed the lack of the control group prevents clear
attribution of study results due to race or some other mediating factor experienced by all
students. Furthermore, as discussed, Katz and his colleagues did not assess identity threat
through either threat manipulation or self-report measures to support a hypothesis about potential
mediators affecting performance in the experimental setting.
Additionally, the racial climate during the time of Katz’s research was different in
significant ways than the climate several decades later. A fact that is very obviously indicated by
using the word “Negro” to describe African American study participants. Broadly, Katz’s
experiments were instrumental in acknowledging the role that segregation played in the
development of negative stereotypes that depict students of color as intellectually inferior and
possible consequences for learning and demonstrating knowledge. His studies influenced
research about achievement gaps between disenfranchised and stigmatized groups in the United
States and those who are part of the mainstream.
Jane Elliott. On April 4, 1968, Dr. Martin Luther King, Jr. was assassinated at the
Lorraine Motel in Memphis, Tennessee. On April 5, 1968, Jane Elliott, a third-grade school
teacher in Riceville, Iowa, involved her students in the now famous Blue Eyes - Brown Eyes
Exercise. In a two-day exercise, Elliot wanted to demonstrate the experiences of stigmatized
groups in the United States. By her accounts, Elliott stated that her class recently named Dr.
King their “Hero of the Month” and after his murder, they were hurt and confused (PBS
Frontline, 2003). Elliott wanted to explain to her students the consequences of racism in hopes of
offering insight into King’s assassination.
10
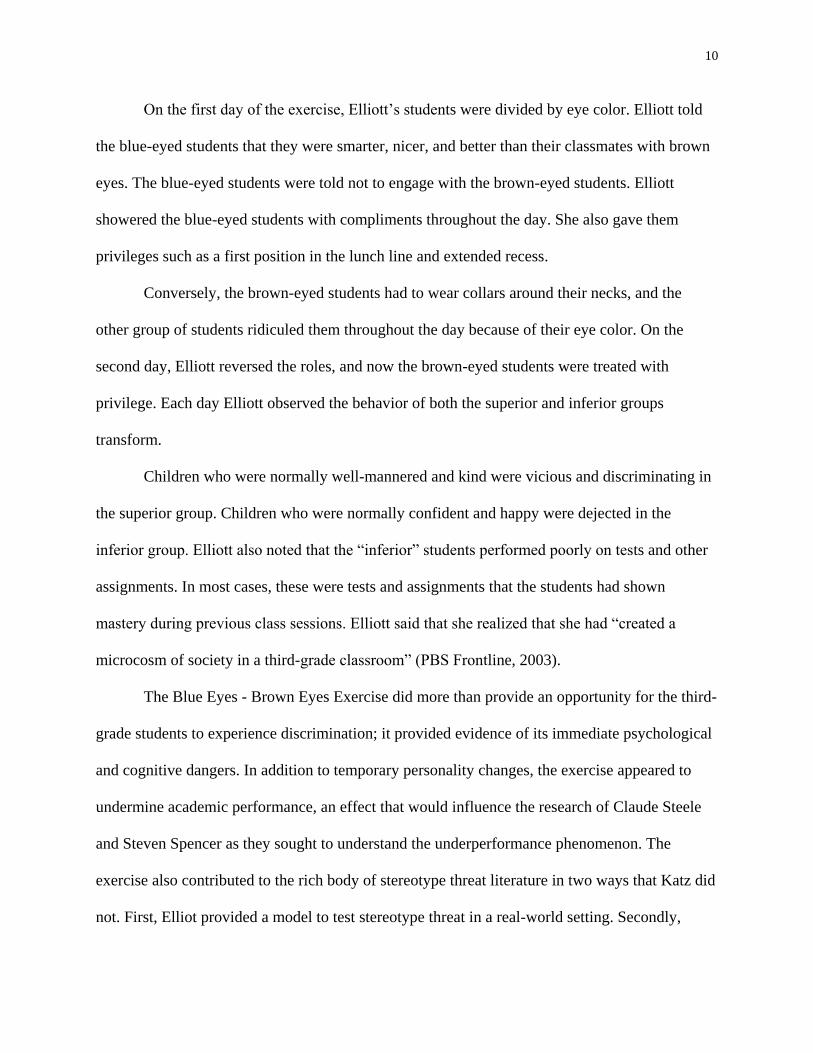
On the first day of the exercise, Elliott’s students were divided by eye color. Elliott told
the blue-eyed students that they were smarter, nicer, and better than their classmates with brown
eyes. The blue-eyed students were told not to engage with the brown-eyed students. Elliott
showered the blue-eyed students with compliments throughout the day. She also gave them
privileges such as a first position in the lunch line and extended recess.
Conversely, the brown-eyed students had to wear collars around their necks, and the
other group of students ridiculed them throughout the day because of their eye color. On the
second day, Elliott reversed the roles, and now the brown-eyed students were treated with
privilege. Each day Elliott observed the behavior of both the superior and inferior groups
transform.
Children who were normally well-mannered and kind were vicious and discriminating in
the superior group. Children who were normally confident and happy were dejected in the
inferior group. Elliott also noted that the “inferior” students performed poorly on tests and other
assignments. In most cases, these were tests and assignments that the students had shown
mastery during previous class sessions. Elliott said that she realized that she had “created a
microcosm of society in a third-grade classroom” (PBS Frontline, 2003).
The Blue Eyes - Brown Eyes Exercise did more than provide an opportunity for the third-
grade students to experience discrimination; it provided evidence of its immediate psychological
and cognitive dangers. In addition to temporary personality changes, the exercise appeared to
undermine academic performance, an effect that would influence the research of Claude Steele
and Steven Spencer as they sought to understand the underperformance phenomenon. The
exercise also contributed to the rich body of stereotype threat literature in two ways that Katz did
not. First, Elliot provided a model to test stereotype threat in a real-world setting. Secondly,

11
Elliott manipulated identity threat through explicit discriminatory statements about other’s
differences. Fortunately, Institutional Review Boards would never approve such a study in
today’s research community due to the possibility of psychological harm. The research
community is aware of the need for natural observations of stereotype threat in real-world
settings and strive to incorporate these elements into their studies.
Claude Steele, Steven Spencer, and Diane Quinn: Women and Mathematics
Performance. Although operating in separate domains (experimental and applied respectively),
the work of Katz and Elliott provide context for the formation of the stereotype threat theory.
Claude Steele attributes his identity threat research on the achievement gap between Caucasian
and African American students to his position as a professor of Psychology and appointment to a
university-wide committee on minority student retention and recruitment at the University of
Michigan in 1987. Steele details his research path in Chapter 2 (“A Mysterious Link Between
Identity and Intellectual Performance”) of his book Whistling Vivaldi published in 2010. The
University of Michigan appointed Steele to the committee on minority student retention and
recruitment. During that time, the University of Michigan had collected data that showed a large
disparity between the academic performance of their African American students and their peers.
University administrators tasked the committee with collecting data to help them understand and
resolve the issues of underperformance by African American students. Through observation,
informal surveys, and reviewing institutional data, Steele discovered that underperformance by
African American students was prevalent across all disciplines, which was not shocking since
national data supported this finding in multiple industries. At the time, explanations often
featured deficit frameworks to explain the achievement gap including lack of motivation or
cultural knowledge, low self-expectations, or low self- esteem.

12
Steele’s appointment led to multiple conversations with African American students at
colleges and university across the nation. He learned that African American students felt general
unhappiness and a lack of sense of belonging and struggles to find friends and strong social
networks. Many students admitted that they went home on the weekends to escape a campus
culture dominated by Caucasian students and organized by race. They often wondered if they
were valued on campus, which is a belief that was reinforced by the lack of African American
administrators and faculty. Overall, the students felt distressed, misunderstood, and
marginalized.
Steele wanted to explore group stigmatization as a cause for underperformance. It
appeared that the impact of stereotypes, microaggressions, and macroaggressions could explain
the apparent underachievement of African American students. However, before conducting a
study on the African American student population, Steele wanted to find a natural occurrence of
identity threat to pilot his theory. He and Steven Spencer (a University of Michigan graduate
student at the time) designed a study comparable to the Blue Eyes - Brown Eyes exercise. Steele
and Spencer wanted to address the underperformance of women in advanced mathematics
courses by bringing awareness to stereotypes about women and math in a test environment.
Today, there is a wealth of research discussing the underrepresentation and underperformance of
women in math and STEM fields (Kianian, 1996; Brown & Josephs, 1999; Lesko & Corpus,
2006; Ceci, Williams, & Barnett, 2009; Good, Rattan, & Dweck, 2012; Chambers, Walpole, &
Outlaw, 2016). As a pilot study, Steele and Spencer analyzed women’s grades in advanced
Mathematics (stigmatized environment) and advanced English (not a stigmatized environment)
courses to measure a difference in performance. Data suggest that women did underperform in
advanced Mathematics courses, but the findings did not offer reasoning for what caused
13
underperformance. Also, Steele and Spencer could not obtain SAT scores for most study
participants, and there was a low number of women enrolled in the advanced Mathematics
courses.
The small sample size, lack of information about domain identification, and absence of
measures to explore possible mediators did not support what would become the stereotype threat
theory. The researchers turned to clinical trials to address these issues in their 1999 study. It must
be noted that the first study published about stereotype threat was in 1995 by Steele and
Aronson. However, according to Steele in his book Whistling Vivaldi, the studies he conducted
with Steven Spencer were the first on stereotype threat. Steele did not provide any explanation
for the order of studies. Steele’s 1999 study will be discussed before his 1995 study to provide a
more accurate historical account.
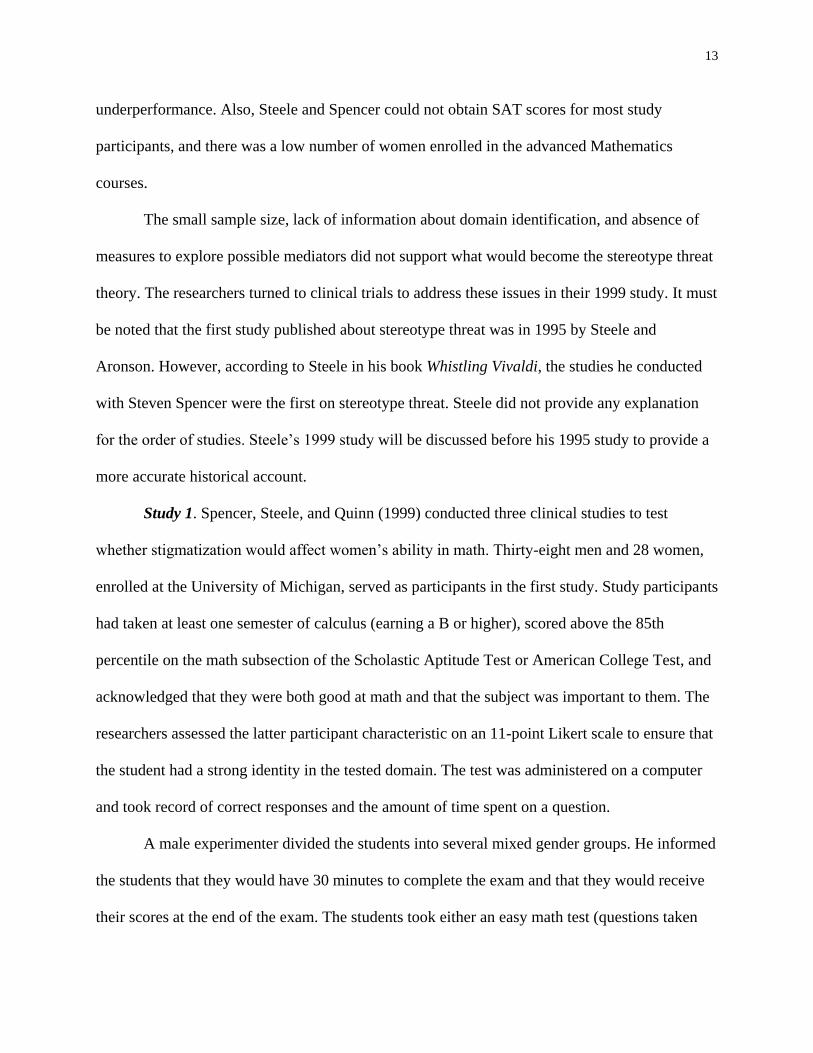
Study 1. Spencer, Steele, and Quinn (1999) conducted three clinical studies to test
whether stigmatization would affect women’s ability in math. Thirty-eight men and 28 women,
enrolled at the University of Michigan, served as participants in the first study. Study participants
had taken at least one semester of calculus (earning a B or higher), scored above the 85th
percentile on the math subsection of the Scholastic Aptitude Test or American College Test, and
acknowledged that they were both good at math and that the subject was important to them. The
researchers assessed the latter participant characteristic on an 11-point Likert scale to ensure that
the student had a strong identity in the tested domain. The test was administered on a computer
and took record of correct responses and the amount of time spent on a question.
A male experimenter divided the students into several mixed gender groups. He informed
the students that they would have 30 minutes to complete the exam and that they would receive
their scores at the end of the exam. The students took either an easy math test (questions taken
14
from the GRE general exam) or a difficult math test (questions taken from the math subsection of
the GRE). The independent variables for the study were gender and test difficulty, and the
dependent variables were test performance and the amount of time spent on the test. Duration
was measured to assess effort (i.e., more time = more effort). Results showed that women in the
difficult test condition scored significantly lower than women and men in any other condition,
while men in the difficult test condition scored lower than women and men in the easy test
condition. Women performed almost equally to men on the easy test. Also, results reveal a
marginal significance in test difficulty, with participants spending more time on the easier exam.
The results are consistent with literature about performance differences between women and men
on math exams. However, the study did not offer information about what causes the differences.
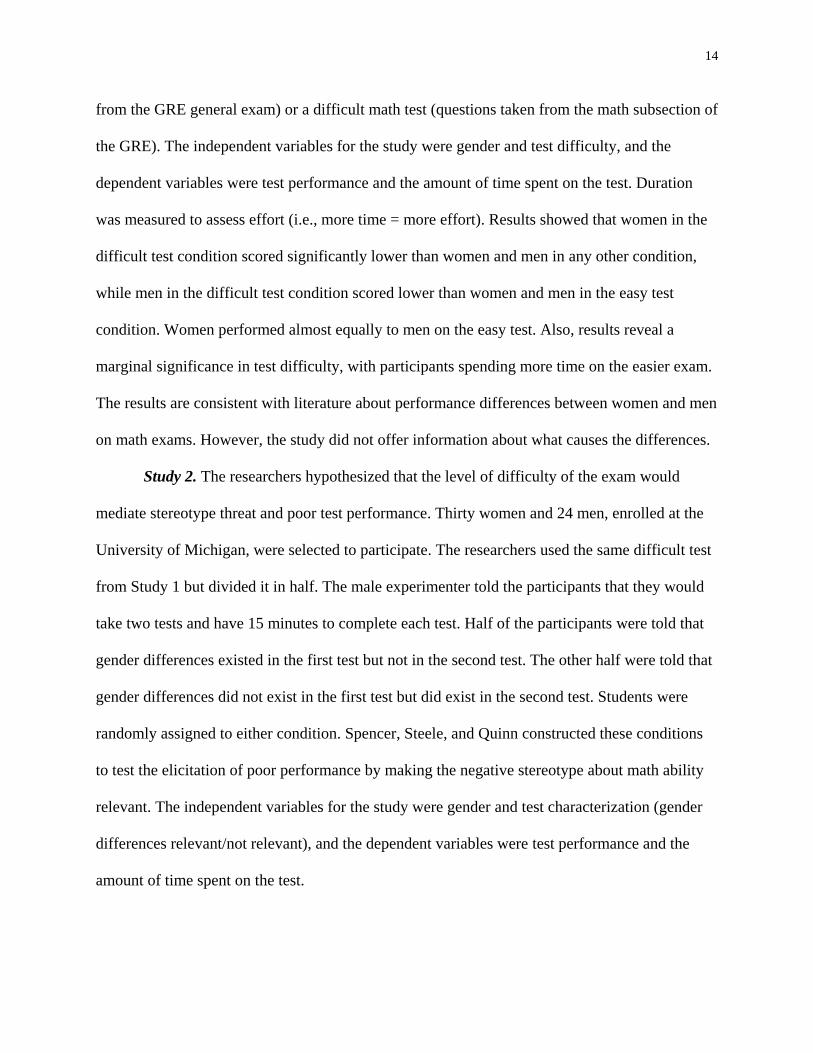
Study 2. The researchers hypothesized that the level of difficulty of the exam would
mediate stereotype threat and poor test performance. Thirty women and 24 men, enrolled at the
University of Michigan, were selected to participate. The researchers used the same difficult test
from Study 1 but divided it in half. The male experimenter told the participants that they would
take two tests and have 15 minutes to complete each test. Half of the participants were told that
gender differences existed in the first test but not in the second test. The other half were told that
gender differences did not exist in the first test but did exist in the second test. Students were
randomly assigned to either condition. Spencer, Steele, and Quinn constructed these conditions
to test the elicitation of poor performance by making the negative stereotype about math ability
relevant. The independent variables for the study were gender and test characterization (gender
differences relevant/not relevant), and the dependent variables were test performance and the
amount of time spent on the test.
15
Participants test scores supported the study hypothesis. When the women were told that
the test yielded gender differences, then they performed worse than men, and when they were
told that the test did not yield gender differences, their performance was equal to men. Women in
the gender relevant condition scored lower than all other groups. Also, women spent less time on
the exam in the gender relevant condition than women in the other condition.
Study 3. The last experiment sought to provide more clear evidence about stereotype
threat and its impact on women’s math performance. Although supportive of the impact of
stereotype threat on women’s math performance, Study 2 failed in some important respects. The
second test did not yield mean differences which could mean that stereotype threat might be
limited to a small number of questions. The experiment only included high ability math students,
which limits generalizability. Lastly, the experiment explicitly stated the existence of gender
differences which may suggest that stereotype threat is only elicited when the stereotype is
purported. Study 3 addressed these issues by selecting participants with moderate math ability
from another university, choosing a wider range of exam items, and including a control group in
the experiment where no gender differences are explicitly stated. Additionally, the study sought
to explore the mediation of the impact of stereotype threat on women’s math performance by
assessing evaluation apprehension, test anxiety, and self-efficacy.
Thirty-six women and 31 men, enrolled at the University of New York at Buffalo,
participated in Study 3. The SAT criteria used for Study 3 participants were less than those used
for Study 1 and 2 participants. The test was taken on paper and students were given 20 minutes
to complete the exam. The exam was easier than the exam used in Studies 1 and 2 and taken
from the Graduate Management Test. Study participants were placed in mixed-gender groups
and assigned to either the no-gender difference condition (explicitly stated that there were no
16
gender differences) or the control condition (nothing about gender mentioned). After the exam
instructions including an example test problem to highlight the difficulty of the test were read
aloud by a female experimenter, participants completed a questionnaire that would measure that
proposed mediators. The independent variables were sex and test characterization, and the
dependent variable was test performance.
Results showed that women performed worse than men in the control condition, but
performed at the same level in the no-gender difference condition. The mean performance of
women in the control condition was lower than any other group. Also, the data collected about
possible mediators of stereotype threat on women’s math performance revealed that evaluation
apprehension and self-efficacy are not likely mediators. Test anxiety did not emerge as a strong
mediator, but Spencer, Steele, and Quinn suggest that others should further test the mediator.
The overall results from the three clinical studies conducted by Steele, Spencer, and
Quinn suggest that negative stereotypes about women and math performance can disrupt
performance. The studies provide evidence to support the idea that stereotype threat can cause
women to underperform when a task exceeds their knowledge base in mathematics. It is not clear
from the data to what extent the strength of identity in a certain domain affects susceptibility to
stereotype threat. The studies found underperformance in both highly skilled and moderately
skilled females in the experimental conditions. Additionally, the studies did allude to
interventions to mitigate stereotype threat by explicitly making gender differences in the test
environment irrelevant. Further research is needed on the specific mediators between stereotype
threat and academic performance because the data offered in the studies did not lead to a viable
mechanism.

17
Claude Steele and Joshua Aronson: African Americans and Academic Performance.
Steele and Aronson (1995) conducted a series of four pioneering clinical studies to explore the
effects of stereotype threat on the intellectual test performance of African American college
students at Stanford University (see Table 1). The goal of the experiments was to introduce the
stereotype threat theory as a possible explanation for the achievement gap between African
American and Caucasian students, specifically addressing the underperformance of African
American students in higher education. I will present a thorough summary of the study to set the
foundation for my discussion on stereotype threat.
Table 1
Summary of Steele and Aronson Stereotype Threat Experiments (1995)
Purpose Research Design Measures Main Findings 1To test the
impact of
an explicit and
difficult
evaluation of
intellectual
ability on
African
American
undergraduate’s
susceptibility to
stereotype threat
2 x 3 factorial
analysis; Race
(African
American and
Caucasian) by
Test Condition
(diagnostic of
intellectual
ability, non-
diagnostic, non-
diagnostic but
framed as
challenge)
• Performance on
verbal ability test
• Self-report on
thoughts about
academic ability
• Self-report on
cognitive
interference
• Self-report on test
difficulty and bias
• Self-report on test
performance
• Check of
evaluative
manipulation
• African American
students in the
diagnostic
condition
performed
significantly
worse than any
other condition
• No significant
race-by-
diagnostic
interaction
• No significant
differences on
self-reports on
academic ability
and cognitive
interference
• Evaluative
manipulation was
effective

18
2To test the
apprehension of
confirming
a negative group
stereotype as a
mediator
between
stereotype threat
and adverse
academic
performance
among African
American
undergraduates
2 x 2 factorial
analysis; Race
(African
American and
Caucasian) by
Test Condition
(diagnostic of
intellectual ability
or non-
diagnostic)
• Performance on
verbal ability test
• Spielberger State
Anxiety Inventory
(STAI)
• Self-report on
cognitive
interference from
Study 1
• Self-report
questions about
guessing on test
items, expended
effort, persistence
on test items,
actions to limit
time on problems,
reading problems
more than once,
frustration leading
to giving up, and
test bias
• African American
students in the
diagnostic
condition
performed
significantly
worse than any
other condition
• A significant race-
by- diagnostic
interaction was
found
• No significant
difference on
STAI or any self-
report measure
3To test
stereotype
activation,
stereotype
disassociation,
and
apprehension in
an evaluative
situation among
stereotype
threatened
African
American
undergraduates
2 x 3 factorial
design; Race
(African
American and
Caucasian) by
Test Condition
(diagnostic of
intellectual
ability, non-
diagnostic, or
control)
• Stereotype
activation: Word
fragment
completion task
• Self-doubt
activation; Word
fragment
completion task
• Self-report on
stereotype
avoidance
• Self-report on self-
handicapping
• Indicating Race
• African American
students in the
diagnostic
condition
completed
significantly more
race-related
fragments and
self-doubt-related
fragments than
any other
condition;
• African American
students displayed
a more significant
effort to avoid
stereotypic
preferences and
made significantly
more excuses
about
performance than
any other

19
condition
• Only 25% of
African American
students in the
diagnostic
condition reported
their race
compared to
100% of students
indicating their
race in any other
condition
4To test the
effect of
stereotype threat
when a test
is not explicitly
diagnostic of
ability and then
if the threat
acts as a
performance
mediator among
American
undergraduates
2 x 2 factorial
design; Race
(African
American and
Caucasian) by
Race prime
(Recorded
ethnicity or did
not record
ethnicity)
• Performance on verbal ability test
• Self-report
questions about
guessing on test
items, expended
effort,
persistence on
test items,
actions to limit
time on
problems,
reading problems
more than once,
frustration
leading to giving
up, and test bias
• Self-report on
stereotype
threat
• Self-report on
academic
identification
• African American
students
• racially primed
performed
significantly
worse than any
other condition
• African
American
students not
racially primed
performed
almost equally to
Caucasian
students
• African American
students felt more
stereotype threat
than Caucasian
students
Note: Superscripts indicate study number.
Study 1. One-hundred and fourteen male and female, and African American and
Caucasian undergraduates from Stanford were given a 30-minute test consisting of difficult items
from the Graduate Record Examination (GRE). Participants were randomly assigned to one of
three experimental conditions: 1) a diagnostic condition where students were told that the test

20
would evaluate their verbal and reasoning abilities; 2) a nondiagnostic-only condition where
students were told that the test would help to understand better the psychological factors used to
solve verbal problems; 3) and a non-diagnostic-challenge condition where students were given
the same message as the other non-diagnostic group but labeled the test as a challenge. After the
test, in addition to test performance, the researchers evaluated several dependent measures as
shown in Table 1.
After controlling for the student’s Standardized Aptitude Test (SAT), results revealed that
African American participants performed worse than Caucasian participants when the test was
presented as an evaluation of their verbal ability; and their performance improved when the test
was presented as less reflective of their verbal ability, and more so when the test was framed as a
challenge. However, race-by-condition interaction was absent. Also, the self-report measures did
not support the hypothesis that stereotype threat affects performance by increasing distracting
thoughts during the test. Due to these findings, the researchers conducted a second study to
further explore the predicted relationship between stereotype threat and academic performance
among African American students and possible mediators.
Study 2. The second study sought to test the argument that the apprehension of
confirming a negative stereotype influences the impact of stereotype threat on academic
performance. Study participants consisted of 20 African American and 20 Caucasian Stanford
female undergraduates. Participants were randomly assigned to either the diagnostic or
nondiagnostic groups presented in Study 1. The participants were given the same test
administered in Study 1; except the time was changed from 30 to 25 minutes, three anagrams
problems were deleted, the test was presented on a computer to track the time spent on each
question, and more difficult questions were moved to the beginning of the exam. The researchers

21
used a computer for Study 2 to measure the time spent on each question to determine if anxiety
influenced the speed of the participants’ response. After the test, participants completed the
Spielberger State Anxiety Inventory to measure test anxiety. Also, participants answered
questions about their testing behavior (guessing, expended effort, persistence, limited time,
rereading, frustration, and bias).
Results showed that the evaluative nature of the test affected performance significantly,
which was only marginally significant in Study 1. African American students in the diagnostic
condition scored significantly worse than any other condition. The researchers acknowledged
that although the test from Study 1 was identical to Study 2 that the subtle differences in the test;
which were computer use, reduction of time, and harder answers, in the beginning, could have
changed these results. However, the researchers had yet to show how the specific apprehension
about fulfilling a negative group stereotype impairs intellectual performance, and thus Steele and
Aronson conducted a third experiment.
Study 3. Thirty-five African American (9 male, 26 female) and 33 Caucasian (20 male,
13 female) undergraduate students from Stanford, were randomly assigned to either a diagnostic,
non-diagnostic, or control condition. Upon their arrival, a Caucasian male experimenter informed
the students in the diagnostic and non-diagnostic conditions that the study would examine the
relationship between the cognitive processes of lexical access processing (LAP) and higher
verbal reasoning (HVR). Students in the diagnostic group were told that the test would measure
LAP and HVR separately to measure their ability in each domain. Students in the nondiagnostic
group were told that they would not measure ability on the tasks. Once the students in both
groups received the study instructions, they were shown a simple fragment completion sample
item from the LAP and three difficult items from the HVR measures. The researchers used the
22
HVR items to highlight the difficulty of the test and elicit poor performance in the diagnostic
group. Conversely, the participants assigned to the control condition arrived at the study site to
find a note on the door instructing them to complete the LAP and HVR tasks mentioned above.
The instructions did not mention that their ability would be evaluated.
Steele and Aronson designed the study to measure stereotype activation, self-doubt
activation, stereotype avoidance, and self-handicapping. The stereotype activation measure
consisted of a word- fragment completion task (LAP task), which asked the participants to
complete word fragments created to prime their racial identity. Items included fragments such as
_ _ CE (RACE), _ _ ACK (BLACK), WEL _ _ _ _ (WELFARE), and TO_ _ _ (TOKEN). The
self-doubt measure consisted of a word-fragment completion task to arouse self-doubt about
competence and ability. Items included fragments such as LO_ _ _ (LOSER), _ _ FERIOR
(INFERIOR), and FL _ _ _ (FLUNK). Filler items were used in the fragment task to prevent
participants from understanding the racial nature of the task.
The stereotype avoidance measure asked participants to rate their preference on a list of
activities and self-identification with a list of personality traits. The measure consisted of
multiple items, some of which were stereotypic of African American culture, asking about the
enjoyment of specific activities and self- perception in certain personality domains. For example,
participants were asked about their favorite sport and music genre. The stereotypic option for
African Americans was basketball and rap. Participants were asked whether they identified with
certain personality domains such as extroverted, lazy, or humorous to address personality traits.
The stereotypic option for African Americans was lazy, aggressive, and belligerent. Stereotypic
activities and traits were selected during a pretest in which 40 Caucasian participants selected

23
these items as stereotypic of African Americans. Sixty-five percent of participants had to include
a specific activity or trait on the pretest for inclusion on the measure.
Additionally, demographic questions were incorporated in this measure (age, gender,
race, and major). The self- handicapping measure rated the participant's perceived preparedness
for the exam including questions about sufficient hours of sleep, ability to focus, current stress,
and tests bias. The stereotype activation results showed that the diagnostic condition yielded an
increase in race-related fragment completion among African American students, which is an
outcome not viewed in the diagnostic condition for Caucasian students. The self-doubt
activation, stereotype avoidance, and the indication of race results showed significant difference
among racial groups. For the latter measure, only 25% of the African American students in the
diagnostic condition indicated their race. Finally, the self- handicapping results showed
significant differences among race and condition for the measures on hours of sleep, ability to
focus, and tests bias. Study 3 supports the idea that the diagnostic condition evaluating
intellectual ability caused apprehension among African American participants in the form of
stereotype threat. However, the previous studies did not address whether African American
students would perform at lower levels than Caucasian students if the diagnostic condition was
not explicitly stated; or whether the diagnostic condition mediated stereotype threat.
Study 4. Twenty-four African American (6 male, 18 female) and 23 Caucasian (11 male,
12 female) Stanford undergraduate students participated in Study 4. The students were randomly
assigned to either a race-prime or no-race-prime condition by a Caucasian male experimenter.
The researchers primed participants by race by asking them to respond to demographic questions
before taking the exam. Students listed their age, year in school, major, number of siblings, and
parents’ education. In the race-prime condition the next demographic question asked the
24
participants to list their race, and in the no-prime- condition, that question about race did not
appear on the questionnaire. Students had 25 minutes to complete the exam.
At the end of the exam, the experimenter collected the exam and disseminated several
questionnaires of dependent measures. The first questionnaire was the same one used in Study 2
and asked participants about their testing behavior (guessing, expended effort, persistence,
limited time, rereading, frustration, and bias). Also, the researchers used a 7-point Likert scale to
measure stereotype threat (Example question: “Some people feel that I have less verbal ability
because of my race”). Lastly, the researchers asked participants to respond to a questionnaire
measuring academic identification (Example questions: “I am a verbally-oriented person;”
“Sports are important to me”). As predicted, data showed that African American participants in
the race-prime condition performed worse than all other groups, but, their performance was
almost equal to Caucasian participants in the no-race- prime condition. African American
students in the race-prime condition performed significantly worse than African American
students in the no-race-prime condition and Caucasian students in the race-prime condition.
Although African American students in the no-race-prime condition performed worse than
Caucasian students in the no-race-prime condition, it was not a significant difference.
Dependent measures revealed that African American students in the prime condition
reported fewer guesses than Caucasian students in the prime condition. African American
students significantly reported, more than Caucasian students, that they read a question more
than once. African American students felt more stereotype threat than Caucasian participants.
Additionally, African American participants reported valuing sports less than Caucasian
participants. Correlations for this measure revealed that the worse African American students felt
they performed, then the more they disidentified with sports.
25
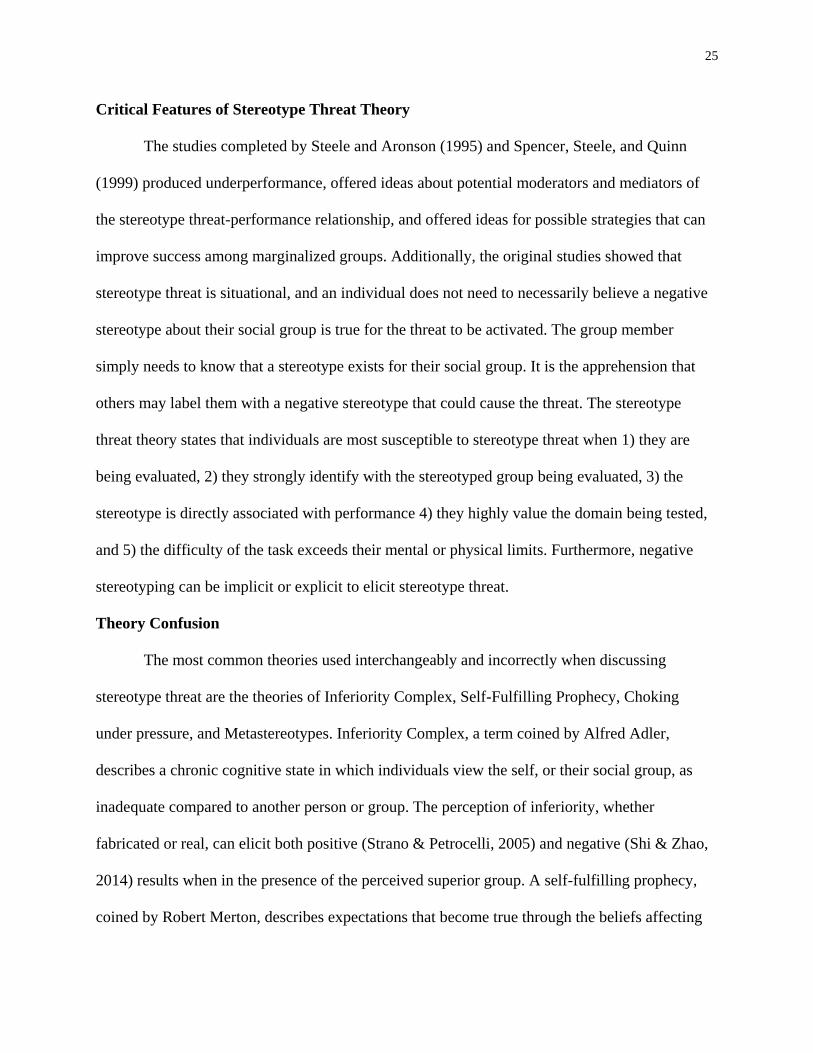
Critical Features of Stereotype Threat Theory
The studies completed by Steele and Aronson (1995) and Spencer, Steele, and Quinn
(1999) produced underperformance, offered ideas about potential moderators and mediators of
the stereotype threat-performance relationship, and offered ideas for possible strategies that can
improve success among marginalized groups. Additionally, the original studies showed that
stereotype threat is situational, and an individual does not need to necessarily believe a negative
stereotype about their social group is true for the threat to be activated. The group member
simply needs to know that a stereotype exists for their social group. It is the apprehension that
others may label them with a negative stereotype that could cause the threat. The stereotype
threat theory states that individuals are most susceptible to stereotype threat when 1) they are
being evaluated, 2) they strongly identify with the stereotyped group being evaluated, 3) the
stereotype is directly associated with performance 4) they highly value the domain being tested,
and 5) the difficulty of the task exceeds their mental or physical limits. Furthermore, negative
stereotyping can be implicit or explicit to elicit stereotype threat.
Theory Confusion
The most common theories used interchangeably and incorrectly when discussing
stereotype threat are the theories of Inferiority Complex, Self-Fulfilling Prophecy, Choking
under pressure, and Metastereotypes. Inferiority Complex, a term coined by Alfred Adler,
describes a chronic cognitive state in which individuals view the self, or their social group, as
inadequate compared to another person or group. The perception of inferiority, whether
fabricated or real, can elicit both positive (Strano & Petrocelli, 2005) and negative (Shi & Zhao,
2014) results when in the presence of the perceived superior group. A self-fulfilling prophecy,
coined by Robert Merton, describes expectations that become true through the beliefs affecting
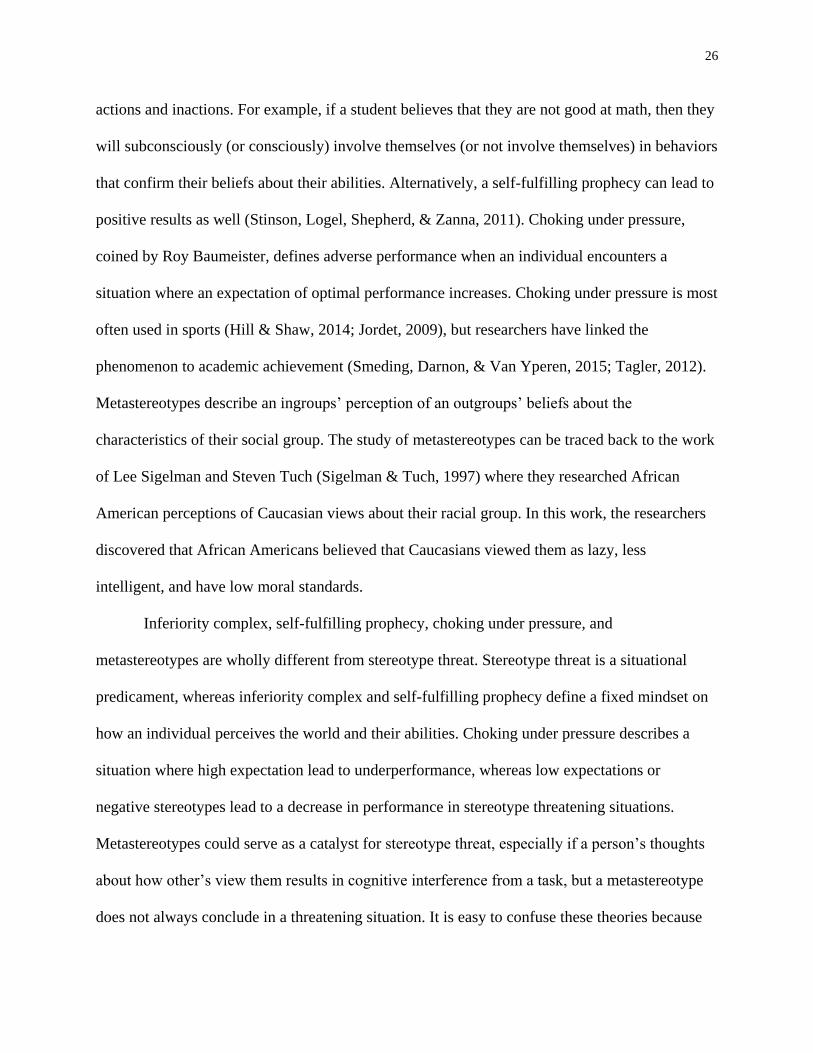
26
actions and inactions. For example, if a student believes that they are not good at math, then they
will subconsciously (or consciously) involve themselves (or not involve themselves) in behaviors
that confirm their beliefs about their abilities. Alternatively, a self-fulfilling prophecy can lead to
positive results as well (Stinson, Logel, Shepherd, & Zanna, 2011). Choking under pressure,
coined by Roy Baumeister, defines adverse performance when an individual encounters a
situation where an expectation of optimal performance increases. Choking under pressure is most
often used in sports (Hill & Shaw, 2014; Jordet, 2009), but researchers have linked the
phenomenon to academic achievement (Smeding, Darnon, & Van Yperen, 2015; Tagler, 2012).
Metastereotypes describe an ingroups’ perception of an outgroups’ beliefs about the
characteristics of their social group. The study of metastereotypes can be traced back to the work
of Lee Sigelman and Steven Tuch (Sigelman & Tuch, 1997) where they researched African
American perceptions of Caucasian views about their racial group. In this work, the researchers
discovered that African Americans believed that Caucasians viewed them as lazy, less
intelligent, and have low moral standards.
Inferiority complex, self-fulfilling prophecy, choking under pressure, and
metastereotypes are wholly different from stereotype threat. Stereotype threat is a situational
predicament, whereas inferiority complex and self-fulfilling prophecy define a fixed mindset on
how an individual perceives the world and their abilities. Choking under pressure describes a
situation where high expectation lead to underperformance, whereas low expectations or
negative stereotypes lead to a decrease in performance in stereotype threatening situations.
Metastereotypes could serve as a catalyst for stereotype threat, especially if a person’s thoughts
about how other’s view them results in cognitive interference from a task, but a metastereotype
does not always conclude in a threatening situation. It is easy to confuse these theories because
27
societal perceptions, self-perception, and stereotypes are the foundation of each theory.
However, each social-psychological situation is activated differently. The threat of being
stereotyped alone does not undermine performance. Individual differences can make a person
more susceptible to the negative effects of stereotype threat and disrupt cognitive functioning.
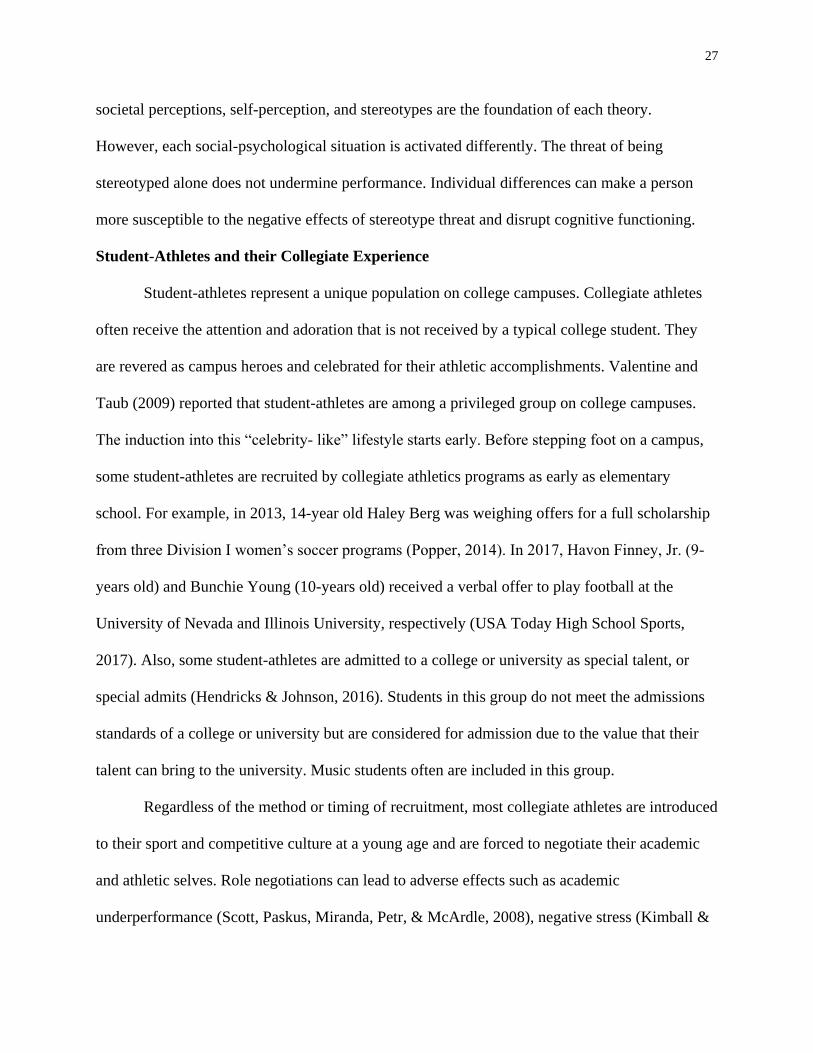
Student-Athletes and their Collegiate Experience
Student-athletes represent a unique population on college campuses. Collegiate athletes
often receive the attention and adoration that is not received by a typical college student. They
are revered as campus heroes and celebrated for their athletic accomplishments. Valentine and
Taub (2009) reported that student-athletes are among a privileged group on college campuses.
The induction into this “celebrity- like” lifestyle starts early. Before stepping foot on a campus,
some student-athletes are recruited by collegiate athletics programs as early as elementary
school. For example, in 2013, 14-year old Haley Berg was weighing offers for a full scholarship
from three Division I women’s soccer programs (Popper, 2014). In 2017, Havon Finney, Jr. (9-
years old) and Bunchie Young (10-years old) received a verbal offer to play football at the
University of Nevada and Illinois University, respectively (USA Today High School Sports,
2017). Also, some student-athletes are admitted to a college or university as special talent, or
special admits (Hendricks & Johnson, 2016). Students in this group do not meet the admissions
standards of a college or university but are considered for admission due to the value that their
talent can bring to the university. Music students often are included in this group.
Regardless of the method or timing of recruitment, most collegiate athletes are introduced
to their sport and competitive culture at a young age and are forced to negotiate their academic
and athletic selves. Role negotiations can lead to adverse effects such as academic
underperformance (Scott, Paskus, Miranda, Petr, & McArdle, 2008), negative stress (Kimball &
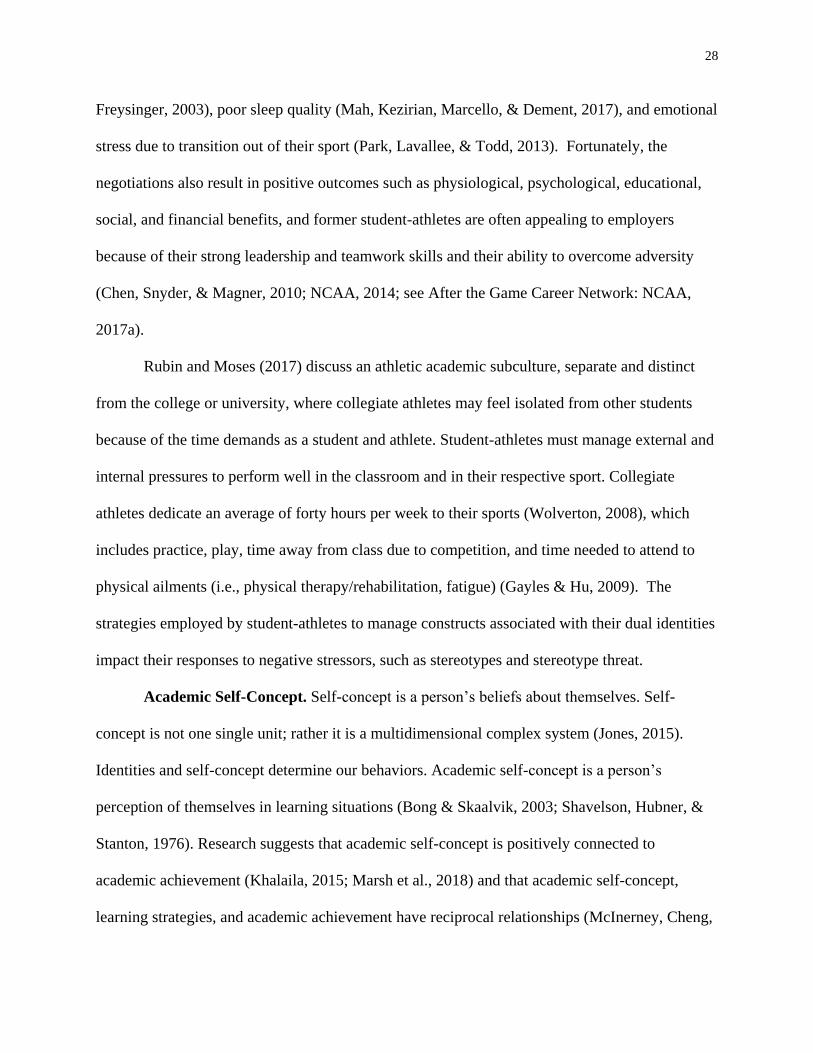
28
Freysinger, 2003), poor sleep quality (Mah, Kezirian, Marcello, & Dement, 2017), and emotional
stress due to transition out of their sport (Park, Lavallee, & Todd, 2013). Fortunately, the
negotiations also result in positive outcomes such as physiological, psychological, educational,
social, and financial benefits, and former student-athletes are often appealing to employers
because of their strong leadership and teamwork skills and their ability to overcome adversity
(Chen, Snyder, & Magner, 2010; NCAA, 2014; see After the Game Career Network: NCAA,
2017a).
Rubin and Moses (2017) discuss an athletic academic subculture, separate and distinct
from the college or university, where collegiate athletes may feel isolated from other students
because of the time demands as a student and athlete. Student-athletes must manage external and
internal pressures to perform well in the classroom and in their respective sport. Collegiate
athletes dedicate an average of forty hours per week to their sports (Wolverton, 2008), which
includes practice, play, time away from class due to competition, and time needed to attend to
physical ailments (i.e., physical therapy/rehabilitation, fatigue) (Gayles & Hu, 2009). The
strategies employed by student-athletes to manage constructs associated with their dual identities
impact their responses to negative stressors, such as stereotypes and stereotype threat.
Academic Self-Concept. Self-concept is a person’s beliefs about themselves. Self-
concept is not one single unit; rather it is a multidimensional complex system (Jones, 2015).
Identities and self-concept determine our behaviors. Academic self-concept is a person’s
perception of themselves in learning situations (Bong & Skaalvik, 2003; Shavelson, Hubner, &
Stanton, 1976). Research suggests that academic self-concept is positively connected to
academic achievement (Khalaila, 2015; Marsh et al., 2018) and that academic self-concept,
learning strategies, and academic achievement have reciprocal relationships (McInerney, Cheng,
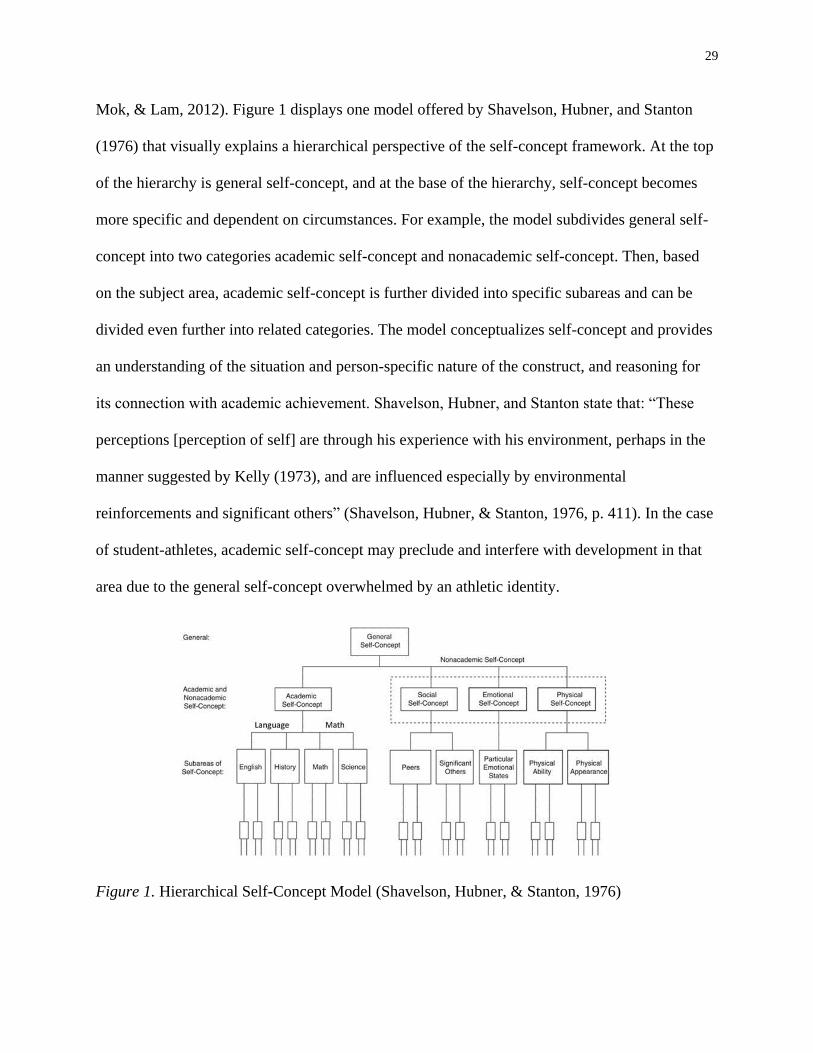
29
Mok, & Lam, 2012). Figure 1 displays one model offered by Shavelson, Hubner, and Stanton
(1976) that visually explains a hierarchical perspective of the self-concept framework. At the top
of the hierarchy is general self-concept, and at the base of the hierarchy, self-concept becomes
more specific and dependent on circumstances. For example, the model subdivides general self-
concept into two categories academic self-concept and nonacademic self-concept. Then, based
on the subject area, academic self-concept is further divided into specific subareas and can be
divided even further into related categories. The model conceptualizes self-concept and provides
an understanding of the situation and person-specific nature of the construct, and reasoning for
its connection with academic achievement. Shavelson, Hubner, and Stanton state that: “These
perceptions [perception of self] are through his experience with his environment, perhaps in the
manner suggested by Kelly (1973), and are influenced especially by environmental
reinforcements and significant others” (Shavelson, Hubner, & Stanton, 1976, p. 411). In the case
of student-athletes, academic self-concept may preclude and interfere with development in that
area due to the general self-concept overwhelmed by an athletic identity.
Figure 1. Hierarchical Self-Concept Model (Shavelson, Hubner, & Stanton, 1976)
30
There is a dearth of research on collegiate athletes and academic identity, which is a
missed opportunity considering the substantial amount of literature produced about collegiate
athletes and academic underperformance. However, the existing literature discusses grade point
average (Beron & Pquero, 2016), academic clustering (Houston & Baber, 2017), major selection
(Foster & Huml, 2017), academic services within athletic departments (Hazzaa, Sonkeng, &
Yoh, 2018), athletic identity (Rankin, Merson, Garvey, Sorgen, Menon, Loya, & Oseguera,
2016), in-Season vs. out-of-Season academic performance (Scott, Paskus, Miranda, Petr, &
McArdle, 2008) and the federal government and NCAA dissatisfaction with academic standards
for student-athletes (Castle, Ammon, & Barnes, 2015; LaForge & Hodge, 2011). Most research
approaches the topic of student-athlete academic identity from a deficit framework. Also, a
substantial amount of the literature focuses on African American male student-athletes (Cooper
& Cooper, 2015; Harris, Hines, Kelly, Williams, & Bagley, 2014; Johnson & Migliaccio, 2009),
because the group is overrepresented in the collegiate athlete population. For example, in 2016,
research showed that African American men at Auburn University represented 3.2% of the
undergraduate population yet comprised 77.9% of the football and basketball teams (Harper,
2016). From the limited research, one cannot construct a complete narrative of the climate of
academic self-concept among student-athletes. Scholars must rely on data from NCAA academic
initiatives to assess the state of collegiate athletes and academic identity.
Due to its renewed focus on the academic achievement of its member institutions, the
NCAA has created the infrastructure to increase academic identification among collegiate
athletes. The NCAA governs academic policies that reward and penalize teams for their
academic performance through the Academic Performance Program (APP). The NCAA
initiatives seek to nurture student-athletes’ socio-psychological well-being when balancing their

31
dual social identities to achieve high academic and athletic standards. The NCAA has a mission
to develop young adults into productive citizens who excel in their post-graduation pursuits.
“More than a decade into academic reform, Division I student-athletes continue to
improve academically. More student-athletes than ever are graduating, due in large part to
enhanced eligibility standards and the success of the Division I Academic Performance Program.
Division I is committed to an intercollegiate athletics model which recognizes and supports the
importance of the academic mission of its member schools” (NCAA, 2018a, para. 1). The APP
covers the Academic Progress Rate (APR) and the Graduate Success Rate (GSR). The APR
accounts for the eligibility (grade point average and credit hours towards degree completion) and
retention of each student-athlete per academic term. The overall score is a team-based average
out of 1000 points. The Graduation Success Rate differs from the Federal Graduate Rate because
it accounts for student-athletes who transfer to another university in good academic standing
(removes them from their GSR cohort) and for those student-athletes who transfer into a
university (adds them to their GSR cohort).
Data show that these initiatives have increased the scholastic success of student-athletes.
Contrary to the negative stereotype about student-athletes’ intellectual ability, graduation rates
for student-athletes are higher than the national average of the general student population
(NCAA, 2018b). However, the NCAA reported differences in APR and GSR scores between
participants on male and female intercollegiate teams. According to multi-year national data
collected by the NCAA (2016), Division I student-athletes in male sports had a lower average
Academic Progress Rate (APR) than student-athletes participating in female sports (male sports:
978; female sports: 987) across 19 varsity sports. Also, based on information collected from the
2014-2017 graduating classes (NCAA, 2017b), student-athletes participating in male sports had a
32
lower average Graduation Success Rate (GSR) than student-athletes participating in female
sports across 18 male sports and 17 female sports (males: 85%; females: 93%). The total number
of teams differ between APR and GSR because cross country and track and field were combined
in the GSR data, and beach volleyball (female sport) was not included in this data for reasons
undisclosed. The differences were not tested for statistical significance, but they are of interest in
the narrative about student-athlete academic success. Although there are no empirically-based
data that discuss academic self-concept among student-athletes specifically, APR and GSR data
combined with tangential literature of academic-related topics could serve as a marker for
student identity development and beliefs in this domain. Further research is needed in this area.
Athletic Identity. Brewer, Van Raalte, and Linder (1993) define athletic identity as the
degree to which an athlete incorporates their athletic identity into their self-concept. Beamon
(2012) states that one’s identity consists of how an individual views him or herself and how
others view an individual. Beamon states that elite athletes receive “elevated levels of social
reinforcement for their physical abilities,” and consequently, elite athletes may have an exclusive
athletic identity, and others view may them solely as an athlete. The athletic identity is
established during the early development stages of a student-athlete’s life, and actions nurture the
identity. A stronger athletic identity can lead collegiate athletes to academically less rigorous
majors (Foster & Huml, 2017), participation in sports with higher cultural significance
(Rasquinha & Cardinal, 2017), decreased career maturity (Houle & Kluck, 2015), lower career
optimism (Tyrance, Harris, & Post, 2013), and emotional distress and negative effects to well-
being upon athletic disengagement (Heird & Steinfeldt, 2011; Van Lone, Siembor, Mistler, &
Mapstone, 2017).
33
Also, Antshel, VanderDrift, and Pauline (2016) conducted a study to explore the effect of
athletic identity on student-athlete concentration or difficulty thinking. The results show that
students with higher levels of athletic identity had the most issues with concentration.
Demographically, it was discovered that females student-athletes had more difficulty thinking
than male student-athletes; students who listed their race as “other” ranked highest in difficulty
thinking (followed by African Americans and then Caucasians); sophomores ranked highest in
inattention (followed by juniors, freshmen, seniors, and then graduate students); students
receiving full scholarships ranked highest in inattention (followed by students receiving partial
scholarships and then students who receive no scholarship); and student-athletes who stated that
they would compete professionally were more likely to have difficulty thinking. Findings also
suggest that the student-athletes with higher levels of inattention had lower grade point averages
and were less likely to use academic support services.
Athletic Identity Foreclosure. Identity foreclosure is one of four identity statuses
(identity diffusion, identity moratorium, identity foreclosure, and identity achievement) in James
Marcia’s Identity Status Theory. According to Marcia, the requirements to attain a mature
identity are based on crisis and commitment (Dembo & Seli, 2016, p. 99). Identity foreclosure
occurs when an individual commits to specific beliefs or goals without considering other options
(see Figure 2). For example, student-athletes may commit to becoming a professional athlete
without considering other skills, passions, and career options to avoid potential anxiety caused
by thinking about a future outside of competition. A foreclosed identity is extremely problematic
for student-athletes because it breeds unrealistic expectations. Out of the 480,000 NCAA
student-athletes that compete nationally, only 2% continue their respective sports professionally.
The probability of the continuation of sport past college is less likely for female collegiate

34
athletes because there are fewer opportunities to play professionally. Discussing alternative
career paths is a logical plan for student-athlete development and success. It is often these
shortsighted goals and underdeveloped plans that lead to monolithic views of student-athletes.
The goal of becoming a professional athlete is not by itself shortsighted, but the lack of
exploration of parallel plans is irresponsible. An even more troubling realization is that student-
athletes are perpetuating their own negative stereotypes through their actions and inactions in
creating multiple identities. It is expected that a student-athlete possess an athletic identity just as
one would expect anyone to identify with a domain they care about; however, overidentification
often perpetuates the view of an academically inferior student-athlete. Lastly and consistent with
the emphasis on individualization, differences among in athletic identity and identity foreclosure
have been shown between across race, gender, sport, and major selection (Beamon, 2012; Daltry,
2012; Foster & Huml, 2017; Harrison, Sailes, Rotich, & Bimper, 2011; Lupo, Mosso, Guidotti,
Cugliari, Pizzigalli, & Rainoldi, 2017; Mignano, Brewer, Winter, & Van Raalte, 2006;
Rasquinha & Cardinal, 2017).
No Crisis Crisis
No Commitment Diffusion Moratorium
Commitment Foreclosure Achieved
Figure 2. Identity Status Theory Model (Marcia, 1966)
Stereotypes. During matriculation, there is a myriad of services offered to student-
athletes while in the care of collegiate athletic programs. Student-athletes have designated
academic advisors (Curtis, 2006; National Association for Academic Advisors for Athletics,
2017), tutoring services (Banbel & Chen, 2014), and writing support (Rifenburg, 2016). These
services often take place in separate athletic learning labs. The recruitment and admission
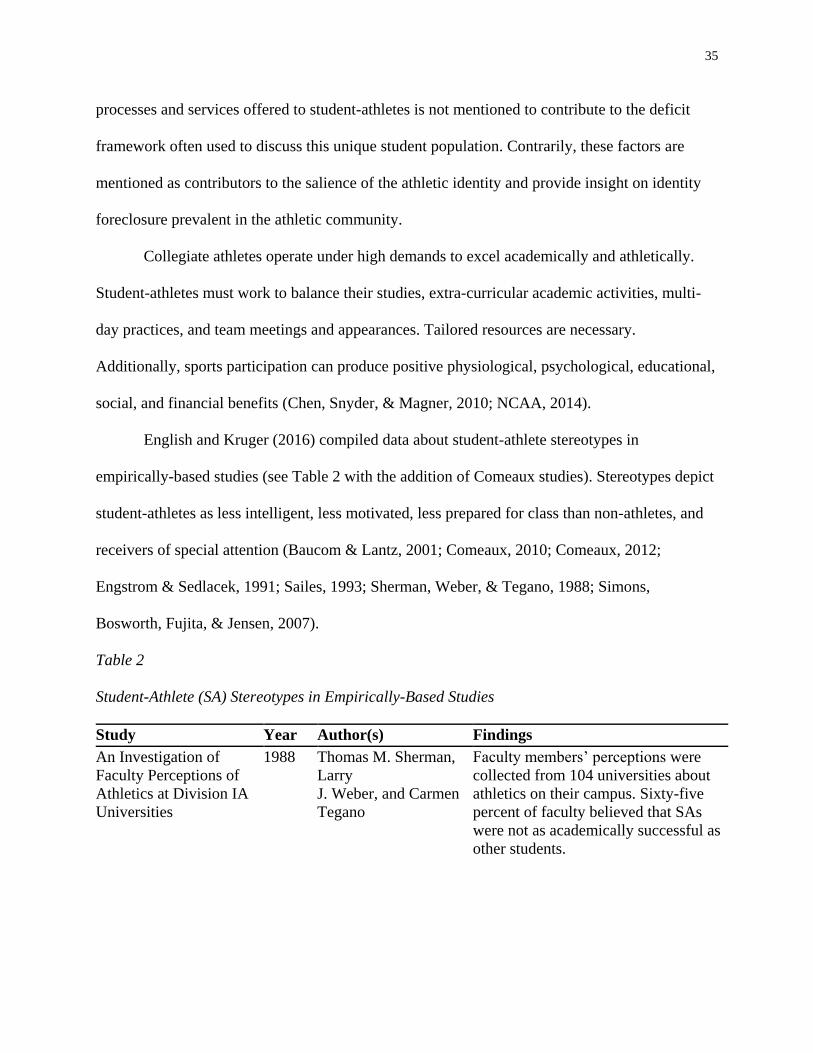
35
processes and services offered to student-athletes is not mentioned to contribute to the deficit
framework often used to discuss this unique student population. Contrarily, these factors are
mentioned as contributors to the salience of the athletic identity and provide insight on identity
foreclosure prevalent in the athletic community.
Collegiate athletes operate under high demands to excel academically and athletically.
Student-athletes must work to balance their studies, extra-curricular academic activities, multi-
day practices, and team meetings and appearances. Tailored resources are necessary.
Additionally, sports participation can produce positive physiological, psychological, educational,
social, and financial benefits (Chen, Snyder, & Magner, 2010; NCAA, 2014).
English and Kruger (2016) compiled data about student-athlete stereotypes in
empirically-based studies (see Table 2 with the addition of Comeaux studies). Stereotypes depict
student-athletes as less intelligent, less motivated, less prepared for class than non-athletes, and
receivers of special attention (Baucom & Lantz, 2001; Comeaux, 2010; Comeaux, 2012;
Engstrom & Sedlacek, 1991; Sailes, 1993; Sherman, Weber, & Tegano, 1988; Simons,
Bosworth, Fujita, & Jensen, 2007).
Table 2
Student-Athlete (SA) Stereotypes in Empirically-Based Studies
Study Year Author(s) Findings
An Investigation of
Faculty Perceptions of
Athletics at Division IA
Universities
1988 Thomas M. Sherman,
Larry
J. Weber, and Carmen
Tegano
Faculty members’ perceptions were
collected from 104 universities about
athletics on their campus. Sixty-five
percent of faculty believed that SAs
were not as academically successful as
other students.
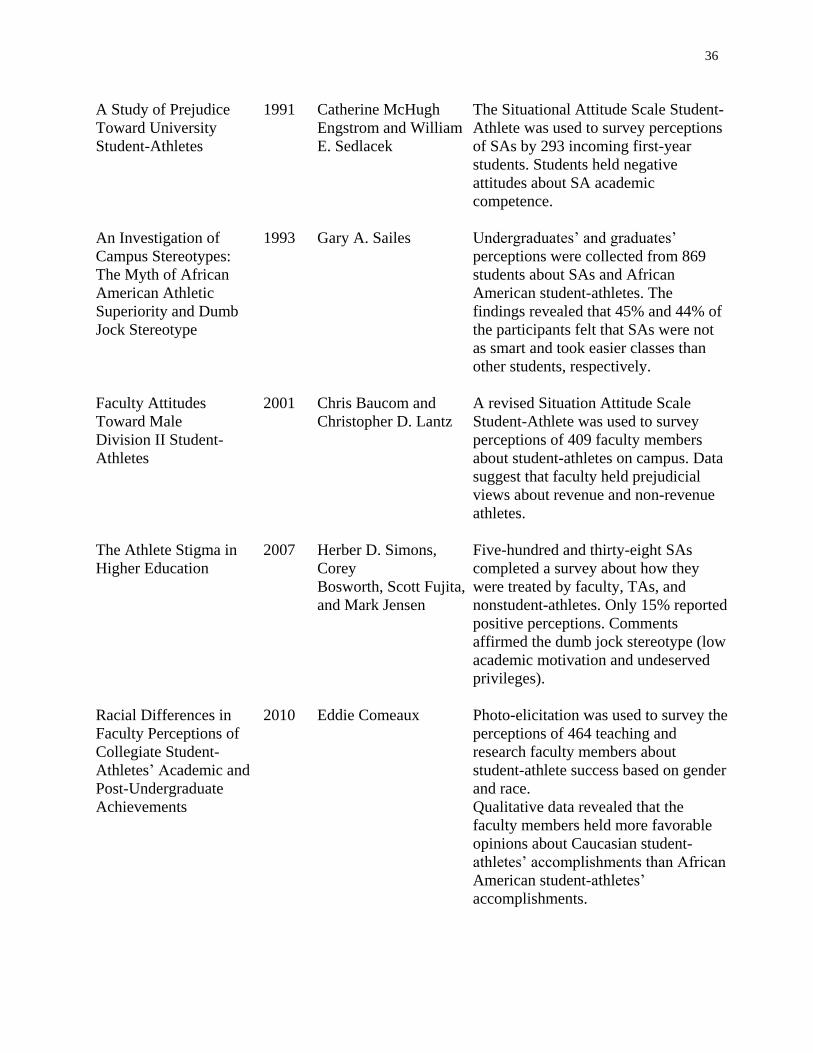
36
A Study of Prejudice
Toward University
Student-Athletes
1991 Catherine McHugh
Engstrom and William
E. Sedlacek
The Situational Attitude Scale Student-
Athlete was used to survey perceptions
of SAs by 293 incoming first-year
students. Students held negative
attitudes about SA academic
competence.
An Investigation of
Campus Stereotypes:
The Myth of African
American Athletic
Superiority and Dumb
Jock Stereotype
1993 Gary A. Sailes Undergraduates’ and graduates’
perceptions were collected from 869
students about SAs and African
American student-athletes. The
findings revealed that 45% and 44% of
the participants felt that SAs were not
as smart and took easier classes than
other students, respectively.
Faculty Attitudes
Toward Male
Division II Student-
Athletes
2001 Chris Baucom and
Christopher D. Lantz
A revised Situation Attitude Scale
Student-Athlete was used to survey
perceptions of 409 faculty members
about student-athletes on campus. Data
suggest that faculty held prejudicial
views about revenue and non-revenue
athletes.
The Athlete Stigma in
Higher Education
2007 Herber D. Simons,
Corey
Bosworth, Scott Fujita,
and Mark Jensen
Five-hundred and thirty-eight SAs
completed a survey about how they
were treated by faculty, TAs, and
nonstudent-athletes. Only 15% reported
positive perceptions. Comments
affirmed the dumb jock stereotype (low
academic motivation and undeserved
privileges).
Racial Differences in
Faculty Perceptions of
Collegiate Student-
Athletes’ Academic and
Post-Undergraduate
Achievements
2010
Eddie Comeaux
Photo-elicitation was used to survey the
perceptions of 464 teaching and
research faculty members about
student-athlete success based on gender
and race.
Qualitative data revealed that the
faculty members held more favorable
opinions about Caucasian student-
athletes’ accomplishments than African
American student-athletes’
accomplishments.

37
Unmasking Athlete
Microaggressions:
Division I Student-
Athletes’ Engagement
with Members of the
Campus Community
2012 Eddie Comeaux The Simons and colleagues (2007)
survey was completed by 122 student-
athletes to explore how they perceive
their experiences with professors and
other students in classroom settings.
Most student-athletes cited positive or
neutral interactions with faculty and
non-athlete peers. Those who did
mention negative interactions stated
that they were viewed as less
intelligent, lacked academic
motivation, and received unwarranted
special treatment.
Negative stereotypes about student-athletes are ubiquitous in society. Most recently, a
dialogue meme about student-athletes appeared on Twitter, satirically depicting an excessively
motivated, self-centered, and overstimulated student-athlete focused on their athletic goals
exclusively (see Figure 3). In the meme, someone says something harmless and the student-
athlete responds defensively and reorients the conversation to discuss their athletic prowess.
Figure 3. Student-Athlete Dialogue Meme Examples 1
Thoughts about student-athletes are portrayed on this medium for entertainment;
however, its presence and popularity are indicative of a view of the one-dimensional student-
athlete. Subsequently, student-athletes may be susceptible to the negative effects that stereotypes
can have on academic performance.
38
Stereotype Threat and Academic Performance. Studies show that stereotype threat
impedes the academic performance of student-athletes in situations where they are primed for
their athletic identity (Dee, 2014; Yopyk & Prentice, 2005) and in some situation where they are
primed for their dual identities as both a student and athlete (Harrison, Stone, Shapiro, Yee,
Boyd, & Rullan, 2009; Stone, Harrison, & Mottley, 2012). Yopyk and Prentice (2005) conducted
two studies to explore the impact of stereotype threat on the test performance and self-regard of
the football team, men’s ice hockey team, and three all-male a capella singing groups at
Princeton University. Study 1 included 37 student-athletes and 30 a capella group members.
Study 2 included 19 student-athletes. The a capella groups were added to the study as a
comparison group to prevent outcomes explained by the manipulation and not the phenomenon
itself. Three to five students were randomly assigned to either a group priming the
extracurricular identity, student identity, or no identity. Students in the extracurricular identity
group were asked to describe their last athletic or singing performance. The experimenters asked
the student group to describe their last academic accomplishment. The students in the control
group (no identity group) wrote specific directions from the library to their dorm. After each
writing task, the students completed the Self-Rating Scale questionnaire and a ten-question
mathematics exam. Student-athletes in the extracurricular identity group performed worse on the
math test and self-rating scale than any other group. The researchers designed Study 2 much like
the Steele and Aronson (1995) study, which included a word fragment completion task.
Experimenters primed students from the football team, men’s hockey team, and baseball teams at
Princeton University for their athlete identity by asking them to complete the self-rating
inventory and for their student identity by asking them to complete the ten questions
mathematics exam from Study 1.

39
Immediately following the completion of the inventory or math test, the students
completed a task that asked them to fill in the letters of 20-word fragments. The fragments
included words related to either the student or athletic identity (i.e., A_ _ _ _ _ IC; ATHLETIC.
ACADEMIC). Student-athletes in the self-rating group (or athlete prime group) completed more
word fragments with athletic-related words, and student-athletes in the math group (student
prime group) completed more word fragment with student-related words. These results highlight
the negative effects of implicit stereotype priming on both relevant and seemingly irrelevant
(word fragment completion) task performance. The salience of the identity, once activated,
elicited a negative stereotype among the student-athletes which led to a decrease in performance
across multiple domains.
Harrison, Stone, and colleagues (2009) evaluated the intersection of gender, athletic
identity, and student-athlete identity (dual identity) on stereotype threat. The researchers
hypothesized that female collegiate athletes would have poorer academic performance than male
collegiate athletes because female student-athletes are more engaged in academics; and thus,
would be more threatened by a negative stereotype. The study included 45 female male student-
athletes and 43 female student-athletes. Before taking a 40-item GRE-style test of verbal
analogies, male and female student-athletes were asked if they were a Division I athlete (athletic
identity prime), a student-athlete (dual identity prime), or a research participant (no prime). The
reported data confirmed that female collegiate athletes posted poorer performance on the GRE-
style test than their male counterparts, especially when they were primed with their dual
identities. The negative stereotypes associated with an athletic identity proved a more
overwhelming factor in performance than the positive stereotypes associated with a student
identity. The study supports a feature of the stereotype threat theory which asserts that stereotype
40
threat is activated when an individual identifies with the group being stereotyped and the domain
being tested.
In 2012, Stone, Harrison, and Mottley expanded their research on stereotype threat to
explore the differences in race on the experiences of stereotype threat among student-athletes
(Stone, Harrison, & Mottley, 2012). Specifically, the researchers wanted to evaluate the effects
of stereotype threat on academically-engaged African American collegiate athletes. The group of
students is stigmatized due to their race and their status as an athlete. After a three-year
recruitment period, the study included 75 African American and 76 Caucasian collegiate athletes
representing nine varsity sports. The experimenters disseminated a pretest asking students to
answer demographic questions and complete a measure of academic engagement. Student-
athletes and nonathletes were invited to participate in the study to simulate a classroom in the
lab. Once in the classroom, students were presented with envelopes on their desk with a 55-
minute verbal analogy test inside. Before starting the exam, students were asked to place a check
next to the following statements on the cover page of their exam depending on their identity
prime group: 1) I am an athlete (athlete prime group); 2) I am a scholar-athlete; (scholar-athlete
prime group) or 3) I am a research participant (no prime group). Only one statement was listed
depending on group assignment. The cover page also indicated that their scores would be
compared to other students on campus. The results show that academically-engaged African
American collegiate athletes performed significantly worse on difficult test items than Caucasian
collegiate athletes when primed for their athletic identity and their scholar-athlete identity and on
easy items when primed for their scholar-athlete identity. The study further supports the
theoretical assertion that group and domain identifications elevate susceptibility to stereotype
41
threat. Additionally, the study highlights the extra burden of racial stereotypes on the effects of
stereotype threat among student-athletes.
From 2005 to 2012, the research on stereotype threat and student-athletes examined
whether the student population was affected by devaluing stereotypes in academic settings. It
was not until 2013, when Feltz, Schneider, Hwang, and Skogsberg sought to understand factors
that made student-athletes susceptible to stereotype threat. The researchers recruited student-
athletes from all divisions to participate in a study seeking to explore the effects of athletic
identity, academic ability, and a coach’s regard of an athlete’s academic ability on their
experiences with stereotype threat. The study included 318 student-athletes. Feltz et al. (2013)
used the Athlete Identity Measurement Scale to measure athletic identity (Brewer et al., 1993),
the Michigan State Self- Concept of Ability Scale-General to measure academic identity
(Brookover, LePere, Hamachek, Thomas, & Erickson, 1965), the question “My coach has a high
opinion of my academic ability” to measure a coach’s regard for an athlete’s academic ability,
and the College Academic Beliefs scale to evaluate individual differences in perceived
stereotype threat (Ployhart, Ziegert, & McFarland, 2003). Ployhart et al.’s study is unique
because they did not experimentally manipulate stereotype threat; rather they measured self-
perceptions of stereotype threat directly. When determining the relationships between those
measures the researchers controlled for gender, race/ethnicity, type of sport, and division level.
Data revealed that academic and athletic identification were negatively correlated, while coach’s
regard was positively correlated with academic identification and negatively correlated with
athletic identification. Furthermore, Division I athletes in high-profile sports (i.e., basketball and
football) were more susceptible to stereotype threat and believed that their coach had a more
negative view of their academic ability. The study was significant because it used Ployhart et

42
al.’s study design to observe stereotype threat in a real-world context, and it explored multiple
variables unique to student-athletes to test susceptibility to stereotype threat.
Dee (2014) presented an economist perspective on the effects of stereotype threat in the
student-athlete population. He argues that social identities (athletic identity) and views of social
norms can lead to negative educational and economic outcomes. The study was designed like
most other stereotype threat experiments. Student-athletes (N = 37) and nonathletes (N = 47)
were placed in a group where they were either primed or not primed for their athletic identity.
Students in both groups completed a one-page questionnaire before answering thirty quantitative
questions and nine verbal questions taken from the Graduate Records Examination (GRE). The
control group (no prime) completed a questionnaire asking about living arrangements. The threat
group (prime) answered questions about their status as NCAA athletes. If the student was a
student-athlete, then they listed the sport they played and provided information about the
prevalence of conflict between their athletic and academic commitments. Results show that
student-athletes in the threat group performed worse on the test than nonathletes, and male
student-athletes performed worse than female student-athletes in the threat condition. The
study’s findings are consistent with the stereotype threat theory. Dee contributed to the literature
by highlighting the educational and economic impairments caused by stereotype threat and
introducing a priming technique that resembles a more realistic student-athlete encounter with a
threat of a negative stereotype (i.e., asking students about scheduling conflicts with academic
activities).
Most recently journals have published studies evaluating stereotype threat and student-
athletes in a specific academic domain and qualitatively. A study by Riciputi and Erdal (2017)
divided 60 student-athletes into a stereotype threat condition or control condition to assess the

43
effects of stereotype threat on math performance. Results showed that student-athletes in the
threat condition attempted fewer math problems and performed worse than student-athletes in the
control condition. The researchers did not find gender differences in effort or performance. The
findings on gender and stereotype threat are contrary to previous findings about women and math
performance. However, the study included Division III student-athletes, which is a group of
students often recognized for their academic accomplishments. Division III athletes are not
awarded athletic scholarships. Thus, the assumption is that less pressure from the university
leads to a decrease in athletic identity.
Griffin (2017) explored how ten collegiate African American football players engage
with stereotype threat. Outcomes from Dee’s (2014) student found that male student-athletes are
more susceptible to stereotype threat and subsequently more at risk for academic
underperformance. Also, there is an abundance of data discussing stereotypes about and the
effects of stereotype threat on African American students (Massey & Owens, 2014; McClain &
Cokley, 2017; McKay, Doverspike, Bowen- Hilton, & McKay, 2003; Sailes, 1993; Steele and
Aronson, 1995; Von Robertson & Chaney, 2015). As discussed in previous sections, the
stigmatization of dual identities can compound the effects of stereotype threat in educational
settings. Griffin sought to capture the first-person narrative from the study participants through
individual interviews. Interview questions asked about the length of play, the recruitment
process, academic difficulties, self-identities, and how others perceived them. The researchers
analyzed the student-athletes’ responses to understand how they experience stereotype threat.
Findings revealed that participants responded to stereotype threat by exacerbating the negative
stereotype by appearing disinterested in learning, habituating or hiding their athletic identity, or
mitigating the threat of a negative stereotype by being engaged while in academic settings. The
44
qualitative data revealed that student-athletes are aware of negative stereotypes about their group
and provided information about how the group manages stereotype threat. The study is a
refreshing alternative to how stereotype threat is traditionally studied. Additionally, it
complements the previous stereotype threat data collected by giving a voice to the quantitative
data.
Collectively, the studies provide critical insight on student-athlete experiences with
stereotype threat in academic environments. Each study, set in academic spaces, compliments
each other by progressing the previous research; offering a more comprehensive perspective on a
complex social and psychological phenomenon within the student population. Yopyk and
Prentice (2005) set the foundation for research in the area of stereotype threat and student-
athletes; suggesting that the population is affected by negative stereotypes in academic settings.
Harrison et al. (2009) followed the research by focusing on the impact of priming methods (i.e.,
athlete vs. scholar-athlete) on collegiate athletes’ interaction with negative stereotypes in the
classroom. Then, Stone, Harrison, and Mottley (2012) coupled their research on priming
methods with intersectional scholarship focusing on the influence of race (African American and
Caucasian) on student-athlete experiences.
Feltz (2013) elevated the research by transitioning the conversation to moderators that
influence stereotype threat susceptibility. In 2014, Dee supported the findings of Yopyk and
Prentice (2005) yet contributed to the literature differently by offering an economist perspective
on the issue and expanding the type of sports represented in stereotype threat research.
Additionally, Dee mimicked a more realistic priming method in his study. Riciputi and Erdal
(2017) focused their interest on the impact of stereotype threat on mathematics performance.
Lastly, Griffin (2017) contributed to the conversation by presenting qualitative research on the
45
experiences of Division I African American football players, who are among one of the most
well-known groups in American society. It is important to briefly discuss the selected statistical
analysis for these studies to place the results in context. Each study used analysis of variance or a
combination of analysis of variance and covariance to analyze data, with the exceptions of Feltz
and his colleagues (structural equation modeling), Dee (regression), and Griffin (semi-structured
interviews). Each study yielded less than one hundred study participants except for Feltz and his
colleagues’ (non-experimental study) and Stone and his colleagues (three-year recruitment
period).
The results of these studies present substantial evidence on the impeded academic
performance of student-athletes when faced with identity threatening situations and provide
insight on strategies to buffer these effects. Student-athletes are a stigmatized group on college
campuses, and a greater understanding of moderators and mediators is necessary to address
stereotype reduction strategies comprehensively. The current published work moves the
conversation forward, and more rigorous analysis (experimental and natural) could enhance the
quality of the student-athlete community.
Mechanism of an Effective Strategy: Effects, Moderators, and Mediators
Effects. Stereotype threat is known to undermine competence in multiple domains.
Specifically, the perceived risk of confirming a negative stereotype about one’s social group can
affect academic performance, motor skill performance, disidentification and career selection,
sense of belonging, and psychological and physical well-being. Rodriguez (2014) found that
stereotype threatened Hispanic undergraduates in a summer bridge program performed worse on
an SAT verbal exam said to measure their academic ability compared to Hispanic
undergraduates in the non-threat condition. When women perceived themselves to be

46
overweight, they performed worse on a balancing task when made aware of a stereotype about
balancing and weight than women who were not made aware of that stereotype (Lopes Cardozo
& Chiviacowsky, 2015). Woodstock, Hernandez, Estrada, and Schulz (2012) discovered the
chronic effects of stereotype threat on science disidentification and subsequent career selection
among Hispanic/Latino postgraduates. A study involving high school students reported a
significant difference among marginalized (African American, American Indian, and Latino) and
non-marginalized (European American and Asian American) groups regarding sense of
belonging dependent on them listing their race before answering a question about sense of
belonging (Mello, Mallett, Andretta, & Worrell, 2012).
Female surgical residents with higher degrees of stereotype perception (more likely to be
negatively impacted by stereotype threat) had poorer psychological health compared to females
with lower degrees of stereotype perception, and male surgical residents (Salles, Mueller, &
Cohen, 2015). Additionally, Blascovich, Spencer, Quinn, & Steele (2001) discovered a link
between stereotype threat and high blood pressure among African American collegiate students.
Research spans multiple domains, and the majority of stereotype threat research is
conducted in educational settings and tested experimentally. Most recently stereotype threat was
shown to reduce the reading performance among elementary school boys (Pansu, Regner, Max,
Cole, Nezlek, & Huguet, 2016), perpetuate a negative self-assessment of management skills
among female business students (Flanagan, 2015), act as a barrier to undergraduate women
entering engineering careers (Caderet, Hartung, Subich, & Wigold, 2017), negatively affect
social adjustment and academic success of African American males attending a predominantly
Caucasian institution (Von Robertson & Chaney, 2015); and junior faculty in the field of
medicine were shown to be more susceptible to stereotype threat and more likely to choose

47
careers outside of academia (Fassiotto et. al., 2016). Stereotype threat is counterintuitive to
learning environments especially if teachers, administrators, and students are perpetuating
stereotypes that could potentially prevent learning. However, stereotype threat is not activated by
the mere existence of a negative stereotype; the effect relies heavily on individual differences.
Moderators. The literature describes several studied moderators of the stereotype threat-
performance relationship and suggests that individual differences determine susceptibility to
stereotype threat. Differences in working memory, self-esteem, locus of control, and stigma
consciousness have been found to moderate stereotype threat (Cadinu, Maass, Lombardo, &
Frigerio, 2006; Régner, Smeding, Gimmig, Thinus-Blanc, Monteil, & Huguet, 2010; Rydell &
Boucher, 2010; Silverman & Cohen, 2014). The bulk of the research has shown that the extent to
which a person identifies with a social group (i.e., race) and domain (i.e., math) moderates
stereotype threat. However, research shows that domain identification is not always a factor in
stereotype threat activation (Keller & Dauenheimer, 2003). This section will focus on social
identity.
Most research on social identities focuses on the influence of gender identification
(Beasley & Fischer, 2012; Gresky, Eyck, Lord, & McIntyre, 2005; Hermann & Vollmeyer, 2016;
Hively & El-Alayli, 2014; Koenig & Eagly, 2005; Luong & Knobloch, 2017; Schmader, 2001)
and race identification (Craemer & Orey, 2017; Fischer, 2010; Jaramillo, Mello, & Worrell,
2016; Johnson-Ahorlu, 2013; Von Robertson & Chaney, 2015) on the impact of stereotype
threat. Specifically, research focuses mostly on women and African Americans. For example,
Schmader (2001) reported that women had significantly lower math performance than men when
researchers made their gender identity relevant to their math performance. The study showed that
gender identification could be a moderator for math performance among women. Additionally,

48
and in another domain, female soccer players had adverse reactions to stereotype threat on a
dribbling task (Hermann & Vollmeyer, 2016). The soccer players completed two dribbling tasks
while being timed. The first dribbling task was followed by either reading an article about the
incompetence of female soccer players (threat condition) or the popularity of soccer (non-threat
condition). After reading the article, the athletes performed their second dribbling task. Soccer
players in the threat condition were shown to need more time on the dribbling task than the
soccer players in the non-threat condition.
African American students have been a population of interest in stereotype threat
research. As noted earlier, the prevailing stereotype about African Americans is that they are
intellectually inferior to other racial groups, and more specifically, stereotypes claim that African
American students are academically inferior to other racial groups. For example, qualitative data
showed that African American college students attending four-year institutions cited stereotype
and stereotype threat as a barrier to academic success (Johnson-Ahorlu, 2013). During focus
groups, African American students detailed situations in which professors and other students
questioned their academic preparedness without cause and discussed the added pressure they feel
from their racial identity in the classroom. Two African American students from the study stated
that,
“. . . one particular professor . . . there have been situations where he keeps coming or
asking other students about me, about whether or not they think I can do my job as a
student, whether I'm pulling my weight in my class and whatever, things like that... the
fact that this one professor has repeatedly asked one of my friends . . . if I can do it or if
I'm contributing to the classroom as I should be, that makes me really mad” (Johnson-
Ahorlu, 2013, p. 387).
49
“It's really sad that I think African Americans and a lot of other cultures . . . we think
about so much. It's not just go to school, sit in class, do well. It's like things are going on
and you're thinking about things. Like . . . we gotta prove that we deserve to be here . . .
there's too much going on” (Johnson-Ahorlu, 2013, p. 388).
Fischer’s (2010) study exploring performance burden and stereotype threat on college
outcomes supports the above student experiences and expounds upon the experiences of students
of color on college campuses with longitudinal data. According to Fisher, performance burden is
defined as “the degree to which students feel that out-group members judge their group on the
basis of their own personal academic successes and struggles” (Fischer, 2010, p. 23). Data for
the study came from the National Longitudinal Survey of Freshmen and examined cumulative
grade point average, satisfaction with campus life, and on- time graduation (graduating in four
years) as college outcomes. Fischer used data collected in the students’ freshman and sophomore
years. Findings suggest that students who experience a higher level of performance burden and
stereotype threat have lower grade point averages, have less satisfaction with campus life, and
are at risk of disidentifying with school by studying less, thus negatively impacting on-time
graduation. Minority populations on college campuses represent students in these categories. The
study was one of the first to examine the effects of stereotype threat over time.
Although research on gender and racial identification is most prevalent, researchers have
provided data on the impact of stereotype threat on other social identities. Researchers have
collected data on stereotype threat and age (Kang & Chasteen, 2009; Lamont, Swift, & Abrams,
2015), religion (Christians: Rios, Chen, Totton, & Shariff, 2015), sexuality (Gay men: Bosson,
Haymovitz, & Pinel, 2004), socioeconomic status (Low socioeconomic status: Desert, Preaux, &
50
Jund; 2009; Leyens, Desert, Croizet, & Darcis, 2000), vocation (Men as nurturers: Kalokerinos,
Leuven, Kjelsaas, Bennetts, & Hippel, 2017), and stigmatized groups (Recovering drug addicts:
Hippel, Henry, Terrett, Mercuri, McAlear, & Rendell). Furthermore, the effects of stereotype
threat are not limited to women, African Americans, and other marginalized groups. Stereotype
threat can affect any social group that has a negative stereotype.
Caucasian male college students underperformed on a math exam when they were told
that their performance would be compared to Asian students (Aronson, Lustina, Good, &
Keough, 1999), and on a golf task when told that the task was framed as diagnostic of their
natural athletic ability (Stone, Lynch, Sjomeling, & Darley, 1999). University males from
multiple racial backgrounds performed worse on a social sensitivity task when told that women
typically perform better on the task than men (Koenig & Eagly, 2005). Stereotypes do exist
about Caucasian men and men in general, but the claims made by the stereotypes often work to
the group’s advantage and, in most cases, place them in a position of power. However, Koenig
and Eagly’s findings are consistent with the literature in showing that stereotype threat is
situational.
The research above highlights an array of studied instances where the nature of an
individual’s social identity moderates their risk of stereotype threat. A higher risk emerges when
multiple identities are threatened within a single person or social group. The construct of
intersectionality can be used to describe this relationship. Intersectionality is a term used to
describe the interaction between overlapping social identities and systems of oppression and
discrimination. Sparks (2016) offers a supporting example with the following scenario:
“Imagine a student starting the first day at a new school. She is an African American
female whose mother had to transfer because of a new job. Her last school was 50%
51
African American, 30% Hispanic, 20% Caucasian, and a mix of students from other
countries. At her old school, she was near the top of her class and enrolled in Advanced
Placement (AP) science and mathematics courses. As she walks into her AP Physics
course, she is struck with the fact that, out of 18 students in the class, she is one of only
five females and only the third African American student. She is the only African
American female. It does not take long for her to feel out of place, as though she does not
belong. Her new school is a suburban school with 70% Caucasian, 15% Hispanic, 10%
African American, and only a few other nationalities. She worries it is going to be a long
year. She meets her teacher, a Caucasian male with many years of experience, and he
greets her with a smile. She has no idea what the year has in store” (Sparks, 2017, p. 4).
In this fictitious example, the student may have to contend with the reality or risk that
negative stereotypes surrounding her intersectional identity as an African American woman may
cause in a domain that she cares about and has excelled in previously. These moderators do not
directly cause cognitive disruption but reveal who may be susceptible to such threats and what
personal characteristics could create vulnerability. Further, psychological factors, like the sense
of belonging described in Spark’s example, mediate between stereotype threat and performance
decrements.
Mediators. Although not the focus of this paper, mediators are essential for a well-
rounded discussion about stereotype threat. Individual differences can predict susceptibility to
stereotype threat, and psychological mediators explain the direct link between stereotype threat
and performance. Mediators explain the affective, cognitive, and motivational factors that
impede performance when faced with the threat of a negative stereotype. In the last two years,
two literature reviews have been published discussing potential mediators of stereotype threat.
52
The reviews are comprehensive, provide a critical analysis of published studies, and identify the
current trends in stereotype threat research and implications for future research.
Spencer, Logel, and Davies (2016) cited five possible mediators of stereotype threat
including mere effort, working memory depletion, conscious attention to automated processes,
self-handicapping, and priming the stereotype. The researchers label mere effort, working
memory depletion, and conscious attention to automated process as underperformance due to
extra pressure to succeed. Pressure to succeed is a byproduct of a stereotyped group’s motivation
to disconfirm or avoid confirming a negative stereotype about their social group, which, as
Spencer, Logel, and Davies notes, is a pressure to succeed that nonstereotyped individuals do not
have to experience. The mere effort account argues that the pressure caused by stereotype threat
motivates stigmatized groups to expend energy or effort on disconfirming the stereotype instead
on focusing on the task at hand (Harkins, 2006; Jamieson & Harkins, 2007; Jamieson & Harkins,
2009; Seitchik & Harkins, 2015).
Working memory depletion occurs when stereotype threat causes an individual to use
memory resources to actively suppress negative thoughts and feelings triggered by a negative
stereotype (see Schmader, Johns, and Forbes’ Integrated Process Model of Stereotype Threat
Effects, 2008). Conscious attention to automated processes mediates stereotype threat when an
individual places effort on skills that are normally performed automatically and independently of
working memory. Essentially, under stereotype threat, an automatic skill may become a
monitored skill, and the unusual attention placed on performing the skill can reduce attention
needed for less automated components of the task and can lead to performance anxiety and
subsequent failure. The concept is often used in studies about stereotype threat and choking
53
under pressure (Hodge & Smith, 2014; Knowles, Lucas, Baumeister, & Gardner, 2015; Tagler,
2012).
Stereotype-threatened individuals might also use self-handicapping as a tactic to protect
the self from feelings of inadequacy and can provide the self with an explanation for failure
(Keller, 2002; Stone, 2002; Tyler et al., 2016). In evaluative and performance situations, self-
handicapping may lead to failure to practice, attempting fewer questions on an examination, or
an overall lack of effort on a task, acting as a barrier to successful performance. Last, the
researchers address underperformance due to priming the stereotype. Several studies have
discussed the critical role of priming a negative stereotype and its effects on performance
(Craemer & Orey, 2017; Fresson, Dardenne, & Meulemans, 2018; Jordano & Touron, 2017b;
Smith & Martiny, 2018). Although some contend that merely activating a negative stereotype
cannot equally threaten performance (Armenta, 2010; Grand, Ryan, Schmitt, & Hmurovic, 2011;
Kaye, Pennington, & McCann, 2018; Kray, Reb, Galinsky, & Thompson, 2004; Smith &
Johnson, 2006), most results point to the critical role that a self-relevant negative stereotype
plays on decrements in performance.
In a review of psychological mediators of stereotype threat from 1995-2015, Pennington
et al. (2016) summarized research citing anxiety (Brodish & Devine, 2009), negative thinking
(Cadinu, Maass, Rosabianca, & Kiesner, 2005), mind-wandering (Mrazek, Chin, Schmader,
Hartson, Smallwood, & Schooler, 2011) compromising of working memory (Rydell, McConnell,
& Beilock, 2009), and self- handicapping rendered by an unfair assessment of ability (Stone,
Lynch, Sjomeling, & Darley, 1999) as possible reasons for the disruption of cognitive
performance (see Pennington study for complete list).
54
Both bodies of work by Spencer et al. and Pennington et al. overlap in their assessments
of the direct links between stereotype threat and performance impediments. There is a general
understanding that the increase in individual cognitive load caused by a negative stereotype can
create a diversion of thought, effort, or intellectual or physical ability from the dominant task.
There is agreement that no one mediator can completely explain what leads to a stereotype-
threatened individual’s altered performance or even that only one mediator is at work in a given
situation. Many social psychologists understand that stereotype threat is “multiply mediated”
(Spencer, Logel, & Davies, 2016). The difference between the papers (and one of the strengths)
is that the emerging topic of the multi-threat framework underpins Pennington et al.’s review.
The multi-threat framework (Shapiro and Neuber, 2007) offers an alternative perspective
on how differences in the target and sources of stereotype threat affect moderators, mediators,
consequences, and interventions. The framework offers six qualitatively distinct stereotype
threats that emerge from the intersection of the target of stereotype threat and the source of
stereotype threat. The topic is gaining quite a bit of attention in stereotype threat literature. The
framework will not be discussed at length to avoid moving this paper in a different direction.
However, acknowledgment of the framework is included to highlight an understanding that the
proposed moderators and mediators of stereotype threat must be viewed differently based on the
population of interest to develop effective interventions. This understanding will serve the
athletic community well in understanding and mitigating this phenomenon among collegiate
athletes.
Mitigation Strategies
Student-athletes’ experiences with stereotype threat depend greatly on the strength of
their academic and athletic identities, which is consistent with the stereotype threat theory. As
55
discussed, individuals are more susceptible to stereotype threat if they identify with the
stereotyped group and, in most cases, when they identify with the tested domain. Thus, it is
logical to focus on social identity as a moderator of stereotype threat and the academic
performance of student-athletes. Mitigation strategies used to positively prime identity could
positively affect student-athlete performance in academic settings. The strategies to mitigate this
threat could benefit from a focus on social interventions to yield academic gains. Empirically-
based studies on reducing stereotype threat have focused on student’s thoughts, feelings, and
beliefs about self (English & Kruger, 2016). Specifically, and most relevant to student-athletes,
research discusses the implementation of strategies focused on individuation (Ambady, Paik,
Steele, Owen-Smith, & Mitchell, 2004; Gresky, Ten Eyck, Lord, & McIntyre, 2005), self-
affirmation (Cohen, Garcia, Apfel, & Master, 2006; Cohen, Garcia, Purdie-Vaughns, Apfel, &
Brzustoski, 2009; Sherman, Hartson, Binning, Purdie-Vaughns, Garcia, Taborsky-Barba,
Tomassetti, Nussbaum, & Cohen; 2013), sense of belonging (Walton & Cohen, 2007; Walton &
Cohen, 2011), and growth mindset (Froehlich, Martiny, Deaux, Goetz, & Mok, 2016; Good,
Aronson, & Inzlicht, 2003) to mitigate stereotype threat.
Ambady et al. (2004) proposed using individuation to combat stereotype threat. The goal
of the mitigation strategy is to prompt a person to reflect on their unique qualities while
identifying with their social group. Individuation does not view the uniqueness and group
membership as mutually exclusive. An individual can connect with their in-group based on
similar characteristics and have an awareness of their differences. Ambady and his colleagues
conducted two experiments where they tested an individuation manipulation on the math
performance of female college students. In the first experiment, participants joined a gender
stereotype prime or neutral prime condition, and then researchers subdivided the students into an
56
individuated or non-individuated condition. Researchers primed students for their gender identity
by showing participants a group of gender-specific words (i.e., aunt, doll, dress, lady, lipstick).
The individuation manipulation consisted of a questionnaire asking students to list their interest
and favorite hobbies, listing three positive traits and then three negative traits, and finally asking
participants to provide examples of instances where they demonstrated those traits. Students in
the no prime and non-individuated conditions were shown neutral words (i.e., animal, before,
example) followed by a questionnaire about lions.
After priming and individuation, students completed a 12-question mathematics test.
Results show that students in the gender-primed and individuated condition performed better on
the exam than gender-primed and non-individuated condition, and almost equal to the unprimed,
non-individuated group. The researchers conducted a second study to confirm that their findings
were a result of individuation and not self-affirmation caused by answering questions about
interests and favorite hobbies before completing the exam. Self-affirmation differs from
individuation because self-affirmation consciously validates one’s ability, whereas individuation
describes a realization of the variation of qualities that coincide to render one’s personality.
Results from the second experiment were identical to the original experiment. The overall
findings suggest that a negative stereotype can become less potent when an individual activates
different aspects of their identity not associated with a devaluing assessment of ability based on
said stereotype.
Cohen et al. (2006) conducted an experiment to explore the impact of self-affirmation
exercises on the academic performance of African American students in the seventh grade. A
racial achievement gap was present in the studied classroom, which, as discussed in previous
sections, is a common disparity in the American education system. The experimenters assigned

57
students to a self-affirmation group or control group. Students in the self-affirmation group
identified their most important values based on a list of values drafted by the researchers and
wrote why the chosen values were important or unimportant. Students in the control group
identified their least important values and responded to the question about importance. During
the term, African American students in the treatment group received higher grades than African
American students in the control group. Cohen et al. (2009) conducted a follow-up study to
evaluate the longitudinal effects after two years of the intervention and found that, with limited
self-affirmation exercises, the students’ grade point averages continued to increase.
Sherman et al. (2013) explored the influence of self-affirmation interventions on the
academic performance of Latino American students in middle school. Sherman and his
colleagues were interested in the ability of value affirmation in decreasing the achievement gap
between Latino American and European American students. Latino American students, like
African American students, have been subjected to negative stereotypes about their academic
abilities. The researchers conducted two longitudinal studies using different implementation
methods. In the first study, students were assigned to a self-affirming or non-self-affirming
condition, and teachers integrated self-affirmation exercises into classroom activities based on
group membership. Results showed that self-affirmed Latino American students earned higher
grades than non-self-affirmed Latino American students in the control condition. The
intervention had no impact on European American students. Also, the effects of the exercises
showed positive impacts on student’s grade point averages over three years. In the second study,
students completed daily entries in an affirmation diary.
Like the first study, the researchers assigned students to a self-affirming or non-self-
affirming condition. The difference between the studies is that Study 2 sought to explore the
58
impact of the intervention on academic performance and daily adversity, identity threat, and
academic fit. Results showed that self-affirmed Latino American students earned higher grades
than non-self-affirmed Latino American students in the control condition. Furthermore, self-
affirmed students demonstrated an enhanced ability to counteract identity threat by constructing
a positive narrative about daily adversity. Once again, the intervention did not impact Caucasian
students. Sherman and his colleagues alluded to the sense of belonging in their curiosity about
the relationship between academic fit, identity threat, and academic performance. A sense of
belonging in an educational environment can motivate a student towards success and buffer
stereotype threat.
Walton and Cohen (2007) conducted two experiments to observe how belonging
uncertainty impacts the achievement of groups viewed as academically limited. In the first
experiment, African American and European American undergraduate students were placed in
three different groups to manipulate the level of threat to the student’s sense of belonging.
Researchers asked two of the groups to list either one friend or eight friends who would fit well
in the computer science department. Walton and Cohen assumed listing one friend (an easy task)
would elicit a low level or no threat to the student’s sense of belonging and listing eight friends
(a harder task) would elicit a high threat to the student’s sense of belonging. Students in the
control group did not make a list. After creating the lists, students completed measures assessing
their own sense of belonging in the computer science department. Also, they were given other
students profiles with pictures to determine their fit in the program. Findings showed that the
African American students who found difficulty listing eight friends did not feel that they
belonged in the computer science department and did not think that other African American
students belonged in the department. Caucasian students were not affected by the threat

59
manipulation. Experiment 2 aimed to reduce the stereotype threat discovered in the first
experiment by telling students that all students have feelings of belonging uncertainty regardless
of race and that those feelings are transient. Students used daily diaries, as one activity, to report
their achievement behaviors for one week. Results showed that the grade point averages of
African American students who used the daily diaries increased from sophomore to senior year
and their sense of belonging improved. Walton and Cohen (2011) completed another study on
belonging that replicated Experiment 2 from their 2007 study. The new three-year study found
the same results from the intervention. Additionally, students reported improved physical health
and happiness and reduced doctor visits up to three years after the intervention.
Students athletes may benefit from stereotype threat reduction strategies that focus on
nurturing a growth mindset. Individuals with a growth mindset view intelligence as pliable rather
than fixed. Individuals with fixed mindsets do not believe that their abilities can be altered
regardless of learning or practice. Good, Aronson and Inzlicht (2003) tested the possibility of
using a growth mindset intervention to combat stereotype threat among Hispanic, African
American, and female junior high school students. Hispanic, African American and Caucasian
students served as study participants. The researchers paired each student with a college mentor
and assigned students to one of the four experimental conditions (incremental, attribution,
combination, and antidrug). In the incremental condition, the mentors taught the students about
the malleability of intelligence. Mentors assigned to the attribution condition taught students
about the ephemeral nature of academic difficulties faced in school. Mentors in the combination
condition taught students the same lessons discussed in the incremental and attribution
conditions. In the antidrug condition (control condition), mentors discussed the dangers of drug
use. The researchers analyzed the students’ math and reading scores on a standardized test at the
60
end of the year and compared performance by condition. The analysis showed that males
outperformed females on the math portion of the exam only in the control condition. Females
performed equally to males in the intervention groups.
Also, females in the treatment conditions significantly outperformed females in the
control conditions. Marginalized students (for this study: Hispanic and African American
students) and low-incoming students in both intervention groups scored higher on the reading
portion of the standardized test than students in the control condition. These results are consistent
with stereotype threat literature about women and math performance and stigmatized groups and
verbal aptitude.
Froehlich and his colleagues (2016) supported the findings above in their study on the
implicit theory of intelligence as a moderator of stereotype activation among Turkish-origin
migrants (“stereotyped as low in verbal ability”) in Germany on a diagnostic verbal test.
Specifically, the study sought to understand the relationship between a fixed and malleable view
of intelligence on stereotype threat and stereotype lift. “Stereotype lift is the performance boost
caused by the awareness that an outgroup is negatively stereotyped” (Walton & Cohen, 2003, p.
456). Study participants were Turkish- origin and German middle-track high school students.
After determining structural equivalence based on the factors of the theory of intelligence, goal
orientation, and effort beliefs across ethnic groups, two studies were conducted to assess views
of intelligence on stereotype threat (Turkish-origin students) and stereotype lift (German
students). Researchers manipulated stereotype activation by describing the test as diagnostic
(high threat) or non-diagnostic (low threat) of verbal ability. Results of Study 2 and 3 showed
that higher fixed mindset endorsement predicted stereotype threat among Turkish-origin students
in the diagnostic condition and stereotype lift in Study 3 among German students.
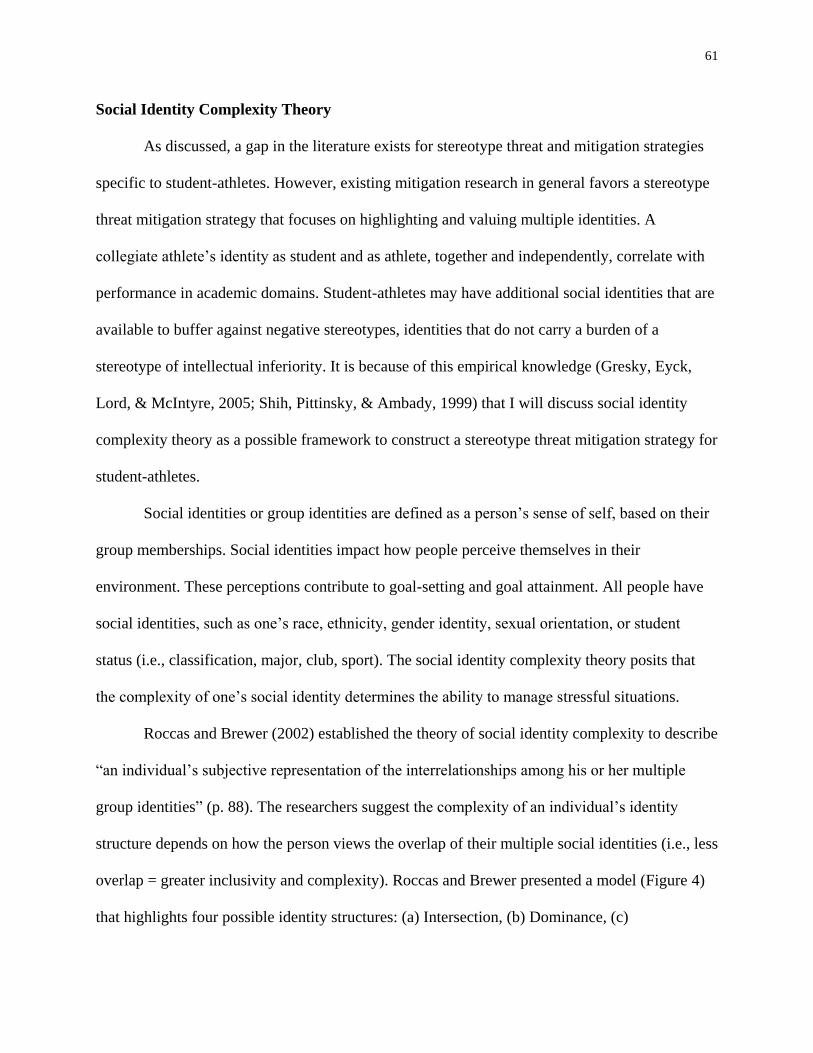
61
Social Identity Complexity Theory
As discussed, a gap in the literature exists for stereotype threat and mitigation strategies
specific to student-athletes. However, existing mitigation research in general favors a stereotype
threat mitigation strategy that focuses on highlighting and valuing multiple identities. A
collegiate athlete’s identity as student and as athlete, together and independently, correlate with
performance in academic domains. Student-athletes may have additional social identities that are
available to buffer against negative stereotypes, identities that do not carry a burden of a
stereotype of intellectual inferiority. It is because of this empirical knowledge (Gresky, Eyck,
Lord, & McIntyre, 2005; Shih, Pittinsky, & Ambady, 1999) that I will discuss social identity
complexity theory as a possible framework to construct a stereotype threat mitigation strategy for
student-athletes.
Social identities or group identities are defined as a person’s sense of self, based on their
group memberships. Social identities impact how people perceive themselves in their
environment. These perceptions contribute to goal-setting and goal attainment. All people have
social identities, such as one’s race, ethnicity, gender identity, sexual orientation, or student
status (i.e., classification, major, club, sport). The social identity complexity theory posits that
the complexity of one’s social identity determines the ability to manage stressful situations.
Roccas and Brewer (2002) established the theory of social identity complexity to describe
“an individual’s subjective representation of the interrelationships among his or her multiple
group identities” (p. 88). The researchers suggest the complexity of an individual’s identity
structure depends on how the person views the overlap of their multiple social identities (i.e., less
overlap = greater inclusivity and complexity). Roccas and Brewer presented a model (Figure 4)
that highlights four possible identity structures: (a) Intersection, (b) Dominance, (c)
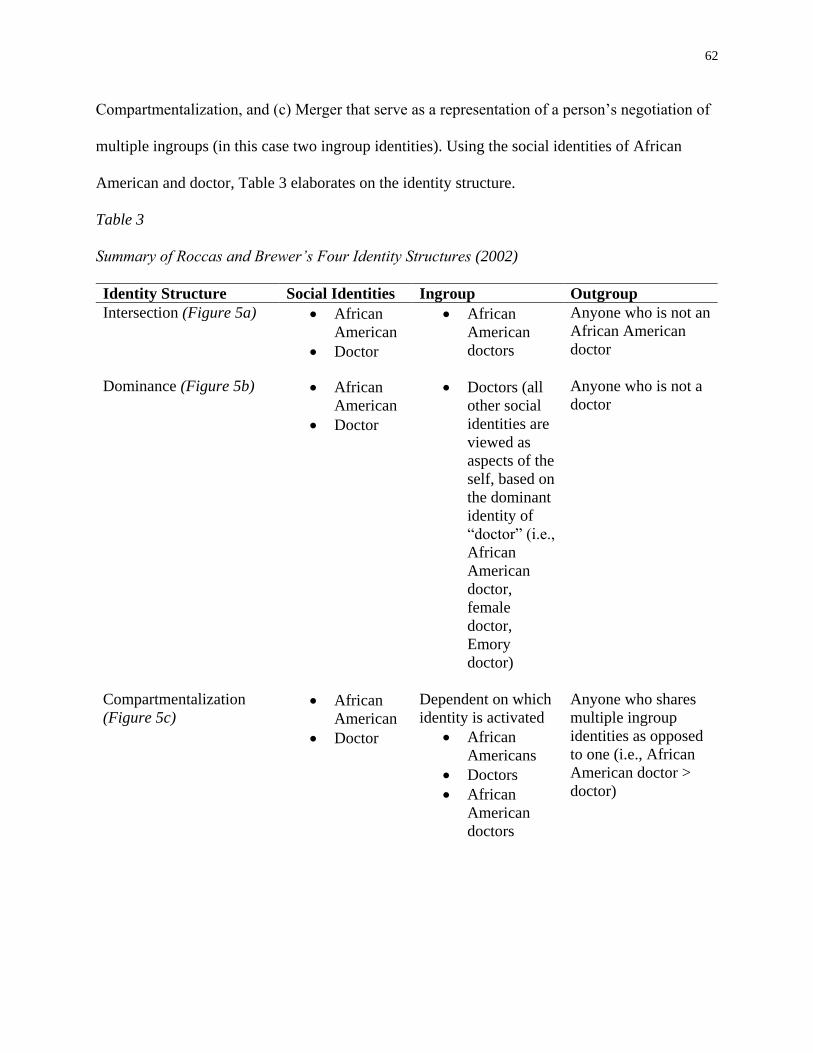
62
Compartmentalization, and (c) Merger that serve as a representation of a person’s negotiation of
multiple ingroups (in this case two ingroup identities). Using the social identities of African
American and doctor, Table 3 elaborates on the identity structure.
Table 3
Summary of Roccas and Brewer’s Four Identity Structures (2002)
Identity Structure Social Identities Ingroup Outgroup
Intersection (Figure 5a) • African
American
• Doctor
• African
American
doctors
Anyone who is not an
African American
doctor
Dominance (Figure 5b) • African
American
• Doctor
• Doctors (all
other social
identities are
viewed as
aspects of the
self, based on
the dominant
identity of
“doctor” (i.e.,
African
American
doctor,
female
doctor,
Emory
doctor)
Anyone who is not a
doctor
Compartmentalization
(Figure 5c) • African
American
• Doctor
Dependent on which
identity is activated
• African
Americans
• Doctors
• African
American
doctors
Anyone who shares
multiple ingroup
identities as opposed
to one (i.e., African
American doctor >
doctor)
63
Merger (Figure 5d) • African
American
• Doctor
• African
Americans
• Doctors
• African
American
doctors
Not applicable;
everyone evaluated
equally
In the case of stereotype threat, achieving a merged identity is ideal in buffering ingroup
threats. For example, an undergraduate student could identify as a woman, dancer, aunt, and
physics major. In this instance, the researchers suggest that if the salience of the fictitious
student’s separate identities is high, then she will experience a more complex and inclusive
identity structure that may lead to a higher ability to manage stress and buffer threats to a social
identity. If the female undergraduate student has a complex identity structure and encounters a
negative stereotype about her math ability as a female, she could have the ability to make salient
her identity as a physics major to mitigate the adverse effects of stereotype threat.
Figure 4. Alternate Structures of Multiple Ingroup Representations (Roccas & Brewer, 2002, p.
90)
Shih, Pittinsky, and Ambady (1999) conducted a two-part study to assess the effects of
positive and negative stereotypes on the mathematics performance of female Asian-American
undergraduate students, which is a population where dual identity may progress or hinder

64
success in an academic setting. The researcher’s sought to understand the effects of an implicit
prime of a positive stereotype about the group’s social identity (Asians are good at math) or a
negative stereotype about the group’s social identity (Women are not good at math) on
mathematics performance. The researchers randomly assigned the study participants to one of
three conditions: 1) gender prime, 2) ethnicity prime, 3) or no prime (control condition). The
study did not include a condition where both ethnicity and gender were primed because the focus
was on the salience of one identity when threatened. Results showed that students in the ethnicity
identity condition answered the most questions correctly, followed by the control condition, and
then the gender identity condition. The results supported the social identity complexity identity
by showing that individuals identify with multiple, in this case, dual social groups. Furthermore,
the results support the researchers’ hypothesis that an implicit prime of either a negative or
positive stereotype, within the same domain, can enhance or hinder an individual’s performance
when different aspects of identity are activated. The study is of great interest to this current
proposal because it too will focus on the dual identities of undergraduate students (i.e., collegiate
student-athletes). Grounded in the affective extremity hypothesis and the social identity
complexity theory, Gresky, Eyck, Lord, and McIntyre (2005) conducted a study to test the
effectiveness of using a self-concept map to combat stereotype threat among female
undergraduates when taking a mathematics exam. The affective extremity hypothesis suggests
that an understanding of oneself across multiple dimensions increases the ability to manage daily
stress effectively (Linville, 1987). Study participants included both men and women, who after
being tested for high or low mathematics identification using the Domain Identification Measure
(Smith & White, 2001), were randomly assigned to one of three experimental conditions: 1) self-
concept maps with few nodes, 2) self-concept maps with many nodes, or 3) no self-concept
65
maps. The researchers used self-concept maps to allow study participants to create a visual
representation of their multiple social identities.
Students in each condition were explicitly made aware of the negative stereotype about
women and mathematics performance. The researchers introduced two activities to students in
the two self-concept maps conditions and one activity in the no self-concept map condition.
Researchers instructed study participants in the few nodes group to construct individual self-
concept maps with a limited number of social identities and instructed participants in the
multiple nodes group to construct individual self-concept maps with many social identities. At
the end of the self-concept map activity, students took a GRE-style mathematics exam. Students
in the no self-concept maps group did not draw self-concept maps and only took the mathematics
exam. Results showed that women with high identification in mathematics in the no self-concept
maps and few self-concept maps conditions scored worse than men high in mathematics
identification in all conditions. Additionally, for men, performance only differed between
identification level; men in the high mathematics identification group outperformed men in the
low mathematics identification group. Women in the high mathematics identification groups who
drew self-concept maps with multiple nodes performed significantly better than or equal to men.
The results are consistent with stereotype threat and social identity complexity literature
regarding domain identification and awareness of multiple social identities, respectively.
The research suggests the positive effects of complex social identities. The complexity of
one’s self-concept or self-schemas has shown to improve psychological well-being. The diversity
of self-perception can serve as a buffer to stressful situations, including stereotype threat, and
protect an individual by focusing them on the richness of their life through multiple social
identities rather than on a singular identity. Further research is needed to expand this work to
66
other populations with dual identities on college campuses. Student-athletes are a suitable group
to test the social identity complexity theory due to their prominence at colleges and universities
and the negative stereotypes used to describe the population (negative categorizations that may
impede holistic development). Stereotype threat research has yet to offer mitigation strategies for
this unique population. The social identity complexity theory addresses the protective
functioning of more than a single identity and should be tested for its ability to buffer threat
among student-athletes.
Discussion and Future Directions
Identity - a concept that is in direct opposition to the construct of stereotypes.
Identity is fluid as a person evolves and discovers different aspects of themselves.
Various identities emerge, and it should be encouraged, as individuals encounter
challenges, opportunities, and new environments. Stereotypes do not allow self-
exploration. Stereotypes categorize and place individuals in a proverbial box without
empathy for the human experience. Stereotypes are not simply private thoughts, even
if they are not communicated. Individuals convey stereotypic thoughts through
nonverbal behaviors, decisions, and actions. Groups who are the target of a negative
stereotype can perceive messages through those nonverbal behaviors, decisions, and
actions, and subsequently, impair performance in multiple domains. Stereotypes create
systems of oppression and disenfranchisement.
Stereotype threat research focuses most of its attention on stigmatized groups.
Most people would not view student-athletes as a marginalized group. It is quite the
opposite thought. Student-athletes are viewed as the campus elite or even local
celebrities. However, when student-athletes and academics are mentioned in the same
67
sentence then the dumb jock stereotype emerges., and instantly stigmatization occurs.
The unfair assessment of this unique populations’ intellectual ability has shown to have
detrimental effects in educational settings. I propose two methods to address this issue.
Firstly, researchers and practitioners can educate their community about stereotype
threat and the harmful effects in hopes of positively affecting opinions and subsequent
actions. Secondly, researchers and practitioners could spend more time and energy
investigating and developing stereotype threat reduction strategies to help student-
athletes decrease or eliminate the negative effects of stereotype threat. It is no surprise
that I am in favor of the latter. Stereotyping is a part of the human condition. I do not
think that it would be efficient to try to deconstruct an individual’s schema about a
social group. Stereotypes are deeply rooted and associated with past experiences. I am
not suggesting that researchers and practitioners halt efforts in this area. However, I
recommend that more energy is redirected towards the target of the threat. This topic
and work could add value to student-athlete development offices. More is at stake than
grades in a class. If a student-athlete fails to achieve in one class, that one class
becomes two, then those two classes become an entire year, and then school
completion could be jeopardized, or there are negative longitudinal consequences post-
graduation. The National Collegiate Athletic Association should be at the forefront of
this initiative.
The purpose of this literature review was to introduce plausible stereotype
threat mitigation strategies for collegiate athletes by exploring the athletic subculture
on college campuses to understand the effects of stereotype threat within the
population. To this end, I defined stereotype threat, offered a historical account of the

68
theory, presented effects of stereotype threat, and presented studied moderators and
mediators. Then, I discussed the specific experiences of student-athletes in academic
settings when faced with negative stereotypes. The constructs of athletic identity and
identity foreclosure underpinned this section. I outlined empirically based mitigation
strategies, specifically focusing on social identity complexity. Future studies could
review a more varied list of moderators and mediators specific to student-athletes and
their experiences with stereotype threat and academic performance. Broadly, more
robust research is needed to continue the conversation and remedy stereotype threat in
collegiate athletics.

69
References
Adams, P. (2006). Exploring social constructivism: Theories and practicalities. Education, 34(3),
243- 257.
Ambady, N., Paik, S. K., Steele, J., Owen-Smith, A., & Mitchell, J. P. (2004). Deflecting
negative self- relevant stereotype activation: The effects of individuation. Journal of
Experimental Social Psychology, 40(3), 401-408.
American Physical Society (2019). Effective Practices for Recruitment and Retention of
Graduate Women. Retrieved January 15, 2019, from
https://www.aps.org/programs/women/reports/cswppractices/graduate.cfm
Antshel, K. M., VanderDrift, L. E., & Pauline, J. S. (2016). The role of athletic identity in the
relationship between difficulty thinking or concentrating and academic service use in
NCAA student-athletes. Journal of Clinical Sport Psychology, 10(4), 309-323.
Appreciative Advising Inventory. (2017). Retrieved September 30, 2017, from
http://www.appreciativeadvising.net/aa-inventory.html
Armenta, B. E. (2010). Stereotype boost and stereotype threat effects: The moderating role of
ethnic identification. Cultural Diversity and Ethnic Minority Psychology, 16(1), 94–98.
https://doi.org/10.1037/a0017564
Aronson, J., Fried, C. B., & Good, C. (2002). Reducing the effects of stereotype threat on
African American college students by shaping theories of intelligence. Journal of
Experimental Social Psychology, 38(2), 113-125.
Aronson, J., Lustina, M., Good, C., & Keough, K. (1999). When Caucasian men can’t do Math:
Necessary and sufficient factors in stereotype threat. Journal of Experimental Social
Psychology, 35, 29-46.

70
Banbel, M., & Chen, S. S. (2014). Academic tutoring program and services for supporting
collegiate student-athletes. KAHPERD Journal, 52(1), 52–65.
Baucom, C., & Lantz, C. D. (2001). Faculty attitudes toward male Division II student-athletes.
Journal of Sport Behavior, 24(3), 265.
Beamon, K. (2012). “I’m a Baller’: Athletic identity foreclosure among African-American
former student-athletes. Journal of African American Studies, 16(2), 195–208.
https://doi.org/10.1007/s12111-012-9211-8
Beasley, M., & Fischer, M. (2012). Why they leave: the impact of stereotype threat on the
attrition of women and minorities from science, math and engineering majors. Social
Psychology of Education, 15(4), 427.
Benbow, C. P., & Stanley, J. C. (1980). Sex differences in mathematical ability: Fact or artifact?
Science 210, 1262–1264.
Beron, K. J., & Piquero, A. R. (2016). Studying the determinants of student-athlete grade point
average: The roles of identity, context, and academic interests. Social Science Quarterly
(Wiley-Blackwell), 97(2), 142–160. https://doi.org/10.1111/ssqu.12235
Blascovich, J., Spencer, S.J., Quinn, D., & Steele, C. (2001). African Americans and high blood
pressure: The role of stereotype threat. Psychological Science, 12(3), 225.
Bloom, J. L., Hutson, B. L., He, Y., Amundsen, S., Buyarski, C., Christman, P.D., Cuevas,
A.E.P., Woodward, L.K., Murray, J.E., Robinson, C., & Kucharczyk, L.M. (2009). How
eight institutions have incorporated appreciative advising. The Mentor: An Academic
Advising Journal, 11(2).
Bong, M., & Skaalvik, E. M. (2003). Academic self-concept and self-efficacy: How different are
they really?. Educational Psychology Review, 15(1), 1-40.
71
Bosson, J. K., Haymovitz, E. L., & Pinel, E. C. (2004). When saying and doing diverge: The
effects of stereotype threat on self-reported versus non-verbal anxiety. Journal of
Experimental Social Psychology, 40(2), 247–255. https://doi.org/10.1016/S0022-
1031(03)00099-4
Brewer, B. W., Van Raalte, J., & Linder, D. E. (1993). Athletic identity: Hercules’ muscle or
Achilles’ heel? International Journal of Sport Psychology, 24, 237–254.
Brodish, A. B., & Devine, P. G. (2009). The role of performance–avoidance goals and worry in
mediating the relationship between stereotype threat and performance. Journal of
Experimental Social Psychology, 45(1), 180-185.
Brookover, W. B., LePere, J. M., Hamachek, D. E., Thomas, S., & Erickson, E. L. (1965). Self-
concept of ability and school achievement: Second report on the continuing study of the
relationships of self- concept and achievement. East Lansing, MI: Education Publication
Services
Broughton, E. (2001). Counseling and Support Services for College Student Athletes, presented
at the Annual Conference of the American College Personnel Association, Boston, MA,
March 3-7, 2001. Boston, MA. (ERIC Document Reproduction Services No. ED449460).
Broughton, E., & Neyer, M. (2001). Advising and counseling student athletes. New Directions
for Student Services, 2001(93), 47-53.
Brown, R. P., & Josephs, R. A. (1999). A burden of proof: Stereotype relevance and gender
differences in Math performance. Journal of Personality & Social Psychology, 76(2),
246–257.
Burg, J. E., & Mayhall, J. L. (2002). Techniques and interventions of solution-focused advising.
NACADA Journal, 22(2), 79-85.
72
Butler, M., Blake, N., Gonzalez, A., Heller, E., & Chang, F. (2016). Appreciative advising:
Retaining academic probation students. Journal of Appreciative Education, 3(1), 1-17.
Cadaret, M. C., Hartung, P. J., Subich, L. M., & Weigold, I. K. (2017). Stereotype threat as a
barrier to women entering engineering careers. Journal of Vocational Behavior, 99, 40–
51. https://doi.org/10.1016/j.jvb.2016.12.002
Cadinu, M., Maass, A., Lombardo, M., & Frigerio, S. (2006). Stereotype threat: The moderating
role of Locus of Control beliefs. European Journal of Social Psychology, 36(2), 183-197.
Cadinu, M., Maass, A., Rosabianca, A., & Kiesner, J. (2005). Why Do Women Underperform
under Stereotype Threat? Evidence for the Role of Negative Thinking. Psychological
Science, 16(7), 572-578.
Cardozo, P.L., & Chiviacowsky, S. (2015). Overweight stereotype threat negatively impacts the
learning of a balance task. Journal of Motor Learning & Development, 3(2), 140–150.
Carodine, K., Almond, K. F., & Gratto, K. K. (2001). College student athlete success both in and
out of the classroom. New Directions for Student Services, 2001(93), 19-33.
Castle, J., Ammon, R., & Barnes, J. C. (2015). An assessment of NCAA Division I directors of
football operations perceptions of changes in recruiting and retention strategies due to
APR legislation. Journal of Contemporary Athletics, 9(1), 15–31.
Ceci, S. J., Williams, W. M., & Barnett, S. M. (2009). Women’s underrepresentation in science:
Sociocultural and biological considerations. Psychological Bulletin, 135(2), 218–261.
https://doi.org/10.1037/a001441
Chambers, C.R., Walpole, M., & Outlaw, N. (2016). The influence of Math self-efficacy on the
college enrollments of young African American women. The Journal of Negro
Education, 85(3), 302. https://doi.org/10.7709/jnegroeducation.85.3.030
73
Chavez, C. (2017, August 15). What you need to know about UNC’s infractions hearing. Sports
Illustrated. Retrieved August 28, 2017, from https://www.si.com/college-
basketball/2017/08/15/unc-academic-scandal-ncaa-investigation-infractions-hearings
Chen, S., Snyder, S., & Magner, M. (2010). The effects of sport participation on student-athletes’
and non-athlete students’ social life and identity. Journal of Issues in Intercollegiate
Athletics, 176–193.
Cohen, G. L., Garcia, J., Apfel, N., & Master, A. (2006). Reducing the racial achievement gap: A
social-psychological intervention. Science, 313, 1307-1310.
Chen, S., Snyder, S., & Magner, M. (2010). The effects of sport participation on student-athletes’
and non-athlete students’ social life and identity. Journal of Issues in Intercollegiate
Athletics, 176–193.
Cohen, G. L., Garcia, J., Purdie-Vaughns, V., Apfel, N., & Brzustoski, P. (2009). Recursive
processes in self-affirmation: Intervening to close the minority achievement gap. Science,
324, 400-403.
Comeaux, E. (2010). Racial differences in faculty perceptions of collegiate student-athletes’
academic and post-undergraduate achievements. Sociology of Sport Journal, 27(4), 390–
412.
Comeaux, E. (2012). Unmasking athlete microaggressions: Division I student-athletes’
engagement with members of the campus community. Journal of Intercollegiate Sport,
5(2), 189–198.
Cooper, J. N., & Cooper, J. E. (2015). “I’m Running So You Can Be Happy and I Can Keep My
Scholarship”: A comparative study of Black male college athletes’ experiences with role
conflict. Journal of Intercollegiate Sport, 8(2), 131–152.
74
Craemer, T., & Orey, D. (2017). Implicit African American identification and stereotype threat
among African American students. Social Science Research, 65, 163-180.
https://doi.org/10.1016/j.ssresearch.2017.02.003
Craemer, T., & Orey, D. (2017). Implicit Black identification and stereotype threat among
African American students. Social Science Research, 65, 163–180.
https://doi.org/10.1016/j.ssresearch.2017.02.003
Curtis, T. R. (2006). Encouraging student-athletes' academic success through task orientation
goal-setting. Journal of College and Character, 7(3).
Daltry, R. (2012). The impact of gender role conflict on the quality of life in female athletes.
International Journal of Sport & Society, 3(2).
Dee, T. S. (2014). Stereotype threat and the student-athlete. Economic Inquiry, 52(1), 173–182.
https://doi.org/10.1111/ecin.12006
Deemer, E. D., Lin, C., & Soto, C. (2016). Stereotype threat and women’s science motivation:
Examining the disidentification effect. Journal of Career Assessment, 24(4), 637–650.
https://doi.org/10.1177/1069072715616064
Degol, J. L., Wang, M. T., Zhang, Y., & Allerton, J. (2017). Do growth mindsets in math benefit
females? Identifying pathways between gender, mindset, and motivation. Journal of
Youth and Adolescence, 1-15.
Dembo, M. H., & Seli, H. ((2016). Motivation and learning strategies for college success: A
focus on self-regulated learning (5th ed.). New York, NY: Routledge.
Demirtaş, H. (2016). The relationship between university students' perceptions of faculty
members' undesirable behaviors, their trust for faculty members and class participation.
International Online Journal of Educational Sciences, 8(4).
75
Désert, M., Préaux, M., & Jund, R. (2009). So young and already victims of stereotype threat:
Socio- economic status and performance of 6 to 9 years old children on Raven’s
progressive matrices. European Journal of Psychology of Education, 24(2), 207.
Desombre, C., Anegmar, S., & Delelis, G. (2017). Stereotype threat among students with
disabilities: the importance of the evaluative context on their cognitive performance.
European Journal of Psychology of Education, 33(2)1-14.
https://doi.org/10.1007/s10212-016-0327-4
English, J.A., & Kruger, A.C. (2016). Appreciative advising: Six phases to mitigate stereotype
threat among student athletes. Journal of Appreciative Education, 3(1), 18-29.
Engstrom, C.M., & Sedlacek, W.E. (1991). A study of prejudice toward university student
athletes. Journal of Counseling and Development, 70(1), 189 – 193.
Ennen, N. L., Stark, E., & Lassiter, A. (2015). The importance of trust for satisfaction,
motivation, and academic performance in student learning groups. Social Psychology of
Education, 18(3), 615-633.
Fassiotto, M., Hamel, E. O., Ku, M., Correll, S., Grewal, D., Lavori, P., Periyakoil, V.J., Reiss,
A., Sandbord, C., Walton, G., Winkleby, M., & Valantine, H. (2016). Women in
academic medicine: Measuring stereotype threat among junior faculty. Journal of
Women’s Health, 25(3), 292–298. https://doi.org/10.1089/jwh.2015.5380
Feltz, D. L., Schneider, R., Hwang, S., & Skogsberg, N. J. (2013). Predictors of collegiate
student- athletes’ susceptibility to stereotype threat. Journal of College Student
Development, 54(2), 184– 201. https://doi.org/10.1353/csd.2013.0014

76
Fischer, M. (2010). A longitudinal examination of the role of stereotype threat and racial climate
on college outcomes for minorities at elite institutions. Social Psychology of Education,
13(1), 19–40.
Flanagan, J. (2015). Gender and the workplace: The impact of stereotype threat on self-
assessment of management skills of female Business students. Advancing Women in
Leadership, 35, 166–171.
Foster, S. J., & Huml, M. R. (2017). The relationship between athletic identity and academic
major chosen by student-athletes. International Journal of Exercise Science, 10(6), 915-
925.
Foster, S. J., & Huml, M. R. (2017). The relationship between athletic identity and academic
major chosen by student-athletes. International journal of Exercise Science, 10(6), 915.
Fresson, M., Dardenne, B., & Meulemans, T. (2018). Diagnosis threat and underperformance:
The threat must be relevant and implicit. Journal of Clinical and Experimental
Neuropsychology, 40(7), 682–697. https://doi.org/10.1080/13803395.2017.1420143
Froehlich, L., Martiny, S. E., Deaux, K., Goetz, T., & Mok, S. Y. (2016). Being smart or getting
smarter: Implicit theory of intelligence moderates stereotype threat and stereotype lift
effects. British Journal of Social Psychology, 55(3), 564-587.
Gaston-Gayles, J. L. (2003). Advising student athletes: An examination of academic support
programs with high graduation rates. NACADA Journal, 23(1-2), 50-57.
Gayles, J. G., & Hu, S. (2009). The influence of student engagment and sport participation on
college outcomes among division I student athletes. The Journal of Higher
Education, 80(3), 315-333.

77
Good, C., Aronson, J., & Inzlicht, M. (2003). Improving adolescents' standardized test
performance: An intervention to reduce the effects of stereotype threat. Journal of
Applied Developmental Psychology, 24(6), 645-662.
Good, C., Rattan, A., & Dweck, C. S. (2012). Why do women opt out? Sense of belonging and
women’s representation in mathematics. Journal of Personality and Social Psychology,
102(4), 700–717. https://doi.org/10.1037/a0026659
Gore Jr, P. A. (2006). Academic self-efficacy as a predictor of college outcomes: Two
incremental validity studies. Journal of Career Assessment, 14(1), 92-115.
Grand, J. A. (2017). Brain drain? An examination of stereotype threat effects during training on
knowledge acquisition and organizational effectiveness. Journal of Applied Psychology,
102(2), 115–150. https://doi.org/10.1037/apl0000171
Grand, J. A., Ryan, A. M., Schmitt, N., & Hmurovic, J. (2010). How far does stereotype threat
reach? The potential detriment of face validity in cognitive ability testing. Human
Performance, 24(1), 1-28.
Gresky, D. M., Ten Eyck, L. L., Lord, C. G., & McIntyre, R. B. (2005). Effects of salient
multiple identities on women's performance under mathematics stereotype threat. Sex
Roles, 53(9-10), 703- 716.
Griffin, W. (2017). Who is Whistling Vivaldi? How Black football players engage with
stereotype threats in college. International Journal of Qualitative Studies in Education,
30(4), 354–369. https://doi.org/10.1080/09518398.2016.1250174
Gruber, C. A. (2003). What every academic advisor should know about advising student athletes.
NACADA Journal, 23(1-2), 44-49.
78
Gustems, J., & Calderon, C. (2014). Character strengths and psychological wellbeing among
students of teacher education. International Journal of Educational Psychology, 3(3),
265-286.
Harkins, S. G. (2006). Mere effort as the mediator of the evaluation-performance relationship.
Journal of Personality and Social Psychology, 91(3), 436.
Harper, S. (2016) Black male student-athletes and racial inequities in NCAA Division I college
sports. University of Pennsylvania Graduate School of Education. Retrieved on January
29, 2019, from https://web-
app.usc.edu/web/rossier/publications/231/Harper%20Sports%20(2016).pdf
Harris, P. C., Hines, E. M., Kelly, D. D., Williams, D. J., & Bagley, B. (2014). Promoting the
academic engagement and success of Black male student-athletes. High School Journal,
97(3), 180–195.
Harrison, C. K., Stone, J., Shapiro, J., Yee, S., Boyd, J. A., & Rullan, V. (2009). The role of
gender identities and stereotype salience with the academic performance of male and
female college athletes. Journal of Sport and Social Issues, 33(1), 78-96.
Harrison, L., Sailes, G., Rotich, W. K., & Bimper, A. Y. (2011). Living the dream or awakening
from the nightmare: Race and athletic identity. Race Ethnicity and Education, 14(1), 91-
103.
Hazzaa, R. N., Sonkeng, K., & Yoh, T. (2018). Antecedents and consequences of student-
athletes’ contentment with academic services. Journal of Intercollegiate Sport, 11(1), 65–
81.
79
Heird, E. B., & Steinfeldt, J. A. (2013). An interpersonal psychotherapy approach to counseling
student athletes: Clinical implications of athletic identity. Journal of College Counseling,
16(2), 143-157.
Hejazi, E., Shahraray, M., Farsinejad, M., & Asgary, A. (2009). Identity styles and academic
achievement: Mediating role of academic self-efficacy. Social Psychology of Education,
12(1), 123-135.
Hendricks, S. P., & Johnson, A. T. (2016). The athlete-student dilemma. Journal of Applied
Sport Management, 8(4), 1–20.
Hermann, J. M., & Vollmeyer, R. (2016). “Girls should cook, rather than kick!” Female soccer
players under stereotype threat. Psychology of Sport and Exercise, 26, 94–101.
https://doi.org/10.1016/j.psychsport.2016.06.010
Herrnstein, R.J., & Marry, C. (1994). The bell curves. New York: Free Press.
Hill, D. M., & Shaw, G. (2013). A qualitative examination of choking under pressure in team
sport. Psychology of Sport and Exercise, 14(1), 103-110.
Hippel, C., Henry, J. D., Terrett, G., Mercuri, K., McAlear, K., & Rendell, P. G. (2017).
Stereotype threat and social function in opioid substitution therapy patients. British
Journal of Clinical Psychology, 56(2), 160-171.
Hively, K., & El-Alayli, A. (2014). “You throw like a girl:” The effect of stereotype threat on
women’s athletic performance and gender stereotypes. Psychology of Sport and Exercise,
15(1), 48–55. https://doi.org/10.1016/j.psychsport.2013.09.001
Hodes, J. S., James, T., Martin, G., & Milliner, K. (2015). Go for the Win: A Collaborative
Model for Supporting Student-Athletes. Learning Assistance Review, 20(1), 47–60.
80
Hodge, K., & Smith, W. (2014). Public expectation, pressure, and avoiding the choke: A case
study from elite sport. Sport Psychologist, 28(4), 375–389.
Houle, J. L., & Kluck, A. S. (2015). An examination of the relationship between athletic identity
and career maturity in student-athletes. Journal of Clinical Sport Psychology, 9(1), 24-40.
Hutson, B. L., He, Y., & Bloom, J. (2014). How appreciative advising is revolutionizing
academic advising: Framework, revolution and possible future directions. AI
Practitioner, 16(2), 46-52.
Hutson, B.L. (2010). The impact of an appreciative advising-based university studies course on
college student first-year experience. Journal of Applied Research in Higher Education,
2(1), 3–13.
Ihme, T. A., & Mòller, J. (2015). “He Who Can, Does; He Who Cannot, Teaches?”: Stereotype
threat and preservice teachers. Journal of Educational Psychology, 107(1), 300–308.
https://doi.org/10.1037/a0037373
Jamieson, J. P., & Harkins, S. G. (2007). Mere effort and stereotype threat performance effects.
Journal of Personality and Social Psychology, 93(4), 544.
Jamieson, J. P., & Harkins, S. G. (2009). The effect of stereotype threat on the solving of
quantitative GRE problems: A mere effort interpretation. Personality and Social
Psychology Bulletin, 35(10), 1301-1314.
Jaramillo, J., Mello, Z. R., & Worrell, F. C. (2016). Ethnic identity, stereotype threat, and
perceived discrimination among Native American adolescents. Journal of Research on
Adolescence, 26(4), 769–775. https://doi.org/10.1111/jora.12228
Johnson, T. S., & Migliaccio, T. A. (2009). The social construction of an Athlete: Africa
American boy's experience in sport. Western Journal of Black Studies, 33(2).
81
Johnson-Ahorlu, R. N. (2013). “Our biggest challenge is stereotypes”: Understanding stereotype
threat and the academic experiences of African American undergraduates. Journal of
Negro Education, 82(4), 382–392.
Jones, J. A. (2015). Risk factors for alcohol abuse among college athletes. Journal of Clinical
Sport Psychology, 9(1), 76–96.
Jordan, J. M., & Denson, E. L. (1990). Student services for athletes: A model for enhancing the
student‐ athlete experience. Journal of Counseling & Development, 69(1), 95-97.
Jordano, M. L., & Touron, D. R. (2017a). Stereotype threat as a trigger of mind-wandering in
older adults. Psychology and Aging, 32(3), 307.
Jordano, M. L., & Touron, D. R. (2017b). Priming performance-related concerns induces task-
related mind-wandering. Consciousness and Cognition, 55, 126-135.
Jordet, G. (2009). Why do English players fail in soccer penalty shootouts? A study of team
status, self- regulation, and choking under pressure. Journal of Sports Sciences, 27(2),
97-106.
Kalokerinos, E. K., Leuven, K. U., Kjelsaas, K., Bennetts, S., & Hippel, C. (2017). Men in pink‐
collars: Stereotype threat and disengagement among male teachers and child protection
workers. European Journal of Social Psychology, 47(5), 553-565. https:/doi:
10.1002/ejsp.2246/
Kang, S. K., & Chasteen, A. L. (2009). The moderating role of age-group identification and
perceived threat on stereotype threat among older adults. International Journal of Aging
and Human Development, 69(3), 201–220.
82
Katz, I., & Greenbaum, C. (1963). Effects of anxiety, threat, and racial environment on task
performance of Negro college students. The Journal of Abnormal and Social Psychology,
66(6), 562–567. https://doi.org/10.1037/h0047829
Katz, I., Epps, E. G., & Axelson, L. J. (1964). Effect upon negro digit-symbol performance of
anticipated comparison with Caucasians and with other negroes. The Journal of
Abnormal and Social Psychology, 69(1), 77–83. https://doi.org/10.1037/h0048496
Katz, I., Roberts, S. O., & Robinson, J. M. (1965). Effects of task difficulty, race of
administrator, and instructions on digit-symbol performance of Negroes. Journal of
Personality and Social Psychology, 2(1), 53–59. https://doi.org/10.1037/h0022080
Kaye, L. K., Pennington, C. R., & McCann, J. J. (2018). Do casual gaming environments evoke
stereotype threat? Examining the effects of explicit priming and avatar gender.
Computers in Human Behavior, 78, 142–150. https://doi.org/10.1016/j.chb.2017.09.031
Keller, J. & Dauenheimer, D. (2003). Stereotype threat in the classroom: Dejection mediates the
disrupting threat effect on women’s math performance. Personality and Social
Psychology Bulletin, 29(3), 371-381
Keller, J. (2002). Blatant stereotype threat and women's math performance: Self-handicapping as
a strategic means to cope with obtrusive negative performance expectations. Sex Roles,
47(3), 193- 198.
Khalaila, R. (2015). The relationship between academic self-concept, intrinsic motivation, test
anxiety, and academic achievement among nursing students: Mediating and moderating
effects. Nurse Education Today, 35(3), 432–438.
https://doi.org/10.1016/j.nedt.2014.11.001

83
Kianian, A. M. (1996). Gender and mathematics achievement parity: Evidence from post-
secondary education. Education, 116(4), 586.
Kimball, A., & Freysinger, V. J. (2003). Leisure, stress, and coping: The sport participation of
collegiate student-athletes. Leisure Sciences, 25(2–3), 115–141.
https://doi.org/10.1080/01490400306569
Koenig, A. M., & Eagly, A. H. (2005). Stereotype threat in men on a test of social sensitivity.
Sex Roles, 52(7–8), 489–496. https://doi.org/10.1007/s11199-005-3714-x
Kray, L. J., Reb, J., Galinsky, A. D., & Thompson, L. (2004). Stereotype reactance at the
bargaining table: The effect of stereotype activation and power on claiming and creating
value. Personality and Social Psychology Bulletin, 30(4), 399–411.
https://doi.org/10.1177/0146167203261884
LaForge, L., & Hodge, J. (2011). NCAA academic performance metrics: Implications for
institutional policy and practice. Journal of Higher Education, 82(2), 217–235.
Lamont, R. A., Swift, H. J., & Abrams, D. (2015). A review and meta-analysis of age-based
stereotype threat: Negative stereotypes, not facts, do the damage. Psychology and Aging,
30(1), 180–193.
Leontopoulou, S. (2015). A positive psychology intervention with emerging adults. The
European Journal of Counselling Psychology, 3(2), 113.
Lesko, A. C., & Corpus, J. H. (2006). Discounting the difficult: How high math-identified
women respond to stereotype threat. Sex Roles, 54(1–2), 113–125.
https://doi.org/10.1007/s11199-005- 8873-2

84
Leyens, J.-P., Désert, M., Croizet, J.-C., & Darcis, C. (2000). Stereotype threat: Are lower status
and history of stigmatization preconditions of stereotype threat? Personality and Social
Psychology Bulletin, 26(10), 1189–1199. https://doi.org/10.1177/0146167200262002
Luong, K. T., & Knobloch-Westerwick, S. (2017). Can the media help women be better at math?
Stereotype threat, selective exposure, media effects, and women’s math performance.
Human Communication Research, 43(2), 193–213. https://doi.org/10.1111/hcre.12101
Lupo, C., Mosso, C. O., Guidotti, F., Cugliari, G., Pizzigalli, L., & Rainoldi, A. (2017). The
adapted Italian version of the baller identity measurement scale to evaluate the student-
athletes’ identity in relation to gender, age, type of sport, and competition level. PloS one,
12(1), e0169278.
Lyons Jr, R., Jackson Jr, E. N., & Livingston, A. (2015). Exploring advising models for effective
student athlete advisement. The Sport Journal, 18.
Lyubomirsky, S., & Layous, K. (2013). How do simple positive activities increase well-being?.
Current Directions in Psychological Science, 22(1), 57-62.
Mah, C. D., Kezirian, E. J., Marcello, B. M., & Dement, W. C. (2018). Poor sleep quality and
insufficient sleep of a collegiate student-athlete population. Sleep Health, 4(3), 251–257.
https://doi.org/10.1016/j.sleh.2018.02.005
Marcia, J. E. (1966). Development and validation of egoidentity status. Journal of Personality &
Social Psychology, 3, 551–558.
Marrero, R.J., Carballeira, M., Martín, S., Mejías, M., & Hernández, J.-A. (2016). Effectiveness
of a positive psychology intervention combined with cognitive behavioral therapy in
university students. Annals of Psychology, 32(3), 728–740.
https://doi.org/10.6018/analesps.32.3.261661
85
Marsh, H. W., Pekrun, R., Murayama, K., Arens, A. K., Parker, P. D., Guo, J., & Dicke, T.
(2018). An integrated model of academic self-concept development: Academic self-
concept, grades, test scores, and tracking over 6 years. Developmental Psychology, 54(2),
263–280. https://doi.org/10.1037/dev0000393
Massey, D. S., & Owens, J. (2014). Mediators of stereotype threat among African American
college students. Ethnic and Racial Studies, 37(3), 557-575.
McClain, S., & Cokley, K. (2017). Academic disidentification in African American college
students: The role of teacher trust and gender. Cultural Diversity and Ethnic Minority
Psychology, 23(1), 125.
McInerney, D. M., Cheng, R. W. Y., Mok, M. M. C., & Lam, A. K. H. (2012). Academic self-
concept and learning strategies: Direction of effect on student academic achievement.
Journal of Advanced Academics, 23(3), 249-269.
McKay, P. F., Doverspike, D., Bowen-Hilton, D., & McKay, Q. D. (2003). The effects of
demographic variables and stereotype threat on African American/Caucasian differences
in cognitive ability test performance. Journal of Business and Psychology, 18(1), 1-14.
Meier, C., & Geldenhuys, D. J. (2017). Co-constructing appreciative inquiry across disciplines:
A duo- ethnography. SA Journal of Industrial Psychology, 43(1), 1-9.
Mello, Z. R., Mallett, R. K., Andretta, J. R., & Worrell, F. C. (2012). Stereotype threat and
school belonging in adolescents from diverse racial/ethnic backgrounds. Journal of At-
Risk Issues, 17(1), 9–14.
Mendoza-Denton, R. (2014). A social psychological perspective on the achievement gap in
standardized test performance between White and minority students: Implications for
assessment. The Journal of Negro Education, 83(4), 465-484.

86
Mignano, A. C., Brewer, B. W., Winter, C. R., & Van Raalte, J. L. (2006). Athletic identity and
student involvement of female athletes at NCAA Division III women's and coeducational
colleges. Journal of College Student Development, 47(4), 457-464.
Mrazek, M. D., Chin, J. M., Schmader, T., Hartson, K. A., Smallwood, J., & Schooler, J. W.
(2011). Threatened to distraction: Mind-wandering as a consequence of stereotype threat.
Journal of Experimental Social Psychology, 47(6), 1243-1248.
Najdowski, C. J., Bottoms, B. L., & Goff, P. A. (2015). Stereotype threat and racial differences
in citizens’ experiences of police encounters. Law & Human Behavior (American
Psychological Association), 39(5), 463–477. https://doi.org/10.1037/lhb0000140
NCAA. (2014). Benefits to college student-athletes. Retrieved July 30, 2017, from
http://www.ncaa.org/student-athletes/benefits-college-student-athletes
NCAA. (2016). APR Averrages and Trends. Retrieved March 28, 2018, from
http://www.ncaa.org/about/resources/research/apr-averages-and-trends
NCAA. (2017a). After the game career center. Retrieved February 13, 2018, from
http://www.ncaa.org/student-athletes/former-student-athlete/careers
NCAA. (2017b). Division I Graduate Rate Trends. Retrieved March 28, 2018, from
http://www.ncaa.org/sites/default/files/2017D1RES_Grad_Rate_Trends_FINAL_20171108
NCAA (2018a). Division I Academics. Retrieved March 13, 2018, from
http://www.ncaa.org/about/what-we-do/academics?division=d1
NCAA (2018b). Graduation Success Rate continues to climb. Retrieved January 27, 2019, from
http://www.ncaa.org/about/resources/media-center/news/graduation-success-rate-
continues-climb

87
Pansu, P., Régner, I., Max, S., Colé, P., Nezlek, J. B., & Huguet, P. (2016). A burden for the
boys: Evidence of stereotype threat in boys’ reading performance. Journal of
Experimental Social Psychology, 65, 26–30. https://doi.org/10.1016/j.jesp.2016.02.008
Park, S., Lavallee, D., & Tod, D. (2013). Athletes’ career transition out of sport: A systematic
review. International Review of Sport and Exercise Psychology, 6(1), 22–53.
https://doi.org/10.1080/1750984X.2012.687053
PBS Frontline (2003). A class divided: Introduction. Retrieved September 20, 2017, from
http://www.pbs.org/wgbh/frontline/article/introduction-2/
Pennington, C. R., Heim, D., Levy, A. R., & Larkin, D. T. (2016). Twenty years of stereotype
threat research: A review of psychological mediators. PLoS ONE, 11(1), 1–25.
https://doi.org/10.1371/journal.pone.0146487
Ployhart, R. E., Ziegert, J. C., & McFarland, L. A. (2003). Understanding racial differences on
cognitive ability tests in selection contexts: An integration of stereotype threat and
applicant reactions research. Human Performance, 16(3), 231-259.
Popper, N. (2014, January 26). Committing to play for a college, then starting 9th grade. The
New York Times. Retrieved from
https://www.nytimes.com/2014/01/27/sports/committing-to-play-for-a- college-then-
starting-9th-grade.html
Rankin, S., Merson, D., Garvey, J. C., Sorgen, C. H., Menon, I., Loya, K., & Oseguera, L.
(2016). The influence of climate on the academic and athletic success of student-athletes:
Results from a multi-institutional national study. Journal of Higher Education, 87(5),
701–730.
88
Rasquinha, A. M., & Cardinal, B. J. (2017). Association of athletic identity by competitive sport
level and cultural popularity. Journal of Sport Behavior, 40(2).
Régner, I., Smeding, A., Gimmig, D., Thinus-Blanc, C., Monteil, J. M., & Huguet, P. (2010).
Individual differences in working memory moderate stereotype-threat effects.
Psychological Science, 21(11), 1646-1648.
Retrieved from
https://www.nytimes.com/2009/03/07/sports/ncaafootball/07ncaa.html
Riciputi, S., & Erdal, K. (2017). The effect of stereotype threat on student-athlete math
performance. Psychology of Sport and Exercise, 32, 54–57.
https://doi.org/10.1016/j.psychsport.2017.06.003
Rifenburg, M. (2016). Supporting student-athlete writers: A case study of a Division I athletics
writing center and NCAA academic mandates. Writing Center Journal, 37(1/2), 61–84.
Rios, K., Cheng, Z. H., Totton, R. R., & Shariff, A. F. (2015). Negative stereotypes cause
Christians to underperform in and disidentify with science. Social Psychological and
Personality Science, 6(8), 959-967.
Roccas, S., & Brewer, M. B. (2002). Social Identity Complexity. Personality & Social Psychology
Review, 6(2), 88–106. https://doi.org/10.1207/S15327957PSPR0602_01
Rodríguez, B. A. (2014). The threat of living up to expectations: analyzing the performance of
Hispanic students on standardized exams. Journal of Hispanic Higher Education, 13(3),
191-205.
Rubin, L. M., & Moses, R. A. (2017). Athletic subculture within student-athlete academic
centers. Sociology of Sport Journal, 34(4), 317–328.

89
Rydell, R. J., & Boucher, K. L. (2010). Capitalizing on multiple social identities to prevent
stereotype threat: The moderating role of self-esteem. Personality and Social Psychology
Bulletin, 36(2), 239- 250.
Rydell, R., McConnell, A., & Beilock, S. (2009). Multiple social identities and stereotype threat:
Imbalance, accessibility, and working memory. Journal of Personality and Social
Psychology, 96(5), 949–966.
Sailes, G. A. (1993). An investigation of campus stereotypes: The myth of African American
athletic superiority and the dumb jock stereotype. Sociology of Sport Journal, 10, 88-97.
Salles, A., Mueller, C. M., & Cohen, G. L. (2016). Exploring the relationship between stereotype
perception and residents’ well-being. Journal of the American College of Surgeons,
222(1), 52–58. https://doi.org/10.1016/j.jamcollsurg.2015.10.004
Saunders, D., & Hutson, B. (2012). Uncovering assets of college students through learning
contracts: An application of appreciative advising. Journal of Appreciative Education,
1(1), 1-13.
Schmader, T. (2001). Gender identification moderates stereotype threat effects on women’s math
performance. Journal of Experimental Social Psychology, 38, 194-2001.
Schmader, T., Johns, M., & Forbes, C. (2008). An integrated process model of stereotype threat
effects on performance. Psychological Review, 115(2), 336–356.
https://doi.org/10.1037/0033- 295X.115.2.336
Scott, B. M., Paskus, T. S., Miranda, M., Petr, T. A., & McArdle, J. J. (2008). In-season vs. out-
of-season academic performance of college student-athletes. Journal of Intercollegiate
Sport, 1(2), 202–226.
90
Seitchik, A. E., & Harkins, S. G. (2015). Stereotype threat, mental arithmetic, and the mere effort
account. Journal of Experimental Social Psychology, 61, 19-30.
Seligman, M. E., Ernst, R. M., Gillham, J., Reivich, K., & Linkins, M. (2009). Positive
education: Positive psychology and classroom interventions. Oxford Review of
Education, 35(3), 293-311.
Seligman, M., & Csikszentmihalyi, M. (2000) Positive Psychology: An introduction. American
Psychologist, 55(1), 5-14.
Shapiro, J. R., & Neuberg, S. L. (2007). From stereotype threat to stereotype threats:
Implications of a multi-threat framework for causes, moderators, mediators,
consequences, and interventions. Personality and Social Psychology Review, 11(2), 107-
130.
Shapiro, J. R., Williams, A. M., & Hambarchyan, M. (2013). Are all interventions created equal?
A multi- threat approach to tailoring stereotype threat interventions. Journal of
Personality and Social Psychology, 104(2), 277.
Shavelson, R. J., Hubner, J. J., & Stanton, G. C. (1976). Self-Concept: Validation of Construct
Interpretations. Review of Educational Research, 46(3), 407–441.
https://doi.org/10.2307/1170010
Sherman, D. K., Hartson, K. A., Binning, K. R., Purdie-Vaughns, V., Garcia, J., Taborsky-Barba,
S., Tomassetti, S., Nussbaum, A.D., & Cohen, G. L. (2013). Deflecting the trajectory and
changing the narrative: How self-affirmation affects academic performance and
motivation under identity threat. Journal of Personality and Social Psychology, 104(4),
591.

91
Sherman, T.M., Weber, L.J., & Tegano, C. (1988). An investigation of faculty perceptions of
athletics at Division IA universities. Blacksburg, VA. (ERIC Document Reproduction
Service No. ED323859).
Shi, C., & Zhao, X. (2014). The influence of college students' coping styles on perceived self-
efficacy in managing inferiority. Social Behavior and Personality: An International
Journal, 42(6), 949-957.
Sica, L. S., Sestito, L. A., & Ragozini, G. (2014). Identity coping in the first years of university:
Identity diffusion, adjustment and identity distress. Journal of Adult Development, 21(3),
159-172.
Sigelman, L., & Tuch, S. A. (1997). Metastereotypes. Public Opinion Quarterly, 61(1), 87.
Silverman, A. M., & Cohen, G. L. (2014). Stereotypes as stumbling-blocks: How coping with
stereotype threat affects life outcomes for people with physical disabilities. Personality
and Social Psychology Bulletin, 40(10), 1330-1340.
Simons, H., Bosworth, C., Fujita, S., & Jensen, M. (2007). The athlete stigma in higher
education. College Student Journal, 41(2), 251-273.
Smeding, A., Darnon, C., & Van Yperen, N. W. (2015). Why do high working memory
individuals choke? An examination of choking under pressure effects in math from a self-
improvement perspective. Learning and Individual Differences, 37, 176-182.
Smith, D. M., & Martiny, S. E. (2018). Stereotype Threat in Sport: Recommendations for
Applied Practice and Research. Sport Psychologist, 32(4), 311–320.
Smith, J. L., & Johnson, C. S. (2006). A stereotype boost or choking under pressure? Positive
gender stereotypes and men who are low in domain identification. Basic and Applied
Social Psychology, 28(1), 51-63.
92
Spencer, J., Steele, C., & Quinn, D. (1999). Stereotype threat and women’s math performance.
Journal of Experimental Social Psychology, 35(4):4–28
Spencer, S. J., Logel, C., & Davies, P. G. (2016). Stereotype Threat. Annual Review of
Psychology, 67(1), 415–437. https://doi.org/10.1146/annurev-psych-073115-103235
Sports Illustrated Wire. (2016, November 23). Mizzou tutor took courses for student-athletes.
Retrieved August 28, 2017, from https://www.si.com/college-
football/2016/11/22/missouri-student-athlete- academic-scandal-tutor-yolanda-kumar
Steele, C. M. (1997). A threat in the air: How stereotypes shape intellectual identity and
performance. American Psychologist, 52(6), 613–629. https://doi.org/10.1037/0003-
066X.52.6.613
Steele, C. M. (1999, August). Thin Ice: Stereotype threat and African American college students.
The Atlantic. Retrieved from
https://www.theatlantic.com/magazine/archive/1999/08/thin-ice- stereotype-threat-and-
African American-college-students/304663/
Steele, C. M., & Aronson, J. (1995). Stereotype threat and the intellectual test performance of
African Americans. Journal of Personality and Social Psychology, 69(5), 797–811.
https://doi.org/10.1037/0022-3514.69.5.797
Steele, C.M. (2010). Whistling Vivaldi: And other clues to how stereotypes affect us. New York,
NY: W.W. Norton & Company, Inc.
Stereotype [Def. 2]. (n.d.). In Merriam Webster Online, Retrieved August 22, 2017, from
https://www.merriam-webster.com/dictionary/stereotype.

93
Stinson, D. A., Logel, C., Shepherd, S., & Zanna, M. P. (2011). Rewriting the self-fulfilling
prophecy of social rejection: Self-affirmation improves relational security and social
behavior up to 2 months later. Psychological Science, 22(9), 1145-1149.
Stone, J. (2002). Battling doubt by avoiding practice: The effects of stereotype threat on self-
handicapping in Caucasian athletes. Personality and Social Psychology Bulletin, 28(12),
1667- 1678.
Stone, J., Harrison C.K., & Mottley, J. (2012). Don’t call me a student-athlete: The effect of
identity priming on stereotype threat for academically engaged African American college
athletes. Basic & Applied Social Psychology, 34(2), 99–106.
Stone, J., Lynch, C. I., Sjomeling, M., & Darley, J. M. (1999). Stereotype threat effects on
African American and Caucasian athletic performance. Journal of Personality and Social
Psychology, 77(6), 1213–1227. https://doi.org/10.1037/0022-3514.77.6.1213
Strano, D. & Petrocelli, J. (2005). A preliminary examination of the role of inferiority feelings in
the academic achievement of college students. The Journal of Individual Psychology, 61
(1). 80-89.
Tagler, M. J. (2012). Choking under the pressure of a positive stereotype: Gender identification
and self- consciousness moderate men's math test performance. The Journal of Social
Psychology, 152(4), 401-416.
Tollefson, M. (2017). Appreciative advising and new student orientation. Journal of
Appreciative Education, 4(1), 10-15.
Tracy, M. (2017). N.C.A.A.: North Carolina Will Not Be Punished for Academic Scandal. The
New York Times. Retrieved from https://www.nytimes.com/2017/10/13/sports/unc-north-
carolina-ncaa.html

94
Truschel, J. (2008). Does the use of appreciative advising work?. Learning Assistance Review,
13(2), 7-16.
Tyler, K. M., Thompson, F. A., Gay, D. E., Burris, J., Lloyd, H., & Fisher, S. (2016).
Internalized stereotypes and academic self-handicapping among African American male
high school students. Negro Educational Review, 67(1-4), 5.
Tyrance, S. C., Harris, H. L., & Post, P. (2013). Predicting positive career planning attitudes
among NCAA Division I college student-athletes. Journal of Clinical Sport Psychology,
7(1), 22-40.
University of California, Berkeley (2019). Advising Matters. Retrieved January 15, 2019, from
https://advisingmatters.berkeley.edu/grow/advancing-practice-
libraryarchive/conceptual/understanding-stereotype-threat
University of Michigan (2018). Graduate Student Workshop on Stereotype Threat and Impostor
Syndrome. Retrieved January 15, 2019, from https://rackham.umich.edu/event/research-
based-strategies-for-overcoming-stereotype-threat-and-imposter-syndrome/
Valentine, J.J., Taub, D.J. (1999). Responding to the developmental needs of student athletes.
Journal of College Counseling, 2, 164-179.
Van Lone, J. S., Siembor, M., Mistler, B. J., & Mapstone, D. J. (2017). Assisting college
students with athletic disengagement. Journal of College Student Psychotherapy, 31(2),
132-154.
Von Robertson, R., & Chaney, C. (2015). The influence of stereotype threat on the responses of
African American males at a predominantly Caucasian college in the South. Journal of
Pan African Studies, 7(8).
95
Walton, G. M., & Cohen, G. L. (2003). Stereotype lift. Journal of Experimental Social
Psychology, 39(5), 456-467.
Walton, G. M., & Cohen, G. L. (2007). A question of belonging: race, social fit, and
achievement. Journal of Personality and Social Psychology, 92(1), 82.
Walton, G. M., & Cohen, G. L. (2011). A brief social-belonging intervention improves academic
and health outcomes of minority students. Science, 331(6023), 1447-1451.
Washington State University (2015). Faculty and Staff Workshop on Stereotype Threat and
First-Generation Students. Retrieved January 15, 2019, from
https://news.wsu.edu/2015/09/17/sept-23-helping-first-generation-students-is-focus-of-
talk/
Waters, L. (2011). A review of school-based positive psychology interventions. The Educational
and Developmental Psychologist, 28(2), 75-90.
Weber, S., Kronberger, N., & Appel, M. (2018). Immigrant students’ educational trajectories:
The influence of cultural identity and stereotype threat. Self and Identity, 17(2), 211-235.
Weber, S., Kronberger, N., & Appel, M. (2018). Immigrant students’ educational trajectories:
The influence of cultural identity and stereotype threat. Self and Identity, 17(2), 211–235.
https://doi.org/10.1080/15298868.2017.1380696
Wolverton, B. (2008, January 25). Athletes’ hours renew debate over college sports. Retrieved
November 11, 2018, from https://www.chronicle.com/article/Athletes-Hours-Renew-
Debate/22003
Wood, A. M., Linley, P. A., Maltby, J., Kashdan, T. B., & Hurling, R. (2011). Using personal
and psychological strengths leads to increases in well-being over time: A longitudinal

96
study and the development of the strengths use questionnaire. Personality and Individual
Differences, 50(1), 15- 19.
Woodcock, A., Hernandez, P. R., Estrada, M., & Schultz, P. W. (2012). The consequences of
chronic stereotype threat: Domain disidentification and abandonment. Journal of
Personality and Social Psychology, 103(4), 635–646. https://doi.org/10.1037/a0029120
Yopyk, D. J. A., & Prentice, D. A. (2005). Am I an athlete or a student? Identity salience and
stereotype threat in student–athletes. Basic & Applied Social Psychology, 27(4), 329–336.
https://doi.org/10.1207/s15324834basp2704_5
Zinser, L. (2009, March 6). Florida state to lose scholarships and vacate wins. The New York
Times.

97
2 I AM NOT YOUR STUDENT-ATHLETE: AN INVESTIGATION OF SOCIAL
IDENTITY COMPLEXITY AS A STEREOTYPE THREAT MITIGATION
STRATEGY AND INDIVIDUAL DIFFERENCES THAT MAY MODERATE
THE EFFECT
“I Am Not Your Negro says, ‘You cannot define me. I define myself.’ This was James
Baldwin’s attitude his whole life: I cannot let anyone define who I am, whether I’m gay,
whether I’m black, whether I’m a writer, whether I’m this or that. This is my own
responsibility—to define myself. And I am not a finished product: I am always in
construction because I learn, I have experience, and I see the world.”
- Raoul Peck (Director, “I Am Not Your Negro”)
Sports are popular in American culture. In 2017, sports revenue equaled $69 billion
across four key segments of the North American sports market: media rights, gate revenues,
sponsorship, and merchandising (PricewaterhouseCoopers, 2018). A Gallup poll indicated that
football is the most popular sport in the United States, followed by basketball and baseball,
respectively (Norman, 2018). For example, according to CBS, 100.1 million viewers watched
Super Bowl LIII (Stelter, 2019). College sports are a part of the American identity as well,
creating a sense of pride among alumni and residents of the state or region. Since the first
intercollegiate competition in 1854, a boat race between Yale and Harvard, collegiate sports have
grown in popularity. For example, 25.2 million viewers watched the 2019 National Collegiate
Athletic Association (NCAA) Division I college football national championship (USA Today,
2019). Comparatively, the 2018 NCAA Division I men’s basketball championship received 16.4
million viewers (Otterson, 2018). In 2018, the NCAA earned $1.06 billion, with most of their
revenue received from television deals (Bloomberg, 2018).
Despite sports, and in particular collegiate sports, being so popular in the United States,
student-athletes are not always viewed in the most positive light. From news headlines to
98
research articles, student-athletes are often discussed from a deficit framework and perceived as
one-dimensional characters whose actions are orchestrated by coaches, advisors, and governing
bodies. There are news stories about academic scandal and misconduct, and research about
academic underperformance and deficits in collegiate athletic culture. Most of the news is
focused on Division I student-athletes, the group of interest for this study, who participate in
revenue sports. The narrative perpetuates negative stereotypes about the student group (Haslerig,
2017). Writers, researchers, and sports enthusiasts should not ignore these negative aspects of
sports culture, but the overrepresentation of bad news belies the complexity of collegiate
athletics. Student-athletes are multifaceted and more than their sport. These young, developing,
and talented individuals are not your student-athlete. They, like all college students, are
exploring various opportunities to determine their academic, professional, and personal paths.
Unfortunately, student-athletes must manage negative stereotypes about their academic
ability. Stereotype threat research has shown that negative stereotypes diminish student-athletes’
academic performance (Yopyk & Prentice, 2005). However, to date, there is no published
evidence-based strategy to reduce the effects of stereotype threat among this group. The current
study seeks to investigate how a group of student-athletes view their academic abilities and the
complexity of their social identities. Coupling the theories of stereotype threat and social identity
complexity, the current study will use an experimental design to explore the effectiveness of a
self-concept map activity among student-athletes when explicitly threatened by a negative
stereotype about their academic ability. First, I will discuss the role of the National Collegiate
Athletic Association in student-athlete development to provide context about the extent that the
governing body nurtures both the academic and athletic identity of student-athletes, followed by
an explanation of the stereotype threat theory and the social identity complexity theory. Last, I

99
will present study details, findings, and discussion.
The National Collegiate Athletics Association. Considering the prominence of
collegiate athletics and its grand entertainment value, infrastructure is required to ensure that
those providing the entertainment, the student-athletes, are receiving both a positive athletic and
academic experience. The National Collegiate Athletics Association (NCAA) is the largest and
most recognized governing body of intercollegiate athletics. Other intercollegiate athletics
governing bodies include the National Association of Intercollegiate Athletics (NAIA), the
National Junior College Athletic Association (NJCAA), the National Christian College Athletic
Association (NCCAA), and the United State Collegiate Athletic Association (USCAA). The
NCAA’s mission “is to be an integral part of higher education and to focus on the development
of our student-athletes” (NCAA, 2019, p.1). The NCAA was first called the Intercollegiate
Athletics Association of the United States (IAAUS). The organization (IAAUS) was established
in 1906 after President Theodore Roosevelt called a White House meeting in 1905 with coaches
and athletic advisers from Harvard University, Yale University, and Princeton University to
discuss the increase in injuries and deaths during college football games attributed to unsafe
equipment and rules (Zezima, 2014). In 1910, IAAUS was renamed the National Collegiate
Athletic Association or NCAA. Over the next few decades, as intercollegiate athletics became an
integral part of American college life, NCAA member institutions continued to improve the
quality of college sports while maintaining the academic integrity of each affiliated college and
university. However, it was not until 1991 that the athletics governing body established the
NCAA CHAMPS/Life Skills program (Challenging Athletes’ Minds for Personal Success) to
take a more holistic approach to student-athlete development. The student development program
was modeled after the Georgia Institute of Technology’s Total Person Program established by
100
Dr. Homer Rice, former athletic director at Georgia Institute of Technology. The project was
motivated by Dr. Rice’s belief that “excellence is a result of a balanced life including academic
achievement, athletic success, and personal wellbeing” (NCAA, 2017).
The program has since been renamed the NCAA Life Skills program. The NCAA
collaborates with the 1,200-member institutions, the affiliate organizations, and conference
offices to implement the program. Although not mandatory, most NCAA member institutions
maintain individual life skills programs, while the NCAA serves as the governing body of all
programs. The Life Skills programs provide student-athletes with academic resources, career
development, strategies to enhance personal well-being, and community service opportunities.
The program is appropriate to address student-athlete needs, but rules are needed to hold
member-institutions accountable for their oversight and implementation of academic initiatives
for student-athletes.
In 2003, the NCAA established the Academic Performance Program (APP) to track the
academic progress and graduation rates of Division I and Division II student-athletes. Division
III athletic programs need not abide by these academic standards because they do not award
athletic scholarships. Currently, there are 350 Division I colleges and universities that provide
opportunities for approximately 170,000 student-athletes to compete. The goal of the APP was
executed through two tracking mechanisms – the Academic Progress Rate (APR) and the
Graduation Success Rate (GSR). The Academic Progress Rate is a score, out of 1000, that is
calculated by the number of individuals on a team who remain academically eligible and are
retained. Each player who receives athletic financial aid receives one point for being
academically eligible and one point for remaining in school. APR is calculated annually, which
means that each team member can receive two points each semester for a total of four points
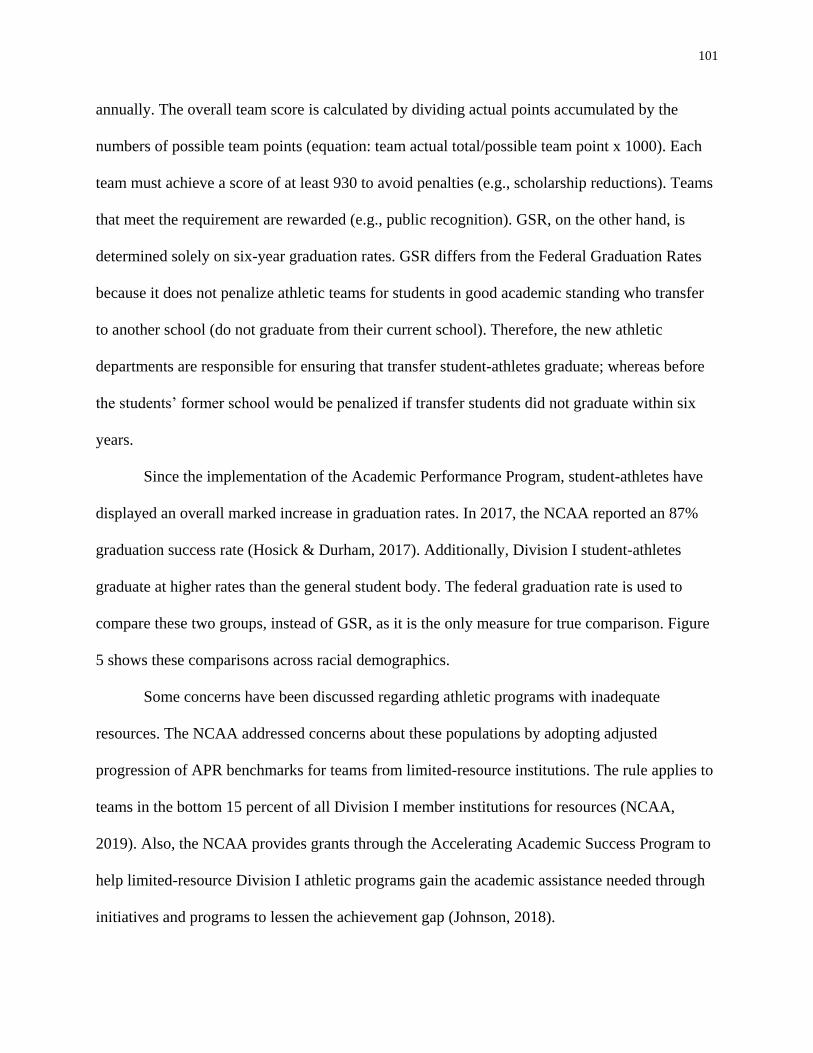
101
annually. The overall team score is calculated by dividing actual points accumulated by the
numbers of possible team points (equation: team actual total/possible team point x 1000). Each
team must achieve a score of at least 930 to avoid penalties (e.g., scholarship reductions). Teams
that meet the requirement are rewarded (e.g., public recognition). GSR, on the other hand, is
determined solely on six-year graduation rates. GSR differs from the Federal Graduation Rates
because it does not penalize athletic teams for students in good academic standing who transfer
to another school (do not graduate from their current school). Therefore, the new athletic
departments are responsible for ensuring that transfer student-athletes graduate; whereas before
the students’ former school would be penalized if transfer students did not graduate within six
years.
Since the implementation of the Academic Performance Program, student-athletes have
displayed an overall marked increase in graduation rates. In 2017, the NCAA reported an 87%
graduation success rate (Hosick & Durham, 2017). Additionally, Division I student-athletes
graduate at higher rates than the general student body. The federal graduation rate is used to
compare these two groups, instead of GSR, as it is the only measure for true comparison. Figure
5 shows these comparisons across racial demographics.
Some concerns have been discussed regarding athletic programs with inadequate
resources. The NCAA addressed concerns about these populations by adopting adjusted
progression of APR benchmarks for teams from limited-resource institutions. The rule applies to
teams in the bottom 15 percent of all Division I member institutions for resources (NCAA,
2019). Also, the NCAA provides grants through the Accelerating Academic Success Program to
help limited-resource Division I athletic programs gain the academic assistance needed through
initiatives and programs to lessen the achievement gap (Johnson, 2018).
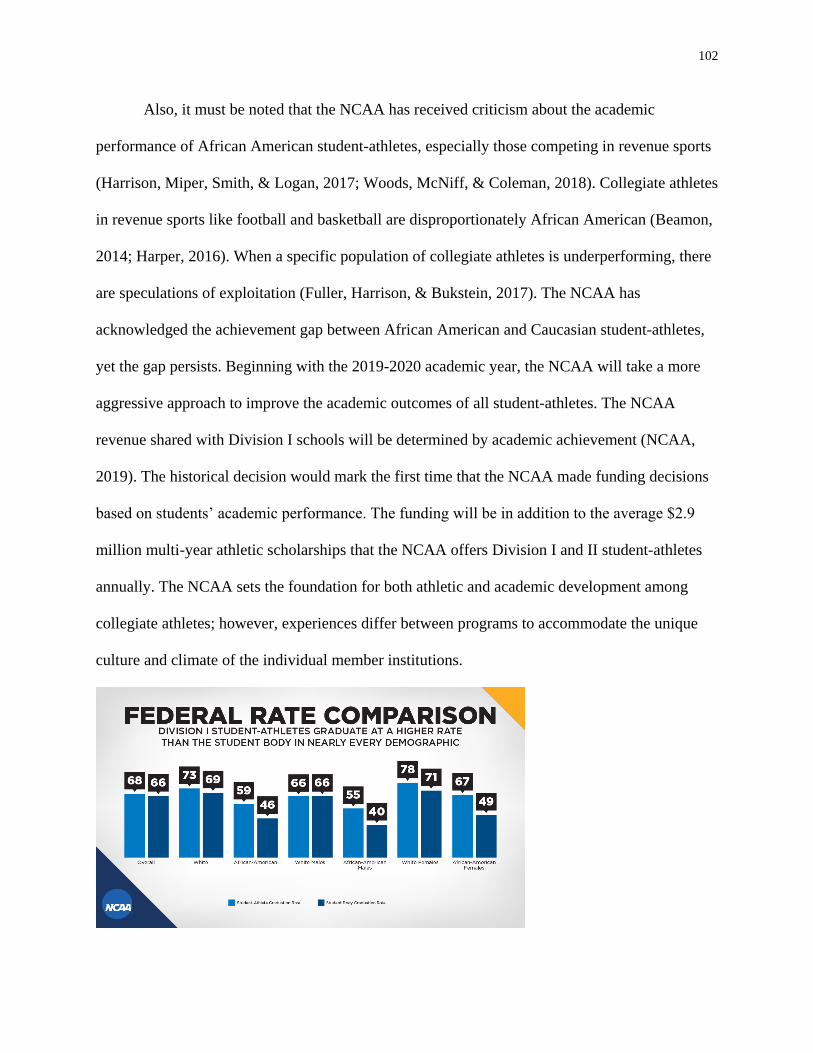
102
Also, it must be noted that the NCAA has received criticism about the academic
performance of African American student-athletes, especially those competing in revenue sports
(Harrison, Miper, Smith, & Logan, 2017; Woods, McNiff, & Coleman, 2018). Collegiate athletes
in revenue sports like football and basketball are disproportionately African American (Beamon,
2014; Harper, 2016). When a specific population of collegiate athletes is underperforming, there
are speculations of exploitation (Fuller, Harrison, & Bukstein, 2017). The NCAA has
acknowledged the achievement gap between African American and Caucasian student-athletes,
yet the gap persists. Beginning with the 2019-2020 academic year, the NCAA will take a more
aggressive approach to improve the academic outcomes of all student-athletes. The NCAA
revenue shared with Division I schools will be determined by academic achievement (NCAA,
2019). The historical decision would mark the first time that the NCAA made funding decisions
based on students’ academic performance. The funding will be in addition to the average $2.9
million multi-year athletic scholarships that the NCAA offers Division I and II student-athletes
annually. The NCAA sets the foundation for both athletic and academic development among
collegiate athletes; however, experiences differ between programs to accommodate the unique
culture and climate of the individual member institutions.
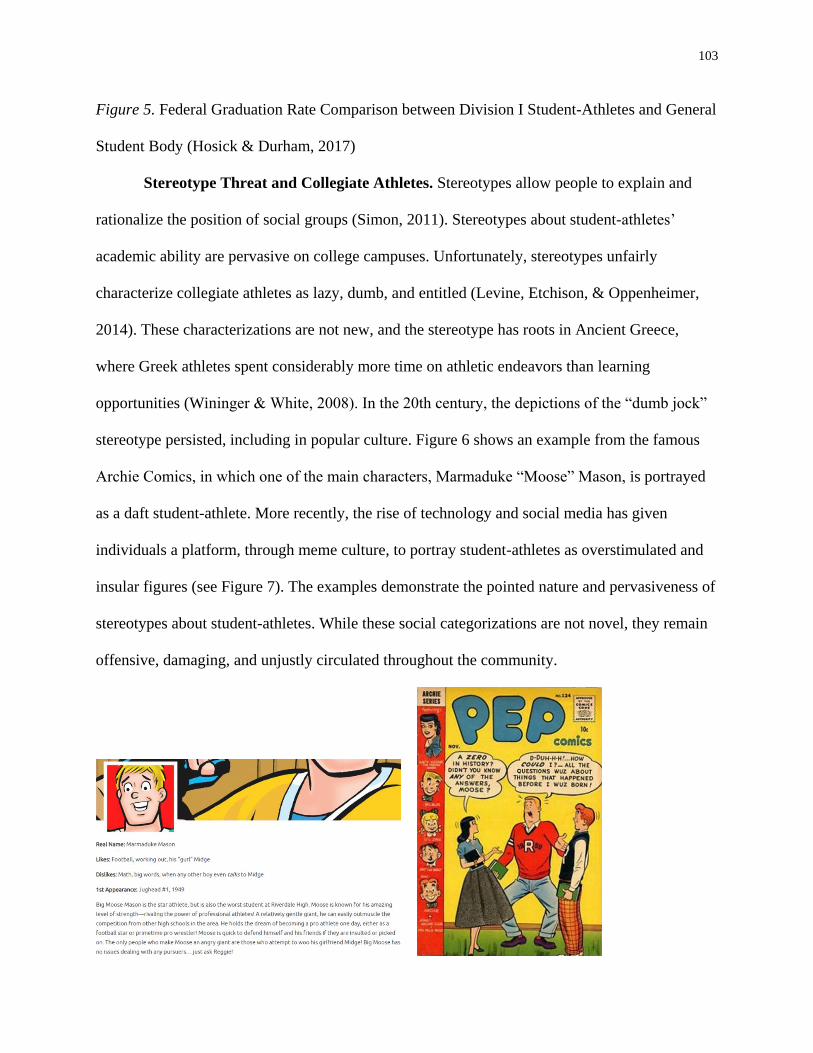
103
Figure 5. Federal Graduation Rate Comparison between Division I Student-Athletes and General
Student Body (Hosick & Durham, 2017)
Stereotype Threat and Collegiate Athletes. Stereotypes allow people to explain and
rationalize the position of social groups (Simon, 2011). Stereotypes about student-athletes’
academic ability are pervasive on college campuses. Unfortunately, stereotypes unfairly
characterize collegiate athletes as lazy, dumb, and entitled (Levine, Etchison, & Oppenheimer,
2014). These characterizations are not new, and the stereotype has roots in Ancient Greece,
where Greek athletes spent considerably more time on athletic endeavors than learning
opportunities (Wininger & White, 2008). In the 20th century, the depictions of the “dumb jock”
stereotype persisted, including in popular culture. Figure 6 shows an example from the famous
Archie Comics, in which one of the main characters, Marmaduke “Moose” Mason, is portrayed
as a daft student-athlete. More recently, the rise of technology and social media has given
individuals a platform, through meme culture, to portray student-athletes as overstimulated and
insular figures (see Figure 7). The examples demonstrate the pointed nature and pervasiveness of
stereotypes about student-athletes. While these social categorizations are not novel, they remain
offensive, damaging, and unjustly circulated throughout the community.

104
Figure 6. Archie Character Description and Comic Cover featuring Marmaduke “Moose” Mason
(1949)
Figure 7. Student-Athlete Dialogue Meme Examples 2
Some student-athletes perform poorly in the classroom just as some nonstudent-athletes
perform poorly, but student-athletes are the group whose failure frequently makes the headlines,
perhaps due to our country’s obsession with sports. It is a rarity that good news about their
intellectual ability makes the headlines. For example, it is a little-known fact that fourteen
student-athletes have been awarded the Rhodes Scholarship within the last six years. The
selected student-athletes represent 9% of the 192 scholars selected (32 selected annually) over
the six years (2014-2019). The Rhodes Scholarship is the oldest and one of the most prestigious
scholarships for postgraduate study, which provides full funding for attending the University of
Oxford in England. Nonetheless, negative stereotypes about the academic prowess of collegiate
athletes persist. Feltz noted that ‘they’re [student-athletes] kind of the last group of students who
can be openly discriminated against” (MSU Today, 2013, p.1).
Research has found that sports participation is linked to positive physiological,
psychological, educational, social, and financial benefits (Chen, Snyder, & Magner, 2010;
NCAA, 2014; see After the Game Career Network: NCAA, 2017). Stereotypes have the potential
to thwart these benefits because they can extend beyond simple labels to become dangerous
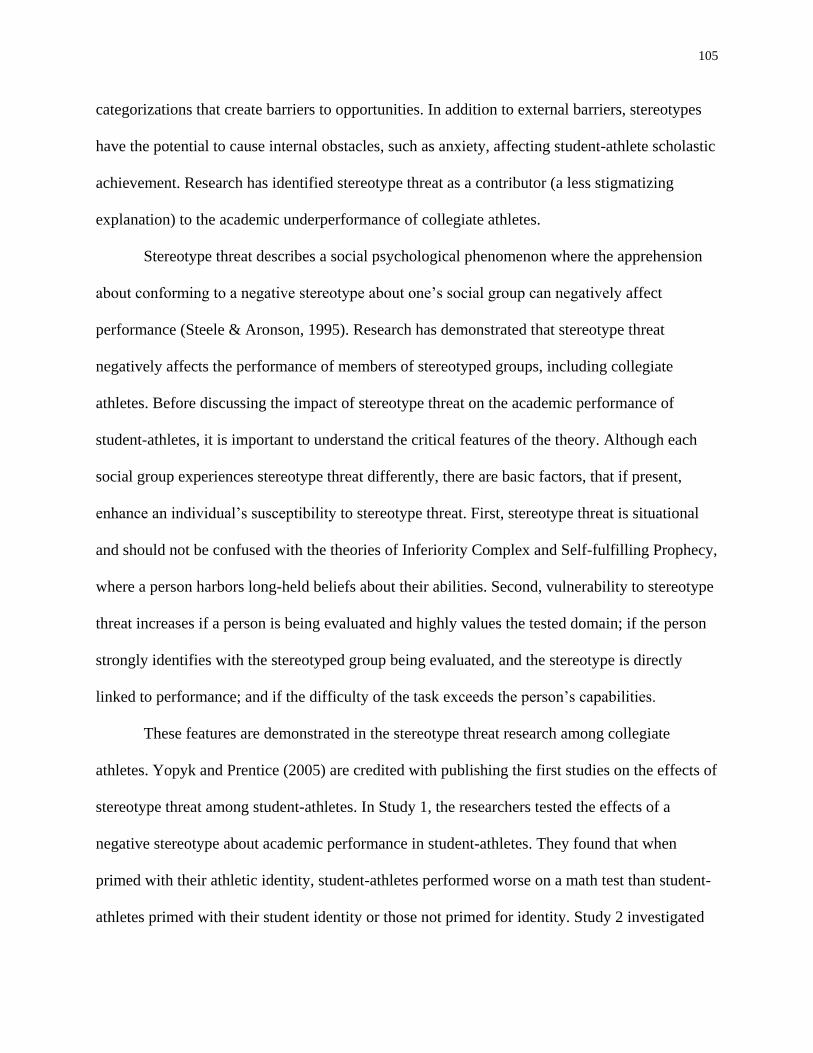
105
categorizations that create barriers to opportunities. In addition to external barriers, stereotypes
have the potential to cause internal obstacles, such as anxiety, affecting student-athlete scholastic
achievement. Research has identified stereotype threat as a contributor (a less stigmatizing
explanation) to the academic underperformance of collegiate athletes.
Stereotype threat describes a social psychological phenomenon where the apprehension
about conforming to a negative stereotype about one’s social group can negatively affect
performance (Steele & Aronson, 1995). Research has demonstrated that stereotype threat
negatively affects the performance of members of stereotyped groups, including collegiate
athletes. Before discussing the impact of stereotype threat on the academic performance of
student-athletes, it is important to understand the critical features of the theory. Although each
social group experiences stereotype threat differently, there are basic factors, that if present,
enhance an individual’s susceptibility to stereotype threat. First, stereotype threat is situational
and should not be confused with the theories of Inferiority Complex and Self-fulfilling Prophecy,
where a person harbors long-held beliefs about their abilities. Second, vulnerability to stereotype
threat increases if a person is being evaluated and highly values the tested domain; if the person
strongly identifies with the stereotyped group being evaluated, and the stereotype is directly
linked to performance; and if the difficulty of the task exceeds the person’s capabilities.
These features are demonstrated in the stereotype threat research among collegiate
athletes. Yopyk and Prentice (2005) are credited with publishing the first studies on the effects of
stereotype threat among student-athletes. In Study 1, the researchers tested the effects of a
negative stereotype about academic performance in student-athletes. They found that when
primed with their athletic identity, student-athletes performed worse on a math test than student-
athletes primed with their student identity or those not primed for identity. Study 2 investigated
106
how priming influences participants’ thinking. Researchers primed student-athletes from
Amherst College with either their athlete identity (by completing a self-rating athletic scale) or
student identity (by completing a math test) before they were presented with an 8-item exercise
with word fragments. The research question was whether the different primes would influence
how participants completed the fragments. The results showed that participants in the athlete
prime condition responded with more athlete-related word completions than participants in the
student prime condition, suggesting that subtle primes differentially influence thinking in a
subsequent task.
Since that time, studies have shown stereotype threat to affect female student-athletes to a
greater extent than male student-athletes, perhaps because of the females’ higher level of
academic engagement (Harrison et al., 2009). However, opposing findings suggest that male
student-athletes who presumably have higher athletic identities have shown to be more
vulnerable to stereotype threat than their female counterparts (Dee, 2014). Contradictory to these
findings, some research suggests that gender does not impact the relationship between stereotype
threat and academic performance among collegiate athletes (Ricipui & Erdal, 2017), but
race/ethnicity may. Academically engaged African American collegiate athletes have displayed
higher stereotype threat susceptibility in learning environments than Caucasians, perhaps due to
intersectional stereotypes regarding race and athletic identity (Stone, Harrison, & Mottley, 2012).
Qualitative evidence suggests that African American football players, specifically, have learned
to employ coping mechanisms (e.g., hiding athletic identity) to manage potential harmful effects
of negative stereotypes (Griffin, 2017).
Moreover, Feltz, Schneider, Hwang, and Skogsberg (2013) explored possible predictors
of collegiate athletes’ susceptibility to stereotype threat. Data revealed that student-athletes who

107
have higher levels of athletic identity perceive higher stereotype threat. Additionally, coaches
regard for athletic and academic identity was observed in the study. Findings showed that
student-athletes were less vulnerable to stereotype threat if their coach thought positively about
their academic abilities. Another theme in the research is the concept of stereotype reactance.
Stereotype reactance occurs when a person reacts against a negative stereotype about their social
group by over-performing, perhaps to invalidate the connection between that negative stereotype
and performance (Kray, Reb, Galinsky, & Thompson, 2004). Harrison and his colleagues (2009)
found when male collegiate athletes were primed with their athlete-only identity, they answered
more items correctly than male participants primed with their dual identity or with no identity
prime.
The collection of stereotype threat research on collegiate athletes reaffirms the theories’
tenets. All these studies used implicit priming, embedding the athlete identity prime in a survey
or by asking students about some aspect of their athletic life. Studies to date have not tested the
impact of an explicit priming technique on academic performance among student-athletes.
However, the implicit primes used differed across studies. Some experiments use an athlete-only
prime (Dee, 2014; Riciputi & Erdal, 2017; Yopyk & Prentice, 2005) while others use a scholar-
athlete or student-athlete prime (Harrision et al., 2009; Stone et al., 2012), dual identity monikers
that vary by region. Nevertheless, both single and dual primes have shown to exacerbate the
effects of stereotype threat on collegiate athletes. The lack of a systematic study directly
comparing the effect of single versus dual implicit primes on student-athletes reveals a gap in our
understanding of how different identity roles may function to influence performance.
Athletic and Academic Identity. It can be argued that is important to attend to both
athletic and academic identity to learn the potential effects of identity conflict among student-
108
athletes. Student-athletes are expected to perform at high levels in both the classroom and in their
sport, and without the proper support systems or tools, identity salience and conflict may impact
overall wellness (Adler & Adler, 1987; Lu, Heinz, & Soderstrom, 2018). Athletic identity is the
extent to which a person identifies with their role as an athlete (Brewer, Van Raalte, and Linder,
1993). Academic identity, in its simplest terms, is the extent to which a person identifies with
their role as a learner. Identity conflict may occur when external factors, such as athletic and
educational commitments, are vying for a collegiate athlete’s attention and time, and adding
pressure to a possibly overextended young adult (Lu, Heinz, & Soderstrom, 2018).
Most Division I collegiate athletes begin participating in their sport at a young age. This
is illustrated in popular culture in the Esquire docu-series “Friday Night Tikes,” which follows
the budding athletic careers of 4 to 13-year-old Pee Wee football players in San Antonio, Texas.
The show chronicles the lives of the players as they prepare for high school football. Some
critics describe the show as terrifying (Mandell, 2014), depressing (Fox Sports, 2014), and
ridiculous (Seifert, 2014). However, the show highlights the development of the athletic identity
and the strength of that identity when established during early and middle childhood. For
example, on the show, some of the children are offered college scholarships, which could
intensify athletic identity and possibly lead to stunted development in other areas (e.g.
academics). Brewer and Petitpas stated that:
“…athletes who believe that their primary means of gaining parental or societal approval
is through athletic accomplishments, may avoid situations or people that they view as a
threat to their athletic identity. In contrast, when athletes get enmeshed in the sport
system, they may not engage in exploratory behavior because of the time commitment
required for sport participation, the approval they receive from peers for participating in

109
sport, and the intrinsic and extrinsic rewards accrued from athletic accomplishments.
These individuals may not have a pressing need to engage in exploratory behavior
because their needs for relatedness and competency are being met through sport
participation. In addition, the sport system is often structured in a manner that promotes
compliance with team norms rather than independent thinking” (Brewer & Petitpas,
2017, p.119).
A collegiate athlete may experience athletic identity foreclosure. Athletic identity
foreclosure is based on James Marcia’s four identity statuses (identity diffusion, identity
moratorium, identity foreclosure, and identity achievement), where an individual establishes
their identity or identities through stages of commitment and crisis (Marcia, 1966). Identity
foreclosure is a stage in the theory’s matrix where a person commits to an identity, belief, or goal
(e.g., major, career, etc.) without exploring other options (e.g., the absence of crisis). Athletic
identity foreclosure occurs when an athlete exclusively commits to their athletic identity without
exploring or even acknowledging other social identities (Brewer & Petitpas, 2017). Athletic
identity, by itself, is not a problem. However, when a student-athlete does not engage with
academics, their athletic identity may foreclose identity development in educational
environments.
Academic identity can be further defined in terms of academic self-concept (Wang &
Neihart, 2015). Academic self-concept describes an individual’s beliefs about their ability in
academic situations (Raufelder & Ringeisen, 2016) and contributes to a learner’s overall self-
concept (Shavelson, Hubner, & Stanton, 1976). Research has shown academic self-concept to
predict academic motivation and achievement (Marsh & Martin, 2011), specifically when
academic achievement is assessed by grade point average (Reynolds, 1988). The positive impact

110
that academic self-concept has on both men’s and women’s grade point averages has been
documented (Cokley et al., 2015). Also, research shows that academic self-concept predicts later
academic success. Self‐concept of ability in math and reading predicts future achievement in
both domains (Susperreguy, Davis-Kean, Duckworth, & Chen, 2017). Academic self-concept
has been studied among particular groups of students at colleges and universities. For example,
academic self-concept influenced academic success among first-year college students in STEM
programs (Van Soom & Donche, 2014). Latina/o college students had higher rates of positive
change in academic self-concept when attending a Hispanic Serving Institution (HSI) as opposed
to Latina/a college students attending an emerging HSI or non-HSI (Cuellar, 2014). Additionally,
cultural identity affects the academic self-concept of African American college students at a
predominately White institution (Williams & Chung, 2013), and racial identity impacts levels of
academic self-concept among African American collegiate athletes (Fuller, Harrsion, &
Bukstein, 2017). Further research is needed on academic self-concept among student-athletes.
Social Identity Complexity and Stereotype Threat. Research indicates that student-
athletes may experience stress from balancing their roles as a student and an athlete (Lu, Heinz,
& Soderstrom, 2018). The identity conflict may become especially stressful in learning
environments because stereotypes categorize students as intelligent and athletes as unintelligent.
Without the proper exposure to techniques to manage these situations, a collegiate athlete may
experience stereotype threat that results in decreased academic performance. The social identity
complexity theory suggests a technique to address stereotype threat. Roccas and Brewer (2002)
introduced the social identity complexity theory to address people’s perceptions of the
interrelationship of their multiple in-group identities. The researchers posit that the degree to
which a person views their social identities as convergent will determine one’s identity structure
111
and the accompanying consequences.
Furthermore, the theory suggests that the perceived complexity and inclusiveness of an
individual’s social identity structure may determine how they manage negative stressors. They
offer four identity structures; intersection, dominance, compartmentalization, and merger; which
explain how a person may perceive their in-groups and out-groups. Coupling two or more social
identities and only considering individuals within the same compounded social categories as
ingroup members describes intersection (e.g., ingroup – female surgeon; outgroup – females who
are not surgeons and male surgeons). Using the same example, if the female surgeon identifies
strongly with being a surgeon from Harvard and all other ingroup identities are secondary to the
primary identity of surgeon, then this describes dominance (e.g., ingroup – all Harvard surgeons;
outgroup – females and Harvard graduates from other programs). Compartmentalization will
occur if the above individual can isolate her social categories in a given situation (e.g., primary
ingroup membership shifts depending on the situation). Lastly, a merged identity occurs when an
individual maintains fluidity between their social identities. For example, the female surgeon will
separately identify other females, surgeons, and Harvard graduates as ingroup members; and
each is equally valued.
Research has shown that identity conflict may contribute to reduced cognitive
functioning during academic tasks among student-athletes (Harrison et al., 2009). Therefore,
engaging collegiate athletes in exercises that allow them to explore multiple social identities may
reduce identity conflict and the negative consequences of stereotype threat. Gresky, Eyck, Lord,
and McIntyre (2005) found such an activity, a self-concept map exercise, to be an effective
mitigation strategy for undergraduate females primed with a negative stereotype about women
and math performance (see Table 4). The current study will test a self-concept activity (listing
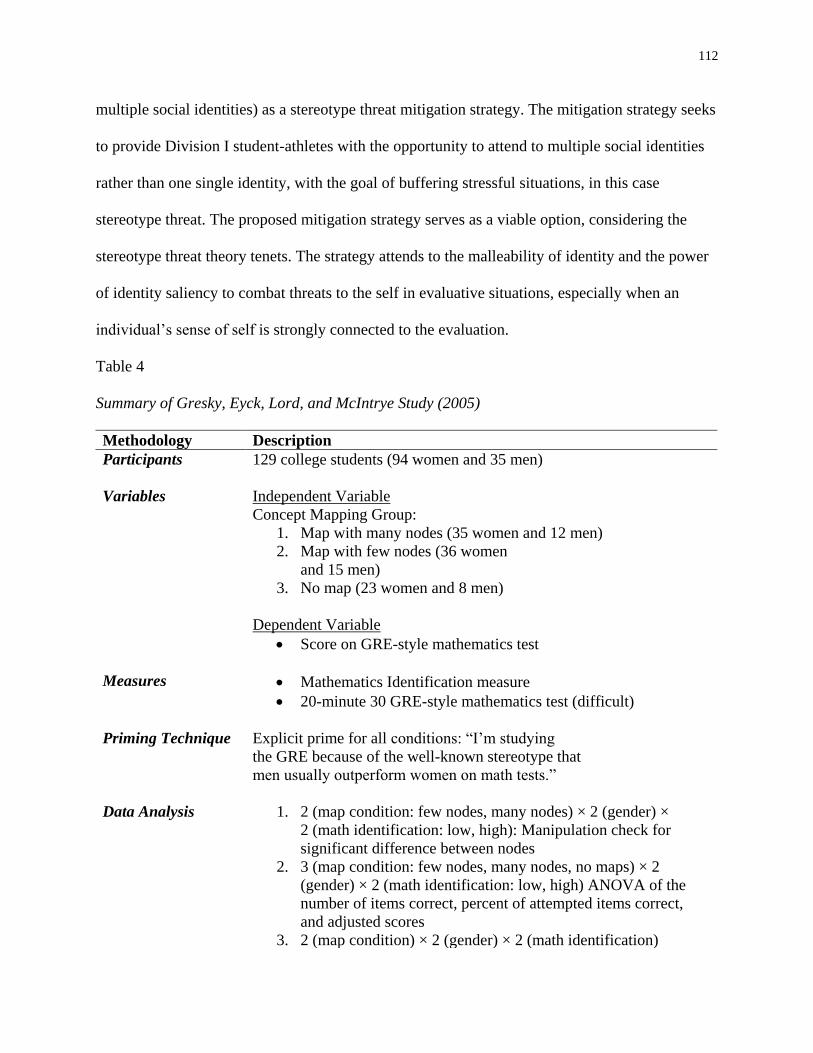
112
multiple social identities) as a stereotype threat mitigation strategy. The mitigation strategy seeks
to provide Division I student-athletes with the opportunity to attend to multiple social identities
rather than one single identity, with the goal of buffering stressful situations, in this case
stereotype threat. The proposed mitigation strategy serves as a viable option, considering the
stereotype threat theory tenets. The strategy attends to the malleability of identity and the power
of identity saliency to combat threats to the self in evaluative situations, especially when an
individual’s sense of self is strongly connected to the evaluation.
Table 4
Summary of Gresky, Eyck, Lord, and McIntrye Study (2005)
Methodology Description
Participants 129 college students (94 women and 35 men)
Variables Independent Variable
Concept Mapping Group:
1. Map with many nodes (35 women and 12 men)
2. Map with few nodes (36 women
and 15 men)
3. No map (23 women and 8 men)
Dependent Variable
• Score on GRE-style mathematics test
Measures • Mathematics Identification measure
• 20-minute 30 GRE-style mathematics test (difficult)
Priming Technique Explicit prime for all conditions: “I’m studying
the GRE because of the well-known stereotype that
men usually outperform women on math tests.”
Data Analysis 1. 2 (map condition: few nodes, many nodes) × 2 (gender) ×
2 (math identification: low, high): Manipulation check for
significant difference between nodes
2. 3 (map condition: few nodes, many nodes, no maps) × 2
(gender) × 2 (math identification: low, high) ANOVA of the
number of items correct, percent of attempted items correct,
and adjusted scores
3. 2 (map condition) × 2 (gender) × 2 (math identification)

113
ANOVA of the number of items that participants attempted
4. 2 (map condition) × 2 (gender) × 2 (math identification) × 5
(node type) ANOVA, with repeated measures on the node type
factor
Main Findings 1. Students in the many nodes condition created significantly
more nodes than participants in the few nodes condition.
2. Students high in math identification received a significantly
higher score than students low in math identification. Men high
in math identification scored significantly better than men low
in math identification. Women in the many nodes condition
performed significantly better than women in the few nodes and
no nodes condition. Women high in math identification in the
many nodes conditions answered significantly more items
correct than women high in math identification in the other two
conditions.
3. Students high in math identification attempted fewer items than
students low in math identification (marginal significance).
4. Five node types were coded as academic, activities, friends,
family, and other. Students in the many nodes condition
included more family nodes than students in the few nodes
condition, and a smaller percentage of “other” nodes. There
was no significant difference between types of nodes and test
performance.
Self-Concept Maps. Concept mapping is an effective activity to visualize complex
systems and ideas, and the relationships between each concept (Roberts & Johnson, 2015).
Concept maps are typically constructed using nodes that represent a concept and the links (or
lines) represent the relationship between each concept (see Figure 8, Schroeder, Nesbit,
Anguiano, & Adesope, 2018). Concept mapping has been shown to support learning in college
classrooms (Mosley & Draper, 2014) and promote critical thinking among undergraduates
(Harris & Zha, 2017). There is an abundance of research on concept mapping (Alfayoumi, 2019;
Asiksoy, 2019; Sturgiss, 2019). Self-concept mapping is a type of identity development exercise.
Identity development impacts learning (Robinson, Perez, Carmel, Linnenbrink-Garcia, 2019), yet
self-concept mapping has received limited research attention.
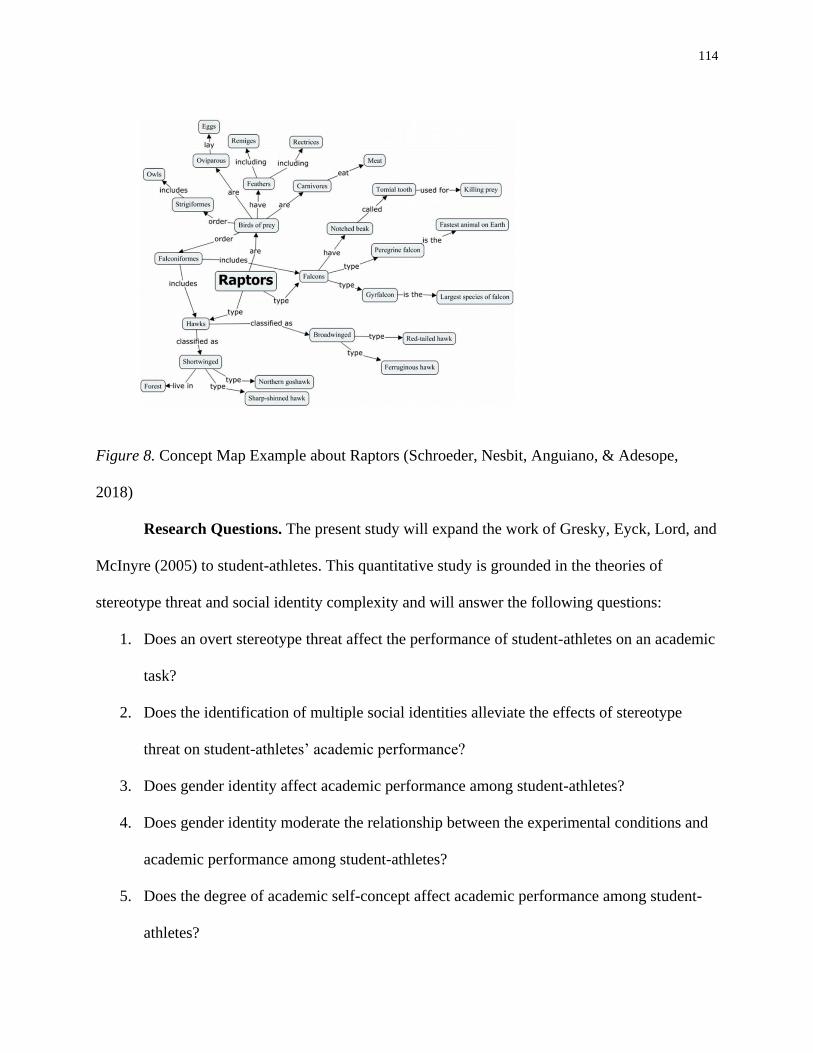
114
Figure 8. Concept Map Example about Raptors (Schroeder, Nesbit, Anguiano, & Adesope,
2018)
Research Questions. The present study will expand the work of Gresky, Eyck, Lord, and
McInyre (2005) to student-athletes. This quantitative study is grounded in the theories of
stereotype threat and social identity complexity and will answer the following questions:
1. Does an overt stereotype threat affect the performance of student-athletes on an academic
task?
2. Does the identification of multiple social identities alleviate the effects of stereotype
threat on student-athletes’ academic performance?
3. Does gender identity affect academic performance among student-athletes?
4. Does gender identity moderate the relationship between the experimental conditions and
academic performance among student-athletes?
5. Does the degree of academic self-concept affect academic performance among student-
athletes?
115
6. Does academic self-concept moderate the relationship between the experimental
conditions and academic performance among student-athletes?
7. Does race/ethnicity affect academic performance among student-athletes?
8. Does race/ethnicity moderate the relationship between the experimental conditions and
academic performance among student-athletes?
Experimental Design. A three-group factorial experimental design was used as in
Gresky et al. (2005) with a modification to include a stereotype threat only condition instead of a
few nodes condition. The three-level independent variable included 1) an explicit stereotype
threat condition with a self-concept map activity (mitigation condition), 2) an explicit stereotype
threat condition without a self-concept map activity (threat condition), and 3) a condition without
stereotype threat or a self-concept map activity (control condition). An independent measures
design was used, and each study participant was randomly assigned to one condition. Gender
identity (female and male) and race/ethnicity (African American, Caucasian, and Hispanic)
served as grouping variables, and information was collected from a demographic survey taken by
study participants in each experimental condition. Also, academic self-concept (lower and
higher) served as another grouping variable, based on information collected from an academic
self-concept scale before the experiment. Academic performance on an SAT-style examination
was the dependent variable. The student-athlete stereotype threat studies reviewed above did not
report rationales for the type of academic task used as the dependent variable. I decided to
include both mathematics and verbal questions to simulate a more authentic standardized testing
experience.
The present study will address the research questions and test the related hypotheses as
outlined in Figure 9 below.
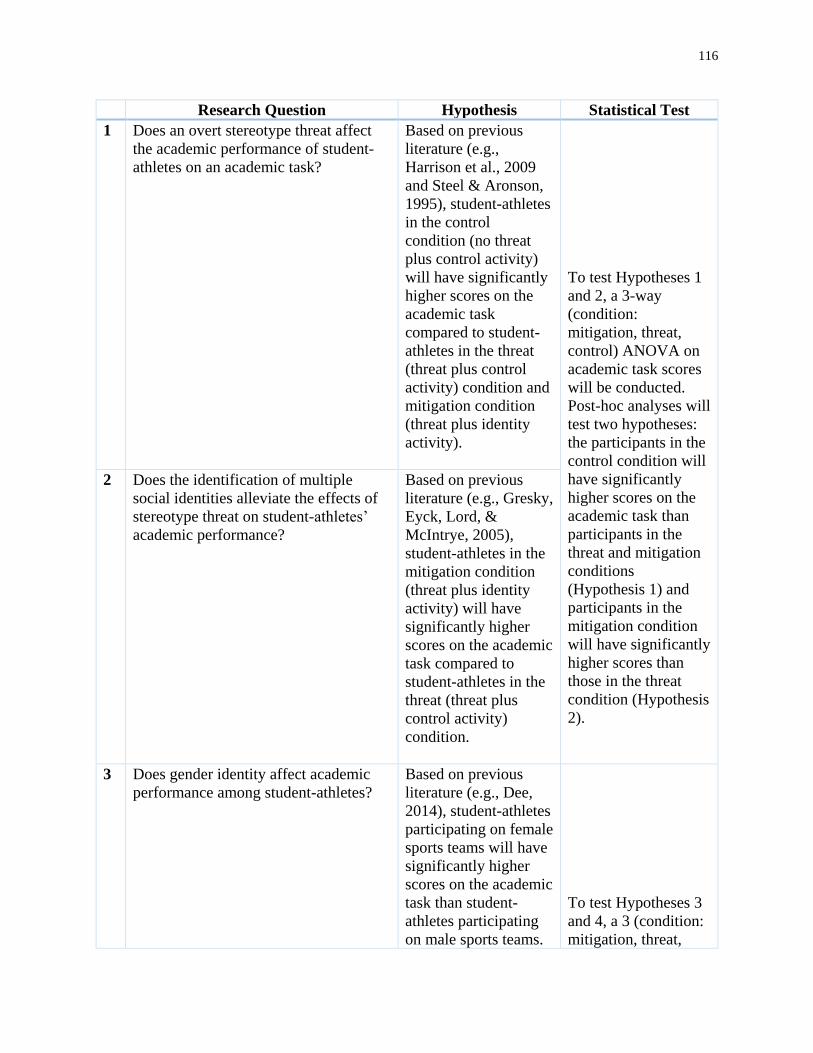
116
Research Question Hypothesis Statistical Test
1 Does an overt stereotype threat affect
the academic performance of student-
athletes on an academic task?
Based on previous
literature (e.g.,
Harrison et al., 2009
and Steel & Aronson,
1995), student-athletes
in the control
condition (no threat
plus control activity)
will have significantly
higher scores on the
academic task
compared to student-
athletes in the threat
(threat plus control
activity) condition and
mitigation condition
(threat plus identity
activity).
To test Hypotheses 1
and 2, a 3-way
(condition:
mitigation, threat,
control) ANOVA on
academic task scores
will be conducted.
Post-hoc analyses will
test two hypotheses:
the participants in the
control condition will
have significantly
higher scores on the
academic task than
participants in the
threat and mitigation
conditions
(Hypothesis 1) and
participants in the
mitigation condition
will have significantly
higher scores than
those in the threat
condition (Hypothesis
2).
2 Does the identification of multiple
social identities alleviate the effects of
stereotype threat on student-athletes’
academic performance?
Based on previous
literature (e.g., Gresky,
Eyck, Lord, &
McIntrye, 2005),
student-athletes in the
mitigation condition
(threat plus identity
activity) will have
significantly higher
scores on the academic
task compared to
student-athletes in the
threat (threat plus
control activity)
condition.
3 Does gender identity affect academic
performance among student-athletes?
Based on previous
literature (e.g., Dee,
2014), student-athletes
participating on female
sports teams will have
significantly higher
scores on the academic
task than student-
athletes participating
on male sports teams.
To test Hypotheses 3
and 4, a 3 (condition:
mitigation, threat,

117
control) x 2
(affiliation: female
sports, male sports)
ANOVA on academic
task scores will be
conducted. Post-hoc
analyses will be
conducted.
4 Does gender identity moderate the
relationship between the experimental
conditions and academic performance
among student-athletes?
Based on previous
literature (Harrison et
al., 2009), student-
athletes participating
on a female sports
team in the mitigation
condition will yield
significantly higher
scores on the academic
task than student-
athletes participating
on female and male
sports teams in the
threat condition. That
is, the main effect of
gender identity will be
refined by an
interaction effect of
condition by gender
identity.
5 Does the degree of academic self-
concept affect academic performance
among student-athletes?
Based on previous
literature (e.g., Feltz et
al., 2013), student-
athletes with higher
academic self-concept
will have significantly
higher scores on the
academic task than
student-athletes with
lower academic self-
concept.
To test Hypotheses 5
and 6, a 3 (condition:
mitigation, threat,
control) x 2
(academic self-
concept: higher,
lower) ANOVA on
academic task scores
will be conducted.
Post-hoc analyses will
be conducted
6 Does academic self-concept moderate
the relationship between the
experimental conditions and academic
performance among student-athletes?
Based on previous
literature on academic
self-concept and
achievement (e.g.,
Reynolds, 2010),
student-athletes higher
in academic self-
concept will have
significantly higher
scores on the academic
task when in the
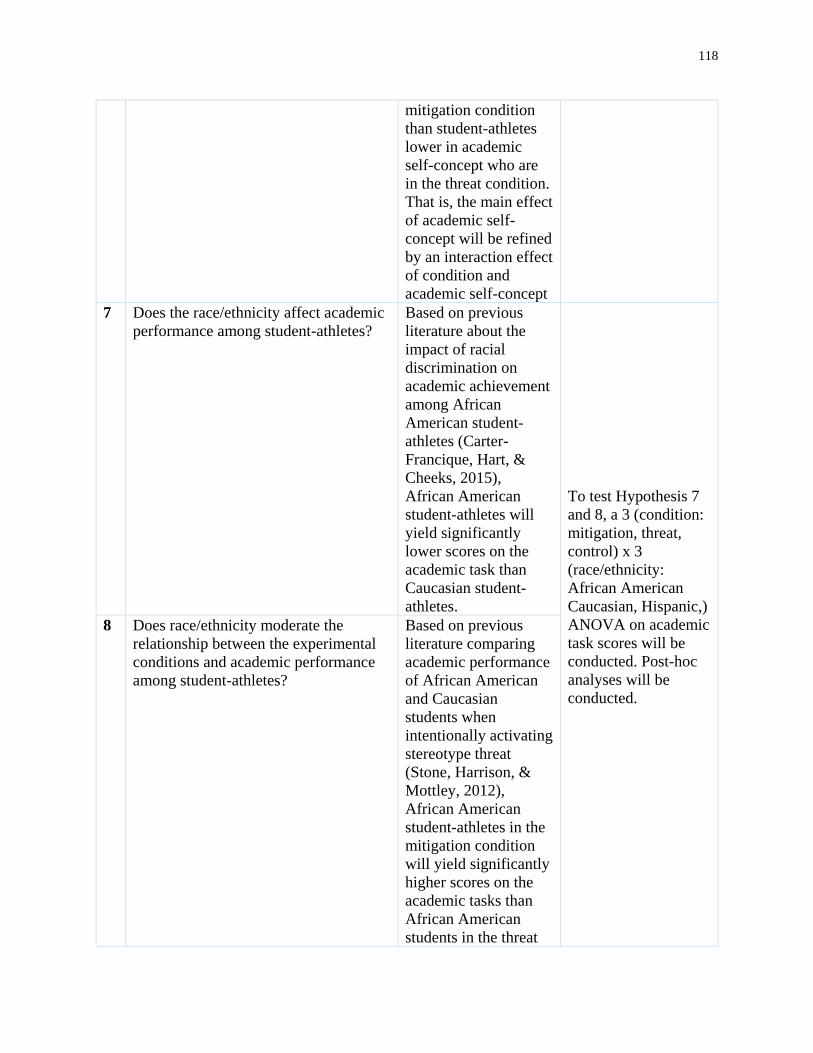
118
mitigation condition
than student-athletes
lower in academic
self-concept who are
in the threat condition.
That is, the main effect
of academic self-
concept will be refined
by an interaction effect
of condition and
academic self-concept
7 Does the race/ethnicity affect academic
performance among student-athletes?
Based on previous
literature about the
impact of racial
discrimination on
academic achievement
among African
American student-
athletes (Carter-
Francique, Hart, &
Cheeks, 2015),
African American
student-athletes will
yield significantly
lower scores on the
academic task than
Caucasian student-
athletes.
To test Hypothesis 7
and 8, a 3 (condition:
mitigation, threat,
control) x 3
(race/ethnicity:
African American
Caucasian, Hispanic,)
ANOVA on academic
task scores will be
conducted. Post-hoc
analyses will be
conducted.
8 Does race/ethnicity moderate the
relationship between the experimental
conditions and academic performance
among student-athletes?
Based on previous
literature comparing
academic performance
of African American
and Caucasian
students when
intentionally activating
stereotype threat
(Stone, Harrison, &
Mottley, 2012),
African American
student-athletes in the
mitigation condition
will yield significantly
higher scores on the
academic tasks than
African American
students in the threat
119
condition. That is, the
main effect of
race/ethnicity will be
refined by an
interaction effect of
condition and
race/ethnicity.
Figure 9. Research Questions, Hypotheses, and Statistical Tests
Methodology
Participants
Institutional Review Board. All procedures were approved by the Georgia State
University Institutional Review Board.
Recruitment. Three hundred and eighty-nine Division I student-athletes who participate
on male and female sports teams at a university in the Southeast region of the United States
received emails at the end of the Fall 2018 semester, inviting them to contribute to a study
exploring the experiences of students participating in extracurricular activities on college
campuses. The student-athletes represented 6 male sports teams (baseball, basketball, football,
golf, soccer, and tennis) and 9 female sports teams (basketball, cross country, golf, beach
volleyball, soccer, softball, tennis, track and field, and volleyball). Recruitment was divided into
two phases: 1) pre-experiment recruitment and 2) experiment recruitment. During August and
September 2018, initial contact was made with an academic support professional in the
university’s Athletic Department to facilitate pre-experiment recruitment, provide basic
information about the study, garner backing for the study, and receive approval to post flyers in
Athletic facilities. The Athletics Department provided the names and emails of the student-
athletes for recruitment purposes. The pre-experiment recruitment email explained that study
participation was voluntary and would require completion of a 10-15-minute survey online about

120
academic self-concept and attendance at a 1-hour workshop on campus, which would include a
brief survey and some cognitive tasks. Also, students were told that they would receive a $40
Amazon gift card after the workshop to demonstrate respect and appreciation for their time and
effort to complete the study. The pre-recruitment period, which included reminder emails and
flyers posted in Athletics facilities, occurred from mid-November 2018 to mid-January 2019
(three months). Recruitment materials did not provide any indication that the study focused on
student-athletes exclusively.
Once the spring semester began, experiment recruitment occurred from mid-January to
early- February. Students who signed up during the pre-experiment phase were emailed about
participating in the study. In addition, to promote statistical power, repeat study invitations were
sent to those student-athletes who had not yet responded. These new study participants were
required to register for the experiment by completing a consent form and the Academic Self-
Concept Scale-Short Form (Reynolds, 2010). After these items were completed, the students
were sent an email requesting that they select one of six scheduled sessions being held in a
classroom on campus. Recruitment yielded 83 student-athletes, and 73 students-athletes
participated in the experiment. Due to the research study questions, an inclusion criterion is
participation in an NCAA-sanctioned sport. However, the list of student-athletes generated by
the Athletics Departments was broader and included other students, such as members of the
dance and cheerleading teams, and ultimately three students from those teams participated in the
study. Therefore, data from those three study participants were not included in the data analysis,
producing a final sample size of 70. An a priori analysis suggested that a sample size of 61 was
required with an alpha set at .05 and an effect size at .60 to achieve statistical power at .90.
Descriptive Statistics. The participants in this study were 70 (43 female and 27 male)
121
Division I student-athletes representing 14 NCAA-sponsored sports (see Table 5). Baseball was
the only sport not represented in the study. Forty-seven students identified as Caucasian, 14 as
African American, and 2 as biracial (African American and Caucasian). Three Caucasian
students listed their ethnicity as Hispanic, Latino(a), or Spanish Origin. Seven students did not
list their race, but listed their ethnicity as Hispanic, Latino(a), or Spanish Origin. The average
age of participants was 20 with a minimum age of 18 and maximum age of 24. There was equal
representation across classifications with 17 first-year students, 18 sophomores, 17 juniors, and
19 seniors participating in the study. Participants reported their grade point averages by selecting
from a range (e.g., 3.00 – 3.19, 3.20 – 3.39). Studies show that there are strong correlations
between self-reported grade point average and school-reported grade point average when
students list both their GPA, and GPA by range (Citrus College Office of Institutional Research,
Planning, and Effectiveness, 2017). Most students reported their grade point average in the
ranges of 3.40 – 3.59 and 3.60 - 3.79. There was no significant difference of grade point average
between female (M = 3.56, SD = .435) and male (M = 3.51, SD = 3.51) student-athletes, F(1,68)
= .224, p = .638. Also, there was no significant difference of grade point average between
racial/ethnic groups (African American: M = 3.38, SD = .389, Caucasian: M = 3.57, SD = .405,
Hispanic: M = 3.68, SD = .253), F(2,67) = 2.17, p = .123. Information about student major was
collected to observe any trends of academic clustering. Academic clustering, a term coined in
1987 by Case, Greer, and Brown, happens when a disproportionate number (compared to
nonstudent-athletes at the same college or university) of student-athletes, usually 25% or more,
select the same major or enroll in the same class (Case, Dey, Barry, & Rudolph, 2017). There
was no indication of academic clustering, and the study participants represented disciplines
across six of the seven academic colleges at the study site, with no more than three students in
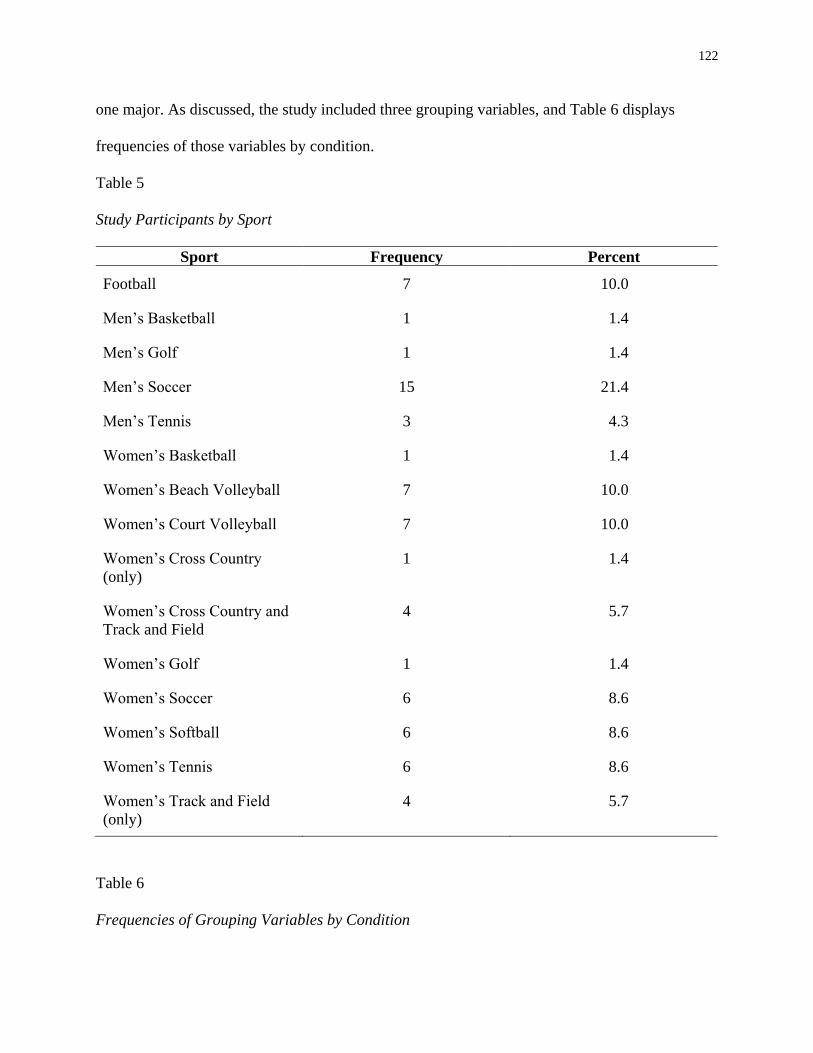
122
one major. As discussed, the study included three grouping variables, and Table 6 displays
frequencies of those variables by condition.
Table 5
Study Participants by Sport
Sport Frequency Percent
Football 7 10.0
Men’s Basketball 1 1.4
Men’s Golf 1 1.4
Men’s Soccer 15 21.4
Men’s Tennis 3 4.3
Women’s Basketball 1 1.4
Women’s Beach Volleyball 7 10.0
Women’s Court Volleyball 7 10.0
Women’s Cross Country
(only)
1 1.4
Women’s Cross Country and
Track and Field
4 5.7
Women’s Golf 1 1.4
Women’s Soccer 6 8.6
Women’s Softball 6 8.6
Women’s Tennis 6 8.6
Women’s Track and Field
(only)
4 5.7
Table 6
Frequencies of Grouping Variables by Condition
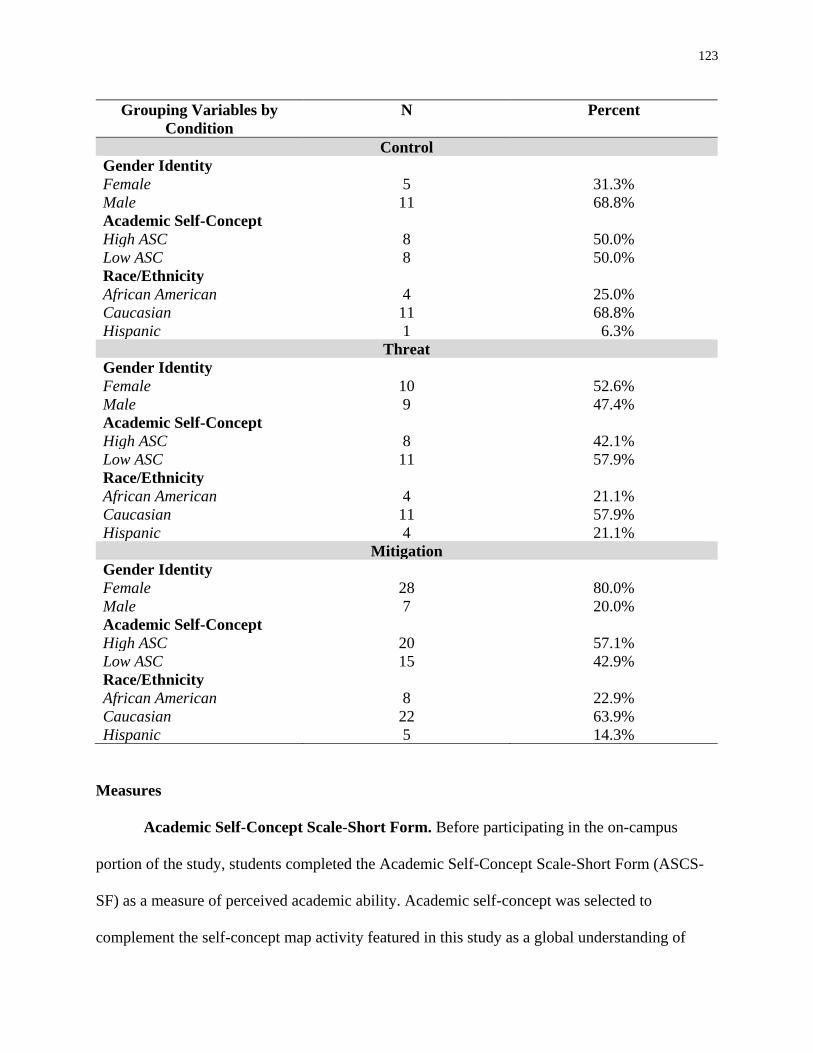
123
Grouping Variables by
Condition
N Percent
Control
Gender Identity
Female 5 31.3%
Male 11 68.8%
Academic Self-Concept
High ASC 8 50.0%
Low ASC 8 50.0%
Race/Ethnicity
African American 4 25.0%
Caucasian 11 68.8%
Hispanic 1 6.3%
Threat
Gender Identity
Female 10 52.6%
Male 9 47.4%
Academic Self-Concept
High ASC 8 42.1%
Low ASC 11 57.9%
Race/Ethnicity
African American 4 21.1%
Caucasian 11 57.9%
Hispanic 4 21.1%
Mitigation
Gender Identity
Female 28 80.0%
Male 7 20.0%
Academic Self-Concept
High ASC 20 57.1%
Low ASC 15 42.9%
Race/Ethnicity
African American 8 22.9%
Caucasian 22 63.9%
Hispanic 5 14.3%
Measures
Academic Self-Concept Scale-Short Form. Before participating in the on-campus
portion of the study, students completed the Academic Self-Concept Scale-Short Form (ASCS-
SF) as a measure of perceived academic ability. Academic self-concept was selected to
complement the self-concept map activity featured in this study as a global understanding of

124
student-athletes’ perception of self and their abilities as a learner. The ASCS-SF developed by
Dr. William Reynolds addressed the stereotype threat tenet concerning identification with a
tested domain. The scale is an abbreviated version of the original Academic Self-Concept Scale
(Reynolds, 1988). Academic self-concept refers to the student’s perception of their abilities as a
learner. The ACSC-SF, which is an 18-item questionnaire using a 4-point Likert scale, measures
general academic self-concept with higher scores indicating stronger academic self-concept. The
scale contains 8 items that are normally scored (items 4, 7, 9, 11, 12, 14, 16, and 18; strongly
agree = 4, agree = 3, disagree = 2, strongly disagree = 1). The remaining 10 items require reverse
scoring (items 1, 2, 3, 5, 6, 8, 10, 13, 15, and 17; strongly disagree = 4, disagree = 4, agree = 3,
strongly agree = 1). Students are asked to rate how they feel most of the time concerning
statements about school-related attitudes. Sample items include: “No matter how hard I try I
don’t do well in school; Most of my instructors think that I am a good student; and At times I
feel college is too difficult for me.” In 2010, Reynolds tested the ACSC-SF with 467 college
students. The ACSC-SF reported an internal consistency reliability score of .90 and
demonstrated convergent validity by relationships with GPA (r = .49), general self-concept (r =
.47), procrastination (r = .46), and discriminant validity shown by a low relationship with social
desirability (r = .21).
Concept Map Activities. A self-concept map is a visualization of the subjective
representation of the self, including the interrelationships among an individual’s different social
identities. Two concept mapping activities were used in the experiment. In the mitigation
condition, I used an adaptation of the self-concept map described in the 2005 Gresky, Eyck,
Lord, and McIntrye study. As discussed previously, Gresky et al. (2005) were testing self-
concept mapping as a stereotype threat mitigation for women completing a mathematics
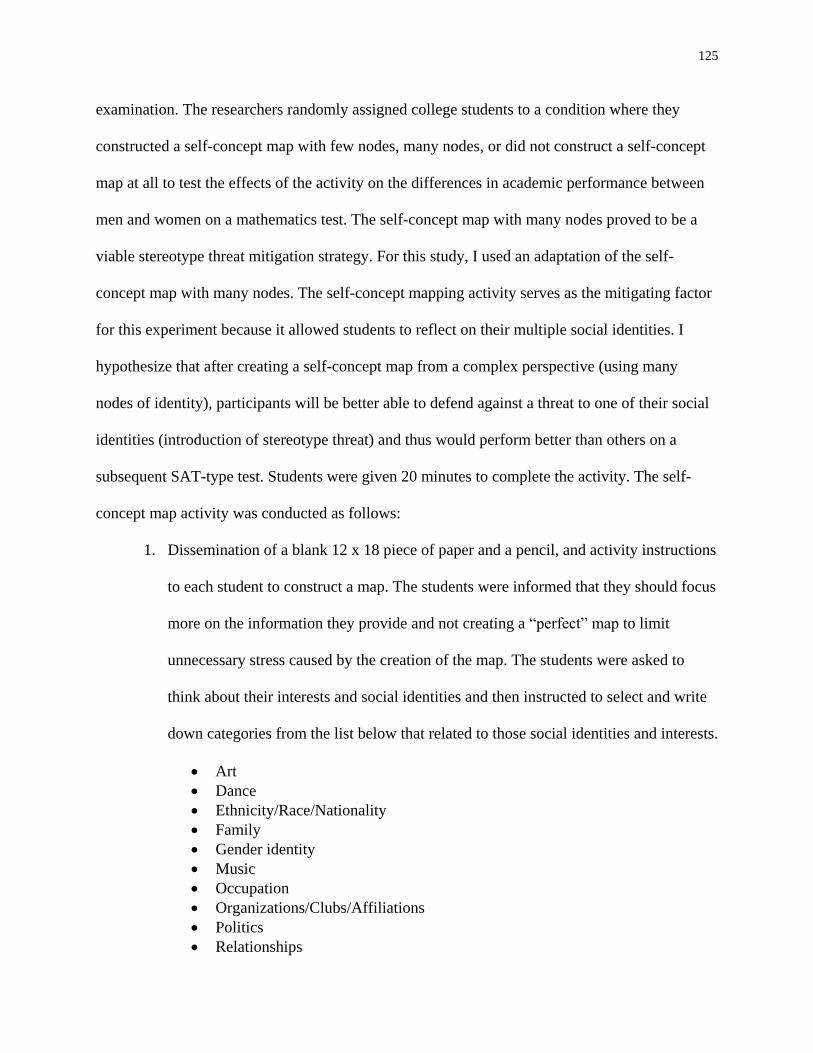
125
examination. The researchers randomly assigned college students to a condition where they
constructed a self-concept map with few nodes, many nodes, or did not construct a self-concept
map at all to test the effects of the activity on the differences in academic performance between
men and women on a mathematics test. The self-concept map with many nodes proved to be a
viable stereotype threat mitigation strategy. For this study, I used an adaptation of the self-
concept map with many nodes. The self-concept mapping activity serves as the mitigating factor
for this experiment because it allowed students to reflect on their multiple social identities. I
hypothesize that after creating a self-concept map from a complex perspective (using many
nodes of identity), participants will be better able to defend against a threat to one of their social
identities (introduction of stereotype threat) and thus would perform better than others on a
subsequent SAT-type test. Students were given 20 minutes to complete the activity. The self-
concept map activity was conducted as follows:
1. Dissemination of a blank 12 x 18 piece of paper and a pencil, and activity instructions
to each student to construct a map. The students were informed that they should focus
more on the information they provide and not creating a “perfect” map to limit
unnecessary stress caused by the creation of the map. The students were asked to
think about their interests and social identities and then instructed to select and write
down categories from the list below that related to those social identities and interests.
• Art
• Dance
• Ethnicity/Race/Nationality
• Family
• Gender identity
• Music
• Occupation
• Organizations/Clubs/Affiliations
• Politics
• Relationships

126
• Religion
• School
• Sports
• Other (Specify)
2. Students were instructed to select as many categories as they could from the list
above. Students were asked to separate the categories in their own areas on the paper.
3. Students were instructed to reflect and write down a list of their identities or roles
under the categories they selected. The following examples were given: “For
example, if you select Family as a category, you could list daughter, son, brother,
uncle etc. as identities or roles that you highly value in your life; or if you select
Relationships as a category, you could list friend, girlfriend/boyfriend, business
partner, etc. as identities or roles that you highly value in your life.”
4. Students were instructed to draw a line between identities or roles that they felt were
connected.
5. Students were instructed to place a star next to identities that they find most
significant to their overall identity.
6. Students were instructed to write the word “Me” in the center of their map.
7. Students were asked to reflect on what they had written.
The activity can be subdivided into four actions: 1) list identity categories, 2) list exemplars for
those categories, 3) make connections between exemplars, and 4) identify highly valued
identities (categories or exemplars).
Participants in the remaining two conditions participated in an alternate mapping activity
about food as a control for the effort and distraction of the other mapping task. The topic of food
was unlikely to prime participants for either their student or athlete identity. Students were given
20 minutes to complete the activity. The alternate map activity was conducted as follows:
127
1. Dissemination of a blank 12 x 18 piece of paper and a pencil, and activity instructions
to each student to construct a map. The students were informed that they should focus
more on the information they provide and not creating a “perfect” map to limit
unnecessary stress caused by the creation of the map. The students were asked to
discuss, in list format, their favorite and most visited places to eat in their
neighborhood using the categories below.
• Coffee Shop
• Delivery
• Diner
• Family member’s house
• Fast Food
• Grocery Store
• Health Food Store
• Restaurant
• Other (Specify)
2. Students were instructed to select as many options as they could from the list above.
3. Students were instructed to make a list of items that they recently purchased or ate
under the options they selected. Students were asked to separate the list in their own
areas on the paper.
4. Students were instructed to write down the best day and time to purchase or eat items
they listed.
5. Students were instructed to place a star next to their favorite food items.
The activity can be subdivided into four actions: 1) list food categories, 2) list examples for those
categories, 3) list the best day and time to purchase/eat, and 4) identify favorite food items.
Scholastic Aptitude Test (SAT) writing and language and mathematics questions.
During the experiment, study participants completed a computerized academic test. The test
consisted of 18 questions from the SAT writing and language and mathematics (no calculator

128
permitted) sections of the standardized test. The writing and language section was composed of 9
questions from the College Board website (CollegeBoard, 2019). The mathematics section was
composed of 9 questions from SAT practice materials written by Hofstra University
Mathematics professor, Steven Warner (Warner, 2012). Each section of the test included three
items of easy, moderate, and difficult level of difficulty. The degree of difficulty increased
throughout the exam to challenge the students but not exhaust their mental capacity on items that
could cause them to disengage from the material (Steele & Aronson, 1995). The students had 25
minutes to complete the test. The presentation of the test material adhered to the guidelines of the
SAT. Students completed the writing and language section before they completed the
mathematics section. Also, students had 10 minutes to complete the writing and language section
and 15 minutes to complete the mathematics section. Scores were determined by the number of
items answered correctly out of the total items available on each section. Dependent measures
for analysis included total items correct, writing and language items correct, math items correct,
total difficult items correct, difficult writing and language items correct, and difficult math items
correct.
Demographic Survey. The demographic survey included items to collect information
about gender identity, race, ethnicity, age, classification, major, grade point average range, and
sport.
Procedures
Pilot. A pilot study was conducted for the entire experiment with five undergraduate
students. The pilot study was used to test the validity of the instructions, the mapping activities,
and the SAT-style test. Additionally, the pilot study was critical in testing the functionality of the
technology used in the study and the logistics (e.g., organization, timing, and materials needed)
129
of the experiment.
Experiment. After the study received IRB approval, participants were invited to
volunteer for the study by submitting an electronic participation form using the link included in
their invitation email. Those students who chose to participate in the study completed a consent
form and the ASCS-SF. After these items were completed, the students were sent an email
requesting that they select one of six scheduled sessions being held in a classroom on campus.
The classroom held 20 people. After the study participant registration deadline, a graduate
research assistant assigned student participant identification numbers to replace their names to
ensure anonymity during the experiment. Additionally, the graduate assistant randomly assigned
participants to one of three experimental groups: 1) an explicit stereotype threat condition with
the self-concept mapping activity (mitigation condition), 2) an explicit stereotype threat
condition with the food mapping activity (threat condition), or 3) a condition without stereotype
threat, but with the food mapping activity (control condition). I facilitated the experiment, and I
was blind to the student’s academic self-concept scale scores. The students were blind to the
condition in which they were randomly assigned. On the day of the sessions, another graduate
research assistant greeted each student and provided them with their identification numbers to
include on all their study materials instead of their names. I began the experiment, in all
conditions, by telling the students that they would participate in three unrelated activities - a
mapping activity, an academic test, and a demographic survey. Also, at the end of each session, I
told the students that they would receive a study debriefing at the completion of the entire
experiment. Additionally, students were asked not to share any information about the experiment
with their peers to prevent crosstalk and to maintain the integrity of the study. Before leaving the
classroom, each student received a $40 Amazon gift card.

130
In the mitigation condition (N = 35), students heard the explicit prime message about
athletes and academic performance (“I’m exploring performance on the exam that you will take
today. In the past, student-athletes have not performed as well as other students nationally. I will
compare test performance of student-athletes and nonstudent-athletes”). Replicating the priming
technique of Gresky and colleagues (2005), I chose an explicit priming method because the study
is more focused on the mitigation to lessen stereotype threat than the factors that create the
threat. The method was implemented to maximize the possibility of evoking the threat to test the
mitigation. The same evocation rationale applies to the decision to use the “student-athlete” dual
identity prime, as opposed to the “athlete” only identity prime. The published works on the
effects of stereotype threat among student-athletes are split on the identity priming techniques.
Therefore, I used the term most commonly used on-campus at the study site to identify a college
student who participate on an NCAA-sponsored sports team. Following the prime, participants
engaged in the self-concept mapping activity. The students were told that the mapping activity
provided a visual tool to elaborate on a topic and was shown an example of a completed map.
They were instructed not to replicate the map example but use it as a reference. The example
map was only displayed for approximately 1 minute. I asked participants to reflect on their
various social identities by making a list of them; participants could use a suggested list of social
identity categories to begin. The list included an “Other” option for participants to use categories
not represented in the list. Under each category, the student was asked to list more specific
identities or roles related to each category. Students had 20 minutes to complete the task.
In the threat condition (N = 19), students heard the same explicit prime message about
student-athletes and academic performance as participants heard in the mitigation condition.
After the prime, participants engaged in the food mapping activity. The participants were also
131
told that the mapping activity provided a visual tool to elaborate on a topic and was shown an
example of a completed map. They were instructed not to replicate the map example but use it as
a reference. The example map was only displayed for approximately 1 minute. Students were
instructed to create a map based on their favorite food items.
In the control condition (N = 16), students were not primed with the negative stereotype
about student-athletes and academic performance. Instead, the participants received the
following message: “I’m exploring test construction and test performance on an exam.” Students
in the condition engaged in the same mapping activity as the threat condition group.
After the mapping activity in each condition, participants had 25 minutes to complete an
18-question SAT-style writing and language (10 minutes), and mathematics (15 minutes) exam.
After the test, participants completed a survey requesting demographic information about their
race/ethnicity, classification, age, major, grade point average, and sport.
Data analysis. As discussed earlier, a three-group factorial experimental design was used
to explore the impact of a self-concept map activity on the academic performance of student-
athletes when threatened with a negative stereotype. All analyses as outlined in Figure 9 were
conducted using IBM SPSS 25. The dependent measure was performance on the academic task.
Specifically, performance was analyzed separately by the number of items correct on
components of the task: 1) total items, 2) writing and language items, 3) mathematics items, 4)
difficult items, 5) difficult writing and language items, and 5) difficult mathematics items.
Stereotype threat typically occurs when a person attempts a mentally taxing evaluative task, so it
was appropriate to look at performance in these different ways. A reliability analysis of the
ASCS-SF items was completed using IBM SPSS 25. Exploratory research questions were
answered later by reporting multiple correlations.
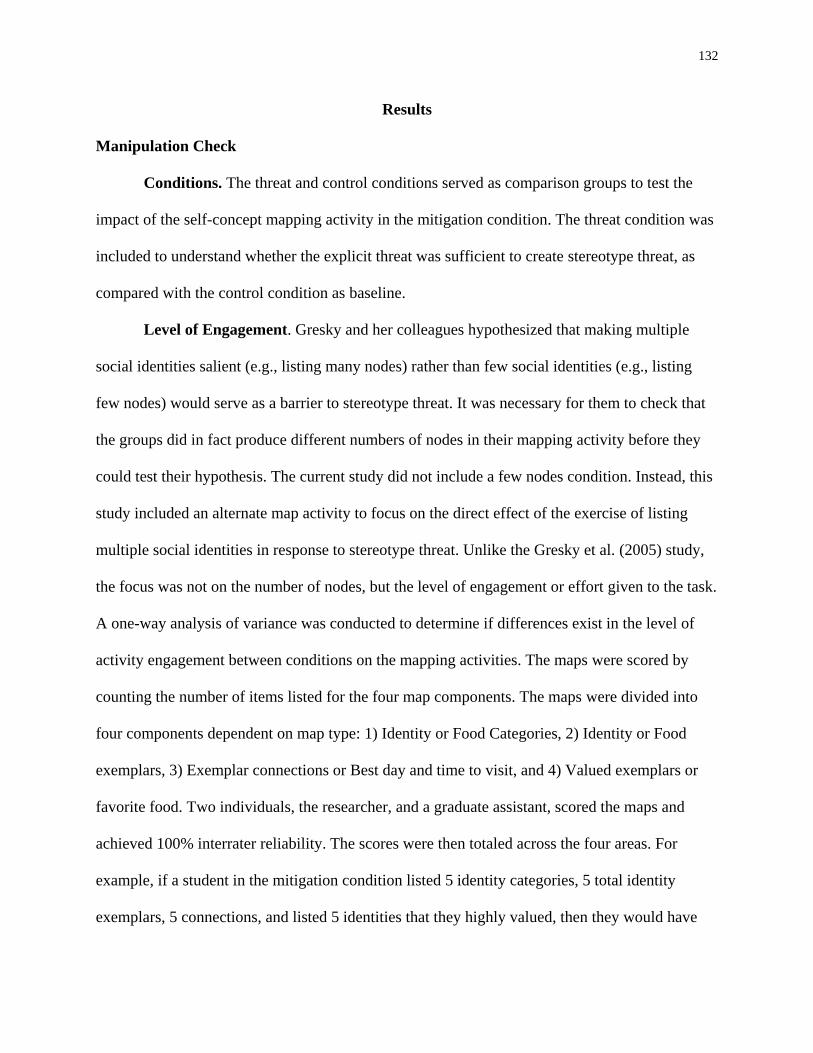
132
Results
Manipulation Check
Conditions. The threat and control conditions served as comparison groups to test the
impact of the self-concept mapping activity in the mitigation condition. The threat condition was
included to understand whether the explicit threat was sufficient to create stereotype threat, as
compared with the control condition as baseline.
Level of Engagement. Gresky and her colleagues hypothesized that making multiple
social identities salient (e.g., listing many nodes) rather than few social identities (e.g., listing
few nodes) would serve as a barrier to stereotype threat. It was necessary for them to check that
the groups did in fact produce different numbers of nodes in their mapping activity before they
could test their hypothesis. The current study did not include a few nodes condition. Instead, this
study included an alternate map activity to focus on the direct effect of the exercise of listing
multiple social identities in response to stereotype threat. Unlike the Gresky et al. (2005) study,
the focus was not on the number of nodes, but the level of engagement or effort given to the task.
A one-way analysis of variance was conducted to determine if differences exist in the level of
activity engagement between conditions on the mapping activities. The maps were scored by
counting the number of items listed for the four map components. The maps were divided into
four components dependent on map type: 1) Identity or Food Categories, 2) Identity or Food
exemplars, 3) Exemplar connections or Best day and time to visit, and 4) Valued exemplars or
favorite food. Two individuals, the researcher, and a graduate assistant, scored the maps and
achieved 100% interrater reliability. The scores were then totaled across the four areas. For
example, if a student in the mitigation condition listed 5 identity categories, 5 total identity
exemplars, 5 connections, and listed 5 identities that they highly valued, then they would have
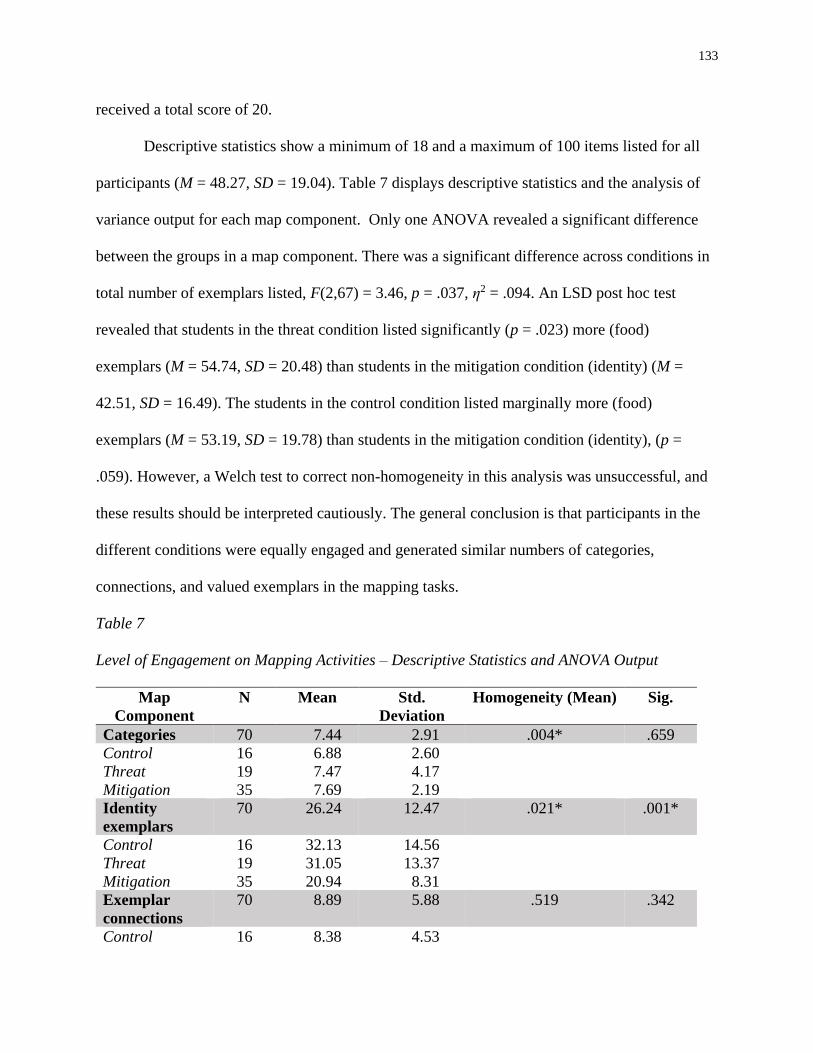
133
received a total score of 20.
Descriptive statistics show a minimum of 18 and a maximum of 100 items listed for all
participants (M = 48.27, SD = 19.04). Table 7 displays descriptive statistics and the analysis of
variance output for each map component. Only one ANOVA revealed a significant difference
between the groups in a map component. There was a significant difference across conditions in
total number of exemplars listed, F(2,67) = 3.46, p = .037, η2 = .094. An LSD post hoc test
revealed that students in the threat condition listed significantly (p = .023) more (food)
exemplars (M = 54.74, SD = 20.48) than students in the mitigation condition (identity) (M =
42.51, SD = 16.49). The students in the control condition listed marginally more (food)
exemplars (M = 53.19, SD = 19.78) than students in the mitigation condition (identity), (p =
.059). However, a Welch test to correct non-homogeneity in this analysis was unsuccessful, and
these results should be interpreted cautiously. The general conclusion is that participants in the
different conditions were equally engaged and generated similar numbers of categories,
connections, and valued exemplars in the mapping tasks.
Table 7
Level of Engagement on Mapping Activities – Descriptive Statistics and ANOVA Output
Map
Component
N Mean Std.
Deviation
Homogeneity (Mean) Sig.
Categories 70 7.44 2.91 .004* .659
Control 16 6.88 2.60
Threat 19 7.47 4.17
Mitigation 35 7.69 2.19
Identity
exemplars
70 26.24 12.47 .021* .001*
Control 16 32.13 14.56
Threat 19 31.05 13.37
Mitigation 35 20.94 8.31
Exemplar
connections
70 8.89 5.88 .519 .342
Control 16 8.38 4.53
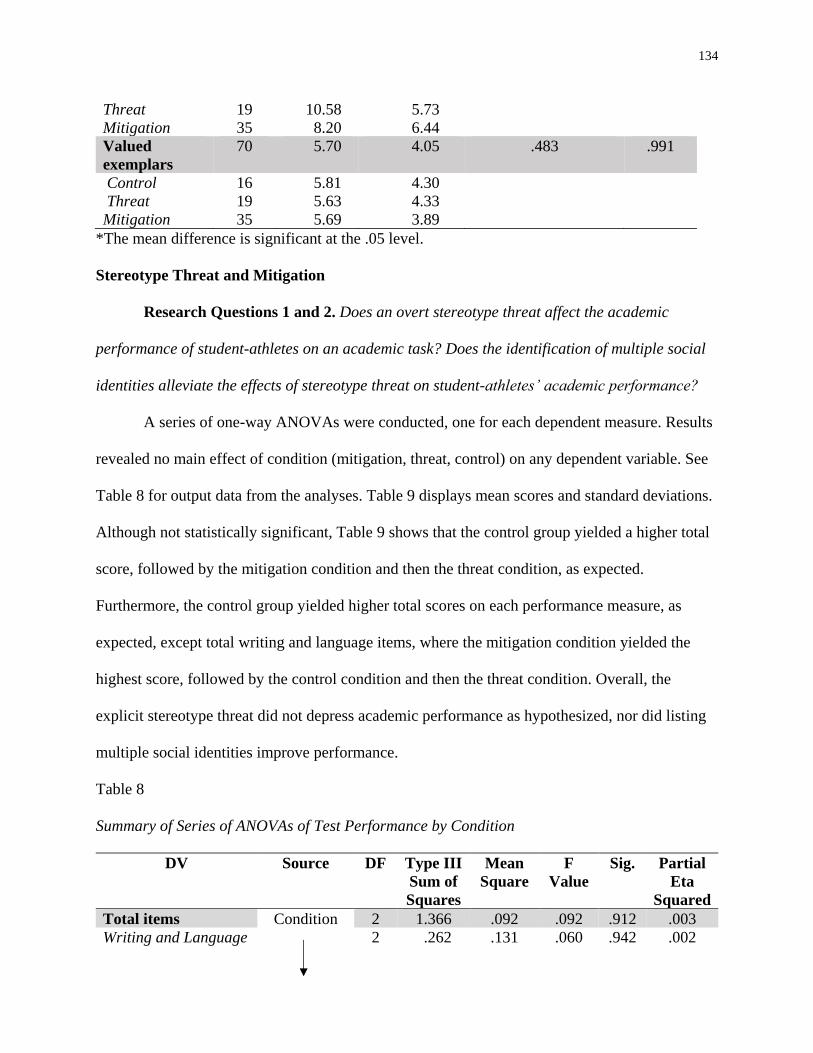
134
Threat 19 10.58 5.73
Mitigation 35 8.20 6.44
Valued
exemplars
70 5.70 4.05 .483 .991
Control 16 5.81 4.30
Threat 19 5.63 4.33
Mitigation 35 5.69 3.89
*The mean difference is significant at the .05 level.
Stereotype Threat and Mitigation
Research Questions 1 and 2. Does an overt stereotype threat affect the academic
performance of student-athletes on an academic task? Does the identification of multiple social
identities alleviate the effects of stereotype threat on student-athletes’ academic performance?
A series of one-way ANOVAs were conducted, one for each dependent measure. Results
revealed no main effect of condition (mitigation, threat, control) on any dependent variable. See
Table 8 for output data from the analyses. Table 9 displays mean scores and standard deviations.
Although not statistically significant, Table 9 shows that the control group yielded a higher total
score, followed by the mitigation condition and then the threat condition, as expected.
Furthermore, the control group yielded higher total scores on each performance measure, as
expected, except total writing and language items, where the mitigation condition yielded the
highest score, followed by the control condition and then the threat condition. Overall, the
explicit stereotype threat did not depress academic performance as hypothesized, nor did listing
multiple social identities improve performance.
Table 8
Summary of Series of ANOVAs of Test Performance by Condition
DV Source DF Type III
Sum of
Squares
Mean
Square
F
Value
Sig. Partial
Eta
Squared
Total items Condition 2 1.366 .092 .092 .912 .003
Writing and Language 2 .262 .131 .060 .942 .002

135
Math 2 1.435 .718 .204 .816 .006
Total difficult items 2 1.209 .605 .371 .691 .011
Writing and Language 2 .493 .246 .519 .597 .015
Math 2 .229 .115 .107 .899 .003
*The mean difference is significant at the .05 level.
Table 9
Mean Scores - Test Performance by Condition
Mean Scores – Overall Test
Performance
Condition N Total
Score
SD Writing and
Language
SD Mathematics SD
Control 16 12.13 2.16 5.06 1.34 7.06 1.77
Threat 19 11.74 2.88 5.00 1.37 6.74 1.88
Mitigation 35 11.86 2.85 5.14 1.59 6.71 1.92
Total 70 11.89 2.68 5.09 1.46 6.80 1.85
Mean Scores – Difficult Items
N Total
Score
SD Writing and
Language
SD Mathematics SD
Control 16 3.50 1.03 1.44 .629 2.06 .93
Threat 19 3.32 1.25 1.26 .653 2.05 1.03
Mitigation 35 3.17 1.38 1.23 .731 1.94 1.08
Total 70 3.29 1.26 1.29 .684 2.00 1.02
Gender Identity
Research Questions 3 and 4. Does gender identity affect academic performance among
student-athletes? Does gender identity moderate the relationship between the experimental
conditions and academic performance among student-athletes?
A series of 3 (condition) x 2 (gender identity) ANOVAs were conducted, one for each
dependent measure. Results revealed no main effects of condition or gender identity and no
interaction effects on any dependent variable. See Table 10 for output data from the analyses.
Table 11 displays mean scores and standard deviations of female and male sports participants in
each experimental condition. As discussed earlier, there was no significant difference in GPA

136
mean between female and male student-athletes. Overall, male student-athletes performed better
(but not significantly so) than female student-athletes, especially on difficult test items.
Table 10
Summary of Series of ANOVAs of Test Performance – Condition by Gender Identity
DV Source DF Type
III Sum
of
Squares
Mean
Square
F
Value
Sig. Partial
Eta
Squared
Total items Condition 2 3.770 1.885 .249 .780 .008
Gender 1 1.419 1.149 .187 .666 .003
Interaction 2 11.054 5.527 .730 .486 .022
Writing and Language Condition 2 1.144 .572 .265 .768 .008
Gender 1 7.919 7.919 3.663 .060 .054
Interaction 2 2.030 1.015 .470 .627 .014
Math Condition 2 1.514 .757 .214 .808 .007
Gender. 1 2.634 2.634 .744 .392 .011
Interaction 2 5.000 2.500 .706 .497 .022
Total difficult items Condition 2 .587 .294 .177 .838 .005
Gender 1 1.043 1.043 .628 .431 .010
Interaction 2 1.314 .657 .395 .675 .012
Writing and Language Condition 2 .695 .347 .723 .489 .022
Gender 1 .019 .019 .039 .844 .001
Interaction 2 1.026 .513 1.067 .350 .032
Math Condition 2 .042 .021 .019 .981 .001
Gender 1 .782 .782 .724 .398 .011
Interaction 2 1.389 .695 .644 .529 .020
*The mean difference is significant at the .05 level.
Table 11
Mean Scores of Test Performance – Condition by Gender Identity
Mean Scores – Overall Test
Performance
Condition N Total
Score
SD Writing
and
Language
SD Mathematics SD
Control 16 12.13 2.16 5.06 1.34 7.06 1.77
Female 5 13.20 1.48 6.00 .00 7.20 1.48
Male 11 11.64 2.92 4.64 1.43 7.00 1.95

137
Threat 19 11.74 2.88 5.00 1.37 6.74 1.88
Female 10 11.80 3.33 5.20 1.55 6.60 2.17
Male 9 11.67 2.50 4.78 1.20 6.89 1.62
Mitigation 35 11.86 2.85 5.14 1.59 6.71 1.92
Female 28 11.71 2.83 5.25 1.53 6.46 1.93
Male 7 12.43 3.10 4.71 1.89 7.71 1.60
Total 70 11.89 2.68 5.09 1.46 6.80 1.85
Female 43 11.91 2.82 5.33 1.44 6.58 1.92
Male 27 11.85 2.51 4.70 1.44 7.15 1.73
Mean Scores – Difficult Items
N Total
Score
SD Writing
and
Language
SD Mathematics SD
Control 16 3.50 1.03 1.44 .629 2.06 .93
Female 5 3.60 .89 1.40 .548 2.20 .84
Male 11 3.45 1.13 1.45 .688 2.00 .93
Threat 19 3.32 1.25 1.26 .653 2.05 1.03
Female 10 3.00 1.15 1.10 .568 1.90 1.10
Male 9 3.67 1.32 1.44 .726 2.22 .97
Mitigation 35 3.17 1.38 1.23 .731 1.94 1.08
Female 28 3.11 1.34 1.29 .659 1.82 1.06
Male 7 3.43 1.62 1.00 1.000 2.43 1.13
Total 70 3.29 1.26 1.29 .684 2.00 1.02
Female 43 3.14 1.25 1.26 .621 1.88 1.03
Male 27 3.52 1.28 1.33 .784 2.19 1.00
Academic Self-Concept
Research Questions 5 and 6. Does the degree of academic self-concept affect academic
performance among student-athletes? Does academic self-concept moderate the relationship
between the experimental conditions and academic performance among student-athletes?
A reliability analysis was conducted on the Academic Self-Concept scale comprising 18
items. Cronbach’s alpha showed the questionnaire to reach acceptable reliability, α =
0.90, with convergent validity shown by a relationship with grade point average (r = .55, p <
.001). Academic self-concept scores were divided at the median (median = 55) to create higher
self-concept and lower self-concept groups (higher self-concept: N = 36, M = 62.36, SD = 4.83;
lower self-concept N = 34, M = 50.29, SD = 3.18). Across all conditions, the mean academic
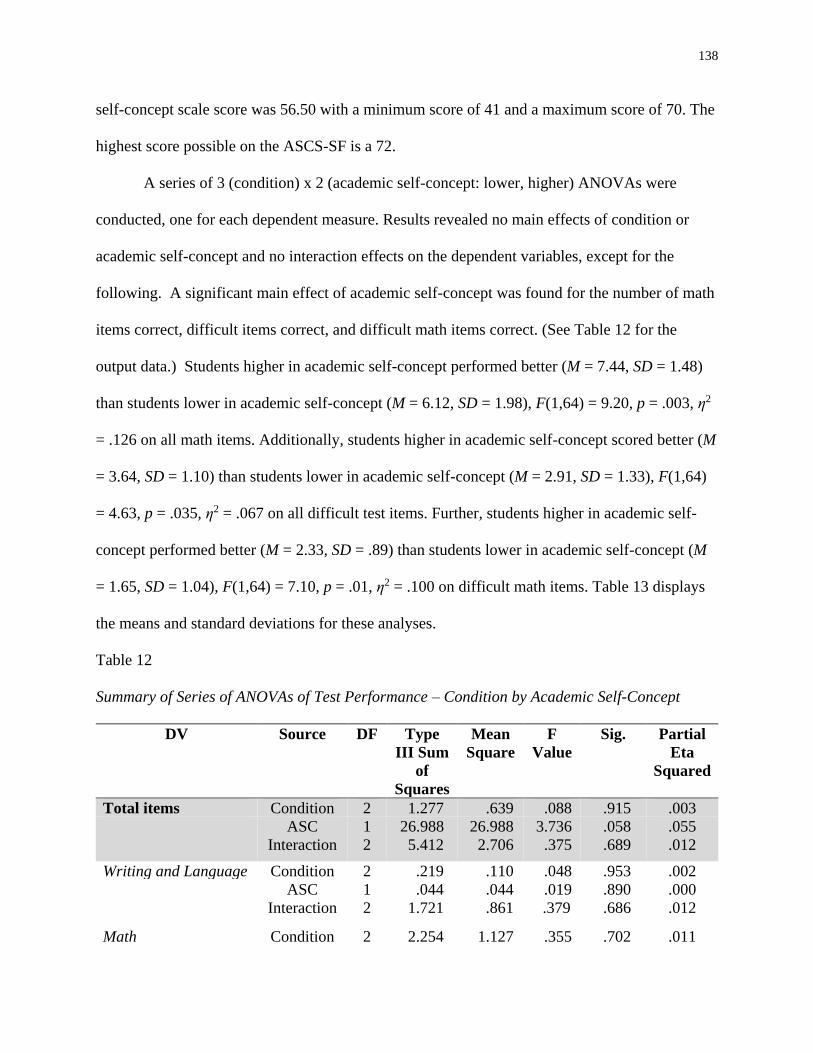
138
self-concept scale score was 56.50 with a minimum score of 41 and a maximum score of 70. The
highest score possible on the ASCS-SF is a 72.
A series of 3 (condition) x 2 (academic self-concept: lower, higher) ANOVAs were
conducted, one for each dependent measure. Results revealed no main effects of condition or
academic self-concept and no interaction effects on the dependent variables, except for the
following. A significant main effect of academic self-concept was found for the number of math
items correct, difficult items correct, and difficult math items correct. (See Table 12 for the
output data.) Students higher in academic self-concept performed better (M = 7.44, SD = 1.48)
than students lower in academic self-concept (M = 6.12, SD = 1.98), F(1,64) = 9.20, p = .003, η2
= .126 on all math items. Additionally, students higher in academic self-concept scored better (M
= 3.64, SD = 1.10) than students lower in academic self-concept (M = 2.91, SD = 1.33), F(1,64)
= 4.63, p = .035, η2 = .067 on all difficult test items. Further, students higher in academic self-
concept performed better (M = 2.33, SD = .89) than students lower in academic self-concept (M
= 1.65, SD = 1.04), F(1,64) = 7.10, p = .01, η2 = .100 on difficult math items. Table 13 displays
the means and standard deviations for these analyses.
Table 12
Summary of Series of ANOVAs of Test Performance – Condition by Academic Self-Concept
DV Source DF Type
III Sum
of
Squares
Mean
Square
F
Value
Sig. Partial
Eta
Squared
Total items Condition 2 1.277 .639 .088 .915 .003
ASC 1 26.988 26.988 3.736 .058 .055
Interaction 2 5.412 2.706 .375 .689 .012
Writing and Language Condition 2 .219 .110 .048 .953 .002
ASC 1 .044 .044 .019 .890 .000
Interaction 2 1.721 .861 .379 .686 .012
Math Condition 2 2.254 1.127 .355 .702 .011
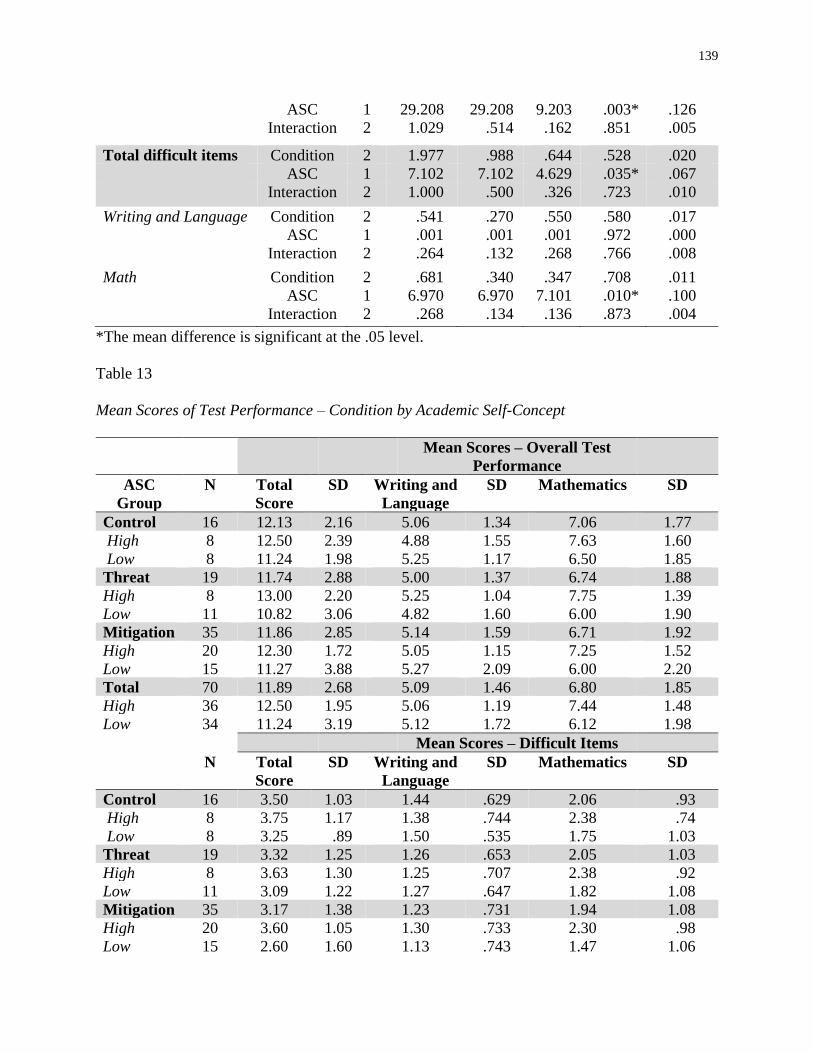
139
ASC 1 29.208 29.208 9.203 .003* .126
Interaction 2 1.029 .514 .162 .851 .005
Total difficult items Condition 2 1.977 .988 .644 .528 .020
ASC 1 7.102 7.102 4.629 .035* .067
Interaction 2 1.000 .500 .326 .723 .010
Writing and Language Condition 2 .541 .270 .550 .580 .017
ASC 1 .001 .001 .001 .972 .000
Interaction 2 .264 .132 .268 .766 .008
Math Condition 2 .681 .340 .347 .708 .011
ASC 1 6.970 6.970 7.101 .010* .100
Interaction 2 .268 .134 .136 .873 .004
*The mean difference is significant at the .05 level.
Table 13
Mean Scores of Test Performance – Condition by Academic Self-Concept
Mean Scores – Overall Test
Performance
ASC
Group
N Total
Score
SD Writing and
Language
SD Mathematics SD
Control 16 12.13 2.16 5.06 1.34 7.06 1.77
High 8 12.50 2.39 4.88 1.55 7.63 1.60
Low 8 11.24 1.98 5.25 1.17 6.50 1.85
Threat 19 11.74 2.88 5.00 1.37 6.74 1.88
High 8 13.00 2.20 5.25 1.04 7.75 1.39
Low 11 10.82 3.06 4.82 1.60 6.00 1.90
Mitigation 35 11.86 2.85 5.14 1.59 6.71 1.92
High 20 12.30 1.72 5.05 1.15 7.25 1.52
Low 15 11.27 3.88 5.27 2.09 6.00 2.20
Total 70 11.89 2.68 5.09 1.46 6.80 1.85
High 36 12.50 1.95 5.06 1.19 7.44 1.48
Low 34 11.24 3.19 5.12 1.72 6.12 1.98
Mean Scores – Difficult Items
N Total
Score
SD Writing and
Language
SD Mathematics SD
Control 16 3.50 1.03 1.44 .629 2.06 .93
High 8 3.75 1.17 1.38 .744 2.38 .74
Low 8 3.25 .89 1.50 .535 1.75 1.03
Threat 19 3.32 1.25 1.26 .653 2.05 1.03
High 8 3.63 1.30 1.25 .707 2.38 .92
Low 11 3.09 1.22 1.27 .647 1.82 1.08
Mitigation 35 3.17 1.38 1.23 .731 1.94 1.08
High 20 3.60 1.05 1.30 .733 2.30 .98
Low 15 2.60 1.60 1.13 .743 1.47 1.06
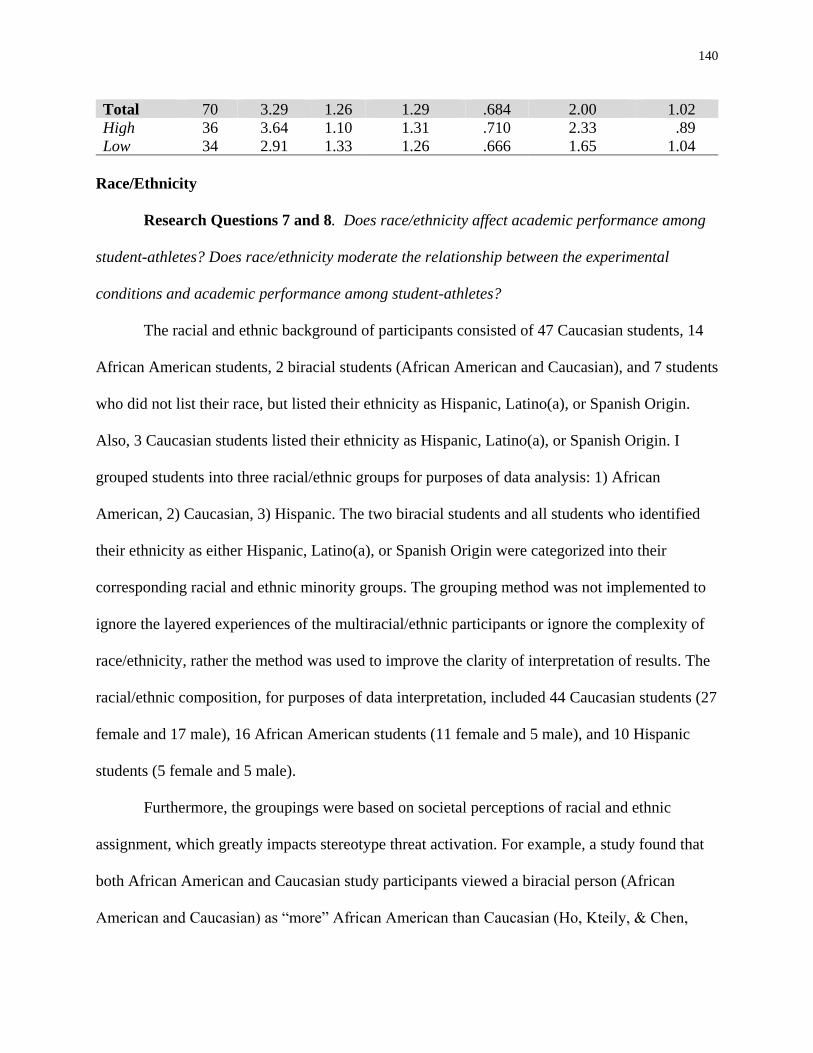
140
Total 70 3.29 1.26 1.29 .684 2.00 1.02
High 36 3.64 1.10 1.31 .710 2.33 .89
Low 34 2.91 1.33 1.26 .666 1.65 1.04
Race/Ethnicity
Research Questions 7 and 8. Does race/ethnicity affect academic performance among
student-athletes? Does race/ethnicity moderate the relationship between the experimental
conditions and academic performance among student-athletes?
The racial and ethnic background of participants consisted of 47 Caucasian students, 14
African American students, 2 biracial students (African American and Caucasian), and 7 students
who did not list their race, but listed their ethnicity as Hispanic, Latino(a), or Spanish Origin.
Also, 3 Caucasian students listed their ethnicity as Hispanic, Latino(a), or Spanish Origin. I
grouped students into three racial/ethnic groups for purposes of data analysis: 1) African
American, 2) Caucasian, 3) Hispanic. The two biracial students and all students who identified
their ethnicity as either Hispanic, Latino(a), or Spanish Origin were categorized into their
corresponding racial and ethnic minority groups. The grouping method was not implemented to
ignore the layered experiences of the multiracial/ethnic participants or ignore the complexity of
race/ethnicity, rather the method was used to improve the clarity of interpretation of results. The
racial/ethnic composition, for purposes of data interpretation, included 44 Caucasian students (27
female and 17 male), 16 African American students (11 female and 5 male), and 10 Hispanic
students (5 female and 5 male).
Furthermore, the groupings were based on societal perceptions of racial and ethnic
assignment, which greatly impacts stereotype threat activation. For example, a study found that
both African American and Caucasian study participants viewed a biracial person (African
American and Caucasian) as “more” African American than Caucasian (Ho, Kteily, & Chen,

141
2017; Ho, Sidanius, Cuddy, & Banaji, 2013;). Research supports the same perception of ethnicity
among Hispanic people (Hollinger, 2005). The idea supports the notion of hypodescent practices
(crudely known as the “one-drop rule”) in American culture, which describes the assignment of a
person of mixed race, by the dominant social group, to a single racial group.
A series of 3 (condition) x 3 (race/ethnicity: African American, Caucasian, and Hispanic)
ANOVAs were conducted, one for each dependent measure. Results revealed no main effects of
condition or race/ethnicity and no interaction effects on the dependent variables, except for the
following. There was a main effect of race/ethnicity on the total number of items correct, F(2,61)
= 3.54, p = .035, η2 = .104; math items correct, F(2,61) = 7.66, p = .001, η2 = .083; difficult items
correct, F(2,61) = 5.57, p = .009, η2 = .145; and difficult math items correct, F(2,61) = 8.45, p =
.001, η2 = .217. LSD post hoc tests revealed significant differences in scores between African
American and Caucasian students. Caucasian students performed significantly better (M = 12.36,
SD = 2.16) than African American students (M = 10.81, SD = 3.60) on total items correct (p =
.047), math items correct (Caucasian: M = 7.30, SD = 1.56, African American: M = 5.56, SD =
2.10, p = .001), and difficult items correct (Caucasian: M = 3.55, SD = 1.15, African American:
M = 2.69, SD = 1.45, p = .018). Additionally, Caucasian and Hispanic students performed
significantly better (Caucasian: M = 2.23, SD = .886, Hispanic: M = 2.10, SD = .994) than
African American students (M = 1.31, SD = 1.14) on difficult math items correct (Caucasian: p =
.001, Hispanic: p = .040). Tables 14 and 15 show output data and means and standard deviations.
Table 14
Summary of Series of ANOVAs of Test Performance – Condition by Race/Ethnicity
DV Source DF Type
III Sum
of
Squares
Mean
Square
F
Value
Sig. Partial
Eta
Squared

142
Total items Condition 2 3.092 1.546 .226 .799 .007
Race/Ethnicity 2 48.475 24.238 3.538 .035* .104
Interaction 4 48.201 12.050 1.759 .149 .103
Writing and Language Condition 2 2.121 1.060 .475 .624 .015
Race/Ethnicity 2 2.418 1.209 .541 .585 .017
Interaction 4 10.261 2.565 1.149 .342 .070
Math Condition 2 .256 .128 .042 .958 .001
Race/Ethnicity 2 45.565 22.782 7.565 .001* .199
Interaction 4 16.520 4.130 1.371 .254 .083
Total difficult items Condition 2 .615 .307 .211 .811 .007
Race/Ethnicity 2 15.049 7.525 5.156 .009* .145
Interaction 4 11.111 2.778 1.903 .121 .111
Writing and Language Condition 2 .296 .148 .326 .723 .011
Race/Ethnicity 2 2.463 1.231 2.714 .074 .082
Interaction 4 3.251 .813 1.791 .142 .105
Math Condition 2 .062 .031 .036 .965 .001
Race/Ethnicity 2 14.723 7.362 8.452 .001* .217
Interaction 4 8.700 2.175 2.497 .052 .141
*The mean difference is significant at the .05 level.
Table 15
Mean Scores of Test Performance – Condition by Race/Ethnicity
Mean Scores – Overall Test
Performance
Race/Ethnicity N Total
Score
SD Writing and
Language
SD Mathematics SD
Control 16 12.13 2.16 5.06 1.34 7.06 1.77
African American 4 11.00 1.83 5.50 .58 5.50 1.92
Caucasian 11 12.82 1.99 5.09 1.45 7.73 1.42
Hispanic 1 9.00 . 3.00 . 6.00 .
Threat 19 11.74 2.88 5.00 1.37 6.74 1.88
African American 4 8.50 3.11 4.25 1.50 4.25 1.71
Caucasian 11 12.55 2.16 5.09 1.45 7.45 1.04
Hispanic 4 12.75 2.63 5.50 1.00 7.25 2.06
Mitigation 35 11.86 2.85 5.14 1.59 6.71 1.92
African American 8 11.88 4.22 5.63 2.33 6.25 2.25
Caucasian 22 12.05 2.28 5.05 1.13 7.00 1.83
Hispanic 5 11.00 3.08 4.80 2.17 6.20 1.92
Total 70 11.89 2.68 5.09 1.46 6.80 1.85
African American 16 10.81 3.60 5.25 1.84 5.56 2.10
Caucasian 44 12.36 2.16 4.90 1.27 7.30 1.56
Hispanic 10 11.50 2.84 5.07 1.73 6.60 1.84

143
Mean Scores – Difficult Items
N Total
Score
SD Writing and
Language
SD Mathematics SD
Control 16 3.50 1.03 1.44 .629 2.06 .93
African American 4 2.75 .50 1.75 .500 1.00 .82
Caucasian 11 3.91 .94 1.45 .522 2.45 .69
Hispanic 1 2.00 . .00 . 2.00 .
Threat 19 3.32 1.25 1.26 .653 2.05 1.03
African American 4 1.75 .96 1.25 .500 .50 .58
Caucasian 11 3.91 1.04 1.45 .688 2.45 .69
Hispanic 4 3.25 .50 .75 .500 2.50 .58
Mitigation 35 3.17 1.38 1.23 .731 1.94 1.08
African American 8 3.13 1.81 1.25 .707 1.88 1.25
Caucasian 22 3.18 1.22 1.18 .795 2.00 1.02
Hispanic 5 3.20 1.64 1.40 .548 1.80 1.30
Total 70 3.29 1.26 1.29 .684 2.00 1.02
African American 16 2.69 1.45 1.38 .619 1.31 1.14
Caucasian 44 3.55 1.15 1.32 .708 2.23 .89
Hispanic 10 3.10 1.20 1.00 .667 2.10 .99
There was a marginally significant condition by race/ethnicity effect on difficult math
items, F(4,61) = 2.50, p = .052, η2 = .141 (see Table 16). Figure 10 displays results from further
investigation through a simple effect analysis. In the control condition, African American
student-athletes received significantly lower scores (M = 1.00, SD = .816) than Caucasian
student-athletes (M = 2.45, SD = .688) on difficult math items (p = .010). In the threat condition,
African American student-athletes received significantly lower scores (M = 0.50, SD = .577)
than the other race/ethnicity groups on difficult math items (Hispanic: M = 2.50, SD = .577, p =
.004; Caucasian, M = 2.45, SD = .688, p = .001). Yet, African American students in the
mitigation condition posted significantly higher scores (M = 1.88, SD = 1.25) on difficult math
items than African American students in the threat condition (p = .02). Additionally, the
difference between African American student-athletes’ performance on difficult math items in
the control condition and mitigation condition shows a marginal trend (p = .13). There were no
significant differences between racial/ethnic groups in the mitigation condition.

144
Table 16
Analysis of Variance Summary (Difficult Math Items) – Condition by Race/Ethnicity
Source df Type III
Sum of
Squares
Mean
Square
F Value Sig. Partial
Eta
Squared
Condition 2 .062 .031 .036 .965 .001
Race/Ethnicity 2 14.723 7.362 8.452 .001* .217
Condition*Race/Ethnicity 4 8.700 2.175 2.497 .052† .141
Error 61 53.130 .871
Total 70 352.000
*The mean difference is significant at the .05 level.
†The mean difference is marginally significant at the .10 level
Figure 10. Mean Score on Difficult Math Items - Condition by Race/Ethnicity
The observation of this interaction effect on difficult math items prompted further
exploration into the moderate and easy math items. Two 3 (condition) x 3 (race/ethnicity:
African American, Caucasian, and Hispanic) ANOVAs were conducted, one for moderate math
1.00
0.50
1.88
2.45 2.45
2.002.00
2.50
1.80
0.00
0.50
1.00
1.50
2.00
2.50
3.00
Control Threat Mitigation
Mat
h S
core
Condition
Mean Score of Difficult Math Items - Condition by
Race/Ethnicity
African American Caucasian Hispanic

145
items and one for easy math items. The analyses yielded no main effects and no interaction
effect. Table 17 displays means and standard deviations for those performance measures.
Table 17
Mean Scores of Moderate and Easy Math Items – Condition by Race/Ethnicity
Mean Scores –
Moderate and Easy Items
Race/Ethnicity N Math
Moderate
SD Math Easy SD
Control 16 2.13 .88 2.87 .342
African American 4 1.75 .96 2.75 .500
Caucasian 11 2.36 .81 2.91 .302
Hispanic 1 1.00 . 3.00 .
Threat 19 2.00 .94 2.68 .582
African American 4 1.50 1.00 2.25 .957
Caucasian 11 2.27 .65 2.73 .467
Hispanic 4 1.75 1.50 3.00 .000
Mitigation 35 1.91 .95 2.86 .430
African American 8 1.75 .71 2.63 .744
Caucasian 22 2.09 .97 2.91 .294
Hispanic 5 1.40 1.14 3.00 .000
Total 70 1.99 .93 2.81 .460
African American 16 1.69 .79 2.56 .727
Caucasian 44 2.20 .85 2.86 .347
Hispanic 10 1.50 1.80 3.00 .000
Summary of Findings
Hypotheses 1 and 2 were not supported. There was no evidence that the explicit prime
activated stereotype threat among all student-athletes and no evidence of the impact of a threat
mitigation condition on all student-athletes. Further, no support was found for Hypotheses 3 and
4. There was no influence of gender identity on performance nor did it function as a moderator of
the relationship between the experimental conditions and academic performance among student-
athletes. However, the results showed, as expected (Hypothesis 5), that academic self-concept
affected academic performance on some measures. Students who scored higher on the academic
146
self-concept scale answered more items correctly on math items, all difficult items, and difficult
math items than students who scored lower on the academic self-concept scale. However,
Hypothesis 6 was not supported; academic self-concept did not function as a moderator of the
relationship between the experimental conditions and academic performance. There was support
for Hypotheses 7 and 8. Race/ethnicity had a main effect on academic performance in the
predicted direction. African American student-athletes posted significantly lower performance on
all test items, math items, and all difficult items than Caucasian student-athletes; and difficult
math items in comparison to both Caucasian and Hispanic student-athletes. Further, a marginally
significant condition by race/ethnicity interaction effect for difficult math items was observed.
In the control condition, African American student-athletes performed significantly worse than
Caucasian student-athletes. In the threat condition, African American student-athletes performed
significantly worse than their Caucasian and Hispanic counterparts on difficult math items, but
African American student-athletes in the mitigation condition performed significantly better on
difficult math items than African American student-athletes in the threat condition. Additionally,
there was a marginal trend between African American student-athletes in the control condition
and the mitigation condition (mitigation condition scoring better than control condition). Further,
the performance of African American participants in the mitigation condition was not different
from Caucasian and Hispanic students, suggesting that for African American participants, the
threat condition further reduced performance and the mitigation condition reduced the threat
effect in the area of difficult math.
Investigation of Potential Relationships
When ANOVAs with grouping variables suggested some main or interaction effects,
further relationships were explored using correlations. Therefore, the following sections will

147
focus on the variables of academic self-concept and race/ethnicity and their relationships with
other variables measured.
Academic Self-Concept. Bivariate correlations revealed several significant positive
relationships between academic self-concept scale-short form (ASCS-SF) score and academic
performance. Table 18 shows mean ASCS-SF score by race/ethnicity and condition. Overall,
there were significant positive relationships between ASCS-SF score and total test score (r =
.325, p = .006), math score (r = .394, p = .001), score on all difficult items (r = .413, p < .001),
and score on difficult math items (r = .392, p = .001) across all conditions. Subsequent
correlations examined the relationship between ASC and performance within experimental
conditions and within the race/ethnicity by experimental conditions. In the mitigation condition,
there were significant positive relationships between ASCS-SF score and total test score (r =
.346, p = .042), math score (r = .445, p = 007), score on all difficult items (r = .565, p < .001),
and score on difficult math items (r = .535, p = .001). Specifically, there were significant positive
relationships between ASCS-SF score and academic performance among Hispanic and
Caucasian student-athletes in the mitigation condition, as follows. Among Hispanic student-
athletes, there were significant positive relationships between ASCS-SF score and score on all
difficult items (r = .975, p = .005) and score on difficult math items (r = .997, p < .001).
Significant positive relationships were observed among Caucasian student-athletes between
ASCS-SF score and total test score (r = .430, p = .046), total math score (r = .477, p = .025),
score on all difficult items (r = .616, p = .002), and difficult math items (r = .497, p = .019).
Student ASCS-SF scores did not significantly predict performance in the control or threat
conditions. African American student ASCS-SF scores did not significantly predict performance

148
in any condition. Thus, results indicated that ASC predicted performance on some variables, but
only for Hispanic and Caucasian participants in the mitigation condition.
Table 18
Academic Self-Concept Scale-Short Form Score - Race/Ethnicity by Condition
Race/Ethnicity Condition N Minimum Maximum Mean
Score
SD
African American Control 4 50 69 57.50 8.58
Threat 4 45 64 53.00 8.04
Mitigation 8 53 67 57.50 5.26
Caucasian Control 11 47 70 56.64 8.18
Threat 11 45 68 56.45 7.61
Mitigation 22 44 69 56.77 7.21
Hispanic Control 1 56 56 56.00 .
Threat 4 50 56 53.00 2.45
Mitigation 5 41 70 58.40 12.58
Total Control 16 47 70 56.81 7.71
Threat 19 45 68 55.00 6.86
Mitigation 35 41 70 57.17 7.54
Race/Ethnicity. A marginally significant condition by race/ethnicity interaction effect on
difficult math items was shown through an analysis of variance reported above. Post-hoc
analyses showed that, in the control condition, African American student-athletes received
significantly lower scores than Caucasian student-athletes on difficult math items (p = .010).
African American student-athletes had significantly poorer scores in the threat condition than did
Caucasian (p = .001) and Hispanic (p = .004) student-athletes, but there was no difference
between these groups in the mitigation condition. African American participants’ performance
on difficult math items in the mitigation condition was significantly better than their performance
in the threat condition (p = .02), and reached marginal significance in the control condition (p =
.13). This suggests that only African Americans were affected by the threat and mitigation
149
interventions in the predicted directions. This raises the question of whether there were
race/ethnicity group differences in the amount of engagement by participants in the different
mapping tasks and whether differences in that degree of engagement predicted their performance
differences in the different conditions. In other words, did race/ethnicity differences lead to
different degrees of engagement with the mapping tasks and does that explain the observed
interaction effect?
Bivariate correlations were performed between the level of engagement with different
mapping tasks and test performance for race/ethnicity groups separately. Figure 11 organizes the
results. First, I present the following relationships observed in the mitigation condition:
• Among all students, there was a significant positive correlation between the number of
exemplars starred (valued identities) and the number of items correct on all difficult items
(r = .382, p = .024) and difficult writing and language (r = .367, p = .030) items,
specifically.
• Among African American students, there was a significant positive correlation between
the number of exemplars starred (valued identities) and the number of items correct on all
difficult items (r = .791, p = .020), and difficult writing and language (r = .748, p = .033)
and math (r = .722, p = .043) items, separately.
• Among Hispanic students, there was a significant positive correlation between the
number of exemplars starred (valued identities) and the total number of items correct on
the academic exam (r = .918, p = .028).
• Among Caucasian students, there was a significant positive correlation between the total
engagement score on the self-concept mapping activity and the number of items correct
on difficult writing and language items (r = .429, p = .046).

150
• Among Caucasian students, there was a significant positive correlation between the
number of connections made between exemplars (identities) and the number of items
correct on difficult writing and language items (r = .440, p = .040), and a significant
negative relationship between the number of connections made between exemplars
(identities) and the number of items correct on difficult math items (r = -.440, p = .040).
It is important to reference results from the manipulation check, because data revealed
that the students in the threat condition included more total number of exemplars (foods) on their
maps than students in the mitigation condition (identities). If it is assumed that the level of
engagement in the food mapping task predicted performance, then one could expect to observe a
positive relationship between engagement and academic performance. On the other hand, if it is
assumed that the food mapping task was a non-meaningful distraction (as intended), there would
be no relationship between engagement and performance. The following relationships were
observed in the threat condition:
• Among all students, there was a significant positive correlation between the number of
food categories listed and the number of items correct on the difficult writing and
language items (r = .462, p = .047).
• Among Hispanic students, there was a significant positive correlation between the total
engagement on the food mapping activity and the number of items correct on all writing
and language items (r = .955, p = .045).
• Among African American students, there was a significant positive correlation between
the number of exemplars starred (favorite food) and the number of items correct on
difficult writing and language items (r = .962, p = .038).
• Among African American students, there was a significant positive correlation between

151
the number of dates and times listed (best time and day to visit at the food location) and
the number of items correct on difficult writing and language items (r = .993, p = .007).
Last, significant relationships were observed in the control condition. It would be assumed
that the food mapping task would be irrelevant to performance, and in the absence of a threat,
any correlation between engagement and performance in the control condition indicates a
baseline relationship. The following relationships were observed in the control condition:
• Among all students, there was a significant negative relationship between the number of
food categories listed and the number of items correct on all difficult items (r = .570, p =
.021).
• Among all students, there was a significant positive relationship between the number of
dates and times listed (best time and day to visit the food location) and the number of
items correct on math items (r = .563, p = .527) and all difficult items (r = .527, p =
.036).
• Among Caucasian students, there were significant positive relationships between total
engagement on the food mapping activity and the number of items correct on difficult
writing and language items (r = .684, p = .020), the number of food exemplars listed and
the number of items correct on difficult writing and language items (r = .761, p = .007),
and the number of dates and times listed (best time and day to visit the food location) and
the number of items correct of difficult writing and language items (r = .654, p = .029).
• Among Caucasian students, there was a significant negative relationship between the
number of food categories listed and the number of difficult items correct (r = -.671, p =
.024).
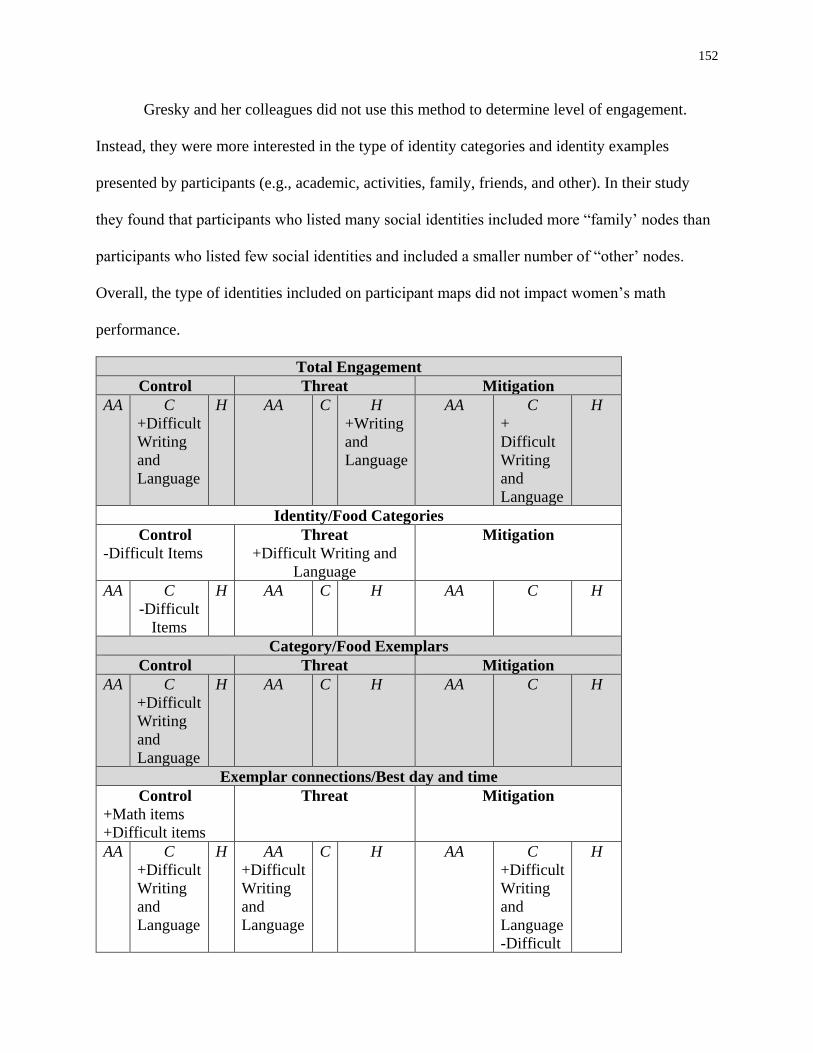
152
Gresky and her colleagues did not use this method to determine level of engagement.
Instead, they were more interested in the type of identity categories and identity examples
presented by participants (e.g., academic, activities, family, friends, and other). In their study
they found that participants who listed many social identities included more “family’ nodes than
participants who listed few social identities and included a smaller number of “other’ nodes.
Overall, the type of identities included on participant maps did not impact women’s math
performance.
Total Engagement
Control Threat Mitigation
AA C
+Difficult
Writing
and
Language
H
AA C H
+Writing
and
Language
AA C
+
Difficult
Writing
and
Language
H
Identity/Food Categories
Control
-Difficult Items
Threat
+Difficult Writing and
Language
Mitigation
AA C
-Difficult
Items
H
AA C H
AA C H
Category/Food Exemplars
Control Threat Mitigation
AA C
+Difficult
Writing
and
Language
H
AA C H
AA C H
Exemplar connections/Best day and time
Control
+Math items
+Difficult items
Threat Mitigation
AA C
+Difficult
Writing
and
Language
H
AA
+Difficult
Writing
and
Language
C H
AA C
+Difficult
Writing
and
Language
-Difficult
H

153
Math
Valued Exemplars/Favorite food
Control Threat Mitigation
+Difficult Items
+Hard Writing and Language
AA C H
AA
+Difficult
Writing
and
Language
C H
AA
+Difficult
Items
+Difficult
Writing
and
Language
+Difficult
Math
C H
+All
Test
Items
KEY
+/- Direction of
relationship
AA: African
American
C: Caucasian H: Hispanic
Figure 11. Conceptual Model of Multiple Correlation Data
Summary of Exploratory Findings
The first set of exploratory findings suggest that academic self-concept contributes to
academic test performance overall, as shown in previous studies (e.g., DeFreitas & Rinn, 2013).
However, a closer examination here suggested that ASC predicted performance only for
Hispanic and Caucasian participants in the mitigation condition (after they had mapped their
social identities).
The second set of explorations looked closely at relationships between engagement with
the different mapping tasks and test performance within race/ethnicity groups. Engagement with
the food mapping task in the control condition predicted test performance only for Caucasian
student-athletes and mainly for their performance on difficult writing/language items. A
different pattern was observed in the threat condition. Engagement with the food mapping task
in the threat condition had no relationship with test performance among Caucasian participants.
However, among African American student-athletes, two components of the task positively

154
predicted performance on difficult writing and language items. Among Hispanic participants,
total engagement predicted the number of writing and language items correct. Generally, food
mapping engagement predicted writing and language scores, perhaps because a general language
fluency underlies both.
Looking at the identity mapping task within race/ethnicity groups, components of the task
(total engagement and number of connections) predicted score on difficult writing and language
items for Caucasian participants, a pattern similar to the predictions in this group in the control
condition. However, within the African American group, the more valued identities listed in the
map, the greater their performance on all difficult items, difficult writing and language items,
and difficult math items. Within the Hispanic group, the more valued identities listed, the greater
the total test score. Only identity mapping positively predicted performance on hard math items
and only among African American participants. This is noteworthy since the condition by
race/ethnicity interaction effect was observed for difficult math items. The methods used in this
section were exploratory, yet the findings hint at a specific component of the self-concept
mapping activity – listing valued identities - that may have enhanced test performance for
African Americans on difficult math items.
Discussion
The main goal of this study was to explore the impact of a stereotype threat mitigation
technique among Division I student-athletes on an evaluative academic task. The mitigation
encouraged participants to explore their multiple social identities through a self-concept mapping
activity. In addition, the study sought to explore moderators that may influence the impact of the
mitigation. The study expanded the work of Gresky et al. (2005) which explored a similar self-
concept mapping activity to address the experiences of stereotype threat among women during
155
an evaluative math task. The current investigation provides the first study to evaluate a
stereotype threat mitigation strategy tailored to student-athletes.
The study investigated a technique to empower students to address negative stereotypes
and stereotype threat. The issue of stereotyping and its consequences are complex, and although
the recipient of the negative stereotype is not at fault, the best and immediate response to a social
and psychological threat is managed internally, sometimes resulting in decreased performance in
a valued area.
Stereotype Threat and Mitigation
Overall, the hypothesis that student-athletes in the control condition would perform
significantly better than students in the threat condition was not supported; thus, the threat did
not depress performance. Further, the mitigation did not improve performance over the threat
condition (possibly since there was no effective threat to mitigate). Although not significant,
mean scores show that, as predicted, student-athletes in the control condition performed better
(total test score) than the student-athletes in the mitigation condition, followed by student-
athletes in the threat condition.
Gender Identity
Gender identity did not impact test performance, and there was no observation of
significant interactions between gender identity and conditions on any performance measure. The
hypotheses in this study about gender identity were based on literature that has reported that
female student-athletes are seen as the academic vanguard of the athletic community and are
more affected by stereotype threat because of their presumably stronger academic self-concept.
It is noteworthy that females performed worse (but not significantly so) than males on all
math items in both the threat and mitigation conditions (not in the control condition); on all

156
difficult items in both the threat and mitigation conditions (not in the control condition); and on
difficult math items in both the threat and mitigation conditions (not in the control condition).
The differences between females and males in the threat and mitigation conditions are not
significant but are in the predicted directions and could be of interest to stereotype threat
researchers because of the wealth of literature on women, stereotype threat, and math
performance (Beasley & Fishcer, 2012; Brown & Josephs, 1999; Gresky et al., 2005; Schmader,
2001; Spencer, Steele, & Quinn, 1999)
Academic Self-Concept
As predicted, student-athletes with higher academic self-concept had significantly higher
scores on the academic task than student-athletes with lower academic self-concept, specifically,
on all math items, all difficult items, and difficult math items. Contrary to predictions, academic
self-concept did not serve as a moderator between the experimental conditions and performance
measures. Follow-up bivariate correlations identified significant positive relationships between
ASCS-SF score and the abovementioned performance measures plus total test score across all
conditions. However, when investigating these relationships within the different experimental
conditions, academic self-concept scale scores predicted performance in the mitigation condition
only and for only Caucasian and Hispanic participants, possibly suggesting that the mitigation
task was successful in priming the academic self for those students and in so doing influenced
performance.
The findings suggest that academic self-concept is a strong predictor of academic
performance, however it does not clearly explain how the construct interacts with stereotype
threat and stereotype threat mitigation strategies. Nevertheless, it appears that students in the
mitigation condition were able to leverage their academic self-concept in a way that students in

157
the threat condition and control conditions were not. It is yet to be determined how the act of
recalling, listing, and reflecting on multiple social identities buffers against attacks on one
identity. The data is promising in that it could lead to directing attention to developing a student-
athlete’s self-concept and academic self-concept, specifically, to improve overall academic
performance and combat stereotype threat. Additionally, the findings offer one potential
technique to boost academic self-concept for further study (listing multiple social identities).
Race and Ethnicity
“Today, to be sure, we know that the Negro is not biologically or mentally inferior; there
is no truth in those rumors of his body or his incorrigible sexuality; or no more truth than
can be easily explained or even defended by the social sciences. Yet, in our most recent
war, his blood was segregated as was, for the most part, his person. Up to today we are
set at a division, so that he may not marry our daughters or our sisters, nor may he – for
the most part – eat at our table or live in our houses. Moreover, those who do, do so at the
grave expense of a double alienation: from their own people, whose fabled attributes they
must either deny or, worse, cheapen and bring to market; from us, for we require of them,
when we accept them, that they at once cease to be Negroes and yet not fail to remember
what being a Negro means – to remember, that is, what is means to us” (Baldwin &
Morrison, 1998, pp. 20-21).
The passage is from James Baldwin’s essay entitled Many Thousands Gone, published in
1955, which pointedly discusses the history and oppression of African Americans in the United
States. Since slavery, African Americans have been treated as an inferior race, and as such,
Americans are often socialized to believe negative stereotypes about African American people
and their contributions to America. No other concept has caused so much division than race in

158
America. It is because of those deeply-rooted feelings and misconceptions about African
Americans that they have experienced, currently experience, and will continue to experience
violence, racism, discriminatory practices, impostor syndrome, stereotype threat in learning
spaces, and other negative consequences tied to their racial identity. Of greatest interest to this
study and findings is Baldwin’s declaration about identity negotiation in the African American
community. Baldwin discusses the challenges of belonging in a society that appropriates African
American culture yet abhors African American people. Additionally, he speaks to the task of
managing a dual existence (living in Black America and White America simultaneously).
Specific to this study’s findings, the challenges may compound experiences with stereotype
threat among African American student-athletes who are attempting to negotiate roles as an
African American, student, athlete (specifically a Division I athlete) at American colleges and
universities.
The hypothesis that, based on previous literature about the impact of racial discrimination
on academic achievement among African American student-athletes (Carter-Francique, Hart, &
Cheeks, 2015), African American student-athletes would yield significantly lower scores on the
academic task than Caucasian student-athletes was supported. Caucasian student-athletes
performed significantly better than African American student-athletes on total items correct,
math items correct, and difficult items correct. Additionally, Caucasian and Hispanic students
performed significantly better than African American students on difficult math items correct. It
is relevant to remember that although there were differences between race/ethnicity groups on
the academic task in this study, there were no differences in reported GPA between the groups,
suggesting that African American students found the testing situation, even without an explicit
threat about athletes, a more stressful situation, quite possibly because of the racial stereotype

159
threat that is “in the air” (Steele, 1997). Importantly, the hypothesis that student-athletes in the
mitigation condition would yield significantly higher scores on the academic tasks than students
in the threat condition was supported only for African Americans in the area of difficult
mathematics. African American student-athletes yielded significantly poorer scores than
Caucasian student-athletes on difficult math items in the control condition. Additionally, African
American student-athletes yielded significantly poorer scores than both Caucasian and Hispanic
student-athletes on difficult math items in the threat condition. However, African American
student-athletes in the mitigation condition scored significantly better than African American
student-athletes in the threat condition and equally to other groups in the mitigation condition.
There was no significant difference in academic performance between African American
student-athletes in the control condition and African American student-athletes in the threat
condition. There was a marginally significant difference between African American student-
athletes in the control condition and African American student-athletes in the mitigation
condition.
The findings suggest that, possibly, there was a “threat in the air” (Steele, 1997) for
African American student-athletes in the control condition which may suggest that even without
an explicit prime, African American student-athletes were impacted by stereotype threat. Then,
the threat was compounded in the threat condition (not significantly so), yet the mitigation was
effective in increasing their performance. The explicit prime about the academic ability of
student-athletes could have differentially affected the African American student-athletes in the
threat condition, but African American student-athletes benefitted from the mitigation strategy
on difficult math items and achieved performance equal to their peers.
In general, these findings support recent research about student-athletes and math

160
performance when faced with stereotype threat. As mentioned earlier and worth reiterating,
Riciputi and Erdal (2017) found that when student-athletes were primed with their athletic
identity, they received lower math scores than student-athletes who were not primed. Also, and
specific to math performance by students of color, Betty and Leyva (2016) describe mathematics
as a racialized space. The researchers posit that current mathematics environments perpetuate
internalized deficit beliefs among students of color. In the present study, African American
student-athletes in all conditions, but especially in the threat and mitigation conditions, could
have been impacted by both explicit and implicit threats to their intellectual ability compounded
not only by their identity as African American, student, and athlete, but also their math identity.
Racial and ethnic identity is further implicated in the findings of positive relationships between
academic self-concept and test performance only for Caucasian and Hispanic participants in the
mitigation condition. The findings suggest that how Caucasian and Hispanic students felt about
their academic selves impacted performance in a manner that it did not for African American
students in the mitigation condition, even though there were no significant differences between
the groups’ ASCS-SF scores.
What explains African Americans’ performance on difficult math items? The African
American participants in this study did not differ from other participants in GPA or academic
self-concept, but only in the mitigation condition were they able to score equally with the other
groups on difficult math items. For African Americans only, listing valued identities in the
mitigation task predicted performance on difficult math items. The theme in this study’s
findings persists, suggesting that future mitigation strategies should consider variations of
techniques based on identity groups.
Strengths, Limitations, and Implications
161
Strengths. The current study built on previous literature and expanded it to student-
athletes’ academic performance under stereotype threat. It tested a potential mitigation strategy
and points toward formulation of robust mitigation strategies specific to this group, particularly
African American student-athletes. Many evidence-based strategies exist to help resist stereotype
threat in the learning environment, but none cater to the collegiate athlete, a unique and
seemingly paradoxical community at colleges and universities. Another strength of the study is
the intentional anti-deficit framework serving as the foundation of the experiment – a framework
that hopes to uplift the student-athlete community as well as encourage practitioners to
acknowledge issues in the athletic community and address them from a strengths-based and
success-based approach. Further strengths are present in the experimental design and measures
used in the study.
The study addressed limitations raised by Gresky and her colleagues in their study; they
did not include a ‘no threat control condition.’ Without the comparison group they could not
make a claim that the explicit stereotype threat they used led to reduced performance among
their participants. The current study included a no-threat, no-mitigation control group. Also, the
current study included students from both female and male sports teams since prior research has
produced differing outcomes about gender identity as a moderator of the relationship between
stereotype threat and academic performance. The current study found no evidence that gender
identity was a main effect or a moderator.
Last, the study emphasized the role of academic self-concept on academic performance,
and self-concept maps as a potential identity development tool for student-athletes and possibly
all college students. The study also suggests further exploration of self-concept maps in the
collegiate classroom environment. This identity development exercise is a low cost, high stakes
162
option that could improve academic self-concept and achievement among marginalized groups.
Limitations. The study limitations include sample profile and sample size. Trends in
hypothesized directions observed in the current results may prove to be significant in a study
with a larger sample. There was a slight imbalance of race/ethnicity and larger imbalance of
gender identity in the present study that was not representative of Division I student-athletes
nationally. The NCAA (2018) reported that the Division I student-athlete body consists of 47%
females and 53% males; and 57% Caucasian and 43% student-athletes of color. The current
study yielded 61% females and 39% males, and 63% Caucasian student-athletes and 37%
student-athletes of color. Additionally, in this study, there was a small number of students from
revenue sports (N = 8) compared to students from non-revenue sports (N = 62). These are the
students who may be most affected by stereotype threat because their high visibility may place
them at greater risk of being stereotyped (Simons, Bosworth, Fujita, & Jensen, 2007). The low
diversity in the sample could jeopardize generalizability. Last, the study did not include a
measure of athletic identity, which could have provided further insight on additional moderators
that influence student-athlete stereotype threat.
Implications. The current study does not hypothesize that experiences with stereotype
threat can dissipate through one exercise, yet the premise is that the exploration of multiple
social identities over time could serve as a positive strategy for identity development, meaningful
identity activation, and identity appreciation. Griffin (2017), in her qualitative study on African
American male collegiate football players, shared a quote from one of the study participants who
stated: “I love playing football. I hate being a football player.” This sentiment highlights athletic
identity conflict and the balancing act that must be performed daily by student-athletes. The
study offers an opportunity for the higher education community to dismantle this dichotomous
163
thinking (e.g., only student or athlete) and address challenges that may arise using approaches
that acknowledge the full range of social identities that students possess. Specifically, results
from this study help 1) identify potential stereotype threat mitigation strategies for student-
athletes, 2) extend our understanding of the influence of academic self-concept and race/ethnicity
on academic performance, and 3) explore potential moderators, particularly race/ethnicity, in the
relationship between stereotype threat mitigation and academic performance among student-
athletes.
A practical application of this study’s findings could include incorporating identity
exploration activities in NCAA Life Skills programs. Also, coaches could encourage activities
beyond the athletic facilities. Academic advisors could join in this effort with the coaches and
implement an internal competition between teams to promote involvement in extracurricular
activities outside of their sport. Specifically, greater attention could be placed on student-athletes
of color. As Barack Obama stated in his discussion about his My Brother’s Keeper initiative,
students of color do not suffer from an achievement gap, rather an opportunity gap. There is a
need for culturally-aware student-athlete development support staff to create, implement, and
revise culturally-specific academic programming. The goal of these proposed ideas is to allow
student-athletes to explore and develop multiple social identities.
Future Directions
The study focused on building a model for mitigating stereotype threat among Division I
student-athletes. The findings of the study suggest that mitigation strategies may be most
effective if they are culturally specific and specific to a certain task. First, future studies could
explore the mitigation strategy among affinity groups separately, for example, African American
students, females, international students, and students who receive athletic scholarships. The

164
current mitigation strategy may help buffer stereotype threat to some degree, but it seems
beneficial to tailor the mitigation strategy to meet the needs of a specific population. To reach
that goal, the literature on student-athlete stereotype threat could benefit from a qualitative
investigation of student-athletes’ perceptions of stereotype threat and their opinions on how to
combat it. The student voice could be critical in establishing robust identity development
exercises and subsequent mitigation strategies.
Second, further investigation should be conducted on the impact of specific mapping
components to provide a possible rationale for how these areas functioned as stereotype threat
deterrents on test performance. Also, a mixed-method study focused on exploring the differences
between the ethnic groups and the identities they include on their maps could contribute to future
understanding.
Last, in future studies it would be beneficial to explore the use of an implicit priming
technique instead of the explicit priming technique. The inclusion of more students from revenue
sports could also strengthen the findings. A comparison between Division I, III, and III student-
athletes would provide insight on the differences of stereotype threat experiences and the
potential mitigation strategy across athletic divisions; and a similar comparison between revenue
and nonrevenue sports participants. Additionally, future research could further explore academic
self-concept and explore athletic identity as moderators for the relationship between stereotype
threat mitigation strategies and academic performance among student-athletes. To end, future
research could explore the extent to which the current study and findings apply to student-
athletes of all levels (youth sport, high school, professional).
Conclusion
The student-athlete experience can consist of academic achievements, immediate and
165
strong support systems, lifelong community, and holistic personal and professional development;
if it is intentionally designed to do so. The design should include a focus on social factors and
psychological factors that lead to success. The current study focused on a socio-psychological
factor, stereotype threat, that could hinder the variety of benefits inherent to the Divison I athletic
experience. This study provides a glimpse into the impact that engaging student-athletes in
activities that allow them to explore their interests, and understand their worth beyond the
classroom or sports complex, may have on overall development. Specifically, identity
development activities may significantly benefit students of color who may deal with
compounded stereotypes as a contingency of their race/ethnicity and student status (e.g., student-
athlete) in learning environments. For example, this study’s findings showed that African
American student-athletes outperformed other African American student-athletes on difficult
math items when they participated in an identity development exercise in which the latter group
did not. Further exploration provided some indication that reflecting on valued identities
enhanced academic performance among African American student-athletes.
The ‘dumb jock’ stereotype is pervasive, unfair, harsh, and unnecessary. It does not
celebrate the multiple social identities held by student-athletes. These bright, capable, and
hopeful students are not your student-athlete; they are learners, brothers, aunts, cousins,
musicians, and future doctors. With the proper resources, they can become change agents in a
world in desperate need of leaders.

166
References
Adler, P., & Adler, P. A. (1987). Role conflict and identity salience: College athletics and the
academic role. The Social Science Journal, 24(4), 443–455. https://doi.org/10.1016/0362-
3319(87)90059-0
Alfayoumi, I. (2019). The impact of combining concept-based learning and concept-mapping
pedagogies on nursing students’ clinical reasoning abilities. Nurse Education Today, 72,
40–46. https://doi.org/10.1016/j.nedt.2018.10.009
Aşıksoy, G. (2019). Computer-based concept mapping as a method for enhancing the
effectiveness of concept learning in technology-enhanced learning. Sustainability, 11(4),
1005.
Baldwin, J., & Morrison, T. (1998). James Baldwin: Collected Essays: Notes of a Native
Son/Nobody Knows My Name/The Fire Next Time/No Name in the Street/The Devil Finds
Work/Other Essays. Edited by Toni Morrison. New York: Library of America.
Battey, D., & Leyva, L. A. (2016). A framework for understanding whiteness in mathematics
education. Journal of Urban Mathematics Education, 9(2).
Beamon, K. (2014). Racism and stereotyping on campus: Experiences of African American male
Student-athletes. The Journal of Negro Education, 83(2), 121.
Beasley, M., & Fischer, M. (2012). Why they leave: the impact of stereotype threat on the
attrition of women and minorities from science, math and engineering majors. Social
Psychology of Education, 15(4), 427.
Bloomberg. (2018). The NCAA Raked in Over $1 Billion Last Year. Retrieved February 14,
2019, from http://fortune.com/2018/03/07/ncaa-billion-dollars/
Brewer, B. W., Van Raalte, J., & Linder, D. E. (1993). Athletic identity: Hercules’ muscle or
167
Achilles’ heel? International Journal of Sport Psychology, 24, 237–254.
Brewer, B. W., & Petitpas, A. J. (2017). Athletic identity foreclosure. Current Opinion in
Psychology, 16, 118–122. https://doi.org/10.1016/j.copsyc.2017.05.004
Brown, R. P., & Josephs, R. A. (1999). A burden of proof: Stereotype relevance and gender
differences in Math performance. Journal of Personality & Social Psychology, 76(2),
246–257.
Carter-Francique, A., Hart, A., & Cheeks, G. (2015). Examining the value of social capital and
social support for Black student-athletes’ academic success. Journal of African American
Studies, 19(2), 157–177. https://doi.org/10.1007/s12111-015-9295-z
Case, R., Dey, T., Barry, A., & Rudolph, W. (2017). An examination of the nature and scope of
academic clustering in college athletic programs. Journal of Contemporary Athletics,
11(1), 47–57.
Chen, S., Snyder, S., & Magner, M. (2010). The effects of sport participation on student-athletes’
and non-athlete students’ social life and identity. Journal of Issues in Intercollegiate
Athletics, 176–193.
Citrus College Office of Institutional Research, Planning, and Effectiveness (2017). Accuracy of
self-reported high school GPA. Retrieved March 2, 2019, from
http://www.citruscollege.edu/admin/research/Documents/AB705/AccuracyGPA2017.pdf
Cokley, K., Awad, G., Smith, L., Jackson, S., Awosogba, O., Hurst, A., Stone, S., Blondeau, L.,
& Roberts, D. (2015). The roles of gender stigma consciousness, impostor phenomenon
and academic self-concept in the academic outcomes of women and men. Sex Roles,
73(9–10), 414–426. https://doi.org/10.1007/s11199-015-0516-7
CollegeBoard. (2018). Retrieved March 17, 2019, from
168
https://collegereadiness.collegeboard.org/sample-questions/writing/1
Comeaux, E. (2012). Unmasking athlete microaggressions: Division I student-athletes’
engagement with members of the campus community. Journal of Intercollegiate Sport,
5(2), 189–198
Cuellar, M. (2014). The impact of Hispanic-Serving Institutions (HSIs), Emerging HSIs, and
Non-HSIs on Latina/o academic self-Concept. The Review of Higher Education, 37(4),
499–530. https://doi.org/10.1353/rhe.2014.0032
Dee, T. S. (2014). Stereotype threat and the student-athlete. Economic Inquiry, 52(1), 173–182.
https://doi.org/10.1111/ecin.12006
DeFreitas, S. C., & Rinn, A. (2013). Academic achievement in first generation college students:
The role of academic self-concept. Journal of the Scholarship of Teaching & Learning,
13(1), 57–67.
Feltz, D. L., Schneider, R., Hwang, S., & Skogsberg, N. J. (2013). Predictors of collegiate
student- athletes’ susceptibility to stereotype threat. Journal of College Student
Development, 54(2), 184– 201. https://doi.org/10.1353/csd.2013.0014
FOX Sports. (2014). ‘Friday Night Tykes’ is the most depressing show on television. Retrieved
February 15, 2019, from https://www.foxsports.com/buzzer/story/friday-night-tykes-is-
the-most-depressing-show-on-television-011514
Fuller, R. D., Harrison, C. K., & Bukstein, S. J. (2017). A study of significance of racial and
athletic identification on educational perceptions among African American male college
athletes. Race Ethnicity and Education, 20(5), 711–722.
https://doi.org/10.1080/13613324.2016.1150829
169
Fuller, R. D., Harrison, C. K., & Bukstein, S. J. (2017). A study of significance of racial and
athletic identification on educational perceptions among African American male college
athletes. Race Ethnicity and Education, 20(5), 711–722.
https://doi.org/10.1080/13613324.2016.1150829
Gresky, D. M., Ten Eyck, L. L., Lord, C. G., & McIntyre, R. B. (2005). Effects of salient
multiple identities on women's performance under mathematics stereotype threat. Sex
Roles, 53(9-10), 703- 716.
Griffin, W. (2017). Who is Whistling Vivaldi? How Black football players engage with
stereotype threats in college. International Journal of Qualitative Studies in Education,
30(4), 354–369. https://doi.org/10.1080/09518398.2016.1250174
Harper, S. R. (2016). Black male student-athletes and racial inequities in NCAA Division I
college sports: 2016 edition. Philadelphia: University of Pennsylvania, Center for the
Study of Race & Equity in Education.
Harris, C. M., & Zha, S. (2017). Concept mapping for critical thinking: Efficacy, timing, & type.
Education, 137(3), 277–280.
Harrison, C. K., Stone, J., Shapiro, J., Yee, S., Boyd, J. A., & Rullan, V. (2009). The role of
gender identities and stereotype salience with the academic performance of male and
female college athletes. Journal of Sport and Social Issues, 33(1), 78-96.
Harrison, L. H, Bimper, A.Y., Smith, M. P., & Logan, A. D. (2017). The mis-education of the
African American student-athlete. Kinesiology Review, 6(1), 60–69.
Haslerig, S. J. (2017). Graduate(d) student athletes in Division I football: Redefining Archetypes
and disrupting stereotypes or invisible? Sociology of Sport Journal, 34(4), 329–343.
170
Ho, A. K., Sidanius, J., Cuddy, A. J. C., & Banaji, M. R. (2013). Status boundary enforcement
and the categorization of black–white biracials. Journal of Experimental Social
Psychology, 49(5), 940–943. https://doi.org/10.1016/j.jesp.2013.04.010
Ho, A. K., Kteily, N. S., & Chen, J. M. (2017). “You’re one of us”: Black Americans’ use of
hypodescent and its association with egalitarianism. Journal of Personality and Social
Psychology, 113(5), 753–768. https://doi.org/10.1037/pspi0000107
Hollinger, D. A. (2005). The one drop rule & the one hate rule. Daedalus, 134(1), 18–28.
https://doi.org/10.1162/0011526053124424
Hosick, M.B., & Durham, M. DI African-American student-athletes graduate at record rates.
Retrieved February 19, 2019, from http://www.ncaa.org/about/resources/media-
center/news/di-african-american-student-athletes-graduate-record-rates
Johnson, G. (2018). 2018 AASP Career Development Award recipients named. Retrieved
February 15, 2019, from http://www.ncaa.org/about/resources/media-center/news/2018-
aasp-career-development-award-recipients-named
Kray, L. J., Reb, J., Galinsky, A. D., & Thompson, L. (2004). Stereotype reactance at the
bargaining Table: The effect of stereotype activation and power on claiming and creating
value. Personality and Social Psychology Bulletin, 30(4), 399–411.
https://doi.org/10.1177/0146167203261884
Levine, J., Etchison, S., & Oppenheimer, D. (2014). Pluralistic ignorance among student-athlete
populations: a factor in academic underperformance. Higher Education, 68(4), 525–540.
https://doi.org/10.1007/s10734-014-9726-0
Lu, L. D., Heinze, K. L., & Soderstrom, S. (2018). Playing Multiple Positions: Student-Athlete
Identity Salience and Conflict. Journal of Intercollegiate Sport, 11(2), 214-241.

171
Lu, L. D., Heinze, K. L., & Soderstrom, S. (2018). Playing multiple positions: Student-athlete
identity salience and conflict. Journal of Intercollegiate Sport, 11(2), 214–241.
Mandell, N. (2014). ‘Friday Night Tykes’ provides a terrifying look into the world of extreme
youth football in Texas. Retrieved on February 15, 2019, from
https://ftw.usatoday.com/2014/01/friday-night-tykes-youth-football-texas
Marcia, J. E. (1966). Development and validation of egoidentity status. Journal of Personality &
Social Psychology, 3, 551–558.
Marsh, H. W., & Martin, A. J. (2011). Academic self-concept and academic achievement:
relations and causal ordering. The British Journal of Educational Psychology, 81(1), 59–
77. https://doi.org/10.1348/000709910X503501
Mosley, B. F., & Draper, S. R. (2014). Concept Mapping: A tool to support learning. National
Teacher Education Journal, 7(2), 27–30.
MSU Today. (2013). Fighting the ‘Dumb Jock’ Stereotype. Retrieved February 14, 2019, from
https://msutoday.msu.edu/news/2013/fighting-the-dumb-jock-stereotype/
NCAA. (2014). Benefits to college student-athletes. Retrieved July 30, 2017, from
http://www.ncaa.org/student-athletes/benefits-college-student-athletes
NCAA. (2017). After the game career center. Retrieved February 13, 2018, from
http://www.ncaa.org/student-athletes/former-student-athlete/careers
NCAA (2018). NCAA Demographics Database. Retrieved March 21, 2019, from
http://www.ncaa.org/about/resources/research/ncaa-demographics-database
NCAA. (2019a). Office of President: On the Mark. Retrieved February 12, 2019, from
http://www.ncaa.org/about/who-we-are/office-president/office-president-mark
NCAA. (2019b). Life Skills. Retrieved on February 12, 2019, from
172
http://www.ncaa.org/about/resources/leadership-development/life-skills
NCAA. (2019c). Academic Progress Rate Timeline. Retrieved on February 13, from
http://www.ncaa.org/about/resources/research/academic-progress-rate-timeline
NCAA. (2019d). Academic Based Revenue Distribution. Retrieved on February 12, from
http://www.ncaa.org/academic-based-revenue-distribution
Norman, J. (2018). Football Still Americans’ Favorite Sport to Watch. Retrieved February 12,
2019, from https://news.gallup.com/poll/224864/football-americans-favorite-sport-
watch.aspx
Otterson, J. (2018). NCAA Championship Game Viewership Drops 28% From 2017. Retrieved
February 14, 2019, from https://variety.com/2018/tv/news/2018-ncaa-championship-
game-ratings-1202742895/
PricewaterhouseCoopers. (2018). Outlook for the sports market in North America through 2022.
Retrieved February 12, 2019, from
https://www.pwc.com/us/en/industries/tmt/library/sports-outlook-north-america.html
Raufelder, D., & Ringeisen, T. (2016). Self-perceived competence and test anxiety: The role of
academic self-concept and self-efficacy. Journal of Individual Differences, 37(3), 159–
167. https://doi.org/10.1027/1614-0001/a000202
Reynolds, W. M. (1988). Measurement of academic self-concept in college students. Journal of
Personality Assessment, 52(2), 223–240. https://doi.org/10.1207/s15327752jpa5202_4
Riciputi, S., & Erdal, K. (2017). The effect of stereotype threat on student-athlete math
performance. Psychology of Sport and Exercise, 32, 54–57.
https://doi.org/10.1016/j.psychsport.2017.06.003
173
Roberts, R., & Johnson, P. (2015). Understanding the quality of data: a concept map for ‘the
thinking behind the doing’ in scientific practice. Curriculum Journal, 26(3), 345–369.
https://doi.org/10.1080/09585176.2015.1044459
Robinson, K. A., Perez, T., Carmel, J. H., & Linnenbrink-Garcia, L. (2019). Science identity
development trajectories in a gateway college chemistry course: Predictors and relations
to achievement and STEM pursuit. Contemporary Educational Psychology, 56, 180–192.
https://doi.org/10.1016/j.cedpsych.2019.01.004
Roccas, S., & Brewer, M. B. (2002). Social Identity Complexity. Personality & Social
Psychology Review, 6(2), 88–106. https://doi.org/10.1207/S15327957PSPR0602_01
Schroeder, N. L., Nesbit, J. C., Anguiano, C. J., & Adesope, O. O. (2018). Studying and
constructing concept maps: A meta-analysis. Educational Psychology Review, 30(2),
431–455. https://doi.org/10.1007/s10648-017-9403-9
Seifert, K. (2014). Inside Slants: ‘Friday Night Tykes’ fallout. Retrieved on February 15, 2019,
from http://www.espn.com/blog/nflnation/post/_/id/113458/inside-slant-on-friday-night-
tykes
Shavelson, R. J., Hubner, J. J., & Stanton, G. C. (1976). Self-Concept: Validation of Construct
Interpretations. Review of Educational Research, 46(3), 407–441.
https://doi.org/10.2307/1170010
Simon, E. L. (2011). Psychology of Stereotypes. New York: Nova Science Publishers, Inc
Simons, H., Bosworth, C., Fujita, S., & Jensen, M. (2007). The athlete stigma in higher
education. College Student Journal, 41(2), 251-273.
Spencer, J., Steele, C., & Quinn, D. (1999). Stereotype threat and women’s math performance.
Journal of Experimental Social Psychology, 35(4):4–28

174
Steele, C. M. (1997). A threat in the air: How stereotypes shape intellectual identity and
performance. American Psychologist, 52(6), 613–629. https://doi.org/10.1037/0003-
066X.52.6.613
Steele, C. M., & Aronson, J. (1995). Stereotype threat and the intellectual test performance of
African Americans. Journal of Personality and Social Psychology, 69(5), 797–811.
https://doi.org/10.1037/0022-3514.69.5.797
Stelter, B. (2019). Super Bowl ratings still super, but drop for Rams-Patriots snoozer. Retrieved
February 12, 2019, from https://www.cnn.com/2019/02/04/media/super-bowl-
ratings/index.html
Stevens, C., Liu, C. H., & Chen, J. A. (2018). Racial/ethnic disparities in US college students’
experience: Discrimination as an impediment to academic performance. Journal of
American College Health, 66(7), 665–673.
https://doi.org/10.1080/07448481.2018.1452745
Stone, J., Harrison C.K., & Mottley, J. (2012). Don’t call me a student-athlete: The effect of
identity priming on stereotype threat for academically engaged African American college
athletes. Basic & Applied Social Psychology, 34(2), 99–106.
Sturgiss, E., Luig, T., Campbell-Scherer, D. L., Green, L. A., & Lewanczuk, R. (2019). Using
concept maps to compare obesity knowledge between policy makers and primary care
researchers in Canada. BMC Research Notes, 12(1), N.PAG-N.PAG.
https://doi.org/10.1186/s13104-018-4042-x
Susperreguy, M. I., Davis‐Kean, P. E., Duckworth, K., & Chen, M. (2018). Self-concept predicts
academic achievement across levels of the achievement distribution: Domain specificity
175
for math and reading. Child Development, 89(6), 2196–2214.
https://doi.org/10.1111/cdev.12924
USA Today. (2019). Clemson blowout draws lowest TV ratings for CFP title game. Retrieved
February 14, 2019, from
https://www.usatoday.com/story/sports/ncaaf/2019/01/08/clemson-blowout-draws-
lowest-tv-ratings-for-cfp-title-game/38863005/
Van Soom, C., & Donche, V. (2014). Profiling first-year students in STEM programs based on
autonomous motivation and academic self-concept and relationship with academic
achievement. PLoS ONE, 9(11).
Wang, C. W., & Neihart, M. (2015). Academic self-concept and academic self-Efficacy: Self-
beliefs enable academic achievement of twice-exceptional students. Roeper Review,
37(2), 63–73. https://doi.org/10.1080/02783193.2015.1008660
Williams, W. S., & Chung, Y. B. (2013). Do cultural attitudes matter? The role of cultural
orientation on academic self-concept among Black/African College students. Journal of
College Counseling, 16(3), 228–242. https://doi.org/10.1002/j.2161-1882.2013.00039.x
Wininger, S., & White, T. (2008). The dumb jock stereotype: To what extent do student-athletes
feel the stereotype? Journal for the Study of Sports and Athletes in Education, 2, 227–
237.
Woods, A. D., McNiff, J., & Coleman, L. (2018). A comparative analysis: Assessing student
engagement on African-American male student-athletes at NCAA divisional and NAIA
institutions. Education, 138(4), 356–368.
Yopyk, D. J. A., & Prentice, D. A. (2005). Am I an athlete or a student? Identity salience and
stereotype threat in student–athletes. Basic & Applied Social Psychology, 27(4), 329–336.

176
https://doi.org/10.1207/s15324834basp2704_5
Zezima, K. (2014.). How Teddy Roosevelt helped save football. Retrieved February 15, 2019,
from https://www.washingtonpost.com/news/the-fix/wp/2014/05/29/teddy-roosevelt-
helped-save-football-with-a-white-house-meeting-in-1905/

177
APPENDICES
Appendix A
Consent Form
Georgia State University
Informed Consent
Title: Exploring the Experiences of Students Participating in Extracurricular Activities on
College Campuses
Principal Investigator: Ann Kruger, Ph.D.
Student Principal Investigator: Jacob English, M.S.
Purpose
The purpose of the study is to explore the experiences of students participating in extracurricular
activities on college campuses. You are invited to take part in this research study because you are
a student-athlete enrolled at Georgia State University for the fall 2018 semester and participating
on an NCAA-sponsored sports team. Approximately 389 participants will be recruited for this
study. Participation will require you to complete one 10-15-minute survey online about academic
self-concept and participate in one experimental 1-hour workshop which consists of a survey and
some cognitive tasks.
Procedures
If you decide to take part, you will be asked to complete two related activities. The first activity
is one 10-15-minute online survey exploring academic self-concept. The survey will be followed
by a 1-hour workshop on the campus of Georgia State University during this semester. During
the workshop, you will be asked to engage in a mapping activity and take an academic test. We
will not tell you everything about the study in advance. When the study is over, we will tell you
everything. At that time, you can choose whether you want to allow us to use the
information/responses you have provided.
You will interact with the Student Principal Investigator and a student research assistant
throughout the length of the experiment. The following procedures are experimental:
mapping activity; and academic evaluation.
Future Research
Researchers will remove information that may identify you and may use your data for future
research. If we do this, we will not ask for any additional consent for you.
Risks
178
In this study, you will not have any more risks than you would in a normal day of life.
Benefits
This study is not designed to benefit you personally. Overall, we hope to gain information about
the experiences of college students who participate in extracurricular activities.
Compensation
You will receive a $40 Amazon gift card for participating in this study, which will be distributed
at the end of the 1-hour workshop.
Alternatives
The alternative to taking part in this study is to not take part in the study.
Voluntary Participation and Withdrawal
You do not have to be in this study. If you decide to be in the study and change your mind, you
have the right to drop out at any time. You may skip questions or stop participating at any time.
You may refuse to take part in the study or stop at any time; this will not cause you to lose any
benefits to which you are otherwise entitled.
Confidentiality
We will keep your records private to the extent allowed by law. The following people and
entities will have access to the information you provide:
• Principal Investigator: Ann Kruger, Ph.D.
• Student Principal Investigator: Jacob English, M.S.
• GSU Institutional Review Board
• Office for Human Research Protection (OHRP)
Names and email addresses will be collected at the time of consent. However, that identifiable
information will be stored separately from all other subject data. We will use a study number
rather than your name on study records. A code linking name to a study identification will be
stored separately in a third secure location. The survey information will be stored in Qualtrics
and will only be accessed by Dr. Ann Kruger and Jacob English using a password. Researchers
with access to nonidentifiable data will not have access to the identifiable data. Analyzed data
will be stored on a firewall-protected, password-secured, encrypted computer in the office of Mr.
Jacob English. Your name and other facts that might point to you will not appear when we
present this study or publish its results. The findings will be summarized and reported in group
form. You will not be identified personally. At the conclusion of the study, all identifiable data
will be destroyed.
Contact Information
Contact Dr. Ann Kruger by phone at 404-413-8040 or by email at [email protected]; or Mr.
179
Jacob English by phone at 404-413-5907 or by email at [email protected]:
• if you have questions about the study or your part in it
• if you have questions, concerns, or complaints about the study
Contact the GSU Office of Human Research Protections at 404-413-3500 or [email protected]:
• if you have questions about your rights as a research participant
• if you have questions, concerns, or complaints about the research
Consent
Upon request, we will give you a copy of this consent form to keep. You can print out a copy of
this consent form to keep.
If you are willing to volunteer for this research, please indicate below by pressing the “Agree”
button.
___________________________________________
Printed Name of Participant
____________________________________________ _________________
Signature of Participant Date
_____________________________________________ _________________
Principal Investigator or Researcher Obtaining Consent Date

180
Appendix B
Phase 1: Pre-Experiment Recruitment Email
Subject: Study Invitation for Student-Athletes (Part 1 of 2)
Hello [Student Name]:
You are invited to participate in a research study exploring the experiences of students
participating in extracurricular activities on college campuses. You have been selected because
you are enrolled at [University] during the fall 2018 semester and participating on a NCAA-
sponsored sports team. Your participation in this study will require you to complete a 10-15-
minute survey online about academic self-concept and attend a 1-hour workshop on campus
which includes a brief survey and some cognitive tasks. You will receive a $40 Amazon gift card
at the conclusion of the workshop to demonstrate respect and appreciation for your time and
effort to complete the study.
• Location of Study: Classroom on campus
• Timing of Study: Early-Mid January (based on your availability)
If you wish to participate, please click on the link below. This link will direct you to a consent
form. After carefully reading the consent form you will have the opportunity to click on “Agree.”
By clicking “Agree” you are providing your consent to participate in the study and will be
directed to the survey questions.
Results from this study will provide valuable information to inform students, instructors,
colleges, and universities as programs are developed. We will keep the information you provide
and your identity private.
Your participation in this study is absolutely voluntary. Please contact me directly at
[email protected] for more detailed information. Thank you.
[Survey link]
Best,
Jacob English, M.S.
Student Principal Investigator
Department of Learning Sciences
College of Education and Human Development

181
Appendix C
Phase 2: Experiment Recruitment Email
Subject: Study Invitation for Student-Athletes (Part 2 of 2)
Hello [Student Name]:
Thank you for agreeing to participate in the study exploring the experiences of students
participating in extracurricular activities on college campuses. You will receive a $40 Amazon
gift card for participating in this study, which will be distributed at the end of the 1-hour
workshop. Below is the information that you need to participate in the second part of the study.
Please use the link below to select a time to participate in the study.
• Location: Classroom on campus
• Duration: 1 hour
[Sign Up Link]
I will send you a confirmation email, once your registration is complete.
Once you arrive at the <location>, you will be greeted by a research assistant and given a
number that you will use throughout the study instead of using your name on study
documentation. This is to protect your privacy.
As a reminder, results from this study will provide valuable information to inform students,
instructors, colleges, and universities as programs are developed.
If you have any questions before the day of the experiment, please contact me directly at
[email protected] for more information. Thank you.
Best,
Jacob English, M.S.
Student Principal Investigator
Department of Learning Sciences
College of Education and Human Development
182
Appendix D
Academic Self-Concept Scale Short Form (Reynolds, 1988, 2010)
For information on obtaining a copy of the Academic Self-Concept Scale Short Form (ASCS-
SF), contact: William Reynolds,
Professor Emeritus of Psychology
Humboldt State University
BSS 527 Arcata, California 95521
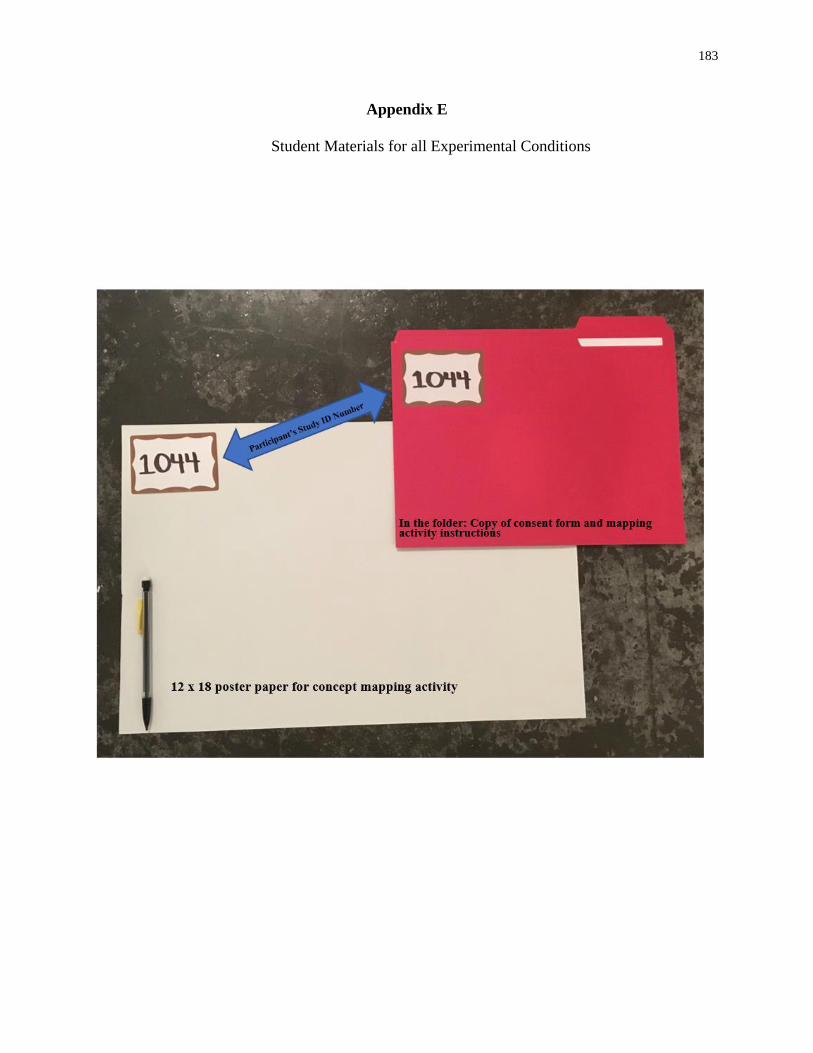
183
Appendix E
Student Materials for all Experimental Conditions
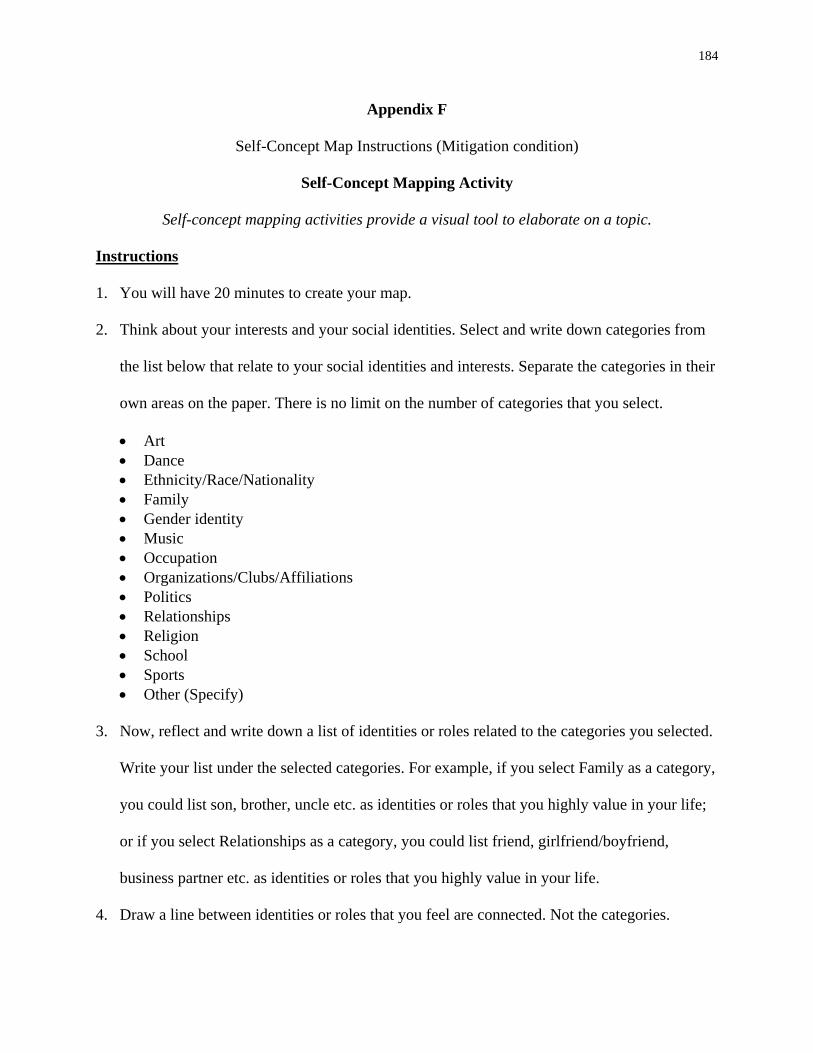
184
Appendix F
Self-Concept Map Instructions (Mitigation condition)
Self-Concept Mapping Activity
Self-concept mapping activities provide a visual tool to elaborate on a topic.
Instructions
1. You will have 20 minutes to create your map.
2. Think about your interests and your social identities. Select and write down categories from
the list below that relate to your social identities and interests. Separate the categories in their
own areas on the paper. There is no limit on the number of categories that you select.
• Art
• Dance
• Ethnicity/Race/Nationality
• Family
• Gender identity
• Music
• Occupation
• Organizations/Clubs/Affiliations
• Politics
• Relationships
• Religion
• School
• Sports
• Other (Specify)
3. Now, reflect and write down a list of identities or roles related to the categories you selected.
Write your list under the selected categories. For example, if you select Family as a category,
you could list son, brother, uncle etc. as identities or roles that you highly value in your life;
or if you select Relationships as a category, you could list friend, girlfriend/boyfriend,
business partner etc. as identities or roles that you highly value in your life.
4. Draw a line between identities or roles that you feel are connected. Not the categories.

185
5. Place a star next to the identities that are most significant to your overall identity.
6. Please write “Me” at the center of your map.

186
Appendix G
Alternate Map Instructions (Food Map: Threat and Control conditions)
Mapping Activity
Mapping activities provide a visual tool to elaborate on a topic.
Instructions
1. You will have 20 minutes to create your map.
2. Think about your favorite and most visited places to eat. Select and write down categories
from the list below related to those places. Separate the categories in their own areas on the
paper. There is no limit on the number of categories that you select.
• Coffee Shop • Delivery
• Diner
• Family member’s house
• Fast Food
• Grocery Store
• Health Food Store
• Restaurant
• Other (Specify)
3. Now, write down a list of items that you recently purchased or ate. Write your list under the
selected categories.
4. Write down the best day and time to visit the locations you listed.
5. Place a star next to your favorite food items.
6. Please write “Food” at the center of your map.
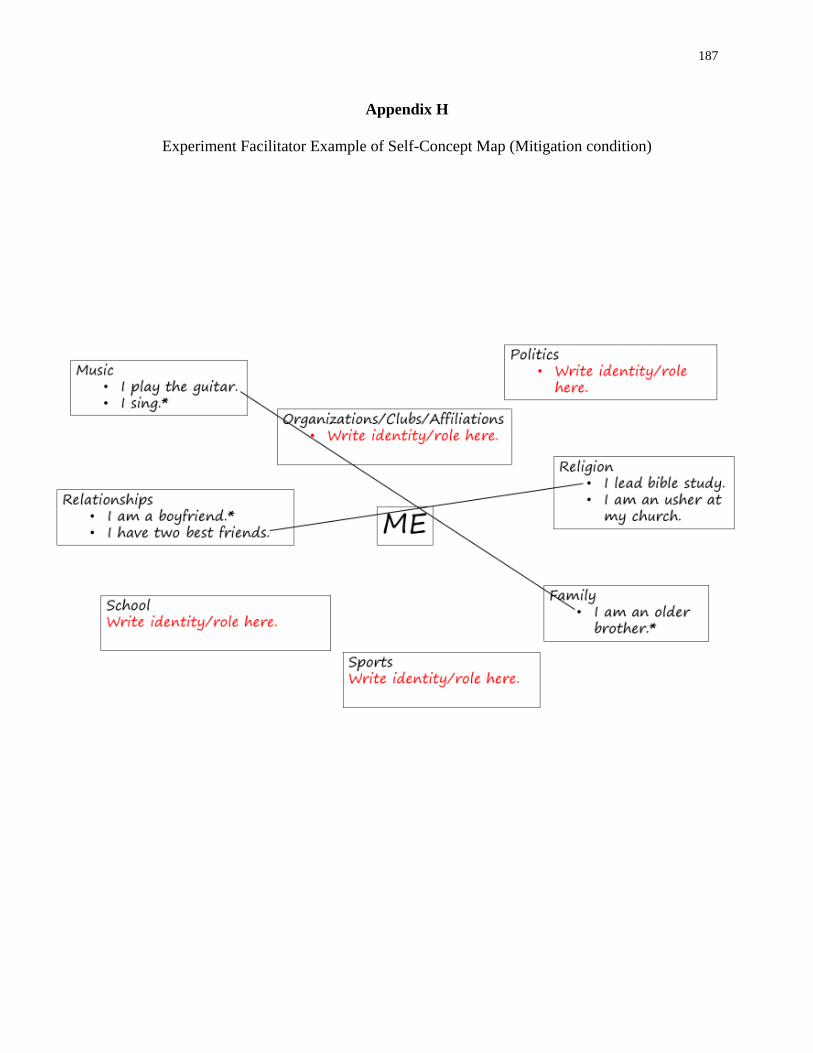
187
Appendix H
Experiment Facilitator Example of Self-Concept Map (Mitigation condition)
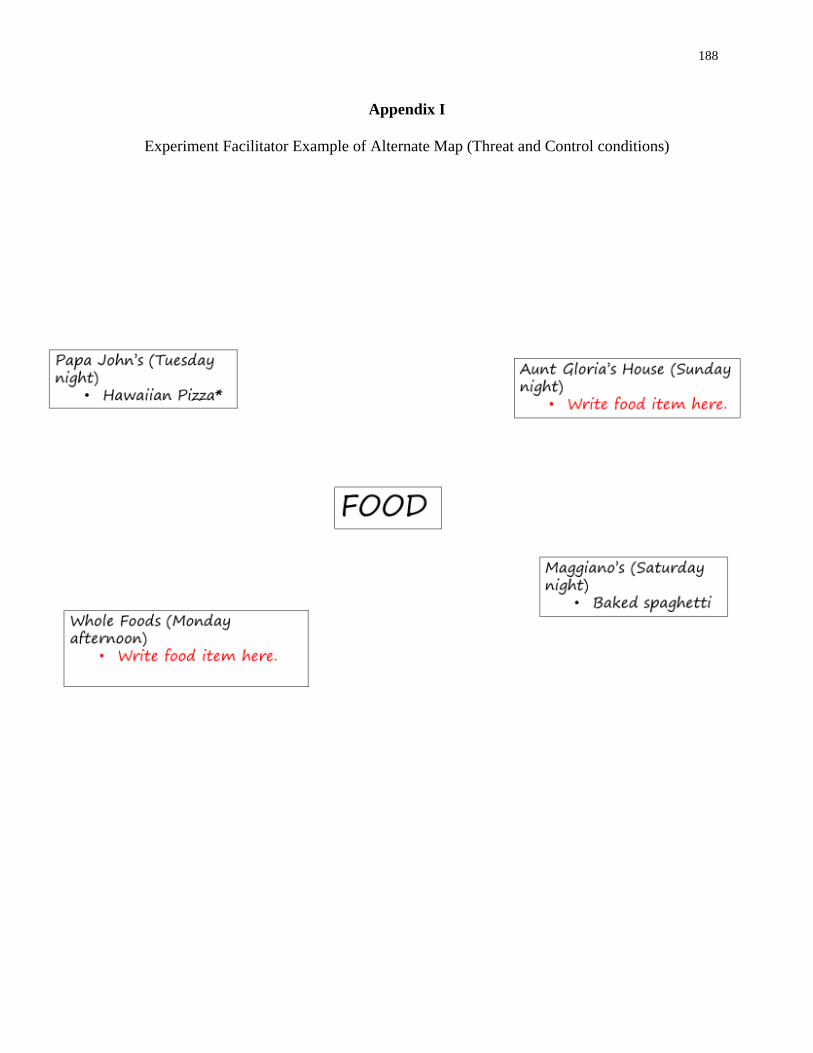
188
Appendix I
Experiment Facilitator Example of Alternate Map (Threat and Control conditions)
189
Appendix J
SAT-style Academic Examination
Academic Examination
THIS TEST BOOK MUST NOT BE TAKEN FROM THE ROOM. UNAUTHORIZED
REPORDUCTION OR USE OF ANY PART OF THIS TEST BOOK IS PROHIBITED

190
Writing and Language Section
Instructions
The passage below is accompanied by a number of questions. For some questions, you will consider
how the passage might be revised to improve the expression of ideas. For other questions, you will
consider how the passage might be edited to correct errors in sentence structure, usage, or punctuation.
A passage or a question may be accompanied by one or more graphics (such as a table or graph) that
you will consider as you make revising and editing decisions.
After reading the passage, choose the answer to each question that most effectively improves the
quality of writing in the passage or that makes the passage conform to the conventions of standard
written English. Many questions include a “NO CHANGE” option. Choose that option if you think the
best choice is to leave the relevant portion of the passage as it is.
Each question will direct you to an underlined portion of a passage. A pair of brackets containing an
uppercase Q and a number — for example, [Q1] — indicates that a question refers to that location in
the passage or the following underlined portion of the passage.

191
A Life in Traffic
A subway system is expanded to provide service to a growing suburb. A bike-sharing program is
adopted to encourage nonmotorized transportation. [Q1] To alleviate rush hour traffic jams in a
congested downtown area, stoplight timing is coordinated. When any one of these changes
[Q2] occur, it is likely the result of careful analysis conducted by transportation planners.
The work of transportation planners generally includes evaluating current transportation needs,
assessing the effectiveness of existing facilities, and improving those facilities or [Q3] they
design new ones. Most transportation planners work in or near cities, [Q4] but some are
employed in rural areas. Say, for example, a large factory is built on the outskirts of a small
town. Traffic to and from that location would increase at the beginning and end of work shifts.
The transportation [Q5] planner’s job,might involve conducting a traffic count to determine the
daily number of vehicles traveling on the road to the new factory. If analysis of the traffic count
indicates that there is more traffic than the [Q6] current road as it is designed at this time can
efficiently accommodate, the transportation planner might recommend widening the road to add
another lane.
Transportation planners work closely with a number of community stakeholders, such as
government officials and other interested organizations and individuals.
[Q7] Next, representatives from the local public health department might provide input in
designing a network of trails and sidewalks to encourage people to walk more. [Q8] According
to the American Heart Association, walking provides numerous benefits related to health and
well-being. Members of the Chamber of Commerce might share suggestions about designing
transportation and parking facilities to support local businesses.
[Q9] People who pursue careers in transportation planning have a wide variety of educational
backgrounds. A two-year degree in transportation technology may be sufficient for some entry-
level jobs in the field. Most jobs, however, require at least a bachelor’s degree; majors of
transportation planners are [Q10] varied, including fields such as urban studies, civil
engineering, geography, or transportation and logistics management. For many positions in the
field, a master’s degree is required.
Transportation planners perform critical work within the broader field of urban and regional
planning. As of 2010, there were approximately 40,300 urban and regional planners employed in
the United States. The United States Bureau of Labor Statistics forecasts steady job growth in
this field, [Q11] projecting that 16 percent of new jobs in all occupations will be related to urban
and regional planning. Population growth and concerns about environmental sustainability are
expected to spur the need for transportation planning professionals.
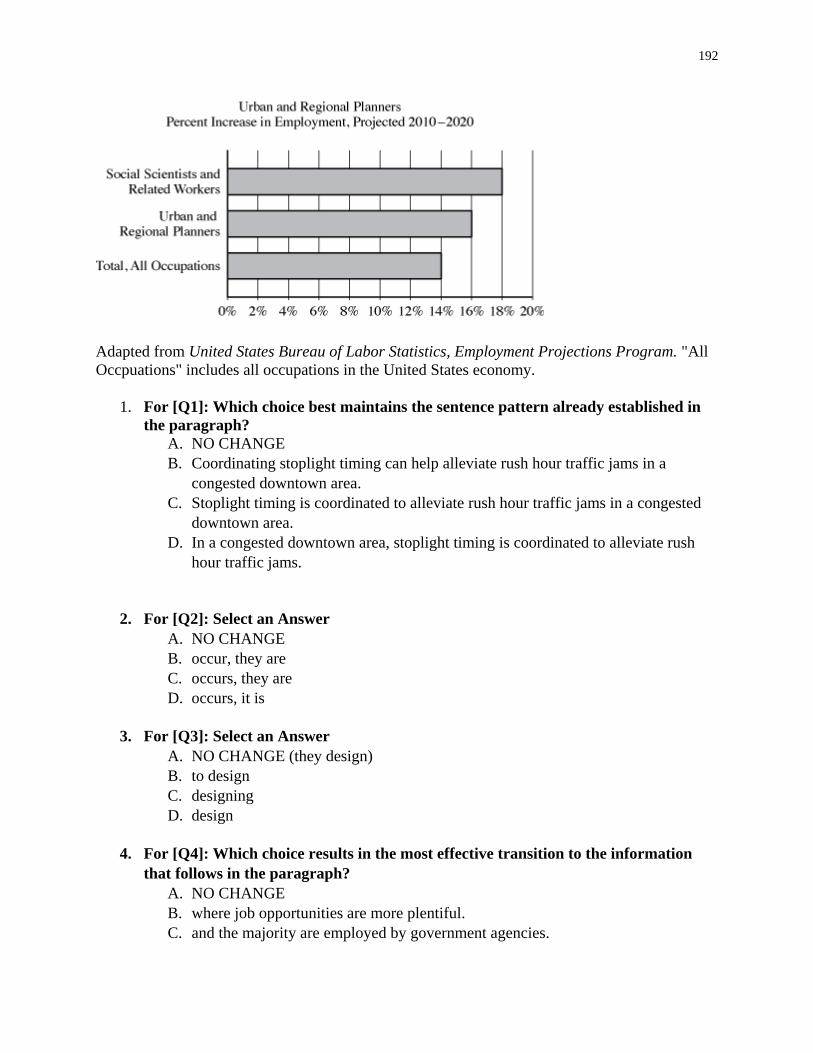
192
Adapted from United States Bureau of Labor Statistics, Employment Projections Program. "All
Occpuations" includes all occupations in the United States economy.
1. For [Q1]: Which choice best maintains the sentence pattern already established in
the paragraph?
A. NO CHANGE
B. Coordinating stoplight timing can help alleviate rush hour traffic jams in a
congested downtown area.
C. Stoplight timing is coordinated to alleviate rush hour traffic jams in a congested
downtown area.
D. In a congested downtown area, stoplight timing is coordinated to alleviate rush
hour traffic jams.
2. For [Q2]: Select an Answer
A. NO CHANGE
B. occur, they are
C. occurs, they are
D. occurs, it is
3. For [Q3]: Select an Answer
A. NO CHANGE (they design)
B. to design
C. designing
D. design
4. For [Q4]: Which choice results in the most effective transition to the information
that follows in the paragraph?
A. NO CHANGE
B. where job opportunities are more plentiful.
C. and the majority are employed by government agencies.
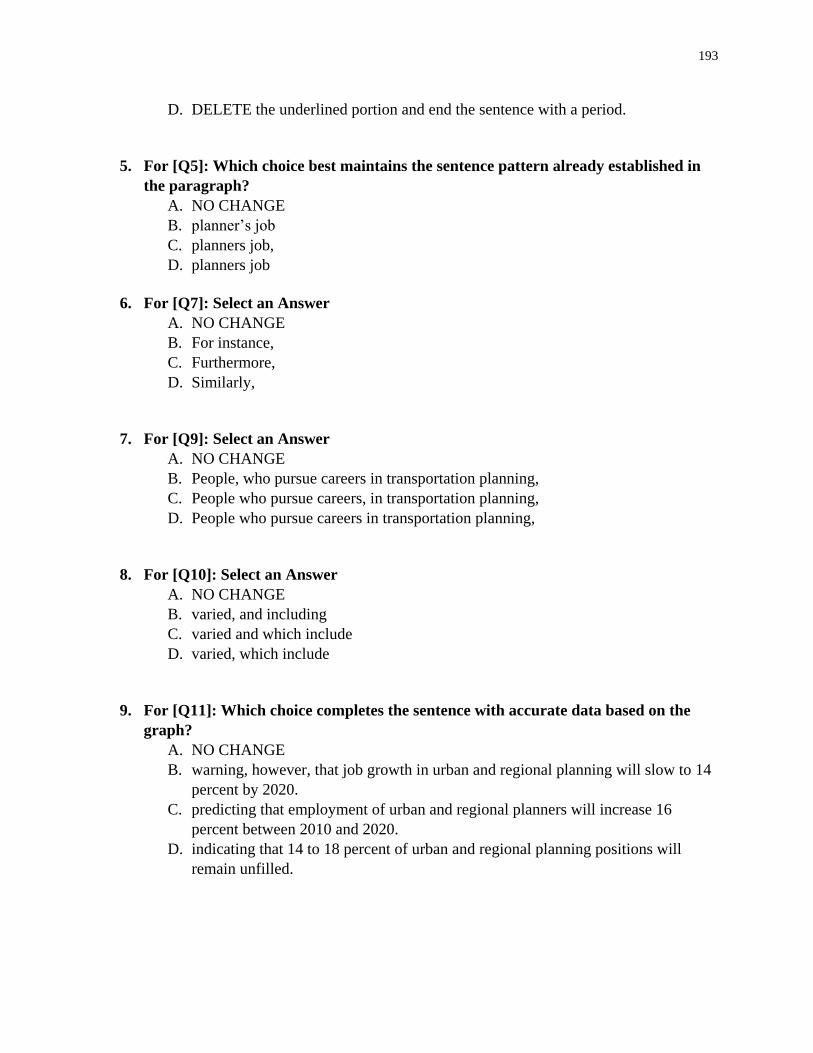
193
D. DELETE the underlined portion and end the sentence with a period.
5. For [Q5]: Which choice best maintains the sentence pattern already established in
the paragraph?
A. NO CHANGE
B. planner’s job
C. planners job,
D. planners job
6. For [Q7]: Select an Answer
A. NO CHANGE
B. For instance,
C. Furthermore,
D. Similarly,
7. For [Q9]: Select an Answer
A. NO CHANGE
B. People, who pursue careers in transportation planning,
C. People who pursue careers, in transportation planning,
D. People who pursue careers in transportation planning,
8. For [Q10]: Select an Answer
A. NO CHANGE
B. varied, and including
C. varied and which include
D. varied, which include
9. For [Q11]: Which choice completes the sentence with accurate data based on the
graph?
A. NO CHANGE
B. warning, however, that job growth in urban and regional planning will slow to 14
percent by 2020.
C. predicting that employment of urban and regional planners will increase 16
percent between 2010 and 2020.
D. indicating that 14 to 18 percent of urban and regional planning positions will
remain unfilled.

194
STOP
If you finish before time is called, you
may check your work on this section only.
Do not turn to any other section.
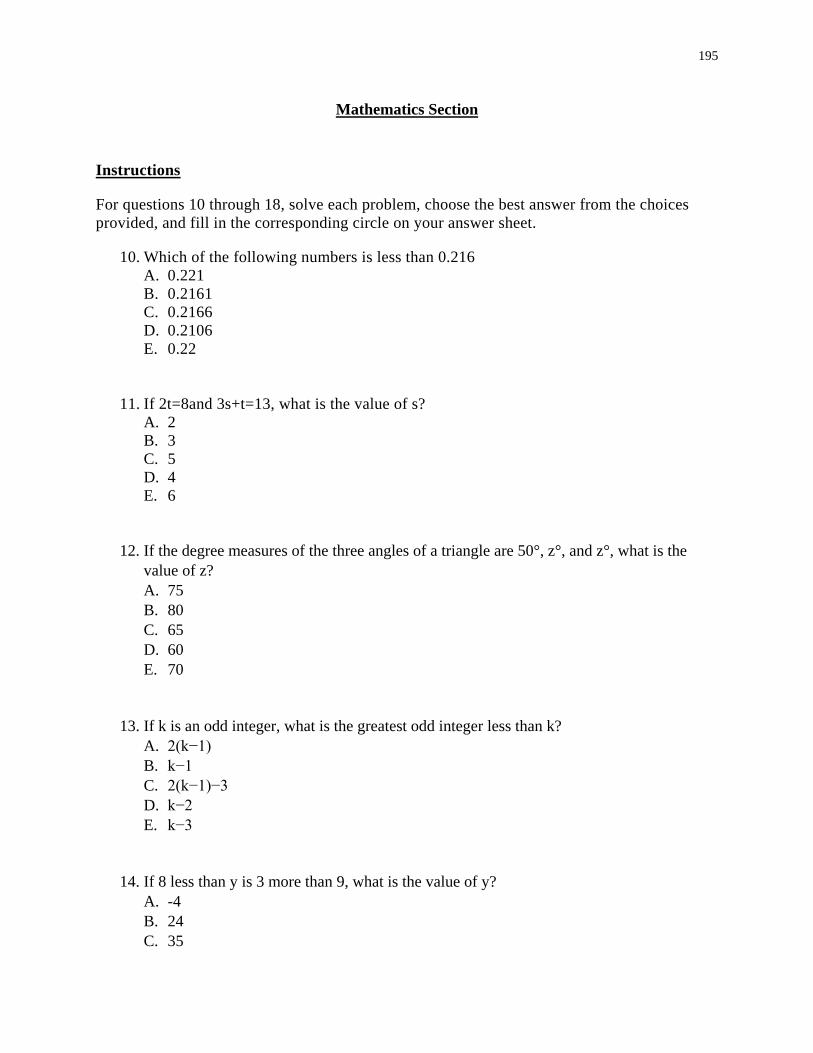
195
Mathematics Section
Instructions
For questions 10 through 18, solve each problem, choose the best answer from the choices
provided, and fill in the corresponding circle on your answer sheet.
10. Which of the following numbers is less than 0.216
A. 0.221
B. 0.2161
C. 0.2166
D. 0.2106
E. 0.22
11. If 2t=8and 3s+t=13, what is the value of s?
A. 2
B. 3
C. 5
D. 4
E. 6
12. If the degree measures of the three angles of a triangle are 50°, z°, and z°, what is the
value of z?
A. 75
B. 80
C. 65
D. 60
E. 70
13. If k is an odd integer, what is the greatest odd integer less than k?
A. 2(k−1)
B. k−1
C. 2(k−1)−3
D. k−2
E. k−3
14. If 8 less than y is 3 more than 9, what is the value of y?
A. -4
B. 24
C. 35

196
D. -19
E. 20
15. In ∆ABD above, if y=35, what is the value of z?
A. 40
B. 30
C. 45
D. 25
E. 35
16. How many seconds are required for a bicycle to go 2 miles at a constant speed of 4 miles
per hour?
A. 1200
B. 1800
C. 2400
D. 3600
E. 3000
17. If 15x+55y=35, what is the value of 3x+11y?
A. 15
B. 30
C. 14
D. 7
E. 8
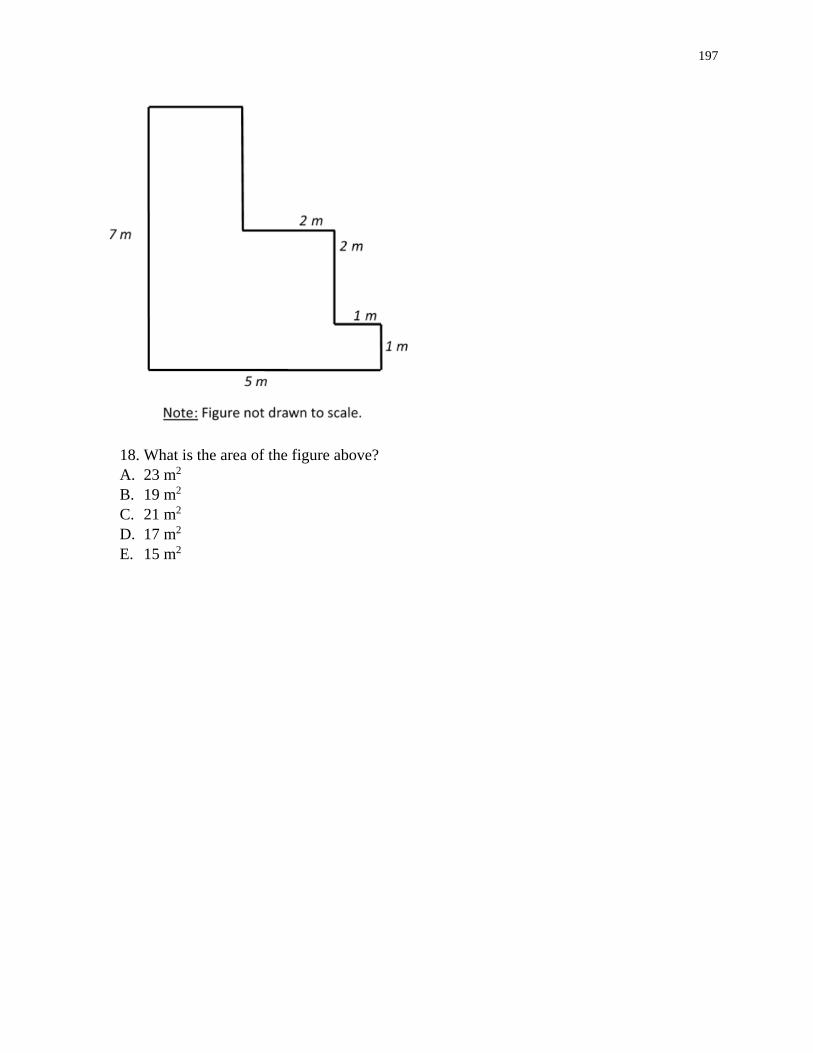
197
18. What is the area of the figure above?
A. 23 m2
B. 19 m2
C. 21 m2
D. 17 m2
E. 15 m2

198
Appendix K
Demographic Survey
1. Study Identification Number:
2. How do you describe yourself?
• Female
• Male
• Write in:
3. What categories describe your race/ethnicity? Select all boxes that apply.
• American Indian or Alaska Native
• Asian
• Black or African American
• Hispanic, Latino or Spanish Origin
• Middle Eastern or North African
• Native Hawaiian or Other Pacific Islander
• White
• Write in:
• What is your age?
• 17
• 18
• 19
• 20
• 21
• 22
• 23
• 24
• 25
• Write in:
4. What is your classification?
• Freshman
• Sophomore
• Junior
• Senior
5. What is your major?
• Write in:
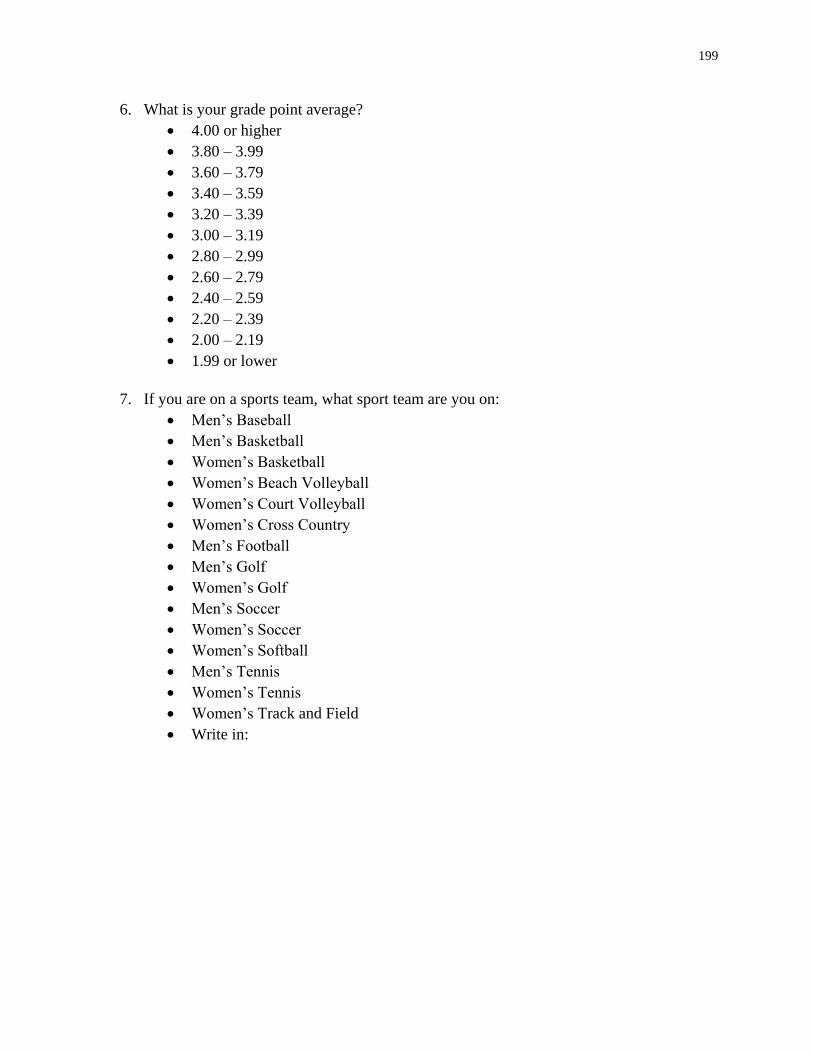
199
6. What is your grade point average?
• 4.00 or higher
• 3.80 – 3.99
• 3.60 – 3.79
• 3.40 – 3.59
• 3.20 – 3.39
• 3.00 – 3.19
• 2.80 – 2.99
• 2.60 – 2.79
• 2.40 – 2.59
• 2.20 – 2.39
• 2.00 – 2.19
• 1.99 or lower
7. If you are on a sports team, what sport team are you on:
• Men’s Baseball
• Men’s Basketball
• Women’s Basketball
• Women’s Beach Volleyball
• Women’s Court Volleyball
• Women’s Cross Country
• Men’s Football
• Men’s Golf
• Women’s Golf
• Men’s Soccer
• Women’s Soccer
• Women’s Softball
• Men’s Tennis
• Women’s Tennis
• Women’s Track and Field
• Write in:

200
Appendix L
Debrief Email
Subject: Study Follow-Up
Hello [Student Name],
Thank you for participating in the recent study exploring the experiences of student-athletes on
college campuses. When you signed your consent form, you acknowledged that you understood
that the researchers needed to withhold certain details about the study to ensure that we could
answer our research questions and better inform the development of positive models, programs,
and initiatives for student-athletes. The study is complete, and I would like to share with you
details about the study.
The study did explore the experiences of student-athletes. During the study, you may have heard
the statement: “I’m exploring performance on the exam that you will take today. In the past,
student-athletes have not performed as well as other students nationally. I will compare test
performance of student-athletes and nonstudent-athletes.” The statement was not true, because
we did not test the exam among other college students. We have no evidence that student-
athletes performed differently on this test or any other standardized test than their peers. We
made no such comparison. The reason we used that false statement was to create a situation like
in real life. Some student-athletes hear negative stereotypes about their academic abilities, and it
can affect their performance. We wanted to recreate that experience to explore whether different
mapping activities could reduce the negative effects of the stereotype.
Please let me know if you have any questions. I am happy to share with you the full report once
it is complete. As a reminder, your name and other facts that might point to you will not appear
when we present this study or publish its results. The findings will be summarized and reported
in group form. You will not be identified personally.
You are not required to respond to this message. You should only respond if you would like your
data removed from the study or if you have any questions.
Best,
Jacob English, M.S.
Student Principal Investigator
Department of Learning Sciences
College of Education and Human Development