
Hydrogen Production and Management for Petroleum Processing
67
Hydrogen Production and Management for Petroleum Processing Steven A. Treese* Puget Sound Investments LLC, Katy, TX, USA Introduction and Scope of Discussion Introduction As refinery product specifications become more stringent to meet environmental requirements, refinery demand for hydrogen has continually increased to supply the required hydroprocessing units. Additional improvements in burning qualities, like cetane, also require more hydrogen. For many refineries, the by-product hydrogen produced by naphtha reforming has been able to supply sufficient hydrogen. The drive toward ultralow sulfur diesel and near-zero gasoline sulfur has exceeded the availability of hydrogen from reforming in most cases. Full-conversion and cracking refineries today generally need incremental hydrogen that is produced “on purpose.” A refinery with a hydrocracker will almost always need incremental hydrogen. This chapter explores the alternative methods for hydrogen production, with a focus on the most commonly applied hydrogen plant technologies. Many refineries obtain the additional hydrogen supply “over the fence” from a second party. Several gas suppliers, like Praxair, Air Liquide, and Air Products, offer these services. They are especially common where the hydrogen can be used by several different facilities in an area. The plants used to make the hydrogen still follow the same processes discussed below. The main difference in over-the-fence supply is that the refiner is not directly responsible for the hydrogen plant operation. Production Processes The first source for hydrogen in a refinery is always catalytic naphtha reforming. This process is discussed in detail elsewhere in this book. We will only touch on reformer hydrogen qualities and issues in this section. Incremental hydrogen will be our primary focus here. In order of importance to refineries, the key processes for making or recovering incremental hydrogen are: • Steam-methane reforming • Refinery gas recovery • Partial oxidation/gasification • Olefins cracking by-product recovery • Electrolytic hydrogen • Other processes We will look at each of these processes in turn and provide references for additional information. Steven A. Treese is retired from Phillips 66. *Email: [email protected] Handbook of Petroleum Processing DOI 10.1007/978-3-319-05545-9_12-1 # Springer International Publishing Switzerland 2014 Page 1 of 67
-
Upload
khangminh22 -
Category
Documents
-
view
1 -
download
0
Transcript of Hydrogen Production and Management for Petroleum Processing

Hydrogen Production and Management for Petroleum Processing
Steven A. Treese*Puget Sound Investments LLC, Katy, TX, USA
Introduction and Scope of Discussion
IntroductionAs refinery product specifications become more stringent to meet environmental requirements,refinery demand for hydrogen has continually increased to supply the required hydroprocessingunits. Additional improvements in burning qualities, like cetane, also require more hydrogen.
For many refineries, the by-product hydrogen produced by naphtha reforming has been able tosupply sufficient hydrogen. The drive toward ultralow sulfur diesel and near-zero gasoline sulfur hasexceeded the availability of hydrogen from reforming in most cases.
Full-conversion and cracking refineries today generally need incremental hydrogen that isproduced “on purpose.” A refinery with a hydrocracker will almost always need incrementalhydrogen. This chapter explores the alternative methods for hydrogen production, with a focus onthe most commonly applied hydrogen plant technologies.
Many refineries obtain the additional hydrogen supply “over the fence” from a second party.Several gas suppliers, like Praxair, Air Liquide, and Air Products, offer these services. They areespecially common where the hydrogen can be used by several different facilities in an area. Theplants used to make the hydrogen still follow the same processes discussed below. The maindifference in over-the-fence supply is that the refiner is not directly responsible for the hydrogenplant operation.
Production ProcessesThe first source for hydrogen in a refinery is always catalytic naphtha reforming. This process isdiscussed in detail elsewhere in this book. We will only touch on reformer hydrogen qualities andissues in this section.
Incremental hydrogen will be our primary focus here. In order of importance to refineries, the keyprocesses for making or recovering incremental hydrogen are:
• Steam-methane reforming• Refinery gas recovery• Partial oxidation/gasification• Olefins cracking by-product recovery• Electrolytic hydrogen• Other processes
We will look at each of these processes in turn and provide references for additional information.
Steven A. Treese is retired from Phillips 66.
*Email: [email protected]
Handbook of Petroleum ProcessingDOI 10.1007/978-3-319-05545-9_12-1# Springer International Publishing Switzerland 2014
Page 1 of 67
Recovery ProcessesThe recovery processes for hydrogen can apply to several of the production technologies. We willdiscuss the three most common recovery processes employed in refineries:
• Pressure swing adsorption• Membranes• Cryogenic recovery
ManagementAll the incremental hydrogen in the world is not helpful if it is poorly managed. Poorly managedhydrogen ultimately ends up getting burned in most refineries, and this is a waste. We will discusssome approaches to ensure that hydrogen is not wasted to fuel or flare.
Catalytic Reforming of Naphtha
DiscussionProduction of hydrogen as a by-product of catalytic naphtha reforming is very common. Thisprovides a large piece of the hydrogen supply in a refinery.
Semi-regenerative reformers can typically make about 1,000 scf of hydrogen per barrel ofreformer charge, while continuous reformers can make around 1,700 scf of hydrogen per barrelcharge. Cyclic reformers operate between.
Process details for naphtha reforming are in the chapter entitled “▶Catalytic Reforming inPetroleum Processing” of this handbook. We will focus here on the hydrogen quality produced bythe naphtha reformer and its implications in hydroprocessing.
Reformer Hydrogen PropertiesReformer hydrogen composition can vary widely as shown in Table 1. Hydrogen from a continuousreformer (CCR) will have a relatively constant composition, while hydrogen from a semi-regen unitwill vary from start of run (just after regeneration) to end of run (just before regeneration). A cyclicreformer’s hydrogen composition will vary over an intermediate range, because the individualreactors are regenerated one at a time and swung back on line.
When viewing these hydrogen compositions from a user’s standpoint, two items are of note:
Table 1 Some typical catalytic naphtha reformer hydrogen products
Type of reformer Semi-regen Cyclic CCR
Hydrogen yield, scf/b charge 1,000–1,300 1,100–1,500 1,600–1,800
Typical hydrogen quality, v%
Hydrogen 75–89 83–87 85–90
Methane 3–6 3–4 2–3
Ethane 2–5 3–4 2–3
Propane 1–5 3–4 1–2
i-Butane 0.2–2 1–2 1–2
n-Butane 0.2–2 1–2 1–2
C5-Plus 3–5 1–2 3
Chloride (as HCl) (1–3 vppm) (1–3 vppm) (1–3 vppm)
Handbook of Petroleum ProcessingDOI 10.1007/978-3-319-05545-9_12-1# Springer International Publishing Switzerland 2014
Page 2 of 67

• Methane, ethane, and propane will build up in the recycle gas system of any unit that uses thehydrogen, depressing the effective hydrogen partial pressure.– In many cases, the reformer hydrogen is sent initially through the naphtha hydrotreater (NHT
or pretreater), sometimes once through, ahead of the naphtha reformer. The naphthahydrotreater acts as a sponge to remove almost all the heavier impurities and some of thelighter hydrocarbons. The NHT is effectively improving the hydrogen purity before it goes toother units. There is also a benefit in recovering the yield represented by the heavierhydrocarbons.
– Some refineries send the reformer hydrogen through a pressure swing adsorption (PSA) unit, amembrane unit, or a steam-methane reformer (SMR) to improve the purity. The impurities arerejected to fuel gas or, in the case of the SMR, used to make more hydrogen. The higher-purityproduct maintains high hydrogen partial pressures in the hydrogen users.
– If the hydrogen is routed directly to a user, the impurities in the gas appear in the products fromthe user. When looking at net yields in a user, this needs to be factored into the balance.
• The residual chloride in reformer hydrogen presents a problem for users.– The chloride would normally be coming from the reforming process, but poor desalting of the
crude, poor water-chloride balance control in the reformer, or organic chlorides in the crudemay greatly increase the reformer hydrogen chloride contents.
– In hydroprocessing units, the chloride, starting out as HCl, will end up forming ammoniumchloride deposits in the effluent train and increasing corrosion rates.
– Sometimes, the chloride content is tolerable, especially if the reformer hydrogen is only aminor portion of the makeup to the user.
– See the discussion of effluent salts in the chapters on hydrocracking and hydrotreating.• Frequently, reformer net hydrogen is sent through a low-temperature chloride absorber to remove
the chloride compounds.– These absorbers use granular solid sorbents, like alumina, to remove the chloride to about
0.1 vppm as HCl.– The sorbent must be monitored and periodically changed out.– These beds often have issues with channeling unless the reformer hydrogen stream is kept free
of liquid (Do not let it cool).– If there are substantial olefins in the reformer hydrogen (e.g., from running a reformer past
EOR), there are significant aromatics in the gas, and/or the sorbent surface is acidic (which canbe due to the being nearly spent or from presence of excessive water vapor), a chloride absorberwill make “green oil.” These are polymeric, chlorinated hydrocarbons. They will drop out inlow spots, foul compressor valves, and move chloride into the process units. These cansomewhat defeat the purpose of the absorber. Absorbents are available to reduce green oilformation through the absorbent used or alkaline additives to reduce acidification of thesurface.
Further Information on Reformer HydrogenPlease refer to the chapter on naphtha reforming for additional detail on hydrogen production fromcatalytic reforming.
Handbook of Petroleum ProcessingDOI 10.1007/978-3-319-05545-9_12-1# Springer International Publishing Switzerland 2014
Page 3 of 67

Steam-Methane Reforming
IntroductionSteam-methane reforming (SMR) is the main process used in refineries to produce hydrogen. Itshould not be confused with catalytic naphtha reforming. The technology is offered by severalcompanies on a proprietary basis, including Haldor Topsoe, Foster Wheeler, CB&I/HoweBaker,Lurgi, and KTI.
In the SMR reactions, methane is reacted with steam at very high temperatures and relatively lowpressures to make hydrogen and a mixture of CO/CO2. The process is used extensively by allindustries requiring hydrogen. The largest hydrogen plants are used in the manufacture of ammonia.These are usually several times larger than the plants we use in refineries.
When a facility decides to purchase hydrogen over the fence from a gas supplier, that supplier isnormally making the hydrogen using SMR.
Advantages of the SMR process are:
• High yields and efficiency – low cost of hydrogen• High-purity hydrogen product (93–100 %)• Feedstock flexibility (natural gas, refinery gases, refinery liquids – anything with carbon)• Relatively easy to operate (governed by equilibrium)• Relatively easy to monitor (you cannot ignore an SMR, however)• Scalable – smallest units less than 1 MMscfd to more than 800 MMscfd• Open art technology, although some equipment and design methods are proprietary• Many design, equipment, catalyst, and sorbent suppliers, who will help train your personnel and
monitor plant• Well-established safety and support organizations (e.g., AIChE Annual Safety in Ammonia
Plants and Related Facilities Symposia)
The disadvantages of the SMR process are largely manageable:
• Severe operating conditions push materials limits• Cleanup of feedstock and products can be complex• SMR plants work best at high loads – they do not operate well below 50 % rate• They like stable production rates – rate changes require a lot of adjustments that are not automatic• The plants produce CO/CO2, NOx, trace organic oxygenates (like methanol), and trace
ammonia – all of which must be reported and managed within environmental limits• An absolutely stable supply of boiler feedwater is required – loss of boiler feedwater for a few
minutes (or sometimes seconds) can have drastic consequences
Now, we will walk through the process step by step. The process will focus primarily on makinghydrogen from natural gas or refinery gases, with appropriate touches on SMR of refinery liquids.
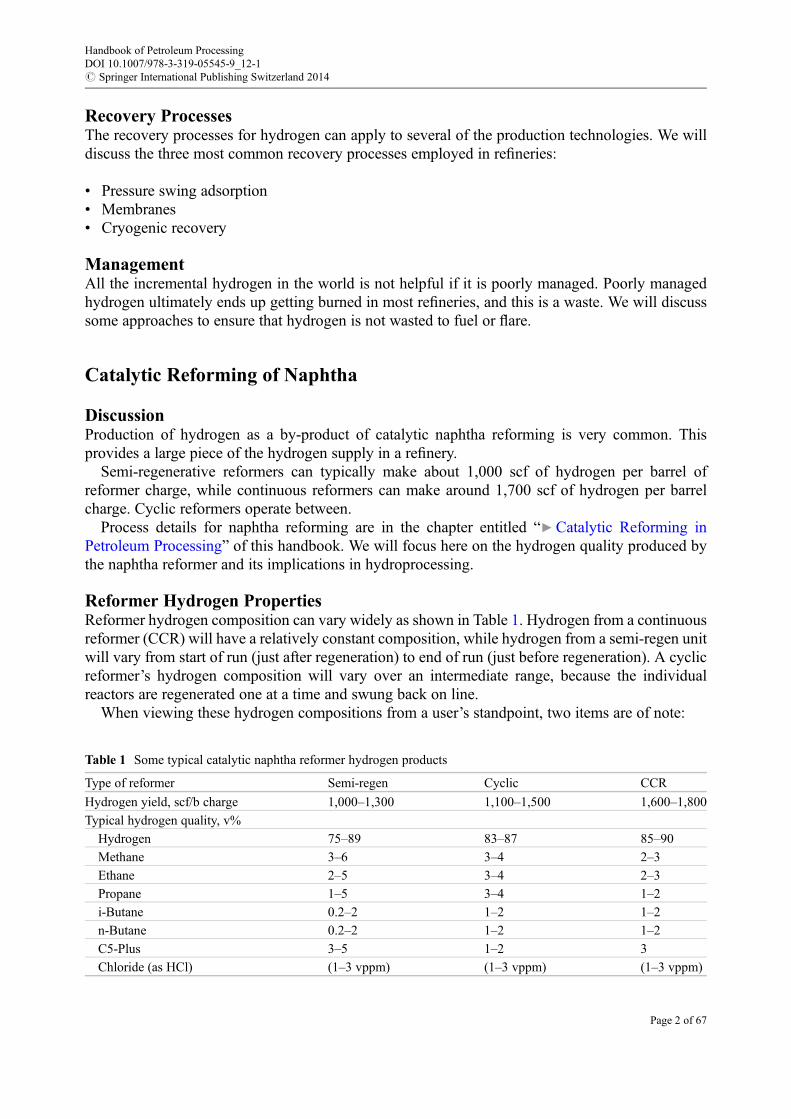
SMR Processes: Step by StepThe steam-methane reforming process, in its most common form, can be divided into several distinctprocess sections, as shown in the block flow diagram of Fig. 1:
• Feed gas compression – may be required for low pressure gas feeds• Feed liquid vaporization – required for liquid feeds
Handbook of Petroleum ProcessingDOI 10.1007/978-3-319-05545-9_12-1# Springer International Publishing Switzerland 2014
Page 4 of 67
• Feedstock purification – removes all impurities to prepare the feedstock for the SMR; recyclehydrogen is needed if feed contains insufficient hydrogen
• Primary reforming – reaction of the feedstock with steam to make hydrogen• Shift conversion and cooling – further reaction of residual CO to make more hydrogen and
cooling of raw hydrogen• Product hydrogen purification – removing impurities from the raw hydrogen to make the high-
purity hydrogen product• Product hydrogen compression – needed at users or inside the SMR hydrogen plant, supplies any
recycle hydrogen needs• Steam system – generates steam from waste heat to supply the process steam requirements;
surplus steam is exported to the refinery
We will consider the major process steps in order as the feedstock flows through the plant.
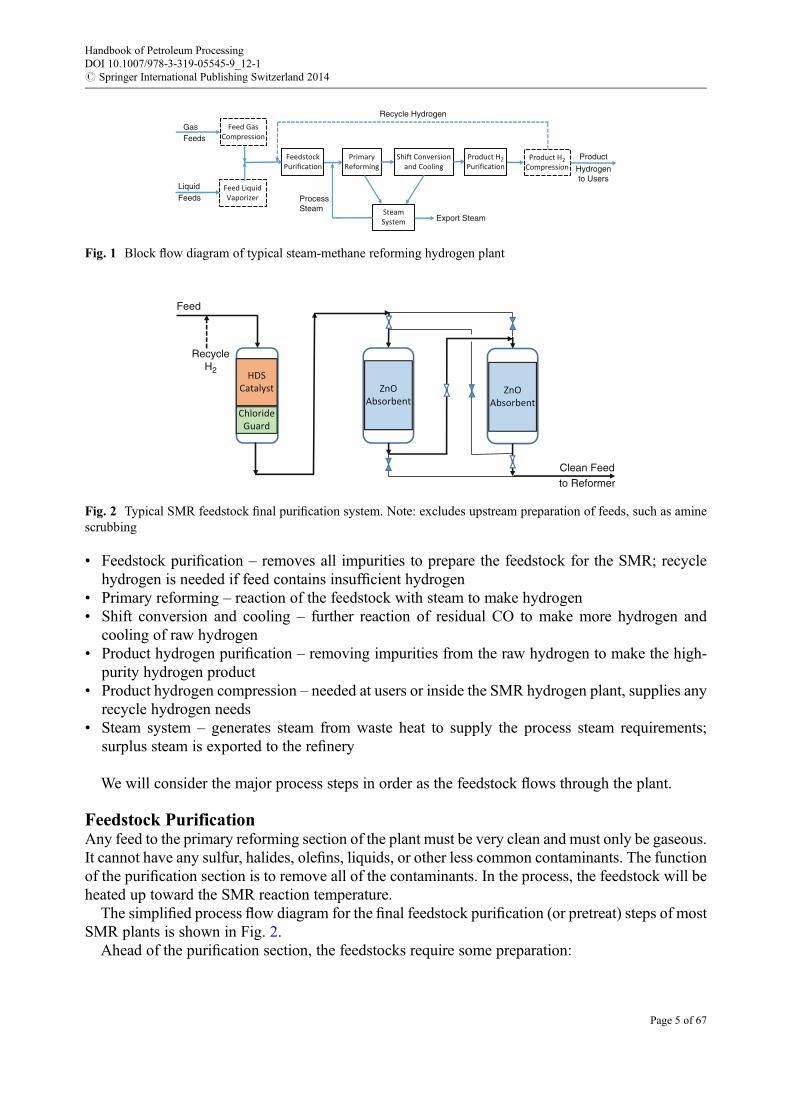
Feedstock PurificationAny feed to the primary reforming section of the plant must be very clean and must only be gaseous.It cannot have any sulfur, halides, olefins, liquids, or other less common contaminants. The functionof the purification section is to remove all of the contaminants. In the process, the feedstock will beheated up toward the SMR reaction temperature.
The simplified process flow diagram for the final feedstock purification (or pretreat) steps of mostSMR plants is shown in Fig. 2.
Ahead of the purification section, the feedstocks require some preparation:
Product
Hydrogento Users
Recycle Hydrogen
GasFeeds
LiquidFeeds Process
SteamExport Steam
Feed GasCompression
Feed LiquidVaporizer
FeedstockPurification
PrimaryReforming
Shift Conversionand Cooling
Product H2Purification
Product H2Compression
SteamSystem
Fig. 1 Block flow diagram of typical steam-methane reforming hydrogen plant
Feed
RecycleH2
Clean Feed
to Reformer
HDSCatalyst
ChlorideGuard
ZnOAbsorbent
ZnOAbsorbent
Fig. 2 Typical SMR feedstock final purification system. Note: excludes upstream preparation of feeds, such as aminescrubbing
Handbook of Petroleum ProcessingDOI 10.1007/978-3-319-05545-9_12-1# Springer International Publishing Switzerland 2014
Page 5 of 67

• Gas feeds:– All liquids knocked out of the gases– Low pressure gases compressed to required pressure, typically around 450–500 psig
• Liquid feeds:– Filtered– Vaporized, normally in a kettle-style vaporizer
• All feedstocks:– Blended together – preferably in controlled proportions– Final trace liquid knocked out
If the blended gas contains very high H2S levels (more than about 10 vppm), the mixed feed willbe routed through an amine scrubber to remove the bulk of the H2S. The rich amine from thescrubber is sent to regeneration for sulfur recovery, normally out of the SMR plant. A typicalreaction in the scrubber, using MEA as an example, is shown in Eq. 1:
HOC2H4 � N� H2 aqð Þ þ H2S gð Þ ! HOC2H4 � N� H3þ aqð Þ þ SH� aqð Þ (1)
Depending on residual sulfur after amine scrubbing, very sour gases may also be scrubbed withcaustic to remove traces of H2S down to the sub 10 vppm H2S range. That caustic reaction is shownin Eq. 2. The spent caustic is routed off plot for disposal:
H2S gð Þ þ NaOH aqð Þ ! NaHS aqð Þ þ H2O lð Þ (2)
The somewhat cleaner feed gas is then mixed with enough hydrogen for hydrotreating and heatedto about 600–750 �F. If there are significant olefins present, the preheated temperature may be lowerto offset heat of reaction from olefin saturation (see below). The amount of hydrogen requireddepends on the feedstock but generally falls in the following ranges:
• Natural gas feed: 2–5 v%• Refinery gases: 2–5+ v%• Propane and butane: 12 v%• Naphtha: 25–35 v%
The preheated feed plus hydrogen is now routed to a hydrotreating reactor to convert any residualorganic sulfur compounds quantitatively to H2S and to eliminate olefins. Organic chlorides that maybe present are all converted to HCl. Equations for these reactions are below. The reactions are drivenalmost totally to completion and they are all exothermic:
Sulfur : RS gð Þ þ H2 gð Þ ! RH gð Þ þ H2S gð Þ (3)
Olefins : R� C ¼ C� R0 gð Þ þ H2 gð Þ ! R� C� C� R0 gð Þ (4)
Chlorides : R� Cl gð Þ þ H2 gð Þ ! RH gð Þ þ HCl gð Þ (5)
Because all the reactions are exothermic, the gas temperature can increase across thehydrotreating reactor. However, since the starting sulfur and chloride contents will be very low inthe feeds, the main reaction generating heat is olefin saturation. Olefins can generate 40 �F rise per
Handbook of Petroleum ProcessingDOI 10.1007/978-3-319-05545-9_12-1# Springer International Publishing Switzerland 2014
Page 6 of 67

percent olefin in a gaseous feed, 15 �F per percent olefin in butane feed, and 10 �F per percent olefinin a naphtha feed. These rises place a limit on the amount of olefins in a feedstock. Hydrotreatedproduct can be recycled back through the feed compressors to help moderate the reaction, but thisconsumes feed gas compressor capacity.
For gaseous feeds, the practical limit is about 5 % olefins in the combined feed (including anyrecycle). To manage this concentration of olefins, you have to lower the hydrotreater inlet temper-ature about 200 �F, to about 500–550 �F. If you go lower in temperature, the hydrotreater reactionsmay not initiate. Higher temperature may result in a hydrocracking runway.
The pretreated gases, now at about 700–750 �F, are passed through a bed of chloride trap and bedsof zinc oxide (ZnO). The chloride trap, normally activated alumina (NaAlO2), absorbs the chloridesquantitatively until it is nearly spent. The zinc oxide beds absorb the sulfur quantitatively(<0.01 ppm residual is possible) until the beds are nearly spent. Two ZnO beds are usually usedin series with the valves and piping to change out the beds on line and swing the order of the twobeds. The essential equations in the sorbent beds are below. These reactions are slightly exothermic,but do not generate significant heat at the low impurity concentrations seen in hydrogen plant feeds:
Chlorides : 2HCl gð Þ þ 2NaAlO2 sð Þ ! NaCl sð Þ þ Al2O3 sð Þ þ H2O gð Þ (6)
Sulfur : H2S gð Þ þ ZnO sð Þ ! ZnS sð Þ þ H2O gð Þ (7)
Some units do not have separate hydrotreaters. This is not unusual where a plant only feeds sweetnatural gas. In these cases, combined function hydrotreating/absorbing catalysts may be used. Someof the sweet feed units may also not use a hydrogen recycle, but there is some risk of thiophene sulfurgetting through. Activated carbon has also been used instead of ZnO for sulfur sorption, but this isuncommon today because activated carbon has such a low capacity.
The general ranges for key operating conditions in the purification section of an SMR hydrogenplant are:
Hydrotreating
Temperature 550–750 �FPressure 350–500 psig
GHSV <3,000–4,000 h�1
Catalyst CoMo, NiMo
Absorbers (chloride and sulfur)
Temperature 650–750 �F (from hydrotreater)
Pressure 300–500 psig
GHSV 500–3,000 h�1
Catalysts
Chlorides Activated alumina
Sulfur Zinc oxide
Combined function catalyst/sorbents also available
Now, we have sweet, clean, hot gas feedstock available for the SMR reaction.
Primary ReformingThe simplified process flow diagram for the primary reforming section of most SMR plants is shownin Fig. 3. The preheat and heat recovery arrangements can vary. This is where most of the hydrogenwill be made.
Handbook of Petroleum ProcessingDOI 10.1007/978-3-319-05545-9_12-1# Springer International Publishing Switzerland 2014
Page 7 of 67

In this section of the plant, the hot, pretreated feed is mixed with steam in a precise proportionbased on the amount of carbon in the feed. This is the critical steam/carbon ratio and is based onmoles of steam per mole of carbon in the feed. Steam/carbon ratio typically ranges from 2.0 to 5.0,depending on the hydrogen plant design.Most new plants in refineries run 2.5–3.0 for gaseous feeds.The ratio is increased for butane and heavier feeds and if additional heat is needed to cool the shifteffluent (to be discussed later).
The combined reformer charge is preheated further to 800–1,150 �F by exchange before enteringthe reforming furnace radiant tubes. It is a large firebox with rows of catalyst-packed tubessurrounded by the burner flames. The SMR reactions occur in the furnace at �1,350–1,740 �Fand �250–350 psig. There can be hundreds of tubes in a typical furnace.
Flow distribution to the tubes is by pressure drop, so the inlet and outlet header designs andcatalyst loading are carefully controlled to ensure exactly the same pressure drop exists through eachtube – and hence the same flow. In practice, there are some deviations and an allowable tolerance.
The reactions occurring in this section of the SMR plant are primarily:Feed gas cracking to methane:
CnH2nþ2 þ n� 1H2 ! nCH4 þ Heat (8)
Steam-methane reforming:
CH4 þ H2Oþ Heat ! COþ 3H2 (9)
Water-gas shift:
COþ H2O ! CO2 þ H2 þ Heat (10)
In the first reaction, which normally occurs in the catalyst near each tube inlet, all hydrocarbonscoming in are cracked to methane. The catalyst used for this is an SMR catalyst that has an alkali
Fuel Gas Atm
PSA Offgas/Tail Gas350-
400°F
800-1150°F Steam Drum
Steam Drum Makeup StackHDS Reactor
Steam Drum
InducedDraft Fan
SCRModule
700-750°FSMR Process Effluent to WHB
Purified Feed Gas750°F, 250-350 psig
Boiler WaterCirculation
Process Steam Feed Gas Boiler Feed Water
Boiler WaterCirculation
SMR FurnaceFirebox
2000-2200°F0.5-1.5"H2O Draft
ConvectionInlet
1750-1850°F
1350-1740°F250-350psig
Fig. 3 Typical down-fired primary reformer simplified process flow diagram
Handbook of Petroleum ProcessingDOI 10.1007/978-3-319-05545-9_12-1# Springer International Publishing Switzerland 2014
Page 8 of 67

metal component added. The alkali helps scavenge coke that may form on the catalyst from thecracking reactions.
The steam-methane reforming reaction is our primary objective in this section of the plant. Steamreacts with the methane to produce hydrogen and carbon monoxide. This reaction consumes a lot ofheat. The heat consumed by reforming is why the primary reforming reactions are carried out intubes within a furnace firebox.
Finally, the carbon monoxide will react further with steam to make additional hydrogen andcarbon dioxide. This reaction is favored by lower temperatures, so it only goes part way tocompletion in the reforming furnace.
All the products are at or near equilibrium at the furnace outlet conditions when the catalyst hasgood activity. As the catalyst ages, the composition at the furnace outlet drifts away from equilib-rium, and the outlet temperature must be raised to maintain production.
The equilibrium can be calculated from the furnace inlet composition and outlet pressure andtemperature using published SMR and water-gas shift K values. These data are available, forinstance, in Catalyst Handbook (by Katalco, Springer-Verlag, NY, 1970) as Tables 2 and 3 of theAppendices to that book. Be sure you look carefully at the form of the KSMR equation to get the rightdirection for the reaction you are calculating.
For convenience, the charts have been converted to equations relating KSMR and temperaturesbelow:
SMR reaction:
Table 2 Comparison of common steam-methane reforming furnace types
Furnace type Down fired Terrace-wall fired Side fired Bottom fired
Layout
Advantages Steam and feed quicklybrought to reactiontemperature; cheaperfurnace box construction;fewer burners
Better control of heatflux; lower tube walltemperatures; moderatefirebox cost
Good control of heatflux; lower tube walltemperatures
Relatively low cost;steam and feed quicklybrought to reactiontemperatures; fewerburners
Disadvantages High heat flux neartop = high tube walltemperatures; ID fangenerally required; canhave large footprint forconvection section
More burners; draftbalance and controlwith multiple cells;convection elevationhigh or need to use IDfan
Many (hundreds) smallburners; high risk offlame impingement;draft balance andcontrol with multiplecells; convectionelevation high or needto use ID fan; High cost;Air preheat distributioncramped
Potential high tube walltemperatures nearbottom; usually limitedto small reformers; draftimbalance potential
Handbook of Petroleum ProcessingDOI 10.1007/978-3-319-05545-9_12-1# Springer International Publishing Switzerland 2014
Page 9 of 67

Table 3 Common materials damage mechanisms in SMR hydrogen plants (Reference: API RecommendedPractice 571)
Damage mechanisms
Equipment affected Creep=stress
rupture
Hightemphydrogen
attack
Oxidatio
n
Therm
alfatig
ue
Refractorydegradation
Tem
perem
brittlement
Aminecracking
Chloridestress
corr:Cracking
Steam
blanketin
g
Therm
alshock
Short�term
overheading�stress
rupture
Sigma�phase=chiem
brittlement
Reheatcracking
Dissimilarmetal
weldcracking
CO
2corrosion
Aminecorrosion
Boilerwater=condensate
corrosion
Metal
dusting
Pressurecyclefatig
ue
Feed gas hydrotreater X
ZnO drums X
Convection steam gen coils X X X
SMR furnace tubes/refractory
X X X X X X X X
SMR furnace process outlet X X X X
Waste heat boiler/steam gen X X X X
SMR effluent hot bypass X X X X X X
HTSC inlet X
HTS converter X X X X
HTSC outlet X
LTS converter X X X
Shift effluent cooling X X
Shift effluent to KO drum X X
Solvent CO2 removal
CO2 absorber X X X
Rich solution lines/equipment
X X X X
CO2 stripper X X X
CO2 stripper reboilers X X X X
Lean solution lines/equipment
X X X X
Methanator preheatexchange
X
Methanator reactor X
PSA purification
PSA vessels X
Handbook of Petroleum ProcessingDOI 10.1007/978-3-319-05545-9_12-1# Springer International Publishing Switzerland 2014
Page 10 of 67
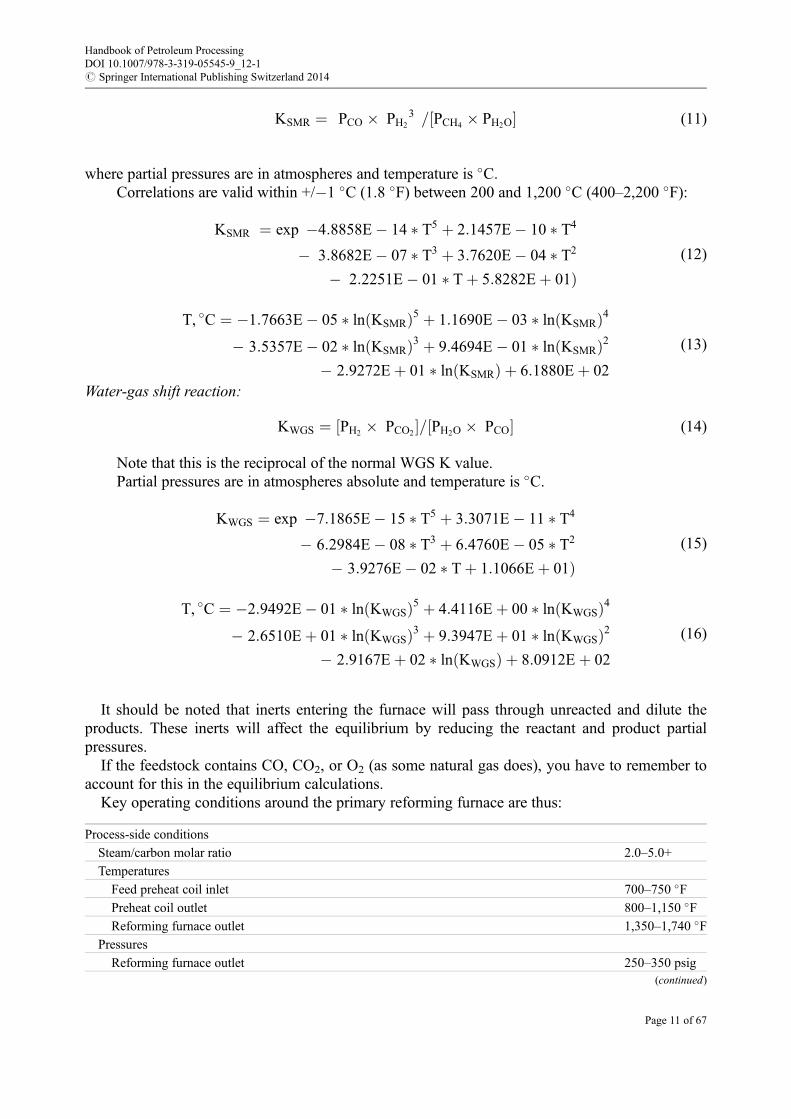
KSMR ¼ PCO � PH23
� �= PCH4 � PH2O½ � (11)
where partial pressures are in atmospheres and temperature is �C.Correlations are valid within +/�1 �C (1.8 �F) between 200 and 1,200 �C (400–2,200 �F):
KSMR ¼ exp �4:8858E� 14 � T5 þ 2:1457E� 10 � T4�
� 3:8682E� 07 � T3 þ 3:7620E� 04 � T2
� 2:2251E� 01 � Tþ 5:8282Eþ 01Þ(12)
T, �C ¼ �1:7663E� 05 � ln KSMRð Þ5 þ 1:1690E� 03 � ln KSMRð Þ4
� 3:5357E� 02 � ln KSMRð Þ3 þ 9:4694E� 01 � ln KSMRð Þ2� 2:9272Eþ 01 � ln KSMRð Þ þ 6:1880Eþ 02
(13)
Water-gas shift reaction:
KWGS ¼ PH2 � PCO2½ �= PH2O � PCO½ � (14)
Note that this is the reciprocal of the normal WGS K value.Partial pressures are in atmospheres absolute and temperature is �C.
KWGS ¼ exp �7:1865E� 15 � T5 þ 3:3071E� 11 � T4�
� 6:2984E� 08 � T3 þ 6:4760E� 05 � T2
� 3:9276E� 02 � Tþ 1:1066Eþ 01Þ(15)
T, �C ¼ �2:9492E� 01 � ln KWGSð Þ5 þ 4:4116Eþ 00 � ln KWGSð Þ4
� 2:6510Eþ 01 � ln KWGSð Þ3 þ 9:3947Eþ 01 � ln KWGSð Þ2� 2:9167Eþ 02 � ln KWGSð Þ þ 8:0912Eþ 02
(16)
It should be noted that inerts entering the furnace will pass through unreacted and dilute theproducts. These inerts will affect the equilibrium by reducing the reactant and product partialpressures.
If the feedstock contains CO, CO2, or O2 (as some natural gas does), you have to remember toaccount for this in the equilibrium calculations.
Key operating conditions around the primary reforming furnace are thus:
Process-side conditions
Steam/carbon molar ratio 2.0–5.0+
Temperatures
Feed preheat coil inlet 700–750 �FPreheat coil outlet 800–1,150 �FReforming furnace outlet 1,350–1,740 �F
Pressures
Reforming furnace outlet 250–350 psig(continued)
Handbook of Petroleum ProcessingDOI 10.1007/978-3-319-05545-9_12-1# Springer International Publishing Switzerland 2014
Page 11 of 67

Tube pressure drop 15–40 psi
Catalyst volume/GHSV By designer
Firebox-side conditions
Firebox temperature (firing level) 2,000–2,200 �FDraft at burners 0.5–1.5 “H2O
Flue gas exiting firebox (bridgewall) 1,750–1,850 �F
Water-Gas ShiftThe outlet from the reforming furnace consists of hydrogen, CO, CO2, residual CH4, a lot of steam,plus any inerts. These products are all at or close to equilibrium at the process outlet temperaturefrom the furnace, usually in the 1,350–1,740 �F range. At these temperatures, there will still be30–70 % of the carbon present as CO. This CO can be “shifted” to CO2 with incremental productionof hydrogen at lower temperatures using the water-gas shift reaction:
COþ H2O ! CO2 þ H2 þ Heat (17)
The simplified process flow diagram for the water-gas shift section of most SMR plants is shownin Fig. 4. The heat recovery arrangements in this section will vary, depending on the type ofpurification system used and the shift stages employed.
For the first shift stage, the reformer effluent is cooled, usually in a large steam generator or wasteheat boiler, to about 650–700 F and enters a high-temperature shift (HTS) reactor. This fixed-bedreactor is packed with a chrome-promoted, iron oxide shift catalyst. In the reactor, most of the CO isshifted to CO2, with additional hydrogen production. The temperature in the reactor rises 50–100 �Fdue to heat released by the reaction, so reactor effluent is around 700–800 �F. Pressure is low.Normally, all plants have HTS reactors. The catalyst is fairly robust and stable, resistant topoisoning.
The HTS effluent is cooled further. In pressure swing adsorption (PSA)-based plants, the effluentis normally cooled all the way to near-ambient conditions without further shift. In plants employinga wet chemical purification system and in a few PSA plants, there is a low-temperature shift (LTS)reactor to make additional hydrogen and eliminate more CO. Some plants use medium temperatureshift (MTS) reactors, but these are less common.
The LTS reactor normally uses a copper-based catalyst to reduce the residual CO to less than�0.5 v% (can be as low as 0.1 %). This type of catalyst is not robust, so activation and managementof the LTS catalyst requires special procedures. A LTS reactor tends to make methanol and
600-700°F
SMR ProcessOutlet1350-1740°F250-350 psig
Waste Heat Boiler/Steam Generator
Hot InternalBypass Duct
100-130°F200-300 psig
350-450°F700-850°F
Shift CondensateSeparator(s)
Final ShiftEffluent Cooling
Raw HydrogenTo Purification
Shift CondensateTo Degasifier
Boiler Water Drag LinesFrom Steam Drum
Steam Lines BackTo Steam Drum
Heat Recovery &Steam Generation
HighTempShift
(HTSC)
LowTempShift
(LTSC)
TC
Fig. 4 Typical water-gas shift simplified process flow diagram
Handbook of Petroleum ProcessingDOI 10.1007/978-3-319-05545-9_12-1# Springer International Publishing Switzerland 2014
Page 12 of 67

ammonia, which will contribute to emissions later. This issue is exacerbated by very low steam/carbon ratios. Specific, low-methanol catalysts are available to limit these side reactions. For a unitwith only HTS, the addition of LTS can increase hydrogen production 5–10 %, provided thepurification system can handle the extra load. Purification may need to be debottlenecked.
In the final steps of shift effluent cooling, we condense and recover the unreacted steam (shiftcondensate) for reuse. The relatively dry raw hydrogen is then sent to final purification.
Shift condensate will be saturated with CO2 and is quite corrosive. It is handled in stainless steelequipment. Direct reuse of the condensate with the dissolved CO2 would cause high corrosion ratesin the boiler system and introduce excessive amounts of CO2 into the steam from the hydrogenplant – causing high corrosion rates in condensate systems throughout the refinery. Before reuse, theshift condensate must be “degassed” by steam stripping to remove the CO2. This can be doneseparately in a dedicated stripper or degasifier or combined with deaeration of incoming boilerfeedwater (BFW). Combining degassing with deaeration is generally less effective.
Because the shift condensate also contains methanol and other trace organic oxygenates plus traceammonia, disposal of the stripper or degasifier off-gas must be considered. Environmental regula-tions limit the options in many areas. If a unit only has HTS, degasifier off-gas can often go toatmosphere. In other cases, the degasifier or deaerator off-gas can be routed to the reforming furnacefirebox. Some units use high-pressure steam strippers to remove the dissolved gases, with thestripper off-gases routed back to feed as part of the process steam.
Typical key operating conditions in the water-gas shift section of the plant are:
Temperatures
High-temperature shift reactor
Inlet 600–700 �FOutlet 700–850 �F
Low-temperature shift reactor
Range 350–450 �FFinal shift condensate separator 100–130 �F
Pressure
Final raw hydrogen to purification 250–350 psig
The raw hydrogen is now ready for purification to the final product.
PurificationThere are two general approaches to purification of raw hydrogen which we will consider here:
1. Pressure swing adsorption2. Wet chemical/solvent with methanation
Pressure Swing AdsorptionIn modern hydrogen plants, pressure swing adsorption (PSA) is the most common method ofpurification. The resulting product is nearly 100 % pure hydrogen, and the off-gas can be used asfuel in the SMR furnace.
Refer to the section “Pressure Swing Adsorption” of this chapter for more detailed discussion ofPSAs. The following comments address how a PSA is applied in SMR hydrogen plant service.
A PSA is typically integrated into an SMR hydrogen plant as shown in Fig. 5.
Handbook of Petroleum ProcessingDOI 10.1007/978-3-319-05545-9_12-1# Springer International Publishing Switzerland 2014
Page 13 of 67

The PSA feeds the cooled, dry (<130 �F) raw hydrogen from the SMR shift effluent. The PSAbeds adsorb the impurities from the raw hydrogen at inlet pressure (�250–450 psig normally). Pure,nearly 100 %, hydrogen is produced at near PSA inlet pressure.
Each bed in the PSA is periodically cycled off-line and depressured to release the adsorbedimpurities. This cycle occurs a few times per hour, typically. Off-line, the pressure in the PSA bed isdecreased in steps to near atmospheric pressure (say 4–6 psig). The adsorbent releases the impuritiesat the low pressure. The resulting tail gas or off-gas is sent to the SMR furnace as fuel.
There are normally several (4–12) PSA adsorbers that are connected together in a system. ThePSA system uses control valves, headers, surge vessels, and a programmable logic controller toswing each bed through the adsorption-desorption steps in sequence to provide continuous producthydrogen flow. The off-gas is collected in a surge drum to moderate pressure and compositionchanges before it is sent to the SMR furnace to be burned. The off-gas provides about 50–70% of theSMR fuel requirement.
Hydrogen recovery in a PSA tied to an SMR unit typically ranges from 80 % to 92 % of the totalhydrogen produced in the plant, with a good typical value of about 85 %. The multiple steps in thebed regeneration sequence help optimize hydrogen product recovery. More steps increase recovery,but can require more beds and additional complexity. There may be 50–100 individual steps in thesequence for several beds.
Hydrogen recovery can also be enhanced by online analyzers to monitor product or intermediate-pressure step gases.
One downside of a PSA tied to a continuous process is that it either works or it does not. There areseveral problems that can cause a PSA to trip. In a trip, your hydrogen product is immediately lostand the hydrogen plant will experience a major upset as the off-gas fuel is lost immediately – causinga major furnace firing disturbance.
The most frequent problems for PSAs are valve failures. These can be expected a few times a year.Sometimes, the PSA logic can work around a problem by removing pairs of beds from service andnot interrupting the flow; but often a problem trips the unit. Operators will develop experience tomanage the trips with time.
The finished PSA product is nearly 100 % hydrogen, with traces of nitrogen and CO (typically<100 ppmN2,<10 ppm CO). N2 and CO are the first gases that will break through a PSA. The PSAoperation can be adjusted to allow more or less N2/CO slip, depending on the hydrogen userlimitations. For instance, if the hydrogen is used in an isomerization unit, you would want less
Flare Flare
Set Pt fmPSA
PSA Offgas
3-7 psig3-5 psig
Offgas
To BurnersRaw Hydrogen
100-130°F, ~300 psig
Product H2
To Compression~300 psig
RecycleTo Feed
Vent
PSA Adsorber System
PSAOffgasSurgeDrum
FI
PC FC
PC
PC
Fig. 5 Typical PSA product hydrogen purification system integration simplified process flow diagram. For detailsinside PSA adsorber system box, refer to more detailed PSA system process flow diagram in PSA discussion
Handbook of Petroleum ProcessingDOI 10.1007/978-3-319-05545-9_12-1# Springer International Publishing Switzerland 2014
Page 14 of 67

than 1 ppm CO. This can be achieved by a PSA, with some loss of recovery. More typically, a COlevel of<10 vppm in the product hydrogen is the target. Allowing more CO to slip into the producthydrogen does not significantly increase the amount of hydrogen recovered and, at some point,actually decreases net hydrogen recovery because methanation begins consuming the hydrogen inthe users.
Wet Chemical/Solvent with MethanationMost of the older hydrogen plants used a wet chemical/solvent approach to hydrogen purification.These systems remove nearly all the CO2, but leave CO in the product hydrogen; hence, plants usingwet chemical/solvent purification follow the CO2 removal with a methanation step to eliminatethe CO.
The chemical processes used here generally follow these equations, using DGA as an examplesolvent:
Absorption/desorption:
Solvent aqð Þ þ CO2 gð Þ ! Solvent:CO2 aqð Þ (18)
Methanation:
CO gð Þ þ 3H2 gð Þ ! CH4 gð Þ þ H2O gð Þ þ heat (19)
Table 4 provides a summary of the wet chemical/solvent processes that are available for hydrogenpurification, along with a few comparison notes. Some of the processes employ simple chemicalsolvents. Some use physical solvents. Some use combined chemical and physical solvents. Some ofthese processes may be patented or involve proprietary information.
Table 4 Typical SMR hydrogen plant CO2 removal solvents (Reference: Benamor (2012) Carbon capture andStorage . . ., Gas Processing Center, Qatar University)
Removal system type and technology Licensor/Supplier
Amine solvent systems
Monoethanolamine (MEA) Fluor (EconamineSM)
Diglycolamine (DGA) Fluor (EconamineSM)
Methyldiethanolamine (MDEA)
Jefftreat Huntsman
Gas/Spec CS-2000 Ineos
BASF aMDEA (MDEA + Accel) BASF
ADIP-X (MDEA + Accel) Shell
Ucarsol Dow
KM CDR (KS-1 hindered amine) Mitsubishi Hvy Ind
Hot potassium carbonate systems
Catacarb and LRS-10 Eickmeyer and assoc
Benfield and Benfield ACT-1 UOP
Physical solvents
Selexol UOP/Dow
Mixed solvents
Handbook of Petroleum ProcessingDOI 10.1007/978-3-319-05545-9_12-1# Springer International Publishing Switzerland 2014
Page 15 of 67

Most of these processes offer an option that is not readily available in a PSA system: i.e., food-grade carbon dioxide is a by-product of the process. This CO2 product can be sold to help offsetoperating costs. This has some advantage in the current drive to reduce greenhouse gas emissions.
Figure 6 provides a typical flow sheet for a wet chemical/solvent system of hydrogen purification.An amine-type system is used in this example since these are the most common. Individualprocesses and units may deviate from this flow, but the general principles are the same.
In the wet chemical/solvent approach, cool, raw hydrogen is sent to an absorber where the CO2 isremoved by a circulating solvent. The scrubbed hydrogen, with residual CO and saturated withwater, is heated and sent through a fixed-bed methanation reactor (methanator). The catalyst in thereactor is a high nickel oxide material, in a reduced form. The CO is converted almost quantitativelyto methane according to Eq. 19 above, consuming some of the hydrogen. Note that methanation isreally just undoing the reaction we performed in the SMR furnace, and it will release just as muchheat – although from much less reactant.
The outlet temperature of the methanator is controlled by the inlet temperature and the CO slip outof the last shift reactor. The final hydrogen from the methanator is cooled and sent to the users.
Dry hydrogen after the methanator is typically 92–96 % hydrogen, with the balance beingmethane. There will also normally be <10 vppm CO+CO2 remaining plus some water fromsaturation of the hydrogen from the absorber and the methanation reaction.
Because the methanator is so highly exothermic, a methanator normally has an automaticemergency shutdown system, which will bypass the reactor and send the hydrogen to flare or venton high-high temperature to avoid failing the reactor vessel or piping.
Meanwhile, our solvent containing the CO2 (“rich” or “fat” solvent) is preheated and sent to areboiled stripper or regenerator. In the stripper, the CO2 is driven overhead to a condensing system.The water condensed from the overhead is refluxed to the stripper.
Hydrogen to Methanator
RefluxDrum
CO2Absorber Reflux
PumpAmineRegenerator
Raw Hydrogen ShiftEffluent100-130°F
200-300 psig
Lean SolventLean Solvent
PumpRich Solvent ShiftEffluent
Carbon Dioxide Gas
Reboiler
Fig. 6 Typical wet chemical/solvent CO2 removal system for an SMR hydrogen plant
Handbook of Petroleum ProcessingDOI 10.1007/978-3-319-05545-9_12-1# Springer International Publishing Switzerland 2014
Page 16 of 67
The overhead gas, which is nearly pure CO2, is vented or sold as carbon dioxide product. For aCO2 liquid product, only minor final cleanup is needed. Sales of CO2 are typically via an over-the-fence arrangement with a gas supplier who does the final cleanup, liquefies, and ships the product.
The regenerated (“lean”) solvent from the bottom of the stripper is cooled and circulated back tothe CO2 absorber for reuse. Small amounts of makeup water or solvent may be needed to coverlosses or a small water purge may be necessary to avoid accumulation. Water balance and solventpurity must be controlled within limits.
Key operating conditions for a solvent CO2 removal system depend on the solvent used, so are notlisted here. A methanator will normally operate in the 200–300 psig range with temperatures from600 to 700 �F inlet and 700–800 �F outlet. The temperature rise in the methanator will be about130 �F per v% CO in the methanator feed and about 108 �F per v% CO2 in the methanator feed.
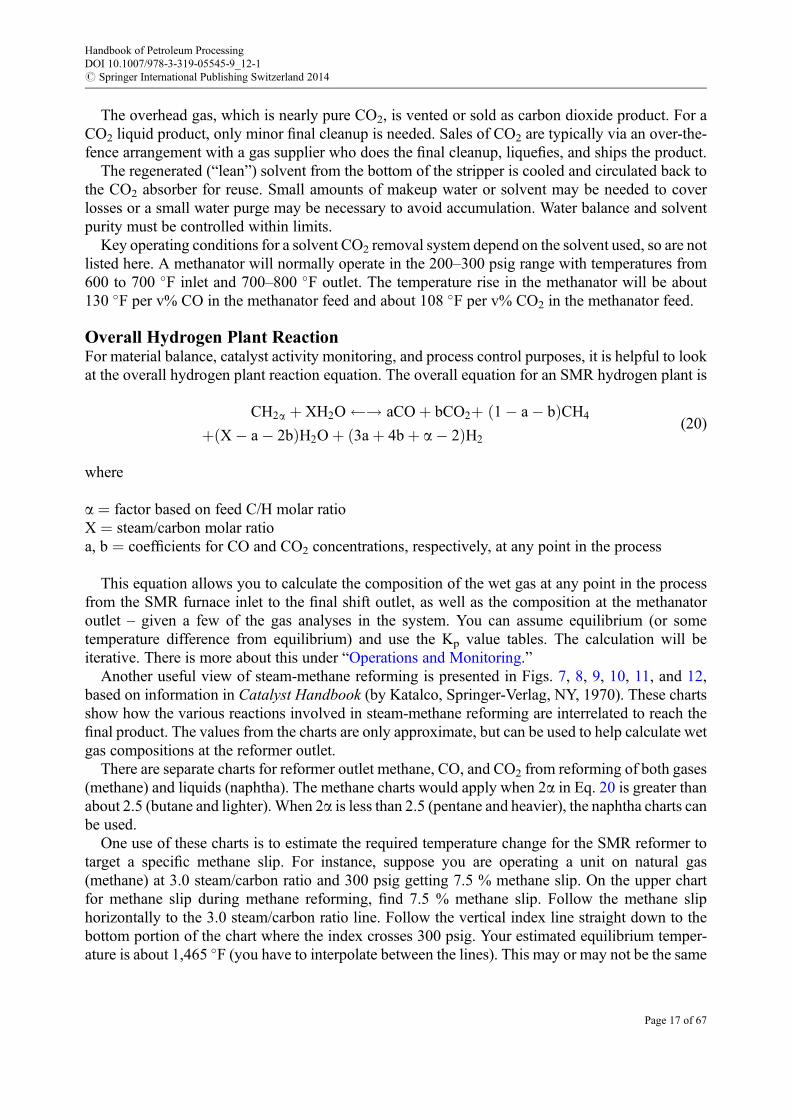
Overall Hydrogen Plant ReactionFor material balance, catalyst activity monitoring, and process control purposes, it is helpful to lookat the overall hydrogen plant reaction equation. The overall equation for an SMR hydrogen plant is
CH2a þ XH2O ! aCOþ bCO2þ 1� a� bð ÞCH4
þ X� a� 2bð ÞH2Oþ 3aþ 4bþ a� 2ð ÞH2(20)
where
a = factor based on feed C/H molar ratioX = steam/carbon molar ratioa, b = coefficients for CO and CO2 concentrations, respectively, at any point in the process
This equation allows you to calculate the composition of the wet gas at any point in the processfrom the SMR furnace inlet to the final shift outlet, as well as the composition at the methanatoroutlet – given a few of the gas analyses in the system. You can assume equilibrium (or sometemperature difference from equilibrium) and use the Kp value tables. The calculation will beiterative. There is more about this under “Operations and Monitoring.”
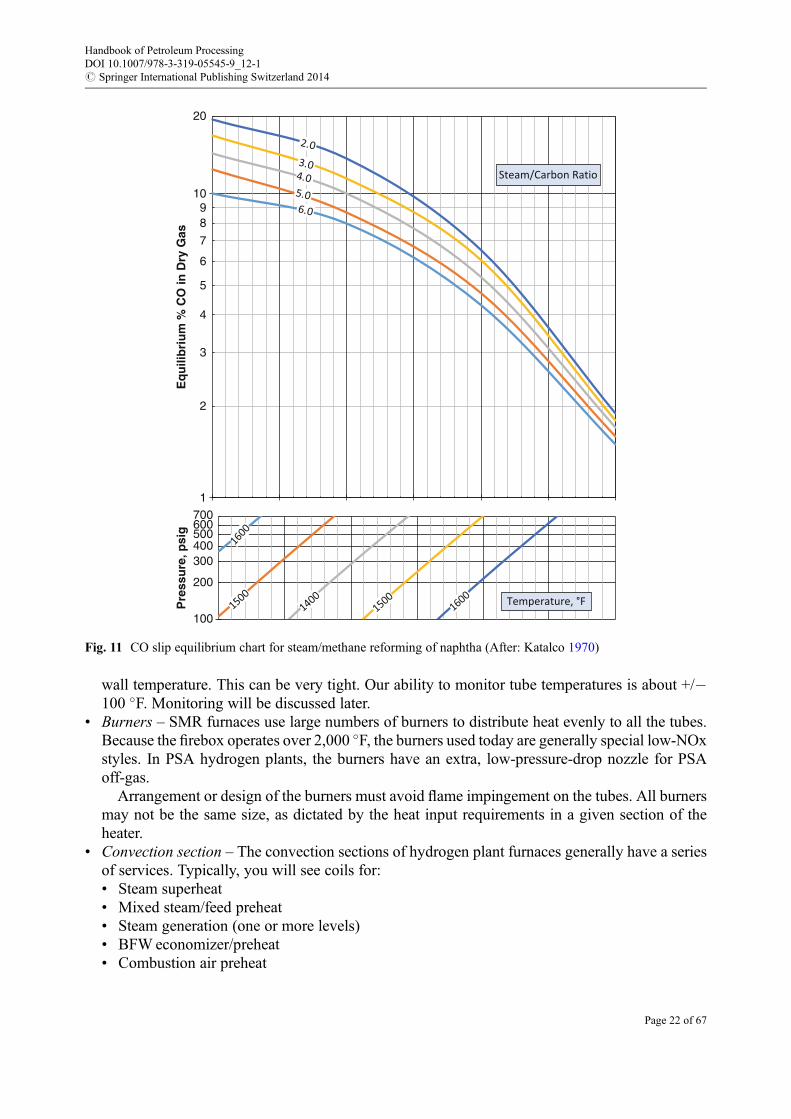
Another useful view of steam-methane reforming is presented in Figs. 7, 8, 9, 10, 11, and 12,based on information in Catalyst Handbook (by Katalco, Springer-Verlag, NY, 1970). These chartsshow how the various reactions involved in steam-methane reforming are interrelated to reach thefinal product. The values from the charts are only approximate, but can be used to help calculate wetgas compositions at the reformer outlet.
There are separate charts for reformer outlet methane, CO, and CO2 from reforming of both gases(methane) and liquids (naphtha). The methane charts would apply when 2a in Eq. 20 is greater thanabout 2.5 (butane and lighter). When 2a is less than 2.5 (pentane and heavier), the naphtha charts canbe used.
One use of these charts is to estimate the required temperature change for the SMR reformer totarget a specific methane slip. For instance, suppose you are operating a unit on natural gas(methane) at 3.0 steam/carbon ratio and 300 psig getting 7.5 % methane slip. On the upper chartfor methane slip during methane reforming, find 7.5 % methane slip. Follow the methane sliphorizontally to the 3.0 steam/carbon ratio line. Follow the vertical index line straight down to thebottom portion of the chart where the index crosses 300 psig. Your estimated equilibrium temper-ature is about 1,465 �F (you have to interpolate between the lines). This may or may not be the same
Handbook of Petroleum ProcessingDOI 10.1007/978-3-319-05545-9_12-1# Springer International Publishing Switzerland 2014
Page 17 of 67

as the actual process outlet temperature, but you are only going to use it as a reference in thisexample.
Now, you want to decrease the methane slip to a new target of 6.0 v% methane. You can increasesteam/carbon ratio or you can change temperature. Suppose you chose to change temperature. In theupper chart, find where 3.0 steam/carbon crosses the 6.0 %methane slip line. Then, follow the indexline vertically down to the 300 psig on the lower chart. The indicated equilibrium temperature isabout 1,500 �F. So, increasing the reformer outlet temperature by 1,500 �F�1,465 �F = +35 �Fshould bring the methane slip to 6.0 v%.
Steam SystemIntimately integrated into the SMR process is a steam system which provides process steam as wellas removes the large amount of waste heat required to cool the furnace process outlet, shift outlet,and flue. The steam system allows a hydrogen plant to be nearly self-sufficient. Many hydrogenplants generate surplus, high-pressure steam that is exported to the refinery. They can be major steamgenerators, replacing boilers. When properly designed and spared, hydrogen plants can supplysteam in an emergency, such as the loss of other boilers.
A typical steam system for an SMR hydrogen plant is illustrated in Fig. 13. Many configurationsare used for these systems, however.
0.1
1.0
10.0
100.0
EQ
UIL
IBR
IUM
% M
ET
HA
NE
IN D
RY
GA
S
Steam/Carbon Ratio
100
Pre
ssu
re, p
sig
Temperature,°F
200
300
400
500
Fig. 7 CH4 slip equilibrium chart for steam/methane reforming of methane (After: Katalco 1970)
Handbook of Petroleum ProcessingDOI 10.1007/978-3-319-05545-9_12-1# Springer International Publishing Switzerland 2014
Page 18 of 67

There are three areas where most steam is generated in a hydrogen plant:
• Reforming furnace process outlet. Here, a steam generator/waste heat boiler (WHB) is installed.TheWHB cools the process gases from their exit temperature of 1,350–1,740 �F down to the HTSconverter inlet temperature of about 700 �F. The final temperature is controlled by bypassing hotgas around (or through) the steam generator using a damper system. Water supply to the WHB isnormally by thermosiphon from a steam drum located somewhat above theWHB. Vaporization istypically 10–20 % in the WHB.
• Reforming furnace flue gas. One or more steam generation coils plus an economizer to preheatboiler feedwater are normally included in the flue gas ducting. These are usually thermosiphon orforced circulation steam generators tied to the main steam drum.
• High-temperature shift reactor effluent. Many plants employ a separate steam generator(s),sometimes kettle style, on the shift reactor effluent to recover additional high-level heat. In plantsthat use wet chemical/solvent CO2 recovery, this heat is normally used to drive the solvent system,so the steam generator may be omitted in these plants.
100
Pre
ssu
re, p
sig
200
600
300400500
Temperature, °F
0
2
4
6
8
10
12
14
16
18
Eq
uili
bri
um
% C
O in
Dry
Gas
Steam/Carbon Ratio
Fig. 8 CO slip equilibrium chart for steam/methane reforming of methane (After: Katalco 1970)
Handbook of Petroleum ProcessingDOI 10.1007/978-3-319-05545-9_12-1# Springer International Publishing Switzerland 2014
Page 19 of 67

Treatment of the boiler feedwater (BFW) for the steam generator systems and steam fromhydrogen plants is critical. Table 5 summarizes the typical BFW treatment requirements.
Hydrogen plant steam systems are highly stressed and require higher treatment levels than normalboilers. In the WHB on the furnace outlet, for instance, the tube walls will be over 1,000 �F. Whenworking with a boiler chemical vendor, you need to be sure the vendor is experienced in hydrogenplant chemical treatment. One specific caution is that BFW for a hydrogen plant should not usesulfite as an oxygen scavenger. The small amount of residual sulfur that ends up in the steam willpoison the reforming catalyst.
Recycle of shift condensate can introduce higher levels of CO2 into the steam generated. The CO2
becomes a corrosion problem in condensate systems using the steam. Critical factors in preventingthis corrosion are:
• Proper stripping of the shift condensate, as noted in the discussion of the water-gas shift sectionabove
• Injection of amine corrosion inhibitors into the export steam that will drop out into the condensateheaders at the correct pressures/temperatures
2
5
1
10E
qu
ilib
riu
m %
CO
2 in
Dry
Gas
3
4
6
7
89
15
100
Pre
ssu
re, p
sig
200
300
400500
141312
Temperature, °F
Steam/Carbon Ratio
Fig. 9 CO2 slip equilibrium chart for steam/methane reforming of methane (After: Katalco 1970)
Handbook of Petroleum ProcessingDOI 10.1007/978-3-319-05545-9_12-1# Springer International Publishing Switzerland 2014
Page 20 of 67

Unique Equipment Design and Metallurgy ConsiderationsIn this section, we will review a few of the unique considerations in hydrogen plant equipmentdesign. Properly addressing these factors is critical to building and operating a hydrogen plant.
SMR FurnaceHere, we will highlight only some of the more important considerations around an SMR furnace.These furnaces are not “run-of-the-mill” units. They require design experience. For very largefurnaces, computational fluid dynamics (CFD) may be employed to ensure heat release and flow inthe firebox are properly designed.
• Style of furnace – The SMR furnaces are generally some of the largest, if not the largest, firedheaters in a refinery. Several furnace types have been used, as shown in Table 2. The tableenumerates some of the key advantages and disadvantages of each style of heater. Today, mosthydrogen plants are either down fired or terrace-wall fired.
• Radiant tubes – Some typical hydrogen plant tube configurations are depicted in Fig. 14.The tubes are made of high nickel alloys (HK-40, Manurite, etc.). Tube IDs range from 1.5 to
5.5 in.. The tube design temperature is chosen based on the calculated maximum expected end-of-run wall temperature. The design margin today is about 50 �F higher than the maximum expected
1
10
100
Eq
uili
bri
um
% M
eth
ane
in D
ry G
as
20
30
40
60
80
8
6
4
2
Steam/Carbon Ratio
100
Pre
ssu
re, p
sig
200
300
400
500
600700
Temperature, °F
Fig. 10 CH4 slip equilibrium chart for steam/methane reforming of naphtha (After: Katalco 1970)
Handbook of Petroleum ProcessingDOI 10.1007/978-3-319-05545-9_12-1# Springer International Publishing Switzerland 2014
Page 21 of 67
wall temperature. This can be very tight. Our ability to monitor tube temperatures is about +/�100 �F. Monitoring will be discussed later.
• Burners – SMR furnaces use large numbers of burners to distribute heat evenly to all the tubes.Because the firebox operates over 2,000 �F, the burners used today are generally special low-NOxstyles. In PSA hydrogen plants, the burners have an extra, low-pressure-drop nozzle for PSAoff-gas.
Arrangement or design of the burners must avoid flame impingement on the tubes. All burnersmay not be the same size, as dictated by the heat input requirements in a given section of theheater.
• Convection section – The convection sections of hydrogen plant furnaces generally have a seriesof services. Typically, you will see coils for:• Steam superheat• Mixed steam/feed preheat• Steam generation (one or more levels)• BFW economizer/preheat• Combustion air preheat
100
Pre
ssu
re, p
sig
200
600
300400500
Temperature, °F
1
10E
qu
ilib
riu
m %
CO
in D
ry G
as
700
2
3
4
5
6
7
89
20
Steam/Carbon Ratio
Fig. 11 CO slip equilibrium chart for steam/methane reforming of naphtha (After: Katalco 1970)
Handbook of Petroleum ProcessingDOI 10.1007/978-3-319-05545-9_12-1# Springer International Publishing Switzerland 2014
Page 22 of 67

In some areas, selective catalytic reduction (SCR) units may be installed in the flue to reduceNOx. These systems employ a catalyst matrix with very low pressure drop (inches of water).Ammonia is injected into the flue ahead of the catalyst through a grid of nozzles. The ammonia isvaporized outside the flue and diluted into hot air to improve distribution. The SCR must belocated in an exact temperature range (depending on the catalyst chosen). Sometimes, these areretrofitted to existing hydrogen plants, with the convection coils rearranged to ensure the correcttemperature range.
• Furnace draft control – SMR furnaces may be natural draft, induced draft, or forced/induceddraft. You seldom see forced draft-only furnaces in this service. Older units tend to be naturaldraft. For down-fired furnaces or where an SCR is required, induced draft is used. If a furnace hasair preheat, it will generally have both forced and induced draft fans.
The burner registers provide additional draft control. The registers must be open enough toallow the control system to work.
PSA off-gas combustion introduces a swing into the fuel gas controls that will affect draft. Thedraft will vary slightly every couple of minutes as the PSA cycles. Controls around the PSA
5
Eq
uili
bri
um
% C
O2
in D
ry G
asSteam/Carbon Ratio
10
15
30
100
Pre
ssu
re, p
sig
200
300
400500
Temperature, °F
25
20
Fig. 12 CO2 slip equilibrium chart for steam/methane reforming of naphtha (After: Katalco 1970)
Handbook of Petroleum ProcessingDOI 10.1007/978-3-319-05545-9_12-1# Springer International Publishing Switzerland 2014
Page 23 of 67

attempt to moderate the swing, but generally cannot eliminate it. With careful tuning of control-lers, the swing can generally be managed. Keep in mind that swinging draft also means swingingexcess oxygen levels.
• SMR process outlet header – The high process outlet header temperatures from an SMR furnacegive rise to special problems when transferring the effluent to the waste heat boiler. The outletheaders inside the firebox are generally high alloy (e.g., Incoloy). The high alloy is transitioned toa lower alloy header, normally something like 1¼ Cr steel, that is lined with a refractory system.Figure 15 illustrates the types of refractory arrangements normally seen in this service.
Atm
Continuous Blowdown
BFW MakeupReturnLinesfromWHB
Boiler CircAnd DragLines to
Steam Gens.
Intermit.Blowdown
Stack
Steam GenCoils Economizer
CoilSMR Inlet HDS
Super heatCoil Option
ID Fan
SCRMod
Export Steam ProcSteam
Vent to Atm, Furnace, or Process FeedFeed
Shift CondensateTo Degasifier/Deaerator Feed From Boiler Circ. Lines Stripping
SteamMakeup BFW
Degasifier/Deaerator
Waste HeatBoiler
IntermittentBlowdownDrag Lines from Steam Drum
Steam Drum
BFW StorageReturn Lines to Steam Drum
Fig. 13 Typical SMR steam system simplified process flow diagram. Note: This is only one possible configurationpresented, for example. Other steam generators may also be installed in the shift effluent
Table 5 Typical SMR hydrogen plant boiler chemical treatment (Reference: Nalco)
Function Chemical Feed point Notes and commentsOxygenscavenger
Passivatingscavenger
Deaerator/degasified storagetank
No sulfur compounds
Boiler pHcontrol
High-puritycaustic
BFW to pumpsuction
Depends on makeup water; avoid ammonia and amines
Boiler internaltreatment
Polymersystem
BFW to pumpsuction
Avoid ammonia generation; need iron dispersant capability;analytical capability to track chemicals; maximize cleanliness ofboilers
Supplementaliron dispersant
Polymersystem
BFW to pumpsuction
Needed if chelant or phosphate internal treatment is used
Condensatetreatment
Mixedamines
Export steam lineonly
Amine boiling points should match condensate system pressures;H2 plant condensate system should be stainless steel; amine in H2
plant will convert to ammonia in process
Handbook of Petroleum ProcessingDOI 10.1007/978-3-319-05545-9_12-1# Springer International Publishing Switzerland 2014
Page 24 of 67

The refractory-lined effluent piping needs to be monitored to ensure that an internal refractoryfailure does not lead to a pipe wall failure. Even a small crack in the refractory will increase walltemperature. A major refractory loss will rapidly heat the wall above its allowable maximum. Tomonitor for this, the outside wall of the transfer line is painted with temperature-indicating paint,normally changing color if the pipe wall exceeds about 500 �F. This provides a margin betweenmaximum allowable temperature and actual.
Conversely, it is important that the steel wall of the refractory-lined header be maintained abovethe water condensation temperature. The SMR effluent, if condensed, will form carbonic acid.That acid will corrode the low-alloy steel. The outside wall of the refractory lined pipe normallyruns about 250–350 �F to meet all the requirements.
• Safety – Any fired heater needs a safety system, and an SMR furnace is not an exception. Thecomplexity of the SMR means that the safety systems around these units are correspondinglymore complex. These systems will not be comprehensively covered, but a few specific consid-erations in SMR furnaces are highlighted:– Loss of draft control – Because an SMR fires at such high rates, loss of draft control in the
firebox creates a potentially hazardous situation. This can occur with loss of the forced orinduced draft fans, damper or register control issues, PSA trips, excessive changes in fuel gasrates, high or low fuel pressures, and many other causes. Safety systems for these furnacesgenerally trip on high or low draft. These systems are backed up by excess oxygen monitoringat the firebox outlet.
– SCR problems –Where a furnace has an SCR, the SCR may be tripped on high or low flue gastemperature or on loss of ratio control in the vaporizer skid. These trips are intended to avoidpotentially explosive mixtures or deposits in the vaporizer and/or flue.
– Fuel gas, pilot gas, or PSA off-gas high/low pressures –Depending on the type of failure, therewill generally be trips on several fuel stream pressures because these can cause other issues.Fuels are tripped out of the furnace to avoid accumulating an explosive mixture. Generally,pilot gas is maintained unless draft is lost.
– Firing protection – In modern reformers, the safety systems contain a number of interlocks toensure the heater is fired safely. Typical interlocks include verifying that all fuels are isolatedbefore allowing a purge, ensuring that a purge is completed, verifying that pilots are lit beforeallowing main fuel to be admitted, and verifying that the main fuel is on before allowing PSAoff-gas. Factory Mutual (FM) cock valves and nitrogen pressurization of fuel headers haveboth been used to verify fuel isolation before allowing a purge to start.
– Process trip – If the process side of the furnace trips for any reason, the heat load on the furnaceis drastically and immediately reduced. The furnace must be cut back very quickly, and this canlead to the furnace tripping on draft or fuel pressure. Generally, however, a process trip does notrequire a furnace trip if the furnace can be reduced back to pilots with control.
Waste Heat Boiler• General design – The SMR effluent steam generator or waste heat boiler is normally a large,
horizontal heat exchanger. See Fig. 16 for a sketch of a typical WHB exchanger.The inlet to the process side of the exchanger is connected to the SMR furnace with the
refractory-line transition header. The WHB inlet is normally refractory lined also, with high alloyinserts into each of the boiler tubes.
There is normally a single, larger, lined tube that passes through the boiler to act as a hot gasbypass duct. In some units, this may be an actual bypass around the WHB, rather than through it.
Handbook of Petroleum ProcessingDOI 10.1007/978-3-319-05545-9_12-1# Springer International Publishing Switzerland 2014
Page 25 of 67

The hot gas bypass is equipped with a damper to control the final process outlet temperaturefrom the WHB. The damper is generally arranged to act like a three-way valve – restricting theflow through the boiler tubes as it opens to allow hot gas bypassing. Sometimes, the bypass isautomatically controlled, but manual control is also used.
Inlet from Pigtail
Inlet fromPigtail
CatBed Cat
Bed
Outlet toPigtail
Bottom Flange for Dumping
Outlet to Header(May Have Short Pigtail)
Tubes are 35-55 ft LongPacked with CatalystTubes may be top
or bottom supported.
CatalystSupportCone or
Grid
Fig. 14 Some typical SMR tube arrangements. Note: These are examples only. There are many styles in use
InconelShroud
3" Hot FacingRefractory
Dual RefractoryLined Pipe
Outer Shell1 1/4 Cr Steel
4-6" InsulatingRefractory
Shrouded RefractoryLined Pipe
OpOpenPipe
OpenPipe
Fig. 15 Typical refractory systems for SMR furnace process outlet
Handbook of Petroleum ProcessingDOI 10.1007/978-3-319-05545-9_12-1# Springer International Publishing Switzerland 2014
Page 26 of 67

On the water side of the exchanger, the flow is generally by thermosiphon, so water from theoverhead steam drum is distributed to the WHB at several points along the bottom of the shell.Mixed steam/BFW returns to the steam drum from outlets distributed along the top of the shell.Intermittent blowdown is taken from the bottom of the shell. The steam side of theWHB is hard toinspect normally.
• Metal dusting – The process conditions in the WHB can result in metal dusting. This is where theprocess gases cause migration of carbon to the grain boundary metals, and the metal crystallitesessentially turn to dust. It is promoted by reducing gases (H2, CO, methane) in the 900–1,500 �Frange. While a hydrogen plant normally has an oxidizing atmosphere, the reformer outlet is muchcloser to reducing conditions. Metal dusting is seen more at low steam/carbon ratios. The metaltubes and the hot gas bypass in a waste heat boiler are especially susceptible to this damage. Theinserts on the tube inlets and selection of metallurgy help control this phenomenon.
PSA SystemsMost modern hydrogen plants use pressure swing adsorption (PSA) systems. Refer to the detailedPSA discussion in the section “Pressure Swing Adsorption” of this chapter for information oncritical aspects of PSAs.
Some specific areas to note about PSAs in the discussion are:
• Valves and sequence steps• PSA adsorbers• Off-gas/tail-gas drum• Control system
Wet Chemical/Solvent SystemsWet chemical or solvent CO2 removal systems present their own challenges in design. We will focuson amine solvent systems here, since they are most common. Hot carbonate and other systems havesome of the same issues, with slightly different flavors.
A couple of the challenges considered here are:
• Corrosion managementAs with most acid gas removal systems, metallurgy of the system needs to consider the
materials handled. Some specific considerations with hydrogen plant systems are:– Amine scrubbing solutions subject equipment to potential amine cracking. Post-weld heat
treatment of amine handling systems is advisable.
Outlet toHTSCRefractory-lined
Inlet Channel & Pipe TemperatureControl Damper
Mixed Phase Risers to Steam Drum
Hot SMR ProcessOutlet Hot Internal Bypass
Duct
Boiler Tubes - Refractory-faced Tubesheet - Inlet Ferrules
Outlet Channel MayAlso Be Refractory-linedBoiler Water In Boiler Water In
Intermittent Blowdown
Fig. 16 Sketch of a typical SMR furnace process outlet waste heat boiler or steam generator
Handbook of Petroleum ProcessingDOI 10.1007/978-3-319-05545-9_12-1# Springer International Publishing Switzerland 2014
Page 27 of 67

– The amine regenerator/CO2 stripper tower and overhead are subject to carbonic acid attack.Stainless steel piping is needed.
– Carbonic acid attack is also seen in some unexpected places around the stripper: shell near thereboiler return line and the piping and shell around the stripper inlet line. It is advisable toconsider alloying these areas and watching the maximum velocities.
– In MEA amine systems, arsenic compounds may be used for corrosion inhibitors. These areeffective, but introduce an additional hazard during operation and maintenance.
– Solvents tend to build heat-stable salts. These need to be eliminated to keep the solutionhealthy. Some systems employ side-stream reclaimers to remove the salts. They can also beremoved by ion exchange using an outside service company.
• FiltrationThe circulating solvent streams will build up corrosion products and other solids, in spite of
corrosion inhibitors. These materials need to be removed from the stream. This is normallyaccomplished by side-stream filtration of a slipstream off the main circulating flow. The slip-stream usually passes through a cartridge filter and may also go through an activated carbon filterto remove potential foaming materials or trace organics that you do not want in the solvent.
Materials Damage MechanismsThere are a number of mechanisms that can cause damage to materials in a hydrogen plant. Some ofthese have been alluded to in the above discussion. For a complete review of the damage mecha-nisms and management practices, please refer to API RP-571. This is an excellent resource for anytype of system.
For general reference, the mechanisms highlighted in RP-571 for hydrogen plants are summarizedin Table 3.
Operations and MonitoringOperationsThe following discussion will briefly describe the main operating phases of an SMR hydrogen plantfrom start-up through shutdown. Initial commissioning of a hydrogen plant is beyond the scope ofthis discussion. For additional detail, consult the references listed at the end of this chapter.
• Start-upStart-up of a hydrogen plant follows this general outline:
– Inventory water in the steam system. If the unit has solvent CO2 purification, the solvents areinventoried in parallel.
– Air-free the process system with nitrogen.– Pressure and circulate the process system with a noncondensable gas.
This is often nitrogen, but pure hydrogen or natural gas can also be used. Do not use reformerhydrogen.
It is also possible to heat the furnace to 800 F in the flue without circulation. The downside ofthis approach is that the high-temperature shift converter is not heated up, so it must bebypassed when steam is introduced and then heated later with process flow.
If the system uses a LTS converter, this converter should be bypassed. It will be activated later.– Fire the reforming furnace and heat to about 800 �F in the furnace outlet flue gas (convection
inlet) at 50–100 �F per hour.When the flue gas reaches the required conditions, the SCR (if applicable) can be started.
Handbook of Petroleum ProcessingDOI 10.1007/978-3-319-05545-9_12-1# Springer International Publishing Switzerland 2014
Page 28 of 67

Initially, you would use only a few burners evenly distributed in the furnace. As the furnaceheats up, addmore burners and ensure they are evenly distributed in the firebox to avoid tubefailures from flame impingement. These comments apply throughout the start-up procedure.
– Slowly start process steam and increase steam rate to at least 50 % of design with continuedheating to 1,000 �F in the process outlet temperature from the furnace.Inert circulation can be discontinued at this point since the main flow is now steam.There may be condensation of steam in the HTS converter initially, but the converter will dry
out. Do not heat the shift converter too fast to avoid catalyst damage.If the initial heat up to 800 �F did not use inert gas flow, then the HTS converter should be
bypassed and heated up with steam at a controlled rate once the main flow is stable.– Continue increasing temperature and steam rate to feed gas inlet conditions at no more than
100 �F per hour – normally about 1,200–1,300 �F on the process outlet from the SMR furnace.– Start clean feed gas.
If the system has a low-temperature shift converter, the converter is bypassed.Adjust the feed gas purification conditions to clean up the feed gas. You should have no
detectable H2S in the reformer feed gas (<0.01 ppm).– Maintain a high steam/carbon ratio (>�6.0) in the reformer as the reforming catalyst and HTS
converter catalyst are activated over a few hours.– Continue heating to 1,350–1,550 �F process outlet temperature from the SMR furnace with the
high steam/carbon ratio. Adjust the SMR and HTS temperatures to your start-of-run targets.– If the hydrogen plant uses PSA purification, the PSA can be purged out with nitrogen and then
started up, initially taking no product.Once the product hydrogen is on spec, the product can be sent to the users.The PSA off-gas can be sent to the SMR furnace for firing once the PSA is stable.
– If the hydrogen plant uses wet chemical purification, the absorber system can be started andstabilized.The methanator can be heated up before being brought on line at the initial target temperature.
Nickel carbonyl formation is a potential concern here. The methanator temperature must beover 400–450 �F before introducing gases containing CO.
CO2 production can start when the system is stable.– Once the main process is stable, the low-temperature shift converter is normally activated and
brought on line. This may be a couple of days after the main process.– Finally, move the steam/carbon ratio to the target level and begin adjusting operating condi-
tions to targets.Adjust the SMR furnace to achieve the desired methane slip.Adjust the HTS and LTS converters to obtain the target CO slip.Adjust the PSA cycle or the solvent system conditions to obtain and maintain targets.Export surplus steam.
• Routine operationsThere are not a lot of major adjustments required for hydrogen plant operating conditions
normally. The rate may be increased or decreased with corresponding adjustments, but certaintargets stay the same. Note that hydrogen plants operate best at a steady, stable rate. They do notrespond well to frequent rate changes. Daily rate changes are usually tolerable; hourly changesmake operation difficult.
The most common adjustments to operating conditions are listed below. This is, by no means, acomprehensive listing.– Feed purification
Handbook of Petroleum ProcessingDOI 10.1007/978-3-319-05545-9_12-1# Springer International Publishing Switzerland 2014
Page 29 of 67

Adjust temperatures and/or absorber flows and loadings to maintain non-detectable H2S in thereformer feed.
– Reforming furnaceMaintain steam/carbon ratio at design. Slight changes may be needed, depending on the
feedstock.Pressure is not normally changed.Reformer process outlet temperature is controlled to maintain the target methane slip.Firebox-side control of the reforming furnace is similar to other furnaces, with appropriate
safety interlocks. The PSA gas may introduce fluctuations that must be managed by thecontrols.
Adjustments to manage methane slip can be estimated from the figures included in the overallprocess discussion section. These figures relate methane slip, steam/carbon ratio, tempera-ture and pressure for methane, and naphtha feedstocks. Essentially, they are graphicalrepresentations of the SMR equilibrium with parameters in the normal operating ranges.
If the furnace has an SCR, the vaporizer and ammonia flows will be automatically controlled.They just need to be monitored.
– Shift conversionAdjust the shift converter inlet temperature to obtain the target outlet CO slip. For quick
estimates relating CO slip, temperature, and steam/carbon ratio, the following equation canbe used:
ln COð Þ ¼ 3:5514 � ln Tð Þ � 1:6775 � ln S=Cð Þ � 20:338 (21)
where:CO = v% CO in dry gasT = Temperature at reactor outlet, �FS/C = Initial steam/carbon molar ratio to SMR
Note that, because the reaction does not change the number of moles in the vapor, there isnegligible pressure effect in this range.
– Product purificationFor a PSA system, the time on adsorption for a single bed is adjusted to maintain purity.
Sometimes, this is part of the “capacity” factor. The control system makes the othernecessary adjustments. Routinely check the PSA valves for leakage around the packingsand smooth action.
For a solvent purification system, the absorption and regeneration flows, temperatures, pres-sures, and solvent loadings need to be kept within the design limits.
– Steam systemsAdjust blowdown rates to target conductivities. This may be automatic.Adjust BFW preheat conditions. This must be coordinated with other conditions.The steam system controls will normally handle changes in the plant.Stripping conditions in the shift condensate degassing system need some attention to ensure the
CO2 is removed. Use the system design as a guideline to what conditions to expect.• Shutdown
Shutdown of a hydrogen plant generally follows the same sequence, regardless of the type ofunit. The primary steps are:– Cool reforming furnace to 1,200–1,300 �F process outlet temperature.
Handbook of Petroleum ProcessingDOI 10.1007/978-3-319-05545-9_12-1# Springer International Publishing Switzerland 2014
Page 30 of 67

– Stop feed, but continue steam. Stop the PSA, if present.– Steam the catalysts for 2–6 h at 1,200 �F in the reformer.
The LTS converter may be bypassed and shut down separately.– Cool the reforming furnace with steam flow at no more than 100 �F per hour to about 800 �F at
the flue gas outlet from the radiant box.During this time, inert gas flow can be reintroduced to the process, if desired. Inert flow will
help cool the HTS converter and other equipment.If the unit has a methanator, it should be removed from the flowing system and separately
purged at least five times with nitrogen before cooling below 400–450 �F to prevent nickelcarbonyl formation.
– Stop steam flow. If using inert flow, continue cooling with the inert gas. The SMR furnace canbe shut down when firing reaches minimum.
– Purge the entire system with nitrogen to eliminate hydrogen and hydrocarbons. Test for CO inthe gas. The concern is that nickel carbonyl may form at low temperatures (<�450 �F). COmust be less than 10 vppm in the system if you are below this temperature. The methanator isespecially susceptible to nickel carbonyl and should be managed separately as noted above.
MonitoringTable 6 provides a list of the key variables to monitor in an SMR hydrogen plant, along with thefrequency. The following discussion describes calculation of some of these key variables. Issuesaround tube wall temperature monitoring in reforming furnaces are also discussed.
Most catalyst suppliers for hydrogen plants will provide a detailed material balance and analysisof your unit’s performance if you provide them with operating data. Table 7 indicates the informa-tion needed to obtain a detailed performance analysis from a supplier. You should be continuallymonitoring the unit yourself; but, it is still a good idea to have a third party evaluation periodically(say quarterly). This service is usually provided at no cost.
• Material balanceSuccessful monitoring of an SMR hydrogen plant process starts with a good material balance
for the plant at a point in time. The flow, composition, pressure, and temperature for the processstreams at the following points are required for the best results. The minimum data required areindicated by asterisks below:– Feed gas ahead of pretreat system
Gas chromatograph (GC) analysis* – note that even natural gas feed will have variablecomposition
You especially need the moles of carbon per mole of feed*Flow rate*
– Feed pretreat system inletFeed gas analysis from aboveFlow rate of feed and recycle hydrogen
– Reforming furnace inletComposition calculated from pretreat system inlet after reactions plus process steam flowFlows for feed gas and steam*
– Reforming furnace outlet/HTS inletIdeally, you want a GC of the reformer outlet gas, but this is a hard sample to take.You can back calculate the composition from the methane contents in the raw hydrogen to
purification*.
Handbook of Petroleum ProcessingDOI 10.1007/978-3-319-05545-9_12-1# Springer International Publishing Switzerland 2014
Page 31 of 67

Total flow will be the same as the reformer inlet.– LTS inlet (if applicable)
Need a GC of the HTS converter outletTotal flow is normally the same as the HTS outlet.
– Raw hydrogen before purificationNeed a GC of this dry gas going to the purification system*Assume the gas is saturated with waterNeed the total gas rate*
– Product hydrogen to methanator (if applicable)
Table 6 Typical key SMR hydrogen plant monitoring parameters
Monitored variable Frequency Basis
Overall unit
Feed rate(s) Daily Trend meters
Production rate(s) Daily Trend meters
Material balance Weekly/monthly Detailed calculation
Feed pretreat process
Hydrogen recycle rate Daily Trend meter
Hydrotreater temperatures Weekly Review data
Zinc oxide bed outlet H2S Weekly Look for breakthrough
SMR and shift processes
Steam/carbon ratio Daily Trend, verify weekly
Reformer outlet temperature Daily Trend
Reformer outlet pressure Daily Trend
Reformer tube pressure drop Weekly Trend normalized dP – watch for jumps
Reformer max tube wall temp Weekly Trend, watch for hot spots
Methane slip Daily Trend, adjust
Reformer ATE Weekly/monthly Calculate, trend – watch for deactivation
Shift converter outlet temps Daily Trend
Shift converter rises Daily Trend
CO slip Daily Trend, adjust
HTSC ATE Weekly/monthly Calculate, trend – watch for deactivation
LTSC temp front location Weekly/monthly Calculate, trend – watch for deactivation
Boiler water chemistry Weekly pH, conductivity, hardness – adjust
Steam production/distribution Weekly Trend – watch for loss in rates
SCR performance Weekly/monthly Watch for increasing NH3 rqmt => deactivation
Product purification
Overall purification
Product purity, % H2 Weekly Watch for loss of purity, ethane
Product H2/unit feed Weekly Watch for loss of efficiency, trends
Solvent/wet chemical
Lean and rich loadings Weekly Keep within design limits
Methanator rise Daily Trend, watch for increases => CO2 removal problem
Methanator temp front location Weekly/monthly Trend location in bed => deactivation
CO2 production rate Daily Trend
Pressure swing adsorption
Recovery, v% raw H2 Weekly Calculate and trend => efficiency loss, optimization
Handbook of Petroleum ProcessingDOI 10.1007/978-3-319-05545-9_12-1# Springer International Publishing Switzerland 2014
Page 32 of 67

A GC of this is nice, but it can be estimated from the raw hydrogen by removing the CO2.The stream will be saturated with water at absorber overhead conditions.
– Product hydrogenNeed a GC of this stream*Need flow rate*
– Product CO2 (if applicable)This stream will be mostly CO2, so it mainly needs the temperature and pressure.It will be saturated with water at production conditions.
– PSA off-gas (if applicable)GC of the gas*Flow rate*
– Shift condensateThis stream is normally not metered, so the flowmust normally be calculated or estimated from
the other streams.It may be sampled; the CO2 content can be estimated assuming the water is saturated with CO2
at production conditions.If there are hot and cold shift effluent separators, you need to estimate the flows and CO2
contents for each separator.Using the available data, a component-by-component material balance can be constructed,
along with the pressure and temperature for each stream. An example of how to do this is in theAppendix of this chapter.
Table 7 Example of data needed by third party to analyze hydrogen plant performanceSMR Design Data Date:
Number of tubes Unit:Tube ID/OD inches Location:Fired/loaded height feet Notes:Tube material 1. Provide as much actual data as possible.Type of furnace 2. Use only measured values.
Key Flow Rates 3. Provide process PFD.Design feed rate MMscfdFeed rate MMscfdRecycle H2 MMscfdRaw H2 to purification MMscfdTotal product MMscfdPSA offgas MMscfdProcess steam lbs/hr
Gas Analyses Feed Reformer HTS LTS Meth In Meth OutH2 v%N2 v%Ar + He v%CO v%CO2 v%CH4 v%C2 v%C3 v%C4s v%C5s v%C6-Plus v%Sulfur ppm
Reactor Data Hydrotreater Cl-guard ZnO Reformer HTS LTS MethanatorCatalyst typeBed diameter feetBed height feetCatalyst volume cubic feetInlet Pressure psigOutlet pressure psigInlet temperature °FOutlet temperature °FOther bed temperatures °F & Location
Provide IRSurvey
Handbook of Petroleum ProcessingDOI 10.1007/978-3-319-05545-9_12-1# Springer International Publishing Switzerland 2014
Page 33 of 67

Where data are not available (especially GCs), the data can be calculated assuming equilibriaand using the overall equation for SMR reforming (Eq. 20). Remember that you want the wetcompositions at each point because water is a major participant in many of the reactions.
Usually, this can all be built into a spreadsheet that will reconcile all the data. This takes aninitial effort to set up; but once the spreadsheet is built, it greatly improves your ability toanalyze the hydrogen plant operation.
Once you have a reasonable material balance, catalyst activity tracking and other analysesare possible.
• Steam/carbon ratioThe molar ratio of steam to carbon is one of the most critical parameters to monitor in an
SMR. To calculate the steam/carbon ratio (sometimes abbreviated S/C):– Use the feed detailed analysis to calculate the moles of carbon per mole of feed. Include any
CO or CO2 in the feed as part of the calculation.– Calculate the total moles of feed using the feed flowmeter, with corrections. Normally, this will
be moles per hour of feed.– Calculate the molar rate of carbon in the feed from the moles carbon per mole feed times the
feed rate. This will normally be moles carbon per hour.– From the process steam flow meter, calculate the moles of steam per hour.– Divide the moles steam per hour by the moles carbon per hour to get the steam/carbon ratio.
For liquid feedstocks where composition is not necessarily available, the carbon in the feed canbe estimated using C/H ratio correlations from API based on boiling range and specific or APIgravity.
The S/C must be maintained within a specified range. A high ratio will make more hydrogen,but loses some efficiency in the process. A low ratio leads to coking and deactivation of thereforming catalyst, as well as making less hydrogen.
Note that you do not need the whole material balance to calculate the steam/carbon ratio. Often,the ratio is calculated online with sufficient accuracy using average compositions to allow thedirect control of the ratio by the basic process control system.
See the Appendix for a sample calculation of the corrected steam/carbon ratio.• Reforming catalyst approach to equilibrium
Using the reformer outlet composition from the material balance and the equilibrium K values,the equivalent reformer outlet temperature that the equilibrium corresponds to can be calculated.This calculated temperature is subtracted from the actual temperature to obtain the “approach toequilibrium” (ATE) temperature. This is a way to track reforming catalyst activity.
Note that an equation for calculating the equilibrium temperature from the calculated K value isincluded in the overall reforming process discussion in section “Primary Reforming” of thischapter (Eq. 13).
The ATE value is normally negative with fresh catalyst. The actual approach is zero, but heatloss from the actual catalyst outlet to the reformer outlet temperature measuring point results inthe negative value. This is not really a problem, because you will track catalyst activity by relativechanges in the ATE.
Over time, the reformer ATE trends upward as the furnace eventually cannot reach equilibrium.At some point, you decide to replace the catalyst. Reformer catalyst can typically operate over5 years, unless it is poisoned or coked. However, even a few minutes with very low or no steam inthe feed may dictate an immediate end of run.
Handbook of Petroleum ProcessingDOI 10.1007/978-3-319-05545-9_12-1# Springer International Publishing Switzerland 2014
Page 34 of 67
The ATE value calculated will bounce around significantly, so you are really looking for atrend. Another hint that the catalyst is spent is if you detect any ethane above �0.05 v% in theproduct hydrogen.
See the Appendix for a sample calculation of the reformer approach to equilibrium.• HTS catalyst approach to equilibrium
Similar to the reforming furnace, you can calculate the approach to equilibrium from HTSusing your material balance compositions and the previously provided equilibrium information.
Note that an equation for calculating the equilibrium temperature from the calculated K value isincluded in the overall reforming process discussion in section “Primary Reforming” of thischapter (Eq. 16).
The HTS will not completely reach equilibrium, normally. A plot of the ATE in the HTS willtrend upward with catalyst deactivation. You will need to decide at what point you want to replacethe HTS catalyst. Usually, this will be determined by the amount of CO slipping and your abilityto handle it downstream. The ATE plot does allow early identification of major problems.
See Appendix for a sample calculation of the HTS converter approach to equilibrium.• PSA recovery
For units with PSAs, it is important to track the hydrogen recovery in the PSA. Poor recoverymay indicate problems with the valves as well as potential adsorbent issues.
Using the material balance, you can determine the hydrogen recovery in several ways. Themost straightforward approach is to determine the percentage of the incoming hydrogen that exitsin the product hydrogen stream. Since the product hydrogen is essentially 100 % hydrogen, therecovery is just the product hydrogen flow rate divided by the PSA feed gas % hydrogen timesfeed gas rate, all times 100 %.
This recovery should be around 85–87 %. If it is lower, the PSA is not performing and needs tobe further investigated. If it is above about 92 %, there is probably a metering or analysis error.
See the Appendix for a sample calculation of PSA recovery.• Reforming furnace tube wall temperature monitoring
One of the trickiest aspects of SMR furnace operation seems to be obtaining accurate tube walltemperatures. When you “shoot the tubes” with an infrared thermometer, there are a number ofinterferences:– You are looking through hot combustion gases that have some luminosity.– You are getting reflections from the very hot furnace refractory walls.– You may be seeing part of the furnace refractory in the background.– The emissivity of the tube walls may be different or the tube wall may have a deposit on it.
To manage some of these interferences, IR thermometers for hydrogen plants look at arelatively narrow frequency of IR radiation that minimizes the gas interference. The measuringzone on an IR thermometer is usually a small spot focused on the tube. A laser sight may be used.Equations are used to correct the reading for background and reflected radiation.Still, the resulting tube wall temperature measurements are probably not accurate to more than+/� 50–100 �F.
There are techniques available, such as the “gold cup measurement method,” which directlymeasure tube wall temperature by contact. These can be used to verify other readings or tocalibrate readings.
Some refiners routinely take infrared photos of their tubes tomonitor issues and trends. This is agood approach for trending, but, from experience, these photos seem to indicate higher temper-atures than other methods.
• Reformer pressure drop
Handbook of Petroleum ProcessingDOI 10.1007/978-3-319-05545-9_12-1# Springer International Publishing Switzerland 2014
Page 35 of 67
Pressure drop in the reformer tubes is one of the best and simplest methods to track catalystcoke buildup and catalyst crushing. The pressure drop needs to be normalized for rate.
To normalize the pressure drop in a furnace, you can use Eq. 22. The flow factor is usually thevolumetric flow of steam plus feed gas. You could refine the factor further, but the simplevolumetric flows at STP seem to work fine. The exponent, n, is determined by trial and error tominimize scatter of the normalized dPs. Once set, the same value of n is used consistently for agiven plant, and it is usually between 1 and 2:
dPnorm ¼ dPact � Fnorm=Factð Þn (22)
wheredPnorm = normalized pressure dropdPact = measured pressure dropFnorm = flow factor at normalized conditionFact = flow factor at measured conditionsn = scaling exponent, determined by best fit
The normalized pressure drop is trended with time. When excessive coking incidents orshutdowns occur, you will see step increases in the normalized pressure drop. The maximumallowable pressure drop will normally be set by either (1) the ability to get feed gas into the plantor (2) the ability of the purification system to deliver product at the required pressure. Once themaximum dP is reached, the reformer catalyst has to be replaced.
See the Appendix for a sample calculation of normalized reformer pressure drop.• LTS converter activity
Tracking of catalyst activity in a low-temperature shift converter is accomplished by trackingthe position of the temperature rise front (as a percentage of the total bed depth) as it movesthrough the catalyst bed. The catalyst is poisoned slowly in service by both sulfur and chloride in aplug-flow manner. It is much more sensitive to these poisons than reforming or HTS catalysts.
Replacement of the LTS catalyst should be planned when the deactivated catalyst reaches about70–80% of the bed depth. The position of the deactivated catalyst front can be plotted with time toproject end of run.
Note that if there is a sulfur slip problem in the feed gas pretreatment system, the LTS catalystwill take a large hit and may need to be replaced immediately. Activity of this catalyst cannot berecovered in service.
• Methanator activitySimilar to a LTS catalyst, methanator catalyst will deactivate in a plug-flow manner. The
methanation reaction occurs quickly, producing a sharp temperature rise in the catalyst bed. Theposition of this sharp rise can be trended using the available temperature points at differentelevations in the bed. The bed should be replaced when the rise is about 70–80 % of the waythrough the bed.
Fortunately, methanator catalyst is fairly robust, so it does not deactivate quickly.
Catalyst ChangeoutFixed-Bed ReactorsChangeout of the fixed-bed catalysts and sorbents in a hydrogen plant is similar to changeout offixed beds in any other process units. There are a few specific points highlighted below.
Handbook of Petroleum ProcessingDOI 10.1007/978-3-319-05545-9_12-1# Springer International Publishing Switzerland 2014
Page 36 of 67

• Methanator and hydrotreating catalysts contain nickel and may generate nickel carbonyl if anyCO is present.– In the methanator, COmay be left by inadequate purging during shutdown. Refer to comments
in the generic shutdown procedure.– Hydrotreating catalyst that has coke on it can begin low-level combustion and generate
CO. The CO may react with nickel on the catalyst to release nickel carbonyl.– In both cases, the reactors should be routinely monitored for COwhenever work is occurring in
or around the reactors.• PSA adsorbents are normally dense loaded using a method specified by the technology provider.
The pressure drop through each vessel must be as close as possible to the same value, so care mustbe taken during the dense loading process.
• PSA adsorbents generate a large amount of heat if they are exposed to water, even atmosphericmoisture. Do not let these materials get wet and do not unload or load adsorbents in rain.
• Shift catalysts, both HTS and LTS, will probably be self-heating if they contact air. Monitor theunloading atmosphere to keep them blanketed with inert gas.
• Zinc oxide, carbon adsorbents, and certain other solids used in a hydrogen plant reactor do nothold up well during handling. They will generate a lot of dust. Respiratory protection and dustmanagement practices should be employed by anyone near these materials.
• Because of the high nickel content of methanator catalyst, respiratory protection must be used byanyone handling either fresh or used methanator catalyst.
• Get samples of all your spent materials for postmortem analysis. Your catalyst supplier willgenerally be willing to provide some analyses of the spent catalysts to identify poisoningmechanisms and other potential issues.
Work with your catalyst and adsorbent suppliers and the catalyst handling personnel to ensure thematerials are loaded and unloaded safely and correctly. This will provide the best performance fromthe fixed-bed reactors and absorbers/adsorbers.
SMR Reformer TubesUnloading and loading of reformer tubes presents some special challenges. Each tube is a small,fixed-bed reactor. A few of the critical items are noted below.
• The reforming catalyst contains high levels of nickel, which is a known carcinogen. Anyonehandling the catalyst or around catalyst dust should be wearing respiratory protection. Vacuumsystems and dust suppression measures should be used.
• Catalyst is unloaded from the reformer furnace tubes by vacuuming. It may be necessary to breakthe catalyst up to get it out. Contractors experienced in hydrogen plant catalyst replacement areaccustomed to the procedures.
• Reloading of catalyst is best accomplished with one of several available dense loading methods(Unidense, Spiraload, Catcade, etc.). Sock loading can be done, but is not as effective (i.e., youwill probably have to vacuum out and reload more tubes to meet pressure-drop constraints).
• A typical catalyst tube loading and loading data sheet are shown in Table 8.• Every tube in the reforming furnace must have as close to the same pressure drop as possible
because flow to the tubes is distributed by pressure drop. The dPs of all tubes will be measured(1) empty, (2) after loading each layer of catalyst, and (3) after all the tubes are completely loaded.When measuring the dP on each layer, load all the tubes before taking the measurements and donot load tubes while you are taking measurements. Each dP should be within +/� 10 % of the
Handbook of Petroleum ProcessingDOI 10.1007/978-3-319-05545-9_12-1# Springer International Publishing Switzerland 2014
Page 37 of 67

average dP using a pressure-drop measurement apparatus like that shown in Fig. 17. Anexperienced hydrogen plant catalyst loading company will have their own pressure-drop appa-ratus. Dense loading techniques generally are able to achieve +/� 5 %.
• Sample the spent SMR catalyst from each catalyst layer at several points in the furnace.Composite these samples by layer for analysis. Your catalyst supplier will generally provide apostmortem analysis of the catalyst to identify poisoning mechanisms and enable him to adviseyou on future operations. This is especially important if you experience a rapid, unexpectedpoisoning event for which you could not identify a cause.
• When loading, make sure you get the right catalysts in the right order in the tubes. This is mosteasily accomplished by only loading one type of catalyst at a time throughout the entire furnace.
Table 8 Typical SMR furnace tube loading and data record sheet
Lo
adin
g D
ate:
Un
it/E
qu
ipm
ent:
Pag
e __
____
of
____
___
Inle
t
Vid
eoO
uta
ge
Vo
lum
eW
eig
ht
Ou
tag
eV
olu
me
Wei
gh
tO
uta
ge
Vo
lum
eW
eig
ht
Ch
eck
Tub
e N
oft-
incf
tlb
sft-
incf
tlb
sft-
incf
tlb
sE
mpt
yE
mpt
yM
iddl
eF
ull
Alk
alyz
edC
atal
yst
(~40
-50%
)
Prim
ary
Met
hane
Ref
orm
ing
Cat
alys
t(~
50-6
0%)
Larg
eC
atal
yst
Sup
port
(Ove
r O
utle
tC
one)
Ou
tlet
Pre
ssu
re D
rop
sps
i
Lo
adin
g M
easu
rem
ents
Bo
tto
m S
up
po
rtP
rim
ary
Ref
orm
ing
Alk
ayze
d (
To
p)
Cat
alys
t
Mea
sure
Out
ages
from
Top
Flan
ge F
ace
Targ
etD
epth
Targ
etD
epth
Mea
sure
dP H
ere
Mea
sure
dP H
ere
Mea
sure
dP H
ere
Handbook of Petroleum ProcessingDOI 10.1007/978-3-319-05545-9_12-1# Springer International Publishing Switzerland 2014
Page 38 of 67

• It is a good practice to select a few tubes in different sections of the furnace to load as “test tubes”before beginning to load the entire furnace. Usually, you pick about 1–3 % of the furnace tubes astest tubes. Load this subset of tubes just like you load the rest of the furnace: (1) take empty dPs,(2) load each layer and then measure dPs, and (3) take final dPs after loading. Track the weight ofcatalyst in each layer of the test “tubes” (and how many buckets or socks are required for eachlayer). The resulting data will act as a check on loading the balance of the furnace.
• After a tube is loaded, cover the tube opening to ensure nothing gets accidently dropped into thetube before closure.
Loading the SMR furnace sounds more difficult than it is. An experienced hydrogen plant loadingcontractor will be able to perform the work adequately.
TroubleshootingAs alluded to in the foregoing discussion, there are several things that can result in problems whenoperating a hydrogen plant. Table 9 provides a matrix of the most common symptoms and relatedproblems in the SMR process, along with potential remedies. This table is by no means all-inclusive,but can be used as a starting point for troubleshooting.
SMR Process Flow Sheet VariationsThe foregoing section described the most common, and simplest, process flow sheet for carrying outsteam-methane reforming with a couple of minor variations in the product hydrogen purificationsystem. There are other process variations in commercial operation. These are less common, but maybe encountered or considered for a specific plant. Some variations may be helpful in debottleneckingor production rate increases. The three most common variations are briefly described below.
Keep AirPressureConstant
Here
Fixed FlowOrifice
Sets Rate(Target 10-20 psi dP)
CleanAir
SupplyTube dP is Read Here
General Procedure:1. Tube bottom open to atmosphere.2. Insert plumber's plug into tube.3. Pressure up plumber's plug to seal.4. Slowly open clean air supply flow to tube.5. Allow flow to stabilize.6. Read tube pressure drop on indicated gauge. Record.7. Block in clean air supply.8. Allow indicated pressure to decay to zero. (If you fail to do this, catalyst will be blown out of tube.)9. Depressure and remove plumber's plug.10. Go to next tube and repeat until all dPs are complete.
Air toPlumber's
Plug
Plumber'sPlug Seal
Tube Open to Atmosphere
PI FO
PI
Fig. 17 Procedure for measuring SMR furnace tube pressure drops
Handbook of Petroleum ProcessingDOI 10.1007/978-3-319-05545-9_12-1# Springer International Publishing Switzerland 2014
Page 39 of 67
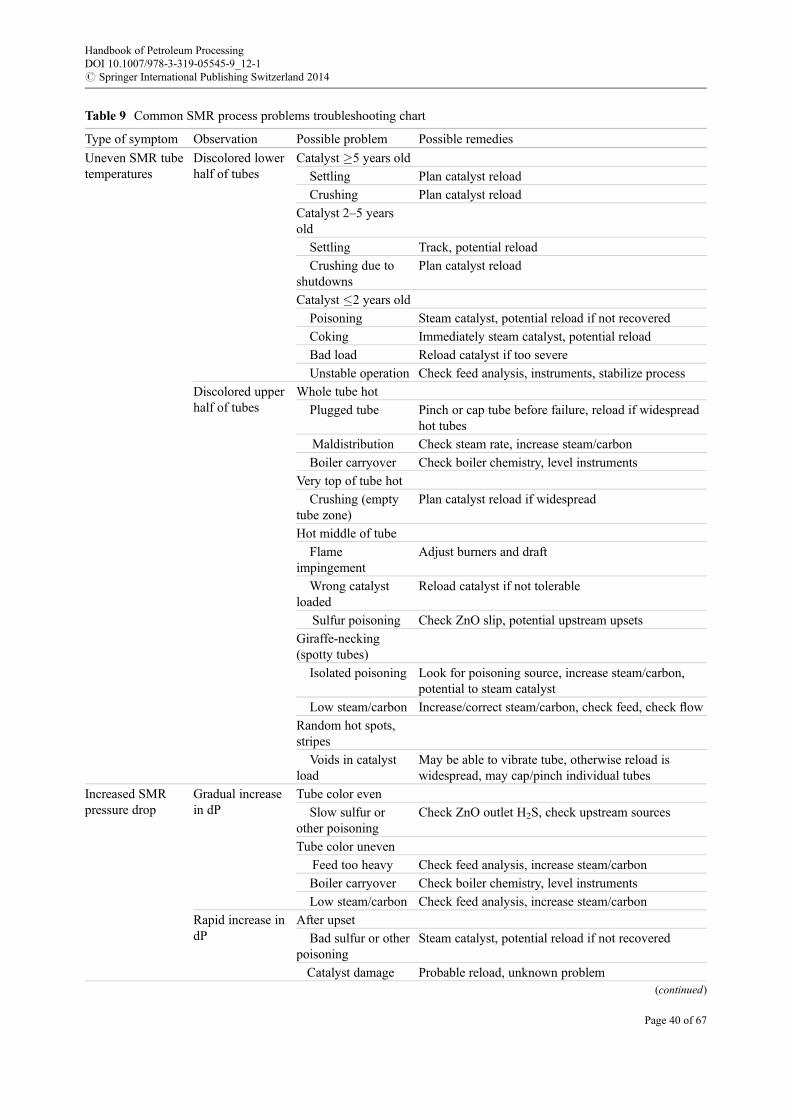
Table 9 Common SMR process problems troubleshooting chart
Type of symptom Observation Possible problem Possible remedies
Uneven SMR tubetemperatures
Discolored lowerhalf of tubes
Catalyst �5 years old
Settling Plan catalyst reload
Crushing Plan catalyst reload
Catalyst 2–5 yearsold
Settling Track, potential reload
Crushing due toshutdowns
Plan catalyst reload
Catalyst 2 years old
Poisoning Steam catalyst, potential reload if not recovered
Coking Immediately steam catalyst, potential reload
Bad load Reload catalyst if too severe
Unstable operation Check feed analysis, instruments, stabilize process
Discolored upperhalf of tubes
Whole tube hot
Plugged tube Pinch or cap tube before failure, reload if widespreadhot tubes
Maldistribution Check steam rate, increase steam/carbon
Boiler carryover Check boiler chemistry, level instruments
Very top of tube hot
Crushing (emptytube zone)
Plan catalyst reload if widespread
Hot middle of tube
Flameimpingement
Adjust burners and draft
Wrong catalystloaded
Reload catalyst if not tolerable
Sulfur poisoning Check ZnO slip, potential upstream upsets
Giraffe-necking(spotty tubes)
Isolated poisoning Look for poisoning source, increase steam/carbon,potential to steam catalyst
Low steam/carbon Increase/correct steam/carbon, check feed, check flow
Random hot spots,stripes
Voids in catalystload
May be able to vibrate tube, otherwise reload iswidespread, may cap/pinch individual tubes
Increased SMRpressure drop
Gradual increasein dP
Tube color even
Slow sulfur orother poisoning
Check ZnO outlet H2S, check upstream sources
Tube color uneven
Feed too heavy Check feed analysis, increase steam/carbon
Boiler carryover Check boiler chemistry, level instruments
Low steam/carbon Check feed analysis, increase steam/carbon
Rapid increase indP
After upset
Bad sulfur or otherpoisoning
Steam catalyst, potential reload if not recovered
Catalyst damage Probable reload, unknown problem(continued)
Handbook of Petroleum ProcessingDOI 10.1007/978-3-319-05545-9_12-1# Springer International Publishing Switzerland 2014
Page 40 of 67

Pre-reformingA pre-reformer is a fixed-bed reactor installed upstream of the main SMR reforming furnace. Thepre-reformer performs the cracking part of the reactions (Eq. 8) and does some minor reforming.At the pre-reformer outlet, the feedstock has been converted to essentially all methane for the SMRfurnace. This enables the furnace tube volume to be devoted to the SMR reaction.
A pre-reformer also acts as a guard bed for the main reforming catalyst; it takes any impacts frompoisoning and protects the furnace catalyst. Pre-reformers can often be taken off-line and changedout, while the main process continues, albeit with an easier feed during the changeout. Pre-reformercatalyst is permanently deactivated by sulfur, chlorine, and other poisons. The pre-reformer helpsopen up the possible feedstocks for a hydrogen plant and levels out feedstock variations.
Heat is supplied to the pre-reformer by replacing one of the convection steam generation coilswith a pre-reformer preheat coil. This means less steam generation from the plant, but improveshydrogen production efficiency.
Some process designers like to always include a pre-reformer in their flow sheet. Others offerpre-reforming as an option or for increasing rate. Addition of a pre-reformer to an existing hydrogenplant can enable it to make about 10–20 % more hydrogen and use a lower steam/carbon ratio. Theshift cooling and product purification systems still need to have enough capacity to handle theincremental raw hydrogen produced, so some additional debottlenecking may be required.
This technology is offered by Haldor Topsoe, ThyssenKrupp Uhde (Uhde), CB&I/HoweBaker,Technip, Kellogg Brown & Root (KBR), and others.
Table 9 (continued)
Type of symptom Observation Possible problem Possible remedies
Heavy feed duringupset
Immediately steam catalyst, run high S/C for extendedperiod,
Compaction Reload catalyst
No upset
Bad dP instrument Check instrument
Bad metering Check meters
Low steam/carbon Check feed analysis, increase steam/carbon
Heavier feed thanknown
Check feed analysis, increase steam/carbon
High methanatortemperature
High rise High Inlet CO2
CO2 removalsystem failure
Correct CO2 removal system problem, bypassmethanator or shutdown to fix
Low reformer outlettemperature
Check feed, S/C, adjust SMR temperature
Poor shift converteroperation
Check feed, S/C, adjust HTS/LTS temperatures
Low steam/carbonratio
Check feed analysis, increase steam/carbon
High feed carboncontent
Check feed analysis, increase steam/carbon
Sulfur poisoning ofreformer or shift
Steam reformer catalyst, replace shift catalyst
PSA systemproblems
PSA system problems are beyond the scope of this chart. Work with your PSA vendor totroubleshoot PSA problems
Handbook of Petroleum ProcessingDOI 10.1007/978-3-319-05545-9_12-1# Springer International Publishing Switzerland 2014
Page 41 of 67

Exchanger Reforming/Post-ReformingAn exchanger reformer uses waste heat from the SMR furnace to reform additional feed and makemore hydrogen. The post-reformer is usually an exchanger with catalyst-packed tubes. Heat issupplied by waste heat in the SMR furnace effluent or convection section at the expense of steamgeneration.
This type of reformer can also be used in place of a primary reformer with tight heat integration.Additional feed gas and steam may be introduced ahead of the post-reformer to provide incre-
mental production. About 35–40% additional hydrogen can be made by post-reforming. As with thepre-reformer, the shift cooling and product purification systems may have to be debottlenecked totake advantage of post-reforming.
This technology is offered by Haldor Topsoe, KBR, Uhde, and others.
Autothermal ReformingAutothermal reforming (ATR) can be added in parallel to a standard SMR furnace to significantlyincrease hydrogen production or it can be used in place of the conventional SMR furnace. Inautothermal reforming, feed gas is partially burned using pure oxygen. Steam may be injectedalong with the feed. The CO2 produced is recycled to moderate the combustion temperatures. Theheat from burning is used to drive the reforming reactions in the balance of the feed. You make COdirectly in the combustion process and then shift it to hydrogen. No catalyst is required; however,some systems do incorporate reforming catalyst. The ATR effluent joins the main hydrogen plantgases going to the HTS converter and flows through the rest of the plant.
An ATR can also be used in series as a post-reformer. You find ATRsmore commonly in ammoniaor methanol manufacture than refinery hydrogen production, since ATRs can easily make thenecessary synthesis gas.
This approach to reforming is related to gasification, although gasification usually refers tomaking hydrogen from residuum/pitch or solids by partial oxidation followed by a sour shift reactorand product cleanup.
As with the other variations, if an ATR is added, the cooling and purification system capacitiesmay need to be debottlenecked. This type of reformer also requires availability of pure oxygen,which usually means proximity to an air separation plant.
This technology is offered by several suppliers, including Haldor Topsoe, KBR, S€ud Chemie,Lurgi, Imperial Chemical Industries, and Johnson Matthey.
Partial Oxidation
IntroductionPartial oxidation (POX) has been used commercially to produce hydrogen from very heavy liquidfeedstocks (resid, asphalt, tar) and solids (coal, petroleum coke). Essentially, this is a gasificationprocess. More commonly, the technology is used to generate synthesis gas for other products,however. Texaco had several POX hydrogen plants at one time, but these have been largely replacedby the more reliable and easier to operate SMR furnace plants. Still you will occasionally find POXplants associated with refineries.
POX is essentially the same as autothermal reforming discussed above. The distinction drawnhere is between the types of feedstocks. In autothermal reforming, we have focused on gases throughnaphtha. There are several of that type of plant in operation. The autothermal reformer feedstock hasgenerally been cleaned to SMR reformer standards, so sulfur in minimal.
Handbook of Petroleum ProcessingDOI 10.1007/978-3-319-05545-9_12-1# Springer International Publishing Switzerland 2014
Page 42 of 67
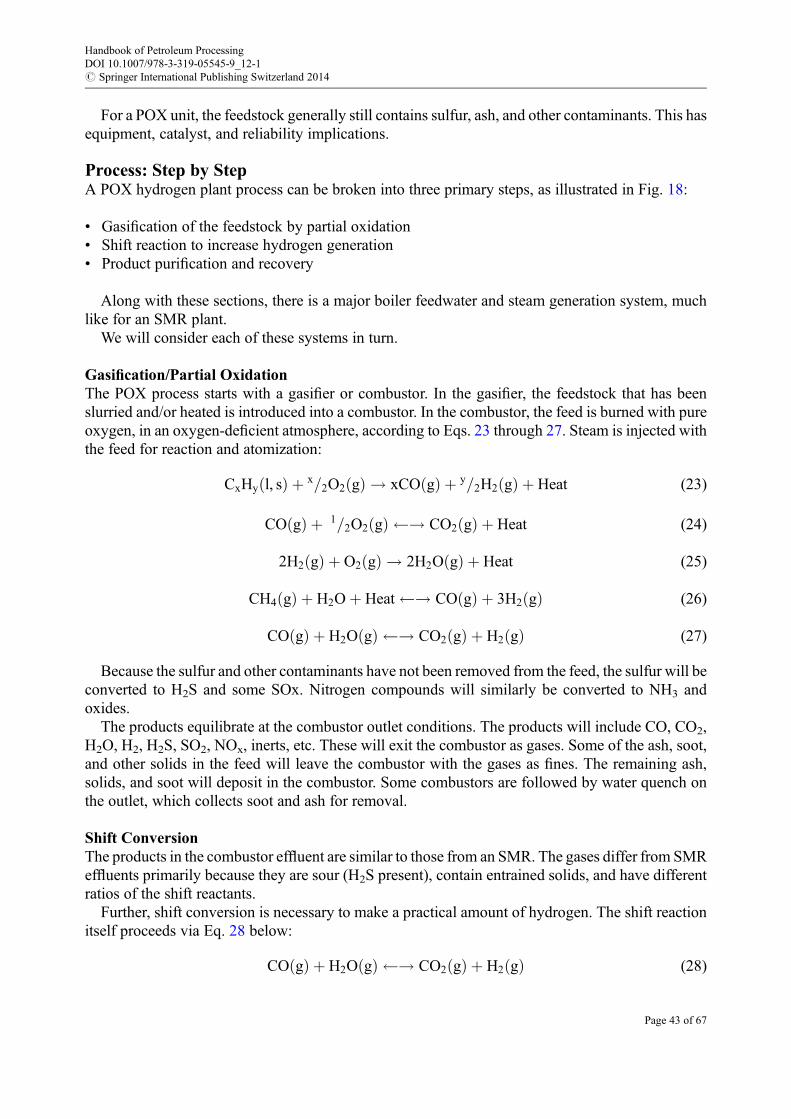
For a POX unit, the feedstock generally still contains sulfur, ash, and other contaminants. This hasequipment, catalyst, and reliability implications.
Process: Step by StepA POX hydrogen plant process can be broken into three primary steps, as illustrated in Fig. 18:
• Gasification of the feedstock by partial oxidation• Shift reaction to increase hydrogen generation• Product purification and recovery
Along with these sections, there is a major boiler feedwater and steam generation system, muchlike for an SMR plant.
We will consider each of these systems in turn.
Gasification/Partial OxidationThe POX process starts with a gasifier or combustor. In the gasifier, the feedstock that has beenslurried and/or heated is introduced into a combustor. In the combustor, the feed is burned with pureoxygen, in an oxygen-deficient atmosphere, according to Eqs. 23 through 27. Steam is injected withthe feed for reaction and atomization:
CxHy l, sð Þ þ x=2O2 gð Þ ! xCO gð Þ þ y=2H2 gð Þ þ Heat (23)
CO gð Þ þ 1=2O2 gð Þ ! CO2 gð Þ þ Heat (24)
2H2 gð Þ þ O2 gð Þ ! 2H2O gð Þ þ Heat (25)
CH4 gð Þ þ H2Oþ Heat ! CO gð Þ þ 3H2 gð Þ (26)
CO gð Þ þ H2O gð Þ ! CO2 gð Þ þ H2 gð Þ (27)
Because the sulfur and other contaminants have not been removed from the feed, the sulfur will beconverted to H2S and some SOx. Nitrogen compounds will similarly be converted to NH3 andoxides.
The products equilibrate at the combustor outlet conditions. The products will include CO, CO2,H2O, H2, H2S, SO2, NOx, inerts, etc. These will exit the combustor as gases. Some of the ash, soot,and other solids in the feed will leave the combustor with the gases as fines. The remaining ash,solids, and soot will deposit in the combustor. Some combustors are followed by water quench onthe outlet, which collects soot and ash for removal.
Shift ConversionThe products in the combustor effluent are similar to those from an SMR. The gases differ from SMReffluents primarily because they are sour (H2S present), contain entrained solids, and have differentratios of the shift reactants.
Further, shift conversion is necessary to make a practical amount of hydrogen. The shift reactionitself proceeds via Eq. 28 below:
CO gð Þ þ H2O gð Þ ! CO2 gð Þ þ H2 gð Þ (28)
Handbook of Petroleum ProcessingDOI 10.1007/978-3-319-05545-9_12-1# Springer International Publishing Switzerland 2014
Page 43 of 67

There are two general approaches to shift conversion in POX plants, as illustrated in Fig. 18.
• The H2S can be removed, along with soot and other solids and the resulting gases sent toconventional shift converters – a process tolerant of impurities is used for this, such as Rectisol(cold methanol).
• The soot and solids can be removed and the product sent to a sour shift converter before finalcooling. The availability of sour shift catalysts is fairly recent.
Product Purification and RecoveryThe raw hydrogen is finally purified. If the raw hydrogen is sour, the purification system will need toremove both H2S and CO2. This would entail a system like a CO2 Rectisol (cold methanol), whichmay be followed by PSA. If the sour components have been removed ahead of the shift reactor(or after shifting), then the purification system can be either wet chemical/solvent or PSA.
Equipment Design and MetallurgyThe key to the POX process is the combustor/gasifier design and the quench immediatelydownstream.
Several combustor system designs have been used. There are many combustor variations offeredby Linde, Shell, Lurgi, and others. Because this is a very severe service, more than one combustor isnormally installed to permit servicing of the equipment.
These systems will not be discussed in further detail here. The POX system suppliers are the bestreferences.
Concluding Remarks on POXPOX hydrogen plants are not common, but this is a viable option to make hydrogen and it has beenused on a commercial scale. The costs are high compared to making hydrogen in an SMR. Still, POXunits can feed solids and residual materials that are not feasible to run in an SMR. There are timesPOX may be favored.
We will not go into further discussion of POX at this time. Several vendors offer this technology,including Linde, Lurgi, and Shell.
BFW CO2, H2S
Steam OxygenProduct H2
~95% H2
Feed
Product H2
99.99+% H2
BFW H2S/Sulfur
FeedPretreat-
ment
PartialOxidation
SyngasCooling
Solvent CO2
Removal
Methan-ation
SyngasCooling/H2S
Removal
SweetCO Shift
Sour COShift
PressureSwing
Adsorption
Fig. 18 Block flow diagram of partial oxidation hydrogen plant options
Handbook of Petroleum ProcessingDOI 10.1007/978-3-319-05545-9_12-1# Springer International Publishing Switzerland 2014
Page 44 of 67

Electrolytic Hydrogen
IntroductionHydrogen can be made by electrolysis of water. There are packaged units available for this service.These are generally limited in size, so they are not commonly used in refineries. They are beingconsidered for renewable energy applications.
The following discussion provides only a broad brush background for this type of unit. Contactthe suppliers of these units for additional information.
ProcessElectrolytic production of hydrogen occurs in an electrolytic cell. The overall process is simple, asdescribed in Eq. 29:
H2O lð Þ þ power ! H2 gð Þ þ 1=2O2 gð Þ (29)
The reaction requires an electrolyte. Normally, potassium hydroxide is used, as noted in the flowdiagram below.
There are three types of cells available, as summarized in Table 10.The general flow sheet for an electrolysis hydrogen plant is shown in Fig. 19.
Concluding Remarks on Electrolytic HydrogenNo further details about electrolytic hydrogen production are offered here, because of the limitedopportunities for refinery application at this time. Future renewable developments may change thispicture, but widespread use of electrolytic hydrogen in refineries is not likely in the near future.
Manufacturers of commercially available units include:
Table 10 Types of electrolytic cells for making hydrogen
Type of technology Key elements
Solid oxide electrolysis cell(SOEC)
Operate at high temperatures (�800 �C); outside heat sources (waste heat) can reduceelectrical requirement, long start-up times, and material differential expansion issues
Polymer electrolyte membranecell (PEM)
Operate at low temperatures (<100 �C), simple, commercially available, variablevoltage input capabilities, no KOH required, high pressures
Alkaline electrolysis cell(AEM)
Operate at intermediate temperatures (�200 �C), high electrolyte (20–30 % KOH orK2CO3) concentrations
HydrogenTo UsersRaw Water
CompressorKOH
ElectrolyteSolution
Oxygen By product
Water
Purifier
PurifiedWater
StorageTk
KOHMixTK
ElectrolyzerModule Hydrogen
Storage
Fig. 19 Simplified typical electrolysis flow sheet for low-pressure electrolyzer (Source: Ivy 2004)
Handbook of Petroleum ProcessingDOI 10.1007/978-3-319-05545-9_12-1# Springer International Publishing Switzerland 2014
Page 45 of 67

• Avalence LLC – high-pressure and ultrahigh-pressure hydrogen, small units; brand name:“Hydrofiller,” focus on hydrogen fueling (www.avalence.com)
• Proton Onsite – fuel hydrogen and renewable focus, backup power systems integrated with fuelcells; brand name: “HOGEN RE” (www.protononsite.com)
• Teledyne Energy Systems – PEM units to 150 Nm3/h (134,000 scfd); brand name: “TITAN”(www.teledynees.com)
• NEL Hydrogen AS (Norsk Hydro) – atmospheric pressure units, 50–485 NM3/h(45,000–434,000 scfd); brand name: NEL-A (www.NEL-hydrogen.com)
• Hydrogenics – alkaline and PEM cells; brand name: “HySTAT” (www.hydrogenics.com)
Olefin Cracking By-Product Recovery
The furnaces that make olefins from refinery feedstocks like ethane, propane, and naphthas makehydrogen as a by-product according to Eq. 30, using ethane cracking as an example:
C2H6 gð Þ þ Heat! C2H4 gð Þ þ H2 gð Þ (30)
The hydrogen by-product from this reaction can be recovered as part of ethylene recovery andseparation. Recovery of the hydrogen can be accomplished cryogenically or using membranes.
This is a source of hydrogen in some refineries that are tied to chemical plants. The producthydrogen will contain some contaminants (like CO, N2, CH4), but will generally be about90–98 % pure.
Refinery Gas Recovery
IntroductionA lot of hydrogen made in a refinery finds its way into the fuel gas and other systems. Eventually,much of this hydrogen gets into fuel gas, if it is not recovered. Burning the hydrogen can be wasteful.Ideally, you want to prevent the hydrogen from getting into the fuel gas in the first place. Thatdiscussion will be covered under hydrogen management.
Many refiners chose to recover hydrogen from the various refinery off-gases for reuse. Membraneand PSA units are normally used for this service. Cryogenic recovery is also feasible, but theincreased complexity in operating cryogenic units makes them less desirable, unless recovery oflight hydrocarbons (ethane, ethylene) is also desired.
Process DiscussionMembrane RecoveryMembrane technology can be applied to several refinery gases:
• Catalytic reformer off-gas• Hydrotreater off-gas and purge• Hydrocracker off-gas and purge• Fuel gas• FCC off-gases• PSA off-gases
Handbook of Petroleum ProcessingDOI 10.1007/978-3-319-05545-9_12-1# Springer International Publishing Switzerland 2014
Page 46 of 67

Table 11 indicates how membranes can be used to recover the hydrogen from a few of these gasesand their effectiveness.
Figure 20 illustrates the key process steps in using membranes for hydrogen recovery in a possibleapplication. The pressures and purities are for illustration only.
Note that the feed gas to a membrane must be clean (no solids, low sulfur, etc.), free of liquids(both aqueous and hydrocarbon), and at elevated pressure (prefer >1,000 psig, but can be used atless than 1,000 psig). The final hydrogen from a membrane unit will be at low pressure and theimpurities are rejected at high pressure. The product hydrogen must be recompressed for use.
Additional discussion of membranes follows later in this chapter.
Pressure Swing Adsorption RecoveryPSAs can be used to recover hydrogen from refinery gases in essentially the same services asmembranes. PSA recovery will be 60–90 % of the contained hydrogen and product purity can benearly 100 %.
Figure 21 illustrates how a PSA can be integrated into a recovery scheme.The feed gas for a PSA unit must be of similar quality to that for a membrane unit – clean, no
liquids, and high pressure. The pressures used for PSAs can be somewhat lower than for a membrane(�300 psig is alright), with some loss of recovery or increase in size. The product hydrogen from aPSAwill be available at essentially feed pressure, but the purge gases containing the impurities are atlow pressure.
Additional discussion of PSAs follows later in this chapter.
Table 11 Some typical refinery hydrogen recovery membrane applications (Source: Fleming 2006)
Refinery gas source
Typical source purity Membrane product purity Hydrogen recovery
Mole % H2 Mole % H2 %
Catalytic naphtha reformer 70–80 90–97 75–95+
FCC off-gas 15–20 80–90 70–80
Hydroprocessing purges and off-gas 60–80 85–95 80–95
PSA off-gas 50–60 80–90 65–85
~1300 psig83% H2
Feed Gas
Feed GasCompressor(If Required)
Liquids
~300 psig, 99% H2PermeateHydrogen
Preheater
Residue Gas~1270 psig, 28% H2
LiqKOP
MembraneUnit
Fig. 20 An example of a hydrogen recovery membrane application (Reference: Fleming 2006)
Handbook of Petroleum ProcessingDOI 10.1007/978-3-319-05545-9_12-1# Springer International Publishing Switzerland 2014
Page 47 of 67
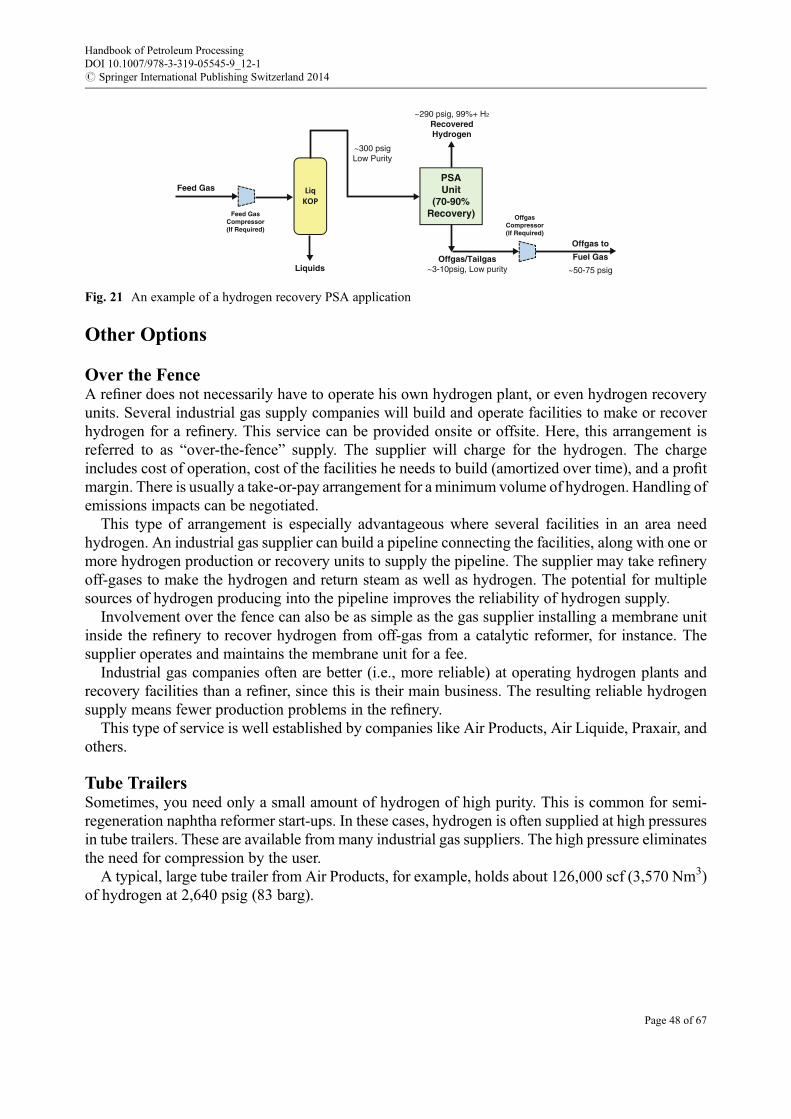
Other Options
Over the FenceA refiner does not necessarily have to operate his own hydrogen plant, or even hydrogen recoveryunits. Several industrial gas supply companies will build and operate facilities to make or recoverhydrogen for a refinery. This service can be provided onsite or offsite. Here, this arrangement isreferred to as “over-the-fence” supply. The supplier will charge for the hydrogen. The chargeincludes cost of operation, cost of the facilities he needs to build (amortized over time), and a profitmargin. There is usually a take-or-pay arrangement for a minimum volume of hydrogen. Handling ofemissions impacts can be negotiated.
This type of arrangement is especially advantageous where several facilities in an area needhydrogen. An industrial gas supplier can build a pipeline connecting the facilities, along with one ormore hydrogen production or recovery units to supply the pipeline. The supplier may take refineryoff-gases to make the hydrogen and return steam as well as hydrogen. The potential for multiplesources of hydrogen producing into the pipeline improves the reliability of hydrogen supply.
Involvement over the fence can also be as simple as the gas supplier installing a membrane unitinside the refinery to recover hydrogen from off-gas from a catalytic reformer, for instance. Thesupplier operates and maintains the membrane unit for a fee.
Industrial gas companies often are better (i.e., more reliable) at operating hydrogen plants andrecovery facilities than a refiner, since this is their main business. The resulting reliable hydrogensupply means fewer production problems in the refinery.
This type of service is well established by companies like Air Products, Air Liquide, Praxair, andothers.
Tube TrailersSometimes, you need only a small amount of hydrogen of high purity. This is common for semi-regeneration naphtha reformer start-ups. In these cases, hydrogen is often supplied at high pressuresin tube trailers. These are available from many industrial gas suppliers. The high pressure eliminatesthe need for compression by the user.
A typical, large tube trailer from Air Products, for example, holds about 126,000 scf (3,570 Nm3)of hydrogen at 2,640 psig (83 barg).
~300 psigLow Purity
Feed Gas
Feed GasCompressor(If Required)
OffgasCompressor(If Required)
Offgas to
Fuel Gas
~50-75 psigLiquids
~290 psig, 99%+ H2
RecoveredHydrogen
Offgas/Tailgas~3-10psig, Low purity
LiqKOP
PSAUnit
(70-90%Recovery)
Fig. 21 An example of a hydrogen recovery PSA application
Handbook of Petroleum ProcessingDOI 10.1007/978-3-319-05545-9_12-1# Springer International Publishing Switzerland 2014
Page 48 of 67
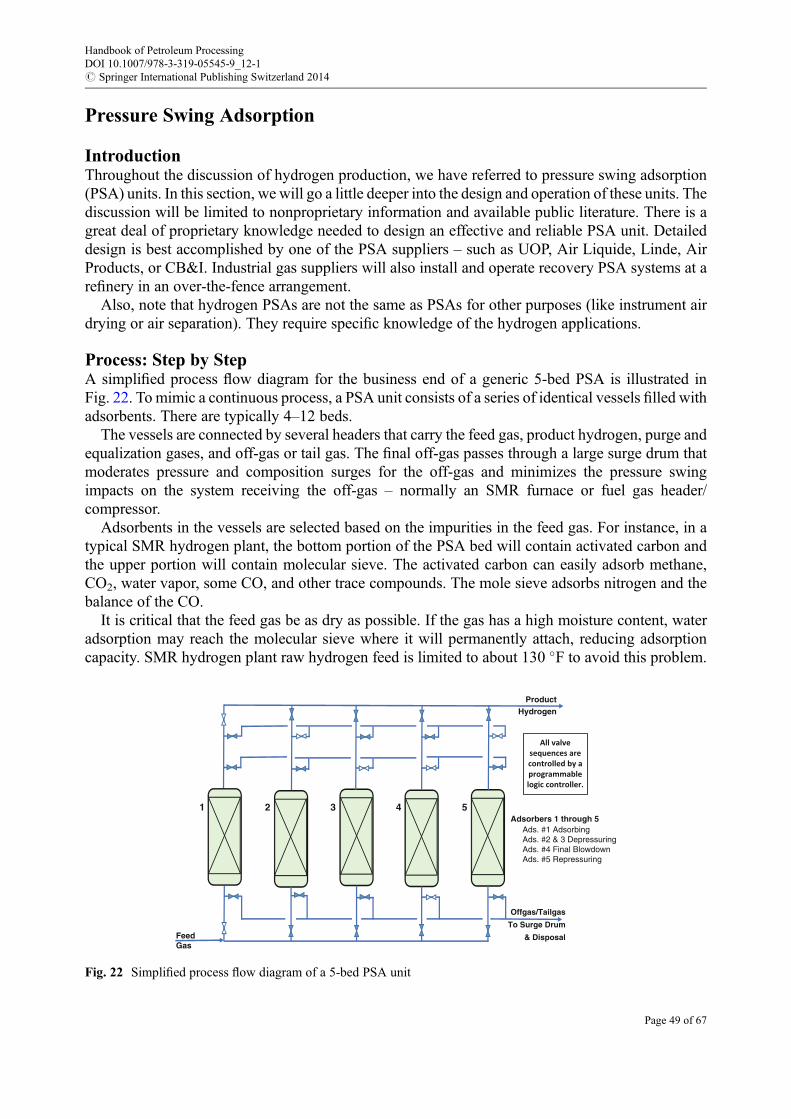
Pressure Swing Adsorption
IntroductionThroughout the discussion of hydrogen production, we have referred to pressure swing adsorption(PSA) units. In this section, we will go a little deeper into the design and operation of these units. Thediscussion will be limited to nonproprietary information and available public literature. There is agreat deal of proprietary knowledge needed to design an effective and reliable PSA unit. Detaileddesign is best accomplished by one of the PSA suppliers – such as UOP, Air Liquide, Linde, AirProducts, or CB&I. Industrial gas suppliers will also install and operate recovery PSA systems at arefinery in an over-the-fence arrangement.
Also, note that hydrogen PSAs are not the same as PSAs for other purposes (like instrument airdrying or air separation). They require specific knowledge of the hydrogen applications.
Process: Step by StepA simplified process flow diagram for the business end of a generic 5-bed PSA is illustrated inFig. 22. To mimic a continuous process, a PSA unit consists of a series of identical vessels filled withadsorbents. There are typically 4–12 beds.
The vessels are connected by several headers that carry the feed gas, product hydrogen, purge andequalization gases, and off-gas or tail gas. The final off-gas passes through a large surge drum thatmoderates pressure and composition surges for the off-gas and minimizes the pressure swingimpacts on the system receiving the off-gas – normally an SMR furnace or fuel gas header/compressor.
Adsorbents in the vessels are selected based on the impurities in the feed gas. For instance, in atypical SMR hydrogen plant, the bottom portion of the PSA bed will contain activated carbon andthe upper portion will contain molecular sieve. The activated carbon can easily adsorb methane,CO2, water vapor, some CO, and other trace compounds. The mole sieve adsorbs nitrogen and thebalance of the CO.
It is critical that the feed gas be as dry as possible. If the gas has a high moisture content, wateradsorption may reach the molecular sieve where it will permanently attach, reducing adsorptioncapacity. SMR hydrogen plant raw hydrogen feed is limited to about 130 �F to avoid this problem.
ProductHydrogen
1 2 3 4 5Adsorbers 1 through 5
Ads. #1 AdsorbingAds. #2 & 3 DepressuringAds. #4 Final BlowdownAds. #5 Repressuring
Offgas/Tailgas
To Surge Drum
& DisposalFeedGas
All valvesequences arecontrolled by aprogrammablelogic controller.
Fig. 22 Simplified process flow diagram of a 5-bed PSA unit
Handbook of Petroleum ProcessingDOI 10.1007/978-3-319-05545-9_12-1# Springer International Publishing Switzerland 2014
Page 49 of 67

Adsorption releases heat. The temperature of a PSA bed rises slightly (5–20 �F) during theadsorption steps and drops back down as the bed is depressured. If any liquids reach the bed, theadsorption heat rise will be very high, so liquids are strictly excluded.
The steps in a typical PSA cycle applied to one bed are shown in Table 12. There are severalsub-steps in the actual control software, but the cycle will generally follow the pattern in the table.The table also illustrates the pressure steps a single adsorption bed progresses through during acycle.
Let us start with a single target adsorber at full pressure being brought on line and follow the steps:
• Adsorption – Raw feed is brought into the pressured vessel, normally in upflow. Impurities in thefeed adhere to the adsorbents from the bottom up, with hydrogen adhering the least. Hence,hydrogen passes mostly through the bed and onto production at nearly full pressure. The bed stayson line for a set time, determined by the amount of impurities in the feed and the flow rate. Thisadsorption time can be fine-tuned based on the product hydrogen purity. Nitrogen and CO will bethe first impurities to begin slipping out of the bed – normally setting the maximum adsorptiontime. During this time, another adsorber bed is being brought up to pressure using a little of theproduct hydrogen so it can be swung on line when our current bed is taken off-line, without anypressure bumps.
• First equalization – At the end of the adsorption time, the feed and product valves are closed onthe vessel of interest, and the other vessel that was being pressured up with product hydrogen goeson line. Then, the first equalization valve opens on our target adsorber. This is the first of severaldepressurization steps. The initially purged gases are fairly pure hydrogen, so flow in this first stepis upward and the hydrogen leaving is used to pressure up another adsorber bed that will bebrought on line next. There is no gas coming into the vessel. This is called an equalization becauseat the end of the step, the pressure of our target vessel and the pressure of the vessel it isrepressuring are both about equal.
• Additional equalizations and providing purges – There are typically two more equalization stepswith other PSAvessels. In these steps, gas from our target vessel is dropped in pressure. Flow outof the vessel is still upward. There is no incoming flow. Flow from the current vessel, which isreasonably pure, is used to push the impurities out of other, lower-pressure vessels. During thesesteps, the actual impurities front in the target bed is continuing to rise.
Table 12 Example PSA bed cycle steps
Handbook of Petroleum ProcessingDOI 10.1007/978-3-319-05545-9_12-1# Springer International Publishing Switzerland 2014
Page 50 of 67
• Blowdown – Now, we begin rejecting the impurities from the bottom of our target vessel usingdownward flow. The vessel pressure is dropped to the low tail-gas or off-gas drum pressure. Thisis where the impurities are largely desorbed. Some hydrogen is unfortunately lost in the process.At this point, there is no incoming gas, just depressurization out the bottom of the vessel.
• Purge –Now, the vessel is purged to blowdown using gas from one of the other PSAvessels in the“provide purge” step. This is downflow at low pressure. The impurities are reduced to theirminimum in the bed.
• Equalization steps – The vessel is now repressured using equalization step gases from othervessels that are being depressured. As the pressure is increased, the purity of the repressuringgases increases. Flow is downward to avoid fluffing the bed and there is no outgoing flow atthis time.
• Repressurization – There is a final repressurization step using product hydrogen in downflow tobring the bed pressure up to the product header pressure and avoid a pressure bump when thevessel comes on line. There is no outflow.
• Adsorption – The vessel is brought back on line in upflow to start the next cycle by opening thefeed and product valves.
There are pressure and time criteria for completion of each step before the sequence willadvance. If these are failed, the control system can adjust or, if the failure is serious enough, it canshut down the PSA and block in the vessels.
Equipment Design and MetallurgyValvesPSA systems depend heavily on control valves to accomplish their function. Each PSA vessel hasfour to six valves associated with it, depending on the number of steps in the cycle. Each PSAvesselvalve will go through around 35,000 cycles per year on average. In addition, there are other valvesthat control surge pressures and compositions of the off-gas or tail gas.
All of these valves must be routinely and regularly checked and serviced to ensure reliability ofthe PSA system. Valve failure is the number one problem in low PSA reliability.
PSA designers have specific valves they recommend for their units based on extensive experi-ence. It is wise to take advantage of their expertise. These are not normal control valves. The valveshave specific features tailored to the PSA service.
PSA Adsorbers and Cyclic ServiceJust as each PSA vessel valve will go through about 35,000 cycles per year, each vessel ispressurized and depressurized about 35,000 times per year. This cyclic stress on a vessel canexacerbate small defects in construction of the vessel, resulting in cracking of vessel.
This cyclic loading has to be recognized in specifying and monitoring the vessels. Normally, thereare periodic inspections for cracks growing from the cyclic stresses. Inspection methods continue todevelop for this service.
Off-Gas/Tail-Gas Surge DrumThe off-gas or tail-gas surge drum is a large vessel designed to moderate the pressure andcomposition changes that come from the PSA vessel cycles. This is required to provide a relativelystable fuel supply to the SMR furnace or other fuel gas users.
At one time, there were two surge drums employed – one to moderate the pressure cycles and asecond drum to even out the compositions. This two-drum system resulted in very stable off-gasflow and composition.
Handbook of Petroleum ProcessingDOI 10.1007/978-3-319-05545-9_12-1# Springer International Publishing Switzerland 2014
Page 51 of 67

Recent practice for PSAs uses a single surge drum combined with improved control valve logicand tuning to provide stable off-gas flow. This has not been quite as effective as the two-drumsystem, but works well enough and significantly reduces capital cost and footprint.
The surge drum is mostly just an empty space, but the inlet lines from the PSA usually terminateinside the surge drum with elbows or distribution headers. These improve mixing and reducecomposition variations. Pressure surge may be managed with control valves (in and/or out) of thesurge drum.
Control SystemThe PSA cycles are controlled by a programmable logic controller (PLC). In some cases, this logichas been incorporated into the plant’s distributed control system (DCS), but more often the logic ishoused in a dedicated PLC, with interfaces to the DCS.
The control system will normally match the capacity of the PSA to the plant rate and handle ratechanges. The system can manage some types of valve failures by switching between operationmodes (number of beds on line), with minimal upset. Many systems have built-in diagnostics to helpanalyze problems. The systems can also be combined with online gas analyzers to optimizerecoveries.
OperationsStart-UpFrom a routine standpoint, the start-up of a PSA is relatively simple:
• The PSA system is air-freed.• Feed gas is lined up to the unit. Off-gas is lined up to the surge drum and, usually, flare. The vessel
block valves are all opened, with the control valves still closed.• The adsorber pressures are set to the required starting pressure profile for a desired start-up step
using available gases. This may also be automatic.• The PLC is started at the desired step and the PSAvalves begin cycling. All the incoming feed gas
goes out through the surge drum to flare initially for a few cycles to establish the correct impurityprofiles.
• Once the system is operating reliably and smoothly, hydrogen production to users can begin.• Once the system is stable, the off-gas can be routed to either the SMR or fuel gas.
ShutdownShutdown of a PSA unit is accomplished by stopping the PSA cycle. The control logic in the PLCwill automatically block in the vessels and freeze the cycle and pressures in the current step.Incoming feed gas will go to flare or its alternative destination. The off-gas/tail gas will stopimmediately.
Adjustments will need to be made to downstream, and possibly upstream, units that feed the PSAor use the off-gas.
Routine OperationOnce in service, the PLC controlling the PSA will operate the unit and continuously monitor forproblems. The operator may need to adjust the adsorption cycle time periodically to fine-tune thecycle or for major rate changes. Generally, the PSA system will take care of itself.
Handbook of Petroleum ProcessingDOI 10.1007/978-3-319-05545-9_12-1# Springer International Publishing Switzerland 2014
Page 52 of 67
Once a unit is operating, it is worthwhile to have your PSA vendor periodically review theoperation and fine-tune it (say, annually). They can help spot potential issues that may not beobvious.
MonitoringTable 13 provides a summary of the important parameters and equipment to monitor on a PSAduring operation. Early detection of problems provides an opportunity to make a controlled switch toan alternate operation without the PSA control systemmaking a radical move on its own and causingan upset.
Troubleshooting PSAsTable 14 provides a summary of the more common PSA problems and hints at possible causes. Thisis a starting point. The control software error logs and information will often provide a good startingpoint for troubleshooting.
Detailed discussion on troubleshooting more complex issues is beyond the scope of this book.PSA unit vendors are usually more than happy to help in troubleshooting. As noted above, a periodic(annual) review of the unit operation by the PSAvendor is advisable to identify problems that are notobvious.
Membranes
Advances in technology have made membranes a viable hydrogen recovery option for several typesof systems. The discussion of the applications for membranes and the typical process flow inhydrogen recovery service is in the section “Refinery Gas Recovery.” Membrane capacities over60MMscfd of feed are possible because of the modular nature of the process. These units are, in fact,usually supplied as prefabricated modules.
Reviewing the flow sheet in Fig. 20 above, compressed, high-pressure raw gas (preferably>1,000 psig) passes through a knockout drum or coalescer to eliminate any possible liquids in thefeed. The clean raw gas is then fed to a bank of several membranes housed in tubes, all operating inparallel. Hydrogen diffuses through the membranes to the low-pressure side and exits (permeate).The impurities remain on the high-pressure side and exit (residue).
Product hydrogen permeate from a membrane will range from 80 % to 98 % purity, with 65–95 %recovery. Feed hydrogen for a membrane unit can range from 15 % to 80 % hydrogen purity,although purity greater than 70 % is best.
The most common membranes for hydrogen are hollow fibers or wound sheets of thinpolyaramide or polyimide on a support material. The membrane selectively allows the smallestmolecules to pass; so hydrogen gets through preferentially. The membrane materials are fairlyresistant to damage from most chemicals they may encounter, but eventually are damaged to thepoint of requiring replacement.
Other membrane materials, including inorganics, are in development.Basic monitoring of a membrane unit would consist of periodically calculating the hydrogen
recovery percentage and trending the product hydrogen contaminants. Feed composition andpotential carryover should also be tracked routinely. Membrane system vendors would provideadditional support for analyzing system performance.
Handbook of Petroleum ProcessingDOI 10.1007/978-3-319-05545-9_12-1# Springer International Publishing Switzerland 2014
Page 53 of 67

Tab
le13
Key
routinemonito
ring
parametersforaPSAunit
Param
eter
Basis
Frequency
Criteria
Hydrogen
recovery
%Recovery¼
molsor
scfH
2in
product
ðÞ=
molsor
scfH
2in
feed
gas
ðÞ�
100%
Weekly
Trend
andwatch
forloss
ofrecovery
with
time
Feedand
off-gas
pressures
Reviewpressure
trends
Daily
Ensurepressuresstay
with
inallowableranges
Feedgas
temperature
Reviewdata
Daily
Ensuretemperature
stayswith
inallowablerange
Feedgas
compositio
nReviewdata
Weekly
Watch
forexcessiveethane
orheaviercomponents
Adsorption
time
Reviewadsorptio
ntim
eforeach
bedin
seconds
Weekly
Trend
andwatch
forincreasing
requirem
entatthe
samefeed
rate
Productpurity
ppm
COin
producth
ydrogen–thiswill
need
tobe
bydetector
tube
orother
sensitive
means,G
Cwill
notb
eadequate
Weekly
Trend
andwatch
forincreasesinCOwith
time.Donot
runforextended
periodswith
lowpurity
Valve
packing
leakage
Physicalinspection
Weekly
Shouldnotb
eableto
feelgasescomingfrom
any
packings
Cycle
diagnostics
ReviewPLCexceptionlogs
orpressure
graphs
foreach
vessel
Weekly
Lookforanom
aliesin
thecycles
likeextended
repressurizatio
ntim
esor
changesto
patterns
Handbook of Petroleum ProcessingDOI 10.1007/978-3-319-05545-9_12-1# Springer International Publishing Switzerland 2014
Page 54 of 67
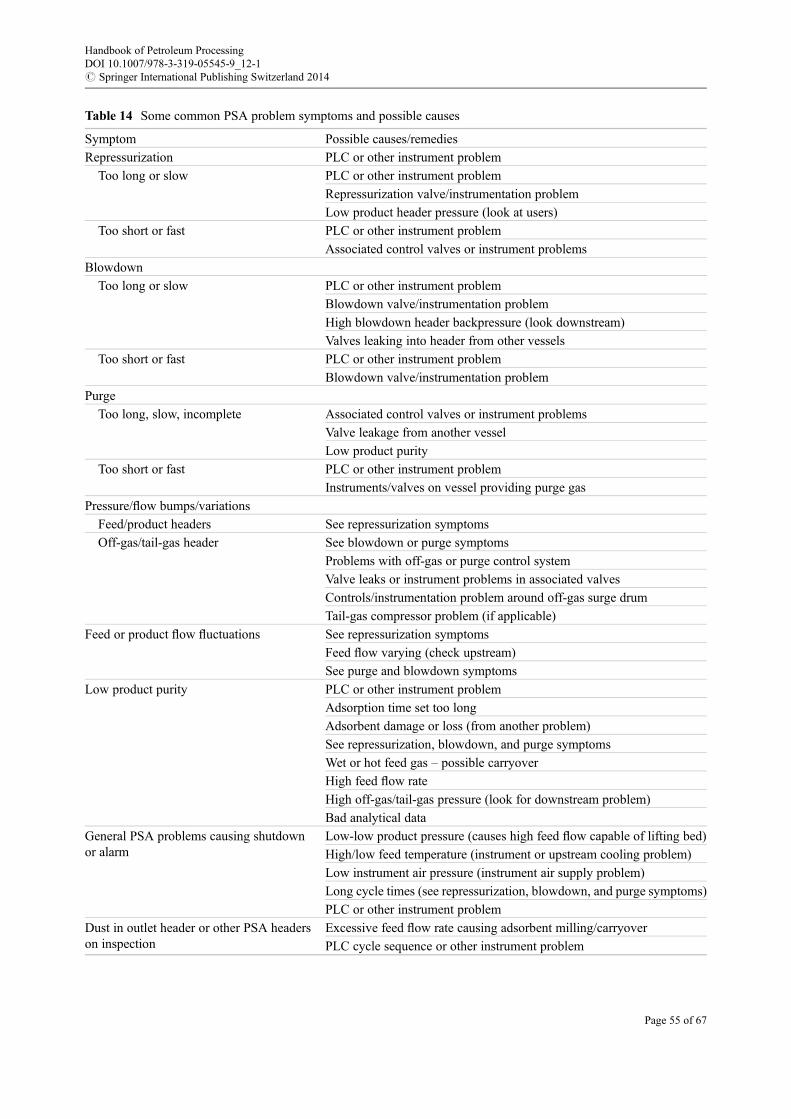
Table 14 Some common PSA problem symptoms and possible causes
Symptom Possible causes/remedies
Repressurization PLC or other instrument problem
Too long or slow PLC or other instrument problem
Repressurization valve/instrumentation problem
Low product header pressure (look at users)
Too short or fast PLC or other instrument problem
Associated control valves or instrument problems
Blowdown
Too long or slow PLC or other instrument problem
Blowdown valve/instrumentation problem
High blowdown header backpressure (look downstream)
Valves leaking into header from other vessels
Too short or fast PLC or other instrument problem
Blowdown valve/instrumentation problem
Purge
Too long, slow, incomplete Associated control valves or instrument problems
Valve leakage from another vessel
Low product purity
Too short or fast PLC or other instrument problem
Instruments/valves on vessel providing purge gas
Pressure/flow bumps/variations
Feed/product headers See repressurization symptoms
Off-gas/tail-gas header See blowdown or purge symptoms
Problems with off-gas or purge control system
Valve leaks or instrument problems in associated valves
Controls/instrumentation problem around off-gas surge drum
Tail-gas compressor problem (if applicable)
Feed or product flow fluctuations See repressurization symptoms
Feed flow varying (check upstream)
See purge and blowdown symptoms
Low product purity PLC or other instrument problem
Adsorption time set too long
Adsorbent damage or loss (from another problem)
See repressurization, blowdown, and purge symptoms
Wet or hot feed gas – possible carryover
High feed flow rate
High off-gas/tail-gas pressure (look for downstream problem)
Bad analytical data
General PSA problems causing shutdownor alarm
Low-low product pressure (causes high feed flow capable of lifting bed)
High/low feed temperature (instrument or upstream cooling problem)
Low instrument air pressure (instrument air supply problem)
Long cycle times (see repressurization, blowdown, and purge symptoms)
PLC or other instrument problem
Dust in outlet header or other PSA headerson inspection
Excessive feed flow rate causing adsorbent milling/carryover
PLC cycle sequence or other instrument problem
Handbook of Petroleum ProcessingDOI 10.1007/978-3-319-05545-9_12-1# Springer International Publishing Switzerland 2014
Page 55 of 67

Membrane systems for hydrogen recovery are offered by several suppliers, including Air Liquide(MEDAL™), Air Products (PRIZM™), and UOP (Polysep™). Industrial gas suppliers will alsoinstall and operate membrane systems at a refinery in something akin to an over-the-fencearrangement.
Cryogenic Recovery
Hydrogen can be recovered cryogenically from various refinery gases and olefins cracking gases. Itis normally a by-product of recovering other, more valuable materials, such as ethylene. Industrialgas suppliers and others will install, own, and operate cryogenic recovery units in an over-the-fencearrangement.
Figure 23 illustrates application of a cryogenic unit to recover hydrogen from refinery fuel gas.The gas must first be compressed to about 200–500 psig and cooled. It is pretreated to removemoisture, CO2, and other impurities before chilling in a multiservice, plate exchanger from �60 to�120 �F. The fluid is flashed and the vapor sent to a second stage of cooling in a plate exchanger tomuch lower temperatures followed by separation. The gas from the second stage flash drum isexpanded across a valve and provides cooling to the two plate exchangers. Final product hydrogenfrom the cryogenic system is about 65 % hydrogen starting with a stream at, perhaps, 30 %hydrogen. By-products include LPG and fuel gas. The product hydrogen can be further upgradedby PSA or membrane. Cryogenic product hydrogen purities of 95–99 % and recoveries of 90–98 %of hydrogen are possible with appropriate process changes.
Cryogenic units are somewhat more difficult to operate and more expensive than the alternativetechnologies if your primary objective is hydrogen recovery. These units may be justified by thevalue of the other products recovered in some cases.
Because these are not common in refinery hydrogen systems, they are not discussed further here.Refer to the available references for suppliers of these systems.
HydrogenHydrogenProduct
Turbo-expander
Product H2Compressor
Heavier Gases
Feed Gas
Feed GasCompressor
Plate-finExchanger
Cold Box
Sepa
rato
r
Sepa
rato
r
Fig. 23 Simplified flow diagram of one type of cryogenic hydrogen recovery process (Reference: Faraji et al. 2005)
Handbook of Petroleum ProcessingDOI 10.1007/978-3-319-05545-9_12-1# Springer International Publishing Switzerland 2014
Page 56 of 67
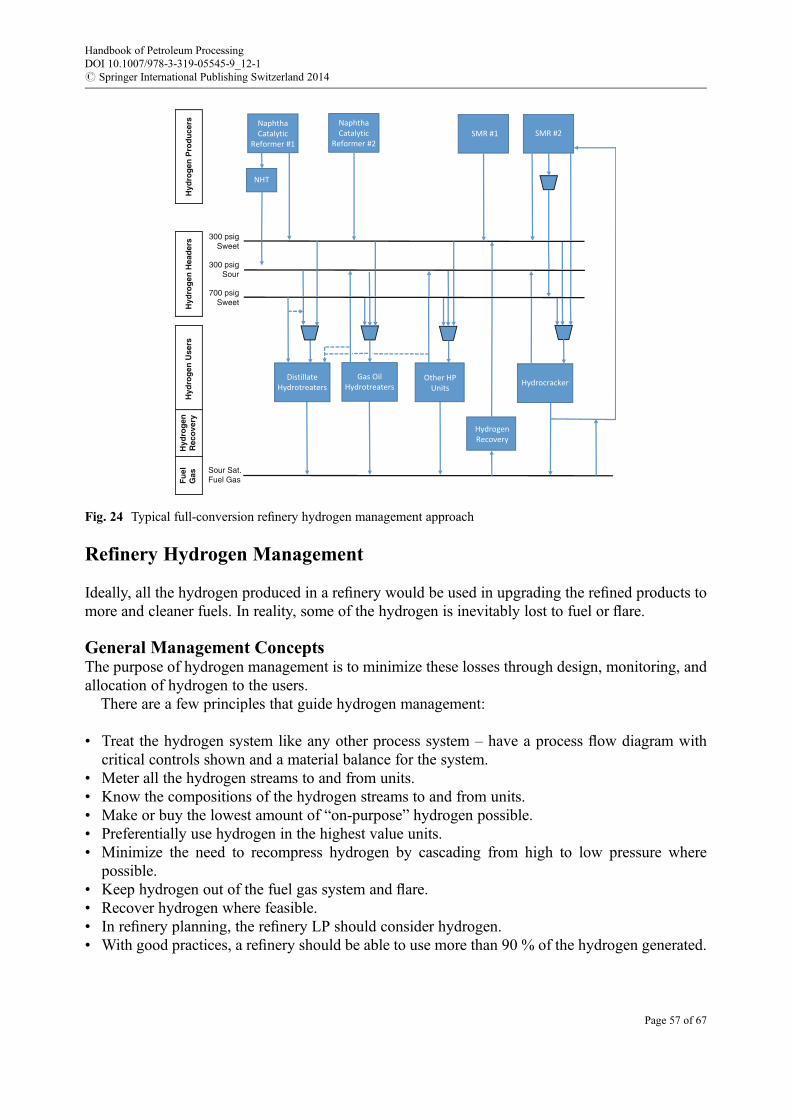
Refinery Hydrogen Management
Ideally, all the hydrogen produced in a refinery would be used in upgrading the refined products tomore and cleaner fuels. In reality, some of the hydrogen is inevitably lost to fuel or flare.
General Management ConceptsThe purpose of hydrogen management is to minimize these losses through design, monitoring, andallocation of hydrogen to the users.
There are a few principles that guide hydrogen management:
• Treat the hydrogen system like any other process system – have a process flow diagram withcritical controls shown and a material balance for the system.
• Meter all the hydrogen streams to and from units.• Know the compositions of the hydrogen streams to and from units.• Make or buy the lowest amount of “on-purpose” hydrogen possible.• Preferentially use hydrogen in the highest value units.• Minimize the need to recompress hydrogen by cascading from high to low pressure where
possible.• Keep hydrogen out of the fuel gas system and flare.• Recover hydrogen where feasible.• In refinery planning, the refinery LP should consider hydrogen.• With good practices, a refinery should be able to use more than 90 % of the hydrogen generated.
300 psigSweet
300 psigSour
700 psigSweet
Sour Sat.Fuel Gas
Hyd
rog
en P
rod
uce
rsH
ydro
gen
Hea
der
sH
ydro
gen
Use
rsH
ydro
gen
Rec
ove
ryF
uel
Gas
NaphthaCatalytic
Reformer #1
NaphthaCatalytic
Reformer #2SMR #1 SMR #2
NHT
DistillateHydrotreaters
Gas OilHydrotreaters
Other HPUnits
Hydrocracker
HydrogenRecovery
Fig. 24 Typical full-conversion refinery hydrogen management approach
Handbook of Petroleum ProcessingDOI 10.1007/978-3-319-05545-9_12-1# Springer International Publishing Switzerland 2014
Page 57 of 67

• A periodic review by a company experienced in hydrogen system studies is advisable (e.g., AirLiquide, UOP, Air Products, etc.).
An example of a hydrogen system in a full-conversion refinery is illustrated in Fig. 24. There are aseries of hydrogen generators (naphtha reformers, SMR plants) connected to hydrogen headers. Theheaders distribute the hydrogen to the users. There may also be intermediate hydrogen headers atdifferent pressures and purities. Headers may be sweet or sour, depending on the design choicesmade for a facility. There may also be hydrogen recovery systems from fuel gas, refinery orpetrochemical gases, and purge gases that make up into the headers.
Along with the process flow diagram, there should be a spreadsheet and/or simulation model thatprovides material balance calculations for the system. The model can use typical hydrogen con-sumptions and production for users based on feed rates or can be more sophisticated and account forfeed quality as well as rates. Having these tools available will allowmore intelligent use of hydrogenin a refinery, especially by operations personnel.
Hydrogen HeadersFresh HydrogenThe fresh hydrogen header takes hydrogen from the producers and distributes it to the initial users.Incoming hydrogen may originate from the SMR hydrogen plant(s), over-the-fence supply, orcatalytic naphtha reformer(s). Incoming hydrogen may also be supplied by recovery unit(s).
One of the suppliers must be used as the swing unit to control the header pressure. The othersuppliers should then be base loaded or may have rates that are set by other factors. For example, anaphtha reformer’s hydrogen production will more often be set by the required naphtha octane andthe catalyst age. You would not normally set naphtha reformer rate just to supply hydrogen, althoughthat is an option.
The swing unit is usually an SMR unit that is large enough to control the fresh hydrogen headerpressure. The SMR is able to react more quickly than many other units. An SMR does not like to beswung around too frequently, however; so, a swing SMR may end up producing a small excess ofhydrogen that is lost. One objective is to minimize that loss.
Sour HydrogenOften, hydrogen is cascaded from high-pressure to low-pressure units for conservation and reuse.The hydrogen picks up H2S the first time it is used. Some refineries scrub the H2S out of purgedgases from the higher-pressure units, but others purge sour gases.
The sour hydrogen is normally handled in a separate header. The gas from this header can be usedin lower-pressure or less severe units. It can also be used for presulfiding or activation ofhydrotreating catalysts.
Surplus hydrogen on the sour header may be cascaded to fuel gas.
Header PressuresThere are a number of strategies used to determine where to set hydrogen header pressures duringdesign. The philosophy described here is one of the more common approaches.
The pressure for the fresh hydrogen header could be set at the maximum makeup pressurerequired for the highest pressure user (hydrocracker or gas oil hydrotreater), but this would meancompressing all the gas to the highest pressure all the time. That would be wasteful.
Handbook of Petroleum ProcessingDOI 10.1007/978-3-319-05545-9_12-1# Springer International Publishing Switzerland 2014
Page 58 of 67

It is similarly not optimum to just supply hydrogen at low pressure, like naphtha reformer outletpressure of 200–300 psig. That would mean installing compressors at many different users orcreating another header for higher pressures.
A compromise that works well is to compress and distribute the fresh hydrogen supply at themakeup pressure required by the diesel hydrotreater (DHT). This usually means the fresh headerruns 700–1,000 psig. This eliminates the need to compress within the DHT and most other units. Itallows the DHT purge to be cascaded to lower-pressure services. If a refinery has a hydrocracker orhigh-pressure gas oil hydrotreater, the hydrogen for those services still requires additionalcompression.
In any event, the best practice for a given refinery is to select header pressures that result in the besteconomics, including the cost of compression.
Managing Hydrogen UsersAllocation of HydrogenSomeone needs to “own” the hydrogen system in a refinery and that person has to be able to makedecisions about the system. Short-term, on-shift decisions are normally made by someone in the shiftoperations organization. Overall decisions day-to-day are usually a joint effort of the operations andplanning staffs. Longer-term planning and improvements are the purview of engineering staff.
Allocation of hydrogen is especially important when a facility is tight or short of hydrogen. Tomaximize the refinery profitability, hydrogen needs to go to the units that will make the most valueper cubic foot (or cubic meter) of hydrogen used. All impacts need to be considered however. Forinstance, allocation of hydrogen to a high value unit that could force a cut in crude rate to the refinerybecause another unit was starved for hydrogen would not be wise.
Factors Affecting Usage and GenerationHydrogen is primarily used to:
• Eliminate sulfur, nitrogen, and other impurities from products or feedstocks.• Upgrade product values (ULSD, dewaxing, isomerization).• Crack heavier hydrocarbons (gas oils) to lighter hydrocarbon products (naphtha, distillates).• Supply reducing gas to sulfur plants (in some cases).
Changes in crude slate and rates impact all these factors. A heavy, sour crude will require morehydrogen to refine than a light, sweet crude. Higher rates in a hydrocracker or gas oil unit (possibledue to crude changes) will require more hydrogen. Deeper HDS or increasing conversion willincrease consumption.
On the supply side, lower reformer severity, increasing catalyst age, or less naphtha available toreform will all reduce cat reformer hydrogen makes. Changes in SMR hydrogen plant feedstocks,catalyst age, capacity, or firing/recovery limits may reduce the amount of hydrogen an SMRcan make.
It is advisable to have a simple model that predicts hydrogen consumption or production for eachunit based on feed rate and quality to estimate changes. These models would be incorporated into thematerial balance model for the system overall.
Overall PlanningGood, active hydrogen management practices will ensure that the least amount of valuable hydrogenis wasted in a refinery. The operations organization can manage the day-to-day hydrogen system, but
Handbook of Petroleum ProcessingDOI 10.1007/978-3-319-05545-9_12-1# Springer International Publishing Switzerland 2014
Page 59 of 67

the planning organization should include the hydrogen system in their process using the refinery LPor another model to avoid arriving at an infeasible plan.
Concluding Remarks
The production and use of hydrogen in a refinery is becoming increasingly important as refinedproduct specifications drive toward zero sulfur, high H/C ratio fuels of all boiling ranges. There areseveral options for providing hydrogen to a refinery. Many of these have been discussed in thissection. This is, by no means, all inclusive, however. Many variations exist among facilities and newoptions for production or recovery of hydrogen continue to grow.
Appendix Example SMR Hydrogen Plant Material Balance andMonitoring Parameters Development
To calculate the key monitoring parameters for an SMR plant, consider the following example that istypical of the sort of calculations needed. This example is for an SMR feeding natural gas plusrefinery saturated off-gas that has been scrubbed free of sulfur (for simplicity). Hydrogen purifica-tion is by PSA unit. The plant only has high-temperature shift.
The objectives are to calculate:
• Material balance around the reforming furnace, shift converter, and PSA• Approach to equilibrium in reformer• Approach to equilibrium in shift converter• PSA recovery efficiency• Shift condensate rate• Normalized reformer pressure drop• Actual steam/carbon ratio
The following data are given:
Flow rates• Sweet feed gas = 6.87 MMscfd• Product hydrogen (99.9999 % H2) = 20.6 MMscfd• Raw hydrogen to the PSA = 31.8 MMscfd• Process steam rate = 66,500 lbs/h
Temperatures• Reformer outlet temperature = 1,500 �F• HTSC outlet temperature = 810 �F
Pressures• Reformer inlet = 315 psig• Reformer outlet = 290 psig• Shift converter outlet = 280 psig• Product hydrogen from PSA = 260 psig
Dry gas analyses, vol % by GC
Handbook of Petroleum ProcessingDOI 10.1007/978-3-319-05545-9_12-1# Springer International Publishing Switzerland 2014
Page 60 of 67

Component Feed gas PSA inlet
Hydrogen 9.3 69.5
Methane 79.7 2.3
Ethane 3.4 0.0
Propane 1.9 0.0
Mixed butanes 1.6 0.0
Mixed pentanes 1.3 0.0
Hexane and heavier 0.2 0.0
CO 0.3 3.0
CO2 0.6 15.7
N2 0.7 7.3
O2 0.0 1.9
Solution1. Normalize the dry gas analyses to 100 %. Notice that the analysis of the raw gas to the PSA
inlet contains a lot of oxygen and nitrogen. This indicates air contamination and is typical ofGC results. The air has to be backed out of the analysis. So remove the 1.9 % oxygen and7.1 % nitrogen (79/21� 1.9). This leaves 0.2 % nitrogen in the PSA inlet. Normalize the PSAinlet gas to 100 % without the air. The final normalized PSA Inlet gas is:• Hydrogen = 76.7 %• Methane = 2.5 %• CO = 3.3 %• CO2 = 17.3 %• N2 = 0.2 %
2. Set up a material balance spreadsheet for the composition, molar flow rate, mass flow rate,pressure, and temperature at each key location in the unit:• Feed gas• Reformer inlet feed gas• Process steam• Reformer outlet• HTSC outlet• Process condensate (shift condensate)• PSA inlet gas• PSA product hydrogen• PSA off-gas
3. Assume the feed gas flow rate is correct and use the feed gas analysis to calculate the moles ofcarbon and hydrogen per hour in the feed. Do not forget to include any CO and CO2 in thecarbon. We are assuming no moisture in the feed. Use these values to calculate alpha (a) foruse in Eq. 20. In this case, we have 816.2 mols of carbon per hour and 3,105.5 mols hydrogenper hour:
2a ¼ 3, 105:5=816:2 ¼ 3:80a ¼ 3:80=2 ¼ 1:90
4. Calculate the steam/carbon ratio (X) at the reformer inlet by converting the steam rate tomoles per hour and dividing it by the moles per hour of carbon:
66,500 lb/h steam/18 = 3694.4 mols/h steam
Handbook of Petroleum ProcessingDOI 10.1007/978-3-319-05545-9_12-1# Springer International Publishing Switzerland 2014
Page 61 of 67

Steam/Carbon = 3694.4/816.2 = 4.53 S/C Ratio = X5. Calculate the wet shift converter outlet composition using the following equation and
knowing a and X from above. The methane, CO, and CO2 proportions (1-a-b, a, and b)come from the PSA inlet dry gas. The steam portion is calculated from the equation.Hydrogen falls out in the calculation. Remember that the nitrogen will come through as aninert:
CH2aþ XH2O ! aCOþ bCO2 þ 1� a� bð ÞCH4
þ X� a� 2bð ÞH2Oþ 3aþ 4bþ a� 2ð ÞH2(31)
wherea = factor based on feed C/H molar ratioX = steam/carbon molar ratioa, b = coefficients for CO and CO2 concentrations, respectively, at any point in the process
6. The shift or process condensate should be the residual water from the reaction. Use this as theprocess condensate flow rate. You can include dissolved CO2, but the amount of dissolvedCO2 is not significant in the overall process.
7. Now check the overall balance in the unit by adding the feeds (feed gas plus steam plus anyrecycle hydrogen) and comparing to the HTSC outlet (PSA inlet gas plus calculated processcondensate). Check the carbon and hydrogen balances also. Make adjustments to flow ratesuntil you closed the balance. This sometimes means compromising on rates or slightadjustments to compositions. There are many sources of possible error in these calculationsso flexibility is needed. If the balance can be closed to +/�2 %, that is good enough for theanalysis.
8. Now estimate the reformer outlet composition.• Assume the HTSC outlet (in moles) is the correct methane slip from the reforming furnace.
Here the slip is 2.5 v% of the dry gas or about 87 mols/h.• Calculate the CO and CO2 proportions by assuming the gas is at water-gas shift equilib-
rium at the reformer outlet. The CO and CO2 proportions can be derived by iteration untilthe calculated KWGS at the reformer outlet matches the KWGS at the reformer outlettemperature of 1,500 �F. Use the definition:
KWGS ¼ PH2 � PCO2ð Þ=PH2O � PCOÞ
where the partial pressures are in atmospheres in the wet gas.Use the equation for KWGS for the SMR process discussion.An easier approach with sufficient accuracy is to use the equilibrium charts provided in
the SMRmonitoring discussion for methane to estimate the%CO and CO2 in the dry gas atthe reformer outlet. From the chart, the CO at the reformer outlet should be about 11.5 v%and CO2 would also be about 11.5 v%.We brought in 816.2 mols/h carbon. 87 mols/h stayed in methane as methane slip. The
remaining 729 mols per hour is roughly split evenly between CO and CO2 at the reformeroutlet (about 365 mols/h each). Iterative calculations give values of about 359 mols/h forCO and 370 mols/h for CO2.Check to be sure the reformer outlet mass balances, including C and H.
Handbook of Petroleum ProcessingDOI 10.1007/978-3-319-05545-9_12-1# Springer International Publishing Switzerland 2014
Page 62 of 67

9. Calculate the partial pressures of methane, CO, CO2, hydrogen, and water in the wet gases atthe outlet of the reforming furnace and shift converter. The partial pressures must be inatmospheres absolute.
10. Calculate KSMR at the reformer outlet and KWGS at the shift converter outlet using thedefinitions in the SMR process discussion.
Reformer outlet actual KSMR = �298 (Table is reciprocal of this)Shift converter outlet actual KWGS = �6.23
11. Calculate the equivalent equilibrium temperatures using the equations in the SMR processdiscussion or use the charts in that section.
Reformer actual equilibrium temperature = �1, 515 �FShift converter actual equilibrium temperature = 878 �F
12. Finish the material balance streams and check the overall, carbon, and hydrogen balances.13. The key monitoring parameters can now be calculated:
• Overall material balancewas derived as part of the calculations. See Table 15 for the basicmaterial balance.
• Approach to equilibrium (ATE) in the reformerReformer ATE ¼ actual� calculated ¼ 1, 500� 1, 515�F ¼ �15�F
• Approach to equilibrium (ATE) in the shift converterShift ATE ¼ actual� calculated ¼ 878� 810 �F ¼ þ68 �F
• PSA recovery efficiency
Recovery ¼ mols H2in product � 100%ð Þ=mols H2in feed
Product H2 ¼ 20:6 MMscfd! 2, 262:0 mols=h
PSA inlet H2 ¼ 76:8% of 31:8 MMscfd! 2, 721 mols H2=h
Recovery ¼ 100% � 2, 262=2, 721 ¼ 83:1%
• Shift condensate rateThis falls out of thematerial balances as 2, 378mols/h (leftover process steam)= 42.3Mlb/h
or �85 gpm.• Actual steam/carbon ratio
This also fell out of the calculations as X = 4.53.• Normalized pressure drop
For normalizing the pressure drop, prior history and a normalization basis (referenceconditions) are required. Here, from prior development work, the equation for normaliza-tion of dP was found to be
dPnorm ¼ dPmeas � Qfeed þ Qsteamð Þnorm= Qfeed þ Qsteamð Þmeas
� �1:6
where:dPnorm = normalized dP at reference conditionsdPmeas = measured dP at actual conditionsQfeed = inlet volumetric flow of feed, reference or actualQsteam = inlet volumetric flow of steam, reference or actualHere:
Handbook of Petroleum ProcessingDOI 10.1007/978-3-319-05545-9_12-1# Springer International Publishing Switzerland 2014
Page 63 of 67

Tab
le15
ExampleSMRhydrogen
plantm
aterialbalancedevelopm
ent
Com
ponent
Feed
Steam
Ref
InReformer
outlet
HTSCoutlet
PSAprod
PSAoff-gas
Shift
condensate
6.87
MMscfd
66.5
Mlb/h
Dry
gas
31.8
MMscfd
20.6
MMscfd
mw
v%
mols=h
lbs=h
molsC=h
molsH=h
mols=h
molsH=hr
mols=h
lbs=h
Cmols=h
Hmols=h
mols=h
Cmols=h
Hmols=h
PP;atm
v%
mols=h
lbs=h
mols=h
mols=h
v%
mols=h
lb=h
H2
29.3
70140
0140
00
70140
0140
2,476
04,952
8.71
76.8
2,721
5,442
2,262
459
35.8
00
C1
1680.7
609
9,741
609
2,435
00
609
9,741
609
2,435
8787
349
0.31
2.5
871,397
087
6.8
00
C2
303.4
26769
51154
00
26769
51154
00
00.00
0.0
00
00
0.0
00
C3
441.9
14631
43115
00
14631
43115
00
00.00
0.0
00
00
0.0
00
C4
581.6
12700
48121
00
12700
48121
00
00.00
0.0
00
00
0.0
00
C5
721.3
10706
49118
00
10706
49118
00
00.00
0.0
00
00
0.0
00
C6
860.2
2130
921
00
2130
921
00
00.00
0.0
00
00
0.0
00
CO
280.3
263
20
00
263
20
359
359
01.26
3.2
114
3,200
0114
8.9
00
CO2
440.6
5199
50
00
5199
50
370
370
01.30
17.4
615
27,045
0615
48.0
00
N2
280.7
5148
00
00
5148
00
50
00.02
0.1
5148
05
0.4
00
H2O
180.0
00
00
3,694
7,389
3,694
66,500
07,389
2,596
05,191
9.13
2,351
42,315
00
0.0
2,351
42,315
100.0
754
13,227
816
3,104
3,694
7,389
4,449
79,727
816
10,492
5,893
816
10,492
20.73
100.0
5,893
79,546
2,262
1,280
100.0
5,893
20.73
Dry
gas
H/C
Rat
3.802
Stm
/Carb
4.53
Dry
gas
molsC
816
Alpha
1.901
molsH
10,492
Reforming
CH2a
+XH2O
<=>
aCO
+bCO2
+(1-a-b)
CH4
+(X
-a-
2b)H
20
+(3a+4b
+α-2)H2
Actual
@Act
EquivT
ATE
mols/
h816.2
3694.4
359.1459
369.8
87.3
2595.7
2475.9
1,500F
KWGS
0.982
0.98
1,500
0
coeff.
1.000
4.526
0.440
0.453
0.107
3.180
3.033
1,500F
KSMR
298.1
239.5
1,515
�15
atm
1.26
1.30
0.31
9.13
8.71
Act-Equiv
H3.80
9.05
0.00
0.00
0.43
6.36
6.07
TotalIn:1
2.855
TotalO
ut:1
2.855
HTSC
mols/
h816.2
3694.4
114.3
614.7
87.3
2350.8
2720.8
Actual
@Act
EquivT
ATE
Coeff
1.000
4.526
0.140
0.753
0.107
2.880
3.333
810F
KWGS
6.23
8.61
878
68
20.05Atm
2.78
12.57
0.39
2.09
0.30
8.00
9.26
Equiv-A
ct
Handbook of Petroleum ProcessingDOI 10.1007/978-3-319-05545-9_12-1# Springer International Publishing Switzerland 2014
Page 64 of 67

dPmeas ¼ 315� 290 psig ¼ 25 psig
Qfeed,meas ¼ 6:87 MMscfd
Qsteam, meas ¼ 66, 500 lb=h � 24 h=day � 379:45 scf=18 lbs! 33:6 MMscfd
Qfeed þ Qsteamð Þnorm ¼ 51:9 MMscfd ðfor normalization reference caseÞSo
dPnorm ¼ 25� 51:9= 6:9þ 33:6ð Þ½ �1:6 ¼ 37 psi
14. From the parameters monitored, we can observe that:• Depending on how much adjustment was needed to get a good material balance, flow
meter, instrument, or analytical issues may be indicated that would bear some evaluation.• The reformer approach to equilibrium is fairly good. Trending the calculated value would
provide an indication of deactivation rate.• The shift converter ATE should also be trended over time for complete analysis. An ATE of
68 �F is a little high and may indicate the shift converter catalyst has deactivated some orthe temperature is not optimum. It could also indicate bad data.
• The PSA recovery efficiency of 83 % is lower than you should expect. Recovery of at least85 % should be achievable. This would bear further investigation.
• The shift condensate rate is informational primarily. It may be needed for loading evalu-ation of the degasifier on occasion.
• The normalized pressure drop of 37 psi is somewhat high for most reformers and mayindicate some catalyst crushing or coking from age or an incident. 37 psi is not particularlyalarming. This value should be trended over time.
• The steam carbon ratio at 4.53 is a little high for most PSA-type units, but would becommon in older units using solvent CO2 cleanup. It could probably be lowered.
15. These calculations can be built into a spreadsheet, including the trial-and-error, iterativesolution to the reformer outlet composition and material balance closure. This would save asignificant amount of time and enable more detailed operations evaluation to be completedmore often.
References
Steam-Methane ReformingAmerican Petroleum Institute, Recommended Practice 571 (RP-571), Common Refinery Damage
MechanismsKatalco Corporation (Imperial Chemical Industries Ltd.), Catalyst Handbook, with Special
Reference to Unit Processes in Ammonia and Hydrogen Manufacture, 1st edn. (Springer,New York, 1970)
H.W. Rasmussen, Haldor Topsoe, Inc., Hydrogen Plant Catalysts and Operation, Unpublished(2001)
J.R. Rostrup-Nielsen, Haldor Topsoe, Inc, Catalytic Steam Reforming (Springer, Berlin/Heidelberg,1984)
Handbook of Petroleum ProcessingDOI 10.1007/978-3-319-05545-9_12-1# Springer International Publishing Switzerland 2014
Page 65 of 67

Partial OxidationHaldor Topsoe Inc., Brochure: Sulphur resistant/sour water-gas shift catalyst, www.topsoe.com.
Accessed Dec 2013H. Heurich, C. Higman, Partial oxidation in the refinery hydrogen management scheme. Paper
presented to AIChE Spring Meeting, Houston, 30 Mar 1993 (1993)Linde Engineering, Partial Oxidation information pages (2013), www.linde-engineering.com.
Accessed 17 Dec 2013J.D. Marano, Gasification and Supporting Technologies, U. S. Department of Energy, National
Energy Technology Laboratory, Energy Information Administration (2003)University of Malaysia Chemistry Department, Techniques for Hydrogen (Synthesis) Production,
http://kimia.um.edu.my/staff_new/sharifa_bee/2324/SCES2340_P3_Hydrogen_Synthesis_041218.pdf. Accessed 13 Dec 2013
K. Wawrzinek, C. Keller, (Linde Engineering, 2007), Industrial hydrogen production and technol-ogy. Paper presented at Karlsruhe FuncHy-Workshop, 21 Nov 2007
Electrolytic HydrogenHydrogen production article in Wikipedia (2013), http://en.wikipedia.org/wiki/Hydrogen_produc
tion. Accessed 17 Dec 2013J. Ivy, Summary of Electrolytic Hydrogen Production, Milestone Completion Report, National
Renewable Energy Laboratory, Golden (2004), www.nrel.gov. Accessed Dec 2013NEL Hydrogen, Process Description, NEL A Atmospheric Electroliser (2012), www.nel-hydrogen.
com. Accessed 17 Dec 2013
Olefin Cracking Byproduct RecoveryCB&I/Lummus, Ethylene (2012), www.CBI.com/lummus-technology. Accessed Dec 2013Orica Ltd., Ethylene Chemical Fact Sheet (1999). Accessed Dec 2013
Refinery Gas RecoveryJ. Alves, (UOP, 2005), Meeting the growing hydrogen demand in oil refining. Presentation to World
Petroleum Congress, https://www.onepetro.org/conference-paper/WPC-18-0914. Accessed Dec2013
S. Faraji, et al., (University of Tehran, 2005), Hydrogen recovery from refinery off-gases. J. Appl.Sci. 5(3),459–464
G. Fleming, (Air Liquide-MEDAL, 2006), Membrane technology for hydrogen recovery. Presen-tation 24 Aug 2006 at Topsoe Catalysis Forum, www.topsoe.com/sitecore/shell/Applications/~/media/PDF%20files/Topsoe_Catalysis_Forum/2006/Fleming.ashx. Accessed Dec 2013
Linde Engineering Inc., Brochure: Hydrogen Recovery by Pressure Swing Adsorption (2012),http://www.linde-engineering.com/internet.global.lindeengineering.global/en/images/HA_H_1_1_e_12_150dpi19_6130.pdf. Accessed Dec 2013
UOP article, Hydrogen Purification, www.UOP.com/processing-solutions/gas-processing/hydrogen/. Accessed 18 Dec 2013
Pressure Swing AdsorptionLinde Engineering Inc., Brochure, Hydrogen Recovery by Pressure Swing Adsorption (2012),
http://www.linde-engineering.com/internet.global.lindeengineering.global/en/images/HA_H_1_1_e_12_150dpi19_6130.pdf. Accessed Dec 2013
Handbook of Petroleum ProcessingDOI 10.1007/978-3-319-05545-9_12-1# Springer International Publishing Switzerland 2014
Page 66 of 67

UOP article, Hydrogen Purification, www.UOP.com/processing-solutions/gas-processing/hydrogen/. Accessed 18 Dec 2013
MembranesG. Fleming, (Air Liquide-MEDAL, 2006), Membrane technology for hydrogen recovery. Presen-
tation 24 Aug 2006 at Topsoe Catalysis Forum, www.topsoe.com/sitecore/shell/Applications/~/media/PDF%20files/Topsoe_Catalysis_Forum/2006/Fleming.ashx. Accessed Dec 2013
UOP article, Hydrogen Purification, www.UOP.com/processing-solutions/gas-processing/hydrogen/. Accessed 18 Dec 2013
UOP website summary item, Polybed™ PSA and Polysep™ Membrane Integration forDebottlenecking: Case Study (2007), http://www.uop.com/?document=uop-psa-polysep-membrane-integration-case-study%26download=1
Cryogenic RecoveryR. Dragomir, et al., (Praxair, 2010), Paper from AIChE 2010 Spring Meeting Proceedings: Tech-
nologies for Enhancing Refinery Gas Value, http://www.praxair.com/~/media/North%20America/US/Documents/Specification%20Sheets%20and%20Brochures/Industries/Refining/AIChE_Paper_2_16_10.ashx. Accessed Dec 2013
S. Faraji, et al., (University of Tehran, 2005), Hydrogen recovery from refinery off-gases. J. Appl Sci5(3), 459–464 (2005). Wilson Energy Partners LLC, www.wilsonenergypartners.com/cryogenic.html
W.H. Isalski, Article on Cryogenic Plant, http://www.thermopedia.com/content/677/?tid=110%26sn=7. Accessed Dec 2013
Handbook of Petroleum ProcessingDOI 10.1007/978-3-319-05545-9_12-1# Springer International Publishing Switzerland 2014
Page 67 of 67