Hydrogen Applications and Business Models - Kearney
192
Hydrogen applications and business models Going blue and green? Kearney Energy Transition Institute June 2020
-
Upload
khangminh22 -
Category
Documents
-
view
1 -
download
0
Transcript of Hydrogen Applications and Business Models - Kearney

Hydrogen applications and business models
Going blue and green?Kearney Energy Transition InstituteJune 2020

22
Compiled by the Kearney Energy Transition Institute
AcknowledgementsThe Kearney Energy Transition Institute wishes to acknowledge the following people for their review of this FactBook: Dr. Brian Efird, program director at the King Abdullah Petroleum Studies and Research Center; Lucas Bertrand, Business Development Director for ITM Power in France and Benelux; as well as Dr. Adnan Shihab-Eldin, Claude Mandil, Antoine Rostand, and Richard Forrest, members of the board for the Kearney Energy Transition Institute.
Their review does not imply that they endorse this FactBook or agree with any specific statements herein.
About the FactBook: hydrogen applications and business modelsThis FactBook seeks to provide an overview of hydrogen-related technologies, emerging applications, and new business models, covering the entire value chain and analyzing the environmental benefits and economics of this space.
About the Kearney Energy Transition InstituteThe Kearney Energy Transition Institute is a nonprofit organization that provides leading insights on global trends in energytransition, technologies, and strategic implications for private-sector businesses and public-sector institutions. The Instituteis dedicated to combining objective technological insights with economical perspectives to define the consequences and opportunities for decision-makers in a rapidly changing energy landscape. The independence of the Institute fosters unbiased primary insights and the ability to co-create new ideas with interested sponsors and relevant stakeholders.
AuthorsThibault L’Huby, Prashant Gahlot, and Romain Debarre
Hydrogen applications and business models

3
Hydrogen – H2FactBook Overview
H2 role in the energy transition
This section provides a brief description of the energy decarbonization challenge to mitigate climate change and gives an overview of hydrogen’s potential role and impact.
This FactBook is structured in four sections
Hydrogen could help reduce GHG emissions in multiple sectors, representing about half of global GHG emissions
Key H2 applications
This section looks at existing and emerging hydrogen applications and assesses their maturity. Hydrogen applications are categorized into four types: industrial applications, mobility, power generation, and gas energy.
Hydrogen is broadly used in industries but remains immature in the broader set of applications, for which cost reduction and innovative business models are required
H2 value chain
This section provides an overview of production, storage, and transport technologies—looking at their performances, limitations, and environmental benefits and giving some perspective on their technology maturity and possible improvements.The deployment of Blue Hydrogen could help develop large-scale infrastructures, providing time for Green Hydrogen to mature and scale up
H2 business Models
This section looks at the emerging business models, considering current market conditions and their possible long-term evolution assuming a potential technology cost reduction and performance improvement.
Most hydrogen business models require policy support, with heavy-duty transportation being the most promising one in the current context
1 2
3 4

4
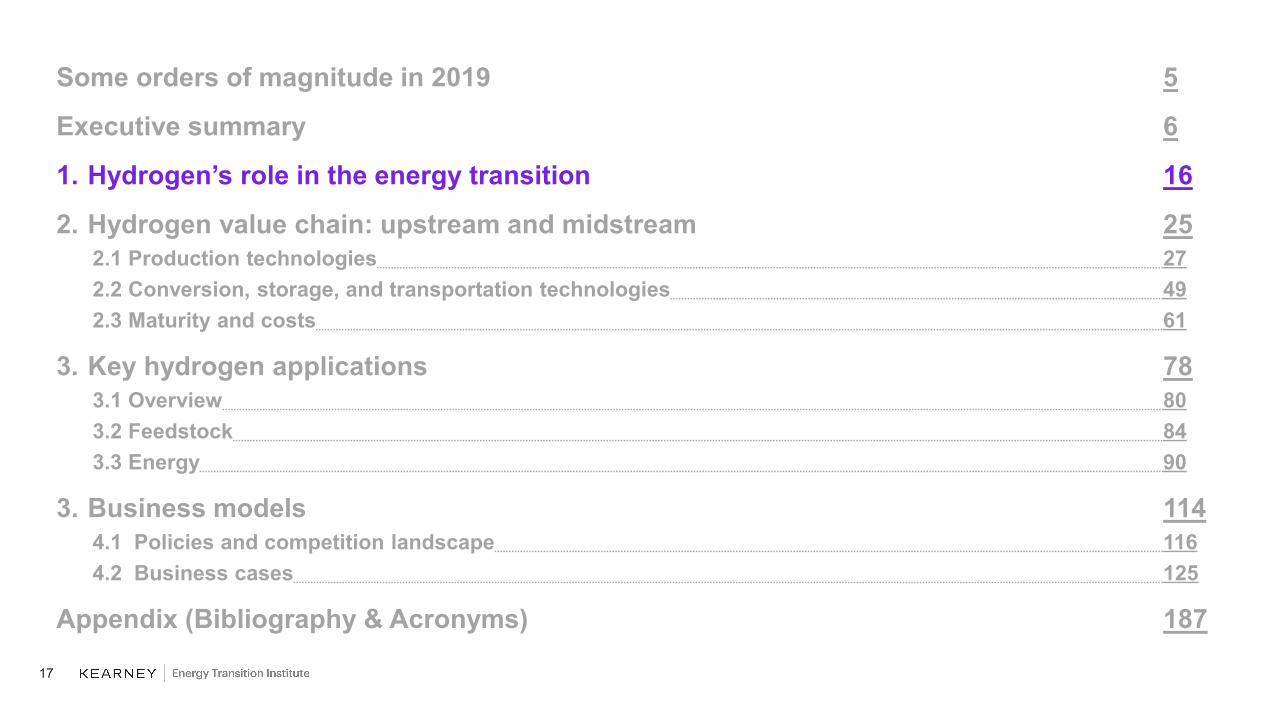
Some orders of magnitude in 2019 5
Executive summary 6
1. Hydrogen’s role in the energy transition 16
2. Hydrogen value chain: upstream and midstream 252.1 Production technologies 272.2 Conversion, storage, and transportation technologies 492.3 Maturity and costs 61
3. Key hydrogen applications 783.1 Overview 803.2 Feedstock 843.3 Energy 90
3. Business models 1144.1 Policies and competition landscape 1164.2 Business cases 125
Appendix (Bibliography & Acronyms) 187
5
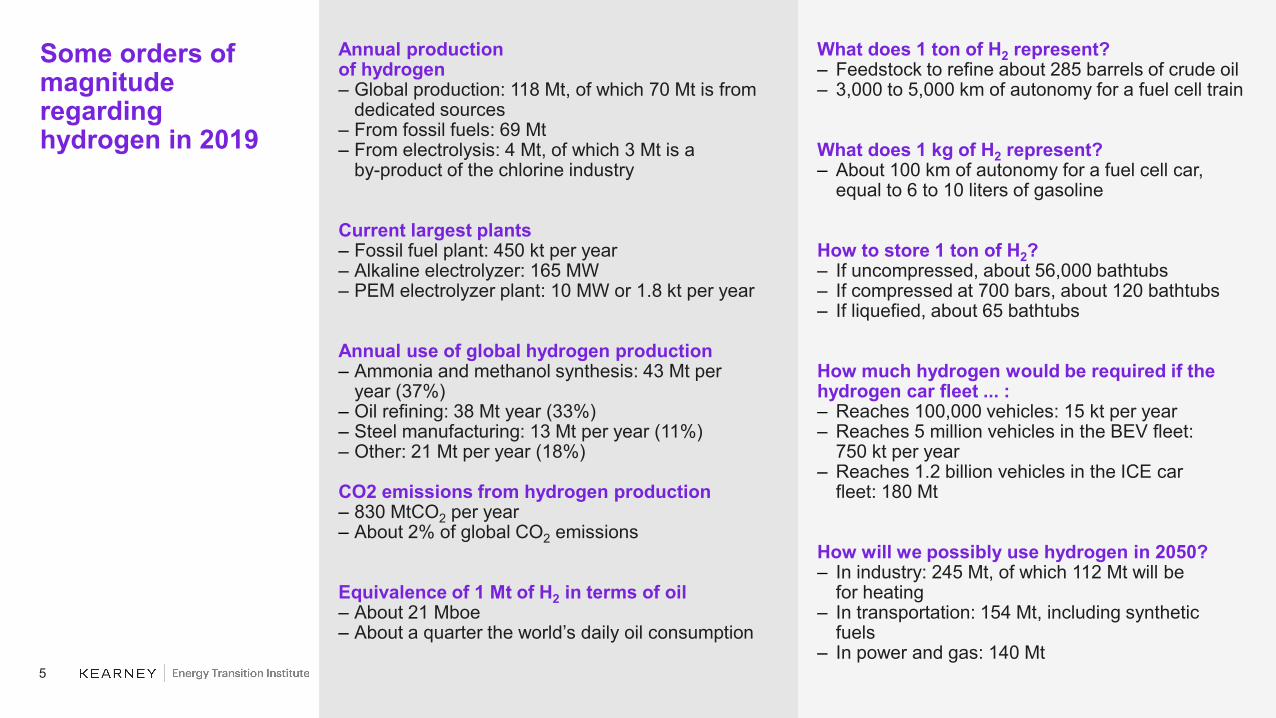
What does 1 ton of H2 represent?– Feedstock to refine about 285 barrels of crude oil– 3,000 to 5,000 km of autonomy for a fuel cell train
What does 1 kg of H2 represent?– About 100 km of autonomy for a fuel cell car,
equal to 6 to 10 liters of gasoline
How to store 1 ton of H2?– If uncompressed, about 56,000 bathtubs– If compressed at 700 bars, about 120 bathtubs– If liquefied, about 65 bathtubs
How much hydrogen would be required if the hydrogen car fleet ... :– Reaches 100,000 vehicles: 15 kt per year– Reaches 5 million vehicles in the BEV fleet:
750 kt per year– Reaches 1.2 billion vehicles in the ICE car
fleet: 180 Mt
How will we possibly use hydrogen in 2050?– In industry: 245 Mt, of which 112 Mt will be
for heating– In transportation: 154 Mt, including synthetic
fuels– In power and gas: 140 Mt
Annual productionof hydrogen– Global production: 118 Mt, of which 70 Mt is from
dedicated sources– From fossil fuels: 69 Mt– From electrolysis: 4 Mt, of which 3 Mt is a
by-product of the chlorine industry
Current largest plants– Fossil fuel plant: 450 kt per year – Alkaline electrolyzer: 165 MW– PEM electrolyzer plant: 10 MW or 1.8 kt per year
Annual use of global hydrogen production– Ammonia and methanol synthesis: 43 Mt per
year (37%)– Oil refining: 38 Mt year (33%)– Steel manufacturing: 13 Mt per year (11%)– Other: 21 Mt per year (18%)
CO2 emissions from hydrogen production– 830 MtCO2 per year– About 2% of global CO2 emissions
Equivalence of 1 Mt of H2 in terms of oil– About 21 Mboe– About a quarter the world’s daily oil consumption
Some orders of magnitude regarding hydrogen in 2019

6
The need for decarbonizationAnthropogenic CO2 emissions (excluding AFOLU1) have accelerated during the 20th century, rising to about 37 Gt per year in 2019, with global CO2 atmospheric concentration reaching 415 ppm. At current emission levels, the remaining carbon budget to keep global warming below the +1.5 °C target could be exhausted in 10 years, which would have dramatic consequences on ecosystems and societies.
Hydrogen: a potential candidateMost of the anthropogenic greenhouse gas (GHG) emissions (excluding AFOLU) comes from the production and transport of energy (about 40%, including electricity and heat production), industry (23%), buildings (21%), and transport (16%).
Hydrogen provides multiple pathways to reducing GHG emissions in these sectors and could address about half of their GHG emissions if produced, stored, and carried cleanly. Hydrogen can either be used as an energy carrier or as a feedstock for various industrial and chemical processes.
Hydrogen is a versatile energy carrier that can either be burnt to release heat or converted into electricity using fuel cells. Therefore, hydrogen offers a broad range of applications from energy production to mobility services. But H2 is competing with other decarbonized solutions that tackle similar applications, such as renewable energy solutions and carbon capture and storage.
Hydrogen has high gravimetric energy density (MJ/kg) and can be stored under multiple forms (for example, gaseous, liquid, or converted to other molecules), which makes it a strong candidate for energy storage as an intermediary vector for the energy system (enabling coupling between electric grid, gas grid, transportation, and industries).
Hydrogen (H2)could play a major role in various energy applications, contributingto global decarbonization
Executive summary (1/10)
Hydrogen’s role in the energy transition
(Section 1: pages 16–24)
1. AFOLU is agriculture, forestry, and other land use.

7
Main brown/grey production sources are steam methane reforming (SMR), gasification, and autothermal reforming (ATR).In a Steam methane reforming reactor, natural gas is mixed with high-temperature steam and nickel catalysts in a endothermic reaction to form H2, CO and CO2, called a syngas. It requires 3 to 4 kg of CH4per kg of H2 (about 65% of lower heating value efficiency).In a coal gasification reactor, O2 is added to the high-temperature combustion chamber in substoichiometric conditions, releasing syngas, tar vapors, and solid residues. About 8 kg of coal are required to produce 1 kg of H2 (70 to 80% LHV efficiency). Autothermal reforming combines both production methods, with a combustion and a catalytic zone within the same chamber, also releasing a syngas. It requires 2.5 to 3 kg of CH4/kgH2 (80% LHV efficiency).
The syngas is a mixture of H2, CO, CO2, and other gases that can be used as is or purified.Syngas composition depends on reactor design and feedstock used. As H2 and CO are main syngas components, syngas quality is measured with H2/CO ratio in volumetric quantities. High ratio means high quantity of H2 in the syngas.Syngas can directly be consumed, such as for methanol synthesis or as a fuel. In other cases, purification is required. There are two main ways to purify syngas:– Pressure swing adsorption (PSA) purification: syngas first undergoes a water–gas shift reaction, where
water steam is added to convert CO into CO2 and H2. CO2 is then removed and released through selective adsorption process.
– Decarbonation and methanation purification: after a water–gas shift reaction, syngas undergoes decarbonation where amines are added to remove the majority of the CO and CO2. During methanation, the remaining CO and CO2 reacts with H2 to create CH4.
Blue hydrogen requires the combination of brown sources with CCS value chain (capture, transportation, storage, and/or usage of CO2), for which multiple technologies are available.Within the energy value chain, CCS applied for hydrogen production is considered as pre-combustion capture: carbon is removed from fossil fuel to create hydrogen. Following on-site capture, carbon can be transported through pipelines or ships and is later stored in underground geological storage (for example, depleted oil and gas fields). Carbon can also be used for further processes, such as chemical feedstock (for example, for methanol or liquid fuels synthesis), enhanced oil recovery (EOR), or agriculture.CCS can be deployed at different stages of the end-to-end production and purification process. Several technologies are available, such as amine capture or membrane separation.
Blue and green hydrogen sources offer potential decarbonization solutions, requiring either CCS deployment or use of renewables (1/2)
Executive summary (2/10)
Hydrogen value chain: upstream and midstream -Production technologies
(Section 2.1: pages 27–48)

8
Green hydrogen mostly relies on electrolysis technologies, involving an electrochemical reaction where electrical energy allows a water split between hydrogen and dioxygen.An electrolysis cell is the assembly of two electrodes—a cathode and an anode—either immerged in an electrolyte (Alkaline) or separated by a polymer membrane (PEM). Direct current is applied from the anode to the cathode. For a potential difference above 1.23V, water is split into H2 and O2. An electrolyzer is an assembly of cell stacks in parallel, a stack being an assembly of cells in serial connection.
Three electrolysis technologies are available, all based on the same electrochemical reaction but with differences in the materials used and the operating point:– Alkaline electrolysis (AE) is the oldest technology. Potassium hydroxide electrolyte is often used
because it is a strong base (avoiding corrosivity caused by acid) with high mobility ions. Anode and cathode are separated by a thin porous foil enabling separation of H2 and O2 with a current density of 0.3 to 0.5 A.cm-2. AE efficiency is usually 52 to 69%. It is currently the cheapest electrolysis option since it does not use rare materials, and large-scale production plants (up to 150 MW) have already been built.
– Proton exchange membrane (PEM) is a rapidly evolving technology and is being commercially deployed. The membrane used is a polymer membrane enabling higher current density (currently 1 to 3 A.cm-2). It is more expensive than AE technologies since rare materials are used (such as platinum for electrodes) but has higher flexibility and quicker response time, making it suitable for renewable energy integration. PEM efficiency is usually 60 to 77%.
– Solid oxide electrolysis cell (SOEC) is still in the R&D stage. The electrolyte used is high temperature steam water (650 to 1,000°C), which provides enough energy to decrease power consumption needs. However, it is economically viable only if fatal heat is available for free or at low cost. Because of high temperature operations, ceramic membranes usually have a shorter lifetime than other technologies. SOEC efficiency is usually 74 to 81%, excluding the energy needed to heat steam.
The balance includes all other components required for the process before electrolysis (AC/DC power converter, water deionizer, and storage tank) and after electrolysis (dehydration unit to purify H2).
Other green hydrogen production sources include dark fermentation, microbial electrolysis, and photolytic conversion, which are still in laboratory stages.
Blue and green hydrogen sources offer potential decarbonization solutions, requiring either CCS deployment or use of renewables (2/2)
Executive summary (3/10)
Note: LCOH calculation: (present value of investments + present value of costs)/(present value of yearly hydrogen production), in $/kg
Hydrogen value chain: upstream and midstream -Production technologies
(Section 2.1: pages 27–48)
9
Executive summary (4/10)
Hydrogen value chain: upstream and midstream -Conversion, storage, and transportation technologies
(Section 2.2: pages 49–60)
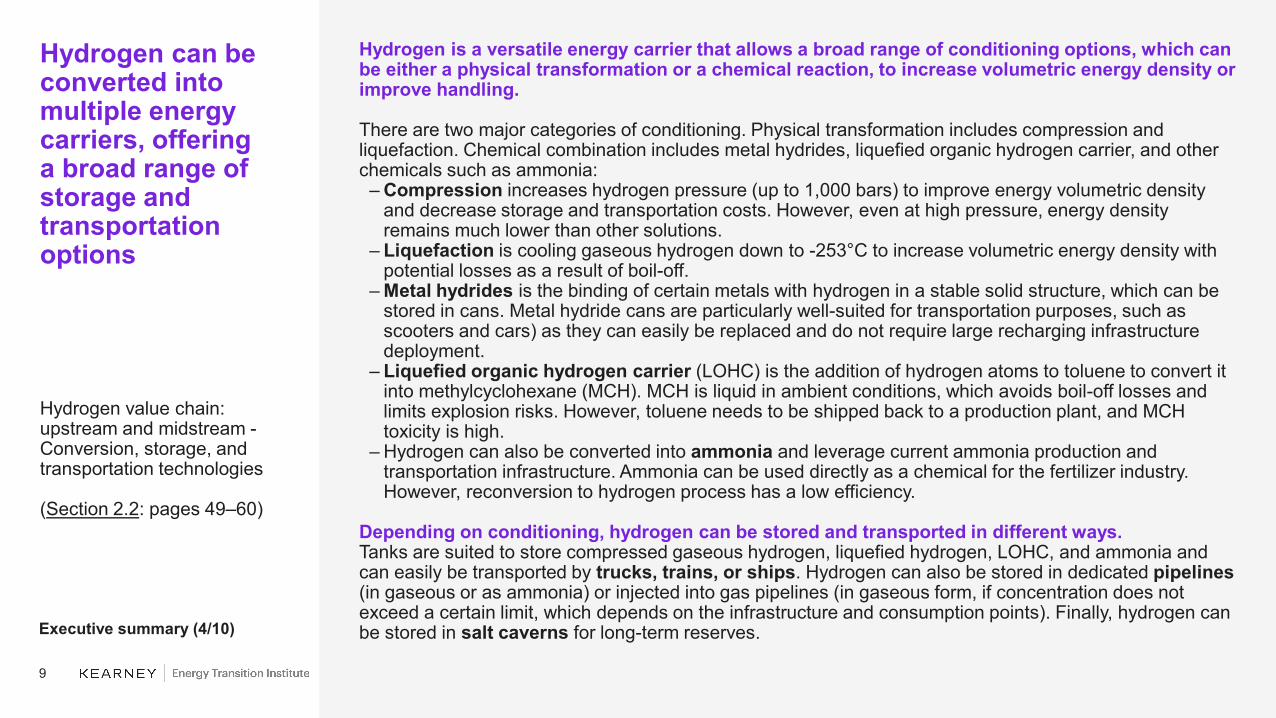
Hydrogen can be converted into multiple energy carriers, offeringa broad range of storage and transportation options
Hydrogen is a versatile energy carrier that allows a broad range of conditioning options, which can be either a physical transformation or a chemical reaction, to increase volumetric energy density or improve handling.
There are two major categories of conditioning. Physical transformation includes compression and liquefaction. Chemical combination includes metal hydrides, liquefied organic hydrogen carrier, and other chemicals such as ammonia:– Compression increases hydrogen pressure (up to 1,000 bars) to improve energy volumetric density
and decrease storage and transportation costs. However, even at high pressure, energy density remains much lower than other solutions.
– Liquefaction is cooling gaseous hydrogen down to -253°C to increase volumetric energy density with potential losses as a result of boil-off.
– Metal hydrides is the binding of certain metals with hydrogen in a stable solid structure, which can be stored in cans. Metal hydride cans are particularly well-suited for transportation purposes, such as scooters and cars) as they can easily be replaced and do not require large recharging infrastructure deployment.
– Liquefied organic hydrogen carrier (LOHC) is the addition of hydrogen atoms to toluene to convert it into methylcyclohexane (MCH). MCH is liquid in ambient conditions, which avoids boil-off losses and limits explosion risks. However, toluene needs to be shipped back to a production plant, and MCH toxicity is high.
– Hydrogen can also be converted into ammonia and leverage current ammonia production and transportation infrastructure. Ammonia can be used directly as a chemical for the fertilizer industry. However, reconversion to hydrogen process has a low efficiency.
Depending on conditioning, hydrogen can be stored and transported in different ways.Tanks are suited to store compressed gaseous hydrogen, liquefied hydrogen, LOHC, and ammonia and can easily be transported by trucks, trains, or ships. Hydrogen can also be stored in dedicated pipelines(in gaseous or as ammonia) or injected into gas pipelines (in gaseous form, if concentration does not exceed a certain limit, which depends on the infrastructure and consumption points). Finally, hydrogen can be stored in salt caverns for long-term reserves.

10
Executive summary (5/10)
Hydrogen value chain: upstream and midstream –Maturity and costs
(Section 2.3: pages 61–77)
While brown technologies are the most mature, blue and green should close the gap by 2030; conditioning transportation remains costly (1/2)
Today, Hydrogen produced from Brown sources is two to ten times less expensive than from Green or Blue sourcesThe Levelized Cost Of Hydrogen is the average discounted cost of hydrogen generation over the lifetime of the considered plant. It is used to compare the production cost of hydrogen from the various sources.
For brown hydrogen production sources, LCOH depends on technology and feedstock price, and commonly range around 90¢ to $2.10 per kg. The SMR average estimated price is currently about $1.40 per kg, with LCOH mainly driven by the price of natural gas (about 75% of LCOH) and capex (about 22%).
For blue hydrogen production sources is ~50¢ per kg higher than brown sources, and is estimated to range between $1.50 and $2.50 per kg. It is still cheaper than electrolyzer but requires carbon storage caverns. The cost of CCS highly depends on the technology used, which will all have different efficiency (up to 90% capture rate).
For green hydrogen production sources, LCOH depends on technology, electricity price, and electrolyzersize as it benefits from economies of scale. Electrolyzers LCOH is estimated to range between $2.50 to $9.50 per kg depending on technologies.– Alkaline electrolysis (AE) is currently the cheapest available technology with an average estimated
LCOH of $4.00 per kg.– The Proton exchange membrane (PEM) average estimated LCOH is $5.00 per kg, and SOEC $7.40
per kg. LCOH is mainly driven by electricity cost (71% for a PEM) and capex (21% for a PEM).For green hydrogen, access to cheap renewable electricity could help reduce LCOH of electrolysis. However, renewable electricity from solar and wind power sources are not dispatchable and provide relatively low load factors. Thus, the capex part would dramatically increase. Reaching economical competitiveness with blue sources (LCOH of $2 to $3 per kg) requires low electricity prices and high load factor (commonly above 90%)
By 2030, LCOH of blue hydrogen is expected to go as low as $1.30 to $1.90 per kg, and between $1.60 to $3.80 per kg for green hydrogen, depending on the electrolysis technology used.R&D improvements will help reduce capex, increase lifetime and improve efficiency. The main focus will be on increasing density, lowering catalysts, and scaling up the balance of system components.

11
Executive summary (6/10)
While brown technologies are the most mature, blue and green should close the gap by 2030; conditioning transportation remains costly (2/2)
Hydrogen LCOH is highly impacted by conditioning and transportation steps, which can double its LCOH cost.
LCOH from conditioning highly varies depending on technologies.
– Compression and tank storage is the cheapest option (20¢ to 40¢ kg) with no associated reconversion costs.
– Liquefaction LCOH is $1.80 to $2.20 per kg, which could be reduced with improvements on boil-off losses. As liquefied hydrogen naturally tends to become gaseous at ambient temperature, no associated reconversion process is required.
– Ammonia conversion LCOH is $1.00 to $1.20 per kg, and reconversion LCOH is 80¢ to $1.00 per kg. Finally, LCOH for LOHC is 40¢ per kg while reconversion can vary from $1.00 to $2.10 per kg.
LCOH from transportation depends on hydrogen conditioning, transportation mean used, and distance travelled:– For long ranges (more than 1,000 km), ships and pipelines are possible options. Pipelines can carry
compressed gaseous hydrogen or ammonia, while ships can be used for liquefied hydrogen, LOHC, or ammonia. For a 3,000 km journey, transporting gaseous hydrogen through a pipeline is about $2.00 per kg. For the same distance but with liquefied hydrogen transported by ship, LCOH is about $1.50 per kg. However, below 2,000 km of travelled distance, pipelines appear to be cheaper.
– For short ranges (less than 1,000 km), trucks, rail, and pipeline are possible options. Compressed gaseous, liquefied, LOHC, and ammonia can be transported by trucks, while pipelines can carry only compressed gaseous hydrogen and ammonia. For a 500 km journey, transporting compressed gaseous hydrogen by trucks costs about $2.00 per km versus about 40¢ to 80¢ for pipelines.
Decentralized production sources or on-site consumption allow skipping the midstream value chain.
Hydrogen value chain: upstream and midstream –Maturity and costs
(Section 2.3: pages 61–77)

12
Executive summary (7/10)
Key hydrogen applications
(Section 3: pages 78–113)
Hydrogen isbeing tested or implemented in a broad range of industrial processes, mobility solutions, power generation, and gas energy
Hydrogen versatility allows for multiple applications as a feedstock, as a gas, or for electricity generation (fuel cells). As of 2019, about 115 Mt of pure and mixed hydrogen are consumed annually, of which 94 Mt is for industrial processes. As a feedstock, hydrogen is mainly used in oil refining, ammonia synthesis, and steel manufacturing. Hydrogen can also be mixed with oxygen in a fuel cell to deliver a direct current and release water and heat, with an efficiency of about 60%. Hydrogen can be burnt in a dedicated turbine coupled with an alternator to produce electricity or be injected into gas network or a dedicated pipeline network to release heat at consumption point.
Industrial processes mainly use hydrogen as a feedstock with on-site productionIn the chemicals industry, hydrogen can be combined with nitrogen to form ammonia (Haber–Bosh process). Ammonia can be later converted into fertilizers. Hydrogen can also be combined with CO and CO2 to form methanol in a catalytic reaction. Methanol can be further converted into polymers or olefins or be used as a fuel. About 44 to 45 Mt of hydrogen are consumed annually for chemicals synthesis.In oil refining, hydrogen is used in hydrodesulfurization to remove sulfur contents in crude and in hydrocracking processes to upgrade the oil quality of heavy residues. About 38 MT of hydrogen are consumed annually for chemicals synthesis.In the steel industry, hydrogen is used in a basic oxygen furnace (BOF) and in direct reduction of iron (DRI) to convert iron ore into steel. Hydrogen can come as a by-product of BOF but needs to be produced on-site in DRI. Annual consumption is about 13 MT.
In mobility, hydrogen is converted to electricity through a fuel cell to power an electric engine.Several types of fuel cells exist and are characterized by various combination of electrodes and electrolytes, with different requirements and performance. As of 2019, hydrogen deployment in mobility has been limited to bikes, scooters, cars, trucks, buses, and trains. Hydrogen use for marine roads and aviation is still in early-stage development.
In power generation, hydrogen will be mainly used as a energy storage vector. In peak times, hydrogen can be supplied to stationary fuel cells or gas turbines that will provide clean electricity to the grid.
By 2050, pure hydrogen consumption could grow eightfold to 540 MT per year, mainly driven by transportation and industrial processes.

13
Executive summary (8/10)
Business models - Policies and competition landscape
(Section 4.1: pages 116–124)
Private companies and governments are investing more in the clean hydrogen economy
Companies specialized in the hydrogen value chain are partnering with a broad range of other industrials to capture value.M&A activity has been growing over the past few years, with companies from different industries partnering to develop new business models based on hydrogen. The Hydrogen Council was created in 2017 by 30 private companies from industry, transportation, and energy to accelerate investments in hydrogen and encourage key stakeholders to back hydrogen as part of the energy mix.
Governments are putting in place regulations and mechanisms to promote hydrogen deployment.Multiple countries have launched support initiatives and incentives mechanisms to accelerate hydrogen deployment, mainly in the transportation sector. Countries have developed specific strategy cases based on their capabilities and economical situations:
– In Europe, Hydrogen Europe is partnering with the European Commission to identify legal barriers that could delay or deter investments in hydrogen. The objectives are to integrate more renewables and decarbonize mobility, heating, and industry.
– In the United States, multiple incentives have been given to fund hydrogen R&D in public laboratories and private R&D departments. Between 2004 and 2017, the Department of Energy was granted $2.5 billion to develop fuel cell electric vehicles (FCEV), build a mature hydrogen economy, decrease oil dependency, and create a sustainable energy economy.
– In Middle Eastern oil-rich countries, a blue hydrogen economy is being studied as a transition from oil exports to hydrogen exports and the use of CO2 for enhanced oil recovery.
– Japan was the first country to adopt a "Basic Hydrogen Strategy" and plans to become a “hydrogen society”, targeting commercial scale capability to procure 300,000 tons of hydrogen annually.
– Australia adopted a National Hydrogen Strategy in late 2019 to open up opportunities in domestic use as well as export market.

14
Executive summary (9/10)
Business models - Business cases
(Section 4.2: pages 125–186)
Most hydrogen business models require policy support, withheavy-duty transportationbeing the most promising onein the current context (1/2)
New business models are developing for both blue and green solutions to take advantage of decarbonization. Centralized blue production sources are being considered for industrial areas, such as the Port of Rotterdam, where hydrogen could feed local industries and power plants. Electrolyzer coupled with renewable energy is being considered as it could both accelerate renewable energy integration on the grid and decarbonize end applications such as gas energy, power generation, industry, and mobility.
Hydrogen-based solutions provide decarbonization solutions that are not yet competitive with traditional solutions. The relevance of business cases has been assessed based on three criteria: economical viability, environmental impact (end-to-end CO2 emissions), and other benefits, such as reduced energy dependency, grid stabilization, job creation, and air-quality improvement in populated areas. All hydrogen solutions appear to be more expensive than conventional solutions. However, in certain cases, CO2 emissions can be significantly reduced. The carbon abatement cost has been calculated to assess the relevance of opportunities for hydrogen and is compared with the IPCC carbon price target of $220 per tCO2 by 2030 in a +2°C trajectory.For a centralized blue production source feeding nearby industries, which would require adjustments to accept hydrogen rather than conventional fuels and feedstocks, mainly in gas power plants and refineries, the carbon abatement cost would be $110 to $215 per tCO2 for 27 to 130 mtpa of CO2 avoided.Electrolyzer business models will be based on a power-to-x scheme. The surplus of electricity will be used to produce hydrogen, which will later be used as a fuel for gas heating, chemicals, power generation, or mobility. However, depending on the electricity source, the carbon impact and LCOH will differ. Electrolyzer can be connected to the grid and running at about 90% load factor, connected solely to a renewable source and be dependent on the source load factor (maximum 40% for wind power plants) or combine both sources:
– Power-to-gas. Hydrogen is injected into gas networks, either blended with natural gas with a certain volumetric limit, which depends on gas grid specifications and tolerance to hydrogen, or undergoing a methanation process to form methane. Injection is easier and cheaper, with a carbon abatement cost of $220 to $320 per tCO2. Adding a methanation step adds complexity and costs, leading to an abatement cost of $1,100 to $2,800 per tCO2.
– Power-to-power. Stored hydrogen is released in a fuel cell to deliver power at peak time rather than starting a coal or gas turbine. Compared with a coal turbine and depending on the electricity source that powered the electrolyzer, 40 to 790 gCO2 per MWhe could be saved at an abatement cost between $120 and $3,000 per tCO2.

15
Executive summary (10/10)
Most hydrogen business models require policy support, withheavy-duty transportationbeing the most promising onein the current context (2/2)
– Power-to-molecule. Electrolyzer is built on a refinery or a chemicals production plant in addition to a SMR and provides hydrogen when electricity surplus is available. However, scalability is limited: electrolyzer (pilot plant) in the Wesseling refinery in Germany supplies only 1% of hydrogen needs to the refinery but could spare about 9 kgCO2 per kgH2 at a cost of about $120 to $150 per tCO2.
– Power-to-mobility. Hydrogen is produced on site at the refueling station. If overall LCOH drops down to $4 to $5 per kg, making it competitive with gasoline, the vehicle acquisition cost is expected to remain higher, increasing total cost of ownership. The CO2 abatement cost is $570 to $2,000 per tCO2 for passenger cars, $120 per tCO2 for buses, and $60 per tCO2 for trains.
Lithium–ion batteries for electricity storage and mobility are the main competitor to hydrogen on its segments. – Lithium–ion batteries are suited for intra-day storage and frequency stabilization, whereas hydrogen is
more suited for long-term seasonal storage.– Battery electric vehicles are the main competitor of hydrogen in the mobility segment, in particular for
light-duty vehicles. (Heavy-duty BEV such as trucks and buses are limited by battery-size requirements.) However, BEV are limited in range (maximum of 650 km with an average of 100-200 km in real-life conditions) and long recharging time. A FCEV is expected to be more competitive than a BEV for a journey of more than ~300 km. For trains, hydrogen is the cheapest clean solution if the rail line is not electrified, which avoids high capex. However, on electrified lines, electric trains are already cheaper than diesel and hydrogen trains.
– The LCOE produced is expected to be comparable between the two technologies: $150 to $250 per MWhe.
Indirect value creation, such as local job creation and grid stabilization, should be considered for hydrogen valuation. Hydrogen business solutions generally provide additional indirect value that are not considered in its economic assessment. Developing a hydrogen economy would require gaining economies of scale and developing large production hubs that could supply multiple applications. To prioritize investments, carbon abatement cost and carbon avoided, as well as favorable impact on local economies, could be used as metrics to assess hydrogen’s relevance compared with other solutions.
Business models - Business cases
(Section 4.2: pages 125–186)

16
Hydrogen’s role in the energy transition
17
Some orders of magnitude in 2019 5
Executive summary 6
1. Hydrogen’s role in the energy transition 16
2. Hydrogen value chain: upstream and midstream 252.1 Production technologies 272.2 Conversion, storage, and transportation technologies 492.3 Maturity and costs 61
3. Key hydrogen applications 783.1 Overview 803.2 Feedstock 843.3 Energy 90
3. Business models 1144.1 Policies and competition landscape 1164.2 Business cases 125
Appendix (Bibliography & Acronyms) 187

18
Global warming can have a dramatic impact on ecosystemsand societies
“Climate-related risks for natural and human systems are higher for global warming of 1.5°C than at present but lower than at 2°C (high confidence). These risks depend on the magnitude and rate of warming, geographic location, levels of development and vulnerability, and on the choices and implementation of adaptation and mitigation options (high confidence).”
– Intergovernmental Panel on Climate Change
Sources: “Special report on the impacts of global warming of 1.5°C above pre-industrial levels and related global greenhouse gas emission pathways (SR1.5),” Intergovernmental Panel on Climate Change, 2018; Kearney Energy Transition Institute analysis
Key consequences of +1.5°C and +2°C global warming by 2100
+1.5°C +2.0°C
Global mean sea level rise 0.26 to 0.77 m(medium confidence)
0.36 to 0.87 m(medium confidence)
Biodiversity losses(among 105,000 species studied)
8% of plants6% of insects4% of vertebrates(medium confidence)
16% of plants18% of insects8% of vertebrates(medium confidence)
Decline of coral reefs 70–90%(high confidence)
More than 99%(very high confidence)
Frequency of disappearance of the Arctic ice cap
Once per century(high confidence)
Once per decade(high confidence)
Decrease in global annual catch for marine fisheries
1.5 million tons(medium confidence)
3 million tons(medium confidence)
Average increase of heat waves mean temperature
+3°C(high confidence)
+4°C(high confidence)Hydrogen’s role in
energy transition1

19
Remaining carbon budget(2018, GtCO2eq)
GHG emissions(2018, GtCO2eq per year)
At current emission levels, we only have about 10 years leftin the estimated carbon budget for global warming of 1.5°C
Carbon GHG Other GHG
2.500
4.000
3.500
3.000
0
4.500
+1.170
2.0°C target
+840
+580
+1500
+420
+2080
1.5°C target
2.200
33 percentile
67 percentile50 percentile
Already emitted(1850–2017)
53
30
50
0
20
10
5
15
25
55
35
40
45
Others
F-gases
Coal
LUC(1)
Gas
Oil
CO2 CH4 N2O Total
43
Hydrogen’s role inenergy transition1
1 LUC : deforestation and other land use changeSources: Global Carbon Budget 2018; IPCC (2018) “SR5–Chapter 2”; BP (2015) “Statistical review”; Kearney Energy Transition Institute analysis

20
Hydrogen could partially address GHG emissions as a fuel substitute in sectors responsible for more than 65% of global emissions.
6%
5%
22%
27%
14%
17%
9%
~44
Current GHG emissions by segment(GT CO2 eq/y)
Hydrogen potential use cases for decarbonization
– Integration of renewables:– Large scale storage for inter-seasonal storage– Geographic balance– Grid stabilization
– Circular economy with CCU/CCS2
– Clean feedstock for oil refining & chemicals
– Heating networks with H2 (blended or full H2)
– Full cell electric vehicle (passenger cars, trucks, trains)
– Synthetic fuels (airplanes, ships)
Not substitutable
by H2
Partially substitutable by
H2
(Either as fuel for heat and power or as
feedstock for industry)
Building
Industry
Transport
Electricity & heatOil & gas, others
Coal
Others
Agriculture, forestry & other land use1
Use case Method of H2 substitution
Hydrogen’s role inenergy transition1
1. Includes land use, emissions from cattle, etc.; 2. Carbon Capture Utilisation/ Carbon Capture StorageSources: IEA; FAO; Kearney Energy Transition Institute analysis

21
Hydrogen provides multiple pathways enabled by various production technologiesand applications across its value chain
Overview of H2 value chain and technologies
Hydrogen’s role inenergy transition1
• Steam methane reforming (SMR)• Gasification• Autothermal reforming (ATR)• Pressurized combustion reforming• Chemical looping• Concentration solar fuels (CSF)• Heat exchange reforming (HER) and
gas heated reforming (GHR)• Pyrolysis• Other technologies (such as microwave)
• Alkaline electrolysis (AE)• Proton exchange membrane (PEM)• Solid oxide electrolyzer cell (SOEC)• Other technologies (such as chlor-alkali)• Dark fermentation• Microbial electrolysis• Photoelectrochemical
Production technology Conversion, storage, transport, and distribution End-use applications
Ther
moc
hem
ical
Elec
tro-
lysi
sO
ther
Upstream
• Hydrogen gas
• Liquid hydrogen
• NH3
• Liquefied organic hydrogen carrier (LOHC)
• Trucks
• Trains
• Pipeline
• Tankers
• Geological storage
• Storage tanks
• Chemical reconversion
• Liquefaction and regasification
Con
vers
ion
Tran
spor
tSt
orag
e
• Oil refining• Chemicals production• Iron and steel production• High-temperature heat• Food industry• Light-duty vehicles• Heavy-duty vehicles• Maritime• Rail• Aviation• Co-firing NH3 in coal power
plants• Flexible power generation• Back-up and off-grid power
supply• Long-term, large-scale storage• Blended H2• Methanation• Pure H2
Indu
stria
l ap
plic
atio
nsM
obilit
yPo
wer
ge
nera
tion
Gas
En
ergy
Midstream and downstream Consumption
Brown H2 Blue H2 Green H2
Sources: Kearney Energy Transition Institute analysis

22
Hydrogen will potentially play a major role in the Energy Transition as a link between multiple energy sources and industrial applications
Simplified value chain of hydrogen-based energy conversion solutions1
Hydrogen’s role inenergy transition1
Gas network Hydrogen network Power network Liquid fuel network
Natural Gas Grid
Refineries
Chemical plants
Refueling stations
Power grid
Fuel cell electric vehicle
Ammonia
Internal combustion engine vehicle
Natural gas vehicle
Petroleum products
Electrolysis Hydrogen storage
OxygenWater
Methanation
Power-to-power
Power-to-chemical
Power-to-mobility
Power-to-gas
Blending
H2CH4
Wind turbine
Solar PV
Combustion turbines
Fuel cells
Processing2
Upgraded and synthetic fuels
Blended gas
H2
Coal and oil
Blue hydrogen
Green hydrogen
CO2
CCS
Simplified value chain. End uses are non-exhaustive; 2. Several possible options (e.g. Steam methane reforming; autothermal reforming; chemical looping, etc.)Sources: Kearney Energy Transition Institute
23
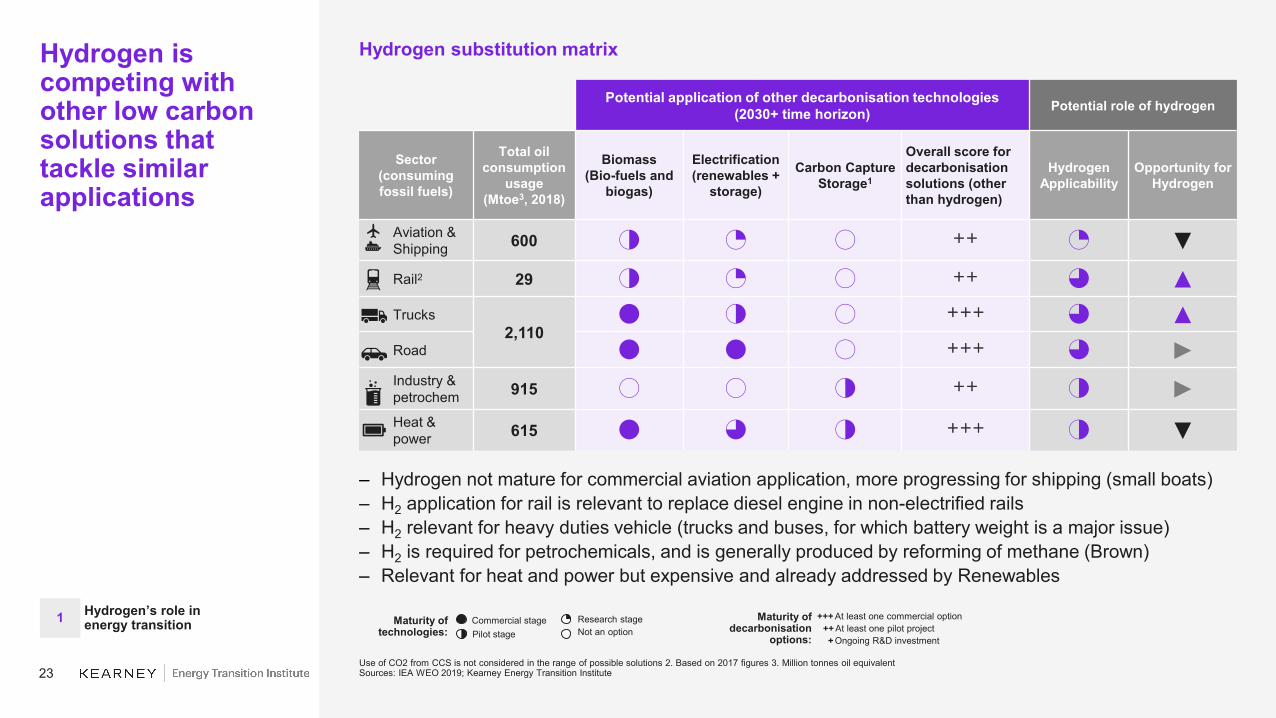
Hydrogen is competing with other low carbon solutions that tackle similar applications
Hydrogen substitution matrix
Use of CO2 from CCS is not considered in the range of possible solutions 2. Based on 2017 figures 3. Million tonnes oil equivalentSources: IEA WEO 2019; Kearney Energy Transition Institute
Commercial stagePilot stage
Research stageNot an option
Potential application of other decarbonisation technologies(2030+ time horizon) Potential role of hydrogen
Sector(consuming fossil fuels)
Total oil consumption
usage(Mtoe3, 2018)
Biomass(Bio-fuels and
biogas)
Electrification (renewables +
storage)
Carbon Capture Storage1
Overall score for decarbonisation solutions (other than hydrogen)
Hydrogen Applicability
Opportunity for Hydrogen
Aviation & Shipping 600 2 1 0 ++ 1 ▼Rail2 29 2 1 0 ++ 3 ▲Trucks
2,1104 2 0 +++ 3 ▲
Road 4 4 0 +++ 3 ►Industry & petrochem 915 0 0 2 ++ 2 ►Heat & power 615 4 3 2 +++ 2 ▼
Maturity of technologies:
At least one commercial option At least one pilot projectOngoing R&D investment
++++++
Maturity ofdecarbonisation
options:
– Hydrogen not mature for commercial aviation application, more progressing for shipping (small boats)– H2 application for rail is relevant to replace diesel engine in non-electrified rails– H2 relevant for heavy duties vehicle (trucks and buses, for which battery weight is a major issue)– H2 is required for petrochemicals, and is generally produced by reforming of methane (Brown)– Relevant for heat and power but expensive and already addressed by Renewables
Hydrogen’s role inenergy transition1

24
Physical propertiesAdvantages
– High energy density– No CO2 emissions
during combustion– Abundant on earth
(water and hydrocarbons)
– Multiple applications in industrial and energy sectors
Description
– Name: Hydrogen (“water former” in ancient Greek)– State in ambient conditions: gaseous, diatomic (H2)– Properties:
– Smallest, lightest, oldest, and most abundant element in the universe
– Mainly found in combination with carbon (hydrocarbons), oxygen (water), or nitrogen (ammonia)
– Colourless, odourless, tasteless, non-toxic, andnon-metallic
– Highly diffusive and oxidizing– Reactants: Reacts spontaneously with oxygen, chlorine,
and fluorine– Combustion:
2H2 + 2O2 → 2 H2O + 572 kJ ΔH = −286 kJ/mol
Hydrogen is the lightest molecule with the highest gravimetric energy density
Hydrogen fact card Disadvantages
– Rare in naturalH2 form
– High CO2emissions for industrial production
– Large ignition range– Corrosive
1 Gas: 0°C, 1 bar; liquid: -253°C, 1 barSources: “Hydrogen Storage,” US Department of Energy; Kearney Energy Transition Institute
Comparison of specific energy (energy per mass or gravimetric density) and energy density (energy per volume or volumetric density) for several fuels based on lower heating values
Density (kg/m3) 0.089 (gas)71 (liquid)1
Boiling point (°C) -253 °CLower heating value (MJ/kg) 120Specific energy, liquefied (MJ/kg) 8.5
Ignition range (% of gasin air volume) 4–77%
Hydrogen’s role inenergy transition1

25
Hydrogen value chain: upstream and midstream

26
Some orders of magnitude in 2019 5
Executive summary 6
1. Hydrogen’s role in the energy transition 16
2. Hydrogen value chain: upstream and midstream 252.1 Production technologies 272.2 Conversion, storage, and transportation technologies 492.3 Maturity and costs 61
3. Key hydrogen applications 783.1 Overview 803.2 Feedstock 843.3 Energy 90
3. Business models 1144.1 Policies and competition landscape 1164.2 Business cases 125
Appendix (Bibliography & Acronyms) 187

27
13(9.2%)
Chlorine3Steel
3(2.0%)
14(9.7%)
Refinery2
0(0.2%)
From RES
18(12.1%)
Others Total
48(33.1%)
Key considerations
– H2 production has reached 118 Mt per year, 59% of which comes from dedicated sources.– Use of fossil
fuels for H2production represented about 6% of global demand for natural gas and about 2% of global demand for coal.
– Global CO2emissions from H2 represented 830 Mt CO2equivalent.
– Overall, 0.6% of H2 is from renewable or fossil fuels plants equipped with CCS.
– About 3 Mt of H2are lost or not recovered (for example, during purification).
About 118 Mt of H2 are produced each year and release about 830 Mt of CO2, mainly from fossil fuels
1 1 Mtoe = 0.35 Mt H22 35% of refinery H2 needs come as a by-product.3 World chlorine production: about 100 MT per year – ratio of 1/35 tH2/tCl2Sources: “The Future of Hydrogen,” International Energy Agency, June 2019; Kearney Energy Transition Institute
48(41%)
70(59%)
118
Total1
Industrialby-product
Dedicatedproduction
Consumed onsite
9 MT consumed
onsite
Clean productionpathway
Global hydrogen production(2018, Mt H2, % of total production)
17(14.2%)
With CCS3
16(13.6%)
0(0.2%)
Coal
0(0.3%)
Oil2
0(0.0%)
Electrolysis
0(0.1%)
Electrolysis from RES
Total
Hydrogen value chain -Production technologies2.1

28
H2 conversion technologiescan be split into thermochemical, electrolysis, microbial, and photolytic
H2 production technologies overview
1 Only for fossil fuels: renewable biomass-based thermochemical production can be considered as green H2.Sources: Shell; International Energy Agency; Kearney Energy Transition Institute
Primary source
Water
Biomass, biofuels, and organic matter
Oil and gas
Brine
CoalThermochemical
Steam methane reforming (SMR)
Gasification
Autothermal reforming (ATR)
Pressurized combustion reforming
Chemical looping
Concentration solar fuels (CSF)
Gas heated reforming (GHR) and heat exchange reforming (HER)
Pyrolysis
Other technologies (such as microwave process)
Waterand brine electrolysis
Alkaline electrolysis (AE)
Proton-exchange membrane (PEM)
Solid oxide electrolyzer cell (SOEC)
Other technologies
Microbial
Dark fermentation
Microbial electrolysis
Other technologies
Photolytic Photoelectrochemical and other technologies
Other technologies
Brown1
H2
Blue1
H2
GreenH2
CCS Optional CCS to reduce carbon footprint Technologies subject to in-depth analysisVRE Use of VRE to produce electricity
VRE
CCS
Conversion technologyH2
category
No
Yes
No
Yes
Hydrogen value chain -Production technologies2.1
29
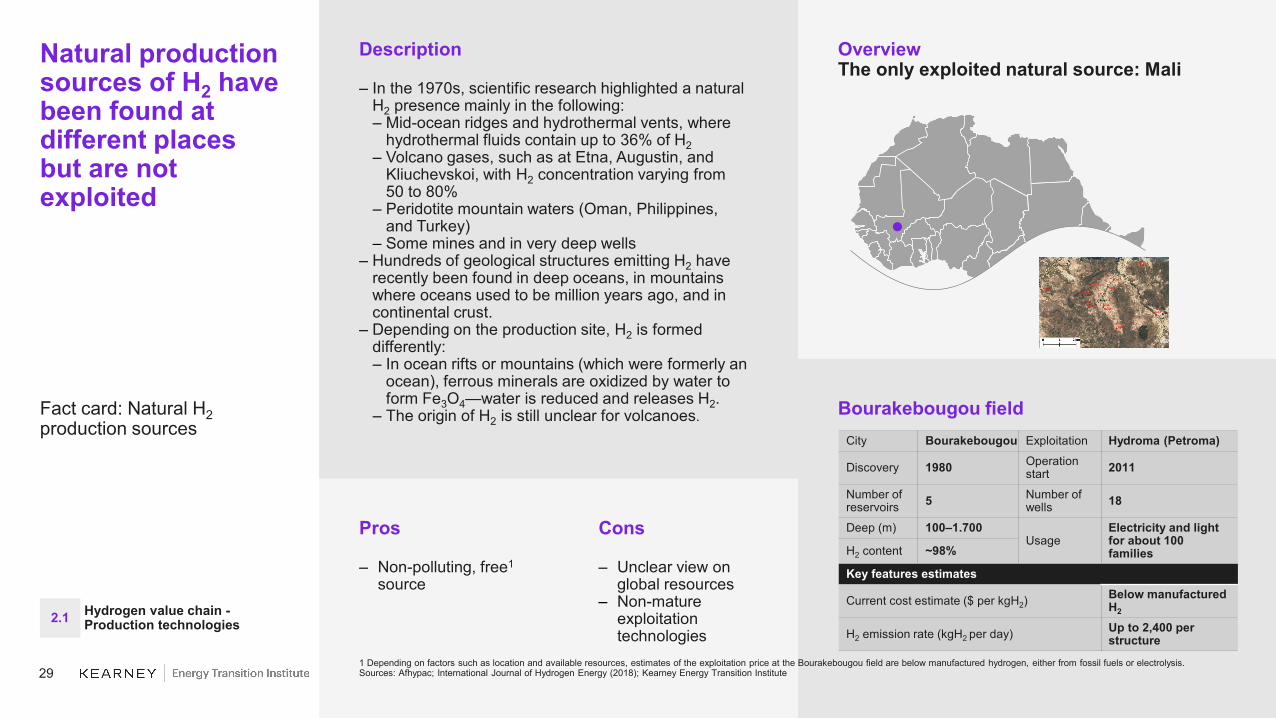
Bourakebougou field
Pros
– Non-polluting, free1
source
OverviewThe only exploited natural source: Mali
Description
– In the 1970s, scientific research highlighted a natural H2 presence mainly in the following: – Mid-ocean ridges and hydrothermal vents, where
hydrothermal fluids contain up to 36% of H2– Volcano gases, such as at Etna, Augustin, and
Kliuchevskoi, with H2 concentration varying from50 to 80%
– Peridotite mountain waters (Oman, Philippines,and Turkey)
– Some mines and in very deep wells– Hundreds of geological structures emitting H2 have
recently been found in deep oceans, in mountains where oceans used to be million years ago, and in continental crust.
– Depending on the production site, H2 is formed differently:– In ocean rifts or mountains (which were formerly an
ocean), ferrous minerals are oxidized by water to form Fe3O4—water is reduced and releases H2.
– The origin of H2 is still unclear for volcanoes.
Natural production sources of H2 have been found at different places but are not exploited
Fact card: Natural H2production sources
Cons
– Unclear view on global resources
– Non-mature exploitation technologies
1 Depending on factors such as location and available resources, estimates of the exploitation price at the Bourakebougou field are below manufactured hydrogen, either from fossil fuels or electrolysis.Sources: Afhypac; International Journal of Hydrogen Energy (2018); Kearney Energy Transition Institute
City Bourakebougou Exploitation Hydroma (Petroma)
Discovery 1980 Operation start 2011
Number of reservoirs 5 Number of
wells 18
Deep (m) 100–1.700Usage
Electricity and light for about 100 familiesH2 content ~98%
Key features estimates
Current cost estimate ($ per kgH2)Below manufactured H2
H2 emission rate (kgH2 per day) Up to 2,400 per structure
Hydrogen value chain -Production technologies2.1

30
Electrolysis was the first H2production technology deployed but was overtaken by fossil fuel-based technologies in the early 1970s
History of H2 production technologies
Sources: Johnson Matthey; Norsk H Hydroydro; SRI (2007); FuelCellToday (2013); Afhypac; Royal Society of Chemistry; Kearney Energy Transition Institute
19001800
Discovery of electrolysis by W. Nicholson and A. Carlisle
First bipolar electrolyzer by Oerlikon
1951
First commercial 30-bar electrolyzer(Lurgi)
1966
First PEM electrolyzer, built by G.E.
1972
First solid oxide electrolyzercell
2006
Electrolysis production capacity reaches 8 GW
2017
Market size for electrolyzers: +100 MW/y
First SMR commissioned in the United States by Standard Oil
1930
Take-off of SMR technologies due to natural gas discovery
70s
BASF patent for a nickel catalyst for reforming
1913
First naphtha reforming plant in the United Kingdom
1962
First gasification patent by Robert Gardner
First commercial gasification plant in the United States
1861
First gasifier unit by Siemens
1997 2018
Water photo-electrolysis efficiency reaching 18%
Largest SMR plant commissioned (315 tpd)
Syngas production capacity from coal gasifier reaches 250 GWth
2008
First microbial electrolysis cell approach
2005 2020
Largest PEM electrolyzerto be built at Shell refinery(1.3 kT per year)
1939
First 10,000 Nm3/h AE electrolyzer
ElectrolysisFossil fuel based
Hydrogen value chain -Production technologies2.1

31
Among production technologies, thermochemical sources benefit from lowercost and high efficiency but are GHG emitters
Comparison of H2 production technologies
1 Excluding the energy required for heat to vaporize water2 Expected maximum size of PEM electrolyzers3 Carbon products are mainly solid carbon residues.Sources: IEA, “The Future of Hydrogen,” June 2019; Commonwealth Scientific and Industrial Research Organisation; Institute of Energy Economics Japan; D.B. Pal et al (2018); S. Reza et al (2014); IEA Greenhouse Gas R&D Programme; Foster Wheeler; Nel; Kearney Energy Transition Institute
LCOH2019,$ per kg
Efficiency Advantages and riskskWh per kg % LHV Feedstock Emissions Scalability Footprint Other
Ther
moc
hem
ical
sou
rces Steam methane
reforming (SMR) 0.9–1.8 52 64% Fossil fuelBiomass
11 kgCO2/ kgH2
200 to 500 tpd n.a. n.a.
Gasification 1.6–2.2 41–47 70–80% Fossil fuelBiomass
20 kgCO2/ kgH2
500 to 800 tpd n.a. n.a.
Autothermal reforming n.a. 40–42 78–82% Fossil fuelBiomass
9 kgCO2/ kgH2
500 to 1000 tpd n.a. n.a.
Pyrolysis 2.2–3.4 47–66 50–70% Fossil fuelBiomass
n.a.(lower3) 50 tpd n.a. n.a.
Elec
trol
ysis
Alkaline electrolysis (AE) 2.6–6.9 48–64 52–69% WaterElectricity
Depends on
electricity sourceWorld
avg. 19-21 kgCO2/ kgH2
<70 tpd 200m2/tpd Waste water mgt.
Proton-exchange membrane (PEM) electrolysis
3.5–7.5 43–60 60–77%up to 86%
WaterElectricity <300 tpd2 50m2/tpd Rare
materials
Solid oxide electrolyzercell (SOEC) electrolysis 5.0–8.5 40–441 74–81%1 Steam
Electricity n.a. n.a. High T°heat
Mic
robi
al Microbial electrolysis n.a. n.a. n.a. WaterElectricity n.a. n.a.
Research stage
Biomass dark fermentation n.a. 47 70% Water
Biomass - n.a. n.a.
P.S. Photoelectrical synthesis n.a. n.a. n.a. Water
Sunlight - n.a. n.a.Hydrogen value chain -Production technologies2.1

32
Key feature estimates
Pros
– Established technology
– Integration potential with refineries
Description– Step 1: Desulfurization treatment
– Natural gas is naturally mixed with sulfur, which is removed thanks to H2.
– Step 2: Reforming– CH4 and high-temperature steam under 3–35 bar
pressure are mixed with nickel catalyst to produce H2, CO, and a small amount of carbon CO2. Heat for the highly endothermic reaction is provided by burning fuel gas.
(1) CH4 + H2O ⇌ CO + 3 H2 ΔH = +206 MJ/kmolCH4– Step 3: Water–gas shift reaction
– The carbon monoxide and steam are then reacted to produce carbon dioxide and more hydrogen in what is known as water–gas shift reaction. Iron-chromium and copper-zinc are used as catalysts.
(2) CO + H2O ⇌ CO2 + H2 ΔH = −41 MJ/kmolCH4
– Step 4: Pressure swing adsorption– In the final step, H2 is separated from the tail gas
through a selective adsorption.
(1)+(2) C𝐇𝐇𝟒𝟒 + 𝟐𝟐𝐇𝐇𝟐𝟐O ⇌ CO2 + 4H2 ΔH = 165 MJ/kmolCH4
H2 is separated from CH4 at a high temperature in a steam methane reformer while producing COand CO2
Fact card: Steammethane reforming
Cons
– High temperaturerequired
– Requires purificationby PSA
– CO2 emissions– Dependence on natural gas
Sources: Commonwealth Scientific and Industrial Research Organisation; Institute of Energy Economics Japan; D. B. Pal et al (2018); S. Reza et al (2014); International Energy Agency Greenhouse Gas R&D Programme; Foster Wheeler; Kearney Energy Transition Institute
Current cost estimate ($ per kgH2) 0.9–1.9Typical plant size (kgH2 per day) 200,000Feedstock use (kgCH4 per kgH2) 3.43Water use (L per kgH2) 4.5Operating CO2 emissions(kgCO2 per kgH2)
9–12
Efficiency (%, LHV) 64Temperature (°C) 750–1,100Purity of H2 99.9%Primary energy source Natural gas
Hydrogen value chain -Production technologies2.1
Desulfu-rization
Reformer(~900 °C)
HT shift reactor
PSA system
Pre-reformer
Natural gas H2
Hydrogen plant
Recycled H2
Tail gas
FuelCombustion air
Flue gas
Steam turbine
Export steamCondensates
Power
1 2 3 4
50% of the H2 produced comes
from water
33
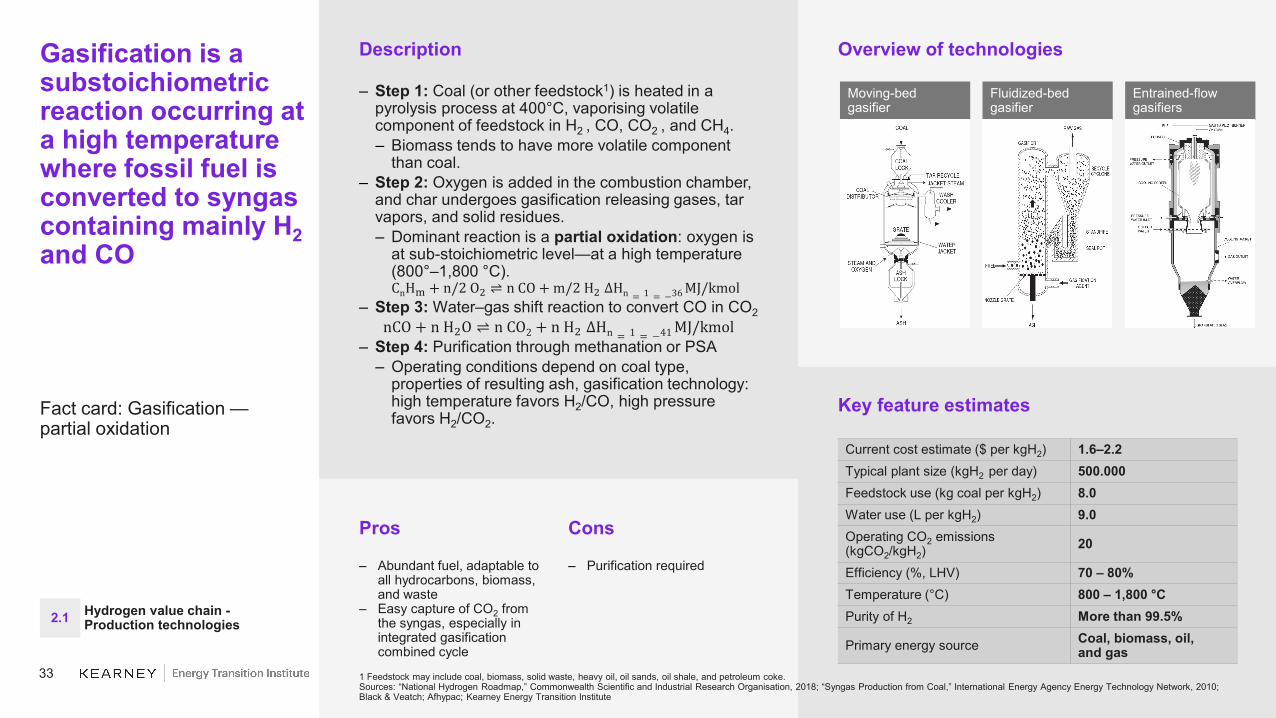
Key feature estimates
Pros
– Abundant fuel, adaptable to all hydrocarbons, biomass, and waste
– Easy capture of CO2 from the syngas, especially in integrated gasification combined cycle
Description
– Step 1: Coal (or other feedstock1) is heated in a pyrolysis process at 400°C, vaporising volatile component of feedstock in H2 , CO, CO2 , and CH4.– Biomass tends to have more volatile component
than coal.– Step 2: Oxygen is added in the combustion chamber,
and char undergoes gasification releasing gases, tar vapors, and solid residues.– Dominant reaction is a partial oxidation: oxygen is
at sub-stoichiometric level—at a high temperature (800°–1,800 °C).CnHm + n/2 O2 ⇌ n CO + m/2 H2 ΔHn = 1 = −36 MJ/kmol
– Step 3: Water–gas shift reaction to convert CO in CO2nCO + n H2O ⇌ n CO2 + n H2 ΔHn = 1 = −41 MJ/kmol
– Step 4: Purification through methanation or PSA– Operating conditions depend on coal type,
properties of resulting ash, gasification technology: high temperature favors H2/CO, high pressure favors H2/CO2.
Gasification is a substoichiometricreaction occurring at a high temperature where fossil fuel is converted to syngas containing mainly H2and CO
Fact card: Gasification —partial oxidation
Cons
– Purification required
1 Feedstock may include coal, biomass, solid waste, heavy oil, oil sands, oil shale, and petroleum coke.Sources: “National Hydrogen Roadmap,” Commonwealth Scientific and Industrial Research Organisation, 2018; “Syngas Production from Coal,” International Energy Agency Energy Technology Network, 2010; Black & Veatch; Afhypac; Kearney Energy Transition Institute
Overview of technologies
Moving-bed gasifier
Fluidized-bed gasifier
Entrained-flow gasifiers
Current cost estimate ($ per kgH2) 1.6–2.2Typical plant size (kgH2 per day) 500.000Feedstock use (kg coal per kgH2) 8.0Water use (L per kgH2) 9.0Operating CO2 emissions (kgCO2/kgH2)
20
Efficiency (%, LHV) 70 – 80%Temperature (°C) 800 – 1,800 °CPurity of H2 More than 99.5%
Primary energy source Coal, biomass, oil,and gas
Hydrogen value chain -Production technologies2.1

34
Key feature estimates
Pros
– Compact design and low investment
– Variable H2/CO ratio, fitting gas-to-liquid requiring a 2:1 ratio
Description
– ATR is mainly used with natural gas and combines endothermic reaction of steam reforming and exothermic reaction of oxidation.
– Feedstock, steam, or sometimes carbon dioxide and dioxygen are directly mixed before pre-heating.
– ATR is described with two reaction zones:– Combustion zone, where partial oxidation occurs
producing a mixture of carbon monoxide and hydrogen (syngas)
– Catalytic zone where the gas leaving combustion zones reach thermodynamic equilibrium
– Reaction can be described in the following equations:– Using steam: 4 CH4 + O2 + 2 H2O → 4 CO + 10 H2– Using CO2: 2 CH4 + O2 + CO2 → 3 CO + 3 H2 + H2O +
Heat– Water–gas shift reaction happens after ATR reaction
CO + H2O ⇌ CO2 + H2– CO2 at exit is less than in SMR because of a higher
operating temperature that restricts exothermic water gas shift reaction.
Autothermal reforming is a combination of a exothermic POX reaction and a endothermic steam reforming
Fact card: Autothermal reforming (ATR)
Cons
– Non-uniform axial temperature distribution with “hot-spots”
– Fuel evaporation– Coke formation
Sources: “National Hydrogen Roadmap,” Commonwealth Scientific and Industrial Research Organisation, 2018; Air Liquide; Haldor Topsoe, International Energy Agency Greenhouse Gas R&D Programme; “Blue hydrogen as accelerator and pioneer for energy transition in the industry,” H-vision, July 2019; Afhypac; Kearney Energy Transition Institute analysis
Overview of technologies
Current cost estimate ($ per kgH2) w. CCS n.a.
Typical plant size (kgH2 per day) Up to 1,500,000Feedstock use (kgCH4/kgH2) 2.8Water use (L/kgH2) n.a.Operating CO2 emissions (kgCO2/kgH2)
9
Efficiency (%, LHV) 78–82Temperature (°C) 980–1200Purity of H2 95.5%Primary energy source Hydrocarbons
Hydrogen value chain -Production technologies2.1

35
Key takeaways
– Syngas has been used for many years for lighting, cooking, and to some extent heating before electric lightning and natural gas infrastructure were deployed.
– During World War II, syngas was used to power cars in Europe as a replacement for gasoline.
– Syngas composition depends on feedstock and the production methods used. Its energy density is half natural gas one.
– Syngas is often used as an intermediate for hydrogen, ammonia, methanol, and liquid fuels production.
Syngas is a mixture of H2, CO, and other gases that comes outof SMR, ATR,and gasification reactors
Syngas usual composition per production method(% of volume)
Note: Others include N2, Ar, H2S, and COSSources: IFP–Afhypac; Kearney Energy Transition Institute
70% 65%
44% 40%
67%
16% 22%
49%
39%
20%
6% 8%5%
21%13%8% 5% 2%
Gasification(heavy oils)
SMR(natural gas)
100%1%0%
Reformer(naphtha)
0%
ATR(low steam)
ATR(high steam)
100% 100% 100% 100%
COH2 CO2 CH4 Others
Hydrogen value chain -Production technologies2.1
36
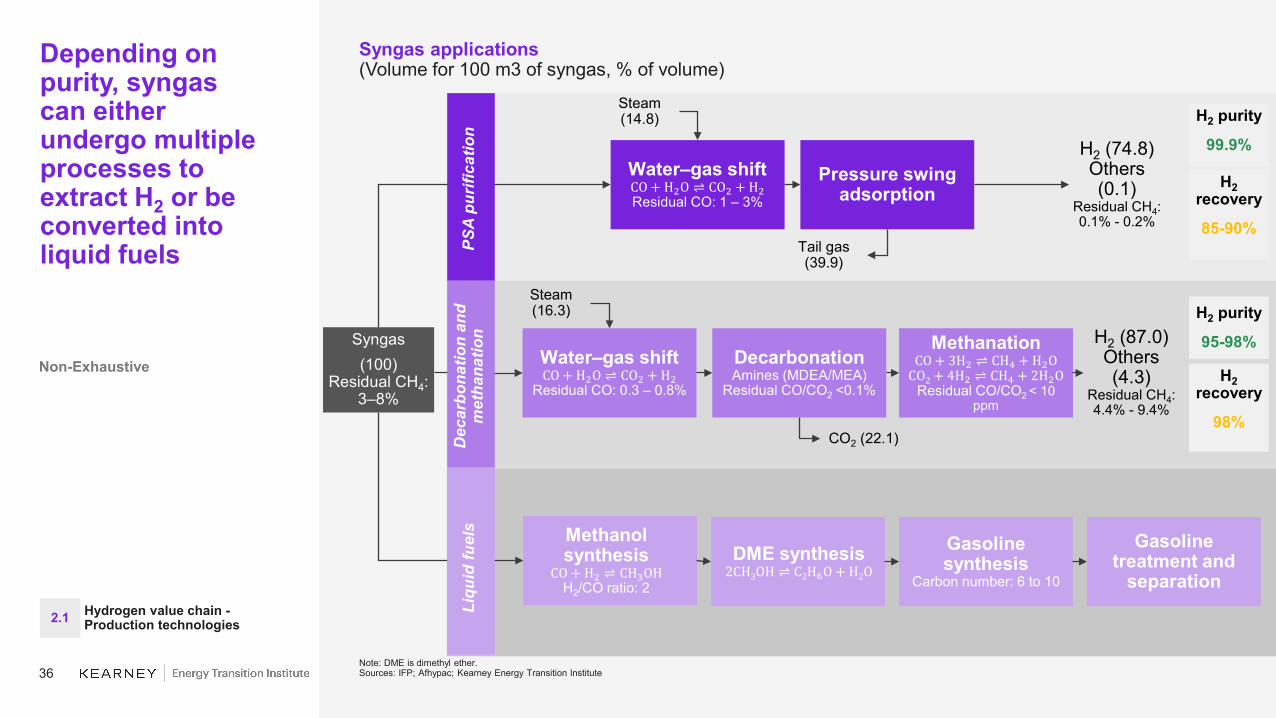
Depending on purity, syngascan eitherundergo multiple processes to extract H2 or be converted into liquid fuels
Syngas applications(Volume for 100 m3 of syngas, % of volume)
Non-Exhaustive
Note: DME is dimethyl ether.Sources: IFP; Afhypac; Kearney Energy Transition Institute
Hydrogen value chain -Production technologies2.1
Syngas(100)
Residual CH4:3–8%
Water–gas shiftCO + H2O ⇌ CO2 + H2Residual CO: 1 – 3%
H2 purity
99.9%
Pressure swing adsorption
Steam (14.8)
Tail gas (39.9)
H2 (74.8)Others (0.1)
Residual CH4: 0.1% - 0.2%
Water–gas shiftCO + H2O ⇌ CO2 + H2
Residual CO: 0.3 – 0.8%
DecarbonationAmines (MDEA/MEA)
Residual CO/CO2 <0.1%
MethanationCO + 3H2 ⇌ CH4 + H2O
CO2 + 4H2 ⇌ CH4 + 2H2OResidual CO/CO2 < 10
ppm
H2 (87.0)Others (4.3)
Residual CH4: 4.4% - 9.4%
H2recovery
85-90%
H2 purity
95-98%
H2recovery
98%
Methanol synthesis
CO + H2 ⇌ CH3OHH2/CO ratio: 2
DME synthesis2CH3OH ⇌ C2H6O + H2O
Gasoline synthesis
Carbon number: 6 to 10
Gasoline treatment and
separation
Steam (16.3)
CO2 (22.1)
PSA
purif
icat
ion
Dec
arbo
natio
n an
d m
etha
natio
nLi
quid
fuel
s
37
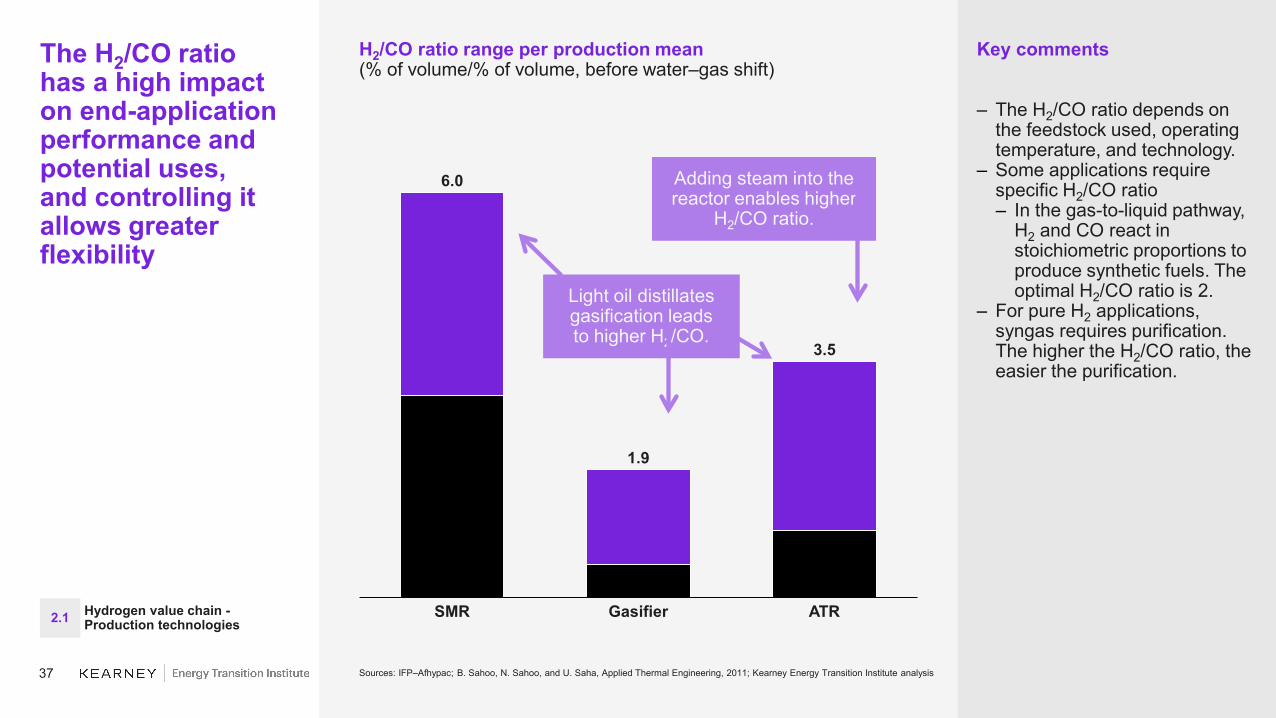
GasifierSMR ATR
6.0
1.9
3.5
Key comments
– The H2/CO ratio depends on the feedstock used, operating temperature, and technology.
– Some applications require specific H2/CO ratio– In the gas-to-liquid pathway,
H2 and CO react in stoichiometric proportions to produce synthetic fuels. The optimal H2/CO ratio is 2.
– For pure H2 applications, syngas requires purification. The higher the H2/CO ratio, the easier the purification.
The H2/CO ratio has a high impact on end-application performance and potential uses, and controlling it allows greater flexibility
H2/CO ratio range per production mean(% of volume/% of volume, before water–gas shift)
Sources: IFP–Afhypac; B. Sahoo, N. Sahoo, and U. Saha, Applied Thermal Engineering, 2011; Kearney Energy Transition Institute analysis
Light oil distillates gasification leadsto higher H2/CO.
Adding steam into the reactor enables higher
H2/CO ratio.
Hydrogen value chain -Production technologies2.1

38
Carbon capture and storage (CCS) refers to a set of CO2 technologies that are put together to abate emissions from stationary CO2sources
Source: Kearney Energy Transition Institute, CCS FactBook
Hydrogen value chain -Production technologies2.1
Carbon Capture and Storage – CCS - value chain

39
CombiningCCS with thermochemical production sources could reduce CO2emissions
Overview of SMR and CCS options
Non-Exhaustive
Option Description Maturity Capture rate
a Capture of CO2 from shifted syngas with MDEA MDEA + CO2 + H2O ⇔ MDEAH+ + HCO3
-State-of-the art technology, with twice the carrying capacity of MEA
54%
bCapture of CO2 from shifted syngas with MDEA with H2-rich burners
MDEA + CO2 + H2O ⇔ MDEAH+ + HCO3-
State-of-the art technology, with twice the carrying capacity of MEA
64%
a Capture of CO2 from PSA tailgas with MDEA MDEA + CO2 + H2O ⇔ MDEAH+ + HCO3
-State-of-the art technology, with twice the carrying capacity of MEA
52%
bCapture of CO2 from PSA tailgas using low temperature and membrane separation
CO2 liquefied and purified to food-grade quality
Pilot scale, under deployment 53%
Capture of CO2 from SMR fuel gas using MEA MEA + CO2 ⇔ H2O + C3H5NO2 - N2 + H2O Standard technology 89%
1 USD = 0,89 €Sources: International Energy Agency Greenhouse Gas R&D Programme, Global CCS Institute, Air Liquide; Kearney Energy Transition Institute analysis
H
Hydrogen value chain -Production technologies2.1
Natural gas (CH4) Desulfurization Reformer
(~900 °C) Shift conversion PSA system
Fuel
Heat recovery
CO2 capture
CO2 capture
CO2 captureTail gas
Syngas
HeatBurner
1
2
3
H2
1
1
2
2
3

40
Key feature estimates
Pros
– Simple technology– Low capex– Graphitic carbon as
by-product– Low to no CO2
emissions
Description
– Hydrocarbons waste undergoes heating without air combustion to break chemical bonds.1
𝐶𝐶𝐻𝐻4 + 𝐻𝐻𝐻𝐻𝐻𝐻𝐻𝐻 → 𝐶𝐶 + 2 𝐻𝐻2– There are four types of pyrolysis:
– Slow pyrolysis: low temperature increase (0.1 to 2°C per second) to reach about 500°C. Residence time of gas over 5 sec per biomass minutes to days. Tar and char are released.
– Flash pyrolysis: rapid heating rate, from 400°C to 600°C. Vapor residence time less than 2 seconds, less gas and tar produced
– Fast pyrolysis: mainly for bio-oil and gas. Rapid heating from 650 to 1,000°C. Large quantities of char must be removed.
– Microwave pyrolysis: lower time and temperatures required
– However, hydrogen production yield of 25% makes it difficult to establish a business case for H2 production.
– Research is focusing on using microwaves to heat crude oil and produce H2.
Pyrolysisrequires a lower temperature than other technologies and happens in a vacuum chamber
Fact card: Pyrolysis
Cons
– Low H2 content– Low scalability
1 Methane pyrolysis is also called methane cracking.Sources: “National Hydrogen Roadmap,” Commonwealth Scientific and Industrial Research Organisation, 2018; Afhypac; Kearney Energy Transition Institute analysis
Current cost estimate ($ per kgH2) 2.2–3.4Typical plant size (kgH2 per day) 10,000–50,000Water use (L/kgH2) –Operating CO2 emissions (kgCO2/kgH2)
–
Efficiency (%, LHV) 50–70%Temperature (°C) 200–760 °CPrimary energy source HydrocarbonsCurrent cost estimate ($ per kgH2) 2.2–3.4Typical plant size (kgH2 per day) 10,000–50,000
Bubbling fluidize bed pyrolizer
Circulating fluid bed pyrolizer
Residence time of vapors controlled by fluidizing gasflow rate
Fast residence time due to high gas velocities
Overview of technologies
Hydrogen value chain -Production technologies2.1

41
O2
Pros
– High purity hydrogen– Oxygen as a by-
product, often not used
– No dependency on fossil fuels
Description
– A direct current passes through an ionic substance, producing chemical reactions at the electrodes (cathode and anode) and decomposing materials.– Electrodes are immerged in electrolyte and
separated by a membrane where ions can move.– Hydrogen ions move toward the cathode to form H2.– Receivers collect hydrogen and oxygen in gaseous
forms.– Reactions that happen at anode and cathode in a
water electrolysis are:– Anode: H2O → 2H+ + 1
2O2 + 2 e − (E0 = 1.23V vs.
SHE1)– Cathode: 2H+ + 2 e −→ H2(E0 = 0.00V vs SHE1)
– Overall reaction of water electrolysis isH2O → H2 + 1
2O2 (E0 = -1.23V vs SHE1)
– For water electrolysis, approximately 9–15 L of water and 50–60 kWh of electricity are required to produce1 kg of H2 and 8 kg of O2 (depends on technology).
Electrolysis produces H2by applying a direct current to an electrolyte solution, which allows high purity of hydrogen
Fact card: Electrolysis
Cons
– More expensive thanmost of thermochemical solutions
– High emitter of CO2 if electricity is not clean
1 Standard hydrogen electrodeSources: “National Hydrogen Roadmap,” Commonwealth Scientific and Industrial Research Organisation, 2018; Kearney Energy Transition Institute analysis
Electrolyzer and cell overview(PEM example)
Electricity
Water
Power converter AC/DC
Deionizer
Water storage tank
Electrolyzer stacks
Dehydration
unit
O2
H2
Heat
H2
H2 production rate= proportional to I= Input power * ηcell
Hydrogen value chain -Production technologies2.1
Elec
troly
te
Anod
e
Cat
hode
+ -Direct current (I)
H2O
Electron flow (e-)
X-
Cell
42
Key feature estimates
Pros
– Cheapest option for electrolyzers, with large-scale proven (up to 150 MW)
– Higher durability– Efficient but only at
high temperature
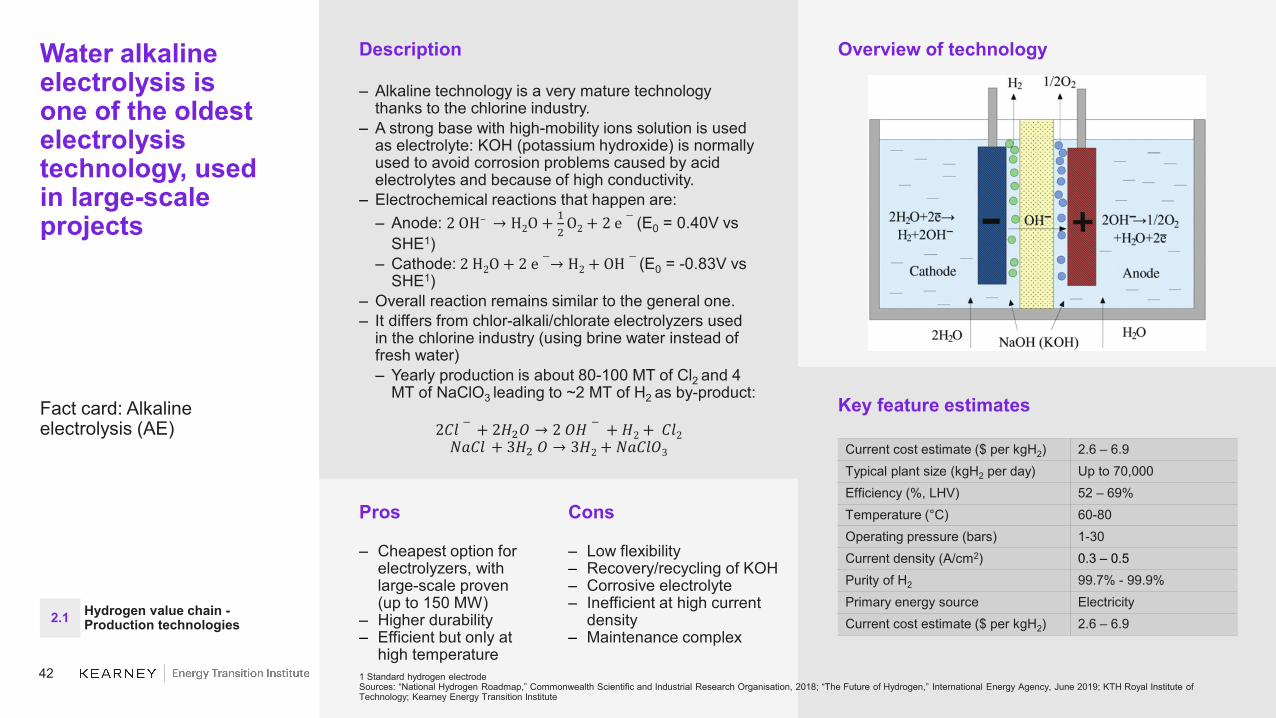
Description
– Alkaline technology is a very mature technology thanks to the chlorine industry.
– A strong base with high-mobility ions solution is used as electrolyte: KOH (potassium hydroxide) is normally used to avoid corrosion problems caused by acid electrolytes and because of high conductivity.
– Electrochemical reactions that happen are:– Anode: 2 OH− → H2O + 1
2O2 + 2 e − (E0 = 0.40V vs
SHE1)– Cathode: 2 H2O + 2 e −→ H2 + OH − (E0 = -0.83V vs
SHE1)– Overall reaction remains similar to the general one.– It differs from chlor-alkali/chlorate electrolyzers used
in the chlorine industry (using brine water instead of fresh water)– Yearly production is about 80-100 MT of Cl2 and 4
MT of NaClO3 leading to ~2 MT of H2 as by-product:
2𝐶𝐶𝐶𝐶 − + 2𝐻𝐻2𝑂𝑂 → 2 𝑂𝑂𝐻𝐻 − + 𝐻𝐻2 + 𝐶𝐶𝐶𝐶2𝑁𝑁𝐻𝐻𝐶𝐶𝐶𝐶 + 3𝐻𝐻2 𝑂𝑂 → 3𝐻𝐻2 + 𝑁𝑁𝐻𝐻𝐶𝐶𝐶𝐶𝑂𝑂3
Water alkaline electrolysis isone of the oldest electrolysis technology, used in large-scale projects
Fact card: Alkaline electrolysis (AE)
Cons
– Low flexibility– Recovery/recycling of KOH– Corrosive electrolyte– Inefficient at high current
density– Maintenance complex
1 Standard hydrogen electrodeSources: “National Hydrogen Roadmap,” Commonwealth Scientific and Industrial Research Organisation, 2018; “The Future of Hydrogen,” International Energy Agency, June 2019; KTH Royal Institute of Technology; Kearney Energy Transition Institute
Overview of technology
Current cost estimate ($ per kgH2) 2.6 – 6.9Typical plant size (kgH2 per day) Up to 70,000Efficiency (%, LHV) 52 – 69%Temperature (°C) 60-80Operating pressure (bars) 1-30Current density (A/cm2) 0.3 – 0.5Purity of H2 99.7% - 99.9%Primary energy source ElectricityCurrent cost estimate ($ per kgH2) 2.6 – 6.9
Hydrogen value chain -Production technologies2.1

43
Key feature estimates
Description
– The PEM electrolyzer uses a ionically conductive solid polymer.
– H+ ions travel through polymer membrane toward the cathode when a potential is applied to form H then H2.
– Reactions that happen at anode and cathode are:– Anode: H2O → 2H+ + 1
2O2 + 2 e − (E0 = 1.23V vs.
SHE1)– Cathode: 2H_++2 e−→H2 (E0 = 0.00V vs SHE1)
– Overall reaction of water electrolysis is:H2O → H2 + 1
2O2 (E0 = -1.23V vs SHE1)
– The PEM electrolyzer has a short response time: below 2 seconds and a cold start time below 5 minutes.
– Most commercial PEM water electrolyzers use self-pressurized PEM cells
PEM is rapidly developing thanks to its compacity, its improved current density and flexibility but requires precious materials
Fact card: Proton exchange membrane (PEM)
Overview of technology
Current cost estimate ($ per kgH2) 3.5–7.5 Typical plant size (kgH2 per day) 50–500, up to 50,000Efficiency (%, LHV) 60–77%Temperature (°C) 50–80Operating pressure (bars) 20–50Current density (A/cm2) 1–3Purity of H2 99.9–99.9999%Primary energy source ElectricityCurrent cost estimate ($ per kgH2) 3.5–7.5
Pros
– Low plant footprint, compacity
– Self-pressurized H2well-suited for storage facilities
– Short response time (less than 2 seconds)
Cons
– High capex and OPEX– Presence of platinum for
electrodes
1 Standard hydrogen electrodeSources: “National Hydrogen Roadmap,” Commonwealth Scientific and Industrial Research Organisation, 2018; “The Future of Hydrogen,” International Energy Agency, June 2019; Hydrogenics; Kearney Energy Transition Institute analysis
Hydrogen value chain -Production technologies2.1

44
Key feature estimates
Description
– SOEC technology is still at an early stage of development but could benefit from high efficiency.
– SOEC is based on steam water electrolysis at high temperature, reducing needs for electrical power.
– Molar Gibbs energy of the reaction drops from about 1.23 eV (237 kJ/mol) at ambient temperatures to about 0.95 eV at 900 °C (183 kJ/mol).– High temperature for heat can be obtained from
nuclear power or waste heat from industrial process—part of it being already supplied by Joule effect in the cells.
– Heat is only needed to vapor water. Operating point can be chosen slightly exothermic to recycle exhaust gas and heat input gases from 150°C to 700°Cwithout additional electricity.
SOEC, the electrolysis of steam, is still in the R&D stagebut is more efficient thanother electrolysis technologies
Fact card: Solid oxide electrolysis cell (SOEC)
Overview of technology
Current cost estimate ($ per kgH2) 5.8–7.0Typical plant size (kgH2 per day) Pilot scaleEfficiency (%, LHV) 74–81%Temperature (°C) 650–1.000Operating pressure (bars) 1Current density (A/cm2) 0.5–1Primary energy source ElectricityCurrent cost estimate ($ per kgH2) 5.8–7.0Typical plant size (kgH2 per day)2 Pilot scale
1 Standard hydrogen electrodeSources: “National Hydrogen Roadmap,” Commonwealth Scientific and Industrial Research Organisation, 2018; “The Future of Hydrogen,” International Energy Agency, June 2019; Hydrogenics; Kearney Energy Transition Institute analysis
Pros
– High efficiency and low electricity consumption
Cons
– High temperature required– Limited flexibility– Low ceramic membrane
lifetime due to extreme operating conditions
Hydrogen value chain -Production technologies2.1

45
These electrolysis technologies exist with different characteristics which make them suitable for different applications
Electrolysis production technologies
1 Depends on design and sizeNote: BoP is balance of plant.Sources: “The Future of Hydrogen,” International Energy Agency, June 2019; National Renewable Energy Laboratory; Kearney Energy Transition institute analysis
AE (Alkaline) PEM SOECOperating pressure (bar) 1–30 20–50 1
Operating temperature (°C) 60–80°C 50–80°C 650–1,000°C
Current density 0.3–0.5 A/cm² 1–3 A/cm² 0.5–1 A/m²
Load range (% of nominal load1)
10–110% 20–100%, up to 160% 20–100%
System efficiency (% LHV) 52–69% 60–77% 74–81%
Response time Start: 1–10 minutes; shut: 1–10 minutes
Start: 1 second–5 minutes; shut: few seconds
High
Reverse mode (fuel cell mode)
No No Depends on design
Stack lifetime (hours) 60,000–90,000;100,000–150,000 expected
30,000–70,000 (80, 000 achieved by ITM);100,000–120,000 expected
10,000–30,000,75,000–100,000 expected
Expected R&Dimprovements
– Scaling benefits and lower cost of BoP
– Improved lifetime of components through R&D
– Improved heat exchangers
– Scaling benefits, smaller footprint of stack, and lower cost of BoP
– Improvement in materials and components lifetime (such as lower resistance membrane, catalyst coating, and current density) through R&D
– Improvement in component lifetime (especially ceramic membrane) by improving resistance to high temperatures
– Improve response to fluctuating energy inputs
Pros and consMature technology with track records of large scale projects but from old alkaline technologies
Highly reactive technology with small land footprint thanks to high current density
High potential of economical benefits if coupled with heat source, geothermal, or CSP
Hydrogen value chain -Production technologies2.1

46
Description
– Dark fermentation happens in a tank with no light. Bacteria will trigger a series of biochemical reactions.– Anaerobic bacterial and microalgae reacts with
carbohydrate (refined sugars, raw biomass) and water (even with waste water) to produce H2 and CO2.
C6H12O6 + H2 O → 2 CH3CO2H + 4 H2 + CO2C6H12O6 + H2 O → CH3CH2CH2CO2H + 2 H2 + 2 CO2
– Operating temperature is mainly between 25 and 40°C even if operations can be conducted at temperature above 80°C.– Temperature has a significant impact on hydrogen
production rate as it affects growth rate of microorganisms. If the temperature exceeds optimum value, it can lead to thermal inactivation of enzymes.
– Dark fermentation is followed by photo fermentation.
Dark fermentation is the conversion of organic matter to hydrogen through biochemical reactions
Fact card: Dark fermentation
Overview of technology
Pros
– Simple reactor design
– Abundant resource– Scaling issues
already addressed by biofuel industry (for fermentation)
Cons
– Low yield of production – Production of CO2 and CO
requiring a purification step– Early-stage technology
Key feature estimates
Current cost estimate($ per kgH2)
No industrial use yet
Hydrogen production yield(kgH2 per kg) 0.03–0.04
Efficiency (%, LHV) 30–40%
Operating temperature (°C) 25–40
Primary energy source BiomassHydrogen value chain -Production technologies2.1
Sources: Renewable Hydrogen Technologies, Luis M. Gandía, Gurutze Arzamendi, and Pedro M. Diéguez, 2013; Afhypac, Department of Energy; Kearney Energy Transition institute analysis

47
Key feature estimates
Description
– Microorganisms are attached to the anode and bacteria consume acetic acid to release e- and protons combining into H+ and CO2.
– A power source provides additional energy (~0.2 V to 0.8 V), below typical water electrolysis technologies (1.23 V – 1.8 V).
– Electrode reactions are as follows:– Anode: C2H4O2 + 2 H2 O → 2 C02 + 8 H + +8 e −
– Cathode: 8 H + +8 e −→ 4 H2– Overall, reaction can be summarized as follows:
C2H4O2 + 2 H2 O → 2 CO2 + 4 H2
Microbial electrolysis combines electrical energy with microorganisms activation to produce H2 with low energy inputs
Fact card: Microbial electrolysis
Overview of technology
Current cost estimate($ per kgH2)
1.7–2.6 in laboratory conditions
Typical plant size (kgH2 per day) No industrial use yet
Efficiency (%, LHV)About 70% (up to 300% if only considering electrical input)
Current density (A/cm2) 8.10-4 –11.10-4
Primary energy source Biomass
Pros
– Carbon neutral technology1
– Abundant resource– Ongoing
development of membrane-free reactors with high production rates
Cons
– No comprehensive reviewon reactor configurations
– Early stage technology
1 Not including emissions from electricity generationSources: Alexandria Engineering Journal, 2016; Afhypac; Department of Energy; Kearney Energy Transition institute analysis
Hydrogen value chain -Production technologies2.1

48
Key feature estimates
Description
– Microorganisms are attached to the anode and bacteria consume acetic acid to release e- and protons combining into H+ and CO2.
– A power source provides additional energy (~0.2 V to 0.8 V), below typical water electrolysis technologies (1.23 V – 1.8 V).
– Electrode reactions are as follows:– Anode: C2H4O2 + 2 H2 O → 2 C02 + 8 H + +8 e −
– Cathode: 8 H + +8 e −→ 4 H2– Overall, reaction can be summarized as follows:
C2H4O2 + 2 H2 O → 2 CO2 + 4 H2
Photolytic technologies directly converts sun energy into hydrogen
Fact card: Photolytic conversion technologies
Overview of technology
Current cost estimate ($ per kgH2) n.a. (laboratory stage)Typical plant size (kgH2 per day) n.a. (laboratory stage)Efficiency (%, LHV) ~15% (max. 23%)Current density (A/cm2) ~10-2
Primary energy source Sunlight
Pros
– Can be developed in thin films
– Able to operate at low temperatures
– One-step process, offering cost-reduction potential
– Efficiency rapidly increasing (3% in 2000 vs. 19% in 2018 reached in laboratory)
Cons
– Low lifetime of materials– Need to protect the
semiconductor from water
Sources: Afhypac, ACS Energy; Kearney Energy Transition institute analysis
Hydrogen value chain -Production technologies2.1

49
Storage andreconversion– Depending on the
transportation method, hydrogen can be stored in tanks, salt caverns, cans (hydrides only), or a pipeline network (even in natural gas pipelines, up to a limit)1
– Reconversion might be needed if the new product is not suited for further application.– Ammonia can be used as
feedstock for multiple applications, especially fertilizers.
– LOHC does not have proper application.
Transportation
– Depending on transformation method, hydrogen can be transported by different means.
– Long-distance transportation means include pipelines and vessels, but infrastructure has not yet been deployed.
– Last-mile hydrogen delivery includes road, rail, and pipeline.– Generally, hydrogen is
consumed on-site, requiring short pipeline networks, and when needed is transported by trucks (about 200 kg per truck).
– Hydrogen pipeline network length is around 5,000 km globally, compared with 1.3 million km for natural gas.
Purification and conversion– Hydrogen needs to purified,
either to remove other components from syngas (including CO and CO2) out of gasifier and reformers or remaining water out of electrolyzer.– These steps are conducted
at the production stage.– To increase energy density
and/or improve stability and safety, hydrogen can be transformed before being stored.– Compression in gaseous
form to increase energy density
– Liquefaction at -252°C to increase energy density
– Material-based transformation, either in liquid form (ammonia and LOHC) or solid form (hydrides) to improve stability and energy density
Storing and transporting hydrogen adds complexity tothe value chain
Hydrogen midstream value chain
Note: LOHC is liquefied organic hydrogen carrier. 1 The limit depends on gas infrastructure and consuming applications connected.Source: Kearney Energy Transition Institute analysis
Hydrogen value chain -Conversion, storage, and transportation technologies
2.2
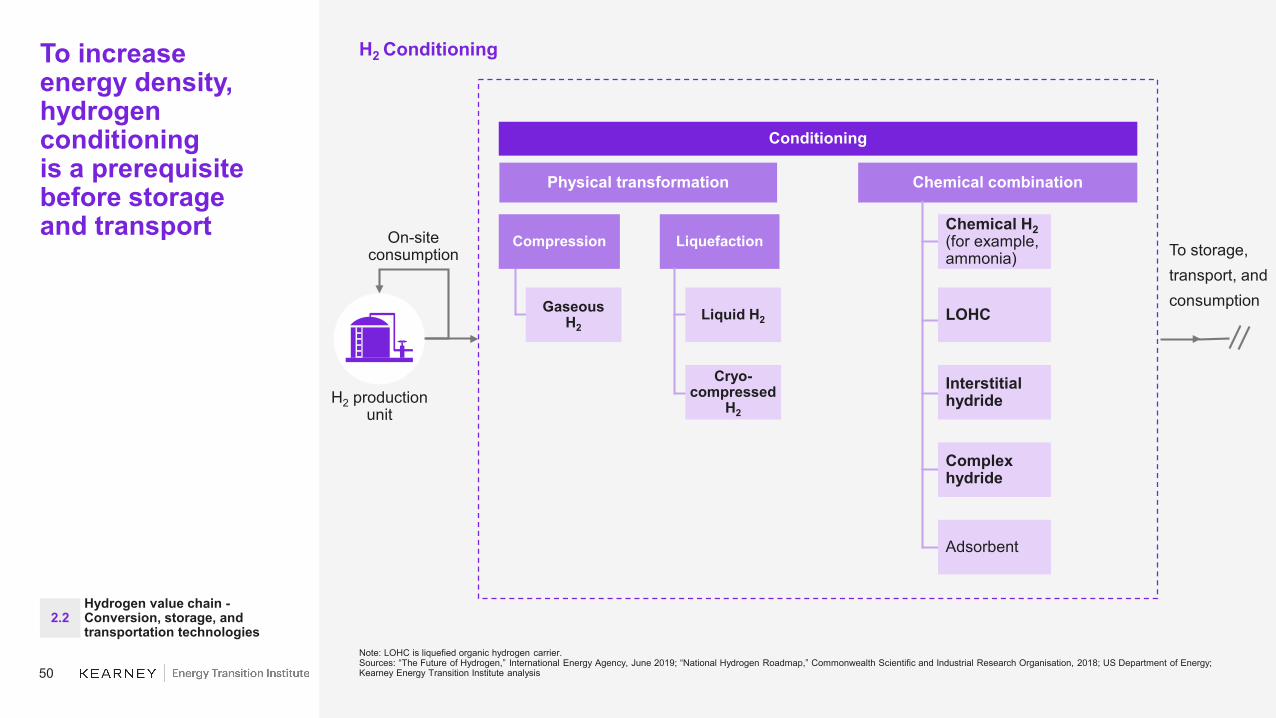
50
To increase energy density, hydrogen conditioningis a prerequisite before storageand transport
Note: LOHC is liquefied organic hydrogen carrier.Sources: “The Future of Hydrogen,” International Energy Agency, June 2019; “National Hydrogen Roadmap,” Commonwealth Scientific and Industrial Research Organisation, 2018; US Department of Energy; Kearney Energy Transition Institute analysis
Conditioning
Physical transformation Chemical combination
Compression Liquefaction
Gaseous H2
Liquid H2
Cryo-compressed
H2
Adsorbent
LOHC
Interstitial hydride
Complex hydride
Chemical H2(for example, ammonia)
Hydrogen value chain -Conversion, storage, and transportation technologies
2.2
H2 Conditioning
H2 production unit
On-site consumption To storage,
transport, andconsumption

51
Transformation method
Long-distance transportation
Short-distance distribution Storage
Pipeline Tankers Pipeline Trucks Trains Tank Pipeline Can Cavern
Phys
ical
tr
ansf
orm
atio
n Compression
Liquefaction
Che
mic
alco
mbi
natio
nAmmonia
LOHC
Hydrides
Scale ~2,000 km
>3,000 km
<500km
<500km
<1,000 km
Small to mid
scale
Small to mid
scaleSmall scale
Large scale
Depending onthe conversion process, H2 canbe stored and transported in multiple ways
H2 storage and transport
1. Note: LOHC is liquefied organic hydrogen carrier.2. Sources: “The Future of Hydrogen,” International Energy Agency, June 2019; Kearney Energy Transition Institute analysis
Hydrogen value chain -Conversion, storage, and transportation technologies
2.2

52
There are multiple opportunities to carry hydrogen: either in gaseous, liquid or in another molecule form
H2 conversion and reconversion key facts
1. 1 PEM produces H2 at this pressure with no additional need for compressor.2. 2 Methylcyclohexane (C7H14)3. Sources: “The Future of Hydrogen,” International Energy Agency, June 2019; “National Hydrogen Roadmap,” Commonwealth Scientific and
Industrial Research Organisation, 2018; Kearney Energy Transition Institute analysis
Material-based
Technology description
Density(kg/m3)
Energy inputProcess maturity Advantages Disadvantages
(kWh/kg H2) (% LHV)
Gas
35Compression of H2 at desired pressure to increase energy density
3 -1 - High – PEM produces H2 at 35 bars pressure
– Flammable150 11 ~1 >90% High
– Compression at 25 °C350 23 ~4 >85% High
700 38 ~6 80% High
Liquefied hydrogen
Cooling of H2 at -253°C through cryo-compression
71 ~9 65-75%
High forsmall scale – Economically viable
where space is limited and high H2 demand
– High energy losses, esp. compared to LNG conversion
– Boil off losses (up to 1% per day)
Low for large scale
Ammonia Reaction with nitrogen
1213 kWh/kg at conversion, up to 8 at
reconversion
82%-93% at conversion,
~80% at reconversion
High for conversion, medium for
reconversion
– Mature industry, potential to leverage current infrastructure
– Toxicity and air polluter– High energy req. for
reconversion
LOHC to MCH2
Mixing with MCH and converted back to hydrogen
110
Exothermic conversion, ~12 kWh/kg
at reconversion
Exothermic conversion,
~65% at reconversion
Medium – No need for cooling
– Toxicity and flammability of toluene
– Price of toluene– Back-shipping of toluene
Metal hydrides
Chemical bonding with metals, reheat back to hydrogen
86 (MgH2)
4 88% Medium
– Lower costs and losses– Higher safety– Higher energy density
than compression
– Heavy storage unit– Long
charging/discharging times
– Low lifetime
Hydrogen value chain -Conversion, storage, and transportation technologies
2.2
Technology advantage Low Medium High

53
Trucks are most suited for short distances and small throughputs; pipelines are preferred for point-to-point transport of large quantities
Key hydrogen transport methods
Sources: “The Future of Hydrogen,” International Energy Agency, June 2019; “National Hydrogen Roadmap,” Commonwealth Scientific and Industrial Research Organisation, 2018; Kearney Energy Transition Institute analysis
Storage type Range (kms)
Key data Process maturity Advantages Disadvantages
Sub-type Metrics
Pipe
line
Compression 1,000–4,000
Low pressure (shorter distances)
– Capex/km (MUSD): 0.3– Gas density (kg/m3): 0.55– Gas velocity (m/s): 15
High
– Lowest-cost option for continuous delivery
– Low operation costs
– Higher capital costs because of infrastructure requirementsHigh pressure
(longer distances)
– Capex/km (MUSD): 0.5– Gas density (kg/m3): 6.4 – Gas velocity (m/s): 15
Truc
ks Compression, liquefaction, ammonia
Less than 1,000
n.a.
– Capex ($ thousand): 185 (truck), 650–1,000 (trailer)
– Loading/unloading time (trailer, hours):
– 3 (LH2), 1.5 (GH2) – Net capacity (trailer, kgH2):
4300 (LH2), 670 (GH2)
High– Delivery to multiple
locations before they are connected to a pipeline
– Lower capacity compared with other options
– Boil-off rate requiring rapid delivery of liquid hydrogen
Trai
ns Compression, liquefaction, ammonia
800–1,100 n.a. n.a. Medium
– Lower operational costs, larger quantities, and distances compared with trucks
– Limited route flexibility
Tank
ers
Liquefaction, ammonia
More than 4,000
n.a.
– Capacity/ship (tH2): 11,000
– capex/ship (MUSD): 412– Fuel use (MJ/km): 1487
Low– Likely option for
exporting huge volumes
– Unlikely to use compression storage because of the cost of operation, distance, and lower hydrogen density
Technology advantage Low Medium High
Hydrogen value chain -Conversion, storage, and transportation technologies
2.2
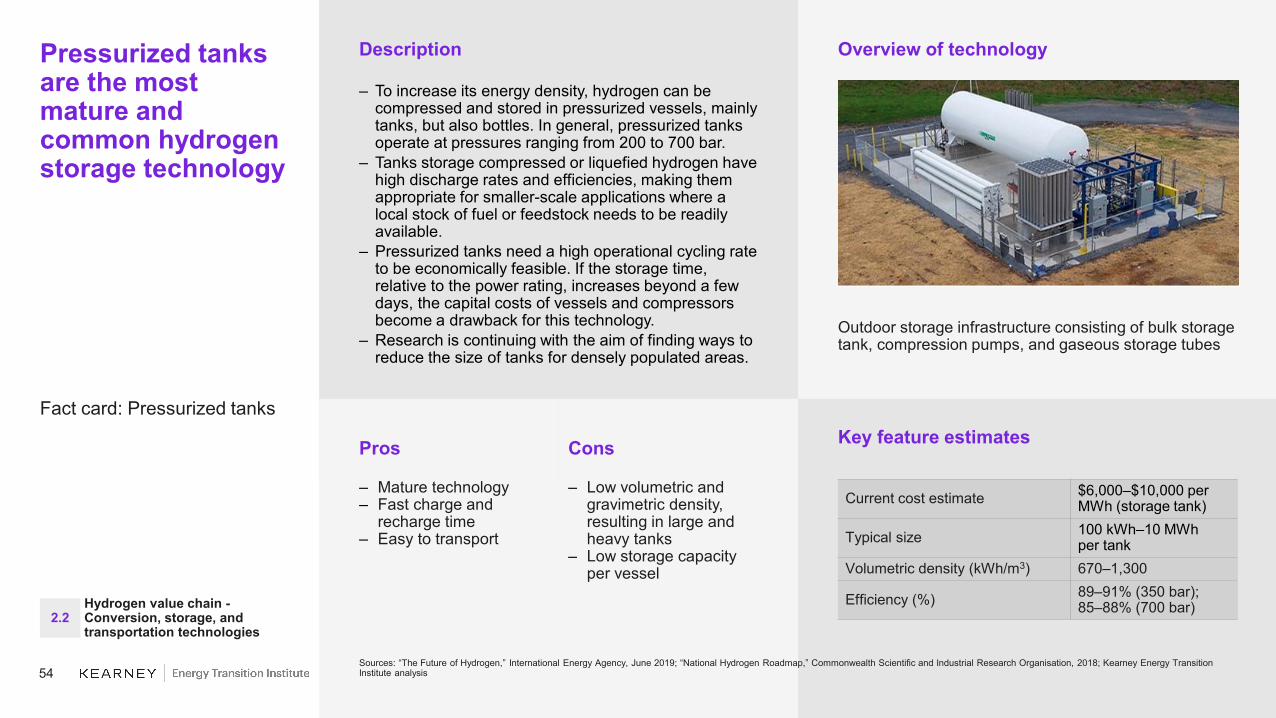
54
Key feature estimates
Description
– To increase its energy density, hydrogen can be compressed and stored in pressurized vessels, mainly tanks, but also bottles. In general, pressurized tanks operate at pressures ranging from 200 to 700 bar.
– Tanks storage compressed or liquefied hydrogen have high discharge rates and efficiencies, making them appropriate for smaller-scale applications where a local stock of fuel or feedstock needs to be readily available.
– Pressurized tanks need a high operational cycling rate to be economically feasible. If the storage time, relative to the power rating, increases beyond a few days, the capital costs of vessels and compressors become a drawback for this technology.
– Research is continuing with the aim of finding ways to reduce the size of tanks for densely populated areas.
Pressurized tanks are the most mature and common hydrogen storage technology
Fact card: Pressurized tanks
Overview of technology
Current cost estimate $6,000–$10,000 per MWh (storage tank)
Typical size 100 kWh–10 MWhper tank
Volumetric density (kWh/m3) 670–1,300
Efficiency (%) 89–91% (350 bar);85–88% (700 bar)
Pros
– Mature technology– Fast charge and
recharge time– Easy to transport
Cons
– Low volumetric and gravimetric density,resulting in large andheavy tanks
– Low storage capacityper vessel
Sources: “The Future of Hydrogen,” International Energy Agency, June 2019; “National Hydrogen Roadmap,” Commonwealth Scientific and Industrial Research Organisation, 2018; Kearney Energy Transition Institute analysis
Outdoor storage infrastructure consisting of bulk storage tank, compression pumps, and gaseous storage tubes
Hydrogen value chain -Conversion, storage, and transportation technologies
2.2
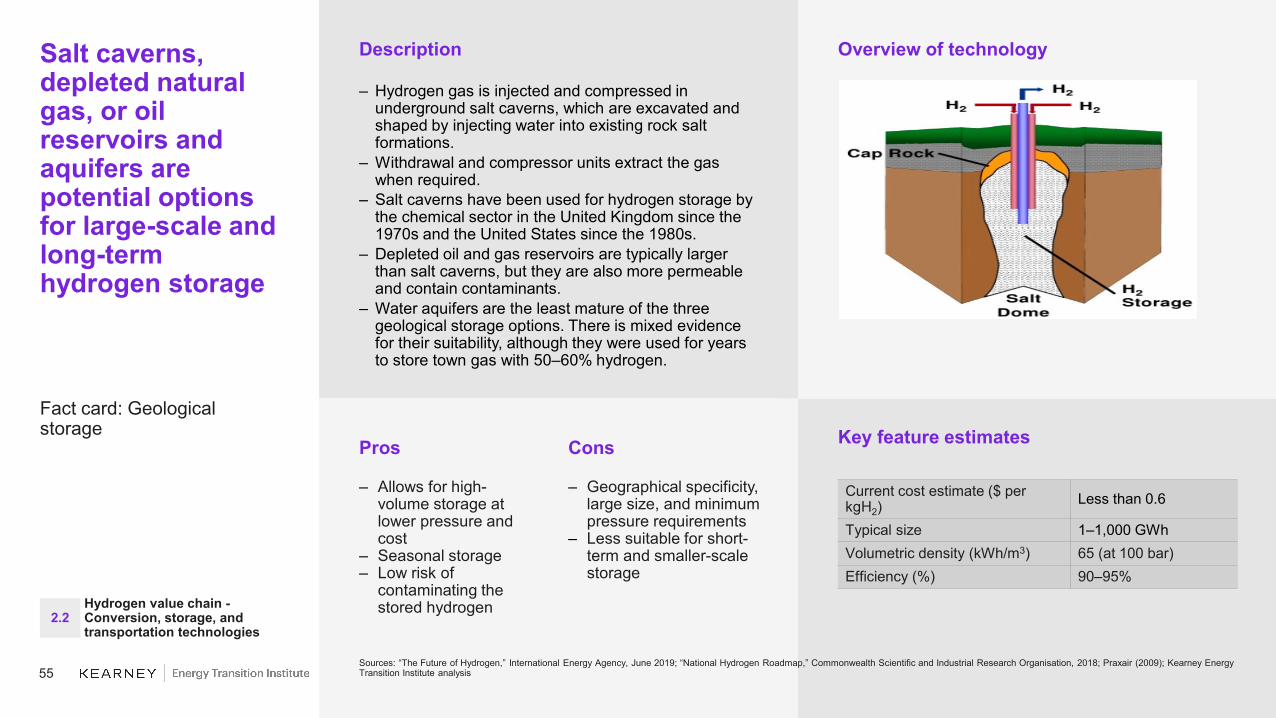
55
Key feature estimates
Description
– Hydrogen gas is injected and compressed in underground salt caverns, which are excavated and shaped by injecting water into existing rock salt formations.
– Withdrawal and compressor units extract the gas when required.
– Salt caverns have been used for hydrogen storage by the chemical sector in the United Kingdom since the 1970s and the United States since the 1980s.
– Depleted oil and gas reservoirs are typically larger than salt caverns, but they are also more permeable and contain contaminants.
– Water aquifers are the least mature of the three geological storage options. There is mixed evidence for their suitability, although they were used for years to store town gas with 50–60% hydrogen.
Salt caverns, depleted natural gas, or oil reservoirs and aquifers are potential options for large-scale and long-term hydrogen storage
Fact card: Geological storage
Overview of technology
Current cost estimate ($ per kgH2)
Less than 0.6
Typical size 1–1,000 GWhVolumetric density (kWh/m3) 65 (at 100 bar)Efficiency (%) 90–95%
Pros
– Allows for high-volume storage at lower pressure and cost
– Seasonal storage– Low risk of
contaminating the stored hydrogen
Cons
– Geographical specificity, large size, and minimum pressure requirements
– Less suitable for short-term and smaller-scale storage
Sources: “The Future of Hydrogen,” International Energy Agency, June 2019; “National Hydrogen Roadmap,” Commonwealth Scientific and Industrial Research Organisation, 2018; Praxair (2009); Kearney Energy Transition Institute analysis
Hydrogen value chain -Conversion, storage, and transportation technologies
2.2

56
Overview of technologiesDescription
– In the form of compressed gas stored in salt caverns, hydrogen could also become a long-term storage option to balance seasonal variations in electricity demand or generation from renewables.
– However, compressed hydrogen suffers from a low round trip efficiency (60% of the original electricity is lost).
– Other hydrogen-based storage alternatives include:– Underground hydrogen storage options, such as pore
storage and storage in depleted oil and gas fields– Storing hydrogen-based fuels, such as methane, liquid
organic hydrogen carriers (LOHCs), and ammonia produced from electricity via electrolysis, in respective storage mediums, including methane (gas grid) and ammonia (steel tanks)
– Prospective customers: utilities
Compressed hydrogen storage in salt caverns offers the most economic option at discharge durations longer than 20 to 45 hours
Fact card: Long-termenergy storage
Source: Kearney Energy Transition Institute analysis
Market maturity Early prototype and demonstration
Market size (numberof units)
3 salt caverns (United States and United Kingdom)
Future growthFew alternatives for long-duration, large-scale storage
Competing technologiesPumped hydro, batteries, thermo-mechanical storage technologies
H2 Market trends
Preliminary
Para-meter Units PHES CAES Li-ion
Comp-ressedH2
Capex (power)
$ per kWe 1130 870 95 1820
Capex (storage)
$ per kWh 80 39 110 0.25
Opex (power)
$ per kWe 8 4 10 73
Opex (storage)
$ per kWh 1 4 3 0
Round-trip efficiency
% 78 44 86 37
Lifetime Years 55 30 13 20
Hydrogen value chain -Conversion, storage, and transportation technologies
2.2

57
Key feature estimates
Description
– George Claude’s cycle to liquefy H2 is a three-step process:– H2 is first cooled with a liquid nitrogen heat exchanger.– Then, H2 is compressed and expanded in adiabatic
conditions, which cools down the gas and the system itself.
– To avoid liquid presence in the system and mechanical troubles, isenthalpic Joule-Thomson expansion allows to recover liquid H2.
– As natural H2 is a mixture of ortho-hydrogen (75%) and para-hydrogen (25%), liquefying transforms all ortho into para-hydrogen, which is an exothermic reaction.– In addition to thermal losses as a result of the non-
perfect insulation of the system, boil-off also happens because of the reaction heat emissions.
Liquefying H2 must be cooled down to -253°C, with potential losses from boil-off
Fact card: Liquefaction of H2
Overview of technology
Current cost estimate($ per kgH2)
~1.0
Typical plant size (kgH2 per day) 5,000–25,000Energy required (kWh/kgH2) 10–13Energy consumption (% of LHV of Hydrogen)
20–25%, potentialto 18%
Pros
– Easy reconversion
– High energy density
– Already used in aerospace industry
Cons
– Flammable– Not mature for large-
scale systems– Boiling off, with 0.3%
to 1% losses per day
Sources: “The Future of Hydrogen,” International Energy Agency, June 2019; “National Hydrogen Roadmap,” Commonwealth Scientific and Industrial Research Organisation, 2018; Afhypac; Linde; Kearney Energy Transition Institute analysis
Linde’s liquefaction plant
Hydrogen value chain -Conversion, storage, and transportation technologies
2.2
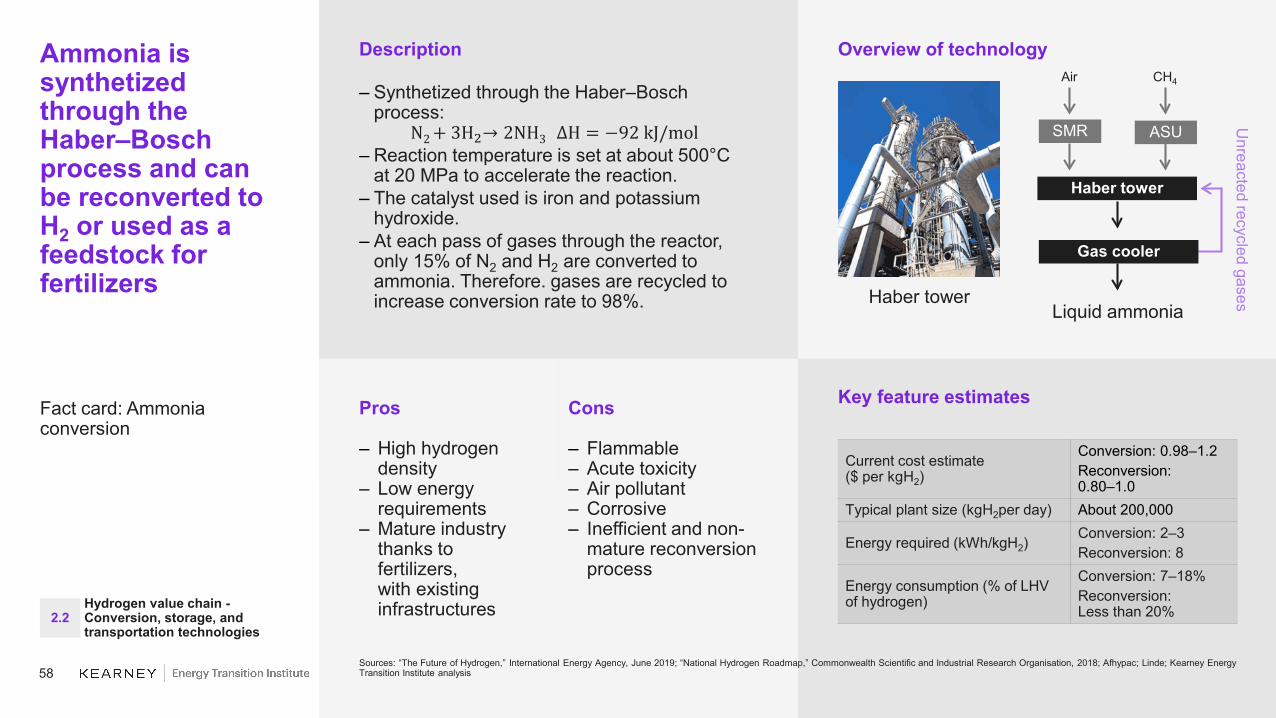
58
Key feature estimates
Description
– Synthetized through the Haber–Bosch process:
N2 + 3H2→ 2NH3 ΔH = −92 kJ/mol– Reaction temperature is set at about 500°C
at 20 MPa to accelerate the reaction.– The catalyst used is iron and potassium
hydroxide.– At each pass of gases through the reactor,
only 15% of N2 and H2 are converted to ammonia. Therefore. gases are recycled to increase conversion rate to 98%.
Ammonia is synthetized through theHaber–Bosch process and can be reconverted to H2 or used as a feedstock for fertilizers
Fact card: Ammonia conversion
Overview of technology
Current cost estimate($ per kgH2)
Conversion: 0.98–1.2Reconversion:0.80–1.0
Typical plant size (kgH2per day) About 200,000
Energy required (kWh/kgH2)Conversion: 2–3Reconversion: 8
Energy consumption (% of LHV of hydrogen)
Conversion: 7–18%Reconversion:Less than 20%
Pros
– High hydrogen density
– Low energy requirements
– Mature industry thanks to fertilizers,with existing infrastructures
Cons
– Flammable– Acute toxicity– Air pollutant– Corrosive– Inefficient and non-
mature reconversion process
Sources: “The Future of Hydrogen,” International Energy Agency, June 2019; “National Hydrogen Roadmap,” Commonwealth Scientific and Industrial Research Organisation, 2018; Afhypac; Linde; Kearney Energy Transition Institute analysis
Haber tower
ASUSMR
Haber tower
Gas cooler
Liquid ammonia
Air CH4
Unreacted recycled gases
Hydrogen value chain -Conversion, storage, and transportation technologies
2.2
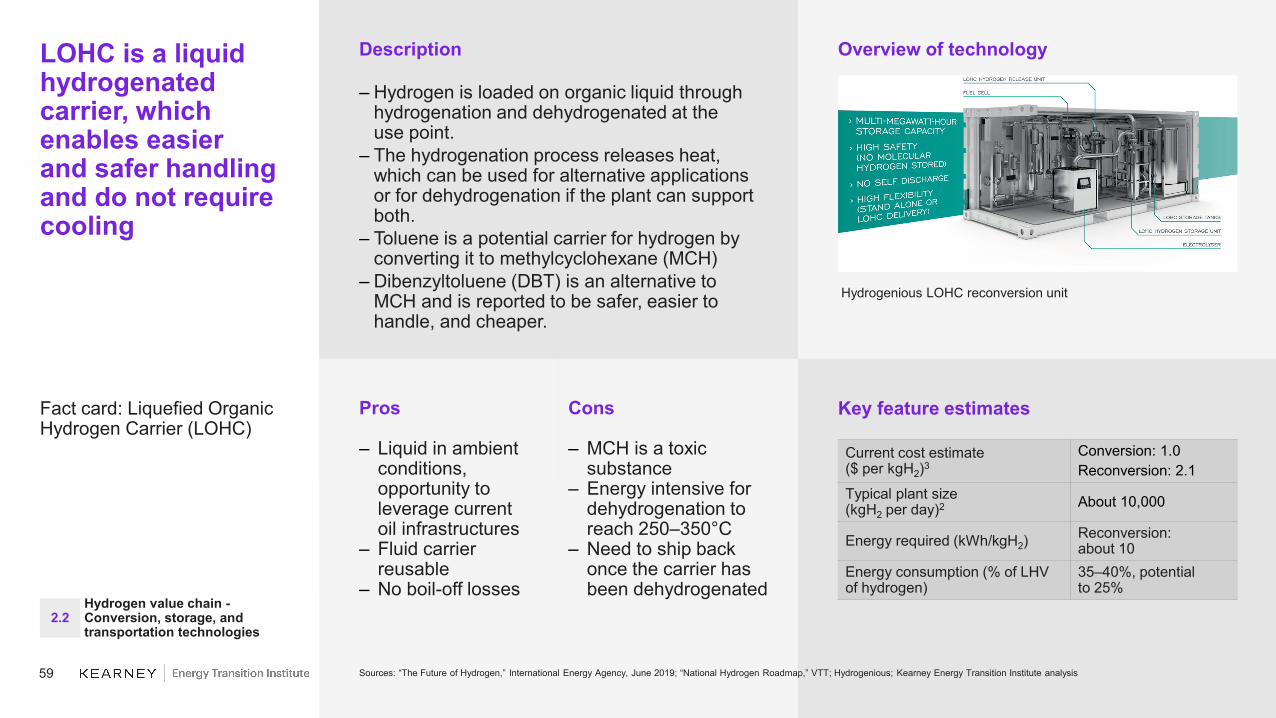
59
Key feature estimates
Description
– Hydrogen is loaded on organic liquid through hydrogenation and dehydrogenated at theuse point.
– The hydrogenation process releases heat, which can be used for alternative applications or for dehydrogenation if the plant can support both.
– Toluene is a potential carrier for hydrogen by converting it to methylcyclohexane (MCH)
– Dibenzyltoluene (DBT) is an alternative to MCH and is reported to be safer, easier to handle, and cheaper.
LOHC is a liquid hydrogenated carrier, which enables easierand safer handling and do not require cooling
Fact card: Liquefied Organic Hydrogen Carrier (LOHC)
Overview of technology
Current cost estimate($ per kgH2)3
Conversion: 1.0Reconversion: 2.1
Typical plant size(kgH2 per day)2 About 10,000
Energy required (kWh/kgH2)Reconversion:about 10
Energy consumption (% of LHV of hydrogen)
35–40%, potentialto 25%
Pros
– Liquid in ambient conditions, opportunity to leverage current oil infrastructures
– Fluid carrier reusable
– No boil-off losses
Cons
– MCH is a toxicsubstance
– Energy intensive for dehydrogenation toreach 250–350°C
– Need to ship backonce the carrier hasbeen dehydrogenated
Sources: “The Future of Hydrogen,” International Energy Agency, June 2019; “National Hydrogen Roadmap,” VTT; Hydrogenious; Kearney Energy Transition Institute analysis
Hydrogenious LOHC reconversion unit
Hydrogen value chain -Conversion, storage, and transportation technologies
2.2

60
Key feature estimates
Description
– Certain metals bind very strongly with hydrogen, forming a metal hydride compound. Under low temperature or at high pressure, hydrogen gas molecules adhere to the surface of the metal and break down into hydrogen atoms, which penetrate the metal crystal to form a solid metal hydride. When the metal hydride is heated, the metal–hydrogen bonds break, and hydrogen atoms migrate to the surface where they recombine into hydrogen molecules.
– To minimize the energy penalty, heat released during absorption can be captured and stored for use during desorption. The combined use of metal hydrides and thermal storage, known as adiabatic metal hydrides, is already on the market.
– Currently, they are being re-examined for niche applications where stability is a key requirement,such as the military.
Metal hydrides operate at low pressure and improve hydrogen-handling safetybut must still demonstrate their economic feasibility
Fact card: Metal hydrides
Overview of technology
Current cost estimate($ per kgH2)
NA
Typical size 10–20 (United States), 1 (United Kingdom)
Volumetric density (kWh/m3) 4,200Efficiency (%) ~80-90%
Pros
– Low pressure operation mode implies lower costs and losses.
– Safety than compressed gas / liquified hydrogen
– Larger energy capacity than compressed tanks
Cons
– Attaching hydrogen to metal results in a heavy storage unit
– Long charging and discharging times
– Low lifetime
Sources: “The Future of Hydrogen,” International Energy Agency, June 2019; “National Hydrogen Roadmap,” Commonwealth Scientific and Industrial Research Organisation, 2018; Kearney Energy Transition Institute analysis
Temperature (°C)
Pres
sure
(bar
)
Pabsorption
Pdesorption
MgH2
Mg+H2
Hydrogenious LOHC reconversion unit
Hydrogen value chain -Conversion, storage, and transportation technologies
2.2
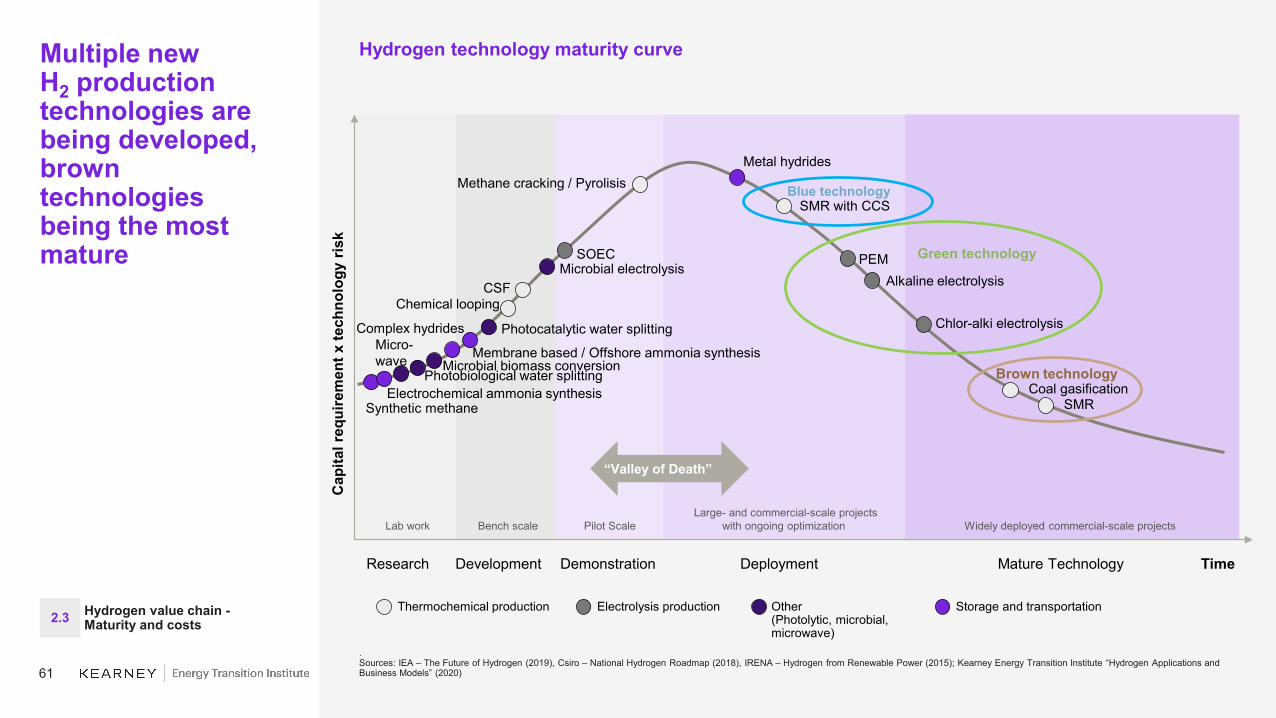
61
Multiple newH2 production technologies are being developed, brown technologies being the most mature
Hydrogen technology maturity curve
.Sources: IEA – The Future of Hydrogen (2019), Csiro – National Hydrogen Roadmap (2018), IRENA – Hydrogen from Renewable Power (2015); Kearney Energy Transition Institute “Hydrogen Applications and Business Models” (2020)
Other(Photolytic, microbial, microwave)
Electrolysis productionThermochemical production Storage and transportationHydrogen value chain -Maturity and costs2.3
Time
Cap
ital r
equi
rem
ent x
tech
nolo
gy r
isk
Research Development Demonstration Deployment Mature Technology
Lab work Bench scale Pilot ScaleLarge- and commercial-scale projects
with ongoing optimization Widely deployed commercial-scale projects
Methane cracking / Pyrolisis
“Valley of Death”
CSFChemical looping
Photocatalytic water splitting
Photobiological water splittingMicrobial biomass conversion
SMR
Microbial electrolysis
Electrochemical ammonia synthesis
Membrane based / Offshore ammonia synthesis
Synthetic methaneCoal gasification
Alkaline electrolysisPEM
Metal hydrides
SOEC
Chlor-alki electrolysis
SMR with CCS
Complex hydrides
Blue technology
Green technology
Brown technology
Micro-wave

62
Thermochemicalsources LCOH
range
9.0
SMR Coal Gasification PEM
2.0
AEATR + CCSATR
9.5
SMR + CCS
10.0
Coal Gas. + CCS SOEC
5.0
0.50.0
7.5
1.01.5
2.53.03.54.0
8.0
4.5
5.56.06.57.0
8.5
1.9
1.2
1.9
7.4
1.4
2.1
1.6
4.0
5.0
The levelizedcost of hydrogenis an average oftwo to four times higher for green sources than for hydrocarbon-based solutions
Estimated LCOH per production technology(2019, $ per kg, average from multiple sources)
Note: All hypotheses are detailed in the appendix.Sources: International Energy Agency Greenhouse Gas R&D Programme, Commonwealth Scientific and Industrial Research Organisation, International Renewable Energy Agency, Foster Wheeler, McPhy, Areva H2Gen, Rabobank, TOTAL, Department of Energy, Air Liquide; Kearney Energy Transition Institute analysis
Not Exhaustive; Indicative
Blue H2Brown H2 Green H2 Average Green only if coupled with renewable electricity sources
Hydrogen value chain -Maturity and costs2.3
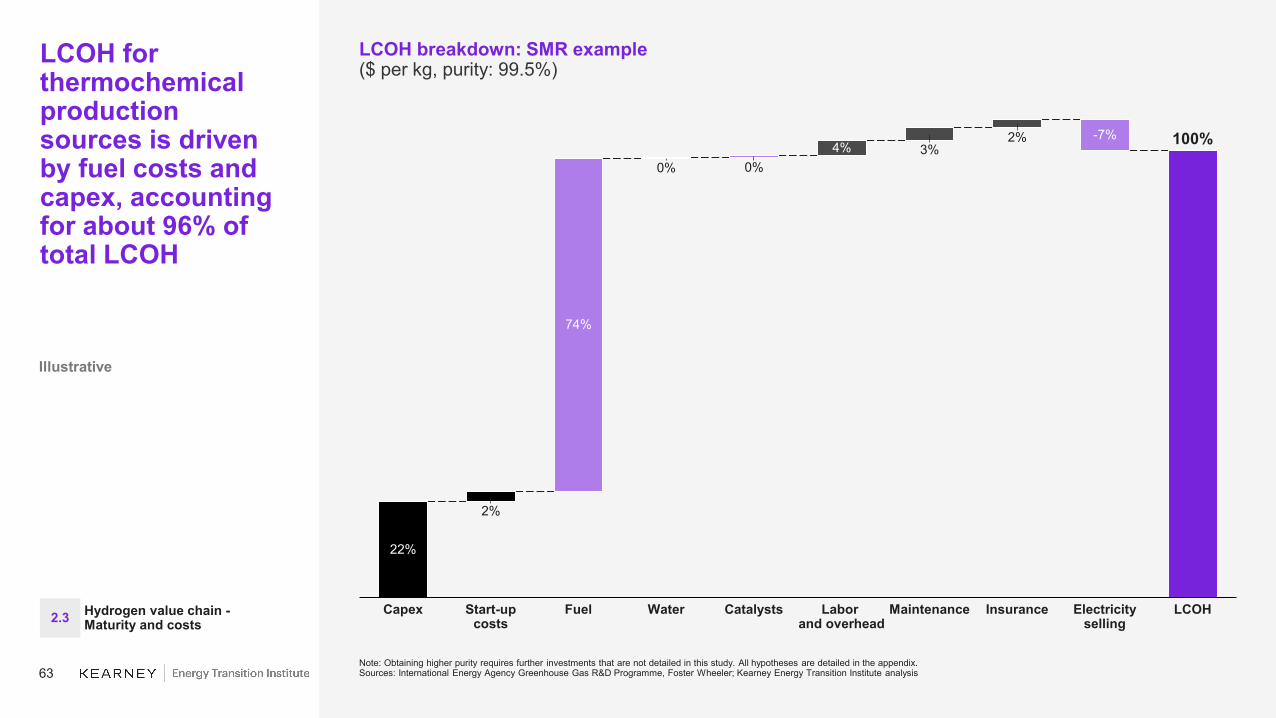
63
LCOH for thermochemical production sources is driven by fuel costs and capex, accounting for about 96% of total LCOH
LCOH breakdown: SMR example($ per kg, purity: 99.5%)
Note: Obtaining higher purity requires further investments that are not detailed in this study. All hypotheses are detailed in the appendix. Sources: International Energy Agency Greenhouse Gas R&D Programme, Foster Wheeler; Kearney Energy Transition Institute analysis
Illustrative
2%
Fuel
22%
Start-up costs
Capex
2%
74%
0%
Water
0%
Catalysts Maintenance
-7%
Insurance Electricity selling
LCOH
4%
Labor and overhead
3%100%
Hydrogen value chain -Maturity and costs2.3

64
Brown H2 sources can be coupled with CCS to reduce emissions, but LCOH could jump by 64¢ per kg
CO2 capture rate per case(SMR, kg CO2/kg H2, % of base case, $ per kg)
Note: CO2 emissions could go up to 11 kg/kgH2. $1 = €0.89Sources: International Energy Agency Greenhouse Gas R&D Programme; Kearney Energy Transition Institute analysis
Illustrative
4.7(52%)
Case 2a
9.9
4.9(53%)
4.2(47%)
Case 2b
8.1(89%)
1.0(11%)
Case 3Case 1b
0.4
4.3(48%)
4.9(54%)
0.8
Base case(SMR)
5.8(64%)
4.2(46%)
Case 1a
3.3(36%)
9.1 9.4 9.5 0.99.1
10.0
0.3
CO2 released CO2 avoided Extra CO2 captured
Extra CO2 emitted and capturedAdditional CO2 emitted to provide energy for CCS solutions, captured by the CCS solution
CO2 avoidedCO2 captured and avoided compared with the base case
CO2 emittedCO2 effectively released in the atmosphere
LCOH($ per kg)
Delta($ per kg)
1.70 1.84 1.79 1.76 2.081.44
0.26 0.40 0.35 0.32 0.64-Hydrogen value chain -Maturity and costs2.3

65
Electrolyzer cost is mainly driven by electricity costs and capex
LCOH breakdown - PEM example($ per kg)
Note: All hypotheses are detailed in the appendix.Sources: AREVA H2Gen; Kearney Energy Transition Institute analysis
Illustrative
21%
Water
3%
71%
Capex Electricity
3%
Maintenance
2%
Insurance LCOH
100%
Hydrogen value chain -Maturity and costs2.3

66
LCOH(load factor and size)
– Capex highly impacts LCOH when the utilization rate is low.
– Average electricity prices increase with load factor.
– Optimum not at 100% utilization
Electricity price(local market)
– Spot prices are market dependent, and average prices vary with time.
– REN have a specific functioning point and range.
Capex(size and technology)
– Capex varies with technology and plant size.
– Electrolyzer size is expected to increase driving marginal capex down.
Two factorscan improve electrolysis LCOH: reducing capex and optimizing electricity price and load factor
Note: Other factors include efficiency, operations and maintenance, and stack replacement and are expected to be improved as technology becomes more mature and the system size grows.Sources: “The Future of Hydrogen,” International Energy Agency, June 2019; European Network of Transmission System Operators; International Renewable Energy Agency; Kearney Energy Transition Institute analysis
6,002,000,00 4,00 8,00
500
010,00
1,000
1,500
MW
$ per kWe PEMAE
10
100%0% 20% 40%0
80%60%
2030405060708090
$ per MWh
Time (%)
Spot pricesWindSolar
20%
14
80%0% 40% 60% 100%0
4
6
8
10
12
Utilization rate (%)
$ per kg $1123 per kW
$450 per kW$787 per kW
Optimum
+ =Factors to improve electrolysis LCOH
Hydrogen value chain -Maturity and costs2.3
French market (2018)
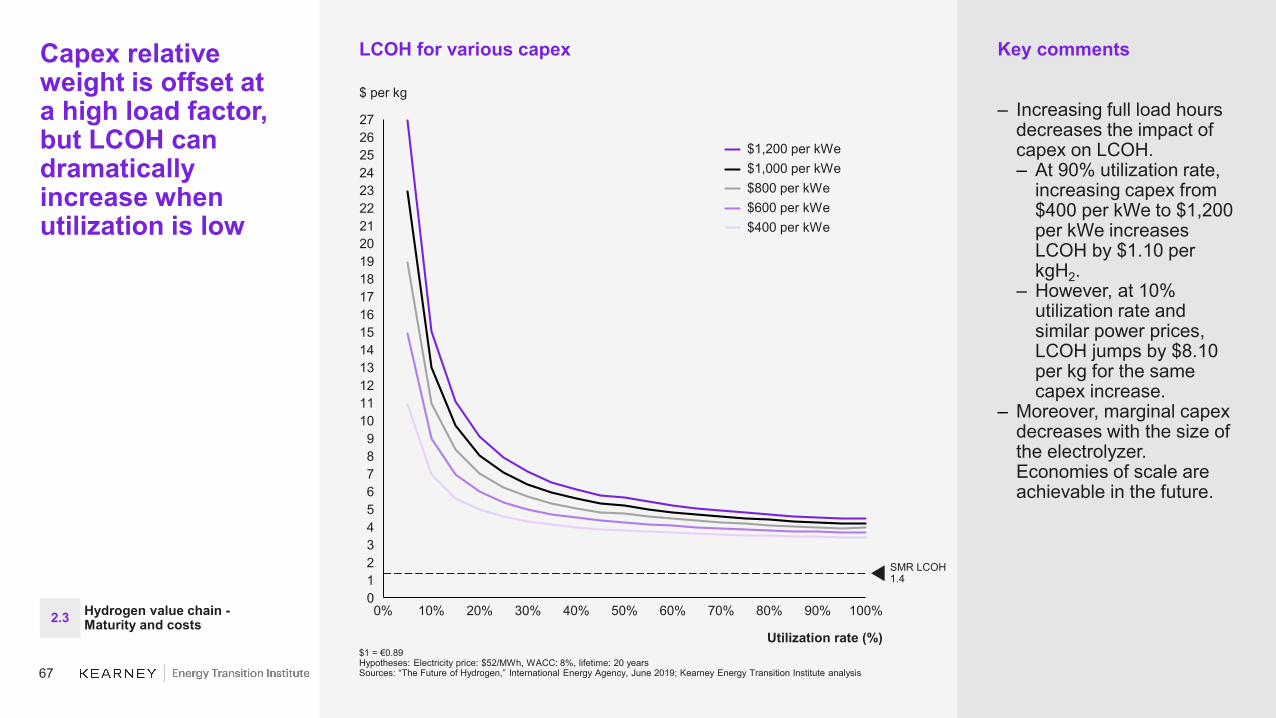
67
Key comments
– Increasing full load hours decreases the impact of capex on LCOH.– At 90% utilization rate,
increasing capex from $400 per kWe to $1,200 per kWe increases LCOH by $1.10 per kgH2.
– However, at 10% utilization rate and similar power prices, LCOH jumps by $8.10 per kg for the same capex increase.
– Moreover, marginal capex decreases with the size of the electrolyzer. Economies of scale are achievable in the future.
Capex relative weight is offset at a high load factor, but LCOH can dramatically increase when utilization is low
$1 = €0.89Hypotheses: Electricity price: $52/MWh, WACC: 8%, lifetime: 20 yearsSources: “The Future of Hydrogen,” International Energy Agency, June 2019; Kearney Energy Transition Institute analysis
LCOH for various capex
50%
7
0% 10%
24
8
2
20%
17
70%30% 60%
1
90%80% 100%
6
0
4
23
15
1110
3
14
12
16
18
20
22
2627
40%
5
9
13
19
21
25
$ per kg
SMR LCOH1.4
Utilization rate (%)
$1,200 per kWe$1,000 per kWe$800 per kWe$600 per kWe$400 per kWe
Hydrogen value chain -Maturity and costs2.3
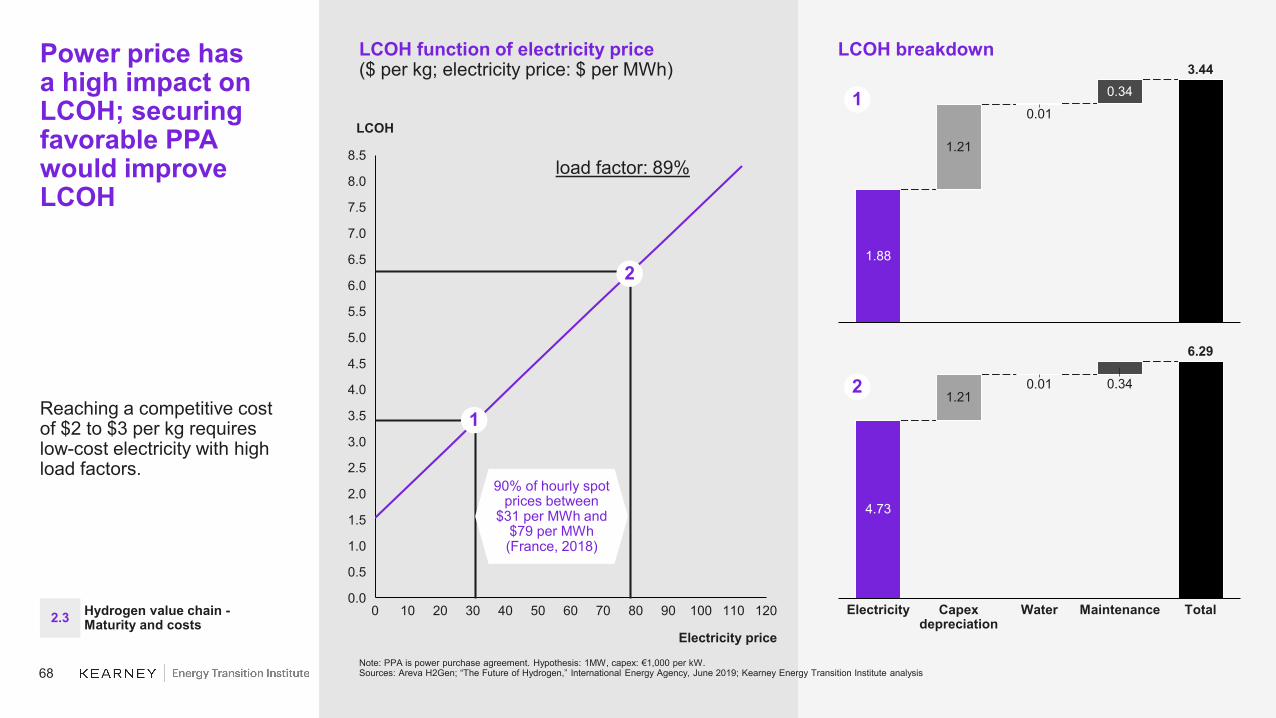
68
500 10 703020 40 80
8.0
90
2.0
100 110 1200.0
0.5
60
1.0
1.5
2.5
3.0
4.5
3.5
4.0
5.0
5.5
6.0
6.5
7.0
7.5
8.5
Electricity price
LCOH
LCOH breakdownPower price hasa high impact on LCOH; securing favorable PPAwould improve LCOH
Reaching a competitive cost of $2 to $3 per kg requires low-cost electricity with high load factors.
Note: PPA is power purchase agreement. Hypothesis: 1MW, capex: €1,000 per kW.Sources: Areva H2Gen; “The Future of Hydrogen,” International Energy Agency, June 2019; Kearney Energy Transition Institute analysis
90% of hourly spot prices between
$31 per MWh and$79 per MWh(France, 2018)
1
2
1.21
1.88
0.340.01
3.44
4.73
Electricity
0.01
Capex depreciation
1.21
Water
0.34
6.29
Maintenance TotalHydrogen value chain -Maturity and costs2.3
LCOH function of electricity price($ per kg; electricity price: $ per MWh)
load factor: 89%
1
2

69
200
0
50
100
250
150
300
0 1000 2000 3000 4000 5000 6000 7000 8000 9000
LCOH per load factor($ per kg)
Minimal LCOH occurs at load factors between70 and 90%, but the spot price range is too narrow to impact LCOH at a high utilization rate
Electricity spot price (January–December 2018, $ per MWh, France)
Sources: European Network of Transmission System Operators; Kearney Energy Transition Institute
Spot prices (ascending order)Spot prices (cumulated average)
Spot prices (chronological order)
13.0
20% 80%
10.510.0
7.5
0%0.0
11.011.5
10%
0.5
30%
5.0
40% 50%
12.0
90%60% 70% 100%
13.5
7.0
3.03.5
9.5
6.0
4.04.5
5.5
6.5
8.08.5
12.5
9.0
$1,124 per kWe$450 per kWe
Hydrogen value chain -Maturity and costs2.3
Illustrative
Electrolyzer• Stack: 70,000 hours lifetime, 36% capex• Electricity consumption: 60 kWh/kg

70
Upcoming R&D initiatives willhelp improve the efficiency of applications while reducing LCOH of blue hydrogen
Key cost drivers and improvement per technology
Sources: “National Hydrogen Roadmap,” Commonwealth Scientific and Industrial Research Organisation, 2018; Kearney Energy Transition Institute analysis
Steam methane reforming + CCS Black coal gasification + CCS
Capacity factor – No change expected – No change expected
Scale and capacity – Secure export offtake agreements – Successful demonstration at scale– Export offtake agreements
Capex – Scaling benefits, – Process intensification
– R&D process intensification– Scaling benefits
Opex – Scaling benefits – Scaling benefits– Improvements in build-up of slag and ash
Efficiency – R&D process improvements, reused heat, membrane separation
– R&D improvements of purification, ASU, and CO2 removal
Risk – Reduced risk of CO2 capture – First of kind demonstration
Cost of capital – Support for CCS – Support for CCS
Hydrogen value chain -Maturity and costs2.3

71
RD&D efforts required tolower LCOH for electrolyzers are primarily focused on lowering capital costs and increasing the lifetime of the system
Key innovation themes in research and developmentProton exchange membrane (PEM)
Note: Bold terms refers to the higher priority with in the impact area. Efficiency improvements are not prioritized. Non-continuous operations mean that operating costs are small, so reduction of capital costs is a higher priority. Efficiencies are maximized at low current density, but to reduce capital costs, research is focused on increasing current density instead.Sources: “Future Cost and Performance of Water Electrolysis: An Expert Elicitation Study,” International Journal of Hydrogen Energy, 28 December 2017; Kearney Energy Transition Institute
Reduced capital cost Longer lifetime Higher efficiency
Cell
– Increase current density– Lower loading of platinum group
metal catalysts, new and improved catalysts
– Improved coating of electrodes– Thinner membranes, advanced
chemistry
– Improved catalyst durability– Structural improvements in
electrodes– Higher physical stability of
membrane– Higher impurity tolerance of
membrane
– Thinner membranes
Stack– Electrochemical pressurization,
increased stack size– Reduction of titanium use– Optimized diffusor set-up
– Slower H2 embrittlement through more suitable coating
– Higher operating temperatures leading to stack and cooling efficiencies
System
– Scale up of system components– Efficient water purification– Improved component integration– Optimized operation set points– Alkaline polymer systems– New low-cost stack designs– Design for high-pressure operation
– Improved water purification– Avoidance of impurity
penetration
– More efficient rectification through more expensive diodes
– More efficient hydrogen purification
Hydrogen value chain -Maturity and costs2.3

72
Capital cost reduction will become more important aslow-cost electricity from renewables becomes possible
Mechanism of capital cost reductions - Proton exchange membrane (PEM)
Non-Exhaustive
Key levers Description
Scale-upof system components
Impact area: System– Enhance combination and scale-up (for example, safe operation
with more than 200 cells) of system components due to system design de-risking and increased operational confidence; leads to better system integration and operation at optimized set points
Impact area: Cell– High current density allows the stack size to be smaller with
increased efficiency. Hydrogen production rate is approximately proportional to the current density.
– Increase up to 3 A/cm2 (by 2020) and further (>3A/cm2) through better electrode design, catalyst coatings, and thinner membranes
Increasing current density
Catalysts
Reduction in titanium use
Impact area: Cell– Better catalysts can lead to increased current density and
reaction rate.– Reduction in usage of expensive precious metals-based catalysts
through the introduction of new and improved catalysts (telluride, nano-catalysts, and mixed metal oxides such as RuOx and IrOx)
Impact area: Stack– Titanium in bipolar plates (up to 51% of the stack cost) is costly,
using a high-conductivity coating on low-cost substrate instead (such as stainless steel).
Sources: “Future Cost and Performance of Water Electrolysis: An Expert Elicitation Study,” International Journal of Hydrogen Energy, 28 December 2017, “Membraneless Electrolyzersfor Low-Cost Hydrogen Production in a Renewable Energy Future,” Joule, 20 December 2017; Kearney Energy Transition Institute
Hydrogen value chain -Maturity and costs2.3

73
2014
1,500
2010
2,000
2022201820162012 20242020 2026 2028 20300
500
1,000
2,500
Capex ($ per kW)
PEM CAPEX Evolution(2010–2030, $ per kW)
AE capex evolution(2010–2030, $ per kW)Capex for
electrolyzer is expected to dramatically decrease by2030
R&D initiatives on AE and PEM could drive capex down to about €400 per kW for both technologies by 2030.
Sources: E4Tech, ITM Power; Kearney Energy Transition Institute
2012
2,500
202020162010 2014 2018 2022 2024 2026 2028 20300
500
2,000
1,000
1,500
Capex ($ per kW)
Hydrogen value chain -Maturity and costs2.3

74
Coal gasification + CCS
SMR + CCS
Brown technologies1
SOEC electrolysis
PEM electrolysis
Alkaline electrolysis
Blue hydrogen and green hydrogen costs are expected to decline and close the gap with brown sources by 2030
LCOH evolution($ per kg, min–max. average)
1 AUD = 70¢1 Thermochemical sources LCOH rangeNote: All hypotheses are detailed in the appendix. Ranges are indicative ranges. LCOH highly depends on fossil fuel prices, electricity prices, and asset utilization.Sources: “The Future of Hydrogen,” International Energy Agency, June 2019; International Energy Agency Greenhouse Gas R&D Programme; Commonwealth Scientific and Industrial Research Organisation; McPhy; Areva; Foster Wheeler; Department of Energy; International Renewable Energy Agency; Rabobank; TOTAL; CEA; Kearney Energy Transition Institute analysis
Illustrative
Blue technologies Green technologies
2019 2025–30
2.51.6
2025–302019
2.51.9
2019
2.2
2025–30
6.97.5
2019 2025–30
2.6
2019
9.6
2025–30
3.8
1.5 1.31.9
1.4
2.6
1.6
3.5
1.62.1
5.0
Green only if coupled with renewable electricity sources
Hydrogen value chain -Maturity and costs2.3

75
Reconversion($/kg)
Conversion($/kg)
Conversion and reconversion increase LCOH, with compression being the cheapest option but with the lowest energy density once stored
H2 conversion and reconversion LCOH, includingon-site storage
Note: 1 AUD = 0.7 USDSources: “The Future of Hydrogen,” International Energy Agency, June 2019; “National Hydrogen Roadmap,” Commonwealth Scientific and Industrial Research Organisation, 2018; Kearney Energy Transition Institute
0.0
1.4
0.20.40.60.8
1.21.0
1.61.82.02.2
1.0
0.20.30.30.2
1.8
0.4
0.40.3
2.2
1.2
0.4
Further reduction potential with salt caverns storage Improvement
opportunities in insulation and
vaporization rates
Scaling benefits
1.21.0
0.2
1.4
0.4
0.0
0.60.8
1.61.82.02.2
AmmoniaGas tanks - 35 bars LiquefactionGas tanks - 150 bars Gas tanks - 350 bars LOHCNegligibleNegligible Negligible Negligible
1.0
2.1High costs for decentralized applications
Hydrogen value chain -Maturity and costs2.3
1.8
1.0
0.81.0

76
H2 transmission LCOH($ per kg, km)
H2 distribution LCOH($ per kg, km)
Transportation costs depends on the hydrogen form, carrier, and distance traveled
Note: 1 AUD = 70¢Sources: “The Future of Hydrogen,” International Energy Agency, June 2019; Kearney Energy Transition Institute analysis
100 tpd
500 tpd
Hydrogen value chain -Maturity and costs2.3
0 1000 2000 3000 4000
1.0
0.0
0.5
1.5
2.0
km
$/kg
Liquefied H2 Ammonia LOHCGaseous H2
Shipping Pipeline Truck
0 100 2000.0
300 400 500
0.5
1.0
1.5
2.0
km0 400100 300200 500
$/kg

77
Conversion and transportation of H2 can double LCOH, which could be avoided with decentralized production sources
Case study: shipping H2 from A to B(2019, $ per kg, base case)
Notes: The main hypotheses are detailed in the appendix. 1 AUD = 70¢Sources: “National Hydrogen Roadmap,” Commonwealth Scientific and Industrial Research Organisation, 2018; “The Future of Hydrogen,” International Energy Agency, June 2019; Kearney Energy Transition Institute analysis
7%
2%
6%6%
39%
48%
5% 0%
48%
39%
100%
Production
Transportation
ConversionStorage
Illustrative
Hydrogen value chain -Maturity and costs2.3
SMR + CCS Shiping: 3,000 km
Liquefaction Pipeline: 50 km
H2reconversion
Storage tanks: 350 bars
End consumer
78
Key hydrogen applications

79
Some orders of magnitude in 2019 5
Executive summary 6
1. Hydrogen’s role in the energy transition 16
2. Hydrogen value chain: upstream and midstream 252.1 Production technologies 272.2 Conversion, storage, and transportation technologies 492.3 Maturity and costs 61
3. Key hydrogen applications 783.1 Overview 803.2 Feedstock 843.3 Energy 90
3. Business models 1144.1 Policies and competition landscape 1164.2 Business cases 125
Appendix (Bibliography & Acronyms) 187

80 Sources: “The Future of Hydrogen,” International Energy Agency, June 2019; Kearney Energy Transition Institute analysis
Key applications include chemicals and steel manufacturing, gas energy, power generation, and mobility
Main H2 applications
Sulphur removal, heavy crude upgrade
Feedstock for ammonia and methanol
Direct reduction of iron (DRI)
Fuel gas
Fuel cells
Fuel cells
Synthetic fuels / Fuel cells
Fuel cells
Synthetic fuels / Fuel cells
5-20% H2 mixed with CH4
Transformation into CH4
100% H2 injected on network
Additional fuel for coal power plant
Combustion turbines / Fuel cells
Fuel for fuel cells
Energy storage in caverns, tanks,…
End-use application
Hydrogenation
Industrial applications
Mobility
Gas energy
Power generation
Oil refining
Chemicals production
Iron & steel production
Light-duty vehicles
Heavy duty vehicles
Maritime
Rail
Aviation
Blended H2
Methanation
Pure H2
Co firing NH3 in coal power plants
Flexible power generation
Back-up / off-grid power supply
Long-term / large scale energy storage
High temperature heat
Application areas
Feedstock
Energy
Food industry
H2 use
Key hydrogen applications -Overview3.1
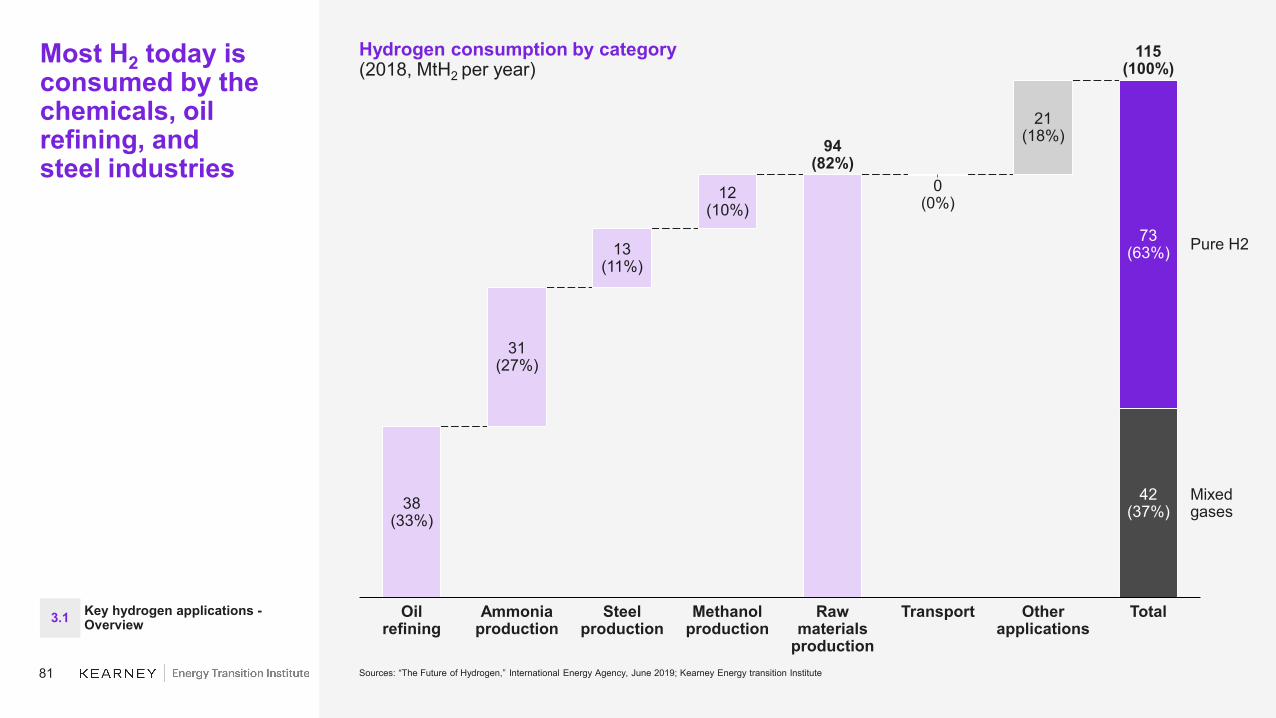
81
Most H2 today is consumed by the chemicals, oil refining, andsteel industries
Hydrogen consumption by category(2018, MtH2 per year)
13(11%)
Transport
38(33%)
Other applications
Oilrefining
Steelproduction
31(27%)
Methanolproduction
21(18%)
Ammoniaproduction
12(10%)
TotalRaw materials
production
115(100%)
0(0%)
73(63%)
42(37%)
Pure H2
Mixedgases
94(82%)
Sources: “The Future of Hydrogen,” International Energy Agency, June 2019; Kearney Energy transition Institute
Key hydrogen applications -Overview3.1

82
Applications will mature at different rates; some of them already have
Expected commercial maturity per application(2020–2050)
Indu
stria
l app
licat
ions
Mob
ility
Oil refining
Chemicals production
Iron and steel production
Light-duty vehicles
Heavy-duty vehicles
Maritime
Rail
Aviation
High-temperature heat
21 22 23 24 25 26 27 28 29 30 31 32 33 34 35 36 37 38 39 40 41 42 43 44 45 46 47 48 49
Forklifts
Decarbonized industrial feedstock
Passenger ships
City cars
Trucks Coaches
High-temperature heat Low- to mid-temperature heat
Merchant navy
Buses
Berlines, SUVs
Power generation
Gas energy
Commercialization start Market maturity, defined as 1% of total sales
Sources: Afhypac; Kearney Energy Transition Institute analysis
Key hydrogen applications -Overview3.1

83
Hydrogen consumption could reach540 Mt peryear by 2050,driven by industrial processes and transportation
Possible hydrogen consumption by 2050(pure hydrogen, MTH2)
70
154
112
77
63
63
63(12%)
77(14%)
2020f Mobility Power generation and buffering
Industrial feedstock
Industrial energy Building heat and power
154(29%)
245(45%)
2050f
539X8
Gas energy
Industrial feedstockMobilityPower generation
Dedicated hydrogen production
~400mn cars~20mn trucks~5mn buses
~25% of diesel trains replaced
~5% of airplanes and freight ships
Sources: Hydrogen Council, Kearney Energy Transition Institute analysis
Key hydrogen applications -Overview3.1
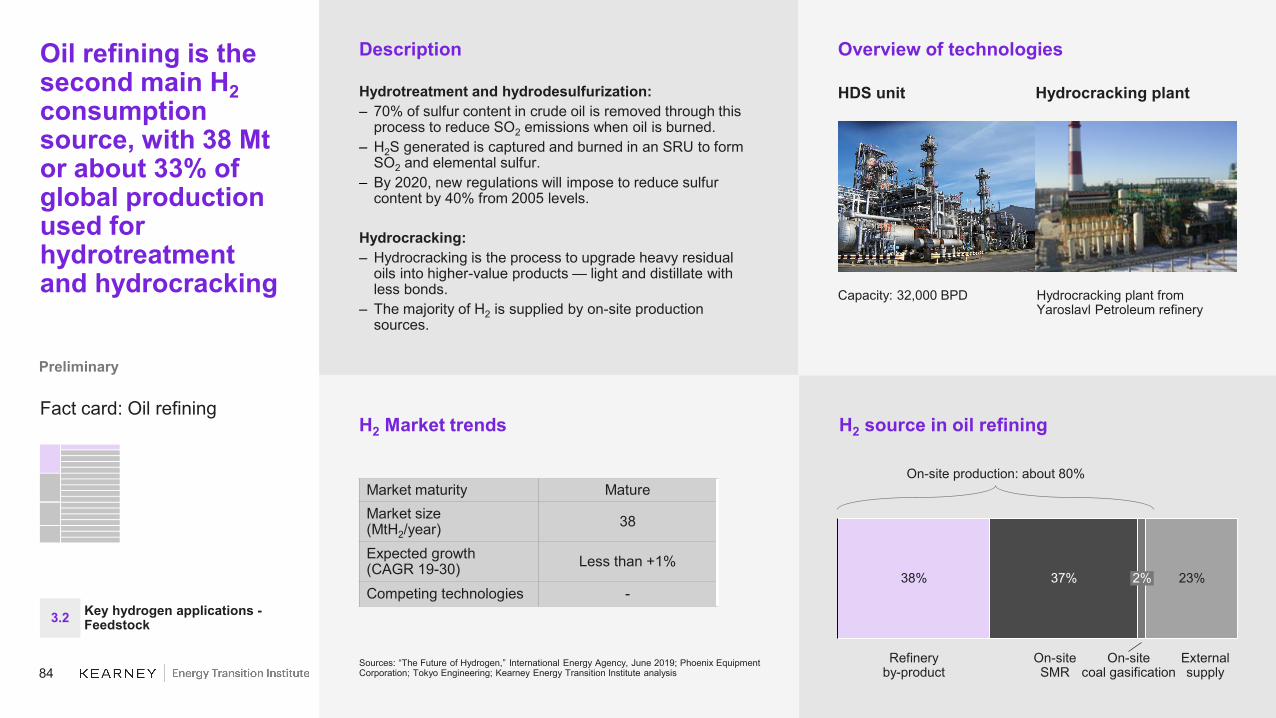
84
H2 source in oil refiningH2 Market trends
Description
Hydrotreatment and hydrodesulfurization:– 70% of sulfur content in crude oil is removed through this
process to reduce SO2 emissions when oil is burned.– H2S generated is captured and burned in an SRU to form
SO2 and elemental sulfur.– By 2020, new regulations will impose to reduce sulfur
content by 40% from 2005 levels.
Hydrocracking:– Hydrocracking is the process to upgrade heavy residual
oils into higher-value products — light and distillate with less bonds.
– The majority of H2 is supplied by on-site production sources.
Oil refining is the second main H2consumption source, with 38 Mt or about 33% of global production used for hydrotreatment and hydrocracking
Fact card: Oil refining
Sources: “The Future of Hydrogen,” International Energy Agency, June 2019; Phoenix Equipment Corporation; Tokyo Engineering; Kearney Energy Transition Institute analysis
Market maturity MatureMarket size(MtH2/year) 38
Expected growth(CAGR 19-30) Less than +1%
Competing technologies -
Preliminary
Overview of technologies
HDS unit Hydrocracking plant
Capacity: 32,000 BPD Hydrocracking plant from Yaroslavl Petroleum refinery
23%2%37%
On-siteSMR
38%
On-sitecoal gasification
Externalsupply
Refineryby-product
On-site production: about 80%
Key hydrogen applications -Feedstock3.2
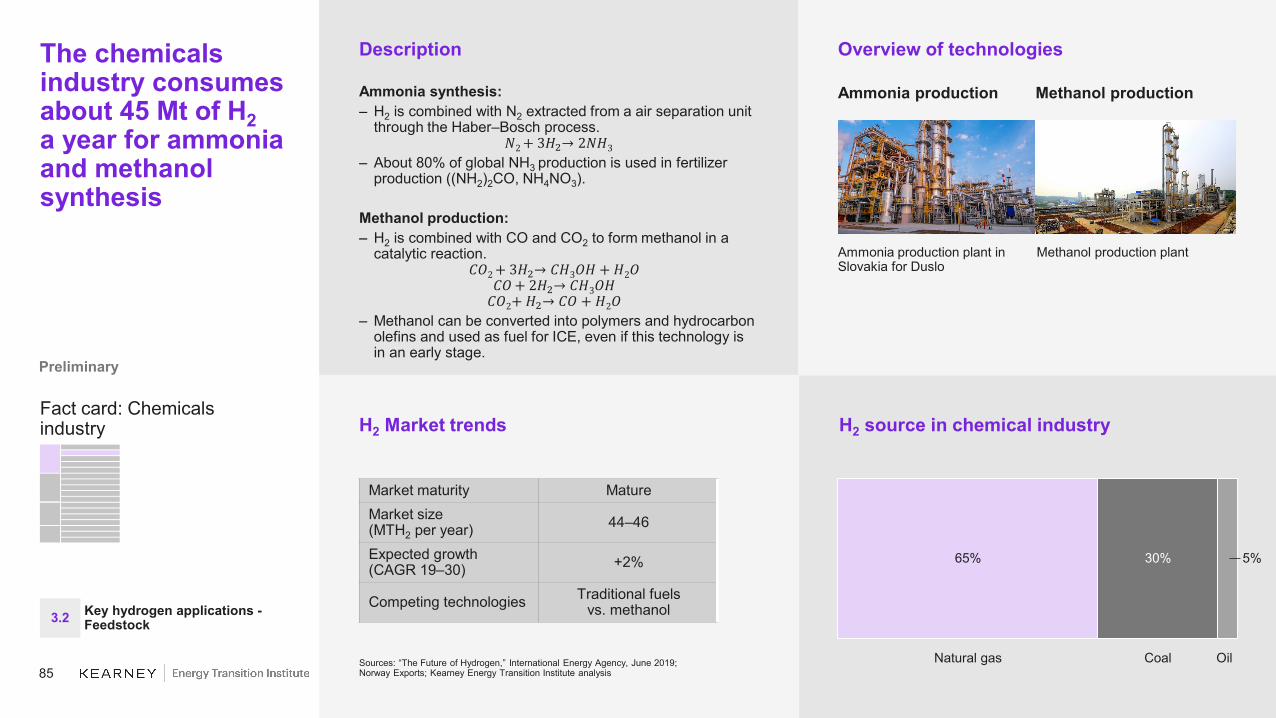
85
H2 source in chemical industryH2 Market trends
Description
Ammonia synthesis:– H2 is combined with N2 extracted from a air separation unit
through the Haber–Bosch process.𝑁𝑁2 + 3𝐻𝐻2→ 2𝑁𝑁𝐻𝐻3
– About 80% of global NH3 production is used in fertilizer production ((NH2)2CO, NH4NO3).
Methanol production:– H2 is combined with CO and CO2 to form methanol in a
catalytic reaction.𝐶𝐶𝑂𝑂2 + 3𝐻𝐻2→ 𝐶𝐶𝐻𝐻3𝑂𝑂𝐻𝐻 + 𝐻𝐻2𝑂𝑂
𝐶𝐶𝑂𝑂+ 2𝐻𝐻2→ 𝐶𝐶𝐻𝐻3𝑂𝑂𝐻𝐻𝐶𝐶𝑂𝑂2+ 𝐻𝐻2→ 𝐶𝐶𝑂𝑂 + 𝐻𝐻2𝑂𝑂
– Methanol can be converted into polymers and hydrocarbon olefins and used as fuel for ICE, even if this technology is in an early stage.
The chemicals industry consumes about 45 Mt of H2a year for ammonia and methanol synthesis
Fact card: Chemicals industry
Sources: “The Future of Hydrogen,” International Energy Agency, June 2019; Norway Exports; Kearney Energy Transition Institute analysis
Market maturity MatureMarket size(MTH2 per year) 44–46
Expected growth(CAGR 19–30) +2%
Competing technologies Traditional fuelsvs. methanol
Preliminary
Overview of technologies
Ammonia production Methanol production
Ammonia production plant in Slovakia for Duslo
Methanol production plant
Natural gas
65% 5%30%
OilCoal
Key hydrogen applications -Feedstock3.2
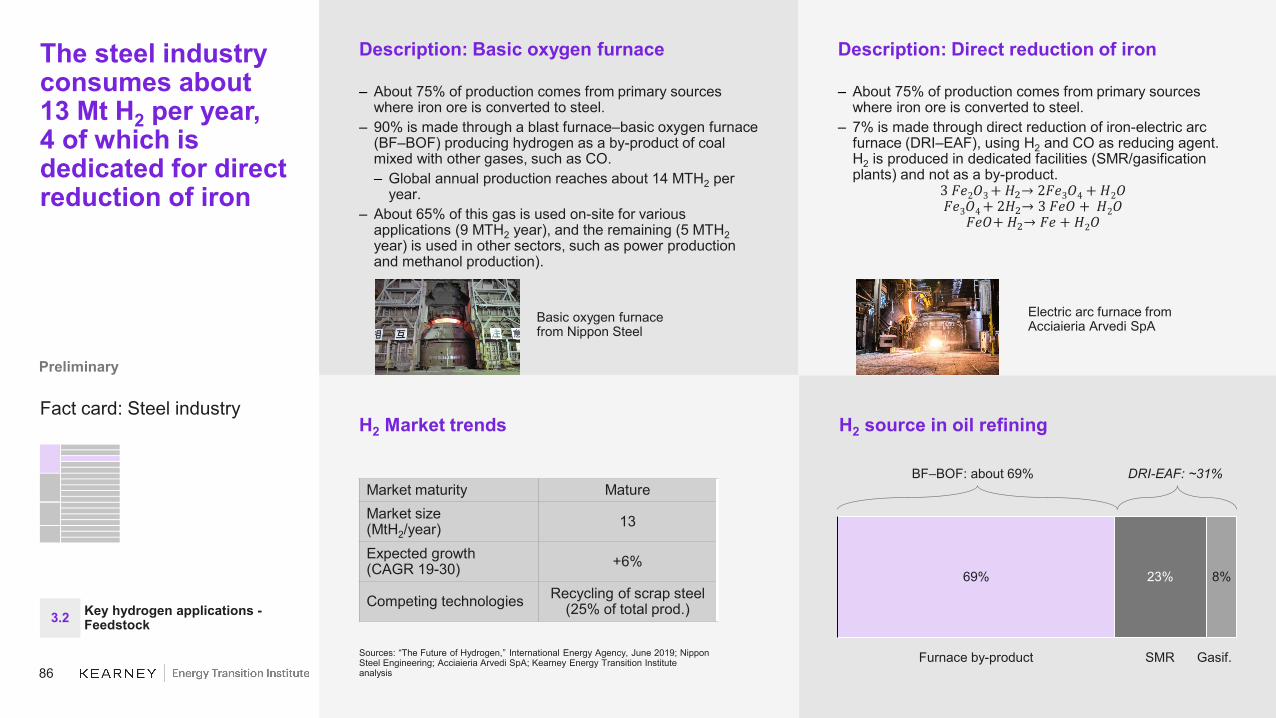
86
H2 source in oil refining
Description: Basic oxygen furnace
– About 75% of production comes from primary sources where iron ore is converted to steel.
– 90% is made through a blast furnace–basic oxygen furnace (BF–BOF) producing hydrogen as a by-product of coal mixed with other gases, such as CO.– Global annual production reaches about 14 MTH2 per
year.– About 65% of this gas is used on-site for various
applications (9 MTH2 year), and the remaining (5 MTH2year) is used in other sectors, such as power production and methanol production).
The steel industry consumes about 13 Mt H2 per year,4 of which is dedicated for direct reduction of iron
Fact card: Steel industry
Sources: “The Future of Hydrogen,” International Energy Agency, June 2019; Nippon Steel Engineering; Acciaieria Arvedi SpA; Kearney Energy Transition Institute analysis
Preliminary
Basic oxygen furnacefrom Nippon Steel
Description: Direct reduction of iron
– About 75% of production comes from primary sources where iron ore is converted to steel.
– 7% is made through direct reduction of iron-electric arc furnace (DRI–EAF), using H2 and CO as reducing agent. H2 is produced in dedicated facilities (SMR/gasification plants) and not as a by-product.
3 𝐹𝐹𝐻𝐻2𝑂𝑂3 + 𝐻𝐻2→ 2𝐹𝐹𝐻𝐻3𝑂𝑂4 + 𝐻𝐻2𝑂𝑂𝐹𝐹𝐻𝐻3𝑂𝑂4 + 2𝐻𝐻2→ 3 𝐹𝐹𝐻𝐻𝑂𝑂 + 𝐻𝐻2𝑂𝑂
𝐹𝐹𝐻𝐻𝑂𝑂+ 𝐻𝐻2→ 𝐹𝐹𝐻𝐻 + 𝐻𝐻2𝑂𝑂
Electric arc furnace fromAcciaieria Arvedi SpA
BF–BOF: about 69% DRI-EAF: ~31%
H2 Market trends
Market maturity MatureMarket size(MtH2/year) 13
Expected growth(CAGR 19-30) +6%
Competing technologies Recycling of scrap steel(25% of total prod.)
8%
SMR
23%
Gasif.
69%
Furnace by-product
Key hydrogen applications -Feedstock3.2

87
Adopting low carbon energy sources and reducing agents, such as Hydrogen, can help decarbonize steel production
1. HBI – Hot-briquetted iron, EAF - Electric arc furnace Sources: Assessment of hydrogen direct reduction for fossil-free steelmaking (Vogi, Ahman, Nilsson 2018), Steel Institute VDEh
Use of Hydrogen to lower emissions
– To reduce carbon emissions in steel making, two fundamental options include
– continued use of fossil fuels but with carbon capture and storage (CCS)
– the use of renewable electricity for producing hydrogen as reduction agent or directly in (yet undeveloped) electrolytic processes
– Blast furnace – basic oxygen furnace (BF/BOF) production route, which is the dominant production pathway currently, relies on the use of coking coal making it difficult to switch to other reduction agents in the blast furnace
– Key concept is to use a hydrogen direct reduction process to produce direct reduced iron (DRI) which is then converted to steel in an electric arc furnace (EAF)
– Ideally Hydrogen should be produced from renewable sources. However, as an intermediate solution, fossil fuels (mainly natural gas) are used to produce Hydrogen until sufficient carbon free electricity will be available at competitive prices
Hydrogen based Direct Reduction proposed process design1
Fact card: Steel industry
Key hydrogen applications -Feedstock3.2

88
Currently 100% Hydrogen based steel production is not cost competitive compared to the more established alternatives
1. BF = Blast furnace, DRI = Direct reduced Iron, EAF = Electrical arc furnace, Oxy. SR-BOF = oxygen-rich smelt reduction, CCUS = Carbon capture and storage 2. Hisarna project3. HYBRIT project for 100% Hydrogen DRI - EAF Sources: IEA – The Future of Hydrogen (2019)
87 66145 156 166 104
166 166
90121 121 138159
111 197
0100200300400500600700800900
1.0001.100
859
398
46100% Hydrogen
DRI - EAF
52 1320 14
14
21
59Oxy-SR-BOF
w/CCUSBF-BOF
1700
24
563
54DRI - EAF
163
49
57DRI - EAF w/CCUS
630
0
378587
0
52
50% Hydrogen DRI - EAF
479
1 084
62
RangeFuelCCUSFeedstock Fixed OPEX
CAPEX
Pilot3Commercial Demo2
Estimated costs of steel for selected greenfield production routes1
Levelized costs (USD/t), 2018 estimates
The economic viability of the hydrogen-based steel production pathways is highly dependent on the low cost clean electricity or higher carbon prices
Key hydrogen applications -Feedstock3.2

89
Strong demand in medium and long term
Demand for dedicated Hydrogen production in steel is expected to grow at a rapid pace over the next decade
Based on trends in total crude steel production, the split between primary & secondary steel production and the share of the DRI-EAF route in primary steel1. Assumption - share of secondary production in total steel production in 2030 = 25%, gas based DRI maintains current growth in primary production2. Assumption - share of secondary production in total steel production in 2050 = 29%, gas based DRI accounts for 100% primary productionSources: IEA – The Future of Hydrogen (2019)
12
2018 20300
20
31
2018 2030
13
230
20302018
410
62
203012018 20502
Hydrogen (MT)Coal (Mtoe) Gas (bcm) Electricity (TWh)
– Without any policy intervention and projecting on the current trends, the demand for dedicated hydrogen production (derived chiefly from natural gas) in steel-making is expected to track growth of gas based DRI-EAF production route
– DRI-EAF tends to be deployed in geographies with low natural gas prices (i.e. Middle East) or low coal price (i.e. India) and could supply 14% of primary steel demand by 2030
– For an accelerated rate of emission reduction in steel making process, the following technological breakthroughs are required which would further increase the demand for hydrogen:
– 30% of the natural gas consumed in DRI-EAF to be replaced by hydrogen produced from electrolysis (renewable sources)
– Commercial-scale 100% Hydrogen based DRI-EAF plant by 2030
Energy and hydrogen requirements for DRI-EAF production route
Key hydrogen applications -Feedstock3.2

90
Among Fuel Cells, PEM seems to be the most promising fuel cell technology, with the widest range of application and demonstrated high-power efficiency
Fuel cell technologies comparison
Sources: US Department of Energy, 2015; Kearney Energy Transition Institute analysis
Temperature
Slack size
Electrical
performance(LHV)
Current applications
Advantages Challenges Improvement potential
Back
up
pow
er
Porta
ble
pow
er
Dis
tribu
ted
gene
ratio
n
Tran
spor
t
Spec
ialty
ve
hicl
es
Milit
ary
Spac
e
Elec
tric
utilit
y
Auxi
liary
po
wer
Polymer electrolyte membrane(PEM)
<120°C <1–100kW 60%
– Low corrosion and electrolyte management
– Low temperature– Quick start-up and load
following
– Expensive catalysts– Sensitive to fuel
impurities
Alkaline (AFC)
<100°C 1-100kW 60%
– Lower cost components– Low temperature– Quick start-up
– Sensitive to CO2 in fuel and air
– Electrolyte management (aqueous)
– Electrolyte conductivity (polymer)
Phosphoric acid(PAFC)
<150 –200°C
5-400kW 40%
– Suitable for CHP– Increased tolerance to
fuel impurities
– Expensive catalysts– Long start-up time– Sulfur sensitivity
Molten carbonate(MCFC)
600-700°C
300kW – 3MW 50%
– High efficiency – Fuel flexibility– Suitable for CHP– Hybrid–gas turbine cycle
– High temperature– Long start-up time– Low power density
Solid oxide(SOFC)
500-1000°C
1kW-2MW 60%
– High efficiency– Fuel flexibility– Solid electrolyte– Suitable for CHP– Hybrid/ gas turbine cycle
– High temperature– Long start-up time – Limited number of
shutdownsKey hydrogen applications –Energy (fuel cells)3.3

91
Key features
Description
– Fuel cells are made of an anode and a cathode in an electrolyte solution.
– Fuel-cell reaction can be described as:H2 +
12
O2→ H2O + We + ΔQ
where We is electrical power and ΔQ heat generated– Fuel cells generate DC current. An AC/DC converter might
be needed depending on the end application.– As for electrolyzer, there are multiple categories of fuel
cells based on the electrolyte and electrodes used:– AFC is the oldest available technology, but efforts are
now focusing on PEMFC used in electric vehicles.– Microbial fuel cells are being developed, based on
bacteria metabolism.– Application types for fuel cells can be portable (consumer
electronics), mobile (vehicles), or stationary.
Fuel cell is a reverse electrolysis in which H2 is combinedwith O2 to produce electricity, heat,and water
Fact card: Fuel cell
Sources: Afhypac, Areva; Kearney Energy Transition Institute analysis
Overview of Technology
Efficiency (%) 55–60%Power (W/cm2) 0.3–0.4Lifecycle (hours) Up to 100,000Compacity (kW/kg) About 3Capex (€ per kWe) 500–1,000
Fuel cell principle
Main technologies
Type Anode and cathode Ions
AFC PT/Pt–Ag OH-
PEMFC Pt/Pt H+
PAFC PT/Pt H+
MCFC Ni/Ni–LiO CO32-
SOFCNi-YSZ/LaxSr1-xMnO3
O2-
PCFC Perovskite/Pr2NiO4
+ H+Expanded in following slides
H2 Market trends
Market maturity Depend on technologyMarket size(MW per year)
+1,000(about 75% for mobility)
Historical growth(CAGR 10–17) +33% in MWe
Competing technologies
– Electricity production sources
– Internal combustion engines
3.3 Key hydrogen applications –Energy (fuel cells)

92
Key features
Description
– Alkaline fuel cell (AFC) uses a solution of potassium hydroxide in water as the electrolyte and can use a variety of non-precious metals as a catalyst at the anode and cathode.
– Fuel cell reaction can be described as:2H2 + O2→ 2H2O
– The high performance of AFC is due to the rate at which electro-chemical reactions take place in the cell.– Closely related to polymer electrolyte membrane (PEM)
fuel cells, except they use an alkaline membrane instead of an acid membrane
– Suffers from the poisoning by CO2, which can be addressed through alkaline membrane fuel cells (AMFC)
– However, CO2 still affects performance, and performance and durability of the AMFCs still lag that of PEMFC.
– Key application areas: military, space, backup power, and transportation
Alkaline fuel cells were one of thefirst fuel cell technologies
Fact card: Alkaline fuel cell
Sources: US Department of Energy; “Introduction to Hydrogen Technology,” Introduction to Transfer Phenomena in PEM Fuel Cell, Bilal Abderezzak, 2018; Kearney Energy Transition Institute analysis
Overview of Technology
Efficiency (%) 60% Operating temperature (°C) Less than 100Typical stack size 1–100 kW
Common electrolyteAqueous potassium hydroxide soaked in a porous matrix or alkaline polymer membrane
Anode/Cathode PT / Pt-Ag
Alkaline fuel cell principle
Advantages
– Wider range of stable materials allows lower cost components
– Low temperature– Quick start-up
Disadvantages
– Sensitive to CO2in fuel and air
– Electrolyte management (aqueous)
– Electrolyte conductivity (polymer)3.3 Key hydrogen applications –
Energy (fuel cells)

93
Description
– Polymer electrolyte membrane (PEM) fuel cell uses solid polymer as an electrolyte and porous carbon electrodes containing a platinum or platinum alloy catalyst.
– Fuel cell reaction can be described as:H2 → 2H + + 2e −
– PEM fuel cells exhibit high efficiency and power density in vehicle engine size class.– Among different fuel cells, PEM fuel cell has been found
to be most suitable for automobiles end use.– Hybrid vehicle can be run by pairing PEMFC with
rechargeable batteries.– A variant that operates at elevated temperatures is known
as the high-temperature PEMFC (HT PEMFC) as electrolyte shifts to a mineral acid-based system from water-based.
– Key application areas: backup power, portable power, distributed generation, transportation, and specialty vehicles.
Polymer electrolyte membrane fuel cells deliver high power density and lower weight and volume
Fact card: Polymer electrolyte membranefuel cell
Sources: US Department of Energy; Kearney Energy Transition Institute analysis
Overview of Technology
Polymer electrolyte membrane fuel cell principle
Advantages
– Solid electrolyte reduces corrosion and electrolyte management issues
– Low temperature– Lower weight and
volume– Quick start-up and
load following
Disadvantages
– Expensive platinum catalyst that is sensitive to CO poisoning
– Requires cooling
Key features
Efficiency (%) 60% direct H2;40% reformed fuel
Operating temperature (°C) Less than 120Typical stack size Less than 1–100 kWCommon electrolyte Perfluoro sulfonic acid Anode/Cathode Pt / Pt3.3 Key hydrogen applications –
Energy (fuel cells)

94
Key features
Description
– Phosphoric acid fuel cells (PAFC) use liquid phosphoric acid as an electrolyte—the acid is contained in a Teflon-bonded silicon carbide matrix—and porous carbon electrodes containing a platinum catalyst.
– Fuel cell reaction can be described as:H2 +
12
O2→ H2O
– Typically used for stationary power generation, but some PAFCs have been used to power large vehicles:– More than 85% efficient when used for the co-
generation of electricity and heat but they are less efficient at generating electricity alone (37–42%)
– PAFCs are also less powerful than other fuel cells, given the same weight and volume.
– Key application areas: Distributed generation and heavy vehicle transport, such as public buses
Phosphoric acid fuel cell is one of the most maturecell types and the first to be used commercially
Fact card: Phosphoricacid fuel cell
Sources: US Department of Energy; Kearney Energy Transition Institute analysis
Overview of Technology
Efficiency (%) 40%Operating temperature (°C) 150–200Typical stack size 5–400 kW
Common electrolytePhosphoric acid soaked in a porous matrix or imbibed in a polymer membrane
Anode/Cathode Pt / Pt
Phosphoric Acid Fuel cell principle
Advantages
– Suitable for CHP– Increased tolerance
to fuel impurities
Disadvantages
– Expensive catalysts– Long start-up time– Sulfur sensitivity
2D model of PAFC
3.3 Key hydrogen applications –Energy (fuel cells)

95
Key features
Description
– Molten carbonate fuel cells (MCFC) use a molten carbonate salt suspended in a porous ceramic matrix as the electrolyte.
– Fuel cell reaction can be described as:H2 +
12
O2→ H2O
– When coupled with a turbine, MCFC can reach efficiencies approaching 65%.– Overall efficiencies can be more than 85% in CHP
or CCP applications where the process heat is also utilized.
– Unlike alkaline, phosphoric acid, and PEM fuel cells, MCFC do not require an external reformer to convert fuels such as natural gas and biogas to hydrogen.
– As they operate at high temperatures, non-precious metals can be used as catalysts reducing costs.
– Key application areas: electric utility and distributed generation
Molten carbonate fuel cells are being developed for natural gas and coal-based power plants for electrical utility applications
Fact card: Moltencarbonate fuel cell
Sources: US Department of Energy; Kearney Energy Transition Institute analysis
Overview of Technology
Efficiency (%) 50% Operating temperature (°C) 600–700Typical stack size 300 kW–3 MW
Common electrolyteMolten lithium, sodium, and/or potassium carbonates, soaked in a porous matrix
Anode/Cathode Ni / Ni – LiO
Molten carbonate fuel cell principle
Advantages
– High efficiency– Fuel flexibility– Suitable for CHP,
hybrid–gas turbine cycle
Disadvantages
– High temperature corrosion and breakdown of cell components
– Long start-up time– Low power density3.3 Key hydrogen applications –
Energy (fuel cells)

96
Description
– Solid oxide fuel cells (SOFC) use a hard, non-porous ceramic compound as the electrolyte.
– Fuel cell reaction can be described as:CO + O2 + H2 → H2O + CO2 + ΔE
– SOFCs are around 60% efficient at converting fuel to electricity.– In applications designed to capture and utilize the
system's waste heat (co-generation), overall efficiencies could be more than 85%.
– High-temperature operation removes the need for precious-metal catalyst reducing costs, but development of low-cost materials with high durability remains a challenge.
– SOFC are not poisoned by carbon monoxide, and this allows them to use natural gas, biogas, and gases made from coal.
– Key application areas: auxiliary power, electric utility, and distributed generation
Solid oxide fuel cells are the most sulfur-resistanttype of fuel cell
Fact card: Solid oxidefuel cell
Sources: US Department of Energy; Kearney Energy Transition Institute analysis
Overview of Technology
Advantages
– High efficiency– Fuel flexibility– Sulfur resistant– Suitable for CHP,
Hybrid/gas turbine cycle
Disadvantages
– High temperature corrosion and breakdown of cell components
– Long start-up time
Solid Oxide Fuel cell principle
Key features
Efficiency (%) 60% Operating temperature (°C) 500–1,000Typical stack size 1 kW–2 MWCommon electrolyte Yttria stabilized zirconiaAnode/Cathode Ni-YSZ / LaxSr1-xMnO3
3.3 Key hydrogen applications –Energy (fuel cells)

97
Present cost of automotive PEMFC system basis deployed commercial technology at current manufacturing rates (1,000 systems per year) = $210 kWnet
Fuel cell researchis focused on achieving higher efficiency, increased durability, and reduced costs
Technical targets and system cost reduction projections for 80 kWe (net) integrated transportation fuel cell power systems operating on direct hydrogen1, 2
1 Polymer electrolyte membrane (PEM) fuel cell-based systems2 8,000 hours (equivalent to 150,000 miles of driving) with less than 10% loss of performanceSources: US Department of Energy Fuel Cell Technologies Office; Kearney Energy Transition Institute analysis
2015 2020 Final stagePeak energy efficiency (%) 60 65 70Power density (W/L) 640 650 850Specific power (W/kg) 659 650 650Durability (hours) 3,900 5,000 8,0002
140
54 53 52 53 44 45
4030
25
11 10 7 7
2016….2006 Final stage
2014
60
2013 2015
549
2017
5
2018 ….. 2025 ….
165
65 63 5950
-5%
-82%
-3%
100,000 systems per year500,000 systems per year
3.3 Key hydrogen applications –Energy (fuel cells)

98
Fuel cell R&D funding1
(Total $ million,% breakup)
Reducing costs and improving durability while maintaining performance continues to bea key challenge
Catalyst developments are crucial to future fuel cell technology
1 US Department of Energy Fuel Cell R&D subprogram budgetSources: US Department of Energy Fuel Cell Technologies Office; Kearney Energy Transition Institute analysis
Non-Exhaustive
19%
23%
3%
12%
44%
2018
32
Catalyst and electrodesPerformance and durabilityTesting and technical assessmentMembrane and electrolytesMembrane electrode assembly,cells, and stack components
Key improvement levers
Areas improved Benefits and challenges
Catalyst
For platinum group metal (PGM) based catalysts, both a reduction in PGM loading and an increase in membrane electrode assembly (MEA) areal power density are required to reduce material costs.
Current state-of-the-art MEAs with very low cathode PGM loadings experience a higher-than-expected reduction in performance when operating at high power.
Improving high-current density performance at low PGM loadings (≤0.125 mgPGM/cm2)
State-of-the-art electrode structures are hindered by severe mass-transport limitations during high-power operation, in part because of transport resistance induced by the ionomer, particularly as the PGM loading decreases.
Development of low PGM catalysts such as accessible porous carbon-supported PtCo catalysts, ultrathin-film catalysts (to stabilize Pt)
Initial results show PtCo/HSC-f catalyst matches or surpasses the performance of a catalyst used in commercial FCEVs despite having less than one-fifth the platinum loading.
Intermediate-Temperature Membranes
Potential benefits of favorable kinetics and decreased sensitivity to fuel impurities, such as CO, also reduce PGM catalyst usage.
Higher efficiency as a result of the production of useful waste heat and/or the elimination of balance-of-plant components
Reversible fuel cells (RFC)
RFC provides easily dispatchable power and is sufficiently flexible to address grid and microgrid reliability and resiliency.
Viability and cost competitiveness of RFC technology require continued improvements to target round-trip efficiency and capital cost targets.
3.3 Key hydrogen applications –Energy (fuel cells)

99
Key featuresH2 Market trends
Description
– Fuel-cell electric bikes use stored compressed hydrogen gas cylinders as a fuel source to generate electricity via an energy converter (fuel cell) to power an electric motor but still needs human muscular energy to be in motion. Hydrogen cylinders can be purchased from refueling stations and other retail outlets.
– Benefits:– Lower battery size, superior operability at low
temperatures, longer range, and shorter refueling time compared with battery-powered bikes
– No emissions of pollutants and greenhouse gases– Prospective customers: private consumers, bike-
sharing operators and rental providers, tourism players, last-mile delivery specialists, corporate staff mobility, and municipalities
Bikes powered by fuel cells offer an easy mobility option for intra-city travel
Fact card: Hydrogen bike
Source: Kearney Energy Transition Institute analysis
Market maturity Advanced prototype/demonstration
Market size (numberof units) More than 200 in France
Future growthMultiple orders of hundreds of bikes expected in European cities
Competing technologies Electric bikes
Power output (kw) 0.1–0.25Fuel consumption(Kg H2/100 km) .035
Range (km) 100–150Capex/acquisition cost ($) 5,000–7,500Lifetime (years) 5
H2cylinders
Fuel cell
Key hydrogen applications –Energy (mobility)3.2

100
Key featuresH2 Market trends
Overview of technologiesDescription
– H2 is stored in compressed tanks and then converted into electricity through a PEMFC, powering an electrical motor.
– Refueling of a compressed H2 tank is performed in dedicated stations.
– The latest research focuses on metal hydrides, where H2 is stored as a powder in 2 cans, which facilitate refueling as no H2-dedicated infrastructure is needed.– H2 can could be bought in petrol stations and
supermarkets.– Metal hydrides are easy to refuel and can operate at low
temperature but are more expensive.– H2 scooters offer multiple benefits, such as no pollutant
emissions, lower noise, and operability at low temperatures.– Potential users include private consumers, company and
public entity fleets, or vehicle sharing companies.– Large-scale deployment will require refueling infrastructure
and compliance with local regulations.
Scooters and bikes powered by fuel cells offer emission-free and low-noise mobility options for intra-city travel
Fact card: Hydrogen scooter
Sources: The Fuel Cells and Hydrogen Joint Undertaking (FCH JU); Kearney Energy Transition Institute analysis
Market maturity Deployment
Market size(number of vehicles)
More than 100, demonstration projects in Europe (such as the ZERE project in the United Kingdom)
Expected growth(CAGR 19–XX)
Public services to lead the demand due to high price premiums
Competing technologiesPetrol and diesel, battery EV, compressed natural gas (CNG)
Fuel consumption (gH2/km) 0.3–0.8/2 cans for200 km
Range (km/tank) 120–200, up to 350Lifetime (years) 5Capex/acquisition cost ($) 3,400–13,000Output (kW) 3–4 kW
Compressed H2 tank Hydrogen can
Hydrogen is stored in powder in a 2.5 L can
3.2 Key hydrogen applications –Energy (mobility)

101
Key featuresH2 Market trends
Overview of technologiesDescription
– Forklifts use gaseous hydrogen compressed in a 350 bars tank.
– Hydrogen is then converted into electricity through a fuel cell– electric engine system.
– Potential users include logistics companies, warehouses, and other industrial plants.– A hydrogen forklift does not release toxic gases during
operations, which makes it a candidate for indoor operations.
– Tanks are recharged every eight hours. Quick refueling time (less than three minutes) allows operation continuity for industrial users.– Performances are maintained even when the tank is half
depleted.– The operating perimeter is relatively limited. Single
refueling stations with multiple plants can be enough to supply hydrogen.
Fork lifts powered by fuel cells are already in use since they don’t need capex-intensive infrastructure for recharging
Fact card: Hydrogen forklift
Sources: Toyota; BallardThe Fuel Cells and Hydrogen Joint Undertaking (FCH JU); “The Future of Hydrogen,” International Energy Agency, June 2019; Kearney Energy Transition Institute
Market maturity CommercializationMarket size(number of vehicles) 25,000
Expected growth (CAGR 19–XX) n.a.
Competing technologiesPetrol and diesel, battery EV, compressed natural gas (CNG)
Fuel consumption(kgH2 per hour) 0.15
Range (km per tank) 8
Capex/acquisition cost ($) $14,000–$30,000 (fuel cell system)
Output (kW) 2.5–4.5Fuel consumption (kgH2 per hour) 0.153.2 Key hydrogen applications –
Energy (mobility)

102
Key featuresH2 Market trends
Overview of technologiesDescription
– As with scooters, H2 is stored in compressed tanks (700 bars) and then converted into electricity through a PEM fuel cell, powering an electrical motor and refueled in dedicated stations.
– A rechargeable (Li–ion or lead–acid) battery is added to provide additional power for the engine—mainly for regenerative braking and acceleration (1.6–9 kWh capacity).
– H2 stored in metal hydride cans is also under development (a car requiring about nine cans), which could offset a low number of refueling stations.
– H2 cars offer multiple benefits, such as no pollutant emissions, lower noise, and operability at low temperatures.
– Potential users include private consumers, company and public entity fleets, or vehicle-sharing companies.
– Large-scale deployment will require refueling infrastructure and compliance with local regulations, especially on tank safety.
Fuel-cell hydrogen cars are commercially available as an alternative to diesel-based internal combustion engine cars
Fact card: Hydrogen car
Sources: “The Future of Hydrogen,” International Energy Agency, June 2019; Kearney Energy Transition Institute
Market maturity CommercializationMarket size(number of vehicles) 11,200
Expected growth(CAGR 2025f) 18% (+56% 17–18)
Competing technologiesPetrol and diesel, petrol and diesel–electric hybrid, battery powered cars
Fuel consumption (kgH2/100km) 0.8–1.0Range (km per tank) 500–700Lifetime (years) 5Capex/acquisition cost ($) 56,000–86,000Output (kW) 70–130 kW
Preliminary
3.2 Key hydrogen applications –Energy (mobility)
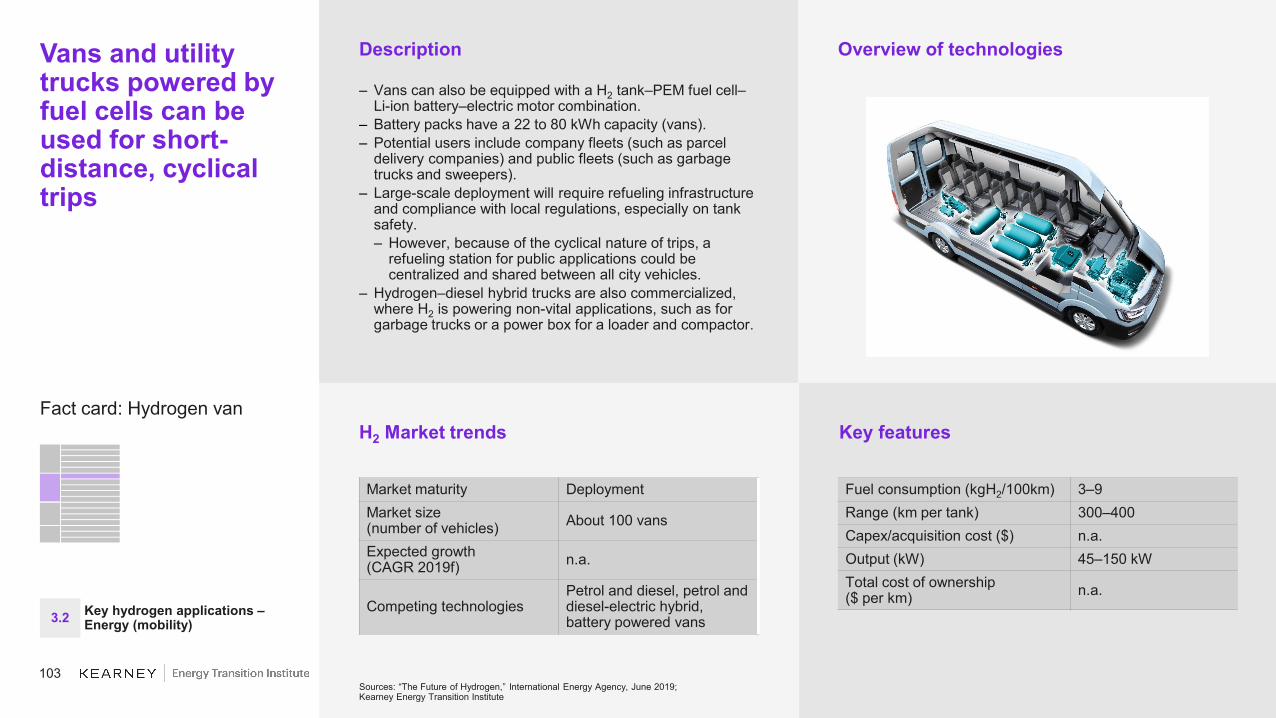
103
Key features
Overview of technologiesDescription
– Vans can also be equipped with a H2 tank–PEM fuel cell–Li-ion battery–electric motor combination.
– Battery packs have a 22 to 80 kWh capacity (vans).– Potential users include company fleets (such as parcel
delivery companies) and public fleets (such as garbage trucks and sweepers).
– Large-scale deployment will require refueling infrastructure and compliance with local regulations, especially on tank safety.– However, because of the cyclical nature of trips, a
refueling station for public applications could be centralized and shared between all city vehicles.
– Hydrogen–diesel hybrid trucks are also commercialized, where H2 is powering non-vital applications, such as for garbage trucks or a power box for a loader and compactor.
Vans and utility trucks powered by fuel cells can be used for short-distance, cyclical trips
Fact card: Hydrogen van
Sources: “The Future of Hydrogen,” International Energy Agency, June 2019; Kearney Energy Transition Institute
Market maturity DeploymentMarket size(number of vehicles) About 100 vans
Expected growth(CAGR 2019f) n.a.
Competing technologiesPetrol and diesel, petrol and diesel-electric hybrid, battery powered vans
Fuel consumption (kgH2/100km) 3–9Range (km per tank) 300–400Capex/acquisition cost ($) n.a.Output (kW) 45–150 kWTotal cost of ownership($ per km) n.a.
H2 Market trends
3.2 Key hydrogen applications –Energy (mobility)

104
Key features
Overview of technologiesDescription
– Fuel-cell electric buses, including hybrids with range extenders, use compressed hydrogen gas as a fuel to generate electricity via the fuel cell.
– Benefits:– No emissions of pollutants and greenhouse gases– Lower noise pollution– Potential to be more cost effective than electric biofuels
or diesel based variants– Prospective customers: public transport authorities, bus
service operators, airports (minibuses), hotels, and resorts
Hydrogen buses powered by fuel cells are a zero-emission alternative to diesel buses
Fact card: Hydrogen buses
Source: Kearney Energy Transition Institute analysis
Market maturity DeploymentMarket size(number of vehicles) More than 500
Future growthSeveral thousand buses expected in China, Japan, and South Korea
Competing technologiesElectric, diesel, diesel-electric hybrid, biofuels, CNG
Fuel consumption (Kg H2/100km) 8–14Range (km per tank) 250–450Power output (kW) 100CAPEX/Acquisition cost ($) 680,000Total cost of ownership($ per km) 4
H2 Market trends
3.2 Key hydrogen applications –Energy (mobility)

105
Key features
Overview of technologiesDescription
– Buses and trucks can be equipped with a H2 tank–PEM fuel cell–Li-ion battery–electric motor combination.
– The Li-ion battery can be used to regenerate energy from braking or can be recharged with plug-in solutions to deliver power during acceleration phases or to extend range.
– Hydrogen tank has a capacity of about 150 kgH2, makingit lighter than the battery part from a BEV truck.
Hydrogen trucks and buses powered by fuel cells are expected to gain market share, mainly in China
Fact card: Hydrogen truck
Sources: The Fuel Cells and Hydrogen Joint Undertaking (FCH JU); “The Future of Hydrogen,” International Energy Agency, June 2019; Kearney Energy Transition Institute
Market maturity DeploymentMarket size(number of vehicles) About 400 trucks
Expected growth(CAGR 2019f)
Several thousand trucks expected in China
Competing technologiesDiesel, diesel-electric hybrid, battery-powered trucks
Fuel consumption (kgH2/100km) 7.5–16Range (km per tank) 1,200Fuel cell efficiency 55%Output (kW) 250–750 kW (trucks) Capex/acquisition cost ($) 350,000Total cost of ownership($ per km) 0.95–1.75
H2 Market trends
3.2 Key hydrogen applications –Energy (mobility)

106
Key features
Overview of technologiesDescription
– Fuel-cell ships, boats, and ferries use stored compressed hydrogen gas as a fuel source to generate electricity via an energy converter (fuel cell) to power an electric motor.
– This is a viable low-carbon fuel for smaller marine vessels. For larger vessel, fuel cells can supplement the main power.
– Hydrogen can also be converted in synthetic fuels through methanol.
– Existing infrastructure in industrial ports (such as SMR providing hydrogen to nearby factories) can be leveraged.
– Benefits:– Depending on the crude prices and clean fuel
regulations, potentially lower total cost of ownership in the future
– No emissions of pollutants and greenhouse gases– Lower noise pollution and beneficial to marine wildlife
Hydrogen can be the main power source for small boats or supply electricity to on-board applications
Fact card: Marine applications
Source: Kearney Energy Transition Institute analysis
Market maturity Concept or early prototype
Market size(number of units)
Demonstration projects under way in the European Union
Future growth Medium-term commercialization unlikely
Competing technologiesHydrocarbon fuels, diesel-electric hybrid, battery electric
Power output (kw) 12–2,500 (ferries)Fuel consumption (Kg H2/nm) 3.4 (ferries)
Range (km, hours) 50–90, 8–12(smaller boats)
Capex/acquisition cost ($) 12–16.5 million (ferries)
Lifetime (years) 25
H2 Market trends
Water output (re-used on board)
Atmospheric air from exterior
Hydrogen from fuel tanks tofuel cells
Excess warm vapor output
Hydrogen and airreact toform electricity
3.2 Key hydrogen applications –Energy (mobility)
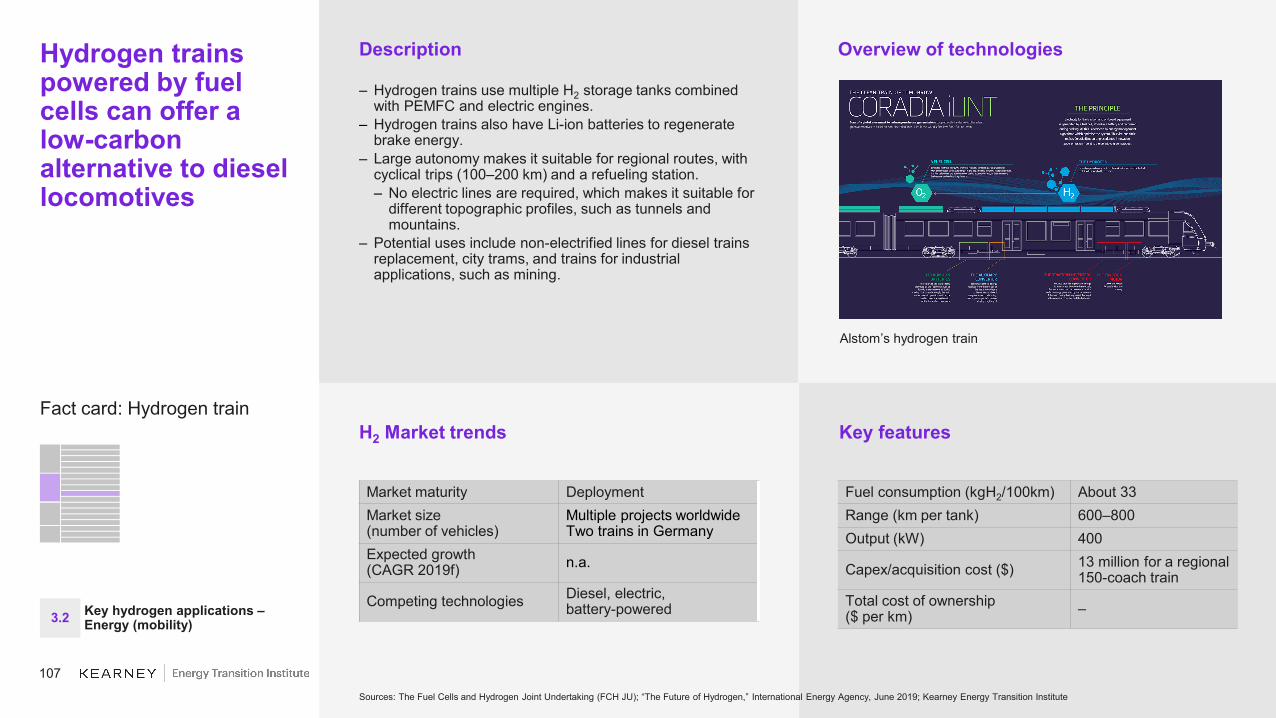
107
Key features
Overview of technologiesDescription
– Hydrogen trains use multiple H2 storage tanks combined with PEMFC and electric engines.
– Hydrogen trains also have Li-ion batteries to regenerate brake energy.
– Large autonomy makes it suitable for regional routes, with cyclical trips (100–200 km) and a refueling station.– No electric lines are required, which makes it suitable for
different topographic profiles, such as tunnels and mountains.
– Potential uses include non-electrified lines for diesel trains replacement, city trams, and trains for industrial applications, such as mining.
Hydrogen trains powered by fuel cells can offer a low-carbon alternative to diesel locomotives
Fact card: Hydrogen train
Sources: The Fuel Cells and Hydrogen Joint Undertaking (FCH JU); “The Future of Hydrogen,” International Energy Agency, June 2019; Kearney Energy Transition Institute
Market maturity DeploymentMarket size(number of vehicles)
Multiple projects worldwideTwo trains in Germany
Expected growth(CAGR 2019f) n.a.
Competing technologies Diesel, electric,battery-powered
Fuel consumption (kgH2/100km) About 33Range (km per tank) 600–800Output (kW) 400
Capex/acquisition cost ($) 13 million for a regional 150-coach train
Total cost of ownership($ per km) –
H2 Market trends
Alstom’s hydrogen train
3.2 Key hydrogen applications –Energy (mobility)

108
Key features
Overview of technologiesDescription
– Small aircraft powered by fuel cells can use stored compressed hydrogen gas to generate electricity via an energy converter (fuel cell) to power an electric motor. The focus is on using it as a propeller powertrain for smaller aircraft or as an auxiliary power unit (APU) on large conventional aircraft.
– Pure hydrogen or hydrogen-based liquid fuels also offer alternative pathways, subject to further R&D.
– Benefits:– Reduced costs as a result of lower OPEX (engine) and
increased efficiency– No emissions of pollutants and greenhouse gases– Prospective customers: airlines, national and local
governments, airport operators, and private fleets
Hydrogen aircrafts powered by fuel cells could offer a solution to reduce aviation-based emissions
Fact card: Aviation
Source: Kearney Energy Transition Institute analysis.
Market maturity Concept or early prototype
Market size(number of units)
Limited to demonstration projects for small aircrafts, such as HY4
Future growthShort-range non-essential uses, unmanned missions, and drones
Competing technologies Petroleum-based aviation fuel, battery powered
Power output (kw) 80 (based onHY4 project)
Fuel consumption (Kg H2)170 (based onHY4 project)
Range (km) 750–1,500 (basedon HY4 project)
Capex/acquisition cost ($) n.a.Lifetime (years) n.a.
H2 Market trends
3.2 Key hydrogen applications –Energy (mobility)

109
Overview of technologiesDescription
– Hydrogen-based fuel ammonia can be co-fired in coal-fired power plants to reduce coal usage and plant carbon emissions.– IHI Corporation successfully co-fired a ammonia–coal
mix with 20% ammonia in a 10 MW furnace (% of energy content).
– The previous test conducted by Chugoku Electric in a 150 MW furnace reached a 0.8% (% of energy content).
– Boiler’s energy conversion efficiency is maintained.– Ammonia feeding pipe design allows to control NOx
emissions, which are similar to regular coal plant.– In small furnaces (less than 10 MWth), reaching 20% of
ammonia in the combustion zone does not pose any particular problems, and no slippage of ammonia into exhaust gas was detected.
– Technology can be retrofitted into existing coal-fired boilers.
– The economics of projects will depend on availability of low-cost ammonia.
Co-firing ammonia in coal-power plants could reduce carbon emissions at low cost; special attention needs to be given to NOx emissions
Fact card: Ammonia co-firing in coal power plants
Sources: “The Future of Hydrogen,” International Energy Agency, June 2019; IHICorporation; Chugoku Electric; Kearney Energy Transition Institute analysis
Market maturity Early stageMarket size(2019, GW, coal-fired) 2,100
Expected market size(2030, GW, coal-fired)
1,650 (including combined heat and power)
Competing technologies CCS, decarbonized sources
H2 Market trends Key features
Ammonia marginal consumption(kgNH3/%ammonia/MW per y) 26,800
Hydrogen marginal consumption(kgH2/%ammonia/MW per year) 4,800
Mizushima coal plant, operated by Chugoku Electric
3.3 Key hydrogen applications –Energy (power generation)

110
Key features
Overview of technologiesDescription
– Hydrogen can be used as a fuel in existing gas turbines and CCGTs, which can handle a 3 to 5% share of hydrogen, up to 30% for some turbines.
– Ammonia can also be used as a fuel in gas turbine. However, NOx emissions and flam stability needs to be controlled.
– Fuel cells have efficiencies close to CCGTs but suffer from a shorter lifetime than turbines and have smaller output (less than 50MW).
– It offers low-carbon flexibility on power system, can be coupled with intermittent renewable sources, and can generate power during peak hours.– Competitiveness is to be assessed against other low-
carbon technologies, such as gas turbines with CCS and biomass gas turbines.
Flexible power generation is the use of hydrogen to produce electricity on demand and operating at low load factors
Fact card: Flexible power
1 Hypothesis: CO2 price of $100 per ton; natural gas price of $7 per mmbtu; biomass gas price of $14 per mmbtu.Sources: BloombergNEF; “The Future of Hydrogen,” International Energy Agency, June 2019; Kearney Energy Transition Institute analysis
Market maturity Early stageMarket size(GW of VRE) n.a.
Expected market size(2050, GW of VRE) n.a.
Competing technologies Batteries, biomass turbines, gas + CCUS turbines
H2 Market trends
BHGE NovaLT gas turbine reconfigured for 100% hydrogen
Competitive price for H2 vs.gas turbine ($ per kgH2)
15% load factor: 1.5
Competitive price for H2 vs.gas turbine + CCUS1
($ per kgH2)15% load factor: 2.5
Competitive price for H2 vs. biomass turbine ($ kgH2)
15% load factor: 4
3.3 Key hydrogen applications –Energy (power generation)

111
Key features
Overview of technologiesDescription
– Blending low shares of H2 in most gas networks would have little impact for the end-use applications, such as boilers and cookstoves.
– Blending H2 into the current gas network allows clean energy to be distributed while saving capex for a new H2network.
– Multiple challenges still need to be addressed:– Lower energy density in a gaseous form, leading to a
reduction in transported energy through the pipeline– Increasing risk of flames spreading as a result of high
flame velocity– Variability in hydrogen volumes, negatively impacting
end equipment designed to operate in certain conditions– Many industrial gas applications have a low upper limit of
H2 blend in natural gas, which will set the upper limit for the whole network.
– Current regulations allow a H2 blend limit up to 6% (for example, in France).
H2 can be blended with CH4 before being injected on the gas grid
Fact card: Hydrogen blending
Sources: “The Future of Hydrogen,” International Energy Agency, June 2019; UsineNouvelle; Kearney Energy Transition Institute analysis
Market maturity DevelopmentNatural gas demand(bcm per year) 3.900
Expected market size(2030, MtH2 per year) 2 – 4
Competing technologiesNatural, gas, Methanation, H2, fuel cells and cogeneration, Biogas
H2 tolerance in gas networks (min/max, % vol)
Compressors:about 10%Distribution: 50–100%
H2 tolerance for end-applications (min/max, % vol)
Gas turbines: 5%Boilers: 30%
H2 Market trends
GRHYD project in Dunkirk
3.3 Key hydrogen applications –Energy (gas energy)

112
Key features
Overview of technologiesDescription
– Methanation is a exothermic catalytic process operating at 320–430°C to produce synthetic CH4 through Sabatier reaction:
CO2 + 4H2→ 2 H2O + CH4 ΔH = −165 MJ/kmol– Reaction can be split in two steps:
CO + 3H2→ H2O + CH4 ΔH = −206 MJ/kmolCO2 + H2→ H2O + CO ΔH = 41 MJ/kmol
– Higher saturated hydrocarbons and solid carbon deposits can be found in the products.
– The main advantage of methanation is its use of fatal CO and CO2:– If coupled with low carbon H2 and CO2 inputs, there is a
potential for full decarbonisation of gas.– Synthetic CH4 may be injected on the gas network for
residential and industrial applications (gas heating, electricity generation), stored or as a fuel for NGV.
H2 can be converted into natural gas to be injected or directly combusted onsite for power generation
Fact card: Hydrogen methanation
1 Considering H2 through electrolysis coupled with PV plant and CO2 sources from exhaust gas of cement factorySources: Afhypac, Frontiers, GRTgaz; Kearney Energy Transition Institute analysis
Market maturity Development
Market sizen.a.(Germany: ~2.5 kTCH4per year)
Expected market size(2030) n.a.
Competing technologiesNatural, gas, blending, H2, fuel cells and cogeneration, biogas
H2 consumption (kgH2/kgCH4) 0.5CAPEX/Acquisition cost($ per kW)
210–445 for methanation plant only
Energy efficiency (%) 83%Marginal cost ($ per kWh) 0.10–0.451
H2 Market trends
Methanation plant in Falkenhagen
3.3 Key hydrogen applications –Energy (gas energy)
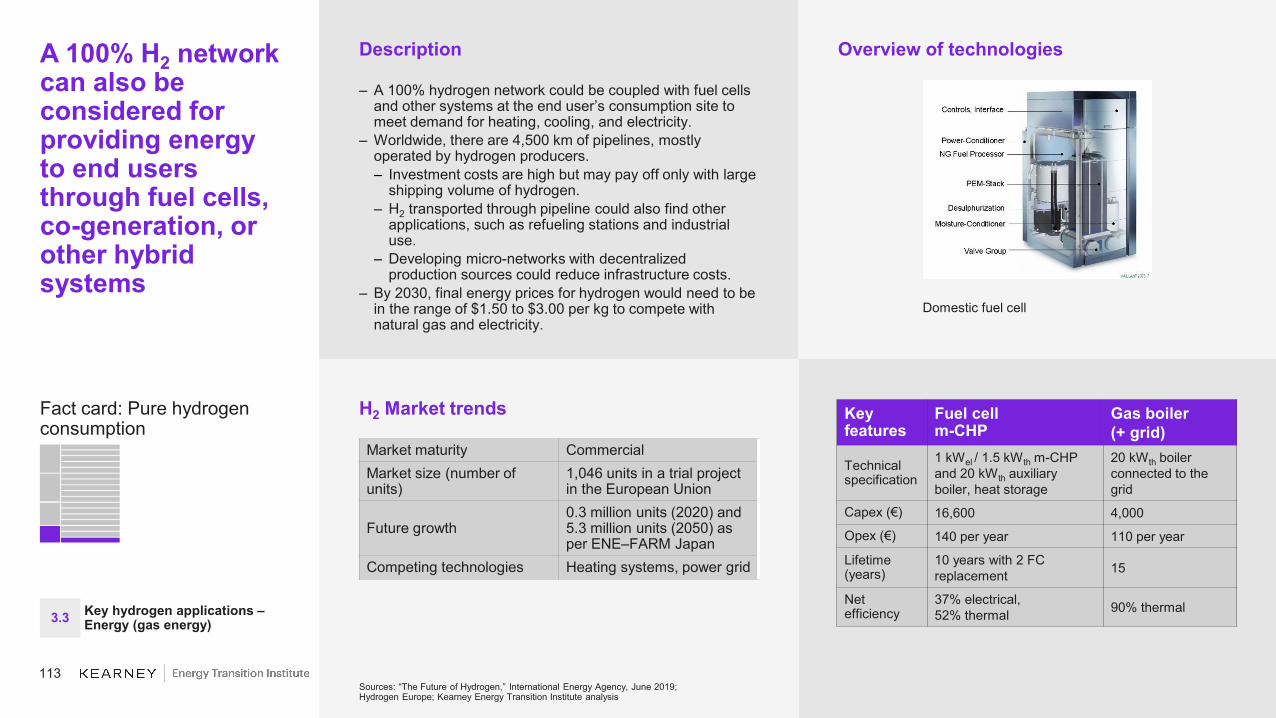
113
Overview of technologiesDescription
– A 100% hydrogen network could be coupled with fuel cells and other systems at the end user’s consumption site to meet demand for heating, cooling, and electricity.
– Worldwide, there are 4,500 km of pipelines, mostly operated by hydrogen producers.– Investment costs are high but may pay off only with large
shipping volume of hydrogen.– H2 transported through pipeline could also find other
applications, such as refueling stations and industrial use.
– Developing micro-networks with decentralized production sources could reduce infrastructure costs.
– By 2030, final energy prices for hydrogen would need to be in the range of $1.50 to $3.00 per kg to compete with natural gas and electricity.
A 100% H2 network can also be considered for providing energyto end users through fuel cells, co-generation, or other hybrid systems
Fact card: Pure hydrogen consumption
Sources: “The Future of Hydrogen,” International Energy Agency, June 2019; Hydrogen Europe; Kearney Energy Transition Institute analysis
Market maturity CommercialMarket size (number of units)
1,046 units in a trial project in the European Union
Future growth0.3 million units (2020) and 5.3 million units (2050) as per ENE–FARM Japan
Competing technologies Heating systems, power grid
H2 Market trends
Domestic fuel cell
Key features
Fuel cellm-CHP
Gas boiler(+ grid)
Technical specification
1 kWel / 1.5 kWth m-CHP and 20 kWth auxiliary boiler, heat storage
20 kWth boiler connected to the grid
Capex (€) 16,600 4,000
Opex (€) 140 per year 110 per year
Lifetime (years)
10 years with 2 FC replacement 15
Net efficiency
37% electrical,52% thermal 90% thermal
3.3 Key hydrogen applications –Energy (gas energy)

114
Hydrogen’s role in the energy transition

115
Some orders of magnitude in 2019 5
Executive summary 6
1. Hydrogen’s role in the energy transition 16
2. Hydrogen value chain: upstream and midstream 252.1 Production technologies 272.2 Conversion, storage, and transportation technologies 492.3 Maturity and costs 61
3. Key hydrogen applications 783.1 Overview 803.2 Feedstock 843.3 Energy 90
3. Business models 1144.1 Policies and competition landscape 1164.2 Business cases 125
Appendix (Bibliography & Acronyms) 187
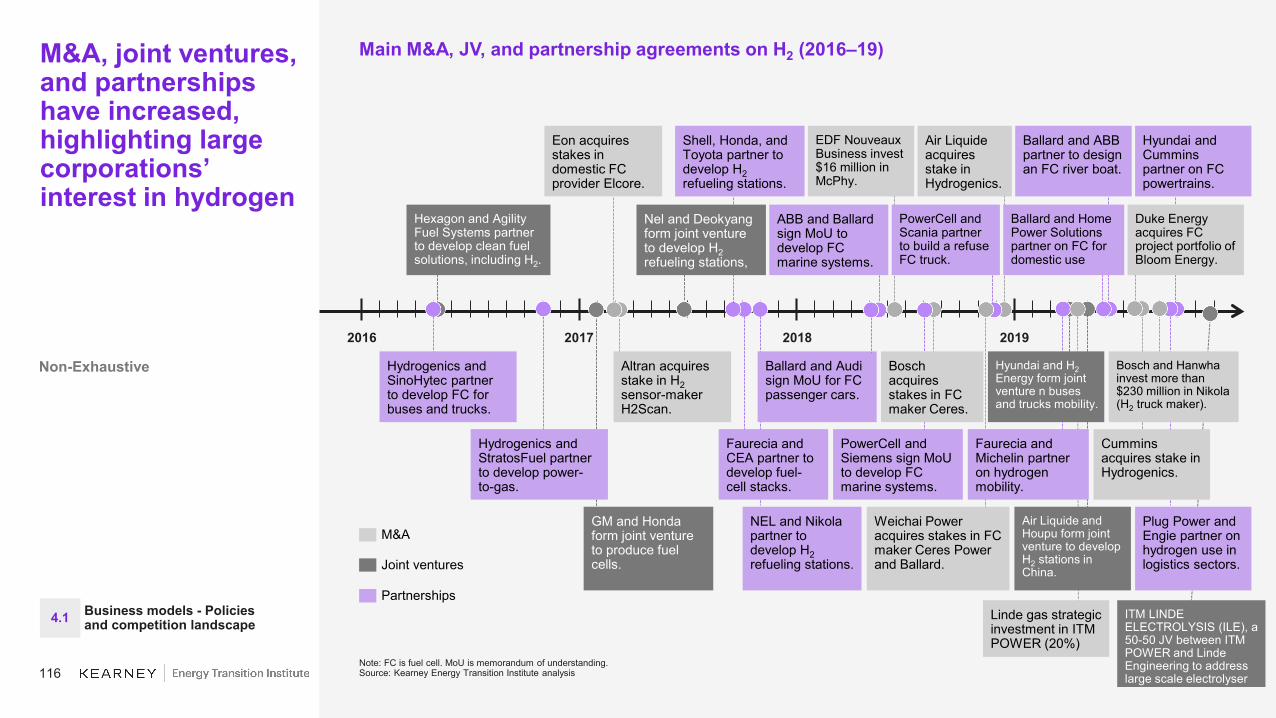
116
GM and Honda form joint venture to produce fuel cells.
M&A, joint ventures, and partnerships have increased, highlighting large corporations’ interest in hydrogen
Main M&A, JV, and partnership agreements on H2 (2016–19)
Non-Exhaustive
Note: FC is fuel cell. MoU is memorandum of understanding.Source: Kearney Energy Transition Institute analysis
2019201820172016
Hexagon and Agility Fuel Systems partner to develop clean fuel solutions, including H2.
Hydrogenics and SinoHytec partnerto develop FC for buses and trucks.
Hydrogenics and StratosFuel partner to develop power-to-gas.
Altran acquires stake in H2sensor-maker H2Scan.
Eon acquires stakes in domestic FC provider Elcore.
NEL and Nikola partner to develop H2refueling stations.
Faurecia and CEA partner to develop fuel-cell stacks.
Shell, Honda, and Toyota partner to develop H2refueling stations.
Nel and Deokyang form joint venture to develop H2refueling stations,
Air Liquide acquires stake in Hydrogenics.
Weichai Power acquires stakes in FC maker Ceres Power and Ballard.
PowerCell and Siemens sign MoU to develop FC marine systems.
Bosch acquires stakes in FC maker Ceres.
PowerCell and Scania partner to build a refuse FC truck.
EDF Nouveaux Business invest $16 million in McPhy.
ABB and Ballard sign MoU to develop FC marine systems.
Ballard and Audi sign MoU for FC passenger cars.
Hyundai and Cummins partner on FC powertrains.
Plug Power and Engie partner on hydrogen use in logistics sectors.
Bosch and Hanwha invest more than $230 million in Nikola (H2 truck maker).
Ballard and ABB partner to design an FC river boat.
Duke Energy acquires FC project portfolio of Bloom Energy.
Cummins acquires stake in Hydrogenics.
Air Liquide and Houpu form joint venture to develop H2 stations in China.
Hyundai and H2Energy form joint venture n busesand trucks mobility.
Ballard and Home Power Solutions partner on FC for domestic use
Faurecia and Michelin partner on hydrogen mobility.
Joint ventures
Partnerships
M&A
4.1 Business models - Policies and competition landscape
ITM LINDE ELECTROLYSIS (ILE), a 50-50 JV between ITM POWER and Linde Engineering to address large scale electrolyser
Linde gas strategic investment in ITM POWER (20%)

117
Hydrogen Council vision: The hydrogen economy in 2050
Steering members
– Established at the World Economic Forum 2017 in Davos – Global initiative of leading energy, transport, and industry companies to:
– Accelerate investments in the development and commercialization of hydrogen and fuel cell-related topics
– Encourage key stakeholders to back hydrogen as part of the future energy mix with appropriate policies and support schemes
– Investment plan of $1.9 billion over five years, mainly for market introduction, deployment, and R&D
Launched in 2017, the Hydrogen Council regroups companies from various industries in North America, Asia, and Europe
Hydrogen Council overview
Hydrogen demand targetsTransportation– 400 million passengers vehicle,
5 million trucks, and 15 million buses– 20% of diesel trains replaced by
hydrogen trains
Industry and building heat– 12% of global energy demand, mainly
in steel, chemicals, and cement– 10% of crude steel production, 20%
of methanol and ethanol derivatives recycling CO2 and decarbonized existing feedstock
– 8% of global energy demand
Power generation– 500 TWh of excess power converted to
about 10 MTH2 of hydrogen– About 126 MTH2 stored in strategic
reserves
Expected outcome– 18% of final energy demand– 6 GT year of CO2 abatement
(20% of the required CO2abatement), mainly from transportation thanks to 20 million barrels of oil replaced
– Market size of $2,500 billion, including hydrogen and fuel-cell equipment
– 30 million jobs created
– Airbus– Air Liquide– Air Products– Alstom– AngloAmerican– Audi– BMW Group– Bosch– BP– CHN Energy– Cummins– Daimler– EDF– Engie– Equinor– Faurecia– GM– Great Wall
Motors
– Honda– Hyundai– Iwatani
Corporation– Johnson Matthey– JXTG Nippon Oil
and Energy Corp.– Kawasaki– Kogas– Linde– Plastic Omnium– Shell– Sinopec– Thyssenkrupp– Total– Toyota– Weichai Power– 3M
Supporting members
– AFC Energy– AVL– Ballard– Faber cylinders– W. L. Gore– Hexagon– Hydrogenics– Itochu Corp– Liebherr– Marubeni– McPhy– Mitsubishi
Heavyindustries
– Nel ASA– NGK NTK– Plug Power– Power Assets
Holdings– Re-fire
Technology– SinoHytec– SoCalGas– Sumitomo – Toyota Tsusho– True Zero– Vopak
Sources: Hydrogen Council; Kearney Energy Transition Institute analysis
4.1 Business models - Policies and competition landscape

118
Multiple countries have launched supportive initiatives to accelerate hydrogen deployment, mainly in transportation …
Hydrogen support initiatives(number of countries)
Note: FCEV is fuel cell electric vehicle.Sources: International Energy Agency; Kearney Energy Transition Institute analysis
15
10 10
6
5
2 2 2
FCEV passenger
cars
Refueling stations
FCEV buses Electrolyzers Power generation
FCEV trucks Building heat and power
Industrial use
Power generationIndustrial use
Transportation
Gas energyElectrolyzers
4.1 Business models - Policies and competition landscape
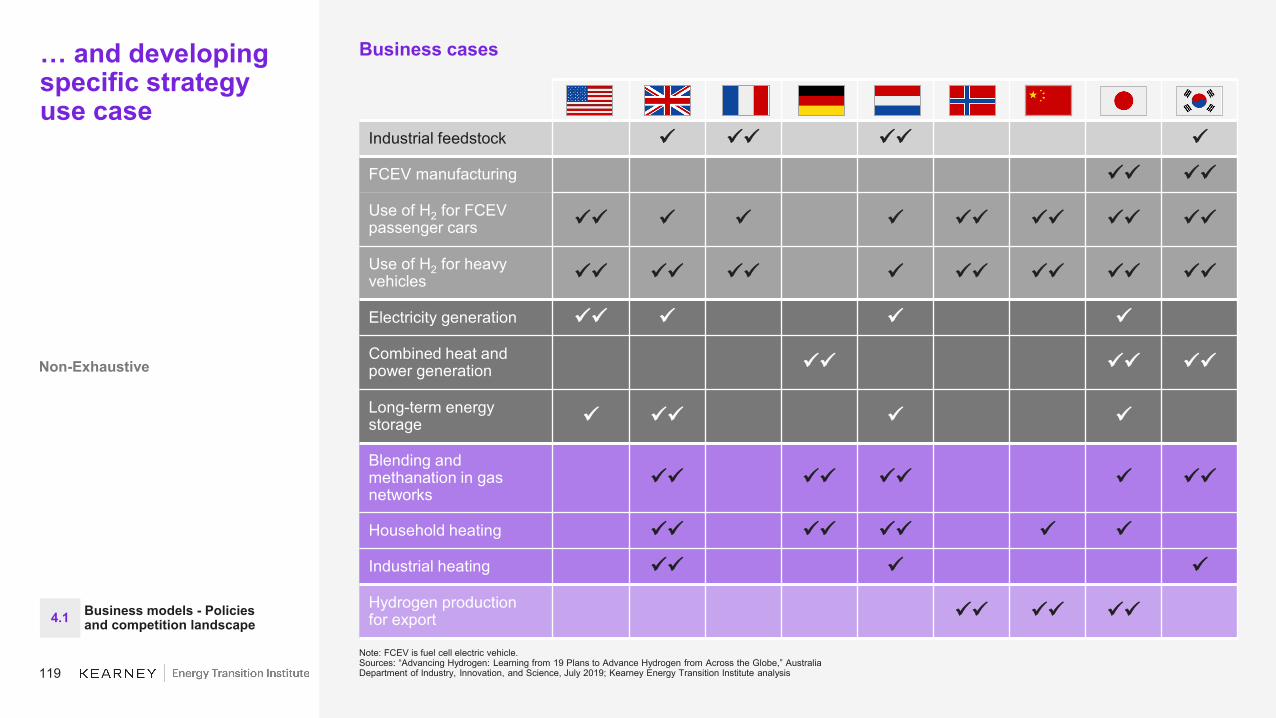
119
… and developing specific strategy use case
Business cases
Note: FCEV is fuel cell electric vehicle.Sources: “Advancing Hydrogen: Learning from 19 Plans to Advance Hydrogen from Across the Globe,” Australia Department of Industry, Innovation, and Science, July 2019; Kearney Energy Transition Institute analysis
Non-Exhaustive
Industrial feedstock
FCEV manufacturing
Use of H2 for FCEV passenger cars
Use of H2 for heavy vehicles
Electricity generation
Combined heat and power generation
Long-term energy storage
Blending and methanation in gas networks
Household heating
Industrial heating
Hydrogen productionfor export 4.1 Business models - Policies
and competition landscape
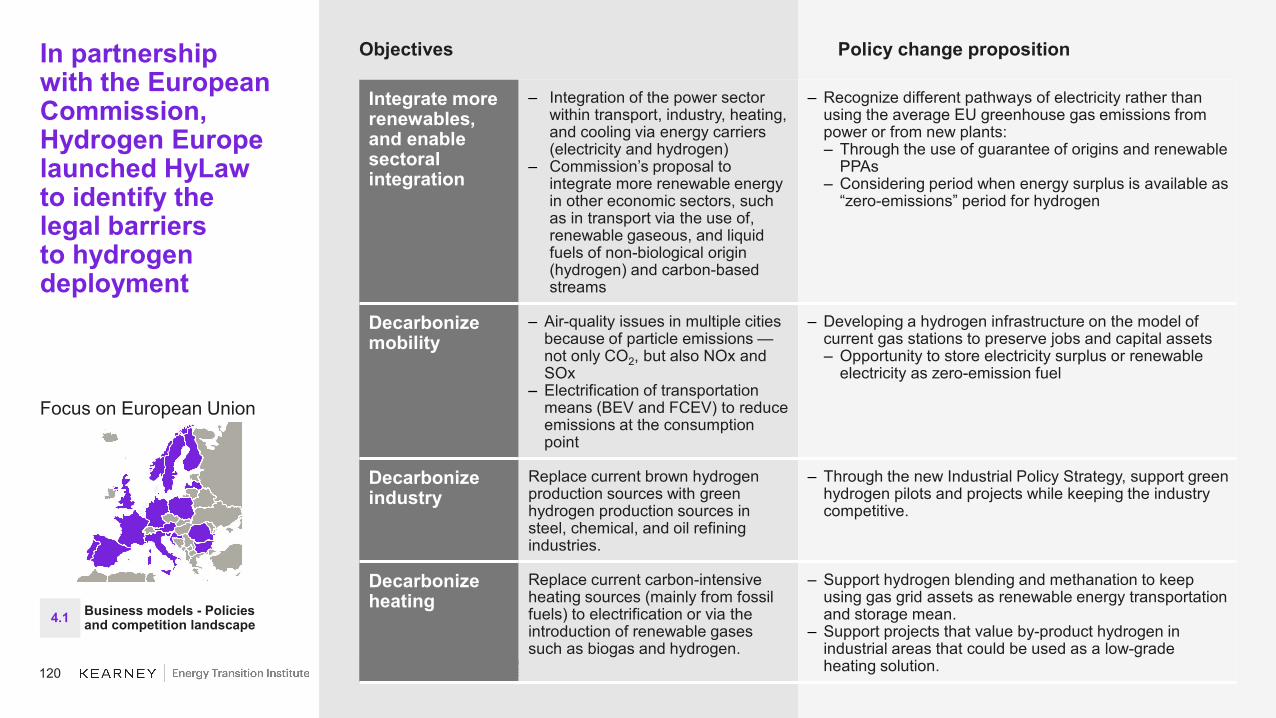
120
Policy change propositionObjectivesIn partnershipwith the European Commission, Hydrogen Europe launched HyLawto identify the legal barriersto hydrogen deployment
Focus on European Union
Note: BEV is battery electric vehicle; FCEV is fuel cell electric vehicle; PPA is power purchase agreement.Sources: Hydrogen Europe; Kearney Energy Transition Institute analysis
Integrate more renewables, and enablesectoral integration
– Integration of the power sector within transport, industry, heating, and cooling via energy carriers (electricity and hydrogen)
– Commission’s proposal to integrate more renewable energy in other economic sectors, such as in transport via the use of, renewable gaseous, and liquid fuels of non-biological origin (hydrogen) and carbon-based streams
– Recognize different pathways of electricity rather than using the average EU greenhouse gas emissions from power or from new plants:– Through the use of guarantee of origins and renewable
PPAs– Considering period when energy surplus is available as
“zero-emissions” period for hydrogen
Decarbonizemobility
– Air-quality issues in multiple cities because of particle emissions —not only CO2, but also NOx and SOx
– Electrification of transportation means (BEV and FCEV) to reduce emissions at the consumption point
– Developing a hydrogen infrastructure on the model of current gas stations to preserve jobs and capital assets– Opportunity to store electricity surplus or renewable
electricity as zero-emission fuel
Decarbonizeindustry
Replace current brown hydrogen production sources with green hydrogen production sources in steel, chemical, and oil refining industries.
– Through the new Industrial Policy Strategy, support green hydrogen pilots and projects while keeping the industry competitive.
Decarbonizeheating
Replace current carbon-intensive heating sources (mainly from fossil fuels) to electrification or via the introduction of renewable gases such as biogas and hydrogen.
– Support hydrogen blending and methanation to keep using gas grid assets as renewable energy transportation and storage mean.
– Support projects that value by-product hydrogen in industrial areas that could be used as a low-grade heating solution.
4.1 Business models - Policies and competition landscape

121
Policy actsFunding and incentivesThe United States has launched incentive programs to accelerate hydrogen deployment
Focus on the United States
Note: BEV is battery electric vehicle; FCEV is fuel cell electric vehicle; PPA is power purchase agreement.Sources: Hydrogen Europe; Kearney Energy Transition Institute analysis
R&DFunding
– Between 2004 and 2017, about $2.5 billion was granted to the Department of Energy for hydrogen R&D activities across its energy efficiency and renewable energy, coal, nuclear energy, and science departments.
– In 2005, OEMs and oil majors partnered to create FreedomCARwithin the Department of Energy to “examine and advance the pre-competitive, high-risk research needed to develop the component and infrastructure technologies necessary to enable a full range of affordable cars and light trucks, and the fueling infrastructure for them that will reduce the dependence of the nation's personal transportation system on imported oil and minimize harmful vehicle emissions, without sacrificing freedom of mobility and freedom of vehicle choice,” identifying FCEV as potential venue for R&D.
Title VIII act objectives:– Promote development, demonstration, and
commercialization of hydrogen and fuel-cell technologies in partnership with industries.
– Make investments in building links between private industries, institutions of higher education, national laboratories, and research institutions to expand innovation and industrial growth.
– Build a mature hydrogen economy creating fuel diversity in the transportation sector.
– Decrease US dependency on imported oil, eliminate emissions from transportation sector, and enhance energy security.
– Create, strengthen, and protect a sustainable national energy economy.
The Energy Policy Act of 2005 calls for a wide R&D program at each step of the hydrogen value chain to demonstrate the use of hydrogen in multiple applications.– By 2020, OEMs must offer at least one FCEV to the
mass consumer market.
The Fuel Cell Technical Task Force is responsible for planning a safe, economical, and ecological hydrogen infrastructure and establishing uniform hydrogen codes, standards, and safety protocols.
Cash prizes are awarded competitively to individuals, universities, and small and large businesses that advanced the research, development, demonstration, and commercialization of hydrogen technologies.
Incentives – At the federal and state level, 280 incentive programs support hydrogen, which includes grants, tax incentives, loans, leases, exemptions, and rebates, and apply for private businesses (fuel producers, OEM, fuel infrastructure operators and others), government entities and personal vehicle owners.
– Clean cities, clean ports, clean agriculture, and clean construction initiatives have developed private–public partnerships to promote alternative fuels and provide information on financial opportunities.
Note: OEM is original equipment manufacturers; FCEV is fuel cell electric vehicle.Sources: Department of Energy; Kearney Energy Transition Institute
4.1 Business models - Policies and competition landscape

122
Policy initiativesObjectivesJapan was the first country to adopt a basic hydrogen strategy and plans to become a “hydrogen society”
Focus on Japan
Note: BEV is battery electric vehicle; FCEV is fuel cell electric vehicle; PPA is power purchase agreement.Sources: Hydrogen Europe; Kearney Energy Transition Institute analysis
Note: FCV is fuel cell vehicle.Sources: Ministry of Economy, Trade and Industry (Japan); Kearney Energy Transition Institute analysis
4.1 Business models: policies and competition landscape
Realize low-cost hydrogen use
– Developing commercial scale capability to procure 300,000 tons of hydrogen annually
– Cost at 30 yen/Nm3 (2030) and 20 yen/Nm3 (beyond)
Financial supportThe Japanese government has dedicated $1.5 billion over the past six years to promote research development, demonstration, and commercialization of hydrogen technologies and subsidies.– In 2018, the Japanese government allocated $272 million
to hydrogen research and subsidies that is 3.5% of its energy budget
– The R&D efforts are channeled through the government research institution the New Energy and Industrial Technology Development Organization (NEDO), which oversees the national program on new technologies.
– Japan H2 Mobility (JHyM), a joint venture of more than 20 participating companies, was established in 2017 to accelerate the deployment of hydrogen filling stations throughout Japan with the help of government subsidies. In cooperation with the Japanese government, JHyM plans to build 80 new hydrogen filling stations by early 2022.
Japan intends to lead international standardization through international frameworks in cooperation with relevant organizations.
Proactively promoting hydrogen to citizens and local governments to share information and facilitate adoption
Japanese companies are already involved in international hydrogen projects such as in Brunei, Norway and Saudi Arabia. Kawasaki Heavy Industries has also announced the construction of a liquefaction plant, storage facility, and loading terminal for hydrogen export to Japan in the Australian state of Victoria as a pilot project for 2020–2021.
Develop international hydrogen supply chains
– Developing energy carrier technologies
– Demonstrating liquefied hydrogen supply chain by mid-2020
– Better handling of ammonia and methanation process
Decarbonizeindustry and power generation
– Carbon-free hydrogen to be used in energy areas where electricity use is difficult and replace fossil fuel-based hydrogen in industrial applications
– Commercialize hydrogen power generation and cut hydrogen power generation cost to 17 yen/kWh by 2030
Decarbonizemobility
– FCV targets: 40,000 units (2020), 200,000 units (2025), and 800,00 units (2030)
– Hydrogen stations targets: 160 (2020) to 320 (2025)
– Specific focus in developing fuel cell-based buses, forklifts, trucks, and small ships

123
Policy initiativesFocus areasAustralia adopted a national hydrogen strategy in late 2019 to open up opportunities in domestic use as well as the export market
Focus on Australia
Develop a strong hydrogen industry and capabilities that will support the country’s low emission energy transition and local job creation
Australia would take an adaptive approach to capitalize on the growth in domestic and global hydrogen demand:Foundation and demonstration– Early actions will focus on
developing clean hydrogen supply chains to service new and existing uses of hydrogen, such as ammonia production, and developing capabilities for rapid industry scale-up.
– Demonstration scale hydrogen hubs will help prove technologies, test business models, and build capabilities.
Large-scale market activation– Scale up the end use of the clean
hydrogen in the domestic market, such as industrial feedstock, heating, blending of hydrogen in the gas network, and use of hydrogen in heavy-duty transport along with refueling infrastructure.
Since 2015, the Australian government has committed more than $146 million to hydrogen projects along the supply chain.– R&D: $67.83 million – Feasibility:$4.88 million– Demonstration: $5.04 million– Pilot: $68.57 millionThe support is provided though the Australian Research Council, CSIRO, the Australian Renewable Energy Agency (ARENA), the Clean Energy Finance Corporation, and the Northern Australia Infrastructure Fund.National Energy Resources Australia (NERA) will support SMEs to take advantage of opportunities in the hydrogen industry by forming an industry-led hydrogen cluster. The hydrogen industry cluster will help build capabilities and drive industry collaboration across the hydrogen value chain.The Australian government has supported nine projects in the past two years alone. The state and territory governments have also made early moves through supporting specific projects and, in some cases, releasing their own hydrogen strategies.The Australian government will establish agreements with key international markets to underpin investment. It has already signed a cooperation agreement with Japan and a letter of intent with Korea.The four year (2018–2021) HESC Pilot Project comprises multiple stages to produce and export hydrogen (from brown coal) to Japan from the Latrobe Valley, using established and scientifically proven technologies. The Pilot Project is the world’s largest hydrogen demonstration. project and includes the transportation of liquified hydrogen in a world-first, purpose-built liquified hydrogen carrier
Transform Australia into a clean hydrogen exporter
Australia has significant competitive advantages for developing a substantial hydrogen export industry. The country has abundant natural resources needed to make clean hydrogen and has a track record in building large-scale energy industries. It has an established reputation as a trusted energy supplier to Asia.
Sources: Australia’s National Hydrogen Strategy (2019); Kearney Energy Transition Institute
4.1 Business models: policies and competition landscape

124
Kuwait
– Discussions on CCUS and H2 productionby KPC
United Arab Emirates
– Test of Toyota Mirai FCEV on roads to evaluate the potential of hydrogen asroad fuel
– Al Reyadah CCUS plant at Emirates Steel plant in Abu Dhabi, used for EOR inADNOC oilfields
Actions takenSaudi Arabia
– Agreement between Air Products and Aramco to build the country’s first compressed hydrogen refueling station for fuel cell electric vehicles
– Development of a blue hydrogen production strategy with planned pilots
Oil-rich countries are looking intoH2 to export asa clean fuel alternative tooil and gas
Business case overview
– Several options can be used to convert hydrocarbons into clean H2 (see Part 2):– Either from natural gas (e.g. SMR) or from
any hydrocarbon sources (e.g. gasification; ATR, Pyrolysis), and combining with CCS
– Using non-emitting technologies (e.g. microwave)
– Blue hydrogen provides a clean opportunity for Arab countries to extend the useful life of their reserves:– Gulf Cooperation Council countries have a
proven track record of brown hydrogen production thanks to their refineries.
– CO2 from CCS can be stored more easily in depleted oil and gas fields or be used for enhanced oil recovery and nearby industries.
– Value from heavy oil resources can be enhanced.
– Carbon emissions targets from Paris agreement can be met.
– Blue hydrogen production costs are half of green hydrogen, but the gap is expected to close by 2030.– However, renewable electricity
infrastructure in Gulf Cooperation Council countries is not big enough to scale up hydrogen production.
Focus on Gulf Cooperation Council countries
Sources: Kuwait Foundation for the Advancement of Sciences; Kearney Energy Transition Institute analysis
4.1 Business models - Policies and competition landscape
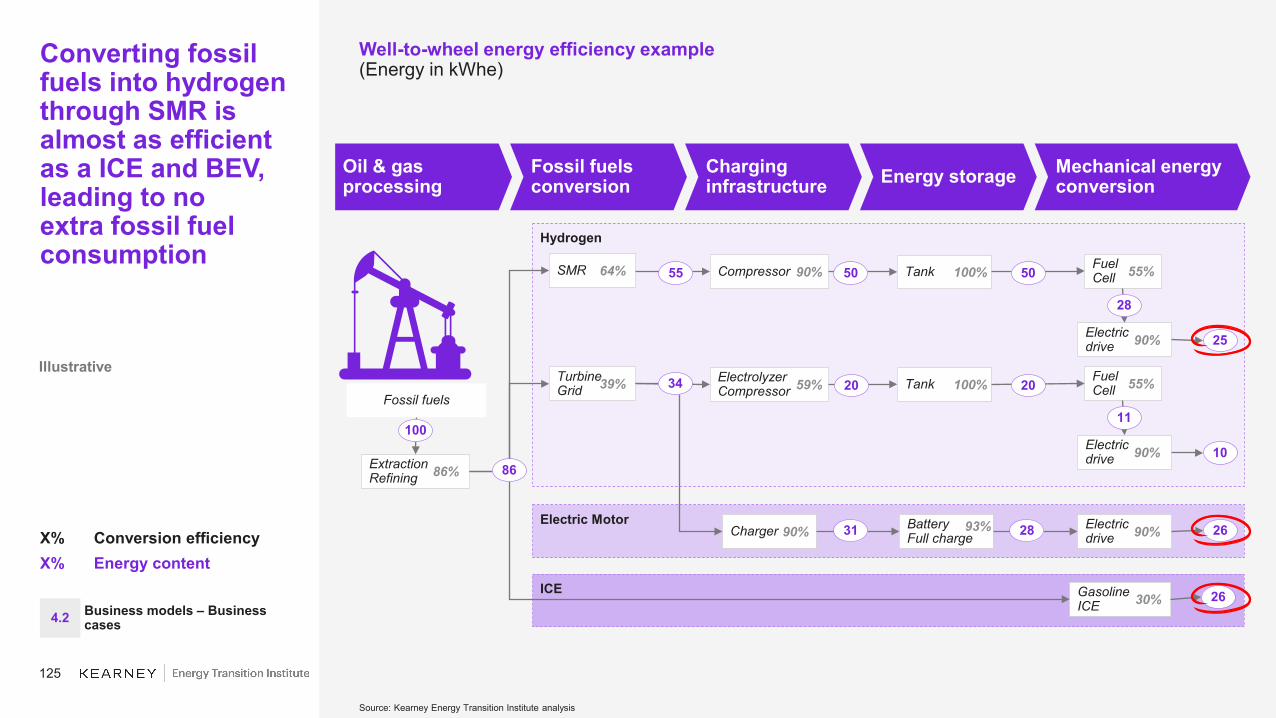
125
Electric Motor
ICE
Hydrogen
Converting fossil fuels into hydrogen through SMR is almost as efficient as a ICE and BEV, leading to noextra fossil fuel consumption
Well-to-wheel energy efficiency example(Energy in kWhe)
Illustrative
Source: Kearney Energy Transition Institute analysis
X% Conversion efficiencyX% Energy content
Fossil fuels
ExtractionRefining 86%
GasolineICE 30% 26
TurbineGrid 39%
Charger 90% BatteryFull charge
93% Electric drive 90%28 26
ElectrolyzerCompressor 59% Fuel
Cell 55%
Electric drive 90% 10
Oil & gas processing
Fossil fuels conversion
Charging infrastructure Energy storage Mechanical energy
conversion
100
SMR 64%
Tank 100%20
86
20
11
34
FuelCell 55%
Electric drive 90% 25
Tank 100% 50
28
31
Compressor 90%55 50
4.2 Business models – Business cases
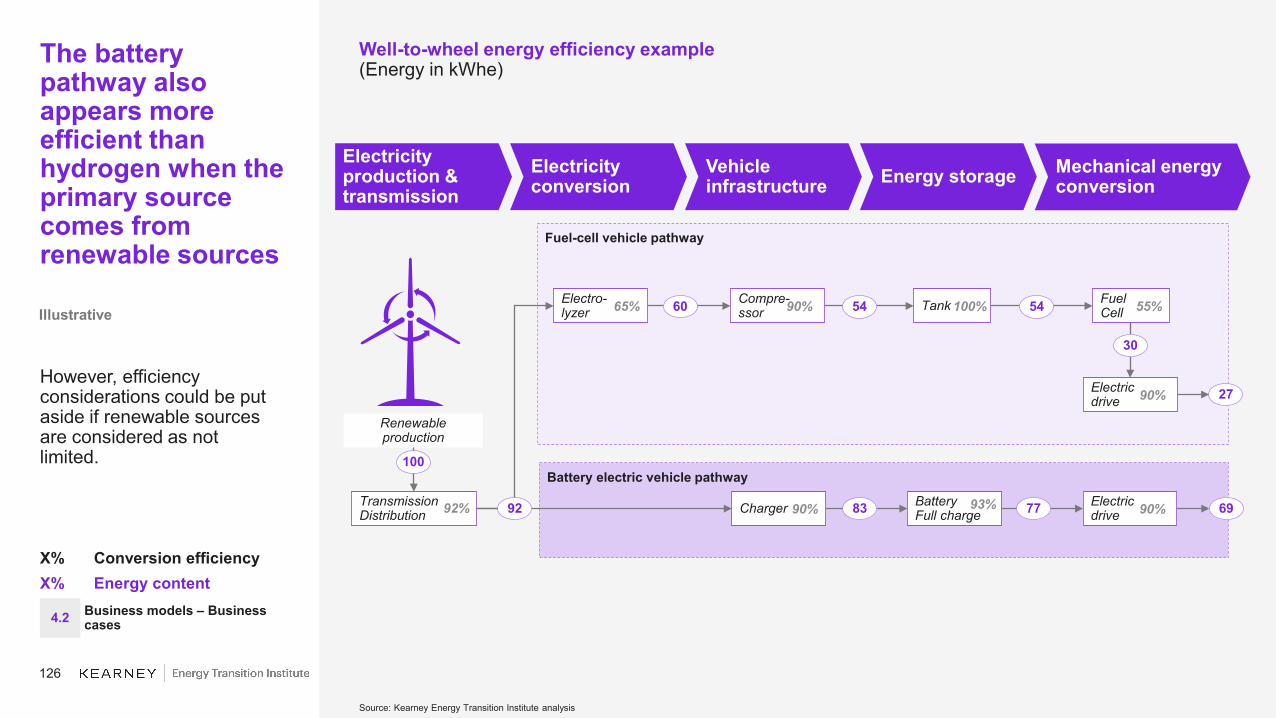
126
Battery electric vehicle pathway
Fuel-cell vehicle pathway
The battery pathway also appears more efficient than hydrogen when the primary source comes from renewable sources
However, efficiency considerations could be put aside if renewable sources are considered as not limited.
Illustrative
Source: Kearney Energy Transition Institute analysis
X% Conversion efficiencyX% Energy content
Renewable production
TransmissionDistribution 92% Charger 90% Battery
Full charge93%83 Electric
drive 90%77 69
100
Electro-lyzer 65% Compre-
ssor 90%60 FuelCell 55%
Electric drive 90% 27
30
Electricity production & transmission
Electricity conversion
Vehicle infrastructure Energy storage
Tank 100%54 54
Well-to-wheel energy efficiency example(Energy in kWhe)
92
Mechanical energy conversion
4.2 Business models – Business cases

127
CO2 emissions related to hydrogen production vary depending on the production pathway
CO2 intensity of hydrogen production(kgCO2/kgH2, includes full life cycle of power plant)
Other hydrocarbons, such as oil, can be used to produce hydrogen, the resulting CO2 intensity is generally comprise between those of coal and natural gas 1 Considering 54 to 89% of capture rate. More details on CCS are in production technologies section.2 Considering energy consumption of 55 kWhe/kgH2 for an electrolyzerSources: “Hydrogen Roadmap Europe,” International Energy Agency, 2019; RTE; Kearney Energy Transition Institute analysis
20
2
45
11
1
27
1
2
1
26
7
4
9
5
Primary source
Coal
Gasification without CCS
Conversion
Gasification with CCS1
Electricity Electrolysis2
SMR without CCS
SMR with CCS1
Electricity Electrolysis2
Electricity Electrolysis2
Electricity Electrolysis2
Electricity Electrolysis2
Electrolysis2
Natural gas
Nuclear fuel
Solar
Wind
World grid (475g CO2/kWhe)
Lower emission limit World average from electrolysis
4.2 Business models – Business cases

128
Other benefits– Will the solution contribute
to an economic development at local or global level?
– Will the solution reduce dependency on fossil fuels imports and improve energy supply security?
– Will the solution help REN integration on the electric grid?
Environmental impact– How many tons of CO2 can
be avoided thanks to the hydrogen solution, and what is the avoidance cost?
– How many tons of CO2would have been avoided with other solutions, and what is the avoidance cost?
Economical competitiveness– What is the net present
value and the LCOXof the investment?1
– What is the net present value of other alternatives, including carbon-intensive and low-carbon solutions?
– LCOH converted either in $ per kg, $ per MWh, $ per km, or $ per passenger depending on the business case
Seven business cases, based on real-life situations, have been studied to assess their competitiveness with other available solutions
Evaluation criteria
Centralized production from ATR to serve local industries with heat and H2
A. Thermochemical production
B. Electrolysis
Power-to-molecule: how to optimize refinery power consumption and reducing footprint
Power-to-power: how to store electricity and discharge it when needed
Hydrogen buses: additional cost vs. impact for local economy
Hydrogen cars: economic assessment of main H2 cars
Hydrogen trains: how to value local H2 fatal production and avoid large investment for rail electrification
Power-to-gas: how to value fatal electricity production into gas or heat energyB1: overview; B1a - blending; B1b: methanation
Business cases
Power-to-X
Greenmobility
1 Levelized cost of X: levelized cost of hydrogen, energy, or Mobility depending on the end-use application. Calculation methodology does not differ, and the denominator is adapted (for example, energy produced or number of passengers).Source: Kearney Energy Transition Institute analysis
A
B1
B2
B3
B4
B5
B6
4.2 Business models – Business cases
B

129
Carbon abatement costs vary widely depending on the business case
Note: The carbon abatement cost is equal to (LCOX(H2) –LCOX(Ref))/(Avoided CO2), with the LCOX(H2) being the LCOX of the H2 solution, LCOX(Ref) being the LCOX of the reference solution, both in $ per unit, and the (avoided CO2) being the CO2 avoided between the H2 solution and Ref solution, in ton per unit.Source: Kearney Energy Transition Institute analysis
Business cases (2030) Extra Cost Carbon abatement costs
+35–110%vs. SMR
Convert electricity into hydrogen for further industrial applications.
3. Power-to-molecule
+35–35%vs. coal turbine
Convert electricity into hydrogen for electricity peak management.
2. Power-to-power
+60–100% injection
+250–400%methanation vs. gas
Convert electricity into hydrogen for heat generation.
1. Power-to-gas
+12–30% vs.av. electricity price
Convert fossil fuels into hydrogen, and capture carbon at production point.
1. Centralized productionfrom ATR
+10–15%vs. diesel bus
Create clean fuel to power buses.
5. Hydrogen buses(Pau example)
+150–215%vs ICE car
Create clean fuel to power cars.4. Hydrogen cars
+1–15%vs. diesel train
Create clean fuel to power trains.
6. Hydrogen trains(Cuxhaven example)
MAX215
MIN100
220 320
11002800
110 3000
130 150
570 2000
120
0 60
4.2 Business models – Business cases
A
B1
B2
B4
B5
B6
B3

130
A. The Rotterdam port is investigating the benefits of H2in its H-vision plan, which would combine fossil fuel-based production and CCS
Hydrogen hub produce from SMR
Production of H2and CO2 capture
Distribution of H2 End use CO2 storage
Technology – High pressure ATR unit– Centralized production of
H2 from CH4 with CO2capture with Rectisol physical absorption
– Pipeline – No storage
– Power plants: new gas turbines to enable H2firing, power generation from ATR steam
– Furnace heat in refineries
– Storage in North Sea depleted oil and gas fields
Illustrative
Maincharacteristics
– Up to 1,500 kt H2 per day– H2 purity of 96%– CCS: 88% capture rate
(8 kg CO2 captured perkg H2)
– Diameter: 12–28 inches– Operating pressure:
about 70 bars
– Power plants: 2x147 MWe H2 turbines + 2x100 MWe gas/H2 turbines:1.9 GW of H2
– Refinery: H2-rich refinery fuel gas
– Multiple sites identified, with total capacity of470 Mt
– Stored quantity over 20 years: 120–288 MT
Cost components
– Capex: up to €910 million– Opex: 2.5% of capex
– Cost: €0.5 million to€1.5 million per km
– Total capex: €0.8 billion to €2.8 billion
– Transport and storage: €17–€30 per ton
Sources: "Blue Hydrogen as Accelerator and Pioneer for Energy Transition in the Industry," H-vision, July 2019; Kearney Energy Transition Institute analysis
4.2 Business models – Business cases
A

131
Value chain and possible partnersObjective– Reaching a carbon-
neutral industry in Rotterdam by2050
Context– Industries in Rotterdam
port areas consumption of about 400 ktH2 per year, half of the Netherlands production
– H2 mainly produced from SMR without CCS
– Almost all production used for oil refineries
A. H-vision projects have multiple partners from various industries
H-vision businessmodel overview
H-vision scope– Developing a blue
hydrogen economy– Development of new
applications for H2, including power, heat generation, chemicals
– Development of new production sources for H2, preferably ATR combined with CCS
– FID by 2021 and project start-up by 2025
Sources: "Blue Hydrogen as Accelerator and Pioneer for Energy Transition in the Industry," H-vision, July 2019; Kearney Energy Transition Institute analysis
Supply1. Production
2. Distribution
3. End use4. Evacuation
– Supply of natural gas,refinery fuel gas, andoxygen
– Production of H2
– Transportation andstorage of blue H2
– Power plant– Refineries– Chemical sites
– Transportation andstorage of CO2
– Equinor– Shell– BP– Air Liquide
– Uniper– Shell– BP– Air Liquide– Gasunie
– Vopak– Gasunie
– Uniper– Shell– BP– ExxonMobile– Air Liquide
– Vopak– Port of Rotterdam– Gasunie
4.2 Business models – Business cases
A
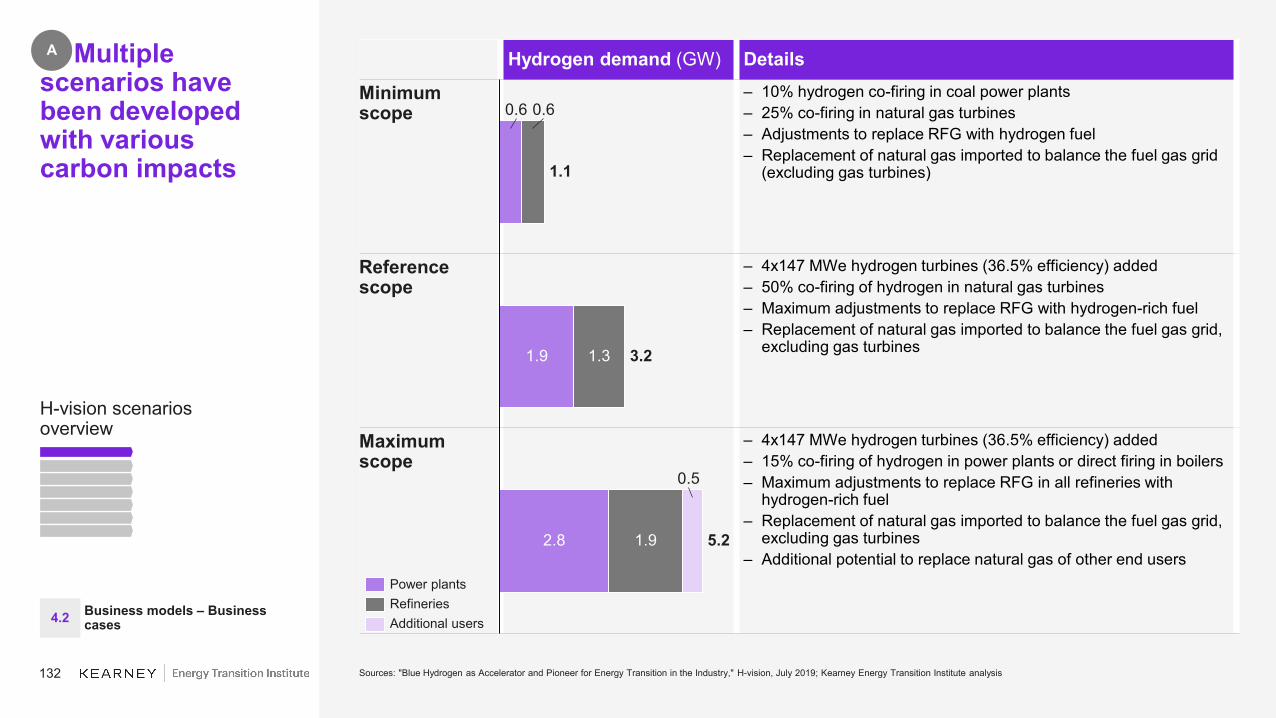
132
A. Multiple scenarios have been developed with variouscarbon impacts
H-vision scenariosoverview
Sources: "Blue Hydrogen as Accelerator and Pioneer for Energy Transition in the Industry," H-vision, July 2019; Kearney Energy Transition Institute analysis
Hydrogen demand (GW) Details
Minimum scope
– 10% hydrogen co-firing in coal power plants – 25% co-firing in natural gas turbines– Adjustments to replace RFG with hydrogen fuel– Replacement of natural gas imported to balance the fuel gas grid
(excluding gas turbines)
Reference scope
– 4x147 MWe hydrogen turbines (36.5% efficiency) added– 50% co-firing of hydrogen in natural gas turbines– Maximum adjustments to replace RFG with hydrogen-rich fuel– Replacement of natural gas imported to balance the fuel gas grid,
excluding gas turbines
Maximum scope
– 4x147 MWe hydrogen turbines (36.5% efficiency) added– 15% co-firing of hydrogen in power plants or direct firing in boilers– Maximum adjustments to replace RFG in all refineries with
hydrogen-rich fuel– Replacement of natural gas imported to balance the fuel gas grid,
excluding gas turbines– Additional potential to replace natural gas of other end users
1.9
0.60.6
1.3
0.5
1.92.8
1.1
3.2
5.2
Power plants
Additional usersRefineries
4.2 Business models – Business cases
A
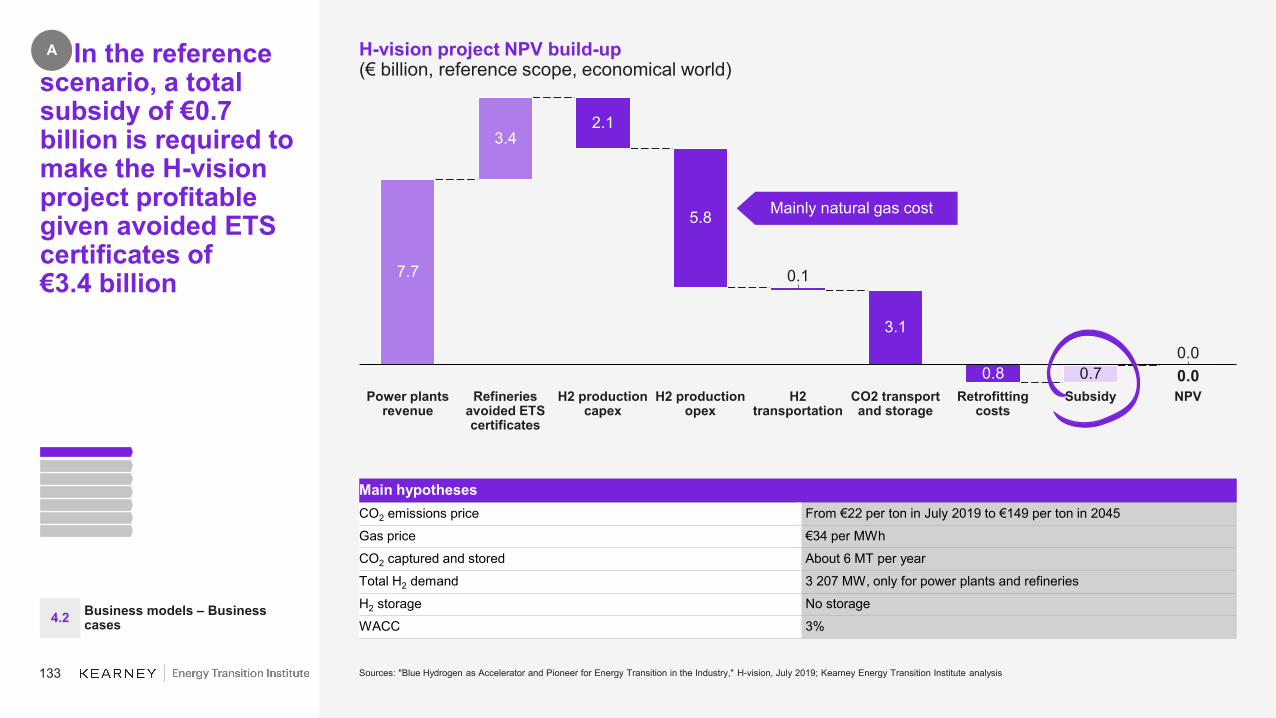
133
A. In the reference scenario, a total subsidy of €0.7 billion is required to make the H-vision project profitable given avoided ETS certificates of€3.4 billion
Sources: "Blue Hydrogen as Accelerator and Pioneer for Energy Transition in the Industry," H-vision, July 2019; Kearney Energy Transition Institute analysis
H-vision project NPV build-up(€ billion, reference scope, economical world)
Main hypothesesCO2 emissions price From €22 per ton in July 2019 to €149 per ton in 2045Gas price €34 per MWhCO2 captured and stored About 6 MT per yearTotal H2 demand 3 207 MW, only for power plants and refineriesH2 storage No storageWACC 3%
H2 production opex
Refineries avoided ETS certificates
0.8Power plants
revenueCO2 transport and storage
NPVH2 transportation
H2 production capex
0.0Retrofitting
costs
0.7Subsidy
0.0
7.7
3.42.1
5.8
0.1
3.1
Mainly natural gas cost
A
4.2 Business models – Business cases

134
A. The H-vision project could help avoid 27 to 130 Mtpa of CO2 over 20 years with an abatement cost of CO2 $97 to $213 per tCO2
CO2 impact of H-vision(Avoided CO2 in Mtpa, abatement cost in $ per tCO2)
Sources: "Blue Hydrogen as Accelerator and Pioneer for Energy Transition in the Industry," H-vision, July 2019; Kearney Energy Transition Institute analysis
– A CCS unit on the ATR has a capture rate of 88%. Therefore, CO2 emissions from hydrogen production for refinery use would be cut by 88%.
– For power generation, efficiency losses imply an overall emission reduction rate of about 80%.Natural gas turbines are slightly more efficient, and converting to hydrogen adds an intermediarystep with additional losses.
Avoided CO2 emissions (Mtpa) Abatement cost range ($ per tCO2eq)
1
4
7
Minimumscope
Referencescope
Maximumscope
164
97
102
49
67
67
213
164
170
IPCC 2°C carbon pricerecommendation, 2030
4.2 Business models – Business cases
A

135
B. Power-to-X is the process of converting electricity into hydrogen for additional applications
Simplified value chain of hydrogen-based energy conversion solutions1
1 End uses are non-exhaustive.2 There are several possible options.Source: Kearney Energy Transition Institute analysis
4.2 Business models – Business cases
B
Gas network Hydrogen network Power network Liquid fuel network
Natural Gas Grid
Refineries
Chemical plants
Refueling stations
Power grid
Fuel cell electric vehicle
Ammonia
Internal combustion engine vehicle
Natural gas vehicle
Petroleum products
Electrolysis Hydrogen storage
OxygenWater
Methanation
Power-to-power
Power-to-chemical
Power-to-mobility
Power-to-gas
Blending
H2CH4
Wind turbine
Solar PV
Combustion turbines
Fuel cells
Processing2
Upgraded and synthetic fuels
Blended gas
H2
Coal and oil
Blue hydrogen
Green hydrogen
CO2
CCS

136
B. Analyses have been conducted for multiple scenarios,with optimistic assumptionson renewable production sourcesevolution
Configuration description for P2G project (based on France electrical mix)
Configurations 2019 2025f 2030f
Electrolyzer
Size 1 MW 10 MW 100 MW
Capex €1,000 per kW €800 per kW €450 per kW
Stack 70,000 hours, 36% capex 80,000 hours, 28% capex 90,000 hours, 28% capex
Elec. Cons 60 kWh/kg 55 kWh/kg 50 kWh/kg
Grid utilizationLoad Factor 90%
Elec. Price $48.60 per MWhe
CO2 475g per kWhe
VRE
aver
age Wind
Load Factor 34% 35% 36%
Elec. Price $56 per MWhe $45 per MWhe $31 per MWhe
CO2 11g per kWhe
SolarLoad Factor 21% 23% 25%
Elec. Price $85 per MWhe $60 per MWhe $22 per MWhe
CO2 42g per kWhe
VRE
and
grid Grid +
wind
Load Factor 90% (Wind 34–36% of time and grid 54–56% of time)
Elec. Price $53.6 per MWhe $49.30 per MWhe $43.60 per MWhe
CO2 300g per kWhe 294g per kWhe 289g per kWhe
Grid +solar
Load Factor 90% (Solar 25–30% of time and grid 60–65% of time)
Elec. Price $59.70 per MWhe $54.10 per MWhe $43.70 per MWhe
CO2 373g per kWhe 365g per kWhe 354g per kWhe
Sources: “The Future of Hydrogen,” International Energy Agency, June 2019; International Renewable Energy Agency; Oxford Institute for Energy Studies; French Environment and Energy Management Agency (ADEME); RTE; expert interviews; Kearney Energy transition Institute analysis
4.2 Business models – Business cases
B
Assumptions used for business cases

137
2019: 1 MW 2025f: 10 MW 2030f: 100 MW
10.9
5.6
6.2
7.1
5.9
B. In the long-term, as capex goes down, electrolyzerpowered from renewables could be competitive with grid-connected
LCOH for P2X project: electrolyzer only(2019–2030, $ per kg)
4.9
4.2
4.2
6.9
4.5
3.1
2.9
2.7
2.7
2.9
Grid utilization
Wind
Solar
Grid wind
Grid solar
Current fossil fuel-dependentsourcesLCOH range(1)
As of today, the cheapest option is to produce H2 with a grid-connected electrolyzer. However, coupling grid with wind to reduce the carbon footprint is close to becoming competitive.
LCOE reduction from renewable and improvementof electrolyzer capex and opexis not expected to make green H2 competitive compared with grid-connected electrolysis by 2025.
Reduction in LCOE for renewable sources, whichis expected to become lower than average grid prices, will make green H2 competitiveout of the electrolyzer.
At optimal rate, LCOH would be about $2.50 per kg at 64% use rate. However, it does not include other components that can be capex-intensive and require a highload factor.
1. Current LCOH of brown hydrogen commonly ranges between 1$/kg to 2$/kg (more details slide 62)Sources: “The Future of Hydrogen,” International Energy Agency, June 2019; GRHYD; International Renewable Energy Agency; Oxford Institute for Energy Studies; French Environment and Energy Management Agency (ADEME); RTE; Kearney Energy transition Institute analysis
4.2 Business models – Business cases
B
H2 electrolysis cost from various power sources
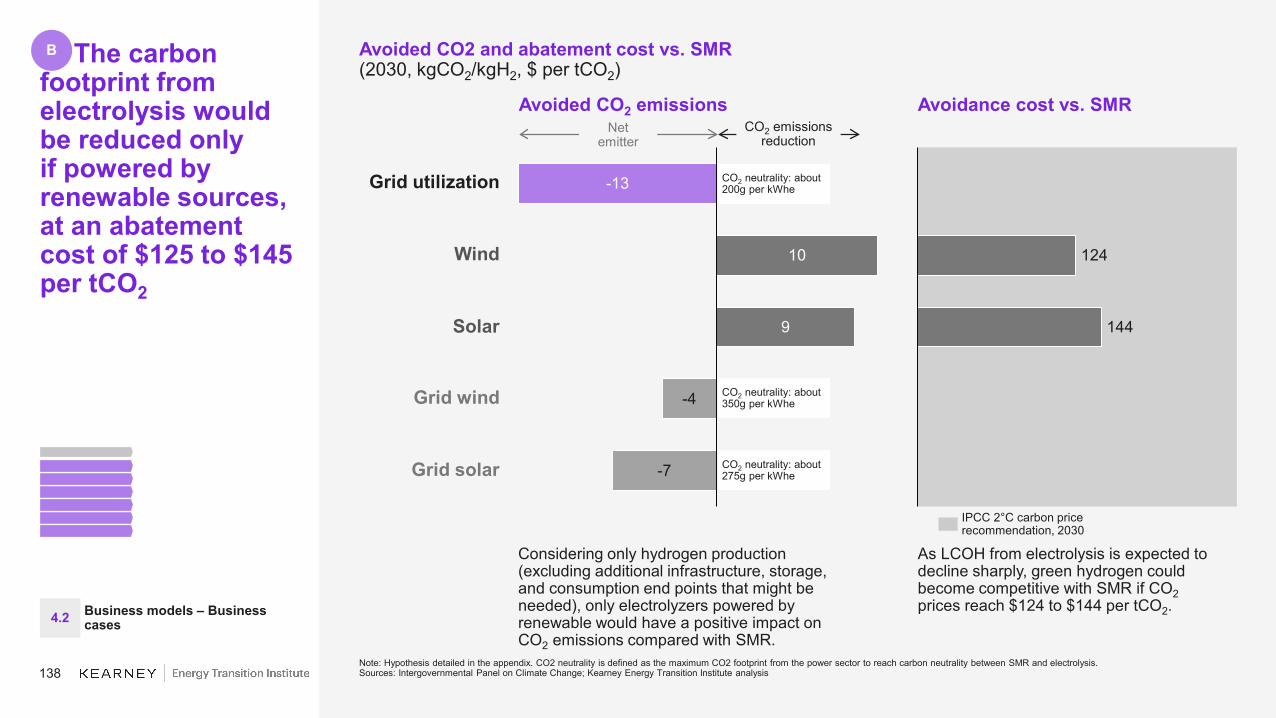
138
124
144
B. The carbon footprint from electrolysis would be reduced onlyif powered by renewable sources, at an abatement cost of $125 to $145 per tCO2
Avoided CO2 and abatement cost vs. SMR(2030, kgCO2/kgH2, $ per tCO2)
Grid utilization
Wind
Solar
Grid wind
Grid solar
As LCOH from electrolysis is expected to decline sharply, green hydrogen could become competitive with SMR if CO2prices reach $124 to $144 per tCO2.
Note: Hypothesis detailed in the appendix. CO2 neutrality is defined as the maximum CO2 footprint from the power sector to reach carbon neutrality between SMR and electrolysis.Sources: Intergovernmental Panel on Climate Change; Kearney Energy Transition Institute analysis
Avoided CO2 emissions Avoidance cost vs. SMR
Considering only hydrogen production (excluding additional infrastructure, storage, and consumption end points that might be needed), only electrolyzers powered by renewable would have a positive impact on CO2 emissions compared with SMR.
-13
10
9
-4
-7
CO2 neutrality: about 200g per kWhe
CO2 neutrality: about 350g per kWhe
CO2 neutrality: about 275g per kWhe
IPCC 2°C carbon pricerecommendation, 2030
Netemitter
CO2 emissions reduction
4.2 Business models – Business cases
B

139
Business case opportunity
With coordinated operations between electrolyzers, a fixed power is injected to the grid from solar and wind power plant.
Quick response time and flexibility of PEM
45 MW of electrolyzers with advanced control is considered in the
National Renewable EnergyLaboratory 2022 business case
PEM can operate at higher rates than nominal load for a certain period of time without impacting its lifetime, which can provide negative power control to the grid.
It can also operate below its nominal rate (to 20%) to provide positive power control to the grid.
High variability of renewable production
Wind and solar production in NREL 2022 business case
Variable energy production from solar and wind sources directly injected on the grid can impact operations (for example, demand lower than production, frequency variations)
B. Electrolyzer could also provide services to the grid to support renewable integration while offsetting variability and improve LCOH
Overview of grid services from electrolysis (2022,wind and solar generation)
Wind and solar generation
Electrolyzer performance
Sources: National Renewable Energy Laboratory, adapted from Siemens (2013) and Mansilla et al. (2012); Kearney Energy Transition Institute analysis
4.2 Business models – Business cases
B

140
Remuneration system, based on Austria tender prices:– €10 per MW available per hour– €120 per MWh delivered
Negative power control opportunity
Variability in renewable production can lead to excess supply on the electric grid, which may require switching off other sources or incentivizing consumers to use the surplus if switch-off time is too long, too risky, or too expensive.
In 2018, renewable production growth occurring at the same time as a decrease of other production sources happened for 2,451 hours.
Positive power control opportunity
In France, TAC (“turbines à combustible”) provide electricity during peak times to maintain grid frequency.
In 2018, TAC delivered power above 60MW for about 467 hours.
B. There is potential for aH2 producerto monetize this service, whichcould furtherreduce LCOH
0.5
1.0
1.5
2.0
TAC power output (GW)
Maximum power capacity
10
14
6
2
4
8
12
Solar and wind power output (GW) Remuneration system, based on Austria tender prices:– €10 per MW available per hour– - €120 per MWh consumed
Note: Grid stabilization with electrolysis (2018 example, France)Sources: National Renewable Energy Laboratory, RTE, Smarten.eu; Kearney Energy Transition Institute analysis
4.2 Business models – Business cases
B
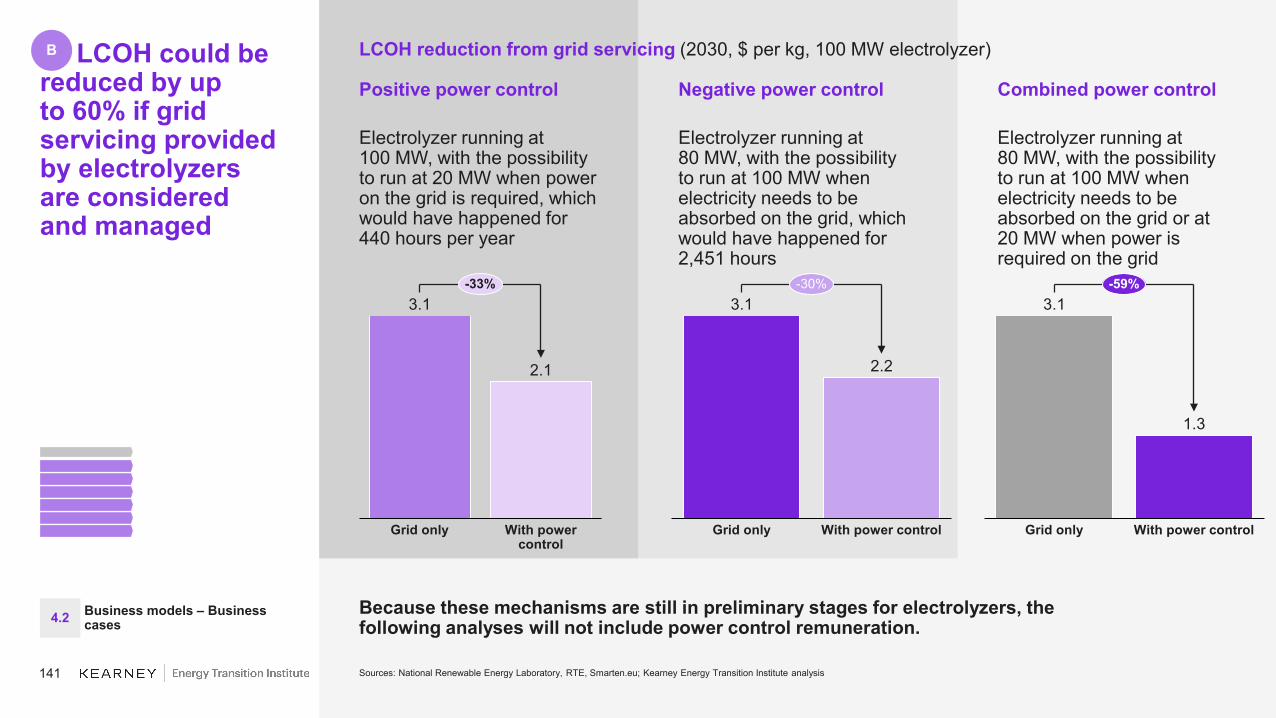
141
Combined power control
Electrolyzer running at80 MW, with the possibilityto run at 100 MW when electricity needs to be absorbed on the grid or at20 MW when power is required on the grid
Negative power control
Electrolyzer running at80 MW, with the possibilityto run at 100 MW when electricity needs to be absorbed on the grid, which would have happened for 2,451 hours
Positive power control
Electrolyzer running at100 MW, with the possibility to run at 20 MW when power on the grid is required, which would have happened for 440 hours per year
LCOH could be reduced by upto 60% if grid servicing provided by electrolyzersare considered and managed
LCOH reduction from grid servicing (2030, $ per kg, 100 MW electrolyzer)
Because these mechanisms are still in preliminary stages for electrolyzers, thefollowing analyses will not include power control remuneration.
Sources: National Renewable Energy Laboratory, RTE, Smarten.eu; Kearney Energy Transition Institute analysis
With power control
Grid only
2.1
3.1-33%
Grid only With power control
2.2
3.1-30%
3.1
Grid only
1.3
With power control
-59%
4.2 Business models – Business cases
B

142
B Power-to-gasis the process of converting surplus electricity into H2through electrolysis for further applications, such as heating and mobility
Power-to-gas overview
Electricitysupply
Blending
Methanation
Com
pressionstorage
Gasnetwork
– Electrolyzer is a key component in a P2G business case and needs to be flexible enough to adapt to sudden power changes and multiple switch-onand switch-off.
– PEM, even if more expensive than AE electrolyzers, is currently the preferred solution thanks to its quick reaction time and its capability to operate at 160% of nominal power for a short period of time.
AE electrolyzer
PEM electrolyzer
SOEC electrolyzer
Sources: International Renewable Energy Agency; Kearney Energy transition Institute
Pure H2 applications
Start-up time per technology(10 MW per minute)
30
10
30
SOECAE PEM
4.2 Business models – Business cases
B1
B1a
B1b
Power-to-gas: overview

143
– Hydrogen—or methane—produced can be usedas a fuel for mobility, feedstock for chemicals, or heat for industry or be converted back to electricity if needed.
Use renewable electricityfor multipleapplications
– Existing gas networks are able to store energy, either as H2 or CH4 if there is a methanation step.
– In France, gas network storage capacity is about 140 TWh, compared with 0.4 TWh on the electricity network.
Store at different time scale and transport energy through gas grid
2050 P2G potential,year of study(TWh, France)– Wind and photovoltaic have
high potential to penetrate electricity grids with fast declining LCOE.
– These generation sources are dependent on weather changes and a high level of integration will require more flexibility.
Value electricity productionsurplusfrom RES
B P2G has been identified as a tool to enable high penetration of renewable on the electricity grid
Key advantages of P2G
35
20182011
150
Higher values for high renewable penetration
Multiple studies conducted
NegaWatt scenario
Sources: GRDF; Kearney Energy Transition Institute analysis
4.2 Business models – Business cases
B1
30
20
Power-to-gas: overview
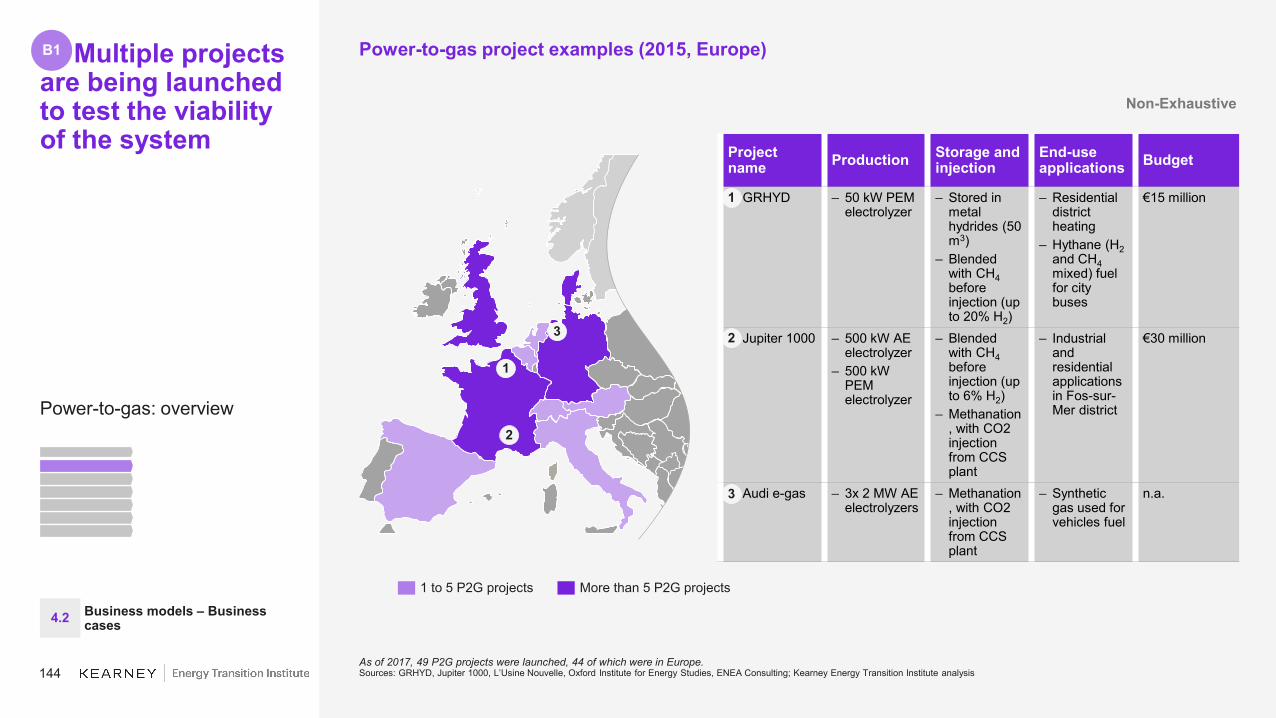
144
B Multiple projects are being launched to test the viability of the system
Non-Exhaustive
Project name Production Storage and
injectionEnd-use applications Budget
1. GRHYD – 50 kW PEM electrolyzer
– Stored in metal hydrides (50 m3)
– Blended with CH4before injection (up to 20% H2)
– Residential district heating
– Hythane (H2and CH4mixed) fuel for city buses
€15 million
2. Jupiter 1000 – 500 kW AE electrolyzer
– 500 kW PEM electrolyzer
– Blended with CH4before injection (up to 6% H2)
– Methanation, with CO2 injection from CCS plant
– Industrial and residential applications in Fos-sur-Mer district
€30 million
3. Audi e-gas – 3x 2 MW AE electrolyzers
– Methanation, with CO2 injection from CCS plant
– Synthetic gas used for vehicles fuel
n.a.
As of 2017, 49 P2G projects were launched, 44 of which were in Europe.Sources: GRHYD, Jupiter 1000, L’Usine Nouvelle, Oxford Institute for Energy Studies, ENEA Consulting; Kearney Energy Transition Institute analysis
More than 5 P2G projects1 to 5 P2G projects
1
2
3
4.2 Business models – Business cases
B1 Power-to-gas project examples (2015, Europe)
1
2
3
Power-to-gas: overview

145
Value chain and possible partnersObjective– Value fatal electricity production
from renewable sources through green H2.
Context– France’s objective is to have
renewable energy representing 23% of final energy consumption by 2020.
– According to ADEME, up to 30 TWhof hydrogen could be produced by power-to-gas by 2035, and a full conversion to a 100% renewable gas-based scenario by 2050 is feasible.
B The GRHYD project was launched in Dunkirk to inject up to 20% of green H2 on residential gas network for heating and mobility
GRHYD project example
GRHYD scope– Experiment with power-to-gas at
project scale:– Test reactivity of PEM electrolyzer.– Test gas network adaptability to
hydrogen injection.– Determine upper limit of injection
(currently at 20% on new networks).
– Test metal hydrides storage option.1 Hydrogen and methaneSources: GRHYD; Kearney Energy Transition Institute analysis
ElectricityElectrolysis
StorageInjection
End use
– Fatal electricity production from VRE
– PEM electrolyzer producing H2 and O2 (released)
– Storage in metal hydrides
– Blending up to 20%– Injection of mixed gas
(hythane1) on gas network
– Heating for new residential buildings
– Fuel for Hydrogen buses
– CEA– Engie– McPhy– AREVA H2GEN– Dunkerque Grand
Littoral– INERIS
– GRDF– CETIAT
– Engie– DK Bus
4.2 Business models – Business cases
B1
Power-to-gas: overview

146
B Productionof H2 and injection on gas network systems (blending) include electricity generation, electrolyzer, and injection station
P2G: injection value chain
Illustrative
4.2 Business models – Business cases
B1a
Sources: expert interviews; Kearney Energy Transition Institute
Grid connection and infrastructure Electrolyzer Injection station
Year 2019: 1 MW 2030f: 100 MW 2019: 1 MW 2030f: 100 MW
Capex($ million)
Transformer: $0.013Line: $0.112
Pipeline: $0.31.46 3.10
OPEX(% capex)
Electrification: 0%Pipeline: 2% 8% 8%
Electricity required(% losses)
3% (losses) 3% (losses) – –
All hypotheses are described in
slide 134
(more details slides 65 to 69)
Power-to-gas: blending business case

147
2019: 1 MW 2025f: 10 MW 2030f: 100 MWB The levelized cost of energy (blending) could go down to $86 to $99 per MWh by 2030, making it competitive with biomass gas
Levelized cost of energy: injection($ per MWh–LHV)
Grid utilization
Wind
Solar
Grid wind
Grid solar
– As of today, injection on the gas grid is not competitive compared with natural gasor biomass.
– The capex required for an injection plant is not amortized because of low production levels.
– As production grows, capex for infrastructure and injection plant is amortized faster.
– Production from grid electricity is now competitive with biomass but may have CO2 impact.
– By 2030, gas injectionon the grid would be competitive with biogas.
1. Current natural gas price range: 25-50 $/MWh; 2. Current biogas price range 100-150$/MWhSources: “The Future of Hydrogen,” International Energy Agency, June 2019; “National Hydrogen Roadmap,” Commonwealth Scientific and Industrial Research Organisation, 2018; International Renewable Energy Agency; Kearney Energy Transition Institute analysis
168
214
331
177
189
57
71
180
284
71
71
16
15
16
672
36
254
430
264
276
126
149
210
128
136
3
136
6
36
7
516
23
46
170
241
137
146
95
81
81
88
88
1
1
4
2
2
1
3
21
291
99
86
87
91
Injection plantInfrastructureElectrolysis
Current biogas price range(2)
Current natural gas price range(1)
4.2 Business models – Business cases
B1a
Power-to-gas: blending business case

148
198
273
B Only injection plants connected to REN without grid back-up would help reduce CO2 emissions at a cost of $200 to $270 per tCO2
Netemitter CO2 emissions
reduction
Grid utilization
Wind
Solar
Grid wind
Grid solar
182
135
-250
-351
-538
Avoided CO2 emissions Abatement cost @ NG = $50 per MWh
CO2 neutrality: about 125g per kWhe
CO2 neutrality: about 220g per kWhe
CO2 neutrality: about 160g per kWhe
Avoided CO2 and abatement cost (2030, kgCO2/kgH2, $ per tCO2)
– The carbon abatement cost from wind powered electrolysis and H2 injection through P2G system would be in line with the IPCC recommendations on carbon price upper limit ($220 per tCO2).
– Other benefits, such as frequency balancing, jobs creation, and lower dependency to fossil fuels, are not included in the calculation and could further reduce the avoidance cost.
Notes: The hypothesis is detailed in the appendix. CO2 neutrality is defined as the maximum CO2 footprint from the power sector to reach carbon neutrality between natural gas and injection.Sources: Intergovernmental Panel on Climate Change; Kearney Energy Transition Institute analysis
– Natural gas emissions in combustion are around 200 kg per MWh.
– On average, if electrolyzer is connected to the grid to ensure a 90% service rate, P2G Injection systems will be net emitters of CO2.
– However, when purely coupled with renewables, 130 to 180 kg of CO2 per MWh LHV could be avoided.
IPCC 2°C carbon pricerecommendation, 2030
4.2 Business models – Business cases
B1a
Power-to-gas: blending business case
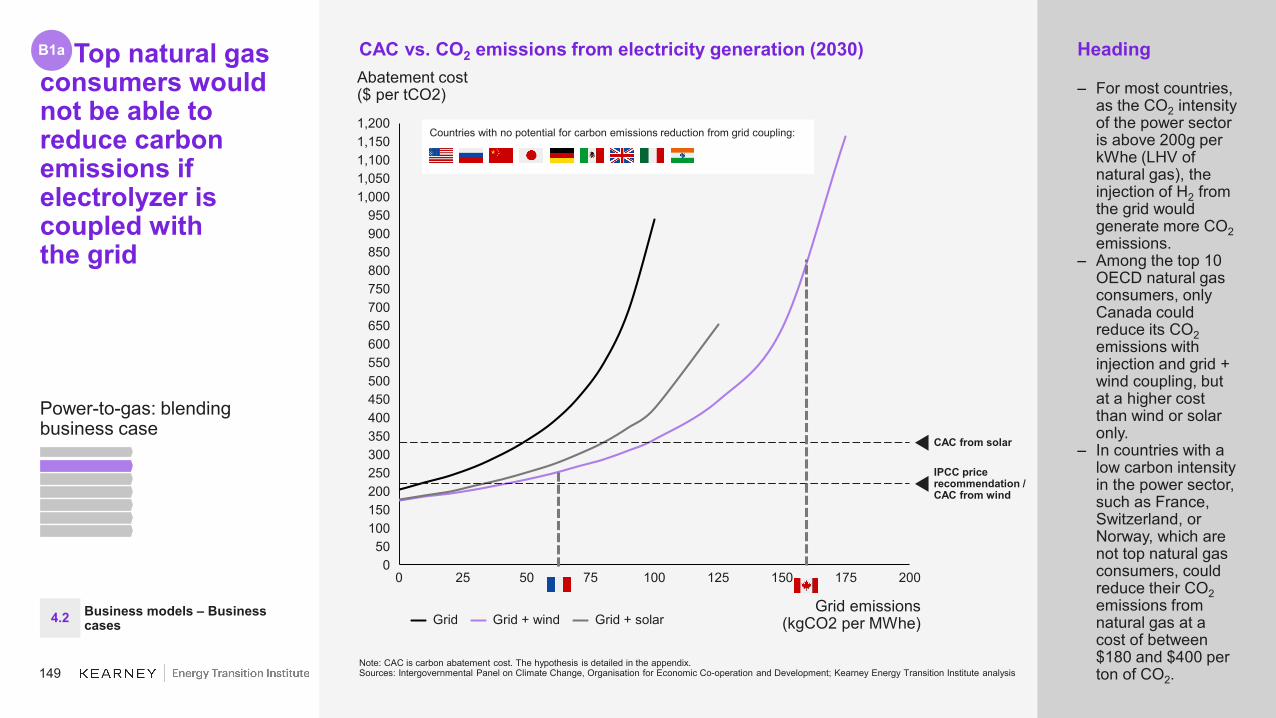
149
250
75
1,100
900
100
750
0
150
25
950
1,050
50 200150
500
125 175
1,2001,150
050
100
200
1,000
850
300
800
350
600550
400450
650700
Abatement cost($ per tCO2)
IPCC price recommendation /CAC from wind
Grid emissions(kgCO2 per MWhe)
CAC from solar
Countries with no potential for carbon emissions reduction from grid coupling:
Heading
– For most countries, as the CO2 intensity of the power sector is above 200g per kWhe (LHV of natural gas), the injection of H2 from the grid would generate more CO2emissions.
– Among the top 10 OECD natural gas consumers, only Canada could reduce its CO2emissions with injection and grid + wind coupling, but at a higher cost than wind or solar only.
– In countries with a low carbon intensity in the power sector, such as France, Switzerland, or Norway, which are not top natural gas consumers, could reduce their CO2emissions from natural gas at a cost of between $180 and $400 per ton of CO2.
B Top natural gas consumers would not be able to reduce carbon emissions if electrolyzer is coupled withthe grid
CAC vs. CO2 emissions from electricity generation (2030)
Note: CAC is carbon abatement cost. The hypothesis is detailed in the appendix.Sources: Intergovernmental Panel on Climate Change, Organisation for Economic Co-operation and Development; Kearney Energy Transition Institute analysis
Grid Grid + solarGrid + wind4.2 Business models – Business cases
B1a
Power-to-gas: blending business case

150
Performance issues
– Lower energy density (in volume) than methane, requiring end users to burn higher volume of gas
– Industrial sectors that rely on carbon content in natural gas (e.g. steel) needing to use higher volumes
Safety issues
– High flame velocity increasing risk of spreading and requiring new flame detectors for high blend ratios
– Corrosivity on old gas networks
Tolerance of selected elements
B The hydrogen injection potential is limited in volume by end applications for safety and performance reasons
Injection on highly connected grids will be limited by end use applications. However, injection on local networks has greater potential .
Sources: “The Future of Hydrogen,” International Energy Agency, June 2019; Kearney Energy Transition Institute analysis
Distribution
Cooking
50%
Gas meters
Undergroundstorage
Compressors
2%
Transmission
Boilers
2%
Engines
Gasturbines
CNG tanks
100%
5%
50%
20%
10%
30%
2%
30%
30%
Allowable under certain circumstances
Gas grid
Applications
4.2 Business models – Business cases
Limits of hydrogen injection on gas networks (% of volume)B1a
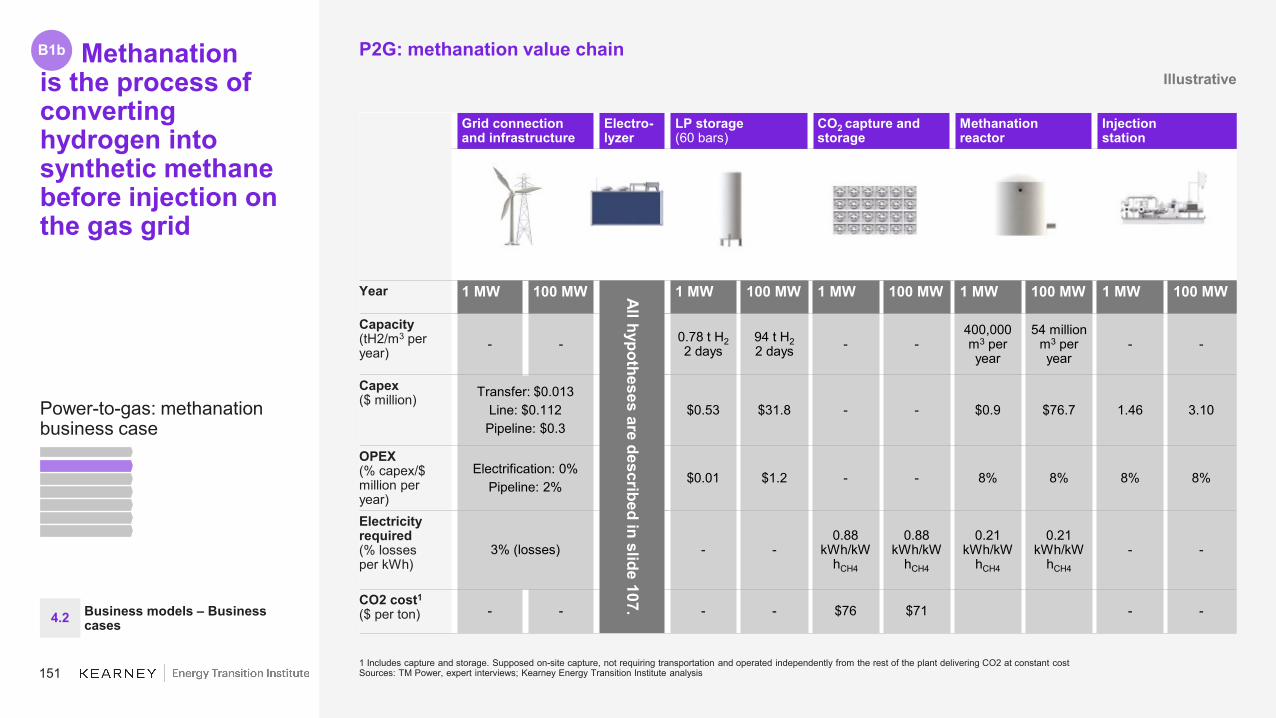
151
B Methanationis the process of converting hydrogen into synthetic methane before injection on the gas grid
P2G: methanation value chain
1 Includes capture and storage. Supposed on-site capture, not requiring transportation and operated independently from the rest of the plant delivering CO2 at constant costSources: TM Power, expert interviews; Kearney Energy Transition Institute analysis
Grid connection and infrastructure
Electro-lyzer
LP storage(60 bars)
CO2 capture and storage
Methanationreactor
Injectionstation
Year 1 MW 100 MW All hypotheses are described in slide 107.
1 MW 100 MW 1 MW 100 MW 1 MW 100 MW 1 MW 100 MW
Capacity(tH2/m3 per year)
- - 0.78 t H22 days
94 t H22 days - -
400,000 m3 per year
54 million m3 per year
- -
Capex($ million) Transfer: $0.013
Line: $0.112Pipeline: $0.3
$0.53 $31.8 - - $0.9 $76.7 1.46 3.10
OPEX(% capex/$ million peryear)
Electrification: 0%Pipeline: 2%
$0.01 $1.2 - - 8% 8% 8% 8%
Electricity required(% lossesper kWh)
3% (losses) - -0.88
kWh/kWhCH4
0.88 kWh/kW
hCH4
0.21 kWh/kW
hCH4
0.21 kWh/kW
hCH4
- -
CO2 cost1
($ per ton) - - - - $76 $71 - -4.2 Business models – Business cases
B1b
Illustrative
Power-to-gas: methanation business case
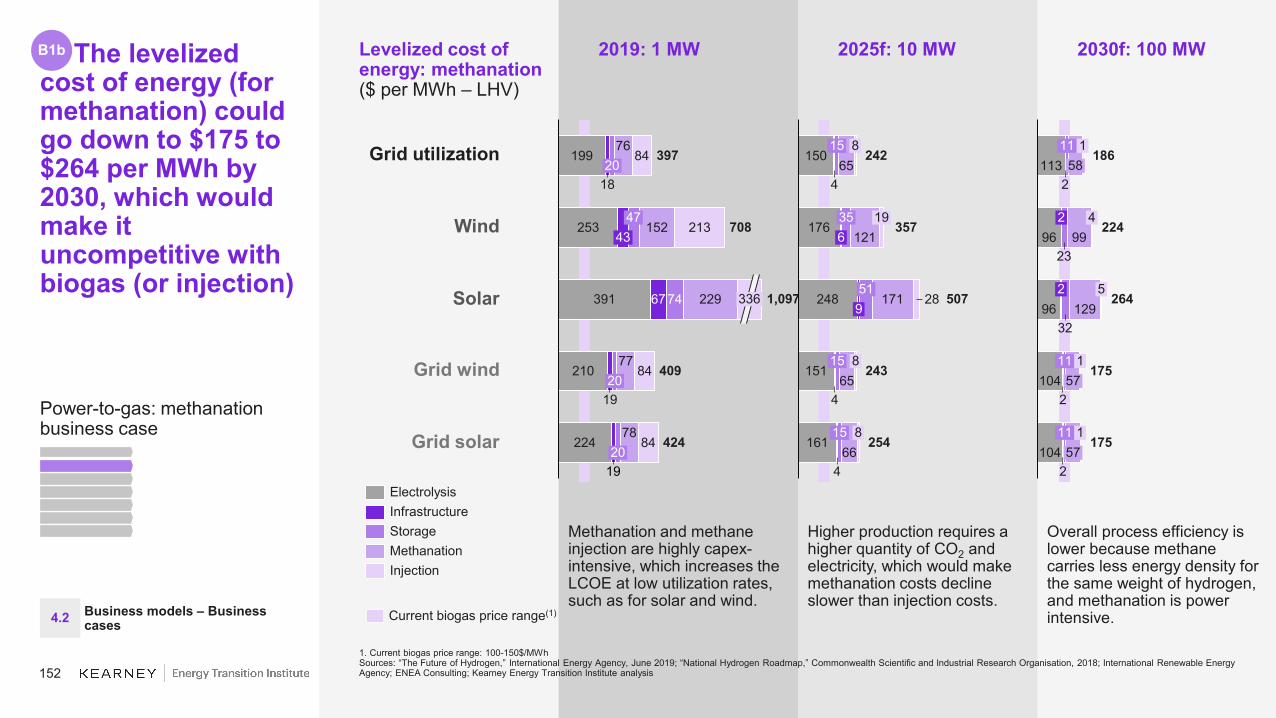
152
2019: 1 MW 2025f: 10 MW 2030f: 100 MWB The levelized cost of energy (for methanation) could go down to $175 to $264 per MWh by 2030, which would make it uncompetitive with biogas (or injection)
Levelized cost of energy: methanation ($ per MWh – LHV)
Grid utilization
Wind
Solar
Grid wind
Grid solar
Methanation and methane injection are highly capex-intensive, which increases the LCOE at low utilization rates, such as for solar and wind.
Higher production requires a higher quantity of CO2 and electricity, which would make methanation costs decline slower than injection costs.
Overall process efficiency is lower because methane carries less energy density for the same weight of hydrogen, and methanation is power intensive.
1. Current biogas price range: 100-150$/MWhSources: “The Future of Hydrogen,” International Energy Agency, June 2019; “National Hydrogen Roadmap,” Commonwealth Scientific and Industrial Research Organisation, 2018; International Renewable Energy Agency; ENEA Consulting; Kearney Energy Transition Institute analysis
199
253
391
210
224
18
67
19
19
74
76
152
229
77
78
84
213
84
84
336
20
4347
20
20
397
708
1,097
409
424
Storage
Electrolysis
Injection
Infrastructure
Methanation
150
176
248
151
161
4
4
4
65
121
171
65
66
28
15
6
51
19
8
15
35
9
15 8
8
242
357
507
243
254
113
96
96
104
104
2
2
2
23
32
99
129
5811
2
4
57
2
5
11
11 1175
186
224
264
175
57
1
1
Current biogas price range(1)4.2 Business models – Business cases
Power-to-gas: methanation business case
B1b

153
160
71
-661
-853
-1,209
B The carbon cost would need to be priced at $1,100 to $3,000 per tCO2 to make a methanation solution competitive with natural gas prices
Avoided CO2 and abatement cost (2030, kgCO2 per MWh, $ per tCO2)
Grid utilization
Wind
Solar
Grid wind
Grid solar
– Wind-powered electrolysis and methanation could be competitive with methane if CO2 were priced around $1,300 per ton, which is unlikely to happen as the IPCC CO2 price scenario varies from $15 to $220 per ton in the 2°C scenario to more than $6,000 per t in the 1.5°C scenario.
Note: Hypothesis detailed in the appendix. CO2 neutrality is defined as the maximum CO2 footprint from the power sector to reach carbon neutrality between SMR and electrolysis.Sources: Intergovernmental Panel on Climate Change; Kearney Energy Transition Institute analysis
Avoided CO2 emissions Abatement cost @ natural gas $50 per MWh
– Natural gas emissions in combustion are around 200 kg per MWh.
– With a low-carbon electrical mix, CO2emissions are always below when hydrogen is produced, even if connected to the electrical grid.– If CO2 emissions for electricity
production are above 65 g per kWh, hydrogen from grid would be a net emitter.
CO2 neutrality: about 65gper kWhe
CO2 neutrality: about 120gper kWhe
CO2 neutrality: about 75gper kWhe
IPCC 2°C carbon pricerecommendation, 2030
Netemitter
CO2 emissions reduction
1,089
2,994
4.2 Business models – Business cases
Power-to-gas: methanation business case
B1b

154
8,000
75 1500 25 125
8,500
50 175
6,000
5,000
200
5,500
0
500
1,000
1,500
2,000
100
2,500
3,000
3,500
4,000
4,500
6,500
7,000
7,500
IPCC price recommendation
Grid emissions(kgCO2 per MWhe)
CAC from solar
CAC from wind
Abatement cost($ per tCO2)
Countries with no potential for carbon emissions reduction from grid coupling:
Heading
– For most countries, because the CO2intensity of the power sector is above 200g per kWhe (LHV of natural gas), methanation of H2 from the grid would generate more CO2emissions.
– Because methanation is power intensive, a carbon intensity below 120 g per kWh is required to reduce CO2 emissions if connected with the grid.
– For France, carbon avoidance cost is cheaper with a fully wind-powered electrolyzer with no grid connection but still higher than the IPCC’s recommendation.
– Countries with a carbon intensity below 25 g per kWhewould benefit from connecting the electrolyzer to the grid.
The carbon abatement cost appears to always be higher thanthe IPCC recommendation, even if electrical mix is fully decarbonized
Notes: CAC is carbon abatement cost. The hypothesis is detailed in the appendix.Sources: Intergovernmental Panel on Climate Change, Organisation for Economic Co-operation and Development; Kearney Energy Transition Institute analysis
Grid Grid + solarGrid + wind4.2 Business models – Business
cases
CAC vs. CO2 emissions from electricity generation (2030)
Power-to-gas: methanation business case
B1b

155
B Power-to-power requires high-pressure storage to feedthe fuel cell for electricity generation
P2P value chain
Sources: ENEA Consulting; ITM Power; “The Future of Hydrogen,” International Energy Agency, June 2019; expert interviews; Kearney Energy Transition Institute analysis
Illustrative
Grid connection and infrastructure
Electro-lyzer
LP storage(60 bars) Compression HP storage
(900 bars) Stationary fuel cell
Year 1 MW 100 MW All hypotheses are described in slide 107.
1 MW 100 MW 1 MW 100 MW 1 MW 100 MW 1 MW 100 MW
Capacity(tH2 per MW) - - 0.78 t H2
2 days94 t H22 days - - 16 kg H2
1 hour2 t H21 hour 1 MW 100 MW
Capex($ million) Transfer: $0.013
Line: $0.112Pipeline: $0.3
$0.53 $31.8 0.3 17.6 $0.045 $3.4 $1.1 $50.6
Opex(% capex/$ million peryear)
Electrification: 0%Pipeline: 2%
$0.01 million
$1.2 million 6% 6% $0.01
million$0.9
million 4% 2%
Electricity required(% lossesper kWh)
3% (losses) - - 8.3 kWh/kg
3.0 kWh/kg - -
Efficiency (%)- - 65% 70%
4.2 Business models – Business cases
B2
P2P: Energy Storage System business case

156
2019: 1 MW 2025f: 10 MW 2030f: 100 MW
259
329
509
273
291
24
88
24
25
38
40
42
178
281
30
458
3070
109
695670
701
106
70
3070
437
421 181
213
300
182
194
5
7
11
5
5
21
21
22
161
287
274
2244
22
48411
108
49590
69
44
2244
272
34
136
125
125
3
2
2
3
3
15
25
15
15
45
17
192
51
268
17
11633
11672
2117
228
180
180
21
33
21
B The levelized cost of electricity from power-to-power could vary from $180 to $270 per MWhe by 2030
Levelized cost of energy: Power($ per MWhe)
Grid utilization
Wind
Solar
Grid wind
Grid solar
– P2P systems are capital-intensive as they require electrolyzer, fuel cell, storage tanks, and compressor.
– Low-pressure tanks could store up to two days of production to ensure business continuity even during renewable disruptions. If needed, trailers could supply additional H2 to the plant (not included in calculations).
– High-pressure tanks and fuel cells delivers electricity to the grid, with a capacity of 70 MWhe and a maximum power output of 100 MW.
– Additional capacity and power output would increase HP storage and fuel cell capex and overall LCOE.
1. Current ESS battery price range: 100-200 $/MWhSources: “The Future of Hydrogen,” International Energy Agency, June 2019; “National Hydrogen Roadmap,” Commonwealth Scientific and Industrial Research Organisation, 2018; International Renewable Energy Agency; Lazard; Kearney Energy Transition Institute analysis
Fuel CellStorage (LP & HP)
InfrastructureCompression
Electrolysis
Current ESS battery price range
4.2 Business models – Business cases
1,092
B2
P2P: Energy Storage System business case

157
Heading
– Spot prices are below $100 per MWh 99% of the time.– Producing
hydrogen during low spot prices and providing electricity to the grid when prices are higher than production costs appears to have low potential as LCOE from P2P may always be higher than spot prices, except for a few hours per year.
– P2P systems can also provide grid flexibility and help load management.
B Selling P2P electricity on the spot market appears to be very opportunistic as prices are over LCOE less than 1% of the time
EPEX spot prices: selected countries(2018, highest prices on 1,000 hours, $ per MWh)
Sources: Energi Data Service; European Network of Transmission System Operators; “The Future of Hydrogen,” International Energy Agency, June 2019; “National Hydrogen Roadmap,” Commonwealth Scientific and Industrial Research Organisation, 2018; International Renewable Energy Agency; Kearney Energy Transition Institute analysis
99%88% 91%89% 100%93%90% 92% 94% 95% 96% 97% 98%0
50
100
150
200
250
300
Wind2030
Grid 2030Grid + solar2030
France Germany DK1 SE3NO2
88 hours per year
4.2 Business models – Business cases
B2
P2P: Energy Storage System business case
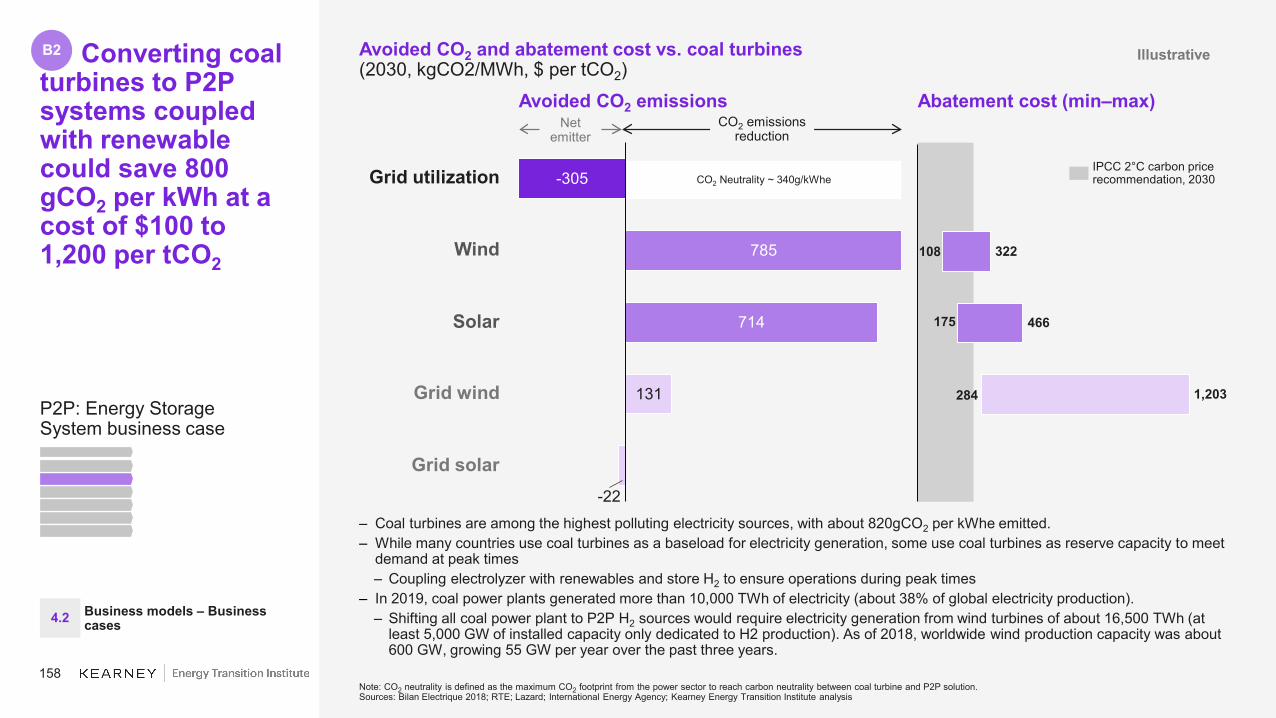
158
108
466
322
1,203
-305
785
714
131
-22
B Converting coal turbines to P2P systems coupled with renewable could save 800 gCO2 per kWh at a cost of $100 to 1,200 per tCO2
Netemitter
CO2 emissions reduction
Grid utilization
Wind
Solar
Grid wind
Grid solar
Avoided CO2 emissions Abatement cost (min–max)
CO2 Neutrality ~ 340g/kWhe
Avoided CO2 and abatement cost vs. coal turbines(2030, kgCO2/MWh, $ per tCO2)
Note: CO2 neutrality is defined as the maximum CO2 footprint from the power sector to reach carbon neutrality between coal turbine and P2P solution.Sources: Bilan Electrique 2018; RTE; Lazard; International Energy Agency; Kearney Energy Transition Institute analysis
– Coal turbines are among the highest polluting electricity sources, with about 820gCO2 per kWhe emitted.– While many countries use coal turbines as a baseload for electricity generation, some use coal turbines as reserve capacity to meet
demand at peak times– Coupling electrolyzer with renewables and store H2 to ensure operations during peak times
– In 2019, coal power plants generated more than 10,000 TWh of electricity (about 38% of global electricity production).– Shifting all coal power plant to P2P H2 sources would require electricity generation from wind turbines of about 16,500 TWh (at
least 5,000 GW of installed capacity only dedicated to H2 production). As of 2018, worldwide wind production capacity was about 600 GW, growing 55 GW per year over the past three years.
IPCC 2°C carbon pricerecommendation, 2030
Illustrative
4.2 Business models – Business cases
B2
175
284P2P: Energy Storage System business case

159
Countries with no potential for carbon emissions reduction from grid coupling:
Heading
– P2P systems connected to the grid and REN could save CO2 emissions from coal turbines if CO2 intensity from power sector does not exceed 500g(grid + wind case).
– For top coal consumer countries, coupling electrolyzerwith the grid would not allow for reducing CO2emissions, except for Russia and the United States.– However, the
carbon avoided cost is higher than a wind-powered electrolyzer.
– Countries with an average low carbon footprint from electricity generation (below 200g per kWh) could reduce CO2 emissions from coal turbines at an abatement cost of $45 to $100 per tCO2.
B The top coal consumers would not reduce CO2emissions by coupling electrolyzerwith grid, except the United States and Russia, but at a higher cost than RES
CAC vs. CO2 emissions from electricity gen. (2030)
Note: CAC is carbon abatement cost. The hypothesis is detailed in the appendix.Sources: Intergovernmental Panel on Climate Change, Organisation for Economic Co-operation and Development; Kearney Energy Transition Institute analysis
3000 250
250
300
50 150 350100 200 400
350
450 600500 550
400
0
50
100
150
200
Avoidance cost($ per tCO2)
Solar 2030
IPCC price recommendation
Wind 2030
Grid emissions(kgCO2 per MWhe)
Grid + solar
GridGrid + wind
4.2 Business models – Business cases
B2
P2P: Energy Storage System business case

160
Business case review
– Electrolyzer will be connected to the grid with the following revenue streams:– Supply of hydrogen to
refinery (1% of refinery demand)
– Load management for refinery site
– Grid balancing– If produced from RES,
electrolyzer could save up to 16 ktCO2 per year at the refinery.
– In the future, hydrogen will also be supplied to other local users, such as bus networks.
– Total investment is about €20 million, with financing from the European Union.
– To achieve 100% green hydrogen production, the electrolyzer size needs to reach 1 GW.
Integration of a 10 MW PEM electrolyzer
– Test economical, technical, and environmentalimpact of the solution
Shell refinery in WesselingCurrent situation
– The refinery supplies 10 to 15% of Germany’s fuel needs.
– Hydrogen produced by steam methane reforming, with about 180 kTH2 every year
– CO2 emissions from SMR at Wesseling amounts to about 1.6 to 2.0 mtCO2per year.
B Green H2 can be produced in chemical plantsor refineries to provide a decarbonized feedstock
REFHYNE project overview(Pilot project)
Munich
Stuttgart
Frankfurt
Berlin
Dusseldorf
Shell
4.2 Business models – Business cases
B3
Power-to-chemical: business case refining
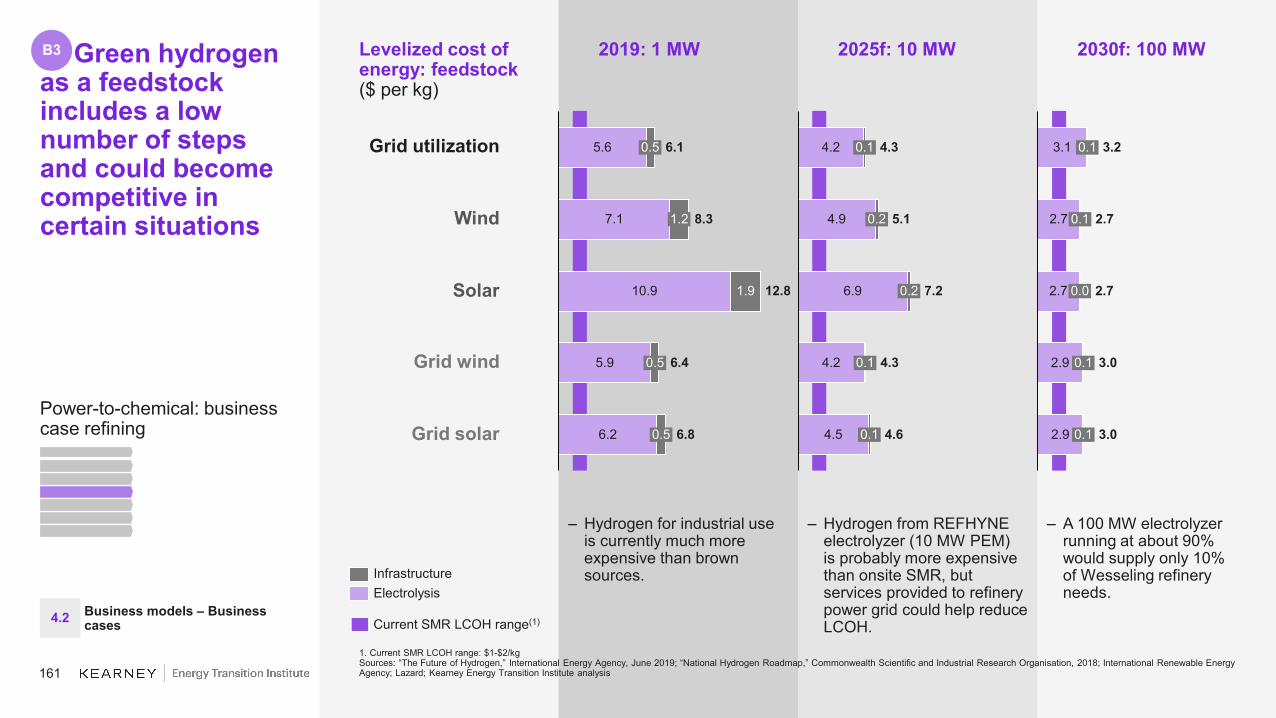
161
2019: 1 MW 2025f: 10 MW 2030f: 100 MW
7.1
12.8
6.10.5
1.2
6.4
8.3
0.5
0.5 6.8
5.6
10.9 1.9
5.9
6.2
0.2
0.1
0.2
0.14.2
4.3
0.1
7.2
5.1
4.3
4.6
4.2
4.9
6.9
4.5
0.0
0.1
0.1
0.1
0.1
3.2
2.7
2.7
3.0
3.0
3.1
2.7
2.7
2.9
2.9
B Green hydrogen as a feedstock includes a low number of steps and could become competitive in certain situations
Levelized cost of energy: feedstock($ per kg)
Grid utilization
Wind
Solar
Grid wind
Grid solar
– Hydrogen for industrial use is currently much more expensive than brown sources.
– Hydrogen from REFHYNE electrolyzer (10 MW PEM)is probably more expensive than onsite SMR, but services provided to refinery power grid could help reduce LCOH.
– A 100 MW electrolyzerrunning at about 90%would supply only 10%of Wesseling refineryneeds.
1. Current SMR LCOH range: $1-$2/kgSources: “The Future of Hydrogen,” International Energy Agency, June 2019; “National Hydrogen Roadmap,” Commonwealth Scientific and Industrial Research Organisation, 2018; International Renewable Energy Agency; Lazard; Kearney Energy Transition Institute analysis
Current SMR LCOH range(1)
ElectrolysisInfrastructure
4.2 Business models – Business cases
B3
Power-to-chemical: business case refining

162
CO2 neutrality:about 200g per kWhe-13
10
9
-4
-7
B Reducing carbon emissions is only possible with renewable sources coupling, with an abatement cost of $129 to $150 per ton
Netemitter
CO2 emissions reduction
Grid utilization
Wind
Solar
Grid wind
Grid solar
Avoided CO2 emissions Avoidance cost vs. SMR
Avoided CO2 and avoidance cost vs. SMR(2030, kgCO2/kgH2, $ per tCO2, based on world electrical mix)
Notes: The hypothesis is detailed in the appendix. CO2 neutrality is defined as a maximum CO2 footprint from the power sector to reach carbon neutrality between SMR and electrolysis.Sources: Intergovernmental Panel on Climate Change; Kearney Energy Transition Institute analysis
– Only electrolyzers powered by renewable sources would have a positive impact on CO2 emissions compared with SMR.
IPCC 2°C carbon pricerecommendation, 2030
CO2 neutrality:about 350g per kWhe
CO2 neutrality:about 275g per kWhe
129
150
– The abatement cost is similar to the one from centralized ATR blue production in business case n°1 (100 to 150 $ per tCO2). However,it might be more competitive for existing chemical plants and refineries to add CCSto existing SMR.
– Further services provided by electrolyzer, such as power consumption optimization, might help reduce the abatement cost.
4.2 Business models – Business cases
B3
Power-to-chemical: business case refining
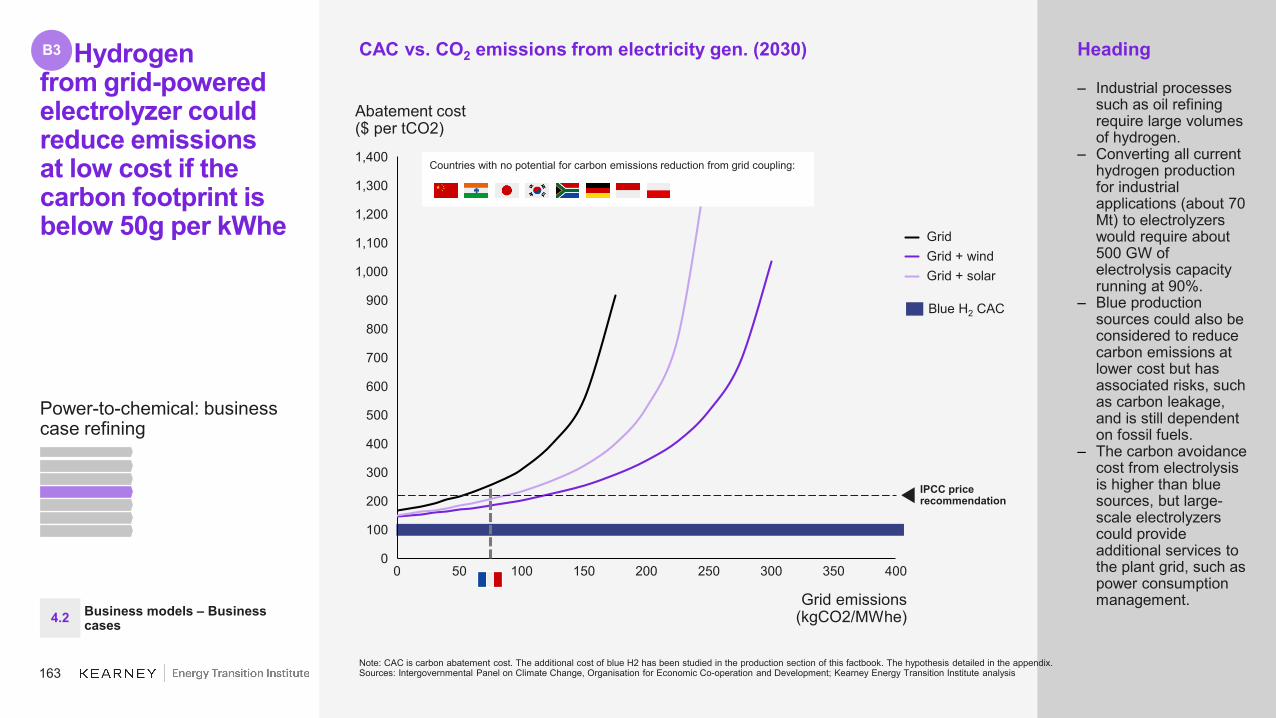
163
3502500
400
50 150100
1,400
200 300 4000
100
1,300
200
300
500
600
700
800
900
1,200
1,100
1,000
Grid emissions(kgCO2/MWhe)
Abatement cost($ per tCO2)
IPCC price recommendation
Countries with no potential for carbon emissions reduction from grid coupling:
Heading
– Industrial processes such as oil refining require large volumes of hydrogen.
– Converting all current hydrogen production for industrial applications (about 70 Mt) to electrolyzerswould require about 500 GW of electrolysis capacity running at 90%.
– Blue production sources could also be considered to reduce carbon emissions at lower cost but has associated risks, such as carbon leakage, and is still dependent on fossil fuels.
– The carbon avoidance cost from electrolysis is higher than blue sources, but large-scale electrolyzerscould provide additional services to the plant grid, such as power consumption management.
B Hydrogenfrom grid-powered electrolyzer could reduce emissionsat low cost if the carbon footprint is below 50g per kWhe
CAC vs. CO2 emissions from electricity gen. (2030)
Note: CAC is carbon abatement cost. The additional cost of blue H2 has been studied in the production section of this factbook. The hypothesis detailed in the appendix.Sources: Intergovernmental Panel on Climate Change, Organisation for Economic Co-operation and Development; Kearney Energy Transition Institute analysis
Grid + windGrid
Grid + solar
Blue H2 CAC
4.2 Business models – Business cases
B3
Power-to-chemical: business case refining
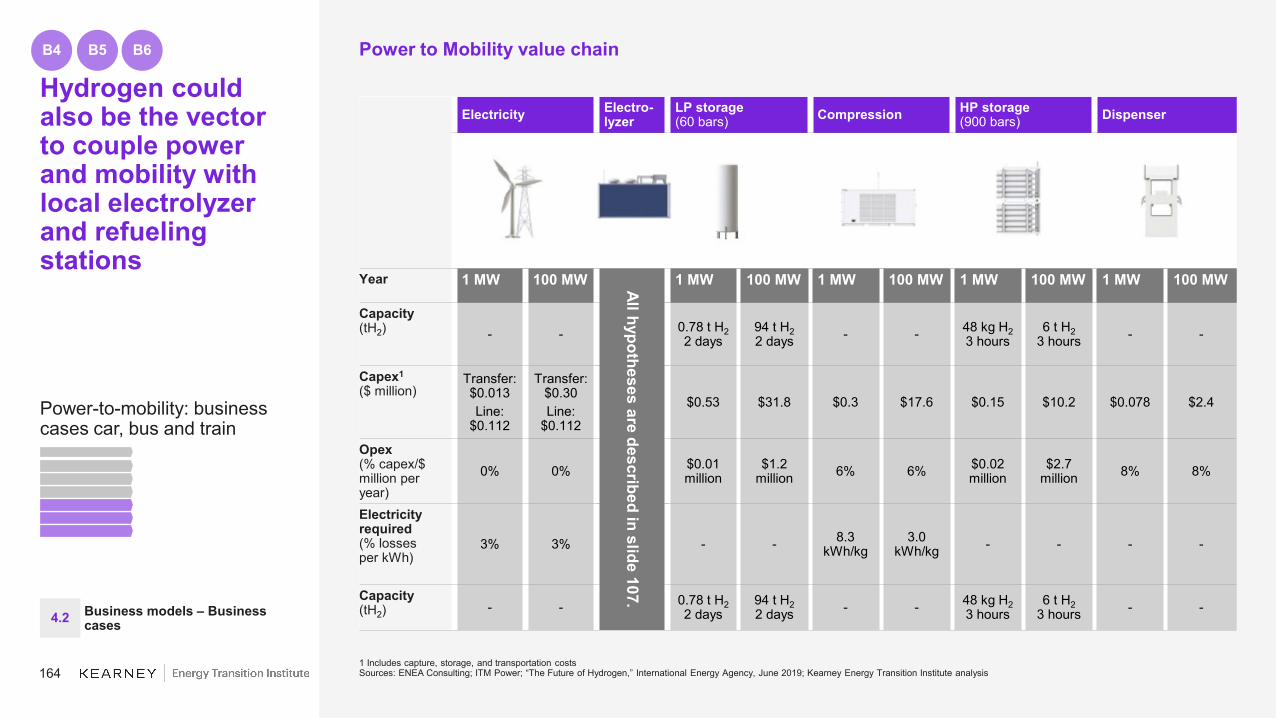
164
Hydrogen could also be the vector to couple power and mobility with local electrolyzerand refueling stations
Power to Mobility value chain
1 Includes capture, storage, and transportation costsSources: ENEA Consulting; ITM Power; “The Future of Hydrogen,” International Energy Agency, June 2019; Kearney Energy Transition Institute analysis
Electricity Electro-lyzer
LP storage(60 bars) Compression HP storage
(900 bars) Dispenser
Year 1 MW 100 MW All hypotheses are described in slide 107.
1 MW 100 MW 1 MW 100 MW 1 MW 100 MW 1 MW 100 MW
Capacity(tH2) - - 0.78 t H2
2 days94 t H22 days - - 48 kg H2
3 hours6 t H2
3 hours - -
Capex1
($ million)Transfer: $0.013Line:
$0.112
Transfer: $0.30Line:
$0.112
$0.53 $31.8 $0.3 $17.6 $0.15 $10.2 $0.078 $2.4
Opex(% capex/$ million peryear)
0% 0% $0.01 million
$1.2 million 6% 6% $0.02
million$2.7
million 8% 8%
Electricity required(% lossesper kWh)
3% 3% - - 8.3 kWh/kg
3.0 kWh/kg - - - -
Capacity(tH2) - - 0.78 t H2
2 days94 t H22 days - - 48 kg H2
3 hours6 t H2
3 hours - -4.2 Business models – Business
cases
B4 B5 B6
Power-to-mobility: business cases car, bus and train

165
2025f: 10 MW2019: 1 MW
4
5
7
4
4
0
0
0
1
1
1
2
0
0
0
0 5 10 15 20
0
0
0
1
1
0
0
01
1
5
7
10
5
6
2030f: 100 MW
6
7
11
6
6
1
2
1
1
2
1
1
2
3
0 5 10 15 20
9
0
1
12
0
1
1
10
0
8
18
8
1
1
1
3
3
3
3
3
0
0
0
1
1
0
0
0
0 5 10 15 20
01
00
0
0
0
0
0
00
4
5
4
4
4
1
Overall LCOH could go as low as $4 to $5 per kg by 2030 and become more competitive than ICE fuels (however total cost of ownership should also be considered)
Levelized cost of hydrogen: mobility($ per kg)
Grid utilization
Wind
Solar
Grid wind
Grid solar
– P2M systems are capital-intensive as they require electrolyzer, dispenser, storage tanks, and compressor.
– Storage tanks aredesigned to store twodays of production at 100% utilization rate. When the utilization rate is low,storage costs are high.
– Grid-connected electrolyzercould be considered as a business case if electricity generation emissions do not overcome emissions from internal combustion engines.
1 Considering 6 to 10L/100km of fuel consumption at $1 per L, equivalent to 6-10 $/kg of hydrogen. Full comparison between ICE and FCEV also presented in the following slides.Sources: “The Future of Hydrogen,” International Energy Agency, June 2019; “National Hydrogen Roadmap,” Commonwealth Scientific and Industrial Research Organisation, 2018; International Renewable Energy Agency; ENEA Consulting; Kearney Energy Transition Institute analysis
Current internal combustionengine fuels pricerange1
Electrolysis
Dispenser
CompressionLP and HP storage
Infrastructure
4.2 Business models – Business cases
B4 B5 B6
Power-to-mobility: business cases car, bus and train

166
Investment costs
Investment costs per refueling ($/refueling)
Space requirements
Space required to service (same number of vehicles, comparative basis)
Refueling speed
Refueling speed(s per 100km ofrefueling)
Faster refueling time for hydrogen-based vehicles also leads to less space requirements and lower investment costs
– Hydrogen refueling takes one tenth to one fifteenth of the time fast charging demands.
– Charging times (HRS vs EV)– Bus: 7–15 mins vs. several
hours– Car: 3–4 mins vs. 4 hours– Forklift: 1–3 mins vs. 25 mins– Scooter: less than 1 minute
vs 4–8 hours– Train: 15 minutes vs.
45 minutes
– When fully utilized, HRS are estimated to cost only half of the capex per refuelingcompared with fast chargers.
– Lower costs present an attractive business case for operators.
– Fast-charging stations handling the same number of vehicles need 10 to 15 times the space of a comparable HRS.
– One HRS with four dispensers could potentially replace 60 fast-charger stations.
– Beneficial to the customer and for municipalities with space constraints
48 65
Petrol H2 station (HRS)
Electric fast charger
1,000
15x
0.7
HRSPetrol Fast charger
4.0
8.5
2x
HRS Fast charger
10-15x
Space requirements and investment costs for HRS Average Estimates
Note: HRS is hydrogen refueling station. Source: Kearney Energy Transition Institute analysis
4.2 Business models – Business cases
B4 B5
Power-to-mobility: business cases car, bus and train
B6

167
Investment costs
– About 24 to 32% of costs are driven by fuel cells. Cost reduction will help improve FCEV cars’ competitiveness.
– Today’s FCEVs have a broader range per tank than most BEV (400–600 km vs. 250–400 km). However, TCO is higher.
– Acquisition and infrastructure cost are higher.
– Utilization of infrastructure is key for competitiveness of FCEV. For example, a 200 kg H2 station at 10% adds a marginal LCOH of $13 per 100km vs. $4 per 100 km if utilized at 33%.
– In the long term, the TCO for FCEV will be comparable with BEV, which would have by then an extended range as well.
– Consumers could also value qualitative benefits in addition to TCO, such as charging time and infrastructure deployment.
TCO for a H2 car could compete with a traditional ICE engine if refueling stations are not under-used
Long-term2019
5
BEV 250 km
30
FCEV 400 km
30
5
ICE Hybrid
8
30
66
3
9
2
0
1
5
2
6
44
65
56
50
46 46
41
3030 30
2
ICE Hybrid
4
BEV 400 km
BEV 400 km
18
05
21
6
5
FCEV 400 km
1
5
2
30
11
+16%
Refueling, charging
Operations and maintenance
Base car costBattery, fuel cell
Electricity, fuel
4.2 Business models – Business cases
B4
Note: The hypotheses are detailed in the appendix.Sources: “The Future of Hydrogen,” International Energy Agency, June 2019; Kearney Energy Transition Institute analysis
Total cost of ownership: cars (2019–long term, $ per 100 km)
Power-to-mobility: business case car

168
0.1
22000.0
0.6
2.3
440340200
0.4
0.9
240 260
1.0
280 300
1.1
640320
0.5
360 380 500400
0.8
420 460 480
0.3
0.2
0.7
660520 600540 560 580 620 680
Hyundai Tucson FCEV
Range (km)
Toyota Mirai JAP
Renault ZOE
Toyota Mirai GER
Tesla Model S
LCOM($ per km)
Huyndai Nexo
Hyundai IONIQeKia e-NIRONissan LEAF
Porsche Taycan Turbo S
Honda Clarity FC
Hydrogen cars have ranges close to high-end BEVs and at a lower cost, but TCO remains higher than mid-end BEVs
LCOM and range for selected models(2019; X axis: range in km; Y axis: LCOM in $ per km)
1 Car price: $20,000; fuel consumption: 6.0L/100kmSources: BNEF; “The Future of Hydrogen,” International Energy Agency, June 2019; Kearney Energy Transition Institute analysis
Non-Exhaustive
FCEV BEV
FCEV mid-class models have a range higher than entry-level BEV but are still slightly more expensive.
Entry level BEV, with low TCO but low operating range
H2 price: $7.40 per kg (refueling LCOH, grid, 2019)Electricity price: $52 per MWhe + 30% for charging station
ICE car reference1
Luxury model with high performances (acceleration and speed), comparable or higher range than FCEV and high TCO
4.2 Business models – Business cases
B4
Power-to-mobility: business case car

169
30
600100
40
400200 700
95
0
100
300
50
500
15
510
65
800
2025
35
75
45
5560
70
908580
2030 LIB price$62 per kWh
Vehicle range(km)
2024 LIB price$94 per kWh
Long-term projected costof fuel cell
Fuel cell capex($ per kW)
Further considerations
– Charging time: See slide 130.– CO2 emissions: End-to-end CO2 emissions
have to be evaluated, including battery and fuel cell production and recycling as well as fuel production (either H2 or electricity).
– For a 500 km range, the FCEV car price could reach about $30,000 by 2030 compared with $35,000 for a BEV.
How to read
– In 2024, lithium–ion batteries for vehicles are expected to cost $94 per kWh.
– To be competitive, fuel cells in FCEV will have to be below the red-line boundary.– For a 400-km range vehicle, fuel cell costs
have to be lower than $50 per kW.– In 2030, LIB cost is expected to go as low as
$62 per kWh.– For a 400-km range vehicle, fuel cell costs
have to be lower than $25 per kW.– By 2030, the Department of Energy expects
that the cost of fuel cells will go down to $30 per kW.
In the long term, FCEV is expected to be more competitive than BEV if the vehicle range is 200 to 400 km
Note: Hypotheses from the International Energy Agency are detailed in the appendix.Sources: BNEF; “The Future of Hydrogen,” International Energy Agency, June 2019; Kearney Energy Transition Institute Analysis
BEV cheaper
FCEV cheaper
Competitiveness FCEV vs. BEV(X axis: range in km; Y axis: FC cost in $ per kW)
4.2
B4
Business models – Business cases
Power-to-mobility: business case car

170
CO2 avoidance cost(2030, $ per ton)
CO2 avoided1
(2030, kgCO2/100km)Carbon abatement cost is lower for short-range BEVs if charging stations are coupled with wind and grid, but FCEVs would save more CO2 at a lower cost for long ranges
1. Including battery manufacturing footprintSources: “The Future of Hydrogen,” International Energy Agency, June 2019; Commonwealth Scientific and Industrial Research Organisation; Pau; ITM Power; RTE; CRMT; Kearney Energy Transition Institute analysis
-5
3
15
1
4
-3
1
Grid + wind
Grid Grid + wind
Grid + wind
Wind Grid Grid
FCEV carPrice: $28,000Range: 600 km
Consumption: 0.8kg/100km
BEV car1Price: $30,000Range: 400 kmConsumption:
17.1 kWH
BEV Car1Price: $34,000Range: 600 km
Consumption 18.1 kWh
Net emitter of CO2
619 471
WindGrid GridGrid + wind
2,159
Grid Grid + wind
Grid + wind
3,410
6,875
FCEV carPrice: $28,000Range: 600 km
Consumption: 0.8kg/100km
BEV car1Price: $30,000Range: 400 km
Consumption 17.1 kWH
BEV car1Price: $34,000Range: 600 km
Consumption: 18.1 kWh
Net emitter of CO2
4.2 Business models – Business cases
B4
Power-to-mobility: business case car

171
4,750
0
4,250
3,500
050 100 250200
3,750
150
2,500
350300 400
4,500
450
1,000
700500
5,500
2,750
2,250
550 600 800650 750
250500750
1,2501,5001,7502,000
3,0003,250
4,000
5,0005,250
Grid emissions(kgCO2/MWhe)
FCEV Wind 2030
Avoidance cost($ per tCO2)
IPCC price recommendation
Countries with no potential for carbon emissions reduction from grid coupling:
Key comments
– Wind-powered electrolyzer has a lower CAC than grid-connected hydrogen stations unless grid emissions are below 200g per kWhe.– However, a 400-
km range BEV has a lower carbon avoidance cost until grid emissions reach 300 to 550 g per kWhe.
– A 600-km range BEV has high avoidance cost due to higher battery carbon footprint and higher electricity consumption per km.
As emissions from the grid grow, FCEV would save more CO2 than 600-km range BEV, but for 400 km, BEV would still be better
CAC vs. CO2 emissions from electricity generation(2030, selected countries)
Note: CAC is carbon abatement cost. The hypothesis is detailed in the appendix.Sources: Intergovernmental Panel on Climate Change, Organisation for Economic Co-operation and Development; Kearney Energy Transition Institute analysis
FCEV: grid + windFCEV: grid
BEV: 400 km–grid + wind
BEV: 400 km–gridBEV: 600 km–grid
BEV: 600 km–grid + wind
4.2 Business models – Business cases
B4
Power-to-mobility: business case car
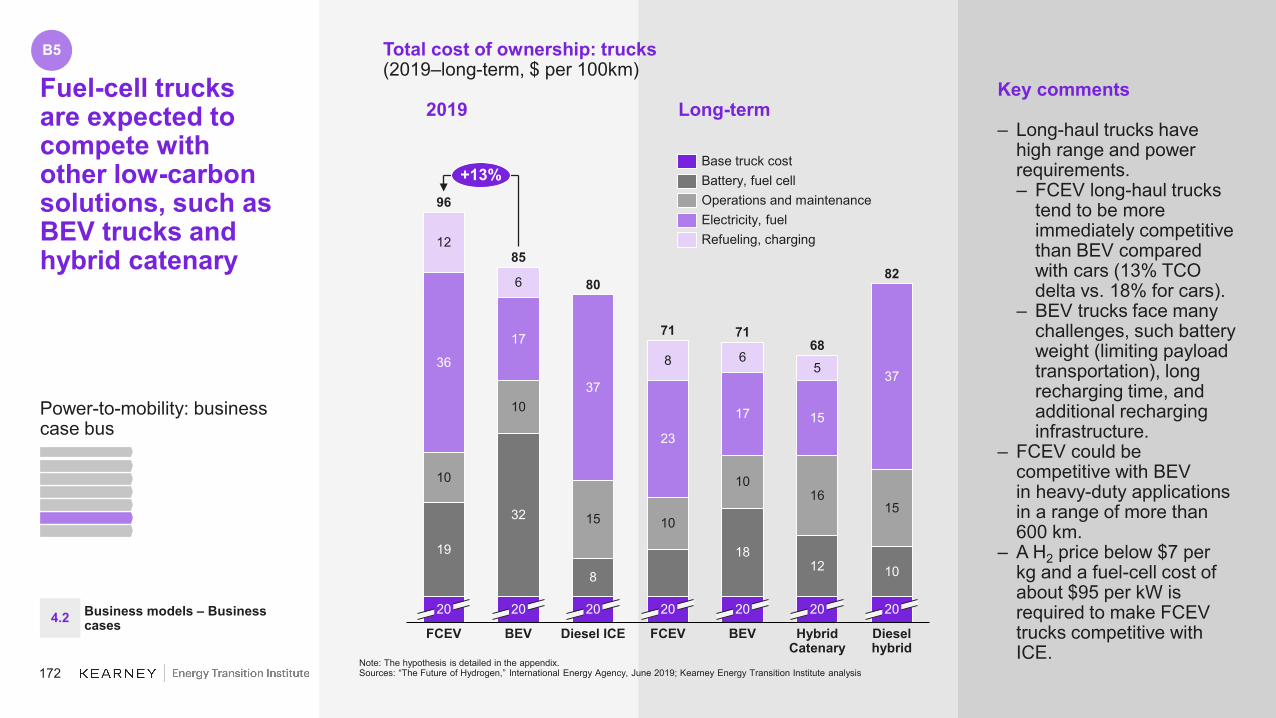
172
Key comments
– Long-haul trucks have high range and power requirements.– FCEV long-haul trucks
tend to be more immediately competitive than BEV compared with cars (13% TCOdelta vs. 18% for cars).
– BEV trucks face many challenges, such battery weight (limiting payload transportation), long recharging time, and additional recharging infrastructure.
– FCEV could be competitive with BEVin heavy-duty applications in a range of more than 600 km.
– A H2 price below $7 perkg and a fuel-cell cost of about $95 per kW is required to make FCEV trucks competitive with ICE.
Long-termFuel-cell trucks are expected to compete with other low-carbon solutions, such as BEV trucks and hybrid catenary
2019
10
17
6
Hybrid Catenary
20
8
20
1015
Diesel ICE
37
20
8
BEVFCEV
10
10
37
Diesel hybrid
96
85
71 7168
8280
BEV
17
18
12
23
10
12
5
15
20
6
20
15
20
19
36
16
FCEV
20
32
+13%Operations and maintenance
Base truck costBattery, fuel cell
Electricity, fuelRefueling, charging
Total cost of ownership: trucks(2019–long-term, $ per 100km)
Note: The hypothesis is detailed in the appendix. Sources: “The Future of Hydrogen,” International Energy Agency, June 2019; Kearney Energy Transition Institute analysis
4.2 Business models – Business cases
B5
Power-to-mobility: business case bus

173
Key project partners
– ITM Power– Pau Porte des Pyrénées– Ville de Pau– Idelis– Engie Gnvert– VanHool
A city in France is experimenting with H2 buses for its city fleet and has promised no cost increase for passengers
Illustrative
Pau, France zero-emission public transportation project, FEBUS
Note: The hypothesis is detailed in the appendix.Sources: Pau, ITM Power; Kearney Energy Transition Institute analysis
Key characteristics
Project investment€74.5 million (of which €14.5 million is for bus and recharging station)
Commissioning date Autumn 2019
Fuel cell power 100 kWConsumption 10–12 kgH2 per 100 kmAutonomy More than 240 km
Electrolyzer PEM: up to 268 kgH2 per day
Number of passengersper bus 125
4.2 Business models – Business cases
B5
Power-to-mobility: business case bus
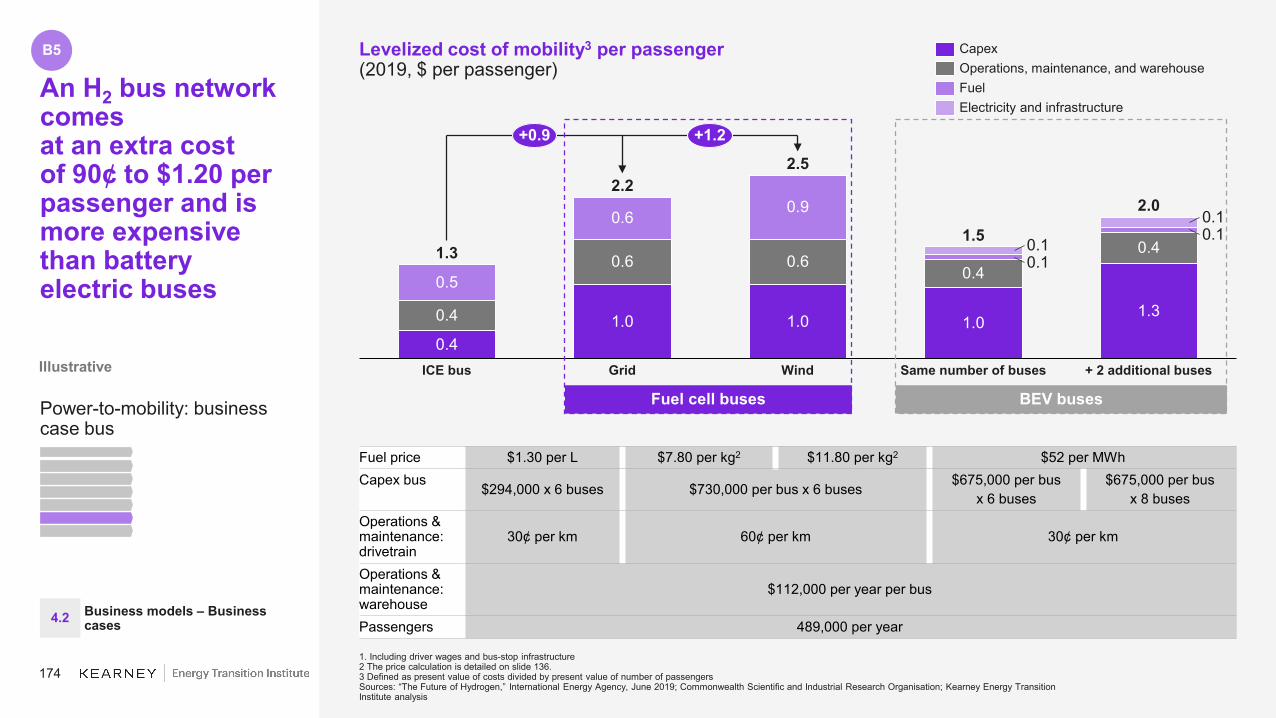
174
An H2 bus network comesat an extra costof 90¢ to $1.20 per passenger and is more expensive than battery electric buses
Levelized cost of mobility3 per passenger(2019, $ per passenger)
Fuel price $1.30 per L $7.80 per kg2 $11.80 per kg2 $52 per MWhCapex bus $294,000 x 6 buses $730,000 per bus x 6 buses $675,000 per bus
x 6 buses$675,000 per bus
x 8 busesOperations & maintenance: drivetrain
30¢ per km 60¢ per km 30¢ per km
Operations & maintenance: warehouse
$112,000 per year per bus
Passengers 489,000 per year
1. Including driver wages and bus-stop infrastructure2 The price calculation is detailed on slide 136.3 Defined as present value of costs divided by present value of number of passengersSources: “The Future of Hydrogen,” International Energy Agency, June 2019; Commonwealth Scientific and Industrial Research Organisation; Kearney Energy Transition Institute analysis
Grid
1.0
Same number of busesWind
0.4
+ 2 additional buses
0.6
1.3
0.1
ICE bus
0.1
1.3
2.2
0.4
2.5
1.5
2.0
0.4
0.5
0.6
1.0
0.6
0.9
1.0
0.10.1 0.4
+0.9 +1.2Electricity and infrastructure
CapexOperations, maintenance, and warehouseFuel
Illustrative
4.2 Business models – Business cases
B5
Fuel cell buses BEV busesPower-to-mobility: business case bus

175
Declining LCOH and acquisition cost reduction triggered by mass production could make FCEV buses competitive with BEV and ICE
Levelized cost of mobility3 per passenger(2030f, $ per passenger)
Fuel price $1.30 per L $3.80 per kg2 $4.40 per kg2 $52 per MWhCapex bus $294,000 x 6 buses $450,000 per x 6 buses $617,000 per bus
x 6 buses$617,000 per bus
x 8 busesOperations & maintenance: drivetrain
30¢ per km 60¢ per km 30¢ per km
Operations & maintenance: warehouse
$112,000 per year per bus
Passengers 489,000 per year
1 Including driver wages and bus-stop infrastructure2 The price calculation is detailed on slide 136.3 Defined as present value of costs divided by present value of number of passengersSources: “The Future of Hydrogen,” International Energy Agency, June 2019; Commonwealth Scientific and Industrial Research Organisation; Kearney Energy Transition Institute analysis
ICE bus
0.4
Grid
1.4
Wind + 2 additional busesSame number of buses
0.1
1.31.4 1.5 0.1
0.1
1.8
0.70.4
0.5
0.7
0.4
0.30.3
0.4
0.9
0.4
0.1
1.2
0.4
+0.1
Fuel
CapexOperations, maintenance, and warehouse
Electricity and infrastructure
4.2 Business models – Business cases
B5
Fuel cell buses BEV buses
Illustrative
Power-to-mobility: business case bus
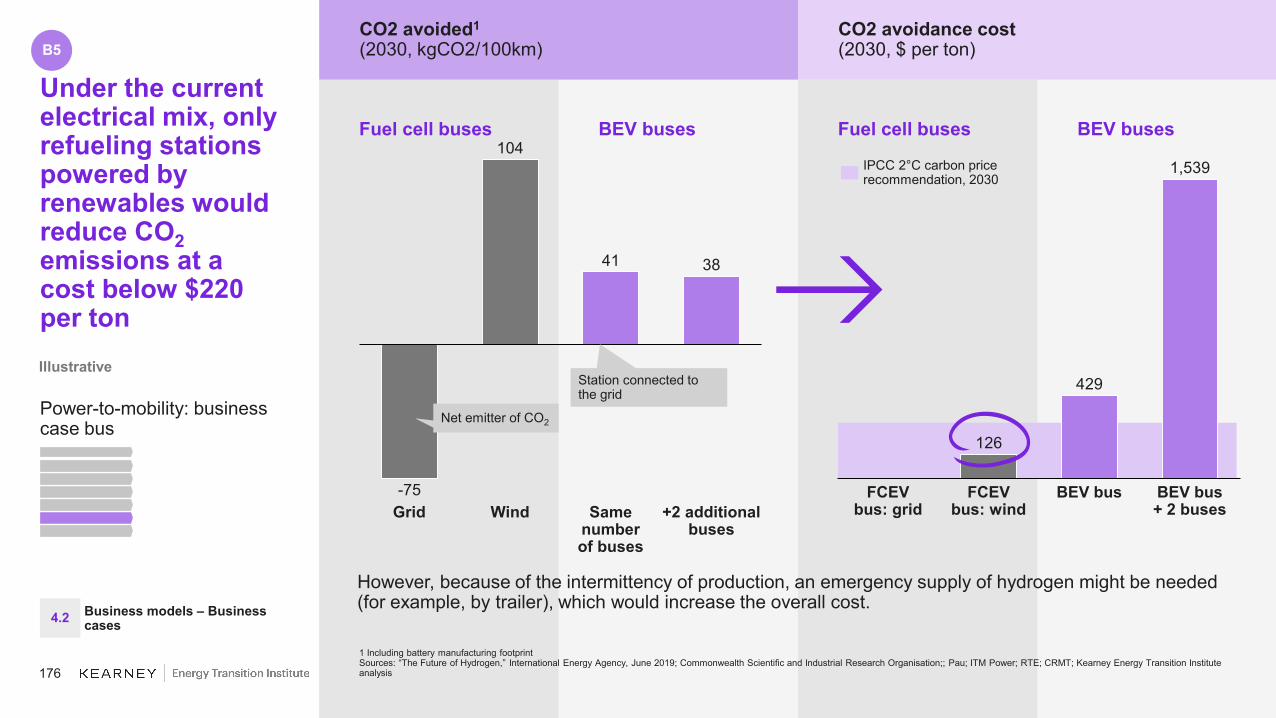
176
BEV busesFuel cell busesBEV busesFuel cell buses
Under the current electrical mix, only refueling stations powered by renewables would reduce CO2emissions at a cost below $220 per ton
CO2 avoided1
(2030, kgCO2/100km)CO2 avoidance cost(2030, $ per ton)
However, because of the intermittency of production, an emergency supply of hydrogen might be needed (for example, by trailer), which would increase the overall cost.
1 Including battery manufacturing footprintSources: “The Future of Hydrogen,” International Energy Agency, June 2019; Commonwealth Scientific and Industrial Research Organisation;; Pau; ITM Power; RTE; CRMT; Kearney Energy Transition Institute analysis
-75
104
41 38
WindGrid Same number of buses
+2 additional buses
Net emitter of CO2
Station connected to the grid
IPCC 2°C carbon pricerecommendation, 2030
126
429
FCEV bus: grid
FCEV bus: wind
BEV bus+ 2 buses
BEV bus
1,539
4.2 Business models – Business cases
B5
Illustrative
Power-to-mobility: business case bus

177
400
650100 3000
800
700
15050 250 600200 350
1,500
400
1,000
600
450
1,600
500 800550 700
100
7500
200
300
500
900
1,300
1,100
1,700
1,200
1,400
IPCC price recommendation
Grid emissions(kgCO2/MWhe)
Wind 2030
Avoidance cost($ per tCO2)
Countries with no potential for carbon emissionsreduction from grid coupling:
Key comments
– Wind-powered electrolyzer has the lowest carbon avoidance cost for city buses, except for countries with electricity carbon intensity below 140g/kWhe.– However, because
of the limiting load factor, this solution might not be always feasible as it requires a minimum service rate.
– Grid-connected electrolyzer can be a sustainable solution over grid-charged BEV buses in countries with low an electricity carbon intensity below 175g/kWhe, as battery manufacturing footprint weight is higher.– Countries with
carbon intensity below 700g/kWhewhen no extra BEV bus is needed and 580 g/kWhe when 33% extra buses are needed would reduce their CO2emissions by switching to BEV buses.
While FCEV buses powered by wind H2 appear to have the lowest CAC, grid-powered BEV buses are the second best alternative
CAC vs. CO2 emissions from electricity generation(2030, selected countries)
Notes: CAC is carbon abatement cost. IPCC is Intergovernmental Panel on Climate Change. The hypothesis is detailed in the appendix. CO2 neutrality is defined as the maximum CO2 footprint from power sector to reach carbon neutrality between natural gas and injection.Sources: Intergovernmental Panel on Climate Change, Organisation for Economic Co-operation and Development; Kearney Energy Transition Institute analyses
FCEV: gridBEV: gridBEV +2: grid
Battery carbon footprint has a high impact when grid emissions are low.
4.2 Business models – Business cases
B5
Power-to-mobility: business case bus

178
Cities around the world are launching H2buses projectsto evaluate the potential
Non-ExhaustiveOverview of H2 buses project(Number of projects per country)
Source: Kearney Energy transition Institute analysis
1
2
5
10 4
1
2
1
31
275
1
12 2
4
2
7
1
1
113
121
2
1
3
4.2 Business models – Business cases
B5
Power-to-mobility: business case bus
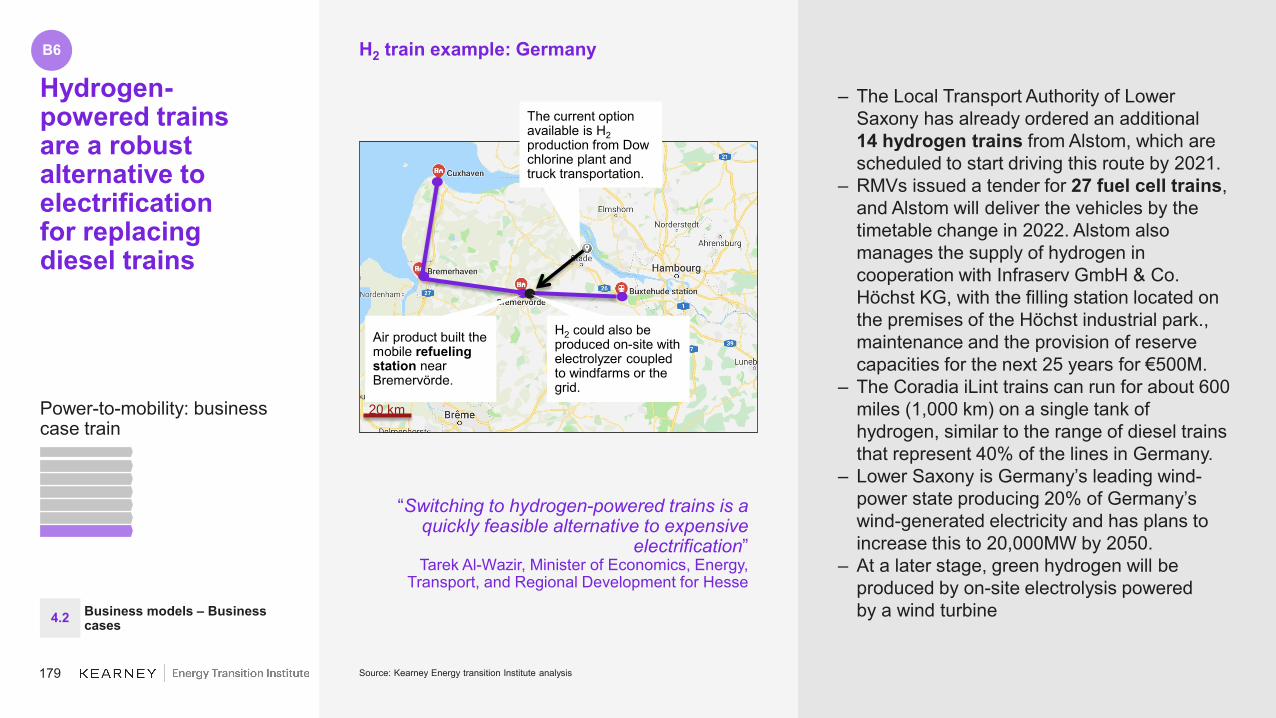
179
– The Local Transport Authority of Lower Saxony has already ordered an additional14 hydrogen trains from Alstom, which are scheduled to start driving this route by 2021.
– RMVs issued a tender for 27 fuel cell trains, and Alstom will deliver the vehicles by the timetable change in 2022. Alstom also manages the supply of hydrogen in cooperation with Infraserv GmbH & Co. Höchst KG, with the filling station located on the premises of the Höchst industrial park., maintenance and the provision of reserve capacities for the next 25 years for €500M.
– The Coradia iLint trains can run for about 600 miles (1,000 km) on a single tank of hydrogen, similar to the range of diesel trains that represent 40% of the lines in Germany.
– Lower Saxony is Germany’s leading wind-power state producing 20% of Germany’s wind-generated electricity and has plans to increase this to 20,000MW by 2050.
– At a later stage, green hydrogen will be produced by on-site electrolysis poweredby a wind turbine
Hydrogen-powered trainsare a robust alternative to electrificationfor replacing diesel trains
Source: Kearney Energy transition Institute analysis
H2 train example: Germany
Air product built the mobile refueling station near Bremervörde.
H2 could also be produced on-site with electrolyzer coupled to windfarms or the grid.
The current option available is H2production from Dow chlorine plant and truck transportation.
20 km
“Switching to hydrogen-powered trains is a quickly feasible alternative to expensive
electrification”Tarek Al-Wazir, Minister of Economics, Energy,
Transport, and Regional Development for Hesse
4.2
B6
Business models – Business cases
Power-to-mobility: business case train
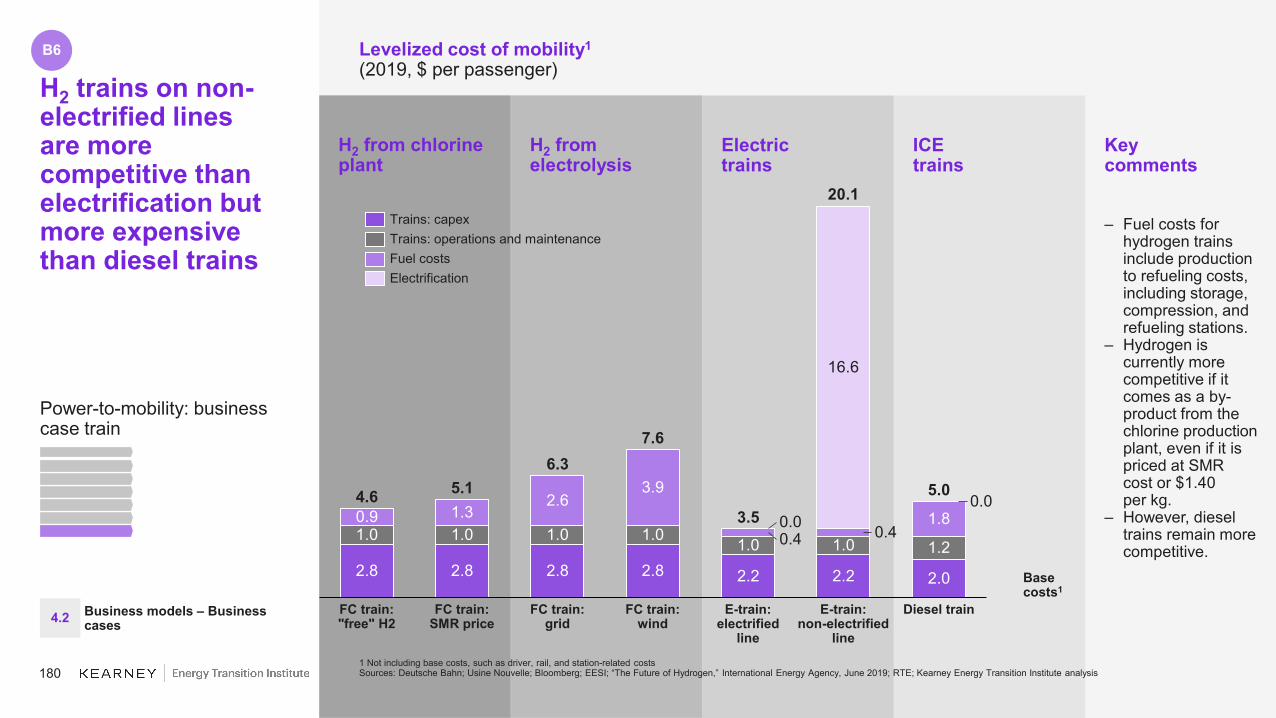
180
Keycomments
– Fuel costs for hydrogen trains include production to refueling costs, including storage, compression, and refueling stations.
– Hydrogen is currently more competitive if it comes as a by-product from the chlorine production plant, even if it is priced at SMRcost or $1.40per kg.
– However, diesel trains remain more competitive.
ICEtrains
Electrictrains
H2 from electrolysis
H2 from chlorine plant
H2 trains on non-electrified lines are more competitive than electrification but more expensive than diesel trains
Levelized cost of mobility1
(2019, $ per passenger)
1 Not including base costs, such as driver, rail, and station-related costsSources: Deutsche Bahn; Usine Nouvelle; Bloomberg; EESI; “The Future of Hydrogen,” International Energy Agency, June 2019; RTE; Kearney Energy Transition Institute analysis
1.0
2.8 2.0
FC train:"free" H2
1.01.0
FC train:SMR price
2.8
1.0
2.6
2.2
FC train:grid
2.8
FC train:wind
1.0 0.40.9 1.80.0
E-train:electrified
line
2.2
1.00.4
1.3
1.2
16.6
E-train:non-electrified
line
2.8
0.0
Diesel train
4.6 5.1 3.9
7.6
20.1
3.55.0
6.3
Trains: capexTrains: operations and maintenanceFuel costsElectrification
Basecosts1
4.2
B6
Business models – Business cases
Power-to-mobility: business case train

181
Keycomments
No capex reduction for FCEV trains has been considered.– As hydrogen
production costs will become cheaper, including related infrastructure, fuel-cell trains could become more competitive than diesel trains if H2 is purchased at free cost or SMRprice and transported to refueling station.
ICEtrains
Electrictrains
H2 from electrolysis
H2 from chlorine plant
H2 trains on non-electrified lines are more competitivethan electrification but more expensive than diesel trains
Levelized cost of mobility1
(2030f, $ per passenger)
1 Not including base costs, such as driver, rail, and station-related costsSources: Deutsche Bahn; Usine Nouvelle; Bloomberg; EESI; “The Future of Hydrogen,” International Energy Agency, June 2019; RTE; Kearney Energy Transition Institute analysis
0.91.0
0.41.0
2.8
FC train:SMR price
16.6
FC train:"free" H2
2.8
0.01.3
FC train:grid
1.01.4
2.2
1.0
FC train:wind
0.40.0
E-train:electrified
line
2.2
1.00.4
2.8
5.04.6
E-train:non-electrified
line
1.01.2
1.8
Diesel train
4.2
2.0
5.1
3.5
20.1
2.8
5.1
Fuel costs
Trains: capexTrains: operations and maintenance
Electrification
Basecosts1
4.2
B6
Business models – Business cases
Power-to-mobility: business case train

182
CO2 avoidance cost(2030, $ per t)
56
FC train: wind
FC train: grid
E-train: electrified
line
FC train: "free" H2
FC train: SMR price
E-train: non electrified
line
122,764
CO2 avoided1
(2030, kgCO2/100km)Usingby-product H2from the chlorine industry appears to have the cheapest avoidance cost
1 Not including base costs, such as driver, rail, and station-related costsSources: Deutsche Bahn; Usine Nouvelle; Bloomberg; EESI; “The Future of Hydrogen,” International Energy Agency, June 2019; RTE; Kearney Energy Transition Institute analysis
213 213
-381
244
9 9 1
FC train: SMR price
FC train: "free" H2
FC train: grid
Grid + wind
FC train: wind
E-train: electrified
line
E-train: non
electrified line
Net emitter of CO2
Already cheaper
than diesel trains
Cheaper than diesel trains
Net emitter of
CO2
IPCC 2°C carbon pricerecommendation, 2030
4.2
B6
Business models – Business cases
Excludes emissions related to chlorine production (and H2
as by-product)
Refueling station powered by grid
Power-to-mobility: business case train

183
350100 650500 150 200 400250 300 450 600500 550 700 750 80010
100
1,000
10,000
100,000
Grid emissions(kgCO2/MWhe)
Avoidance cost($ per tCO2)
IPCC price recommendationWind 2030
Countries with no potential for carbon emissions reduction from grid coupling:
Key comments
– Electrifying lines is very expensive –CAC is therefore always higher than $4,500 per ton.– FCEV trains
appear as a strong alternative to railway electrification at a lower carbon avoidance cost.
– However, FCEV trains with H2produced from grid are sustainable only if grid intensity is below 200gCO2/kWhe.– A wind-powered
production plant is the cheapest alternative when grid emissions are above about 100gCO2/kWhe.
An FCEV train with H2 by grid could save CO2if grid emissions are below 300g/kWhe at a lower avoidance cost than electrification
CAC1 vs. CO2 emissions from electricity generation(2030, selected countries)
Note: CAC is carbon abatement cost. The hypothesis is detailed in the appendix.Sources: Intergovernmental Panel on Climate Change, Organisation for Economic Co-operation and Development; Kearney Energy Transition Institute analysis
FCEV - GridElectric Train - With Electrification
4.2
B6
Business models – Business cases
Power-to-mobility: business case train

184
Benefits of electrolysis vary by applicationand depend onthe country’s energy mix
Carbon abatement cost vs. grid emissions for business cases(2030; Y axis: CAC in $ per tCO2 log scale; X axis: CO2 emissions in kg/MWhe)
Note: IPCC is Intergovernmental Panel on Climate Change.Source: Kearney Energy Transition Institute analysis
3501501000 50 200 250 300 40010
100
10,000
IPCC CO2 price recommendation($220/tCO2)
Avoidance cost($ per tCO2)
Injection
Methanation
Power-2-Power
FCEV car
FCEV bus
FCEV train
Industrial feedstock
Carbon intensity of Countries
(gCO2/kWhe)
4.2 Business models – Business cases
B1a
B1b
B4
B6
B5B3
B2
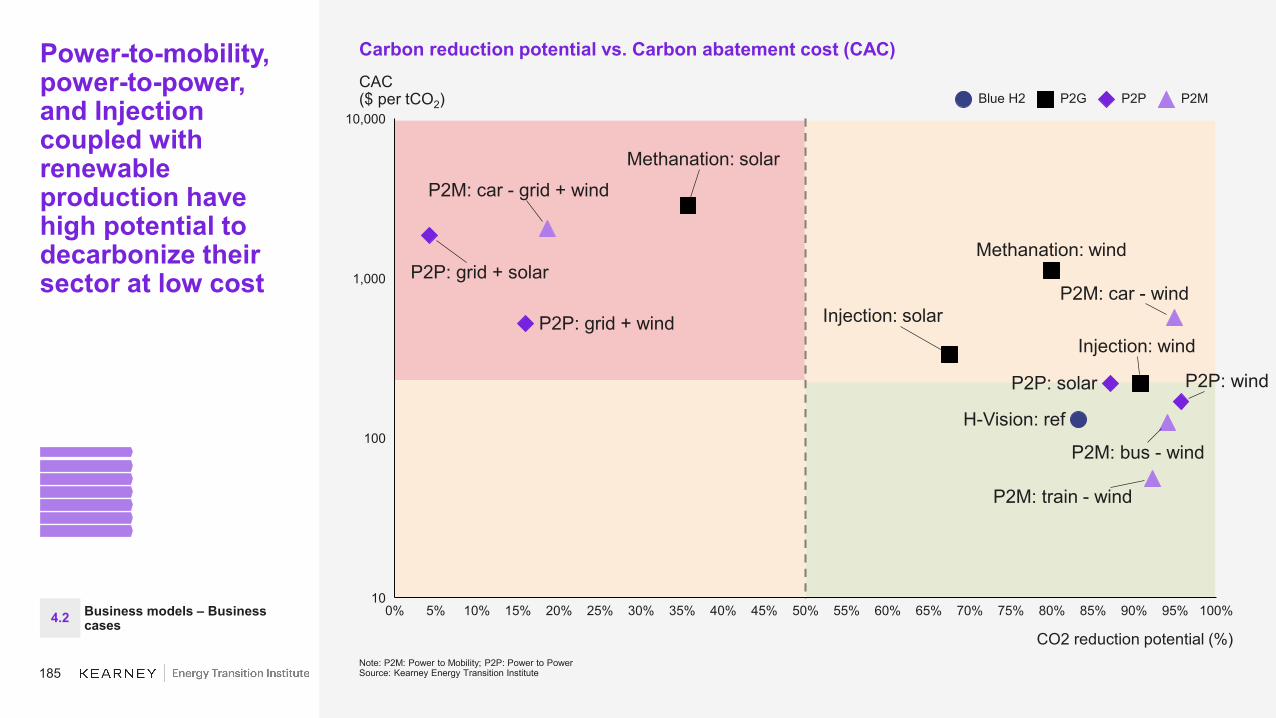
185
0% 5% 10% 15% 20% 35% 70%25%10
30% 40% 45% 50% 95%55% 60% 65% 75% 100%80% 85% 90%
100
1,000
10,000
P2M: car - grid + wind
P2M: train - wind
CO2 reduction potential (%)
P2P: wind
Injection: solarP2P: grid + wind
P2P: solar
Injection: wind
P2P: grid + solarP2M: car - wind
P2M: bus - wind
H-Vision: ref
Methanation: wind
Methanation: solar
Power-to-mobility, power-to-power, and Injection coupled with renewable production have high potential to decarbonize their sector at low cost
Carbon reduction potential vs. Carbon abatement cost (CAC)CAC($ per tCO2)
Note: P2M: Power to Mobility; P2P: Power to PowerSource: Kearney Energy Transition Institute
P2MBlue H2 P2G P2P
4.2 Business models – Business cases

186
Large-scale H2production that can serve multiple users to maximize load factor is vital to competitiveness
Source: Kearney Energy Transition Institute
Illustrative H2-electrolysis hub
Transport
Feedstock(for O&G and Chemicals)
P2G
Heat
Power
10-100 MW electrolysis
H2 hub
4.2 Business models – Business cases
187
Some orders of magnitude in 2019 5
Executive summary 6
1. Hydrogen’s role in the energy transition 16
2. Hydrogen value chain: upstream and midstream 252.1 Production technologies 272.2 Conversion, storage, and transportation technologies 492.3 Maturity and costs 61
3. Key hydrogen applications 783.1 Overview 803.2 Feedstock 843.3 Energy 90
3. Business models 1144.1 Policies and competition landscape 1164.2 Business cases 125
Appendix (Bibliography & Acronyms) 187
188
Bibliography (1/2)
Alexandria engineering journal (link) Applied Thermal Engineering journal (link) Association of German Steel Manufacturers (VDEh) (link) Australia Department of Industry, Innovation and science, (2019), “Advancing Hydrogen: Learning from 19 plans to advance
hydrogen from across the globe” Bilal Abderezzak (2018), “Introduction to Hydrogen Technology” Bloomberg New Energy Finance database (link) BP, Statistical review (2015) Commonwealth Scientific and Industrial Research Organisation (CSIRO), “National Hydrogen Roadmap 2018” European Network of Transmission System Operators for Electricity (ENTSO-E) (link) French Association for Hydrogen and Fuel Cells (AFHYPAC) (link) Global Carbon Budget 2018, by Corinne Le Quéré, Robbie M. Andrew, Pierre Friedlingstein, Stephen Sitch, Judith Hauck,
Julia Pongratz, Penelope A. Pickers, Jan Ivar Korsbakken, Glen P. Peters, Josep G. Canadell, Almut Arneth, Vivek K. Arora, Leticia Barbero, Ana Bastos, Laurent Bopp, Frédéric Chevallier, Louise P. Chini, Philippe Ciais, Scott C. Doney, ThanosGkritzalis, Daniel S. Goll, Ian Harris, Vanessa Haverd, Forrest M. Hoffman, Mario Hoppema, Richard A. Houghton, George Hurtt, Tatiana Ilyina, Atul K. Jain, Truls Johannessen, Chris D. Jones, Etsushi Kato, Ralph F. Keeling, Kees Klein Goldewijk, Peter Landschützer, Nathalie Lefèvre, Sebastian Lienert, Zhu Liu, Danica Lombardozzi, Nicolas Metzl, David R. Munro, Julia E. M. S. Nabel, Shin-ichiro Nakaoka, Craig Neill, Are Olsen, Tsueno Ono, Prabir Patra, Anna Peregon, Wouter Peters, Philippe Peylin, Benjamin Pfeil, Denis Pierrot, Benjamin Poulter, Gregor Rehder, Laure Resplandy, Eddy Robertson, Matthias Rocher, Christian Rödenbeck, Ute Schuster, Jörg Schwinger, Roland Séférian, Ingunn Skjelvan, Tobias Steinhoff, Adrienne Sutton, Pieter P. Tans, Hanqin Tian, Bronte Tilbrook, Francesco N. Tubiello, Ingrid T. van der Laan-Luijkx, Guido R. van der Werf, Nicolas Viovy, Anthony P. Walker, Andrew J. Wiltshire, Rebecca Wright, Sönke Zaehle, and Bo Zheng (2018), Earth System Science Data, 10, 1-54, 2018, DOI: 10.5194/essd-10-2141-2018. (link)
Global CCS Institute (link) H-VISION (2019), “Blue Hydrogen as an accelerator for the energy transition” Higman consulting (link)
AppendixBibliography & Acronyms

189
Bibliography (2/2)
Hydrogen Council (link) Hydrogen Europe (link) Intergovernmental Panel on Climate Change - IPCC (2014), “AR5 Climate Change” (link) Intergovernmental Panel on Climate Change - IPCC (2018), “Special report on Global Warming of 1.5 ºC” (link) International Energy Agency - IEA ETSAP (2010), “Syngas Production from Coal ” (link) International Energy Agency - IEA (2019), “Future of Hydrogen” (link) International Energy Agency - IEA (2019), “World Energy Outlook” (link) International Energy Agency - IEA Greenhouse Gas R&D Programme (IEAGHG) (link) International Journal of Hydrogen Energy (2017), “Future cost and performance of water electrolysis: An expert elicitation
study” International Renewable Energy Agency – IRENA (2018), “Hydrogen from renewable power” (link) Institute of Energy Economics, Japan (link) Joule (2017), “Membraneless Electrolyzers for Low-Cost Hydrogen Production in a Renewable Energy Future” Kuwait Foundation for the Advancement of Sciences (KFAS) (link) National Renewable Energy Laboratory (NREL) (link) Oxford Institute for Energy Studies (link) Organisation for Economic Co-operation and Development – OECD (link) RTE - Bilan électrique (2018) Studies in Surface Science and Catalysis (2019) (link) The Fuel Cells and Hydrogen Joint Undertaking (FCH JU) (link) Vogi, Ahman, Nilsson (2018), “Assessment of hydrogen direct reduction for fossil-free steelmaking” US Department of Energy Fuel Cell Technologies Office (FCTO) (link)
AppendixBibliography & Acronyms

190
Acronyms – (1/2)
AppendixBibliography & Acronyms
AC/DC Alternating/Direct currentAFC Alkaline fuel cellAFOLU Agriculture, Forestry and Other Land UseAPI American Petroleum InstituteBoP Balance of plant BTU British thermal unit (Btu)BEV Battery electric vehicleCAES Compressed air energy storageCAGR Compound annual growth rateCAPEX Capital expenditureCCS Carbon capture & storage CHP Combined heat and powerCNG Compressed natural gasCO2 Carbon dioxideDH District heatingDME Dimethyl etherDSO Distribution system operatorE ElectricityEPEX European Power ExchangeFC Fuel cellFCEV Fuel cell electric vehicleFCHJU Fuel Cell and Hydrogen Joint UndertakingFIT Feed-in tariffGHG Greenhouse gasGtCO2eq Giga tonnes of CO2 equivalentH2 HydrogenH2ICE Hydrogen internal-combustion-engine vehicleHDS Hydrodesulfurization
HENG Hydrogen enriched natural gasH-Gas High calorific gasHHV Higher heating valueHT High temperatureICE Internal combustion engineIEA International Energy AgencyIPCC Intergovernmental Panel on Climate ChangeIRR Internal rate of returnK Kelvin (unit of measurement for temperature)kWh Kilowatt hourLCA Life cycle analysisLCOE Levelized cost of electricityLCOH Levelized cost of hydrogenLDV Light duty vehicle L-Gas Low calorific gasLHV Lower heating value LOHC Liquid organic hydrogen carrier LPG Liquefied petroleum gasMCFC Molten carbonate fuel cellMEA Membrane electrode assembly MtG Methanol-to-gasNG Natural gasNH3 AmmoniaNPV Net present valueNREL National Renewable Energy LaboratoryO&G Oil and gasO&M Operation and maintenanceOPEX Operating expenditure

191
Acronyms – (2/2)Pa Pascal (Unit of measurement for pressure)P2G Power-to-gasP2P Peer-to-peerP2S Power-to-synfuelPAFC Phosphoric acid fuel cellPCM Phase change material PEM Proton exchange membrane PES Primary energy sourcePGM Platinum group metalPHS Pumped-hydro Storage PV Solar photovoltaicR,D&D Research, Development & DemonstrationRE Renewables REC Renewable energy certificateRES Renewable electricity sourceSMES Super-conducting magnetic energy storageSMR Steam methane reformingSNG Synthetic natural gasSOEC Solid oxide electrolyzer cellSOFC Solid oxide fuel cellSTES Seasonal thermal energy storage T&P Temperature and pressureT&D Transmission and distributionTCM Thermo-chemical materialTCNG Turbocharged natural gasTEPS Total primary energy supplyTSO Transmission system operator
URFC Unitized regenerative fuel cellUSDOE US Department of EnergyVRB Vanadium Redox BatteriesW WattZn/Br Zinc-bromine
AppendixBibliography & Acronyms

192192
Kearney Energy Transition Institute
The Kearney Energy Transition Institute is a nonprofit organization. It provides leading insights on global trends in energy transition, technologies, and strategic implications for private sector businesses and public sector institutions. The Institute is dedicated to combining objective technological insights with economical perspectives to define the consequences and opportunities for decision makers in a rapidly changing energy landscape. The independence of the Institute fosters unbiased primary insights and the ability to co-create new ideas with interested sponsors and relevant stakeholders.
For further information about the Kearney Energy Transition Institute and possible ways of collaboration,please visit www.energy-transition-institute.com, or contact us at [email protected].
Permission is hereby granted to reproduce and distribute copies of this work for personal or nonprofit educational purposes. Any copy or extract has to refer to the copyright of the Kearney Energy Transition Institute.