Hydrino States of Hydrogen 091222 - Brilliant Light Power
140
1 Hydrino States of Hydrogen 091322 R. Mills 1,2 1 Brilliant Light Power, Inc., 493 Old Trenton Road, Cranbury, NJ 08512, USA 2 Corresponding author Abstract: In addition to the reciprocal integer squared electronic energy states of atomic hydrogen, hydrogen possesses integer squared electronic energy levels corresponding to 1/p replacing n in the Rydberg formula, corresponding so-called hydrino state of hydrogen. Atomic hydrino, hydrino hydride ion, and molecular hydrino have been produced in the laboratory and analyzed by over 23 methodologies and spectroscopies at numerous laboratories. The formation and existence of hydrino resolves many astrophysical mysteries and the identity of the dark matter of the universe. For example, the observed and theoretical molecular hydrino rotational lines match the Diffuse Interstellar Bands (DIBs) and the EUV continuum emission from the formation of hydrino matches that observed from all over the universe, the continuum band of solar corona, and the continuum bands of white dwarf stars as well as providing the source of ionization of the solar corona and interstellar media as an alternative mechanism to thermal ionization.
-
Upload
khangminh22 -
Category
Documents
-
view
0 -
download
0
Transcript of Hydrino States of Hydrogen 091222 - Brilliant Light Power

1
Hydrino States of Hydrogen091322
R. Mills1,2 1Brilliant Light Power, Inc., 493 Old Trenton Road, Cranbury, NJ 08512, USA
2 Corresponding author
Abstract: In addition to the reciprocal integer squared electronic energy states of atomic hydrogen, hydrogen possesses integer squared electronic energy levels corresponding to 1/p replacing n in the Rydberg formula, corresponding so-called hydrino state of hydrogen. Atomic hydrino, hydrino hydride ion, and molecular hydrino have been produced in the laboratory and analyzed by over 23 methodologies and spectroscopies at numerous laboratories. The formation and existence of hydrino resolves many astrophysical mysteries and the identity of the dark matter of the universe. For example, the observed and theoretical molecular hydrino rotational lines match the Diffuse Interstellar Bands (DIBs) and the EUV continuum emission from the formation of hydrino matches that observed from all over the universe, the continuum band of solar corona, and the continuum bands of white dwarf stars as well as providing the source of ionization of the solar corona and interstellar media as an alternative mechanism to thermal ionization.

2
1 Introduction Classical physical laws predict that atomic hydrogen may undergo a catalytic reaction with certain species, including itself, that can accept energy in integer multiples of the potential energy of atomic hydrogen, m · 27.2 eV, wherein m is an integer. The predicted reaction involves a resonant, nonradiative energy transfer from otherwise stable atomic hydrogen to the catalyst capable of accepting the energy. The product is H(1/p), fractional Rydberg states of atomic hydrogen called “hydrino atoms,” wherein n = 1/2, 1/3, 1/4,…, 1/p (p≤137 is an integer) replaces the well-known parameter n = integer in the Rydberg equation for hydrogen excited states. Each hydrino state also comprises an electron, a proton, and a photon, but the field contribution from the photon increases the binding rather than decreasing it corresponding to energy desorption rather than absorption. Since the potential energy of atomic hydrogen is 27.2 eV, atoms serve as a catalyst of
for another ( )th H atom. For example, an H atom can act as a catalyst for another H by accepting 27.2 eV from it via through-space energy transfer such as by magnetic or induced electric dipole-dipole coupling. In addition to atomic H, a molecule that accepts from atomic H with a decrease in the magnitude of the potential energy of the molecule by the same energy may also serve as a catalyst. The potential energy of H2O is 81.6 eV [1]. Then, by the same mechanism, the nascent H2O molecule (not hydrogen bonded in solid, liquid, or gaseous state) may serve as a catalyst. Based on the 10% energy change in the heat of vaporization in going from ice at 0°C to water at 100°C, the average number of H bonds per water molecule in boiling water is 3.6 [1]; thus, H2O must be formed chemically as isolated molecules with suitable activation energy in order to serve as a catalyst to form hydrinos. The catalysis reaction
regarding the potential energy of nascent H2O is
(1)
(2)
(3)
And, the overall reaction is
(4)
After the energy transfer to the catalyst, an intermediate is formed having the radius
of the H atom and a central field of m +1 times the central field of a proton (e.g. is the
m Hm ⋅27.2 eV m +1
m ⋅ 27.2 eV
m = 3( )
81.6 eV + H2O + H aH⎡⎣ ⎤⎦→ 2H fast+ +O− + e− + H *
aH4
⎡
⎣⎢
⎤
⎦⎥ +81.6 eV
H *aH4
⎡
⎣⎢
⎤
⎦⎥→ H
aH4
⎡
⎣⎢
⎤
⎦⎥ +122.4 eV
2H fast+ +O− + e− → H2O +81.6 eV or OH + H fast
H aH⎡⎣ ⎤⎦→ HaH4
⎡
⎣⎢
⎤
⎦⎥ +81.6 eV +122.4 eV
H *aHm+1
⎡
⎣⎢
⎤
⎦⎥
H *aH4
⎡
⎣⎢
⎤
⎦⎥

3
intermediate in Eq. (1) wherein m = 3, and and refer to these species with excessive
kinetic energy). The radius is predicted to decrease as the electron undergoes radial acceleration to a stable state having a radius of 1/(m +1) the radius of the uncatalyzed hydrogen atom, with the release of eV of energy. The extreme-ultraviolet continuum radiation band due to the
intermediate (e.g. Eq. (2)) is predicted to have a short wavelength cutoff and energy
given by
; (5)
and extending to longer wavelengths than the corresponding cutoff. The continuum radiation band at 10.1 nm and going to longer wavelengths for theoretically
predicted transitions of H to lower-energy, so called “hydrino” states, was observed only arising from pulsed pinched hydrogen discharges first at BlackLight Power, Inc. (BLP) and reproduced at the Harvard Center for Astrophysics (CfA) [2-8]. Similarly, in hydrogen-helium microwave plasma having a high concentration of atomic H, the H undergoing catalysis with H (m=1) as the reactant and catalyst gives rise to fast H+ and e- [1] which recombine to emit a broad continuum peak observed at 45.6 nm [9]. H undergoing catalysis in the hydrogen-helium microwave plasma also gives rise to a concerted energy exchange of the total energy of 40.8 eV with the excitation of the He (1s2) to He (1s12p1) transition (58.5 nm, 21.21 eV) yielding an observed [9] broad continuum emission with ( 19.59 eV). In independent replication experiments the broad 63.3 nm emission of this nature and the continuum radiation have been observed in helium-hydrogen microwave plasmas and in hydrogen pinch plasmas, respectively [10]. The 10.1 nm continuum with the 22.8 nm and 91.2 nm continuum observed previously [2-8, 11] gives a spectrum with continua having edges at 10.1, 22.8, and 91.2 nm, a match to the otherwise challenging white dwarf spectrum [8].
Based on the catalyst mechanism, high current was predicted to facilitate a rapid hydrino transition rate (higher kinetics) by recombining charges that cause an inhibiting space charge build up from the ionization of the HOH catalyst. The application of a high current to a conductive matrix having a source of catalyst such as HOH to react with supplied H was shown to form a low-voltage arc current to dissipate space charge from the hydrino reaction to support high kinetics [2,8,12]. It was shown previously that the kinetics of catalysis of H to H(1/4) by HOH catalyst was explosive when a very low voltage, high current such as 35,000 A was flowed through a solid fuel [2,8,12] comprising 80 mg silver shots each comprising a source of H and HOH embedded in a highly conductive matrix. The resulting brilliant light-emitting expanding plasma (Figure 1)
H fast+ H fast
m2 ⋅13.6
H *aHm+1
⎡
⎣⎢
⎤
⎦⎥
EH→H
aHp=m+1
⎡
⎣⎢
⎤
⎦⎥
⎛
⎝⎜
⎞
⎠⎟
EH→H
aHp=m+1
⎡
⎣⎢
⎤
⎦⎥
⎛
⎝⎜
⎞
⎠⎟
= m2 ⋅13.6 eV λH→H
aHp=m+1
⎡
⎣⎢
⎤
⎦⎥
⎛
⎝⎜
⎞
⎠⎟
= 91.2m2
nm
λ ≤ 63.3 nm ≥

4
produced a strong shock wave and emitted 20 MW-levels of EUV continuum radiation emission with a short wavelength cutoff of 10.1 nm and a cutoff energy of 122.4 eV (Eq. (5) with p = 4) when it was expanded into a vacuum chamber such that its atmospheric pressure was dissipated sufficiently to overcome the optical thickness. Such characteristic continuum radiation is observed over the entire universe [2,8]. Figure 1. High-speed (6500 frames per second) photography of brilliant light-emitting expanding plasma formed from the low voltage (15 V), high current (35,000 A) detonation of hydrated shot.
Indeed, there are some serendipitous observations in the scientific literature that comprise
evidence of hydrino. In addition to HOH, as predicted, atoms acting as a catalyst was previously evidenced by the observation of EUV radiation from a solid fuel comprising a highly conductive material and a source of hydrogen such as a hydrocarbon through which a low voltage, high current was flowed [8]. Ion emission lines were also observed as expected on a continuum radiation background due to continuum absorption and reemission as spectral lines as in the case of HOH catalyst. The same mechanism applies to H pinch plasma emission and to astrophysical H plasma sources [8]. Specifically, catalyst was identified to be active in astronomical sources such as the Sun, stars, and interstellar medium wherein the characteristics of hydrino product match those of the dark matter of the universe [8]. The EUV continuum results offer resolution to many otherwise inexplicable celestial observations with (a) the energy and radiation from the hydrino transitions being the source of extraordinary temperatures and power regarding the solar corona problem, the cause of sunspots and other solar activity, and why the Sun emits X-rays [2,8], (b) the hydrino-transition radiation being the radiation source heating the WHIM (warm-hot ionized media) and behind the observation that diffuse H emission is ubiquitous throughout the Galaxy requiring widespread sources of flux shortward of 912 Å, and (c) the identity of dark matter being hydrinos [8]. The novel energetic light source, decaying dark matter
mH
mH
α
5
to UV radiation, has been proposed to address the crisis created by the Hubble Space Telescope's Cosmic Origins Spectrograph results showing that the amount of required ultraviolet light from known quasars is five times lower than what is needed to explain the amount of electrically neutral intergalactic hydrogen observed. EUV continuum radiation from the formation of hydrino resolves this photon underproduction crisis wherein hydrino is the identity of dark matter [13].
Anomalous H Lyman alpha emission is also observed from atmospheric lightning wherein H and HOH are created with an arc current that provides a positive feedback mechanism of hydrino reaction kinetics [14]. The explosive hydrino reaction is also a likely explanation for why lightning produces a shockwave [15]. XPS spectra of shock quartz or fulgurite formed by lightning strike of silica has shown a peak at 496 eV characteristic of molecular hydrino H2(1/4) that matches the peak shown in Figures 27 and 28 infra.
A broad X-ray peak with a 3.48 keV cutoff was observed in the Perseus Cluster by NASA’s Chandra X-ray Observatory and by the XMM-Newton [16-18] that has no match to any known atomic transition. The 3.48 keV feature assigned to dark matter of unknown identity by Bulbul et
al. [1,16] matches the transition and further confirms hydrinos as
the identity of dark matter. Physical laws such as those of mechanics (Newton-Lorentz) and those of electrodynamics
(Maxwell) require that as matter converts into energy according to E=mc2, spacetime expands according to c3/(4PiG) wherein G is the Newtonian gravitational constant. The resulting dynamic behavior is a universe that oscillates between matter-filled and energy-filled with a period of one trillion years. In 1995, Mills published the GUTCP prediction [19] that the expansion of the universe was accelerating from the same equations that correctly predicted the present Hubble constant and the mass of the top quark before they were measured as well as those of the other fundamental particles and cosmological parameters. To the astonishment of cosmologists, Mills acceleration prediction was confirmed by 2000. Moreover, Mills GUTCP value for the Hubble constant matches the present observed value which has created another crisis in astrophysics regarding cosmological models that inescapably predict an unacceptable fitted value of Hubble constant from other fitted terms [20]. Mills made another prediction based on GUTCP that the identify of dark matter is Hydrino, a more stable allotrope of molecular hydrogen. The best evidence yet for the existence of dark matter is its direct observation as a source of massive gravitational mass evidenced by gravitational lensing of background galaxies that does not emit or absorb light as shown in Figure 2 [21]. We report herein that the existence of Hydrino is confirmed by 23 spectroscopic methods, and its characteristics fit those of dark matter. Furthermore, the recent unanticipated Webb telescope images confirm additional GUTCP predictions of fully
HaH4
⎡
⎣⎢
⎤
⎦⎥ + H
aH1
⎡
⎣⎢
⎤
⎦⎥→ H
aH17
⎡
⎣⎢
⎤
⎦⎥

6
formed galaxies and old galaxies at the beginning of the expansion of the universe that disprove the long held metaphysical Big Bang and related theories of cosmology.
Figure 2. Dark matter ring in galaxy cluster. This Hubble Space Telescope composite image shows a ghostly "ring" of dark matter in the galaxy cluster Cl 0024+17. The ring is one of the strongest pieces of evidence to date for the existence of dark matter, a prior unknown substance that pervades the universe. Courtesy of NASA/ESA, M.J. Jee and H. Ford (Johns Hopkins University), Nov. 2004.
Bournaud et al. [23, 24] suggest that dark matter is hydrogen in dense molecular form that somehow behaves differently in terms of being unobservable except by its gravitational effects. Theoretical models predict that dwarf galaxies formed from collisional debris of massive galaxies should be free of nonbaryonic dark matter. So, their gravity should tally with the stars and gas within them. By analyzing the observed gas kinematics of such recycled galaxies, Bournaud et al. [22, 23] have measured the gravitational masses of a series of dwarf galaxies lying in a ring around a massive galaxy that has recently experienced a collision. Contrary to the predictions of Cold-Dark-Matter (CDM) theories, their results demonstrate that they contain a massive dark component amounting to about twice the visible matter. This baryonic dark matter is argued to be cold molecular hydrogen, but it is distinguished from ordinary molecular hydrogen in that it is not traced at all by traditional methods. These results match the predictions of the dark matter being molecular hydrino.
Additionally, astronomers Jee at al. [24] using data from NASA’s Hubble Telescope have

7
mapped the distribution of dark matter, galaxies, and hot gas in the core of the merging galaxy cluster Abell 520 formed from a violent collision of massive galaxy clusters and have determined that the dark matter had collected in a dark core containing far fewer galaxies than would be expected if dark matter was collisionless with dark matter and galaxies anchored together. The collisional debris left behind by the galaxies departing the impact zone behaved as hydrogen did, another indication that the identity of dark matter is molecular hydrino.
Moreover, detection of alternative hypothesized identities for dark matter such as super-symmetry particles such as neutralinos has failed at the Large Hadron Collider; nor, has a single event been observed for weakly interacting massive particles or wimps at the Large Underground Xenon (LUX) experiment [25]. The HADES search for dark matter eliminated the leading candidate, “Dark Photon” or U Boson, as a possibility. This failure also undermines the Standard Model of particle physics [26].
Diffuse interstellar bands (DIBs) are absorption features seen in the spectra of astronomical objects in the Milky Way and other galaxies caused by the absorption of light by the interstellar medium. Development of many theories to assign the approximately 500 bands observed to date in ultraviolet, visible, and infrared wavelengths [27] have been futile as the nature of the absorbing material (the 'carrier') became a crucial problem in astrophysics. An essential challenge is that the central wavelengths do not correspond with any known spectral lines of any ion or molecule. It is widely believed by DIBs researchers that the existence of sub-structure is caused by molecules, particularly large molecules such as polycyclic aromatic hydrocarbons and other large carbon-bearing molecules. Specifically, it is held that the substructure results from band heads in the rotational band contour and from isotope substitution in these large molecules. The existence of molecular hydrino presents another possibility especially given that it is the best candidate for the identity of dark matter.
EPR and Raman spectroscopy recorded on GaOOH:H2(1/4):H2O formed by a hydrino reaction in our laboratory as well as electron beam emission spectroscopy recorded on gas released by thermal decomposition of GaOOH:H2(1/4):H2O dispositively confirmed that the compound comprised H2(1/4), and the gas was identified as H2(1/4) gas. The EPR peaks were each assigned to a spin flip transition with spin-orbital splitting and fluxon linkage splitting. Both the Raman and e-beam spectra show the same splitting, except they each involve a rotational principal transition. It is remarkable, that forty five Raman lines recorded on GaOOH:H2(1/4):H2O and Ni foils run in the SunCell® match those of DIBs as shown in Tables 14A-B infra. The assignment of all the 380 DIBs listed by Hobbs [27] to H2(1/4) rotational transitions with spin-orbital splitting and fluxon sub-splitting are given in the Appendix.
Using a long path length (60 m), multi-reflection absorption cell coupled to a Fourier transform interferometer, Wishnow et al. [28-31] recorded the H2 spectrum at a spectral resolution

8
of 0.24 cm-1 over the wavenumber, temperature, and pressure ranges of 20–320 cm-1, 21–38 K, and 1-3 atmospheres, respectively. Similar to the case with the 21 cm (1.42 GHz) line of ordinary hydrogen, H(1/4) hydrino atom was identified by its predicted 642 GHz (21.4052 cm-1) spin-nuclear hyperfine transition observed by TeraHz absorption spectroscopy of cryogenically cooled H2 below 35K [32].
Another signature characteristic of the HOH catalyst mechanism is the observation of extraordinarily fast H. Plasmas from sources such as glow, RF, and microwave discharges that are ubiquitous in diverse applications ranging from light sources to material processing are now increasingly becoming the focus of a debate over the explanation of the results of ion-energy-characterization studies on specific hydrogen "mixed gas" plasmas. In mixtures of argon and hydrogen, the hydrogen emission lines are significantly broader than any argon line. Historically, Kuraica and Konjevic [33-34], Videnovic et al. [35], and others [36-50] have characterized mixed hydrogen-argon plasmas by determining the excited hydrogen atom energies from measurements of the line broadening of one or more of the Balmer , , and lines of atomic hydrogen at
656.28, 486.13, and 434.05 , respectively. They found that the Balmer lines were extremely broadened and explained the phenomenon in terms of Doppler broadening due to the various models involving acceleration of charges such as , , and in the high fields (e. g. over
10 kV/cm.) present in the cathode fall region herein called field-acceleration models (FAM). The field-acceleration mechanism, which is directional, position dependent, and is not selective of any particular ion cannot explain the Gaussian Doppler distribution, position independence of the fast H energy, absence of the broadening of the molecular hydrogen and argon lines, gas composition dependence of the hydrogen mixed plasma, and is often not internally consistent or consistent with measured densities and cross sections. The energetic hydrino chemical reaction of hydrogen as the source of broadening explains all the aspects of the atomic H line broadening such as lack of an applied-field dependence, the observation that only particular hydrogen-mixed plasmas show the extraordinary broadening. Specifically, HOH and can serve as catalysts to form fast protons and electrons from ionization to conserve the m27.2 eV energy transfer for H (e.g. Eq. (1)). These fast ionized protons recombine with free electrons in excited states to emit broadened H lines [51-59]. Of the noble gases, HOH is uniquely present in argon-H2 plasmas because oxygen is co-condensed with argon during purification from air, and H catalyst is present in hydrogen plasmas from dissociation of H2. Water vapor plasmas also show extreme selective broadening of over 150 eV [53,54, 57] and further show atomic hydrogen population inversion [60-62] also due to free electron-hot-proton recombination following resonant energy transfer from atomic hydrino to HOH catalyst according to Eq. (1).
α β Hα
α
H + H2+ H 3
+
mH

9
Argon gas is cryo-distilled from the atmosphere. Due to the likeness of boiling points, oxygen co-condenses. Oxygen is removed by adding hydrogen and recombining O2 on a recombination catalyst. An exemplary recombination catalyst is Pt or Pd on an alumina support. The reaction is H2 + O2 to H2O. Recombination catalysts work by creating H atoms and they produce water. Argon greatly increases the concentration of H and HOH (versus water dimers) by interfering with interactions between H atoms and HOH molecules. Commercial argon gas uniquely contains trace H2 and O2 that remains after recombination process, and it contains H2(1/4) as a product of the H and HOH catalyst reaction. The ro-vibration band of H2(1/4) was shown by electron beam excitation spectroscopy. Specifically, irradiation of argon comprising H2(1/4) with high energy electrons of an electron beam showed equal, 0.25 eV spaced line emission in the ultraviolet (150-180 nm) region with a cutoff at that matched the H2(1/4) to vibrational transition with a series of rotational transitions corresponding to the H2(1/4) P-branch. The spectral fit was a good match to . wherein 0.515 eV and
0.01509 eV are the vibrational and rotational energies of ordinary molecular hydrogen, respectively. The same series was previous reported by Murnick et al. as shown in Figure 6 of Ref. [63] and could not be unambiguously assigned by the authors. The series was observed with the same type of e-beam argon plasma with a “contaminant gas” and not observed in krypton and xenon plasmas. The band assigned to H2(1/4) was confirmed through the observation of a spectral match with purified H2(1/4) gas as reported previously [64] and infra.
In this paper we present a very extensive array of spectroscopic and energetic signature measurements that confirm the existence of the hydrino state of hydrogen. The hydrino signals cannot be assigned to any known species since they have one or more extraordinary features such as (i) the signals are outside of an energy range of those of known species, (ii) the signals have a physical characteristic unique to hydrino, there is an absence of other signatures that are required for the alternative assignment, or hydrino has an alternative combination of signatures absent that of known species, (iii) the signature is totally novel, and (iv) in the exemplary case of energetics, the energy or power-related signature is much greater than that of a known species, an alternative explanation does not exist, or an alternative is eliminated upon further investigation.
2 Classical Theory
In the atom such as the simplest one, hydrogen, the electron is constantly accelerating around the proton in an atomic orbit. Yet, classical physics requires that accelerating charges radiate energy, which would cause the electron to spiral into the nucleus in a fraction of a second. This seminal problem of the stability of the atom was one of the key obstacles that physicists faced early in the 20th century, and their inability to solve it led to the construction of quantum theory.
ν = 1 ν = 0
420.515eV − 42 J +1( )0.01509;J = 0,1,2,3...

10
Mills solved the structure of the electron using classical physical laws, such that electron orbits were stable to radiation. This allowed Mills to construct a new theory of atoms and molecules that was based entirely on classical physics that provides exact solutions for core phenomena and observables of chemistry and physics over the scale of quarks to cosmos, 85 orders of magnitude.
According to Mills GUT-CP, nature is classical [1]. Electrons, when bound in an atom,
are considered to be discrete two-dimensional spherical membranes of charge and current that completely surround the nucleus as a bubble that can be viewed in a medium such as superfluid helium [65]. These shells, called electron atomic orbitals, each have an organized pattern of super-current filaments on the surface that gives rise to electron spin. The current may be modulated with a time and spherical harmonic pattern that gives rise to orbital angular momentum. Electrons obey classical physics such that the intrinsic electron angular momentum that arises from the pattern of motion is quantized, and invoking this property predicts that bound electrons are stable to emitting radiation according to Maxwellian electrodynamics. This solves the problem that has plagued atomic physics since the Bohr model of the atom: how an electron, continuously accelerating in the Coulombic field of the proton, is able to remain in a stable orbit [65].
This approach is extended to exactly solve multi-electron atoms and molecules of boundless extent and complexity [1,67-70]. In multi-electron atoms, bound electrons group into a series of concentric shells, each of which is an atomic orbital and may contain several electrons. In molecules, the electrons stretch over two nuclei of each bond of the molecule to form a prolate spheroidal membrane with the nuclei at the foci of the corresponding molecular orbital (MO) which linearly superimposes other such MOs of the molecule. Each MO reaches an equipotential, minimum energy configuration for the system, governed by Maxwellian and Newtonian laws.
From within this frame of reference, GUT-CP unwinds the mysteries of quantum theory. GUT-CP is not a “hidden variables” interpretation of the formalism of quantum theory, rather, it is a new classical theory based on Maxwell’s Equations and Newton’s Laws with relativistic considerations. It explains canonical experiments of quantum mechanics such as the double-slit experiments and the Aspect experiments classically, and provides exact solutions for all the basic phenomena and observables of chemistry and physics over the scale of quarks to cosmos, 85 orders of magnitude [1]. The GUT-CP has been extensively peer reviewed [71]. 3 Parameters and Magnetic Energies Due to the Spin Magnetic Moment of H2(1/4)
This new model of the atom predicted the theoretical existence of the hydrino, or energy states of the hydrogen atom that exist below the energy state of atomic hydrogen. Akin to the case of molecular hydrogen, two hydrino atoms may react to form molecular hydrino.
−13.6 eV

11
Molecular hydrino comprises (i) two electrons bound in a minimum energy,
equipotential, prolate spheroidal, two-dimensional current membrane comprising a molecular orbital (MO), (ii) two nuclei such as two protons at the foci of the prolate spheroid, and (iii) a photon wherein the photon equation of each state is different from that of an excited H2 state given in the Excited States of the Hydrogen Molecule section of Mills [1], in that the photon increases the central field by an integer rather than decreasing the central prolate spheroidal field to that of a reciprocal integer of the fundamental charge at each nucleus centered on the foci of the spheroid, and the electrons of are superimposed in the same shell at the same position
versus being in separate positions. The interaction of the integer hydrino state photon electric
field with each electron of the MO, electron 1 and electron 2, gives rise to a nonradiative radial monopole such that the state is stable. To meet the boundary conditions that each corresponding photon is matched in direction with each electron current and that the electron angular momentum is are satisfied, one half of electron 1 and one half of electron 2 may be spin up and matched with the two photons of the two electrons on the MO, and the other half of electron 1 may be spin up and the other half of electron 2 may be spin down such that one half of the currents are paired
and one half of the currents are unpaired. Thus, the spin of the MO is where each
arrow designates the spin vector of one electron. The two photons that bind the two electrons in the molecular hydrino state are phase-locked to the electron currents and circulate in opposite directions. Given the indivisibility of each electron and the condition that the MO comprises two identical electrons, the force of the two photons is transferred to the totality of the electron MO comprising a linear combination of the two identical electrons to satisfy the central force balance given by Mills Eq. (11.200) [1]. The resulting angular momentum and magnetic moment of the unpaired current density are and a Bohr magneton , respectively.
Due to its unpaired electron, molecular hydrino is electron paramagnetic resonance (EPR) spectroscopy active. Moreover, due to the unpaired electron in a common molecular orbital with a paired electron, the EPR spectrum is uniquely characteristic of and identifies molecular hydrino as shown infra. The spin flip transition energy is (6)
Given that flux is linked by an unpaired electron in quantized units of the fluxon or magnetic flux
quantum the corresponding g factor given by Mills Eq. (16.218) [1] is
(7)
H2 1/ p( )
Z = 1
H2 1/ p( )ξ ξ
!
12
↑↑ + ↓↑( )
! µB
ΔEmag gspin = gH2 (1/4)µBB
h2e
gH2 (1/ p) = 2 1+ 2α2π
+ 23α 2 α
2π⎛⎝⎜
⎞⎠⎟− 43
α2π
⎛⎝⎜
⎞⎠⎟
2⎛
⎝⎜⎜
⎞
⎠⎟⎟
⎛
⎝⎜⎜
⎞
⎠⎟⎟= 2.0046386

12
wherein is the fine structure constant. The unpaired-paired coupling or spin-orbital coupling energy is given as the diamagnetic moment times the magnetic flux of the unpaired electron. Since flux is linked by an unpaired electron in units of the magnetic flux quantum, the spin-orbital coupling energy between two magnetic moments of given by Mills Eqs. (2.194)
and (16.225) [1] can be expressed as:
(8)
wherein the semiminor radius of the MO is given by Mills Eq. (11.205) [1] with
and is the magnitude of the diamagnetic susceptibility of the paired electron given by Mills
Eqs. (11.416) and (16.226) [1]:
(9)
The unpaired-paired coupling energy given by Mills Eq. (16.227) [1] is
(10)
wherein is a positive integer. Consider the case that the EPR frequency is 9.820295 GHz, the resonance magnetic flux
for the principal peak given by Eqs. (6-7) is
(11)
where is Planck’s constant and is the Bohr magneton. The resonance magnetic flux shift of a principal peak at position due to a splitting energy is given by
(12)
Using Eqs. (10-12), the downfield and upfield shifts with quantized spin-orbital splitting energies (Eq. (10) and electron spin-orbital coupling quantum numbers are
given in units of Gauss by
(13)
The spin-orbital splitting shift of (Eq. (10)) is independent of the applied EPR field/frequency combination for both downfield and upfield shifted peaks.
The free electron of must link the magnetic flux component corresponding to
spin-orbital coupling. This flux contribution increases the magnetic energy and the energy of the
α
ES /O H2 1/ 4( )
ES /O = χmm1
4 2( )−3α 5 2π( )2mec2 3
4
⎡
⎣
⎢⎢⎢
⎤
⎦
⎥⎥⎥
H2 1/ 4( ) p = 4χm
χm =αΔBTB
34=αµ0 4− 2 ln 2 +1
2 −1
⎛
⎝⎜
⎞
⎠⎟pe2
36a0me1+ pα 2( ) 3
4= 7.0821 X 10⁻⁷
Es/o = m7.0821X10−7 64 2( )1.5α 5 2π( )2( )mec2 3
4= m7.426 X 10−27 J
m
B
B = h9.820295GHz2.0046386µB
= 0.35001 T
h µBΔBC B1 EC
ΔBC = B1EC
h9.820295GHzΔBS /O
ES /O m = 0.5,1,2,3,5....
ΔBS /O = m0.35001 7.426 X 10⁻²⁷ Jh9.820295GHz
⎡
⎣⎢
⎤
⎦⎥T = m3.99427 G
m7.426 X 10−27 J
H2 1/ 4( )
13
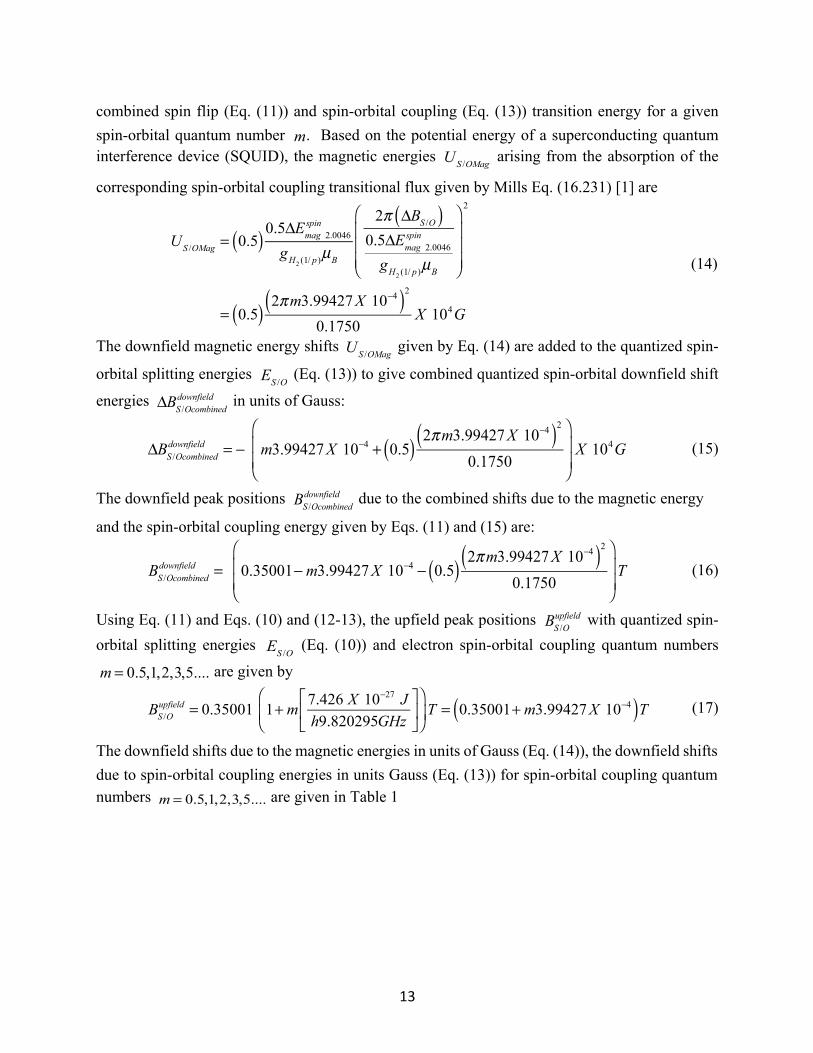
combined spin flip (Eq. (11)) and spin-orbital coupling (Eq. (13)) transition energy for a given spin-orbital quantum number . Based on the potential energy of a superconducting quantum interference device (SQUID), the magnetic energies arising from the absorption of the
corresponding spin-orbital coupling transitional flux given by Mills Eq. (16.231) [1] are
(14)
The downfield magnetic energy shifts given by Eq. (14) are added to the quantized spin-
orbital splitting energies (Eq. (13)) to give combined quantized spin-orbital downfield shift
energies in units of Gauss:
(15)
The downfield peak positions due to the combined shifts due to the magnetic energy
and the spin-orbital coupling energy given by Eqs. (11) and (15) are:
(16)
Using Eq. (11) and Eqs. (10) and (12-13), the upfield peak positions with quantized spin-orbital splitting energies (Eq. (10)) and electron spin-orbital coupling quantum numbers
are given by
(17)
The downfield shifts due to the magnetic energies in units of Gauss (Eq. (14)), the downfield shifts due to spin-orbital coupling energies in units Gauss (Eq. (13)) for spin-orbital coupling quantum numbers are given in Table 1
mUS /OMag
US /OMag = 0.5( )0.5ΔEmag 2.0046spin
gH2 (1/ p)µB
2π ΔBS /O( )0.5ΔEmag 2.0046
spin
gH2 (1/ p)µB
⎛
⎝
⎜⎜⎜
⎞
⎠
⎟⎟⎟
2
= 0.5( ) 2πm3.99427X 10−4( )2
0.1750X 10⁴G
US /OMag
ES /OΔBS /Ocombined
downfield
ΔBS /Ocombineddownfield = − m3.99427X 10−4 + 0.5( ) 2πm3.99427X 10−4( )2
0.1750
⎛
⎝⎜⎜
⎞
⎠⎟⎟X 104G
BS /Ocombineddownfield
BS /Ocombineddownfield = 0.35001−m3.99427X 10−4 − 0.5( ) 2πm3.99427X 10−4( )2
0.1750
⎛
⎝⎜⎜
⎞
⎠⎟⎟T
BS /Oupfield
ES /Om = 0.5,1,2,3,5....
BS /Oupfield = 0.35001 1+m 7.426 X 10⁻²⁷ J
h9.820295GHz⎡
⎣⎢
⎤
⎦⎥
⎛
⎝⎜⎞
⎠⎟T = 0.35001+m3.99427X 10−4( )T
m = 0.5,1,2,3,5....

14
Table 1. The frequency independent EPR downfield shifts due to the magnetic
energies and the downfield shifts due to spin-orbital coupling energies for spin-orbital coupling quantum numbers .
m Downfield Magnetic
Energy Shift (G)
Spin-Orbital Shift (G)
0.5 0.04499 1.99714 1 0.17995 3.99427 2 0.71981 7.98854 3 1.61957 11.98281 4 2.87924 15.97708 5 4.49881 19.97135
The combined downfield shifts due to the magnetic and spin-orbital coupling energies in units of Gauss (Eq. (15)), the resulting downfield peak positions (Eq. (16), and the upfield peak positions (Eq. (17)) shifted only by the spin-orbital coupling energies (Eq. (13)), for spin-orbital coupling quantum numbers wherein the principal peak with the g-factor of 2.0046386 (Eq. (7)) is observed at 0.35001 T (Eq. (11) are given in Table 2. Table 2. The 9.820295 GHz EPR combined downfield shifts due to the magnetic and
spin-orbital coupling, the resulting downfield peak positions, and the upfield peak positions shifted only by the spin-orbital coupling energies for spin-orbital coupling quantum numbers
. m Combined
Downfield Magnetic
Energy Shift (G)
Downfield Peak Position
(T)
Upfield Peak Position
(T)
0.5 2.04212 0.34980 0.35021 1 4.17422 0.34959 0.35041 2 8.70835 0.34914 0.35081 3 13.60238 0.34865 0.35121 4 18.85632 0.34812 0.35160 5 24.47016 0.34756 0.35200
During a spin flip transition, magnetic flux is linked by an unpaired electron in quantized
units of the fluxon or the magnetic flux quantum . The fluxon linkage energies
by molecular hydrino during a spin transition given by Mills Eqs. (16.237-16.240) [1]
are
H2 1/ 4( )
m = 0.5,1,2,3,5
m = 0.5,1,2,3,5....
H2 1/ 4( )
m = 0.5,1,2,3,5
Φ0 =h2e
h2e
EΦ
H2 1/ 4( )

15
(18)
wherein based on the quantized angular momentum components involved in the
transition. Using Eq. (12) with the , the fluxon linkage energy of (Eq. (18)), and the
spin-orbital peak positions (Eqs. (16) and (17)), the separation of the integer series of peaks
at each spin-orbital peak position (Table 2) for an EPR frequency of 9.820295 GHz is given by
(19)
and
(20)
for electron fluxon quantum numbers . The 9.820295 GHz EPR spectral
separations (Eqs. (19) and (20)) of each integer series of the peaks comprising sub-splitting
of the downfield and upfield peaks of Table 2 corresponding to the principal peak having a g-factor of 2.0046386 (Eq. (7)) split by quantized spin-orbital coupling energies (Eq. (13)) and magnetic energies (Eq. (14)) for electron spin-orbital coupling quantum numbers
and electron fluxon quantum numbers (Eq. (18)) are given in Table
3.
EΦ = mΦ4 α2π
+ 23α 2 α
2π⎛⎝⎜
⎞⎠⎟− 4
3α2π
⎛⎝⎜
⎞⎠⎟
2⎛
⎝⎜⎜
⎞
⎠⎟⎟χmΦ
µBs s+1( )
jΦ0
A⎛⎝⎜
⎞⎠⎟
= mΦ j0.0046386χmΦµBs s+1( )
µ0
r3
e!2me
⎛
⎝⎜⎞
⎠⎟⎛
⎝⎜⎜
⎞
⎠⎟⎟
= mΦ j5.7830 X 10−28 J( )mΦ = 1,2,3
EΦ H2 1/ 4( )ΔBΦ
ΔBΦdownfield =
0.35001−m3.99427X 10−4
− 0.5( ) 2πm3.99427X 10−4( )2
0.1750
⎛
⎝
⎜⎜⎜
⎞
⎠
⎟⎟⎟
mΦ5.7830 X 10⁻²⁸ Jh9.820295GHz
⎡
⎣⎢
⎤
⎦⎥ X 104G
ΔBΦupfield = 0.35001+m3.99427X 10−4( ) mΦ5.7830 X 10⁻²⁸ J
h9.820295GHz⎡
⎣⎢
⎤
⎦⎥ X 104G
mΦ = 1,2,3 H2 1/ 4( )ΔBΦ
ΔBS /OUS /OMag
m = 0.5,1,2,3,4,5 mΦ = 1,2,3

16
Table 3. The 9.820295 GHz EPR spectral separation of each integer series of
the peaks comprising sub-splitting of the downfield and upfield peaks of Table 2 for electron spin-orbital coupling quantum numbers and electron fluxon quantum numbers
. m Downfield
Peak Position (T)
(G)
Upfield Peak
Position (T)
(G)
0.5 1 0.34980 0.3109 0.35021 0.3112 1 2 0.34959 0.6214 0.35041 0.6228 2 3 0.34914 0.9309 0.35081 0.9353 3 3 0.34865 0.9296 0.35121 0.9364 4 3 0.34812 0.9282 0.35160 0.9375 5 3 0.34756 0.9267 0.35200 0.9385
The predicted EPR spectrum was confirmed experimentally [72]. The 9.820295 GHz EPR
spectrum was performed on a white polymeric compound identified by X-ray diffraction (XRD), energy-dispersive X-ray spectroscopy (EDS), transmission electron spectroscopy (TEM), scanning electron microscopy (SEM), time-of-flight secondary ionization mass spectroscopy (ToF-SIMs), Rutherford backscattering spectroscopy (RBS), and X-ray photoelectron spectroscopy (XPS) as GaOOH:H2(1/4). The GaOOH:H2(1/4) was formed by dissolving Ga2O3 and gallium-stainless steel metal (~0.1-5%) alloy collected from a hydrino reaction run in a SunCell® in 4M aqueous KOH, allowing fibers to grow, and float to the surface where they were collected by filtration. The white fibers were not soluble in concentrated acid or base, whereas control GaOOH is. No white fibers formed in control solutions. Control GaOOH showed no EPR spectrum. The experimental EPR shown in Table 4 was acquired by Professor Fred Hagen, TU Delft, with a high sensitivity resonator at a microwave power of -28 dB and a modulation amplitude of 0.02 G, that can be changed to 0.1 G since Dr. Hagen rigorously determined that the minimum line width is 0.15 to 0.2 G. The average error between EPR spectrum and theory for peak positions given in Table 4 was 0.097 G. The EPR spectrum was replicated by Bruker (Bruker Scientific LLC, Billerica, MA) using two instruments on two samples as shown in Figures 3A-C.
H2 1/ 4( ) ΔBΦ
m = 0.5,1,2,3,4,5mΦ = 1,2,3
mΦ ΔBΦ ΔBΦ

17
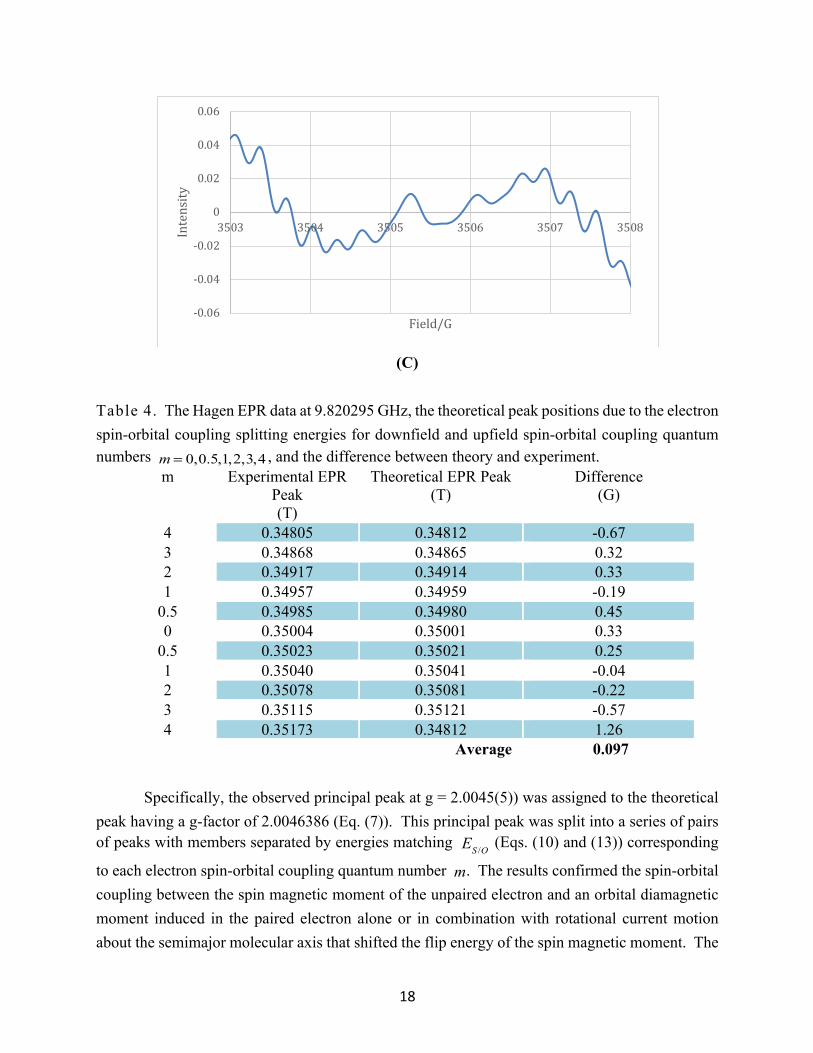
Figures 3A-C. EPR spectra of GaOOH:H2(1/4) replicated by Bruker using two instruments on two samples. (A) EMXnano data. (B) EMXplus data. (C) Expansion of EMXplus data, 3503 G - 3508 G region.
(A)
(B)
18
(C)
Table 4. The Hagen EPR data at 9.820295 GHz, the theoretical peak positions due to the electron spin-orbital coupling splitting energies for downfield and upfield spin-orbital coupling quantum numbers , and the difference between theory and experiment.
m Experimental EPR Peak (T)
Theoretical EPR Peak (T)
Difference (G)
4 0.34805 0.34812 -0.67 3 0.34868 0.34865 0.32 2 0.34917 0.34914 0.33 1 0.34957 0.34959 -0.19
0.5 0.34985 0.34980 0.45 0 0.35004 0.35001 0.33
0.5 0.35023 0.35021 0.25 1 0.35040 0.35041 -0.04 2 0.35078 0.35081 -0.22 3 0.35115 0.35121 -0.57 4 0.35173 0.34812 1.26
Average 0.097 Specifically, the observed principal peak at g = 2.0045(5)) was assigned to the theoretical
peak having a g-factor of 2.0046386 (Eq. (7)). This principal peak was split into a series of pairs of peaks with members separated by energies matching (Eqs. (10) and (13)) corresponding
to each electron spin-orbital coupling quantum number . The results confirmed the spin-orbital coupling between the spin magnetic moment of the unpaired electron and an orbital diamagnetic moment induced in the paired electron alone or in combination with rotational current motion about the semimajor molecular axis that shifted the flip energy of the spin magnetic moment. The
-0.06
-0.04
-0.02
0
0.02
0.04
0.06
3503 3504 3505 3506 3507 3508Intensity
Field/G
m = 0,0.5,1,2,3,4
ES /Om

19
data further matched the theoretically predicted one-sided tilt of the spin-orbital splitting energies wherein the downfield shift was observed to increase with quantum number due to the magnetic energies (Eq. (14)) of the corresponding magnetic flux linked during a spin-orbital
transition. Each spin-orbital splitting peak was further sub-split into a series of equally spaced peaks that matched the integer fluxon energies (Eqs. (19) and (20)) dependent on electron fluxon quantum number corresponding to the number of angular momentum components
involved in the transition. The evenly spaced series of sub-splitting peaks was assigned to flux linkage during the coupling between the paired and unpaired magnetic moments in units of the
magnetic flux quantum while a spin flip transition occurs. The EPR spectrum recorded at
different frequencies showed that the peak assigned the g factor of 2.0046386 (Eq. (7)) remained at constant g factor. Moreover, the peaks, shifted by the fixed spin-orbital splitting energies relative to this true g-factor peak, exactly maintained the separation of the spin-orbital splitting energies independent of frequency as predicted. The GaOOH:H2(1/4) EPR spectrum recorded at Delft University showed remarkably narrow line widths due to the dilute presence of H2(1/4) molecules trapped in GaOOH cages that comprised a diamagnetic matrix. The structure of GaOOH:H2(1/4) and electronic state of H2(1/4) permitted the observations of unprecedented low splitting energies that are between 1000 and 10,000 times smaller than the H Lamb shift.
As given in the Hydrino Hydride Ion Hyperfine Lines section of Mills [1], the pattern of integer-spaced peaks predicted for the EPR spectrum of is very similar to that
experimentally observed on the hydrino hydride ion shown in Figure 4 that also comprises a paired and unpaired electron in a common orbital, except that the orbital is an atomic orbital [11, 73-76].
mUS /OMag
ΔBΦ
mΦ
h2e
H2 1/ 4( )

20
Figure 4. A wavelength-calibrated spectrum (3900-4090 Å) of a hydrino-reaction-plasma formed by heating KNO3 and dissociating H2 using a tungsten filament overlaid with a hydrogen microwave plasma. Due to the requirement that flux is linked by in integer units of the
magnetic flux quantum, the energy is quantized, and the observed emission due to
formation comprises a series of hyperfine lines in the corresponding bound-free band with energies given by the sum of the fluxon energy , the spin-spin energy , and the observed binding
energy peak .
In addition to the peaks in Tables 2 and 3, several very weak peaks assigned to continuations and possible overlaps of series of fluxons of contiguous spin orbital splitting peaks were observed wherein the series intensity decreased significantly due to interference between the competing transitions. This assignment was confirmed by the observation that the very weak peaks shifted with the principal peak and its fine structure peaks with variation in the EPR microwave frequency. Only the principal peak assigned to a g-factor of 2.0046386 (Eq. (7)) at the center of the spectrum is a real g value with a field value that moves linearly with the frequency. All other features including the very weak lines are at a constant distance in field value from the spectral center, implying that they represent an interaction independent of the microwave frequency.
The EPR spectrum showing the principal peak with an assigned g-factor of 2.0046386 and fine structure comprising spin-orbital and spin-orbital magnetic energy splitting with fluxon sub-splitting was observed superimposed on a broad background feature with a center at about the position of the principal peak. It was observed that the fine structure features broadened into a
H 1/ 2( )H − 1/ 2( )
EΦ EssEB*

21
continuum that overlaid the broad background feature as the temperature was lowered into a cryogenic range with the peak assigned to the downfield member corresponding to the electron spin-orbital coupling quantum number being less sensitive to a decrease in temperature than the corresponding upfield peak. The same trend was also observed with increasing microwave power wherein the higher energy transition saturated at a higher power. Thus, the peak assigned to downfield member corresponding to the electron spin-orbital coupling quantum number was selectively observed over the corresponding upfield peak. The higher sensitivity of the upfield peak to low temperature and microwave power is excepted since it corresponds to de-excitation of a spin-orbital energy level during the spin flip transition wherein the spin-orbital energy level requires thermal excitation to be populated. Thus, the population decreases with temperature due to a decreased source of thermal excitation, and the population is smaller than the unexcited population so that it is more easily depleted with microwave power.
The GaOOH:H2(1/4) sample was observed by TEM to comprise two different morphological and crystalline forms of GaOOH. Observed morphologically polymeric crystals comprising hexagonal crystalline structure were very sensitive to the TEM electron beam, whereas rods having orthorhombic crystalline structure were not electron beam sensitive. The latter crystals’ morphology and crystalline structure matches those of the literature for control GaOOH that lacks molecular hydrino inclusion. The hexagonal phase is likely the source of the fine structure EPR spectrum and the orthorhombic phase is likely the source of the broad background EPR feature. Cooling may selectively eliminate, e.g., by microwave power saturation, the observed near free-gas-like EPR spectral behavior of trapped in the hexagonal crystalline
matrix. Any deviations from theory could be due to the influence of the proton of GaOOH and those of water. Also, matrix orientation in the magnetic field, matrix interactions and interactions between one or more could cause some shifts.
Deuterium substitution was performed to eliminate an alternative assignment of any EPR spectral lines as being nuclear split lines. The power released when H2 was replaced by D2 was decrease by at least 1/3. The deuterated analog of GaOOH:H2(1/4), GaOOH:HD(1/4), was confirmed by Raman spectroscopy as shown in Figures 13A-C and Table 9B wherein GaOOH:HD(1/4) was also formed by using D2O. The deuterated analog required a month to form from 4 M potassium hydroxide versus under three days for GaOOH:H2(1/4). The EPR spectrum of the deuterated analog shown in Figure 5 only showed a singlet with no fine structure; thus, eliminating any possible nuclear splitting assignment to the lines given in Table 4.
m = 0.5
m = 0.5
H2 1/ 4( )
H2 1/ 4( )

22
Figure 5. EPR spectrum of GaOOH:HD(1/4) (3464.65 G - 3564.65 G) region.
The g factor and profile matched that of the singlet of GaOOH:H2(1/4) wherein the singlet
in both cases was assigned to the orthorhombic phase. The XRD of the deuterated analog matched that of the hydrogen analog, both comprising gallium oxyhydroxide. TEM confirmed that the deuterated analog comprised 100% orthorhombic phase. The phase preference of the deuterated analog may be due to a different hydrino concentration and kinetic isotope effect which could have also reduced the concentration.
The unpaired electron of molecular hydrino may give rise to non-zero or finite bulk magnetism such as paramagnetism, superparamagnetism and even ferromagnetism when the magnetic moments of a plurality of hydrino molecules interact cooperatively. Matrix magnetism manifest as an upfield shifted matrix peak due to the magnetism of molecular hydrino was observed by 1H MAS nuclear magnetic resonance spectroscopy (NMR) [77], and superparamagnetism was observed using a vibrating sample magnetometer to measure the magnetic susceptibility of compounds comprising molecular hydrino. Specifically, the magnetic characteristic of molecular hydrino is demonstrated by proton magic angle spinning nuclear magnetic resonance spectroscopy (1H MAS NMR) as shown by Mills et al. in the case of electrochemical cells that produce hydrinos called CIHT cells [78]. The presence of molecular hydrino in a solid matrix such as an alkali hydroxide-alkali halide matrix that may further comprise some waters of hydration gives rise to an upfield 1H MAS NMR peak, typically at -4 to -5 ppm due to the molecular hydrinos’ paramagnetic matrix effect whereas the initial matrix devoid of hydrino shows the known down-field shifted matrix peak at +4.41 ppm. Ga2O3:H2(1/4) collected from a stainless steel SunCell® was dissolved in NaOH, filtered, and the filtrate comprising

23
stainless steel oxide and GaOOH was heated to 900 °C in a pressure vessel and the decomposition gas was flowed through hydrated KCl getter packed in a tube connected to the pressure vessel. The 1H MAS NMR spectrum relative to external TMS of the KCl getter exposed to hydrino gas shows an upfield shifted matrix peak at -4.6 ppm due to the magnetism of molecular hydrino (Figure 6). 1H MAS NMR was performed on solid samples using a 500 MHz Bruker instrument with spin speeds of 5 kHz, 10 kHz, and 17.5 kHz to eliminate spinning side bands that shifted with a change in spin speed.
Figure 6. 1H MAS NMR spectrum relative to external TMS of KCl getter exposed to hydrino gas that shows upfield shifted matrix peak at -4.6 ppm due to the magnetism of molecular hydrino.
A convenient method to produce molecular hydrinos is by wire detonation such as Fe wire
detonation in the presence of H2O to serve as the hydrino catalyst and source of H to form H2(1/4) trapped in iron oxides. A self-assembly mechanism is magnetic ordering in addition to van der Waals forces. It is well known that the application of an external magnetic field causes colloidal magnetic nanoparticles such as magnetite (Fe2O3) suspended in a solvent such as toluene to assemble into linear structures. Due to the small mass and high magnetic moment, molecular hydrino magnetically self assembles even in the absence of a magnetic field. Wire detonations in an atmosphere comprising water vapor produced magnetic linear chains of FeOOH/Fe2O3:H2(1/4) that aggregated in air to forms webs. The web did not form without the presence of water vapor. The Fe web was akin to the structure of GaOOH:H2(1/4), confirming the ability of molecular hydrino to form web like complexes in different media. Remarkably, the web fibers were observed to form macroscopically in real time in air and on the micron scale by observation with a scanning electron microscope.

24
Paramagnetic material responds linearly with the induced magnetism, whereas an observed “S” shape is characteristic of superparamagnetism, a hybrid of ferromagnetism and para magnetism. A web of non-magnetic MoO2 complexed to H2(1/4) was formed by detonation of an ultra-high purity Mo wire in an air-water vapor atmosphere. The polymeric MoO2:H2(1/4) web compound was observed to exhibit superparamagnetism. The vibrating sample magnetosusceptometer recording showed an S-shaped curve (Figure 7). It is exception that the induced magnetism peaks at 2-3 kOe and declines with higher applied field.
Figure 7. Vibrating sample magnetometer recording of the hydrino reaction product comprising MoO2:H2(1/4) formed by the detonation of Mo wire in an atmosphere comprising water vapor in air.
4 Rotational Energies Due to the Spin Magnetic Moment of H2(1/4) Molecular hydrino H2(1/p) possesses no electric dipole moment, but it does possess an
unpaired electron that effects selection rules for rotational transitions. The forbidden selection rule barrier to observing infrared spectra may be circumvented by application of an external magnetic field. Raman selection rules are also altered from those of a symmetrical diatomic molecule due to the unpaired electron wherein the electron and consequently the rotational selection rules may be influenced by the application of an external magnetic field. Due to the potential magnetic field effect, both the infrared and Raman spectra may be influenced by recording each spectrum on a compound or material with intrinsic magnetization such as one being ferromagnetic or paramagnetic. An example of the former is molecular hydrino bonded or absorbed on the surface of a nickel or iron foil. An example of the latter is a paramagnetic compound that cages the

25
molecular hydrino such as FeOOH, Fe2O3, or a compound that may be diamagnetic but possess paramagnetic ions in proximity to H2(1/p) such as KCl crystals with trapped H2(1/p) molecules close to paramagnetic impurity ions. Another potential strong agent to particularly enhance the Raman spectrum is a conductive surface that amplifies the laser field locally for absorbed H2(1/p) molecules.
The presence of molecular hydrino in strong matrix magnetic field may result in the
alignment of the free electron angular moment of along the magnetic field vector direction in
either the z-axis or the y-axis direction of the coordinates of H2(1/p) shown in Figure 11.4 of Mills [1]. The external alignment may enhance the permitted excitation of a concerted transition of a rotational molecular hydrino transition coupling to the spin-orbital splitting and fluxon linkage sub-splitting of the free electron energy levels. The spin flip energy given by Eqs. (6-7) with an exemplary intrinsic field of 1 T is (21)
To conserve the photon’s angular momentum of , rotational excitation requires of angular momentum along the axis of molecular rotation, a semiminor axis being either the z-axis or y-axis. The of angular momentum gives rise to a corresponding magnet moment of a Bohr magneton along this rotational angular momentum axis. Typically, the unpaired electron of H2(1/p) gives rise to a Bohr magneton of magnetic moment along the internuclear axis when a magnetic field is applied. However, the molecular rotation of the hydrino molecule about one of the semiminor axes causes the excitation of the semimajor-axis Bohr magneton of magnetic moment to be forbidden. The rotational transition energy may be split by the spin-orbital energy given by Eq. (8), except that the orbital component of spin-orbital splitting is not diamagnetically induced such that and the spin-orbital energy due to rotational excitation is:
(22)
wherein . The spin-orbital splitting energies due to rotation are given in Table 5. The energies of the concerted excitation of the rotational and spin-orbital coupling
transitions are sub-split by the energy corresponding to flux linkage in units of the magnetic flux
quantum . The free electron angular momentum of and the rotational angular momentum
of add when the corresponding vectors are aligned along a common z-axis to give a resultant
!2
ΔEmag 2.0046spin = gH2 (1/ p)µBB = 2.0046386µBB = 1.85910 X 10⁻²³ J (0.93588 cm−1)
! !
!
χm = 1 ES /O ,rot
ES /O ,rot = m1
4 2( )−3 α5 2π( )2
mec2 3
4
⎡
⎣
⎢⎢⎢
⎤
⎦
⎥⎥⎥
= m1.04853X 10−20 J (m6.54434X 10−2eV , m527.83 cm−1)
m = 0.5,1,2,3,...
h2e
!2
!
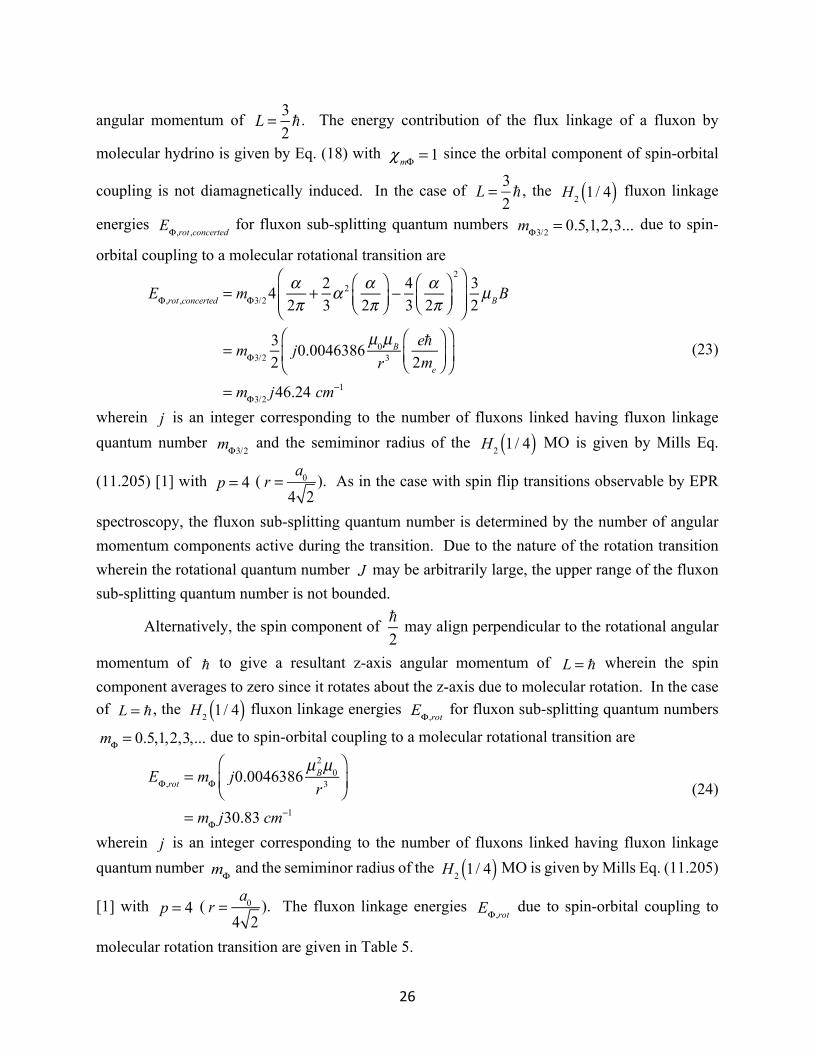
26
angular momentum of . The energy contribution of the flux linkage of a fluxon by
molecular hydrino is given by Eq. (18) with since the orbital component of spin-orbital
coupling is not diamagnetically induced. In the case of , the fluxon linkage
energies for fluxon sub-splitting quantum numbers due to spin-
orbital coupling to a molecular rotational transition are
(23)
wherein is an integer corresponding to the number of fluxons linked having fluxon linkage quantum number and the semiminor radius of the MO is given by Mills Eq.
(11.205) [1] with ( ). As in the case with spin flip transitions observable by EPR
spectroscopy, the fluxon sub-splitting quantum number is determined by the number of angular momentum components active during the transition. Due to the nature of the rotation transition wherein the rotational quantum number may be arbitrarily large, the upper range of the fluxon sub-splitting quantum number is not bounded.
Alternatively, the spin component of may align perpendicular to the rotational angular
momentum of to give a resultant z-axis angular momentum of wherein the spin component averages to zero since it rotates about the z-axis due to molecular rotation. In the case of , the fluxon linkage energies for fluxon sub-splitting quantum numbers
due to spin-orbital coupling to a molecular rotational transition are
(24)
wherein is an integer corresponding to the number of fluxons linked having fluxon linkage quantum number and the semiminor radius of the MO is given by Mills Eq. (11.205)
[1] with ( ). The fluxon linkage energies due to spin-orbital coupling to
molecular rotation transition are given in Table 5.
L = 32!
χmΦ = 1
L = 32! H2 1/ 4( )
EΦ,rot ,concerted mΦ3/2 = 0.5,1,2,3...
EΦ,rot ,concerted = mΦ3/2 4 α2π
+ 23α 2 α
2π⎛⎝⎜
⎞⎠⎟− 4
3α2π
⎛⎝⎜
⎞⎠⎟
2⎛
⎝⎜⎜
⎞
⎠⎟⎟
32µBB
= mΦ3/2
32j0.0046386
µ0µBr3
e!2me
⎛
⎝⎜⎞
⎠⎟⎛
⎝⎜
⎞
⎠⎟
= mΦ3/2 j46.24 cm−1
jmΦ3/2 H2 1/ 4( )p = 4 r =
a04 2
J
!2
! L = !
L = ! H2 1/ 4( ) EΦ,rot
mΦ = 0.5,1,2,3,...
EΦ,rot = mΦ j0.0046386µB
2µ0
r3
⎛
⎝⎜⎞
⎠⎟
= mΦ j30.83 cm−1
jmΦ H2 1/ 4( )
p = 4 r =a04 2
EΦ,rot

27
The absorption of fluxons increases the magnetic energy of . Using Eq. (14), the
Josephson coupling energies due to fluxon linkage during concerted rotational-spin rotational and spin-orbital transitions are given by Eq. (23), and the magnetic energies arising from
the absorption of the integer number of fluxons having fluxon linkage quantum number are given by
(25)
wherein (Eq. (23)), and the energy between
rotational transitions corresponds to the term (Eq. (32, )). The fluxon peak spacing
increases as the energy of the concerted rotation-fluxon absorption transition increases and decreases in the case of emission.
Using Eq. (14), the magnetic energies arising from the absorption of the integer
number of fluxons having fluxon linkage quantum number during concerted rotational
and spin-orbital transitions are given by
(26)
wherein (Eq. (24)), and the energy between
rotational transitions corresponds to the term (Eq. (32, )). The fluxon peak spacing
increases as the energy of the concerted rotation-fluxon absorption transition increases and decreases in the case of emission.
H2 1/ p( )
US /OMag ,concerted
jmΦ3/2 = 2
US /OMag ,concerted =12U0
2π ΔΦ( )Φ0
⎛
⎝⎜
⎞
⎠⎟
2
= 46.24 cm−1 0.5( ) j 2( )46.24 cm−1
1950 cm−1
⎛
⎝⎜
⎞
⎠⎟
2
= 0.0520 j2 cm−1
U0 = 46.24 cm−1;ΔΦ = EΦ,rot ,concerted = 2( )46.24 cm−1
Φ0 p = 4
US /OMag
j mΦ = 2
US /OMag =12U0
2π ΔΦ( )Φ0
⎛
⎝⎜
⎞
⎠⎟
2
= 30.83 cm−1 0.5( ) j 2( )30.83 cm−1
1950 cm−1
⎛
⎝⎜
⎞
⎠⎟
2
= 0.0154 j2 cm−1
U0 = 30.83 cm−1;ΔΦ = EΦ,rot = 2( )30.83 cm−1
Φ0 p = 4

28
Table 5. The electron spin-orbital coupling splitting energies and fluxon sub-splitting energies of molecular rotational transitions for spin-orbital coupling quantum numbers and for electron fluxon quantum numbers and .
m Spin-Orbital Splitting Energy (cm-1)
Fluxon Sub-Splitting Energy
(cm-1)
Fluxon Sub-Splitting Energy (cm-1)
0.5 264 0.5 15.4 0.5 23.1 1 528 1 30.8 1 46.2 2 1056 2 61.7 2 92.5 3 1583 3 92.5 3 138.7 4 2111 4 123.3 4 185.0 5 2639 5 154.1 5 231.2 6 3167 6 185.0 6 277.5 7 3695 7 215.8 7 323.7 8 4223 8 246.6 8 370.0 9 4750 9 277.5 9 416.2 10 5278 10 308.3 10 462.4
The observation of spin-orbital transitions by Raman spectroscopy may be greatly
enhanced by the deposition or absorption of molecular hydrinos on a metal surface to enhance the Raman spectrum. Surface enhanced Raman (SER) is very sensitive because of the surface plasmon waves set up by the stimulating wavelength. The surface plasmon field may extend about 40-60 nm below the surface, providing some depth sensitivity in the material.
The moment of inertia may be measured using rotational energy spectroscopy such as Raman spectroscopy, and using the known nuclear masses, the moment of inertia gives the nuclear separation which is characteristic of and identifies molecular hydrino of a given quantum state. Specifically, for a diatomic molecule having atoms of masses and , the moment of inertia
is (Mills Eq. (12.66)) [1]: (27) where is the reduced mass given by (Mills Eq. (12.67)) [1]:
(28)
and where is the distance between the centers of the atoms, the internuclear distance. The rotational energy levels follow from Mills Eq. (1.71) [1] and are given by (Mills Eq. (12.68)) [1]:
(29)
where is an integer. The pure rotational energies of hydrogen type molecules for transition
m = 0.5,1,2,3,...,10mΦ = 1,2,3,...,10 mΦ3/2 = 1,2,3,...,10
mΦ mΦ3/2
pm1 m2
I = µr 2
µ
µ =m1m2m1 +m2r
Erotational =!2
2IJ (J +1)
J
29
from the to the quantized rotational state are given by (Mills Eq. (12.77)) [1]:
(30)
wherein is the mass of the proton, the moment of inertia , and the
integer-squared dependence is due to the reciprocal integer dependence of the internuclear distance given by (Mills Eq. (12.76)) [1]:
(31)
For example, the predicted rotational energy of is four squared or 16 times that of
due to the internuclear distance being one fourth that of (Eq. (31)). At ambient laboratory
temperature, molecules overwhelmingly populate the rotational state . Then, Eq. (30) becomes
(32)
Molecular hydrino is a diatomic molecule comprising two protons and two electrons,
except that it is unique from molecular hydrogen in that it has an unpaired electron having an
intrinsic angular momentum of . This electron spin angular momentum may align along the
same axis as the rotational angular of or transverse to it. Consider that the rotational energy of about z-axis which is the common axis of the intrinsic electron angular
momentum of and rotational angular momentum of . The rotational energy due to the
concerted double excitation of rotation due to spin and diatomic rotation is given by the sum of the diatomic molecular rotational energy given by Eq. (30) and the spin rotational energy also given by Eq. (30) with the exception that the rotational quantum number can only change by
:
(33)
J J ' ΔEJ→J ' = EJ ' − EJ
= p2!2
2 0.5mp 7.411X10⁻¹¹m( )2( ) J ' J '+1( )− J J +1( )( )
=J ' J '+1( )− J J +1( )( )
2p2121.89 cm−1
mP I = 0.5mp7.411X10−11m
p⎛⎝⎜
⎞⎠⎟
2
2c ' = 0.7411p
Å
H2 1/ 4( ) H2
H2
J = 0
ΔEJ=0→J ' =J ' J '+1( )
2p2121.89 cm−1
H2 1/ p( )
!2
!Erotational H2 1/ p( )
!2
!
J±1
Erotational+spin =!2
2IJ ' J '+1( )− J J +1( )( )+ !
2
IJ +1( )
= J '2+ J '− J 2 + J + 22
⎛⎝⎜
⎞⎠⎟p2121.89 cm−1

30
In the case that the initial rotational state is , Eq. (33) becomes
(34)
Consider that the diatomic molecular rotation is about the z-axis such that the corresponding rotational angular momentum of is aligned along the z-axis. In the case that the axis of the
intrinsic electron spin angular momentum of is along the orthogonal semiminor axis, the y-axis,
the rotation energy of is given by Eq. (32).
The radiation of a multipole of order ( , ) carries units of the z component of
angular momentum per photon of energy . Thus, the z component of the angular momentum of the corresponding excited rotational state is (Mills Eq. (12.69)) [1]: (35) Thus, the selection rule for dipole and quadrupole rotational transitions are (Mills Eq. (12.70)) [1]: (36) and (37) Not only are the lowest energy Raman transitions for pure rotational transitions (Eq.(32)) and for concerted rotational-spin transition (Eq. (34)) allowed by each of the selection rules given by Eqs. (36) and (37) but coupling of allowed dipole and quadrupole transitions permit excitation of higher rotational energy levels. Isotopic substitution and ortho-para state occupancy also determines the section rules of Raman transitions. Exemplary transitions are given in Table 6.
Due to the equivalence of the two semiminor axes, a double rotational excitation comprising the superposition of the independent rotations about each may occur. The energy of the double excitation of these two rotational modes is the sum of the individual pure and concerted rotational transitions. Using Eqs. (32) and (34), the energies of the combined
rotational excitations are
(38)
Exemplary transitions are given in Table 6.
J = 0
Erotational+spin =!2
2IJ ' J '+1( )− J J +1( )( )+ !
2
IJ +1( )
= J '2+ J '+ 22
⎛⎝⎜
⎞⎠⎟p2121.89 cm−1
!!2
Erotational H2 1/ p( )ℓ mℓ m!
!ω
Lz = m!
ΔJ = ±1
ΔJ = ±2
Edouble rotation
Edouble rotational =Jc
'2 + Jc'2 + 2
2⎛
⎝⎜⎞
⎠⎟+J p
' J p' +1( )
2p2121.89 cm−1

31
Table 6. H2(1/4) Raman energies for (i) pure to rotational transitions, (ii) concerted to molecular rotational transition involving a spin rotation transition having the spin rotational state quantum number change from to , and double transition having energies given by the sum of the independent transitions.
J’ Pure Rotational Transition (cm-1)
Concerted Molecular Rotational-Spin Rotation
Transition (cm-1)
Double Rotational Transition (cm-1)
0 0 1950 1/0 3900 1 1950 3900 2/0 7801 2 5851 7801 2/1 9751 3 11701 13652 3/0 13652 4 19502 21453 3/1 15602 5 29254 31204 3/2 19502 6 40955 42905 4/0 21453 7 54607 56557 4/1 23403 8 70209 72159 4/2 27303 9 87761 89711 4/3 33154 10 107263 109213 5/0 31204
The Raman excitation of the pure molecular rotation is allowed for a
rotational transition (Eq. (37)) wherein the spin angular momentum vector is aligned along the y-axis perpendicular to the rotational axis along the z-axis. The transition energy is given
by Eq. (32). Another allowed transition is the coupled excitation of both the rotational transition and an intrinsic spin transition wherein the rotational and intrinsic spin angular momentum are aligned on the common z-axis. The coupled or concerted transition energy is given by the sum of the rotational and the to spin rotational components given by Eq. (34). In addition, the excitation of the spin and rotational transitions results in spin-orbital splitting and fluxon linkage sub-splitting energy shifts of the summation energy given by Eqs. (22-24). These transitions were observed by Raman spectroscopy.
Raman samples of absorbed on metallic surfaces and in metallic and ionic lattices
by magnetic dipole and van der Waals forces were produced by (i) high voltage electrical detonation or Fe wires in an atmosphere comprising water vapor, (ii) low voltage, high current electrical detonation of hydrated silver shots, (iii) ball milling or heating FeOOH and hydrated alkali halide-hydroxide mixtures, and (iv) maintaining a plasma reaction of H and HOH in a so-called SunCell® comprising a molten gallium injector that electrically shorts two plasma electrodes with the molten gallium to maintain an arc current plasma state. Excess power of over 300 kW was measured by water and molten metal bath calorimetry [79]. Raman spectra were recorded on these materials using the Horiba Jobin Yvon LabRAM Aramis Raman spectrometer with (i) a 785
J = 0 J ' = 1,2,3,...J = 0 J ' = 0,1,2,3,...
J = 0 J = 1
J p' / Jc
'
H2 1/ 4( ) ΔJ = 2
H2 1/ 4( )
ΔJ = 2 J = 0 J = 1
H2 1/ 4( )

32
nm laser, (ii) a 442 nm laser, and (iii) a HeCd 325 nm laser in microscope mode with a magnification of 40X. Figures 8A-B. Schematics of a SunCell® hydrino power generator comprising a single electromagnetic pump injector and electrode in an injector reservoir electrode, a vertically aligned counter electrode, and a glow discharge cell connected through a top flange of the SunCell® to form HOH catalyst and atomic H. A. Exterior view. B. Cross sectional view. 1. Electromagnetic pump assembly. 2. Molten gallium reservoir. 3. Ignition injector electrode. 4. Ignition counter electrode. 5. Reaction cell chamber. 6. Vacuum line. 7. Glow discharge cell. 8. Glow discharge chamber. 9. Discharge cell flange and top plate. 10. Discharge cell high voltage feedthrough. 11. Discharge electrode. 12. Discharge gas inlet. 13. Discharge gas outlet. 14. Auxiliary gas inlet line. 15. Ignition counter electrode water cooling inlet line. 16. Ignition counter electrode water cooling outlet line.
(A) (B)
Nickel foil Raman samples were prepared by flowing a hydrino reaction mixture comprising 2000 standard cubic centimeters per minute (sccm) H2 and 1 sccm O2 into a one-liter reaction volume SunCell® shown in Figure 8. The SunCell® comprised an 8-inch diameter 4130 Cr-Mo steel cell with a Mo liner along the reaction cell chamber wall. The SunCell® further

33
comprised molten gallium in a reservoir, an electromagnet pump that served as an electrode and pumped the gallium vertically against a W counter electrode, a low-voltage-high-current ignition power source that maintained a hydrino reaction plasma by maintaining a high current between the electrodes, and a glow discharge hydrogen dissociator and recombiner connected directly to the top flange of the SunCell® reaction cell chamber by a 0.75-inch OD set of Conflat flanges. The glow discharge voltage was 260 V. The glow discharge current was 2 A. The operating pressure was 5.9 Torr. The gallium temperature was maintained at 400°C with water bath cooling. Arc plasma was maintained by an ignition current of 1300A at a voltage of 26-27 V. The electromagnetic pump rate was 100 g/s, and the output power was over 300 kW for an input ignition power of 29 kW corresponding to a gain of 10 times. The Ni foils (1 X 1 X 0.1 cm) to make the Raman samples were placed in the molten gallium. The hydrino reaction was run for 10 minutes, and the cloth-wipe-cleaned surfaces of the foils were analyzed by Raman spectroscopy using a Horiba Jobin Yvon LabRAM Aramis Raman spectrometer with (i) a 785 nm laser and (ii) a 442 nm laser, and a Horiba Jobin-Yvon Si CCD detector (Model number DU420A-OE-324) and a 300 line/mm grating.
The Raman spectrum (2500 cm-1 to 11,000 cm-1) obtained using a Horiba Jobin Yvon LabRam ARAMIS spectrometer with a 11 mW, 785 nm laser on a Ni foil prepared by immersion in the molten gallium of a SunCell® that maintained a hydrino plasma reaction for 10 minutes is shown in Figures 9A-C. The energies of all the novel lines matched either (i) the pure
rotational transition (Eq. (32)) with spin-orbital coupling energy (Eq. (22)) and
fluxon linkage energy (Eq. (24)):
(39)
(ii) the concerted transition comprising the to rotational transitions with the to spin rotational transition (Eq. (34)). Corresponding spin-orbital coupling energy (Eq. (22)) and fluxon linkage energy (Eq. (23)) were also observed with the concerted transition:
(40)
Or (iii) the double transition for final rotational quantum numbers (Eq. (38)) and
with energies given by the sum of the independent transitions:
(41)
The use of the combination of a Si CCD detector with a detection energy range of about 3500 cm-1 with a 785 nm laser wherein the photon energy plus the laser heating energy is capable
ERamanH2 1/ 4( ) J ' = 3
ERaman = ΔEJ=0→J '=3 + ES /O ,rot + EΦ,rot
= 11701 cm−1 +m528 cm−1 +mΦ31 cm−1
J = 0 J ' = 2,3 J = 0J = 1
ERaman = ΔEJ=0→J '=2(3) + ΔEJ=0→1 + ES /O ,rot + EΦ,rot
= 7801 cm−1 13,652 cm−1( )+m528 cm−1 +mΦ3/2 46 cm−1
J p' = 2 Jc
' = 1
ERaman = ΔEJ=0→J p
' =2+ ΔE
J=0→Jc' =1
+ ES /O ,rot + EΦ,rot
= 9751 cm−1 +m528 cm−1 +mΦ31 cm−1 +mΦ3/2 46 cm−1

34
of exciting rotational emission with an upper energy limit of about 14,500 cm-1 enables the detection of sets of multi-order emission spectral lines within spectral windows that very nearly match the ranges of separations of the 785 nm multi-order laser lines. According to Eq. (42), the laser multi-order lines are observed in 2nd, 3rd, 4th, 5th, and 6th order at energies of
6371, 8495, 9557, 10,193, 10,618 cm-1, respectively (Figures 9A-C) wherein all the 785 nm laser multi-order lines have a photon energy of 12,742 cm-1 (1.58 eV).
(42)
The assignments to sets of multi-order emission spectral lines within specific spectral ranges corresponding to the laser excitation energy range and the detector range matches the decrease in energy separation between members of one set versus the members of the next higher energy, higher order set and the decrease in line intensities between members of a given set as the wavenumber increases (Figures 9A-C). A control comprising Ni-gallium alloy Ni3Ga that was formed as a byproduct from the Raman sample nickel foils suspended on the gallium surface during the SunCell® is shown in Figure 9D. No lines were observed which confirmed that the novel lines observed in the Ni foil are real and not an artifact. This result further demonstrates that molecular hydrino binds to Ni foil, but not Ni-gallium alloy. The novel lines shown in Figures 9A-C were eliminated by a Semrock long-pass edge filter (BLP01-785R-25) having an edge wavelength of 805 nm and Tavg > 93% 812.1 – 1200 nm placed between the sample and the detector confirming the assignment to high energy emission rather than low energy Raman transitions. Only the 4th order laser line was observed at 3133 nm in the filtered emission spectrum shown in Figure 9E.
ERaman,order m
ERaman,order m = 12,742 1− 1m
⎛⎝⎜
⎞⎠⎟cm−1; m = 2,3,4,5,6,...

35
Figures 9A-D. Raman spectra obtained using a Horiba Jobin Yvon LabRam ARAMIS spectrometer with a 11mW, 785 nm laser on a Ni foil prepared by immersion in the molten gallium of a SunCell that maintained a hydrino plasma reaction for 10 minutes and control Ni3Ga byproduct. A. Ni foil 2500 cm-1 to 11,000 cm-1 region. B. Ni foil 8500 cm-1 to 11,000 cm-1 region. C. Ni foil 6000 cm-1 to 11,000 cm-1 region. D. Ni3Ga byproduct 2500 cm-1 to 11,000 cm-
1 region. E. Ni foil 0 nm to 6000 nm emission region with Semrock long-pass edge filter. All the novel Ni foil emission lines in Figures 9A-C matched those of either (i) the pure
to rotational transition, (ii) the concerted transitions comprising the to rotational transitions with the to spin rotational transition, or (iii) the double transition for final rotational quantum numbers and . Corresponding spin-orbital coupling and
fluxon coupling were also observed with the pure, concerted, and double transitions.
(A)
H2 1/ 4( ) J = 0J ' = 3 J = 0 J ' = 2,3
J = 0 J = 1J p' = 2 Jc
' = 1

36
(B)
(C)

37
(D)
Emission (nm)
(E)

38
Table 7A. H2(1/4) Raman lines and the corresponding multi-order emission lines for the 785 nm Raman spectrum (2500-11,000 cm-1) of a Ni foil exposed to the hydrino reaction (Figures 9A-C). The parent emission line of each observed Raman line is the wavenumber of the farthest right-handed column wherein the order of the observed line is given in the corresponding column header. Next, the list of parent lines and the parent lines sorted by energy are given.
Observed Lines (cm-1)
Emission Line
(cm-1)
2° 3° 4° 5° 6° Parent Line
(cm-1)
Sorted Lines (cm-1)
3354 9388 9388 7255 3862 8880 8880 7759 4027 8715 8715 8148 4452 8290 8290 8290 4594 8148 8148 8504 4983 7759 7759 8715 5487 7255 7255 8880 5770 6972 13944 13944 9062 5835 6907 13814 13812 9388 6059 6683 13366 13365 9754 6280 6462 12924 12924 9966 6350 6392 12784 12784 10143 6652 6090 12180 12181 10188 6965 5777 11554 11554 10216 7457 5285 10570 10570 10508 7865 4877 9754 9754 10570 8211 4531 9062 9062 10668 8490 4252 8504 8504 10701 8750 3992 7984 11976 11976 10872 8765 3977 7954 11931 11931 11088 8976 3766 7532 11298 11298 11100 8989 3753 7506 11259 11259 11259 9175 3567 7134 10701 10701 11276 9186 3556 7112 10668 10668 11298 9346 3396 6792 10188 10188 11380 9361 3381 6762 10143 10143 11554 9420 3322 6644 9966 9966 11720

39
9689 3053 6106 9159 12212 12212 11790 9812 2930 5860 8790 11720 11720 11931 9923 2819 5638 8457 11276 11276 11976 10024 2718 5436 8154 10872 10872 12006 10115 2627 5254 7881 10508 10508 12015 10188 2554 5108 7662 10216 10216 12181 10268 2474 4948 7422 9896 12370 12370 12212 10339 2403 4806 7209 9612 12015 12015 12240 10466 2276 4552 6828 9104 11380 11380 12370 10522 2220 4440 6660 8880 11100 11100 12492 10660 2082 4164 6246 8328 10410 12492 12492 12784 10702 2040 4080 6120 8160 10200 12240 12240 12924 10741 2001 4002 6003 8004 10005 12006 12006 13365 10777 1965 3930 5895 7860 9825 11790 11790 13812 10894 1848 3696 5544 7392 9240 11088 11088 13944
Table 7B. H2(1/4) Raman lines and corresponding hydrino assignments for the 785 nm Raman spectrum (2500-11,000 cm-1) of a Ni foil exposed to the hydrino reaction (Figures 9A-C). The theoretical rotational energy assignments are according to the energies given in Table 6. The quantum numbers corresponding to spin-orbital splitting and fluxon sub-splitting of the assigned parent peaks are and , and respectively, having energies given in Table 5. Delta is the
difference between the observed and theoretical lines.
Parent Emission
Lines (cm-1)
Rotational Energy (cm-1)
Theoretical (cm-1)
Delta (cm-1)
7255 7801 -1 -0.5 7250 5 7759 7801 -1 7755 4 8148 7801 0.5 2 8157 -9 8290 7801 1 -1 8283 7 8504 7801 1.5 -2 8500 4 8715 7801 1.5 2.5 8708 7 8880 7801 2 0.5 8880 0 9062 9751 -1.5 2 1 9067 -5 9388 9751 -0.5 -2 9395 -7 9754 9751 9751 3 9966 9751 0.5 -1 9969 -3 10143 9751 0.5 1 2 10138 5
m mΦ m
Φ3/2
m mΦ mΦ3/2

40
10188 9751 1 -2 10187 1 10216 9751 1 -2 10217 -1 10508 9751 1.5 -1 10512 -4 10570 9751 1.5 1 10574 -4 10668 9751 1.5 1 2 10666 2 10701 9751 2 -0.5 -2 10699 2 10872 11701 -1.5 -1 10879 -7 11088 11701 -1 -2.5 11097 -9 11100 11701 -1 -2.5 11097 3 11259 11701 -1 2.5 11251 8 11276 11701 -1 3 11266 10 11298 11701 -1 4 11297 1 11380 11701 -0.5 -2 11376 4 11554 11701 -0.5 3.5 11545 9 11720 11701 0.5 11717 3 11790 11701 3 11794 -4 11931 11701 0.5 -1 11935 -4 11976 11701 0.5 0.5 11981 -5 12006 11701 0.5 1 11996 10 12015 11701 0.5 1.5 12012 3 12181 11701 1 -1.5 12183 -2 12212 11701 1 -0.5 12214 -2 12240 11701 1 0.5 12245 -5 12370 11701 1.5 -4 12370 0 12492 11701 1.5 12493 -1 12784 13652 -1.5 -1.5 12791 -7 12924 13652 -1.5 1.5 12929 -5 13365 13652 -0.5 -0.5 13365 1 13812 13652 0.5 -2 13823 -11 13944 13652 0.5 0.5 13939 5
The Raman peaks assigned to rotational transitions in Table 7B were also
observed on hydrated silver shots that were detonated with a current of about 35,000 A [2] as well as SunCell® gallium and Cr, Fe, and stainless-steel foils immersed in the gallium wherein the Raman spectra were run post a SunCell® hydrino plasma reaction as in the case of the Ni foils. The Ni foils showed the greatest peak intensities. The peaks recorded on carbon witness plates were very weak to absent. Raman spectra on pure gallium samples as a function of depth showed that the Raman peaks decreased in intensity with depth and were only found in trace on the negatively polarized W electrode which confirmed previous observations that the hydrino reaction occurs in the plasma at the surface and proximal space above the positive electrode, the positively
H2 1/ 4( )

41
polarized molten gallium in this case. This is consistent with the rate-increasing mechanism of recombining ions and electrons to decrease the space charge caused by the energy transfer to the catalyst and its consequent ionization.
was also observed as a product of the SunCell® hydrino reaction by collection
and purification of a hydrino product from the molten gallium of the SunCell® following a hydrino reaction. Specifically, a 10-minute-duration hydrino reaction plasma run was maintained in the SunCell®, and a white polymeric compound (GaOOH:H2(1/4)) was formed by dissolving Ga2O3 and gallium-stainless steel metal alloy (~0.1-5%) collected from the SunCell® gallium post run in aqueous 4M KOH, allowing fibers to grow, and float to the surface where they were collected by filtration. The Raman spectrum (2200 cm-1 to 11,000 cm-1) shown in Figure 10 was obtained using a Horiba Jobin Yvon LabRam ARAMIS spectrometer with a 785 nm laser on the GaOOH:H2(1/4). All the novel lines matched those of either (i) the pure to rotational
transition, (ii) the concerted transitions comprising the to rotational transitions with the to spin rotational transition, or (iii) the double transition for final rotational quantum numbers and . Corresponding spin-orbital coupling and fluxon coupling
were also observed with the pure, concerted, and double transitions. The peaks matched the peaks given in Table 7B, except that a second set of peaks was additionally observed, shifted 150 cm-1 relative to the set observed on Ni foil (Figures 9A-C). This is likely due to the presence of two phases of GaOOH:H2(1/4) that was confirmed by XRD and TEM and was the source of two distinct spectra in the EPR as discussed in the Parameters and Magnetic Energies Due to the Spin Magnetic Moment of H2(1/4) section.
H2 1/ 4( )
H2 1/ 4( ) J = 0 J ' = 3
J = 0 J ' = 2,3J = 0 J = 1
J p' = 2 Jc
' = 1

42
Figure 10. Raman spectrum (2200 cm-1 to 11,000 cm-1) obtained using a Horiba Jobin Yvon LabRam ARAMIS spectrometer with a 785 nm laser on GaOOH:H2(1/4) showing H2(1/4) rotational transitions with spin-orbital coupling and fluxon linkage shifts.
Hydrinos were identified by characteristic extreme ultraviolet (EUV) continuum radiation
due to the H to H(1/4) transition that was observed at an average power of 4.6 MW and having a predicted 10.1 nm cutoff. Specifically, HOH catalyst was further shown to give continuum EUV radiation by igniting hydrated silver shots comprising a source of H and HOH catalyst by passing a low voltage, high current through the shot to produce explosive plasma that emitted brilliant light predominantly in the short-wavelength 10 to 300 nm region. The power and energy of the light released from the shot ignition event were determined using absolute spectroscopy over the 22.8-647 nm region using a grazing incidence EUV spectrometer (GIS), normal incidence EUV spectrometer (NIS), and an ultraviolet-visible (UV-Vis) spectrometer wherein the UV-Vis spectrometer was absolutely calibrated using a NIST traceable tungsten lamp and a NIST traceable deuterium lamp. The intensity calibration was extended to the EUV wavelengths by spectral overlap with calibrated regions and the spectral responses of the spectrometers.
A typical 80 mg, 10 microliter silver shot was subjected to a short burst of low voltage, high current electrical energy. The applied 60 Hz AC voltage was less than 15 V peak, and the peak current was about 30,000–35,000 A. The high current caused the shot to explosively ignite as brilliant light-emitting expanding plasma that produced a strong shockwave in air detonations. Based on Stark broadening, the initially optically thick essentially 100% ionized plasma expanded in vacuum and thinned to emit EUV and UV light. The peak power of 20 MW and time-average power of 4.6 MW was measured using absolute spectroscopy over the 22.8-647 nm region (Figure 11A) wherein the optical emission energy was 250 times the applied energy. Synchronized high-

43
speed video and spectroscopic recording of the plasma emission and the measurement of the applied ignition power over time showed that plasma persisted even after the ignition power decayed to zero.
The wavelength calibrated and absolute intensity calibrated spectrum (10-45 nm) of the emission of hydrated silver shots recorded on the GIS with a Zr filter showed the EUV continuum cutoff at 10.1 nm that matches dark matter emission as shown in Figure 11B [2]. The calorimetrically measured power of a typical 80 mg, 10 microliter silver shot ignition released by the nascent HOH catalyzed transition of H to hydrino state H2(1/4) in a Parr 1341 water bath bomb calorimeter cell was 400,000 W. The optical power and calorimetrically measured thermal power were independently validated [79].

44
Figures 11A-B. Absolute spectra in the 5 nm to 450 nm region of the ignition of a 80 mg shot of silver comprising absorbed H2 and H2O from gas treatment of silver melt before dripping into a water reservoir showing an average NIST calibrated optical power of 1.3 MW, essentially all in the ultraviolet and extreme ultraviolet spectral region. A. 0-700 nm region. B. 0-45 nm region.
(A)
(B)
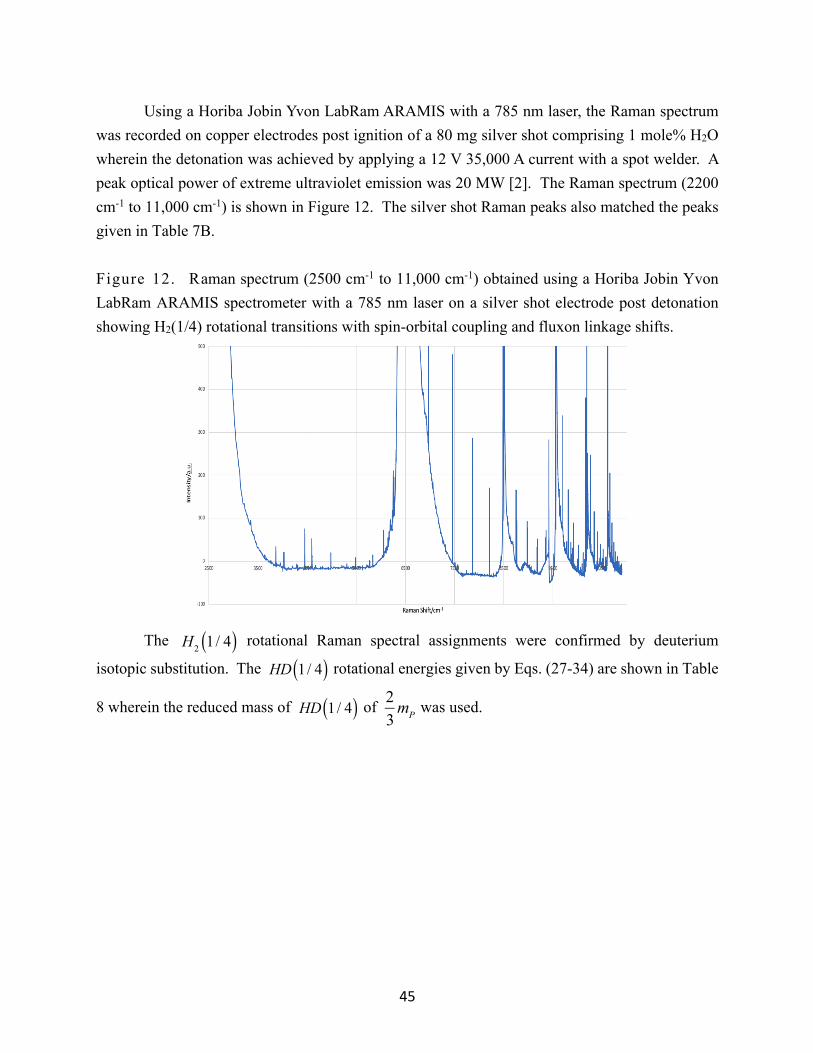
45
Using a Horiba Jobin Yvon LabRam ARAMIS with a 785 nm laser, the Raman spectrum was recorded on copper electrodes post ignition of a 80 mg silver shot comprising 1 mole% H2O wherein the detonation was achieved by applying a 12 V 35,000 A current with a spot welder. A peak optical power of extreme ultraviolet emission was 20 MW [2]. The Raman spectrum (2200 cm-1 to 11,000 cm-1) is shown in Figure 12. The silver shot Raman peaks also matched the peaks given in Table 7B.
Figure 12. Raman spectrum (2500 cm-1 to 11,000 cm-1) obtained using a Horiba Jobin Yvon LabRam ARAMIS spectrometer with a 785 nm laser on a silver shot electrode post detonation showing H2(1/4) rotational transitions with spin-orbital coupling and fluxon linkage shifts.
The rotational Raman spectral assignments were confirmed by deuterium
isotopic substitution. The rotational energies given by Eqs. (27-34) are shown in Table
8 wherein the reduced mass of of was used.
H2 1/ 4( )HD 1/ 4( )
HD 1/ 4( ) 23mP

46
Table 8. HD(1/4) Raman energies for (i) pure to rotational transitions, (ii) concerted to molecular rotational transition involving a spin rotation transition having the spin rotational state quantum number change from to , and double transition having energies given by the sum of the independent transitions.
J’ Pure Rotational Transition (cm-1)
Concerted Molecular Rotational-Spin Rotation
Transition (cm-1)
Double Rotational Transition (cm-1)
0 0 1463 1/0 2925 1 1463 2925 2/0 5851 2 4388 5851 2/1 7313 3 8776 10239 3/0 10239 4 14627 16089 3/1 11701 5 21940 23403 3/2 14627 6 30716 32179 4/0 16089 7 40955 42418 4/1 17552 8 52656 54119 4/2 20478 9 65821 67283 4/3 24866 10 80447 81910 5/0 23403
HD(1/4) product of the SunCell® was formed by propagating a hydrino reaction in the
SunCell® with 250 of D2O injected into the reaction cell chamber every 30 seconds replacing
the H2 and O2 gas mixture as the source of atomic hydrogen and HOH catalyst. A 10-minute-duration hydrino reaction plasma run was maintained in the SunCell®, and a white polymeric compound (GaOOH:HD(1/4)) was formed by dissolving Ga2O3 and gallium-stainless steel metal alloy (~0.1-5%) collected from the SunCell® gallium post run in aqueous 4M KOH, allowing fibers to grow, and float to the surface where they were collected by filtration.
The Raman spectrum (2500 cm-1 to 11,000 cm-1) was obtained using a Horiba Jobin Yvon LabRam ARAMIS spectrometer with a 785 nm laser GaOOH:HD(1/4) (Figures 13A-C). The Raman peaks clearly shifted with deuterium substitution as evident by comparison of the spectrum of pure hydrogen molecular hydrino (Figures 9A-C) and the spectrum of the deuterated molecular hydrino shown in Figures 13A-C. In the latter case, the emission energies of all the novel
lines matched either (i) the pure rotational transition (Eq. (32) and Eqs. (27-
29)) with spin-orbital coupling energy (Eq. (22)) and fluxon linkage energy (Eq. (24)):
(43)
(ii) the concerted transition comprising the to rotational transitions with the to spin rotational transition (Eq. (34) and Eqs. (27-29)). Corresponding spin-orbital coupling
J = 0 J ' = 1,2,3,...J = 0 J ' = 0,1,2,3,...
J = 0 J = 1
J p' / Jc
'
µl
EEmissionH2 1/ 4( ) J ' = 3,4
EEmission = ΔEJ=0→J '=3(4) + ES /O ,rot + EΦ,rot
= 8776 cm−1 14,627 cm−1( )+m528 cm−1 +mΦ31 cm−1
J = 0 J ' = 3 J = 0J = 1

47
energy (Eq. (22)) and fluxon linkage energy (Eq. (23)) were also observed with the concerted transition:
(44)
Or (iii) the double transition for final rotational quantum numbers (Eq. (38) and Eqs. (27-29)) with energies given by the sum of the independent transitions:
(45)
The position and assignment of novel lines assigned to transitions are given in Tables
9A-B. The comparison of the H2(1/4) peaks of Table 7B and HD(1/4) peaks are also shown in Table 9B.
EEmission = ΔEJ=0→J '=3 + ΔEJ=0→1 + ES /O ,rot + EΦ,rot
= 10,239 cm−1 +m528 cm−1 +mΦ3/2 46 cm−1
J p' = 3;Jc
' = 1
EEmission = ΔEJ=0→J p
' =3+ ΔE
J=0→Jc' =1
+ ES /O ,rot + EΦ,rot
= 11,701 cm−1 +m528 cm−1 +mΦ31 cm−1 +mΦ3/2 46 cm−1
HD 1/ 4( )
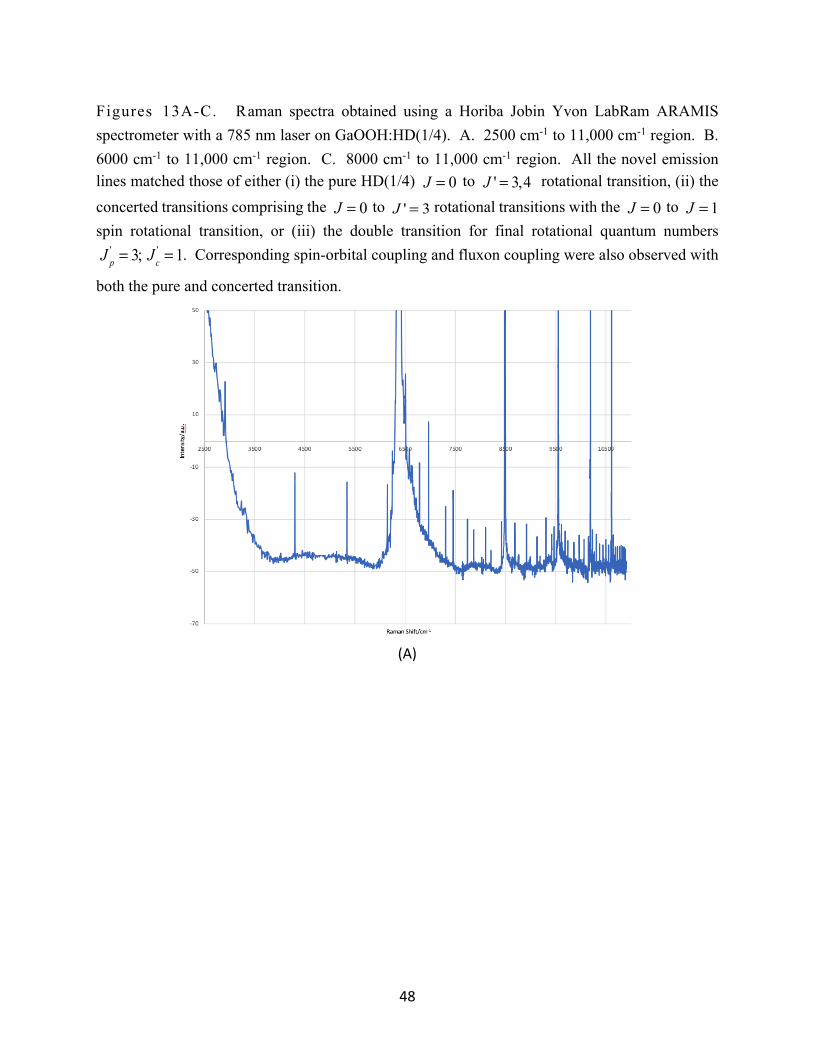
48
Figures 13A-C. Raman spectra obtained using a Horiba Jobin Yvon LabRam ARAMIS spectrometer with a 785 nm laser on GaOOH:HD(1/4). A. 2500 cm-1 to 11,000 cm-1 region. B. 6000 cm-1 to 11,000 cm-1 region. C. 8000 cm-1 to 11,000 cm-1 region. All the novel emission lines matched those of either (i) the pure HD(1/4) to rotational transition, (ii) the concerted transitions comprising the to rotational transitions with the to spin rotational transition, or (iii) the double transition for final rotational quantum numbers
. Corresponding spin-orbital coupling and fluxon coupling were also observed with
both the pure and concerted transition.
(A)
J = 0 J ' = 3,4J = 0 J ' = 3 J = 0 J = 1
J p' = 3; Jc
' = 1

49
(B)
(C)

50
Table 9A. HD(1/4) Raman lines and the corresponding multi-order emission lines for the 785 nm Raman spectrum (2500-11,000 cm-1) of GaOOH:HD(1/4) (Figures 13A-C). The parent emission line of each observed Raman line is the wavenumber of the farthest right-handed column wherein the order of the observed line is given in the corresponding column header. Next, the list of parent lines and the parent lines sorted by energy are given. Observed
Lines (cm-1)
Emission Line
(cm-1)
2° 3° 4° 5° 6° Parent Line
(cm-1)
Sorted Lines (cm-1)
2919 9823 9823 8034 4306 8436 8436 8325 5345 7397 14794 14794 8436 6148 6594 13188 13188 8528 6285 6457 12914 12914 8538 6419 6323 12646 12646 8643 6503 6239 12478 12478 8764 6586 6156 12312 12312 8980 6640 6102 12204 12204 8997 6786 5956 11912 11912 9058 6967 5775 11550 11550 9159 7308 5434 10868 10868 9212 7457 5285 10570 10570 9255 7741 5001 10002 10002 9274 7865 4877 9754 9754 9384 8105 4637 9274 9274 9395 8213 4529 9058 9058 9464 8473 4269 8538 8538 9545 8685 4057 8114 12171 12171 9705 8920 3822 7644 11466 11466 9736 9126 3616 7232 10848 10848 9754 9186 3556 7112 10668 10668 9822 9306 3436 6872 10308 10308 9823 9420 3322 6644 9966 9966 9875 9468 3274 6548 9822 9822 9896 9614 3128 6256 9384 9384 9966 9689 3053 6106 9159 9159 10002 9743 2999 5998 8997 8997 10036 9861 2881 5762 8643 8643 10060 9967 2775 5550 8325 8325 10260 10064 2678 5356 8034 8034 10308 10152 2590 5180 7770 10360 10360 10360 10233 2509 5018 7527 10036 10036 10475 10268 2474 4948 7422 9896 9896 10570 10308 2434 4868 7302 9736 9736 10668 10376 2366 4732 7098 9464 9464 10848

51
10439 2303 4606 6909 9212 9212 10868 10497 2245 4490 6735 8980 8980 11466 10551 2191 4382 6573 8764 8764 11550 10610 2132 4264 6396 8528 8528 11912 10647 2095 4190 6285 8380 10475 10475 12171 10690 2052 4104 6156 8208 10260 10260 12204 10730 2012 4024 6036 8048 10060 10060 12312 10767 1975 3950 5925 7900 9875 9875 12478 10801 1941 3882 5823 7764 9705 9705 12646 10833 1909 3818 5727 7636 9545 9545 12914 10863 1879 3758 5637 7516 9395 9395 13188 10891 1851 3702 5553 7404 9255 9255 14794
Table 9B. HD(1/4) Raman lines and corresponding hydrino assignments for the 785 nm Raman spectrum (2500-11,000 cm-1) of GaOOH:HD(1/4) (Figures 13A-C). The comparison of the H2(1/4) lines from Table 7B with the HD(1/4) lines are given in columns 1 and 2, respectively. The theoretical rotational energy assignments are according to the energies given in Table 8. The quantum numbers corresponding to spin-orbital splitting and fluxon sub-splitting of the assigned parent peaks are and , and respectively, having energies given in Table 5. Delta is the
difference between the observed and theoretical lines. H2(1/4)Parent
Emission Lines (cm-1)
HD(1/4)Parent Emission
Lines (cm-1)
Rotational Energy (cm-1)
Theoretical (cm-1)
Delta (cm-1)
7255 8034 8776 -1.5 1.5 0 8031 3 7759 8325 8776 -1 2.5 0 8325 0 8148 8436 8776 -0.5 -2.5 0 8435 1 8290 8528 8776 -0.5 0.5 0 8528 0 8504 8538 8776 -0.5 1 0 8543 -5 8715 8643 8776 0 -4.5 0 8637 6 8880 8764 8776 0 -0.5 0 8761 3 9062 8980 8776 0.5 -2 0 8978 2 9388 8997 8776 0.5 -1.5 0 8994 3 9754 9058 8776 0.5 0.5 0 9055 3 9966 9159 8776 0.5 4 0 9163 -4 10143 9212 8776 1 -3 0 9211 1 10188 9255 8776 1 -1.5 0 9258 -3 10216 9274 8776 1 -1 0 9273 1 10508 9384 8776 1 2.5 0 9381 3 10570 9395 8776 1 3 0 9396 -1 10668 9464 8776 1.5 -3.5 0 9460 4 10701 9545 10239 -1.5 0 2 9539 6 10872 9705 10239 -1 0 0 9711 -6
m mΦ
mΦ3/2
m mΦ mΦ3/2

52
11088 9736 10239 -1 0 0.5 9734 2 11100 9754 10239 -1 0 1 9757 -3 11259 9822 10239 -1 0 2.5 9827 -5 11276 9823 10239 -1 0 2.5 9827 -4 11298 9875 10239 -0.5 0 -2 9882 -7 11380 9896 10239 -0.5 0 -1.5 9905 -9 11554 9966 10239 -0.5 0 0 9975 -9 11720 10002 10239 -0.5 0 0.5 9998 4 11790 10036 10239 -0.5 0 1.5 10044 -8 11931 10060 10239 -0.5 0 2 10067 -7 11976 10260 10239 0 0.5 10262 -2 12006 10308 10239 0 1.5 10308 0 12015 10360 10239 0 2.5 10354 6 12181 10475 10239 0.5 0 -0.5 10480 -5 12212 10570 10239 0.5 0 1.5 10572 -2 12240 10668 10239 1 0 -2 10674 -6 12370 10848 10239 1 0 2 10859 -11 12492 10868 10239 1 0 2 10859 9 12784 11466 11701 -0.5 0 0.5 11461 5 12924 11550 11701 -0.5 0 2.5 11553 -3 13365 11912 11701 0.5 0 -1 11919 -7 13812 12171 11701 1 -2 0 12168 3 13944 12204 11701 1 0 -0.5 12206 -2
12312 11701 1 1 1 12306 6 12478 11701 1.5 -0.5 0 12478 0 12646 11701 2 -2 -1 12649 -3 12914 11701 2 2 2 12911 3 13188 11701 3 0 -2 13192 -4 14794 14627 0.5 -3 0 14798 -4
Infrared spectroscopic rotational transitions are forbidden for symmetrical diatomic
molecules with no electric dipole moment. However, since molecular hydrino uniquely possesses an unpaired electron, the application of a magnetic field to align the magnetic dipole of molecular hydrino is a means to break the selection rules to permit a novel transition in H2(1/4), in addition to the effect of an intrinsic magnetic field of a sample. Concerted rotation and spin-orbital coupling is another mechanism for permitting otherwise forbidden transitions. Using the absorbance mode of a Thermo Scientific Nicolet iN10 MX spectrometer equipped with a cooled MCT detector, FTIR analysis was performed on solid-sample pellets of GaOOH:H2(1/4) with the presence and absence of an applied magnetic field using a Co-Sm magnet having a field strength of about 2000 G. The spectrum shown in Figure 14A shows that the application of the magnetic field gave rise to an FTIR peak at 4164 cm-1 which is a match to the concerted rotational and spin-orbital transition to , . Other than H2 which is not present in the sample, there is no J = 0 J ' = 1 m = 0.5

53
known assignment due to the high energy of the peak. In addition, a substantial increased intensity of a sharp peak at 1801 cm-1 was observed. This peak was not observed in the FTIR of control GaOOH. The peak matched the concerted rotational and spin-orbital transition to ,
, . A higher sensitivity scale of the 4000-8500 cm-1 region (Figure 14B)
shows additional peaks at (i) 4899 cm-1 that matched the concerted rotational and spin-orbital transition to , , ; (ii) 5318 cm-1 that matched the pure rotational and
spin-orbital transition to , , and (iii) 6690 cm-1 that matched the pure rotational and spin-orbital transition to , , .
Figure 14A. FTIR spectra (200-8200 cm - 1) showing the effect of the application of a magnetic field on the FTIR spectrum (200 cm-1 to 8000 cm-1) recorded on GaOOH:H2(1/4). The application of a magnetic field gave rise to an FTIR peak at 4164 cm-1 which is an exact match to the concerted rotational and spin-orbital transition to , . An intensity increase of a peak at 1801 cm-1 was observed that matched the concerted rotational and spin-orbital transition to , , .
J = 0 J ' = 0m = −0.5 mΦ3/2 = 2.5
J = 0 J ' = 1 m = 2 mΦ3/2 = −1
J = 0 J ' = 2 m = −1J = 0 J ' = 2 m = 1.5 mΦ = 1.5
J = 0 J ' = 1 m = 0.5
J = 0 J ' = 0 m = −0.5 mΦ3/2 = 2.5

54
Figure 14B. FTIR spectra (4000-8500 cm - 1) recorded on GaOOH:H2(1/4) showing addition peaks having the very high energies of 4899 cm-1, 5318 cm-1, and 6690 cm-1 matching H2(1/4) rotational and spin-orbital transitions.
Given that interstitial H2 in silicon and GaAs is nearly a free rotator, and H2 is FTIR active
as well as Raman active due to the induced dipole from interactions with the crystalline site [80], FTIR analysis was performed on KI:H2(1/4), H2(1/4) trapped in a KI matrix. The samples were prepared by reaction of atomic hydrogen, adventitious oxygen and H2O, and K metal with high purity KI as described previously [81]. While handling the samples under an inert atmosphere, KBr pellets of KI:H2(1/4) were prepared. As shown in Figure 14C major sharp peaks were observed at 1943 and 2012 cm−1 in the FTIR spectrum recorded using the transmittance mode using a Nicolet 730 FTIR spectrometer with DTGS detector at resolution of 0.5 cm-1. Additional less intense sharp peaks observed in the FTIR spectrum are given in Table 10. No additional peaks other than those easily assignable to KI were observed. From Eq. (32), the peak at 1943 cm−1 (0.2409 eV) matched the theoretical prediction of 1950 cm−1 for the to H2(1/4) rotational transition wherein the unprecedented rotational energy of 42 times that of ordinary hydrogen establishes the internuclear distance of H2(1/4) as 1/4 that of H2 (Eq. (31)). The 2012 cm−1 peak and three peaks in the 3000 cm-1 region match the to H2(1/4) rotational transition with spin-orbital and fluxon linkage splitting, and the two peaks at 588 cm−1 match spin-orbital and fluxon linkage splitting of the excited H2(1/4) rotational state. Additional small
J = 0 J ' = 1
J = 0 J ' = 1
J ' = 1
55
satellite peaks may be due to phonon coupling, different lattice environments, and additional fluxon splittings with the anticipation that these peaks are temperature sensitive. The assignments are given in Table 10.
The selection rule for infrared absorption corresponding to a dipole transition is given by Eq. (36). The change is quantum numbers between the pure rotational transition having a peak at 1943 cm-1 and the one at 2012 cm-1 (Table 10) corresponds to a spin angular momentum change
of on the y-axis and a spin angular momentum change of on the z-axis with a resultant
total angular momentum change of . The simultaneous transitions along two axes have a transition probability involving the product of the angular projections of the angular momentum vectors over two solids angles ranges for the z-axis and the y-axis. The transition probability and corresponding intensity ratio of the 2012 cm-1 peak relative to the 1943 cm-1 peak is proportional to the squared amplitude of the dot products of the vectors over the angular range given by
. Similarly, considering the quantum numbers in Table 10, the
same changes in angular momentum occur with the excitation of the 588 cm-1 transition such that the 588 cm-1 peak is about 0.25 the intensity of the 1943 cm-1 peak. Also, the change is quantum numbers between the peak at 605 cm-1 and the one at 588 cm-1 (Table 10) corresponds to the spin
angular momentum change of on the y-axis and a spin angular momentum change of on
the z-axis with a resultant total angular momentum change of such that the 605 cm-1 peak is about 0.25 the intensity of the 588 cm-1 peak. The peaks at 3023 cm-1, 3097 cm-1, and 3140 cm-1 are very weak due to the simultaneous excitation of the rotational, spin orbital, and fluxon linkage transitions wherein the angular momentum change corresponds to a forbidden quadrupole transition (Eq. (37)). The intensities of the peaks shown in Figure 14C match theoretical predictions. H2(1/4) transitions are allowed due to dipole inducing lattice interactions which are assumed to be homogeneous and isotropic. However, the lattice interactions may change with crystal phase changes and temperature wherein the former depends on composition, temperature, quenching, and other historic and real-time ambient conditions. These effects have been reported previously in the metaborate monomer research literature [82-85].
!2
− !2
!
I ∝ cos2θ z cos2θ y∫ dθ zdθ y = 0.25
!2
− !2
!

56
Figure 14C. The high resolution (0.5 cm-1) FTIR spectrum (490–4000 cm-1) of KI:H2(1/4) showing unique sharp peaks assigned to H2(1/4).
Table 10. H2(1/4) absorption lines and corresponding hydrino assignments for the FTIR spectrum (490-4000 cm-1) of KI:H2(1/4) (Figure 14C). The assigned theoretical rotational energy and the quantum numbers corresponding to spin-orbital splitting and fluxon sub-splitting of the FTIR peaks are and , and respectively, having energies given in Table 5. Delta is the
difference between the observed and theoretical lines.
Absorption Lines (cm-1)
Rotational Energy (cm-1)
Theoretical (cm-1)
Delta (cm-1)
588 0 1 0.5 1 589 -1 605 0 1 1 1 605 0 1943 1950 0 0 0 1950 -7 2012 1950 0 0.5 1 2012 0 3023 1950 2 0.5 0 3021 2 3097 1950 2 0 2 3098 -1 3140 1950 2 1.5 2 3144 -4
m mΦ m
Φ3/2
m mΦ mΦ3/2

57
Sharp peaks such as those shown in Figure 14C have been reported previously regarding FTIR spectra on samples prepared using reactions that dope alkali halides and solid argon with boron oxide compounds [82-85]. Prior assignment to metaborate monomer ( ) is rejected
since the peak designations are based on an erroneous linear symmetrical molecular model whereas metaborate monomer has been determined to be bent [86] and the oxygen atoms in are not
equivalent [87]. The sodium metaborate monomer spectrum [86] shows no absorption in the region of the 1950 cm-1 and 2012 cm-1 peaks, and the features are very broad as expected for an inorganic compound wherein ions bound in a crystalline lattice are not free rotors capable as in the case of some neutral small molecules such as hydrogen. Therefore, FTIR transitions involve vibrational modes that are always coupled with lattice phonons. In addition to different energies, strong symmetrical vibrational transition peaks in the region of 1943 cm-1 and 2012 cm−1 are required for the metaborate monomer assignment, and they are not observed in the FTIR spectra of Figure 14C or reported in the literature [82-86]. Also, boron was not a reactant of the KI:H2(1/4) sample. KI:H2(1/4) was prepared in a stainless-steel vessel which eliminated glass as a source of boron, and boron was less than 2 ppm by elemental analysis whereas typically 50 to 100 times this amount is the minimum present when so called metaborate monomer peaks are observed [85]. Aging, hydrolysis, and annealing decreased the “monomer” peaks, and reheating regenerated the peaks consistent with KI:H2(1/4) [83-85]. 10B isotope substitution showed variation in peak intensity ratios from those anticipated for natural abundance, but at constant isotope composition, (i) the intensity ratios were inconsistent between 10B and 11B isotope pairs of peaks attributed to the “monomer” including so-called “hot bands”, (ii) the peak ratios varied very significantly with temperature, composition, and sample history, (iii) peak ratios were inconsistent with isotope ratios of the isotopes present in the sample, and (iv) in instances, the peak intensities did not match ones physically possible [82, 84-85]. For example, 10B enriched “hot bands” and the corresponding fundamental peaks were observed to be close in intensity depending on the sample temperature and history [84].
However, the isotope substitution results are consistent with the temperature, thermal cycling, composition, storage, magnetization, and FTIR recording-condition dependence of KI:H2(1/4) spin-orbital and fluxon splitting peaks. For example, the intensity ratio of the pair at 588 cm-1 has been observed to be temperature dependent upon cooling the sample to liquid nitrogen temperature. The same is true of other small satellite peak pairs. An explanation of the unusual sharp peaks in the so-called metaborate monomer samples is that the reactions used to prepare the “monomer” produce H2(1/4) as the product. Specifically, the samples were prepared by hydrino solid fuel reactions comprising a high-temperature MX melt as matrix for the oxidation
BO2−
BO2−
58
of MBH4 or dehydration of MB(OH)4, or reaction of M metal and hydrated borate wherein M is an alkali metal and X is a halide ion [77, 82].
The influence of magnetic materials on the selection rules to observe molecular hydrino rotational transitions involving interaction with the free electron was further investigated. Raman samples comprising solid web-like fibers were prepared by wire detonation of an ultrahigh purity Fe wire in a rectangular cuboid Plexiglas chamber having a length of 46 cm and a width and height of 12.7 cm. A 10.2 cm long, 0.25 mm diameter Fe metal wire (99.995%, Alfa Aesar #10937-G1) was mounted between two Mo poles with Mo nuts at a distance of 9 cm from the chamber floor, a 15 kV capacitor (Westinghouse model 5PH349001AAA, 55 F) was charged to about 4.5 kV
corresponding to 557 J by a 35 kV DC power supply, and a 12 V switch with a triggered spark gap switch (Information Unlimited, model-Trigatron10, 3 kJ) was used to close the circuit from the capacitor to the metal wire inside of the chamber to detonate the wire. The detonation chamber contained air comprising 20 Torr of water vapor controlled by a humidifier and a water vapor sensor. The water vapor served as a source of HOH catalyst and atomic H to form molecular hydrino . The high voltage DC power supply was turned off before closing the trigger
switch. The peak voltage of about 4.5 kV was discharged as a damped harmonic oscillator over about 300 s at a peak current of 5 kA. Web-like fibers formed in about 3-10 minutes after the
wire detonation. Analytical samples were collected from the chamber floor and walls, as well as on a Si wafer placed in the chamber. Raman spectra were recorded on the web material using the Horiba Jobin Yvon LabRAM Aramis Raman spectrometer with a HeCd 325 nm laser in microscope mode with a magnification of 40X or with a 785 nm laser.
The Raman spectra obtained using a Horiba Jobin Yvon LabRam ARAMIS spectrometer with a 300 mW, 785 nm laser on solid web-like fibers prepared by wire detonation of an ultrahigh purity Fe wire in air maintained with 20 Torr of water vapor are shown in Figure 15 and 16. As shown in the 3420 cm-1 to 4850 cm-1 Raman spectral region (Figure 15), a periodic series of peaks was observed. The series of peaks was confirmed to originate from the sample by treating the Fe-web:H2(1/4) sample with HCl. As shown in Figure 16, all the Raman peaks were eliminated by the acid treatment of the Fe-web sample by reaction of iron oxides, iron oxyhydroxide, and iron hydroxide species of the sample to form FeCl3 and H2O. Similarly, KCl also showed no peaks over this spectral range further demonstrating that the periodic peaks were not due to an etalon or other artifact of the optics. It was confirmed by the manufacturer, Horiba Instruments, Inc., that the infrared CCD detector (Horiba Aramis Raman spectrometer with a Synapse CCD camera Model: 354308, S/N: MCD-1393BR-2612, 1024x256CCD Front Illuminated Open Electrode) is front illuminated which also precludes the possibility of an etalon artifact. Due to the extraordinary high energies, the transitions cannot be assigned to any prior known compound. No periodic
µ
H2 1/ 4( )
µ

59
features were observed in the 0 cm-1 to 3420 cm-1 Raman region. The periodic features were absent in the 0 cm-1 to 8000 cm-1 Raman region of FeOOH, Al2O3, Ga2O3, and GaOOH controls.
Figure 15. Raman spectrum (3420 cm-1 to 4850 cm-1) obtained using a Horiba Jobin Yvon LabRam ARAMIS spectrometer with a 300 mW, 785 nm laser on solid web-like fibers (Fe web) prepared by wire detonation of an ultrahigh purity Fe wire in air maintained with 20 Torr of water vapor showing a periodic series of peaks.
Figure 16. The Raman spectrum (3500 cm-1 to 5000 cm-1) obtained using a Horiba Jobin Yvon LabRam ARAMIS spectrometer with a 785 nm laser showing that all the Raman peaks of Figure 15 were eliminated by the acid treatment of the Fe-web:H2(1/4) sample with HCl.
The peak positions of the series of peaks shown in Figure 15 are given in Table 11 with the corresponding peak positions upon conversion from Raman to emission spectral peaks. The series matches and is assigned to the second order emission of fluxon linkages during the
double rotational and spin-orbital transition for final rotational, spin-orbital, and fluxon quantum numbers and , , and , respectively, with energies given by Eqs.
(22), (23), and (38), respectively. The fluxon separation energies given in Table 11
H2 1/ 4( )
J p' = 3 Jc
' = 2 m = −1.5 mΦ3/2 = 2
ΔEΦ,rot ,concerted

60
are calculated by the sum of the components and (Eqs. (23) and (25),
respectively):
(46)
Table 11. The observed Raman energies in the 3420 cm-1 to 4850 cm-1 region shown in Figure 15. The corresponding emission energies assigned to second order emission, parents of the second order emission energies, quantum number of Eq. (46), and observed and theoretical energy separations of the 785 nm Raman spectral peaks demonstrate that the periodic peaks match the second order emission of fluxon linkages during the double rotational and spin-orbital
transition for final rotational, spin-orbital, and fluxon quantum numbers and ,
, and , respectively.
Raman Energy (cm-1)
2° Emission Energy (cm-1)
Parent of 2° Emission Energy
(cm-1)
j Energy Observed
(cm-1)
Energy Theoretical
(cm-1) 3432 9307 18614 0 96 92.5 3480 9259 18518 1 94 92.4 3527 9212 18424 2 94 92.3 3574 9165 18330 3 88 92.0 3618 9121 18242 4 92 91.6 3664 9075 18150 5 92 91.2 3710 9029 18058 6 90 90.6 3755 8984 17968 7 90 89.9 3800 8939 17878 8 88 89.2 3844 8895 17790 9 84 88.3 3886 8853 17706 10 84 87.3 3928 8811 17622 11 88 86.2 3972 8767 17534 12 84 85.0 4014 8725 17450 13 84 83.7 4056 8683 17366 14 82 82.3 4097 8642 17284 15 86 80.8 4140 8599 17198 16 80 79.2 4180 8559 17118 17 82 77.5 4221 8518 17036 18 78 75.6 4260 8479 16958 19 78 73.7 4299 8440 16880 20 80 71.7 4339 8400 16800 21 74 69.5 4376 8363 16726 22 74 67.3
EΦ,rot ,concerted ES /O−Φ3/2
ΔEΦ,rot ,concerted = EΦ,rot ,concerted −US /OMag ,concerted
= 2( )46.24 cm−1 − 0.0520 j2 cm−1
j
H2 1/ 4( )J p' = 3 Jc
' = 2
m = −1.5 mΦ3/2 = 2
Δ Δ

61
4413 8326 16652 23 70 65.0 4448 8291 16582 24 72 62.5 4484 8255 16510 25 72 60.0 4520 8219 16438 26 62 57.3 4551 8188 16376 27 66 54.6 4584 8155 16310 28 60 51.7 4614 8125 16250 29 60 48.7 4644 8095 16190 30 56 45.7 4672 8067 16134 31 52 42.5 4698 8041 16082 32 48 39.2 4722 8017 16034 33 46 35.9 4745 7994 15988 34 40 32.4 4765 7974 15948 35 36 28.8 4783 7956 15912 36 28 25.1 4797 7942 15884 37 24 21.3 4809 7930 15860 38
In addition, FeOOH (99+%, Alfa Aesar#A1626730) was used as a hydrino solid fuel to
form solid Raman samples. FeOOH can form HOH catalyst and atomic hydrogen upon chemical decomposition by heating and was confirmed to produce excess heat. Similar hydrino solid fuels showed analytical signatures of the predicted hydrino product [77]. The 785 nm Raman
run on FeOOH heated to 600°C to form Fe2O3:H2(1/4) is shown in Figure 17.
H2 1/ 4( )

62
Figure 17. Raman spectrum (200 cm-1 to 11,000 cm-1) obtained using a Horiba Jobin Yvon LabRam ARAMIS spectrometer with a 785 nm laser on solid fuel FeOOH powder heated to 600 °C showing a peak at 6263 cm-1 assigned to the pure rotational transition to
, , and . The peak at 1062 cm-1 is due to silicate of the Raman slide and the other
lines are multi-order 785 nm laser lines.
Given that was observed by a hydrino solid fuel reaction of FeOOH, and ball
milling has an effect equivalent to heating to drive chemical reactions [88], FeOOH was ball milled in a stainless-steel chamber using stainless steel balls for 10 hours to form the hydrino product FeOOH:H2(1/4). Raman spectra were recorded on the solid product using the 785 nm and 325 nm lasers. The Raman spectra obtained using a Horiba Jobin Yvon LabRam ARAMIS spectrometer with a 300 mW, 785 nm laser on solid FeOOH:H2(1/4) are shown in Figures 18-19. As shown in the 3500 cm-1 to 8000 cm-1 Raman spectral region (Figure 18), the series of emission peaks assigned to fluxon linkages were also observed in the FeOOH:H2(1/4) product of FeOOH ball milling. The 3500 cm-1 to 5100 cm-1 Raman spectral region (Figure 19) shows the details of the series of peaks assigned to the second order emission of fluxon linkages during the
double rotational and spin-orbital transition for final rotational, spin-orbital, and fluxon quantum numbers and , , and , respectively. And, the 6500 cm-1 to 8100
cm-1 Raman spectral region (Figure 20) shows the details of another series assigned to the third order emission of the parent emission of the corresponding second order emission shown in Figures 15 and 19. The peak positions and energies are shown in Table 12. The observation of both the second and third order emission series of 39 spectral lines over a very wide spectral range further eliminates any possibility of an instrument artifact.
H2 1/ 4( ) J = 0 J ' = 2
m = 1 mΦ = −3
H2 1/ 4( )
H2 1/ 4( )
J p' = 3 Jc
' = 2 m = −1.5 mΦ3/2 = 2

63
Figure 18. Raman spectrum (3500 cm-1 to 8000 cm-1) obtained using a Horiba Jobin Yvon LabRam ARAMIS spectrometer with a 300 mW, 785 nm laser on solid FeOOH powder prepared by ball milling for 10 hours showing two series of peaks assigned to the second and third order emission of fluxon linkages during the double rotational and spin-orbital transition for
final rotational, spin-orbital, and fluxon quantum numbers and , , and
, respectively.
H2 1/ 4( )J p' = 3 Jc
' = 2 m = −1.5
mΦ3/2 = 2

64
Figure 19. Raman spectrum (3500 cm-1 to 5100 cm-1) obtained on solid FeOOH:H2(1/4) showing the details of the series assigned to the second order emission of fluxon linkages during the double rotational and spin-orbital transition for final rotational, spin-orbital, and
fluxon quantum numbers and , , and , respectively.
The peak positions of the series of peaks shown in Figure 20 are given in Table 13 with the corresponding peak positions upon conversion from Raman to emission spectral peaks. The series is assigned to the third order emission of fluxon linkages during the double rotational
and spin-orbital transition for final rotational, spin-orbital, and fluxon quantum numbers
and , , and , respectively with energies given by Eqs. (38), (22), and (23),
respectively. The parent emission energies are indicative of a two-laser-photon excitation involving excitation to a first and then a second higher-energy state which may be facilitated by the extraordinarily high rotational energies of . The high energy in turn precludes
efficient coupling with lattice phonons, and thereby increases the rotational state lifetime and cross section for two-photon excitation. A corresponding application of material comprising molecular hydrino is a laser frequency doubling or increasing medium.
H2 1/ 4( )J p' = 3 Jc
' = 2 m = −1.5 mΦ3/2 = 2
H2 1/ 4( )J p' = 3
Jc' = 2 m = −1.5 mΦ3/2 = 2
H2 1/ 4( )

65
Figure 20. Raman spectrum (6500 cm-1 to 8100 cm-1) obtained on solid FeOOH:H2(1/4) showing the details of the series assigned to the third order emission of fluxon linkages during the
double rotational and spin-orbital transition for final rotational, spin-orbital, and fluxon
quantum numbers and , , and , respectively.
Table 12. The observed Raman energies of the 785 nm Raman spectral peaks in the 6500 cm-1 to 8100 cm-1 region shown in Figure 20. The corresponding observed Raman emission energies, parent energies of second order emission energies from Table 11, corresponding third order emission and Raman energies of the parent emission from Table 11, and difference between the observed and calculated third order Raman lines demonstrate that the periodic peaks are third order emission of fluxon linkages during the double rotational and spin-orbital transition for
final rotational, spin-orbital, and fluxon quantum numbers and , , and
, respectively.
Raman Energy (cm-1)
Emission Energy (cm-1)
Parent Peak of 2°
(cm-1)
3° Emission
(cm-1)
3° Raman (cm-1)
Energy (Observed – 3°)
(cm-1) 6532 6207 18614 6205 6534 -2 6565 6174 18518 6173 6566 -1 6595 6144 18424 6141 6598 -3 6630 6109 18330 6110 6629 1 6655 6084 18242 6081 6658 -3 6687 6052 18150 6050 6689 -2 6719 6020 18058 6019 6720 -1 6752 5987 17968 5989 6750 2 6781 5958 17878 5959 6780 1 6811 5928 17790 5930 6809 2 6835 5904 17706 5902 6837 -2 6867 5872 17622 5874 6865 2
H2 1/ 4( )J p' = 3 Jc
' = 2 m = −1.5 mΦ3/2 = 2
H2 1/ 4( )J p' = 3 Jc
' = 2 m = −1.5
mΦ3/2 = 2
Δ

66
6892 5847 17534 5845 6894 -2 6925 5814 17450 5817 6922 3 6953 5786 17366 5789 6950 3 6975 5764 17284 5761 6978 -3 7010 5729 17198 5733 7006 4 7032 5707 17118 5706 7033 -1 7059 5680 17036 5679 7060 -1 7085 5654 16958 5653 7086 -1 7114 5625 16880 5627 7112 2 7140 5599 16800 5600 7139 1 7165 5574 16726 5575 7164 1 7190 5549 16652 5551 7188 2 7214 5525 16582 5527 7212 2 7239 5500 16510 5503 7236 3 7261 5478 16438 5479 7260 1 7279 5460 16376 5459 7280 -1 7300 5439 16310 5437 7302 -2 7321 5418 16250 5417 7322 -1 7340 5399 16190 5397 7342 -2 7360 5379 16134 5378 7361 -1 7375 5364 16082 5361 7378 -3 7392 5347 16034 5345 7394 -2 7410 5329 15988 5329 7410 0 7425 5314 15948 5316 7423 2 7435 5304 15912 5304 7435 0 7445 5294 15884 5295 7444 1 7450 5289 15860 5287 7452 -2
H2(1/4) lines were observed on Ni foil exposed to the plasma of a hydrino reaction (Figure
9A-9C) using the 11 mW 785 nm laser and 300 line/mm grating, and the H2(1/4) series of fluxon linkage peaks were recorded on ball milled FeOOH (Figure 18) using the 300 mW 785 nm laser and 1200 line/mm grating. Considering that the Ni foil was run at a higher temperature than the Ni Curie temperature and fluxon linkage is more favorable with a sample having a high internal magnetization such as FeOOH, a 1 T neodymium magnet was applied to the Ni foil sample, and the Raman spectrum was reacquired on the Horiba Jobin Yvon LabRam ARAMIS spectrometer as an experiment to cause emission of the series of fluxon linkage peaks on the Ni foil. As shown in the 0 cm-1 to 11,000 cm-1 Raman spectral region (Figures 21A-C), the series of peaks assigned to the second order emission of fluxon linkages during the H2(1/4) double rotational and spin-

67
orbital transition for final rotational, spin-orbital, and fluxon quantum numbers and
, , and , respectively, were observed. The lower innsity of the series was
atributed to the much weaker laser power, 11 mW versus 300 mW. As in the case of the H2(1/4) emission lines shown in Figure 9A-C, the series of fluxon linkage peaks were eliminated by a Semrock long-pass edge filter (BLP01-785R-25) having an edge wavelength of 805 nm and Tavg > 93% 812.1 – 1200 nm placed between the sample and the detector. The blocking of high energy photons confirmed the assignment to high energy emission rather than low energy Raman transitions (Figure 21C). Comparison of the filtered Ni foil spectrum shown in Figure 9A to that with a strong magnet applied (Figure 21A), demonstrates that the magnetic field also increased the high energy broad band emission in the 0-3000 cm-1 Raman spectral region (12,700-12,400 cm-1 emission spectral region) very significantly (e.g. intensity of 33,000 counts versus 97 at 2000 cm-
1). Figure 21A. Raman spectrum (0 cm-1 to 11,000 cm-1) recorded with a 11mW, 785 nm laser on a Ni foil prepared by immersion in the molten gallium of a SunCell that maintained a hydrino plasma reaction for 10 minutes and magnetized with a 1 T neodymium magnet showing the details of the series assigned to the second order emission of fluxon linkages during the H2(1/4) double rotational and spin-orbital transition for final rotational, spin-orbital, and fluxon quantum numbers
and , , and , respectively.
(A)
J p' = 3 Jc
' = 2
m = −1.5 mΦ3/2 = 2
J p' = 3 Jc
' = 2 m = −1.5 mΦ3/2 = 2

68
Figure 21B. Raman spectrum (3700 cm-1 to 5500 cm-1) recorded with a 11mW, 785 nm laser on a Ni foil prepared by immersion in the molten gallium of a SunCell that maintained a hydrino plasma reaction for 10 minutes and magnetized with a 1 T neodymium magnet.
(B)
Figure 21C. Raman spectrum (0 cm-1 to 11,000 cm-1) recorded with a 11mW, 785 nm laser on a Ni foil prepared by immersion in the molten gallium of a SunCell that maintained a hydrino plasma reaction for 10 minutes. The sample was magnetized with a 1 T neodymium magnet and a Semrock long-pass edge filter was applied between the sample and the detector. The series assigned to the second order emission of fluxon linkages during the H2(1/4) were eliminated confirming the assignment to high energy emission.
(C)
69
Materials comprising molecular hydrino were further investigated by Raman spectroscopy using a higher energy UV laser. The presence of in the GaOOH:H2(1/4) SunCell®
product, Fe-web detonation product, and FeOOH:H2(1/4) ball-mill product samples was confirmed using 325 nm Raman spectroscopy by the observation of a characteristic spectral pattern observed previously on hydrino reaction product materials. Specifically, Raman spectra were obtained using a Horiba Jobin Yvon LabRam ARAMIS spectrometer with a 325 nm laser on (i) GaOOH:H2(1/4), (ii) NaOH:KCl (1:1 wt%) getter of the product gas from high current
detonation of hydrated silver shots, (iii) solid web-like fibers prepared by wire detonation of an ultrahigh purity Fe wire in 20 Torr water vapor-air atmosphere, and (iv) FeOOH powder prepared by ball milling for 10 hours. In all four cases, a series of 1000 cm-1 separated peaks were observed in the 17,000 to 22,000 cm-1 region. The peaks exactly matched the ro-vibration of H2(1/4) previously observed in the ultraviolet as a 260 nm e-beam band shown in Figures 22A-B [78,81], but at one half the ro-vibration energies. Due to the unique electronic structure of H2(1/4), the corresponding energy levels matched theoretical predictions of ro-vibration states of molecular hydrino with excitation and decay involving two-photons, each of ½ the energy of the ro-vibrational state.
H2 1/ 4( )
H2 1/ 4( )

70
Figures 22A-B. Ultraviolet electron-beam excitation emission spectrum recorded on KCl getter impregnated with hydrino reaction product gas H2(1/4) showing the 260 nm band comprising H2(1/4) ro-vibrational P branch in the crystalline lattice. Q (0), R(0), R(1), R(2), P(1), P(2), P(3), and P(4) ro-vibrational transitions of H2(1/4) were observed. A. Solid fuels reaction of a source of H, catalyst, and KCl [82]. B. H2(1/4) gas from a sealed reactor of the gun powder reaction, KNO3 with softwood charcoal having the formulation C7H4O [78].
(A)
(B)
The 260nm, e-beam band showed no structure other than the broad peaks at 1.4Å resolution when observed using a Jobin Yvon Horiba 1250M spectrometer. Additionally, structure was found

71
to be absent at an enhanced 0.25Å resolution as well as at 1.65 cm-1 resolution in the photoluminescence spectra eliminating the possibility of the series comprising unresolved ro-vibrational bands of a common molecule [78]. The corresponding energy spectrum in the ultraviolet comprised a series of 0.24 eV evenly spaced peaks centered at 260 nm called the 260 nm e-beam band (Figure 22) recoded with a EUV spectrometer on emission from high-energy electron beam bombardment of solid getter materials that trapped [78]. The intense
fluorescence spectra in all cases comprised the ro-vibration band from the to
vibrational transition shifted by the higher effective mass of in a solid matrix and the
1950 cm-1 spaced lines of the free rotor P-branch of .
The series of ro-vibrational level emission lines assigned to H2(1/4) was also observed by trapping H2(1/4) gas released from SunCell® products in a KCl getter that is transparent to UV emission with the extraordinary exception that the 325 nm-laser-photon-excited spectrum comprised the identical ro-vibrational lines but at ½ the energies of the collisional excited spectrum, and the spectrum further comprised a broad emission background of the same intensity profile as the superimposed lines. H2(1/4) formed in a stainless steel SunCell® was released as a gas for analysis by two methods: (i) 900 °C heating of the oxide mixture formed by trace water addition to the SunCell® to maintain a hydrino plasma reaction wherein the heating caused decomposition of Ga2O3:H2(1/4) of the mixture and (ii) 900 °C heating of the filtrate of the oxide mixture dissolved in NaOH. Specifically, KCl was packed in a tube connected to a pressure vessel containing Ga2O3/GaOOH:H2(1/4) collected from the SunCell®, and the decomposition gas from heating the Ga2O3/GaOOH:H2(1/4) to 900 °C was flowed through the KCl getter. The Raman spectrum of a KCl getter comprising trapped H2(1/4) gas was recorded using the Horiba Jobin Yvon LabRAM Aramis Raman spectrometer with a HeCd 325 nm laser in microscope mode with a magnification of 40X. The Raman spectrum on KCl starting material was unremarkable, whereas the KCl getter Raman comprised a series of 1000 cm-1 (0.1234 eV) equal-energy spaced Raman peaks observed in the 8000 cm-1 to 18,000 cm-1 region. The conversion of the Raman spectrum into the fluorescence or photoluminescence spectrum revealed a match as the ½ energy ro-vibrational spectrum of H2(1/4) corresponding to the 260 nm band first observed by e-beam excitation [78]. Assigning Q(0) to the most intense peak, the peak assignments given in Table 13 to the Q, R, and P branches for the spectra shown in Figure 23A are Q(0), R(0), R(1), R(2), R(3), R(4), P(1), P(2), P(3), P(4), and P(5) observed at 13,188, 12,174, 11,172, 10,159, 9097, 8090, 14,157, 15,106, 16,055, 16,975, and 17,873 cm-1, respectively. The theoretical transition energies with peak assignments compared with the observed emission spectrum are shown in Table 13.
H2 1/ 4( )H2 1/ 4( ) ν = 1 ν = 0
H2 1/ 4( )H2 1/ 4( )

72
Figure 23A. Raman-mode photoluminescence spectrum of KCl getter exposed to gas from the thermal decomposition of Ga2O3:H2(1/4) collected from the SunCell® wherein the spectrum was recorded with a Horiba Jobin Yvon LabRam ARAMIS spectrometer with a 325nm laser and a 300 lines/mm grating over a range of 8000-19,000 cm-1 Raman shift.
Table 13. Comparison of the theoretical emission energies and assignments, corresponding Raman transition energies, and observed Raman peaks. Assignment Emission
Calculated (cm-1)
Calculated Raman (cm-1)
Raman Experimental
(cm-1)
Difference (%)
P(5) 12,721 18,056 17,873 -1.0 P(4) 13,695 17,082 16,975 -0.6 P(3) 14,668 16,109 16,055 -0.3 P(2) 15,642 15,135 15,106 -0.2 P(1) 16,615 14,162 14,157 0 Q(0) 17,589 13,188 13,188 0 R(0) 18,563 12,214 12,174 -0.3 R(1) 19,536 11,241 11,172 -0.6 R(2) 20,510 10,267 10,159 -1.1 R(3) 21,483 9,294 9,097 -2.1 R(4) 22,457 8,320 8,090 -2.8
The 325 nm Raman spectrum recorded with a Semrock long-pass edge filter (BLP01-
325R-25) having an edge wavelength of 331 nm and Tavg > 93% 334.1 – 900 nm is shown in Figure 23B. The first, second, third, and fourth order of the 1000 cm-1 spaced series of lines was

73
observed confirming the assignment of ½ energy ro-vibrational spectrum of H2(1/4) rather than Raman transitions or high energy matrix fluorescence emission due to 325 nm laser excitation. Figure 23B. Raman-mode photoluminescence spectrum of ball milled KOH-KCl recorded with a Horiba Jobin Yvon LabRam ARAMIS spectrometer with a 325nm laser and a 300 lines/mm grating over a range of 8000-19,000 cm-1 Raman shift using a Semrock long-pass edge filter (BLP01-325R-25).
Regarding the nature of the ½ energy spectral emission, consider the formation of a nonradiative state H2 molecule from two non-radiative state H atoms requiring the bond energy to be removed by a third body collision: (47)
Wherein denotes the third body in an energetic state. The hydrino molecule comprises two hydrogen isotope nuclei and two electrons in a single molecular orbital (MO). Uniquely the MO comprises a paired and unpaired electron. To conserve spin angular momentum during the formation of a bond between two hydrino atoms, the bond energy must be released as a neutrino such as an electron neutrino of spin ½ that serves the function of the third body of in Eq. (47): (48)
Specifically, a neutrino comprises a photon having angular momentum in its electric
and magnetic fields (Neutrinos section of Ref. [1]). During the reaction of Eq. (48), the angular
n = 1
H + H + M→ H2 + M *
M *
M *
H 1/ p( )+ H 1/ p( )→ H2 1/ p( )+υe!2

74
momentum of the reactants is conserved in the products wherein each of the two reacting hydrino atoms are electron spin ½, and the product molecular hydrino and electron neutrino are also each spin ½.
H2(1/p) rotational and vibrational transitions may be excited by particle collision of sufficient energy of at least that of the excitation energies. Pure ro-vibrational excitation of H2(1/4) was achieved with a high energy electron beam wherein molecular hydrino behaved as a pure rotor, but constrained vibrator as shown by comparison of the ro-vibrational emission of the free gas shown in Figure 32 with the emission of H2(1/4) trapped in a KCl matrix (Figures 22A-B). KCl has essentially no absorption or fluorescence over the spectral region UV to infrared [89]. However, very intense green fluorescence and a series of 1000 cm-1 evenly spaced peaks were observed from crystalline KCl having trapped H2(1/4) when irradiated by the 325 nm Raman laser. The identical spectrum was observed for KOH matrix as well.
The selection rules for photon mediated excitation of ro-vibrational transitions must obey spin conservation for the reverse of the reaction given by Eq. (48). The spin of the molecular
hydrino MO is where each arrow designates the spin vector of one electron. A
mechanism to conserve spin while exciting ro-vibrational levels involves two-photon absorption. Two spin 1 photons, each of ½ the energy of an exited ro-vibrational transition comprise a photon of total spin 1 that couples separately to the spin 0 paired electron and the spin ½ unpaired electron as two spin ½ photons of total spin 1 to excite the ro-vibrational transition with a change of the vibrational and rotational quantum number by corresponding to the angular momentum of the excitation photon. The spin ½ electron excitation is anticipated to have a shorter lifetime than that of the spin 0 electron excitation. The corresponding very broad emission and narrower line emission, each of about equal intensity and ½ the energy of the standard ro-vibrational mode, were observed as shown in Figure 24 [78]. The broad fluorescence peak is assigned to the spin ½ ro-vibrational state decay, and the line emission is assigned to spin 1 state ro-vibrational state decay. Specifically, a two photon excitation and fluorescence matches the spectrum observed during 325 nm laser Raman spectroscopy of a KOH matrix that served as a getter for H2(1/4) formed in an electrochemical cell [78] wherein two laser photons, each of 3.82 eV and spin 1 excite
a ro-vibrational transition as two concerted excitations, each of ½ the energy ( ) and ½
the angular momentum change ( ) of the transition. The two-photon excitation may be mediated
by the presence of the crystalline lattice. The KOH getter having trapped H2(1/4) having the two-photon emission spectrum shown
in Figure 24 also showed the 260 nm band such as that shown in Figure 22 comprising single
12
↑↑ + ↓↑( )
0,±1 !
E = 12!ω
!2

75
photon emission. Reversal of the two of two-photon excitation giving rise to two-equal-energy photons versus single photon fluorescence observed with high-energy electron beam collisional excitation may be due to loss of coherence of the degenerate ½ energy levels of the two-photon excitation mechanism.
Figure 24. The deconvolution of the 325 nm photoluminescence spectrum recorded on a KOH getter of H2(1/4) gas produced by a CIHT electrochemical cell comprising [Mo/LiBr-LiOH-MgO/NiO] [78], that showed intense (6000 count) e-beam excitation emission of the 260 nm band reveals that the Raman spectrum is the superposition of a fluorescence band of lines of ½-energy the 260 nm band and a separate continuum emission band of the same energy having its maximum intensity at green wavelengths. The black line is the raw data, and the dotted line is the sum of the two deconvolved components.
A Raman laser may heat a medium to create broad band matrix emission and a population of H2(1/4) molecules in the J = 1 rotational level. In this case, two-photon emission also occurs wherein rotationally excited H2(1/4) undergoes stimulated emission as a photon equal to the laser wavelength comprising the photon due to the H2(1/4) J =1 to J = 0 transition and a matrix photon to form a negative peak at the energy of the H2(1/4) J =1 to J = 0 transition. This mechanism known as the Inverse Raman Effect (IRE) may be greatly enhanced on metal surfaces by a mechanism known as a Surface Raman Effect. Raman spectra showing the H2(1/4) J =1 to J = 0 transition IRE peak at the predicted 1950 cm-1 were recorded on metal electrodes from hydrated silver shot detonations [2] (Figures 25A-B) and from CIHT cells (Figure 25C) [90] using a Thermo Scientific DXR SmartRaman spectrometer and the 780 nm laser.

76
Figures 25A-C. Raman spectra obtained on metal electrode surfaces that showed an inverse Raman effect peak at about 1950 cm-1 that matches the free rotor energy of H2(1/4) (0.2414 eV). A. Copper electrodes pre-ignition of an 80 mg silver shot comprising 1 mole% H2O. B. Post ignition of the hydrated silver shot wherein detonation was achieved by applying a 12 V 35,000 A current with a spot welder [2]. C. Anode of the CIHT comprising [MoNiAl (45.5/45.5/9 wt%)/LiOHeLiBr/NiO] that output 2.40 Wh, 80 mA, at 176% energy gain [90].
(A)

77
(B)
(C)
The observation of the H2(1/4) IRE from the detonation of hydrated silver shots that produced a shockwave much greater than that of TNT and CIHT cell anodes comprising aluminum, a very important component of energetic materials that reacts with H2O to form hydrino reactant H, has implications for the design of novel energetic materials. The IRE results were replicated on ball milled alkali hydroxide-alkali halide mixtures at ThermoFisher and University of Texas El Paso [91].
The 785 nm Raman spectra of a Ni foil shown in Figures 9A-C, 325 nm Raman spectra were obtained on Ni foils (1 X 1 X 0.1 cm) floated on the molten gallium surface of the SunCell® during a hydrino reaction run of 10-minute duration. Both the hydrino plasma reaction facing and the molten gallium facing surfaces were cloth-wipe-cleaned and analyzed by Raman spectroscopy using a Horiba Aramis Raman spectrometer with a Synapse infrared CCD camera (Model: 354308, S/N: MCD-1393BR-2612, 1024x256CCD Front Illuminated Open Electrode), a 325 nm laser, and a 600 line/mm grating. These lines were not eliminated by a Semrock long-pass edge filter

78
(BLP01-325R-25) having an edge wavelength of 331 nm and Tavg > 93% 334.1 – 900 nm placed between the 325 nm laser and the sample, nor with the filter placed between the sample and the detector. From the spectrum of the 325 nm laser, only one high intensity line at 587.8 nm (17,011.2 cm-1) was observed that is capable of exciting transitions observed as 325 nm Raman lines in the 12,000-15,000 cm-1 energy region corresponding to emission in the 15,777-18,777 cm-1 energy region. The Raman spectra (12,250 cm-1 to 14,750 cm-1) are shown in Figure 26A with corresponding emission assignments given in Table 14A. The energies of the novel
emission lines that are nearly resonant with the 587.8nm laser line matched the double transition for final rotational quantum numbers (Eq. (38)) with energies given by the sum of
the independent transitions. Corresponding spin-orbital coupling energy (Eq. (22)) and fluxon linkage energies (Eqs. (23) and (24)) were also observed with the double transitions:
(48)
EEmission
J p' = 3;Jc
' = 1,2
EEmission = ΔEJ=0→J p
' =3+ ΔE
J=0→Jc' =1(2)
+ ES /O ,rot + EΦ,rot
= 15,602 cm−1 19,502 cm−1( )+m528 cm−1 +mΦ31 cm−1 +mΦ3/2 46 cm−1

79
Figure 26A. The 325 nm Raman spectrum (12,250-14,750 cm-1) obtained on the plasma and molten gallium exposed surfaces of a Ni foil maintained in a SunCell® during a hydrino plasma reaction for 10 minutes showing a series of emission peaks due 587.8 nm laser line excitation. The peaks were assigned to the double transition state having rotational quantum numbers (Eq. (38))
and and the corresponding spin-orbital coupling and fluxon linkage
energies. A laser line was observed at 13,750 cm-1.
J p' = 3;Jc
' = 1 J p' = 3;Jc
' = 2
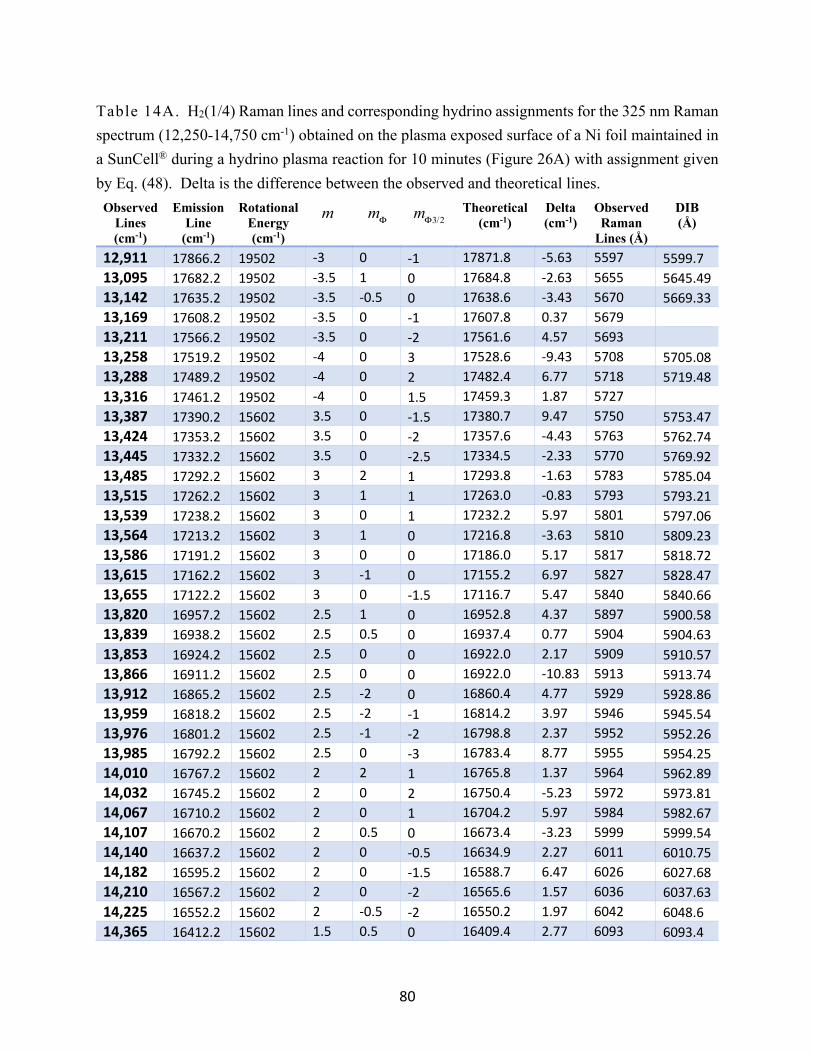
80
Table 14A. H2(1/4) Raman lines and corresponding hydrino assignments for the 325 nm Raman spectrum (12,250-14,750 cm-1) obtained on the plasma exposed surface of a Ni foil maintained in a SunCell® during a hydrino plasma reaction for 10 minutes (Figure 26A) with assignment given by Eq. (48). Delta is the difference between the observed and theoretical lines.
Observed Lines (cm-1)
Emission Line
(cm-1)
Rotational Energy (cm-1)
Theoretical (cm-1)
Delta (cm-1)
Observed Raman
Lines (Å)
DIB (Å)
12,911 17866.2 19502 -3 0 -1 17871.8 -5.63 5597 5599.7 13,095 17682.2 19502 -3.5 1 0 17684.8 -2.63 5655 5645.49 13,142 17635.2 19502 -3.5 -0.5 0 17638.6 -3.43 5670 5669.33 13,169 17608.2 19502 -3.5 0 -1 17607.8 0.37 5679 13,211 17566.2 19502 -3.5 0 -2 17561.6 4.57 5693 13,258 17519.2 19502 -4 0 3 17528.6 -9.43 5708 5705.08 13,288 17489.2 19502 -4 0 2 17482.4 6.77 5718 5719.48 13,316 17461.2 19502 -4 0 1.5 17459.3 1.87 5727 13,387 17390.2 15602 3.5 0 -1.5 17380.7 9.47 5750 5753.47 13,424 17353.2 15602 3.5 0 -2 17357.6 -4.43 5763 5762.74 13,445 17332.2 15602 3.5 0 -2.5 17334.5 -2.33 5770 5769.92 13,485 17292.2 15602 3 2 1 17293.8 -1.63 5783 5785.04 13,515 17262.2 15602 3 1 1 17263.0 -0.83 5793 5793.21 13,539 17238.2 15602 3 0 1 17232.2 5.97 5801 5797.06 13,564 17213.2 15602 3 1 0 17216.8 -3.63 5810 5809.23 13,586 17191.2 15602 3 0 0 17186.0 5.17 5817 5818.72 13,615 17162.2 15602 3 -1 0 17155.2 6.97 5827 5828.47 13,655 17122.2 15602 3 0 -1.5 17116.7 5.47 5840 5840.66 13,820 16957.2 15602 2.5 1 0 16952.8 4.37 5897 5900.58 13,839 16938.2 15602 2.5 0.5 0 16937.4 0.77 5904 5904.63 13,853 16924.2 15602 2.5 0 0 16922.0 2.17 5909 5910.57 13,866 16911.2 15602 2.5 0 0 16922.0 -10.83 5913 5913.74 13,912 16865.2 15602 2.5 -2 0 16860.4 4.77 5929 5928.86 13,959 16818.2 15602 2.5 -2 -1 16814.2 3.97 5946 5945.54 13,976 16801.2 15602 2.5 -1 -2 16798.8 2.37 5952 5952.26 13,985 16792.2 15602 2.5 0 -3 16783.4 8.77 5955 5954.25 14,010 16767.2 15602 2 2 1 16765.8 1.37 5964 5962.89 14,032 16745.2 15602 2 0 2 16750.4 -5.23 5972 5973.81 14,067 16710.2 15602 2 0 1 16704.2 5.97 5984 5982.67 14,107 16670.2 15602 2 0.5 0 16673.4 -3.23 5999 5999.54 14,140 16637.2 15602 2 0 -0.5 16634.9 2.27 6011 6010.75 14,182 16595.2 15602 2 0 -1.5 16588.7 6.47 6026 6027.68 14,210 16567.2 15602 2 0 -2 16565.6 1.57 6036 6037.63 14,225 16552.2 15602 2 -0.5 -2 16550.2 1.97 6042 6048.6 14,365 16412.2 15602 1.5 0.5 0 16409.4 2.77 6093 6093.4
m mΦ mΦ3/2

81
14,402 16375.2 15602 1.5 -0.5 0 16378.6 -3.43 6107 6107.16 14,426 16351.2 15602 1.5 0 -1 16347.8 3.37 6116 6116.84 14,493 16284.2 15602 1.5 -0.5 -2 16286.2 -2.03 6141 6142.09
The 35 matches of the observed Raman lines to those of unassignable astronomical lines
associated with the interstellar medium called diffuse interstellar bands (DIBs). The assignment of all the 380 DIBs listed by Hobbs [27] to H2(1/4) rotational transitions with spin-orbital splitting and fluxon sub-splitting are given in the Appendix.
The addition of water to the complex with GaOOH:H2(1/4)) was tested as a means to suppress the intense fluorescence observed with the UV 325 nm Raman laser irradiation of GaOOH. A sample comprising 50:50 vol% GaOOH:H2(1/4):H2O analyzed by 325 nm Raman spectroscopy showed the absence of fluorescent peaks with novel Raman peaks observed in the 14,000 cm-1-15,000 cm-1 region. The Raman peaks are shown in Figure 26B and assigned in Table 14A to the double transition with spin-orbital coupling and fluxon linkage. Within
experimental error, many of the lines of matched those of obtained on Ni foil shown in Figure 26A having the same assignment (Table 14B).
These lines were observed to be very sensitive to elimination with UV irradiation by the 325 nm Raman laser wherein at least one of the complex GaOOH:H2(1/4):H2O or the compound GaOOH:H2(1/4) decomposed upon prolonged UV irradiation. The sensitivity necessitated the acquisition of the spectrum in short spectral-range intervals such as the one shown in Figure 26B. Figure 26B. The 325 nm Raman spectrum (14,000-15,000 cm-1) obtained on 50:50 vol% GaOOH:H2(1/4):H2O showing a series of peaks assigned to emission from the state
having a double transition with spin-orbital coupling and fluxon linkage.
J p' = 3;Jc
' = 1
H2 1/ 4( )J p' = 3;Jc
' = 1

82
Seventeen of the observed Raman lines match those of unassignable astronomical lines associated with the interstellar medium called diffuse interstellar bands (DIBs) as shown in Table 14A where 7 of the DIBs assigned lines of Table 14B matched DIBs assigned lines of Table 14A. Table 14B. H2(1/4) Raman lines and corresponding hydrino emission assignments (Eq. (48)) for the 325 nm Raman spectrum (14,000-15,000 cm-1) obtained on 50:50 vol% GaOOH:H2(1/4):H2O (Figure 26B).
Observed Lines (cm-1)
Emission Line
(cm-1)
Rotational Energy (cm-1)
Theoretical (cm-1)
Delta (cm-
1)
Observed Raman
Lines (Å)
DIB (Å)
14,003.0 16774.2 15602 2 0 2.5 16773.5 0.67 5962 5962.89 14,031.3 16745.9 15602 2 0 2 16750.4 -4.53 5972 5973.81 14,063.4 16713.8 15602 2 2 0 16719.6 -5.83 5983 5982.67 14,099.1 16678.1 15602 2 0 0.5 16681.1 -3.03 5996 5995.83 14,137.7 16639.5 15602 2 -0.5 0 16642.6 -3.13 6010 6010.75 14,165.7 16611.5 15602 2 0 -1 16611.8 -0.33 6020 6019.32 14,185.4 16591.8 15602 2 -2 0 16596.4 -4.63 6027 6027.68 14,208.7 16568.5 15602 2 0 -2 16565.6 2.87 6036 6037.63 14,226.5 16550.7 15602 2 -0.5 -2 16550.2 0.47 6042 14,241.8 16535.4 15602 2 -1 -2 16534.8 0.57 6048 6048.6 14,275.0 16502.2 15602 1.5 0.5 2 16501.8 0.37 6060 6059.26 14,279.7 16497.5 15602 1.5 2 1 16501.8 -4.33 6062 14,295.7 16481.5 15602 1.5 0 2 16486.4 -4.93 6067 6065.28 14,304.5 16472.7 15602 1.5 1 1 16471.0 1.67 6071 6071.31 14,321.6 16455.6 15602 1.5 0.5 1 16455.6 -0.03 6077 6081.1 14,368.9 16408.3 15602 1.5 0.5 0 16409.4 -1.13 6094 6093.4 14,401.7 16375.5 15602 1.5 0 -0.5 16370.9 4.57 6107 6107.16 14,486.9 16290.3 15602 1.5 -0.5 -2 16286.2 4.07 6139 6139.98 14,633.0 16144.2 15602 1 0.5 0 16145.4 -1.23 6194 6194.74
5 Additional Hydrino Spectroscopies and Energetic Measurements
Next, X-ray photoelectron spectroscopy (XPS) confirmation of molecular hydrino in GaOOH:H2(1/4) was performed by measuring the total energy in the 500
eV region predicted by Mills Eq. (11.240) [1] wherein the double ionization is a required selection rule. A series of XPS analyses were performed on GaOOH:H2(1/4) using a nonmonochromatic Mg Kα (1254 eV) excitation source with the XPS spectra recorded using a SPECS GmbH system with a PHOIBOS 150 hemispherical energy analyzer. at was used as the internal standard. The peak shown in Figure 27 at 496 eV was assigned to wherein other
m mΦ mΦ3/2
H2 1/ 4( ) H2 1/ 4( )
C 1s 284.5 eVH2 1/ 4( )

83
possibilities such Sn, W, and Ir were eliminated since the corresponding peaks of these candidates were absent. Cu is from the TEM grid used to mount the fibers. Figure 27. The XPS spectrum of GaOOH:H2(1/4) showing the total energy peak at
496 eV.
The H2(1/4) total binding energy was further confirmed on copper electrodes before and after the ignition of 80 mg silver shots comprising 1 mole% H2O. The peak power of 20 MW was measured on the ignited shots using absolute spectroscopy over the 22.8-647 nm region wherein the optical emission energy was 250 times the applied energy [2]. The corresponding XPS spectrum on tungsten-coated copper electrodes post ignition of an 80 mg silver shot comprising 1 mole% H
2O, wherein the detonation was achieved by applying a 12 V 35,000 A current with a spot
welder is shown in Figure 28. The peak at 496 eV was assigned to H2(1/4) wherein other
H2 1/ 4( )

84
possibilities such Na, Sn, and Zn were eliminated since the corresponding peaks of these candidates are absent. Figure 28. XPS spectrum on copper electrode post ignition of a 80 mg silver shot comprising 1 mole% H2O, wherein the detonation was achieved by applying a 12 V 35,000 A current with a spot welder.
H2(1/4) was further identified by gas chromatography of gas collected from the SunCell®. H2(1/4) gas was collected from the SunCell® using a valved microchamber connected to the vacuum line and cooled to 15 K by a cryopump system (Helix Corp., CTI-Cryogenics Model SC compressor; TRI-Research Model T-2000D-IEEE controller; Helix Corp., CTI-Cryogenics model 22 cryodyne). The liquefied gas was warmed to room temperature to achieve 10 Torr chamber pressure and was injected into an HP 5890 Series II gas chromatograph with a capillary column (Agilent molecular sieve 5 Å, (50 m x 0.32 mm, df = 30 μm)) at 303 K (30 °C), argon carrier gas, and a thermal conductivity detector (TCD) at 60 °C. H2(1/4) was observed as an early peak at 10.92 minutes and hydrogen that co-condensed with H2 gas was observed at 12.7 minutes (Figure 29). The peak at 18 minutes is oxygen that was condensed before the SunCell® run to serve as a solvent for H2(1/4). The collected gas contained no helium by mass spectroscopy. The early peak was negative with a helium carrier gas indicating that the early peak had a higher thermal conductivity, and the migration rate was faster than that of helium with an argon carrier gas. No

85
known gas has a faster migration rate and higher thermal conductivity than H2 or He which is characteristic of and identifies hydrino since it has a much greater mean free path due to exemplary H2(1/4) having 64 times smaller volume and 16 times smaller ballistic cross section. Hydrogen condensed under pressure and temperature conditions that violate the Clausius Clapeyron equation due to the raising of the H2 liquefaction temperature by co-condensation with H2(1/4). Figure 29. The gas chromatograph of gas collected from the SunCell® by a cryopump showing H2(1/4) at 10.92 minutes and hydrogen that co-condensed with gas was observed at 12.7
minutes.
The SunCell® was operated for one hour at excess power levels of over 100 kW with the intention of forming molecular hydrino states with and , possibly .
The HOH catalyst reaction of to hydrino atom is given by Eqs. (1-4). Hydrino atoms
have a potential energy of an integer multiple of 27.2 eV matching the hydrino catalyst criterion. Thus, hydrino atoms serving as catalysts may react with to form lower energy states than those of the catalysts. A favored reaction is the catalysis of to by serving as the
catalyst (Mills Eqs. (5.76-5.79)) [1]. A characteristic signature of this reaction is the emission of broad soft X-ray radiation of 3.48 keV. A broad X-ray peak with a 3.48 keV cutoff was observed in the Perseus Cluster by NASA’s Chandra X-ray Observatory and by the XMM-Newton that has no match to any known atomic transition. The 3.48 keV feature assigned to dark matter of
unknown identity by Bulbul et al. [16,18] matches the transition.
H2
H2 1/ p( ) p = 4 p > 4 p = 17H H 1/ 4( )
HH H 1/17( ) H 1/ 4( )
HaH4
⎡
⎣⎢
⎤
⎦⎥ + H
aH1
⎡
⎣⎢
⎤
⎦⎥→ H
aH17
⎡
⎣⎢
⎤
⎦⎥

86
The identification of molecular hydrino SunCell® products such as that result from
hydrino serving as a catalyst was sought using gas chromatography. A small reproducible peak shown in Figure 31 that is a candidate for was observed in cryogenically collected
SunCell® gases. Figure 30. Gas chromatograph of gas collected from the SunCell® by a cryopump showing
at 1.95 minutes that may be .
Since molecular hydrino absorbs on metals as shown by the Raman spectroscopy (Figures 9A-C), gallium-transition metal alloys were formed during the propagation of a hydrino plasma reaction in the SunCell®, and solid samples were isolated as a source of molecular hydrino gas release by thermal desorption. The SunCell® comprising Cr-Mo stainless steel reaction vessel walls was operated at a gallium temperature of 600°C, a temperature above the threshold for the formation of gallium-transition metal alloys. Additionally, the hydrino plasma mixture, 2000 sccm H2/10 sccm O2, was richer in oxygen than typical to form some gallium oxide to additionally absorb molecular hydrino. Following a 30-minute plasma run, 3 grams of solid material was collected from the molten SunCell® gallium. The solid sample was mixed with excess aqueous 4 M KOH (Alfa Aesar, flake 85%, AAA161990C) for 24 hours, then the solution was filtered using a Buchner funnel, side-arm flask, and filter paper (WhatmanTM, Grade 50, 09-865C; high-quality cotton liners, high wet-strength, and chemical resistance). By X-ray diffraction, the KOH-treated Ga2O3 collected from SunCell® plasma runs comprised Ga2O3, GaOOH, gallium-stainless steel metal alloys (~0.1-5%) such as iron-gallium, nickel gallium, and chromium-gallium alloys, alloy oxides, and about 1% carbonate. The insoluble solid from the filter paper was placed in a porous thin-walled ceramic crucible. The crucible was placed into a sixty-five-milliliter stainless-steel vessel that was vacuum-sealed using a copper gasket and stainless-steel knife-edge flanged plate having two welded-in ports, one inlet/outlet port, and a port for monitoring pressure changes
H2 1/ 17( )
H2 1/ 17( )
H2 1/ p( ) H2 1/ 17( )

87
during and after the test. The sealed stainless-steel vessel was evacuated, leak checked, and loaded into a smelting furnace (ProCast™ 3 kg 110 Volt U.S. Electric Melting Furnace 2102 °F) and heated to 800 °C over a time interval of 25 to 40 minutes wherein the pressure rose from 20 mTorr to between 1520 Torr to 2289 Torr. The stainless-steel vessel was then connected to the inlet sample tube and pneumatic valve of the gas chromatograph. Optimally, the pressure inside the sample tube maintained at least 1000 Torr.
Using an Agilent 8890 gas chromatograph system with a single filament thermal conductivity detector (TCD), gas chromatography was performed on the gases released by thermal desorption of gas bound to the KOH-treated alloy/Ga2O3 sample originally collected from a SunCell® plasma run. Known gases such as hydrogen were also run to identify their migration times to compare to the results of the SunCell®-derived sample. The pressure controller was set at 19 PSI for the flow of argon carrier gas at 5 ml/min on a capillary column (Agilent molecular sieve 5 Å, (50 m x 0.32, df = 30 μm) at 303 K (30 °C) with the TCD at 60 °C. The gas inlet injected a 1000 ul sample onto the column wherein the volume was precision-controlled by electronic pneumatic controllers run by compressed nitrogen. The Agilent 8890 system sensed and compensated for atmospheric pressure fluctuations, and a microchannel-based architecture protected against gas contaminants. The data was analyzed using Agilent OpenLab CDS.
The gas chromatograph of hydrino gas evolved by heating the KOH-treated alloy/Ga2O3 material collected from the SunCell® to 800°C is shown in Figure 31. The known hydrogen peak was observed at 8 minutes, a nitrogen peak was observed at 15 minutes, and a novel peak observed at 6 minutes was assigned to . The property of molecular hydrino peak having a shorter
retention time than any known gas was attributed to its decreased molecular size and corresponding smaller ballistic cross section.
H2 1/ 4( )

88
Figure 31. The gas chromatograph of hydrino gas evolved by heating the KOH-treated alloy/Ga2O3 material collected from the SunCell® to 800°C. The known hydrogen peak was observed at 8 minutes, a nitrogen peak was observed at 15 minutes, and a novel peak observed at 6 minutes was assigned to H2(1/4).
Using electron beam excitation spectroscopy, H2(1/4) was further identified by ro-vibration emission of H2(1/4) that was shown to be a contaminant of industrial grade commercial argon [64]. As shown in Figure 32, the ro-vibrational spectrum of H2(1/4) was observed as equal-energy-spaced emission lines in the ultraviolet region (130-200 nm) by 12 keV electron beam excitation of the argon gas. The intensity profile, the cutoff of 8.2 eV, and the line spacing of 0.25 eV matched the to vibrational transition with the P-branch rotational spectrum of H2(1/4). The R-branch is not expected to be observed due to the lack of population of ro-vibration states with the plasma gas temperature being lower than the ro-vibrational excitation temperature. Argon gas is cryo-distilled from the atmosphere. Due to the likeness of boiling points, oxygen co-condenses. Oxygen is removed by adding hydrogen and recombining O2 on a recombination catalyst. An exemplary recombination catalyst is Pt or Pd on an alumina support. The reaction is H2 + O2 to H2O. Recombination catalysts work by creating H atoms and they produce water. Argon greatly increases the concentration of H and HOH (versus water dimers) by interfering with interactions between H atoms and HOH molecules. Commercial argon gas uniquely contains trace H2 and O2 that remains after recombination process, and it contains H2(1/4) due to the recombination reaction.
υ = 1 ν = 0

89
Figure 32. The ro-vibrational spectrum of H2(1/4) was observed by 6 keV electron beam excitation of argon gas at atmospheric pressure wherein the electron beam passed through a silicon nitride window of the plasma cell. The cutoff of 8.2 eV and the line spacing of 0.25 eV matched the to vibrational transition with the P-branch rotational spectrum of H2(1/4).
H2(1/4) gas of an argon/H2(1/4) mixture formed by recombination of hydrogen and oxygen on a supported noble metal catalyst in an argon atmosphere was enriched by flowing the mixture through a 35 m long, 2.5 mm ID HayeSep® D chromatographic column cooled to a cryogenic temperature in a liquid argon. The argon was partially liquefied to permit the flowing molecular hydrino gas to be enriched as indicated by the dramatic increase in the ro-vibrational P branch of H2(1/4) observed by e-beam excitation emission spectroscopy as shown in Figure 33.
υ = 1 ν = 0

90
Figure 33. Ultraviolet emission spectrum from electron beam excitation of argon/H2(1/4) gas wherein the ro-vibrational P branch of H2(1/4) was greatly enhanced in intensity by flowing the gas mixture through a HayeSep® D chromatographic column cooled to liquid argon temperature.
The molecular hydrino gas from the chromatographic column was also liquified with trace air as it was flowed into a valved microchamber cooled to 55 K by a cryopump system (Helix Corp., CTI-Cryogenics Model SC compressor; TRI-Research Model T-2000D-IEEE controller; Helix Corp., CTI-Cryogenics model 22 cryodyne). The liquefied gas was warmed to room temperature to achieve 1000 Torr chamber pressure and was injected on to the Agilent column with argon carrier gas. Oxygen and nitrogen were observed at 19 and 35 minutes, respectively. H2(1/4) was observed at 6.9 minutes (Figure 34).

91
Figure 34. The gas chromatograph of molecular hydrino gas enriched using a HayeSep® D chromatographic column cooled to liquid argon temperature, liquified with trace air using a valved microchamber cooled to 55 K by a cryopump system, vaporized by warming to room temperature to achieve 1000 Torr chamber pressure, and injected on to the Agilent column using a HP 5890 Series II gas chromatograph with a thermal conductivity detector and argon carrier gas. Oxygen and nitrogen were observed at 19 and 35 minutes, respectively, and H2(1/4) was observed at 6.9 minutes.
A neon-hydrogen microhollow cathode glow discharge has been proposed as a source of predominantly Lyman radiation. Kurunczi, Shah, and Becker [50] observed intense emission of Lyman and Lyman radiation at 121.6 nm and 102.5 nm, respectively, from microhollow
cathode discharges in high-pressure Ne (740 Torr) with the addition of a small amount of hydrogen (up to 3 Torr). With essentially no molecular emission observed, Kurunczi et al. attributed the anomalous Lyman emission to the near-resonant energy transfer between the excimer and
which leads to formation of H(n=2) atoms, and attributed the Lyman emission to the near-
resonant energy transfer between excited atoms (or vibrationally excited neon excimer molecules) and which leads to formation of H(n=3) atoms. H2(1/4) emission intensity was
greatly amplified by resonance energy transfer for argon or neon excimers. As shown in Figure 35, H2(1/4) was released from heating FeOOH:H2(1/4). The ultraviolet
emission spectrum from electron beam excitation of H2(1/4) gas showed the ro-vibrational P branch of H2(1/4) further confirming the Raman assignments. Through resonance energy transfer from the argon excimer band, the H2(1/4) ro-vibrational band was enhanced in intensity by adding argon gas wherein the argon gas was allowed to stand at atmospheric pressure and 300K for two days to remove any H2(1/4) gas by diffusion.
αα β
α Ne2*
H2 βNe*
H2

92
Figure 35. Ultraviolet emission spectrum from electron beam excitation of H2(1/4) gas released from heating FeOOH:H2(1/4) and mixed with atmospheric pressure argon gas absent H2(1/4) gas. The cutoff of 8.2 eV and the line spacing of 0.25 eV matched the to vibrational transition with the P-branch rotational spectrum of H2(1/4).
The ro-vibrational spectrum of H2(1/4) was also recorded on the emission of gas produced from GaOOH:H2(1/4) and excited by high-energy electron beam bombardment. Three grams of GaOOH:H2(1/4) was thermally decomposed by heating to 600 °C in a quartz tube reactor for one hour and raising the oven temperature thereafter to 850°C. The gas in the cell was mixed with neon carrier gas at a total pressure of one atmosphere, flowed through a HayeSep® D chromatographic column cooled to -78°C by immersion in a CO2(s) bath to remove H2O, and flowed from the column into an electron beam chamber. The chamber gas was excited by a 12 keV to 16 keV electron-beam incident the gas through a silicon nitride window. The emission was observed through a MgF2 window on the opposite side of the gas chamber relative to the silicon nitride window. Emission from the electron-beam excitation was recorded using a McPherson grazing incidence EUV spectrometer (Model 248/310G) equipped with a platinum-coated 600 g/mm or a platinum-coated 1200 g/mm grating. The angle of incidence was 87°. The wavelength resolution was about 0.05 nm with an entrance slit width of <1 µm. The EUV light was detected by a CCD detector (Andor iDUS Model #: DO420A-BEN-995, Serial #: CCD-24974, Date: 2020) cooled to -60 °C. As shown in Figure 36, the ro-vibrational spectrum of H2(1/4) was observed as emission lines in the ultraviolet region (130-200 nm) by 12 keV electron beam excitation of the GaOOH:H2(1/4) decomposition gas. The cutoff of 8.2 eV and the line spacing of 0.25 eV matched the to vibrational transition with the P-branch rotational spectrum of H2(1/4).
υ = 1 ν = 0
υ = 1 ν = 0

93
Figure 36. Ro-vibrational spectrum of H2(1/4) that was observed as ultraviolet emission lines by 12 keV electron beam excitation of thermally released GaOOH:H2(1/4) gas flowed at atmospheric pressure from a cryogenic chromatographic column wherein the electron beam passed through a silicon nitride window of the plasma cell. The cutoff of 8.2 eV and the line spacing of 0.25 eV matched the to vibrational transition with the P-branch rotational spectrum of H2(1/4).
Further consider the EUV spectrum (120-200 nm) of the electron beam emission of argon gas shown in Figure 32. Hydrogen and oxygen are present as evidence by the H I or O I emission at 121.567 nm and 130.5 nm, respectively, in addition to the lines assigned to the ro-vibration of H2(1/4) given in Table 15. In the latter case, the linear curve fit of the line number versus line energy that matches the ro-vibrational energy of H2(1/4) is y = -0.260x eV+8.54 eV with a corresponding R2 = 0.9997.
υ = 1 ν = 0

94
Table 15. The line positions and energies of the EUV spectral lines in the 120-200 nm region assigned to the H2(1/4) rotational and vibrational transitions corresponding to quantum number changes to and to , respectively.
Peak Number Line Position (nm)
Line Energy (eV)
1 149.4 8.30 2 154.8 8.01 3 160 7.75 4 165.6 7.49 5 171.6 7.22 6 177.9 6.97 7 184.7 6.71 8 191.7 6.47
In addition, a series of small satellite peaks were observed that are associated with the H2(1/4) ro-vibrational lines as shown in Figures 32, 33, 35, and 36. They are present even in the absence of any atomic emission such as H I or O I emission and in pure gas samples. For example, as shown in Figures 33 and 36, the satellite lines are present in samples of pure gas from cryogenic gas chromatographic separation. These satellite lines match the rotational spin-orbital splitting energies given by Eq. (22), that were also observed by Raman spectroscopy as shown in exemplary Figures 9A-B with assignments given in Table 7B. The spin-orbital splitting energies due to rotation of , wherein 1.5 involves the and splittings are given in Table 16.
J = 0 J’= 1,2,3,4,6,7 ν = 1 ν = 0
m528 cm−1 m = 1,1.5 m = 0.5 m = 1

95
Table 16. Spin-orbital splitting energy separations of the line emission from electron beam excitation of rotational transitions of . The separations are between each pair of shorter
and succeeding longer wavelength lines in the table. The rotational spin-orbital splitting energy separations matched wherein 1.5 involves the and splittings.
Line Position (nm)
Line Energy (eV)
Spin-Orbital Separation
(eV)
Spin-Orbital Separation
(cm-1)
Spin-Orbital Quantum Number
154.8 8.012 0.067 538.205 1 156.1 7.946 0.096 770.677 1.5 158 7.850 0.098 791.465 1.5 160 7.752 0.161
163.4 7.591 0.101 813.371 1.5 165.6 7.490 0.063 506.442 1 167 7.427 0.097 778.905 1.5
169.2 7.330 0.103 826.937 1.5 171.6 7.228 0.067 538.559 1 173.2 7.161 0.074 594.108 1 175 7.088 0.116
177.9 6.972 0.066 532.286 1 179.6 6.906 0.069 552.723 1 181.4 6.837 0.063 512.038 1 183.1 6.774 0.059 473.307 1 184.7 6.715 0.065 522.764 1 186.5 6.651 0.067 540.969 1 188.4 6.583 0.062 502.527 1 190.2 6.521 0.064 520.229 1 192.1 6.457 0.063 510.039 1 194 6.393 0.052 421.821 1
195.6 6.341 0.064 517.670 1 197.6 6.277 0.063 507.296 1 199.6 6.214 0.062 497.230 1 201.6 6.152 0.066 535.681 1 203.8 6.086
Molecular hydrino was identified by liquid chromatography wherein an inorganic hydrino
complex behaved as an organic molecule in chromatographic analysis with an aqueous solution and an organic column packing. Using an Agilent Technologies 6230 TOFLC/MS and a C18 50 x 2mm 3µm (P/N 94641-12) column, liquid chromatography was performed on an energy dispersive X-ray spectroscopy (EDS) determined gallium (59 at%)/oxygen (38 at%)/carbon (2 at%) sample collected from a hydrino reaction run in the SunCell® and dissolved in 4M NaOH wherein the hydrino composition H2(1/4) was confirmed by XPS and EPR. Following the injection
H2(1/ 4)
m528 cm−1 m = 1,1.5 m = 0.5 m = 1

96
of 20 ul of the liquid sample, an inorganic hydrino complex was eluted with a water + acetonitrile-water gradient. When using an organic column, inorganic compounds such as sodium carbonate chromatographically elute with the void volume with no retention time. Remarkably, when molecular hydrino complexed with sodium carbonate (Na2CO3:H2(1/4)) organic molecular behavior was observed. As shown in Figure 37, the complex showed a chromatographic peak at 23 minutes. The peak fragmented into inorganic ions that identified the complex as comprising sodium carbonate. Figure 37. Liquid chromatograph of Na2CO3:H2(1/4) on an organic-packed column using an aqueous solution eluent showing a chromatographic peak at 23 minutes that fragmented into inorganic ions of sodium carbonate demonstrating corresponding organic molecular behavior of the inorganic hydrino complex.
The energetics of the hydrino reaction may be shown by atomic hydrogen line broadening. Extraordinary Doppler broadening of the Balmer line was observed at low pressure due to the hydrino reaction. From the width of the emitted Balmer lines, it was found that low-pressure capacitively coupled radio frequency (rf) water-vapor plasmas showed the presence of both slow and fast excited hydrogen atoms (Figure 38). The typical slow component was independent of time. A new phenomenon, an extraordinary fast Doppler broadened component (130–150 eV) that increases to a significant portion of the Balmer emission with time, was also observed [53]. These studies demonstrate excessive line broadening in the absence of an observable effect attributable to a strong electric field since the xenon–hydrogen plasma emission showed no broadening. To conserve energy during the resonant energy transfer of 81.6 eV (3 X 27.2 eV) from H to HOH catalyst to form H(1/4), the resulting protons gain high kinetic energy and result in fast H emission with proton-electron recombination. The Balmer line width profile recorded on water-vapor and Xe/H2 (90/10%) rf plasmas are shown in Figure 38.
α
α
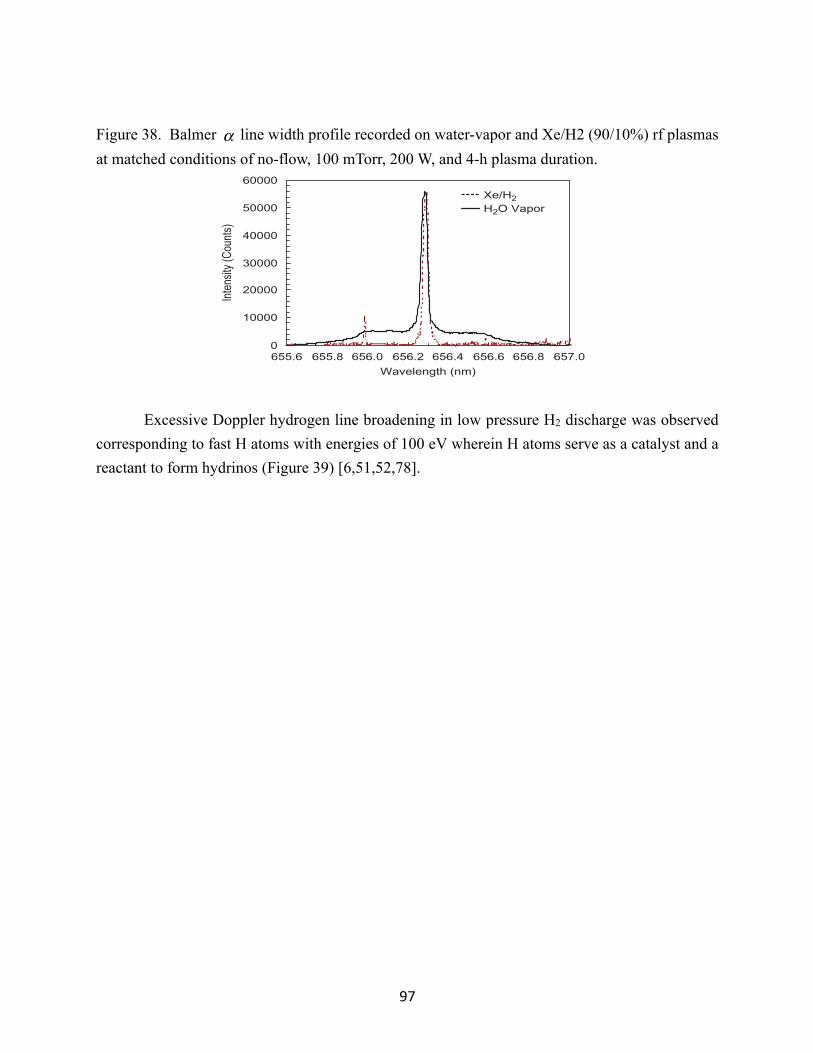
97
Figure 38. Balmer line width profile recorded on water-vapor and Xe/H2 (90/10%) rf plasmas at matched conditions of no-flow, 100 mTorr, 200 W, and 4-h plasma duration.
Excessive Doppler hydrogen line broadening in low pressure H2 discharge was observed corresponding to fast H atoms with energies of 100 eV wherein H atoms serve as a catalyst and a reactant to form hydrinos (Figure 39) [6,51,52,78].
α
72%. Moreover, no change in energy was observed for the coldand mildly warm H atoms. It should be noted here that thedischarge remained primarily capacitive with a small resis-
tive part from the ionized gas and interconnects. The plasmadensity and electron temperature measured between theelectrode plates also remained unchanged during the 4 h ofduration of the discharge.
It should be noted however, that this temporal increase inBalmer line broadening was not observed in Xe/H2 (90/10%)plasma in the no-flow mode. The emission profiles for water-vapor plasma and Xe/H2 (90/10%) plasma sampled after 4 hare shown in Fig. 9. Plasmas were maintained at 100 mTorrand 200 W of coupled power. The emission profile for theXe/H2 (90/10%) plasma remained independent of time and
only a single concentration of H atom with energy !1 eV wasfound. As discussed earlier, the line broadening increaseswith time in water-vapor plasma. The onset of the linebroadening was associated with the appearance of plasmafilling the entire chamber and the increase in the plasmaemission far away from the electrode plates. It should benoted however, that after 4–5 h there was no appreciableincrease in the broadening of the emission line profile.
Excessive broadening in water-vapor plasmas was observedonly for the atomic hydrogen lines (a, b, g, and dÞ. Emissionprofiles of Balmer b and Balmer g lines for the same plasma
conditions as discussed above sampled after 4 h are shown inFig. 10. The corresponding line broadening yields a similarhydrogen atom temperature as obtained from the Balmer aline emission profile. In contrast to the atomic hydrogen lines,no broadening of the oxygen line was observed. This agreeswell with earlier observations that the transfer of energy tothe hydrogen atom is very selective. This is contrary to thefield acceleration mechanism where there are no unique ionsand atoms as the source of energetic hydrogen.
The temporal evolution of the Balmer g emission profile
along with the emission profile of the 435.8 nm Oþ line isshown in Fig. 11. The intensity is normalized with respect tothe peak intensity of Balmer g line. The onset of broadening ofthe emission profile of Balmer lines very closely tracked theincrease in the intensity of the 435.8 nm Oþ line in the water-vapor plasma. In flow mode, the Hg emission profile showedno broadening, and the relatively less intense 435.8 nm Oþ
line was observed. In the beginning of the static (no flow)mode, there was only a slight increase in the intensity of theOþ line and no broadening is observed in the Hg emissionprofile. After 2 h in static mode, the onset of broadening in the
Hg emission profile was accompanied by an increase in theintensity of the 435.8 nm Oþ line. After 4 h, a further increasein the broadening of the Hg profile is seen and a furtherincrease in the intensity of the 435.8 nm Oþ line was observed.
ARTICLE IN PRESS
0
10000
20000
30000
40000
50000
60000
655.6 655.8 656.0 656.2 656.4 656.6 656.8 657.0
Wavelength (nm)
Inte
nsity
(Cou
nts)
Xe/H2
H2O Vapor
Fig. 9 – The Balmer a line width profile recorded on water-vapor and Xe/H2 (90/10%) rf plasmas at matched conditionsof no-flow, 100 mTorr, 200 W, and 4-h plasma duration: Thepeak emission intensity sampled after 4 h is matched. Thebase of the peaks shows the presence of excited fast Hatoms with energy of 130–140 eV for the H2O plasma. Incontrast, only single temperature slow H atoms with energy!1 eV were observed for xenon–hydrogen plasmas.
0
10000
20000
30000
40000
50000
60000
485.6 485.8 486.0 486.2 486.4 486.6
Wavelength (nm)
Inte
nsity
(nm
)
0
4000
8000
12000
16000
20000
433.4 433.6 433.8 434.0 434.2 434.4 434.6
Wavelength (nm)
Inte
nsity
(cou
nts)
Fig. 10 – Emission profiles of a 486.1 nm Balmer b line (Fig. a)and a 434.0 nm Balmer c line (Fig. b) in a 100 mTorr water-vapor plasma after 4 h with rf coupled power of 200 W. Thecorresponding line broadening yields a similar hydrogenatom temperature (130–150 eV) as obtained from the Balmera line emission profile.
I N T E R N A T I O N A L J O U R N A L O F H Y D R O G E N E N E R G Y 3 3 ( 2 0 0 8 ) 8 0 2 – 8 1 5810

98
Figure 39. The 656.3 nm Balmer line width recorded with the Jobin Yvon Horiba 1250 M spectrometer parallel to the electric field. Even though hydrogen ions were accelerated away from the detector, a symmetrical emission profile was observed indicating that the broadening was not dependent on the electric field. The line profile recorded on a 200 mTorr H2 pinch plasma showed a trimodal distribution wherein 18% and 33% of the hydrogen in the excited n = 3 state was fast with an average hydrogen atom energy of 98 eV and 8.8 eV, respectively, compared to 1.3 eV for the slow population.
Argon may show Doppler Balmer alpha line broadening with hydrogen addition due the presence of oxygen in argon. Doppler Balmer alpha line broadening is observed with hydrogen addition to argon plasma due to the presence of oxygen in argon as shown in Figures 40-41 [51,52]. The oxygen is present since it co-condenses with liquid argon during purification from the atmosphere. Hydrogen reacts with trace oxygen to form HOH that serves as the hydrino catalyst for atomic H of the argon-H2 plasma.
α

99
Figure 40. The axial scan of the 656.3 nm Balmer α line width recorded on a 1 Torr Ar /H2 (95/5%) DC plasma discharge with needle-like electrodes at 400 V and 20 mA showing 80% of the hydrogen in excited n=3 state was fast with an average hydrogen atom energy of 40 eV, compared to < 0.5 eV for the slow population.
Figure 41. The 656.3 nm Balmer α line width recorded end-on (parallel to the electric field) on a 1 Torr Ar /H2 (95/5%) DC plasma discharge with needle-like electrodes at 400 V and 20 mA. Both views looking towards the cathode as well as the anode show a symmetrical emission profile. Fast hydrogen atoms have energies in the range of 38-40 eV.
The fast H caused by a hydrino reaction provides a very effective mechanism to form diamond films and coatings [92-94].
Due to the high hydrino reaction energetics, the potential of a novel detonation mechanism whereby the extraordinary power released as extreme ultraviolet radiation couples with air to form a shockwave was investigated by sound propagation velocity and pressure measurements. With only about 1% of the energy coupling to the shockwave observed from high current detonation of hydrated shots, the shockwave propagation velocity and the corresponding overpressure were
0.0
5.0
10.0
15.0
20.0
25.0
30.0
35.0
655.8 656.0 656.2 656.4 656.6 656.8Wavelength (nm)
Relat
ive In
tens
ityZ= 0 cmZ= 2 cmZ= 4 cmZ= 8 cm
0.0
0.2
0.4
0.6
0.8
1.0
655.8 656.0 656.2 656.4 656.6 656.8
Wavelength (nm)
Nor
mal
izd
Inte
nsity
Cathode Anode

100
equivalent to those produced by about 10 times more moles of gunpowder or TNT [2,79]. These results have implications for the shockwave mechanism of known energetic materials. An intense 260 nm band shown in Figure 22B comprising the H2(1/4) ro-vibrational peaks Q(0), R(0), R(1), R(2), P(1), P(2), P(3), and P(4) were observed from the KCl getter from a sealed reactor for a solid fuels reaction of gun powder having the formulation C7H4O [78]. The ro-vibrational spectrum comprising the ½ -energy spectrum of this series of H2(1/4) ro-vibrational peaks was observed in the 325 nm Raman fluorescence spectrum [79]. Following high current detonation of NH4NO3, Raman spectroscopy showed H2(1/4) rotation, EUV spectroscopy showed EUV emission and EUV optical power of at least 10 times that of NH4NO3 chemistry, and XPS showed the H2(1/4) total energy peak [77]. Following high current detonation of gun powder and NH4NO3, EUV spectroscopy showed EUV emission and EUV optical power from NH4NO3 of 36.4 times that of NH4NO3 chemistry [8]. Almost all energetic materials such as gun powder and ammonium nitrate have a common chemistry that provides a source H and HOH. The distinguishing aspect of high explosives that gives rise to a shockwave may not be extraordinary conventional chemistry kinetics, rather the 200 times higher energy release in the formation of hydrinos may be the mechanism.
Hydrogen plasmas formed by incandescently heating of hydrogen gas in the presence of trace amounts of potassium carbonate or alkali nitrates such a KNO3 wherein the plasma demonstrated an anomalous decay when the filament power was terminated [95-97]. As shown in Figure 42, hydrogen plasma emission persisted with no electrical power input. The hydrogen plasma was generated chemically rather than by electrical discharge. The hydrino reaction is assigned the source of the chemically generated hydrogen plasma called a resonance-transfer or rt-plasma. The chemically generated plasma was energetic as evidenced by the observation of Lyman line inversion of a KNO3-H2 rt-plasma as shown in Figure 44 [60,61,74-76].
α

101
Figure 42. Balmer emission of the cell as a function of time while a filament current was turned off and on. The plasma decay with no electric field present followed the decay of atomic hydrogen from the filament dissociator. Upon restoration of the filament temperature, dissociation and the plasmas resumed (note emission scale is plotted negative relative to zero).
Figure 43. EUV spectra (900–1300 Å) of the cell emission from hydrogen microwave plasma (dotted line) and the KNO3-H2 rt-plasma (solid line) with an inverted Lyman population.
Exchange reactions of the anions between an alkali hydroxide and halide (e.g. Cu(OH)2 + FeBr2) as well as dehydration reactions of metal oxyhydroxides (e.g. FeOOH) create HOH catalyst and H as transient species that react to form hydrinos. As shown in Figures 44A-B these hydrino
α
off
Interference filter Ha
lmax = 652 nm, FWHM 7 nmon
time [sec]
emis
sion
inte
nsity
[arb
. uni
ts]
0 10 20 30 40 50
0
-1
-2
-3
-4
-5

102
solid fuels release thermal energy in significant excess than possible according to enthalpy balance due to conventional known chemical reactions [77] as independently validated by scientists at Perkin Elmer, Setaram, University of Illinois, University of Norte Dame, and Auburn University [79]. Hydrino products are observed by multiple analytical techniques [78].

103
Figures 44A-B. (A) Differential scanning calorimetry (DSC) (Setaram DSC131) performed on Cu(OH)2 + CuBr2 by Setaram. The theoretical energy was -39.8 J/g based on the limiting reagent
such that the DSC exothermic energy of -323.1 J/g corresponded to an energy gain of 8.1 times the maximum theoretical from conventional chemistry. (B) Duplicate DSC performed on Cu(OH)2 + CuBr2 by Setaram. The theoretical energy was -39.8 J/g based on the limiting reagent such that
the DSC exothermic energy of -430.9 J/g corresponded to an energy gain of 10.8 times the maximum theoretical from conventional chemistry.
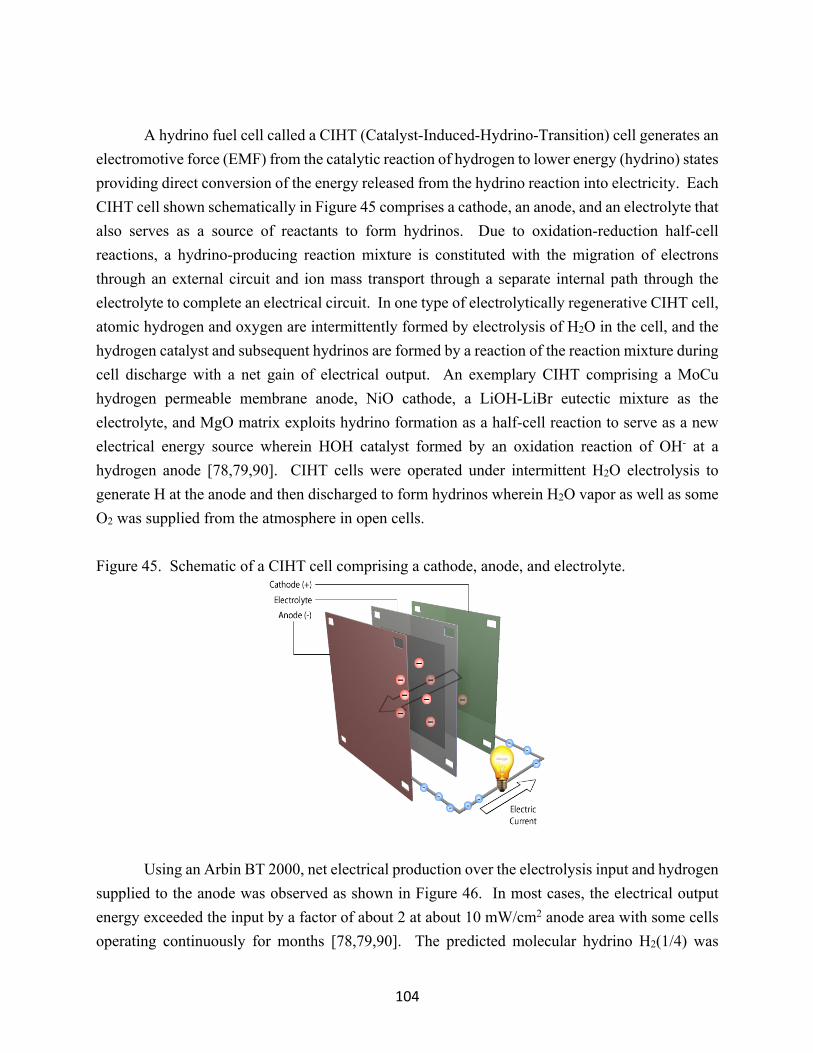
104
A hydrino fuel cell called a CIHT (Catalyst-Induced-Hydrino-Transition) cell generates an
electromotive force (EMF) from the catalytic reaction of hydrogen to lower energy (hydrino) states providing direct conversion of the energy released from the hydrino reaction into electricity. Each CIHT cell shown schematically in Figure 45 comprises a cathode, an anode, and an electrolyte that also serves as a source of reactants to form hydrinos. Due to oxidation-reduction half-cell reactions, a hydrino-producing reaction mixture is constituted with the migration of electrons through an external circuit and ion mass transport through a separate internal path through the electrolyte to complete an electrical circuit. In one type of electrolytically regenerative CIHT cell, atomic hydrogen and oxygen are intermittently formed by electrolysis of H2O in the cell, and the hydrogen catalyst and subsequent hydrinos are formed by a reaction of the reaction mixture during cell discharge with a net gain of electrical output. An exemplary CIHT comprising a MoCu hydrogen permeable membrane anode, NiO cathode, a LiOH-LiBr eutectic mixture as the electrolyte, and MgO matrix exploits hydrino formation as a half-cell reaction to serve as a new electrical energy source wherein HOH catalyst formed by an oxidation reaction of OH- at a hydrogen anode [78,79,90]. CIHT cells were operated under intermittent H2O electrolysis to generate H at the anode and then discharged to form hydrinos wherein H2O vapor as well as some O2 was supplied from the atmosphere in open cells. Figure 45. Schematic of a CIHT cell comprising a cathode, anode, and electrolyte.
Using an Arbin BT 2000, net electrical production over the electrolysis input and hydrogen supplied to the anode was observed as shown in Figure 46. In most cases, the electrical output energy exceeded the input by a factor of about 2 at about 10 mW/cm2 anode area with some cells operating continuously for months [78,79,90]. The predicted molecular hydrino H2(1/4) was

105
spectroscopically identified as a product of CIHT cells [78,90]. The CIHT cell electrical power was independently validated by Dr. Nick Glumac, University of Illinois; Dr. Terry Copeland, CEO Altair Nanotechnologies, Inc.; Dr. Henry Weinberg, California Institute of Technology; a Sanmina SCI team; Dr. K. V. Ramanujachury, Rowan University, and an Enser Corporation team [79]. Figure 46. The charge and discharge voltages, discharge accumulated electrical charge, and discharge energies over time of the CIHT cell [MoCu/LiOH-LiBr/NiO].
Time-of-flight secondary ion mass spectroscopy (ToF-SIMS) and electrospray ionization time-of-flight mass spectroscopy (ESI-ToFMS) of K2CO3-KCl getter exposed to hydrino gas H2(1/4) from a CIHT cell and a white polymeric compound isolated from an electrolysis cell having a Ni cathode, a platinized titanium anode, and aqueous K2CO3 electrolyte showed multimer clusters of the getter or electrolyte compounds with di-hydrogen as part of the structure, M:H2 (M = KOH or K2CO3) [78,98]. Specifically, K+(H2:K2CO3)n and K+(H2:KOH)n consistent with H2(1/p) as a complex in the structure were observed in the positive ion spectra wherein the high-resolution mass and the isotopic abundance of 39K and 41K as well as 35Cl and 37Cl were considered for the assignment of peaks having nominal mass m/e = M + 2. These clusters were not observed in controls comprising the getter exposed to H2 or starting electrolyte. An exemplary ToF-SIMS spectrum of K2CO3-KCl (30:70 wt%) getter exposed to H2(1/4) gas from a 5 W stack of 10 CIHT cells comprising [Mo/LiOH-LiBr-MgO/NiO] that output 1029 Wh at 137% gain is shown in Figures 47A-C. This sample also showed an upfield shifted NMR peak (Figure 6). Both spectral results identify molecular hydrino complexed to the getter compound. Similar M:H2 clusters were observed by ESI-ToFMS as given in Table 17. The observation of positive fragments comprising M + 2 multimer units such as and (n is an integer) using ToF-
SIMS and ESI-ToF recorded on K2CO3 and KOH samples only following exposure to a molecular
K + H2 :K2CO3⎡⎣ ⎤⎦n K + H2 :KOH⎡⎣ ⎤⎦n

106
hydrino gas source (Figures 47A-C and Table 17) demonstrated the ability of molecular hydrino to complex to inorganic compounds comprising oxyanions. Figures 47A-C. ToF-SIMS spectra of K2CO3-KCl (30:70 wt%) getter from a 5 W CIHT cell comprising [Mo/LiOH-LiBr-MgO/NiO] showing getter fragmentation ions comprising di-hydrogen. (A) Positive ToF-SIMS, m/e = 90 to 100 region. (B) Positive ToF-SIMS, m/e = 0 to 200 region. (C) Positive ToF-SIMS, m/e = 200 to 1000 region.
(A)
(B)
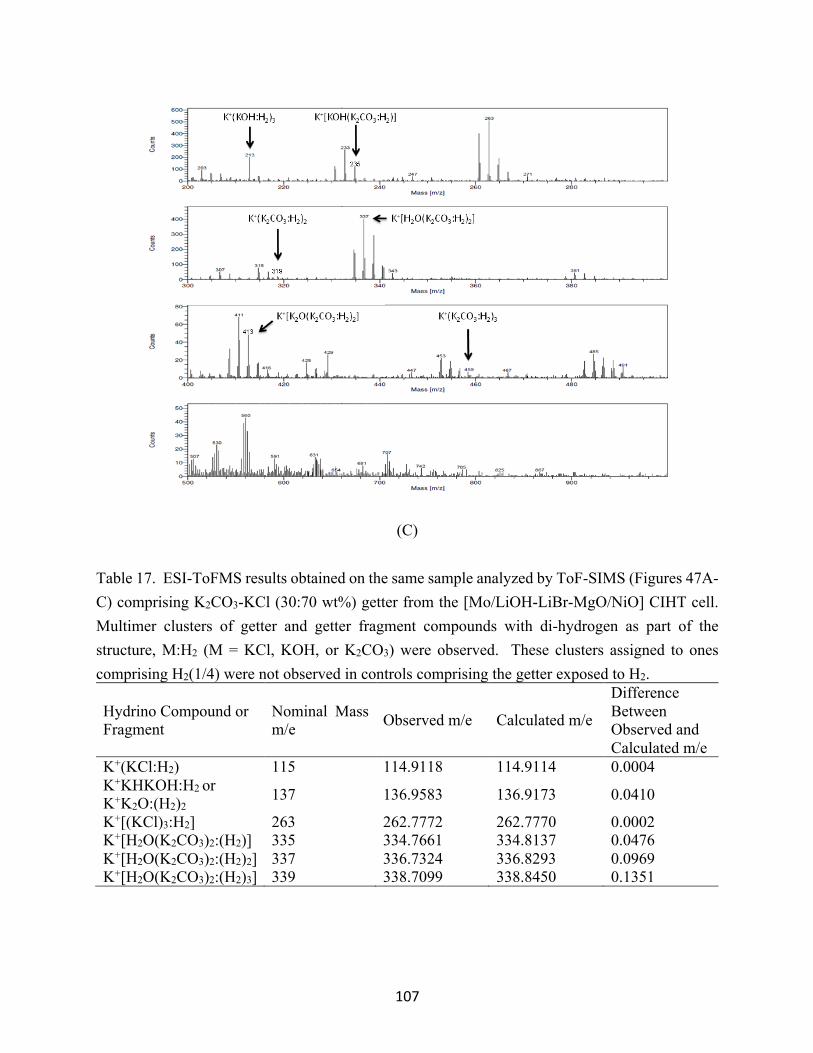
107
(C)
Table 17. ESI-ToFMS results obtained on the same sample analyzed by ToF-SIMS (Figures 47A-C) comprising K2CO3-KCl (30:70 wt%) getter from the [Mo/LiOH-LiBr-MgO/NiO] CIHT cell. Multimer clusters of getter and getter fragment compounds with di-hydrogen as part of the structure, M:H2 (M = KCl, KOH, or K2CO3) were observed. These clusters assigned to ones comprising H2(1/4) were not observed in controls comprising the getter exposed to H2.
Hydrino Compound or Fragment
Nominal Mass m/e Observed m/e Calculated m/e
Difference Between Observed and Calculated m/e
K+(KCl:H2) 115 114.9118 114.9114 0.0004 K+KHKOH:H2 or K+K2O:(H2)2 137 136.9583 136.9173 0.0410
K+[(KCl)3:H2] 263 262.7772 262.7770 0.0002 K+[H2O(K2CO3)2:(H2)] 335 334.7661 334.8137 0.0476 K+[H2O(K2CO3)2:(H2)2] 337 336.7324 336.8293 0.0969 K+[H2O(K2CO3)2:(H2)3] 339 338.7099 338.8450 0.1351

108
The extraordinary power density produced by the hydrino reaction run in a 2-liter Pyrex SunCell® is evident from the observed extreme Stark broadening of the H alpha line of 1.3 nm shown in Figure 48. The broadening corresponds to an electron density of 3.5X10²³/m3. The SunCell® gas density was calculated to be 2.5X1025 atoms/m3 based on an argon-H2 pressure of 800 Torr and temperature of 3000K. The corresponding ionization fraction was about 10%. Given that argon and H2 have ionization energies of about 15.5 eV and a recombination lifetime of less than 100 us at high pressure, the power density to sustain the ionization is
. Stark broadening of
similar magnitude was reported previously in high current detonation of hydrino reaction mixtures [8]. Figure 48. High-resolution visible spectrum of the 800 Torr argon-hydrogen plasma maintained by the hydrino reaction in a Pyrex SunCell® showing a Stark broadening of 1.3 nm corresponding to an electron density of 3.5X10²³/m3 and a 10% ionization fraction requiring about 8.7 GW/m3 to maintain.
The power balances of SunCells® were independently measured by three experts using molten metal bath and water bath calorimetry. Molten metal calorimetry tests were performed on four-inch cubical or six-inch spherical stainless-steel plasma cells, each incorporating an internal mass of liquid gallium or Galinstan which served as a molten metal bath for calorimetric determination of the power balance of a hydrino plasma reaction maintained in the plasma cell. The molten metal also acted as cathode in formation and operation of the very-low voltage, high-
P = 3.5X10²³electrons
m3
⎛⎝⎜
⎞⎠⎟
15.5 eV( ) 1.6X10⁻¹⁹ JeV
⎛⎝⎜
⎞⎠⎟
110−4 s
⎛⎝⎜
⎞⎠⎟= 8.7 X10⁹W
m3

109
current plasma while a tungsten electrode acted as the anode when electrical contact was made between the electrodes by electromagnetic pump injection of the molten metal from the cathode to anode. The plasma formation depended on the injection of either 2000 sccm H2/20 sccm O2 or 3000 sccm H2/50 sccm O2. The excess powers in the range of 197 kW to 273 kW with gains in the range of 2.3 to 2.8 times the power to maintain the hydrogen plasma reactions are given in the Tables 18-19. There was no chemical change observed in cell components as determined by energy dispersive X-ray spectroscopy (EDS). The power from the combustion of the H2/ 1%O2 fuel and HOH catalyst source was negligible (16.5 W for 50 sccm O2 flow) and occurred outside of the cell. Thus, the theoretical maximum excess power from conventional chemistry was zero.
Water bath calorimetry (WBC) can be a highly accurate method of energy measurement due to its inherent ability for complete capture and precise qualification of the released energy. However, submersion of the SunCell® in a water bath lowers its wall temperature significantly relative to operation in air. The hydrino reaction rate increases with temperature, current density, and wall temperature wherein the latter facilitates a high molecular hydrino permeation rate through the wall to avoid product inhibition. In order to evaluate the absolute output energy produced by SunCells® while maintaining favorable operating conditions of high gallium and wall temperatures, the cell was operated suspended on a cable for the duration of a power production phase, and then the cell was lowered into a water bath using an electric winch [99]. The thermal inventory of the entire submerged cell assembly was transferred to the water bath in the form of an increase in the water temperature and steam production. Following equilibration of the cell temperature to that of the water bath, the cell was hoisted from the water bath and the increase in thermal inventory of the water bath was quantified by recording the bath temperature rise and the water lost to steam by measuring the water weight loss. The water bath calorimetry comprising a lever system with a counter balancing water tank and a digital scale to accurately measure the water loss to steam is shown in Figure 49.

110
Figure 49. A schematic of a water bath calorimetric system.
These WBC tests also featured cylindrical cells, each incorporating an internal mass of liquid gallium which served as a molten metal reservoir with a corresponding thermal sink. The molten gallium also acted as an electrode in the formation and operation of the very-low voltage, high-current hydrino-reaction-driven plasma while a tungsten electrode acted as the opposing electrode when electrical contact was made between the electrodes by electromagnetic pump injection of the molten metal from the reservoir to the W electrode. The plasma formation depended on the injection of hydrogen gas with about 8% oxygen gas and the application of high current at low voltage using a DC power source. The excess powers in the range of 273 kW to 342 kW with gains in the range of 3.9 to 4.7 times the power to maintain the hydrogen plasma reactions are given in the Tables 20-22. There was no chemical change observed in cell components as determined by energy dispersive X-ray spectroscopy (EDS) performed on the gallium following the reaction. The power from the combustion of the H2/ 8% O2 fuel and HOH catalyst source was limited by the trace oxygen and was negligible. The input power from the EM pump power was also negligible. Table 18. Dr. Mark Nansteel validated 273 kW of power produced by a hydrino plasma reaction maintained in a SunCell® using molten metal bath calorimetry [100]. Duration (s) Input
Energy (kJ)
Output Energy
(kJ)
Input Power (kW)
Output Power (kW)
Power Gain
Net Excess Power (kW)
1.27 212.9 485.8 167.6 382.5 2.28 273

111
Table 19. Dr. Randy Booker and Dr. Stephen Tse validated 200 kW of power produced by a hydrino plasma reaction maintained in a SunCell® using molten metal bath calorimetry [101]. Duration (s) Input
Energy (kJ)
Output Energy
(kJ)
Input Power (kW)
Output Power (kW)
Power Gain
Net Excess Power (kW)
2.917 422.1 1058.1 144.7 362.8 2.51 218.1
5.055 554.7 1548.1 109.7 306.25 2.79 196.5 Table 20. Dr. Randy Booker validated 296 kW of power produced by a hydrino plasma reaction maintained in a SunCell® using water bath calorimetry [101]. Duration (s) Input
Energy (kJ)
Output Energy
(kJ)
Input Power (kW)
Output Power (kW)
Power Gain
Net Excess Power (kW)
2.115 193 818.4 91.2 386.9 4.24 296 Table 21. Dr. Stephen Tse validated up to 342 kW of power produced by a hydrino plasma reaction maintained in a SunCell® using water bath calorimetry [102]. Duration (s) Input
Energy (kJ)
Output Energy
(kJ)
Input Power (kW)
Output Power (kW)
Power Gain
Net Excess Power (kW)
2.115 192.95 915.35 91.2 432.8 4.74 341.6
Table 22. Dr. Mark Nansteel validated up to 273 kW of power produced by a hydrino plasma reaction maintained in an advanced tube-type SunCell® using water bath calorimetry. The power density was a remarkable 5 MW/liter [103].
Duration (s) Input Energy
(kJ)
Output Energy
(kJ)
Input Power (kW)
Output Power (kW)
Power Gain
Net Excess Power (kW)
274.9 274.9 1080.2 93.2 366.2 3.93 273.0

112
The thermal tests were further performed on cells immersed in the water bath using the water weight lost to steam production over a test duration to quantify the power balance. Each cell comprised a cylindrical 4130 Cr-Mo steel reaction chamber measuring 20 cm ID, 14.3 cm in height, and 1.25 mm thick with cylindrical reservoir attached to the base having dimensions of 5.4 cm height and 10.2 cm ID that contained 6 kg of gallium. The continuous steam power of commercial scale, quality, and power density that developed was observed to be controllable by changing temperature and glow discharge dissociation recombination of the H2 and trace O2 reactants flowed into the cell. Specially, three variations of the basic cell design allowed for testing of these operational parameters. The cell wall was coated with a ceramic coating to prevent gallium alloy formation, and the cell was operated at about 200 °C. Next, the reaction cell chamber was modified by the addition of a concentric three-layer liner comprising, from the cell wall to the plasma, (i) an outer 1.27 cm thick, full-length carbon cylinder, (ii) a 1 mm thick, full length Nb cylinder, and (ii) 4 mm thick, 10.2 mm high W plates arranged in a hexagon. The plates completely covered the region of intense plasma between the W molten metal injector electrode and the W counter electrode. The liner served as thermal insulation to increase the gallium temperature to over 400 °C and also protected the wall from the observed more intense plasma.
The cell comprising the liner was further modified with the addition of a glow discharge cell to dissociate H2 gas to atomic H and also to form HOH hydrino catalyst. The kinetically favorable high temperature reaction condition observed in the performance of the molten metal cells occurred because these cells were not water cooled. Since 1 eV temperature corresponds to 11,600 K gas temperature, the equivalent of very high reaction mixture temperature was achieved under water cooling conditions. The glow discharge cell comprised a 3.8 cm diameter stainless steel tube of 10.2 cm length that was bolted at its base to the top of the reaction cell chamber by Conflat flanges. The positive glow discharge electrode was a stainless-steel rod powered by a high-voltage feed through on top of the glow discharge cell, and the body was grounded to serve as the counter electrode. A hydrino reaction gas mixture of 3000 sccm H2 and 1 sccm O2 was flowed through the top of the discharge cell and out the bottom into the reaction cell chamber.
The power developed due to the hydrino reaction doubled from an average of 26 kW to 55.5 kW with an increase in operating temperature from ~200 °C to over 400 °C. The power was further boosted by the operation of the glow discharge cell to activate the gas reactants wherein the hydrino power was observed to about double again to 93 kW. The results are given in Table 23. The combination of elevated temperature and glow discharge activation have a dramatic effect of the excess power. The results match expectations for a catalytic chemical reaction between H and HOH catalyst.
The SunCell® was modified to a 10-inch diameter Mo-Cr cylindrical cell with a carbon/Mo/hexagonal plate liner and dual molten gallium injectors and run at high temperature

113
with 1500 A per injector. The output increased to 210 kW of hydrino plasma reaction contribution to a total continuous steam output power of 275 kW at 4.2 times gain. The power was also measured using the weight of steam produced over a test period by the SunCell® operated under continuous commercial power generation conditions, controllable by changing temperature, current, and glow discharge heating of the reactants flowed into the cell as summarized in the Table 23. Table 23. Dr. Mark Nansteel validated 210 kW of power produced by a hydrino plasma reaction maintained in a SunCell® using mass balance in the production of steam [104-105]. The hydrino reaction was shown to be dependent on operating temperature, current, and activation of the gas reactants by a glow discharge plasma.
Discharge Gallium
Temperature (°C)
Duration (s)
Input Energy (kJ)
Output Energy (kJ)
Input power (kW)
Output Power (kW)
Power Gain
Net Excess Power (kW)
Yes 196 302 10,346 16,480 34.26 54.57 1.59 20.3
Yes 177 296 9341 18,708 31.56 63.2 2 31.7
No 458 167 6951 16,264 41.62 97.39 2.34 55.8
Yes 425 200 7800 26,392 39 131.96 3.38 93
Yes 716 50 3232 10,480 65 274.2 4.22 210

114
6 Conclusion Hydrino and subsequently molecular hydrino was formed by catalytic reaction
of atomic hydrogen with the resonant energy acceptor of 3x27.2 eV, nascent H2O, wherein the reaction rate was greatly increased by applying an arc current to recombine ions and electrons formed by the energy transfer to HOH that is consequently ionized. H2(1/4) bound to metal oxides and absorbed in metallic and ionic lattices by van der Waals forces was produced by (i) high voltage electrical detonation Fe wires in an atmosphere comprising water vapor, (ii) low voltage, high current electrical detonation of hydrated silver shots, (iii) ball milling or heating hydrated alkali halide-hydroxide mixtures, and (iv) maintaining a plasma reaction of H and HOH in a so-called SunCell® comprising a molten gallium injector that electrically shorts two plasma electrodes with the molten gallium to maintain an arc current plasma state. Excess power at the 340 kW level was measured by water and molten metal bath calorimetry. Samples predicted to comprise molecular hydrino H2(1/4) product were analyzed by multiple analytical methods with results that follow.
H2(1/4) comprises an unpaired electron which enables the electronic structure of this unique hydrogen molecular state to be determined by electron paramagnetic resonance (EPR) spectroscopy. Specially, the H2(1/4) EPR spectrum comprises a principal peak with a g-factor of 2.0046386 that is split into a series of pairs of peaks with members separated by spin-orbital coupling energies that are a function of the corresponding electron spin-orbital coupling quantum numbers. The unpaired electron magnetic moment induces a diamagnetic moment in the paired electron of the H2(1/4) molecular orbital based on the diamagnetic susceptibility of H2(1/4). The corresponding magnetic moments of the intrinsic paired-unpaired current interactions and those due to relative rotational motion about the internuclear axis give rise to the spin-orbital coupling energies. The EPR spectral results confirmed the spin-orbital coupling between the spin magnetic moment of the unpaired electron and an orbital diamagnetic moment induced in the paired electron by the unpaired electron that shifted the flip energy of the spin magnetic moment. Each spin-orbital splitting peak was further sub-split into a series of equally spaced peaks that matched integer fluxon energies that are a function of the electron fluxon quantum number corresponding to the number of angular momentum components involved in the transition. The evenly spaced series of sub-splitting peaks was assigned to flux linkage in units of the magnetic flux quantum h/2e during the coupling between the paired and unpaired magnetic moments while a spin flip transition occurred. Additionally, the spin-orbital splitting increased with spin-orbital coupling quantum number on the downfield side of the series of pairs of peaks due to magnetic energies that increased with accumulated magnetic flux linkage by the molecular orbital. For an EPR frequency of 9.820295 GHz, the downfield peak positions due to the combined shifts
H2 1/ 4( )
BS /Ocombineddownfield

115
due to the magnetic energy and the spin-orbital coupling energy are
. The upfield
peak positions with quantized spin-orbital splitting energies and electron spin-orbital
coupling quantum numbers are
. The
separations of the integer series of peaks at each spin-orbital peak position are
and for electron
fluxon quantum numbers . These EPR results were first observed at TU Delft by Dr.
Hagen [72]. The pattern of integer-spaced peaks of the EPR spectrum of H2(1/4) is very similar to the
periodic pattern observed in the high-resolution visible spectrum of the hydrino hydride ion reported previously. The hydrino hydride ion comprising a paired and unpaired electron in a common atomic orbital also demonstrated the phenomena of flux linkage in quantized units of h/2e. Moreover, the same phenomena were observed when the rotational energy levels of H2(1/4) were excited by laser irradiation during Raman spectroscopy and by collisions of high energy electrons form an electron beam with H2(1/4). It is extraordinary that the EPR, Raman, and electron-beam excitation spectra give the same information about the structure of molecular hydrino in energy ranges that differ by reciprocal of the H2(1/4) diamagnetic susceptibility coefficient: 1/7X10-7 = 1.4X10⁶, wherein the induced diamagnetic orbital magnetic moment active during EPR was replaced by the orbital molecular rotational magnetic moment active during Raman and electron-beam excitation of rotational transitions.
Josephson junctions such as ones of superconducting quantum interference devices
(SQUIDs) link magnetic flux in quantized units of the magnetic flux quantum or fluxon . The
same behavior was predicted and observed for the linkage of magnetic flux by hydrino hydride ion and molecular hydrino controlled by applying specific frequencies of electromagnetic radiation
BS /Ocombineddownfield = 0.35001−m3.99427X 10−4 − 0.5( ) 2πm3.99427X 10−4( )2
0.1750
⎛
⎝⎜⎜
⎞
⎠⎟⎟T
BS /Oupfield ES /O
m = 0.5,1,2,3,5....
BS /Oupfield = 0.35001 1+m 7.426 X 10⁻²⁷ J
h9.820295GHz⎡
⎣⎢
⎤
⎦⎥
⎛
⎝⎜⎞
⎠⎟T = 0.35001+m3.99427X 10−4( )T
ΔBΦ
ΔBΦdownfield = 0.35001−m3.99427X 10−4 − 0.5( ) 2πm3.99427X 10−4( )2
0.1750
⎛
⎝⎜⎜
⎞
⎠⎟⎟mΦ5.7830 X 10⁻²⁸ Jh9.820295GHz
⎡
⎣⎢
⎤
⎦⎥ X 104G
ΔBΦupfield = 0.35001+m3.99427X 10−4( ) mΦ5.7830 X 10⁻²⁸ J
h9.820295GHz⎡
⎣⎢
⎤
⎦⎥ X 104G
mΦ = 1,2,3
h2e

116
over the range of microwave to ultraviolet. The hydrino species such as H2(1/4) is enabling of a computer logic gate or memory element that operates at even elevated temperature versus cryogenic ones and may be a single molecule 43 or 64 times smaller than molecular hydrogen.
Molecular hydrino comprising a magnetic hydrogen molecule enables many other applications in other fields as well. A gaseous contrast agent in magnetic resonance imaging (MRI) is but one example. Specifically, the exemplary Raman transition rotation is about a semiminor axis perpendicular to the internuclear axis. The intrinsic electron spin angular momentum aligns either parallel or perpendicular to the corresponding molecular rotational angular momentum along the molecular rotational axis, and a concerted rotation of the spin current occurs during the molecular rotational transition. The interaction of the corresponding magnetic moments of the intrinsic spin and the molecular rotation give rise to the spin-orbital coupling energies that are a function of the spin-orbital quantum number. The Raman spectral results confirmed the spin-orbital coupling between the spin magnetic moment of the unpaired electron and the orbital magnetic moment due to molecular rotation. The energies of the rotational transitions were shifted by these spin-orbital coupling energies as a function of the corresponding electron spin-orbital coupling quantum numbers. Molecular rotational peaks shifted by spin-orbital energies are further shifted by fluxon linkage energies with each energy corresponding to its electron fluxon quantum number dependent on the number of angular momentum components involved in the rotational transition. The observed sub-splitting or shifting of Raman spectral peaks was assigned to flux linkage in units of the magnetic flux quantum h/2e during the spin-orbital coupling between spin and molecular rotational magnetic moments while the rotational transition occurred.
All the novel lines recorded on Ni foil samples (e.g. Figure 9) matched the novel lines matched those of (i) either the pure to rotational transition with spin-
orbital coupling and fluxon coupling:
, (ii) the
concerted transitions comprising the to rotational transitions with the to
spin rotational transition: , or
(iii) the double transitions for final rotational quantum numbers and
. Corresponding spin-orbital
coupling and fluxon coupling were also observed with the pure, concerted, and double transitions.
H2 1/ 4( ) J = 0 J ' = 3
EEmission = ΔEJ=0→J '=3 + ES /O ,rot + EΦ,rot = 11701 cm−1 +m528 cm−1 +mΦ31 cm−1
J = 0 J ' = 2,3 J = 0
J = 1EEmission = ΔEJ=0→J '=2(3) + ΔEJ=0→1 + ES /O ,rot + EΦ,rot
= 7801 cm−1 13,652 cm−1( )+m528 cm−1 +mΦ3/2 46 cm−1
J p' = 2 Jc
' = 1
EEmission = ΔEJ=0→J p
' =2+ ΔE
J=0→Jc' =1
+ ES /O ,rot + EΦ,rot
= 9751 cm−1 +m528 cm−1 +mΦ31 cm−1 +mΦ3/2 46 cm−1

117
Predicted H2(1/4) emission lines having energies 16,000 cm-1 to 17,900 cm-1 region were observed in observed in the 12,250-15,000 cm-1 region of 325 nm Raman spectra recorded on Ni foils exposed to the hydrino reaction plasma as well as the hydrino complex GaOOH:H2(1/4):H2O. All the novel lines matched emission due to the double transition for rotational quantum numbers (Eq. (38)) with spin-orbital coupling and fluxon linkage splittings:
. Forty-five of the
observed Raman lines match those of unassignable astronomical lines associated with the interstellar medium called diffuse interstellar bands (DIBs) [27]. The assignment of all the 380 DIBs listed by Hobbs [27] to H2(1/4) rotational transitions with spin-orbital splitting and fluxon sub-splitting are given in the Appendix. Molecular hydrino rotational transitional energies cover a broad range of frequencies from infrared to ultraviolet which enables molecular lasers spanning the corresponding wavelengths.
The rotational energies are dependent on the reduced mass which changed by a factor of 3/4 upon substitution of one deuteron for one proton of molecular hydrino H2(1/4) to form HD(1/4). The rotational energies of the HD(1/4) Raman spectrum shifted relative to that of H2(1/4) as predicted. All the novel lines matched those of (i) either the pure HD(1/4) to rotational transition with spin-orbital coupling and fluxon coupling:
,
(ii) the concerted transitions comprising the to rotational transitions with the
to spin rotational transition: ,
or (iii) the double transition for final rotational quantum numbers :
. Corresponding spin-orbital
coupling and fluxon coupling were also observed with both the pure and concerted transition. It was observed by Raman spectroscopy on magnetic samples Fe2O3 and FeOOH that
H2(1/4) showed a series of SQUID-like fluxon transitions of a single rotational and spin-orbital spilt level (e.g. Figure 18). Ni foil samples run at a temperature above the Ni Curie temperature switched from discrete rotational transitions slit by spin-orbital and fluxon linkage transitions to a series of fluxon transitions of a single rotational and spin-orbital spilt level (e.g. Figure 21) that matches the spectra of magnetic Fe2O3 and FeOOH samples. These unique one/zero-type
J p' = 3;Jc
' = 1,2
EEmission = ΔEJ=0→J p
' =3+ ΔE
J=0→Jc' =1(2)
+ ES /O ,rot + EΦ,rot
= 15,602 cm−1 19,502 cm−1( )+m528 cm−1 +mΦ31 cm−1 +mΦ3/2 46 cm−1
J = 0 J ' = 3,4
EEmission = ΔEJ=0→J '=3(4) + ES /O ,rot + EΦ,rot = 8776 cm−1 14,627 cm−1( )+m528 cm−1 +mΦ31 cm−1
J = 0 J ' = 3 J = 0
J = 1EEmission = ΔEJ=0→J '=3 + ΔEJ=0→1 + ES /O ,rot + EΦ,rot = 10,239 cm−1
+m528 cm−1 +mΦ3/2 46 cm−1
J p' = 3; Jc
' = 1
EEmission = ΔEJ=0→J p
' =3+ ΔE
J=0→Jc' =1
+ ES /O ,rot + EΦ,rot
= 11,701 cm−1 +m528 cm−1 +mΦ31 cm−1 +mΦ3/2 46 cm−1
118
magneto-optical signals are enabling of computer logic gate or memory element applicants wherein the application of a magnetic field to magnetize the matrix comprising embedded molecular hydrino such as H2(1/4) or a change in magnetic flux activates the computer logic gate or memory element such as optical ones. The fast speed magnetization switching such as that achieved with applied electric current or laser opto-magnetic interactions by ultrafast lasers [106] is enabling of a fast processor wherein the fluxon series can encode the information that may be read by an infrared, visible, or UV laser as a detector signal.
Akin to the case of molecular hydrino H2(1/4) trapped in a GaOOH lattice that serves as cages for essentially free gas EPR spectra, H2(1/4) in a noble gas mixture provides an interaction-free environment to observe ro-vibrational spectra. H2(1/4)-noble gas mixtures that were irradiated with high energy electrons of an electron beam showed equal, 0.25 eV spaced line emission in the ultraviolet (150-180 nm) region with a cutoff at 8.25 eV that matched the H2(1/4) to vibrational transition with a series of rotational transitions corresponding to the H2(1/4) P-branch.
The spectral fit was a good match to . wherein
0.515 eV and 0.01509 eV are the vibrational and rotational energies of ordinary molecular hydrogen, respectively. In addition, small satellite lines were observed that matched the rotational spin-orbital splitting energies that were also observed by Raman spectroscopy. The rotational spin-orbital splitting energy separations matched wherein 1.5 involves the
and splittings. The spectral emission of the H2(1/4) P-branch rotational transitions with the to
vibrational transition was also observed by electron beam excitation of H2(1/4) trapped in a KCl crystalline matrix. The rotational peaks matched those of a free rotor, whereas the vibrational energy was shifted by the increase in the effective mass due to interaction of the vibration of H2(1/4) with the KCl matrix. The spectral fit was a good match to
comprising peaks spaced at 0.25 eV. The relative
magnitude of the H2(1/4) vibrational energy shift matched the relative effect on the ro-vibrational spectrum caused by ordinary H2 being trapped in KCl.
Using Raman spectroscopy with a high energy laser, a series of 1000 cm-1 (0.1234 eV) equal-energy spaced Raman peaks were observed in the 8000 cm-1 to 18,000 cm-1 region wherein conversion of the Raman spectrum into the fluorescence or photoluminescence spectrum revealed a match as the ½ -energy ro-vibrational spectrum of H2(1/4) corresponding to the e-beam excitation emission spectrum of H2(1/4) in a KCl matrix given by
and comprising the matrix shifted to
ν = 1 ν = 0
420.515eV − 42 J +1( )0.01509;J = 0,1,2,3...
m528 cm−1 m = 1,1.5m = 0.5 m = 1
ν = 1 ν = 0
5.8eV − 42 J +1( )0.01509;J = 0,1,2,3...
5.8eV − 42 J +1( )0.01509eV ;J = 0,1,2,3... ν = 1 ν = 0

119
vibrational transition with 0.25 eV energy-spaced rotational transition peaks. Due to the unique electronic structure of H2(1/4) comprising a paired and an unpaired electron in the H2(1/4) molecular orbital (MO) requiring spin ½ conservation during vibrational transitions, the corresponding energy levels matched theoretical predictions of ro-vibration states of molecular hydrino with excitation and decay involving two-photons, each of ½ the energy of the ro-vibrational state. These results support the potential of H2(1/4) neutrino emission and absorption (Eq. (48)) serving as a means for communication (e.g. a neutrino telecommunication system wherein H2(1/p) serves as a neutrino emitter corresponding to a signal transmitter and a neutrino absorber resulting in partial internal conversion to 2-photon emission to a photodetector corresponding to a receiver). The cross section of neutrinos, and especially low-energy neutrinos, toward any form of interaction such as nuclear reactions is essentially zero such that neutrino signals may be transmitted through any form of solid matter including through the Earth thereby eliminating the dependence on satellites and telecommunication towers.
Infrared transitions of H2(1/4) are forbidden because of its symmetry that lacks an electric dipole moment. However, it was observed that application of a magnetic field in addition to an intrinsic magnetic field permitted molecular rotational infrared excitation by coupling to the aligned magnetic dipole of H2(1/4). Coupling with spin-orbital transitions also allowed the transitions. The ability of interactions with a crystalline site to permit H2(1/4) to be FTIR active due to an induced dipole was tested by embedding H2(1/4) in a KI lattice. A major sharp peak was observed by FTIR on KI:H2(1/4) at 1943 cm-1 that matched near identically the to H2(1/4) rotational transition of H2(1/4). Other sharp peaks in the FTIR spectrum matched this rotational transition with spin-orbital and fluxon linkage splitting.
The allowed double ionization of H2(1/4) by the Compton effect corresponding to the total energy of 496 eV was observed by X-ray photoelectron spectroscopy (XPS) on samples comprising H2(1/4) due the reaction of H with HOH with incorporation in crystalline inorganic and metallic lattices.
H2(1/4) was further observed by gas chromatography that showed a gas from hydrino producing reactions with a faster migration rate than that of any known gas considering that hydrogen and helium have the fastest prior known migration rates and corresponding shortest retention times. Molecular hydrino may serve as a cryogen, a gaseous heat transfer agent, and an agent for buoyancy.
Extreme ultraviolet (EUV) spectroscopy recorded extreme ultraviolet continuum radiation with a 10.1 nm cutoff corresponding to the hydrino reaction transition H to H(1/4) catalyzed by HOH catalyst.
MAS NMR of molecular hydrino trapped in protic matrix represents a means to exploit the unique magntic characteristic of molecular hydrino for its identification via its interaction with the
J = 0 J ' = 1

120
matrix. A unique consideration regarding the NMR spectrum is the possible molecular hydrino quantum states. Proton magic-angle spinning nuclear magnetic resonance spectroscopy (1H MAS NMR) recorded an upfield matrix-water peak in the -4 ppm to -5 ppm region, the signature of the unpaired electron of molecular hydrino and the resulting magnetic moment.
Molecular hydrino may give rise to bulk magnetism such as paramagnetism, superparamagnetism and even ferromagnetism when the magnetic moments of a plurality of hydrino molecules interact cooperatively. Superparamagnetism was observed using a vibrating sample magnetometer to measure the magnetic susceptibility of compounds comprising molecular hydrino.
Complexing of H2(1/4) gas to inorganic compounds comprising oxyanions such a K2CO3 and KOH was confirmed by the unique observation of M + 2 multimer units such as
and wherein n is an integer by exposing K2CO3 and KOH to
a molecular hydrino gas source and running time of flight secondary ion mass spectroscopy (ToF-SIMS) and electrospray time of flight secondary ion mass spectroscopy (ESI-ToF), and the hydrogen content was identified as H2(1/4) by other analytical techniques. In addition to inorganic polymers such as , the ToF-SIMS spectra showed an intense peak due to
the stability of hydrino hydride ion. HPLC showed inorganic hydrino compounds behaving like organic molecules as
evidenced by a chromatographic peak on an organic molecular matrix column that fragmented into inorganic ions.
Signatures of the high energetics and power release of the hydrino reaction were evidenced by (i) extraordinary Doppler line broadening of the H Balmer a line of over 100 eV in plasmas that comprised H atoms and HOH or H catalyst such as argon-H2, H2, and H2O vapor plasmas, (ii) H excited state line inversion, (iii) anomalous H plasma afterglow duration, (iv) shockwave propagation velocity and the corresponding pressure equivalent to about 10 times more moles of gunpowder with only about 1% of the power coupling to the shockwave, (v) optical power of up to 20 MW, and (vi) calorimetry of hydrino solid fuels, hydrino electrochemical cells, and the SunCell® wherein the latter was validated at a power level of 340,000 W. The H inversion, optical, and shock effects of the hydrino reaction have practical applications of an atomic hydrogen laser, light sources of high power in the EUV and other spectral regions, and novel more powerful and non-sensitive energetic materials, respectively. The power balance was measured by the change in the thermal inventory of a water bath. Following a power run of a duration limited by nearly reaching the melting point of SunCell® components, the heat of the SunCell® was transferred to a water bath, and the increase in thermal inventory of the water bath was quantified by recording the bath temperature rise and the water lost to steam by measuring the water weight loss. The SunCell®
K + H2 :K2CO3⎡⎣ ⎤⎦n K + H2 :KOH⎡⎣ ⎤⎦n
K + H2 :K2CO3⎡⎣ ⎤⎦n H −

121
was fitted to continuously operate with water bath cooling, and the continuous excess power due to the hydrino reaction was validated at a level of 210 kW.
These analytical tests confirm the existence of hydrino, a smaller more stable form of hydrogen formed by the release of power at power densities exceeding that of other known power sources. Brilliant Light Power is developing the proprietary SunCell® to harness this green power source, initially for thermal applications, and then electrical. The energetic plasma formed by the hydrino reaction enables novel direct power conversion technologies in addition to conventional Rankine, Brayton, and Stirling cycles [108-111]. A novel magnetohydrodynamic cycle has potential for electrical power generation at 23 MW/liter power densities at greater than 90% efficiency [107].
122
Appendix The pure, concerted, and double transition rotational transition energies of H2(1/4) are given in Table 6. The rotational energies of all the 380 DIBs lines reported by Hobbs et
al. [27] each match either (i) the pure to rotational transition (Eq. (32))
with spin-orbital coupling energy (Eq. (22)) and fluxon linkage energy (Eq. (24)):
(A.1)
(ii) the concerted transition comprising the to rotational transitions with the to spin rotational transition (Eq. (34)). Corresponding spin-orbital coupling energy (Eq. (22)) and fluxon linkage energy (Eq. (23)) were also observed with the concerted transition:
(A.2)
or (iii) the double transition for final rotational quantum numbers (Eq. (38)) and
with energies given by the sum of the independent transitions:
(A.3)
The DIBs lines assigned to rotational transitions are given in Table A.1. Additionally,
the very low energy separation of lines with the same rotational, spin-orbital and fluxon linkage quantum numbers may be due to the magnetic energies arising from at least one of the
absorption of the integer number of fluxons having fluxon linkage quantum numbers of (Eq. (25)) and (Eq. (26)) and the coupling energy wherein the fluxon
linkage energy decreases due to coupling to the spin-orbital coupling (Eq. (46). In cold regions of interstellar space, [H2(1/4)]2 dimer electron spin flip transitions of 0.797 cm-1 (Mills Eq. (16.244) [1]), [H2(1/4)]2 dimer rotational splitting of 44.3 cm-1 (Mills Eq. (16.276) [1]), or the [H2(1/4)]2 vibration dissociation separation of 8.991 cm-1 (Mills Eq. (16.205) [1]) may be the source of energy shifts.
H2 1/ 4( ) EEmissionH2 1/ 4( ) J = 0 J ' = 3,4
EEmission = ΔEJ=0→J '=3(4) + ES /O ,rot + EΦ,rot
= 11,701 cm−1 + 19,502 cm−1( )+m528 cm−1 +mΦ31 cm−1
J = 0 J ' = 3,4 J = 0J = 1
EEmission = ΔEJ=0→J '=3(4) = EJ=0→1 + ES /O ,rot + EΦ,rot
= 13,652 cm−1 21,453 cm−1( )+m528 cm−1 +mΦ3/2 46 cm−1
J p' = 3;Jc
' = 1
J p' = 4;Jc
' = 1
EEmission = ΔEJ=0→J p
' =3(4)+ ΔE
J=0→Jc' =1
+ ES /O ,rot + EΦ,rot
= 15,602 cm−1 23,403 cm−1( )+m528 cm−1 +mΦ31 cm−1 +mΦ3/2 46 cm−1
H2 1/ 4( )
US /OMag
jmΦ3/2 = 1 mΦ = 1 ES /O−Φ3/2

123
Table A.1. H2(1/4) rotational assignments of 380 DIBs [27]. The theoretical rotational energy assignments are according to the energies given in Table 6. The quantum numbers corresponding to spin-orbital splitting and fluxon sub-splitting of the assigned parent peaks are and , and
respectively, having energies given in Table 5. Delta is the difference between the observed
and theoretical lines. DIB (Å)
DIB (cm-1)
Rotational Energy (cm-1)
Theoretical (cm-1)
Delta (cm-1)
4259.01 23480 23403 1.5 23472 7 4363.86 22915 21453 2.5 3.0 22911 4 4428.19 22583 21453 2.0 1.5 22578 5 4501.79 22213 21453 1.5 -0.5 22222 -8 4659.82 21460 21453 21453 7 4668.65 21419 21453 -0.5 21430 -10 4680.2 21367 21453 -2.0 21361 6 4683.03 21354 21453 -2.0 21361 -7 4688.89 21327 21453 -0.5 3.0 21328 -1 4726.83 21156 21453 -0.5 -1.0 21143 13 4734.79 21120 21453 -0.5 -1.5 21120 1 4762.61 20997 21453 -1.0 1.5 20995 2 4780.02 20920 21453 -1.0 20925 -5 4817.64 20757 21453 -1.5 2.0 20754 3 4879.96 20492 21453 -2.0 2.0 20490 2 4887.14 20462 21453 -2.0 1.5 20467 -5 4947.38 20213 21453 -2.5 1.5 20203 10 4951.12 20197 21453 -2.5 1.5 20203 -5 4959.63 20163 21453 -2.5 0.5 20157 6 4961.95 20153 21453 -2.5 0.5 20157 -3 4963.88 20146 21453 -2.5 0.5 20157 -11 4965.22 20140 21453 -2.5 20133 7 4966.01 20137 21453 -2.5 20133 3 4969.14 20124 21453 -2.5 20133 -9 4979.61 20082 21453 -2.5 -1.0 20087 -5 4982.14 20072 19502 1.0 1.5 20076 -4 4984.79 20061 19502 1.0 1.0 20061 0 4987.42 20050 19502 1.0 0.5 20045 5 5003.58 19986 19502 1.0 -1.5 19984 2 5027.47 19891 19502 0.5 4.0 19889 1 5054.84 19783 19502 0.5 0.5 19781 2 5061.49 19757 19502 0.5 19766 -9 5074.47 19706 19502 0.5 -2.0 19704 2 5092.09 19638 19502 0.5 -4.0 19643 -4 5100.95 19604 19502 3.0 19594 10 5110.89 19566 19502 2.0 19564 2
m mΦ
mΦ3/2
m mΦ mΦ3/2

124
5117.62 19540 19502 1.0 19533 8 5133.14 19481 19502 -0.5 19487 -5 5137.07 19466 19502 -1.0 19471 -5 5170.49 19341 19502 -0.5 3.0 19331 10 5176.04 19320 19502 -0.5 3.0 19331 -11 5178.1 19312 19502 -0.5 2.5 19315 -3 5217.85 19165 19502 -0.5 -2.5 19161 4 5229.76 19121 19502 -0.5 -4.0 19115 7 5236.18 19098 19502 -1.0 4.0 19097 0 5245.48 19064 19502 -1.0 3.0 19067 -3 5251.78 19041 19502 -1.0 2.0 19036 5 5257.47 19021 19502 -1.0 1.5 19020 0 5262.48 19002 19502 -1.0 1.0 19005 -3 5297.97 18875 19502 -1.0 -3.0 18882 -7 5304.25 18853 19502 -1.0 -4.0 18851 2 5340.38 18725 19502 -1.5 0.5 18726 0 5342.54 18718 19502 -1.5 18710 7 5358.75 18661 19502 -1.5 -1.5 18664 -3 5363.7 18644 19502 -1.5 -2.0 18649 -5 5371.28 18618 19502 -1.5 -3.0 18618 0 5384.19 18573 19502 -2.0 4.0 18570 3 5390.85 18550 19502 -2.0 3.0 18539 11 5395.64 18533 19502 -2.0 3.0 18539 -5 5404.56 18503 19502 -2.0 2.0 18508 -5 5418.87 18454 19502 -2.0 0.5 18462 -8 5424.1 18436 19502 -2.0 -0.5 18431 5 5433.5 18404 19502 -2.0 -1.5 18400 4 5450.62 18347 19502 -2.0 -3.0 18354 -7 5480.79 18246 19502 -2.5 2.0 18244 1 5487.69 18223 19502 -2.5 1.5 18229 -6 5494.1 18201 19502 -2.5 0.5 18198 4 5497.08 18191 19502 -2.5 0.5 18198 -6 5502.91 18172 19502 -2.5 -0.5 18167 5 5504.31 18168 19502 -2.5 -0.5 18167 1 5506.28 18161 19502 -2.5 -0.5 18167 -6 5508.12 18155 19502 -2.5 -1.0 18152 3 5512.68 18140 19502 -2.5 -1.5 18136 4 5515.99 18129 19502 -2.5 -1.5 18136 -7 5524.98 18100 19502 -2.5 -2.5 18105 -6 5525.48 18098 19502 -2.5 -2.5 18105 -7 5527.55 18091 19502 -2.5 -3.0 18090 1 5530.07 18083 19502 -2.5 -3.0 18090 -7 5535.2 18066 19502 -2.5 -4.0 18059 7 5537.27 18059 19502 -2.5 -4.0 18059 0 5541.84 18045 19502 -3.0 4.0 18042 3 5545.06 18034 19502 -3.0 4.0 18042 -8

125
5546.48 18029 19502 -3.0 3.5 18026 3 5547.48 18026 19502 -3.0 3.5 18026 0 5551.07 18015 19502 -3.0 3.0 18011 4 5553.98 18005 19502 -3.0 3.0 18011 -6 5556.44 17997 19502 -3.0 2.5 17996 2 5560.03 17986 19502 -3.0 2.0 17980 5 5566.11 17966 19502 -3.0 1.5 17965 1 5580.82 17919 19502 -3.0 17919 0 5585.56 17903 19502 -3.0 -0.5 17903 0 5594.6 17874 19502 -3.0 -1.5 17872 2 5599.7 17858 19502 -3.0 -2.0 17857 1 5600.85 17854 19502 -3.0 -2.0 17857 -2 5609.78 17826 19502 -3.0 -3.0 17826 0 5634.98 17746 19502 -3.0 -5.5 17749 -3 5645.49 17713 19502 -3.0 -6.5 17718 -5 5669.33 17639 19502 -3.5 -0.5 17639 0 5705.08 17528 15602 3.5 1.0 1.0 17526 2 5706.51 17524 15602 3.5 1.5 17519 5 5707.77 17520 15602 3.5 1.5 17519 1 5711.45 17509 15602 3.5 2.0 17511 -2 5716.32 17494 15602 3.5 1.0 17496 -2 5719.48 17484 15602 3.5 1 17480 4 5734.97 17437 15602 3.5 -0.5 17434 3 5735.89 17434 15602 3.5 -0.5 17426 8 5753.47 17381 15602 3.5 -1 -1 17372 9 5756.12 17373 15602 3.5 0.5 -2 17372 1 5758.9 17364 15602 3.5 -2 17357 8 5760.53 17360 15602 3.5 -0.5 -1.5 17365 -5 5762.74 17353 15602 3.5 -2 17357 -4 5766.1 17343 15602 3.5 -1 -1.5 17349 -6 5769.09 17334 15602 3.5 -1 -2 17326 8 5769.92 17331 15602 3.5 -2.5 17334 -2 5772.61 17323 15602 3.5 -0.5 -2.5 17318 5 5775.9 17313 15602 3.0 1 2 17309 5 5780.48 17300 15602 3.0 2.5 17301 -1 5785.04 17286 15602 3.0 0.5 2 17293 -7 5793.21 17262 15602 3.0 1 1 17262 -1 5795.2 17256 15602 3.0 1.5 0.5 17255 1 5797.06 17250 15602 3.0 2 17247 3 5806.62 17222 15602 3.0 1 17216 5 5809.23 17214 15602 3.0 0.5 17209 5 5814.26 17199 15602 3.0 0.5 17201 -2 5815.74 17195 15602 3.0 17185 9 5818.72 17186 15602 3.0 17185 1 5821.17 17179 15602 3.0 17185 -7 5828.47 17157 15602 3.0 -0.5 17162 -5

126
5838.02 17129 15602 3.0 -0.5 -1 17124 5 5838.97 17126 15602 3.0 -2 17124 3 5840.66 17121 15602 3.0 -1.5 17116 5 5842.93 17115 15602 3.0 -2.5 17108 6 5844.92 17109 15602 3.0 -1 -1 17108 1 5849.81 17095 15602 3.0 -2 17093 2 5854.54 17081 15602 3.0 -1 -1.5 17085 -4 5855.68 17077 15602 3.0 -0.5 -2 17078 0 5859.05 17068 15602 3.0 -2.5 17070 -2 5885.37 16991 15602 2.5 1 1 16999 -7 5888.75 16982 15602 2.5 2 16983 -2 5893.54 16968 15602 2.5 1.5 16968 0 5900.58 16947 15602 2.5 0.5 16945 3 5904.63 16936 15602 2.5 0.5 16937 -1 5910.57 16919 15602 2.5 16921 -3 5913.74 16910 15602 2.5 -0.5 16906 4 5914.79 16907 15602 2.5 -0.5 16906 1 5917.05 16900 15602 2.5 -0.5 16898 2 5922.32 16885 15602 2.5 -0.5 -0.5 16883 2 5923.47 16882 15602 2.5 -1 16875 7 5925.94 16875 15602 2.5 -1 16875 0 5927.63 16870 15602 2.5 -1 16875 -5 5928.86 16867 15602 2.5 -2 16860 7 5934.6 16850 15602 2.5 -2 16860 -9 5945.54 16819 15602 2.5 -2.5 -0.5 16821 -2 5947.32 16814 15602 2.5 1 -3 16814 1 5948.88 16810 15602 2.5 -0.5 -2 16814 -4 5952.26 16800 15602 2.5 0.5 -3 16798 2 5954.25 16795 15602 2.5 -0.5 -2.5 16790 4 5958.91 16782 15602 2.0 1 2 16781 1 5962.89 16770 15602 2.0 2.5 16773 -3 5973.81 16740 15602 2.0 2 0.5 16742 -3 5975.75 16734 15602 2.0 2.5 16735 0 5982.67 16715 15602 2.0 1 0.5 16712 3 5986.55 16704 15602 2.0 1 16704 0 5988.11 16700 15602 2.0 1.5 16704 -4 5989.46 16696 15602 2.0 1 16704 -8 5995.83 16678 15602 2.0 0.5 16681 -2 5999.54 16668 15602 2.0 16658 10 6004.89 16653 15602 2.0 16658 -4 6010.75 16637 15602 2.0 -0.5 16634 2 6014.81 16626 15602 2.0 -1 16627 -1 6019.32 16613 15602 2.0 -1 16611 2 6027.68 16590 15602 2.0 -2 16596 -6 6030.49 16582 15602 2.0 -1 -1 16581 2 6037.63 16563 15602 2.0 -2 16565 -2

127
6048.6 16533 15602 2.0 -1 -2 16534 -2 6054.5 16517 15602 1.5 1 2 16517 0 6057.52 16508 15602 1.5 2.5 16509 -1 6059.26 16504 15602 1.5 -1 3 16502 2 6065.28 16487 15602 1.5 2 16486 1 6071.31 16471 15602 1.5 2.5 16471 0 6081.1 16444 15602 1.5 1 0.5 16448 -3 6082.33 16441 15602 1.5 1 16440 1 6084.94 16434 15602 1.5 0.5 0.5 16432 2 6087.48 16427 15602 1.5 1 16424 3 6089.85 16421 15602 1.5 0.5 16417 4 6093.4 16411 15602 1.5 0.5 16409 2 6102.72 16386 15602 1.5 16394 -8 6106.36 16376 15602 1.5 -0.5 16378 -2 6107.16 16374 15602 1.5 -0.5 16371 4 6108.05 16372 15602 1.5 -0.5 16371 1 6109.88 16367 15602 1.5 -0.5 16371 -4 6113.18 16358 15602 1.5 -1 16363 -5 6116.84 16348 15602 1.5 -1 16347 1 6118.63 16344 15602 1.5 -1 16347 -4 6136.08 16297 15602 1.5 -2 16301 -4 6139.98 16287 15602 1.5 -0.5 -2 16286 1 6142.09 16281 15602 1.5 -2.5 16278 3 6145.61 16272 15602 1.5 0.5 -3 16270 1 6148.4 16264 15602 1.5 -3 16255 9 6151.14 16257 15602 1.0 -0.5 3 16253 4 6158.57 16238 15602 1.0 0.5 2 16238 0 6161.88 16229 15602 1.0 2 16222 7 6163.49 16225 15602 1.0 2 16222 2 6165.68 16219 15602 1.0 1.5 1 16222 -3 6170.48 16206 15602 1.0 2.5 16207 -1 6174.8 16195 15602 1.0 2 16191 3 6177.63 16187 15602 1.0 0.5 1 16191 -4 6182.58 16174 15602 1.0 1 16176 -2 6185.81 16166 15602 1.0 1 16161 5 6187.22 16162 15602 1.0 1 16161 2 6189.52 16156 15602 1.0 0.5 16153 3 6194.74 16143 15602 1.0 0.5 16145 -2 6195.98 16139 15602 1.0 16130 10 6198.97 16132 15602 1.0 16130 2 6203.05 16121 15602 1.0 16130 -9 6204.49 16117 15602 1.0 -0.5 16114 3 6211.69 16099 15602 1.0 -1 16099 0 6212.91 16096 15602 1.0 -0.5 -0.5 16091 4 6215.81 16088 15602 1.0 -1 16084 4 6223.67 16068 15602 1.0 -2 16068 0

128
6225.24 16064 15602 1.0 -1.5 16060 3 6226.27 16061 15602 1.0 -2 16068 -7 6234.01 16041 15602 1.0 -2 16037 4 6236.92 16034 15602 1.0 -1 -1.5 16030 4 6244.46 16014 15602 1.0 -2.5 16014 0 6250.88 15998 15602 0.5 2 1.5 15997 1 6252.43 15994 15602 0.5 1 2 15989 5 6259.7 15975 15602 0.5 2.5 15981 -6 6269.85 15949 15602 0.5 0.5 1.5 15951 -1 6275.58 15935 15602 0.5 2 15927 7 6283.84 15914 15602 0.5 1 15912 2 6287.59 15904 15602 0.5 1 15897 8 6308.8 15851 15602 0.5 -0.5 15850 0 6317.86 15828 15602 0.5 -1 15820 9 6324.45 15812 15602 0.5 -0.5 -1 15804 7 6329.98 15798 15602 0.5 -2 15804 -6
6338 15778 15602 0.5 -2 15773 4 6353.38 15740 15602 0.5 -1 -2 15743 -3 6355.45 15735 15602 0.5 -3 15727 7 6358.14 15728 15602 -0.5 3 15725 3 6362.15 15718 15602 2.5 15718 0 6367.34 15705 15602 0.5 2 15710 -5 6374.66 15687 15602 2 15694 -7 6376.08 15684 15602 2.5 15679 5 6379.32 15676 15602 1 1 15679 -3 6384.97 15662 15602 2 15664 -2 6397.01 15632 15602 1 15633 0 6400.46 15624 15602 0.5 15625 -1 6410.2 15600 15602 15602 -2 6414.67 15589 15602 -0.5 15587 3 6417.03 15584 15602 -0.5 15579 5 6418.61 15580 15602 -0.5 15579 1 6425.66 15563 15602 -1 15556 7 6439.48 15529 15602 -1.5 15533 -3 6445.28 15515 15602 -1.5 -1 15509 6 6449.22 15506 15602 -2 15509 -4 6452.12 15499 15602 -2.5 -0.5 15502 -3 6456.01 15489 15602 -0.5 -2 15494 -5 6460.44 15479 15602 0.5 -3 15479 0 6463.68 15471 15602 -3 15463 8 6465.37 15467 15602 -0.5 1 2 15461 6 6466.86 15463 15602 -0.5 2 1.5 15469 -6 6468.77 15459 15602 -0.5 2.5 15454 5 6474.24 15446 15602 -0.5 1 1.5 15438 8 6485.71 15419 15602 -0.5 0.5 1.5 15423 -4 6489.47 15410 15602 -0.5 1 1 15415 -5

129
6492.01 15404 15602 -0.5 2 15400 4 6494.05 15399 15602 -0.5 2 15400 -1 6498.08 15389 15602 -0.5 1 0.55 15394 -5 6520.62 15336 15602 -0.5 15338 -2 6523.28 15330 15602 -0.5 15338 -8 6536.53 15299 15602 -0.5 -1 15292 7 6543.08 15283 15602 -0.5 -1.5 15292 -8 6553.92 15258 15602 -0.5 -1 -1 15261 -3 6590.42 15174 15602 -1 2 15167 7 6594.36 15164 15602 -1 2 15167 -2 6597.31 15158 15602 -1 1 1 15151 7 6600.08 15151 15602 -1 1 1 15151 0 6607.07 15135 15602 -1 2 15136 0 6613.62 15120 15602 -1 1 15120 0 6622.82 15099 15602 -1 0.5 15097 2 6625.77 15093 15602 -1 0.5 15090 3 6628.14 15087 15602 -1 0.5 15090 -2 6629.6 15084 15602 -1 15074 10 6630.77 15081 15602 -1 15074 7 6631.69 15079 15602 -1 15074 5 6633.12 15076 15602 -1 15074 2 6635.74 15070 15602 -1 15074 -4 6645.95 15047 15602 -1 -1 15043 3 6654.73 15027 15602 -1 -1 15028 -1 6657.11 15022 15602 -1 -1.5 15028 -6 6658.74 15018 15602 -1 -0.5 -1 15012 5 6660.71 15013 15602 -1 -2 15012 1 6662.21 15010 15602 -1 -2 15012 -2 6663.71 15007 15602 -1 -1.5 -0.5 15005 2 6665.27 15003 15602 -1 -1.5 15005 -2 6672.27 14987 15602 -1 -2 -0.5 14989 -2 6684.86 14959 15602 -1 -1.5 -1.5 14958 1 6689.44 14949 15602 -1 0.5 -3 14951 -2 6693.52 14940 15602 -1.5 3 14949 -9 6694.54 14938 15602 -1.5 -0.5 3 14933 4 6699.32 14927 15602 -1.5 2.5 14926 1 6702.02 14921 15602 -1.5 0.5 2 14918 3 6709.43 14904 15602 -1.5 3 14903 2 6719.18 14883 15602 -1.5 1.5 14880 3 6727.47 14864 15602 -1.5 1.5 14856 8 6729.27 14860 15602 -1.5 1 14856 4 6733.16 14852 15602 -1.5 0.5 0.5 14849 3 6737.28 14843 15602 -1.5 1 14841 2 6740.82 14835 15602 -1.5 0.5 14833 2 6747.78 14820 15602 -1.5 0.5 14826 -6 6751.51 14812 15602 -1.5 14810 1

130
6762.05 14788 15602 -1.5 -0.5 14787 1 6765.34 14781 15602 -1.5 -1 14779 2 6767.76 14776 15602 -1.5 -0.5 -0.5 14772 4 6770.21 14771 15602 -1.5 -1 14764 7 6778.98 14751 15602 -1.5 -0.5 -1 14749 3 6780.65 14748 15602 -1.5 -2 14749 -1 6788.76 14730 15602 -1.5 -1 -1 14733 -3 6792.46 14722 15602 -1.5 -0.5 -1.5 14725 -3 6795.21 14716 15602 -1.5 -2 14718 -1 6801.46 14703 15602 -1.5 -2 -1 14702 0 6803.21 14699 15602 -1.5 -0.5 -2 14702 -3 6809.51 14685 15602 -1.5 -0.5 -2.5 14679 6 6811.15 14682 15602 -1.5 -0.5 -2.5 14679 3 6812.73 14678 15602 -2 3 14685 -7 6814.2 14675 15602 -2 0.5 2.5 14677 -2 6823.45 14655 15602 -2 0.5 2 14654 1 6825.8 14650 15602 -2 2 1 14654 -4 6827.33 14647 15602 -2 2 14639 8 6837.71 14625 15602 -2 2.5 14623 1 6839.49 14621 15602 -2 1.5 14616 5 6841.52 14617 15602 -2 2 14608 9 6843.63 14612 15602 -2 0.5 1 14608 4 6845.34 14608 15602 -2 2 14608 1 6846.5 14606 15602 -2 0.5 1 14608 -2 6852.53 14593 15602 -2 1 14593 1 6862.51 14572 15602 -2 0.5 14569 3 6864.72 14567 13652 2.0 -3.0 14569 -2 6919.21 14453 13652 1.5 14444 9 6944.6 14400 13652 1.5 -1.0 14398 2 6973.76 14339 13652 1.5 -2.0 14351 -12 6978.4 14330 13652 1.5 -2.5 14328 2 6993.13 14300 13652 1.5 -3.0 14305 -5 7030.29 14224 13652 1.0 1.0 14226 -2 7031.52 14222 13652 1.0 1.0 14226 -4 7045.89 14193 13652 1.0 0.5 14203 -10 7061.05 14162 13652 1.0 -0.5 14157 5 7062.68 14159 13652 1.0 -0.5 14157 2 7069.55 14145 13652 1.0 -1.0 14134 12 7077.86 14129 13652 1.0 -1.0 14134 -5 7084.65 14115 13652 1.0 -1.5 14110 5 7092.67 14099 13652 1.0 -2.0 14087 12 7116.31 14052 13652 0.5 3.0 14055 -2 7119.71 14046 13652 1.0 -3.0 14041 4 7159.83 13967 13652 0.5 1.0 13962 5 7162.87 13961 13652 0.5 1.0 13962 -1 7203.65 13882 13652 0.5 -1.0 13870 12

131
7224.03 13843 13652 0.5 -1.5 13847 -4 7334.48 13634 13652 -0.5 13629 5 7357.56 13591 13652 -1.5 13583 9 7367.13 13574 13652 -1.5 13583 -9 7375.87 13558 13652 -2.0 13560 -2 7385.89 13539 13652 -2.5 13536 3 7405.71 13503 13652 -0.5 2.5 13504 -1 7419.05 13479 13652 -0.5 2.0 13481 -2 7470.32 13386 13652 -0.5 13388 -2 7472.6 13382 13652 -0.5 13388 -6 7482.91 13364 13652 -0.5 -0.5 13365 -1 7484.17 13362 13652 -0.5 -0.5 13365 -3 7495.02 13342 13652 -0.5 -1.0 13342 0 7520.6 13297 13652 -0.5 -2.0 13296 1 7559.41 13229 13652 -1.0 2.0 13217 12 7562.25 13224 13652 -1.0 2.0 13217 7 7706.8 12976 13652 -1.5 2.5 12976 0 7708.06 12973 13652 -1.5 2.5 12976 -2 7822.8 12783 13652 -1.5 -2.0 12768 15 7832.89 12767 13652 -1.5 -2.0 12768 -1 7862.43 12719 13652 -1.5 -3.0 12722 -3 8026.25 12459 11701 1.5 -1.0 12462 -3

132
Acknowledgements Dr. Robert Frankel is acknowldged for recommending the use of edge filters to confirm
the emssion nature and energy region of the Raman results.
References 1. R. Mills The Grand Unified Theory of Classical Physics September 2016 Edition,
http://brilliantlightpower.com/book-download-and-streaming/. 2. R. Mills, Y. Lu, R. Frazer, “Power Determination and Hydrino Product Characterization of
Ultra-low Field Ignition of Hydrated Silver Shots”, Chinese Journal of Physics, Vol. 56, (2018), pp. 1667-1717.
3. R. L. Mills, Y. Lu, “Hydrino continuum transitions with cutoffs at 22.8 nm and 10.1 nm,” Int. J. Hydrogen Energy, 35 (2010), pp. 8446-8456, doi: 10.1016/j.ijhydene.2010.05.098.
4. R. L. Mills, Y. Lu, K. Akhtar, “Spectroscopic observation of helium-ion- and hydrogen-catalyzed hydrino transitions,” Cent. Eur. J. Phys., 8 (2010), pp. 318-339, doi: 10.2478/s11534-009-0106-9.
5. R. L. Mills, Y. Lu, “Time-resolved hydrino continuum transitions with cutoffs at 22.8 nm and 10.1 nm,” Eur. Phys. J. D, Vol. 64, (2011), pp. 65, DOI: 10.1140/epjd/e2011-20246-5.
6. R. L. Mills, R. Booker, Y. Lu, “Soft X-ray Continuum Radiation from Low-Energy Pinch Discharges of Hydrogen,” J. Plasma Physics, Vol. 79, (2013), pp 489-507; doi: 10.1017/S0022377812001109.
7. A. Bykanov, “Validation of the observation of soft X-ray continuum radiation from low energy pinch discharges in the presence of molecular hydrogen,” http://www.blacklightpower.com/wp-content/uploads/pdf/GEN3_Harvard.pdf.
8. R. Mills, J. Lotoski, Y. Lu, “Mechanism of soft X-ray continuum radiation from low-energy pinch discharges of hydrogen and ultra-low field ignition of solid fuels”, Plasma Science and Technology, Vol. 19, (2017), pp. 1-28.
9. R. L. Mills, P. Ray, B. Dhandapani, M. Nansteel, X. Chen, J. He, “New Power Source from Fractional Quantum Energy Levels of Atomic Hydrogen that Surpasses Internal Combustion,” J. Mol. Struct., Vol. 643, No. 1–3, (2002), pp. 43–54.
10. A. F. H. van Gessel, Masters Thesis: EUV spectroscopy of hydrogen plasmas, April (2009), Eindhoven University of Technology, Department of Applied Physics, Group of Elementary Processes in Gas Discharges, EPG 09-02, pp. 61-70.
11. R. L. Mills, “Spectroscopic Identification of a Novel Catalytic Reaction of Atomic Hydrogen and the Hydride Ion Product,” Int. J. Hydrogen Energy, Vol. 26, No. 10, (2001), pp. 1041–1058.
133
12. R. Mills J. Lotoski, “H2O-based solid fuel power source based on the catalysis of H by HOH catalyst”, Int’l J. Hydrogen Energy, Vol. 40, (2015), pp. 25-37.
13. J. A. Kollmeier, D. H. Weinberg, B. D. Oppenheimer, F. Haardt, N. Katz, R. Davé, M. Fardal, P. Madau, C. Danforth, A. B. Ford, “The photon underproduction crisis, The Astrophysical Journal Letters, Vol. 789, No. 2, (2014), p. L-32(5pp).
14. R. D. Hill, “Anomalous Behavior of H Lines in Lightning Spectra”, Electrical Processes in Atmospheres, Proceedings of the Fifth International Conference on Atmospheric Electricity held at Garmisch-Partenkirchen (Germany), 2–7 September 1974, Editors: H. Dolezalek, R. Reiter, H. E. Landsberg, pp 647-651, https://link.springer.com/chapter/10.1007%2F978-3-642-85294-7_102.
15. C. Karch, M. Schreiner; R. Honke; J. Wolfrum, “Shock waves from a lightning discharge”, 2018 34th International Conference on Lightning Protection (ICLP), DOI: 10.1109/ICLP.2018.8503327.
16. E. Bulbul, M. Markevitch, A. Foster, R. K. Smith, M. Loewenstein, S. W. Randall, “Detection of an unidentified emission line in the stacked X-Ray spectrum of galaxy clusters,” The Astrophysical Journal, Volume 789, Number 1, (2014).
17. A. Boyarsky, O. Ruchayskiy, D. Iakubovskyi, J. Franse, “An unidentified line in X-ray spectra of the Andromeda galaxy and Perseus galaxy cluster,” (2014), arXiv:1402.4119 [astro-ph.CO].
18. N. Cappelluti, E. Bulbul, A. Foster, P. Natarajan, M. C. Urry, M. W. Bautz, F. Civano, E. Miller, R. K. Smith, “Searching for the 3.5 keV Line in the Deep Fields with Chandra: The 10 ms Observations,” The Astrophysical Journal, Vol. 854 (2), (2018), p. 179 DOI: 10.3847/1538-4357/aaaa68.
19. R. L. Mills The Grand Unified Theory of Classical Quantum Mechanics, November 1995 Edition HydroCatalysis Power Corp. Malvern, PA Library of Congress Catalog Number 94-077780 Chp.22 ISBN number ISBN 0-9635171-1-2.
20. G. C-F Chen et al. “A HARP view of H0LiCOW: H0 from three time-delay gravitational lens systems with adaptive optics imaging”, Monthly Notices of the Royal Astronomical Society, (2019). DOI: 10.1093/mnras/stz2547.
21. M. J. Jee, et al., “Discovery of a ringlike dark matter structure in the core of the galaxy cluster C1 0024+17,” Astrophysical Journal, Vol. 661, (2007), pp. 728-749.
22. F. Bournaud, P. A. Duc, E. Brinks, M. Boquien, P. Amram, U. Lisenfeld, B. Koribalski, F. Walter, V. Charmandaris, “Missing mass in collisional debris from galaxies,” Science, Vol. 316, (2007), pp. 1166–1169.
23. B. G. Elmegreen, “Dark matter in galactic collisional debris,” Science, Vol. 316, (2007), pp. 32-33.

134
24. M. J. Jee, A. Mahdavi, H. Hoekstra, A. Babul, J. J. Dalcanton, P. Carroll, P. Capak, “A study of the dark core in A520 with the Hubble Space Telescope: The mystery deepens,” Astrophys. J., Vol. 747, No.96, (2012), pp. 96-103.
25. D. S. Akerib, et al “First results from the LUX dark matter experiment at the Stanford Underground Research Facility” 2014 http://arxiv.org/abs/1310.8214.
26. G. Agakishiev et al., Physics Letters B, 731, (2014) 365 DOI: 10.1016/j.physletb.2014.02.035. 27. L. M. Hobbs, D. G. York, T. P. Snow, T. Oka, J. A. Thorburn, M. Bishof, S. D. Friedman, B.
J. McCall, B. Rachford, P. Sonnentrucker, D. E. Welty, A Catalog of Diffuse Interstellar Bands in the Spectrum of HD 204827”, Astrophysical Journal, Vol. 680, No. 2, (2008), pp. 1256-1270, http://dibdata.org/HD204827.pdf, https://iopscience.iop.org/article/10.1086/587930/pdf.
28. E.H. Wishnow, The Far-Infrared Absorption Spectrum of Low Temperature Hydrogen Gas, Ph.D. Thesis, University of British Columbia, Canada, (1993).
29. E. H. Wishnow, I. Ozier, H. P. Gush, “Submillimeter spectrum of low-temperature hydrogen: The pure translational band of H2 and the R(0) line of HD,” The Astrophysical Journal, Vol. 392, (1992), pp. L43-L46.
30. E. H. Wishnow, I. Ozier, H. P. Gush, J. Schaefer, “Translational band of gaseous hydrogen at low temperature,” The Astrophysical Journal, Vol. 492, (1998), pp. 843-848.
31. E. H. Wishnow, A. Leung, H. P. Gush, “Cryogenic multiple reflection absorption cell and Fourier transform spectrometer system for the far infrared,” Review of Scientific Instruments, Vol. 70, No. 1, (1999), pp. 23-31.
32. R. L. Mills, J. Lotoski, G. Zhao, K. Akhtar, Z. Chang, J. He, X. Hu, G. Wu, G. Chu and Y. Lu, “Identification of New Hydrogen States,” Physics Essays, Vol. 24, (2011), pp. 95–117; doi:10.4006/1.3544207.
33. M. Kuraica, N. Konjevic, "Line shapes of atomic hydrogen in a plane-cathode abnormal glow discharge", Physical Review A, Volume 46, No. 7, October (1992), pp. 4429-4432.
34. M. Kuraica, N. Konjevic, M. Platisa and D. Pantelic, Spectrochimica Acta Vol. 47, 1173 (1992).
35. I. R. Videnovic, N. Konjevic, M. M. Kuraica, "Spectroscopic investigations of a cathode fall region of the Grimm-type glow discharge", Spectrochimica Acta, Part B, Vol. 51, (1996), pp. 1707-1731.
36. S. Alexiou, E. Leboucher-Dalimier, "Hydrogen Balmer- in dense plasmas", Phys, Rev. E, Vol. 60, No. 3, (1999), pp. 3436-3438.
37. S. Djurovic, J. R. Roberts, "Hydrogen Balmer alpha line shapes for hydrogen-argon mixtures in a low-pressure rf discharge", J. Appl. Phys., Vol. 74, No. 11, (1993), pp. 6558-6565.
α

135
38. S. B. Radovanov, K. Dzierzega, J. R. Roberts, J. K. Olthoff, Time-resolved Balmer-alpha emission from fast hydrogen atoms in low pressure, radio-frequency discharges in hydrogen", Appl. Phys. Lett., Vol. 66, No. 20, (1995), pp. 2637-2639.
39. S. B. Radovanov, J. K. Olthoff, R. J. Van Brunt, S. Djurovic, "Ion kinetic-energy distributions and Balmer-alpha ( ) excitation in radio-frequency discharges", J. Appl. Phys.,
Vol. 78, No. 2, (1995), pp. 746-757. 40. G. Baravian, Y. Chouan, A. Ricard, G. Sultan, J. Appl. Phys., Vol. 61, (1987), p. 5249. 41. E. L. Ayers and W. Benesch, Phys. Rev., Vol. A37, (1988), p. 194. 42. A. V. Phelps, “Collisions of H+, H2+, H3+, ArH+,H-, H, and H2 with Ar and Ar+ of ArH+ and H2
with for energies from 0.1 eV to 10 keV”, J. Phys. Chem. Ref Data, Vol. 21, (1992), pp. 883-897.
43. D. Barton, J. W. Bradley, D. A. Steele, and R. D. Short, "Investigating radio frequency plasmas used for the modification of polymer surfaces," J. Phys. Chem. B, Vol. 103, (1999), pp. 4423-4430.
44. N. Cvetanovic, M. M. Kuraica, N. Konjevic, “Excessive Balmer line broadening in a plane cathode abnormal glow discharge in hydrogen” Journal of Applied Physics. Vol. 97, (2005), pp. 33302-1 to 33302-8.
45. C. Barbeau, J. Jolly, "Spectroscopic investigation of energetic atoms in a DC hydrogen glow discharge", Journal of Physics, D, Applied Physics, Vol. 23, (1990), pp. 1168-1174.
46. S. A. Bzenic, S. B. Radovanov, S. B. Vrhovac, Z. B. Velikic, and B. M. Jelenkovic, Chem. Phys. Lett., Vol. 184, (1991), pp. 108-112.
47. E. L. Ayers, W. Benesch, "Shapes of atomic-hydrogen lines produced at a cathode surface", Physical Review A, Vol. 37, No. 1, (1988), pp. 194-199.
48. W. Benesch, E. Li, "Line shapes of atomic hydrogen in hollow-cathode discharges", Optic Letters, Vol. 9, No. 8, (1984), pp. 338-340.
49. A. Bogaerts, R. Gijbels, "Effects of adding hydrogen to an argon glow discharge: overview of some relevant processes and some quantitative explanations", Journal of Analytical Atomic Spectroscopy, Vol. 15, (2000), pp. 441-449.
50. P. Kurunczi, H. Shah, K. Becker, “Hydrogen Lyman-α and Lyman-β emissions from high-pressure microhollow cathode discharges in Ne-H2 mixtures”, Journal of Physics B: Atomic, Molecular and Optical Physics, Vol. 32, No. 22, (1999), L651-L658.
51. K. Akhtar, J. Scharer, R. L. Mills, “Substantial Doppler Broadening of Atomic Hydrogen Lines in DC and Capacitively Coupled RF Plasmas”, J. Phys. D: Appl. Phys., Vol. 42, Issue 13 (2009), p. 135207 (12pp).
52. R. L. Mills, K. Akhtar, “Tests of Features of Field-Acceleration Models for the Extraordinary
Hα Ar − H2

136
Selective H Balmer Broadening in Certain Hydrogen Mixed Plasmas,” Int. J. Hydrogen Energy, Vol. 34, (2009), pp. 6465–6477.
53. R. L. Mills, B. Dhandapani, K. Akhtar, “Excessive Balmer Line Broadening of Water-Vapor Capacitively-Coupled RF Discharge Plasmas,” Int. J. Hydrogen Energy, Vol. 33, (2008), pp. 802–815.
54. J. Phillips, C. K. Chen, R. Mills, "Evidence of Energetic Reactions Between Hydrogen and Oxygen Species in RF Generated H2O Plasmas", Int. J. Hydrogen Energy, Vol. 33 (2008), pp. 2419-2432.
55. J. Phillips, C-K Chen, K. Akhtar, B. Dhandapani, R. Mills, "Evidence of Catalytic Production of Hot Hydrogen in RF Generated Hydrogen/Argon Plasmas", International Journal of Hydrogen Energy, Vol. 32(14), (2007), pp. 3010-3025.
56. R. Mills, P. Ray, B. Dhandapani, "Evidence of an Energy Transfer Reaction Between Atomic Hydrogen and Argon II or Helium II as the Source of Excessively Hot H Atoms in RF Plasmas", Journal of Plasma Physics, (2006), Vol. 72, Issue 4, pp. 469-484.24.
57. R. L. Mills, P. C. Ray, R. M. Mayo, M. Nansteel, B. Dhandapani, J. Phillips, "Spectroscopic Study of Unique Line Broadening and Inversion in Low Pressure Microwave Generated Water Plasmas", J. Plasma Physics, Vol. 71, Part 6, (2005), pp. 877-888.
58. R. L. Mills, K. Akhtar, “Fast H in hydrogen mixed gas microwave plasmas when an atomic hydrogen supporting surface was present,” Int. J. Hydrogen Energy, 35 (2010), pp. 2546-2555, doi:10.1016/j.ijhydene.2009.12.148.
59. C. Chen, T. Wei, L. R. Collins, and J. Phillips, "Modeling the discharge region of a microwave generated hydrogen plasma", J. Phys. D: Appl. Phys., Vol. 32, (1999), pp. 688-698.
60. R. Mills, P. Ray, R. M. Mayo, "CW HI Laser Based on a Stationary Inverted Lyman Population Formed from Incandescently Heated Hydrogen Gas with Certain Group I Catalysts", IEEE Transactions on Plasma Science, Vol. 31, No. 2, (2003), pp. 236-247.
61. R. L. Mills, P. Ray, "Stationary Inverted Lyman Population Formed from Incandescently Heated Hydrogen Gas with Certain Catalysts", J. Phys. D, Applied Physics, Vol. 36, (2003), pp. 1504-1509.
62. R. Mills, P. Ray, R. M. Mayo, "The Potential for a Hydrogen Water-Plasma Laser", Applied Physics Letters, Vol. 82, No. 11, (2003), pp. 1679-1681.
63. A. Ulrich, J. Wieser, D. E. Murnick, “Excimer formation using low energy electron beam excitation”, Second International Conference on Atomic Molecular Pulsed Lasers, Proc SPIE, (1998), Vol. 3403, pp. 300-307.
64. R. L. Mills, K. Akhtar, G. Zhao, Z. Chang, J. He, X. Hu, G. Chu, “Commercializable Power Source Using Heterogeneous Hydrino Catalysts,” Int. J. Hydrogen Energy, Vol. 35, (2010), pp. 395–419, doi: 10.1016/j.ijhydene.2009.10.038.
α
α

137
65. R. L. Mills, “The Nature of Free Electrons in Superfluid Helium—a Test of Quantum Mechanics and a Basis to Review its Foundations and Make a Comparison to Classical Theory,” Int. J. Hydrogen Energy, Vol. 26, No. 10, (2001), pp. 1059–1096.
66. R. L. Mills, “The Fallacy of Feynman’s Argument on the Stability of the Hydrogen Atom According to Quantum Mechanics,” Ann. Fund. Louis de Broglie, Vol. 30, No. 2, (2005), pp. 129–151.
67. R. L. Mills, “Exact Classical Quantum Mechanical Solutions for One- through Twenty-Electron Atoms,” Physics Essays, Vol. 18, (2005), pp. 321–361.
68. W. Xie, R. L. Mills, W. Good, A. Makwana, B. Holverstott, N. Hogle, “Millsian 2.0: A Molecular Modeling Software for Structures, Charge Distributions and Energetics of Biomolecules,” Physics Essays, Vol. 24, (2011), pp. 200–212.
69. R. L. Mills, B. Holverstott, W. Good, A. Makwana, “Total Bond Energies of Exact Classical Solutions of Molecules Generated by Millsian 1.0 Compared to Those Computed Using Modern 3-21G and 6-31G* Basis Sets,” Phys. Essays, Vol. 23, (2010), 153–199; doi: 10.4006/1.3310832.
70. https://brilliantlightpower.com/millsian-inc/ 71. https://brilliantlightpower.com/theory/, “Reviews by Dr. Randy Booker and Dr. Mark
Nansteel”. 72. W. R. Hagen, R. L. Mills, “Electron Paramagnetic Resonance Proof for the Existence of
Molecular Hydrino”, Vol. 47, No. 56, (2022), pp. 23751-23761; https://www.sciencedirect.com/science/article/pii/S0360319922022406.
73. R. L. Mills, P. Ray, "A Comprehensive Study of Spectra of the Bound-Free Hyperfine Levels of Novel Hydride Ion H-(1/2), Hydrogen, Nitrogen, and Air", Int. J. Hydrogen Energy, Vol. 28, No. 8, (2003), pp. 825-871.
74. R. Mills, W. Good, P. Jansson, J. He, “Stationary Inverted Lyman Populations and Free-Free and Bound-Free Emission of Lower-Energy State Hydride Ion formed by and Exothermic Catalytic Reaction of Atomic Hydrogen and Certain Group I Catalysts,” Cent. Eur. J. Phys., Vol. 8, (2010), pp. 7–16, doi: 10.2478/s11534-009-0052-6.
75. R. L. Mills, P. Ray, “Stationary Inverted Lyman Population and a Very Stable Novel Hydride Formed by a Catalytic Reaction of Atomic Hydrogen and Certain Catalysts,” J. Opt. Mat., 27, (2004), pp. 181–186.
76. R. L. Mills, P. C. Ray, R. M. Mayo, M. Nansteel, W. Good, P. Jansson, B. Dhandapani, J. He, “Hydrogen Plasmas Generated Using Certain Group I Catalysts Show Stationary Inverted Lyman Populations and Free-Free and Bound-Free Emission of Lower-Energy State Hydride,” Res. J. Chem Env., Vol. 12(2), (2008), pp. 42–72.
77. R. Mills, J. Lotoski, W. Good, J. He, “Solid Fuels that Form HOH Catalyst,” Int’l J. Hydrogen

138
Energy, Vol. 39 (2014), pp. 11930–11944 DOI: 10.1016/j.ijhydene.2014.05.170. 78. R. Mills, X Yu, Y. Lu, G Chu, J. He, J. Lotoski, “Catalyst induced hydrino transition (CIHT)
electrochemical cell,” Int. J. Energy Res., Vol. 38, (2014), pp. 1741-1736, DOI: 10.1002/er.3142.
79. https://brilliantlightpower.com/validation-reports/. 80. E. E. Chen, M. Stavola, W. B. Fowler, J. A. Zhou, “Rotation of molecular hydrogen in Si:
unambiguous identification of ortho-H2 and para-D2”, Phys Rev Lett, (2002), Vol. 88(24), pp. 245503-1 to 245503-4.
81. R. L. Mills, J. He, Z. Chang, W. Good, Y. Lu, B. Dhandapani, “Catalysis of Atomic Hydrogen to Novel Hydrogen Species H-(1/4) and H2(1/4) as a New Power Source,” Int. J. Hydrogen Energy, Vol. 32(13), (2007), pp. 2573–2584.
82. C. Hisatsune, N. H. Suarez, "Infrared spectra of metaborate monomer and trimer ions", Inorganic Chemistry, Vol. 3, No. 2, (1964), pp. 168-174.
83. D. F. Smith, Jr., "Infrared spectra of in alkali halides—I. Potassium and rubidium
halides", Spectrochimica Acta, Vol. 30A, pp. 875-882.C. 84. R. Becker, “An investigation of the metaborate monomer and trimer ions in alkali halide
crystals”, PhD Thesis submitted to Oregon State University, June, 1969. 85. T. R. Burkholder, L. Andrews, “Reactions of boron atoms with molecular oxygen. Infrared
spectra of BO, BO2, B2O2, B2O3, and in solid argon”, J. Chem. Phys., Vol 95, No. 12
(1991), pp. 8697-8709. 86. https://webbook.nist.gov/cgi/cbook.cgi?ID=B6000451&Mask=80. 87. R. Teghil, B. Janis, L. Bencivenni, "Matrix-isolation IR studies on alkali metal M(XO2)
species. Bonding and structure of Li(CO2), M(ClO2) and M(BO2) molecules", Inorganica Chimica Acta, Vol. 88, (1984), pp. 115-124.
88. T. Markmaitree, R. Ren, L. L. Shaw, “Enhancement of lithium amide to lithium imide transition via mechanical activation”, J. Phys. Chem. B., Vol. 110, No. 41, pp. 20710-20718.
89. https://www.halide-crylink.com/wp-content/uploads/2020/07/KCl-Crystal.pdf. 90. R. Mills, J. Lotoski, J. Kong, G. Chu, J. He, J. Trevey, “High-Power-Density Catalyst Induced
Hydrino Transition (CIHT) Electrochemical Cell.” Int. J. Hydrogen Energy, 39 (2014), pp. 14512–14530 DOI: 10.1016/j.ijhydene.2014.06.153.
91. https://brilliantlightpower.com/pdf/Analytical_Presentation.pdf. 92. R. L. Mills, J. Sankar, A. Voigt, J. He, P. Ray, B. Dhandapani, “Role of Atomic Hydrogen
Density and Energy in Low Power CVD Synthesis of Diamond Films,” Thin Solid Films, 478, (2005), pp. 77–90.
93. R. L. Mills, J. Sankar, A. Voigt, J. He, B. Dhandapani, “Spectroscopic Characterization of the
BO2−
BO2−

139
Atomic Hydrogen Energies and Densities and Carbon Species During Helium-Hydrogen-Methane Plasma CVD Synthesis of Diamond Films,” Chemistry of Materials, Vol. 15, (2003), pp. 1313–1321.
94. R. L. Mills, J. Sankar, A. Voigt, J. He, B. Dhandapani, “Synthesis of HDLC Films from Solid Carbon,” J. Materials Science, J. Mater. Sci. 39 (2004), pp. 3309–3318.
95. H. Conrads, R. Mills, Th. Wrubel, “Emission in the Deep Vacuum Ultraviolet from a Plasma Formed by Incandescently Heating Hydrogen Gas with Trace Amounts of Potassium Carbonate,” Plasma Sources Science and Technology, Vol. 12, (2003), pp. 389-395.
96. R. L. Mills, T. Onuma, and Y. Lu, “Formation of a Hydrogen Plasma from an Incandescently Heated Hydrogen-Catalyst Gas Mixture with an Anomalous Afterglow Duration,” Int. J. Hydrogen Energy, Vol. 26, No. 7, July, (2001), pp. 749–762.
97. R. L. Mills, “Temporal Behavior of Light-Emission in the Visible Spectral Range from a Ti-K2CO3-H-Cell,” Int. J. Hydrogen Energy, Vol. 26, No. 4, (2001), pp. 327–332.
98. R. L. Mills, E. Dayalan, P. Ray, B. Dhandapani, J. He, “Highly Stable Novel Inorganic Hydrides from Aqueous Electrolysis and Plasma Electrolysis,” Electrochimica Acta, Vol. 47, No. 24, (2002), pp. 3909–3926.
99. https://brilliantlightpower.com/pdf/Waterbath_Calorimeter_Protocol_031720.pdf. 100. brilliantlightpower.com/pdf/Mark_Nansteel_Report.pdf. 101. brilliantlightpower.com/pdf/Randy_Booker_Report.pdf. 102. https://brilliantlightpower.com/pdf/Tse-Validation-Report-Brilliant-Light-Power.pdf. 103.
https://brilliantlightpower.com/pdf/Waterbath_Calorimetry_Data_and_Analysis_031120.pdf. 104. https://brilliantlightpower.com/pdf/Report_on_Water_Bath_Calorimetry_12.04.20.pdf. 105. https://brilliantlightpower.com/pdf/Report_on_Water_Bath_Calorimetry_(031621)_rev.pdf. 106. C. Wang, Y. Liu, “Ultrafast optical manipulation of magnetic order in ferromagnetic
materials”, Nano Convergence, Vol. 7, No. 35, (2020), https://nanoconvergencejournal.springeropen.com/articles/10.1186/s40580-020-00246-3.
107. R. Mills, M. W. Nansteel, “Oxygen and Silver Nanoparticle Aerosol Magnetohydrodynamic Power Cycle”, Journal of Aeronautics & Aerospace Engineering, Vol. 8, Iss. 2, No 216. 108. R. M. Mayo, R. L. Mills, M. Nansteel, “Direct Plasmadynamic Conversion of Plasma
Thermal Power to Electricity,” IEEE Transactions on Plasma Science, October, (2002), Vol. 30, No. 5, pp. 2066–2073.
109. R. M. Mayo, R. L. Mills, M. Nansteel, “On the Potential of Direct and MHD Conversion of Power from a Novel Plasma Source to Electricity for Microdistributed Power Applications,” IEEE Transactions on Plasma Science, August, (2002), Vol. 30, No. 4, pp. 1568–1578.
110. R. M. Mayo, R. L. Mills, “Direct Plasmadynamic Conversion of Plasma Thermal Power to

140
Electricity for Microdistributed Power Applications,” 40th Annual Power Sources Conference, Cherry Hill, NJ, June 10–13, (2002), pp. 1-4.