HYDRAULIC CONDUCTIVITY AT AND NEAR SATURATION OF AN ORTHIC LUVISOL AFTER 15 YEARS OF DIFFERENT SOIL...
9
HYDRAULIC CODUCTIVITY AT AD EAR SATURATIO OF A ORTHIC LUVISOL AFTER 15 YEARS OF DIFFERET SOIL MAAGEMET PRACTICES K. ŠPOGROVÁ 1, * M. MIHÁLIKOVÁ 1 S. MATULA 1 P. RŮŽEK 2 1 Czech University of Life Sciences Prague, Faculty of Agrobiology, Food and atural Resources, Department of Water Resources, Kamýcká 129, 165 21 Praha 6, Czech Republic 2 Crop Research Institute, Department of Agrochemistry, Drnovská 507, 161 06 Praha 6 Czech Republic *e-mail: [email protected] Abstract: Soil tillage is one of the key soil management practices in agricultural land use. The farming concepts are based on understanding of soil physical and hydrological characteristics under different tillage treatments. Hydraulic conductivity of the surface layer determines water infiltration into the soil profile and possible runoff formation. The treatment of the surface layer affects the soil pore system (distribution and connectivity of macroscopic cracks, voids, holes, etc.). The aim of this study was to evaluate the changes in hydraulic conductivity at and near saturation under the field conditions for soil with different tillage treatments (reduced tillage – RT, no tillage – NT, and conventional tillage – CT). The field experiments were carried out in four phases (June 2008, September 2008, April 2009, and July 2009) in order to characterise also the seasonal changes in hydraulic conductivity of the soil. Pressure ring infiltrometer (Matula and Kozáková, 1997) was employed to carry out the infiltration tests to determine hydraulic conductivity at saturation, K s . The infiltration time was allowed long enough to obtain steady state infiltration data, which were analysed based on the equations formulated by Philip (1985) and Reynolds and Elrick (1990). To determine hydraulic conductivity near saturation K(h), Mini Disk infiltrometer (Decagon Devices, Inc.) was used. The transient infiltration data obtained from Mini Disk infiltrometer were analysed by HYDRUS 2D software (Šimůnek et al., 1999). Analysis of variance identified significantly lower K s values for NT plots, while CT and RT plots did not differ from each other. When comparing the K(h) values measured at three consecutive water pressure heads (-5, -3, and -1 cm) the statistically significant differences were found between all three treatments (CT > RT > NT). The seasonal changes in hydraulic conductivity were reflecting the changes in structure of the surface layer (caused for example by tillage operation, winter frost, and wetting and drying circles). In contrast to some published studies, this study showed no improvement in soil structure of soil under NT after certain time period, resulting in significantly lower values of hydraulic conductivity during each of the experimental phase. Key Words: Hydraulic conductivity, Tillage treatment, Pressure ring infiltrometer, Mini disk infiltrometer 1. ITRODUCTIO Hydraulic conductivity controls water and solute transport within the soil profile. Davis et al. (1999) reported saturated hydraulic conductivity K s as one of the most sensitive input parameters for hydrological models, which is very difficult to measure accurately and thus disputing the model results. Sobieraj et al. (2004) concluded that predictability of K s is very little, if the soil does not have a course structure. Tillage of the topsoil layers changes the soil structure and thus its hydrophysical properties. It is important to characterise its changes in time with regard to the different tillage management practices. It was found that long-term tillage effects on hydraulic conductivity at saturation vary; Arshad et al. (1999), and Coutadeur et al. (2002) reported higher infiltration rates for soils under no-tillage when compared to the conventional tillage, Blanco-Canqui et al. (2004), Gregorich et al. (1993), and Karlen et al. (1994) reported similar values, while Lampurlanés and Cantero-Martínez (2006), Moret and Arrúe (2007a), and Kribaa et al. (2001) reported smaller infiltration rates. The effects of tillage were found to be strongly time-dependant (Xu and Mermoud 2001). Tillage operations lead to soil loosening accompanying by an increase in number of active macropores and disruption of macropores continuity. The amount of macropores and mesopores can be calculated based on the measured infiltration rates for certain water pressure heads (tensions) near saturation. Park and Smucker (2005) reported tillage as a factor decreasing aggregate stability due to increased mineralisation of organic matter, which is enhanced by rain-drops impact. Osunbitan et al. (2005), and Kribaa et al. (2001) reported that hydraulic conductivity at saturation decreases with time (weeks) after soil cultivation due to soil reconsolidation and compacting effects of rainfall. The aim of this study was to evaluate changes in hydraulic conductivity at and near saturation for a silty clay loam under three different tillage treatments (conventional tillage, reduced (non-inversion) tillage and no-tillage) measured at four phases within approximately one year period (from June 2008 to July 2009). 2. MATERIAL AD METHODS The experimental site (Figure 1& 2) is located in the area of Crop Research Institute in Praha- Ruzyně (sugar beet production area; altitude 340 m a. s. l.; latitude 50°05’ N; longitude 14°20’ E; annual precipitation 472 mm; annual average temperature 7.9°C). The soil being tested was classified according to FAO system as Orthic Luvisol. The experimental site was established in 1994. Since then, three different tillage practices, each one on the particular plot were applied. The tillage systems were as follows: i) conventional tillage CT (ploughed to 25 cm); ii) reduced tillage RT (non-inversion treatment of a surface soil layer to 10 cm); iii) no-tillage NT (direct drilling). The measurements were carried out in four phases: in June 2008 before the harvesting of the Anadolu Tarım Bilim. Derg., 2010,25(S-3):148-156 Anadolu J. Agric. Sci., 2010,25(S-3):148-156 Research Araştırma
Transcript of HYDRAULIC CONDUCTIVITY AT AND NEAR SATURATION OF AN ORTHIC LUVISOL AFTER 15 YEARS OF DIFFERENT SOIL...
HYDRAULIC CO�DUCTIVITY AT A�D �EAR SATURATIO� OF A� ORTHIC LUVISOL AFTER 15 YEARS OF DIFFERE�T SOIL MA�AGEME�T PRACTICES
K. ŠPO�GROVÁ1,* M. MIHÁLIKOVÁ1 S. MATULA1 P. RŮŽEK2
1Czech University of Life Sciences Prague, Faculty of Agrobiology, Food and �atural Resources,
Department of Water Resources, Kamýcká 129, 165 21 Praha 6, Czech Republic 2Crop Research Institute, Department of Agrochemistry, Drnovská 507, 161 06 Praha 6 Czech Republic
*e-mail: [email protected] Abstract: Soil tillage is one of the key soil management practices in agricultural land use. The farming concepts are based on understanding of soil physical and hydrological characteristics under different tillage treatments. Hydraulic conductivity of the surface layer determines water infiltration into the soil profile and possible runoff formation. The treatment of the surface layer affects the soil pore system (distribution and connectivity of macroscopic cracks, voids, holes, etc.). The aim of this study was to evaluate the changes in hydraulic conductivity at and near saturation under the field conditions for soil with different tillage treatments (reduced tillage – RT, no tillage – NT, and conventional tillage – CT). The field experiments were carried out in four phases (June 2008, September 2008, April 2009, and July 2009) in order to characterise also the seasonal changes in hydraulic conductivity of the soil. Pressure ring infiltrometer (Matula and Kozáková, 1997) was employed to carry out the infiltration tests to determine hydraulic conductivity at saturation, Ks. The infiltration time was allowed long enough to obtain steady state infiltration data, which were analysed based on the equations formulated by Philip (1985) and Reynolds and Elrick (1990). To determine hydraulic conductivity near saturation K(h), Mini Disk infiltrometer (Decagon Devices, Inc.) was used. The transient infiltration data obtained from Mini Disk infiltrometer were analysed by HYDRUS 2D software (Šimůnek et al., 1999). Analysis of variance identified significantly lower Ks values for NT plots, while CT and RT plots did not differ from each other. When comparing the K(h) values measured at three consecutive water pressure heads (-5, -3, and -1 cm) the statistically significant differences were found between all three treatments (CT > RT > NT). The seasonal changes in hydraulic conductivity were reflecting the changes in structure of the surface layer (caused for example by tillage operation, winter frost, and wetting and drying circles). In contrast to some published studies, this study showed no improvement in soil structure of soil under NT after certain time period, resulting in significantly lower values of hydraulic conductivity during each of the experimental phase. Key Words: Hydraulic conductivity, Tillage treatment, Pressure ring infiltrometer, Mini disk infiltrometer 1. I�TRODUCTIO�
Hydraulic conductivity controls water and solute transport within the soil profile. Davis et al. (1999) reported saturated hydraulic conductivity Ks as one of the most sensitive input parameters for hydrological models, which is very difficult to measure accurately and thus disputing the model results. Sobieraj et al. (2004) concluded that predictability of Ks is very little, if the soil does not have a course structure. Tillage of the topsoil layers changes the soil structure and thus its hydrophysical properties. It is important to characterise its changes in time with regard to the different tillage management practices. It was found that long-term tillage effects on hydraulic conductivity at saturation vary; Arshad et al. (1999), and Coutadeur et al. (2002) reported higher infiltration rates for soils under no-tillage when compared to the conventional tillage, Blanco-Canqui et al. (2004), Gregorich et al. (1993), and Karlen et al. (1994) reported similar values, while Lampurlanés and Cantero-Martínez (2006), Moret and Arrúe (2007a), and Kribaa et al. (2001) reported smaller infiltration rates. The effects of tillage were found to be strongly time-dependant (Xu and Mermoud 2001). Tillage operations lead to soil loosening accompanying by an increase in number of active macropores and disruption of macropores continuity. The amount of macropores and mesopores can be calculated based on the measured infiltration rates for certain water pressure heads (tensions) near saturation. Park and Smucker (2005) reported tillage as a factor decreasing
aggregate stability due to increased mineralisation of organic matter, which is enhanced by rain-drops impact. Osunbitan et al. (2005), and Kribaa et al. (2001) reported that hydraulic conductivity at saturation decreases with time (weeks) after soil cultivation due to soil reconsolidation and compacting effects of rainfall.
The aim of this study was to evaluate changes in hydraulic conductivity at and near saturation for a silty clay loam under three different tillage treatments (conventional tillage, reduced (non-inversion) tillage and no-tillage) measured at four phases within approximately one year period (from June 2008 to July 2009). 2. MATERIAL A�D METHODS
The experimental site (Figure 1& 2) is located in the area of Crop Research Institute in Praha- Ruzyně (sugar beet production area; altitude 340 m a. s. l.; latitude 50°05’ N; longitude 14°20’ E; annual precipitation 472 mm; annual average temperature 7.9°C). The soil being tested was classified according to FAO system as Orthic Luvisol. The experimental site was established in 1994. Since then, three different tillage practices, each one on the particular plot were applied. The tillage systems were as follows: i) conventional tillage CT (ploughed to 25 cm); ii) reduced tillage RT (non-inversion treatment of a surface soil layer to 10 cm); iii) no-tillage NT (direct drilling). The measurements were carried out in four phases: in June 2008 before the harvesting of the
Anadolu Tarım Bilim. Derg., 2010,25(S-3):148-156 Anadolu J. Agric. Sci., 2010,25(S-3):148-156
Research Araştırma
K. Špongrová, M. Miháliková, S. Matula, P. Růžek
149
preceding crop (Triticum aestivum), in September 2008, 2 weeks after planting of the main crop (Brassica napus subsp. napus), in April 2009 during the flowering period and in July 2009 just before harvesting.
Pressure ring infiltrometer (Matula and Kozáková, 1997) was used for the infiltration experiments to determine hydraulic conductivity at saturation Ks. Three replicates in 1 m distance were performed for each tillage treatment at each experimental phase (36 infiltration tests in total). The infiltrometer consists of a large Mariotte type water reservoir (app. 10 litres) which is placed on an iron metal ring driven into the soil up to 8 – 10 cm. The inner diameter of the iron ring is 15 cm. A wide range of water pressure can be applied on the soil surface inside the infiltration ring by adjusting a movable air tube inside the infiltrometer water reservoir. The scheme with basic dimensions of the infiltrometer together with the field application is presented in Figure 3. The infiltration time was allowed at least 60 min to ensure steady water flow. To determine the hydraulic conductivity at saturation Ks equations formulated by Philip (1985), Reynolds and Elrick (1990), Reynolds and Elrick (1991) and Elrick and Reynolds (1992) can be applied on the steady-state infiltration data. Matula (2003) presented a final formula for Ks determination from the pressure ring infiltrometer measurements:
++= ∞
απ
aGaHa
GqK s
2
(1) where Ks (L T
-1) is saturated hydraulic conductivity, q∞ (L
3 T-1) is steady state infiltration rate, H (L) is
positive hydrostatic head, � (L-1) is the alpha parameter, a (L) inner radius of the infiltration ring, G
is a dimensionless geometry factor defined by Reynolds and Elrick (1990) for the pressure ring infiltrometer:
( ) 184.0316.0 += adG
where d (L) is the depth of the iron ring insertion.
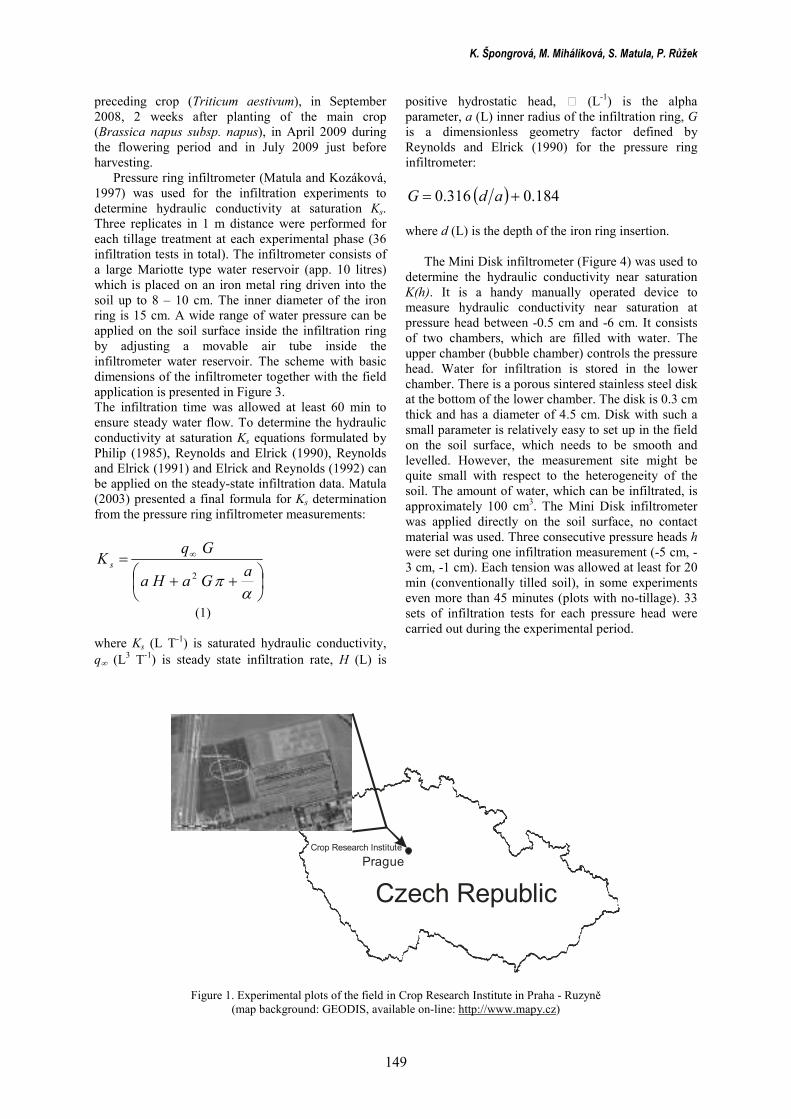
The Mini Disk infiltrometer (Figure 4) was used to
determine the hydraulic conductivity near saturation K(h). It is a handy manually operated device to measure hydraulic conductivity near saturation at pressure head between -0.5 cm and -6 cm. It consists of two chambers, which are filled with water. The upper chamber (bubble chamber) controls the pressure head. Water for infiltration is stored in the lower chamber. There is a porous sintered stainless steel disk at the bottom of the lower chamber. The disk is 0.3 cm thick and has a diameter of 4.5 cm. Disk with such a small parameter is relatively easy to set up in the field on the soil surface, which needs to be smooth and levelled. However, the measurement site might be quite small with respect to the heterogeneity of the soil. The amount of water, which can be infiltrated, is approximately 100 cm3. The Mini Disk infiltrometer was applied directly on the soil surface, no contact material was used. Three consecutive pressure heads h were set during one infiltration measurement (-5 cm, -3 cm, -1 cm). Each tension was allowed at least for 20 min (conventionally tilled soil), in some experiments even more than 45 minutes (plots with no-tillage). 33 sets of infiltration tests for each pressure head were carried out during the experimental period.
Prague
Czech Republic
Crop Research Institute
Figure 1. Experimental plots of the field in Crop Research Institute in Praha - Ruzyně (map background: GEODIS, available on-line: http://www.mapy.cz)

Hydraulic conductivity at and near saturation of an orthic luvisol after 15 years of different soil management practices
150
Figure 2. Detailed scheme of the experimental plots of the field in Crop Research Institute in Praha - Ruzyně
a) b)
Figure 3. Pressure ring infiltrometer by Matula and Kozáková (1997)
a) Pressure ring infiltrometer scheme: 1-Piston valve to open or close the water outlet 2-Moveable air tube to set the applied water pressure H on infiltrating surface 3-Marriote type water reservoir 4-Plexiglass tube of a small diameter to enable accurate fading of the water level 5-Iron ring with a radius of a driven into the soil to the depth d 6-Bulb of field saturated soil 7-Wetting front 8-Wetted zone;
b) Pressure ring infiltrometer applied in the field
K. Špongrová, M. Miháliková, S. Matula, P. Růžek
151
a) b)
Figure 4. The Mini Disk infiltrometer
a) Scheme of the infiltrometer (User’s manual, Decagon Devices, Inc., 2006) b) Application of the infiltrometer in the experimental field
To determine the unsaturated hydraulic
conductivity for the applied pressure heads, a method proposed by Zhang (1997a) was applied. Cumulative infiltration vs. time was measured and then fitted with the following equation (Philip, 1957):
tCCI 21 += (2)
where: C1 (L T
-1) and C2 (L T-1/2) are parameters
related to hydraulic conductivity and soil sorptivity respectively, I (L) is the cumulative infiltration, and t (T) the time.
The hydraulic conductivity of the soil K at the particular applied pressure head h is then calculated as follows:
A
ChK 1)( = (3)
where: C1 is the slope of the curve of the cumulative infiltration vs. the square root of time, and A is a value relating the van Genuchten parameters (van Genuchten, 1980) for 12 soil texture classes to the radius of the disk and applied pressure head. The A parameter was determined based on the data reported in the User’s manual (Decagon Devices, Inc., 2006); for silty clay loam is A equal to 10.1 for pressure head -5 cm, 9.1 for pressure head -3 cm, and 8.3 for pressure head -1 cm.
Šimůnek and van Genuchten (1996, 1997), and Šimůnek et al. (1998) proposed an inverse numerical method to estimate the parameters of the hydraulic
conductivity function and the soil water retention curve from transient infiltration data from disc infiltrometers. The determination of soil hydraulic parameters from inverse modelling requires a numerical solution of the Richards’ equation (Richards, 1931) for given initial and boundary conditions and the optimisation of the parameters in assumed forms of the soil hydraulic functions. Software HYDRUS 2D (Šimůnek et al, 1999) was used for the numerical solution; an axisymetrical vertical flow of water was modelled on a generally described domain discretised into 1111 2D elements with 599 nodes. The hydraulic parameters for the inverse solution were set as follows: saturated moisture content �s was determined as an averaged value for each tillage treatment at each experimental phase; �r was set as a constant at a value of 0.08 cm
3 cm-3; parameter l was set to 0.5; all other parameters �, n, and Ks were optimised during the calculation procedure. An additional value of final moisture content �final was used to improve the optimisation procedure. Calculated K(h) and Ks values were transformed (logarithm to the base of 10) and than statistically assessed by analysis of variance on a significance level � = 0.05 (Statgraphics Centurion XV software).
The accessibility to the field was governed by the soil moisture content at the particular period. Averaged daily temperatures and amount of daily precipitation (sum) during the whole experimental period is displayed in Figure 5.

Hydraulic conductivity at and near saturation of an orthic luvisol after 15 years of different soil management practices
152
Figure 5. Average daily temperatures and amount of daily precipitation (sum) for the whole experimental period (Crop Research Institute, data taken from: http://www.vurv.cz/meteo)
3. RESULTS A�D DISCUSSIO�
An overview of averaged initial and final conditions together with the averaged values of � an n resulting from the inverse solution in HYDRUS 2D and averaged values of hydraulic conductivity for each soil treatment and experimental phase is presented in Tab.1. 3.1. Effect of Time
The changes of hydraulic conductivity near saturation K(h) in time are displayed in Figure 6a. Statistically significant increase in K(h) was observed after the soil treatment carried out just before the measurement at the second experimental phase. Further decrease in K(h) was observed during the third and fourth experimental phases. To observe the changes in K(h) in time for each soil treatment, an interaction effect of soil treatment and measurement phase was studied (Figure 6b). The increase in hydraulic conductivity at the second experimental phase was observed for all treatments, CT, RT, and NT. The largest increase was observed for RT and NT, while for CT the increase was statistically insignificant.
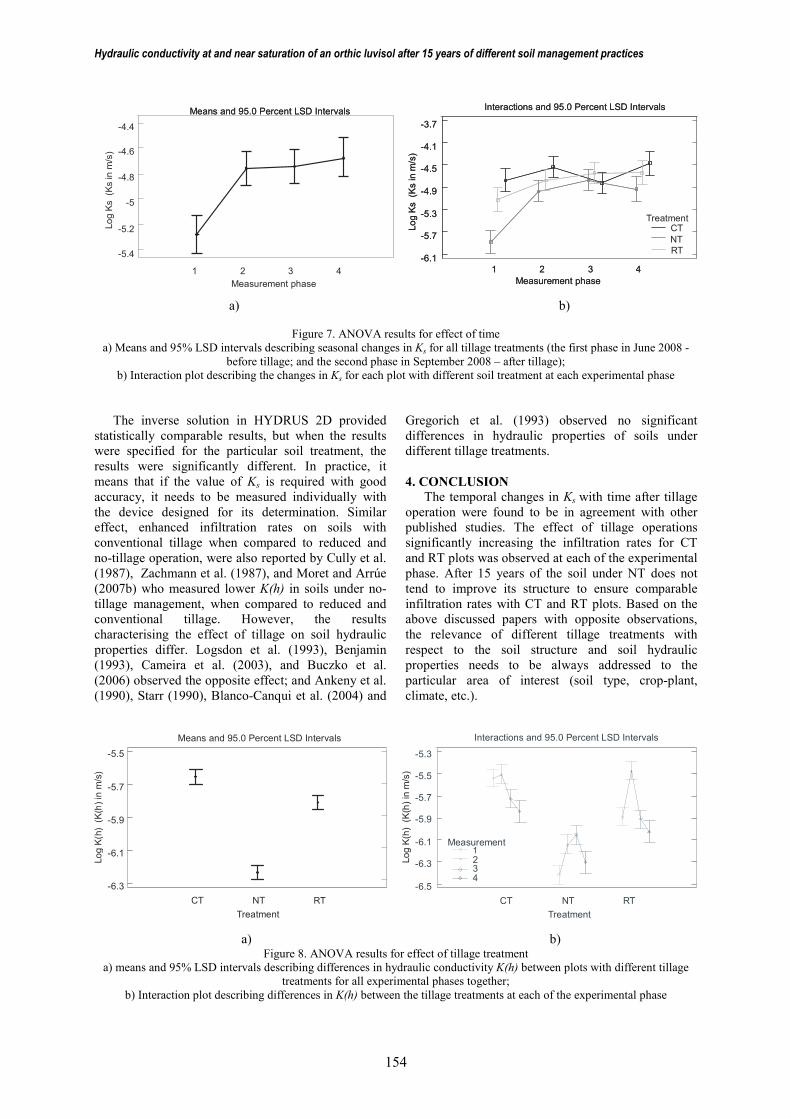
Significantly smaller values of Ks (Figure 7a) were measured in June 2008 (the first experimental phase) before harvesting the preceding crop (Triticum
aestivum) for all tillage treatments. After the tillage and seeding operations of the main crop (Brassica
napus subsp. napus) the Ks increased significantly for all treatments. The increase in Ks measured on NT plot was relatively smaller when compared to the other two tillage systems (CT and RT). There was another increase in hydraulic conductivity in the following experimental phase in April 2009. This was probably caused by the improving effects of winter frost, wetting and drying periods and developing root system of the main crop. During the last measurement phase in July 2009 a decrease in Ks was observed on
RT and NT plots. However, the Ks on plot with conventional tillage were increasing very mildly during the rest of the experimental period after tillage operations. The changes of Ks in time for the different tillage treatments are displayed in the interaction plot in Figure 7b.
The results are in correspondence with the findings of other published studies. Moret and Arrúe (2007a) observed short-term changes of hydrophysical properties of plots under CT, RT and NT; they reported a significant increase in Ks and K(h) as a result of an increase in number of water-conductive macropores, which was followed by decline in hydraulic conductivity due to soil reconsolidation by post-tillage rains and associated wetting and drying circles. Xu and Mermoud (2001) observed a significant decrease in K(h) with time during the growing season on soils with CT, RT, NT and subsoiling tillage. Such a significant decrease in Ks was not observed, probably because of the improving effect of the roots of the main crop. 3.2. Effect of Tillage
Analysis of variance identified a significant effect of tillage treatment on the resulting K(h) values (Figure 8a). Significant differences were found between all three treatments. The highest values of K(h) were determined on CT plot, lower values on RT plot and the smallest values on NT plot. Changes in K(h) for plots with different tillage treatments at each of the experimental phase are displayed in the interaction plot in Figure 8b. A significant increase in K(h) at the second experimental phase was followed with a decrease in K(h) at the third and fourth measurement phase on CT and RT plots. On NT plot the K(h) values increased at the second and also at the third experimental phase, and than at the fourth phase decreased almost to the level at the beginning of the experimental period.

K. Špongrová, M. Miháliková, S. Matula, P. Růžek
153
Table 1. Averaged initial and final conditions together with the averaged values resulting from the inverse solution in HYDRUS 2D and averaged values of Ks for each soil treatment and experimental phase determined by Mini Disk and Pressure ring infiltrometers
Mini Disk infiltrometer Pressure ring
infiltrometer
Input data HYDRUS 2D results results
Treat-ment
�initial
(cm3 cm-3) �final
(cm3cm-3) �� (cm-1)
n
(-) Ks
(cm min-1) Coefficient of determination R2
Ks
(cm min-1)
Exp. phase I.
CT 0.125 0.338 0.1397 2.1004 0.04673 0.9986 0.09827
RT 0.139 0.345 0.1999 1.8178 0.02938 0.9983 0.05171
NT 0.151 0.339 0.2052 1.8914 0.00733 0.9950 0.01278 Exp. phase II. CT 0.187 0.323 0.2190 1.8829 0.07704 0.9985 0.49662
RT 0.188 0.339 0.2512 1.5753 0.14546 0.9983 0.06906
NT 0.222 0.347 0.6050 1.2316 0.36237 0.9963 0.03265 Exp. phase III.
CT 0.126 0.321 0.1627 1.5842 0.04123 0.9987 0.58626
RT 0.155 0.338 0.5247 1.3931 0.32927 0.9967 0.47732
NT 0.173 0.323 0.8524 1.4240 0.70469 0.9928 0.06954 Exp. phase IV.
CT 0.234 0.385 0.5129 1.2359 0.43622 0.9982 0.66826
RT 0.271 0.399 0.5083 1.1973 0.47263 0.9969 0.27466
NT 0.303 0.387 0.5865 1.1526 0.51410 0.9940 0.16642
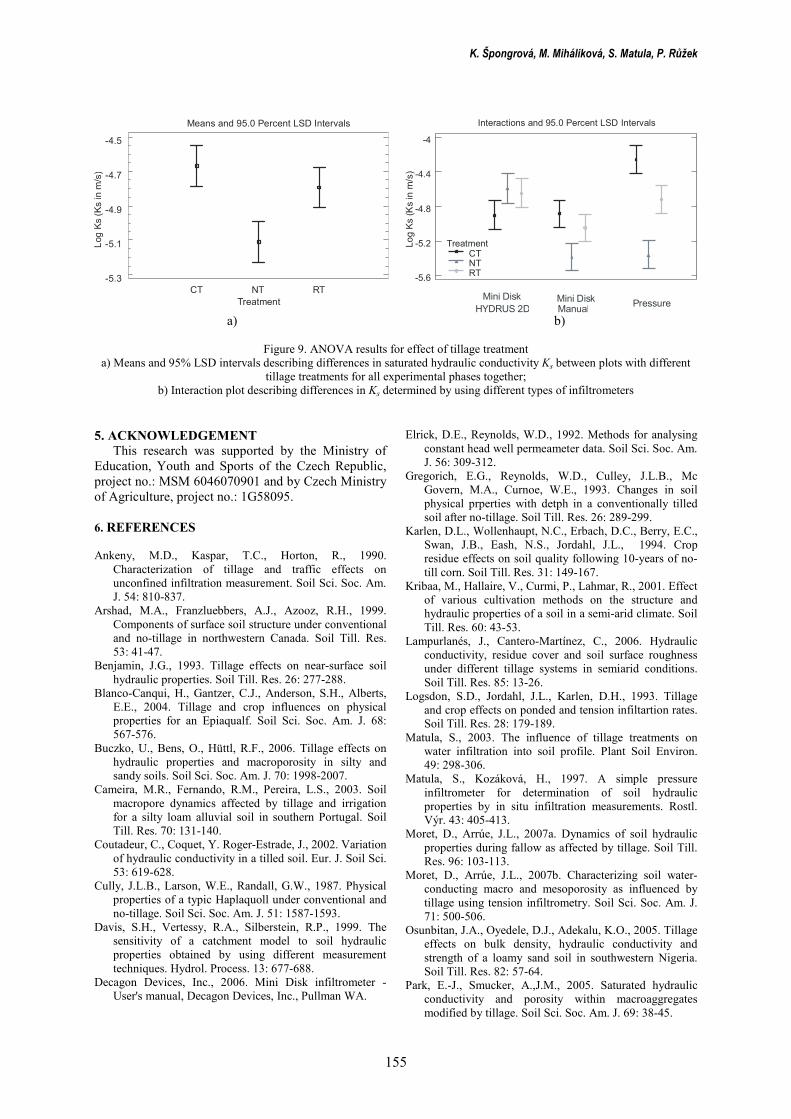
Analysis of variance identified also a significant effect of tillage treatment on the resulting Ks values (Figure 9). Significantly lower values of hydraulic conductivity were measured on NT plot, while CT and RT plots did not significantly differ within the whole experimental period. The effect of used infiltrometer was also tested in order to compare the ability of the Mini Disk infiltrometer to determine the Ks values. If the infiltration data were analysed according to the manual, the resulting Ks values were significantly
lower than those measured by the Pressure ring infiltrometer (Matula and Kozáková, 1997). The interaction plot (Figure 9b) shows that the Mini Disk infiltrometer was systematically underestimating Ks
for all plots, because of the underestimation of macropores (only small underestimation of Ks for NT plot). However, the estimates for the plots with smaller amount of macropores (RT, NT) were not statistically different.
1 2 3 4
Means and 95.0 Percent LSD Intervals
Measurement phase
-6.2
-6.1
-6
-5.9
-5.8
-5.7
-5.6
Log K(h) (K(h) in m/s)
Interactions and 95.0 Percent LSD Intervals
-6.5
-6.3
-6.1
-5.9
-5.7
-5.5
-5.3
1 2 3 4
Treatment
CT
NT
RT
Measurement phase
Log K(h) (K(h) in m/s)
a) b)
Figure 6. ANOVA results for an effect of time
a) Changes in hydraulic conductivity near saturation K(h) for the four experimental phases between June 2008 and July 2009; b) Interaction plot describing the changes in hydraulic conductivity near saturation K(h) for each plot with different soil
treatment at each experimental phase
Hydraulic conductivity at and near saturation of an orthic luvisol after 15 years of different soil management practices
154
Log Ks (Ks in m
/s)
Means and 95.0 Percent LSD Intervals
Measurement phase
1 2 3 4
Measurement phase
-5.4
-5.2
-5
-4.8
-4.6
-4.4
Log K(h) (K(h) in m/s)
Interactions and 95.0 Percent LSD Intervals
Measurement phase
-6.1
-5.7
-5.3
-4.9
-4.5
-4.1
-3.7
1 2 3 4
Log Ks (Ks in m/s)
Log Ks (Ks in m
/s)
Means and 95.0 Percent LSD Intervals
Measurement phase
1 2 3 4
-5.4
-5.2
-5
-4.8
-4.6
-4.4
Log Ks (Ks in m/s)
Interactions and 95.0 Percent LSD Intervals
Measurement phase
CTTreatment
NT
RT-6.1
-5.7
-5.3
-4.9
-4.5
-4.1
-3.7
1 2 3 4
Log Ks (Ks in m/s)
Means and 95.0 Percent LSD Intervals
Measurement phase
a) b)
Figure 7. ANOVA results for effect of time a) Means and 95% LSD intervals describing seasonal changes in Ks for all tillage treatments (the first phase in June 2008 -
before tillage; and the second phase in September 2008 – after tillage); b) Interaction plot describing the changes in Ks for each plot with different soil treatment at each experimental phase
The inverse solution in HYDRUS 2D provided
statistically comparable results, but when the results were specified for the particular soil treatment, the results were significantly different. In practice, it means that if the value of Ks is required with good accuracy, it needs to be measured individually with the device designed for its determination. Similar effect, enhanced infiltration rates on soils with conventional tillage when compared to reduced and no-tillage operation, were also reported by Cully et al. (1987), Zachmann et al. (1987), and Moret and Arrúe (2007b) who measured lower K(h) in soils under no-tillage management, when compared to reduced and conventional tillage. However, the results characterising the effect of tillage on soil hydraulic properties differ. Logsdon et al. (1993), Benjamin (1993), Cameira et al. (2003), and Buczko et al. (2006) observed the opposite effect; and Ankeny et al. (1990), Starr (1990), Blanco-Canqui et al. (2004) and
Gregorich et al. (1993) observed no significant differences in hydraulic properties of soils under different tillage treatments. 4. CO�CLUSIO�
The temporal changes in Ks with time after tillage operation were found to be in agreement with other published studies. The effect of tillage operations significantly increasing the infiltration rates for CT and RT plots was observed at each of the experimental phase. After 15 years of the soil under NT does not tend to improve its structure to ensure comparable infiltration rates with CT and RT plots. Based on the above discussed papers with opposite observations, the relevance of different tillage treatments with respect to the soil structure and soil hydraulic properties needs to be always addressed to the particular area of interest (soil type, crop-plant, climate, etc.).
CT NT RT
Means and 95.0 Percent LSD Intervals
Treatment
-6.3
-6.1
-5.9
-5.7
-5.5
Log K(h) (K(h) in m/s)
Interactions and 95.0 Percent LSD Intervals
Treatment
-6.5
-6.3
-6.1
-5.9
-5.7
-5.5
-5.3
CT NT RT
Measurement1234
Log K(h) (K(h) in m/s)
a) b)
Figure 8. ANOVA results for effect of tillage treatment a) means and 95% LSD intervals describing differences in hydraulic conductivity K(h) between plots with different tillage
treatments for all experimental phases together; b) Interaction plot describing differences in K(h) between the tillage treatments at each of the experimental phase
K. Špongrová, M. Miháliková, S. Matula, P. Růžek
155
Interactions and 95.0 Percent LSD Intervals
-5.6
-5.2
-4.8
-4.4
-4
TreatmentCTNTRT
Mini is D kPressure
HYDRUS 2D Manual
Mini is D k
Means and 95.0 Percent LSD Intervals
Treatment
Log Ks (Ks in m/s)
CT NT RT
-5.3
-5.1
-4.9
-4.7
-4.5
Log Ks (Ks in m/s)
a) b)
Figure 9. ANOVA results for effect of tillage treatment
a) Means and 95% LSD intervals describing differences in saturated hydraulic conductivity Ks between plots with different tillage treatments for all experimental phases together;
b) Interaction plot describing differences in Ks determined by using different types of infiltrometers 5. ACK�OWLEDGEME�T
This research was supported by the Ministry of Education, Youth and Sports of the Czech Republic, project no.: MSM 6046070901 and by Czech Ministry of Agriculture, project no.: 1G58095. 6. REFERE�CES Ankeny, M.D., Kaspar, T.C., Horton, R., 1990.
Characterization of tillage and traffic effects on unconfined infiltration measurement. Soil Sci. Soc. Am. J. 54: 810-837.
Arshad, M.A., Franzluebbers, A.J., Azooz, R.H., 1999. Components of surface soil structure under conventional and no-tillage in northwestern Canada. Soil Till. Res. 53: 41-47.
Benjamin, J.G., 1993. Tillage effects on near-surface soil hydraulic properties. Soil Till. Res. 26: 277-288.
Blanco-Canqui, H., Gantzer, C.J., Anderson, S.H., Alberts, E.E., 2004. Tillage and crop influences on physical properties for an Epiaqualf. Soil Sci. Soc. Am. J. 68: 567-576.
Buczko, U., Bens, O., Hüttl, R.F., 2006. Tillage effects on hydraulic properties and macroporosity in silty and sandy soils. Soil Sci. Soc. Am. J. 70: 1998-2007.
Cameira, M.R., Fernando, R.M., Pereira, L.S., 2003. Soil macropore dynamics affected by tillage and irrigation for a silty loam alluvial soil in southern Portugal. Soil Till. Res. 70: 131-140.
Coutadeur, C., Coquet, Y. Roger-Estrade, J., 2002. Variation of hydraulic conductivity in a tilled soil. Eur. J. Soil Sci. 53: 619-628.
Cully, J.L.B., Larson, W.E., Randall, G.W., 1987. Physical properties of a typic Haplaquoll under conventional and no-tillage. Soil Sci. Soc. Am. J. 51: 1587-1593.
Davis, S.H., Vertessy, R.A., Silberstein, R.P., 1999. The sensitivity of a catchment model to soil hydraulic properties obtained by using different measurement techniques. Hydrol. Process. 13: 677-688.
Decagon Devices, Inc., 2006. Mini Disk infiltrometer - User's manual, Decagon Devices, Inc., Pullman WA.
Elrick, D.E., Reynolds, W.D., 1992. Methods for analysing constant head well permeameter data. Soil Sci. Soc. Am. J. 56: 309-312.
Gregorich, E.G., Reynolds, W.D., Culley, J.L.B., Mc Govern, M.A., Curnoe, W.E., 1993. Changes in soil physical prperties with detph in a conventionally tilled soil after no-tillage. Soil Till. Res. 26: 289-299.
Karlen, D.L., Wollenhaupt, N.C., Erbach, D.C., Berry, E.C., Swan, J.B., Eash, N.S., Jordahl, J.L., 1994. Crop residue effects on soil quality following 10-years of no-till corn. Soil Till. Res. 31: 149-167.
Kribaa, M., Hallaire, V., Curmi, P., Lahmar, R., 2001. Effect of various cultivation methods on the structure and hydraulic properties of a soil in a semi-arid climate. Soil Till. Res. 60: 43-53.
Lampurlanés, J., Cantero-Martínez, C., 2006. Hydraulic conductivity, residue cover and soil surface roughness under different tillage systems in semiarid conditions. Soil Till. Res. 85: 13-26.
Logsdon, S.D., Jordahl, J.L., Karlen, D.H., 1993. Tillage and crop effects on ponded and tension infiltartion rates. Soil Till. Res. 28: 179-189.
Matula, S., 2003. The influence of tillage treatments on water infiltration into soil profile. Plant Soil Environ. 49: 298-306.
Matula, S., Kozáková, H., 1997. A simple pressure infiltrometer for determination of soil hydraulic properties by in situ infiltration measurements. Rostl. Výr. 43: 405-413.
Moret, D., Arrúe, J.L., 2007a. Dynamics of soil hydraulic properties during fallow as affected by tillage. Soil Till. Res. 96: 103-113.
Moret, D., Arrúe, J.L., 2007b. Characterizing soil water-conducting macro and mesoporosity as influenced by tillage using tension infiltrometry. Soil Sci. Soc. Am. J. 71: 500-506.
Osunbitan, J.A., Oyedele, D.J., Adekalu, K.O., 2005. Tillage effects on bulk density, hydraulic conductivity and strength of a loamy sand soil in southwestern Nigeria. Soil Till. Res. 82: 57-64.
Park, E.-J., Smucker, A.,J.M., 2005. Saturated hydraulic conductivity and porosity within macroaggregates modified by tillage. Soil Sci. Soc. Am. J. 69: 38-45.
Hydraulic conductivity at and near saturation of an orthic luvisol after 15 years of different soil management practices
156
Philip, J.R., 1957. The theory of infiltration: 4. Sorptivity and algebraic infiltration equations. Soil Sci. 84: 257-264.
Philip, J.R., 1985. Approximate analysis of the borehole permeameter in unsaturated soils. Water Resour. Res. 21: 1025-1033.
Reynolds, W.D., Elrick, D.E., 1990. Ponded infiltration from a single ring: I. Analysis of steady flow. Soil Sci. Soc. Am. J. 54: 1233-1241.
Reynolds, W.D., Elrick, D.E., 1991. Determination of hydraulic conductivity using a tension infiltrometer. Soil Sci. Soc. Am. J. 55: 633-639.
Richards, L.A., 1931. Capillary conduction of liquids through porous mediums. Physics, 1: 318-333.
Sobieraj, J.A., Elsenbeer, H., Cameron, G., 2004. Scale dependency in spatial patterns of saturated hydraulic conductivity. Catena, 55: 49-77.
Starr, J.L., 1990. Spatial and temporal variation of ponded infiltration. Soil Sci. Soc. Am. J. 54: 629-636.
Šimůnek, J., Angulo-Jaramillo, R., Shaap, M.G., Vandervaere, J.P., van Genuchten, M.T., 1998. Using an inverse method to estimate the hydraulic properties of crusted soils from tension-disc infiltrometer data. Geoderma, 86: 61-81.
Šimůnek, J., Šejna, M., van Genuchten, M.Th., 1999. The HYDRUS-2D software package for simulating the two-
dimensional movement of water, heat, and multiple solutes in variably-saturated media. Version 2.0. U.S. Salinity laboratory, Agricultural research service, U.S. department of agriculture, Riverside, California.
Šimůnek, J., van Genuchten, M.Th., 1996. Estimating unsaturated soil hydraulic properties from tension disc infiltrometer data by numerical inversion. Water Resour. Res. 32: 2683-2696.
Šimůnek, J., van Genuchten, M.Th., 1997. Parameter estimation of soil hydraulic properties from multiple tension disc infiltrometer data. Soil Sci. 162: 383-398.
Xu, D., Mermoud, A., 2001. Topsoil properties as affected by tillage practices in North China. Soil Till. Res. 60: 11-19.
van Genuchten, M. Th., 1980. A closed-form equation for predicting the hydraulic conductivity of unsaturated soils. Soil Sci. Soc. Am. J. 44: 892-898.
Zachmann, J.E., Linden, D.R., Clapp, C.E., 1987. Macroporous infiltration and redistribution as affected by earthworms, tillage and residue. Soil Sci. Soc. Am. J. 51: 1580-1586.
Zhang, R., 1997. Infiltration models for the disk infiltrometer. Soil Sci. Soc. Am. J. 61: 1597-1603.
http://www.mapy.cz; accessed on 20 March 2008. http://www.vurv.cz/meteo; accessed on 6 October 2009.