
Hybrid methods for combined experimental and computational ...
31
J. Chem. Phys. 153, 240901 (2020); https://doi.org/10.1063/5.0026025 153, 240901 © 2020 Author(s). Hybrid methods for combined experimental and computational determination of protein structure Cite as: J. Chem. Phys. 153, 240901 (2020); https://doi.org/10.1063/5.0026025 Submitted: 20 August 2020 . Accepted: 10 November 2020 . Published Online: 29 December 2020 Justin T. Seffernick, and Steffen Lindert COLLECTIONS This paper was selected as Featured
-
Upload
khangminh22 -
Category
Documents
-
view
2 -
download
0
Transcript of Hybrid methods for combined experimental and computational ...

J. Chem. Phys. 153, 240901 (2020); https://doi.org/10.1063/5.0026025 153, 240901
© 2020 Author(s).
Hybrid methods for combined experimentaland computational determination ofprotein structure Cite as: J. Chem. Phys. 153, 240901 (2020); https://doi.org/10.1063/5.0026025Submitted: 20 August 2020 . Accepted: 10 November 2020 . Published Online: 29 December 2020
Justin T. Seffernick, and Steffen Lindert
COLLECTIONS
This paper was selected as Featured
The Journalof Chemical Physics PERSPECTIVE scitation.org/journal/jcp
Hybrid methods for combined experimentaland computational determination of proteinstructure
Cite as: J. Chem. Phys. 153, 240901 (2020); doi: 10.1063/5.0026025Submitted: 20 August 2020 • Accepted: 10 November 2020 •Published Online: 29 December 2020
Justin T. Seffernick and Steffen Linderta)
AFFILIATIONSDepartment of Chemistry and Biochemistry, Ohio State University, Columbus, Ohio 43210, USA
a)Current address: Department of Chemistry and Biochemistry, Ohio State University, 2114 Newman andWolfrom Laboratory,100 W. 18th Avenue, Columbus, OH 43210, USA. Author to whom correspondence should be addressed: [email protected]: 614-292-8284. Fax: 614-292-1685
ABSTRACTKnowledge of protein structure is paramount to the understanding of biological function, developing new therapeutics, and making detailedmechanistic hypotheses. Therefore, methods to accurately elucidate three-dimensional structures of proteins are in high demand. While thereare a few experimental techniques that can routinely provide high-resolution structures, such as x-ray crystallography, nuclear magnetic res-onance (NMR), and cryo-EM, which have been developed to determine the structures of proteins, these techniques each have shortcomingsand thus cannot be used in all cases. However, additionally, a large number of experimental techniques that provide some structural infor-mation, but not enough to assign atomic positions with high certainty have been developed. These methods offer sparse experimental data,which can also be noisy and inaccurate in some instances. In cases where it is not possible to determine the structure of a protein experimen-tally, computational structure prediction methods can be used as an alternative. Although computational methods can be performed withoutany experimental data in a large number of studies, inclusion of sparse experimental data into these prediction methods has yielded signifi-cant improvement. In this Perspective, we cover many of the successes of integrative modeling, computational modeling with experimentaldata, specifically for protein folding, protein–protein docking, and molecular dynamics simulations. We describe methods that incorpo-rate sparse data from cryo-EM, NMR, mass spectrometry, electron paramagnetic resonance, small-angle x-ray scattering, Förster resonanceenergy transfer, and genetic sequence covariation. Finally, we highlight some of the major challenges in the field as well as possible futuredirections.Published under license by AIP Publishing. https://doi.org/10.1063/5.0026025., s
I. INTRODUCTION
In order to solve many of the large, pressing problems in scienceand medicine, methods to determine accurate structures of pro-teins and protein complexes are necessary. Understanding proteinstructure gives us an enhanced ability to understand and manip-ulate protein function. Obtaining accurate protein structures cansignificantly facilitate the discovery of mechanisms of the machin-ery of life. Once structures are determined and mechanisms ofaction are better understood, new therapeutics can be developedmuch more rapidly, often enhanced by the use of computer-aided
structure-based drug discovery (SBDD) methods.1 For example,with the determination of a protein structure, SBDD can drasticallyreduce the number of small molecules to be screened experimen-tally, excluding the most unlikely binders based on computationalpredictions.
There are some experimental methods that can be used todetermine the structures of proteins at resolutions where the posi-tions of heavy atoms can be elucidated (<3 Å), namely, x-ray crys-tallography, nuclear magnetic resonance (NMR) spectroscopy, andcryo-electron microscopy (cryo-EM). These methods have been andwill continue to be central to the field of structural biology.2–4
J. Chem. Phys. 153, 240901 (2020); doi: 10.1063/5.0026025 153, 240901-1
Published under license by AIP Publishing
The Journalof Chemical Physics PERSPECTIVE scitation.org/journal/jcp
Determined structures are typically deposited in the Protein DataBank (PDB), making them available to the scientific community.However, while the data collected from these methods can be usedto unambiguously determine the 3D coordinates of most or all ofthe atoms, they each offer some unfortunate shortcomings. Whilex-ray crystallography is still the most common structure determina-tion method used for stable, ordered proteins (accounting for ∼89%of protein structures in the PDB5), determining the proper crystal-lization conditions for a specific protein system can take months toyears. Another downside of x-ray crystallography is that it can bedifficult to obtain the structures of large complexes. On the otherhand, NMR (∼7% of protein structures in the PDB5) is beneficial inthat it is the most commonly used method to determine an ensem-ble of structures, providing information on conformational flexibil-ity, which has made it more amenable to intrinsically disorderedproteins.6 The downside to NMR as a full structure determinationmethod is that it is typically limited to smaller structures (with someexceptions) due to issues with peak overlapping and line broad-ening. Finally, cryo-EM (∼3% of protein structures in the PDB5)continues to increase in popularity due to its benefits such as notrequiring crystallization and utilizing conditions that are relativelynative-like. Despite these benefits, density maps at high resolutioncurrently cannot be routinely achieved, and the method is typicallylimited to large structures (although a benefit over x-ray crystallog-raphy and NMR is that it can be used on very large complexes).Additionally, all three of these methods require large amounts ofsample as compared to some other experimental methods discussedlater (although cryo-EM can be performed using much less samplethan the other two methods). Despite the strong interest in proteinstructure determination, there is currently a huge gap between thenumber of known sequences and experimentally determined struc-tures deposited in the PDB, highlighting the difficulties of structureelucidation. At the time of writing, there were about 185 × 106
known sequences in the UniProt database,7 while there were onlyabout 163 000 structures containing proteins in the PDB,5 with manyexhibiting high sequence similarity to each other. While there aremany reasons for this discrepancy (many of which are due to thedescribed limitations), one reason is conformational heterogeneity.Dynamic systems that cannot be fully described by a single structureare typically harder to fully characterize experimentally (e.g., theyare difficult to crystallize). Nonetheless, these methods undoubtedlywill remain central to protein structure determination in the future,and advances are still being made, but it would be beneficial to thefield to have the ability to consistently construct accurate structuresof protein systems using data from easier-to-perform experimentalmethods.
There are many examples of experimental methods that aremore accessible, easier to perform, and that provide some struc-tural information, but from which the data alone are not enoughto fully establish the structure of a protein. These data are sparse,in that they do not contain enough information to fully constrainthe structure, but are also often simultaneously ambiguous (notspecific, allowing for multiple interpretations) and uncertain (highfalse-positive signals).8 Nevertheless, some types of experimentaldata may provide enough information for full structure determi-nation but are not practically usable in that way due to a lack offull understanding of the structural connection. For example, NMRchemical shifts (CSs) provide a large amount of information (as
they are very sensitive to changes in structure), but currently, thetranslation between CS and structure is not perfectly understood.In summary, the experimental data that cannot practically be usedfor full protein structure determination may inherently not provideenough information (e.g., not enough measurements, ambiguity,and uncertainty) or may not be understood well enough for transla-tion to the protein structure (or in many cases, a combination of thetwo).
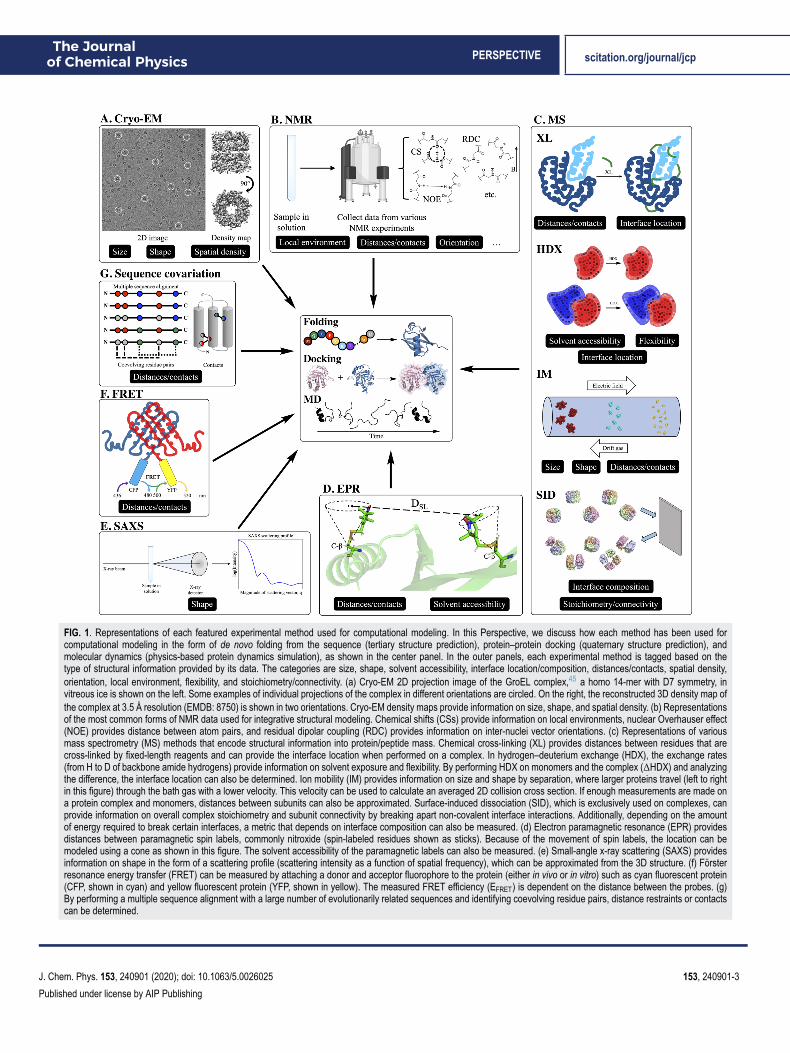
Some examples of techniques that can be used to collect thesetypes of data are cryo-EM (when high-resolution density mapscannot be obtained), NMR (when a full collection of structuredetermination experiments are not performed), mass spectrom-etry (MS), electron paramagnetic resonance (EPR) spectroscopy,small-angle x-ray scattering (SAXS), Förster resonance energy trans-fer (FRET) spectroscopy, and genome sequencing (for the anal-ysis of co-evolving residues). These methods will each be high-lighted in more detail later in this Perspective, but, in general, theyprovide structural information such as size, shape, solvent acces-sibility, interface location/composition, distances/contacts, spatialdensity, orientation, local environment, flexibility, and stoichiom-etry/connectivity. Figure 1 shows representations for each experi-mental method as well as tags indicating what type of structuralinformation that they can provide for modeling efforts. While know-ing these types of information can be very beneficial, unfortunatelythey do not unambiguously specify the three-dimensional atomiccoordinates.
An alternative approach for protein structure determinationis to use computational prediction methods. Over the past 20–30years, a large number of software packages and online tools havebeen developed toward structural modeling of proteins, manyfreely available for use. These algorithms can be broadly bro-ken down into three categories: protein folding (prediction ofthe tertiary structure from the sequence), protein–protein docking(prediction of the quaternary structure from the structures ofthe monomers), and molecular dynamics [MD, short timescale(usually ns to μs) sampling of conformational dynamics of a pro-tein]. As outlined in Levinthal’s paradox, computational proteinstructure prediction methods realistically cannot sample all pos-sible backbone conformations of a protein but rather generallyrely on stochastic approaches. For protein folding, most algorithmsuse Monte Carlo methods, sampling different backbone conforma-tions by iteratively inserting small fragments of backbone coordi-nates (with similar sequences) obtained from the PDB9 and scoringthe conformations with scoring functions that generally containknowledge- and/or physics-based terms.10 Some examples of pro-grams that can be used for ab initio protein structure predictionare Rosetta,9,11–13 BCL,14,15 QUARK,16 TOUCHSTONE II,17 andI-TASSER.18 Structure prediction can be further facilitated if thestructures of similar sequences are available in the PDB (homol-ogy modeling). Some examples of homology modeling meth-ods are RosettaCM,19 Modeller,20 SWISS-Model,21 and MOE.22
Quaternary structure prediction methods can either dock chainstogether (locally or globally) or build entire complexes using sym-metry. Specifically for local docking, Monte Carlo methods arecommon. These methods sample many orientations between dif-ferent protein chains and score models based on shape agree-ment and energetic enhancement of the interface(s). For globaldocking, fast Fourier transform methods (FFT) are generally used.
J. Chem. Phys. 153, 240901 (2020); doi: 10.1063/5.0026025 153, 240901-2
Published under license by AIP Publishing
The Journalof Chemical Physics PERSPECTIVE scitation.org/journal/jcp
FIG. 1. Representations of each featured experimental method used for computational modeling. In this Perspective, we discuss how each method has been used forcomputational modeling in the form of de novo folding from the sequence (tertiary structure prediction), protein–protein docking (quaternary structure prediction), andmolecular dynamics (physics-based protein dynamics simulation), as shown in the center panel. In the outer panels, each experimental method is tagged based on thetype of structural information provided by its data. The categories are size, shape, solvent accessibility, interface location/composition, distances/contacts, spatial density,orientation, local environment, flexibility, and stoichiometry/connectivity. (a) Cryo-EM 2D projection image of the GroEL complex,45 a homo 14-mer with D7 symmetry, invitreous ice is shown on the left. Some examples of individual projections of the complex in different orientations are circled. On the right, the reconstructed 3D density map ofthe complex at 3.5 Å resolution (EMDB: 8750) is shown in two orientations. Cryo-EM density maps provide information on size, shape, and spatial density. (b) Representationsof the most common forms of NMR data used for integrative structural modeling. Chemical shifts (CSs) provide information on local environments, nuclear Overhauser effect(NOE) provides distance between atom pairs, and residual dipolar coupling (RDC) provides information on inter-nuclei vector orientations. (c) Representations of variousmass spectrometry (MS) methods that encode structural information into protein/peptide mass. Chemical cross-linking (XL) provides distances between residues that arecross-linked by fixed-length reagents and can provide the interface location when performed on a complex. In hydrogen–deuterium exchange (HDX), the exchange rates(from H to D of backbone amide hydrogens) provide information on solvent exposure and flexibility. By performing HDX on monomers and the complex (ΔHDX) and analyzingthe difference, the interface location can also be determined. Ion mobility (IM) provides information on size and shape by separation, where larger proteins travel (left to rightin this figure) through the bath gas with a lower velocity. This velocity can be used to calculate an averaged 2D collision cross section. If enough measurements are made ona protein complex and monomers, distances between subunits can also be approximated. Surface-induced dissociation (SID), which is exclusively used on complexes, canprovide information on overall complex stoichiometry and subunit connectivity by breaking apart non-covalent interface interactions. Additionally, depending on the amountof energy required to break certain interfaces, a metric that depends on interface composition can also be measured. (d) Electron paramagnetic resonance (EPR) providesdistances between paramagnetic spin labels, commonly nitroxide (spin-labeled residues shown as sticks). Because of the movement of spin labels, the location can bemodeled using a cone as shown in this figure. The solvent accessibility of the paramagnetic labels can also be measured. (e) Small-angle x-ray scattering (SAXS) providesinformation on shape in the form of a scattering profile (scattering intensity as a function of spatial frequency), which can be approximated from the 3D structure. (f) Försterresonance energy transfer (FRET) can be measured by attaching a donor and acceptor fluorophore to the protein (either in vivo or in vitro) such as cyan fluorescent protein(CFP, shown in cyan) and yellow fluorescent protein (YFP, shown in yellow). The measured FRET efficiency (EFRET) is dependent on the distance between the probes. (g)By performing a multiple sequence alignment with a large number of evolutionarily related sequences and identifying coevolving residue pairs, distance restraints or contactscan be determined.
J. Chem. Phys. 153, 240901 (2020); doi: 10.1063/5.0026025 153, 240901-3
Published under license by AIP Publishing
The Journalof Chemical Physics PERSPECTIVE scitation.org/journal/jcp
FFT methods sample the large conformational space with highefficiency and evaluate the fit between subunits based on shapecomplementarity. Some methods for protein–protein dockingare RosettaDock,23,24 Rosetta SymDock,25 DOT,26 HADDOCK,27
ZDOCK,28 ClusPro,29 PatchDock/SymmDock,30 and FTDOCK.31
Finally, while it is certainly powerful to obtain or predict a staticstructure, many proteins can adopt multiple different physiolog-ically relevant conformations in vivo. MD offers the ability tosample some of these different structures, which can then beused to gain crucial insight into the function. MD algorithmstypically use classical, physics-based force fields32–35 (molecularmechanics, either all atom or coarse-grained) to simulate thedynamics and model the structure in relevant solution condi-tions (proteins are typically embedded in explicit water boxeswith periodic boundary conditions during the simulations). Someprograms that can be used to perform MD simulations areNAMD,36 Amber,37 GROMACS,38 Desmond,39 CHARMM,40 andOpenMM.41 While these methods for protein structure predictionand modeling have been very successful, de novo modeling remainsa challenge.
Due to the challenges of both computational modeling andinterpreting the data of experimental methods, it has becomeincreasingly popular to incorporate restraints [reward or penaltyfunctions that quantify the agreement with the experiment insome way, i.e., (1) based on deviation from the experiment usinga forward model or (2) using geometric functions derived fromthe experiment] from sparse experimental data into modelingalgorithms. While we generally refer to the experimental meth-ods as either techniques that routinely elucidate high-resolutionstructures or those that provide some structural information, butnot enough to fully determine atomic coordinates; in reality, thecomputational methods using these data exist on a spectrum.Depending on the amount of information provided as well as theunderstanding of those data with relation to the structure, themethods exist somewhere in the spectrum of de novo structureprediction (from the sequence only), structure prediction usingsparse experimental data, and full structure determination (x-raycrystallography, NMR, and cryo-EM). While not a focus of thisPerspective, we note that dynamic systems with large confor-mational heterogeneity may especially require integrative model-ing. For these systems, however, it is important to be aware thatmultiple conformations may be present in the data and are rel-evant to the function. Because of the popularity of integrativemodeling, the biennial Critical Assessment of Structure Predic-tion (CASP) competition added structure prediction categories formodeling with multiple varieties of data from experiments suchas NMR, SAXS, cross-linking MS, small-angle neutron scatter-ing (SANS), and FRET in CASP13.42 In addition to the incor-poration of restraints from the experimental data into the exist-ing structure modeling algorithms, software exclusively focusing onstructure modeling based on the experimental data, such as theIntegrative Modeling Platform (IMP),43,44 has also been devel-oped. In this Perspective, we highlight many different ways thatthe experimental data have been incorporated into protein tertiarystructure prediction, protein–protein docking, and MD. This Per-spective will focus on methods that generate experimental restraintsfrom cryo-EM, NMR, MS, EPR, SAXS, FRET, and genetic sequencedata.
II. INTEGRATIVE MODELING: COMBININGEXPERIMENTAL DATA AND COMPUTATIONALMODELINGA. Cryo-electron microscopy
Cryo-EM is performed by rapidly freezing an aqueous pro-tein sample in a thin layer of vitreous ice and then analyzing thefrozen sample with electron microscopy. From this analysis, 2Dimages of individual molecules in many different orientations canbe obtained. After taking numerous measurements and obtainingthousands of 2D projections, a 3D density map of the protein canbe reconstructed by combining projections of single particles in dif-ferent rotational orientations. An example for GroEL, a homo 14-mer with D7 symmetry, is shown in Fig. 1(a): the 2D image onthe left and density map on the right. However, the resolution ofcryo-EM density maps can vary significantly (∼1.25 Å to >20 Å).46,47
At low resolutions, the overall shape and topography can beobserved. As the resolution increases to ∼5 Å to 7 Å, secondarystructure elements such as alpha helices and beta sheets becomevisible, but side chains are not resolved until ∼3 Å or higher reso-lution is obtained. Recent years have seen a resolution revolution,where the number of high-resolution structures (and structures ingeneral) deposited in the Electron Microscopy Data Bank (EMDB)has increased significantly.48 For example, in as late as 2014, nomaps with a resolution higher than 3 Å had yet been deposited inthe EMDB, while in 2019 alone, 265 maps of such resolution werereleased. Over the same time frame, the total number of depositedmaps has increased from 2725 to 11 363. Despite this success, high-resolution maps are not yet routinely obtained from cryo-EM exper-iments, and thus, many medium- to low-resolution density mapsare available for modeling. Over the years, numerous computationalmethods have been developed to model the structure of proteinsbased on these density maps.49 In a recent protein–protein dock-ing study, it was shown that the information contained in evenvery low-resolution density maps (∼20 Å) was more useful for inte-grative modeling than contact or interface information.50 Resultsfrom this study showing the effectiveness of the different types ofinformation for modeling are shown in Fig. 2. In this Perspective,we will focus on computational methods that use density maps forrigid fitting, flexible fitting (refinement), and de novo modeling.However, it is important to point out that the sophisticated com-putational algorithms have been developed to construct 3D struc-tures from the obtained 2D projections.51–53 Additionally, methodshave also been developed to identify secondary structural elements(SSEs) from a density map (of which many modeling methods takeadvantage).54–58
The original computational methods developed to model thestructure based on cryo-EM density maps were rigid fitting meth-ods. Rigid fitting methods attempt to place previously obtainedhigh-resolution structures into density maps without altering thetertiary structures. One of the first algorithms to perform rigid fit-ting was Situs.59 This method uses an exhaustive docking approachto sample all possible conformations. Other examples of rigid fit-ting methods have been developed based on rotational/translationalsearch (EMfit),60 fast Fourier transform,61–63 grid-threading MonteCarlo,64 spherical harmonics for rotational sampling (ADP_EM),65
and geometric hashing (BCL::EM-Fit).66 While rigid fitting meth-ods are often used with tertiary structures obtained experimentally,
J. Chem. Phys. 153, 240901 (2020); doi: 10.1063/5.0026025 153, 240901-4
Published under license by AIP Publishing

The Journalof Chemical Physics PERSPECTIVE scitation.org/journal/jcp
FIG. 2. Comparison of the utility of differ-ent types of information (green: contacts;orange: interface; and blue: EM den-sity) for protein–protein docking. Dockingresults for a benchmark set of 162 com-plexes were evaluated based on the suc-cess rate (percentages of cases with agood model in the top N = 1, 10, 20, 100,or all), Fnat (fraction of native contacts),L-RMSD (ligand RMSD), and I-RMSD(interface RMSD). For all metrics, infor-mation on EM density was the most ben-eficial for integrative modeling. Reprintedwith permission from de Vries et al., Bio-phys. J. 110(4), 785–797 (2016). Copy-right 2016 Cell Press.
generated homology models of monomers have been built intocomplexes using rigid modeling.67
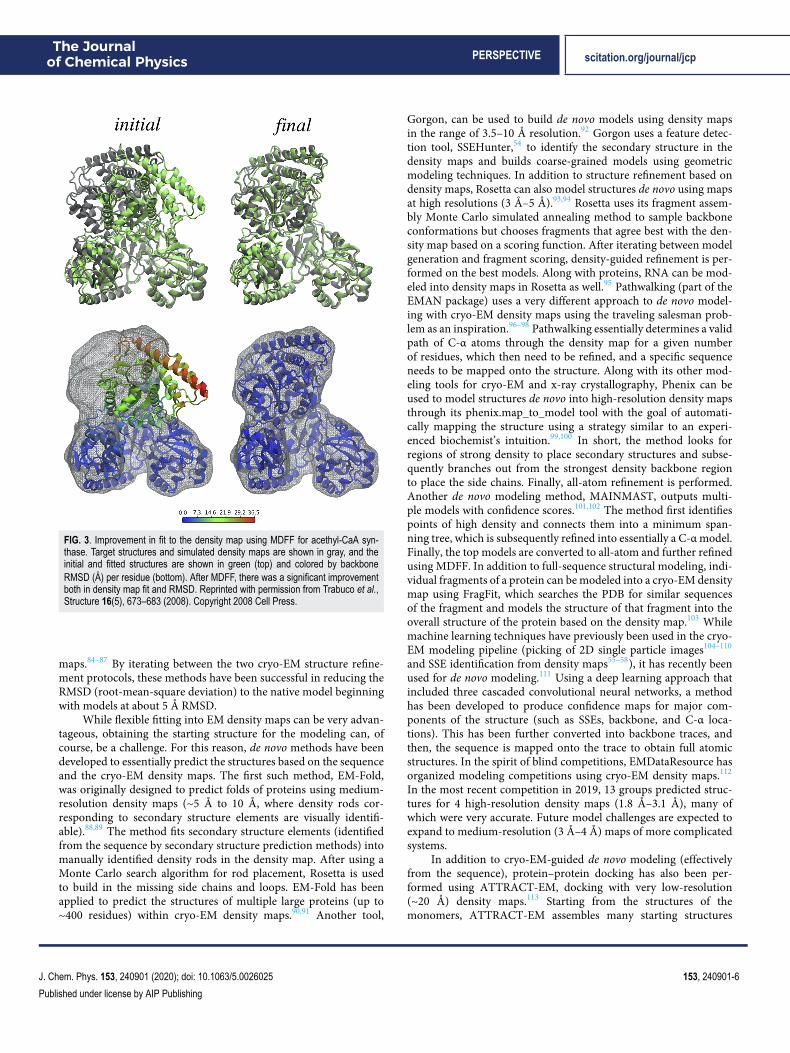
Flexible fitting methods, which perform fitting into densitymaps, while allowing changes in tertiary structure, have sincebecome more common as structure refinement tools. One branch ofthese methods uses molecular dynamics simulations to sample struc-tures while using the well-established MD force fields combinedwith cryo-EM density maps to energetically guide the sampling.The molecular dynamics flexible fitting (MDFF,68,69 using NAMD)method was developed to guide the structures of biomoleculestoward density maps by including a density map-based potentialfunction. MDFF has been shown to be very robust as it can alsobe performed on membrane proteins,70 it can include additionalsymmetry restraints,71 and further advances have been made suchthat it can be used with a wide range of resolutions (even down tosub-5 Å).72,73 An example of the drastic improvement in terms ofagreement with a density map that can be obtained using MDFFis shown in Fig. 3. A similar approach to flexible fitting has beenperformed using Amber, where the potential was based on cross cor-relation between the density map and the structure.74 In additionto all-atom modeling, a coarse-grained, Go-model (which translatedthe initial structure to C-α positions and native potentials betweenthe C-α’s) has been used to simulate proteins based on densitymaps.75 Finally, REMDFit that increases conformational fitting trialswith a variety of different force constants has been developed.76
As an alternative to using MD to sample conformations forEM-based structure refinement, and to possibly obtain more diverse
backbone sampling, normal mode analysis (NMA) can also beused. In NMA, backbones are sampled by perturbing the struc-ture along normal modes, collective motions where bonds vibratewith the same phase and frequency.77 Methods have been devel-oped to use NMA to distort the structure away from its startingstate and toward agreement with the density map. In order to probemore physically realistic deformations, NMFF-EM only considerslow-energy motions of the protein to guide the structure towardthe low-resolution density maps.78,79 Rather than excluding high-energy normal modes, iMODFIT uses all normal modes for itscoarse-grained density map fitting.80 Because of this, a larger rangeof conformations can be sampled including large scale conforma-tional changes. Similarly to NMFF-EM, iMODFIT samples only thelow frequency vibrations and can efficiently sample using internalcoordinates.81
In addition to cryo-EM-based flexible fitting with MD andNMA, structure refinement can also be performed using Rosetta.82
The density-based refinement performs particularly well on high-resolution density maps (<4.5 Å). In short, segments (fragments)of the protein are optimized within the density map by first rigidbody minimizing, then optimizing the side chain rotamers, andfinally minimizing torsions with the inclusion of density agreementinto the force field. A similar, automated approach can be used torefine models of complexes into large density maps.83 Additionally,exploiting the orthogonality of the force fields, MDFF has been suc-cessfully combined iteratively with Rosetta to refine the structuresof both soluble and membrane proteins based on cryo-EM density
J. Chem. Phys. 153, 240901 (2020); doi: 10.1063/5.0026025 153, 240901-5
Published under license by AIP Publishing
The Journalof Chemical Physics PERSPECTIVE scitation.org/journal/jcp
FIG. 3. Improvement in fit to the density map using MDFF for acethyl-CaA syn-thase. Target structures and simulated density maps are shown in gray, and theinitial and fitted structures are shown in green (top) and colored by backboneRMSD (Å) per residue (bottom). After MDFF, there was a significant improvementboth in density map fit and RMSD. Reprinted with permission from Trabuco et al.,Structure 16(5), 673–683 (2008). Copyright 2008 Cell Press.
maps.84–87 By iterating between the two cryo-EM structure refine-ment protocols, these methods have been successful in reducing theRMSD (root-mean-square deviation) to the native model beginningwith models at about 5 Å RMSD.
While flexible fitting into EM density maps can be very advan-tageous, obtaining the starting structure for the modeling can, ofcourse, be a challenge. For this reason, de novo methods have beendeveloped to essentially predict the structures based on the sequenceand the cryo-EM density maps. The first such method, EM-Fold,was originally designed to predict folds of proteins using medium-resolution density maps (∼5 Å to 10 Å, where density rods cor-responding to secondary structure elements are visually identifi-able).88,89 The method fits secondary structure elements (identifiedfrom the sequence by secondary structure prediction methods) intomanually identified density rods in the density map. After using aMonte Carlo search algorithm for rod placement, Rosetta is usedto build in the missing side chains and loops. EM-Fold has beenapplied to predict the structures of multiple large proteins (up to∼400 residues) within cryo-EM density maps.90,91 Another tool,
Gorgon, can be used to build de novo models using density mapsin the range of 3.5–10 Å resolution.92 Gorgon uses a feature detec-tion tool, SSEHunter,54 to identify the secondary structure in thedensity maps and builds coarse-grained models using geometricmodeling techniques. In addition to structure refinement based ondensity maps, Rosetta can also model structures de novo using mapsat high resolutions (3 Å–5 Å).93,94 Rosetta uses its fragment assem-bly Monte Carlo simulated annealing method to sample backboneconformations but chooses fragments that agree best with the den-sity map based on a scoring function. After iterating between modelgeneration and fragment scoring, density-guided refinement is per-formed on the best models. Along with proteins, RNA can be mod-eled into density maps in Rosetta as well.95 Pathwalking (part of theEMAN package) uses a very different approach to de novo model-ing with cryo-EM density maps using the traveling salesman prob-lem as an inspiration.96–98 Pathwalking essentially determines a validpath of C-α atoms through the density map for a given numberof residues, which then need to be refined, and a specific sequenceneeds to be mapped onto the structure. Along with its other mod-eling tools for cryo-EM and x-ray crystallography, Phenix can beused to model structures de novo into high-resolution density mapsthrough its phenix.map_to_model tool with the goal of automati-cally mapping the structure using a strategy similar to an experi-enced biochemist’s intuition.99,100 In short, the method looks forregions of strong density to place secondary structures and subse-quently branches out from the strongest density backbone regionto place the side chains. Finally, all-atom refinement is performed.Another de novo modeling method, MAINMAST, outputs multi-ple models with confidence scores.101,102 The method first identifiespoints of high density and connects them into a minimum span-ning tree, which is subsequently refined into essentially a C-α model.Finally, the top models are converted to all-atom and further refinedusing MDFF. In addition to full-sequence structural modeling, indi-vidual fragments of a protein can be modeled into a cryo-EM densitymap using FragFit, which searches the PDB for similar sequencesof the fragment and models the structure of that fragment into theoverall structure of the protein based on the density map.103 Whilemachine learning techniques have previously been used in the cryo-EM modeling pipeline (picking of 2D single particle images104–110
and SSE identification from density maps55–58), it has recently beenused for de novo modeling.111 Using a deep learning approach thatincluded three cascaded convolutional neural networks, a methodhas been developed to produce confidence maps for major com-ponents of the structure (such as SSEs, backbone, and C-α loca-tions). This has been further converted into backbone traces, andthen, the sequence is mapped onto the trace to obtain full atomicstructures. In the spirit of blind competitions, EMDataResource hasorganized modeling competitions using cryo-EM density maps.112
In the most recent competition in 2019, 13 groups predicted struc-tures for 4 high-resolution density maps (1.8 Å–3.1 Å), many ofwhich were very accurate. Future model challenges are expected toexpand to medium-resolution (3 Å–4 Å) maps of more complicatedsystems.
In addition to cryo-EM-guided de novo modeling (effectivelyfrom the sequence), protein–protein docking has also been per-formed using ATTRACT-EM, docking with very low-resolution(∼20 Å) density maps.113 Starting from the structures of themonomers, ATTRACT-EM assembles many starting structures
J. Chem. Phys. 153, 240901 (2020); doi: 10.1063/5.0026025 153, 240901-6
Published under license by AIP Publishing
The Journalof Chemical Physics PERSPECTIVE scitation.org/journal/jcp
and restrains the further refinement based on symmetry and theagreement with the density map, with final models being refinedfurther. In the Integrative Modeling Platform (IMP), a Bayesianscoring function to quantify the agreement between structures anddensity maps has been developed.114 The input to this integrativemodeling is the structures of the monomers. From these struc-tures, monomers are fitted into their portions of the density maps,and they are assembled into complexes using Monte Carlo replicaexchange. Importantly, the scoring function includes prior informa-tion, such as how well the monomer agreed with their portions of thedensity map.
Cryo-EM is certainly one of the fastest growing techniques inprotein structure determination. Modeling approaches are used forboth high- and low-resolution density maps obtained from cryo-EMto study many different systems involving proteins and protein com-plexes. For cryo-EM, the biggest challenge is dealing with hetero-geneous and dynamic systems where multiple conformations mayblur the overall density map. Moving forward, cryo-EM will likelybecome the prime structure determination method, elucidating pro-tein structures for many systems that have long evaded traditionaltechniques such as x-ray crystallography and NMR.
B. Nuclear magnetic resonance spectroscopyAs previously mentioned, solution NMR can be used to
uniquely determine the 3D structure for some small protein systems.However, doing so requires the collection of a full set of structuredetermination data from a variety of different NMR experiments.Depending on the experiment, prior to collecting data, the proteinsneed to be expressed in isotopically labeled media using NMR active13C and/or 15N isotopes. Optimizing the expression medium andconditions to produce large amounts of sample is incredibly expen-sive and challenging due to the inherent cost of isotopically labeledmaterials. While the specific experiments performed to determinethe protein structure with NMR can vary, typically, this requiresassigning the peaks of the 2D HSQC (heteronuclear single quan-tum coherence) spectra in order to determine the sequence positionsof observed amide chemical shifts and then performing 2D NOESY(nuclear Overhauser effect spectroscopy) experiments to determinewhich atoms are close in space, as well as some other experimentsto determine additional restraints. Assigning the backbone peaksof the HQSC spectra can be very time consuming and expensive,requiring multiple separate experiments [such as 3D HNCACB and3D CBCA(CO)NH] which require days to weeks of data collectionfor each. In addition, because of the continuous data collection timenecessary for these experiments, the proteins must be very stable insolution. Once enough distance restraints from NOESY as well asadditional restraints such as dihedral angles and inter-nuclei vectororientation are defined (such that the restraints are abundant andnot sparse), an ensemble of structures can nearly unambiguouslybe determined using simulated annealing. Despite the successes ofthe technique, typically, a full set of restraints can only be deter-mined for small proteins (although there are some exceptions withmore advanced techniques). Even then, the data collection and anal-ysis can be very expensive and time consuming (typically monthsto years and thousands of dollars). However, some useful struc-tural restraints can be determined from NMR experiments on alarger variety of systems without performing a full set of structure
determination experiments, saving time and money. In this Per-spective, we will highlight computational methods that can incor-porate sparse data from NMR into protein structure prediction andmodeling.
The restraints derived from sparse NMR data that are used forstructural modeling most commonly come in three forms: chem-ical shifts (CSs), distance restraints from NOE, and orientationalrestraints from residual dipolar coupling (RDC), as displayed inFig. 1(b). Chemical shifts provide information on the local environ-ment for specific atoms, which has been incorporated into mod-eling in multiple different ways, but, in general, tools are usedto predict CSs from the structure,115–118 which can then be com-pared to CS values derived from the experiment. NOE is a relax-ation technique, where the basic idea is to alter the spin on onenucleus and measure the effect that has on a different nucleus.Because the intensity of the measurement is dependent on the dis-tance between two atoms, NOE can provide through-space dis-tance restraints for atoms that are within approximately 5 Å. WhileNOE is an important part of full structure determination fromNMR as described above, often, sparse amounts of these restraintscan be measured and input into computational modeling methods.Finally, RDC arises when proteins in solution align to the mag-netic field, facilitated by the alignment medium. When this hap-pens, the amount of dipolar coupling observed is dependent onthe angle between the inter-nuclei vector and the magnitude ofthe magnetic field. These measurements can provide orientationalrestraints for computational modeling as RDCs can be predictedfrom the structure and compared to the experiment.119 In additionto using these sparse data for structural modeling (i.e., using themas restraints in structure prediction and simulations, which will bethe focus of the rest of this section), NMR data have also been usedto parameterize120,121 and evaluate122–126 molecular mechanics forcefields.
Chemical shifts, which are obtained in the early stages of anyNMR structure determination protocol as previously described, canbe used to guide protein structure prediction as they encode infor-mation about local environments. Many of the CS-based structureprediction methods use tools such as TALOS, which can be used topredict secondary structure or torsion angles from CS.127–129 Oneof the first methods to incorporate chemical shifts into structureprediction was CHESHIRE.130 In CHESHIRE, the secondary struc-tures are predicted based on both sequence and chemical shifts,which are then used to predict backbone torsion angles. These tor-sion angles are subsequently used to select fragments from the PDB,which are then used for Monte Carlo fragment insertion. Whilethese fragments are typically selected based on the local sequencesimilarity for ab initio modeling, choosing them based on CS dataensures that the fragments have backbones that are more native-like. In a benchmark, CHESHIRE predicted native-like structures for11 proteins with up to 123 residues. A similar approach is taken inCS-Rosetta.131–133 When Rosetta performs Monte Carlo simulationsto sample the protein structure, it does so by inserting backboneangles of fragments obtained from the PDB. Similar to CHESHIRE,CS-Rosetta includes a CS-based bias into the fragment selection inorder to select fragments with a similar local environment as wellas a sequence. The difference is that CS-Rosetta’s fragment selectionis performed by directly comparing experimental CS to predictedCS for fragments in the PDB (rather than first predicting bb
J. Chem. Phys. 153, 240901 (2020); doi: 10.1063/5.0026025 153, 240901-7
Published under license by AIP Publishing
The Journalof Chemical Physics PERSPECTIVE scitation.org/journal/jcp
torsions and then using that to select fragments). This method hasbeen shown to be successful even when only sparse chemical shiftassignments are available. While CS-based de novo methods such asCS-Rosetta and CHESHIRE have been successful, they are typicallyonly viable for smaller proteins (up to ∼125 residues). To overcomethis size limitation, CS data can also be incorporated into homol-ogy modeling for proteins with the available homologs. In Rosetta,this has been done by using the CS data to identify homologs ofthe target sequence and to align it to templates (alignment methodcalled POMONA), with RosettaCM used for the homology modeling(CS-RosettaCM).134 In a benchmark (proteins between 100 and 400residues), the method predicted accurate structures (<2.5 Å) in 15/16cases. In addition to tertiary structure prediction, CS values can beused to predict elements of the secondary structure, which could beadditionally helpful for modeling. MICS was developed to do thisand used a neural network to develop a model that can accuratelypredict the locations of helix capping and β-turn motifs as they areinherently dependent on the local environment and thus chemicalshifts.135
Distance restraints from NOE can be incredibly useful becauseone of the most difficult aspects of computational structure pre-diction methods is to correctly identify contacts that are close inspace but far in sequence. For example, this is one of the reasonswhy the structures of proteins with high beta sheet content are oftenmore difficult to predict. One of the first computational methods toillustrate the usefulness of NOE restraints into structure predictionwas RosettaNMR.136 The developed approach was to alter the scor-ing function to take into account the sparse NOE restraints (∼1 perresidue). Another method that was developed to use NOE restraintsfor structure prediction is TOUCHSTONEX.137,138 This methoduses a coarse-grained approach where proteins are represented byC-α, C-β, and side chain center of mass and an energy functionthat includes a pairwise energy term that is dependent on theNOE-derived atom–atom distances. Additionally, NOE restraintshave been incorporated into I-TASSER (I-TASSER-NMR).139 In thisapproach, a scoring function is used to not only evaluate distancerestraints for a single pair of atoms at a time but also to include theprobability that the NOE restraint could be assigned to a differentpair.
Furthermore, RDCs can be used in protein structure model-ing, providing information on the inter-nuclei vector orientations.RDC’s were incorporated into RosettaNMR by including an addi-tional score term with the Rosetta scoring function that quanti-fied the agreement between predicted119 and experimental RDC’s.140
Another method, REDCRAFT, has also been developed to modelstructures using RDC data.141 In this method, RDC fitness for eachpairwise residue–residue interaction is ranked and the structure isbuilt up one residue at a time based on this RDC agreement. WhileRDC data provide useful information to include into structure pre-diction, RDC’s are not typically used as the exclusive NMR restraintfor structure prediction.
Because they can provide different types of orthogonal infor-mation and are sometimes collected at the same time, incompletesets of CS, NOE, and RDC can be even more beneficial to structureprediction when used together. Even unassigned NMR data of thethree types have been shown to effectively predict accurate struc-tures using Rosetta.142 After initial structure generation, a MonteCarlo method was used to search for assignments that best match the
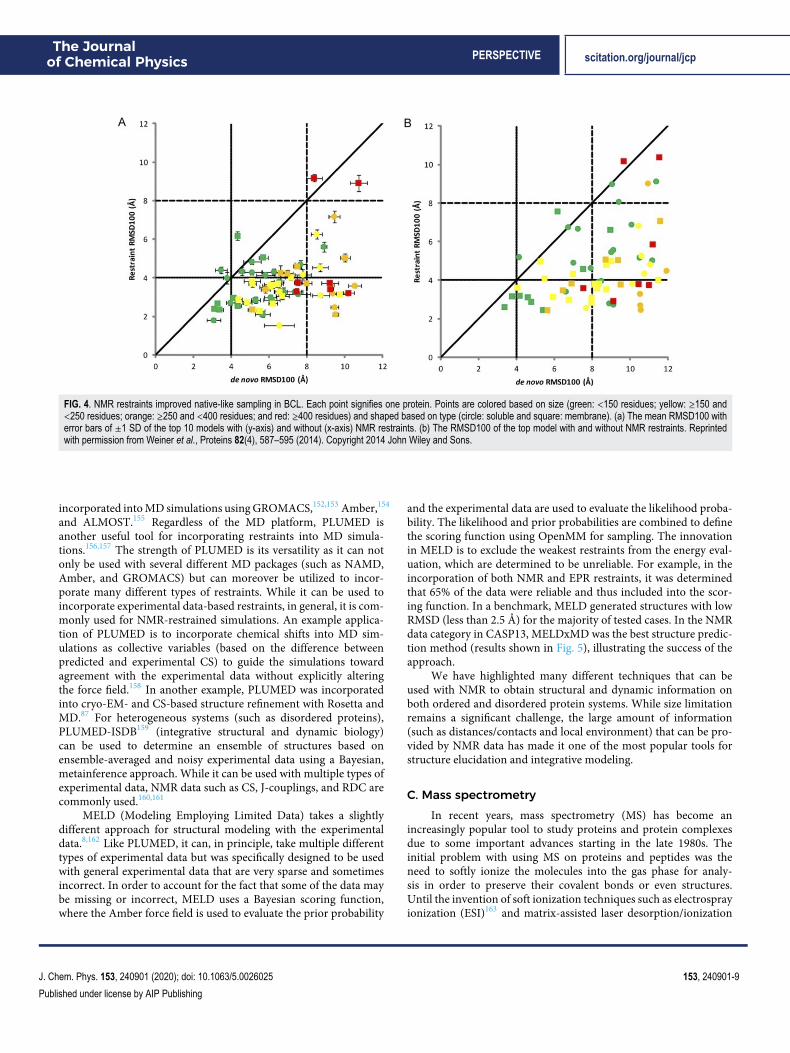
data and structures. This method was able to identify correct folds inall cases, and refinement was able to identify high-resolution mod-els in some cases. As integrative modeling has become more popularand strategies have been developed to model structures with NMRdata, many methods now commonly incorporate multiple types ofsparse NMR data into their structure prediction methods. CS, NOE,and RDC data have been used to build complexes in Rosetta fromthe sequence.143 This strategy is to use CS data to build monomers(CS-Rosetta) as previously described and dock them together withthe NOE interface and RDC restraints to predict the accurate struc-tures of homodimers. In this method, the RDC restraints wereincorporated by quantifying the deviation of predicted and experi-mental RDC as a scoring function into docking. Another method,MFR (molecular fragment replacement) also uses NMR restraintsfrom CS, NOE, and RDC to produce backbone models of a pro-tein.144 In this method, backbone data (CS and RDC) are used toselect fragments, and RDC and optionally NOE are used during thefragment assembly process. The biggest benefit of this method isthe speed. Additionally, CS, NOE, and RDC data can be used forcoarse-grained modeling in BCL::Fold and BCL::MP-Fold.145,146 Ina benchmark which included dozens of small proteins and somevery large (6 with more than 220 residues), the correct protein foldwas sampled in 65/67 cases. Figure 4 shows the improvement ofsampling when NMR restraints were included. Again in Rosetta, acombination of NOE and RDC restraints was used to predict struc-tures in CASP13.147 In this method, low-resolution models wereproduced using NOE distance restraints and RosettaCM was usedto refine based on NOE and RDC restraints. In the blind test set,more than half of the proteins were predicted with a RMSD of lessthan 3.5 Å.
While the most common types of NMR data used for modelingare CS, NOE, and RDC, other types of sparse data have been used forstructure prediction as well. For example, paramagnetic restraintsfrom NMR have also been used for structure prediction withRosettaNMR.148 As a supplement to the CS and NOE data, paramag-netic relaxation enhancements (interactions between nuclear spinsand paramagnetic metals or nitroxide spin-labels) can provide longdistance restraints (up to 40 Å, compared to ∼5 Å for NOE). Simi-lar to RDC, orientational restraints from pseudocontact shifts (PCS)can be obtained and used for modeling in RosettaNMR. In a largebenchmark (of both structure prediction and docking), both over-all sampling and the RMSD of the predicted structure improvedwhen the paramagnetic NMR data were included. While NMR istypically performed in the solution state for protein structural char-acterization, restraints can also be derived from solid-state NMR.Some examples include magic-angle-spinning assignments,149 dis-tance restraints,149 and angular restraints.150
In addition to structure prediction, NMR-based restraints canbe incorporated into molecular dynamics simulations (outside ofthe use of MD to refine high-resolution structures). These simu-lations are typically used for structure refinement, with the goalof sampling a structure or an ensemble of structures that is ingood agreement with both the experimental data and the molec-ular mechanics force field. The restraints can sometimes be usedfor long MD simulations as well. As early as the mid-1990s, dis-tance restraints from NOE were incorporated into MD simulationsusing GROMOS, showing the proof of principle of such methods.151
Furthermore, restraints from CS, RDC, and/or NOE were
J. Chem. Phys. 153, 240901 (2020); doi: 10.1063/5.0026025 153, 240901-8
Published under license by AIP Publishing
The Journalof Chemical Physics PERSPECTIVE scitation.org/journal/jcp
FIG. 4. NMR restraints improved native-like sampling in BCL. Each point signifies one protein. Points are colored based on size (green: <150 residues; yellow: ≥150 and<250 residues; orange: ≥250 and <400 residues; and red: ≥400 residues) and shaped based on type (circle: soluble and square: membrane). (a) The mean RMSD100 witherror bars of ±1 SD of the top 10 models with (y-axis) and without (x-axis) NMR restraints. (b) The RMSD100 of the top model with and without NMR restraints. Reprintedwith permission from Weiner et al., Proteins 82(4), 587–595 (2014). Copyright 2014 John Wiley and Sons.
incorporated into MD simulations using GROMACS,152,153 Amber,154
and ALMOST.155 Regardless of the MD platform, PLUMED isanother useful tool for incorporating restraints into MD simula-tions.156,157 The strength of PLUMED is its versatility as it can notonly be used with several different MD packages (such as NAMD,Amber, and GROMACS) but can moreover be utilized to incor-porate many different types of restraints. While it can be used toincorporate experimental data-based restraints, in general, it is com-monly used for NMR-restrained simulations. An example applica-tion of PLUMED is to incorporate chemical shifts into MD sim-ulations as collective variables (based on the difference betweenpredicted and experimental CS) to guide the simulations towardagreement with the experimental data without explicitly alteringthe force field.158 In another example, PLUMED was incorporatedinto cryo-EM- and CS-based structure refinement with Rosetta andMD.87 For heterogeneous systems (such as disordered proteins),PLUMED-ISDB159 (integrative structural and dynamic biology)can be used to determine an ensemble of structures based onensemble-averaged and noisy experimental data using a Bayesian,metainference approach. While it can be used with multiple types ofexperimental data, NMR data such as CS, J-couplings, and RDC arecommonly used.160,161
MELD (Modeling Employing Limited Data) takes a slightlydifferent approach for structural modeling with the experimentaldata.8,162 Like PLUMED, it can, in principle, take multiple differenttypes of experimental data but was specifically designed to be usedwith general experimental data that are very sparse and sometimesincorrect. In order to account for the fact that some of the data maybe missing or incorrect, MELD uses a Bayesian scoring function,where the Amber force field is used to evaluate the prior probability
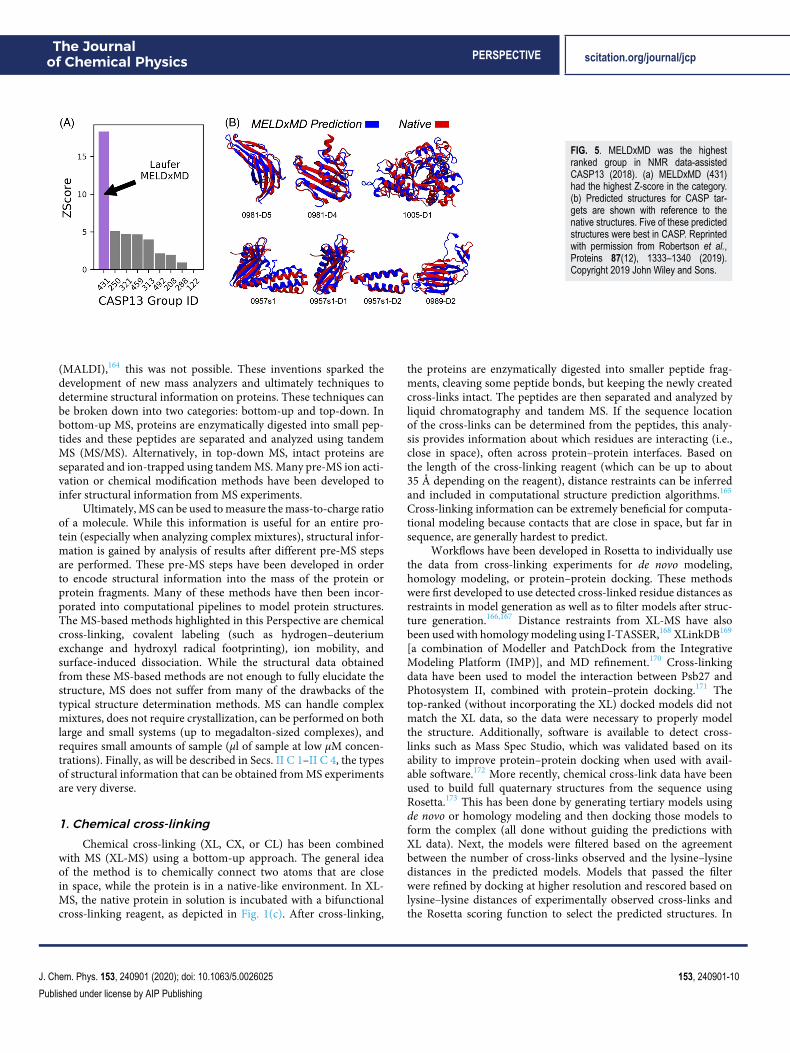
and the experimental data are used to evaluate the likelihood proba-bility. The likelihood and prior probabilities are combined to definethe scoring function using OpenMM for sampling. The innovationin MELD is to exclude the weakest restraints from the energy eval-uation, which are determined to be unreliable. For example, in theincorporation of both NMR and EPR restraints, it was determinedthat 65% of the data were reliable and thus included into the scor-ing function. In a benchmark, MELD generated structures with lowRMSD (less than 2.5 Å) for the majority of tested cases. In the NMRdata category in CASP13, MELDxMD was the best structure predic-tion method (results shown in Fig. 5), illustrating the success of theapproach.
We have highlighted many different techniques that can beused with NMR to obtain structural and dynamic information onboth ordered and disordered protein systems. While size limitationremains a significant challenge, the large amount of information(such as distances/contacts and local environment) that can be pro-vided by NMR data has made it one of the most popular tools forstructure elucidation and integrative modeling.
C. Mass spectrometryIn recent years, mass spectrometry (MS) has become an
increasingly popular tool to study proteins and protein complexesdue to some important advances starting in the late 1980s. Theinitial problem with using MS on proteins and peptides was theneed to softly ionize the molecules into the gas phase for analy-sis in order to preserve their covalent bonds or even structures.Until the invention of soft ionization techniques such as electrosprayionization (ESI)163 and matrix-assisted laser desorption/ionization
J. Chem. Phys. 153, 240901 (2020); doi: 10.1063/5.0026025 153, 240901-9
Published under license by AIP Publishing
The Journalof Chemical Physics PERSPECTIVE scitation.org/journal/jcp
FIG. 5. MELDxMD was the highestranked group in NMR data-assistedCASP13 (2018). (a) MELDxMD (431)had the highest Z-score in the category.(b) Predicted structures for CASP tar-gets are shown with reference to thenative structures. Five of these predictedstructures were best in CASP. Reprintedwith permission from Robertson et al.,Proteins 87(12), 1333–1340 (2019).Copyright 2019 John Wiley and Sons.
(MALDI),164 this was not possible. These inventions sparked thedevelopment of new mass analyzers and ultimately techniques todetermine structural information on proteins. These techniques canbe broken down into two categories: bottom-up and top-down. Inbottom-up MS, proteins are enzymatically digested into small pep-tides and these peptides are separated and analyzed using tandemMS (MS/MS). Alternatively, in top-down MS, intact proteins areseparated and ion-trapped using tandem MS. Many pre-MS ion acti-vation or chemical modification methods have been developed toinfer structural information from MS experiments.
Ultimately, MS can be used to measure the mass-to-charge ratioof a molecule. While this information is useful for an entire pro-tein (especially when analyzing complex mixtures), structural infor-mation is gained by analysis of results after different pre-MS stepsare performed. These pre-MS steps have been developed in orderto encode structural information into the mass of the protein orprotein fragments. Many of these methods have then been incor-porated into computational pipelines to model protein structures.The MS-based methods highlighted in this Perspective are chemicalcross-linking, covalent labeling (such as hydrogen–deuteriumexchange and hydroxyl radical footprinting), ion mobility, andsurface-induced dissociation. While the structural data obtainedfrom these MS-based methods are not enough to fully elucidate thestructure, MS does not suffer from many of the drawbacks of thetypical structure determination methods. MS can handle complexmixtures, does not require crystallization, can be performed on bothlarge and small systems (up to megadalton-sized complexes), andrequires small amounts of sample (μl of sample at low μM concen-trations). Finally, as will be described in Secs. II C 1–II C 4, the typesof structural information that can be obtained from MS experimentsare very diverse.
1. Chemical cross-linkingChemical cross-linking (XL, CX, or CL) has been combined
with MS (XL-MS) using a bottom-up approach. The general ideaof the method is to chemically connect two atoms that are closein space, while the protein is in a native-like environment. In XL-MS, the native protein in solution is incubated with a bifunctionalcross-linking reagent, as depicted in Fig. 1(c). After cross-linking,
the proteins are enzymatically digested into smaller peptide frag-ments, cleaving some peptide bonds, but keeping the newly createdcross-links intact. The peptides are then separated and analyzed byliquid chromatography and tandem MS. If the sequence locationof the cross-links can be determined from the peptides, this analy-sis provides information about which residues are interacting (i.e.,close in space), often across protein–protein interfaces. Based onthe length of the cross-linking reagent (which can be up to about35 Å depending on the reagent), distance restraints can be inferredand included in computational structure prediction algorithms.165
Cross-linking information can be extremely beneficial for computa-tional modeling because contacts that are close in space, but far insequence, are generally hardest to predict.
Workflows have been developed in Rosetta to individually usethe data from cross-linking experiments for de novo modeling,homology modeling, or protein–protein docking. These methodswere first developed to use detected cross-linked residue distances asrestraints in model generation as well as to filter models after struc-ture generation.166,167 Distance restraints from XL-MS have alsobeen used with homology modeling using I-TASSER,168 XLinkDB169
[a combination of Modeller and PatchDock from the IntegrativeModeling Platform (IMP)], and MD refinement.170 Cross-linkingdata have been used to model the interaction between Psb27 andPhotosystem II, combined with protein–protein docking.171 Thetop-ranked (without incorporating the XL) docked models did notmatch the XL data, so the data were necessary to properly modelthe structure. Additionally, software is available to detect cross-links such as Mass Spec Studio, which was validated based on itsability to improve protein–protein docking when used with avail-able software.172 More recently, chemical cross-link data have beenused to build full quaternary structures from the sequence usingRosetta.173 This has been done by generating tertiary models usingde novo or homology modeling and then docking those models toform the complex (all done without guiding the predictions withXL data). Next, the models were filtered based on the agreementbetween the number of cross-links observed and the lysine–lysinedistances in the predicted models. Models that passed the filterwere refined by docking at higher resolution and rescored based onlysine–lysine distances of experimentally observed cross-links andthe Rosetta scoring function to select the predicted structures. In
J. Chem. Phys. 153, 240901 (2020); doi: 10.1063/5.0026025 153, 240901-10
Published under license by AIP Publishing
The Journalof Chemical Physics PERSPECTIVE scitation.org/journal/jcp
addition in Rosetta, flexible peptide docking has been performedusing experimentally determined cross-links as filters to select goodmodels.174
Rather than simply using XL data as restraints, the importanceof cross-link distance restraints being surface accessible (rather thanthrough the protein) has furthermore been examined by calculat-ing the surface accessible surface distance using Jwalk and usingthat in a scoring function to score homology models based on XLdata.175 In another study, a statistical XL-based potential based ondistance calculations from the protein data bank was developedand incorporated into the Rosetta ab initio folding as a proof ofprinciple.176 This force field improved tertiary structure predictionby including the probability that cross-linked residues are surfaceaccessible.
In addition to detecting if and where cross-links bind to gen-erate distance restraints or use in a scoring function, it is possi-ble to quantify the number of cross-links between two residues(quantitative chemical cross-linking). Based on the intensity of dif-ferent cross-links, this type of analysis can give information ondynamics and can sometimes detect multiple conformations. It hasbeen shown that multiple relevant protein conformations can bemodeled based on cross-link intensity by combining xTract withdocking.177
2. Covalent labelingWhile XL-MS methods gain insight into residue–residue dis-
tances, covalent labeling methods gain insight into solvent acces-sibility and flexibility. Covalent labeling (CL) reagents can bind toproteins in solution and thus chemically alter their masses (eitherirreversibly or reversibly). The structural hypothesis is that thereagents bind more favorably or more rapidly to residues that aremore solvent-exposed and more flexible. The general workflow forcovalent labeling MS (CL-MS) methods is to incubate the pro-tein in solution with the labeling reagent for a certain period oftime to allow the labeling reagents to bind to the protein. Then,the protein is enzymatically fragmented into peptides (bottom-up),which are separated and analyzed by tandem MS to determine thebinding location of the labels within the sequence by detecting thechange in mass (although it can sometimes be a challenge to deter-mine the exact, residue-resolved locations since measurements aregenerally performed on peptides). Covalent labeling strategies canbe employed in many different flavors (depending on the label-ing reagent used) but can generally be broken down into spe-cific and non-specific labeling methods. Specific covalent labelingreagents bind to particular amino acids or amino acid functionalgroups. Common methods are available to target arginine, car-boxylic acids, cysteine, histidine, lysine, tryptophan, or tyrosine.178
On the other hand, non-specific labeling reagents can label most orall of the amino acid types. The most commonly used non-specificlabeling methods are hydroxyl radical footprinting (HRF) andhydrogen–deuterium exchange (HDX). While both types of cova-lent labeling can provide useful structural information, the use ofnon-specific methods to this point has been more successful in struc-tural modeling since they provide more information by labelingmore residue types; therefore, this Perspective will highlight meth-ods that incorporate HDX and HRF into modeling. To make struc-tural hypotheses, it is also important that covalent labels do notcause changes to the overall structure of the protein. However, this
effect is minimal when small labels are used (such as with HDXand to a lesser extent HRF)178 and also when the experiment is per-formed sufficiently fast [such as fast photochemical oxidation ofproteins (FPOP)].179 It has been shown using simulated CL datawith noise that labeling the following residues provides the most use-ful information toward tertiary structure prediction because of theirabundance in sequence: L, G, R, V, and S.180
a. Hydrogen–deuterium exchange. Hydrogen–deuteriumexchange, a non-specific covalent labeling method, has been used fora long time to study biomolecules (since the 1930s for small systems)but has become very popular when combined with MS (HDX-MS).As the pre-MS, covalent labeling step, the protein is incubated in aD2O buffer solution. In this solution, some hydrogens in the proteinare able to exchange with deuterium, as shown in Fig. 1(c). Aftersome time, the exchange is quenched and continued in the CL-MSpipeline, as previously described. This experiment is repeated formany different incubation times so that kinetics can be determined.Rate constants or protection factors derived from rate constants ateach measured position are commonly reported in the literature.However, it is not uncommon to report percent deuteration incor-poration of certain positions at certain time points. Because of fastback-exchange for side-chain hydrogens (after quench) and slowexchange for carbon-bound hydrogens (prior to quench), only theamount of exchange from backbone amide hydrogens is measured(starting at the third residue in each fragment). One major difficultyof HDX is to convert the data collected on peptides to the residuelevel, although many methods have been developed to facilitate thisconversion.181,182 For HDX to occur at a given position, it is particu-larly important that the amide hydrogens be both exposed and flex-ible (i.e., not participating in a hydrogen bond) in order to rapidlyexchange because hydrogen-bonded hydrogens are much less likelyto exchange with deuterium.
HDX data have been successfully incorporated with homologymodeling to predict structures. In one study, using a two-stephomology modeling strategy, where the sequence alignment wasadjusted after the first step to better match the HDX data, themodels were further evaluated based on solvent exposure.183 Ofthe predicted models, the best model showed a strong correlation(R2 = 0.94) between the backbone solvent-accessible surface area(SASA) and percent deuterium incorporation measured with HDXat the peptide level. This analysis leads to new mechanistic hypothe-ses for the system. In a different study, correlations between thenumber of deuterons and the backbone SASA for each peptide wereused to analyze homology models of IκBε generated with two dif-ferent templates (both with strong correlations).184 The templatesdiffered in length and the HDX analysis, showing a good correlationin the extended region, was used to justify an additional structuredankyrin repeat in the target.
In addition to homology modeling, HDX data have beensuccessfully incorporated into protein–protein docking. Differ-ential HDX (ΔHDX), performing HDX-MS experiments on themonomers separately and comparing to HDX of the complex,can provide useful information specifically on the location of theprotein–protein interface. Interface residues are likely to exchangerapidly in the monomer but may exchange slower in the complexas they generally become more buried and less flexible upon bind-ing. However, it is important to note that changes in non-interface
J. Chem. Phys. 153, 240901 (2020); doi: 10.1063/5.0026025 153, 240901-11
Published under license by AIP Publishing
The Journalof Chemical Physics PERSPECTIVE scitation.org/journal/jcp
residues upon binding (protection or deprotection) can also occurdue to the general stabilization of the complex as well as allostericeffects. Figure 1(c) shows an example of the difference in deuterationthat could occur in the unbound and bound forms. To demonstratethis, the hUNG-UGI complex was docked using DOT and outputswere filtered based on HDX data.185 For peptides observed in boththe monomer and the complex, the difference between the num-ber of deuterons in the monomer and the complex was measured(this number indicates the number of backbone amide hydrogens atthe interface). The filtering step required that the same number ofresidues in the fragment was within a 7 Å interaction distance of theother subunit and this part of the interface. This filtering was shownto enrich the number of native-like structures in the prediction. Inanother study, ΔHDX was used to help identify the binding interfacebetween two partners and was combined with RosettaDock, whichwas also restrained using inter-subunit cross-links.186 In addition tousing HDX to identify the interface, models were evaluated based onSASA and HDX agreement, which resulted in a model with a RMSDof less than 2 Å. Similar analyses have been done with protein–ligandcomplexes.181,187–189
Since HDX is a solution-based approach, it can provide infor-mation on the ensemble of structures present in the solution.Because of this, it is beneficial to use HDX data in conjunctionwith MD simulations. It has been shown that HDX data can dis-criminate between native and non-native folds from conformationsgenerated in an MD simulation.190 This was done by predictingthe deuterium uptake based on near contacts and hydrogen bondsfrom the structures and comparing it to the experimental results.In addition to actually modeling HDX during MD simulations, thesimulations themselves have been extensively used to better under-stand and predict the HDX results. For example, MD simulationshave been used to predict the peptide-resolved HDX data basedon solvent accessibility. These data were calculated over the sim-ulation based on both residue SASA and whether the amide NHinteracts with a water molecule. The predictions correlated well withthe experimental results.191,192 Numerous other methods have beendeveloped that quantify some combination of hydrogen bonding,solvent accessibility, and RMSF (root-mean-square fluctuation).193
b. Hydroxyl radical footprinting. In contrast to HDX, HRFmethods irreversibly alter the mass of the protein at certain posi-tions. The strategy is to introduce hydroxyl radicals into solutionto interact with the side chains of exposed residues. The result-ing mass change is very dependent on the amino acid type, forexample, the radical can abstract hydrogens from aliphatic residuesor directly attack sulfur atoms or aromatic rings. Although thereare many different ways to introduce the hydroxyl radicals (suchas radiolysis of water with electrons, x rays, or gamma radiation,transition metal-dependent chemical reactions with peroxide, orhigh-voltage electrical discharge in water), one of the most com-mon methods that has been used in structure prediction is throughperoxide photolysis, called fast photochemical oxidation of pro-teins (FPOP). In FPOP, hydroxyl radicals are produced in situ byUV laser-based photolysis of hydrogen peroxide. The radicals thenalter the mass of a broad range of amino acid types with differ-ent intrinsic reactivities that have been tabulated. Similarly to HDX,FPOP rate constants can be determined for each residue and fromthe rate constants, protection factors (intrinsic reactivity divided by
rate constant) are generally derived. The structure-based hypothe-sis for this metric is that a higher protection factor should corre-late with less solvent exposure due to the lack of accessibility of theradicals.
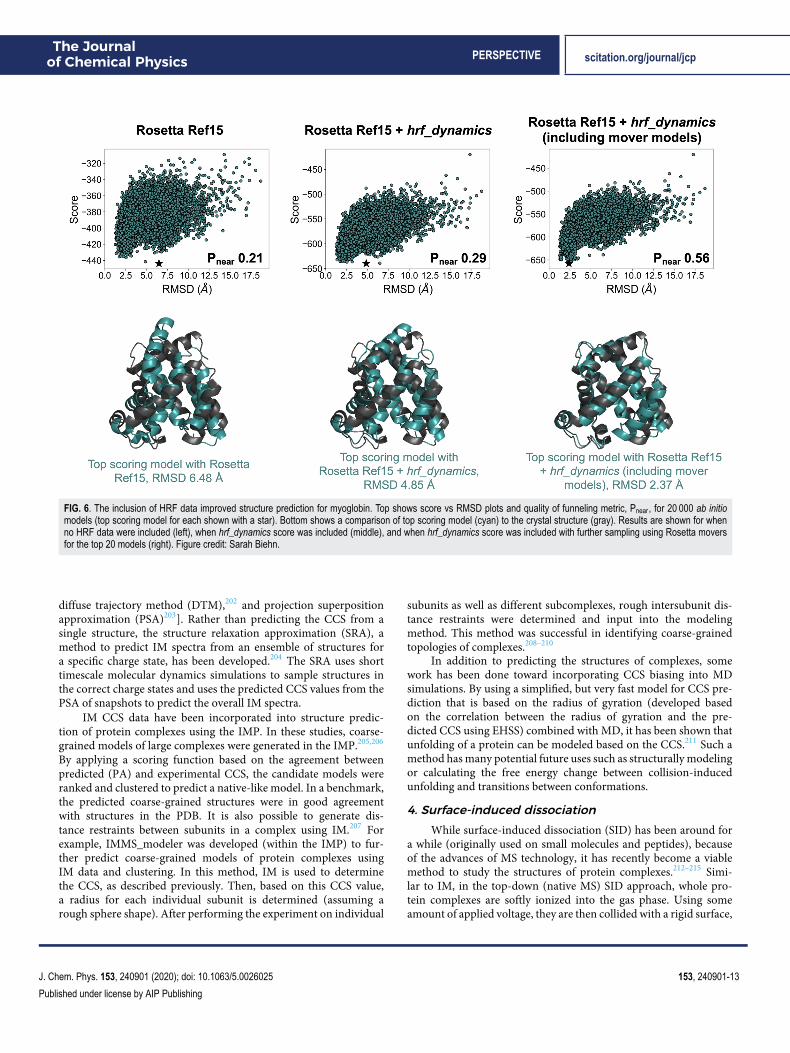
Based on this hypothesis, correlations between structure andFPOP data have been examined.194 The average SASA derivedfrom MD simulations normalized by the sequence context, calcu-lated for residues with high and moderate hydroxyl radical reac-tivity, was shown to be strongly correlated with a normalizedprotection factor (PF). Analyzing the frames from unfolding simu-lations, this metric was able to discriminate well between native-likeand non-native-like models based on RMSD. Furthermore, FPOPhas been incorporated into a de novo tertiary structure predictionframework.195 Based on an observed correlation between neighborcount, a surface-accessibility measure of the number of neighbor-ing residues within a specific distance, and natural logarithm of PF,a model to predict FPOP data from structure was developed. Thismodel was incorporated into an FPOP-quantifying scoring term,which was used to rescore models generated in Rosetta. Structureprediction was improved with the inclusion of FPOP data. Fur-thermore, accounting for side chain flexibility through MD andRosetta movers has been shown to improve the observed correla-tion between residue exposure and experimental PF.196 Incorpora-tion of this improved correlation into a scoring function producedimprovement in model selection for tertiary structure prediction aswell. Extracting the top 20 scoring models and generating 30 addi-tional structures for each using a combination of Rosetta moverschosen to boost side-chain sampling further improved the predictedstructure in all cases. An example is shown in Fig. 6 for myoglobin.The selected model (based on score) improved from 6.48 Å (left)when no HRF data were included to 4.85 Å (middle) and whenHRF data were included and further improved to 2.37 Å (right)when additional side-chain sampling was allowed using the movermodels.
3. Ion mobilityIon mobility (IM), a top-down, native MS approach, provides
structural information not on specific residues, but rather on theshape of the entire protein or protein complex. In IM, the entirenative protein, rather than broken into peptides, is softly ionized inthe gas phase and accelerated through a bath gas (commonly nitro-gen or helium) and subsequently analyzed with MS. The velocityof each ion as it passes through the bath gas depends on its sizeand shape (as well as charge and other experimental factors), whichcan then be translated into a rotationally averaged collision cross-sectional area (CCS). Figure 1(c) illustrates this separation, show-ing smaller ions moving faster through the bath gas (left to right).This experimentally derived CCS can then be used for structuralmodeling. While there is a plethora of different computational meth-ods to predict the experimentally measured CCS from the 3D coor-dinates of a protein, selecting the best method can be challengingbecause there is usually a tradeoff between accuracy and computa-tion time. Briefly, some methods simply calculate the average projec-tion area over multiple rotations of the protein [projection approx-imation (PA)197,198 and exact hard-spheres scattering (EHSS)199],while some also take gas–protein interaction energy and multiplegas–protein collisions into account [trajectory method (TJM),200,201
J. Chem. Phys. 153, 240901 (2020); doi: 10.1063/5.0026025 153, 240901-12
Published under license by AIP Publishing
The Journalof Chemical Physics PERSPECTIVE scitation.org/journal/jcp
FIG. 6. The inclusion of HRF data improved structure prediction for myoglobin. Top shows score vs RMSD plots and quality of funneling metric, Pnear, for 20 000 ab initiomodels (top scoring model for each shown with a star). Bottom shows a comparison of top scoring model (cyan) to the crystal structure (gray). Results are shown for whenno HRF data were included (left), when hrf_dynamics score was included (middle), and when hrf_dynamics score was included with further sampling using Rosetta moversfor the top 20 models (right). Figure credit: Sarah Biehn.
diffuse trajectory method (DTM),202 and projection superpositionapproximation (PSA)203]. Rather than predicting the CCS from asingle structure, the structure relaxation approximation (SRA), amethod to predict IM spectra from an ensemble of structures fora specific charge state, has been developed.204 The SRA uses shorttimescale molecular dynamics simulations to sample structures inthe correct charge states and uses the predicted CCS values from thePSA of snapshots to predict the overall IM spectra.
IM CCS data have been incorporated into structure predic-tion of protein complexes using the IMP. In these studies, coarse-grained models of large complexes were generated in the IMP.205,206
By applying a scoring function based on the agreement betweenpredicted (PA) and experimental CCS, the candidate models wereranked and clustered to predict a native-like model. In a benchmark,the predicted coarse-grained structures were in good agreementwith structures in the PDB. It is also possible to generate dis-tance restraints between subunits in a complex using IM.207 Forexample, IMMS_modeler was developed (within the IMP) to fur-ther predict coarse-grained models of protein complexes usingIM data and clustering. In this method, IM is used to determinethe CCS, as described previously. Then, based on this CCS value,a radius for each individual subunit is determined (assuming arough sphere shape). After performing the experiment on individual
subunits as well as different subcomplexes, rough intersubunit dis-tance restraints were determined and input into the modelingmethod. This method was successful in identifying coarse-grainedtopologies of complexes.208–210
In addition to predicting the structures of complexes, somework has been done toward incorporating CCS biasing into MDsimulations. By using a simplified, but very fast model for CCS pre-diction that is based on the radius of gyration (developed basedon the correlation between the radius of gyration and the pre-dicted CCS using EHSS) combined with MD, it has been shown thatunfolding of a protein can be modeled based on the CCS.211 Such amethod has many potential future uses such as structurally modelingor calculating the free energy change between collision-inducedunfolding and transitions between conformations.
4. Surface-induced dissociationWhile surface-induced dissociation (SID) has been around for
a while (originally used on small molecules and peptides), becauseof the advances of MS technology, it has recently become a viablemethod to study the structures of protein complexes.212–215 Simi-lar to IM, in the top-down (native MS) SID approach, whole pro-tein complexes are softly ionized into the gas phase. Using someamount of applied voltage, they are then collided with a rigid surface,
J. Chem. Phys. 153, 240901 (2020); doi: 10.1063/5.0026025 153, 240901-13
Published under license by AIP Publishing
The Journalof Chemical Physics PERSPECTIVE scitation.org/journal/jcp
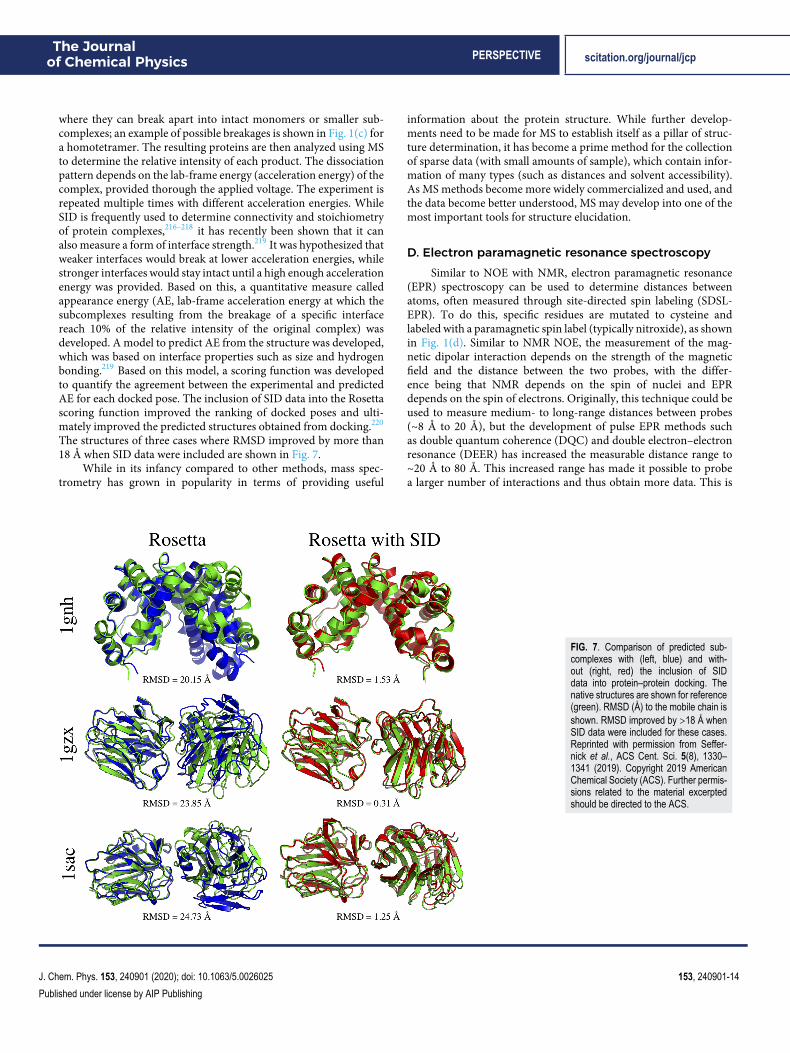
where they can break apart into intact monomers or smaller sub-complexes; an example of possible breakages is shown in Fig. 1(c) fora homotetramer. The resulting proteins are then analyzed using MSto determine the relative intensity of each product. The dissociationpattern depends on the lab-frame energy (acceleration energy) of thecomplex, provided thorough the applied voltage. The experiment isrepeated multiple times with different acceleration energies. WhileSID is frequently used to determine connectivity and stoichiometryof protein complexes,216–218 it has recently been shown that it canalso measure a form of interface strength.219 It was hypothesized thatweaker interfaces would break at lower acceleration energies, whilestronger interfaces would stay intact until a high enough accelerationenergy was provided. Based on this, a quantitative measure calledappearance energy (AE, lab-frame acceleration energy at which thesubcomplexes resulting from the breakage of a specific interfacereach 10% of the relative intensity of the original complex) wasdeveloped. A model to predict AE from the structure was developed,which was based on interface properties such as size and hydrogenbonding.219 Based on this model, a scoring function was developedto quantify the agreement between the experimental and predictedAE for each docked pose. The inclusion of SID data into the Rosettascoring function improved the ranking of docked poses and ulti-mately improved the predicted structures obtained from docking.220
The structures of three cases where RMSD improved by more than18 Å when SID data were included are shown in Fig. 7.
While in its infancy compared to other methods, mass spec-trometry has grown in popularity in terms of providing useful
information about the protein structure. While further develop-ments need to be made for MS to establish itself as a pillar of struc-ture determination, it has become a prime method for the collectionof sparse data (with small amounts of sample), which contain infor-mation of many types (such as distances and solvent accessibility).As MS methods become more widely commercialized and used, andthe data become better understood, MS may develop into one of themost important tools for structure elucidation.
D. Electron paramagnetic resonance spectroscopySimilar to NOE with NMR, electron paramagnetic resonance
(EPR) spectroscopy can be used to determine distances betweenatoms, often measured through site-directed spin labeling (SDSL-EPR). To do this, specific residues are mutated to cysteine andlabeled with a paramagnetic spin label (typically nitroxide), as shownin Fig. 1(d). Similar to NMR NOE, the measurement of the mag-netic dipolar interaction depends on the strength of the magneticfield and the distance between the two probes, with the differ-ence being that NMR depends on the spin of nuclei and EPRdepends on the spin of electrons. Originally, this technique could beused to measure medium- to long-range distances between probes(∼8 Å to 20 Å), but the development of pulse EPR methods suchas double quantum coherence (DQC) and double electron–electronresonance (DEER) has increased the measurable distance range to∼20 Å to 80 Å. This increased range has made it possible to probea larger number of interactions and thus obtain more data. This is
FIG. 7. Comparison of predicted sub-complexes with (left, blue) and with-out (right, red) the inclusion of SIDdata into protein–protein docking. Thenative structures are shown for reference(green). RMSD (Å) to the mobile chain isshown. RMSD improved by >18 Å whenSID data were included for these cases.Reprinted with permission from Seffer-nick et al., ACS Cent. Sci. 5(8), 1330–1341 (2019). Copyright 2019 AmericanChemical Society (ACS). Further permis-sions related to the material excerptedshould be directed to the ACS.
J. Chem. Phys. 153, 240901 (2020); doi: 10.1063/5.0026025 153, 240901-14
Published under license by AIP Publishing
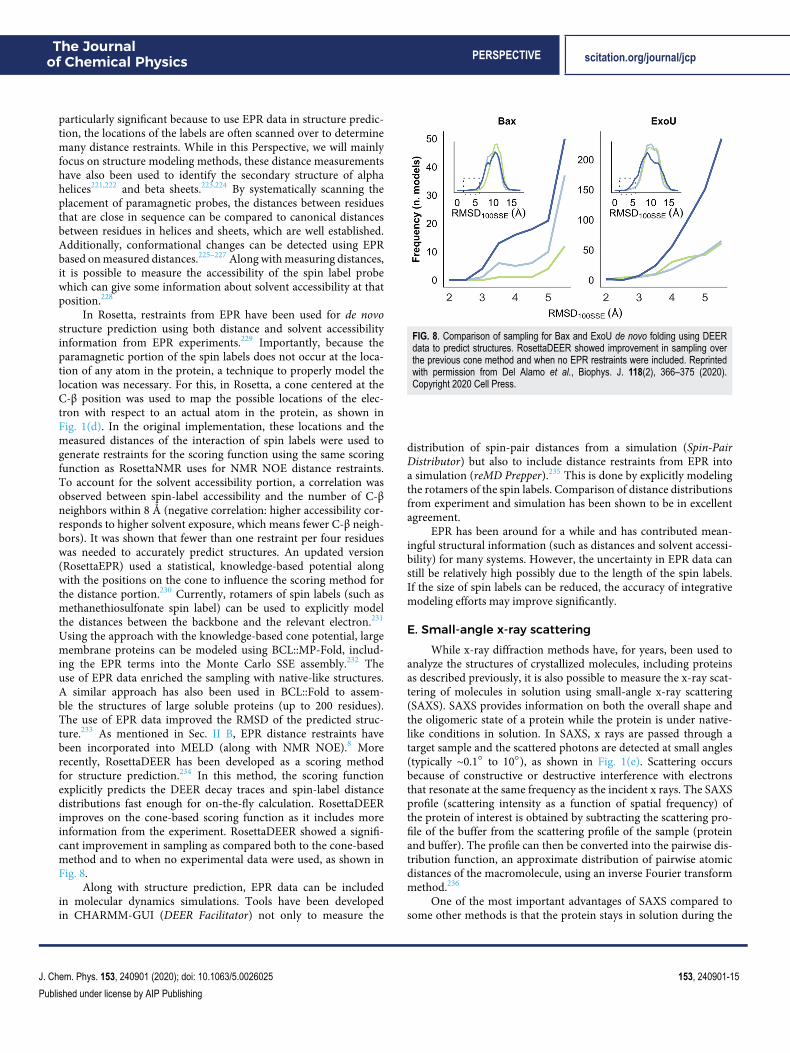
The Journalof Chemical Physics PERSPECTIVE scitation.org/journal/jcp
particularly significant because to use EPR data in structure predic-tion, the locations of the labels are often scanned over to determinemany distance restraints. While in this Perspective, we will mainlyfocus on structure modeling methods, these distance measurementshave also been used to identify the secondary structure of alphahelices221,222 and beta sheets.223,224 By systematically scanning theplacement of paramagnetic probes, the distances between residuesthat are close in sequence can be compared to canonical distancesbetween residues in helices and sheets, which are well established.Additionally, conformational changes can be detected using EPRbased on measured distances.225–227 Along with measuring distances,it is possible to measure the accessibility of the spin label probewhich can give some information about solvent accessibility at thatposition.228
In Rosetta, restraints from EPR have been used for de novostructure prediction using both distance and solvent accessibilityinformation from EPR experiments.229 Importantly, because theparamagnetic portion of the spin labels does not occur at the loca-tion of any atom in the protein, a technique to properly model thelocation was necessary. For this, in Rosetta, a cone centered at theC-β position was used to map the possible locations of the elec-tron with respect to an actual atom in the protein, as shown inFig. 1(d). In the original implementation, these locations and themeasured distances of the interaction of spin labels were used togenerate restraints for the scoring function using the same scoringfunction as RosettaNMR uses for NMR NOE distance restraints.To account for the solvent accessibility portion, a correlation wasobserved between spin-label accessibility and the number of C-βneighbors within 8 Å (negative correlation: higher accessibility cor-responds to higher solvent exposure, which means fewer C-β neigh-bors). It was shown that fewer than one restraint per four residueswas needed to accurately predict structures. An updated version(RosettaEPR) used a statistical, knowledge-based potential alongwith the positions on the cone to influence the scoring method forthe distance portion.230 Currently, rotamers of spin labels (such asmethanethiosulfonate spin label) can be used to explicitly modelthe distances between the backbone and the relevant electron.231
Using the approach with the knowledge-based cone potential, largemembrane proteins can be modeled using BCL::MP-Fold, includ-ing the EPR terms into the Monte Carlo SSE assembly.232 Theuse of EPR data enriched the sampling with native-like structures.A similar approach has also been used in BCL::Fold to assem-ble the structures of large soluble proteins (up to 200 residues).The use of EPR data improved the RMSD of the predicted struc-ture.233 As mentioned in Sec. II B, EPR distance restraints havebeen incorporated into MELD (along with NMR NOE).8 Morerecently, RosettaDEER has been developed as a scoring methodfor structure prediction.234 In this method, the scoring functionexplicitly predicts the DEER decay traces and spin-label distancedistributions fast enough for on-the-fly calculation. RosettaDEERimproves on the cone-based scoring function as it includes moreinformation from the experiment. RosettaDEER showed a signifi-cant improvement in sampling as compared both to the cone-basedmethod and to when no experimental data were used, as shown inFig. 8.
Along with structure prediction, EPR data can be includedin molecular dynamics simulations. Tools have been developedin CHARMM-GUI (DEER Facilitator) not only to measure the
FIG. 8. Comparison of sampling for Bax and ExoU de novo folding using DEERdata to predict structures. RosettaDEER showed improvement in sampling overthe previous cone method and when no EPR restraints were included. Reprintedwith permission from Del Alamo et al., Biophys. J. 118(2), 366–375 (2020).Copyright 2020 Cell Press.
distribution of spin-pair distances from a simulation (Spin-PairDistributor) but also to include distance restraints from EPR intoa simulation (reMD Prepper).235 This is done by explicitly modelingthe rotamers of the spin labels. Comparison of distance distributionsfrom experiment and simulation has been shown to be in excellentagreement.
EPR has been around for a while and has contributed mean-ingful structural information (such as distances and solvent accessi-bility) for many systems. However, the uncertainty in EPR data canstill be relatively high possibly due to the length of the spin labels.If the size of spin labels can be reduced, the accuracy of integrativemodeling efforts may improve significantly.
E. Small-angle x-ray scatteringWhile x-ray diffraction methods have, for years, been used to
analyze the structures of crystallized molecules, including proteinsas described previously, it is also possible to measure the x-ray scat-tering of molecules in solution using small-angle x-ray scattering(SAXS). SAXS provides information on both the overall shape andthe oligomeric state of a protein while the protein is under native-like conditions in solution. In SAXS, x rays are passed through atarget sample and the scattered photons are detected at small angles(typically ∼0.1○ to 10○), as shown in Fig. 1(e). Scattering occursbecause of constructive or destructive interference with electronsthat resonate at the same frequency as the incident x rays. The SAXSprofile (scattering intensity as a function of spatial frequency) ofthe protein of interest is obtained by subtracting the scattering pro-file of the buffer from the scattering profile of the sample (proteinand buffer). The profile can then be converted into the pairwise dis-tribution function, an approximate distribution of pairwise atomicdistances of the macromolecule, using an inverse Fourier transformmethod.236
One of the most important advantages of SAXS compared tosome other methods is that the protein stays in solution during the
J. Chem. Phys. 153, 240901 (2020); doi: 10.1063/5.0026025 153, 240901-15
Published under license by AIP Publishing
The Journalof Chemical Physics PERSPECTIVE scitation.org/journal/jcp
experiment (and thus does not need to be crystallized) and is notartificially disrupted (for example, with labeling reagents), whichallows SAXS to provide information on the ensemble of conforma-tions of the protein in near-native conditions. Because of this, SAXSis very amenable to multi-domain proteins and intrinsically disor-dered proteins. While SAXS has many advantages, there are alsosome important disadvantages. Whereas x-ray diffraction of crys-tals can provide high-resolution structural information, measuringthe scattering of x rays in solution significantly decreases the res-olution (typically ∼10 Å–20 Å or lower). Because of this low reso-lution, it is typical to combine the data obtained from SAXS withdata determined from other structure determination methods. Ithas become very common to use computational structure predic-tion methods with SAXS data to model the structures of proteins.In addition to SAXS, a similar experimental method, small-angleneutron scattering (SANS), has been used to some extent for struc-tural modeling (generally low-resolution modeling of membraneproteins, sometimes combined with SAXS).237–241 Because structureprediction methods using SANS data are not as well developed atthis stage, we will focus on SAXS in this Perspective.
Many methods are available to predict the SAXS profile from astructure so that the agreement with SAXS data can be measuredin a variety of ways.242–244 A common strategy to use SAXS pro-files for structural modeling is to filter/rank the predicted structuresbased on their agreement with SAXS data. Another common strat-egy to model the data is to use the predicted structures to choosean ensemble that, when the structures are combined, matches thedata. While the first approach is more common for structure predic-tion and docking, both strategies can be performed using the FoXSfamily of analysis tools.245,246 Using FoXS, a model can be evaluatedbased on the agreement with a SAXS profile, which could be usedin structure prediction (as can be done for protein–protein dock-ing using FoXSDock, described in the next paragraph). The secondapproach can be performed using MultiFoXS, where an ensemble ofstructures is generated based on an input structure. The structuresin the ensemble are then evaluated based on the SAXS agreement,and probabilities are output for the top models. Another method,BILBOMD, takes a similar approach, generating different confor-mations using molecular dynamics and then using those framesto determine a representative ensemble that matches the SAXSdata.247
Because of the topological information gained from SAXSprofiles, the data have been very useful for the modeling of pro-tein complexes through protein–protein docking. The first suchmethod to combine SAXS data with docking, pyDockSAXS (whichhas since been incorporated as a webserver), uses an approachthat ranks potential docked structures based on a scoring functionand SAXS agreement after unrestrained docking.248,249 FoXSDock,another online SAXS-based docking server takes a similar approach,rescoring docked poses (generated using PatchDock) based on theagreement with the SAXS profile of the complex.245,246 Anothernotable method for protein–protein docking with SAXS data isClusPro.250–252 The method for docking with SAXS data in Clus-Pro is performed with a few simple steps. First, 70 000 structuresare obtained using unrestrained docking using the PIPER methodin ClusPro. These structures are filtered down to the top 2000based on the agreement with the obtained SAXS profile by predict-ing the SAXS profile for each structure and calculating the χ-score
agreement. Finally, the resulting 2000 structures are ranked based ontheir PIPER energies, and the resulting top 1000 structures are clus-tered to produce 10 clusters. In a benchmark, the inclusion of SAXSdata improved the model selection. It has also been shown by simu-lating the experimental data based on crystal structures that iSPOTcould combine both SAXS and footprinting data to filter dockedstructures and identify a native-like model.253
While most protein–protein docking methods use SAXS data torank the predicted structures as a post-processing step, some meth-ods use the data during the structure generation phase. In theory,this should enrich the sampling of native-like structures as comparedto docking without the SAXS data. ATTRACT-SAXS can generateand rank structures based on SAXS data alone.254 This approach isparticularly significant because the method relies only on assessingthe interface energy but does not require forcefield to assess ener-gies for all atoms. ATTRACT-SAXS uses a scoring function basedon SAXS agreement as the energy function for the Monte Carlo sam-pling and clusters top models to select a predicted structure. In abenchmark, ATTRACT-SAXS was able to improve the sampling ofnative-like structures when including SAXS and outperformed someother available methods. A few predicted structures are shown inFig. 9. While ATTRACT-SAXS generates structures based on dataalone, another study that included SAXS data during docking wasperformed using RosettaDock.255 This method incorporated SAXSrestraints into the low-resolution docking phase along with using theRosetta energy function and significantly improved both samplingand structure prediction.
Some alternative approaches are also available for protein mod-eling with SAXS data. It has shown that principal component anal-ysis and SAXS data with clustering can be used to classify ab initiopredicted models.256 Additionally, DecodeSAXS, a machine learn-ing algorithm, has been developed to generate 3D models of proteinsfrom SAXS profiles.257
SAXS profiles can furthermore be useful for modeling of multi-domain proteins. Due to flexible linker regions, the whole structuresof multidomain proteins can be particularly difficult to obtain withx-ray crystallography, but it is not uncommon to obtain the struc-tures of the stable regions. SAXS data, when used with those struc-tures of stable domains, can be used to model the flexible linkerregions. This type of prediction can be done using SAXSDom.258
Based on the input structures of the domains, the sequence (i.e., thesequence and location of the linker region), and the SAXS profile,the method performs Monte Carlo sampling on the linker regionand evaluates each move based on the agreement with the SAXSprofile of the entire protein. A similar approach can be used withalgorithms in ATSAS.259 Using BUNCH,260 multidomain proteinscan be modeled from the structures of the individual domains, butalso CORAL can be used to build up those multidomain monomersinto complexes.
Due to the encoding of flexibility into the data (since data arecollected in native-like solution conditions), molecular dynamicssimulations have been used in combination with SAXS in multipledifferent ways. For example, coarse-grained MD simulations havebeen used to predict the SAXS profile for a protein.261 By simu-lating the structure and analyzing the trajectory, a better estimatecan be made toward the experimental profile than with just thecrystal structure because of the use of dynamic information. Addi-tionally, restraints based on SAXS data have been incorporated into
J. Chem. Phys. 153, 240901 (2020); doi: 10.1063/5.0026025 153, 240901-16
Published under license by AIP Publishing

The Journalof Chemical Physics PERSPECTIVE scitation.org/journal/jcp
FIG. 9. Docked structures generatedusing ATTRACT-SAXS for an easy [(a)2GTP], medium [(b) 1B6C], and hard[(c) 3F1P] case. Docked models areshown in green and red, and the crys-tal structure is shown in gray alongwith the cluster rank, IRMSD, LRMSD,and fnat. For comparison, the simulatedSAXS profiles are also shown along withthe experimental curves. Reprinted withpermission from Schindler et al., Struc-ture 24(8), 1387–1397 (2016). Copyright2016 Cell Press.
MD simulations using a quick on-the-fly SAXS energy to bias thesimulation.262 The method was used on intrinsically disordered pro-teins, a good test case due to their high intrinsic flexibility, to createan ensemble of structures that agreed very well with the experimen-tal SAXS data. Finally, a hybrid resolution MD method (hySAXS)has been developed to incorporate SAXS data into a simulation. Ina comparison to an MD simulation without the incorporation ofthe data, the SAXS-based simulation was better able to reproducea separate set of data from NMR.
While SAXS provides information on shape and oligomericstate, the data are sparse and require integrative modeling. Usingdata from SAXS has been successful for protein–protein docking
because it breaks degeneracy in the overall symmetry of the protein.However, when used in CASP (for tertiary structure prediction),SAXS has not thus far provided a huge advantage. While SAXS dataare useful, the sparsity of the data might make the method best usedin conjunction with orthogonal data from other methods.
F. Förster resonance energy transferFörster resonance energy transfer (FRET) occurs when a fluo-
rescent donor and acceptor are in close proximity in space. In FRET,the donor is excited, and then, energy is transferred to the accep-tor non-radiatively by dipole–dipole coupling. In order for FRET to
J. Chem. Phys. 153, 240901 (2020); doi: 10.1063/5.0026025 153, 240901-17
Published under license by AIP Publishing
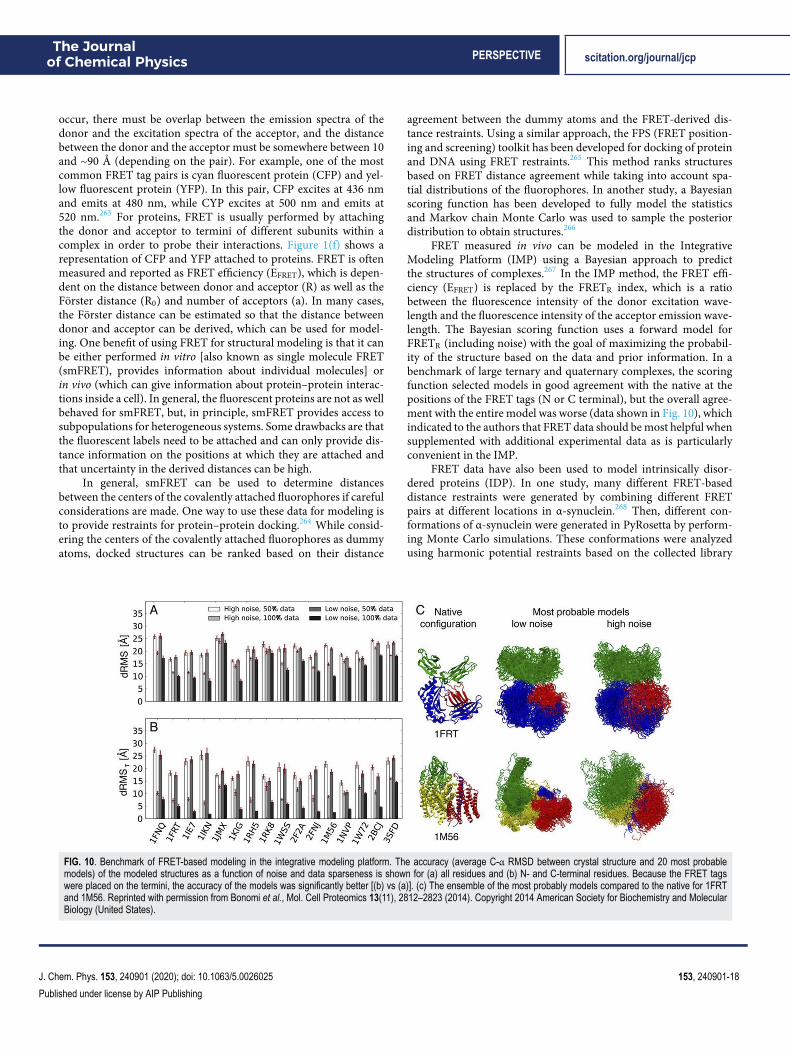
The Journalof Chemical Physics PERSPECTIVE scitation.org/journal/jcp
occur, there must be overlap between the emission spectra of thedonor and the excitation spectra of the acceptor, and the distancebetween the donor and the acceptor must be somewhere between 10and ∼90 Å (depending on the pair). For example, one of the mostcommon FRET tag pairs is cyan fluorescent protein (CFP) and yel-low fluorescent protein (YFP). In this pair, CFP excites at 436 nmand emits at 480 nm, while CYP excites at 500 nm and emits at520 nm.263 For proteins, FRET is usually performed by attachingthe donor and acceptor to termini of different subunits within acomplex in order to probe their interactions. Figure 1(f) shows arepresentation of CFP and YFP attached to proteins. FRET is oftenmeasured and reported as FRET efficiency (EFRET), which is depen-dent on the distance between donor and acceptor (R) as well as theFörster distance (R0) and number of acceptors (a). In many cases,the Förster distance can be estimated so that the distance betweendonor and acceptor can be derived, which can be used for model-ing. One benefit of using FRET for structural modeling is that it canbe either performed in vitro [also known as single molecule FRET(smFRET), provides information about individual molecules] orin vivo (which can give information about protein–protein interac-tions inside a cell). In general, the fluorescent proteins are not as wellbehaved for smFRET, but, in principle, smFRET provides access tosubpopulations for heterogeneous systems. Some drawbacks are thatthe fluorescent labels need to be attached and can only provide dis-tance information on the positions at which they are attached andthat uncertainty in the derived distances can be high.
In general, smFRET can be used to determine distancesbetween the centers of the covalently attached fluorophores if carefulconsiderations are made. One way to use these data for modeling isto provide restraints for protein–protein docking.264 While consid-ering the centers of the covalently attached fluorophores as dummyatoms, docked structures can be ranked based on their distance
agreement between the dummy atoms and the FRET-derived dis-tance restraints. Using a similar approach, the FPS (FRET position-ing and screening) toolkit has been developed for docking of proteinand DNA using FRET restraints.265 This method ranks structuresbased on FRET distance agreement while taking into account spa-tial distributions of the fluorophores. In another study, a Bayesianscoring function has been developed to fully model the statisticsand Markov chain Monte Carlo was used to sample the posteriordistribution to obtain structures.266
FRET measured in vivo can be modeled in the IntegrativeModeling Platform (IMP) using a Bayesian approach to predictthe structures of complexes.267 In the IMP method, the FRET effi-ciency (EFRET) is replaced by the FRETR index, which is a ratiobetween the fluorescence intensity of the donor excitation wave-length and the fluorescence intensity of the acceptor emission wave-length. The Bayesian scoring function uses a forward model forFRETR (including noise) with the goal of maximizing the probabil-ity of the structure based on the data and prior information. In abenchmark of large ternary and quaternary complexes, the scoringfunction selected models in good agreement with the native at thepositions of the FRET tags (N or C terminal), but the overall agree-ment with the entire model was worse (data shown in Fig. 10), whichindicated to the authors that FRET data should be most helpful whensupplemented with additional experimental data as is particularlyconvenient in the IMP.
FRET data have also been used to model intrinsically disor-dered proteins (IDP). In one study, many different FRET-baseddistance restraints were generated by combining different FRETpairs at different locations in α-synuclein.268 Then, different con-formations of α-synuclein were generated in PyRosetta by perform-ing Monte Carlo simulations. These conformations were analyzedusing harmonic potential restraints based on the collected library
FIG. 10. Benchmark of FRET-based modeling in the integrative modeling platform. The accuracy (average C-α RMSD between crystal structure and 20 most probablemodels) of the modeled structures as a function of noise and data sparseness is shown for (a) all residues and (b) N- and C-terminal residues. Because the FRET tagswere placed on the termini, the accuracy of the models was significantly better [(b) vs (a)]. (c) The ensemble of the most probably models compared to the native for 1FRTand 1M56. Reprinted with permission from Bonomi et al., Mol. Cell Proteomics 13(11), 2812–2823 (2014). Copyright 2014 American Society for Biochemistry and MolecularBiology (United States).
J. Chem. Phys. 153, 240901 (2020); doi: 10.1063/5.0026025 153, 240901-18
Published under license by AIP Publishing
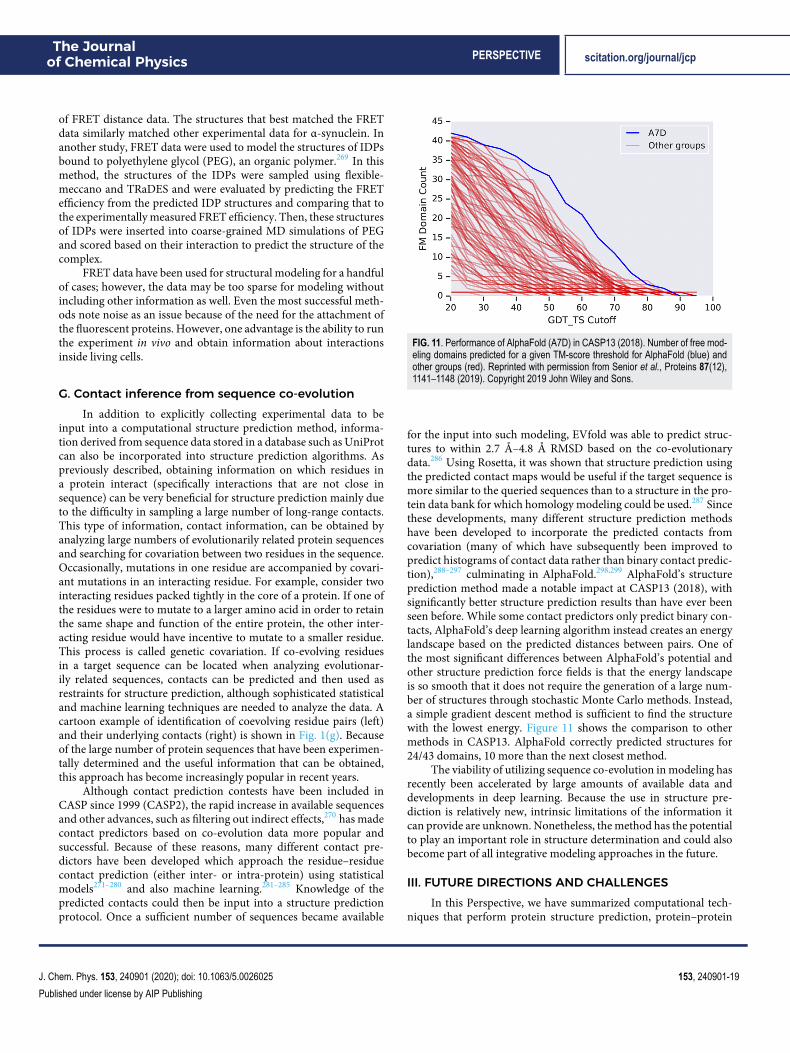
The Journalof Chemical Physics PERSPECTIVE scitation.org/journal/jcp
of FRET distance data. The structures that best matched the FRETdata similarly matched other experimental data for α-synuclein. Inanother study, FRET data were used to model the structures of IDPsbound to polyethylene glycol (PEG), an organic polymer.269 In thismethod, the structures of the IDPs were sampled using flexible-meccano and TRaDES and were evaluated by predicting the FRETefficiency from the predicted IDP structures and comparing that tothe experimentally measured FRET efficiency. Then, these structuresof IDPs were inserted into coarse-grained MD simulations of PEGand scored based on their interaction to predict the structure of thecomplex.
FRET data have been used for structural modeling for a handfulof cases; however, the data may be too sparse for modeling withoutincluding other information as well. Even the most successful meth-ods note noise as an issue because of the need for the attachment ofthe fluorescent proteins. However, one advantage is the ability to runthe experiment in vivo and obtain information about interactionsinside living cells.
G. Contact inference from sequence co-evolutionIn addition to explicitly collecting experimental data to be
input into a computational structure prediction method, informa-tion derived from sequence data stored in a database such as UniProtcan also be incorporated into structure prediction algorithms. Aspreviously described, obtaining information on which residues ina protein interact (specifically interactions that are not close insequence) can be very beneficial for structure prediction mainly dueto the difficulty in sampling a large number of long-range contacts.This type of information, contact information, can be obtained byanalyzing large numbers of evolutionarily related protein sequencesand searching for covariation between two residues in the sequence.Occasionally, mutations in one residue are accompanied by covari-ant mutations in an interacting residue. For example, consider twointeracting residues packed tightly in the core of a protein. If one ofthe residues were to mutate to a larger amino acid in order to retainthe same shape and function of the entire protein, the other inter-acting residue would have incentive to mutate to a smaller residue.This process is called genetic covariation. If co-evolving residuesin a target sequence can be located when analyzing evolutionar-ily related sequences, contacts can be predicted and then used asrestraints for structure prediction, although sophisticated statisticaland machine learning techniques are needed to analyze the data. Acartoon example of identification of coevolving residue pairs (left)and their underlying contacts (right) is shown in Fig. 1(g). Becauseof the large number of protein sequences that have been experimen-tally determined and the useful information that can be obtained,this approach has become increasingly popular in recent years.
Although contact prediction contests have been included inCASP since 1999 (CASP2), the rapid increase in available sequencesand other advances, such as filtering out indirect effects,270 has madecontact predictors based on co-evolution data more popular andsuccessful. Because of these reasons, many different contact pre-dictors have been developed which approach the residue–residuecontact prediction (either inter- or intra-protein) using statisticalmodels271–280 and also machine learning.281–285 Knowledge of thepredicted contacts could then be input into a structure predictionprotocol. Once a sufficient number of sequences became available
FIG. 11. Performance of AlphaFold (A7D) in CASP13 (2018). Number of free mod-eling domains predicted for a given TM-score threshold for AlphaFold (blue) andother groups (red). Reprinted with permission from Senior et al., Proteins 87(12),1141–1148 (2019). Copyright 2019 John Wiley and Sons.
for the input into such modeling, EVfold was able to predict struc-tures to within 2.7 Å–4.8 Å RMSD based on the co-evolutionarydata.286 Using Rosetta, it was shown that structure prediction usingthe predicted contact maps would be useful if the target sequence ismore similar to the queried sequences than to a structure in the pro-tein data bank for which homology modeling could be used.287 Sincethese developments, many different structure prediction methodshave been developed to incorporate the predicted contacts fromcovariation (many of which have subsequently been improved topredict histograms of contact data rather than binary contact predic-tion),288–297 culminating in AlphaFold.298,299 AlphaFold’s structureprediction method made a notable impact at CASP13 (2018), withsignificantly better structure prediction results than have ever beenseen before. While some contact predictors only predict binary con-tacts, AlphaFold’s deep learning algorithm instead creates an energylandscape based on the predicted distances between pairs. One ofthe most significant differences between AlphaFold’s potential andother structure prediction force fields is that the energy landscapeis so smooth that it does not require the generation of a large num-ber of structures through stochastic Monte Carlo methods. Instead,a simple gradient descent method is sufficient to find the structurewith the lowest energy. Figure 11 shows the comparison to othermethods in CASP13. AlphaFold correctly predicted structures for24/43 domains, 10 more than the next closest method.
The viability of utilizing sequence co-evolution in modeling hasrecently been accelerated by large amounts of available data anddevelopments in deep learning. Because the use in structure pre-diction is relatively new, intrinsic limitations of the information itcan provide are unknown. Nonetheless, the method has the potentialto play an important role in structure determination and could alsobecome part of all integrative modeling approaches in the future.
III. FUTURE DIRECTIONS AND CHALLENGESIn this Perspective, we have summarized computational tech-
niques that perform protein structure prediction, protein–protein
J. Chem. Phys. 153, 240901 (2020); doi: 10.1063/5.0026025 153, 240901-19
Published under license by AIP Publishing
The Journalof Chemical Physics PERSPECTIVE scitation.org/journal/jcp
docking, and/or molecular dynamics simulations by includingexperimental data from cryo-EM, NMR, MS, EPR, SAXS, FRET,and/or sequence covariation to improve modeling accuracy. Whileimprovements in algorithms and data availability have resulted indramatic improvements in modeling accuracy over the last decade,there are still challenges ahead.
One challenge for integrative modeling approaches is to prop-erly account for the experimental error and noise. While doingso can improve modeling results even with partially incorrect orincomplete data, perfectly accurate modeling with sparse data can-not be reasonably expected. In addition to modeling experimentalerror and noise for dynamic systems, it can also be very important tomodel ensembles of multiple conformations. Another challenge andreason for inaccurate modeling is error in forward models, whichpredict the data from the structure. This might be a reason why manymethods are only successfully able to rank models after generation,rather than being used during the sampling phase. Improvementsin understanding and theory of experimental techniques shouldimprove these forward models over time.
The understanding of the relationships between experimentaldata and structure is one reason why integrated approaches can fail.One way to gain a more accurate understanding of experimental dataand successfully use the information in modeling is to make datasetsmore easily available. For example, databases such as the ElectronMicroscopy Data Bank (EMDB) and UniProt have made a largeamount of data available for cryo-EM- and sequence covariation-based modeling. Databases to unify and store data from other exper-imental methods would be tremendously beneficial to protein struc-ture modeling efforts. While unifying large amounts of experimentaldata is certainly a huge challenge, we hope that the successes of com-putational modeling highlighted in this Perspective demonstrate thedemand for these types of resources.
Despite the recent success of AlphaFold298 in covariation-basedmodeling, accurate tertiary structure prediction remains a huge chal-lenge. AlphaFold’s structure prediction results in CASP13 (2018)were the best ever seen, but the method still failed to accuratelypredict structures (TM score > 0.7) of 19/43 domains. One of the rea-sons for AlphaFold’s success, besides the use of state-of-the-art neu-ral networks to derive sequence-dependent potentials, is the quantityof data available for multiple sequence alignment used to predictdistances and contacts (∼185 × 106 available sequences7). Whilein the long-term, it is potentially shortsighted to place limits ondeep learning methods such as AlphaFold, current implementationsmay be dependent on the amount of distance information stored inthe aligned, evolutionarily relevant sequences. One possible solutioncould be to include more data, specifically data from experimen-tal methods that contain structural information as outlined in thisPerspective, into the structure prediction potentials.
Numerous computational methods outside of AlphaFold incor-porate multiple types of experimental data into their structure pre-diction methods. When doing so, we hypothesize that it is mostbeneficial to combine methods that provide orthogonal informa-tion. In Fig. 1, we have roughly categorized the data obtained fromthe featured experimental methods based on the type of structuralinformation they provide. The categories are size, shape, solventaccessibility, interface location/composition, distances/contacts,spatial density, orientation, local environment, flexibility, andstoichiometry/connectivity. For example, when deciding which
methods to combine, it might be most advantageous to obtain someinformation on overall shape (e.g., SAXS or cryo-EM), some infor-mation on solvent exposed residues (e.g., covalent labeling or EPR),and some information on contacts (e.g., sequence co-evolution,FRET, XL, EPR, and NOE). This type of combined informationcould have the potential to synergistically improve structure pre-diction. However, one of the main challenges in the combinationof multiple types of experimental restraints is to properly weightthe information, ideally in a probabilistic approach based on theiraccuracy and uncertainty. For example, Bayesian approaches in theIntegrative Modeling Platform (IMP)43,44 and Modeling EmployingLimited Data (MELD)8,162 are specifically designed to statisticallymodel the probabilities and noise.
While monomer fold prediction methods such as AlphaFoldare very important, much of the biological function is mediatedby protein–protein interactions, where the majority of proteinsexist at least transiently as part of a complex. In this Perspec-tive, we have discussed several experimental methods that canspecifically provide information about these protein–protein inter-faces, such as hydrogen–deuterium exchange (covalent labeling),chemical cross-linking, surface-induced dissociation, Förster reso-nance energy transfer, and electron paramagnetic resonance. Usingthese methods to collect data on interfaces as well as other meth-ods that provide information on the entire complex should facili-tate the prediction of these complex structures. For example, it isfeasible to use some information to predict monomer structuresand some other information to predict the relative orientations ofthose monomers as they form a complex, assuming that they donot undergo significant backbone conformational changes uponbinding.
During protein structural modeling efforts, computer algo-rithms for conformational sampling are almost always used. Con-versely, one such unconventional approach to sampling is used inFoldit. Foldit, a video game with a Rosetta backend, takes advan-tage of the intuition of “citizen scientists” to explore the confor-mational space of proteins that are visually presented in interactivepuzzles.300 In Foldit, players can sample different structures by man-ually changing positions of backbones and side chains as well asusing built-in tools which perform some small algorithmic refine-ment, such as gradient-based minimization and combinatorial side-chain rotamer packing. This strategy of crowdsourcing the samplingusing Foldit has been successful in terms of predicting the struc-tures of real proteins in multiple studies.301–304 Foldit has also beenincorporated into the classroom to teach students about the proteinstructure in a more interactive manner.305–307 Recently, cryo-EMdensity maps have been integrated into Foldit puzzles, allowing theplayers to fit proteins into visualized density maps.308 In a com-parison to other automated cryo-EM density flexible fitting tools,Foldit players were able to identify a structure of S. entomophilaafp7. Of course, using Foldit to determine a structure based on adensity map is considerably more time consuming than automatedalgorithms, but the method was able to produce a structure withbetter side-chain placement in the density map and which was moregeometrically plausible, as shown in Fig. 12. Moving forward, itwould be interesting to see Foldit players building structures usinginformation from other experimental data, such as labeled residuesfrom covalent labeling and contacts from a variety of experimentalmethods.
J. Chem. Phys. 153, 240901 (2020); doi: 10.1063/5.0026025 153, 240901-20
Published under license by AIP Publishing
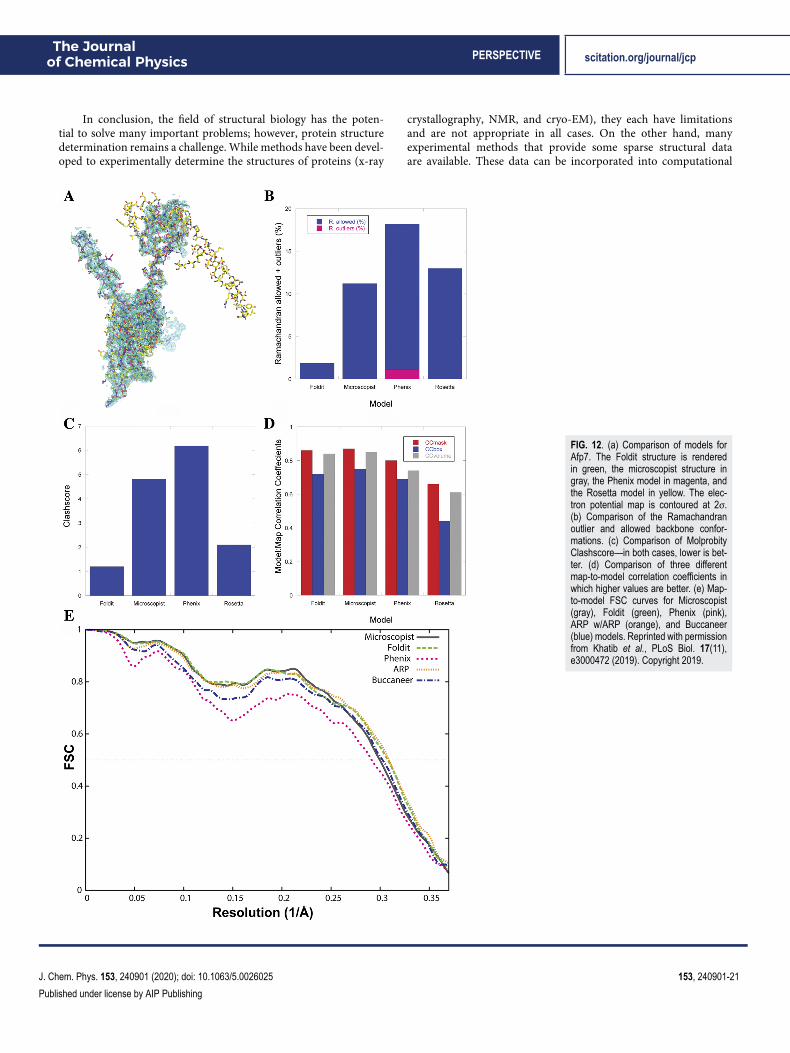
The Journalof Chemical Physics PERSPECTIVE scitation.org/journal/jcp
In conclusion, the field of structural biology has the poten-tial to solve many important problems; however, protein structuredetermination remains a challenge. While methods have been devel-oped to experimentally determine the structures of proteins (x-ray
crystallography, NMR, and cryo-EM), they each have limitationsand are not appropriate in all cases. On the other hand, manyexperimental methods that provide some sparse structural dataare available. These data can be incorporated into computational
FIG. 12. (a) Comparison of models forAfp7. The Foldit structure is renderedin green, the microscopist structure ingray, the Phenix model in magenta, andthe Rosetta model in yellow. The elec-tron potential map is contoured at 2σ.(b) Comparison of the Ramachandranoutlier and allowed backbone confor-mations. (c) Comparison of MolprobityClashscore—in both cases, lower is bet-ter. (d) Comparison of three differentmap-to-model correlation coefficients inwhich higher values are better. (e) Map-to-model FSC curves for Microscopist(gray), Foldit (green), Phenix (pink),ARP w/ARP (orange), and Buccaneer(blue) models. Reprinted with permissionfrom Khatib et al., PLoS Biol. 17(11),e3000472 (2019). Copyright 2019.
J. Chem. Phys. 153, 240901 (2020); doi: 10.1063/5.0026025 153, 240901-21
Published under license by AIP Publishing
The Journalof Chemical Physics PERSPECTIVE scitation.org/journal/jcp
protein modeling algorithms such as de novo folding, protein–protein docking, and molecular dynamics. Over the past fewdecades, many combined experimental/computational methodshave been successfully developed and benchmarked as described inthis Perspective. In the future, significant advancements to data col-lection and modeling of the methods highlighted in this Perspectivewill be made. There is little doubt that new experimental methodswill be developed and used for protein structure modeling as well.For example, cryo-EM, which has become one of the most pop-ular methods for integrative modeling, was not thought of in thislight even 20 years prior. Current and future methods have tremen-dous potential to facilitate structure determination of proteins andprotein complexes.
ACKNOWLEDGMENTSThe authors would like to thank the members of the Lindert
group for useful discussions. We would also like to thank SarahBiehn for kindly providing Fig. 6. Integrative protein modelingwork in the Lindert group was supported by the NSF (Grant No.CHE 1750666), the NIH (Grant No. P41 GM128577), and a SloanResearch Fellowship to S.L.
DATA AVAILABILITY
Data sharing is not applicable to this article as no new data werecreated or analyzed in this study.
REFERENCES1S. P. Leelananda and S. Lindert, “Computational methods in drug discovery,”Beilstein J. Org. Chem. 12, 2694–2718 (2016).2E. Nwanochie and V. N. Uversky, “Structure determination by single-particlecryo-electron microscopy: Only the sky (and intrinsic disorder) is the limit,” Int.J. Mol. Sci. 20(17), 4186 (2019).3J. M. Würz, S. Kazemi, E. Schmidt, A. Bagaria, and P. Güntert, “NMR-basedautomated protein structure determination,” Arch. Biochem. Biophys. 628, 24–32(2017).4A. Ilari and C. Savino, “Protein structure determination by x-raycrystallography,” Methods Mol. Biol. 452, 63–87 (2008).5Overall Growth of Released Structures per Year, RCSB, 2020.6A. Prestel, K. Bugge, L. Staby, R. Hendus-Altenburger, and B. B. Kragelund,“Characterization of dynamic IDP complexes by NMR spectroscopy,” MethodsEnzymol. 611, 193–226 (2018).7See https://www.ebi.ac.uk/uniprot/TrEMBLstats for Release Statistics.8J. L. MacCallum, A. Perez, and K. A. Dill, “Determining protein structuresby combining semireliable data with atomistic physical models by Bayesianinference,” Proc. Natl. Acad. Sci. U. S. A. 112(22), 6985–6990 (2015).9K. T. Simons, C. Kooperberg, E. Huang, and D. Baker, “Assembly of pro-tein tertiary structures from fragments with similar local sequences using sim-ulated annealing and Bayesian scoring functions,” J. Mol. Biol. 268(1), 209–225(1997).10R. F. Alford, A. Leaver-Fay, J. R. Jeliazkov, M. J. O’Meara, F. P. DiMaio, H. Park,M. V. Shapovalov, P. D. Renfrew, V. K. Mulligan, K. Kappel, J. W. Labonte, M. S.Pacella, R. Bonneau, P. Bradley, R. L. Dunbrack, Jr., R. Das, D. Baker, B. Kuhlman,T. Kortemme, and J. J. Gray, “The Rosetta all-atom energy function for macro-molecular modeling and design,” J. Chem. Theory Comput. 13(6), 3031–3048(2017).11K. T. Simons, I. Ruczinski, C. Kooperberg, B. A. Fox, C. Bystroff, and D. Baker,“Improved recognition of native-like protein structures using a combination of
sequence-dependent and sequence-independent features of proteins,” Proteins34(1), 82–95 (1999).12A. Leaver-Fay, M. Tyka, S. M. Lewis, O. F. Lange, J. Thompson, R. Jacak,K. Kaufman, P. D. Renfrew, C. A. Smith, W. Sheffler, I. W. Davis, S. Cooper,A. Treuille, D. J. Mandell, F. Richter, Y.-E. A. Ban, S. J. Fleishman, J. E. Corn, D. E.Kim, S. Lyskov, M. Berrondo, S. Mentzer, Z. Popovic, J. J. Havranek, J. Karan-icolas, R. Das, J. Meiler, T. Kortemme, J. J. Gray, B. Kuhlman, D. Baker, andP. Bradley, “ROSETTA3: An object-oriented software suite for the simulation anddesign of macromolecules,” Methods Enzymol. 487, 545–574 (2011).13J. K. Leman, B. D. Weitzner, S. M. Lewis, J. Adolf-Bryfogle, N. Alam, R. F.Alford, M. Aprahamian, D. Baker, K. A. Barlow, P. Barth, B. Basanta, B. J. Bender,K. Blacklock, J. Bonet, S. E. Boyken, P. Bradley, C. Bystroff, P. Conway, S. Cooper,B. E. Correia, B. Coventry, R. Das, R. M. De Jong, F. DiMaio, L. Dsilva, R.Dunbrack, A. S. Ford, B. Frenz, D. Y. Fu, C. Geniesse, L. Goldschmidt,R. Gowthaman, J. J. Gray, D. Gront, S. Guffy, S. Horowitz, P.-S. Huang, T. Huber,T. M. Jacobs, J. R. Jeliazkov, D. K. Johnson, K. Kappel, J. Karanicolas, H. Khakzad,K. R. Khar, S. D. Khare, F. Khatib, A. Khramushin, I. C. King, R. Kleffner, B.Koepnick, T. Kortemme, G. Kuenze, B. Kuhlman, D. Kuroda, J. W. Labonte, J. K.Lai, G. Lapidoth, A. Leaver-Fay, S. Lindert, T. Linsky, N. London, J. H. Lubin,S. Lyskov, J. Maguire, L. Malmström, E. Marcos, O. Marcu, N. A. Marze, J. Meiler,R. Moretti, V. K. Mulligan, S. Nerli, C. Norn, S. Ó’Conchúir, N. Ollikainen,S. Ovchinnikov, M. S. Pacella, X. Pan, H. Park, R. E. Pavlovicz, M. Pethe, B. G.Pierce, K. B. Pilla, B. Raveh, P. D. Renfrew, S. S. R. Burman, A. Rubenstein, M. F.Sauer, A. Scheck, W. Schief, O. Schueler-Furman, Y. Sedan, A. M. Sevy, N. G.Sgourakis, L. Shi, J. B. Siegel, D.-A. Silva, S. Smith, Y. Song, A. Stein, M. Szegedy,F. D. Teets, S. B. Thyme, R. Y.-R. Wang, A. Watkins, L. Zimmerman, andR. Bonneau, “Macromolecular modeling and design in Rosetta: Recent methodsand frameworks,” Nat. Methods 17(7), 665–680 (2020).14M. Karakas, N. Woetzel, R. Staritzbichler, N. Alexander, B. E. Weiner, andJ. Meiler, “BCL::Fold–de novo prediction of complex and large protein topolo-gies by assembly of secondary structure elements,” PLoS One 7(11), e49240(2012).15B. E. Weiner, N. Woetzel, M. Karakas, N. Alexander, and J. Meiler,“BCL::MP-Fold: Folding membrane proteins through assembly of transmembranehelices,” Structure 21(7), 1107–1117 (2013).16D. Xu and Y. Zhang, “Toward optimal fragment generations for ab initio proteinstructure assembly,” Proteins 81(2), 229–239 (2013).17Y. Zhang, A. Kolinski, and J. Skolnick, “TOUCHSTONE II: A new approachto ab initio protein structure prediction,” Biophys. J. 85(2), 1145–1164(2003).18J. Yang, R. Yan, A. Roy, D. Xu, J. Poisson, and Y. Zhang, “The I-TASSER suite:Protein structure and function prediction,” Nat Methods 12, 7–8 (2015).19Y. Song, F. DiMaio, R. Y.-R. Wang, D. Kim, C. Miles, T. Brunette, J. Thompson,and D. Baker, “High-resolution comparative modeling with RosettaCM,” Struc-ture 21(10), 1735–1742 (2013).20B. Webb and A. Sali, “Comparative protein structure modeling usingMODELLER,” Curr. Protoc. Bioinf. 54, 5.6.1–5.6.37 (2016).21A. Waterhouse, M. Bertoni, S. Bienert, G. Studer, G. Tauriello, R. Gumienny,F. T. Heer, T. A. P. de Beer, C. Rempfer, L. Bordoli, R. Lepore, and T. Schwede,“SWISS-MODEL: Homology modelling of protein structures and complexes,”Nucleic Acids Res. 46(W1), W296–W303 (2018).22Molecular Operating Environment (MOE) software, Chemical ComputingGroup, Inc., 2020.23J. J. Gray, S. Moughon, C. Wang, O. Schueler-Furman, B. Kuhlman, C. A. Rohl,and D. Baker, “Protein-protein docking with simultaneous optimization of rigid-body displacement and side-chain conformations,” J. Mol. Biol. 331(1), 281–299(2003).24A. Sircar, S. Chaudhury, K. P. Kilambi, M. Berrondo, and J. J. Gray, “A general-ized approach to sampling backbone conformations with RosettaDock for CAPRIrounds 13-19,” Proteins 78(15), 3115–3123 (2010).25I. Andre, P. Bradley, C. Wang, and D. Baker, “Prediction of the structureof symmetrical protein assemblies,” Proc. Natl. Acad. Sci. U. S. A. 104(45),17656–17661 (2007).26V. A. Roberts, E. E. Thompson, M. E. Pique, M. S. Perez, and L. F. Ten Eyck,“DOT2: Macromolecular docking with improved biophysical models,” J. Comput.Chem. 34(20), 1743–1758 (2013).
J. Chem. Phys. 153, 240901 (2020); doi: 10.1063/5.0026025 153, 240901-22
Published under license by AIP Publishing
The Journalof Chemical Physics PERSPECTIVE scitation.org/journal/jcp
27P. L. Kastritis, J. P. G. L. M. Rodrigues, and A. M. J. J. Bonvin, “HAD-DOCK(2P2I): A biophysical model for predicting the binding affinity of protein-protein interaction inhibitors,” J. Chem. Inf. Model. 54(3), 826–836 (2014).28B. G. Pierce, K. Wiehe, H. Hwang, B.-H. Kim, T. Vreven, and Z. Weng,“ZDOCK server: Interactive docking prediction of protein-protein complexes andsymmetric multimers,” Bioinformatics 30(12), 1771–1773 (2014).29S. R. Comeau, D. W. Gatchell, S. Vajda, and C. J. Camacho, “ClusPro: Anautomated docking and discrimination method for the prediction of proteincomplexes,” Bioinformatics 20(1), 45–50 (2004).30D. Schneidman-Duhovny, Y. Inbar, R. Nussinov, and H. J. Wolfson, “Patch-Dock and SymmDock: Servers for rigid and symmetric docking,” Nucleic AcidsRes. 33, W363–W367 (2005).31H. A. Gabb, R. M. Jackson, and M. J. E. Sternberg, “Modelling protein dockingusing shape complementarity, electrostatics and biochemical information,” J. Mol.Biol. 272(1), 106–120 (1997).32S. J. Marrink, H. J. Risselada, S. Yefimov, D. P. Tieleman, and A. H. de Vries,“The MARTINI force field: Coarse grained model for biomolecular simulations,”J. Phys. Chem. B 111(27), 7812–7824 (2007).33J. Huang, S. Rauscher, G. Nawrocki, T. Ran, M. Feig, B. L. de Groot,H. Grubmüller, and A. D. MacKerell, Jr., “CHARMM36m: An improved forcefield for folded and intrinsically disordered proteins,” Nat. Methods 14(1), 71–73(2017).34J. A. Maier, C. Martinez, K. Kasavajhala, L. Wickstrom, K. E. Hauser, andC. Simmerling, “ff14SB: Improving the accuracy of protein side chain and back-bone parameters from ff99SB,” J. Chem. Theory Comput. 11(8), 3696–3713(2015).35Y. Shi, Z. Xia, J. Zhang, R. Best, C. Wu, J. W. Ponder, and P. Ren, “The polariz-able atomic multipole-based AMOEBA force field for proteins,” J. Chem. TheoryComput. 9(9), 4046–4063 (2013).36J. C. Phillips, R. Braun, W. Wang, J. Gumbart, E. Tajkhorshid, E. Villa,C. Chipot, R. D. Skeel, L. Kalé, and K. Schulten, “Scalable molecular dynamicswith NAMD,” J. Comput. Chem. 26(16), 1781–1802 (2005).37R. Salomon-Ferrer, D. A. Case, and R. C. Walker, “An overview of the Amberbiomolecular simulation package,” Wiley Interdiscip. Rev.: Comput. Mol. Sci.3(2), 198–210 (2013).38M. J. Abraham, T. Murtola, R. Schulz, S. Páll, J. C. Smith, B. Hess, andE. Lindahl, “GROMACS: High performance molecular simulations throughmulti-level parallelism from laptops to supercomputers,” SoftwareX 1-2, 19–25(2015).39K. J. Bowers, D. E. Chow, H. Xu, R. O. Dror, M. P. Eastwood, B. A. Gregersen,J. L. Klepeis, I. Kolossvary, M. A. Moraes, F. D. Sacerdoti, J. K. Salmon, Y. Shan,and D. E. Shaw, “Scalable algorithms for molecular dynamics simulations on com-modity clusters,” in SC ‘06: Proceedings of the 2006 ACM/IEEE Conference onSupercomputing (IEEE, 2006), p. 43.40B. R. Brooks, C. L. Brooks III, A. D. Mackerell III, L. Nilsson, R. J. Petrella,B. Roux, Y. Won, G. Archontis, C. Bartels, S. Boresch, A. Caflisch, L. Caves,Q. Cui, A. R. Dinner, M. Feig, S. Fischer, J. Gao, M. Hodoscek, W. Im,K. Kuczera, T. Lazaridis, J. Ma, V. Ovchinnikov, E. Paci, R. W. Pastor, C. B. Post,J. Z. Pu, M. Schaefer, B. Tidor, R. M. Venable, H. L. Woodcock, X. Wu, W. Yang,D. M. York, and M. Karplus, “CHARMM: The biomolecular simulation program,”J. Comput. Chem. 30(10), 1545–1614 (2009).41P. Eastman, M. S. Friedrichs, J. D. Chodera, R. J. Radmer, C. M. Bruns, J. P. Ku,K. A. Beauchamp, T. J. Lane, L.-P. Wang, D. Shukla, T. Tye, M. Houston, T. Stich,C. Klein, M. R. Shirts, and V. S. Pande, “OpenMM 4: A reusable, extensible, hard-ware independent library for high performance molecular simulation,” J. Chem.Theory Comput. 9(1), 461–469 (2013).42A. Kryshtafovych, T. Schwede, M. Topf, K. Fidelis, and J. Moult, “Critical assess-ment of methods of protein structure prediction (CASP)-Round XIII,” Proteins87(12), 1011–1020 (2019).43B. Webb, K. Lasker, J. Velázquez-Muriel, D. Schneidman-Duhovny, R. Pellarin,M. Bonomi, C. Greenberg, B. Raveh, E. Tjioe, D. Russel, and A. Sali, “Modeling ofproteins and their assemblies with the integrative modeling platform,” MethodsMol. Biol. 1091, 277–295 (2014).44B. Webb, S. Viswanath, M. Bonomi, R. Pellarin, C. H. Greenberg, D. Saltzberg,and A. Sali, “Integrative structure modeling with the integrative modeling plat-form,” Protein Sci. 27(1), 245–258 (2018).
45https://commons.wikimedia.org/wiki/File:Cryoem_groel.jpg for Vossman.46K. M. Yip, N. Fischer, E. Paknia, A. Chari, and H. Stark, “Atomic-resolutionprotein structure determination by cryo-EM,” Nature. 587(7832), 157–161(2020).47T. Nakane, A. Kotecha, A. Sente, G. McMullan, S. Masiulis, P. M. G. E. Brown,I. T. Grigoras, L. Malinauskaite, T. Malinauskas, J. Miehling, T. Uchanski, L. Yu,D. Karia, E. V. Pechnikova, E. de Jong, J. Keizer, M. Bischoff, J. McCormack,P. Tiemeijer, S. W. Hardwick, D. Y. Chirgadze, G. Murshudov, A. R. Aricescu,and S. H. W. Scheres, “Single-particle cryo-EM at atomic resolution,” Nature 587,152–156 (2020).48C. L. Lawson, A. Patwardhan, M. L. Baker, C. Hryc, E. S. Garcia, B. P. Hudson,I. Lagerstedt, S. J. Ludtke, G. Pintilie, R. Sala, J. D. Westbrook, H. M. Berman, G. J.Kleywegt, and W. Chiu, “EMDataBank unified data resource for 3DEM,” NucleicAcids Res. 44(D1), D396–D403 (2016).49E. Alnabati and D. Kihara, “Advances in structure modeling methods for cryo-electron microscopy maps,” Molecules 25(1), 82 (2019).50S. J. de Vries, I. Chauvot de Beauchêne, C. E. Schindler, and M. Zacharias,“Cryo-EM data are superior to contact and interface information in integrativemodeling,” Biophys. J. 110(4), 785–797 (2016).51J. M. Bell, M. Chen, P. R. Baldwin, and S. J. Ludtke, “High resolution singleparticle refinement in EMAN2.1,” Methods 100, 25–34 (2016).52A. Punjani, J. L. Rubinstein, D. J. Fleet, and M. A. Brubaker, “cryoSPARC: Algo-rithms for rapid unsupervised cryo-EM structure determination,” Nat. Methods14(3), 290–296 (2017).53S. H. W. Scheres, “RELION: Implementation of a Bayesian approach to cryo-EMstructure determination,” J. Struct. Biol. 180(3), 519–530 (2012).54M. L. Baker, T. Ju, and W. Chiu, “Identification of secondary structure elementsin intermediate-resolution density maps,” Structure 15(1), 7–19 (2007).55S. R. Maddhuri Venkata Subramaniya, G. Terashi, and D. Kihara, “Protein sec-ondary structure detection in intermediate-resolution cryo-EM maps using deeplearning,” Nat. Methods 16(9), 911–917 (2019).56L. Ma, M. Reisert, and H. Burkhardt, “RENNSH: A novel alpha-helix identifi-cation approach for intermediate resolution electron density maps,” IEEE/ACMTrans. Comput. Biol. Bioinf. 9(1), 228–239 (2012).57D. Si, S. Ji, K. A. Nasr, and J. He, “A machine learning approach for the iden-tification of protein secondary structure elements from electron cryo-microscopydensity maps,” Biopolymers 97(9), 698–708 (2012).58R. Li, D. Si, T. Zeng, S. Ji, and J. He, “Deep convolutional neural networksfor detecting secondary structures in protein density maps from cryo-electronmicroscopy,” in Proceedings of 2016 IEEE International Conference on Bioinfor-matics and Biomedicine (IEEE, 2016), pp. 41–46.59W. Wriggers, R. A. Milligan, and J. A. McCammon, “Situs: A package fordocking crystal structures into low-resolution maps from electron microscopy,”J. Struct. Biol. 125(2-3), 185–195 (1999).60M. G. Rossmann, R. Bernal, and S. V. Pletnev, “Combining electron microscopicwith x-ray crystallographic structures,” J. Struct. Biol. 136(3), 190–200 (2001).61X. Wu, J. L. S. Milne, M. J. Borgnia, A. V. Rostapshov, S. Subramaniam, andB. R. Brooks, “A core-weighted fitting method for docking atomic structures intolow-resolution maps: Application to cryo-electron microscopy,” J. Struct. Biol.141(1), 63–76 (2003).62J. I. Garzón, J. Kovacs, R. Abagyan, and P. Chacón, “ADP_EM: Fast exhaustivemulti-resolution docking for high-throughput coverage,” Bioinformatics 23(4),427–433 (2007).63N. Woetzel, S. Lindert, P. L. Stewart, and J. Meiler, “BCL::EM-Fit: Rigid bodyfitting of atomic structures into density maps using geometric hashing and realspace refinement,” J. Struct. Biol. 175(3), 264–276 (2011).64P. Chacón and W. Wriggers, “Multi-resolution contour-based fitting of macro-molecular structures,” J. Mol. Biol. 317(3), 375–384 (2002).65G. Derevyanko and S. Grudinin, “HermiteFit: Fast-fitting atomic structuresinto a low-resolution density map using three-dimensional orthogonal her-mite functions,” Acta Crystallogr., Sect. D: Biol. Crystallogr. 70(8), 2069–2084(2014).66R. Bettadapura, M. Rasheed, A. Vollrath, and C. Bajaj, “PF2fit: Polar fast Fouriermatched alignment of atomistic structures with 3D electron microscopy maps,”PLoS Comput. Biol. 11(10), e1004289 (2015).
J. Chem. Phys. 153, 240901 (2020); doi: 10.1063/5.0026025 153, 240901-23
Published under license by AIP Publishing
The Journalof Chemical Physics PERSPECTIVE scitation.org/journal/jcp
67M. Topf, M. L. Baker, B. John, W. Chiu, and A. Sali, “Structural characterizationof components of protein assemblies by comparative modeling and electron cryo-microscopy,” J. Struct. Biol. 149(2), 191–203 (2005).68L. G. Trabuco, E. Villa, K. Mitra, J. Frank, and K. Schulten, “Flexible fittingof atomic structures into electron microscopy maps using molecular dynamics,”Structure 16(5), 673–683 (2008).69L. G. Trabuco, E. Villa, E. Schreiner, C. B. Harrison, and K. Schulten, “Moleculardynamics flexible fitting: A practical guide to combine cryo-electron microscopyand X-ray crystallography,” Methods 49(2), 174–180 (2009).70J. Hsin, J. Gumbart, L. G. Trabuco, E. Villa, P. Qian, C. N. Hunter, andK. Schulten, “Protein-induced membrane curvature investigated through molec-ular dynamics flexible fitting,” Biophys. J. 97(1), 321–329 (2009).71K.-Y. Chan, J. Gumbart, R. McGreevy, J. M. Watermeyer, B. T. Sewell, andK. Schulten, “Symmetry-restrained flexible fitting for symmetric EM maps,”Structure 19(9), 1211–1218 (2011).72A. Singharoy, I. Teo, R. McGreevy, J. E. Stone, J. Zhao, and K. Schulten,“Molecular dynamics-based refinement and validation for sub-5 Å cryo-electronmicroscopy maps,” Elife 5, e16105 (2016).73R. McGreevy, I. Teo, A. Singharoy, and K. Schulten, “Advances in the molecu-lar dynamics flexible fitting method for cryo-EM modeling,” Methods 100, 50–60(2016).74M. Orzechowski and F. Tama, “Flexible fitting of high-resolution x-ray struc-tures into cryoelectron microscopy maps using biased molecular dynamics simu-lations,” Biophys. J. 95(12), 5692–5705 (2008).75I. Grubisic, M. N. Shokhirev, M. Orzechowski, O. Miyashita, and F. Tama,“Biased coarse-grained molecular dynamics simulation approach for flexible fit-ting of X-ray structure into cryo electron microscopy maps,” J. Struct. Biol. 169(1),95–105 (2010).76O. Miyashita, C. Kobayashi, T. Mori, Y. Sugita, and F. Tama, “Flexible fit-ting to cryo-EM density map using ensemble molecular dynamics simulations,”J. Comput. Chem. 38(16), 1447–1461 (2017).77N. Go, T. Noguti, and T. Nishikawa, “Dynamics of a small globular protein interms of low-frequency vibrational modes,” Proc. Natl. Acad. Sci. U. S. A. 80(12),3696–3700 (1983).78F. Tama, O. Miyashita, and C. L. Brooks III, “Normal mode based flexiblefitting of high-resolution structure into low-resolution experimental data fromcryo-EM,” J. Struct. Biol. 147(3), 315–326 (2004).79F. Tama, O. Miyashita, and C. L. Brooks III, “Flexible multi-scale fitting ofatomic structures into low-resolution electron density maps with elastic networknormal mode analysis,” J. Mol. Biol. 337(4), 985–999 (2004).80W. Zheng, “Accurate flexible fitting of high-resolution protein structures intocryo-electron microscopy maps using coarse-grained pseudo-energy minimiza-tion,” Biophys. J. 100(2), 478–488 (2011).81J. R. Lopéz-Blanco and P. Chacón, “iMODFIT: Efficient and robust flexible fit-ting based on vibrational analysis in internal coordinates,” J. Struct. Biol. 184(2),261–270 (2013).82F. DiMaio, Y. Song, X. Li, M. J. Brunner, C. Xu, V. Conticello, E. Egelman,T. Marlovits, Y. Cheng, and D. Baker, “Atomic-accuracy models from 4.5-Åcryo-electron microscopy data with density-guided iterative local refinement,”Nat. Methods 12(4), 361–365 (2015).83R. Y. Wang, Y. Song, B. A. Barad, Y. Cheng, J. S. Fraser, and F. DiMaio, “Auto-mated structure refinement of macromolecular assemblies from cryo-EM mapsusing Rosetta,” Elife 5, e17219 (2016).84S. Lindert, J. Meiler, and J. A. McCammon, “Iterative molecular dynamics-Rosetta protein structure refinement protocol to improve model quality,” J. Chem.Theory Comput. 9(8), 3843–3847 (2013).85S. Lindert and J. A. McCammon, “Improved cryoEM-guided iterative molec-ular dynamics–Rosetta protein structure refinement protocol for high precisionprotein structure prediction,” J. Chem. Theory Comput. 11(3), 1337–1346 (2015).86S. P. Leelananda and S. Lindert, “Iterative molecular dynamics-Rosetta mem-brane protein structure refinement guided by cryo-EM densities,” J. Chem. TheoryComput. 13(10), 5131–5145 (2017).87S. P. Leelananda and S. Lindert, “Using NMR chemical shifts and cryo-EM den-sity restraints in iterative rosetta-MD protein structure refinement,” J. Chem. Inf.Model. 60(5), 2522–2532 (2019).
88S. Lindert, R. Staritzbichler, N. Wötzel, M. Karakas, P. L. Stewart, and J. Meiler,“EM-fold: De novo folding of alpha-helical proteins guided by intermediate-resolution electron microscopy density maps,” Structure 17(7), 990–1003(2009).89S. Lindert, N. Alexander, N. Wötzel, M. Karakas, P. L. Stewart, and J. Meiler,“EM-fold: de novo atomic-detail protein structure determination from medium-resolution density maps,” Structure 20(3), 464–478 (2012).90S. Lindert, T. Hofmann, N. Wötzel, M. Karakas, P. L. Stewart, and J. Meiler,“Ab initio protein modeling into CryoEM density maps using EM-Fold,” Biopoly-mers 97(9), 669–677 (2012).91S. Lindert, P. L. Stewart, and J. Meiler, “Computational determination of theorientation of a heat repeat-like domain of DNA-PKcs,” Comput. Biol. Chem. 42,1–4 (2013).92M. L. Baker, S. S. Abeysinghe, S. Schuh, R. A. Coleman, A. Abrams, M. P.Marsh, C. F. Hryc, T. Ruths, W. Chiu, and T. Ju, “Modeling protein struc-ture at near atomic resolutions with Gorgon,” J. Struct. Biol. 174(2), 360–373(2011).93R. Y.-R. Wang, M. Kudryashev, X. Li, E. H. Egelman, M. Basler, Y. Cheng,D. Baker, and F. DiMaio, “De novo protein structure determination from near-atomic-resolution cryo-EM maps,” Nat. Methods 12(4), 335–338 (2015).94B. Frenz, A. C. Walls, E. H. Egelman, D. Veesler, and F. DiMaio, “RosettaES: Asampling strategy enabling automated interpretation of difficult cryo-EM maps,”Nat. Methods 14(8), 797–800 (2017).95K. Kappel, S. Liu, K. P. Larsen, G. Skiniotis, E. V. Puglisi, J. D. Puglisi, Z. H.Zhou, R. Zhao, and R. Das, “De novo computational RNA modeling into cryo-EM maps of large ribonucleoprotein complexes,” Nat. Methods 15(11), 947–954(2018).96M. R. Baker, I. Rees, S. J. Ludtke, W. Chiu, and M. L. Baker, “Constructingand validating initial Cα models from subnanometer resolution density maps withpathwalking,” Structure 20(3), 450–463 (2012).97M. Chen, P. R. Baldwin, S. J. Ludtke, and M. L. Baker, “De Novo model-ing in cryo-EM density maps with Pathwalking,” J. Struct. Biol. 196(3), 289–298(2016).98M. Chen and M. L. Baker, “Automation and assessment of de novo modelingwith Pathwalking in near atomic resolution cryoEM density maps,” J. Struct. Biol.204(3), 555–563 (2018).99T. C. Terwilliger, P. D. Adams, P. V. Afonine, and O. V. Sobolev, “A fullyautomatic method yielding initial models from high-resolution cryo-electronmicroscopy maps,” Nat. Methods 15(11), 905–908 (2018).100T. C. Terwilliger, P. D. Adams, P. V. Afonine, and O. V. Sobolev, “Cryo-EMmap interpretation and protein model-building using iterative map segmenta-tion,” Protein Sci. 29(1), 87–99 (2020).101G. Terashi and D. Kihara, “De novo main-chain modeling for EM maps usingMAINMAST,” Nat. Commun. 9(1), 1618 (2018).102G. Terashi and D. Kihara, “De novo main-chain modeling with MAIN-MAST in 2015/2016 EM Model Challenge,” J. Struct. Biol. 204(2), 351–359(2018).103J. Ismer, A. S. Rose, J. K. S. Tiemann, and P. W. Hildebrand, “A fragment basedmethod for modeling of protein segments into cryo-EM density maps,” BMCBioinf. 18(1), 475 (2017).104Y. Zhu, Q. Ouyang, and Y. Mao, “A deep convolutional neural networkapproach to single-particle recognition in cryo-electron microscopy,” BMCBioinf. 18(1), 348 (2017).105F. Wang, H. Gong, G. Liu, M. Li, C. Yan, T. Xia, X. Li, and J. Zeng, “DeepPicker:A deep learning approach for fully automated particle picking in cryo-EM,”J. Struct. Biol. 195(3), 325–336 (2016).106R. Sanchez-Garcia, J. Segura, D. Maluenda, J. M. Carazo, and C. O. S. Sorzano,“Deep Consensus, a deep learning-based approach for particle pruning in cryo-electron microscopy,” IUCrJ 5(Pt 6), 854–865 (2018).107M. Chen, W. Dai, S. Y. Sun, D. Jonasch, C. Y. He, M. F. Schmid, W. Chiu, andS. J. Ludtke, “Convolutional neural networks for automated annotation of cellularcryo-electron tomograms,” Nat. Methods 14(10), 983–985 (2017).108J. M. Bell, M. Chen, T. Durmaz, A. C. Fluty, and S. J. Ludtke, “New softwaretools in EMAN2 inspired by EMDatabank map challenge,” J. Struct. Biol. 204(2),283–290 (2018).
J. Chem. Phys. 153, 240901 (2020); doi: 10.1063/5.0026025 153, 240901-24
Published under license by AIP Publishing
The Journalof Chemical Physics PERSPECTIVE scitation.org/journal/jcp
109J. Zhang, Z. Wang, Y. Chen, R. Han, Z. Liu, F. Sun, and F. Zhang, “PIXER: Anautomated particle-selection method based on segmentation using a deep neuralnetwork,” BMC Bioinf. 20(1), 41 (2019).110A. Al-Azzawi, A. Ouadou, J. J. Tanner, and J. Cheng, “AutoCryoPicker: Anunsupervised learning approach for fully automated single particle picking incryo-EM images,” BMC Bioinf. 20(1), 326 (2019).111D. Si, S. A. Moritz, J. Pfab, J. Hou, R. Cao, L. Wang, T. Wu, and J. Cheng,“Deep learning to predict protein backbone structure from high-resolution cryo-EM density maps,” Sci. Rep. 10(1), 4282 (2020).112C. L. Lawson, A. Kryshtafovych, P. D. Adams, P. V. Afonine, M. L. Baker, B. A.Barad, P. Bond, T. Burnley, R. Cao, J. Cheng, G. Chojnowski, K. Cowtan, K. A. Dill,F. DiMaio, D. P. Farrell, J. S. Fraser, M. A. Herzik, S. W. Hoh, J. Hou, L.-W. Hung,M. Igaev, A. P. Joseph, D. Kihara, D. Kumar, S. Mittal, B. Monastyrskyy, M. Olek,C. M. Palmer, A. Patwardhan, A. Perez, J. Pfab, G. D. Pintilie, J. S. Richardson,P. B. Rosenthal, D. Sarkar, L. U. Schäfer, M. F. Schmid, G. F. Schröder, M. Shekhar,D. Si, A. Singharoy, G. Terashi, T. C. Terwilliger, A. Vaiana, L. Wang, Z. Wang,S. A. Wankowicz, C. J. Williams, M. Winn, T. Wu, X. Yu, K. Zhang, H. M.Berman, and W. Chiu, “Outcomes of the 2019 EMDataResource model chal-lenge: Validation of cryo-EM models at near-atomic resolution,” bioRxiv: 147033(2020).113S. J. de Vries and M. Zacharias, “ATTRACT-EM: A new method for the com-putational assembly of large molecular machines using cryo-EM maps,” PLoS One7(12), e49733 (2012).114M. Bonomi, S. Hanot, C. H. Greenberg, A. Sali, M. Nilges, M. Vendruscolo, andR. Pellarin, “Bayesian weighing of electron cryo-microscopy data for integrativestructural modeling,” Structure 27(1), 175–188.e6 (2019).115D. Li and R. Brüschweiler, “PPM_One: A static protein structure based chem-ical shift predictor,” J. Biomol. NMR 62(3), 403–409 (2015).116J. Meiler, “PROSHIFT: Protein chemical shift prediction using artificial neuralnetworks,” J. Biomol. NMR 26(1), 25–37 (2003).117Y. Shen and A. Bax, “Protein backbone chemical shifts predicted from search-ing a database for torsion angle and sequence homology,” J. Biomol. NMR 38(4),289–302 (2007).118J. Swails, T. Zhu, X. He, and D. A. Case, “AFNMR: Automated fragmenta-tion quantum mechanical calculation of NMR chemical shifts for biomolecules,”J. Biomol. NMR 63(2), 125–139 (2015).119J. A. Losonczi, M. Andrec, M. W. F. Fischer, and J. H. Prestegard, “Ordermatrix analysis of residual dipolar couplings using singular value decomposition,”J. Magn. Reson. 138(2), 334–342 (1999).120D.-W. Li and R. Brüschweiler, “NMR-based protein potentials,” Angew.Chem., Int. Ed. 49(38), 6778–6780 (2010).121D.-W. Li and R. Brüschweiler, “Iterative optimization of molecular mechanicsforce fields from NMR data of full-length proteins,” J. Chem. Theory Comput.7(6), 1773–1782 (2011).122L. Wickstrom, A. Okur, and C. Simmerling, “Evaluating the performance of theff99SB force field based on NMR scalar coupling data,” Biophys. J. 97(3), 853–856(2009).123O. F. Lange, D. van der Spoel, and B. L. de Groot, “Scrutinizing molecu-lar mechanics force fields on the submicrosecond timescale with NMR data,”Biophys. J. 99(2), 647–655 (2010).124K. A. Beauchamp, Y.-S. Lin, R. Das, and V. S. Pande, “Are protein force fieldsgetting better? A systematic benchmark on 524 diverse NMR measurements,”J. Chem. Theory Comput. 8(4), 1409–1414 (2012).125E. S. O’Brien, A. J. Wand, and K. A. Sharp, “On the ability of molecular dynam-ics force fields to recapitulate NMR derived protein side chain order parameters,”Protein Sci. 25(6), 1156–1160 (2016).126P. Robustelli, S. Piana, and D. E. Shaw, “Developing a molecular dynamicsforce field for both folded and disordered protein states,” Proc. Natl. Acad. Sci.U. S. A. 115(21), E4758–E4766 (2018).127G. Cornilescu, F. Delaglio, and A. Bax, “Protein backbone angle restraints fromsearching a database for chemical shift and sequence homology,” J. Biomol. NMR13(3), 289–302 (1999).128Y. Shen, F. Delaglio, G. Cornilescu, and A. Bax, “TALOS+: A hybrid method forpredicting protein backbone torsion angles from NMR chemical shifts,” J. Biomol.NMR 44(4), 213–223 (2009).
129Y. Shen and A. Bax, “Protein backbone and sidechain torsion angles predictedfrom NMR chemical shifts using artificial neural networks,” J. Biomol. NMR56(3), 227–241 (2013).130A. Cavalli, X. Salvatella, C. M. Dobson, and M. Vendruscolo, “Protein structuredetermination from NMR chemical shifts,” Proc. Natl. Acad. Sci. U. S. A. 104(23),9615–9620 (2007).131Y. Shen, O. Lange, F. Delaglio, P. Rossi, J. M. Aramini, G. Liu, A. Eletsky,Y. Wu, K. K. Singarapu, A. Lemak, A. Ignatchenko, C. H. Arrowsmith,T. Szyperski, G. T. Montelione, D. Baker, and A. Bax, “Consistent blind proteinstructure generation from NMR chemical shift data,” Proc. Natl. Acad. Sci. U. S.A. 105, 4685–4690 (2008).132Y. Shen, R. Vernon, D. Baker, and A. Bax, “De novo protein structure genera-tion from incomplete chemical shift assignments,” J. Biomol. NMR 43(2), 63–78(2009).133R. Vernon, Y. Shen, D. Baker, and O. F. Lange, “Improved chemical shift basedfragment selection for CS-Rosetta using Rosetta3 fragment picker,” J. Biomol.NMR 57(2), 117–127 (2013).134Y. Shen and A. Bax, “Homology modeling of larger proteins guided bychemical shifts,” Nat. Methods 12(8), 747–750 (2015).135Y. Shen and A. Bax, “Identification of helix capping and b-turn motifs fromNMR chemical shifts,” J. Biomol. NMR 52(3), 211–232 (2012).136P. M. Bowers, C. E. M. Strauss, and D. Baker, “De novo protein structuredetermination using sparse NMR data,” J. Biomol. NMR 18(4), 311–318 (2000).137W. Li, Y. Zhang, D. Kihara, Y. J. Huang, D. Zheng, G. T. Montelione,A. Kolinski, and J. Skolnick, “TOUCHSTONEX: Protein structure prediction withsparse NMR data,” Proteins 53(2), 290–306 (2003).138W. Li, Y. Zhang, and J. Skolnick, “Application of sparse NMR restraints tolarge-scale protein structure prediction,” Biophys. J. 87(2), 1241–1248 (2004).139R. Jang, Y. Wang, Z. Xue, and Y. Zhang, “NMR data-driven structure determi-nation using NMR-I-TASSER in the CASD-NMR experiment,” J. Biomol. NMR62(4), 511–525 (2015).140C. A. Rohl and D. Baker, “De novo determination of protein backbone struc-ture from residual dipolar couplings using Rosetta,” J. Am. Chem. Soc. 124(11),2723–2729 (2002).141M. Bryson, F. Tian, J. H. Prestegard, and H. Valafar, “REDCRAFT: A tool forsimultaneous characterization of protein backbone structure and motion fromRDC data,” J. Magn. Reson. 191(2), 322–334 (2008).142J. Meiler and D. Baker, “Rapid protein fold determination using unassignedNMR data,” Proc. Natl. Acad. Sci. U. S. A. 100(26), 15404–15409 (2003).143N. G. Sgourakis, O. F. Lange, F. DiMaio, I. André, N. C. Fitzkee, P. Rossi, G. T.Montelione, A. Bax, and D. Baker, “Determination of the structures of symmet-ric protein oligomers from NMR chemical shifts and residual dipolar couplings,”J. Am. Chem. Soc. 133(16), 6288–6298 (2011).144G. Kontaxis, “An improved algorithm for MFR fragment assembly,” J. Biomol.NMR 53(2), 149–159 (2012).145B. E. Weiner, N. Alexander, L. R. Akin, N. Woetzel, M. Karakas, and J. Meiler,“BCL::Fold–protein topology determination from limited NMR restraints,”Proteins 82(4), 587–595 (2014).146Y. Xia, A. W. Fischer, P. Teixeira, B. Weiner, and J. Meiler, “Integrated struc-tural biology for α-helical membrane protein structure determination,” Structure26(4), 657–666.e2 (2018).147G. Kuenze and J. Meiler, “Protein structure prediction using sparse NOEand RDC restraints with Rosetta in CASP13,” Proteins 87(12), 1341–1350(2019).148G. Kuenze, R. Bonneau, J. K. Leman, and J. Meiler, “Integrative protein mod-eling in RosettaNMR from sparse paramagnetic restraints,” Structure 27(11),1721–1734.e5 (2019).149D. F. Gauto, L. F. Estrozi, C. D. Schwieters, G. Effantin, P. Macek, R. Sounier,A. C. Sivertsen, E. Schmidt, R. Kerfah, G. Mas, J. P. Colletier, P. Güntert,A. Favier, G. Schoehn, P. Schanda, and J. Boisbouvier, “Integrated NMR andcryo-EM atomic-resolution structure determination of a half-megadalton enzymecomplex,” Nat. Commun. 10(1), 2697 (2019).150J. Lapin and A. A. Nevzorov, “Validation of protein backbone structurescalculated from NMR angular restraints using Rosetta,” J. Biomol. NMR 73(5),229–244 (2019).
J. Chem. Phys. 153, 240901 (2020); doi: 10.1063/5.0026025 153, 240901-25
Published under license by AIP Publishing
The Journalof Chemical Physics PERSPECTIVE scitation.org/journal/jcp
151A. P. Nanzer, T. Huber, A. E. Torda, and W. F. van Gunsteren, “Moleculardynamics simulation using weak-coupling NOE distance restraining,” J. Biomol.NMR 8(3), 285–291 (1996).152B. Hess and R. M. Scheek, “Orientation restraints in molecular dynamicssimulations using time and ensemble averaging,” J. Magn. Reson. 164(1), 19–27(2003).153D.-W. Li and R. Brüschweiler, “Protocol to make protein NMR structuresamenable to stable long time scale molecular dynamics simulations,” J. Chem.Theory Comput. 10(4), 1781–1787 (2014).154I. Bertini, D. A. Case, L. Ferella, A. Giachetti, and A. Rosato, “A Grid-enabledweb portal for NMR structure refinement with AMBER,” Bioinformatics 27(17),2384–2390 (2011).155A. Cavalli, C. Camilloni, and M. Vendruscolo, “Molecular dynamics simu-lations with replica-averaged structural restraints generate structural ensemblesaccording to the maximum entropy principle,” J. Chem. Phys. 138(9), 094112(2013).156M. Bonomi, D. Branduardi, G. Bussi, C. Camilloni, D. Provasi, P. Raiteri,D. Donadio, F. Marinelli, F. Pietrucci, R. A. Broglia, and M. Parrinello, “PLUMED:A portable plugin for free-energy calculations with molecular dynamics,” Comput.Phys. Commun. 180(10), 1961–1972 (2009).157G. A. Tribello, M. Bonomi, D. Branduardi, C. Camilloni, and G. Bussi,“PLUMED 2: New feathers for an old bird,” Comput. Phys. Commun. 185(2),604–613 (2014).158D. Granata, C. Camilloni, M. Vendruscolo, and A. Laio, “Characterizationof the free-energy landscapes of proteins by NMR-guided metadynamics,” Proc.Natl. Acad. Sci. U. S. A. 110(17), 6817–6822 (2013).159M. Bonomi and C. Camilloni, “Integrative structural and dynamical biologywith PLUMED-ISDB,” Bioinformatics 33(24), 3999–4000 (2017).160T. Löhr, A. Jussupow, and C. Camilloni, “Metadynamic metainference: Con-vergence towards force field independent structural ensembles of a disorderedpeptide,” J. Chem. Phys. 146(16), 165102 (2017).161M. Bonomi, C. Camilloni, A. Cavalli, and M. Vendruscolo, “Metainference: ABayesian inference method for heterogeneous systems,” Sci. Adv. 2(1), e1501177(2016).162J. C. Robertson, R. Nassar, C. Liu, E. Brini, K. A. Dill, and A. Perez, “NMR-assisted protein structure prediction with MELDxMD,” Proteins 87(12), 1333–1340 (2019).163J. B. Fenn, M. Mann, C. K. Meng, S. F. Wong, and C. M. Whitehouse, “Electro-spray ionization for mass spectrometry of large biomolecules,” Science 246(4926),64–71 (1989).164M. Karas and F. Hillenkamp, “Laser desorption ionization of proteins withmolecular masses exceeding 10,000 daltons,” Anal. Chem. 60(20), 2299–2301(1988).165T. Hofmann, A. W. Fischer, J. Meiler, and S. Kalkhof, “Protein structure pre-diction guided by crosslinking restraints—A systematic evaluation of the impactof the crosslinking spacer length,” Methods 89, 79–90 (2015).166A. Kahraman, F. Herzog, A. Leitner, G. Rosenberger, R. Aebersold, andL. Malmström, “Cross-link guided molecular modeling with ROSETTA,” PLoSOne 8(9), e73411 (2013).167P. Lössl, K. Kölbel, D. Tänzler, D. Nannemann, C. H. Ihling, M. V. Keller,M. Schneider, F. Zaucke, J. Meiler, and A. Sinz, “Analysis of nidogen-1/laminin gamma1 interaction by cross-linking, mass spectrometry, and com-putational modeling reveals multiple binding modes,” PLoS One 9(11), e112886(2014).168M. R. Tubb, R. A. G. D. Silva, J. Fang, P. Tso, and W. S. Davidson, “Athree-dimensional homology model of lipid-free apolipoprotein A-IV usingcross-linking and mass spectrometry,” J. Biol. Chem. 283(25), 17314–17323(2008).169D. K. Schweppe, C. Zheng, J. D. Chavez, A. T. Navare, X. Wu, J. K. Eng, andJ. E. Bruce, “XLinkDB 2.0: Integrated, large-scale structural analysis of proteincrosslinking data,” Bioinformatics 32(17), 2716–2718 (2016).170Z. Liu, A. Szarecka, M. Yonkunas, K. Speranskiy, M. Kurnikova, andM. Cascio, “Crosslinking constraints and computational models as complemen-tary tools in modeling the extracellular domain of the glycine receptor,” PLoS One9(7), e102571 (2014).
171K. U. Cormann, M. Möller, and M. M. Nowaczyk, “Critical assessment of pro-tein cross-linking and molecular docking: An updated model for the interactionbetween Photosystem II and Psb27,” Front. Plant Sci. 7, 157 (2016).172V. Sarpe, A. Rafiei, M. Hepburn, N. Ostan, A. B. Schryvers, and D. C.Schriemer, “High sensitivity crosslink detection coupled with integrative struc-ture modeling in the mass spec studio,” Mol. Cell. Proteomics 15(9), 3071–3080(2016).173S. Hauri, H. Khakzad, L. Happonen, J. Teleman, J. Malmstrom, and L. Malm-strom, “Rapid determination of quaternary protein structures in complex biolog-ical samples,” Nat. Commun. 10(1), 192 (2019).174C. Piotrowski, R. Moretti, C. H. Ihling, A. Haedicke, T. Liepold, N. Lipstein,J. Meiler, O. Jahn, and A. Sinz, “Delineating the molecular basis of theCalmodulinbMunc13-2 interaction by cross-linking/mass spectrometry-evidencefor a novel CaM binding motif in bMunc13-2,” Cells 9(1), 136 (2020).175J. M. A. Bullock, J. Schwab, K. Thalassinos, and M. Topf, “The importance ofnon-accessible crosslinks and solvent accessible surface distance in modeling pro-teins with restraints from crosslinking mass spectrometry,” Mol. Cell. Proteomics15(7), 2491–2500 (2016).176A. J. R. Ferrari, F. C. Gozzo, and L. Martínez, “Statistical force-field forstructural modeling using chemical cross-linking/mass spectrometry distanceconstraints,” Bioinformatics 35(17), 3005–3012 (2019).177T. Walzthoeni, L. A. Joachimiak, G. Rosenberger, H. L. Röst, L. Malmström,A. Leitner, J. Frydman, and R. Aebersold, “xTract: software for characterizingconformational changes of protein complexes by quantitative cross-linking massspectrometry,” Nat. Methods 12(12), 1185–1190 (2015).178V. L. Mendoza and R. W. Vachet, “Probing protein structure by amino acid-specific covalent labeling and mass spectrometry,” Mass Spectrom. Rev. 28(5),785–815 (2009).179B. Zhang, M. Cheng, D. Rempel, and M. L. Gross, “Implementing fast photo-chemical oxidation of proteins (FPOP) as a footprinting approach to solve diverseproblems in structural biology,” Methods 144, 94–103 (2018).180M. L. Aprahamian and S. Lindert, “Utility of covalent labeling mass spectrom-etry data in protein structure prediction with Rosetta,” J. Chem. Theory Comput.15(5), 3410–3424 (2019).181D. J. Saltzberg, H. B. Broughton, R. Pellarin, M. J. Chalmers, A. Espada,J. A. Dodge, B. D. Pascal, P. R. Griffin, C. Humblet, and A. Sali, “A residue-resolved Bayesian approach to quantitative interpretation of hydrogen-deuteriumexchange from mass spectrometry: Application to characterizing protein-ligandinteractions,” J. Phys. Chem. B 121(15), 3493–3501 (2017).182Z.-Y. Kan, B. T. Walters, L. Mayne, and S. W. Englander, “Protein hydrogenexchange at residue resolution by proteolytic fragmentation mass spectrometryanalysis,” Proc. Natl. Acad. Sci. U. S. A. 110(41), 16438–16443 (2013).183Y. Zhang, E. L.-W. Majumder, H. Yue, R. E. Blankenship, and M. L. Gross,“Structural analysis of diheme cytochrome c by hydrogen-deuterium exchangemass spectrometry and homology modeling,” Biochemistry 53(35), 5619–5630(2014).184K. M. Ramsey, D. Narang, and E. A. Komives, “Prediction of the pres-ence of a seventh ankyrin repeat in IκBε from homology modeling combinedwith hydrogen-deuterium exchange mass spectrometry (HDX-MS),” Protein Sci.27(9), 1624–1635 (2018).185V. A. Roberts, M. E. Pique, S. Hsu, and S. Li, “Combining H/D exchangemass spectrometry and computational docking to derive the structure of protein-protein complexes,” Biochemistry 56(48), 6329–6342 (2017).186M. M. Zhang, B. R. Beno, R. Y.-C. Huang, J. Adhikari, E. G. Deyanova,J. Li, G. Chen, and M. L. Gross, “An integrated approach for determining aprotein-protein binding interface in solution and an evaluation of hydrogen-deuterium exchange kinetics for adjudicating candidate docking models,” Anal.Chem. 91(24), 15709–15717 (2019).187Y. W. Li, Q. Chi, T. Feng, H. Xiao, L. Li, and X. Wang, “Interactionsof indole alkaloids with myoglobin: A mass spectrometry based spectromet-ric and computational method,” Rapid Commun. Mass Spectrom. 34(7), e8656(2020).188M. J. Chalmers, S. A. Busby, B. D. Pascal, G. M. West, and P. R. Griffin,“Differential hydrogen/deuterium exchange mass spectrometry analysis ofprotein-ligand interactions,” Expert Rev. Proteomics 8(1), 43–59 (2011).
J. Chem. Phys. 153, 240901 (2020); doi: 10.1063/5.0026025 153, 240901-26
Published under license by AIP Publishing
The Journalof Chemical Physics PERSPECTIVE scitation.org/journal/jcp
189M. L. Eisinger, A. R. Dörrbaum, H. Michel, E. Padan, and J. D. Langer, “Ligand-induced conformational dynamics of the Escherichia coli Na+/H+ antiporter NhaArevealed by hydrogen/deuterium exchange mass spectrometry,” Proc. Natl. Acad.Sci. U. S. A. 114(44), 11691–11696 (2017).190M. J. Harris, D. Raghavan, and A. J. Borysik, “Quantitative evaluation of nativeprotein folds and assemblies by hydrogen deuterium exchange mass spectrometry(HDX-MS),” J. Am. Soc. Mass Spectrom. 30(1), 58–66 (2019).191A. A. Makarov, R. E. Iacob, G. F. Pirrone, A. Rodriguez-Granillo, L. Joyce,I. Mangion, J. C. Moore, E. C. Sherer, and J. R. Engen, “Combination ofHDX-MS and in silico modeling to study enzymatic reactivity and stereo-selectivity at different solvent conditions,” J. Pharm. Biomed. Anal. 182, 113141(2020).192A. A. Petruk, L. A. Defelipe, R. G. Rodríguez Limardo, H. Bucci, M. A.Marti, and A. G. Turjanski, “Molecular dynamics simulations provide atomisticinsight into hydrogen exchange mass spectrometry experiments,” J. Chem. TheoryComput. 9(1), 658–669 (2013).193H. Mohammadiarani, V. S. Shaw, R. R. Neubig, and H. Vashisth, “Interpret-ing hydrogen-deuterium exchange events in proteins using atomistic simulations:Case studies on regulators of G-protein signaling proteins,” J. Phys. Chem. B122(40), 9314–9323 (2018).194B. Xie, A. Sood, R. J. Woods, and J. S. Sharp, “Quantitative protein topogra-phy measurements by high resolution hydroxyl radical protein footprinting enableaccurate molecular model selection,” Sci. Rep. 7(1), 4552 (2017).195M. L. Aprahamian, E. E. Chea, L. M. Jones, and S. Lindert, “Rosetta proteinstructure prediction from hydroxyl radical protein footprinting mass spectrome-try data,” Anal. Chem. 90(12), 7721–7729 (2018).196S. H. Biehn and S. Lindert, “Accurate protein structure predictionwith hydroxyl radical protein footprinting data,” Nature Communications(unpublished) (2020).197E. Mack, “Average cross-sectional areas of molecules by gaseous diffusionmethods,” J. Am. Chem. Soc. 47(10), 2468–2482 (1925).198E. G. Marklund, M. T. Degiacomi, C. V. Robinson, A. J. Baldwin, and J. L. P.Benesch, “Collision cross sections for structural proteomics,” Structure 23(4),791–799 (2015).199A. A. Shvartsburg and M. F. Jarrold, “An exact hard-spheres scatteringmodel for the mobilities of polyatomic ions,” Chem. Phys. Lett. 261(1), 86–91(1996).200M. F. Mesleh, J. M. Hunter, A. A. Shvartsburg, G. C. Schatz, and M. F.Jarrold, “Structural information from ion mobility measurements: Effects of thelong-range potential,” J. Phys. Chem. 100(40), 16082–16086 (1996).201S. A. Ewing, M. T. Donor, J. W. Wilson, and J. S. Prell, “Collidoscope:An improved tool for computing collisional cross-sections with the trajectorymethod,” J. Am. Soc. Mass Spectrom. 28(4), 587–596 (2017).202C. E. Larriba and C. J. Hogan, “Free molecular collision cross section calcula-tion methods for nanoparticles and complex ions with energy accommodation,”J. Comput. Phys. 251, 344–363 (2013).203C. Bleiholder, T. Wyttenbach, and M. T. Bowers, “A novel projection approx-imation algorithm for the fast and accurate computation of molecular collisioncross sections (I). Method,” Int. J. Mass Spectrom. 308, 1–10 (2011).204C. Bleiholder and F. C. Liu, “Structure relaxation approximation (SRA) for elu-cidation of protein structures from ion mobility measurements,” J. Phys. Chem. B123(13), 2756–2769 (2019).205Z. Hall, A. Politis, and C. V. Robinson, “Structural modeling of heteromericprotein complexes from disassembly pathways and ion mobility-mass spectrome-try,” Structure 20(9), 1596–1609 (2012).206A. Politis, A. Y. Park, Z. Hall, B. T. Ruotolo, and C. V. Robinson, “Integrativemodelling coupled with ion mobility mass spectrometry reveals structural fea-tures of the clamp loader in complex with single-stranded DNA binding protein,”J. Mol. Biol. 425(23), 4790–4801 (2013).207M. T. Degiacomi, “On the effect of sphere-overlap on super coarse-grainedmodels of protein assemblies,” J. Am. Soc. Mass Spectrom. 30(1), 113–117(2019).208J. D. Eschweiler, A. T. Frank, and B. T. Ruotolo, “Coming to grips with ambigu-ity: Ion mobility-mass spectrometry for protein quaternary structure assignment,”J. Am. Soc. Mass Spectrom. 28(10), 1991–2000 (2017).
209J. D. Eschweiler, M. A. Farrugia, S. M. Dixit, R. P. Hausinger, and B. T. Ruotolo,“A structural model of the urease activation complex derived from ion mobility-mass spectrometry and integrative modeling,” Structure 26(4), 599–606.e3(2018).210H. Wang, J. Eschweiler, W. Cui, H. Zhang, C. Frieden, B. T. Ruotolo, andM. L. Gross, “Native mass spectrometry, ion mobility, electron-capture dissoci-ation, and modeling provide structural information for gas-phase apolipoproteinE oligomers,” J. Am. Soc. Mass Spectrom. 30(5), 876–885 (2019).211A. Kulesza, E. G. Marklund, L. MacAleese, F. Chirot, and P. Dugourd, “Bring-ing molecular dynamics and ion-mobility spectrometry closer together: Shape cor-relations, structure-based predictors, and dissociation,” J. Phys. Chem. B 122(35),8317–8329 (2018).212A. E. Blackwell, E. D. Dodds, V. Bandarian, and V. H. Wysocki, “Revealing thequaternary structure of a heterogeneous noncovalent protein complex throughsurface-induced dissociation,” Anal. Chem. 83(8), 2862–2865 (2011).213M. Zhou, C. M. Jones, and V. H. Wysocki, “Dissecting the large noncovalentprotein complex GroEL with surface-induced dissociation and ion mobility-massspectrometry,” Anal. Chem. 85(17), 8262–8267 (2013).214S. R. Harvey, J. Yan, J. M. Brown, E. Hoyes, and V. H. Wysocki, “Extended gas-phase trapping followed by surface-induced dissociation of noncovalent proteincomplexes,” Anal. Chem. 88(2), 1218–1221 (2016).215A. Q. Stiving, Z. L. VanAernum, F. Busch, S. R. Harvey, S. H. Sarni, and V. H.Wysocki, “Surface-induced dissociation: An effective method for characterizationof protein quaternary structure,” Anal. Chem. 91(1), 190–209 (2019).216A. Sahasrabuddhe, Y. Hsia, F. Busch, W. Sheffler, N. P. King, D. Baker,and V. H. Wysocki, “Confirmation of intersubunit connectivity and topology ofdesigned protein complexes by native MS,” Proc. Natl. Acad. Sci. U. S. A. 115(6),1268–1273 (2018).217S. E. Boyken, M. A. Benhaim, F. Busch, M. Jia, M. J. Bick, H. Choi, J. C. Klima,Z. Chen, C. Walkey, A. Mileant, A. Sahasrabuddhe, K. Y. Wei, E. A. Hodge,S. Byron, A. Quijano-Rubio, B. Sankaran, N. P. King, J. Lippincott-Schwartz,V. H. Wysocki, K. K. Lee, and D. Baker, “De novo design of tunable, pH-drivenconformational changes,” Science 364(6441), 658–664 (2019).218Z. Chen, R. D. Kibler, A. Hunt, F. Busch, J. Pearl, M. Jia, Z. L. VanAernum, B.I. M. Wicky, G. Dods, H. Liao, M. S. Wilken, C. Ciarlo, S. Green, H. El-Samad,J. Stamatoyannopoulos, V. H. Wysocki, M. C. Jewett, S. E. Boyken, and D. Baker,“De novo design of protein logic gates,” Science 368(6486), 78–84 (2020).219S. R. Harvey, J. T. Seffernick, R. S. Quintyn, Y. Song, Y. Ju, J. Yan, A. N.Sahasrabuddhe, A. Norris, M. Zhou, E. J. Behrman, S. Lindert, and V. H. Wysocki,“Relative interfacial cleavage energetics of protein complexes revealed by surfacecollisions,” Proc. Natl. Acad. Sci. U. S. A. 116(17), 8143–8148 (2019).220J. T. Seffernick, S. R. Harvey, V. H. Wysocki, and S. Lindert, “Predicting proteincomplex structure from surface-induced dissociation mass spectrometry data,”ACS Cent. Sci. 5(8), 1330–1341 (2019).221W. L. Hubbell, H. S. McHaourab, C. Altenbach, and M. A. Lietzow, “Watchingproteins move using site-directed spin labeling,” Structure 4(7), 779–783 (1996).222J. Voss, M. M. He, W. L. Hubbell, and H. R. Kaback, “Site-directed spinlabeling demonstrates that transmembrane domain XII in the lactose perme-ase of Escherichia coli is an alpha-helix,” Biochemistry 35(39), 12915–12918(1996).223M. A. Lietzow and W. L. Hubbell, “Motion of spin label side chains in cel-lular retinol-binding protein: Correlation with structure and nearest-neighborinteractions in an antiparallel beta-sheet,” Biochemistry 43(11), 3137–3151(2004).224C. S. Klug, W. Su, and J. B. Feix, “Mapping of the residues involved ina proposed beta-strand located in the ferric enterobactin receptor FepA usingsite-directed spin-labeling,” Biochemistry 36(42), 13027–13033 (1997).225E. R. Georgieva, T. F. Ramlall, P. P. Borbat, J. H. Freed, and D. Eliezer,“Membrane-bound alpha-synuclein forms an extended helix: Long-distancepulsed ESR measurements using vesicles, bicelles, and rodlike micelles,” J. Am.Chem. Soc. 130(39), 12856–12857 (2008).226B. Vileno, J. Chamoun, H. Liang, P. Brewer, B. D. Haldeman, K. C. Facemyer,B. Salzameda, L. Song, H.-C. Li, C. R. Cremo, and P. G. Fajer, “Broad disorder andthe allosteric mechanism of myosin II regulation by phosphorylation,” Proc. Natl.Acad. Sci. U. S. A. 108(20), 8218–8223 (2011).
J. Chem. Phys. 153, 240901 (2020); doi: 10.1063/5.0026025 153, 240901-27
Published under license by AIP Publishing

The Journalof Chemical Physics PERSPECTIVE scitation.org/journal/jcp
227J. Tong, P. P. Borbat, J. H. Freed, and Y.-K. Shin, “A scissors mechanism forstimulation of SNARE-mediated lipid mixing by cholesterol,” Proc. Natl. Acad.Sci. U. S. A. 106(13), 5141–5146 (2009).228C. Altenbach, W. Froncisz, R. Hemker, H. McHaourab, and W. L. Hubbell,“Accessibility of nitroxide side chains: Absolute Heisenberg exchange rates frompower saturation EPR,” Biophys. J. 89(3), 2103–2112 (2005).229N. Alexander, A. Al-Mestarihi, M. Bortolus, H. McHaourab, and J. Meiler, “Denovo high-resolution protein structure determination from sparse spin-labelingEPR data,” Structure 16(2), 181–195 (2008).230S. J. Hirst, N. Alexander, H. S. McHaourab, and J. Meiler, “RosettaEPR:An integrated tool for protein structure determination from sparse EPR data,”J. Struct. Biol. 173(3), 506–514 (2011).231N. S. Alexander, R. A. Stein, H. A. Koteiche, K. W. Kaufmann, H. S.McHaourab, and J. Meiler, “RosettaEPR: Rotamer library for spin label structureand dynamics,” PLoS One 8(9), e72851 (2013).232A. W. Fischer, N. S. Alexander, N. Woetzel, M. Karakas, B. E. Weiner, andJ. Meiler, “BCL::MP-fold: Membrane protein structure prediction guided by EPRrestraints,” Proteins 83(11), 1947–1962 (2015).233A. W. Fischer, E. Bordignon, S. Bleicken, A. J. García-Sáez, G. Jeschke, andJ. Meiler, “Pushing the size limit of de novo structure ensemble prediction guidedby sparse SDSL-EPR restraints to 200 residues: The monomeric and homodimericforms of BAX,” J. Struct. Biol. 195(1), 62–71 (2016).234D. Del Alamo, M. H. Tessmer, R. A. Stein, J. B. Feix, H. S. McHaourab, andJ. Meiler, “Rapid simulation of unprocessed DEER decay data for protein foldprediction,” Biophys. J. 118(2), 366–375 (2020).235Y. Qi, J. Lee, X. Cheng, R. Shen, S. M. Islam, B. Roux, and W. Im, “CHARMM-GUI DEER facilitator for spin-pair distance distribution calculations and prepara-tion of restrained-ensemble molecular dynamics simulations,” J. Comput. Chem.41(5), 415–420 (2020).236J. Köfinger and G. Hummer, “Atomic-resolution structural information fromscattering experiments on macromolecules in solution,” Phys. Rev. E 87(5),052712 (2013).237M. Sonntag, P. K. A. Jagtap, B. Simon, M.-S. Appavou, A. Geerlof, R. Stehle,F. Gabel, J. Hennig, and M. Sattler, “Segmental, domain-selective perdeutera-tion and small-angle neutron scattering for structural analysis of multi-domainproteins,” Angew. Chem., Int. Ed. 56(32), 9322–9325 (2017).238A. Koutsioubas, “Low-resolution structure of detergent-solubilized mem-brane proteins from small-angle scattering data,” Biophys. J. 113(11), 2373–2382(2017).239P.-C. Chen, R. Shevchuk, F. M. Strnad, C. Lorenz, L. Karge, R. Gilles, A. M.Stadler, J. Hennig, and J. S. Hub, “Combined small-angle x-ray and neutron scat-tering restraints in molecular dynamics simulations,” J. Chem. Theory Comput.15(8), 4687–4698 (2019).240A. Johs, M. Hammel, I. Waldner, R. P. May, P. Laggner, and R. Prassl, “Mod-ular structure of solubilized human apolipoprotein B-100. Low resolution modelrevealed by small angle neutron scattering,” J. Biol. Chem. 281(28), 19732–19739(2006).241G. Dias Mirandela, G. Tamburrino, M. T. Ivanovic, F. M. Strnad, O. Byron,T. Rasmussen, P. A. Hoskisson, J. S. Hub, U. Zachariae, F. Gabel, and A. Javelle,“Merging in-solution X-ray and neutron scattering data allows fine structuralanalysis of membrane-protein detergent complexes,” J. Phys. Chem. Lett. 9(14),3910–3914 (2018).242D. K. Putnam, B. E. Weiner, N. Woetzel, E. W. Lowe, Jr., and J. Meiler,“BCL::SAXS: GPU accelerated Debye method for computation of small angleX-ray scattering profiles,” Proteins 83(8), 1500–1512 (2015).243D. Svergun, C. Barberato, and M. H. J. Koch, “CRYSOL—A program toevaluate x-ray solution scattering of biological macromolecules from atomiccoordinates,” J. Appl. Crystallogr. 28(6), 768–773 (1995).244K. Stovgaard, C. Andreetta, J. Ferkinghoff-Borg, and T. Hamelryck, “Calcula-tion of accurate small angle X-ray scattering curves from coarse-grained proteinmodels,” BMC Bioinf. 11, 429 (2010).245D. Schneidman-Duhovny, M. Hammel, J. A. Tainer, and A. Sali, “FoXS, Dock-FoXS, and MultiFoXS: Single-state and multi-state structural modeling of pro-teins and their complexes based on SAXS profiles,” Nucleic Acids Res. 44(W1),W424–W429 (2016).
246D. Schneidman-Duhovny and M. Hammel, “Modeling structure and dynam-ics of protein complexes with SAXS profiles,” Methods Mol Biol 1764, 449–473(2018).247M. Pelikan, G. L. Hura, and M. Hammel, “Structure and flexibility within pro-teins as identified through small angle X-ray scattering,” Gen. Physiol. Biophys.28(2), 174–189 (2009).248C. Pons, M. D’Abramo, D. I. Svergun, M. Orozco, P. Bernadó, andJ. Fernández-Recio, “Structural characterization of protein-protein complexes byintegrating computational docking with small-angle scattering data,” J. Mol. Biol.403(2), 217–230 (2010).249B. Jiménez-García, C. Pons, D. I. Svergun, P. Bernadó, and J. Fernández-Recio,“pyDockSAXS: protein-protein complex structure by SAXS and computationaldocking,” Nucleic Acids Res. 43(W1), W356–W361 (2015).250B. Xia, A. Mamonov, S. Leysen, K. N. Allen, S. V. Strelkov, I. C. Paschalidis,S. Vajda, and D. Kozakov, “Accounting for observed small angle X-ray scatteringprofile in the protein-protein docking server ClusPro,” J. Comput. Chem. 36(20),1568–1572 (2015).251D. Kozakov, D. R. Hall, B. Xia, K. A. Porter, D. Padhorny, C. Yueh, D. Beglov,and S. Vajda, “The ClusPro web server for protein-protein docking,” Nat. Protoc.12(2), 255–278 (2017).252M. Ignatov, A. Kazennov, and D. Kozakov, “ClusPro FMFT-SAXS: Ultra-fastfiltering using small-angle x-ray scattering data in protein docking,” J. Mol. Biol.430(15), 2249–2255 (2018).253W. Huang, K. M. Ravikumar, M. Parisien, and S. Yang, “Theoretical modelingof multiprotein complexes by iSPOT: Integration of small-angle X-ray scattering,hydroxyl radical footprinting, and computational docking,” J. Struct. Biol. 196(3),340–349 (2016).254C. E. M. Schindler, S. J. de Vries, A. Sasse, and M. Zacharias, “SAXS data alonecan generate high-quality models of protein-protein complexes,” Structure 24(8),1387–1397 (2016).255P. Sønderby, Å. Rinnan, J. J. Madsen, P. Harris, J. T. Bukrinski, andG. H. J. Peters, “Small-angle X-ray scattering data in combination with Roset-taDock improves the docking energy landscape,” J. Chem. Inf. Model. 57(10),2463–2475 (2017).256M. Oide, Y. Sekiguchi, A. Fukuda, K. Okajima, T. Oroguchi, and M. Nakasako,“Classification of ab initio models of proteins restored from small-angle X-rayscattering,” J. Synchrotron Radiat. 25(5), 1379–1388 (2018).257H. He, C. Liu, and H. Liu, “Model reconstruction from small-anglex-ray scattering data using deep learning methods,” iScience 23(3), 100906 (2020).258J. Hou, B. Adhikari, J. J. Tanner, and J. Cheng, “SAXSDom: Modeling multido-main protein structures using small-angle X-ray scattering data,” Proteins 88, 775(2019).259M. V. Petoukhov, D. Franke, A. V. Shkumatov, G. Tria, A. G. Kikhney,M. Gajda, C. Gorba, H. D. Mertens, P. V. Konarev, and D. I. Svergun, “New devel-opments in the ATSAS program package for small-angle scattering data analysis,”J. Appl. Crystallogr. 45(2), 342–350 (2012).260M. V. Petoukhov and D. I. Svergun, “Global rigid body modeling of macro-molecular complexes against small-angle scattering data,” Biophys. J. 89(2), 1237–1250 (2005).261T. Ekimoto, Y. Kokabu, T. Oroguchi, and M. Ikeguchi, “Combination ofcoarse-grained molecular dynamics simulations and small-angle X-ray scatteringexperiments,” Biophys. Physicobiol. 16, 377–390 (2019).262M. R. Hermann and J. S. Hub, “SAXS-restrained ensemble simulations ofintrinsically disordered proteins with commitment to the principle of maximumentropy,” J. Chem. Theory Comput. 15(9), 5103–5115 (2019).263D. M. Miller III, N. S. Desai, D. C. Hardin, D. W. Piston, G. H. Patterson,J. Fleenor, S. Xu, and A. Fire, “Two-color GFP expression system for C. elegans,”Biotechniques 26(5), 914–921 (1999).264A. T. Brunger, P. Strop, M. Vrljic, S. Chu, and K. R. Weninger, “Three-dimensional molecular modeling with single molecule FRET,” J. Struct. Biol.173(3), 497–505 (2011).265S. Kalinin, T. Peulen, S. Sindbert, P. J. Rothwell, S. Berger, T. Restle, R. S.Goody, H. Gohlke, and C. A. M. Seidel, “A toolkit and benchmark study for FRET-restrained high-precision structural modeling,” Nat. Methods 9(12), 1218–1225(2012).
J. Chem. Phys. 153, 240901 (2020); doi: 10.1063/5.0026025 153, 240901-28
Published under license by AIP Publishing

The Journalof Chemical Physics PERSPECTIVE scitation.org/journal/jcp
266J.-O. Hooghoudt, M. Barroso, and R. Waagepetersen, “Toward Bayesian infer-ence of the spatial distribution of proteins from three-cube Forster resonanceenergy transfer data,” Ann. Appl. Stat. 11(3), 1711–1737 (2017).267M. Bonomi, R. Pellarin, S. J. Kim, D. Russel, B. A. Sundin, M. Riffle, D. Jaschob,R. Ramsden, T. N. Davis, E. G. D. Muller, and A. Sali, “Determining pro-tein complex structures based on a Bayesian model of in vivo Förster reso-nance energy transfer (FRET) data,” Mol. Cell. Proteomics 13(11), 2812–2823(2014).268J. J. Ferrie, C. M. Haney, J. Yoon, B. Pan, Y.-C. Lin, Z. Fakhraai, E. Rhoades,A. Nath, and E. J. Petersson, “Using a FRET library with multiple probe pairsto drive Monte Carlo simulations of α-synuclein,” Biophys. J. 114(1), 53–64(2018).269V. Nguemaha, S. Qin, and H.-X. Zhou, “Atomistic modeling of intrinsicallydisordered proteins under polyethylene glycol crowding: Quantitative comparisonwith experimental data and implication of protein-crowder attraction,” J. Phys.Chem. B 122(49), 11262–11270 (2018).270L. Burger and E. van Nimwegen, “Disentangling direct from indirect co-evolution of residues in protein alignments,” PLoS Comput. Biol. 6(1), e1000633(2010).271S. Seemayer, M. Gruber, and J. Söding, “CCMpred–fast and precise predictionof protein residue-residue contacts from correlated mutations,” Bioinformatics30(21), 3128–3130 (2014).272D. T. Jones, D. W. A. Buchan, D. Cozzetto, and M. Pontil, “PSICOV: Precisestructural contact prediction using sparse inverse covariance estimation on largemultiple sequence alignments,” Bioinformatics 28(2), 184–190 (2012).273S. Ovchinnikov, H. Kamisetty, and D. Baker, “Robust and accurate predic-tion of residue-residue interactions across protein interfaces using evolutionaryinformation,” Elife 3, e02030 (2014).274F. Morcos, A. Pagnani, B. Lunt, A. Bertolino, D. S. Marks, C. Sander,R. Zecchina, J. N. Onuchic, T. Hwa, and M. Weigt, “Direct-coupling analysis ofresidue coevolution captures native contacts across many protein families,” Proc.Natl. Acad. Sci. U. S. A. 108(49), E1293–E1301 (2011).275M. Weigt, R. A. White, H. Szurmant, J. A. Hoch, and T. Hwa, “Identification ofdirect residue contacts in protein-protein interaction by message passing,” Proc.Natl. Acad. Sci. U. S. A. 106(1), 67–72 (2009).276L. Kaján, T. A. Hopf, M. Kalaš, D. S. Marks, and B. Rost, “FreeContact: Fastand free software for protein contact prediction from residue co-evolution,” BMCBioinformatics 15, 85 (2014).277C. Feinauer, M. J. Skwark, A. Pagnani, and E. Aurell, “Improving con-tact prediction along three dimensions,” PLoS Comput. Biol. 10(10), e1003847(2014).278M. J. Skwark, A. Abdel-Rehim, and A. Elofsson, “PconsC: Combination ofdirect information methods and alignments improves contact prediction,” Bioin-formatics 29(14), 1815–1816 (2013).279M. Ekeberg, T. Hartonen, and E. Aurell, “Fast pseudolikelihood maximizationfor direct-coupling analysis of protein structure from many homologous amino-acid sequences,” J. Comput. Phys. 276, 341–356 (2014).280S. D. Dunn, L. M. Wahl, and G. B. Gloor, “Mutual information withoutthe influence of phylogeny or entropy dramatically improves residue contactprediction,” Bioinformatics 24(3), 333–340 (2008).281M. J. Skwark, D. Raimondi, M. Michel, and A. Elofsson, “Improved contactpredictions using the recognition of protein like contact patterns,” PLoS Comput.Biol. 10(11), e1003889 (2014).282D. T. Jones, T. Singh, T. Kosciolek, and S. Tetchner, “MetaPSICOV: Com-bining coevolution methods for accurate prediction of contacts and long rangehydrogen bonding in proteins,” Bioinformatics 31(7), 999–1006 (2015).283S. Wang, S. Sun, Z. Li, R. Zhang, and J. Xu, “Accurate de novo prediction ofprotein contact map by ultra-deep learning model,” PLoS Comput. Biol. 13(1),e1005324 (2017).284D. T. Jones and S. M. Kandathil, “High precision in protein contact predic-tion using fully convolutional neural networks and minimal sequence features,”Bioinformatics 34(19), 3308–3315 (2018).285S. M. Kandathil, J. G. Greener, and D. T. Jones, “Prediction of inter-residue contacts with DeepMetaPSICOV in CASP13,” Proteins 87(12), 1092–1099(2019).
286D. S. Marks, L. J. Colwell, R. Sheridan, T. A. Hopf, A. Pagnani, R. Zecchina,and C. Sander, “Protein 3D structure computed from evolutionary sequencevariation,” PLoS One 6(12), e28766 (2011).287H. Kamisetty, S. Ovchinnikov, and D. Baker, “Assessing the utility ofcoevolution-based residue–residue contact predictions in a sequence- andstructure-rich era,” Proc. Natl. Acad. Sci. U. S. A. 110(39), 15674–15679(2013).288J. Xu and S. Wang, “Analysis of distance-based protein structure prediction bydeep learning in CASP13,” Proteins 87(12), 1069–1081 (2019).289F. Zhao and J. Xu, “A position-specific distance-dependent statistical poten-tial for protein structure and functional study,” Structure 20(6), 1118–1126(2012).290S. Ovchinnikov, D. E. Kim, R. Y.-R. Wang, Y. Liu, F. DiMaio, and D. Baker,“Improved de novo structure prediction in CASP11 by incorporating coevolutioninformation into Rosetta,” Proteins 84(S1), 67–75 (2016).291C. Zhang, S. M. Mortuza, B. He, Y. Wang, and Y. Zhang, “Template-based andfree modeling of I-TASSER and QUARK pipelines using predicted contact mapsin CASP12,” Proteins 86(S1), 136–151 (2018).292Y. Gao, S. Wang, M. Deng, and J. Xu, “RaptorX-angle: Real-value prediction ofprotein backbone dihedral angles through a hybrid method of clustering and deeplearning,” BMC Bioinf. 19(Suppl 4), 100 (2018).293J. G. Greener, S. M. Kandathil, and D. T. Jones, “Deep learning extends denovo protein modelling coverage of genomes using iteratively predicted structuralconstraints,” Nat. Commun. 10(1), 3977 (2019).294M. Michel, S. Hayat, M. J. Skwark, C. Sander, D. S. Marks, and A. Elofsson,“PconsFold: Improved contact predictions improve protein models,” Bioinfor-matics 30(17), i482–i488 (2014).295J. I. Sulkowska, F. Morcos, M. Weigt, T. Hwa, and J. N. Onuchic, “Genomics-aided structure prediction,” Proc. Natl. Acad. Sci. U. S. A. 109(26), 10340–10345(2012).296T. A. Hopf, L. J. Colwell, R. Sheridan, B. Rost, C. Sander, and D. S. Marks,“Three-dimensional structures of membrane proteins from genomic sequencing,”Cell 149(7), 1607–1621 (2012).297T. Nugent and D. T. Jones, “Accurate de novo structure prediction oflarge transmembrane protein domains using fragment-assembly and corre-lated mutation analysis,” Proc. Natl. Acad. Sci. U. S. A. 109(24), E1540–E1547(2012).298A. W. Senior, R. Evans, J. Jumper, J. Kirkpatrick, L. Sifre, T. Green, C. Qin,A. Žídek, A. W. R. Nelson, A. Bridgland, H. Penedones, S. Petersen, K. Simonyan,S. Crossan, P. Kohli, D. T. Jones, D. Silver, K. Kavukcuoglu, and D. Hassabis,“Improved protein structure prediction using potentials from deep learning,”Nature 577(7792), 706–710 (2020).299A. W. Senior, R. Evans, J. Jumper, J. Kirkpatrick, L. Sifre, T. Green, C. Qin,A. Žídek, A. W. R. Nelson, A. Bridgland, H. Penedones, S. Petersen, K. Simonyan,S. Crossan, P. Kohli, D. T. Jones, D. Silver, K. Kavukcuoglu, and D. Hassabis,“Protein structure prediction using multiple deep neural networks in the 13thCritical Assessment of Protein Structure Prediction (CASP13),” Proteins 87(12),1141–1148 (2019).300R. Kleffner, J. Flatten, A. Leaver-Fay, D. Baker, J. B. Siegel, F. Khatib, andS. Cooper, “Foldit standalone: A video game-derived protein structure manipu-lation interface using Rosetta,” Bioinformatics 33(17), 2765–2767 (2017).301C. B. Eiben, J. B. Siegel, J. B. Bale, S. Cooper, F. Khatib, B. W. Shen,F. Players, B. L. Stoddard, Z. Popovic, and D. Baker, “Increased Diels-Alderaseactivity through backbone remodeling guided by Foldit players,” Nat. Biotechnol.30(2), 190–192 (2012).302S. Horowitz, B. Koepnick, R. Martin, A. Tymieniecki, A. A. Winburn,S. Cooper, J. Flatten, D. S. Rogawski, N. M. Koropatkin, T. T. Hailu, N. Jain,P. Koldewey, L. S. Ahlstrom, M. R. Chapman, A. P. Sikkema, M. A. Skiba, F. P.Maloney, F. R. Beinlich, Z. Popovic, D. Baker, F. Khatib, and J. C. Bardwell,“Determining crystal structures through crowdsourcing and coursework,” Nat.Commun. 7, 12549 (2016).303F. Khatib, F. DiMaio, S. Cooper, M. Kazmierczyk, M. Gilski, S. Krzywda,H. Zabranska, I. Pichova, J. Thompson, Z. Popovic, M. Jaskolski, and D. Baker,“Crystal structure of a monomeric retroviral protease solved by protein foldinggame players,” Nat. Struct. Mol. Biol. 18(10), 1175–1177 (2011).
J. Chem. Phys. 153, 240901 (2020); doi: 10.1063/5.0026025 153, 240901-29
Published under license by AIP Publishing

The Journalof Chemical Physics PERSPECTIVE scitation.org/journal/jcp
304C. Keasar, L. J. McGuffin, B. Wallner, G. Chopra, B. Adhikari, D. Bhattacharya,L. Blake, L. O. Bortot, R. Cao, B. K. Dhanasekaran, I. Dimas, R. A. Faccioli,E. Faraggi, R. Ganzynkowicz, S. Ghosh, A. Giełdon, L. Golon, Y. He, L. Heo,J. Hou, M. Khan, F. Khatib, G. A. Khoury, C. Kieslich, D. E. Kim, P. Krupa, G. R.Lee, H. Li, J. Li, A. Lipska, A. Liwo, A. H. A. Maghrabi, M. Mirdita, S. Mirzaei,M. A. Mozolewska, M. Onel, S. Ovchinnikov, A. Shah, U. Shah, T. Sidi, A. K.Sieradzan, M. Slusarz, R. Slusarz, J. Smadbeck, P. Tamamis, N. Trieber, T. Wirecki,Y. Yin, Y. Zhang, J. Bacardit, M. Baranowski, N. Chapman, S. Cooper, A.Defelicibus, J. Flatten, B. Koepnick, Z. Popovic, B. Zaborowski, D. Baker, J. Cheng,C. Czaplewski, A. C. B. Delbem, C. Floudas, A. Kloczkowski, S. Ołdziej, M. Levitt,H. Scheraga, C. Seok, J. Söding, S. Vishveshwara, D. Xu, and S. N. Crivelli,“An analysis and evaluation of the WeFold collaborative for protein structureprediction and its pipelines in CASP11 and CASP12,” Sci. Rep. 8(1), 9939 (2018).
305L. Dsilva, S. Mittal, B. Koepnick, J. Flatten, S. Cooper, and S. Horowitz, “Creat-ing custom Foldit puzzles for teaching biochemistry,” Biochem. Mol. Biol. Educ.47(2), 133–139 (2019).306R. R. Achterman, “Minds at play: Using an online protein folding game, Foldit,to support student learning about protein folding, structure, and the scientificprocess,” J. Microbiol. Biol. Educ. 20(3), 20.3.63 (2019).307P. C. Farley, “Using the computer game “FoldIt” to entice students to exploreexternal representations of protein structure in a biochemistry course for nonma-jors,” Biochem. Mol. Biol. Educ. 41(1), 56–57 (2013).308F. Khatib, A. Desfosses, B. Koepnick, J. Flatten, Z. Popovic, D. Baker, S. Cooper,I. Gutsche, and S. Horowitz, “Building de novo cryo-electron microscopystructures collaboratively with citizen scientists,” PLoS Biol. 17(11), e3000472(2019).
J. Chem. Phys. 153, 240901 (2020); doi: 10.1063/5.0026025 153, 240901-30
Published under license by AIP Publishing