How well does the Theory of Planned Behavior predict graduation among college and university...
31
1 23 Social Psychology of Education An International Journal ISSN 1381-2890 Volume 17 Number 4 Soc Psychol Educ (2014) 17:657-685 DOI 10.1007/s11218-014-9272-8 How well does the Theory of Planned Behavior predict graduation among college and university students with disabilities? Catherine S. Fichten, Mai Nhu Nguyen, Rhonda Amsel, Shirley Jorgensen, Jillian Budd, Mary Jorgensen, Jennison Asuncion, et al.
-
Upload
independent -
Category
Documents
-
view
5 -
download
0
Transcript of How well does the Theory of Planned Behavior predict graduation among college and university...

1 23
Social Psychology of EducationAn International Journal ISSN 1381-2890Volume 17Number 4 Soc Psychol Educ (2014) 17:657-685DOI 10.1007/s11218-014-9272-8
How well does the Theory of PlannedBehavior predict graduation among collegeand university students with disabilities?
Catherine S. Fichten, Mai Nhu Nguyen,Rhonda Amsel, Shirley Jorgensen,Jillian Budd, Mary Jorgensen, JennisonAsuncion, et al.

1 23
Your article is protected by copyright and all
rights are held exclusively by Springer Science
+Business Media Dordrecht. This e-offprint
is for personal use only and shall not be self-
archived in electronic repositories. If you wish
to self-archive your article, please use the
accepted manuscript version for posting on
your own website. You may further deposit
the accepted manuscript version in any
repository, provided it is only made publicly
available 12 months after official publication
or later and provided acknowledgement is
given to the original source of publication
and a link is inserted to the published article
on Springer's website. The link must be
accompanied by the following text: "The final
publication is available at link.springer.com”.
Soc Psychol Educ (2014) 17:657–685DOI 10.1007/s11218-014-9272-8
How well does the Theory of Planned Behavior predictgraduation among college and university studentswith disabilities?
Catherine S. Fichten · Mai Nhu Nguyen · Rhonda Amsel ·Shirley Jorgensen · Jillian Budd · Mary Jorgensen ·Jennison Asuncion · Maria Barile
Received: 18 November 2013 / Accepted: 27 May 2014 / Published online: 8 August 2014© Springer Science+Business Media Dordrecht 2014
Abstract The goal of this research was to develop a model to predict which stu-dents with disabilities will drop out before graduation and to investigate the dropout pattern of students with disabilities. To accomplish this we evaluated potentialpredictors of persistence and drop-out among 611 college and university studentswith various disabilities and developed a prediction model. We tested this model ina retrospective study using an independent sample of actual graduates (n = 133)and premature leavers (n = 39). Results show that the best predictors of academicpersistence and drop-out are the three Theory of Planned Behavior scales. These pre-dicted 25 % of the variance in intention to graduate and correctly classified 83 % of participants who were no longer in school (86 % of graduates and 74 % of prema-ture leavers). Path analysis showed linkages between demographic, academic per-
This study was funded by the Social Sciences and Humanities Research Council of Canada (SSHRC).We are grateful for the support.
M. Barile—deceased.
C. S. Fichten (B) · S. JorgensenDawson College, 3040 Sherbrooke St. West, Montreal, QC H3Z 1A4, Canadae-mail: [email protected]
S. Jorgensene-mail: [email protected]
C. S. Fichten · M. N. Nguyen · J. Budd · M. Jorgensen · J. Asuncion · M. BarileAdaptech Research Network, Montreal, QC, Canadae-mail: [email protected]
J. Budde-mail: [email protected]
M. Jorgensene-mail: [email protected]
123
Author's personal copy
658 C. S. Fichten et al.
formance, personality, self-efficacy, and college experience measures and the threeTheory of Planned Behavior predictors. Key reasons for dropping out were: disability,health, finances, career direction uncertainty, inadequate disability accommodations,and lack of interest/motivation. A one-page questionnaire based on the Theory ofPlanned Behavior (i.e., Attitude, Subjective Norms, Perceived Behavioral Control)can add to the literature on predictors of intention to graduate, graduation and drop-out among college and university students with disabilities; this is enclosed in the“Appendix”.
Keywords Academic persistence · Graduation · Postsecondary studentswith disabilities · College · University · Drop-out
1 Introduction
The numbers of junior/community college and university students with various dis-abilities (e.g., visual, hearing, learning) constitute a substantial proportion of post-secondary enrollments in North America. For example, a large scale American studyshowed that 11 % of undergraduates had a disability (Snyder and Dillow 2012). Datafrom Canada’s largest province show that as many as 14 % of junior/communitycollege students have a disability (Ministry of Training, Colleges & Universities2012).
Students with disabilities must overcome unique barriers to pursue postsecondaryeducation. Many need both human and technological accommodations, such as notetakers and adaptive information and communication technologies (Fichten et al. 2012a;Lang et al. 2014). Questions about postsecondary education for students with dis-abilities abound. Some wonder whether the investment of resources for postsec-ondary education for these students is worthwhile. “Does the extra cost produceresults?”
Findings related to the academic success of students with disabilities are inconsis-tent. There are several conceptual and methodological reasons for this. First, academicsuccess is sometimes defined in terms of grades and other times in terms of graduation.Second, both have multiple definitions and means of measurement. Of course gradesare an important aspect of academic success. Graduation—obtaining a credential—however, is especially important for life outcomes, such as obtaining employment(Achterberg et al. 2009; Lindsay 2011). For example some research shows that stu-dents with and without disabilities have similar grades (e.g., Jorgensen et al. 2005;
J. Asuncione-mail: [email protected]
C. S. Fichten · R. AmselMcGill University, Montreal, QC, Canadae-mail: [email protected]
C. S. FichtenJewish General Hospital, Montreal, QC Canada
123
Author's personal copy
Theory of Planned Behavior: graduation and disabilities 659
Wessel et al. 2009), while other investigations found that students with disabilities hadlower GPAs (Adams and Proctor 2010; Jorgensen et al. 2009a).
When it comes to graduation, some investigations use actual graduation (e.g.,Achola 2013; Barber 2012; Unger et al. 2000), others use persistence (i.e., studentsare enrolled a year or a semester after testing—e.g., Boutin 2008; Mamiseishvili andKoch 2011), “quality of degree” (i.e., various types of honors degrees—Richardson2009), or a mixture of “positive outcomes” including graduation or persistence in ajunior/community college or a transfer to a 4 year university (Jameson 2007). Otherinvestigations use “graduating in prescribed time” (i.e., the time prescribed for theprogram of study—e.g., Jorgensen et al. 2005) while others evaluate graduation two,five or even 10 years after “prescribed time.” Several longitudinal studies suggest thatpersistence rates of students with and without disabilities are similar when the possi-bility of longer times to graduate are taken into account (Jorgensen et al. 2009b, 2005;O’Neill et al. 2012; Wessel et al. 2009), although others have indicated that this is notthe case (Getzel and Thoma 2008; Lombardi et al. 2012). Thus, definitive informationabout whether students with and without disabilities differ on grades or graduation isnot available.
In addition, in spite of a vast literature on needs and concerns of students with dis-abilities, we know little about which students will persist and which will give up. Thevariables which seem to work relatively well in predicting grade point average, suchas pre-entry characteristics (e.g., high school grades, scholastic aptitudes test results,parental education) and academic in-college variables (e.g., study habits, student sat-isfaction) (see reviews by Metz 2006; Hudy 2007) generally work relatively poorly inpredicting persistence (Achola 2013; DaDeppo 2009; Jorgensen et al. 2009b).
Student retention and drop-out have important consequences for both society andthe students, as dropping out can result in diminished access to employment andearning potential (Fassinger 2008; Metz 2006). Drop-outs also have a major impacton the finances of colleges and universities (Pascarella and Terenzini 2005).
Graduation of students without any disabilities has recently been reported to be aslow as 29 % in 2-year American junior/community colleges (by the end of 3 years)and 40 % in public universities (by the end of 5 years), with approximately half ofdrop-outs occurring in the first year and half (ACT 2006). Nevertheless, it shouldbe noted that a report from Statistics Canada concluded that, “The research showsthat while about 50 % of all students failed to finish their initial programs of studywithin 5 years, only about 10 to 15 % can be considered true drop-outs. Many switchedprograms, either within a given institution or between institutions (sometimes evenmoving to a different level of study—e.g., switching from college to university orvice versa). Among those who left at some point, 40 % of college students and 54 %of university students returned to postsecondary studies within 3 years” (Finnie et al.2010).
2 Education models
Theoretical frameworks for predicting student retention have largely been influencedby Tinto’s Student Integration Model (Tinto 1993), and Bean’s (1982) Student Attri-
123
Author's personal copy
660 C. S. Fichten et al.
tion Model. In Tinto’s model, pre-entry characteristics (e.g., family, socio-economicstatus, high school performance), initial goals and commitments, academic and socialintegration, and goals and commitments resulting from experience within the insti-tution are seen as identifiers for students at risk of drop-out. Working from a differ-ent theoretical base, Bean (1982) proposed a model that included external variablessuch as behavioral indicators, particularly student contact with faculty (measure ofstudent interaction) and time spent away from campus (measure of lack of involve-ment). Student engagement also seems to be important (Kuh 2007). Both modelshave empirical support (Metz 2006). Attempts to integrate these models have foundthem to be complementary (Attewell et al. 2011). For example, Metz’s (2006) reviewof traditional measures of retention among students without disabilities indicates thatachievement and ability, family background (e.g., level of parental education), and stu-dent demographics (e.g., full vs. part-time, age, sex, ethnicity, financial need) are allimportant for retention. Both Metz’ (2006) and Hudy’s (2007) literature reviews alsoshow that personality and psychosocial adjustment, social support, perceived insti-tutional climate, and academic self-efficacy all have empirical support. Self-efficacyseems especially important (Chemers et al. 2001). Nevertheless, some variables areapplicable only to certain groups and others show inconsistent results. Thus, edu-cation models have only limited ability to predict graduation among students withdisabilities.
3 Psychological models
A different approach toward investigation of graduation has been evident in psycho-logical models. Psychological models of persistence have included expectancy-valueformulations and combinations of motivation and skills constructs (Pintrich 2000).For example, Eccles and Wigfield (2002) link academic persistence to the individu-als’ expectancy and task-value related beliefs. They define expectations in terms ofself-efficacy beliefs and task-values in terms of intrinsic and extrinsic goals, relativecosts (obstacles, effort), and attainment value (importance of doing well). Their modelcontains numerous linked constructs, including variables such as attitudes and expec-tations, which are key in Ajzen’s (2002, 2012) Theory of Planned Behavior as well.Because of its success in predicting behavioral intention and actual behavior in manyrealms, we selected the constructs of the Theory of Planned Behavior (Ajzen 2012)for evaluation in this investigation.
3.1 Theory of Planned Behavior
A well-known social psychological model of behavior, Ajzen’s (2002, 2012) Theoryof Planned Behavior proposes that behavior is influenced by intention to carry out thebehavior (Behavioral Intention). According to the theory, the criterion variable Behav-ior (in our case graduation) is related to Behavioral Intention (in our case intentionto graduate). Behavioral Intention, according to Ajzen, is predicted by the followingthree predictors: Attitude, Subjective Norms, and Perceived Behavioral Control. Anenormous variety of studies during the past 30 years have used the Theory of Planned
123
Author's personal copy
Theory of Planned Behavior: graduation and disabilities 661
Behavior to understand and modify behavior. For example, Ajzen’s own web pagelists well over 100 books and journal articles on this topic authored or co-authored byhim http://people.umass.edu/aizen/publications.html. We were interested in addingTheory of Planned Behavior constructs to education model predictors of graduationbecause of its exceptional ability in being able to predict behavior and behavioralintention. The examples below illustrate how this theoretical formulation is relevantto graduation.
Attitude is a positive or negative evaluation of behavior (graduation). For example,if a student’s attitude toward graduation is positive, he or she is more likely to intendto graduate.
Subjective Norms refer to perceived social/peer pressure from individuals importantin the student’s life. The theory proposes that beliefs about the favorability of others’views about graduation are likely to influence a student’s intention to graduate.
Perceived Behavioral Control represents perceptions of the ease or difficulty ofenacting the behavior and is related to both self-efficacy beliefs and perceived control-lability. The greater the Perceived Behavioral Control, the more likely the individual isto carry out the behavior (i.e., the stronger the student’s belief about his or her abilityto overcome obstacles to graduation, the more likely he or she is likely to intend tograduate).
A meta-analysis shows that the model can explain as much as 39 % of thevariance in Behavioral Intention and 27 % in Behavior (Armitage and Conner 2001).We found some investigations using the Theory of Planned Behavior in disabilityand rehabilitation related areas (Brouwer 2009; Fraser et al. 2011; Hergenrather et al.2011), although none examined academic persistence and drop-out. It was, there-fore, timely to bring this theoretical formulation into the postsecondary educationrealm.
4 Persistence and drop-out among postsecondary students with disabilities
The literature suggests unique predictors of persistence and drop-out for this group(Koch et al. 2014; Mamiseishvili and Koch 2011; Getzel and Thoma 2008). For exam-ple, needed academic supports are not always available (e.g., Christ and Stodden 2005;Tagayuna et al. 2005). Availability of accommodations is variable and dependent on thestudent’s impairment (e.g., poor accessibility of e-learning for students who are blind,problematic campus access for wheelchair users, difficulties with time off for studentswith medical or mental health impairments, and unsupportive peer attitudes). Stu-dents with disabilities may need to devote disproportionate amounts of time, energyand other resources during the academic year (Michallet et al. 2004). Faculty atti-tudes can also be problematic (Bissonnette 2006; Hindes and Mather 2007; Bakeret al. 2012). In addition, students with disabilities must surmount unique obstacles,such as negotiating with faculty about academic accommodations (Cullen and Shaw1996).
Studies of graduation rates of students with disabilities vary dramatically. For exam-ple, Mamiseishvili and Koch (2012) showed that almost 51 % of students with dis-abilities in 2-year institutions had left their studies by the end of their third year. On
123
Author's personal copy

662 C. S. Fichten et al.
the other hand, O’Neill et al. (2012) found that of those no longer enrolled, 74 %of university students with disabilities had graduated. Discrepancies in findings canbe due to a variety of factors, including the level of studies (e.g., junior/communitycollege vs. university) and length of follow-up. Although the literature is inconsistent,several longitudinal studies suggest that persistence rates for students with and withoutdisabilities are similar when the possibility of longer time to graduate is taken intoaccount and, as is the case for students without disabilities, males have a higher attri-tion rate than females (Jorgensen et al. 2009b; O’Neill et al. 2012; Wessel et al. 2009).An archival investigation of junior/community college students showed virtually iden-tical graduation rates over 12 years for the 653 students with various disabilities andthe 41,357 students without disabilities studied: these varied between 55 and 52 %,depending on the program of studies, but with the graduation rates of students withdisabilities always slightly, although not significantly, greater than those of studentswithout disabilities (Jorgensen et al. 2005).
5 The present study
The objective of the present investigation was to develop a model, using a concurrentdesign, to predict which students with disabilities would drop-out before graduationand to investigate the drop-out pattern of students with disabilities. To develop andtest a model of persistence and drop-out, we used an online questionnaire consistingprimarily of closed-ended measures which assess most of the constructs cited in theliterature.
We developed the model using Intention to Graduate as the predicted variable in asample of current college and university students with various disabilities (Sample 1).Predictor variables include the three components of the Theory of Planned Behavior(i.e., Attitude, Perceived Behavioral Control, Subjective Norms) as well as demo-graphic and school related aspects as well as personality and academic experiences.To ascertain how well the model predicts actual graduation and drop-out we evaluatedthe prediction model retrospectively in an independent sample of individuals who hadleft college or university during the past two and a half years and were not currentlyenrolled (Sample 2).
5.1 Hypotheses
(1) We hypothesized that the three Theory of Planned Behavior predictors (i.e., morepositive Attitude, greater Perceived Behavioral Control, more favorable SubjectiveNorms), which have worked so well in other contexts (Ajzen 2002, 2012), would alsobe related to academic persistence (i.e., intention to graduate for current students andactual degree/diploma completion for individuals no longer in school). (2) We alsopredicted that aspects such as personal and academic facilitators, strong academicself-efficacy, good social skills, an even temperament, higher academic performance,fewer disabilities/impairments, higher parental education, lower alienation on campus,and a good sense of connectedness with faculty and students are likely to be related
123
Author's personal copy

Theory of Planned Behavior: graduation and disabilities 663
to persistence. (3) In addition, we expected that the largest number of students woulddrop-out during the early stages of their studies, as is typically found among studentswithout disabilities (ACT 2006).
6 Method
6.1 Participants
6.1.1 Sample 1
A convenience sample of 611 Canadian postsecondary students with various dis-abilities who were enrolled in a certificate, diploma or degree program were par-ticipants (415 females, 194 males, 2 did not indicate). Of these, 65 % attended auniversity and 35 % a junior/community college. Participants attended school in 9of Canada’s 10 provinces. Mean age of participants was 29 (SD = 9, median = 25,range = 19–66). There was no significant difference in age between male and femalestudents, although university students (M = 31, SD = 10) were significantly olderthan junior/community college students (M = 25, SD = 8), t (603) = 7.53, p < .001.Participants were enrolled in 98 different Canadian universities and junior/communitycolleges. Forty-four percent of students had two or more disability/impairments. Stu-dents’ self-reported disabilities are presented in Table 1.
Table 1 Median age and disabilities of students reporting each disability/impairment (Sample 1)
Type of disability/impairment Number Percent Age
Psychological/psychiatric disability 189 19 26
Learning disability (LD) 181 18 24
Attention deficit hyperactivity disorder (ADHD) 174 17 24
Chronic medical/health problem 113 11 29
Limitation in the use of hands/arms 58 6 29
Hearing impairment 56 6 26
Low vision 49 5 27
Mobility impairment: use of a cane/crutches/walkers 44 4 32
Neurological impairment 43 4 26
Mobility impairment: wheelchair/scooter user 38 4 27
Speech/communication impairment 24 2 26
Totally blind 17 2 30
Pervasive developmental disorder (e.g. Asperger’s) 15 1 23
Deaf 12 1 28
Total disabilities/impairments 1,013 − 25
611 students reported a total of 1,013 disabilities/impairments. Participants could check all disabilities thatapplied. 44 % of students had two or more disabilities/impairments
123
Author's personal copy

664 C. S. Fichten et al.
Table 1 shows that the most common disability/impairment of students was a psy-chological/psychiatric disability, followed by a learning disability, Attention DeficitHyperactivity Disorder (ADHD), and a chronic medical/health problem. Almost halfof the participants had two disabilities/impairments or more, with learning disabil-ity plus ADHD being most common, followed by ADHD plus another psychologicaldisability, chronic health problems plus psychological disability, and mobility impair-ment plus limitation in the use of hands/arms. It should be noted that psychologi-cal/psychiatric disability was most often coupled with another disability/impairment,and was reported by only 9 % of participants when this was the sole reported dis-ability. Learning disability was reported as the sole disability by 12 % of partici-pants. Nevertheless, psychological/psychiatric disability and learning disability werethe most common disabilities reported by students, regardless of how percentages werecalculated.
About half of the sample (n = 309) did not work during the academic year.The 302 who did so worked an average of 17 h per week (range = 1–40 h,SD = 11). Most participants (83 %) were full-time students, almost half (47 %)were pursuing a Bachelor’s degree at a university, and 32 % were pursuing ajunior/community college diploma/associate’s degree. The rest were enrolled incertificate or graduate programs. Eighty-seven percent were registered with theirschool for disability related services and 84 % were enrolled in their first choiceprogram.
6.1.2 Sample 2
Participants consisted of a convenience sample of 133 recent (past 21/2 years) Cana-dian postsecondary graduates (79 females, 54 males) and 39 individuals who haddropped out (25 females, 14 males) during the 21/2 years before entering the study.Of these, 130 individuals last attended a university and 40 a junior/community college(2 did not specify). As in Sample 1, the rest had been enrolled in certificate andgraduate programs. The 133 Graduates had been enrolled in 60 different Cana-dian universities and junior/community colleges and the 39 individuals who haddropped out (Premature Leavers) had been enrolled in 30 different schools. Therewas no significant difference in age between Graduates and Premature Leavers(mean for the groups combined = 31, SD = 11, range = 18–59, median = 27)or between males and females. As was the case for Sample 1, most participantswere pursuing a Bachelor’s degree at a university (55 %), had registered for dis-ability related services (87 %), and had been enrolled in their first choice program(89 %). There were no significant differences between Graduates and PrematureLeavers on these variables. However, Premature Leavers were significantly more likelyto have been part-time students (34 %) than Graduates (16 %), X2(1,172) = 5.85,p < .05.
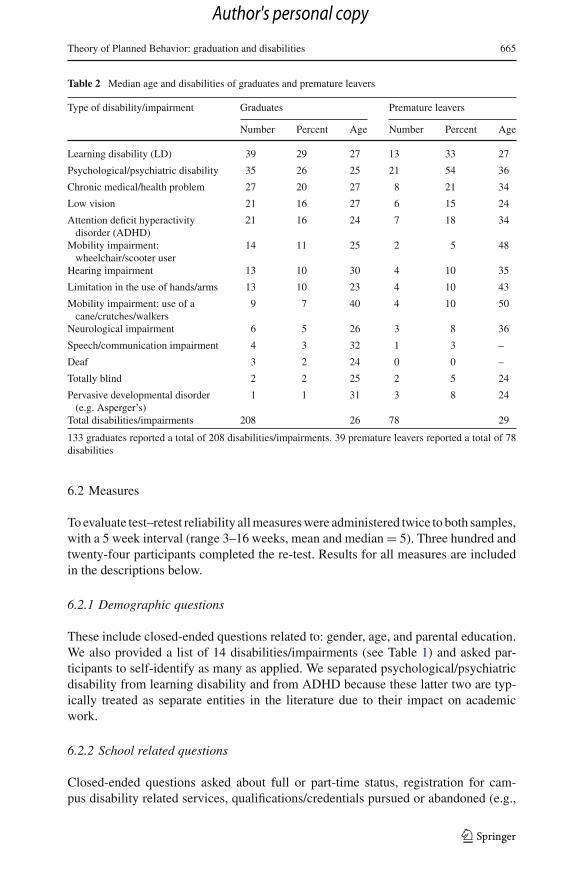
Fifty-two graduates (39 %) and 24 Premature Leavers (61 %) had two or more dis-abilities/impairments. Graduates’ disabilities are presented in Table 2. This showsthat both groups were most likely to have a learning disability or a psychologi-cal/psychiatric disability.
123
Author's personal copy
Theory of Planned Behavior: graduation and disabilities 665
Table 2 Median age and disabilities of graduates and premature leavers
Type of disability/impairment Graduates Premature leavers
Number Percent Age Number Percent Age
Learning disability (LD) 39 29 27 13 33 27
Psychological/psychiatric disability 35 26 25 21 54 36
Chronic medical/health problem 27 20 27 8 21 34
Low vision 21 16 27 6 15 24
Attention deficit hyperactivitydisorder (ADHD)
21 16 24 7 18 34
Mobility impairment:wheelchair/scooter user
14 11 25 2 5 48
Hearing impairment 13 10 30 4 10 35
Limitation in the use of hands/arms 13 10 23 4 10 43
Mobility impairment: use of acane/crutches/walkers
9 7 40 4 10 50
Neurological impairment 6 5 26 3 8 36
Speech/communication impairment 4 3 32 1 3 –
Deaf 3 2 24 0 0 –
Totally blind 2 2 25 2 5 24
Pervasive developmental disorder(e.g. Asperger’s)
1 1 31 3 8 24
Total disabilities/impairments 208 26 78 29
133 graduates reported a total of 208 disabilities/impairments. 39 premature leavers reported a total of 78disabilities
6.2 Measures
To evaluate test–retest reliability all measures were administered twice to both samples,with a 5 week interval (range 3–16 weeks, mean and median = 5). Three hundred andtwenty-four participants completed the re-test. Results for all measures are includedin the descriptions below.
6.2.1 Demographic questions
These include closed-ended questions related to: gender, age, and parental education.We also provided a list of 14 disabilities/impairments (see Table 1) and asked par-ticipants to self-identify as many as applied. We separated psychological/psychiatricdisability from learning disability and from ADHD because these latter two are typ-ically treated as separate entities in the literature due to their impact on academicwork.
6.2.2 School related questions
Closed-ended questions asked about full or part-time status, registration for cam-pus disability related services, qualifications/credentials pursued or abandoned (e.g.,
123
Author's personal copy
666 C. S. Fichten et al.
Bachelor’s degree, college diploma), type of institution (junior/community college oruniversity), whether the participant was/had been enrolled in their first choice pro-gram, whether their program included an internship, the number of hours they workedduring the academic year while studying, whether they had taken a leave of absence,the percentage of their program that they had completed, and whether they knew otherswith the same disability as their own who successfully completed or dropped out of asimilar program. We also asked Premature Leavers to indicate why they dropped outby checking as many reasons as applied to them on a list of 18 possible reasons; thesewere adapted from Jorgensen et al. (2009b) and Statistics Canada (2003, 2008). Thesequestions have been used in previous studies (Fichten et al. 2010a, 2009).
6.2.3 Academic performance
We asked all participants two questions about their academic performance: one askedrespondents to describe themselves as: an A, B, C, or a D or less student. The otherasked participants to rank themselves against the rest of the students in their programof study: in the top, middle, or bottom third (modified from Statistics Canada, 2008).For both questions, participants could answer, “I don’t know.” Since the correlationbetween scores was high, r(665) = .72, p < .001), and because more participantsanswered, “I don’t know” to the ranking question we only used the A, B, C, or Dquestion in data analyses. Test–retest reliability for 312 participants was .83, p <
.001.
6.2.4 College Experience Questionnaire (CEQ) (Fichten et al. 2006, 2010b)
This measure uses a 6-point Likert-type scale (1 = Much Harder, 6 = Much Easier)and inquires about aspects which can facilitate or act as barriers to academic success.It has three subscales which evaluate whether rated aspects made the participant’spostsecondary studies harder or easier. Here we used two subscales: Personal Situ-ation (9 items—e.g., study habits, financial situation) and School Environment (14items—e.g., level of difficulty of courses, availability of computers on campus). Thethird subscale (Government and Community Supports and Services) was not usedbecause it deals with specific services that are not applicable to all students. Goodpsychometric properties were reported by the CEQ’s authors. In the present sam-ple Cronbach’s alpha for 323 participants was .76 and test–retest reliability was .73,p < .001, for the Personal subscale and .84 and .70, p < .001, respectively, for theSchool Environment subscale. Scores have also been shown to be related to the qualityof academic supports that students with learning disabilities and ADHD report receiv-ing (Wolforth and Roberts 2009). In addition, scores on both subscales were relatedto academic satisfaction of students both with and without disabilities and the Per-sonal subscale was related to academic retention of junior/community students withdisabilities (Jorgensen et al. 2011). Higher scores indicate facilitating conditions (i.e.,made academic life easier), and lower scores indicate barriers (i.e., made academiclife harder).
123
Author's personal copy
Theory of Planned Behavior: graduation and disabilities 667
6.2.5 Theory of Planned Behavior (Ajzen 2002, 2012)
Traditional predictors of the criterion variable (Behavior/Behavioral Intention) aremeasures of Attitude, Subjective Norms, and Perceived Behavioral Control. Becausethere were no suitable measures related to postsecondary education, scales wereadapted from Davis et al. (2002); these modified scales are available in the “Appen-dix”. Six-point Likert scale ratings (Strongly Disagree to Strongly Agree) were usedto evaluate Behavioral Intention (5 items—e.g., All things considered, it is possi-ble that I might not complete my program of study), Perceived Behavioral Control(4 items—e.g., It is mostly up to me whether or not I complete my program of study),and Subjective Norms (3 items—e.g., Most people who are important to me thinkthat I should complete my program of study). The Attitude scale (8 items) evaluatesattitude toward completing one’s program on 6-point semantic differential scale rang-ing from –3 to +3 (e.g., very rewarding to very punishing). Scoring is the mean ofeach scale (for ease of scoring we added 3 to the Attitude scale to eliminate negativenumbers); thus the range of scores on all scales is 1 to 6. A Total score for the three pre-dictor variables is calculated by summing Attitude, Subjective Norms, and PerceivedBehavioral Control mean scores (range = 3–18). In the present study Cronbach’s alphafor 322 participants was .83 and test–retest reliability was .67, p < .001, for Totalscore; Cronbach’s alpha was .71 and test–retest reliability was .75, p < .001, for Per-ceived Behavioral Control: Cronbach’s alpha was .74 and test–retest reliability was.62, p < .001, for Subjective Norms; and Cronbach’s alpha was .78 and test–retestreliability was .74, p > .001, for Attitude). Higher scores indicate more favorableviews about graduating.
Behavioral Intention scale items are as follows: I intent to complete my program ofstudy; I will try to complete my program of study; I expect to complete my programof study; I am determined to complete my program of study; All things considered,it is possible that I might not complete my program of study. Cronbach’s alpha for325 participants was .79 and test–retest reliability was .75, p < .001. Higher scoresindicate greater likelihood of graduating.
6.2.6 Self-Efficacy Questionnaire (Solberg et al. 1998)
This measures, on a 10-point scale (0–9), how confident respondents are that they couldsuccessfully enact various behaviors. We used two subscales: Course Self-Efficacy (7items—e.g., take good class notes) and Social Self-Efficacy (6 items—e.g., talk to yourprofessors/instructors). In the present study Cronbach’s alpha for 324 participants was.81 and test–retest reliability was .89, p < .001, for Course Self-Efficacy and .84 and.89, p < .001, respectively for Social Self-Efficacy. Higher scores indicate strongerself-efficacy beliefs.
6.2.7 Campus Climate—Social Alienation (Wiseman et al. 1988)
Only the 4-item Social Alienation Subscale of this 6-point Likert scaled measure(Strongly Disagree—Strongly Agree) was used (e.g., I find myself lonely and lost on
123
Author's personal copy
668 C. S. Fichten et al.
this campus). In the present study Cronbach’s alpha for 323 participants was .73 andtest–retest reliability was .59, p < .001). Higher scores indicate greater alienation.
6.2.8 Eysenck Personality Questionnaire Revised-Abbreviated (EPQR-A)(Francis et al. 1992)
Only the Neuroticism (6 items—e.g., Are you a worrier?) and Extraversion subscales(6 items—e.g., Are you mostly quiet when you are with other people?) of this well-known forced choice questionnaire were used. In the present sample Cronbach’s alphafor 324 participants was .73 and test–retest reliability was .83, p < .001, for Neuroti-cism and .81 and .88, p < .001, respectively, for Extraversion. Lower scores indicategreater Extraversion and greater Neuroticism.
6.3 Procedure
In the spring 2010 semester we sent invitations to all current and former postsecondarystudents with disabilities who had participated in our previous research and who indi-cated that we may contact them for future studies. We also emailed announcements todiscussion lists focusing on Canadian postsecondary education and to project partners(mainly student and campus disability service provider groups). The announcementindicated that we were seeking college and university students currently enrolled ina program (i.e., diploma, certificate or degree program) as well as recent (past 21/2years) graduates and individuals who had dropped out prior to completing their pro-gram. Individuals aged 18 or over were sought to help identify environmental, financial,personal and other factors that facilitate or pose barriers to students with disabilitiespursuing a junior/community college or university education in Canada. Based on pre-testing we indicated that it would take approximately 20 min to complete the onlinequestionnaire and that we were offering a $20 honorarium.
Individuals who indicated their interest were directed to a website where they readthe information and consent form approved by Dawson College’s Human ResearchEthics Committee. Participants clicked on the “Continue” button to signal their agree-ment. This brought them to the accessible online questionnaire. Participants selectedtheir category [current student, recent graduate, recent premature leaver (dropped out)]and answered questions. The same questions were asked of all groups of participantswith the following exceptions: grammatical changes were made to reflect current orpast studies, and only participants who had dropped out were asked about reasons forthis. The final screen requested permission to contact the individual for future stud-ies and invited them to provide contact information for the honorarium. Virtually allparticipants provided this information.
Four weeks later, those who indicated that we may contact them for future studieswere e-mailed and asked to complete the same questionnaire again (to allow calculationof test–retest reliability). Three hundred and thirty-four individuals completed the re-test. They were informed that doing so would qualify them for a draw for one of five$100 gift certificates from Chapters/Indigo Books & Music. Prior to data analysis the
123
Author's personal copy

Theory of Planned Behavior: graduation and disabilities 669
Table 3 Students: summary for stepwise regression for behavioral intention to graduate
Variable R square Beta � F p
Theory of Planned Behavior: Perceived Behavioural Control 0.167 0.29 94.546 <.001
Theory of Planned Behavior: Attitude 0.215 0.18 28.732 <.001
Theory of Planned Behavior: Subjective Norms 0.250 0.14 22.123 <.001
EPQR-A: Neuroticism 0.261 0.04 6.900 <.01
Academic Performancea 0.269 −0.09 5.133 <.05aLower is better
data set was thoroughly scrutinized to ensure the integrity of responses (cf. Prince etal. 2012).
7 Results
7.1 Sample 1: Students
To predict Behavioral Intention to Graduate we entered all 26 potential predictorvariables into a stepwise linear regression equation. Results in Table 3 indicate that thefirst three variables to enter were the three Theory of Planned Behavior measures, withPerceived Behavioral Control, Attitude, and Subjective Norms all adding significantlyto the prediction. These variables were significant, F(3, 473) = 52.25, p < .001,and together accounted for 25 % of the variance in Behavioral Intention to Graduate.Although two other variables (i.e., lower EPQR-A Neuroticism, and higher AcademicPerformance) also added at p < .05, Table 3 shows that these only added negligiblyto the prediction. All other variables entered in the equation did not add significantlyto the regression for Behavioral Intention to Graduate.
Due to shared variance, several variables of interest that were correlated with theTheory of Planned Behavior predictor variables did not add significantly to the model.Correlations with the predictor variables are presented in Table 4. Only coefficients sig-nificant at the .001 level remained significant after a Bonferroni correction to the alphalevel was made. Table 4 shows that more positive Attitude as well as greater PerceivedBehavioral Control were significantly related to: fewer Disabilities, more facilitat-ing CEQ Personal and School experiences, greater Course and Social Self-Efficacy,lower Campus Climate—Social Alienation, and higher EPQR-A Extraversion andlower Neuroticism. More positive Attitude was also related to better Academic Per-formance. Greater Perceived Behavioral Control was also related to being Youngerand to being enrolled in a College rather than a University. The pattern of variablessignificantly related to Subjective Norms was quite different: greater Parental Educa-tion, being Enrolled Full-Time, not having been on a Leave of Absence, younger Age,and lower Campus Climate—Social Alienation were related to Subjective Norms. Itis noteworthy that the following variables were not related to any Theory of PlannedBehavior predictor variables: Gender, Registration for Disability Related Services,being enrolled in one’s First Choice Program, the Percent of Program Completed,whether one’s program of studies included an Internship, the number of hours worked
123
Author's personal copy

670 C. S. Fichten et al.
Table 4 Students: correlations with Theory of Planned Behavior predictors
Variable Attitude Perceived BehavioralControl
Subjective Norms
Demographics
Number of disabilitiesa −.150*** −.170*** −.098*
Age .035 −.252*** −.269***
Gender (1 = female, 2 = male) −.065 .045 .005
Parental education
Years of education of father −.021 .103* .147***
Years of education of mother −.019 .055 .178***
School related aspects
Full or part-time student (1 = full-time,2 = part-time)
.017 −.078 −.155***
Registration for disability relatedservices (1 = yes, 2 = no)
.031 −.048 −.052
First choice of program (1 = yes, 2 = no) −.090* −.074 −.058
Percent of program completed −.038 .002 .062
Leave of absence (1 = yes, 2 = no) .033 .110** .141***
Internship (1 = yes, 2 = no) −.085* .020 .020
Employment hours per week .019 −.007 .013
Type of institution: college = 1 oruniversity = 2
.019 −.137*** −.071
Knowing others with same disability/impairment
Someone who graduated(1 = yes, 2 = no)a
−.081* −.123** −.124**
Someone who dropped out(1 = yes, 2 = no)
−.004 .080 −.044
Academic performancea
Grade (1 = A, 2 = B, 3 = C, 4 = D orworse)a
−.135*** −.107** .023
College Experience Questionnaire (CEQ)
CEQ—personal situation(higher score = more facilitating)
.192*** .421*** .081*
CEQ—school environment(higher score = more facilitating)
.264*** .375*** .100*
Self-efficacy (academic)
Course self-efficacy .273*** .399*** .090*
Social self-efficacy .294*** .320*** .091*
Campus climate
Social alienation (higher score = morealienated)a
−.283*** −.435*** −.142***
Eysenck Personality Questionnaire (EPQR-A)
Extraversion (lower score = moreextraverted)
−.158*** −.149*** .000
Neuroticism (lower score = moreneurotic)
.258*** .180*** −.054
123
Author's personal copy

Theory of Planned Behavior: graduation and disabilities 671
Table 4 continued
Variable Attitude Perceived BehavioralControl
Subjective Norms
Theory of Planned Behavior
Attitude 1 .337*** .151***
Perceived Behavioral Control .337*** 1 .261***
Subjective Norms .151*** 261*** 1
Total .683*** .773*** .656***
Sample sizes range from 524 to 611. r values significant at the .001 level or better are bolded. After aBonferroni correction to the alpha level, only coefficients significant at the .001 level remain significant* p < .05, ** p< .01, *** p< .001aLower score is better, else higher score is better
Table 5 Discriminating graduates and premature leavers: discriminant function predicting graduation anddrop-out based on the three Theory of Planned Behavior variables
Sample Variables Correlations to thediscriminant function
Full sample: Canonical correlation = .54, p < .001
Theory of Planned Behavior: Perceived Behavioral Control .899
Theory of Planned Behavior: Subjective Norms .640
Theory of Planned Behavior: Attitude .339
Females: Canonical correlation = .49, p < .001
Theory of Planned Behavior: Perceived Behavioral Control .867
Theory of Planned Behavior: Subjective Norms .748
Theory of Planned Behavior: Attitude .278
Males: Canonical correlation = .64, p < .001
Theory of Planned Behavior: Perceived Behavioral Control .904
Theory of Planned Behavior: Subjective Norms .453
Theory of Planned Behavior: Attitude .415
per week, or Knowing Someone with the Same Impairment who either Graduated orDropped Out.
7.2 Sample 2: Graduates and premature leavers
To validate the model derived from the stepwise linear regression analysis on studentdata (Sample 1) we conducted a stepwise discriminant analysis to predict which indi-viduals actually graduated or dropped out. Entered into the discriminant analysis werethe three Theory of Planned Behavior predictor variables.
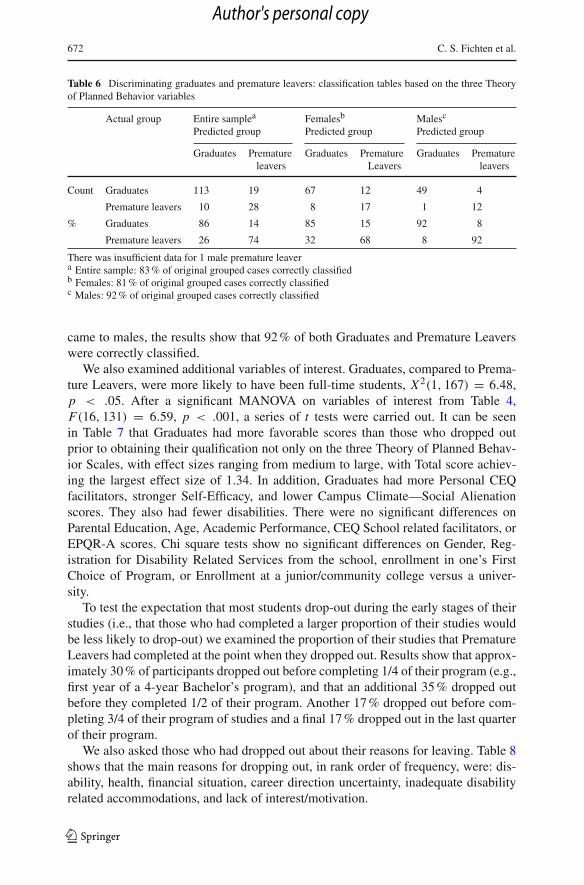
Results in Tables 5 and 6 show that 83 % of the entire sample was correctly grouped,with 74 % of Premature Leavers and 86 % of Graduates correctly classified. Althoughthe model worked less well for females, with only 81 % correctly classified, when it
123
Author's personal copy
672 C. S. Fichten et al.
Table 6 Discriminating graduates and premature leavers: classification tables based on the three Theoryof Planned Behavior variables
Actual group Entire samplea Femalesb Malesc
Predicted group Predicted group Predicted group
Graduates Prematureleavers
Graduates PrematureLeavers
Graduates Prematureleavers
Count Graduates 113 19 67 12 49 4
Premature leavers 10 28 8 17 1 12
% Graduates 86 14 85 15 92 8
Premature leavers 26 74 32 68 8 92
There was insufficient data for 1 male premature leavera Entire sample: 83 % of original grouped cases correctly classifiedb Females: 81 % of original grouped cases correctly classifiedc Males: 92 % of original grouped cases correctly classified
came to males, the results show that 92 % of both Graduates and Premature Leaverswere correctly classified.
We also examined additional variables of interest. Graduates, compared to Prema-ture Leavers, were more likely to have been full-time students, X2(1, 167) = 6.48,p < .05. After a significant MANOVA on variables of interest from Table 4,F(16, 131) = 6.59, p < .001, a series of t tests were carried out. It can be seenin Table 7 that Graduates had more favorable scores than those who dropped outprior to obtaining their qualification not only on the three Theory of Planned Behav-ior Scales, with effect sizes ranging from medium to large, with Total score achiev-ing the largest effect size of 1.34. In addition, Graduates had more Personal CEQfacilitators, stronger Self-Efficacy, and lower Campus Climate—Social Alienationscores. They also had fewer disabilities. There were no significant differences onParental Education, Age, Academic Performance, CEQ School related facilitators, orEPQR-A scores. Chi square tests show no significant differences on Gender, Reg-istration for Disability Related Services from the school, enrollment in one’s FirstChoice of Program, or Enrollment at a junior/community college versus a univer-sity.
To test the expectation that most students drop-out during the early stages of theirstudies (i.e., that those who had completed a larger proportion of their studies wouldbe less likely to drop-out) we examined the proportion of their studies that PrematureLeavers had completed at the point when they dropped out. Results show that approx-imately 30 % of participants dropped out before completing 1/4 of their program (e.g.,first year of a 4-year Bachelor’s program), and that an additional 35 % dropped outbefore they completed 1/2 of their program. Another 17 % dropped out before com-pleting 3/4 of their program of studies and a final 17 % dropped out in the last quarterof their program.
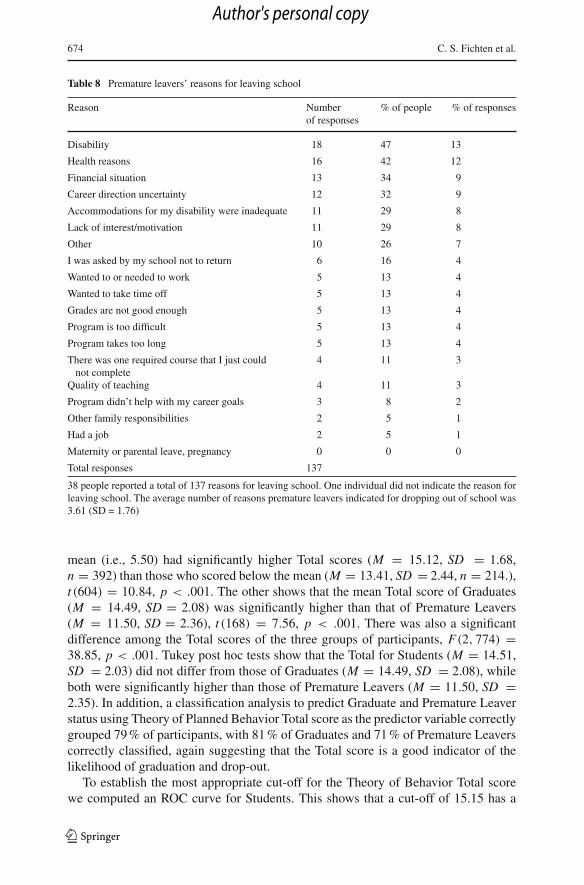
We also asked those who had dropped out about their reasons for leaving. Table 8shows that the main reasons for dropping out, in rank order of frequency, were: dis-ability, health, financial situation, career direction uncertainty, inadequate disabilityrelated accommodations, and lack of interest/motivation.
123
Author's personal copy

Theory of Planned Behavior: graduation and disabilities 673
Table 7 Similarities and differences: graduates and premature leavers
Graduates Premature Leavers Test
n Mean SD n Mean SD t df Sig. p < d
Demographics
Number of disabilities 133 1.56 0.83 39 2.00 1.03 2.73 170 .01 0.47
Age 125 30.45 10.08 37 33.57 11.99 1.58 160 .116 0.34
Parental education
Years of education of father 127 12.65 3.89 36 12.74 3.97 0.11 161 .911 0.02
Years of education of mother 130 12.69 3.51 36 13.22 3.27 0.82 164 .410 0.16
Academic performancea
Grade (1 = A, 2 = B, 3 = C,4 = D or worse)a
130 1.72 0.67 37 1.97 0.87 1.921 165 .056 0.32
College ExperiencesQuestionnaire
CEQ—personal situation(higher score = morefacilitating)
131 3.81 1.05 37 3.19 0.88 3.32 166 .001 0.64
CEQ—school environment(higher score = morefacilitating)
131 3.96 1.09 37 3.61 0.93 1.80 166 .100 0.35
Self-efficacy
Course self-efficacy 131 6.52 1.66 39 5.66 1.98 2.73 168 .01 0.47
Social self-efficacy 131 6.69 1.87 39 5.57 2.24 3.15 168 .01 0.54
Campus climatea
Social alienation (higherscore = more alienated)a
132 3.09 0.80 39 3.53 0.73 3.10 169 .01 0.57
Eysenck Personality Questionnaire (EPQR-A)
Extraversion (lower score= more extraverted)
131 8.52 2.02 39 8.85 2.19 0.87 168 .386 0.16
Neuroticism (lower score= more neurotic)
131 8.42 2.00 39 8.08 1.74 0.96 168 .340 0.18
Theory of Planned Behavior
Perceived Behavioral Control 133 4.44 0.94 39 3.22 1.10 6.89 170 .001 1.20
Subjective Norms 132 5.25 1.04 39 4.12 1.43 5.47 169 .001 0.90
Attitude 132 4.79 1.05 38 4.23 1.19 2.82 168 .01 0.50
Total 132 14.49 2.08 38 11.50 2.35 7.56 168 .001 1.34
Significant items are boldeda Lower score is better, else higher score is better
7.3 Cut-off scores for students
To establish an easily implemented recommended cut-off for current students usingTheory of Planned Behavior Total scores, we performed a series of tests. First weshowed that Students’ Total scores were significantly related to their Behavioral Inten-tion to graduate scores, r(604) = .52, p < .001. Next we performed two t tests. Oneshows that Students who scored at or above the Behavioral Intention to graduate
123
Author's personal copy
674 C. S. Fichten et al.
Table 8 Premature leavers’ reasons for leaving school
Reason Numberof responses
% of people % of responses
Disability 18 47 13
Health reasons 16 42 12
Financial situation 13 34 9
Career direction uncertainty 12 32 9
Accommodations for my disability were inadequate 11 29 8
Lack of interest/motivation 11 29 8
Other 10 26 7
I was asked by my school not to return 6 16 4
Wanted to or needed to work 5 13 4
Wanted to take time off 5 13 4
Grades are not good enough 5 13 4
Program is too difficult 5 13 4
Program takes too long 5 13 4
There was one required course that I just couldnot complete
4 11 3
Quality of teaching 4 11 3
Program didn’t help with my career goals 3 8 2
Other family responsibilities 2 5 1
Had a job 2 5 1
Maternity or parental leave, pregnancy 0 0 0
Total responses 137
38 people reported a total of 137 reasons for leaving school. One individual did not indicate the reason forleaving school. The average number of reasons premature leavers indicated for dropping out of school was3.61 (SD = 1.76)
mean (i.e., 5.50) had significantly higher Total scores (M = 15.12, SD = 1.68,n = 392) than those who scored below the mean (M = 13.41, SD = 2.44, n = 214.),t (604) = 10.84, p < .001. The other shows that the mean Total score of Graduates(M = 14.49, SD = 2.08) was significantly higher than that of Premature Leavers(M = 11.50, SD = 2.36), t (168) = 7.56, p < .001. There was also a significantdifference among the Total scores of the three groups of participants, F(2, 774) =38.85, p < .001. Tukey post hoc tests show that the Total for Students (M = 14.51,SD = 2.03) did not differ from those of Graduates (M = 14.49, SD = 2.08), whileboth were significantly higher than those of Premature Leavers (M = 11.50, SD =2.35). In addition, a classification analysis to predict Graduate and Premature Leaverstatus using Theory of Planned Behavior Total score as the predictor variable correctlygrouped 79 % of participants, with 81 % of Graduates and 71 % of Premature Leaverscorrectly classified, again suggesting that the Total score is a good indicator of thelikelihood of graduation and drop-out.
To establish the most appropriate cut-off for the Theory of Behavior Total scorewe computed an ROC curve for Students. This shows that a cut-off of 15.15 has a
123
Author's personal copy
Theory of Planned Behavior: graduation and disabilities 675
sensitivity of .669 and a specificity of .690 (i.e., correctly identified 2/3 of those likelyto graduate and almost 70 % of those likely to drop-out. The conditional probabilityof graduation, based on the proposed cut-off, is 65 %.
8 Discussion
8.1 Sample characteristics
Both current students (median age = 25) and those who had left school (median agewhen they left school = 27) were older than typical samples without disabilities. This iscommon in studies of students with disabilities, possibly because these students oftenenter postsecondary studies later (Mamiseishvili and Koch 2012) and stay longer(Jorgensen et al. 2005). For example, the mean age of students in O’Neill et al.’s(2012) recent study was 26 with a range of 17–67. Half of our sample of studentsworked during the academic year. Those who did so worked for an average of 17 h perweek. The most common disabilities/impairments for participants in all groups in thepresent investigation were a learning disability, a psychological/psychiatric disability, achronic health impairment, and ADHD. Although psychiatric/psychological disabilityis not commonly noted in most studies, in the present investigation this was found mostoften to co-occur with another disability/impairment. Almost half of all samples hadtwo or more disabilities/impairments.
8.2 Predicting students’ intention to graduate
The best predictors of the criterion variable “Intention to Graduate” were the threeTheory of Planned Behavior Scales, with Perceived Behavioral Control being the most,and Subjective Norms the least important. Attitude was in the middle. Together thesethree variables predicted 25 % of the variability in students’ Intention to Graduate. Twoadditional variables, lower neuroticism and higher grade also added to the prediction,but their joint contribution added only 2 % to the prediction.
In addition, because of shared variance, several variables of interest that were relatedto the predictor variables did not add significantly to the prediction model. Sincewe were also interested in variables found in the literature to be related to postsec-ondary academic persistence, we examined the relationship between the three Theoryof Planned Behavior predictors (i.e., Perceived Behavioral Control, Subjective Normsand Attitude) and the remaining 23 variables in our investigation. We found that manyof the variables related to Perceived Behavioral Control were also related to Attitude:these include fewer disabilities, more facilitating personal and school experiences,greater course and social self-efficacy, lower social alienation, higher extraversionand lower neuroticism. When it came to Subjective Norms, the pattern of variableswas quite different: being younger, higher parental education, full-time studies, andnot having been on a leave of absence.
On the other hand, several variables linked in the literature to academic persistencewere unrelated to the predictor variables: gender, registration for disability related ser-vices, being enrolled in one’s first choice program, the percent of program completed,
123
Author's personal copy
676 C. S. Fichten et al.
whether one’s program of studies included an internship, knowing someone with thesame impairment who either graduated or dropped out, or the number of hours workedper week. Although in samples of students without disabilities the number of hoursthat students work during the academic year is also related to graduation (Bozick2007), this was not the case in the present study, even though approximately half ofthe sample of students worked during the academic year.
Registration for campus disability related services, usually rated the most importantfacilitator of academic performance by students with disabilities (Fichten et al. 2006),was similarly unrelated either to intention to graduate or to actual graduation. Theliterature on the role of registration for disability related services in predicting gradua-tion is inconsistent, with some studies showing that this adds, although slightly, to theability to predict persistence (O’Neill et al. 2012), while others show that the effectof accommodations is negated when other variables are included (Mamiseishvili andKoch 2011). Such differences may occur, in part, due to a priori differences betweenstudents who do and those who do not elect to register for such services. For example,in the present study students least likely to have registered for such services were thosewith chronic medical/health problems and those who used a cane, walker, or crutches.Another possibility relates to the actual use of disability related services, rather thanto mere registration.
It should be noted that students’ disabilities/impairments may have differentialimpact on the likelihood of graduation. The sample sizes in the present investiga-tion precluded analysis of intention to graduate of students with different disabilities.Clearly, further research on students with diverse backgrounds and different disabili-ties is needed.
Several studies show that the attrition rate of male students is higher than thatof females (Jorgensen et al. 2009b; National Center for Education Statistics 2010;Mamiseishvili and Koch 2011, 2012; O’Neill et al. 2012; Wessel et al. 2009). In theseinvestigations graduation and drop-out rates were provided by the school, and werenot based on volunteer participants’ responses. We believe the failure to find a sexdifference in drop-out and graduation may have been due to our methodology, asvolunteers often have different profiles from those who do not volunteer for studies(Jorgensen and Fichten 2007; Woosley 2005). Research carried out at different schoolsis needed where all students complete measures and where graduation and drop-outare based on actual outcomes and, thus, are not affected by volunteer effects.
8.3 Validating the model: predicting actual graduation and drop-out
The goal here was to ascertain how well the variables which predicted intention tograduate predict actual graduation and drop-out. Therefore, in a discriminant analysiswe examined how well the three Theory of Planned Behavior Scales predicted acad-emic persistence in an independent sample comprised of former students who eitherrecently graduated (n = 133) or dropped out (n = 39). The findings show that 83 %of these individuals were correctly classified by the three Theory of Planned Behaviorpredictors, with 92 % of males who had dropped out being classified correctly. Never-
123
Author's personal copy
Theory of Planned Behavior: graduation and disabilities 677
theless, it should be noted that the sample sizes are small and replication of the resultsis needed.
As in the case of students, for graduates and premature leavers, too, we examinedthe hypothesized predictors of persistence. Here, we again found that graduates hadmore favorable scores than those who dropped out not only on the three Theory ofPlanned Behavior predictors but also on self-described academic performance, schooland personal facilitators, academic self-efficacy, being enrolled on a full-time basis,and campus social alienation. They also had fewer disabilities. There were no signifi-cant differences on parental education, age, gender, registration for disability relatedservices from the school, enrollment in one’s first choice of program, or enrollmentat a junior/community college versus a university. In fact, the only variables that wefound to be related to predictors of intention to graduate among students that wereunrelated to actual persistence are Neuroticism and Extraversion.
8.4 Using and researching the Theory of Planned Behavior to identifystudents at risk for dropping out
The one-page measure comprising the three Theory of Planned Behavior Scales, avail-able in the “Appendix”, can provide useful data and should be considered for additionto college and university institutional research measures for further study. It is free,takes minutes to complete, and appears to have excellent potential for predicting notonly intention to graduate but also actual graduation and drop-out. To establish aneasily implemented recommended cut-off for current students we recommend usinga Total score of 15.15; this could be used as a tentative cut-off for initiating retentionprogramming. Research using this cutoff in additional studies is needed.
8.5 When do students drop-out?
It has been suggested that students may have more “invested” the closer they are tograduation (Hatcher et al. 1992). This argument implies that students would be lesslikely to drop-out in their final years. Indeed, an ACT (2006) study showed that almosthalf of all drop-outs among students without disabilities typically occurred in the earlysemesters.
In the present investigation, current students’ intention to graduate was not signif-icantly related to percent of program completed. As for those who actually droppedout, our results show that about 30 % of individuals quit before completing the firstquarter of their program (e.g., during the first year of a 4-year Bachelor’s programor the first semester of a 2-year junior/community college program), another 30 %dropped out before completing half of their program, and almost 20 % dropped outin each subsequent quarter. It should be noted, however, that the number of partic-ipants who dropped out was relatively small. Nevertheless, such results are consis-tent with results of a previous study of junior/community college students whereit was found that compared to students without disabilities, students with disabil-ities enrolled in junior/community college dropped out at lower rates between thefirst and third semesters, but at higher rates in later semesters, resulting in sim-
123
Author's personal copy
678 C. S. Fichten et al.
ilar drop-out and graduation rates at the end of ten semesters (Jorgensen et al.2009b).
Examination of reasons for dropping out clarifies these results, since the most com-mon reasons given for dropping out were one’s health and one’s disability, followedby financial concerns, career direction uncertainly, lack of interest/motivation, andinadequate disability related accommodations. Thus, the most common reasons forabandoning one’s studies are impairment/disability related. These results are similarto findings of a previous study of junior/community college students (Jorgensen etal. 2009b) which found that a significantly larger proportion of both male and femalestudents with than without disabilities indicated that they abandoned their studies dueto disability/personal health issues. Parenthetically, in the Jorgensen et al. study themost important reasons for leaving given by females without disabilities were to attenduniversity and career direction uncertainty/change. For males without disabilities themost frequent reasons were career direction uncertainty/change and dislike of one’sacademic program.
8.5.1 Limitations
While nine out of 10 Canadian provinces and both college and university sectors arerepresented, our samples are neither random nor fully representative of the popula-tions studied. Self-selection biases, volunteer effects, the use of e-mail discussionlists as a main form of recruitment, and the small proportion of individuals who hadnot registered for disability related services pose methodological challenges in thisregard. Given the regression analysis in Sample 1, we talk about predicting inten-tion to graduate. It should also be noted that all measures were administered concur-rently, and that the best design for evaluating the validity of the prediction model isin a longitudinal design. Such a study is currently ongoing in our laboratory. More-over, Sample 2 involved retrospective ratings, raising the possibility of confirmatoryself-rating bias. In addition, the sample of participants who had dropped out wassmall.
8.5.2 Future research
Younger age was related to two components of intention to graduate among students,a finding consistent with some studies (Jorgensen et al. 2009b; Mamiseishvili andKoch 2012) but not others (O’Neill et al. 2012). The literature suggests that somestudents wait before starting postsecondary studies, and it is these students’ older agethat is related to drop-out (Mamiseishvili and Koch 2011). Clearly the role of age inpredicting academic persistence needs further investigation.
Future research should also examine larger samples and evaluate the Theory ofPlanned Behavior based model to compare persistence, intention to graduate, anddrop-out between individuals with and without disabilities. The generalizability of themodel for students with different disabilities/impairments also needs further evalua-tion. In addition, a longitudinal study to explore the link between intention to graduateand actual graduation and drop-out should be carried out. Moreover, studies wherevolunteer effects have no bearing need to be implemented. Reasons identified in this
123
Author's personal copy

Theory of Planned Behavior: graduation and disabilities 679
study for dropping-out can help identify strategies and best practices that could eithermanage or largely eliminate these.
9 Recommendations
When it comes to addressing drop-out among students with disabilities, our datasuggest that the following characteristics put these students at higher risk of droppingout: lower grades, a leave of absence, having more than one disability/impairment,being older, feeling alienated on campus, personal and school related variables thatmake academic studies harder, higher neuroticism, lower levels of academic self-efficacy, being introverted, and studying on a part-time basis.
Students with disabilities are often unsure about the value of a college or univer-sity education to help them gain jobs. The incorrect, but ubiquitous “70 % of peoplewith disabilities are unemployed” (see Fichten et al. 2012b) can discourage studentsfrom continuing their studies (Why bother studying if it just leads to unemployment?),resulting in career direction uncertainty and lack of interest/motivation. To assist stu-dents with disabilities secure employment after graduation, campus-based servicescharged with career discovery/transition, along with internship and other related pro-grams need to be carefully evaluated to ensure that the full range of tools, resources,and opportunities that are available to students without disabilities are accessible tostudents with different disabilities as well (e.g., online career aptitude tests and job-related resources being accessible to students using adaptive software such as a screenreader).
Given that most premature leavers cited health and disability/impairment relatedissues for dropping out, more needs to be done by colleges and universities to follow-up with students with disabilities who are facing health-related issues while in school.First, these students can be encouraged to return once the health concern has beenaddressed. Postsecondary institutions should make it easy for students to return in thiscase. Second, schools can help students explore other options that might be practical,such as long leaves of absence or taking courses using some form of distance educationprovided students are interested and able to do this while away from the physicalcampus.
Since another common reason cited for dropping out was poor financial situa-tion, policy makers who deal with student financial aid, as well as rehabilitation andcampus-based financial aid professionals need to gain better insight into the spe-cial situations faced by some students with disabilities and address these in order toassist students in financial distress. The older age of students with disabilities, whomay no longer be living with parents and who may already have a family, shouldbe considered. Moreover, some students are forced to choose between being eligiblefor funding to go to school and being eligible to receive financial assistance throughother disability support programs for life’s necessities. Since graduation from post-secondary education for individuals with disabilities is related to employment (e.g.,Fichten et al. 2012b), it is in everyone’s interest, including society’s, to facilitate theirgraduation.
123
Author's personal copy
680 C. S. Fichten et al.
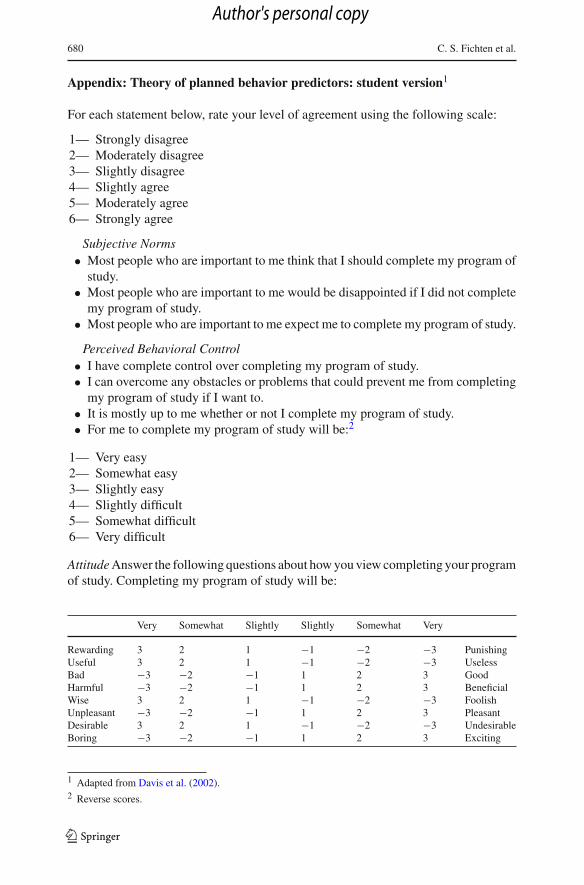
Appendix: Theory of planned behavior predictors: student version1
For each statement below, rate your level of agreement using the following scale:
1— Strongly disagree2— Moderately disagree3— Slightly disagree4— Slightly agree5— Moderately agree6— Strongly agree
Subjective Norms• Most people who are important to me think that I should complete my program of
study.• Most people who are important to me would be disappointed if I did not complete
my program of study.• Most people who are important to me expect me to complete my program of study.
Perceived Behavioral Control• I have complete control over completing my program of study.• I can overcome any obstacles or problems that could prevent me from completing
my program of study if I want to.• It is mostly up to me whether or not I complete my program of study.• For me to complete my program of study will be:2
1— Very easy2— Somewhat easy3— Slightly easy4— Slightly difficult5— Somewhat difficult6— Very difficult
Attitude Answer the following questions about how you view completing your programof study. Completing my program of study will be:
Very Somewhat Slightly Slightly Somewhat Very
Rewarding 3 2 1 −1 −2 −3 PunishingUseful 3 2 1 −1 −2 −3 UselessBad −3 −2 −1 1 2 3 GoodHarmful −3 −2 −1 1 2 3 BeneficialWise 3 2 1 −1 −2 −3 FoolishUnpleasant −3 −2 −1 1 2 3 PleasantDesirable 3 2 1 −1 −2 −3 UndesirableBoring −3 −2 −1 1 2 3 Exciting
1 Adapted from Davis et al. (2002).2 Reverse scores.
123
Author's personal copy

Theory of Planned Behavior: graduation and disabilities 681
Scoring Average scores, with higher means indicating more favorable responses. Add3 to Attitude Scale mean. A Total score is calculated by summing the three Scalemeans.
References
Achola, E. O. (2013). Completing college: A longitudinal examination of potential antecedents of success inpostsecondary education for students with disabilities [PhD dissertation]. Virginia Commonwealth Uni-versity. Retrieved October 28, 2013, from https://digarchive.library.vcu.edu/bitstream/handle/10156/4507/Dissertation-July_2013.pdf?sequence=1.
Achterberg, T. J., Wind, H., de Boer, A., & Frings-Dresen, M. H. W. (2009). Factors that promote orhinder young disabled people in work participation: A systematic review. Journal of OccupationalRehabilitation, 19(2), 129–141.
ACT. (2006). National collegiate retention and persistence to degree rates: 2006. Retrieved from https://www.noellevitz.com/documents/shared/Papers_and_Research/ACT_Data/ACT_2006.pdf.
Adams, K. S., & Proctor, B. E. (2010). Adaptation to college for students with and without disabilities:Group differences and predictors. Journal of Postsecondary Education and Disability, 22(3), 166–184.
Ajzen, I. (2002). Perceived behavioral control, self-efficacy, locus of control, and the theory of plannedbehavior. Journal of Applied Social Psychology, 32(4), 665–683. doi:10.1111/j.1559-1816.2002.tb00236.x.
Ajzen, I. (2012). The theory of planned behavior. In P. A. M. Lange, A. W. Kruglanski, & E. T. Higgins(Eds.), Handbook of theories of social psychology (Vol. 1, pp. 438–459). London: Sage.
Armitage, C. J., & Conner, M. (2001). Efficacy of the theory of planned behavior: A meta-analytic review.British Journal of Social Psychology, 40(4), 471–499. doi:10.1348/014466601164939.
Attewell, P., Heil, S., & Reisel, L. (2011). Competing explanations of undergraduate noncompletion. Amer-ican Educational Research Journal, 48(3), 536–559. doi:10.3102/0002831210392018.
Baker, K. Q., Boland, K., & Nowik, C. M. (2012). A campus survey of faculty and student perceptions ofpersons with disabilities. Journal of Postsecondary Education and Disability, 25(4), 309–329. Retrievedfrom http://www.ahead.org/publications/jped.
Barber, P. (2012). College students with disabilities: What factors influence successful degree completion?A case study. Disability and Work: Research Report. Retrieved from http://www.heldrich.rutgers.edu/sites/default/files/content/College_Students_Disabilities_Report.pdf.
Bean, J. P. (1982). Student attrition, intentions and confidence: Interactions effects in a path model. Researchin Higher Education, 17(4), 291–319. doi:10.1007/BF00977899.
Bissonnette, L. A. (2006). Teaching and learning at Concordia University: Meeting the evolving educationneeds of faculty in providing access for university students with disabilities (Doctoral dissertation,Concordia University, Canada). Retrieved from http://spectrum.library.concordia.ca/8741/.
Boutin, D. (2008). Persistence in postsecondary environments of students with hearing impairments. Journalof Rehabilitation, 74(1), 25–31.
Bozick, R. (2007). Making it through the first year of college: The role of students’ economicresources, employment, and living arrangements. Sociology of Education, 80(3), 261–284. doi:10.1177/003804070708000304.
Brouwer, S., Krol, B., Reneman, M. F., Bültmann, U., Franch, R.-L., van der Klink, J. J. L., et al. (2009).Behavioral determinants as predictors of return to work after long-term sickness absence: An applicationof the theory of planned behavior. Journal of Occupational Rehabilitation, 19(2), 166–174. doi:10.1007/s10926-009-9172-5.
Chemers, M. P., Hu, L., & Garcia, B. F. (2001). Academic self-efficacy and first-year college studentperformance and adjustment. Journal of Educational Psychology, 93(1), 55–64. doi:10.1037/0022-0663.93.1.55.
Christ, T. W., & Stodden, R. (2005). Advantages of developing survey constructs when compar-ing educational supports offered to students with disabilities in postsecondary education. Jour-nal of Vocational Rehabilitation, 22(1), 23–31. Retrieved from http://www.iospress.nl/journal/journal-of-vocational-rehabilitation/.
123
Author's personal copy
https://digarchive.library.vcu.edu/bitstream/handle/10156/4507/Dissertation-July_2013.pdf?sequence=1
https://digarchive.library.vcu.edu/bitstream/handle/10156/4507/Dissertation-July_2013.pdf?sequence=1
http://www.heldrich.rutgers.edu/sites/default/files/content/College_Students_Disabilities_Report.pdf
682 C. S. Fichten et al.
Cullen, J. P., & Shaw, S. F. (1996). Practitioner support of self-advocacy among college students withlearning disabilities: A comparison of practice and attitudes. Journal of Postsecondary Education andDisability, 12(2), 2–15. Retrieved from http://www.ahead.org/publications/jped.
DaDeppo, L. M. W. (2009). Integration factors related to the academic success and intent to persist ofcollege students with learning disabilities. Learning Disabilities Research & Practice, 24(3), 122–131.doi:10.1111/j.1540-5826.2009.00286.x.
Davis, L. E., Ajzen, I., Saunders, J., & Williams, T. (2002). The decision of African American studentsto complete high school: An application of the theory of planned behavior. Journal of EducationalPsychology, 94(4), 810–819. doi:10.1037//0022-0663.94.4.810.
Eccles, J. S., & Wigfield, A. (2002). Motivational beliefs, values, and goals. Annual Review of Psychology,53(1), 109–132. doi:10.1146/annurev.psych.53.100901.135153.
Fassinger, R. (2008). Workplace diversity and public policy. American Psychologist, 63(4), 252–268. doi:10.1037/0003-066X.63.4.252.
Fichten, C. S., Asuncion, J. V., Barile, M., Ferraro, V., & Wolforth, J. (2009). Accessibility of eLearning,computer and information technologies to students with visual impairments in postsecondary education.Journal of Visual Impairment and Blindness, 103(9), 543–557. Retrieved from http://www.jvib.org/.
Fichten, C. S., Asuncion, J. V., Nguyen, M. N., Budd, J., & Amsel, R. (2010a). The POSITIVES Scale:Development and validation of a measure of how well the ICT needs of students with disabilities aremet. Journal of Postsecondary Education and Disability, 23(2), 137–154. Retrieved from http://www.ahead.org/publications/jped.
Fichten, C. S., Jorgensen, S., Havel, A., & Barile, M. (2010b). College/University Experience Questionnaire( CEQ). Montreal, Quebec: Adaptech Research Network. Retrieved from http://www.adaptech.org/pubs/CollegeUniversityExperienceQuestionnaire2010.doc.
Fichten, C. S., Jorgensen, S., Havel, A., & Barile, M. (2006). College students with disabilities: Their futureand success. Final report presented to Fonds de Recherche du Québec-Société et culture (FRQSC).Montreal, Quebec: Adaptech Research Network. Retrieved from ERIC database. (ED491585).
Fichten, C. S., Asuncion, J. V., Wolforth, J., Barile, M., Budd, J., Martiniello, N., et al. (2012a). Informa-tion and communication technology related needs of college and university students with disabilities.Research in Learning Technology, 20, 323–344. doi:10.3402/rlt.v20i0.18646.
Fichten, C. S., Jorgensen, S., Havel, A., Barile, M., Ferraro, V., Landry, M. E., et al. (2012b). What happensafter graduation? Outcomes, employment, and recommendations of recent junior/community collegegraduates with and without disabilities. Disability and Rehabilitation, 34(11), 917–924.
Finnie, R., Mueller, R. E., Sweetman, A., & Usher, A. (2010). New perspectives on access to postsecondaryeducation. Education matters: Insights on education, learning and training in Canada, Statistics Canada.Retrieved from http://www.statcan.gc.ca/pub/81-004-x/2010001/article/11152-eng.htm.
Francis, L. J., Brown, L. B., & Philipchalk, R. (1992). The development of an abbreviated formof the revised Eysenck Personality Questionnaire (EPQR-A): Its use among students in England,Canada, the U.S.A. and Australia. Personality and Individual Differences, 13(4), 443–449. doi:10.1016/0191-8869(92)90073-X.
Fraser, R., Ajzen, I., Johnson, K., Hebert, J., & Chan, F. (2011). Understanding employers’ hiring intentionin relation to qualified workers with disabilities. Journal of Vocational Rehabilitation, 5(1), 1–11. doi:10.3233/JVR-2011-0548.
Hergenrather, K. C., Rhodes, S. D., & Gitlin, D. J. (2011). Consumers with a bipolar disorder: A theory-based approach to explore beliefs impacting job placement. Journal of Rehabilitation, 77(3), 14–24.Retrieved from www.nationalrehab.org/.
Getzel, E. E., & Thoma, C. A. (2008). Experiences of college students with disabilities and the importanceof self-determination in higher education settings. Career Development for Exceptional Individuals,31(2), 77–84. doi:10.1177/0885728808317658.
Hatcher, L., Kryter, K., Prus, J. S., & Fitzgerald, V. (1992). Predicting college student satisfaction, com-mitment, and attrition from investment model constructs. Journal of Applied Social Psychology, 22(16),1273–1296.
Hindes, Y., & Mather, J. (2007). Inclusive education at the post-secondary level: Attitudes of students andprofessors. Exceptionality Education Canada, 17(1–2), 107–128.
Hudy, G. T. (2007). An analysis of motivational factors related to academic success and persistence foruniversity students. Dissertation Abstracts International Section A: Humanities and Social Sciences,67(11-A). (UMI No. 3240170).
123
Author's personal copy
Theory of Planned Behavior: graduation and disabilities 683
Jameson, D. R. (2007). Self-determination and success outcomes of two-year college students with disabil-ities. Journal of College Reading and Learning, 37, 26–46.
Jorgensen, S., Ferraro, V., Fichten, C. S., & Havel, A. (2009a). Predicting the at risk status of collegestudents: Males and students with disabilities. Final report presented to Programme d’aide à la recherchesur l’enseignement et l’apprentissage (PAREA). Retrieved from ERIC database. (ED505871).
Jorgensen, S., Fichten, C. S., & Havel, A. (2009b). Academic success of graduates with and withoutdisabilities—A comparative study of university entrance scores. Pédagogie Collégiale, 22(5), SpecialIssue, 26–29.
Jorgensen, S., Fichten, C. S., Havel, A., Lamb, D., James, C., & Barile, M. (2005). Academic performanceof college students with and without disabilities: An archival study. Canadian Journal of Counselling,39(2), 101–117. Retrieved from http://cjc-rcc.ucalgary.ca/cjc/index.php/rcc.
Jorgensen, S., & Fichten, C. S. (2007). Linking grades and college graduates’ perceptions of obstaclesand facilitators: A cautionary tale. Montreal, Qc: Dawson College. Retrieved from ERIC database.(ED498249).
Jorgensen, S., Fichten, C. S., & Havel, S. (2011). College satisfaction and academic success. Final reportpresented to Programme d’aide à la recherche sur l’enseignement et l’apprentissage (PAREA). Montreal:Dawson College. Retrieved from ERIC database. (ED522996).
Koch, L. C., Mamiseishvili, K., & Higgins, K. (2014). Persistence to degree completion: A profile of studentswith psychiatric disabilities in higher education. Journal of Vocational Rehabilitation, 40, 73–82. doi:10.3233/JVR-130663.
Kuh, G. (2007). How to help students achieve. Chronicle of Higher Education, 53(41), B12–B13. Retrievedfrom http://chronicle.com/article/How-to-Help-Students-Achieve/31980/.
Lang, R., Ramdoss, S., Sigafoos, J., Green, V. A., van der Meer, L., Tostanoski, A., Lee, A., & O’Reilly, M.F. (2014). Assistive technology for postsecondary students with disabilities. In G. E. Lancioni & N. N.Singh (Eds). Assistive technologies for people with diverse abilities (pp 53–76). New York: Springer Sci-ence+Business Media. Retrieved from http://link.springer.com/chapter/10.1007/978-1-4899-8029-8_3.
Lindsay, S. (2011). Discrimination and other barriers to employment for teens and young adults withdisabilities. Disability and Rehabilitation, 33(15–16), 1340–1350. doi:10.3109/09638288.2010.531372.
Lombardi, A. R., Murray, C., & Gerdes, H. (2012). Academic performance of first-generation collegestudents with disabilities. Journal of College Student Development, 53(6), 811–826.
Mamiseishvili, K., & Koch, L. C. (2011). First-to-second-year persistence of students with disabilitiesin postsecondary institutions in the United States. Rehabilitation Counseling Bulletin, 54(2), 93–105.doi:10.1177/0034355210382580.
Mamiseishvili, K., & Koch, L. C. (2012). Students with disabilities at 2-year institutions in theUnited States: Factors related to success. Community College Review, 40(4), 320–339. doi:10.1177/0091552112456281.
Metz, A. J. (2006). Unique contributions of career-related variables in predicting academic persistenceand performance in university 101 college students. Dissertation Abstracts International Section A:Humanities and Social Sciences, 66(11-A). (UMI No. 3196016).
Michallet, B., Boudreault, P., Theolis, M., Lamirande, K. (2004). Dysphasie et fonctionnement familial: Desparents nous font part de leurs perceptions [Dysphasia and family functioning: Parents share their per-ceptions]. Approche Neuropsychologique des Apprentissages Chez l’enfant, 16(1–2), 38–41. Retrievedfrom http://www.anae-revue.com/.
Ministry of Training, Colleges & Universities. (2012). Update on students with disabilities.PowerPointpresentation at Postsecondary Education Division, Ontario.
National Center for Education Statistics. (2010). Number and percentage distribution of students enrolled inpostsecondary institutions, by level, disability status, and selected student and characteristics: 2003–04and 2007–08. Washington, DC: National Center for Education Statistics. Retrieved from http://nces.ed.gov/programs/digest/d10/tables/dt10_240.asp.
O’Neill, L. N. P., Markward, M. J., & French, J. P. (2012). Predictors of graduation among college studentswith disabilities. Journal of Postsecondary Education and Disability, 25(1), 21–36. Retrieved from http://www.ahead.org/publications/jped.
Pascarella, E. T., & Terenzini, P. T. (2005). How college affects students: A third decade of research. SanFrancisco, CA: Jossey Bass.
Pintrich, P. R. (2000). An achievement goal theory perspective on issues in motivation terminology, theoryand research. Contemporary Educational Psychology, 25(1), 92–104. doi:10.1006/ceps.1999.1017.
123
Author's personal copy
684 C. S. Fichten et al.
Prince, K. R., Litovsky, A. R., & Friedman-Wheeler, D. G. (2012). Internet-mediated research:Beware of bots. The Behavior Therapist, 35(5), 85, 87–88. Retrieved from http://www.abct.org/Members/?m=mMembers&fa=JournalsPeriodicals#sec3.
Richardson, J. T. E. (2009). The academic attainment of students with disabilities in UK higher education.Studies in Higher Education, 34(2), 123–137.
Snyder, T. D. & Dillow, S. A. (2012). Digest of education statistics 2011. NCES 2012–001. Washington, DC:National Center for Education Statistics, Institute of Education Sciences, U.S. Department of Education.Retrieved March 11, 2013, from http://nces.ed.gov/pubs2012/2012001.pdf.
Solberg, V. S., Gusavac, N., Hamann, T., Felch, J., Johnson, J., Lamborn, S., et al. (1998). The adaptive suc-cess identity plan (ASIP): A career intervention for college students. The Career Development Quarterly,47, 48–95. doi:10.1002/j.2161-0045.1998.tb00728.x.
Statistics Canada. (2003). Post-Secondary Education Participation Survey (2002). Retrieved from http://www23.statcan.gc.ca/imdb-bmdi/pub/instrument/4446_Q1_V1-eng.pdf.
Statistics Canada. (2008). National Graduates Survey-Class of 2005. Retrieved from http://www23.statcan.gc.ca/imdb-bmdi/instrument/5012_Q3_V4-eng.pdf.
Tagayuna, A., Stodden, R. A., Chang, C., Zeleznik, M. E., & Whelley, T., A. (2005). A two-year comparison of support provision for persons with disabilities in postsecondary education.Journal of Vocational Rehabilitation, 22(1), 13–21. Retrieved from http://www.iospress.nl/journal/journal-of-vocational-rehabilitation/.
Tinto, V. (1993). Leaving college (2nd ed.). Chicago: University of Chicago Press.Unger, K. V., Pardee, R., & Shafer, M. S. (2000). Outcomes of post-secondary supported education for
people with psychiatric disabilities. Journal of Vocational Rehabilitation, 14(3), 195–199.Wessel, R. O., Jones, J. A., Markle, L., & Westfall, K. (2009). Retention and graduation of students with
disabilities: Facilitating student success. Journal of Postsecondary Education and Disability, 21(3),116–125. Retrieved from http://www.ahead.org/publications/jped.
Wiseman, R. L., Emry, R. A., & Morgan, D. (1988). Predicting academic success for disabled students inhigher education. Research in Higher Education, 28(3), 255–269. Retrieved from http://www.airweb.org/eAIR/journalnews/Pages/JournalNewsRIHE.aspx.
Wolforth, J., & Roberts, E. (2009). The situation of students with learning disabilities or attention deficitdisorder in CEGEPS in the province of Quebec: Are they a group that demonstrates a legitimate needfor funding and services? Final report to the Direction des affaires étudiantes universitaires et collégiales(DAEUC). Quebec: Ministère de l’Éducation, du Loisir et du Sport (MELS).
Woosley, A. S. (2005). Survey response and its relationship to educational outcomes among first-yearcollege students. Journal of College Student Retention: Research, Theory & Practice, 6(4), 413–423.doi:10.2190/61B3-KTKC-WCRE-RH1N.
Catherine S. Fichten Ph.D. is Professor of Psychology at Dawson College, Associate Professor of Psy-chiatry at McGill University, Co-Director of the Adaptech Research Network, and Senior Clinical Psy-chologist at the Behavioural Psychotherapy and Research Unit of the Jewish General Hospital. Researchinterests include factors which affect success in postsecondary education for students with disabilities. Shecan be reached at: [email protected]
Mai Nhu Nguyen received her B.Sc. in psychology and her B.A. in translation from the Université deMontréal. An English to French translator, her experience includes working at the Adaptech ResearchNetwork since 2002, where she is now an Associate Director. Her research interests are related to stu-dents with hearing impairments and social media use by people with disabilities. She can be reached [email protected].
Rhonda Amsel is currently an Associate Professor (Professional) in the Department of Psychology atMcGill University. She also serves as consulting statistician in Psychology and Neuropsychology, is anaffiliate in Teaching and Learning Services and has served as Associate Dean of Students at McGill. Herresearch interests include experimental design and methodology, and learning technologies. She can bereached at: [email protected]
123
Author's personal copy
Theory of Planned Behavior: graduation and disabilities 685
Shirley Jorgensen has an M.B.A. from the University of Wollongong in Australia. She is the Coordi-nator of Dawson College’s Office of Institutional Research. Her expertise is in the area of survey devel-opment, student satisfaction, employment of college graduates, and the analysis of large data-sets. Herresearch interests focus on institutional aspects related to student success. She can be reached at [email protected]
Jillian Budd received her B.A. (Hon.) degree from Concordia University. She is currently a Ph.D. stu-dent at McGill University studying School/Applied Child Psychology. She has been a research assistant atthe Adaptech Research Network since 2007 where she has been involved in numerous projects includingtesting and maintaining a database of free and inexpensive information and communication technologies.Some of her interests include learning disabilities, ADHD, and assistive technology. She can be reachedat [email protected]
Mary Jorgensen received her BA degree in psychology from Bishop’s University. Her experienceincludes working as a research assistant and teaching assistant at Bishop’s University. She is currently aresearch assistant at the Adaptech Research Network. Her research interests include self-efficacy (intrinsicand extrinsic) and its effects on self-evaluations, as well as the experiences of students with disabilitieswho pursue post-secondary education. She is also very keen about becoming a child psychologist andhelping children in the future. She can be reached at [email protected]
Jennison Asuncion received his B.A. in Political Science and his M.A. in Educational Technology fromConcordia University. His experience includes serving as Senior Advisor to the National EducationalAssociation of Disabled Students (NEADS). He is currently a Co-Director of the Adaptech Research Net-work. His research interests include the use and accessibility of information and communication technol-ogy by postsecondary students with disabilities, and how these impact student success and meaningfulemployment upon graduation. He can be reached at: [email protected].
Maria Barile M.S.W. died in 2013. She was a co-director of the Adaptech Research Network. She wasalso Co-Founder of Éco-Access, a consulting company which provides workshops and expertise on dis-ability related issues. She was a community-based activist and researcher in disability and women’s issuesfor 25 years and is missed by all who knew her.
123
Author's personal copy