An Intelligent Fuzzy Logic Control System for Road Traffic Congestion
Upload
khangminh22Category
view
4download
0
sensors
Communication
How to Improve Urban Intelligent Traffic? A Case Study UsingTraffic Signal Timing Optimization Model Based on SwarmIntelligence Algorithm
Xiancheng Fu 1, Hengqiang Gao 1,*, Hongjuan Cai 2, Zhihao Wang 3 and Weiming Chen 3
�����������������
Citation: Fu, X.; Gao, H.; Cai, H.;
Wang, Z.; Chen, W. How to Improve
Urban Intelligent Traffic? A Case
Study Using Traffic Signal Timing
Optimization Model Based on Swarm
Intelligence Algorithm. Sensors 2021,
21, 2631. https://doi.org/10.3390/
s21082631
Academic Editors: Enrique Alba and
Zakaria Abdelmoiz Dahi
Received: 29 March 2021
Accepted: 6 April 2021
Published: 8 April 2021
Publisher’s Note: MDPI stays neutral
with regard to jurisdictional claims in
published maps and institutional affil-
iations.
Copyright: © 2021 by the authors.
Licensee MDPI, Basel, Switzerland.
This article is an open access article
distributed under the terms and
conditions of the Creative Commons
Attribution (CC BY) license (https://
creativecommons.org/licenses/by/
4.0/).
1 School of Mechanical Engineering and Electronic Information, China University of Geosciences,Wuhan 430074, China; [email protected]
2 School of Information Science and Engineering, Wuchang Shouyi University, Wuhan 430064, China;[email protected]
3 Faculty of Engineering, China University of Geosciences, Wuhan 430074, China;[email protected] (Z.W.); [email protected] (W.C.)
* Correspondence: [email protected]
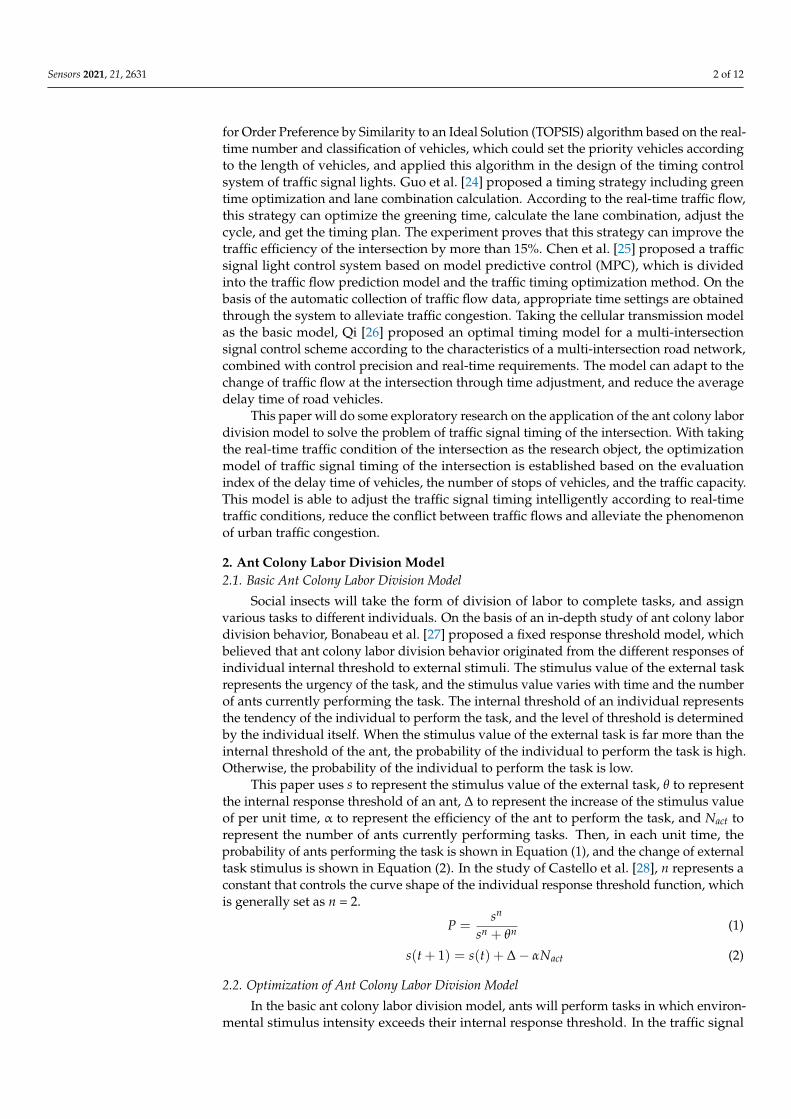
Abstract: Traffic congestion is a major problem in today’s society, and the intersection, as an importanthub of urban traffic, is one of the most common places to produce traffic congestion. To alleviate thephenomenon of congestion at urban traffic intersections and relieve the traffic pressure at intersections,this paper takes the traffic flow at intersections as the research object and adopts the swarm intelligentalgorithm to establish an optimization model of intersection traffic signal timing, which takes theaverage delay time of vehicles, the average number of stops of vehicles and the traffic capacity as theevaluation indexes. This model adjusts the intersection traffic signal timing intelligence accordingto the real-time traffic flow and carries out simulation experiments with MATLAB. Compared withthe traditional timing schemes, the average delay time of vehicles is reduced by 10.25%, the averagenumber of stops of vehicles is reduced by 24.55%, and the total traffic capacity of the intersection isincreased by 3.56%, which verifies that the scheme proposed in this paper is effective in relievingtraffic congestion.
Keywords: intersection; traffic signal timing; labor division; real-time control
1. Introduction
The collective behavior of social insects through simple cooperation is called “swarm-ing intelligence (SI)”. In 1992, Dorigo [1] proposed the ant colony algorithm (ACO) in theswarm intelligence algorithm. Then, Levy [2] first introduced swarm intelligence in detailin 1994. After that, particle swarm optimization (PSO) [3], artificial fish swarm algorithm(AFSA) [4], artificial bee colony algorithm (ABC) [5], and other algorithms based on bio-logical foraging were proposed by scholars, and the research on swarm intelligence wasgradually deepened. With the development of the information age, those algorithms havebeen widely used in various kinds of fields, including the public opinion polarization pro-cess [6–9], fall detection [10], analysis of user satisfaction [11], welding flame detection [12],and road networks [13,14].
Division of labor is also an important behavior of swarm intelligence [15], which hasbeen widely used in task allocation [16,17], space allocation [18,19], robots, and UnmannedAerial Vehicle (UAV) [20,21] in recent years.
In recent years, with the continuous improvement of people’s living standards, thetraffic demand is also increasing, and traffic congestion has become a major problemfaced by many cities. Because urban traffic is a complex system with many controlledvariables [22], the urban traffic problem has become a “perennial difficulty” among manyurban problems. For this reason, scholars have put forward various countermeasures andapplied a variety of emerging technologies. Hakim et al. [23] proposed a fuzzy Technique
Sensors 2021, 21, 2631. https://doi.org/10.3390/s21082631 https://www.mdpi.com/journal/sensors
Sensors 2021, 21, 2631 2 of 12
for Order Preference by Similarity to an Ideal Solution (TOPSIS) algorithm based on the real-time number and classification of vehicles, which could set the priority vehicles accordingto the length of vehicles, and applied this algorithm in the design of the timing controlsystem of traffic signal lights. Guo et al. [24] proposed a timing strategy including greentime optimization and lane combination calculation. According to the real-time traffic flow,this strategy can optimize the greening time, calculate the lane combination, adjust thecycle, and get the timing plan. The experiment proves that this strategy can improve thetraffic efficiency of the intersection by more than 15%. Chen et al. [25] proposed a trafficsignal light control system based on model predictive control (MPC), which is dividedinto the traffic flow prediction model and the traffic timing optimization method. On thebasis of the automatic collection of traffic flow data, appropriate time settings are obtainedthrough the system to alleviate traffic congestion. Taking the cellular transmission modelas the basic model, Qi [26] proposed an optimal timing model for a multi-intersectionsignal control scheme according to the characteristics of a multi-intersection road network,combined with control precision and real-time requirements. The model can adapt to thechange of traffic flow at the intersection through time adjustment, and reduce the averagedelay time of road vehicles.
This paper will do some exploratory research on the application of the ant colony labordivision model to solve the problem of traffic signal timing of the intersection. With takingthe real-time traffic condition of the intersection as the research object, the optimizationmodel of traffic signal timing of the intersection is established based on the evaluationindex of the delay time of vehicles, the number of stops of vehicles, and the traffic capacity.This model is able to adjust the traffic signal timing intelligently according to real-timetraffic conditions, reduce the conflict between traffic flows and alleviate the phenomenonof urban traffic congestion.
2. Ant Colony Labor Division Model2.1. Basic Ant Colony Labor Division Model
Social insects will take the form of division of labor to complete tasks, and assignvarious tasks to different individuals. On the basis of an in-depth study of ant colony labordivision behavior, Bonabeau et al. [27] proposed a fixed response threshold model, whichbelieved that ant colony labor division behavior originated from the different responses ofindividual internal threshold to external stimuli. The stimulus value of the external taskrepresents the urgency of the task, and the stimulus value varies with time and the numberof ants currently performing the task. The internal threshold of an individual representsthe tendency of the individual to perform the task, and the level of threshold is determinedby the individual itself. When the stimulus value of the external task is far more than theinternal threshold of the ant, the probability of the individual to perform the task is high.Otherwise, the probability of the individual to perform the task is low.
This paper uses s to represent the stimulus value of the external task, θ to representthe internal response threshold of an ant, ∆ to represent the increase of the stimulus valueof per unit time, α to represent the efficiency of the ant to perform the task, and Nact torepresent the number of ants currently performing tasks. Then, in each unit time, theprobability of ants performing the task is shown in Equation (1), and the change of externaltask stimulus is shown in Equation (2). In the study of Castello et al. [28], n represents aconstant that controls the curve shape of the individual response threshold function, whichis generally set as n = 2.
P =sn
sn + θn (1)
s(t + 1) = s(t) + ∆ − αNact (2)
2.2. Optimization of Ant Colony Labor Division Model
In the basic ant colony labor division model, ants will perform tasks in which environ-mental stimulus intensity exceeds their internal response threshold. In the traffic signal

Sensors 2021, 21, 2631 3 of 12
timing problem, different signal phases will increase or decrease the green time accordingto the traffic flow of each phase. Therefore, in the traffic signal timing problem, the signalphase can be regarded as different ants, and the traffic flow and green time of each phasecan be regarded as the stimulus value of the external environment.
Here are the definitions of some of the notation involved in this model:
qi—the traffic flow at phase i;tg
i—the green time at phase i;si
+—the stimulus value of increasing green time at phase i;si−—the stimulus value for the reduction of green time at phase i;
θi+—the response threshold of increasing the green time in phase i;
θi−—the response threshold of reducing the green time in phase i;
Pi+—the selection probability of the green time increase in phase i;
Pi−—the selection probability of the green time decrease in phase i;
Pi*—the selection probability of the green time invariant in phase i;
ξi+—the increment of green time for phase i;
ξi−—the reduction of green time for phase i;
λi—the green ratio in phase i;xi—the effective green time of phase i;yi—the degree of traffic flow saturation;C—the cycle time;Di—the delay time of vehicles in phase i;Hi—the number of stops of vehicles in phase i;Qi—the traffic capacity in phase i.
2.2.1. Environmental Stimulus
In the problem of green time allocation at a traffic intersection, if the total cycle time isfixed, when the green time of a certain phase increases, the traffic congestion at that phaseis relieved, but it will inevitably lead to the decrease of green time of other phases and theincrease of the probability of traffic congestion. Generally speaking, in the distributionproblem, when the interest subjects increase their interests, their willingness to continueto increase will be relatively weakened, and the willingness to reduce the interests willbe relatively enhanced. On the contrary, when the interest subject reduces their interests,their willingness to continue to reduce will be relatively weakened, and the willingness toincrease the interests will be relatively enhanced.
Let the current traffic flow at phase i of the intersection be qi and the green time atphase i be tg
i. The stimulus value of increasing green time at this phase is si+, and the
change of si+ is shown in Equation (3). As can be seen from Equation (3), when tg
i remainsconstant, the higher qi is, the higher si
+ is, indicating that the busier the current traffic flowis, the stronger the stimulus of increasing the green time of phase i is. Similarly, when qiremains constant, the lower tg
i is, the higher si+ is, indicating that the shorter the current
green time is, the stronger the stimulus of increasing the green time in phase i is.
s+i =qi
qi + tig
(3)
The stimulus value for the reduction of green time in phase i is si−, and the change of
si− is shown in Equation (4). As can be seen from Equation (4), when qi remains unchanged,
the higher tgi is, the higher si
− is, indicating that the longer the current green time is, thestronger the stimulus of reducing green time in phase i is. Similarly, when tg
i remainsunchanged, the lower qi is, the higher si
− is, indicating that the lower traffic flow is, thestronger the stimulus of reducing green time in phase i is.
s−i =tig
qi + tig
(4)
Sensors 2021, 21, 2631 4 of 12
2.2.2. Response Threshold
In the process of green time allocation at traffic intersections, the busier the trafficflow of a phase is, the greater the tendency of green time increase of the phase is. On thecontrary, the smaller the traffic flow of a phase is, the greater the tendency to reduce thegreen time at this phase is, and the smaller the tendency to increase it is.
θ+i =1
kqi(5)
θ−i = kqi (6)
where θi+ is the response threshold of increasing the green time in phase i, and θi
− is theresponse threshold of reducing the green time in phase i.
Equations (5) and (6) show that θi+ is inversely proportional to qi. That is, when the
traffic flow of phase i is busier, the response threshold of green time increase in this phaseis lower, and the tendency of green time increase is greater. θi
− is proportional to qi. Thatis, when the traffic flow in phase i is lower, the response threshold of green time reductionin this phase is lower, and the tendency of green time reduction is greater.
2.2.3. Probability of Task Execution
In the process of each time allocation, there are only three states for green lights ofeach phase: increase, constant, and decrease, and only one of them can be selected. Theprobability sum of the three states is 1.
P+i =
(s+i
)2(s+i
)2+
(θ+i
)2 =
(qi
qi+tig
)2
(Ci
qi+tig
)2+
(1
kqi
)2(7)
P−i =
(s−i
)2(s−i
)2+
(θ−i
)2 =
(tig
qi+tig
)2
(tig
qi+tig
)2+ (kqi)
2(8)
P∗i = 1 − P+
i − P−i (9)
where Pi+ is the selection probability of the green time increase in phase i, Pi
− is theselection probability of the green time decrease, and Pi
* is the selection probability of thegreen time invariant.
Equations (7) and (8) show that the stronger the stimulus of increasing green time is,and the lower the response threshold of increasing green time is, the greater the probabilityof increasing green time is. Similarly, the stronger the stimulus of reducing green time is,and the lower the response threshold of reducing green time is, the greater the probabilityof green time reduction is.
2.2.4. Task Response
In the ant colony labor division model, most tasks are expressed in the form ofstimulus, and ants decide whether to perform tasks through probability. In the trafficintersection signal timing problem, the probability of task execution is used to determinewhether the green time in a phase needs to be adjusted. Let β be the lower limit thresholdof Pi
+. Only when Pi+ is greater than β, i.e., Pi
+ > β will the green time of the phase beincreased. The increment is:
ξi+ = f (Pi
+) (10)
In Equation (10), ξi+ is a positive correlation function of Pi
+. When the probability ofgreen time increase is greater than the lower limit of the probability of green time increase,
Sensors 2021, 21, 2631 5 of 12
the green time of this phase increases. The greater the probability of task execution is, themore likely the green time will increase.
Let α be the lower limit threshold of Pi−. Only when Pi
− is greater than α, i.e., Pi− > α,
will the green time of phase i be decreased. The reduction amount is:
ξi− = f (Pi
−) (11)
Similar to Equation (10), in Equation (11), ξi− is a positive correlation function of
Pi−. When the probability of green time reduction is greater than the lower limit of the
probability of green time reduction, the green time of the phase decreases. The greater theprobability of task execution is, the more likely the green time will decrease.
When Pi+ <β and Pi
− < α, the green time of phase i remains unchanged.
2.2.5. Algorithm implementation
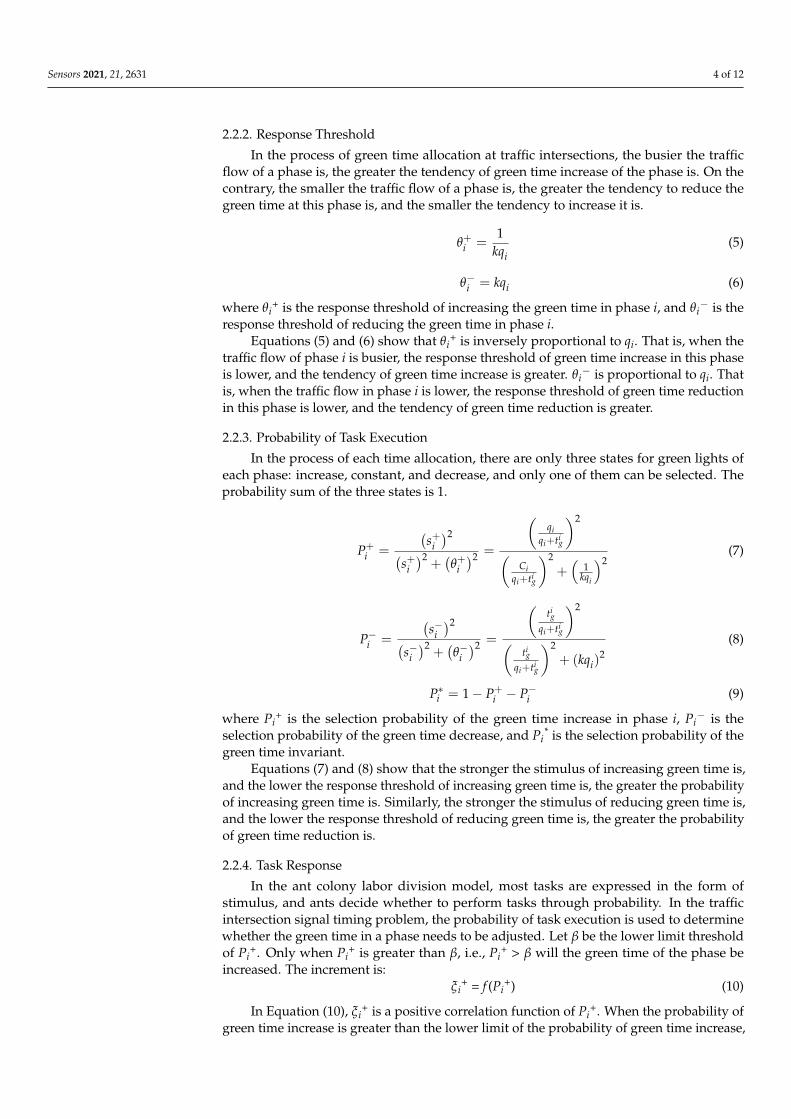
According to the previous description of the model, the algorithm implementationprocess of the model is given, as shown in Figure 1. The process is described as follows:
(1) Parameters including phase number n, initial green time, scale coefficient k, maximumiteration number N, etc., are initialized.
(2) The initial number of iterations is set to 1.(3) According to Equations (3)–(8), the environmental stimulus, response threshold, and
probability of task execution of each phase are calculated.(4) If Pi
+ is greater than β or Pi− is greater than α, jump to (5), otherwise, jump to (6).
(5) According to Equation (10) or (11), the change amount of green time is calculated andthen the green time of each phase is updated.
(6) According to Equations (12)–(17), the delay time of vehicles Di, stopping times ofvehicles Hi, and the road traffic capacity Qi are calculated.
(7) The value of evaluation function F(x, c) is calculated according to Equation (18).(8) Update the min F(x,c), and the corresponding optimal solution of green time.(9) Increase the number of iterations by 1.(10) Judge whether the maximum number of iterations has been reached. If so, jump to
(11); otherwise, jump to (3).(11) Output the optimal solution.
Sensors 2021, 21, 2631 6 of 13
Figure 1. The algorithm calculation process.
3. Experiment and Analysis 3.1. Design of the Signal Phase
There are many types of intersections in the city, including intersection, roundabout, and interchange. Intersection includes T-shaped intersection, Y-shaped intersection, X-shaped intersection, cross-shaped intersection, and so on. For the sake of simplification, only the most common cross-shaped intersections in daily life are considered in this paper, of which shapes are shown in Figure 2. The intersection points to the different directions of the road, and the vehicles drive in different directions, which leads to the intersection become a traffic accident-prone point, known as the conflict point[29]. In Figure 2, the east, west, south, and north directions of the intersection are divided into left, straight and right lanes, and vehicles drive in the corresponding lanes.
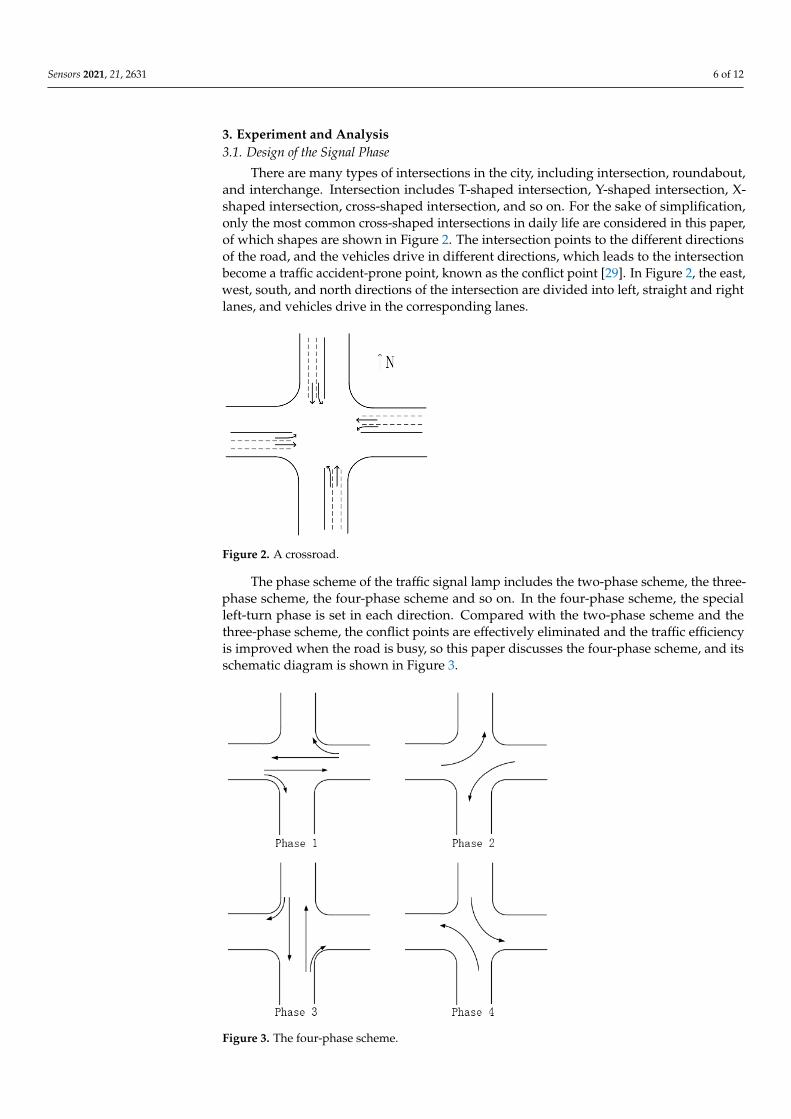
The phase scheme of the traffic signal lamp includes the two-phase scheme, the three-phase scheme, the four-phase scheme and so on. In the four-phase scheme, the special left-turn phase is set in each direction. Compared with the two-phase scheme and the three-phase scheme, the conflict points are effectively eliminated and the traffic efficiency is improved when the road is busy, so this paper discusses the four-phase scheme, and its schematic diagram is shown in Figure 3.
Figure 1. The algorithm calculation process.
Sensors 2021, 21, 2631 6 of 12
3. Experiment and Analysis3.1. Design of the Signal Phase
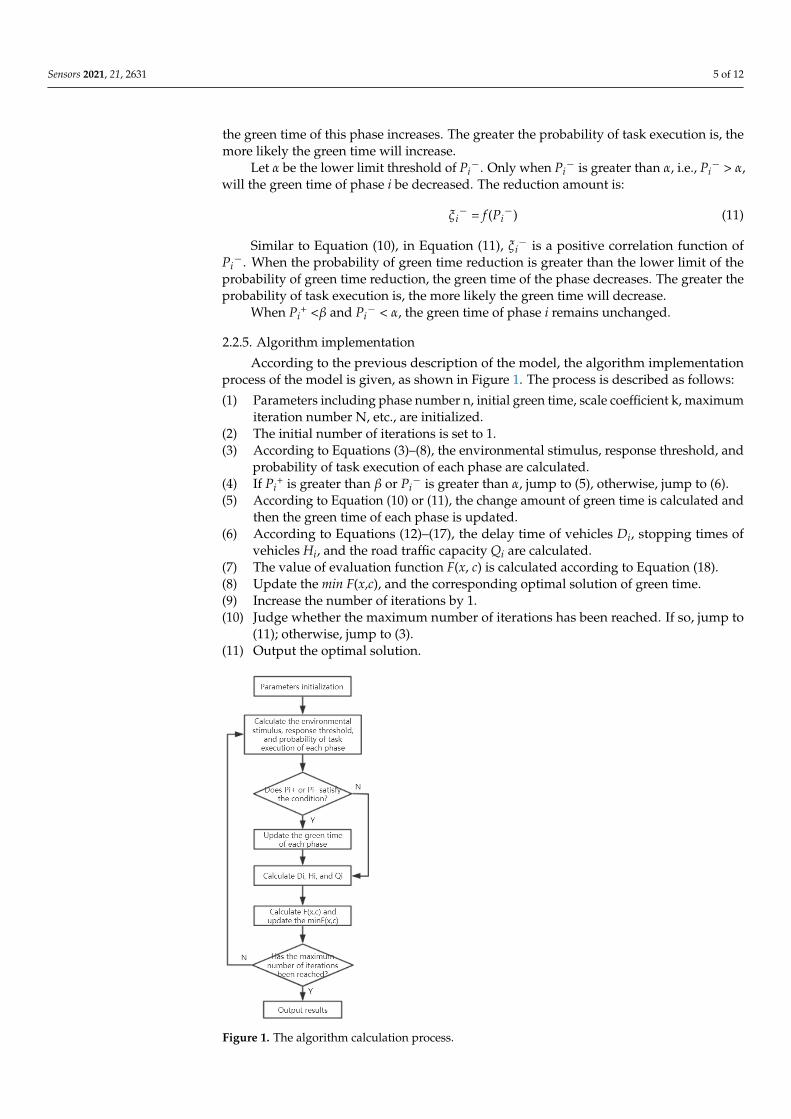
There are many types of intersections in the city, including intersection, roundabout,and interchange. Intersection includes T-shaped intersection, Y-shaped intersection, X-shaped intersection, cross-shaped intersection, and so on. For the sake of simplification,only the most common cross-shaped intersections in daily life are considered in this paper,of which shapes are shown in Figure 2. The intersection points to the different directionsof the road, and the vehicles drive in different directions, which leads to the intersectionbecome a traffic accident-prone point, known as the conflict point [29]. In Figure 2, the east,west, south, and north directions of the intersection are divided into left, straight and rightlanes, and vehicles drive in the corresponding lanes.
Sensors 2021, 21, 2631 7 of 13
Figure 2. A crossroad.
Figure 3. The four-phase scheme.
3.2. Experiment Data The data used in this paper come from “2020 China University computer
competition · Huawei cloud big data challenge”, which describes the traffic situation at the intersection of Wuhe Avenue and Zhangheng Road in Longgang, Shenzhen. It intercepts the traffic flow at the intersection from 7 am to 11 pm on 12 January, 2020, and sets every five minutes as a unit time. Due to the excessive number of straight cars in all directions of the intersection, in order to eliminate the conflict points and reduce the possibility of accidents, the four-phase scheme is selected. After processing, the traffic flow at the intersection on that day is shown in Figure 4.
Figure 2. A crossroad.
The phase scheme of the traffic signal lamp includes the two-phase scheme, the three-phase scheme, the four-phase scheme and so on. In the four-phase scheme, the specialleft-turn phase is set in each direction. Compared with the two-phase scheme and thethree-phase scheme, the conflict points are effectively eliminated and the traffic efficiencyis improved when the road is busy, so this paper discusses the four-phase scheme, and itsschematic diagram is shown in Figure 3.
Sensors 2021, 21, 2631 7 of 13
Figure 2. A crossroad.
Figure 3. The four-phase scheme.
3.2. Experiment Data The data used in this paper come from “2020 China University computer
competition · Huawei cloud big data challenge”, which describes the traffic situation at the intersection of Wuhe Avenue and Zhangheng Road in Longgang, Shenzhen. It intercepts the traffic flow at the intersection from 7 am to 11 pm on 12 January, 2020, and sets every five minutes as a unit time. Due to the excessive number of straight cars in all directions of the intersection, in order to eliminate the conflict points and reduce the possibility of accidents, the four-phase scheme is selected. After processing, the traffic flow at the intersection on that day is shown in Figure 4.
Figure 3. The four-phase scheme.
Sensors 2021, 21, 2631 7 of 12
3.2. Experiment Data
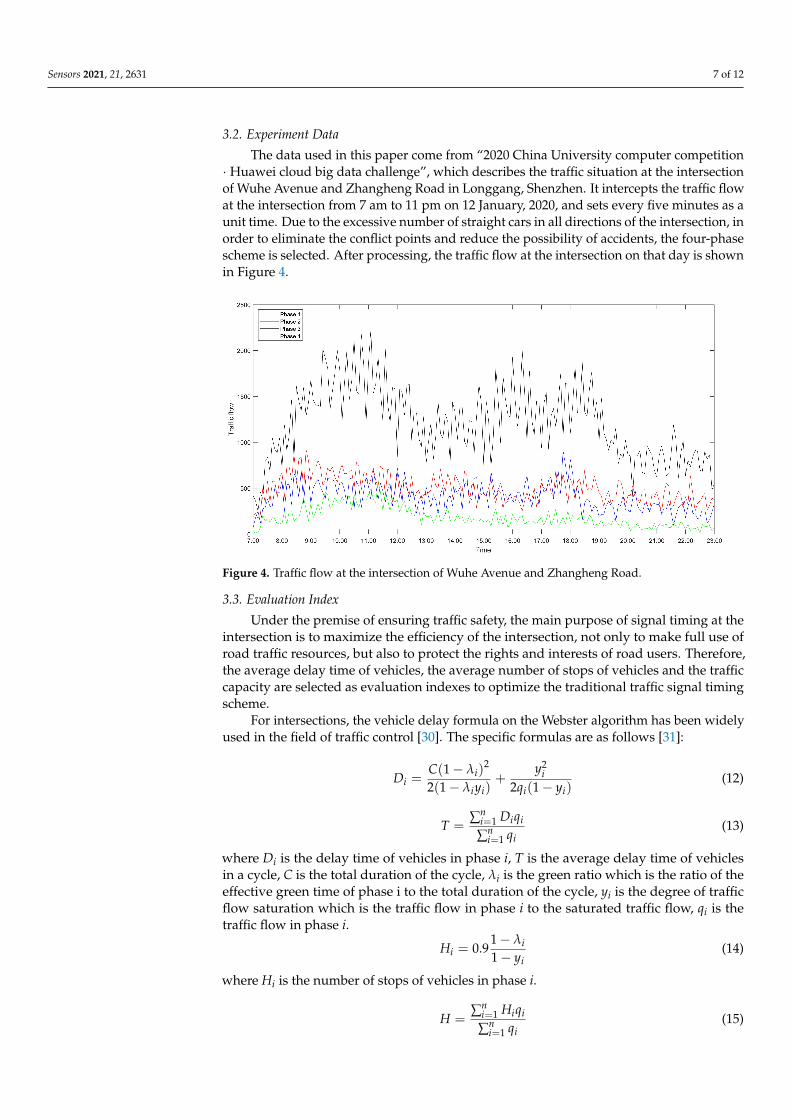
The data used in this paper come from “2020 China University computer competition· Huawei cloud big data challenge”, which describes the traffic situation at the intersectionof Wuhe Avenue and Zhangheng Road in Longgang, Shenzhen. It intercepts the traffic flowat the intersection from 7 am to 11 pm on 12 January, 2020, and sets every five minutes as aunit time. Due to the excessive number of straight cars in all directions of the intersection, inorder to eliminate the conflict points and reduce the possibility of accidents, the four-phasescheme is selected. After processing, the traffic flow at the intersection on that day is shownin Figure 4.
Sensors 2021, 21, 2631 8 of 13
Figure 4. Traffic flow at the intersection of Wuhe Avenue and Zhangheng Road.
3.3. Evaluation Index Under the premise of ensuring traffic safety, the main purpose of signal timing at the
intersection is to maximize the efficiency of the intersection, not only to make full use of road traffic resources, but also to protect the rights and interests of road users. Therefore, the average delay time of vehicles, the average number of stops of vehicles and the traffic capacity are selected as evaluation indexes to optimize the traditional traffic signal timing scheme.
For intersections, the vehicle delay formula on the Webster algorithm has been widely used in the field of traffic control[30]. The specific formulas are as follows[31]: D = C(1 − λ )2(1 − λ y ) + y2q (1 − y ) (12)
T = ∑ D q∑ q (13)
where Di is the delay time of vehicles in phase i, T is the average delay time of vehicles in a cycle, C is the total duration of the cycle, λi is the green ratio which is the ratio of the effective green time of phase i to the total duration of the cycle, yi is the degree of traffic flow saturation which is the traffic flow in phase i to the saturated traffic flow, qi is the traffic flow in phase i. H = 0.9 1 − λ1 − y (14)
where Hi is the number of stops of vehicles in phase i. H = ∑ H q∑ q (15)
where H is the average number of stops of vehicles in phase i. Q = S λ = S , (16)
where Qi[31] is the traffic capacity in phase i, Si is the traffic saturation flow rate in phase i, xi is the effective green time of phase i. Q = ∑ Q , (17)
where Q[29] is the total traffic capacity of the intersection.
Figure 4. Traffic flow at the intersection of Wuhe Avenue and Zhangheng Road.
3.3. Evaluation Index
Under the premise of ensuring traffic safety, the main purpose of signal timing at theintersection is to maximize the efficiency of the intersection, not only to make full use ofroad traffic resources, but also to protect the rights and interests of road users. Therefore,the average delay time of vehicles, the average number of stops of vehicles and the trafficcapacity are selected as evaluation indexes to optimize the traditional traffic signal timingscheme.
For intersections, the vehicle delay formula on the Webster algorithm has been widelyused in the field of traffic control [30]. The specific formulas are as follows [31]:
Di =C(1 − λi)
2
2(1 − λiyi)+
y2i
2qi(1 − yi)(12)
T =∑n
i=1 Diqi
∑ni=1 qi
(13)
where Di is the delay time of vehicles in phase i, T is the average delay time of vehiclesin a cycle, C is the total duration of the cycle, λi is the green ratio which is the ratio of theeffective green time of phase i to the total duration of the cycle, yi is the degree of trafficflow saturation which is the traffic flow in phase i to the saturated traffic flow, qi is thetraffic flow in phase i.
Hi = 0.91 − λi1 − yi
(14)
where Hi is the number of stops of vehicles in phase i.
H =∑n
i=1 Hiqi
∑ni=1 qi
(15)
Sensors 2021, 21, 2631 8 of 12
where H is the average number of stops of vehicles in phase i.
Qi = Siλi = SixiC
(16)
where Qi [31] is the traffic capacity in phase i, Si is the traffic saturation flow rate in phase i,xi is the effective green time of phase i.
Q = ∑ni Qi (17)
where Q [29] is the total traffic capacity of the intersection.
3.4. Experiment
The traffic signal timing scheme proposed in this paper will be compared with thetraditional fixed timing scheme. In the traditional fixed timing scheme, the cycle lengthand the green time of each phase in a day remain unchanged. The scheme proposed in thispaper will judge whether the cycle length and green time should be adjusted according tothe number of vehicles passing through the intersection. The solution optimization modelis given in reference [32]:
minF(x, c) =∑n
i=1(K1Di + K2Hi)
∑ni=1 K3Qi
(18)
It is assumed that the saturated traffic flow at each phase of the intersection is 1000pcu/h, 1000 pcu/h, 2500 pcu/h and 600 pcu/h. The time of the amber is 3 s, the changeinterval is 5 s, and the start-up delay is 3 s. The shortest and longest green time is 20 sand 90 s, and the initial green time is 40 s. f (Pi+) is an exponential function with e as thebase and Pi+ as the exponent. f (Pi−) is an exponential function with e as the base andPi− as the exponent. The maximum number of iterations N is set to 50. The simulationcalculation environment is described as follows: MATLAB language is used to completethe implementation of the algorithm in this paper, and the experiment is carried out on aPC with a 2.5 GHz CPU and 8 GB memory.
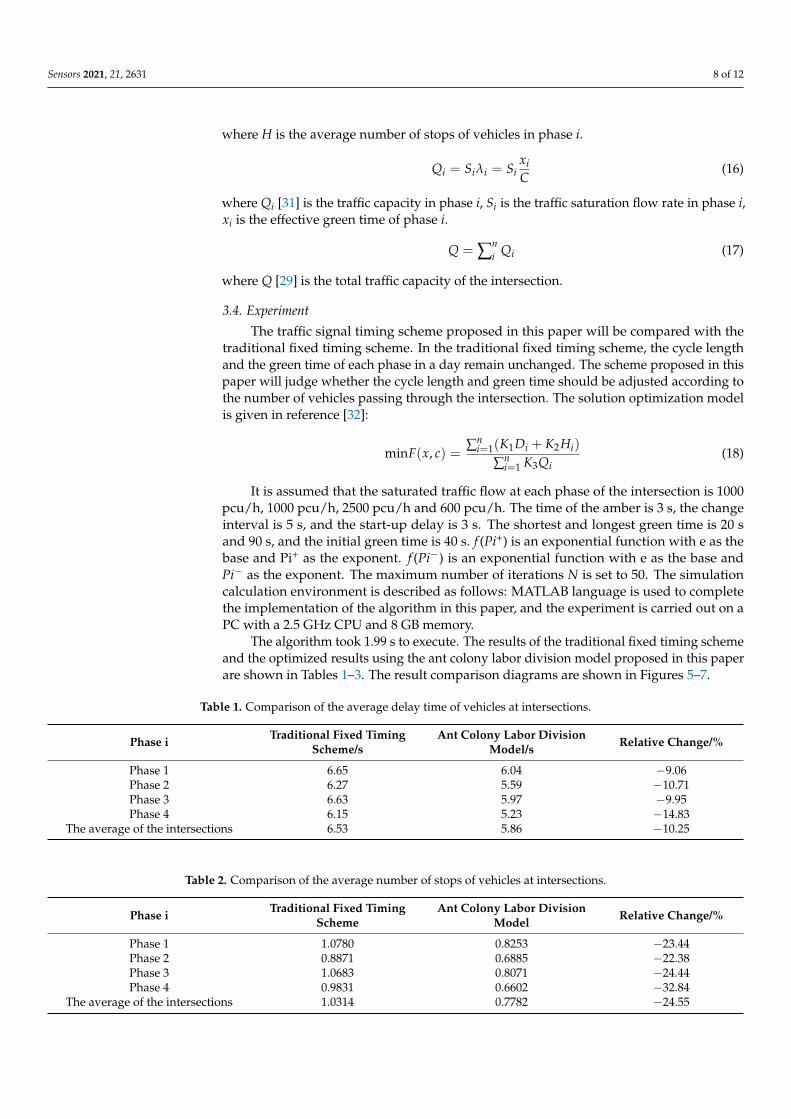
The algorithm took 1.99 s to execute. The results of the traditional fixed timing schemeand the optimized results using the ant colony labor division model proposed in this paperare shown in Tables 1–3. The result comparison diagrams are shown in Figures 5–7.
Table 1. Comparison of the average delay time of vehicles at intersections.
Phase i Traditional Fixed TimingScheme/s
Ant Colony Labor DivisionModel/s Relative Change/%
Phase 1 6.65 6.04 −9.06Phase 2 6.27 5.59 −10.71Phase 3 6.63 5.97 −9.95Phase 4 6.15 5.23 −14.83
The average of the intersections 6.53 5.86 −10.25
Table 2. Comparison of the average number of stops of vehicles at intersections.
Phase i Traditional Fixed TimingScheme
Ant Colony Labor DivisionModel Relative Change/%
Phase 1 1.0780 0.8253 −23.44Phase 2 0.8871 0.6885 −22.38Phase 3 1.0683 0.8071 −24.44Phase 4 0.9831 0.6602 −32.84
The average of the intersections 1.0314 0.7782 −24.55

Sensors 2021, 21, 2631 9 of 12
Table 3. Comparison of traffic capacity at intersections.
Phase i Traditional Fixed TimingScheme/pch·h−1
Ant Colony Labor DivisionModel/pch·h−1 Relative Change/%
Phase 1 6073 6329 +4.23Phase 2 6073 6252 +2.95Phase 3 15,181 15,832 +4.28Phase 4 3644 3660 +0.45
The intersection traffic capacity 30,969.76 32,072.55 +3.56Sensors 2021, 21, 2631 11 of 13
Figure 5. Comparison diagram of average vehicle delay time.
Figure 6. Comparison diagram of the average number of stops of vehicles.
Figure 7. Comparison diagram of traffic capacity at intersections.
Figure 5. Comparison diagram of average vehicle delay time.
Sensors 2021, 21, 2631 11 of 13
Figure 5. Comparison diagram of average vehicle delay time.
Figure 6. Comparison diagram of the average number of stops of vehicles.
Figure 7. Comparison diagram of traffic capacity at intersections.
Figure 6. Comparison diagram of the average number of stops of vehicles.

Sensors 2021, 21, 2631 10 of 12
Sensors 2021, 21, 2631 11 of 13
Figure 5. Comparison diagram of average vehicle delay time.
Figure 6. Comparison diagram of the average number of stops of vehicles.
Figure 7. Comparison diagram of traffic capacity at intersections. Figure 7. Comparison diagram of traffic capacity at intersections.
3.5. Result Analysis
It can be seen from Tables 1–3 that compared with the traditional fixed timing scheme,the scheme optimized by the ant colony labor division model has significant improvementin the delay time of vehicles and the number of stops. The average delay time of vehicles inthe traditional fixed timing scheme is 6.53 s, and in the optimized scheme is 5.86 s, whichis 10.25% lower than that in the traditional fixed-timing scheme. The average number ofstops in the traditional fixed timing scheme is 1.0314, and after optimization, it is 0.7782,which is 24.55% lower than that in the traditional fixed timing scheme. It can be seen thatin terms of the average delay time of vehicles and the average number of stops, the resultsof the proposed optimization algorithm proposed in this paper are obviously better thanthose of the traditional fixed timing scheme.
Besides, the results of the optimized algorithm also have a corresponding improve-ment in the traffic capacity, but the improvement is not significant. In order to betteranalyze the changes before and after optimization, the comparison diagrams of the averagevehicle delay time, the average number of stops of vehicles and the traffic capacity atintersections are shown (as shown in Figures 4–6). As can be seen from Figure 6, the trafficcapacity has been greatly improved during 9:00–12:00 on that day, and from 14:00 to 19:00.Although the data fluctuates up and down, the traffic capacity is improved. The trafficcapacity, however, decreased during 7:00–8:00 and 19:00–23:00. Combined with Equations(16) and (17), and the trend analysis of traffic flow in Figure 3, it is found that the trafficcapacity of the optimized algorithm is related to the effective green time of the phase. Whenthe traffic flow of this phase is very low, according to the algorithm, the green time of thisphase will be decreased. Correspondingly, the effective green time will also be decreased,and the green ratio will be decreased, leading to the decrease of the traffic capacity of theintersection. However, from the point of the traffic flow saturation in the intersection, thereis no over-saturation state in the whole day, nor does it exceed the maximum capacity ofthe intersection. It can be said that this phenomenon has very little impact on the trafficoperation efficiency of the intersection.
From Figures 5–7, it can be seen that in the period of busy traffic flow, such as8:00–12:00 and 17:00–19:00, the average delay time and the average number of stops ofvehicles after optimization are significantly reduced, and the intersection capacity is alsosignificantly improved. According to calculation, during the period of 8:00–12:00, comparedwith the fixed timing scheme, the average delay time of vehicles is reduced by 22.01% inthe timing scheme optimized by the ant colony labor division model, the average numberof stops of vehicles is reduced by 40.92%, and the road capacity is increased by 24.37%.During the period of 17:00–19:00, the average delay time of vehicles is reduced by 12.46%,
Sensors 2021, 21, 2631 11 of 12
the average number of stops of vehicles is reduced by 25.29%, and the road capacity isincreased by 9.92%. However, in the period after 20:00, due to the small traffic flow, thepossibility of congestion is low, and the optimization effect of the algorithm is not obvious.
In general, the scheme proposed in this paper is more suitable for the situation ofheavy traffic flow, and the greater the traffic flow, the better the improvement effect ofthe scheme on vehicle delay time, number of stops and road capacity will be. Ant colonylabor division model can alleviate traffic congestion at intersections to a certain extent andimprove the utilization rate of roads.
4. Conclusions
In the problem of traffic intersection green time allocation, the traffic flow in eachphase changes dynamically. In order to relieve the congestion at the intersection, the trafficsignal green time of each phase should change dynamically with the traffic flow, ratherthan remain unchanged.
As a new optimization model, the ant colony labor division model has been widelyapplied to the dynamic task assignment problem because of its flexibility. In this paper, theant colony labor division model is applied to the problem of traffic green time allocationat traffic intersections. The simulation experiment results show that compared with thefixed timing scheme, the proposed timing scheme can reduce the average delay time ofvehicles by 10.25% and the average number of stops by 24.55%, and it can increase theroad capacity by 3.56%. These data proved that the effect of this scheme is better thanthe traditional fixed timing scheme, and it can better alleviate the traffic pressure at theintersections during rush hours.
Due to the strong real-time uncontrollability of the traffic situation at the intersection,the next research direction is to further optimize the precision of the model, and tryto combine it with the video monitoring, which can obtain the traffic flow and otherinformation, as well as extend the application range from the single intersection to urbantrunk lines, and even extended to larger urban traffic network.
Author Contributions: X.F. contributed to the conception of the study. H.G. and H.C. performedthe experiment and the analysis with constructive discussions; W.C. and Z.W. performed the dataanalyses. All authors wrote and revised the manuscript. All authors have read and agreed to thepublished version of the manuscript.
Funding: This research received no external funding.
Institutional Review Board Statement: Not applicable.
Informed Consent Statement: Not applicable.
Data Availability Statement: The study used the open data.
Acknowledgments: The authors would like to thank the editor and the reviewers for the helpfulsuggestions and kind help.
Conflicts of Interest: The authors declare no conflict of interest.
References1. Dorigo, M. Optimization, Learning and Natural Algorithma. Ph. D. Thesis, Dipartmento di Elettronica, Politecnico di Milano,
Milan, Italy, 1992. (In Italian).2. Liu, F.; Zhong, S. A Review of Foreign Literatures on “swarm intelligence” Research. Stud. Dialectics Nat. 2012, 28, 114–117.
(In Chinese) [CrossRef]3. Kennedy, J.; Eberhart, R.C. Particle swarm optimization. In Proceedings of the IEEE International Conference on Neural Networks,
Perth, Australia, 27 November–1 December 1995.4. Li, X.; Shao, Z.; Qian, J. An Optimizing Method Based on Autonomous Animats: Fish-swarm Algorithm. Syst. Eng. Theory Pract.
2002, 22, 32–38.5. Karaboga, D. An Idea Based on Honey Bee Swarm for Numerical Optimization; Computers Engineering Department, Engineering
Faculty, Erciyes University: Kayseri, Turkey, 2005.
Sensors 2021, 21, 2631 12 of 12
6. Chen, T.; Li, Q.; Fu, P.; Yang, J.; Xu, C.; Cong, G.; Li, G. Public Opinion Polarization by Individual Revenue from the SocialPreference Theory. Int. J. Environ. Res. Public Health 2020, 17, 946. [CrossRef] [PubMed]
7. Ni, X.; Zhou, H.; Chen, W. Addition of an Emotionally Stable Node in the SOSa-SPSa Model for Group Emotional Contagion ofPanic in Public Health Emergency: Implications for Epidemic Emergency Responses. Int. J. Environ. Res. Public Health 2020, 17,5044. [CrossRef] [PubMed]
8. Chen, T.; Wang, Y.; Yang, J.; Cong, G. Modeling Public Opinion Reversal Process with the Considerations of External InterventionInformation and Individual Internal Characteristics. Healthcare 2020, 8, 160. [CrossRef] [PubMed]
9. Chen, T.; Li, Q.; Fu, P.; Yang, J.; Xu, C.; Cong, G.; Li, G. Modeling of the Public Opinion Polarization Process with the Considerationsof Individual Heterogeneity and Dynamic Conformity. Mathematics 2019, 7, 917. [CrossRef]
10. Chen, W.; Jiang, Z.; Guo, H.; Ni, X. Fall Detection Based on Key Points of Human-Skeleton Using OpenPose. Symmetry 2020, 12,744. [CrossRef]
11. Chen, T.; Peng, L.; Yin, X.; Rong, J.; Yang, J.; Cong, G. Analysis of User Satisfaction with Online Education Platforms in Chinaduring the COVID-19 Pandemic. Healthcare 2020, 8, 200. [CrossRef]
12. Chen, W.; Chen, S.; Guo, H.; Ni, X. Welding flame detection based on color recognition and progressive probabilistic Houghtransform. Concurr. Comput. Pract. Exp. 2020, 32, e5815. [CrossRef]
13. Chen, T.; Wu, S.; Yang, J.; Cong, G. Risk Propagation Model and Its Simulation of Emergency Logistics Network Based on MaterialReliability. Int. J. Environ. Res. Public Health 2019, 16, 4677. [CrossRef] [PubMed]
14. Chen, T.; Wu, S.; Yang, J.; Cong, G.; Li, G. Modeling of Emergency Supply Scheduling Problem Based on Reliability and ItsSolution Algorithm under Variable Road Network after Sudden-Onset Disasters. Complexity 2020. [CrossRef]
15. Xiao, R.; Wang, Y. Research Progress of Self-organized Labor Division in Swarm Intelligence. Inf. Control. 2019, 48, 129–139.16. Zhang, W.; Zhang, B.; Qiu, W. The Use of Ant Colony Model in the Staff Deployment Problem. Adv. Mater. Res. 2011, 317,
1501–1506. [CrossRef]17. Xiao, R.; Chen, W.; Chen, T. Modeling of Ant Colony’s Labor Division for the Multi-Project Scheduling Problem and Its Solution
by PSO. J. Comput. Theor. Nanosci. 2012, 9, 223–232. [CrossRef]18. Wang, Y.; Wang, Y.; Sun, J.; Huang, C.; Zhang, X. A stimulus–response-based allocation method for the circle packing problem
with equilibrium constraints. Phys. A Stat. Mech. Appl. 2019, 522, 232–247. [CrossRef]19. Wang, Y.; Xiao, R. Structure Emergence of Spatial Fidelity Zones in Biosystems. J. Bioinform. Intell. Control 2014, 3, 90–99.
[CrossRef]20. Wu, H.; Li, H.; Xiao, R.; Liu, J. Modeling and simulation of dynamic ant colony’s labor division for task allocation of UAV swarm.
Phys. A Stat. Mech. Appl. 2018, 491, 127–141. [CrossRef]21. Xiao, R.; Wu, H.; Hu, L.; Hu, J. A swarm intelligence labor division approach to solving complex area coverage problems of
swarm robots. Int. J. Bio Inspired Comput. 2020, 15, 224–238. [CrossRef]22. Su, H. Study on the Optimization Methods of Signal Timing Parameters of Urban Traffic Control. Ph. D. Thesis, Jilin University,
Changchun, China, 2004.23. Hakim, G.P.N.; Firdausi, A.; Alaydrus, M.; Budiyanto, S. Dynamic Traffic Light Timing Control System using Fuzzy TOPSIS
Algorithm. In IOP Conference Series Materials Science and Engineering; IOP: London, UK, 2018; Volume 453.24. Guo, P.; Lei, D.; Ye, L. An Indefinite Cycle Traffic Light Timing Strategy. Int. J. Adv. Comput. Sci. Appl. 2018, 9, 1–12. [CrossRef]25. Chen, Y.; Chen, K.; Hsiung, P.A. Dynamic traffic light optimization and Control System using model-predictive control method.
In Proceedings of the 2016 IEEE 19th International Conference on Intelligent Transportation Systems (ITSC), Rio de Janeiro, Brazil,1–4 November 2016; pp. 2366–2371.
26. Qi, A. Research on Timing Optimization of Regional Traffic Signals based on Improved Genetic Algorithm. In Proceedings of the2018 3rd International Workshop on Materials Engineering and Computer Sciences (IWMECS 2018), Jinan, China, 27–28 January2018.
27. Bonabeau, E.; Theraulaz, G.; Deneubourg, J. Fixed Response Thresholds and the Regulation of Division of Labor in Insect Societies.Bull. Math. Biol. 1998, 60, 753–807. [CrossRef]
28. Castello, E.; Yamamoto, T.; Nakamura, Y.; Ishiguro, H. Foraging optimization in swarm robotic systems based on an adaptiveresponse threshold model. Adv. Robot. 2014, 28, 1343–1356. [CrossRef]
29. Wang, B. The Research on Signal Timing Algorithm Intersections Based on Ant Colony Algorithm and Fuzzy Control Theory; JilinUniversity: Changchun, China, 2018.
30. Yang, P.; Zhang, S. Traffic Management and Control; China Communication Press: Beijing, China, 1995.31. Chen, X.; Qian, D.; Shi, D. Multi-objective optimization method for signal timing of urban traffic intersection. Mod. Electron. Tech.
2016, 39, 19–22.32. He, J. Traffic Signal Timing Optimization Based on Ant Colony Algorithm; Shanxi University of Science and Technology: Taiyuan,
China, 2012.
Copyright © 2022 FDOKUMEN