HOW MUCH WILL IT COST? - Public Agenda
50
A REPORT BY HOW MUCH WILL IT COST? How Americans Use Prices In Health Care A report by Public Agenda, with support from the Robert Wood Johnson Foundation MARCH 2015
-
Upload
khangminh22 -
Category
Documents
-
view
1 -
download
0
Transcript of HOW MUCH WILL IT COST? - Public Agenda
A REPORT BY
HOW MUCH WILL IT COST? How Americans Use Prices In Health Care
A report by Public Agenda, with support from the Robert Wood Johnson Foundation
MARCH 2015
How Much Will It Cost? How Americans Use Prices In Health Care2
How Much Will It Cost? How Americans Use Prices In Health Care
A report from Public Agenda by David Schleifer, Carolin Hagelskamp and Chloe Rinehart
Sponsored by the Robert Wood Johnson Foundation
Available online at: http://www.publicagenda.org/pages/ how-much-will-it-cost
Design: Carrie Chatterson Studio
Copyediting: Lisa Ferraro Parmelee
Copyright © 2015 Public Agenda
This work is licensed under the Creative Commons Attribution-NonCommercial-ShareAlike 3.0 Unported license. To view a copy of this license, visit http://creativecommons.org/licenses/by-nc-sa/3.0/ or send a letter to Creative Commons at 171 Second Street, Suite 300, San Francisco, CA 94105, USA.
How Much Will It Cost? How Americans Use Prices In Health Care 1
Executive Summary. . . . . . . . . . . . . . . . . . . . . . . . 2
Introduction . . . . . . . . . . . . . . . . . . . . . . . . . . . 7
Main Findings . . . . . . . . . . . . . . . . . . . . . . . . . 10
Implications . . . . . . . . . . . . . . . . . . . . . . . . . . 36
Methodology . . . . . . . . . . . . . . . . . . . . . . . . . 38
Sample Characteristics . . . . . . . . . . . . . . . . . . . . . 41
Bibliography. . . . . . . . . . . . . . . . . . . . . . . . . . 44
Related Publications from Public Agenda . . . . . . . . . . . . . . 46
Acknowledgments . . . . . . . . . . . . . . . . . . . . . . . 47
About Public Agenda . . . . . . . . . . . . . . . . . . . Back cover
About the Robert Wood Johnson Foundation . . . . . . . . . Back cover
HOW MUCH WILL IT COST? How Americans Use Prices In Health Care
How Much Will It Cost? How Americans Use Prices In Health Care2
EXECUTIVE SUMMARY
1 Telephone and online samples were combined using propensity score matching techniques and weighted to the general U.S. population. See the methodology at the end of this report for a detailed description of how this research was conducted.
Public Agenda conducted this research with support from the Robert Wood Johnson Foundation. The findings are based on survey data from a nationally representative sample of 2,010 Americans ages 18 and older. The survey was conducted in July and August 2014 via telephone, including cell phones, and online.1
Before fielding the survey, Public Agenda conducted three focus groups with demographically diverse groups of insured and uninsured adults in New Jersey, Massachusetts and Iowa. We also conducted 30 semi-structured follow-up interviews with selected survey respondents who have sought price information.
How many Americans are trying to find out how much their health care will cost them?
How are they using the information they find?
Are a significant number of Americans ready to look for better-value care?
This nationally representative survey finds that a majority of Americans have tried to find information about health care prices before getting care, including 21 percent who have compared prices across multiple providers. Most of those who have compared prices say they saved money. We also found that the majority of Americans do not believe higher-priced care is necessarily of better quality. And most say insurance companies should be required to make public how much they pay doctors for medical services.
The research also highlights potential obstacles to increasing the number of those who compare prices. Most Americans are not aware prices can vary across health care providers. People are split on whether or not they think it is reasonable to expect patients to compare prices before getting care. And half of those who have not ever tried to find out prices before getting care say they are unsure how to do so.
How Much Will It Cost? How Americans Use Prices In Health Care 3
Findings in Brief
Finding 1: The majority of Americans have tried to find information about health care prices before getting care. • 56 percent of Americans say they have tried to find out how much they would have to
pay out of pocket—not including a copay—or how much their insurer would have to pay a doctor or hospital, before getting care.
• People with higher deductibles are more likely to have sought price information: 67 percent of those with deductibles of $500 to $3,000 and 74 percent of those with deductibles higher than $3,000 have tried to find price information before getting care.
• People with college degrees and women are more likely to have sought price information than those without degrees and men—62 percent of those with college degrees and 59 percent of women report having done so. Only 40 percent of retired Americans report having done so.
• There are no significant differences by income, age or race/ethnicity in whether or not people have sought price information when taking into consideration other relevant variables.
Finding 2: Most Americans seem open to looking for better-value care. • 71 percent of Americans say higher prices are not typically a sign of better-quality
medical care.
• 69 percent say insurance companies should be required to make public how much they pay doctors for medical services.
• Even among those who have not ever tried to find out a price before getting care, 57 percent say they would like to know the prices of medical services in advance, and 43 percent would choose less expensive doctors if they knew the prices in advance.
Finding 3: Looking for price information does not necessarily mean comparing prices.• About one in five Americans—21 percent—say that when trying to find price informa-
tion before getting care, they have compared prices across multiple providers.
• 33 percent say that when trying to find price information before getting care, they have checked prices from just one provider.
• People who have compared prices across multiple providers are more likely to be making health care decisions for adult family members: 53 percent of those who have compared prices across providers make such decisions, compared with only 34 percent of those who have checked prices from just one provider.
• People who have compared prices across multiple providers are more likely to receive regular medical treatment: 42 percent of people who have compared prices before getting care receive regular medical treatment, compared with 33 percent of those who have not ever sought price information before getting care.
• Hispanics, African-Americans and younger people are more likely than other groups to have compared prices across multiple providers. Those with incomes over $100,000 are less likely than those with lower incomes to have compared prices.
How Much Will It Cost? How Americans Use Prices In Health Care4
Findings in Brief
Finding 4: Comparing prices, many Americans say, has saved them money. • Among Americans who have compared prices across multiple providers, 62 percent
believe they have saved money.
• 82 percent of those who have compared prices across multiple providers say they will do so again in the future.
Finding 5: Some obstacles stand in the way of increasing the number of Americans who compare prices before getting care.• 57 percent of insured Americans do not think some doctors covered under their
insurance plans charge more than others for the same services.
• 43 percent of Americans say it is not reasonable to expect people to compare prices before getting care.
• 50 percent of those who have never checked a price are unsure how to find price information.
Finding 6: Insurers, providers and office staff can play key roles in helping Americans manage their health care spending. • 69 percent of Americans say a website showing how much different doctors charge
would help them with their health care spending.
• 64 percent say that after a doctor’s appointment, they would find it helpful to get an estimate from the receptionist of how much their bill will be.

How Much Will It Cost? How Americans Use Prices In Health Care 5
Implications
This research suggests many people are hungry for price information. Our report concludes with implications based on these findings for policymakers, insurers, employers and providers who are interested in engaging more Americans in comparing prices and choosing better-value care.
• Strengthen the capacity of providers, staff and insurance company personnel to discuss prices: The finding that many Americans are already trying to get price information from receptionists and hospital staff, insurance companies, doctors, hospital billing departments and nurses suggests a need to strengthen these professionals’ capacity to provide and discuss price information.
• Help people understand that prices vary: Most Americans are not aware of price variation. This may keep them from comparing prices or looking for less expensive providers when they are quoted a price that they cannot afford. Policymakers, insurers, employers and providers may wish to consider how to help more people understand the types of care for which prices do and do not vary.
• Help people understand how to find price information: Most Americans who have not ever sought price information say they would like to know the prices of medical services in advance. Half of them, however, say they do not know how to find it. This suggests a need for more outreach and education about reliable sources of price information.
• Focus engagement efforts on people who care for others and those who receive regular medical care: Americans who have compared prices are more likely than others to be helping adult family members make health care decisions or receiving regular medical care themselves. Those making efforts to engage more people in comparing prices may wish to focus on these people, who may also be those most in need of savings on their out-of-pocket expenses.
• Recognize the challenges to engaging people in both seeking and comparing prices and in choosing better-value care: Our follow-up interviews suggest that some people are comfortable with their current providers and do not want to switch even if they could save money, while some live in regions where they feel they have little choice of providers. Our follow-up interviews also suggest that some people feel that the prices they find are unaffordable.
For full survey results go to http://www.publicagenda.org/media/how-much-will-it-cost-topline-methodology

How Much Will It Cost? How Americans Use Prices In Health Care6
How Much Will It Cost? How Americans Use Prices In Health Care 7
Individuals and families bear the largest share of health care costs in the United States. In 2013, households’ insurance premiums, out-of-pocket spending and contributions to Medicare through payroll taxes and premiums accounted for 28 percent of the $2.9 trillion dollars spent on health care, more than the proportions spent by the federal government, state governments or businesses.2
The burden of health care costs on individuals and families has grown in the past decade. Workers’ contributions to their employer-sponsored insurance premiums increased an average of 81 percent from 2004 to 2014.3 In 2014, 80 percent of workers in employer-sponsored health insurance plans had deductibles, up from 63 percent in 2009. The average deductible in 2014 for single coverage was $1,217.4 Nearly three-quarters of workers in 2014 also had copayments for doctor’s office visits. And 62 percent of covered workers had coinsurance for hospital admissions after meeting their deductibles.5
Moreover, approximately 13 percent of Americans remained uninsured at the end of 2014.6 Uninsured people are vulnerable to being billed at higher rates than those with insurance.7 While millions have gained insurance under the Affordable Care Act, 70 percent of plans offered in the federal health insurance market-place in the 2015 enrollment period had deductibles of up to $3,000.8
Until recently, however, it has been nearly impossible for people to find out in advance how much they will have to pay out of pocket for their care.9 When Catalyst for Payment Reform graded states’ price transparency laws in 2014, 45 states earned failing grades. No state merited a grade of A, meaning none satisfied the organization’s criteria for accessibility of price informa-tion and regulations regarding it.10
Several hurdles stand in the way of making health care price information more accurate, comprehensive and readily available to individuals. Neither doctors nor patients necessarily know before an episode of care what combination of tests and treatments will be needed, so knowing what prices to ask about may be difficult. In emergencies, seeking and using price information may be impossible. For providers of price information, assembling accurate price data across patients’ many different insurance plans can be difficult. And gag clauses in contracts sometimes prevent insurers from disclosing the prices they pay to health care providers.
Nevertheless, several efforts are underway to make health care prices more readily available to individuals. Insurers such as UnitedHealthcare have added price information tools to their websites.11 Vendors such as Castlight and Healthcare Bluebook provide price information tools to employees at some companies.
INTRODUCTION
2 Micah Hartman, Anne B. Martin, David Lassman, Aaron Catlin and the National Health Expenditure Accounts Team, “National Health Spending in 2013: Growth Slows, Remains in Step with the Overall Economy,” Health Affairs 34, no. 1 (2015): 150–60.
3 About 56 percent of nonelderly Americans had health coverage from their employers in 2013. Gary Claxton, Matthew Rae, Nirmita Panchal, Anthony Damico, Nathan Bostick, Kevin Kenward and Heidi Whitmore, ”Employer Health Benefit 2014 Annual Survey” (Menlo Park, CA and Chicago, IL: Henry J. Kaiser Family Foundation and Health Research and Educational Trust, 2014).
4 Claxton et al., “Employer Health Benefit 2014 Annual Survey.”
5 Claxton et al., “Employer Health Benefit 2014 Annual Survey.”
6 Jenna Levy, “In U.S., Uninsured Rate Sinks to 12.9%” (Princeton NJ: Gallup, 2015).
7 Steven Brill, “Bitter Pill: Why Medical Bills Are Killing Us,” Time, March 4, 2013.
8 HealthCare.gov Blog, “6 Things to Know About Deductibles in the Health Insurance Marketplace” (Baltimore, MD: U.S. Centers for Medicare & Medicaid Services, 2014) https://www.healthcare.gov/blog/6-things-to-know-about-deductibles-in-the-health-insurance-marketplace.
9 General Accounting Office, “Health Care Price Transparency: Meaningful Price Information Is Difficult for Consumers to Obtain Prior to Receiving Care” (Washington, DC: General Accounting Office, 2011).
10 Catalyst for Payment Reform and Health Care Incentives Improvement Institute, “2014 Report Card on State Price Transparency Laws” (Oakland, CA: Catalyst for Payment Reform, 2014).
11 UnitedHealthCare, “A Comparison of myHealthcare Cost Estimator Users and Nonusers: Effect on Provider Choices,” Samira Kamrudin and Mona Shah (Minnetonka, MN: UnitedHealthCare, 2014).
How Much Will It Cost? How Americans Use Prices In Health Care8
Public Agenda, with support from the Robert Wood Johnson Foundation, set out to learn about Americans’ use of and perspectives on health care price informa-tion and to gain some indication of how Americans might respond as price information becomes more widely available. We sought to answer questions such as the following:
• How eager are Americans to know the prices of their medical care in advance?
• How many have already tried to find out the prices of health care services before getting care?
• What sources are they using to find price information?
• Does price information help them save money?
• What distinguishes Americans who have sought price information from those who have not?
• What stands in the way of more people seeking price information?
• Do Americans really believe higher priced health care is necessarily of higher quality?
• Would more people choose less expensive providers if they knew prices in advance?
Massachusetts has required since 2014 that insurers in the state disclose price information upon request to the people they cover.12 Several experiments have shown that giving price information to patients can lead them to choose lower-cost care, help employers and other insurance purchasers save money and even lead providers to reduce their prices.13
The emergence and growth of price transparency efforts raises questions about how Americans are already seeking and using price information, their views about the relationship between cost and quality, and their willingness to choose better-value care. This research begins to answer those questions.
The research consisted of a nationally representative survey of 2,010 U.S. adults (ages 18+), conducted via telephone and online during the summer of 2014. Before fielding the survey, Public Agenda conducted three focus groups with demographically diverse groups of insured and uninsured adults in New Jersey, Massachusetts and Iowa. We also conducted 30 semi-structured follow-up interviews with selected survey respondents who have sought price information.
This report presents findings from the survey, augmented with illustrative quotes from our focus groups. In addition, we present stories from our follow-up interviews in “price information–seeker spotlights” throughout the report.
The methodology section and sample characteristics table at the end of the report provide detailed descrip-tions of how this research was conducted. The survey’s complete topline findings, including full question wording and subgroup findings, can be found at http://www.publicagenda.org/media/how-much-will-it-cost-topline-methodology
THIS RESEARCH
12 Massachusetts Law for Health Care Cost Reduction, “An Act Improving the Quality of Health Care and Reducing Costs Through Increased Transparency, Efficiency and Innovation,” 2012. The National Conference of State Legislatures tracks state actions to improve transparency in health care costs and prices at http://www.ncsl.org/research/health/transparency-and-disclosure-health-costs.aspx.
13 UnitedHealthCare, “A Comparison of Myhealthcare Cost Estimator Users and Nonusers”; Christopher Whaley, Jennifer Schneider Chafen, Sophie Pinkard, Gabriella Kellerman, Dena Bravata, Robert Kocher and Neeraj Sood, “Association Between Availability of Health Service Prices and Payments for These Services,” JAMA 312, no. 16 (2014): 1670–76; James C. Robinson and Timothy T. Brown, “Increases in Consumer Cost Sharing Redirect Patient Volumes and Reduce Hospital Prices for Orthopedic Surgery,” Health Affairs 32, no. 8 (2013): 1392–97; Sze-jung Wu, Gosia Sylwestrzak, Christiane Shah and Andrea DeVries, “Price Transparency for MRIs Increased Use of Less Costly Providers and Triggered Provider Competition,” Health Affairs 33, no. 8 (2014): 1391–98.
How Much Will It Cost? How Americans Use Prices In Health Care 9
WHAT “PRICE INFORMATION SEEKING”MEANS IN THIS RESEARCHIf people were able and motivated to find out the out-of-pocket costs of medical services before getting care, they could, at least theoretically, be in a position to save money by choosing lower-priced providers, negotiating for lower prices or choosing not to get care at all. Furthermore, if people were attentive not only to their own out-of-pocket costs but also to what their providers charge insurers, the health care system as a whole could also, at least theoretically, save money.
To find out whether Americans seek price information that could help them or their insurers save money, our survey did the following:
• First, all questions pertaining to price-seeking behavior asked whether people have ever sought price information before getting care.
• Second, we included four questions about whether people have sought information about their out-of-pocket prices, as well as one question about whether they have sought information about the costs of their care to their insurers.
• Third, when asking whether or not people have tried to find information about their out-of-pocket costs, we specifically asked them about costs other than their copayments. We did this to focus solely on the more variable and potentially costly out-of-pocket prices people may have to pay in addition to their copayments.
• Fourth, we asked people whether they have ever tried to find health care price information because that information can be difficult to find and understand. In subsequent questions, we asked whether they actually found the information they have been looking for and how they used it.
Specifically, this research categorized Americans as having sought price information if they say they have ever done one or more of the following before getting medical care:
• Tried to find out in advance how much a visit to a primary care doctor would cost them out of pocket, not including the copay.
• Tried to find out in advance how much a visit to a specialist doctor would cost them out of pocket, not including the copay.
• Tried to find out in advance how much a medical test would cost them out of pocket, not including the copay.
• Tried to find out in advance how much a hospital stay would cost them out of pocket, not including the copay.
• Tried to find out in advance how much their insurance company would have to pay a doctor or hospital, even if it did not affect their out-of-pocket costs.
MAIN FINDINGS
How Much Will It Cost? How Americans Use Prices In Health Care10
How Much Will It Cost? How Americans Use Prices In Health Care 11
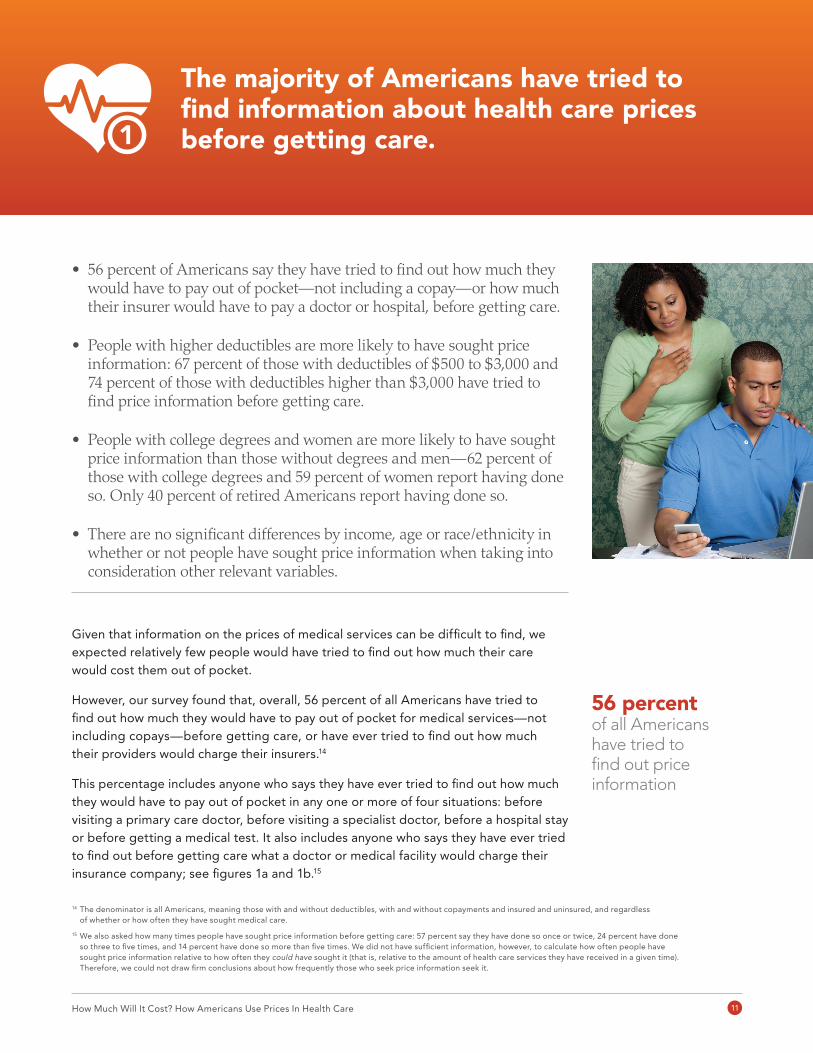
Given that information on the prices of medical services can be difficult to find, we expected relatively few people would have tried to find out how much their care would cost them out of pocket.
However, our survey found that, overall, 56 percent of all Americans have tried to find out how much they would have to pay out of pocket for medical services—not including copays—before getting care, or have ever tried to find out how much their providers would charge their insurers.14
This percentage includes anyone who says they have ever tried to find out how much they would have to pay out of pocket in any one or more of four situations: before visiting a primary care doctor, before visiting a specialist doctor, before a hospital stay or before getting a medical test. It also includes anyone who says they have ever tried to find out before getting care what a doctor or medical facility would charge their insurance company; see figures 1a and 1b.15
The majority of Americans have tried to find information about health care prices before getting care.
• 56 percent of Americans say they have tried to find out how much they would have to pay out of pocket—not including a copay—or how much their insurer would have to pay a doctor or hospital, before getting care.
• People with higher deductibles are more likely to have sought price information: 67 percent of those with deductibles of $500 to $3,000 and 74 percent of those with deductibles higher than $3,000 have tried to find price information before getting care.
• People with college degrees and women are more likely to have sought price information than those without degrees and men—62 percent of those with college degrees and 59 percent of women report having done so. Only 40 percent of retired Americans report having done so.
• There are no significant differences by income, age or race/ethnicity in whether or not people have sought price informa tion when taking into consideration other relevant variables.
14 The denominator is all Americans, meaning those with and without deductibles, with and without copayments and insured and uninsured, and regardless of whether or how often they have sought medical care.
15 We also asked how many times people have sought price information before getting care: 57 percent say they have done so once or twice, 24 percent have done so three to five times, and 14 percent have done so more than five times. We did not have sufficient information, however, to calculate how often people have sought price information relative to how often they could have sought it (that is, relative to the amount of health care services they have received in a given time). Therefore, we could not draw firm conclusions about how frequently those who seek price information seek it.
1
56 percent of all Americans have tried to find out price information
How Much Will It Cost? How Americans Use Prices In Health Care12
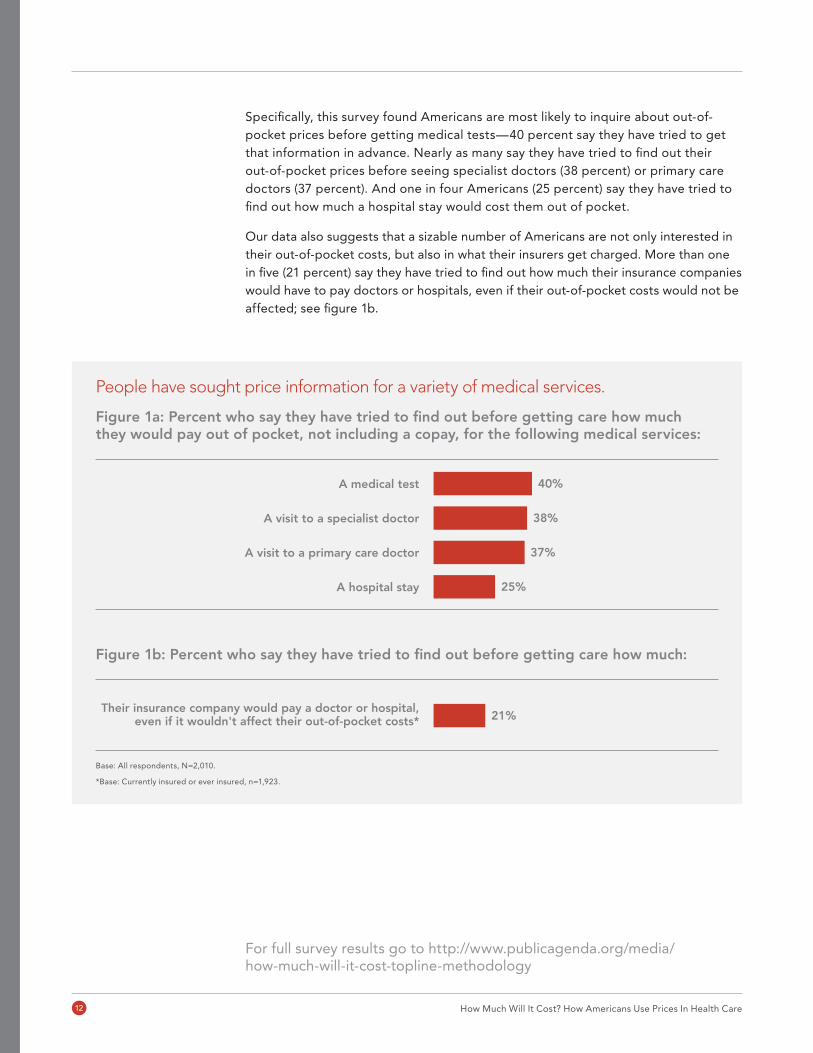
Specifically, this survey found Americans are most likely to inquire about out-of-pocket prices before getting medical tests—40 percent say they have tried to get that information in advance. Nearly as many say they have tried to find out their out-of-pocket prices before seeing specialist doctors (38 percent) or primary care doctors (37 percent). And one in four Americans (25 percent) say they have tried to find out how much a hospital stay would cost them out of pocket.
Our data also suggests that a sizable number of Americans are not only interested in their out-of-pocket costs, but also in what their insurers get charged. More than one in five (21 percent) say they have tried to find out how much their insurance companies would have to pay doctors or hospitals, even if their out-of-pocket costs would not be affected; see figure 1b.
People have sought price information for a variety of medical services.
Figure 1a: Percent who say they have tried to find out before getting care how much they would pay out of pocket, not including a copay, for the following medical services:
Figure 1b: Percent who say they have tried to find out before getting care how much:
A hospital stay
A visit to a primary care doctor
A visit to a specialist doctor
A medical test 40%
38%
37%
25%
Their insurance company would pay a doctor or hospital,even if it wouldn't affect their out-of-pocket costs* 21%
Base: All respondents, N=2,010.
*Base: Currently insured or ever insured, n=1,923.
For full survey results go to http://www.publicagenda.org/media/how-much-will-it-cost-topline-methodology
How Much Will It Cost? How Americans Use Prices In Health Care 13
Price information–seeker spotlight:
Emily’s son has special needs.16 Her family once got a bill from a laboratory for over $1,000 for a test he required. Other parents with special-needs children then told her different labs charge different prices. Now Emily always asks the price before getting tests.
– Insured with a deductible, in her 40s, white.
People who have higher deductibles are more likely to have sought price information before getting care.17
A deductible is an amount of money a person must pay out of pocket before their insurance company begins covering the costs of his or her care. People with deduct-ibles are, therefore, responsible for paying at least some of the upfront costs of their health care. Ostensibly, making patients share costs should give them an incentive to seek lower-priced care. An increasing number of workers have deductibles, and the average size of their deductibles has been growing.18
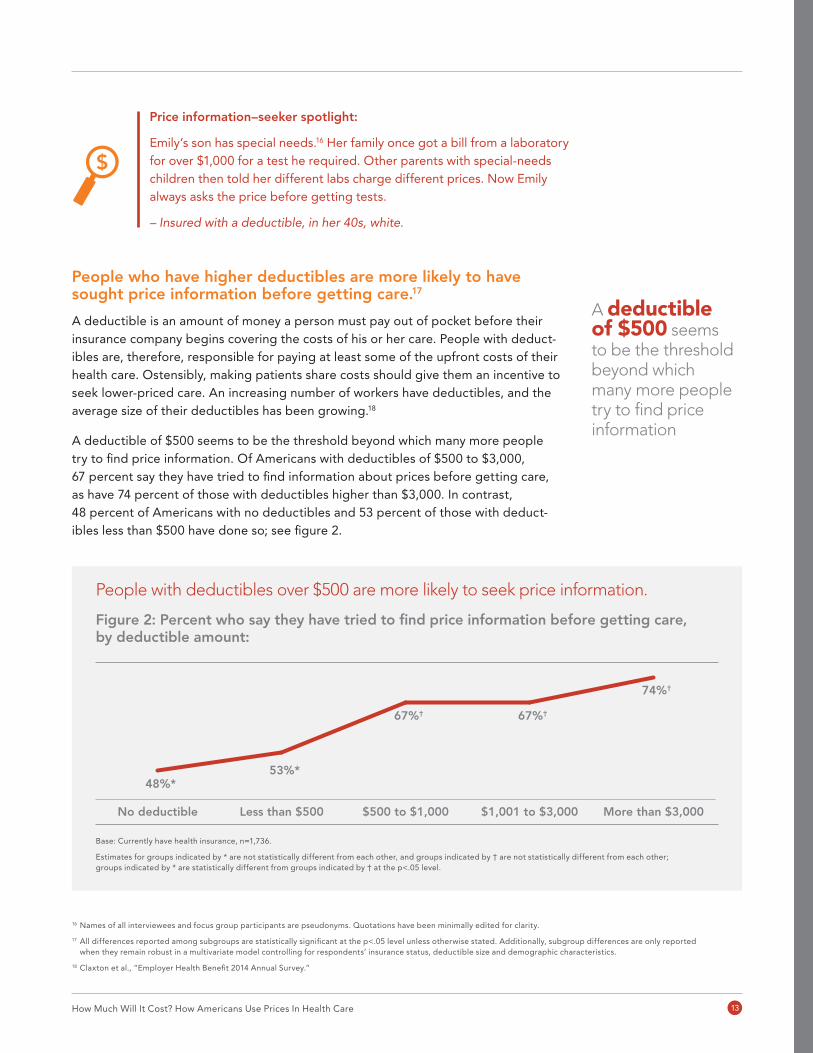
A deductible of $500 seems to be the threshold beyond which many more people try to find price information. Of Americans with deductibles of $500 to $3,000, 67 percent say they have tried to find information about prices before getting care, as have 74 percent of those with deductibles higher than $3,000. In contrast, 48 percent of Americans with no deductibles and 53 percent of those with deduct-ibles less than $500 have done so; see figure 2.
A deductible of $500 seems to be the threshold beyond which many more people try to find price information
16 Names of all interviewees and focus group participants are pseudonyms. Quotations have been minimally edited for clarity.
17 All differences reported among subgroups are statistically significant at the p<.05 level unless otherwise stated. Additionally, subgroup differences are only reported when they remain robust in a multivariate model controlling for respondents’ insurance status, deductible size and demographic characteristics.
18 Claxton et al., “Employer Health Benefit 2014 Annual Survey.”
People with deductibles over $500 are more likely to seek price information.
Figure 2: Percent who say they have tried to find price information before getting care, by deductible amount:
More than $3,000$1,001 to $3,000$500 to $1,000Less than $500No deductible
48%*53%*
67%† 67%†
74%†
Base: Currently have health insurance, n=1,736.
Estimates for groups indicated by * are not statistically different from each other, and groups indicated by † are not statistically different from each other; groups indicated by * are statistically different from groups indicated by † at the p<.05 level.
How Much Will It Cost? How Americans Use Prices In Health Care14
For example, Heather, an insured participant in our Massachusetts focus group with a $1,500 deductible, explained that she called her insurance company to ask about the price of a procedure. When she found out the price, she called the office of the provider she had already chosen. Despite feeling embarrassed, she asked for a discount. The office staff told her they got such requests all the time and offered her a 50 percent discount. Heather told the other focus group participants, “You have to put on your big girl pants and ask. I did, and I paid half of what I was going to pay.”
However, people do not necessarily stop trying to find price information after they meet their deductibles. Of those who have tried to find price information before getting care, 43 percent have done so before meeting their deductibles, 40 percent have done so both before and after meeting their deductibles and 11 percent have done so after meeting their deductibles.
Price information–seeker spotlight:
After having surgery, William got a $7,000 bill from a pathology lab that turned out to be out of his provider network. Since then, he has begun asking about prices. “I have an $8,850 deductible, so I always ask how much things will cost before I go in. Everything is negotiable, so I always ask.”
– Insured with a deductible, in his 50s, white.
People who have been uninsured at some point in the past 12 months are more likely to have ever tried to find price information before getting care.
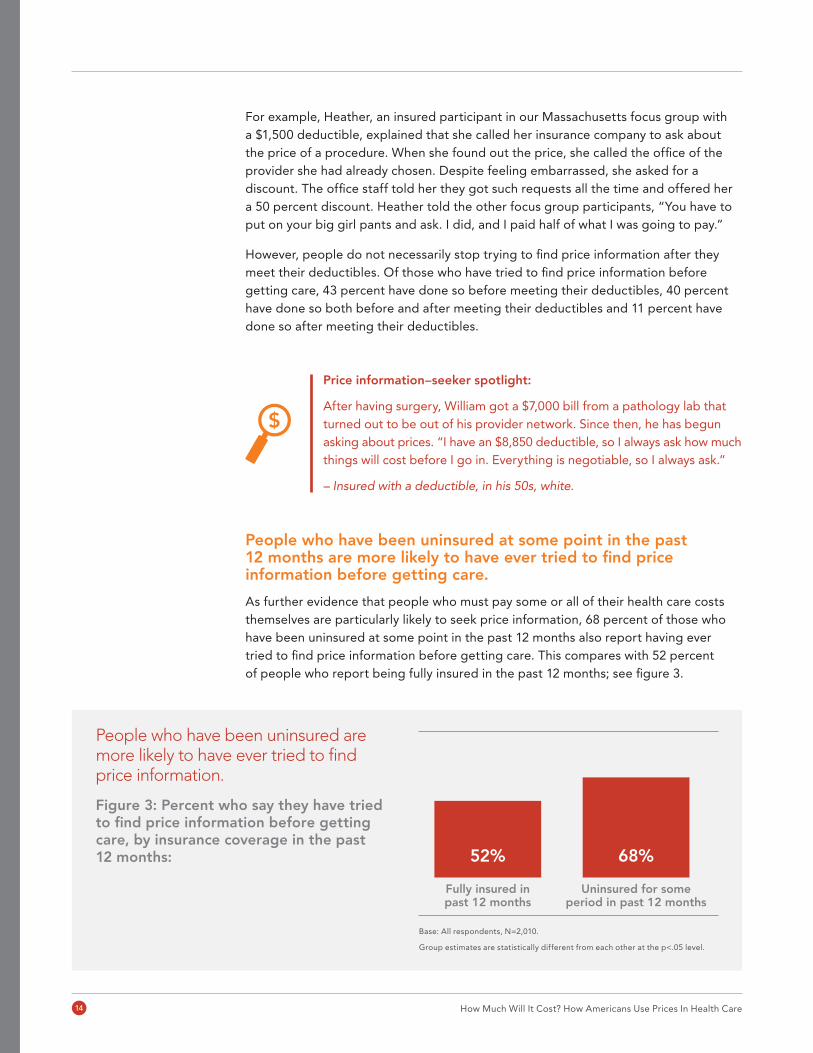
As further evidence that people who must pay some or all of their health care costs themselves are particularly likely to seek price information, 68 percent of those who have been uninsured at some point in the past 12 months also report having ever tried to find price information before getting care. This compares with 52 percent of people who report being fully insured in the past 12 months; see figure 3.
People who have been uninsured are more likely to have ever tried to find price information.
Figure 3: Percent who say they have tried to find price information before getting care, by insurance coverage in the past 12 months:
Uninsured for someperiod in past 12 months
Fully insured inpast 12 months
52% 68%
Base: All respondents, N=2,010.
Group estimates are statistically different from each other at the p<.05 level.
How Much Will It Cost? How Americans Use Prices In Health Care 15
People who have been surprised by high bills are more likely to have tried to find price information.
The experience of getting a surprisingly high bill also seems to be related to seeking price information. Two-thirds of people who say they have been surprised by how much a doctor, hospital or medical facility charged them or their insurance compa-nies—64 percent—say they have tried to find price information before getting care. In contrast, only 38 percent of people who do not recall having been surprised by how much they or their insurance companies were charged have sought price information before getting care.
People with college degrees and women are more likely to have sought price information before getting care. But retired people are less likely to have done so.
While 56 percent of Americans overall have sought price information, we found 62 percent of those with college degrees have done so, as opposed to 54 percent of those without degrees. In addition, 59 percent of women versus 53 percent of men have sought price information. Moreover, while 62 percent of employed Americans have sought price information, the same can be said of only 55 percent of unemployed Americans and 40 percent of retired people.
Each of these differences remains statistically significant in analyses that examine them together and also take into consideration other demographic variables, such as income, age and race/ethnicity, as well as the size of insured people’s deductibles, whether or not people have been surprised by high bills and the extent of their insurance coverage in the past 12 months. These demographic differences also remain statistically significant when taking into account whether people have children under age 18 and whether they make medical decisions for adult family members.
We found no statistically significant differences in whether or not people have sought price information by income or race/ethnicity. Differences by age were no longer statistically significant when other demographic variables were taken into consider-ation, such as income, education, gender, race/ethnicity and employment status, as well as the size of insured people’s deductibles, whether or not they have been surprised by high bills and the extent of their insurance coverage in the past 12 months.
How are people trying to find price information?
The most common ways people try to find price information are by asking friends, relatives and colleagues, asking receptionists or other staff in doctors’ offices and either calling their insurance companies or looking on their insurance companies’ websites; see figure 4.
Although several for-profit companies, nonprofit organizations and state governments now provide price information online, only 17 percent of people who have sought price information report using websites run by companies or organizations other than their insurance companies; see figure 4. Only 26 percent of people who have used websites other than those of their insurance companies can remember those other websites’ names.
Only 17 percent of people who have sought price information report using websites run by companies or organizations other than their insurance companies

How Much Will It Cost? How Americans Use Prices In Health Care16
People are seeking price information from a variety of sources.
Figure 4: Percent who say they have tried to find price information before getting care, from the following sources:
The Internet, other than insurer’s website
A nurse
A hospital‘s billing department
A doctor
Their insurance company, by phone or web*
A receptionist or other doctor’s office staff
A friend, relative or colleague 50%
48%
46%
46%
34%
29%
17%
Base: Tried to find price information before getting medical care, n=1,164.
* Base: Tried to find price information before getting medical care and currently or ever insured, n=1,128.
Price information–seeker spotlight:
Gabrielle tried to find an orthopedic surgeon who would be cheaper than the providers covered in her network by looking online and calling a few providers’ offices. Gabrielle feels that talking to a real person on the phone is the best way to get the price information she wants. Ultimately, she determined she could not get a better deal going out of network.
– Insured with a deductible, in her 50s, African-American.
Price information–seeker spotlight:
Stuart’s father told him always to ask doctors, “What’s your price?” Stuart has gotten into the habit of asking, but he thinks many doctors are taken aback by his questions. Stuart said doctors are not used to people asking about money and behave like they do not have time to talk about prices. He told us, “I think every office should have somebody that can sit down and talk with you about money.”
– Insured with a deductible, in his 40s, white.

How Much Will It Cost? How Americans Use Prices In Health Care 17
One goal of this study was to determine whether there is a potential for more Ameri-cans to seek price information and use it to choose better-value care. Several of our findings suggest such a potential does, indeed, exist.
Most Americans do not believe more expensive care is necessarily of higher quality.
Many health policy experts believe Americans think higher-priced care is higher-quality care.19 This assumption that people equate cost with quality is viewed as a barrier to increasing the use of price information because it suggests they might be reluctant to choose less expensive care.
However, our research calls that assumption into question. We asked Americans about their views on the relationship between cost and quality, using four different ques-tions. We found consistently that most Americans do not think that higher priced care is necessarily higher quality. For example, when asked whether they think higher prices are typically a sign of better quality care or not, 71 percent said they do not think so. Similarly, 63 percent do not think lower prices are typically a sign of lower-quality care; see figure 5. These findings suggest Americans are less reluctant to choose lower-priced care than many experts expect.
Most Americans seem open to looking for better-value care.
• 71 percent of Americans say higher prices are not typically a sign of better-quality medical care.
• 69 percent say insurance companies should be required to make public how much they pay doctors for medical services.
• Even among those who have not ever tried to find out a price before getting care, 57 percent say they would like to know the prices of medical services in advance, and 43 percent would choose less expensive doctors if they knew the prices in advance.
19 Anna D. Sinaiko and Meredith B. Rosenthal, “Increased Price Transparency in Health Care—Challenges and Potential Effects,” New England Journal of Medicine 364, no. 10 (2011): 891–94; Pacific Business Group on Health, “PGBH Policy Brief: Price Transparency” (San Francisco, CA: Pacific Business Group on Health, 2013); Judith H. Hibbard, Jessica Greene, Shoshanna Sofaer, Kirsten Firminger and Judith Hirsh, “An Experiment Shows that a Well-Designed Report on Costs and Quality Can Help Consumers Choose High-Value Health Care,” Health Affairs 31, no. 3 (2012): 560–68.
2

How Much Will It Cost? How Americans Use Prices In Health Care18
Most Americans do not equate cost with quality in health care.
Figure 5: Percent who say yes, no, or don’t know to each of the following questions:
Would you say higher prices are typically a sign of better-quality medical care, or not?
If one doctor charged more than another doctor for the same service, would you think that the more expensive doctor is providing higher-quality care, or would you not think that?
Would you say lower prices are typically a sign of lower-quality medical care, or not?
If one doctor charged less than another doctor for the same service, would you think that the less expensive doctor is providing lower-quality care, or would you not think that?
71%
21%
8%
63%22%
14%
No Yes Don’t know
67%
23%
9%
58% 24%
16%
71%
21%
8%
63%22%
14%
No Yes Don’t know
67%
23%
9%
58% 24%
16%
71%
21%
8%
63%22%
14%
No Yes Don’t know
67%
23%
9%
58% 24%
16%
Base: Random half, n=1,008.
Base: Random half, n=1,002.
Numbers may not add up to 100 percent due to rounding and the less than one percent of respondents who refused the question and are not represented in the charts.
Base: Random half, n=1,002.
Base: Random half, n=1,008.

How Much Will It Cost? How Americans Use Prices In Health Care 19
Price information–seeker spotlight:
Martin has atrial fibrillation. Upon noticing a procedure to treat his condition would cost more in a hospital setting than in a doctor’s office, he started comparing providers’ prices. Martin said he has never felt like he has sacrificed quality when he has gotten lower-priced care. “I don’t lose any sleep going someplace else,” he told us.
– Insured with a deductible, in his 60s, white.
It is important to note that our findings differ somewhat from those of a survey of adult Americans conducted in 2014 by the Associated Press-NORC Center for Public Affairs Research (AP-NORC),20 which found Americans divided on whether quality and cost are related in health care. We believe the differences between our findings and AP-NORC’s can likely be attributed to differences in question wordings between the two surveys. The consistent pattern of our findings across our four different question wordings gives us confidence in the reliability of our results.21
Most Americans support increased price transparency.
Overall, Americans seem eager to know more about health care prices; 68 percent say not enough information is available about how much medical services cost. Further-more, 69 percent of Americans say insurance companies should be required to make public how much they pay doctors for medical services. Only 20 percent feel it is not reasonable to require insurance companies to make this information public. Similarly, the 2014 AP-NORC survey found 57 percent of adult Americans think requirements for doctors or other health care providers to report publicly how much they charge for services would improve the quality of care.22
20 Associated Press-NORC Center for Public Affairs Research, “Finding Quality Doctors: How Americans Evaluate Provider Quality in the United States” (Chicago, IL: AP-NORC, 2014).
21 AP-NORC asked two questions on this topic and got different patterns of response depending on how their questions were framed and worded. They asked half their sample, “When it comes to health care, does higher quality usually come at a higher cost, or is there no real relationship between the quality and cost of health care?” Forty-eight percent of respondents said higher quality comes at higher cost, 37 percent said there was no real relationship, 10 percent said they did not know, 4 percent said it depends and 1 percent answered neither.
AP-NORC asked the other half of their sample, “When it comes to health care, does lower quality health care usually come at a lower cost, or is there no real relationship between the quality and cost of health care?” With that wording of the question, 29 percent of respondents said lower quality comes at lower cost, 46 percent said there is no real relationship, 13 percent said they did not know, 8 percent said it depends, 2 percent said neither, 1 percent said both and 1 percent refused.
While our survey and AP-NORC’s differ in sample size, response rate and mode, these differences seem unlikely to explain the differences between our findings and theirs. Our sample size was 2,010, whereas AP-NORC’s was 1,002. AP-NORC’s response rate was 25 percent, whereas the response rate for our telephone sample was 17 percent. AP-NORC used only telephone probability sampling, while we combined telephone probability sampling with a nonprobability online panel and used propensity-score matching when we combined and weighted the samples. We found, however, that our online and telephone respondents were equally likely to equate costs with quality.
22 AP-NORC, “Finding Quality Doctors.”
69 percent of Americans say insurance companies should be required to make public how much they pay doctors for medical services
How Much Will It Cost? How Americans Use Prices In Health Care20
Even people who have not ever sought price information express an interest in doing so.
In this research, we found the majority—57 percent—of those who have not ever tried to find price information would actually like to know the prices of medical services before getting care.
In addition, 43 percent of those who have not ever tried to find price information say they would choose a less expensive doctor if they knew prices in advance. We heard this sentiment in our focus groups when we showed participants examples of some price information websites. John, an uninsured participant in our Iowa group, said, “Wait! There are sites like this that are open to the public?” He said if he could get this kind of information, “I’d show up to one of those expensive clinics” and tell the doctor, “‘It costs me $350 to walk in here. Why? Look, bro, you can’t be doing this. I’ve done my research.’”

How Much Will It Cost? How Americans Use Prices In Health Care 21
As noted above, 56 percent of Americans say they have tried to find out how much they would have to pay out of pocket—not including copays—before getting care or how much their insurers would have to pay doctors or hospitals. However, looking for price information does not necessarily mean comparing prices across multiple providers.
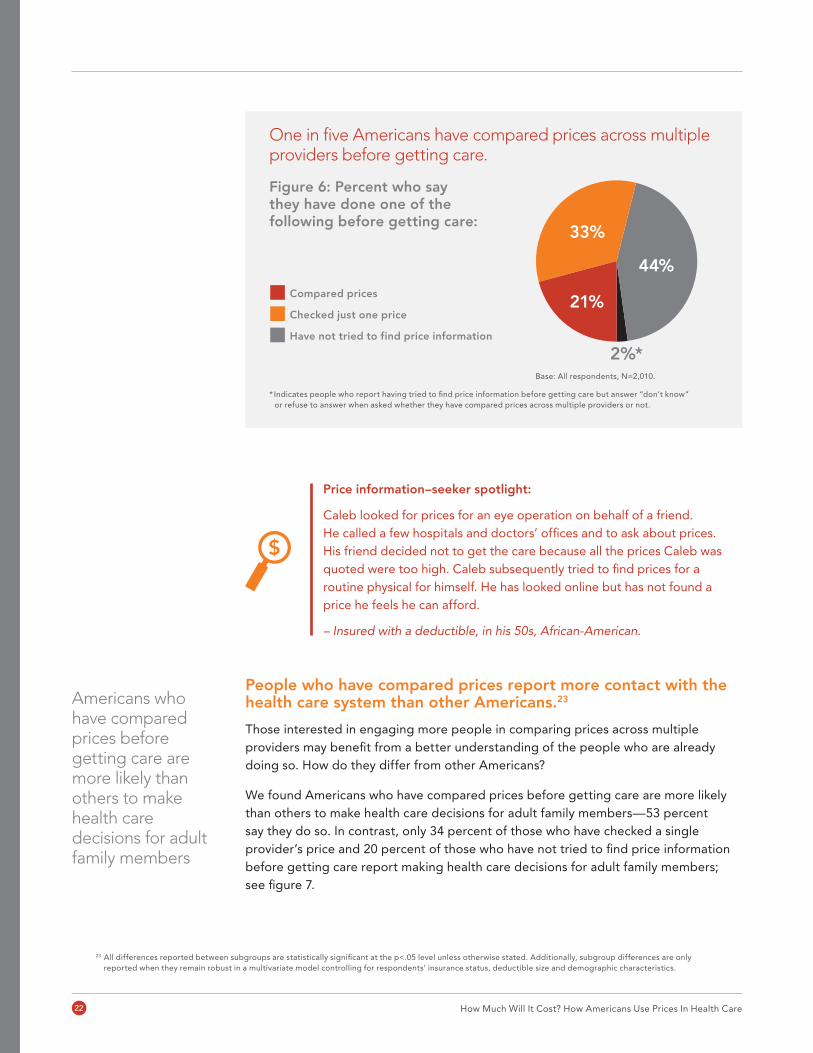
Overall, our survey finds that one in five Americans—21 percent—have attempted to compare prices across multiple providers before getting care. About one in three—33 percent—have tried to find out a single provider’s price but have not compared prices across providers; see figure 6.
Looking for price information does not necessarily mean comparing prices.
• About one in five Americans—21 percent—say that when trying to find price information before getting care, they have compared prices across multiple providers.
• 33 percent say that when trying to find price information before getting care, they have checked prices from just one provider.
• People who have compared prices across multiple providers are more likely to be making health care decisions for adult family members: 53 percent of those who have compared prices across providers make such decisions, compared with only 34 percent of those who have checked prices from just one provider.
• People who have compared prices across multiple providers are more likely to receive regular medical treatment: 42 percent of people who have compared prices before getting care receive regular medical treatment, compared with 33 percent of those who have not ever sought price information before getting care.
• Hispanics, African-Americans and younger people are more likely than other groups to have compared prices across multiple providers. Those with incomes over $100,000 are less likely than those with lower incomes to have compared prices.
3
How Much Will It Cost? How Americans Use Prices In Health Care22
Price information–seeker spotlight:
Caleb looked for prices for an eye operation on behalf of a friend. He called a few hospitals and doctors’ offices and to ask about prices. His friend decided not to get the care because all the prices Caleb was quoted were too high. Caleb subsequently tried to find prices for a routine physical for himself. He has looked online but has not found a price he feels he can afford.
– Insured with a deductible, in his 50s, African-American.
People who have compared prices report more contact with the health care system than other Americans.23
Those interested in engaging more people in comparing prices across multiple providers may benefit from a better understanding of the people who are already doing so. How do they differ from other Americans?
We found Americans who have compared prices before getting care are more likely than others to make health care decisions for adult family members—53 percent say they do so. In contrast, only 34 percent of those who have checked a single provider’s price and 20 percent of those who have not tried to find price information before getting care report making health care decisions for adult family members; see figure 7.
One in five Americans have compared prices across multiple providers before getting care.
Figure 6: Percent who say they have done one of the following before getting care:
Base: All respondents, N=2,010.
* Indicates people who report having tried to find price information before getting care but answer “don’t know” or refuse to answer when asked whether they have compared prices across multiple providers or not.
23 All differences reported between subgroups are statistically significant at the p<.05 level unless otherwise stated. Additionally, subgroup differences are only reported when they remain robust in a multivariate model controlling for respondents’ insurance status, deductible size and demographic characteristics.
Americans who have compared prices before getting care are more likely than others to make health care decisions for adult family members
44%
33%
21%
2%*
Have not tried to find price information
Checked just one price
Compared prices
44%
33%
21%
2%*
Have not tried to find price information
Checked just one price
Compared prices

How Much Will It Cost? How Americans Use Prices In Health Care 23
Those who have compared prices across providers are also more likely to receive regular medical treatment or make regular visits to doctors for chronic health problems. Of people who have compared prices before getting care, 42 percent receive regular treatment or regularly visit doctors for chronic health problems, compared with 33 percent of those who have not sought price information before getting care. Among those who have checked one provider’s price but have not compared prices across providers, 37 percent say they receive regular medical treatment—this percentage is not statistically different from either of the other two estimates, however; see figure 8.
People who have compared prices are more likely to make health care decisions for adult family members.
Figure 7: Percent who say they make health care decisions for an adult family member:
People who have compared prices are more likely to receive regular medical treatment.
Figure 8: Percent who say they are receiving regular medical treatment:
People who have not tried to find price information
People who have checked just one price
People who have compared prices 53%
34%
20%
People who have not tried to find price information
People who have checked just one price
People who have compared prices 42%
37%
33%
Base: All respondents, N=2,010.
All three group estimates are statistically different from one another at the p<.05 level.
Base: All respondents, N=2,010.
The largest and smallest group estimates are statistically different from each other at the p<.05 level but not from the middle group estimate.
How Much Will It Cost? How Americans Use Prices In Health Care24
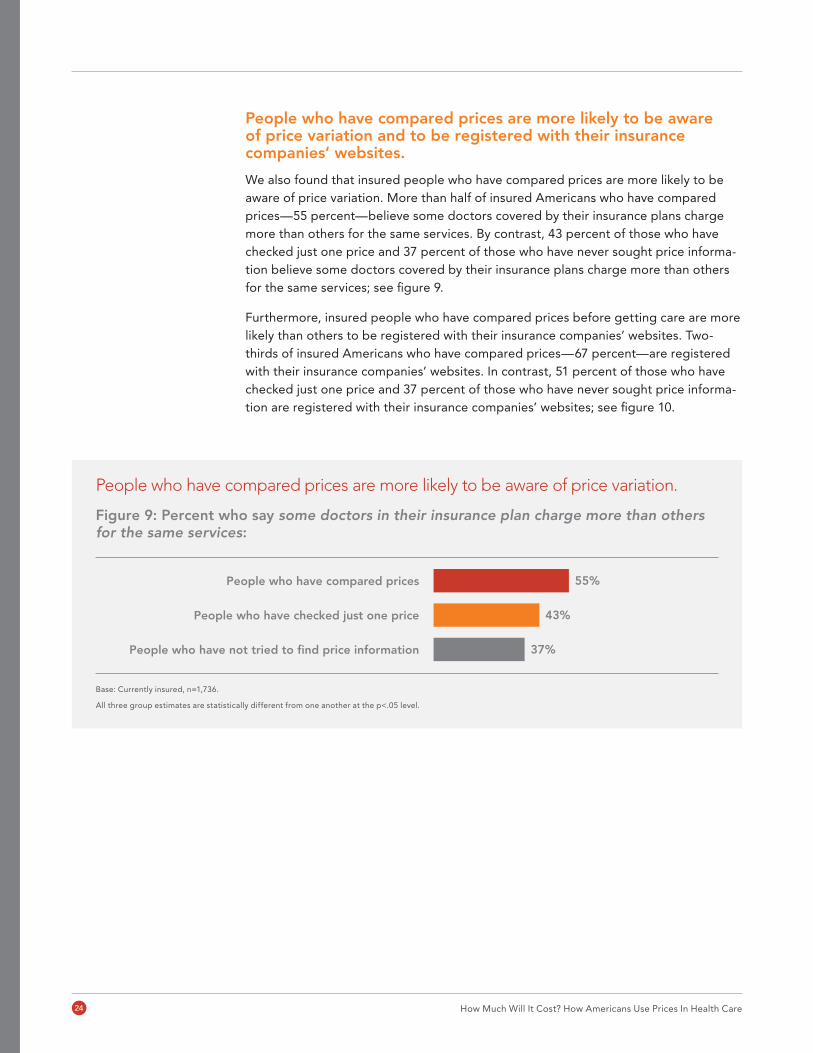
People who have compared prices are more likely to be aware of price variation and to be registered with their insurance companies’ websites.
We also found that insured people who have compared prices are more likely to be aware of price variation. More than half of insured Americans who have compared prices—55 percent—believe some doctors covered by their insurance plans charge more than others for the same services. By contrast, 43 percent of those who have checked just one price and 37 percent of those who have never sought price informa-tion believe some doctors covered by their insurance plans charge more than others for the same services; see figure 9.
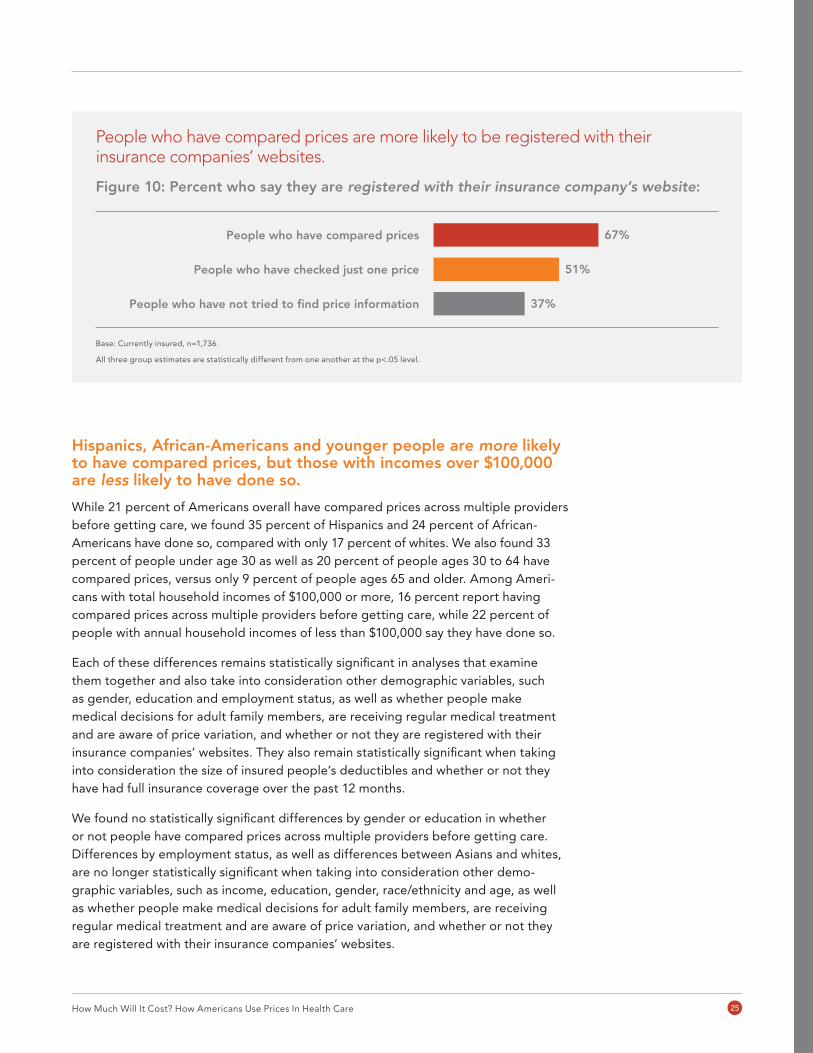
Furthermore, insured people who have compared prices before getting care are more likely than others to be registered with their insurance companies’ websites. Two-thirds of insured Americans who have compared prices—67 percent—are registered with their insurance companies’ websites. In contrast, 51 percent of those who have checked just one price and 37 percent of those who have never sought price informa-tion are registered with their insurance companies’ websites; see figure 10.
People who have compared prices are more likely to be aware of price variation.
Figure 9: Percent who say some doctors in their insurance plan charge more than others for the same services:
People who have not tried to find price information
People who have checked just one price
People who have compared prices 55%
43%
37%
Base: Currently insured, n=1,736.
All three group estimates are statistically different from one another at the p<.05 level.
How Much Will It Cost? How Americans Use Prices In Health Care 25
Hispanics, African-Americans and younger people are more likely to have compared prices, but those with incomes over $100,000 are less likely to have done so.
While 21 percent of Americans overall have compared prices across multiple providers before getting care, we found 35 percent of Hispanics and 24 percent of African-Americans have done so, compared with only 17 percent of whites. We also found 33 percent of people under age 30 as well as 20 percent of people ages 30 to 64 have compared prices, versus only 9 percent of people ages 65 and older. Among Ameri-cans with total household incomes of $100,000 or more, 16 percent report having compared prices across multiple providers before getting care, while 22 percent of people with annual household incomes of less than $100,000 say they have done so.
Each of these differences remains statistically significant in analyses that examine them together and also take into consideration other demographic variables, such as gender, education and employment status, as well as whether people make medical decisions for adult family members, are receiving regular medical treatment and are aware of price variation, and whether or not they are registered with their insurance companies’ websites. They also remain statistically significant when taking into consideration the size of insured people’s deductibles and whether or not they have had full insurance coverage over the past 12 months.
We found no statistically significant differences by gender or education in whether or not people have compared prices across multiple providers before getting care. Differences by employment status, as well as differences between Asians and whites, are no longer statistically significant when taking into consideration other demo-graphic variables, such as income, education, gender, race/ethnicity and age, as well as whether people make medical decisions for adult family members, are receiving regular medical treatment and are aware of price variation, and whether or not they are registered with their insurance companies’ websites.
People who have compared prices are more likely to be registered with their insurance companies’ websites.
Figure 10: Percent who say they are registered with their insurance company’s website:
People who have not tried to find price information
People who have checked just one price
People who have compared prices 67%
51%
37%
Base: Currently insured, n=1,736.
All three group estimates are statistically different from one another at the p<.05 level.
How Much Will It Cost? How Americans Use Prices In Health Care26
Possible reasons people may check but not compare prices
Those interested in engaging more people in comparing prices across multiple providers may want to understand why many are only checking a single provider’s price.
Our follow-up interviews with survey respondents who report having sought price information suggest some might check only one provider’s price because they are unwilling or unable to go to a different provider. They may live in rural areas with little choice among providers, or they may not want to disrupt their ongoing relationships with the doctors or hospitals they know and trust.
Price information–seeker spotlight:
Paul tried to find information about prices at his local hospital. But he told us he would never compare multiple providers’ prices because he would only consider going to that hospital, where he feels comfortable and is well-known. Paul said, “That’s where all my medical adventures have occurred. I wouldn’t even have considered any other place. All my records are there, all my doctors are there, I go there routinely for care.”
– Insured with deductible, in his 60s, white.
Price information–seeker spotlight:
Sofia lives in what she described as a geographically “remote” town with only a “mediocre” clinic. She also has a $3,000 insurance deductible. She wanted to know the price of a gynecological procedure, so she asked a nurse. The nurse did not know but called Sofia’s insurance company for her. Sofia learned that the procedure would cost her $1,500 out-of-pocket. She decided it was too expensive and postponed the procedure. She added, “Of course, I would not shop around like that for emergency care.”
– Insured with a deductible, in her 20s, Hispanic.
Price information-seeker spotlight:
Diane needed a nonemergency operation on her toe. But, “Quite frankly,” she said, “I had a terrible insurance plan with high out-of-pocket costs.” She explained that she needed to know how much the operation would cost her before she committed to having it done. When her surgeon’s office gave her the surgeon’s price, Diane decided not to have the operation at all. She did not compare other providers’ prices because she said the surgeon she had chosen was the only person in her rural area she trusted to do the procedure. Diane is a nurse, and she knows she will need the surgery eventually. But, for now, she is walking on an injured toe.
Currently uninsured, in her 40s, white.
How Much Will It Cost? How Americans Use Prices In Health Care 27
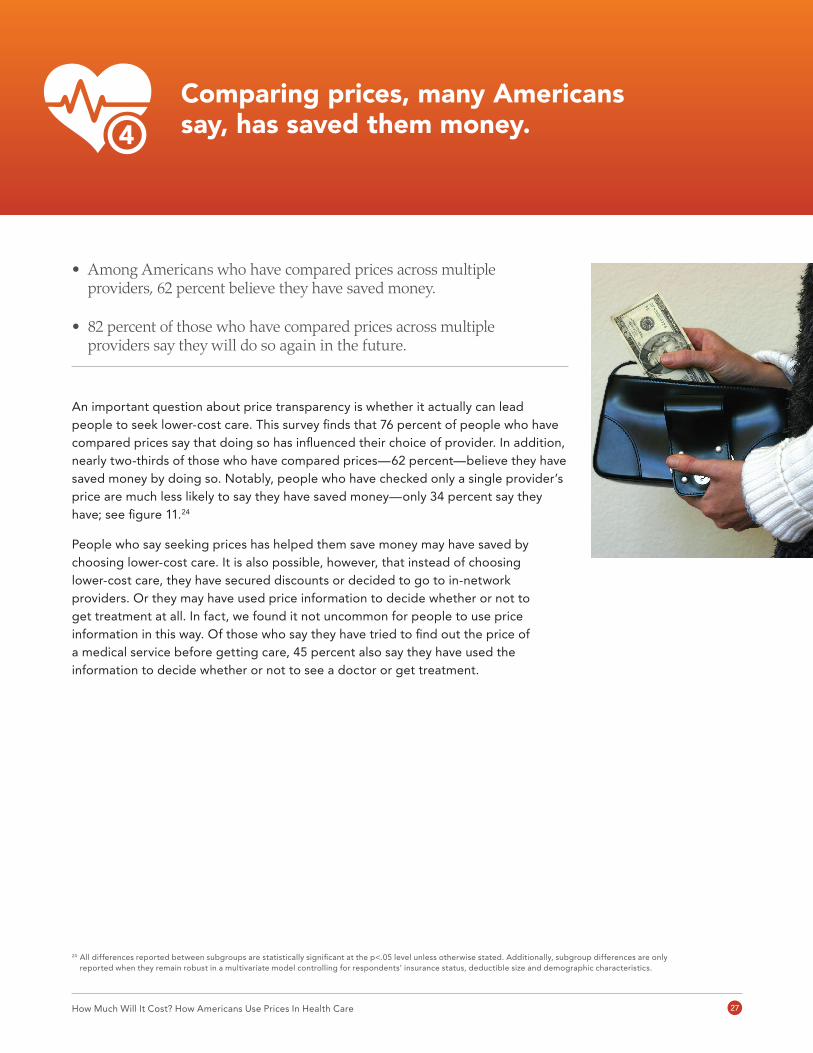
Comparing prices, many Americans say, has saved them money.
• Among Americans who have compared prices across multiple providers, 62 percent believe they have saved money.
• 82 percent of those who have compared prices across multiple providers say they will do so again in the future.
24 All differences reported between subgroups are statistically significant at the p<.05 level unless otherwise stated. Additionally, subgroup differences are only reported when they remain robust in a multivariate model controlling for respondents’ insurance status, deductible size and demographic characteristics.
An important question about price transparency is whether it actually can lead people to seek lower-cost care. This survey finds that 76 percent of people who have compared prices say that doing so has influenced their choice of provider. In addition, nearly two-thirds of those who have compared prices—62 percent—believe they have saved money by doing so. Notably, people who have checked only a single provider’s price are much less likely to say they have saved money—only 34 percent say they have; see figure 11.24
People who say seeking prices has helped them save money may have saved by choosing lower-cost care. It is also possible, however, that instead of choosing lower-cost care, they have secured discounts or decided to go to in-network providers. Or they may have used price information to decide whether or not to get treatment at all. In fact, we found it not uncommon for people to use price information in this way. Of those who say they have tried to find out the price of a medical service before getting care, 45 percent also say they have used the information to decide whether or not to see a doctor or get treatment.
4
How Much Will It Cost? How Americans Use Prices In Health Care28
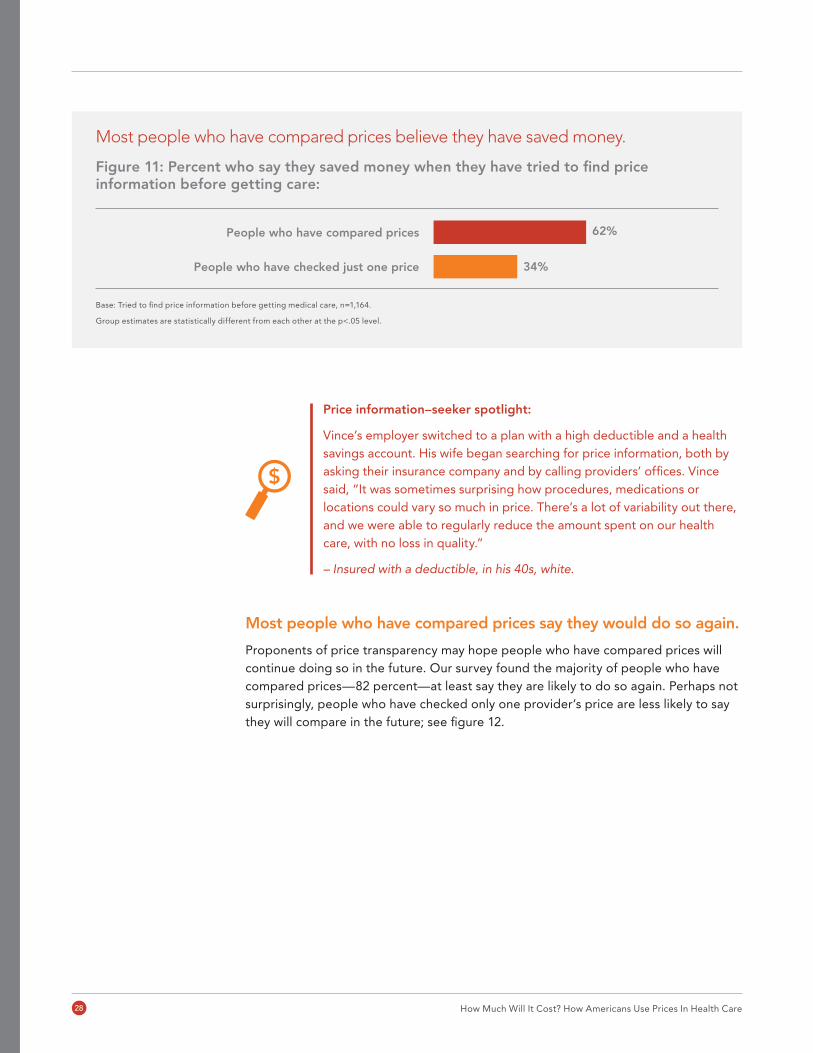
Most people who have compared prices believe they have saved money.
Figure 11: Percent who say they saved money when they have tried to find price information before getting care:
People who have checked just one price
People who have compared prices 62%
34%
Base: Tried to find price information before getting medical care, n=1,164.
Group estimates are statistically different from each other at the p<.05 level.
Price information–seeker spotlight:
Vince’s employer switched to a plan with a high deductible and a health savings account. His wife began searching for price information, both by asking their insurance company and by calling providers’ offices. Vince said, “It was sometimes surprising how procedures, medications or locations could vary so much in price. There’s a lot of variability out there, and we were able to regularly reduce the amount spent on our health care, with no loss in quality.”
– Insured with a deductible, in his 40s, white.
Most people who have compared prices say they would do so again.
Proponents of price transparency may hope people who have compared prices will continue doing so in the future. Our survey found the majority of people who have compared prices—82 percent—at least say they are likely to do so again. Perhaps not surprisingly, people who have checked only one provider’s price are less likely to say they will compare in the future; see figure 12.
How Much Will It Cost? How Americans Use Prices In Health Care 29
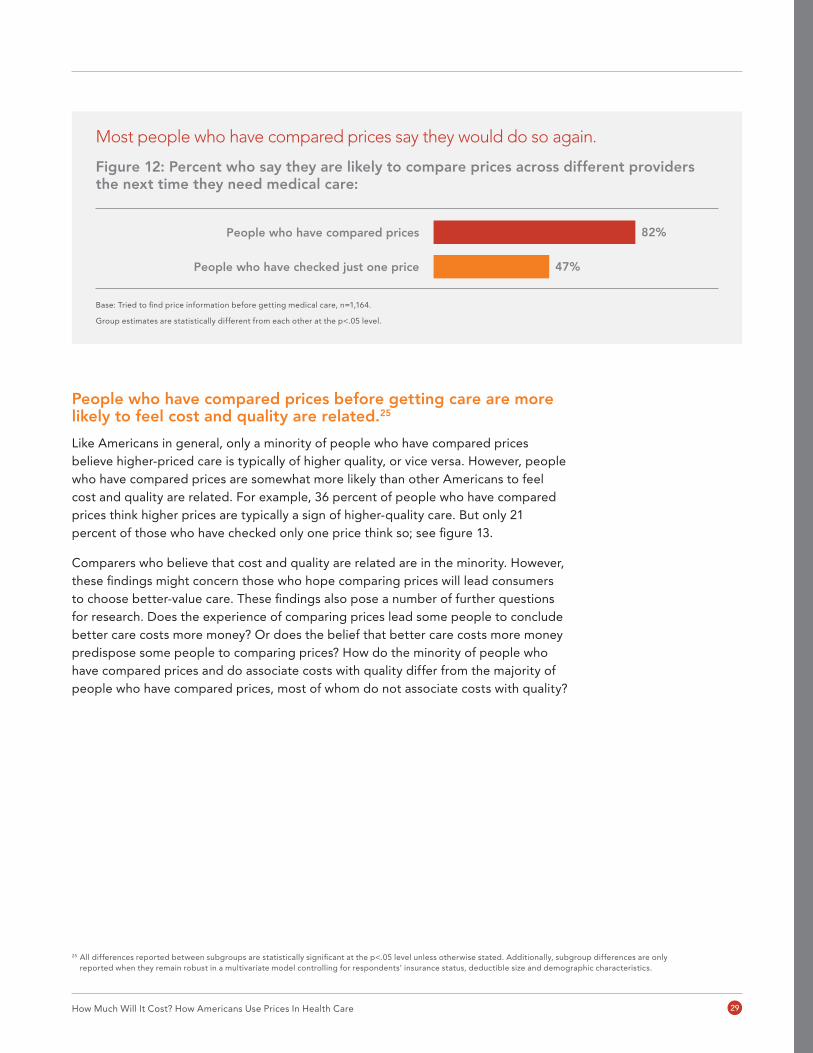
Most people who have compared prices say they would do so again.
Figure 12: Percent who say they are likely to compare prices across different providers the next time they need medical care:
People who have checked just one price
People who have compared prices 82%
47%
Base: Tried to find price information before getting medical care, n=1,164.
Group estimates are statistically different from each other at the p<.05 level.
People who have compared prices before getting care are more likely to feel cost and quality are related.25
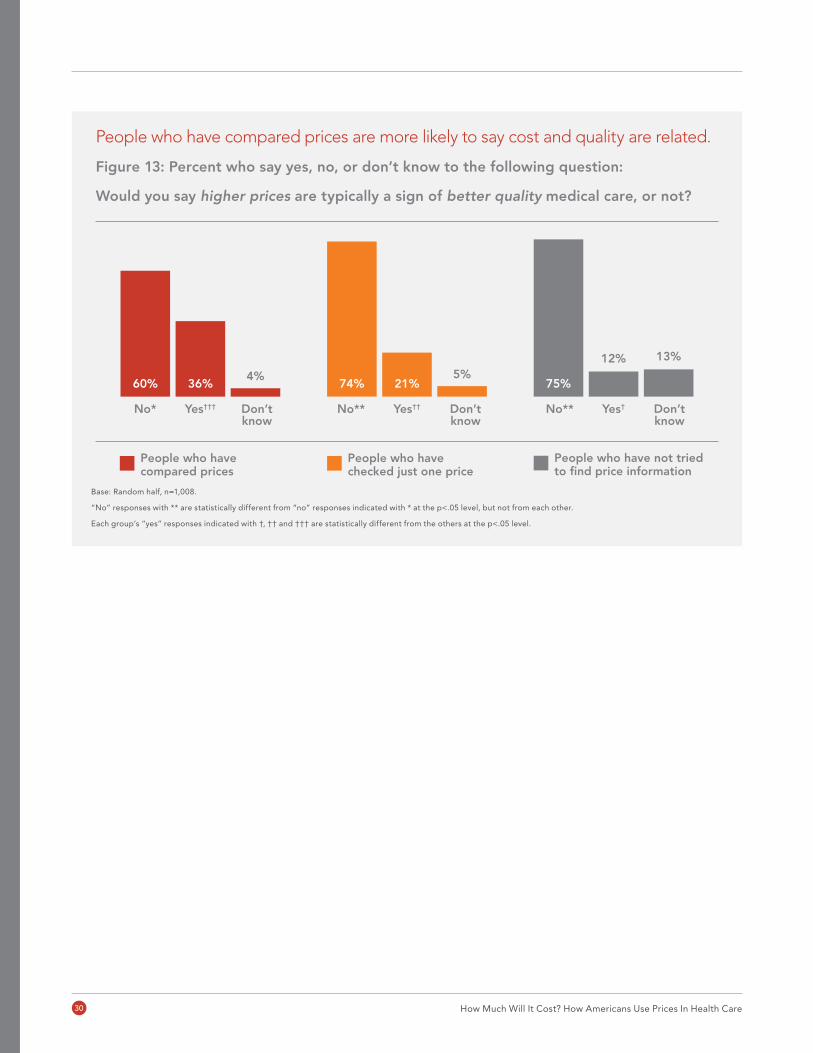
Like Americans in general, only a minority of people who have compared prices believe higher-priced care is typically of higher quality, or vice versa. However, people who have compared prices are somewhat more likely than other Americans to feel cost and quality are related. For example, 36 percent of people who have compared prices think higher prices are typically a sign of higher-quality care. But only 21 percent of those who have checked only one price think so; see figure 13.
Comparers who believe that cost and quality are related are in the minority. However, these findings might concern those who hope comparing prices will lead consumers to choose better-value care. These findings also pose a number of further questions for research. Does the experience of comparing prices lead some people to conclude better care costs more money? Or does the belief that better care costs more money predispose some people to comparing prices? How do the minority of people who have compared prices and do associate costs with quality differ from the majority of people who have compared prices, most of whom do not associate costs with quality?
25 All differences reported between subgroups are statistically significant at the p<.05 level unless otherwise stated. Additionally, subgroup differences are only reported when they remain robust in a multivariate model controlling for respondents’ insurance status, deductible size and demographic characteristics.
How Much Will It Cost? How Americans Use Prices In Health Care30
People who have compared prices are more likely to say cost and quality are related.
Figure 13: Percent who say yes, no, or don’t know to the following question:
Would you say higher prices are typically a sign of better quality medical care, or not?
People who havecompared prices
People who havechecked just one price
People who have not tried to find price information
Yes† Don’tknow
No**Yes†† Don’tknow
No**Yes†††No* Don’tknow
60% 36%4%
74% 21%5%
75%
12% 13%
No Yes Don’t know
People who have not triedto find price information
People who havechecked just one price
People who havecompared prices
60%* 36%††† 4%74%** 21%††
5%75%** 12%† 13%
Base: Random half, n=1,008.
“No” responses with ** are statistically different from “no” responses indicated with * at the p<.05 level, but not from each other.
Each group’s “yes” responses indicated with †, †† and ††† are statistically different from the others at the p<.05 level.
How Much Will It Cost? How Americans Use Prices In Health Care 31
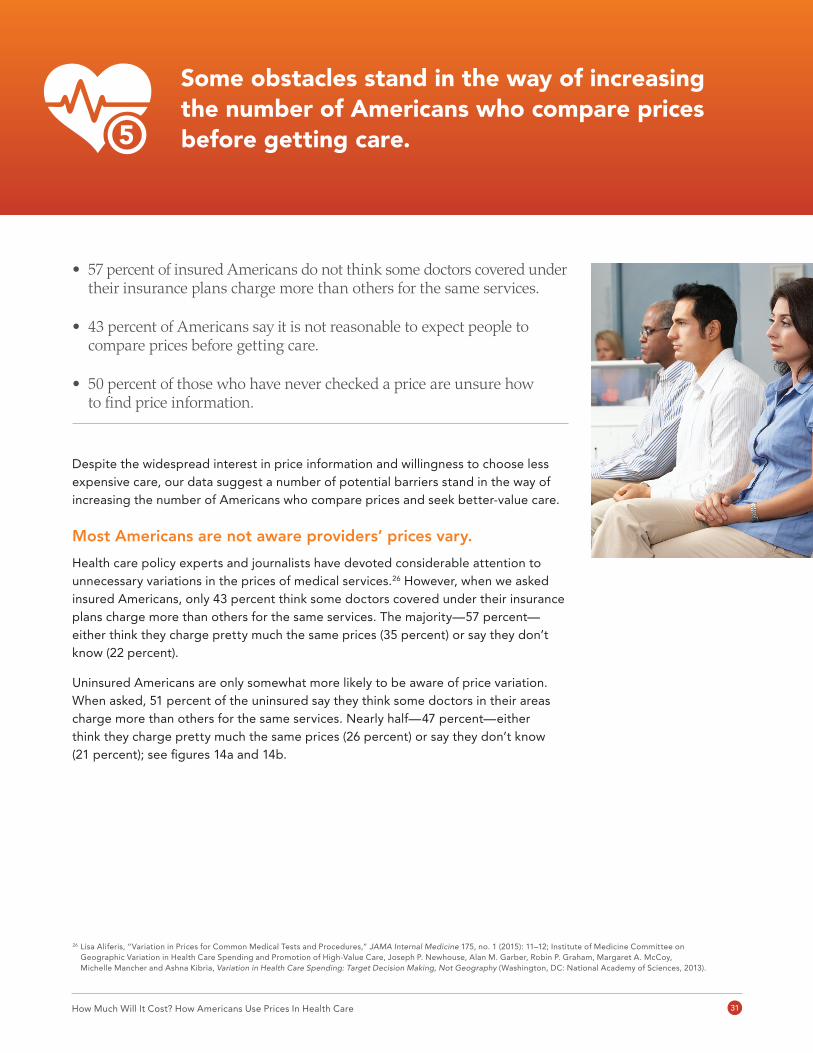
Some obstacles stand in the way of increasing the number of Americans who compare prices before getting care.
Despite the widespread interest in price information and willingness to choose less expensive care, our data suggest a number of potential barriers stand in the way of increasing the number of Americans who compare prices and seek better-value care.
Most Americans are not aware providers’ prices vary.
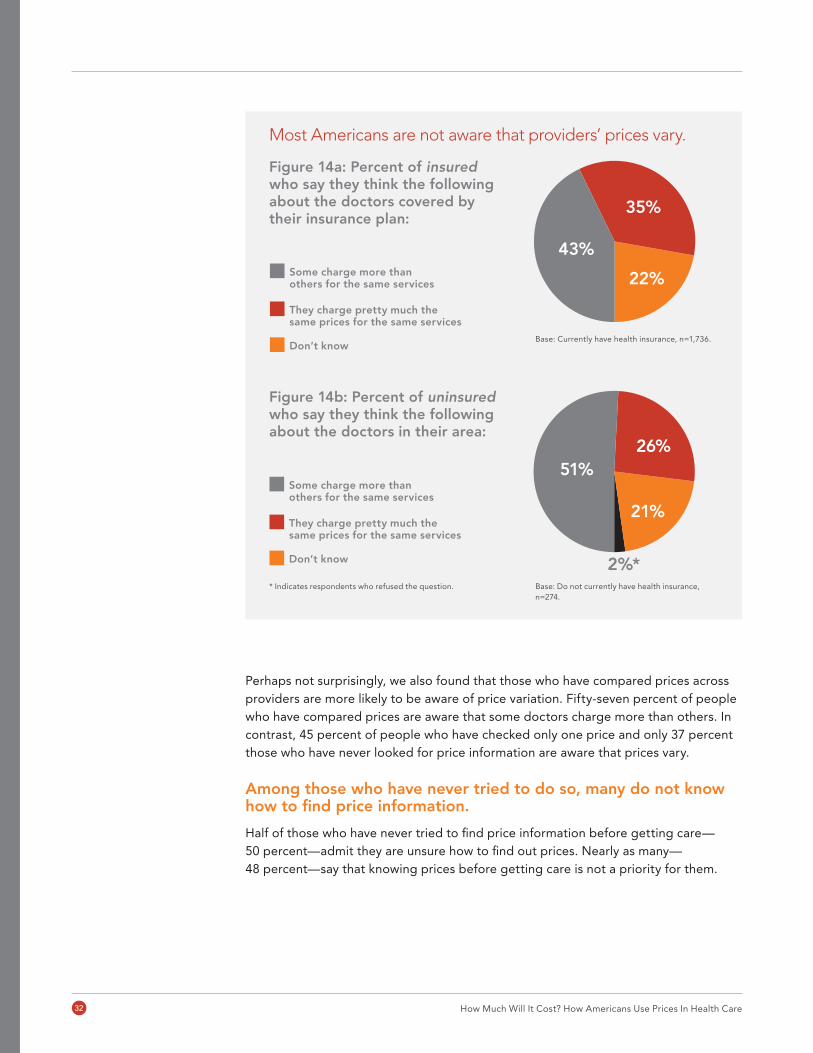
Health care policy experts and journalists have devoted considerable attention to unnecessary variations in the prices of medical services.26 However, when we asked insured Americans, only 43 percent think some doctors covered under their insurance plans charge more than others for the same services. The majority—57 percent—either think they charge pretty much the same prices (35 percent) or say they don’t know (22 percent).
Uninsured Americans are only somewhat more likely to be aware of price variation. When asked, 51 percent of the uninsured say they think some doctors in their areas charge more than others for the same services. Nearly half—47 percent—either think they charge pretty much the same prices (26 percent) or say they don’t know (21 percent); see figures 14a and 14b.
• 57 percent of insured Americans do not think some doctors covered under their insurance plans charge more than others for the same services.
• 43 percent of Americans say it is not reasonable to expect people to compare prices before getting care.
• 50 percent of those who have never checked a price are unsure how to find price information.
26 Lisa Aliferis, “Variation in Prices for Common Medical Tests and Procedures,” JAMA Internal Medicine 175, no. 1 (2015): 11–12; Institute of Medicine Committee on Geographic Variation in Health Care Spending and Promotion of High-Value Care, Joseph P. Newhouse, Alan M. Garber, Robin P. Graham, Margaret A. McCoy, Michelle Mancher and Ashna Kibria, Variation in Health Care Spending: Target Decision Making, Not Geography (Washington, DC: National Academy of Sciences, 2013).
5
How Much Will It Cost? How Americans Use Prices In Health Care32
Most Americans are not aware that providers’ prices vary.
Perhaps not surprisingly, we also found that those who have compared prices across providers are more likely to be aware of price variation. Fifty-seven percent of people who have compared prices are aware that some doctors charge more than others. In contrast, 45 percent of people who have checked only one price and only 37 percent those who have never looked for price information are aware that prices vary.
Among those who have never tried to do so, many do not know how to find price information.
Half of those who have never tried to find price information before getting care— 50 percent—admit they are unsure how to find out prices. Nearly as many— 48 percent—say that knowing prices before getting care is not a priority for them.
Figure 14a: Percent of insured who say they think the following about the doctors covered by their insurance plan:
Figure 14b: Percent of uninsured who say they think the following about the doctors in their area:
35%
22%
43%
They charge pretty much the same prices for the same services
Don’t know
Some charge more than others for the same services
They charge pretty much the same prices for the same services
Don’t know
Some charge more than others for the same services
26%
21%
51%
2%*
35%
22%
43%
They charge pretty much the same prices for the same services
Don’t know
Some charge more than others for the same services
They charge pretty much the same prices for the same services
Don’t know
Some charge more than others for the same services
26%
21%
51%
2%*
35%
22%
43%
They charge pretty much the same prices for the same services
Don’t know
Some charge more than others for the same services
They charge pretty much the same prices for the same services
Don’t know
Some charge more than others for the same services
26%
21%
51%
2%*
35%
22%
43%
They charge pretty much the same prices for the same services
Don’t know
Some charge more than others for the same services
They charge pretty much the same prices for the same services
Don’t know
Some charge more than others for the same services
26%
21%
51%
2%*
Base: Currently have health insurance, n=1,736.
Base: Do not currently have health insurance, n=274.
* Indicates respondents who refused the question.
How Much Will It Cost? How Americans Use Prices In Health Care 33
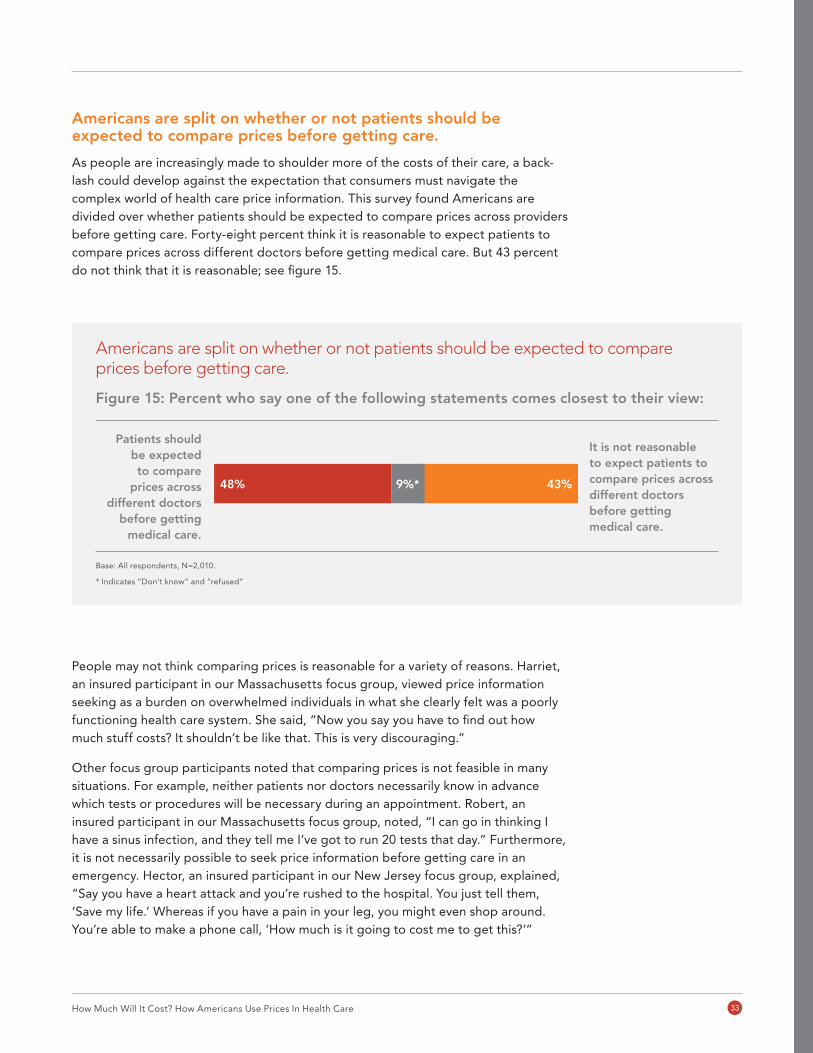
Americans are split on whether or not patients should be expected to compare prices before getting care.
As people are increasingly made to shoulder more of the costs of their care, a back-lash could develop against the expectation that consumers must navigate the complex world of health care price information. This survey found Americans are divided over whether patients should be expected to compare prices across providers before getting care. Forty-eight percent think it is reasonable to expect patients to compare prices across different doctors before getting medical care. But 43 percent do not think that it is reasonable; see figure 15.
People may not think comparing prices is reasonable for a variety of reasons. Harriet, an insured participant in our Massachusetts focus group, viewed price information seeking as a burden on overwhelmed individuals in what she clearly felt was a poorly functioning health care system. She said, “Now you say you have to find out how much stuff costs? It shouldn’t be like that. This is very discouraging.”
Other focus group participants noted that comparing prices is not feasible in many situations. For example, neither patients nor doctors necessarily know in advance which tests or procedures will be necessary during an appointment. Robert, an insured participant in our Massachusetts focus group, noted, “I can go in thinking I have a sinus infection, and they tell me I’ve got to run 20 tests that day.” Furthermore, it is not necessarily possible to seek price information before getting care in an emergency. Hector, an insured participant in our New Jersey focus group, explained, “Say you have a heart attack and you’re rushed to the hospital. You just tell them, ‘Save my life.’ Whereas if you have a pain in your leg, you might even shop around. You’re able to make a phone call, ‘How much is it going to cost me to get this?’”
Americans are split on whether or not patients should be expected to compare prices before getting care.
Figure 15: Percent who say one of the following statements comes closest to their view:
48% 43%9%*
Patients should be expected to compare
prices across different doctors
before getting medical care.
It is not reasonable to expect patients to compare prices across different doctors before getting medical care.
48% 43%
Patients should be expected to compare prices across different doctors before getting medical care.
It is not reasonable to expect patients to compare prices across different doctors before getting medical care.
Base: All respondents, N=2,010.
* Indicates “Don’t know” and “refused”
How Much Will It Cost? How Americans Use Prices In Health Care34
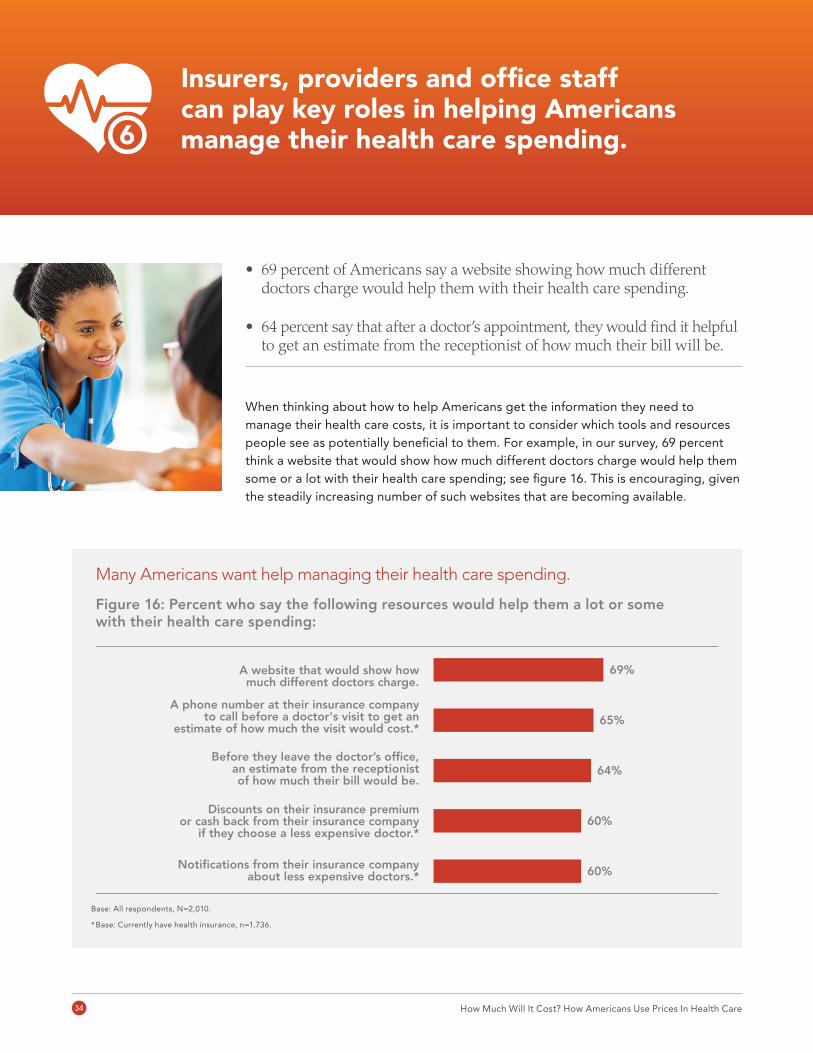
Insurers, providers and office staff can play key roles in helping Americans manage their health care spending.
• 69 percent of Americans say a website showing how much different doctors charge would help them with their health care spending.
• 64 percent say that after a doctor’s appointment, they would find it helpful to get an estimate from the receptionist of how much their bill will be.
When thinking about how to help Americans get the information they need to manage their health care costs, it is important to consider which tools and resources people see as potentially beneficial to them. For example, in our survey, 69 percent think a website that would show how much different doctors charge would help them some or a lot with their health care spending; see figure 16. This is encouraging, given the steadily increasing number of such websites that are becoming available.
Many Americans want help managing their health care spending.
Figure 16: Percent who say the following resources would help them a lot or some with their health care spending:
Notifications from their insurance companyabout less expensive doctors.*
Discounts on their insurance premiumor cash back from their insurance company
if they choose a less expensive doctor.*
Before they leave the doctor’s office,an estimate from the receptionistof how much their bill would be.
A phone number at their insurance companyto call before a doctor's visit to get an
estimate of how much the visit would cost.*
A website that would show howmuch different doctors charge.
69%
65%
64%
60%
60%
Base: All respondents, N=2,010.
* Base: Currently have health insurance, n=1,736.
6
How Much Will It Cost? How Americans Use Prices In Health Care 35
A unique role for office staff and doctors?
Doctors’ office staff and doctors themselves are among the sources people say they have turned to most when they have tried to find price information. Among those who have tried to find price information before getting care, 48 percent have asked receptionists or other doctor’s office staff, 46 percent have asked doctors and 29 percent have asked nurses; see figure 4, page 16. We also found 32 percent of Americans can remember doctors or members of their staff bringing up with them the price of procedures before doing or ordering them.
In addition, 64 percent of Americans say that after doctors’ appointments, they would find it helpful to get estimates from the receptionists of how much their bills will be; see figure 17.
Heather, a participant in our Massachusetts focus group with a $1,500 deductible, pointed out that her doctor’s office already has “a little cubicle” where someone hands her prescriptions and schedules her next appointment. Heather suggested that person could also tell her how much the appointment she just had was going to cost, “so that when you walk out of that doctor’s office, you know what you’re responsible for. I know that’s probably not possible. But it would be nice if there was somebody in the office that had access to your type of medical plan and knew how much it would cost when your insurance was billed.”
Price information–seeker spotlight:
Carla always tries to find out how much she has to pay out-of-pocket. She has never felt she has sacrificed quality and has always been pleased with the lower-priced care she has obtained for herself and her children. Carla feels strongly there is no reason doctors can’t know the prices of their more common procedures. She recalled a doctor who performed a major surgery on her son and explained everything to her about the procedure beforehand—including the price. If more doctors could be as informative as he was, Carla said, it would help people decide what care they need and to understand how the process works.
– Insured, no deductible, in her 40s, Hispanic.
In our focus groups, we also heard that people could imagine finding price information online and using it to spark conversations with their doctors. When we showed his focus group examples of some price information websites, James, an uninsured man in Iowa, said the information would be “just a starting point … not the be-all or end-all.” He maintained, “This is what can empower us with the knowledge of finding out.”
IMPLICATIONS
How Much Will It Cost? How Americans Use Prices In Health Care36

How Much Will It Cost? How Americans Use Prices In Health Care 37
Our findings indicate most Americans have already sought price information before getting care; that of the one in five who have not only sought price information but have compared prices across multiple providers, most believe they have saved money; and that more people want to know the prices of medical services in advance and are willing to choose less expensive providers.
Whether making prices more transparent can help curb health care costs in the aggregate is a question beyond the scope of the present research. Health care prices are largely determined by factors far removed from individual patients’ control, such as negotiations between hospital systems and insurers. Members of the public who seek lower-priced care could, however, become one of the factors that move policymakers, insurers, employers and providers toward more comprehensive action to address high prices and costs.
This report concludes with implications based on these findings for policymakers, insurers, employers and providers who are interested in pursuing price transpar-ency efforts that are informed by and responsive to the needs and perspectives of the American public.
• Strengthen the capacity of providers, staff and insurance company personnel to discuss prices: The finding that many Americans are already trying to get price information from receptionists and hospital staff, insurance companies, doctors, hospital billing departments and nurses suggests a need to strengthen these professionals’ capacity to provide and discuss price information.
• Help people understand that prices vary: Most Americans are not aware of price variation. This may keep them from comparing prices or looking for less expensive providers when they are quoted a price that they cannot afford. Policymakers, insurers, employers and providers may wish to consider how to help more people understand the types of care for which prices do and do not vary.
• Help people understand how to find price informa-tion: Most Americans who have not ever sought price information say they would like to know the prices of medical services in advance. Half of them, however, say they do not know how to find it. This suggests a need for more outreach and education about reliable sources of price information.
• Focus engagement efforts on people who care for others and those who receive regular medical care: Americans who have compared prices are more likely than others to be helping adult family members make health care decisions or receiving regular medical care themselves. Those making efforts to engage more people in comparing prices may wish to focus on these people, who may also be those most in need of savings on their out-of-pocket expenses.
• Recognize the challenges to engaging people in both seeking and comparing prices, and in choosing better-value care: Our follow-up interviews suggest that some people are comfortable with their current providers and do not want to switch even if they could save money, while some live in regions where they feel they have little choice of providers. Our follow-up interviews also suggest that some people feel that the prices they find are unaffordable.
How Much Will It Cost? How Americans Use Prices In Health Care38
METHODOLOGYSummary
The findings in “How Much Will It Cost?” are based on a nationally representative survey of 2,010 adults (ages 18+). Interviews were conducted from July 29 through August 21, 2014, across the 50 states and the District of Columbia, via telephone, including cell phones, and online. Respondents had the option to complete the survey in English or Spanish. The survey was designed by Public Agenda and fielded by Social Science Research Solutions Inc. (SSRS). The questionnaire, including full question wording, topline findings and sample demo-graphics can be found at http://www.publicagenda.org/media/how-much-will-it-cost-topline-methodology.
Public Agenda also conducted three pre-survey focus groups with demographically diverse groups of adults (ages 18+) and 30 semi-structured follow-up interviews with selected survey respondents.
This work was funded through a grant to Public Agenda from the Robert Wood Johnson Foundation.
The survey
The study used a multi-modal design. Data were collected via telephone interviews, including cell phone interviews, and online. A total of 2,010 interviews was completed with U.S. adults. Of these, 340 were completed via landline phone, 320 were completed on cell phones, and 1,350 were completed online.
Phone sample To collect data via telephone, this survey used an overlapping RDD (random digit dialing) dual-frame (landline and cell phone) design. The RDD landline sample was generated by SSRS’s sister company, Marketing Systems Group (MSG). The sample was generated no more than five business days before the commencement of data collection, which provided the most up-to-date sample possible by maximizing the number of valid telephone extensions. The RDD sample was prepared using MSG’s proprietary GENESYS IDplus procedure, which not only limits sample to non-zero banks, but also identifies and eliminates approximately 90 percent of all nonworking and business numbers and ported cell phones.
Nearly half the interviews for this study were completed with respondents reached by cell phone. As with the landline sample, MSG generated a list of cell phone telephone numbers in a random fashion. Nonworking numbers were removed using MSG’s CellWINS procedure.
The survey covered the 50 states and the District of Columbia.
Web sampleTo collect data online, this survey was administered through a nonprobability-based, opt-in web panel including residents of the 50 states and the District of Columbia and provided to SSRS by ResearchNow. All web respondents were asked to complete the entire survey immediately after completing the screening eligibility questions.
FieldingThe survey was designed to be compatible with web and phone interviews. Respondents to either could refuse to answer any question. Questions that allowed the telephone respondent to volunteer “don’t know” as a response included “don’t know” as an explicit response category in the web version.
Before the field period, the survey was programmed using CfMC computer-assisted telephone interviewing (CATI) software. The software was used to produce both a web and CATI version of the survey. SSRS and members of Public Agenda’s research team checked the programs extensively to ensure skip patterns followed the design of the questionnaire. In addition, both the phone and web versions of the questionnaire were translated into Spanish.
The fielding began with two live pretests of the survey. Pretest interviews were completed with eight respon-dents each time. Following the pretest, the wording of a few questions was modified slightly. A Public Agenda staff member listened in on each pretest, along with SSRS project managers.
How Much Will It Cost? How Americans Use Prices In Health Care 39
The field period for this survey was July 29 through August 21, 2014. Telephone interviewers received both written materials on the survey and formal training, detailed explanations of why questions were being asked, the meanings and pronunciations of key terms, pointers on potential obstacles to be overcome in getting good answers to questions and respondent problems that could be anticipated, as well as strategies for addressing the potential problems.
To maximize survey response, the following procedures were enacted:
• Six follow-up attempts were made on average to contact nonresponsive numbers.
• Each nonresponsive number was contacted multiple times, with a programmed differential call rule used to vary the times of day and the days of the week of the callbacks.
• Respondents were allowed to set the schedule for callbacks.
• Specially trained interviewers contacted households where the initial calls resulted in refusal to attempt to convert the refusals into completed interviews.
• Respondents could choose to be interviewed in English or Spanish.
The telephone response rate for this study was calcu-lated to be 16.9 percent using the American Association for Public Opinion Research RR3 formula and did not differ between landline and cell phone interviews.
Invitations to complete the web survey were sent directly to potential respondents by the web panel company. In addition, reminder invites were sent to non-responders to the web survey after a two day period of non-participation.
WeightingThe final data were weighted to correct for variance in the likelihood of selection for a given case and to balance the sample to known population parameters to correct for systematic under- or overrepresentation of meaningful social categories.
The weighting procedure involved the following steps:
First, a base weight was calculated for the telephone sample to correct (a) for the fact that in an overlapping dual-frame design, respondents whose households answer both landlines and cell phones have a higher likelihood of inclusion than those in cell phone–only or landline-only households and (b) for the fact that respondents in households with just one qualifying adult are more likely to be included than those in households with more than one qualifying adult.
Second, the telephone sample was weighted to census population targets utilizing the iterative proportional fitting (IPF) process—that is, “raking.” Parameter estimates for the adult population were drawn from the U.S. Census Bureau’s 2012 American Community Survey (ACS). Data were balanced to resemble the population distribution for adults along the following parameters: gender, age, education, ethnicity, phone status (that is, cell phone only, not cell phone only)27 and density of the population.28
Third, to combine the online sample with the telephone sample, a propensity weight was created that modeled the online sample against the telephone survey. To reduce variance, this procedure included converting the continuous propensity weight into a five-class weight. The final base weight for the online sample was calculated by multiplying the propensity weight by the regular base weight (derived from the telephone sample).
27 The levels of cell phone only and not cell phone only were based on projections from the most recent account in the CDC’s National Health Interview Survey (NHIS).
28 Population density is based on county-level population density (that is, total population divided by total land area in square miles). County is based on self-reported zip code, and counties are divided into density quintiles, where 1=lowest density and 5=highest density.
How Much Will It Cost? How Americans Use Prices In Health Care40
Fourth, post-stratification weighting was conducted on the entire sample with final base weight applied. Data were “raked” using the IPF process to resemble the population distribution for adults along the following parameters: gender, age, education, ethnicity, phone status and density of the population.29 Parameter estimates for the adult population were drawn from the U.S. Census Bureau’s 2012 ACS.
The design effect for this survey was 1.52 and the weight-adjusted margin of sampling error was +/–2.78 percentage points at the 95 percent confidence level. All differences reported between subgroups are statistically significant at the p<.05 level unless other-wise stated. Additionally, subgroup differences are only reported when they remain robust in a multivariate model controlling for respondents’ insurance status, deductible size and demographic characteristics.
As in all surveys, question order effects and other nonsampling sources of error can affect the results. Steps were taken to minimize these issues, including pretesting the survey instrument and randomizing order within question wordings as well as the order in which questions were asked.
Pre-survey focus groups
We conducted three focus groups with diverse Ameri-cans before developing the survey instrument. Focus groups were conducted in March 2014 in Secaucus, New Jersey, Woburn, Massachusetts, and Des Moines, Iowa. These states were chosen for their different policy approaches to health care price transparency, according to Catalyst for Payment Reform (CPR) in its 2013 Report Card on State Price Transparency Laws. CPR awarded Massachusetts an A, Iowa a C and New Jersey an F for price transparency in 2013. In total, 28 people partici-pated in these focus groups. Iowa participants were recruited who would all be without insurance at the time of the group discussion.
Follow-up phone interviews
After survey data collection was completed, we conducted 30 semi-structured phone interviews with survey respondents who said they had tried to find out prices before getting care and had agreed after they completed the survey to be called back for the follow-up interviews.
More information about this study can be obtained at http://www.publicagenda.org/pages/how-much- will-it-cost or by emailing [email protected].
29 Population density is based on county-level population density (that is, total population divided by total land area in square miles). County is based on self-reported zip code, and counties are divided into density quintiles, where 1=lowest density and 5=highest density.
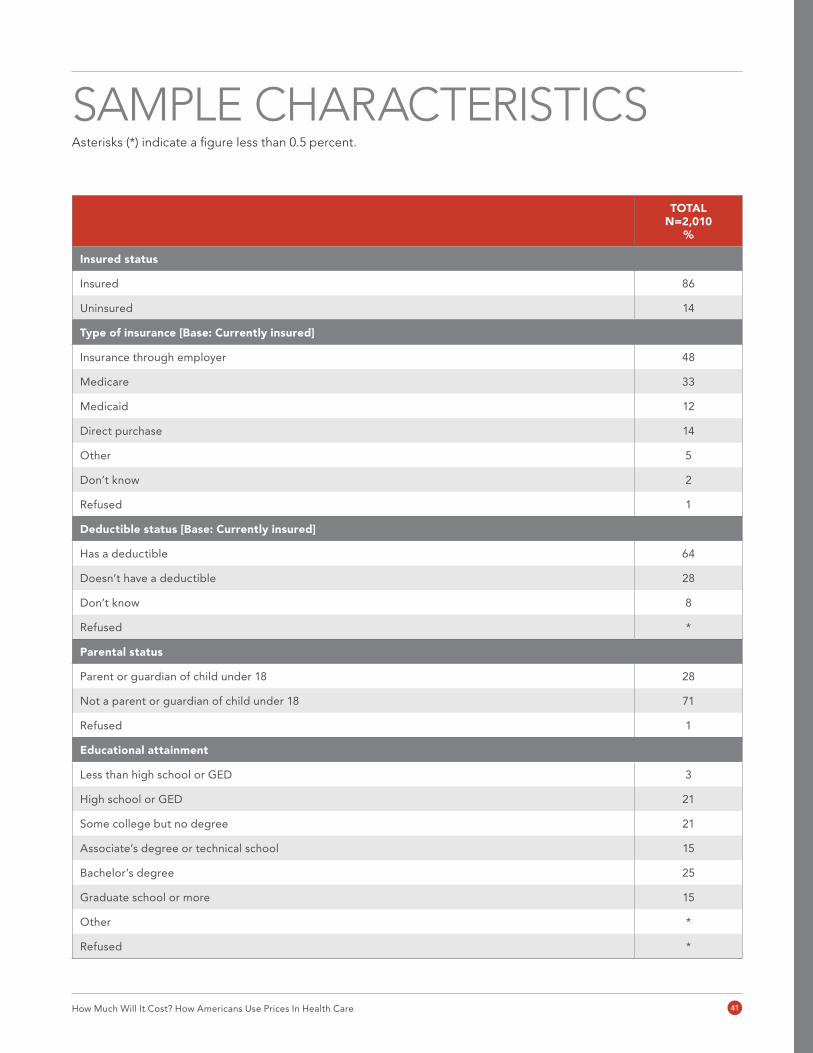
How Much Will It Cost? How Americans Use Prices In Health Care 41
TOTAL N=2,010
%
Insured status
Insured 86
Uninsured 14
Type of insurance [Base: Currently insured]
Insurance through employer 48
Medicare 33
Medicaid 12
Direct purchase 14
Other 5
Don’t know 2
Refused 1
Deductible status [Base: Currently insured]
Has a deductible 64
Doesn’t have a deductible 28
Don’t know 8
Refused *
Parental status
Parent or guardian of child under 18 28
Not a parent or guardian of child under 18 71
Refused 1
Educational attainment
Less than high school or GED 3
High school or GED 21
Some college but no degree 21
Associate’s degree or technical school 15
Bachelor’s degree 25
Graduate school or more 15
Other *
Refused *
SAMPLE CHARACTERISTICSAsterisks (*) indicate a figure less than 0.5 percent.
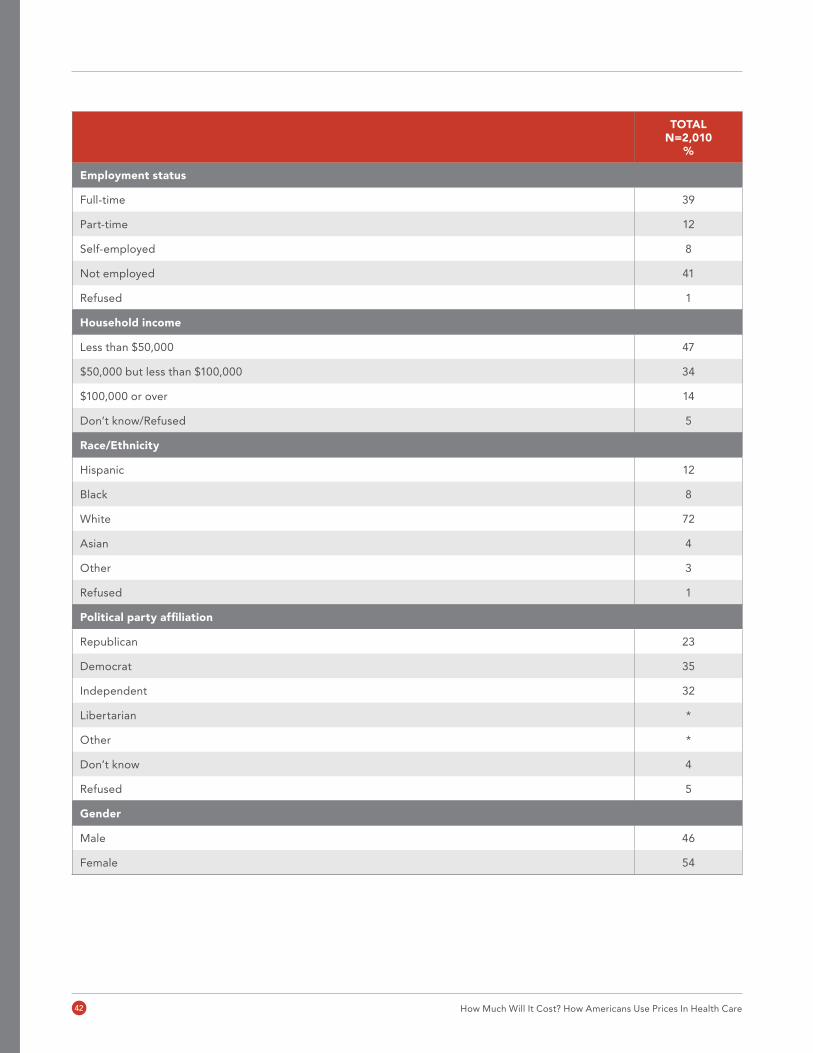
How Much Will It Cost? How Americans Use Prices In Health Care42
TOTAL N=2,010
%
Employment status
Full-time 39
Part-time 12
Self-employed 8
Not employed 41
Refused 1
Household income
Less than $50,000 47
$50,000 but less than $100,000 34
$100,000 or over 14
Don’t know/Refused 5
Race/Ethnicity
Hispanic 12
Black 8
White 72
Asian 4
Other 3
Refused 1
Political party affiliation
Republican 23
Democrat 35
Independent 32
Libertarian *
Other *
Don’t know 4
Refused 5
Gender
Male 46
Female 54
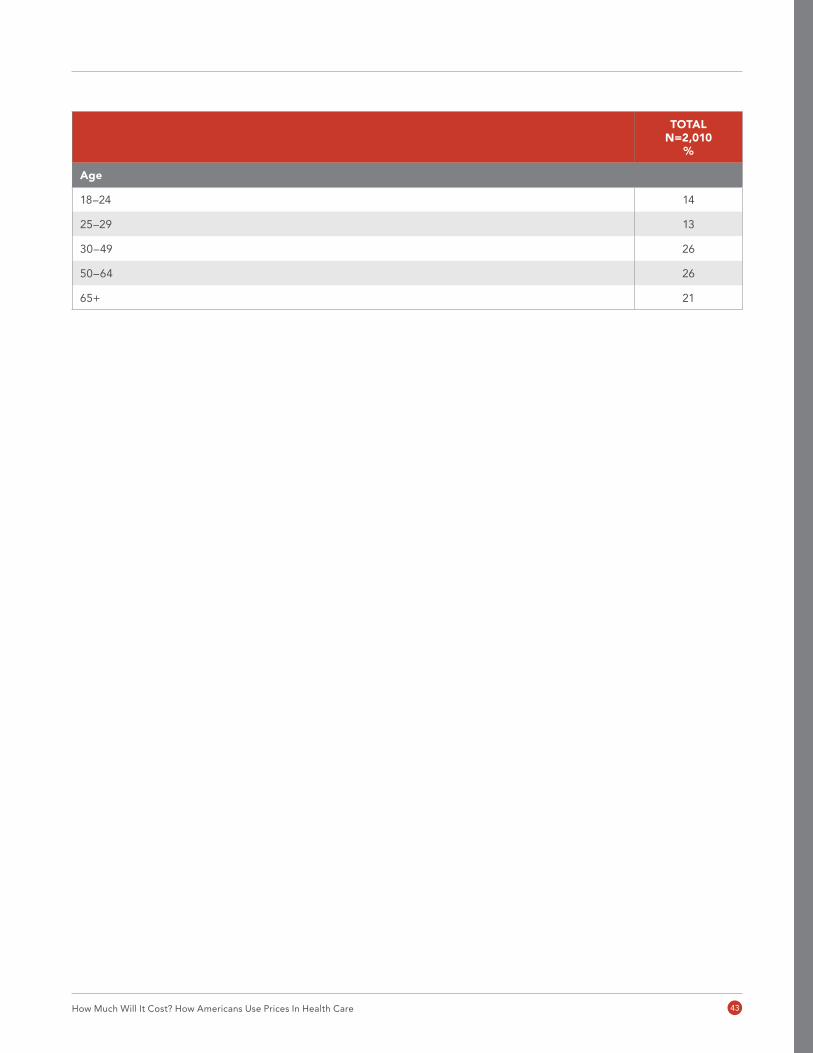
How Much Will It Cost? How Americans Use Prices In Health Care 43
TOTAL N=2,010
%
Age
18–24 14
25–29 13
30–49 26
50–64 26
65+ 21
How Much Will It Cost? How Americans Use Prices In Health Care44
Aliferis, Lisa. “Variation in Prices for Common Medical Tests and Procedures.” JAMA Internal Medicine 175, no. 1 (2015): 11–12.
Associated Press-NORC Center for Public Affairs Research. “Finding Quality Doctors: How Americans Evaluate Provider Quality in the United States.” Chicago, IL: AP-NORC, 2014.
Brill, Steven. ”Bitter Pill: Why Medical Bills Are Killing Us.” Time, March 4, 2013.
Catalyst for Payment Reform and Health Care Incentives Improvement Institute. “2014 Report Card on State Price Transparency Laws.” Oakland, CA: Catalyst for Payment Reform, 2014.
Claxton, Gary, Matthew Rae, Nirmita Panchal, Anthony Damico, Nathan Bostick, Kevin Kenward and Heidi Whitmore. “Employer Health Benefit 2014 Annual Survey.” Menlo Park, CA, and Chicago, IL: Henry J. Kaiser Family Foundation and Health Research and Educational Trust, 2014.
General Accounting Office. ”Health Care Price Transparency: Meaningful Price Information Is Difficult for Consumers to Obtain Prior to Receiving Care.” Washington, DC: General Accounting Office, 2011.
Hartman, Micah, Anne B. Martin, David Lassman, Aaron Catlin and the National Health Expenditure Accounts Team. ”National Health Spending in 2013: Growth Slows, Remains in Step with the Overall Economy.” Health Affairs 34, no. 1 (2015): 150–60.
HealthCare.gov Blog. ”6 Things to Know About Deductibles in the Health Insurance Marketplace.” U.S. Centers for Medicare & Medicaid Services. Baltimore, MD. January 28, 2014. https://www.healthcare.gov/blog/ 6-things-to-know-about-deductibles-in-the-health-insurance-marketplace/
Hibbard, Judith H., Jessica Greene, Shoshanna Sofaer, Kirsten Firminger and Judith Hirsh. ”An Experiment Shows that a Well-Designed Report on Costs and Quality Can Help Consumers Choose High-Value Health Care.” Health Affairs 31, no. 3 (2012): 560–68.
Institute of Medicine Committee on Geographic Variation in Health Care Spending and Promotion of High-Value Care, Joseph P. Newhouse, Alan M. Garber, Robin P. Graham, Margaret A. McCoy, Michelle Mancher and Ashna Kibria. Variation in Health Care Spending: Target Decision Making, Not Geography. Washington, DC: National Academy of Sciences, 2013.
Levy, Jenna. “In U.S., Uninsured Rate Sinks to 12.9%.” Princeton NJ: Gallup, 2015.
Massachusetts Law for Health Care Cost Reduction. “An Act Improving the Quality of Health Care and Reducing Costs Through Increased Transparency, Efficiency and Innovation.” 2012.
BIBLIOGRAPHY

How Much Will It Cost? How Americans Use Prices In Health Care 45
National Conference of State Legislatures. “Transparency and Disclosure of Health Costs and Provider Payments: State Actions.” Denver, CO: National Conference of State Legislatures, 2015.
Pacific Business Group on Health. ”PGBH Policy Brief: Price Transparency.” San Francisco, CA: Pacific Business Group on Health, 2013.
Robinson, James C., and Timothy T. Brown. ”Increases in Consumer Cost Sharing Redirect Patient Volumes and Reduce Hospital Prices for Orthopedic Surgery.” Health Affairs 32, no. 8 (2013): 1392–97.
Sinaiko, Anna D., and Meredith B. Rosenthal. ”Increased Price Transparency in Health Care—Challenges and Potential Effects.” New England Journal of Medicine 364, no. 10 (2011): 891–94.
UnitedHealthCare. ”A Comparison of myHealthcare Cost Estimator Users and Nonusers: Effect on Provider Choices.” Samira Kamrudin and Mona Shah. Minnetonka, MN. UnitedHealthCare, 2014.
Whaley, Christopher, Jennifer Schneider Chafen, Sophie Pinkard, Gabriella Kellerman, Dena Bravata, Robert Kocher and Neeraj Sood. “Association Between Availability of Health Service Prices and Payments for These Services.” JAMA 312, no. 16 (2014): 1670–76.
Wu, Sze-jung, Gosia Sylwestrzak, Christiane Shah and Andrea DeVries. “Price Transparency for MRIs Increased Use of Less Costly Providers and Triggered Provider Competition.” Health Affairs 33, no. 8 (2014): 1391–98.

How Much Will It Cost? How Americans Use Prices In Health Care46
RELATED PUBLICATIONSfrom Public Agenda
Curbing Health Care Costs: Are Citizens Ready to Wrestle with Tough Choices? Public Agenda and the Kettering Foundation
To inform policy and broaden the dialogue about controlling health care costs, Public Agenda, in partnership with the Kettering Foundation, conducted extended delibera-tive focus groups and in-depth follow-up interviews with Americans between the ages of 40 and 64. We sought answers to the following questions: What do Americans think about health care spending? In what ways, if any, do their initial thoughts and feelings change when they have the opportunity to deliberate over different approaches to controlling costs? Which changes to the health care system will people most readily accept, and which are likely to elicit resistance?
http://www.publicagenda.org/files/CurbingHealthCareCosts_PublicAgenda_2014.pdf
Citizens’ Solutions Guide: Health CarePublic Agenda
Public Agenda’s Citizens’ Solutions Guides series is a nonpartisan resource to help members of the public think through difficult policy issues, weighing values, priorities, pros, cons and tradeoffs. The Citizens’ Solutions Guide: Health Care arms voters with the knowledge they need to understand the challenges and choices Americans face about health care.
http://www.publicagenda.org/files/PublicAgenda_CitizensSolutionsGuide_Healthcare.pdf
Coping with the Cost of Health Care: How Do We Pay for What We Need? John Doble, Jared Bosk and Samantha DuPont Public Agenda and the Kettering Foundation
In 2008, the National Issues Forums, a nonpartisan, nationwide network of public forums for the consideration of public policy issues, facilitated deliberative forums with more than 1,000 citizens in 40 states and the District of Columbia to gain an understanding of how citizens can cope with the rising cost of health care. This report discusses the outcomes of those forums.
http://www.publicagenda.org/files/Coping-With-The-Cost-Of-Health-Care-2009.pdf
How Much Will It Cost? How Americans Use Prices In Health Care 47
The authors of “How Much Is It Going To Cost” would like to thank the following people for their support and contributions to the preparation of this report:
The expert interviewees whose insights informed this project throughout its development;
The participants in our survey, focus groups and follow-up interviews for taking the time to share their views and experiences with us;
Our funder, the Robert Wood Johnson Foundation;
Andrea Ducas and her colleagues at the Robert Wood Johnson Foundation and Bonnie J. Austin and Megan Collado at AcademyHealth for allowing us the opportunity to conduct this research, for their assistance throughout the process and for allowing us the freedom to explore the issues it touched upon without constraint or bias;
Social Science Research Solutions, Inc., which brought invaluable expertise to its fielding of the survey;
Christopher DiStasi, for his excellent background research and support in developing the survey;
Allison Rizzolo, Megan Donovan and Michael Rojas, Public Agenda’s communication team, for bringing our work to the attention of a broad audience;
Steve Schoenbaum, Kathryn Phillips, Jeffrey Rice and Lynn Quincy for giving valuable feedback on drafts of this report;
Senior fellow Jean Johnson, for her invaluable assistance and insight;
And Will Friedman, president of Public Agenda, for his vision, insight and guidance throughout this project.
ACKNOWLEDGMENTS
How Much Will It Cost? How Americans Use Prices In Health CareA
About Public Agenda Public Agenda is a nonprofit organization that helps diverse leaders and citizens navigate divisive, complex issues. Through nonpartisan research and engagement, it provides people with the insights and support they need to arrive at workable solutions on critical issues, regardless of their differences. Since 1975, Public Agenda has helped foster progress on K–12 and higher education reform, health care, federal and local budgets, energy and immigration.
Find Public Agenda online at PublicAgenda.org, on Facebook at facebook.com/PublicAgenda and on Twitter at @PublicAgenda.
For more information about this study, and to see full survey results, visit: http://www.publicagenda.org/media/how-much-will-it-cost-topline-methodology
Or contact: Carolin Hagelskamp at [email protected], tel: 212.686.6610.
About the Robert Wood Johnson Foundation For more than 40 years the Robert Wood Johnson Foundation has worked to improve health and health care. We are striving to build a national Culture of Health that will enable all to live longer, healthier lives now and for generations to come.
For more information, visit www.rwjf.org. Follow the Foundation on Twitter at www.rwjf.org/twitter or on Facebook at www.rwjf.org/facebook.