Recognition of symptoms, mitigating mechanisms and self-care ...
Upload
peacebuildingportalCategory
view
0download
0
Journal of Policy Modeling 36 (2014) 840–854
Available online at www.sciencedirect.com
ScienceDirect
How effective are countercyclical policy tools inmitigating the impact of financial and economic
crises in Africa?
Amarakoon Bandara ∗United Nations Development Programme, P.O. Box 9182, Dar es Salaam, Tanzania
Received 9 December 2013; received in revised form 24 May 2014; accepted 12 July 2014Available online 1 September 2014
Abstract
Using panel vector auto regression (PVAR) and GMM estimates we provide evidence for the transmissionof financial crises to African economies through foreign direct investments and exports. Although manycountries resort to stimulus packages to mitigate the impacts of financial crises, we find no evidence for fiscalpolicy to be considered an effective countercyclical policy tool in the African context. Monetary policy couldbe an effective tool in mitigating the impact in non-resource rich SSA countries, but not in others. Limitedpolicy space calls for African economies to reconsider their policies towards trade, investment, finance andmacroeconomic management.© 2014 Society for Policy Modeling. Published by Elsevier Inc. All rights reserved.
JEL classification: C23; E23; E53; E63
Keywords: Financial crisis; Transmission; Fiscal stimulus; Monetary policy
1. Introduction
The global financial and economic crisis of 2008 had a significant impact on African countries,although brief (IMF, 2009a). Economic growth of Sub-Saharan Africa (SSA) dropped to 2.6 percent in 2009 against an original estimate of 6.4 per cent in April 2008, a potential loss of almost
∗ Tel.: +255 786122655; fax: +255 222111168.E-mail address: [email protected]
http://dx.doi.org/10.1016/j.jpolmod.2014.08.0030161-8938/© 2014 Society for Policy Modeling. Published by Elsevier Inc. All rights reserved.
A. Bandara / Journal of Policy Modeling 36 (2014) 840–854 841
4 percentage points of gross domestic product (GDP) (IMF, 2008, 2010). The scale of the impactdiffered widely depending on the level of financial and economic integration with the rest of theworld. While countries such as Botswana, Chad, Gabon, Guinea, Madagascar, Namibia, Niger andSouth Africa experienced a contraction in real economic growth in 2009, there were others whoseeconomies showed resilience in the face of the financial crisis. Republic of Congo, Ethiopia,Malawi, Mozambique, Nigeria, Uganda, Tanzania, and Zambia for example, registered a growthof over 6 per cent although they indicated a slowdown (IMF, 2010). Economies of SSA grew onaverage by 5 per cent in 2010 (IMF, 2011) but it was below the 7 per cent growth recorded in 2007,prior to the onset of the crisis. The recovery, however, remains fragile as the global economy hasseen setbacks in financial stability and policies to foster internal and external rebalancing are notyet in place.
Several factors seem to have underscored the rather quick recovery. First, the weak integrationof African financial markets with global financial markets and the limited exposure of Africanfinancial markets to toxic assets in the crisis hit countries could have shielded the region fromthe crisis. Secondly, strong macroeconomic fundamentals through much of the region left it wellpositioned to benefit from a global recovery. Thirdly, the recovery was also supported by thecountercyclical measures adopted by governments enabled by a build-up of fiscal policy spaceprior to the downturn.
Does limited integration of African economies with global financial markets act as a beneficial‘buffer’ in times of a crisis? Or does it simply delay the inevitable effects? How effective arecountercyclical policy tools in the African context? What are the policy implications? And howbest could African countries respond to financial crises. These are the questions that the currentpaper intends to address. A key challenge for Africa is how to manage a crisis to ensure that itdoes not reverse the progress made in socio-economic development. As such, understanding thekey transmission channels of financial crises to African economies is vital in intervening in crisismitigation, prevention and recovery. While the analysis of transmission channels and the impactof financial crises is nothing new, our contribution to the body of knowledge on the subject comesfrom two counts: (i) we make a systematic assessment of the effectiveness of countercyclicalpolicy tools to mitigate the impact of the crisis on African economies and (ii) we investigate howuseful are financial flows in economic growth in the African context. We make these assessmentsfor three groups of countries, Africa, SSA and non-resource rich SSA countries to give a betterunderstanding of the diversity in transmission, impact and effectiveness of policy tools.
The rest of the paper is structured as follows: Section 2 provides theory and evidence onthe impact of the financial and economic crises with a focus on possible transmission channels.Section 3 describes the modelling framework used to assess the impact of the crisis on Africancountries. A brief discussion on estimation techniques and results are provided in Section 4.Section 5 briefly analyses policy implications. Section 6 concludes.
2. Transmission channels: theory and evidence
Markets around the globe have become increasingly inter-connected with one another,particularly with respect to cross border trade and financial flows. These cross-border linkageshave increased the likelihood of transmitting shocks in one country or region to another, andperhaps globally; the transmission becoming quicker and stronger as the integration intensifies.Several theories explain the transmission of a financial crisis from one country or region toanother. Most of these fall into two broader groups: those explaining fundamental causes andthose linked to investor behaviour. Common shocks such as a major shift in economic policy
842 A. Bandara / Journal of Policy Modeling 36 (2014) 840–854
in a major market player, and trade and financial linkages are among the main fundamentalcauses. Investor behaviour is attached mainly to liquidity issues, incentive problems, asymmetricinformation and issues relating to market coordination.
Trade and financial linkages feature heavily in open economy systems. Trade linkages, includ-ing linkages through direct trade and competitive devaluations, can transmit a crisis from onecountry to another as a crisis in one country can cause a reduction in income and a correspondingdecline in demand for imports.1 Currency devaluation in one country as a result of a crisis couldreduce the relative export competitiveness of other countries forcing them to adopt “competitivedevaluations” even if their fundamentals do not call for such devaluations.2 Larger currency depre-ciations than required by the initial deterioration in fundamentals through repeated competitivedevaluations can trigger a crisis through its links to debt service payments.
As evidenced during recent episodes, financial linkages have become an important channel oftransmission of a financial crisis in an increasingly integrated world. According to Dell’ Ariccia,Detragiache, and Rajan (2008), bank distress could contribute to a decline in credit. Markets alsotend to re-asses their risk exposure and make portfolio adjustments in the face of shocks.3 Theeffects of such market adjustments are stronger in emerging markets and developing countrieswith limited access to foreign finance (Krozner, Laeven, & Klingebiel, 2007). The increasingcomplexity of modern banking systems through their off-balance sheet vehicles and financialinstruments and their global reach have compounded regulation of financial systems, both homeand abroad, making the global economy more vulnerable to contagion effects. Financial inno-vation in the form of credit risk transfer through for example, credit default swaps (CDS) andsecuritization (assets backed securities) has allowed credit expansion through higher leverage ofthe entire financial system (Allen & Carletti, 2006; Shin, 2009). As evidenced during the recentfinancial crisis such practices could drive lending standards down enhancing financial systemfragility.
Portfolio readjustments due to incentive structures and changes in risk aversion could alsocontribute to crises as investors try to maintain their country/region “risk adjusted” portfolios andtrack their benchmarks. Fixed country portfolio weights and a large number of investors havingsimilar benchmarks could hasten such adjustments. An important theory relating to financial crisisand contagion is the theory of asymmetric information which leads to adverse selection and moralhazard. A central feature of asymmetric information is the difficulty in identification of risks andthe resulting credit rationing as demonstrated by Stiglitz and Weiss (1981) and Greenwald, Stiglitz,and Weiss (1984). Information asymmetry could also lead to herd behaviour as seen during theAsian financial crisis.
The recent global financial and economic crisis has impacted Africa through several channels,trade and financial flows being the main transmission channels.4 The lower global economicgrowth has reduced demand for African exports since the crisis started in mid 2007. The recession
1 For example, Hernández and Valdés (2001) find that the trade linkage is the most important transmission channelduring Thailand and Brazilian crises. Salvatore and Campano (2010) find similar channels in the Asian context. Salvatore(2010) discusses contagion effects through trade and financial linkages. Alfaro, Chanda, Kalemli-Ozcan, and Sayek (2004)highlight the increasing role of FDI in the global financial crises as multinational activities have proliferated in recentdecades.
2 For detailed discussions see Eichengreen, Rose, and Wyplosz (1996).3 For example, the signal sent to markets by allowing the bankruptcy of Lehman Brothers in 2008 forced markets to
re-assess risks previously overlooked leading to investor withdrawal from markets and drying up of liquidity.4 The literature also emphasizes trade and finance as the main channels of transmission of financial stress. See for
example, Eichengreen and Rose (1999), Forbes and Chinn (2004).
A. Bandara / Journal of Policy Modeling 36 (2014) 840–854 843
in the US and the EU in particular had a significant impact as Africa’s exports concentrate heavilyon these markets.5 The growth of Africa’s exports volume fell from 4.8 per cent in 2007 to −2.8per cent in 2008 and further to −10 per cent in 2009. Growth in the volume of exports by SSAcountries dropped similarly from 4.7 per cent in 2007 to −1.4 per cent in 2008 and −10.3 percent in 2009 (UNCTAD, 2009). Despite an initial improvement by 9.7 per cent in 2008 partly dueto high international prices of gold on the back of the heavy demand for gold as a safe heaven,terms of trade for SSA deteriorated by 12.4 per cent in 2009.6
Private investors appeared to have taken shelter in safe heavens, at least temporarily, movingaway from Africa, as they tend to minimize the risks by shifting their investments to more liquidand safer markets and assets. Net private capital flows to SSA fell by 10 per cent to US$ 27 billionin 2008 and further by 3 per cent to US$ 26 billion in 2009 due to an outflow of private portfolioinvestment. In 2008 SSA witnessed a net outflow of portfolio investments (US$ 19 billion) forthe first time since 2003 before recovering in 2009 (IMF, 2010). Private remittances to Africa,which registered a record growth in 2008, provided some buffer against capital outflows. Netofficial development assistance (ODA), excluding grants, remained resilient to global shocks.Donors appear to respect their ODA commitments in the medium term. However, whether ornot the flow of ODA to Africa remains robust depends heavily on to what extent and how longthe crisis would strain fiscal conditions in donor countries. In contrast, foreign direct investment(FDI) flows to SSA increased by 43 per cent to US$ 33 billion in 2008 but fell by 17 per cent in2009 as the pressure on investors remained high as indicated by postponements or suspension ofsome projects in several countries.7
Access to global financial markets by more financially developed countries in Africa has driedup since the crisis. For example, foreign capital mobilized through bond issues fell from US$ 13.2billion in 2007 to US$ 1.5 billion in 2008. Several new issues had to be cancelled or postponedsince the crisis. South Africa, the only emerging market economy in Africa, was the only countryto issue bonds in the international market in 2008 but with a substantially curtailed volume (US$1.5 billion in 2008 against US$ 9.8 billion in 2007) under the prevailing market conditions (IMF,2009b).
Although African banks do not seem to have direct exposure to distressed assets in banksin crisis affected countries, indirect effects seem to have an impact on them. Loan syndicationshave also dropped by 23 per cent to US$ 6.4 billion in 2008 with a sharp decline since the thirdquarter. Private remittances have been an important source of external finance for many countriesin Africa during the recent past. For example, total remittances flows to Africa amounted to $38billion in 2007 while its importance for SSA has increased substantially in recent years withthe total inflow growing from $4.6 billion in 2000 to $20 billion in 2008 (Ratha, Mohapatra, &Silwal, 2009). Although this accounts only for 2.5 per cent of GDP, it is equal to the amount theregion has received as ODA. With about 80 per cent of its remittances coming from advancedeconomies, delays in recovery in these economies could have an adverse impact on SSA countries.It is estimated that private remittances to SSA would drop by 8 per cent in 2009 and will recoveronly partially in 2010 (Ratha et al., 2009).
5 One third of Africa’s exports go to EU countries while another one-fourth goes to the USA. In 2008, advancedeconomies accounted for 62 per cent of SSA’s exports.
6 Several African countries, including Cote d’Ivoire, Egypt and South Africa also benefitted from this as indicated inhigher growth in gold exports in 2008.
7 See UNECA and ACU (2009) for details of projects cancelled due to the current financial crisis.
844 A. Bandara / Journal of Policy Modeling 36 (2014) 840–854
Historical evidence also suggests that financial and economic crises could affect Africa despiteits limited integration with global financial markets. Direct impact on the financial sectors maybe limited and the transmission of real sector shocks takes place with a lag. ODA to Africacontinued to drop from 1991 and did not recover until 2000. This sharp drop in ODA coincidedwith real estate and equity price bubbles burst in Scandinavia and Japan, and the crisis withthe European exchange rate mechanism (ERM) during 1991–1992. Foreign direct investments,short-term capital and exports seem to have suffered, albeit on a limited scale, during the LatinAmerican debt crisis in the early 1980s. While short-term capital flows started falling since theonset of the Asian and Russian crises in the late 1990s, ODA continued to drop until the criseswere over. Although FDI dropped somewhat, it recovered soon. Economic growth suffered in theaftermath of almost all crisis periods with serious welfare effects.8
3. The model
We start with the aggregate production function
Yt = AtKθt L
1−θt θ > 0 (1)
where Yt is output (GDP) at time t. Kt and Lt denote stock of capital and labour input, respectively.θis the share of capital in national output. At is total factor productivity (TFP) reflecting technicalchange and innovation. Taking natural logarithm of Eq. (1) we obtain:
yt = at + θkt + (1 − θ)lt (2)
where small size letters denote the log values of variables. Taking first difference of Eq. (2) weobtain:
yt − y(t−1) = at − a(t−1) + θ(kt − k(t−1)) + (1 − θ)(lt − l(t−1)) (3)
Following Blundell and MaCardy (1999) and Klevmarken (2004) and with some minor mod-ifications, we assume the labour function to have the following relationship:
lt = β0 + β1wt + β2yt + εt (4)
where wt is the log of hourly wage rate and εt a random error. In effect we assume the labour supplyto respond to hourly wage rate and national output. The wage rate is assumed to be composedof a fixed component (w0) and a variable component, the latter being determined by the rate ofinflation (�t). The relationship is given by:
wt = w0 + β3πt + ∈ t (5)
where εt is a random error term. Substituting (4) and (5) in (3) we have:
yt − γat − γθkt − γ(1 − θ)β1β3πt = yt−1 − γat−1 + γθkt−1 − γ(1 − θ)β1β3πt−1
+ γ(1 − θ)(β1( ∈ t − ∈ t−1) + εt − εt−1) (6)
where γ = (1 − (1 − θ)β2)−1.
8 See Barro (2009).
A. Bandara / Journal of Policy Modeling 36 (2014) 840–854 845
We assume that the capital stock is a function of domestic (or internal) capital (DC) and externalcapital, the latter comprising foreign direct investments (FDI), official development assistance(ODA) and short-term capital flows (STC) given by:
kt = kt(fdit, odat, stct, dct) (7)
Similarly and following Akinlo (2006) we assume TFP to be determined by human capital(Ht), macroeconomic stability, financial market development, and external sector developments.The evolution of institutions and policy frameworks over the years will also be captured by thesevariables. The function is given by:
at = at(ht, dist, deet, xt, tott) (8)
where DIS is the central bank discount (policy) rate and DEE is financial deepening, respectiveproxy variables for macroeconomic stability and financial market development. External sectordevelopments are represented by exports (X) and terms of trade (TOT).
We use growth rates (indicated by the pre-fix ‘GR’), instead of log values, for most of thevariables, to avoid loss of information due to the existence of negative numbers. Governmentconsumption expenditure (C) is used as a proxy for domestic capital. For inflation we use thepercentage change in consumer price index (CPI). Financial deepening, measured by broad moneyas a percentage of GDP, is used as a proxy for financial market development. For human capitalwe use primary school completion rates (EDU). A set of unbalanced panel data for 53 Africancountries covering the period 1970–2008 is used for the estimation.9 The data used for thisestimation are from the African Development Indicators of the World Bank except for the centralbank policy rate, which is from the International Financial Statistics of the International MonetaryFund.
With the above data transformation and rearranging Eq. (6) taken together with (7) and (8),and applying for all cross-sections will yield the following:
Yi,t = δidt +p∑
s=1
αi,sYi,t−s + ut
i = 1, 2, 3, . . ., N
i = 1, 2, 3, . . ., T
(9)
where the vector of interest for cross section i in period t is given by:
Yi,t = [GRGDPit, GRFDIit, GRODAit, GRSTCit, GRXit,
TOTit, GREDUit, GRCit, DEEit, CPIit, DISit] (10)
Note that we have included a deterministic component as well. δi and α are matrices ofcoefficients to be estimated and dt is an N×1 vector of ones. N is the number of cross sec-tions and T is the time. ut ∼ Normal(0, Ω) where the covariance matrix Ω = E(utu
′t). Eq. (9) also
represents a traditional fixed effects model.
9 For all countries in the sample the data range is 1970–2008 except for Angola (1985–2008), Cape Verde(1986–2008), Comoros, Djibouti, Guinea, Mozambique (1980–2008), Eritrea (1992–2008), Ethiopia (1976–2008),Namibia (1980–2007), Sao Tome and Principe (1979–2007), Somalia and Zimbabwe (1970–2007). It should be notedhowever, that there are still missing data within these respective data ranges.
846 A. Bandara / Journal of Policy Modeling 36 (2014) 840–854
As per the above analysis we expect the two main transmission channels of financial crises tobe financial flows and trade shocks. Transmission is stronger in emerging economies with well-developed financial markets and strong linkages to advanced economies. While macroeconomicstability provides some protection against financial stress, it also helps speedy recovery once thecrisis recedes. While countries with low fiscal deficits could use fiscal stimulus as a counter-cyclical measure, policy rates could be employed in those with limited fiscal space to stimulatetheir economies. Following the above discussion, we expect the signs of coefficients of GRFDI,GRODA, GRSTC, GRX, TOT, GREDU, GRC, and DEE to be positive while those of CPI andDIS to be negative.
We consider three hypotheses. The first hypothesis is that financial and economic crises willnot be transmitted through financial (FDI, ODA and short term capital flows) and trade (exportsand terms of trade) linkages. As discussed above, a crisis could trigger a credit crunch and are-assessment of investment risks with spillover effects on countries elsewhere. As such, financialcrises could result in a drop in financial flows to developing countries. On the other hand, slowdownin domestic demand in crisis hit countries could reduce demand for imported goods which couldin turn trigger a drop in terms of trade. The first hypothesis:
H1. αi,s = 0 for GRFDIit, GRODAi,t−s, GRSTCi,t−s, GRXi,t−s, TOTi,t−s separately for s = 1, . . .,q1, q1 ≤ p
If H1 is accepted, we can infer that the financial crisis will not be transmitted through thesefinancial and trade linkages to African economies.
The second hypothesis we consider is that countercyclical fiscal policies are not helpful in mit-igating the effects of financial and economic crises. Financial crises tend to slowdown globaldemand. One of the common policy instruments used to counter the effects of such globaleconomic slowdown at the national level is to adopt expansionary fiscal policies to create domes-tic demand. In the current exercise we use government consumption expenditure as the policyinstrument. The second hypothesis:
H2. αi,s = 0 for GRCi,t−s for s = 1, . . ., q2, q2 ≤ p
If H2 is accepted we can say that countercyclical fiscal policy is not effective in mitigating theimpact of the crisis.
The third hypothesis we consider is that countercyclical monetary policies could not stimulatedomestic economies in the face of financial and economic crises. The objective is to createdomestic demand through an increase in availability of credit by lowering policy rates. The thirdhypothesis:
H3. αi,s = 0 for DISi,t−s for s = 1, . . ., q3, q3 ≤ p
Here, if H3 is accepted we can conjecture that countercyclical monetary policy is not effectivein stimulating the economies in the face of financial crises.
We start with using a panel vector auto regression (PVAR) to estimate Eq. (9) with Yi,t givenby Eq. (10) to determine the transmission channels of financial crises to African countries, assesstheir impact on economic growth and policy options that are available to mitigate the impactsof a financial and economic crisis. A PVAR is considered for several reasons. VARs generallyhave little serial correlation in residuals and can be used to explain complex relationships amongvariable. VARs are also a parsimonious and useful means of summarizing time series “facts”. Theuse of a panel substantially increases the efficiency and power of the analysis as the degrees offreedom increases in a panel of several countries. This is particularly so for SSA countries where
A. Bandara / Journal of Policy Modeling 36 (2014) 840–854 847
availability of data is an issue. A panel approach also helps uncover common dynamic relationshipswhich might otherwise be obscured by idiosyncratic effects at the individual country level.
Questions have been raised on the appropriateness of standard techniques for estimating VARswith panel data as the pooling of data from different cross sections imposes the constraint that theunderlying structure is the same for each cross-sectional unit. The constraint that the time seriesrelationship of variables is the same for each cross-section is likely to be violated in practice andit is desirable to relax this restriction. According to Holtz-Eakin, Newey, and Rosen (1988), oneway to address this restriction is to allow for individual effects in Eq. (9). The resulting changesin the intercept of a stationary vector autoregression correspond to changes in the means of thevariables, allowing heterogeneity in the levels. A second approach proposed by them to accountfor individual heterogeneity is to allow the variance of the innovation in Eq. (9) to vary withthe cross section unit. After excluding the unidentified equations, they developed the followingmodel:
Yi,t = μidt +p+1∑
s=1
ρi,sYi,t−s + ϑt
i = 1, 2, 3, . . ., N
t = (p + 3), (p + 4), . . ., T
(11)
where the coefficients have similar interpretations as before. ρ is now a (p + 1) × 1 vector ofcoefficients.
An alternative approach was proposed by Cornwell, Schmidt, and Sickles (1990) to accountfor the unobserved heterogeneity in the data. In this model they allow the intercept to vary acrosscross sections. The model they used in Eq. (12) is similar to Eq. (9) in all respects except nowthe vector of individual specific effects dt contains in addition to a constant, a time trend and asquared time trend allowing individual effects to vary over time.10
Yi,t = δidt +p∑
s=0
αi,sYi,t−s + ut ; dt = (1, t, t2) (12)
In addition to the above approaches we also estimate the model after excluding the top/bottom10 per cent of the countries in the sample on the basis of the share of FDI as a percentage of GDP.
4. Estimation and results
One of the most recent criticisms of dynamic heterogeneous panel data estimation is that suchestimates could yield inconsistent and misleading results of short-term effects of shocks. Accord-ing to Pesaran and Smith (1995) the problem arises because when the regressors are seriallycorrelated, incorrectly ignoring coefficient heterogeneity induces serial correlation in the distur-bances. This generates inconsistent estimates in models with lagged dependent variables even asT → ∞. The bias of the estimator is likely to be serious when T is small. They recommendedusing the mean group (MG) estimator, which provided consistent estimates of the mean effectsby averaging the coefficients across countries. Pesaran, Shin, and Smith (1999) developed the
10 A similar methodology has been used by Hollingsworth and Wildman (2002) and Battes and Coelli (1995).
848 A. Bandara / Journal of Policy Modeling 36 (2014) 840–854
pooled mean group (PMG) estimator, which allows the intercepts, short-run coefficients and errorvariances to differ across groups, but constrains the long-run coefficients to be identical.11
It should be noted that Pesaran and Smith (1995) assume regressors to be I(1), the variablescointegrate, and coefficients are independent of regressors all of which are important for the results.In our estimation regressors are I(0), variables do not cointegrate and both T and N are relativelylarge. The fact that the sample used in the present paper has missing values makes it impossiblefor us to use the PMG estimator. As we show below, the variables we use for the estimation are notcointegrated, so there is no long run relationship (the reason for using VAR instead of VECM).The heterogeneity of the sample is confirmed by the white heteroskedasticity test indicating thatresidual variance for each cross-section differs freely across groups. Application of the model tothree different country groups (Africa, SSA and Non-Resource Rich SSA Countries) would alsostrengthen our arguments.
Nonetheless, to ensure consistency, we estimate Eqs. (9), (11) and (12) with the vector of interestgiven in Eq. (10) using both VAR and GMM (GMM results not reported). In GMM estimates weexperiment with fixed effects and also allow the error term to follow an autoregressive process.12
The estimates are carried out for all three groups of countries. Initial estimates of the model in Eq.(9) with all variables in (10) indicate the insufficiency of the number of observations. The VARis also not stable. We therefore drop the education variable (GREDU) from the vector of interestgiven in Eq. (10) as this is the least important variable in our estimation.13
Standard lag length criteria are used to determine the number of optimal lags in the VAR.While most of the criteria select one lag, LR test indicated a lag length of 2.14 In order to ensurethat we do not lose information by restricting the lag length; we performed a VAR lag exclusionWald test, which indicated that two lags are jointly significant for the system. Therefore, the VARis estimated with two lags (p = 2) for Eqs. (9) and (12) and with three lags (p = 3) for Eq. (11).15
We also carried out VAR validation tests. While the roots of the characteristic AR polynomialhad a modulus less than one indicating that the VAR is stationary, Granger Causality/Block Exo-geneity Wald test indicated that the endogenous variables could jointly be treated as exogenous.We therefore, carry out the estimation with all the variables treated as endogenous variables. Port-manteau Autocorrelation Test and the Autocorrelation LM Test indicated that the model is quitesuccessful as the residuals pass the white noise test. Normality test indicated that the residualsare not normal distributed. Panel unit root tests for all the variables except DEE rejected the nullof having unit roots by all tests. In the case of DEE, the null was rejected by the ADF test. KaoResidual cointegration test with lag selection fixed at one indicated that the variables are notcointegrated, allowing us to estimate a VAR instead of a vector error correction model (VECM).
Impulse response functions help determine the extent to which a shock that hits one variableaffects the other variables in the VAR system. We estimated the impulse response functions,accumulated responses and variance decomposition of GDP growth to one standard deviationinnovations in the variables of interest in the VAR system for Africa, SSA and Non-Resource
11 Among the other research on the subject include Canova and Ciccarelli (2009) who show how to conduct inferencein multi-country VAR models featuring short time series in a factor model.12 Random effects have no impact on the results, while we are constrained in allowing the error term to follow a moving
average process in panel GMM estimation.13 This is considering the fact that our main focus is on channels of transmission and policy instruments in mitigating
the crisis.14 Diagnostic and validation test results are not reported due to space limitations but available on request.15 We also carried out estimates with 4 lags, which indicated more or less similar results.
A. Bandara / Journal of Policy Modeling 36 (2014) 840–854 849
Rich Countries in SSA.16 Only the responses of the economic growth rate to innovations inselected variables are shown in Appendix 1. Results of GMM estimates of Eqs. (9), (11) and (12)are used for hypothesis testing.
We observe the following:
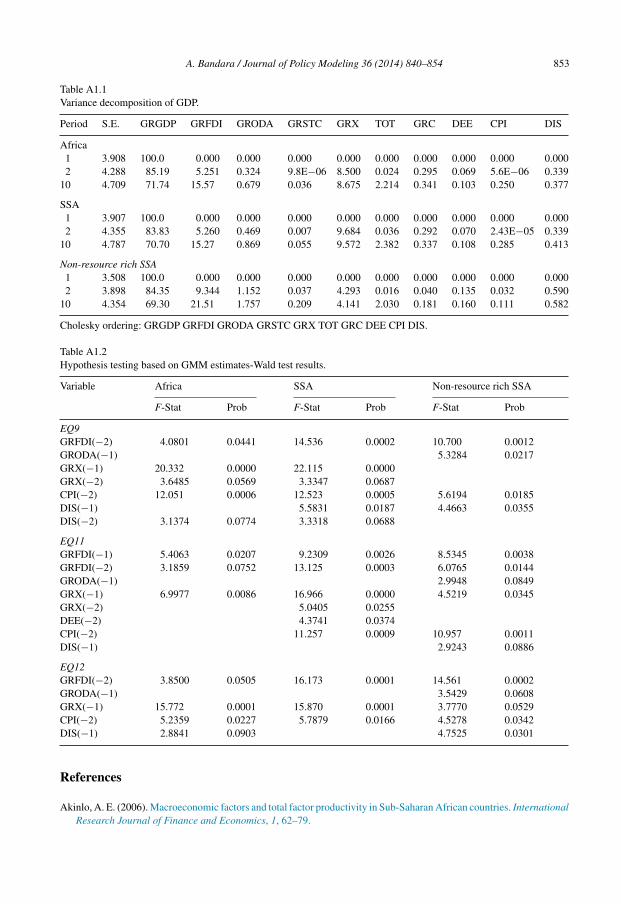
(i) Both VAR and GMM estimates indicate that positive shocks (increases) on the growth rate ofFDI and exports in Africa have statistically significant positive effects on economic growth.A similar impact of FDI is seen in SSA. In contrast, FDI seems to play a bigger role ineconomic growth in non-resource rich SSA countries with the impact lasting a little longer.Only in non-resource rich SSA countries economic growth is likely to be affected by ODA.With Wald test results for GMM estimates of models (9), (11) and (12) given in Appendix1, we reject the hypothesis that financial and economic crises do not have any impact onAfrican economies at conventional significance levels. Impact of financial crises could befelt through foreign direct investments and exports.
(ii) Government consumption expenditure does not seem to have any impact on growth underall estimations and for all regions.17 We fail to reject the hypothesis that fiscal policy is noteffective as a countercyclical policy at times of crisis.
(iii) A positive shock on the central bank policy rate has a negative impact on the economicgrowth rate under model (11) using VAR estimates. Similar results are found under models(9) and (12) with GMM estimates. Note however, that while we reject the hypothesis thatcountercyclical monetary policy is not effective in mitigating the impact of financial crisesin non-resource rich SSA countries under all model specifications, we fail to do so in thecase of other regions under all model specifications.
VAR estimates of model in Eq. (9) with top/bottom 10 per cent of countries excluded on thebasis of the share of FDI as percentage of GDP for Africa and SSA provided more or less similarresults in terms of sign, size and significance.18
The variance decomposition provides information on the relative importance of each innovationin affecting the variables in the VAR system. Estimated variance decomposition results for Africa,SSA and non-resource rich SSA countries given in Table A1.1 of Appendix 1. The economicgrowth in the past years appears to generate a momentum for itself to grow. For the Africa region,85 per cent of the variation of GDP due to innovations is caused by itself in the short run. Growthin exports contributes to 8 per cent of the variation in GDP growth, while FDI accounts for 5 percent. The contribution of the growth in FDI to GDP growth increases over time, the share risingto 15 per cent as its own contribution drops to 72 per cent. While the impact of exports remains
16 The non-resource rich countries are defined as those whose primary commodity rents exceed 10 per cent of GDP. SeeIMF (2010) for a list of countries in this group.17 Estimations with government consumption replaced by total government expenditure and government capital expen-
diture provided similar results except that in the latter estimation the sign of the coefficient becomes positive as expectedalthough smaller and less significant. Estimates with budget deficit (before grants) in place of government consumptionwere not significant.18 We excluded Cape Verde, Democratic Republic of Congo, Libya, Senegal, Somalia (having the lowest average share
of FDI as a percentage of GDP during the sample period), Eritrea, the Gambia, Lesotho, Sao Tome and Principe andSeychelles (having the highest average share of FDI as a percentage of GDP) from Africa. Same list of countries exceptLibya and Somalia (which are not in SSA) were excluded from the SSA countries. The results are not reported but availableon request.
850 A. Bandara / Journal of Policy Modeling 36 (2014) 840–854
stable at 8 per cent, the variation caused by improvements in terms of trade increases from almostzero to 2 per cent in the long run. The VAR system for SSA countries provides similar results.
However, results for non-resource rich countries differ quite substantially from Africa andSSA. While its own effects explain 84 per cent of the variation of GDP growth due to innovationsin the short run, FDI growth accounts for 9 per cent. The variation caused by exports is only 4per cent. The long run contribution of the growth of FDI to GDP growth increases to 21 per centas GDP growth’s own account reduces to 69 per cent indicting an increasing impact of FDI oneconomic growth in these countries.
5. Policy implications
Important inferences can be drawn from the above results, in particular in assessing the impactof external shocks due to crises such as the current global financial and economic crisis on theeconomies of Africa. The above results indicate that there are two main channels of transmis-sion of external shocks to African countries: FDI and exports. Limited financial integration withmajor markets alone would not provide a buffer against shocks of financial crises to Africa.Lag effects indicate that it only delays the inevitable. African countries need to further diver-sify its exports from major markets such as the EU and the USA. While there has been somere-orientation of its exports in recent years to emerging markets, particularly in Asia, intra-regional exports remain low. This is an area that African countries need to expand. Primarycommodities still constitute the bulk of African exports. Value addition to its products couldenable them to cater to regional demand reducing the need to rely on major markets for itsexports.
The transmission channel through foreign direct investments could be somewhat mitigated ifAfrican economies become attractive investment destinations. Also important is having efficientdomestic policies and institutions to induce investors to retain their investments. Policy consistencyand transparency as well as ease of doing business are key factors for attracting and retaininginvestments. Yet, policy inconsistencies and high cost of doing business in most African countriesmake them less attractive in a competitive market. Another consideration could be to develop thedomestic entrepreneurship. Domestic private sector in most countries in Africa is under-developedplaying a secondary role in the economy. This could be reversed to provide a strong basis forgrowth and prevent sudden capital reversals in times of a crisis. Joint ventures and partnershipswith regional investors are other alternatives that could well serve Africa and withstand crisisspillovers.
The fact that main policy instruments (fiscal policy and central bank policy rate) that aregenerally considered to be effective in stimulating economies at times of negative shocks arenot helpful in the context of African economies would impose pressure on them to reconsidertheir policies towards finance and macroeconomic management. Such policy ineffectivenesswould deteriorate fiscal positions and thereby debt stock. While many countries in Africa haveundertaken financial sector reforms much needs to be done to make the financial systems moreefficient and responsive. On the fiscal side, improving public sector efficiency and effectivenessthrough strengthening fiscal institutions, public financial management, building capacities andgovernance would be critical to reinforcing the effectiveness of fiscal policy. Public sector cor-ruption is a major constraint to development in Africa as scarce resources are misallocated. Assimilar effects could be expected at times of stimulus, effective targeting, prioritization of keyexpenditures such as infrastructure that could also serve long term development objectives, and
A. Bandara / Journal of Policy Modeling 36 (2014) 840–854 851
improving transparency and accountability would be essential in improving the efficiency of fiscalpolicies.
On the other hand, the underdeveloped financial markets are the primary reason for monetarypolicy being less effective as an instrument in stimulating Africa economies. Informal marketsdominate most African economies. Shallow and poorly integrated financial markets, low levelof intermediation, risk induced involuntary excess liquidity, and an interest inelastic demand forcredit are common features in most financial markets in Africa. In such circumstances marginalchanges to policy rates have little impact on credit demand and as a result monetary policybecomes an ineffective instrument in cushioning exogenous shocks. Development of financialsector is thus essential for strengthening policy efficacy. Improving the institutional frameworkfor financial intermediation, access to bank credit, auditing and accounting standards and strength-ening frameworks for governing the enforceability of claims are important elements of financialsector development.
6. Conclusion
The paper uses panel VAR and GMM estimates to identify the transmission channels of finan-cial and economic crises and their impact on African countries. The study finds that financialcrises will have significant impacts on African economies. Cross-border linkages, particularlythrough international trade and financial flows appear to play important roles in the transmissionof financial crises from the rest of the world to African countries. The scale of the impact varieswidely depending on the level of financial and economic integration with major markets as wellas their importance in their economies. The main transmission channels through which the impactof financial crises will be felt on African economies are FDI and exports. The most vulnerablewould be non-resource rich SSA countries as their dependency on FDI for economic growth islarge.
African economies appear to have limited policy space in responding to financial and economiccrises, as counter cyclical fiscal and monetary policies that are usually used in other countries,would be ineffective in stimulating African economies. Only non-resource rich SSA countriesseem to be able use monetary policy as an effective tool to mitigate the effects of financial crises.The findings of the paper provide important insights for African countries to reconsider theirdevelopment policy, particularly in areas such as trade, investment, finance and macroeconomicmanagement.
Acknowledgements
The views expressed in the paper are those of the author and do not necessarily reflect thoseof the UNDP. Any remaining errors and omissions are the responsibility of the author. Theauthor wishes to thank the editor, anonymous referees and participants at the CSAE Conferenceon Economic Development in Africa held at Catherine’s College, Oxford University on 20–22March 2011 for their useful comments.
Appendix 1. Impulse response functions and variance decomposition
See Fig. A1 and Tables A1.1 and A1.2.

852 A. Bandara / Journal of Policy Modeling 36 (2014) 840–854
-0.5
0.0
0.5
1.0
1.5
2.0
1 2 3 4 5 6 7 8 9 10
Response of GRGDP to GRFDI
-0.5
0.0
0.5
1.0
1.5
2.0
1 2 3 4 5 6 7 8 9 10
Response of GRGDP to GRX
-0.5
0.0
0.5
1.0
1.5
2.0
1 2 3 4 5 6 7 8 9 10
Response of GRGDP to GRC
-0.5
0.0
0.5
1.0
1.5
2.0
1 2 3 4 5 6 7 8 9 10
Response of GRGDP to DIS
Response to Cholesky One S.D. Innovations ± 2S.E.
-0.5
0.0
0.5
1.0
1.5
2.0
1 2 3 4 5 6 7 8 9 10
Response of GRGDP to GRFDI
-0.5
0.0
0.5
1.0
1.5
2.0
1 2 3 4 5 6 7 8 9 10
Response of GRGDP to GRX
-0.5
0.0
0.5
1.0
1.5
2.0
1 2 3 4 5 6 7 8 9 10
Response of GRGDP to GRC
-0.5
0.0
0.5
1.0
1.5
2.0
1 2 3 4 5 6 7 8 9 10
Response of GRGDP to DIS
Response to Cholesky One S.D. Innovations ± 2S.E.
-1
0
1
2
3
1 2 3 4 5 6 7 8 9 10
Response of GRGDP to GRFDI
-1
0
1
2
3
1 2 3 4 5 6 7 8 9 10
Response of GRGDP to GRX
-1
0
1
2
3
1 2 3 4 5 6 7 8 9 10
Response of GRGDP to GRC
-1
0
1
2
3
1 2 3 4 5 6 7 8 9 10
Response of GRGDP to DIS
Response to Cholesky One S.D. Innovations±2S.E.
Africa
SSA
Non-Resource Rich SSA
Fig. A1. Impulse response functions.
A. Bandara / Journal of Policy Modeling 36 (2014) 840–854 853
Table A1.1Variance decomposition of GDP.
Period S.E. GRGDP GRFDI GRODA GRSTC GRX TOT GRC DEE CPI DIS
Africa1 3.908 100.0 0.000 0.000 0.000 0.000 0.000 0.000 0.000 0.000 0.0002 4.288 85.19 5.251 0.324 9.8E−06 8.500 0.024 0.295 0.069 5.6E−06 0.339
10 4.709 71.74 15.57 0.679 0.036 8.675 2.214 0.341 0.103 0.250 0.377
SSA1 3.907 100.0 0.000 0.000 0.000 0.000 0.000 0.000 0.000 0.000 0.0002 4.355 83.83 5.260 0.469 0.007 9.684 0.036 0.292 0.070 2.43E−05 0.339
10 4.787 70.70 15.27 0.869 0.055 9.572 2.382 0.337 0.108 0.285 0.413
Non-resource rich SSA1 3.508 100.0 0.000 0.000 0.000 0.000 0.000 0.000 0.000 0.000 0.0002 3.898 84.35 9.344 1.152 0.037 4.293 0.016 0.040 0.135 0.032 0.590
10 4.354 69.30 21.51 1.757 0.209 4.141 2.030 0.181 0.160 0.111 0.582
Cholesky ordering: GRGDP GRFDI GRODA GRSTC GRX TOT GRC DEE CPI DIS.
Table A1.2Hypothesis testing based on GMM estimates-Wald test results.
Variable Africa SSA Non-resource rich SSA
F-Stat Prob F-Stat Prob F-Stat Prob
EQ9GRFDI(−2) 4.0801 0.0441 14.536 0.0002 10.700 0.0012GRODA(−1) 5.3284 0.0217GRX(−1) 20.332 0.0000 22.115 0.0000GRX(−2) 3.6485 0.0569 3.3347 0.0687CPI(−2) 12.051 0.0006 12.523 0.0005 5.6194 0.0185DIS(−1) 5.5831 0.0187 4.4663 0.0355DIS(−2) 3.1374 0.0774 3.3318 0.0688
EQ11GRFDI(−1) 5.4063 0.0207 9.2309 0.0026 8.5345 0.0038GRFDI(−2) 3.1859 0.0752 13.125 0.0003 6.0765 0.0144GRODA(−1) 2.9948 0.0849GRX(−1) 6.9977 0.0086 16.966 0.0000 4.5219 0.0345GRX(−2) 5.0405 0.0255DEE(−2) 4.3741 0.0374CPI(−2) 11.257 0.0009 10.957 0.0011DIS(−1) 2.9243 0.0886
EQ12GRFDI(−2) 3.8500 0.0505 16.173 0.0001 14.561 0.0002GRODA(−1) 3.5429 0.0608GRX(−1) 15.772 0.0001 15.870 0.0001 3.7770 0.0529CPI(−2) 5.2359 0.0227 5.7879 0.0166 4.5278 0.0342DIS(−1) 2.8841 0.0903 4.7525 0.0301
References
Akinlo, A. E. (2006). Macroeconomic factors and total factor productivity in Sub-Saharan African countries. InternationalResearch Journal of Finance and Economics, 1, 62–79.
854 A. Bandara / Journal of Policy Modeling 36 (2014) 840–854
Alfaro, L., Chanda, A., Kalemli-Ozcan, S., & Sayek, S. (2004). FDI and economic growth: The role of local financialmarkets. Journal of International Economics, 64(1), 89–112.
Allen, F., & Carletti, E. (2006). Credit risk transfer and contagion. Journal of Monetary Economics, 53, 89–111.Barro, R. (2009). Rare disasters, asset prices and welfare costs. American Economic Review, 99(1), 243–264.Battes, G., & Coelli, T. (1995). A model for technical inefficiency effects in a stochastic frontier production function for
panel data. Empirical Economics, 20, 325–332.Blundell, R., & MaCardy, T. (1999). Labour supply: A review of alternative approaches. In O. C. Ashenfelter, & D. Cards
(Eds.), Handbook of labour economics (Vol. 3A). Amsterdam: North-Holland.Canova, F., & Ciccarelli, M. (2009). Estimating multi-country VAR models. International Economic Review, 50(3),
929–959.Cornwell, C., Schmidt, P., & Sickles, R. (1990). Production frontiers with cross-sectional and time-series variation in
efficiency levels. Journal of Econometrics, 46, 185–200.Dell’ Ariccia, G., Detragiache, E., & Rajan, R. (2008). The real effects of banking crises. Journal of Financial Interme-
diation, 17, 89–112.Eichengreen, B., & Rose, A. (1999). Contagious currency crises: Channels of conveyance. In T. Ito, & A. Krueger (Eds.),
Changes in exchange rates in rapidly developing economies. Chicago: University of Chicago Press.Eichengreen, B., Rose, R., & Wyplosz, C. (1996). Contagious currency crises. Scandinavian Economic Review, 98,
463–484.Forbes, K., & Chinn, M. D. (2004). A decomposition of global linkages in financial markets over time. The Review of
Economic Statistics, 86(3), 705–722.Greenwald, B., Stiglitz, J. E., & Weiss, A. (1984). Information imperfections in the capital market and macroeconomic
fluctuations. American Economic Review, 74, 194–199.Hernández, L. F., & Valdés, R. O. (2001). What drives contagion trade, neighborhood, or financial links? International
Review of Financial Analysis, 10, 203–218.Hollingsworth, J., & Wildman, B. (2002). The efficiency of health production: Re-estimating the WHO panel data using
parametric and nonparametric approaches to provide additional information. Health Economics, 11, 1–11.Holtz-Eakin, D., Newey, W., & Rosen, H. S. (1988). Estimating vector autoregressions with panel data. Econometrica,
56(6), 1835–1849.International Monetary Fund. (2008 April). World economic outlook. Washington, DC: International Monetary Fund.International Monetary Fund. (2009a). Impact of the global financial crisis on Sub-Saharan Africa. Washington, DC:
International Monetary Fund.International Monetary Fund. (2009b October). Global financial stability report. Washington, DC: International Monetary
Fund.International Monetary Fund. (2010 October). World economic outlook. Washington, DC: International Monetary Fund.International Monetary Fund. (2011 April). World economic outlook. Washington, DC: International Monetary Fund.Klevmarken, N. A. (2004). Estimates of a labour supply function using alternative measures of hours of work, IZA
discussion paper no 1035.Krozner, R., Laeven, L., & Klingebiel, D. (2007). Banking crises, financial dependence, and growth. Journal of Financial
Economics, 84, 187–228.Pesaran, M. H., Shin, Y., & Smith, R. (1999). Pooled mean group estimation of dynamic heterogeneous panels. Journal
of American Statistical Association, 94, 621–634.Pesaran, M. H., & Smith, R. (1995). Estimating long-run relationships from dynamic heterogeneous panels. Journal of
Econometrics, 68, 79–113.Ratha, D., Mohapatra, S., & Silwal, A. (2009). Outlook for Remittances flows 2009–2011, Migration and Development
Brief 10, World Bank.Salvatore, D. (2010). The financial crisis: Causes, effects, policies and prospects. Journal of Politics and Society, (Fall),
7–16.Salvatore, D., & Campano, F. (2010). The financial crisis in East Asia: Then and now. East Asia Law Journal, 5(1).Shin, H. (2009). Securitization and financial stability. Economic Journal, 119, 309–332.Stiglitz, J. E., & Weiss, A. (1981). Credit rationing in markets with imperfect information. American Economic Review,
71, 393–410.UNCTAD. (2009). Trade and investment report. New York: United Nations.UNECA and ACU. (2009). The global financial crisis: impact, responses and way forward, paper presented at the twenty
eighth meeting of the Committee of Experts, Cairo, Egypt, June 2009.
Copyright © 2022 FDOKUMEN