Horowitz dissertation FINAL - eScholarship
201
UNIVERSITY OF CALIFORNIA, SAN DIEGO Campaigns and Ethnic Polarization in Kenya A dissertation submitted in partial satisfaction of the requirements for the degree Doctor of Philosophy in Political Science by Jeremy Horowitz Committee in charge: Professor Karen E. Ferree, Co-chair Professor Clark C. Gibson, Co-chair Professor Gary W. Cox Professor Scott W. Desposato Professor Daniel C. Hallin Professor Craig McIntosh 2012
-
Upload
khangminh22 -
Category
Documents
-
view
2 -
download
0
Transcript of Horowitz dissertation FINAL - eScholarship

UNIVERSITY OF CALIFORNIA, SAN DIEGO
Campaigns and Ethnic Polarization in Kenya
A dissertation submitted in partial satisfaction of the
requirements for the degree Doctor of Philosophy
in
Political Science
by
Jeremy Horowitz
Committee in charge:
Professor Karen E. Ferree, Co-chair Professor Clark C. Gibson, Co-chair Professor Gary W. Cox Professor Scott W. Desposato Professor Daniel C. Hallin Professor Craig McIntosh
2012

Copyright
Jeremy Horowitz, 2012
All rights reserved.

iii
The dissertation of Jeremy Horowitz is approved, and it is acceptable in quality and form for publication
on microfilm:
___________________________________________
___________________________________________
___________________________________________
___________________________________________
___________________________________________
Co-chair
___________________________________________
Co-chair
University of California, San Diego
2012

iv
Dedication
To my parents, Paulette and Jay, and to my wife, Amanda

v
Table of Contents
Signature Page ................................................................................................. iii
Dedication ........................................................................................................ iv
Table of Contents .............................................................................................. v
List of Figures .................................................................................................. vi
List of Tables .................................................................................................. vii
Acknowledgements .......................................................................................... ix
Vita ................................................................................................................... xi
Abstract ........................................................................................................... xii
Chapter 1. Introduction ...................................................................................................... 1
Chapter 2. The Ethnic Foundations of Electoral Politics .................................................. 27
Chapter 3. Ethnic Groups and Campaign Strategy ........................................................... 65
Chapter 4. Ethnic Appeals ................................................................................................ 98
Chapter 5. Recruiting Trusted Messengers ..................................................................... 122
Chapter 6. Campaigns and Ethnic Polarization .............................................................. 146
Chapter 7. Conclusion ..................................................................................................... 167
References ....................................................................................................................... 174

vi
List of Figures
Figure 2.1 Beliefs about Candidate Favoritism Intensions, 2007 Election .................... 48
Figure 2.2 Beliefs about Candidate Intentions among Luhya Respondents ................... 50
Figure 2.3 Vote Choice and Favoritism Beliefs at the Group Level .............................. 57
Figure 2.4 Vote Share of Leading Candidate, 1992 ....................................................... 60
Figure 2.5 Size of Largest Ethnic Group ........................................................................ 60
Figure 2.6 Bounds on Support for Leading Candidates (1992) ...................................... 62
Figure 2.7 Estimated Turnout Rates by Ethnic Group in 2002 (with 95% CIs) ............. 64
Figure 3.1 Presidential Rallies and Population Density ................................................. 78
Figure 3.2 Major Campaign Rallies ................................................................................ 80
Figure 3.3 Share of Rallies in Major Ethnic Areas ......................................................... 87
Figure 5.1 Ethnic Composition of PNU’s Parliamentary Slate .................................... 126
Figure 5.2 Ethnic Composition of ODM’s Parliamentary Slate ................................... 127
Figure 5.3 Ethnic Composition of ODM-K’s Parliamentary Slate ............................... 127
Figure 5.4 Predicted Probability of Recruiting High-Quality Candidates .................... 139
Figure 5.5 Share of Quality Candidates Recruited from Major Ethnic Groups ........... 142
Figure 6.1 Beliefs about The Trustworthiness of Presidential Candidates ................... 151
Figure 6.2 Beliefs about Economic and Education Reform ......................................... 157
Figure 6.3 Support for Devolution ................................................................................ 159
Figure 6.4 Change in % Believing Government Favors Kikuyus ................................ 160
Figure 6.5 Anxiety about Out-Groups Being in Power ................................................ 162
Figure 6.6 Voting Intentions, September - December 2007 ......................................... 165

vii
List of Tables
Table 1.1 Share of Population Affected by Post-Election Violence, 2007-2008 ............. 2
Table 1.2 Ethnic Groups ................................................................................................. 17
Table 1.3 Ethnic Group Concentration ........................................................................... 19
Table 2.1 1992 Election Results .................................................................................... 31
Table 2.2 1997 Election Results .................................................................................... 31
Table 2.3 2002 Election Results .................................................................................... 33
Table 2.4 2007 Election Results .................................................................................... 33
Table 2.5 Multinomial Logit Models of Vote Choice .................................................... 54
Table 2.6 Multinomial Logit Models of Vote Choice .................................................... 55
Table 2.7 Comparison of EI Estimates ........................................................................... 63
Table 2.8 Comparison between EI Results and Survey Data for 2007 ........................... 64
Table 3.1 Voting Intentions by Ethnic Group in September 2007 .................................. 74
Table 3.2 Location of Presidential Rallies ...................................................................... 81
Table 3.3 Negative Binomial Regression Models of Rally Locations ............................ 84
Table 3.4 Logit Models of Campaign Contact ................................................................ 90
Table 3.5 Voting Intentions by Province in September 2007 ......................................... 92
Table 3.6 Comparison between Survey Estimates and Census Data at District Level ... 97
Table 4.1 Recording Sample versus Estimated Population of Rallies .......................... 105
Table 4.2 Campaign Messages ...................................................................................... 109
Table 4.3 Performance Messages .................................................................................. 110
Table 4.4 Issue Priorities / Positions Messages ............................................................ 112

viii
Table 4.5 Candidate Characteristics Messages ............................................................. 113
Table 4.6 Ethnic Appeals .............................................................................................. 114
Table 5.1 Logit Models of Candidate Recruitment ....................................................... 138
Table 5.2 Estimated Vote Share by Ethnic Group ........................................................ 145

ix
Acknowledgements
I wish to acknowledge the many individuals who helped make this dissertation
possible. Above all, I thank Karen Ferree, who served as my advisor and mentor through
every stage of this project. Karen provided invaluable support, encouragement, and
guidance throughout the entire process. I also thank Clark Gibson, who served as the co-
chair for my dissertation committee, and provided important input along the way. I
express my gratitude as well to the other members of my committee – Gary Cox, Scott
Desposato, Craig McIntosh, and Daniel Hallin – for their contributions.
For helpful feedback, I thank the many participants who commented on early
drafts presented at meetings of the Working Group in African Political Economy, the
Contemporary African Political Economy Research Seminar, the American Political
Science Association, the African Studies Association, and UCSD’s International
Relations and Comparative Politics Workshops.
In Kenya, I received help from several individuals and institutions. I thank the
Kenya National Commission on Human Rights (KNCHR) for sharing recordings of
campaign speeches from the 2007 election. I express deep gratitude to the research
assistants who helped me code the speeches: George Ondeng, John Gitau, Paul
Kipchumba, and Sheila Down. I thank also George Waititu from Steadman for providing
access to survey data collected prior to the 2007 election, and to the team of research
assistants from the University of Nairobi who coded the names of all parliamentary
candidates in the 2007 election. I also thank Tom Wolf, who helped me get acquainted in
Nairobi and introduced me to many valuable contacts. I thank the many members of the

x
Kenyan parliament and political party officials who offered wisdom on the inner
workings of the Kenyan political system during interviews in 2007 and 2008. I thank
James Long for many valuable discussions of my project and for sharing survey data. I
acknowledge also Karen Austrian who provided a lovely home for much of my time in
Kenya.
For financial support, I thank the National Science Foundation, the Institute for
Global Conflict and Cooperation (IGCC) at the University of California, and UCSD’s
Political Science Department.
Finally, I thank my family. My mother Paulette and father Jay instilled in me a
curiosity about the world that has contributed very directly to my interests in international
affairs. Their support sustained me throughout this project. My wife Amanda saw me
through all of the ups and downs and never lost faith in this project or my ability to
complete it. For her love and companionship, I am deeply grateful.

xi
Vita
1996 B.A., Oberlin College 2003 M.A., Johns Hopkins University 2012 Ph.D., University of California, San Diego

xii
ABSTRACT OF THE DISSERTATION
Campaigns and Ethnic Polarization in Kenya
by
Jeremy Horowitz
Doctor of Philosophy in Political Science
University of California, San Diego
Professor Karen E. Ferree, Co-Chair Professor Clark C. Gibson, Co-Chair
This dissertation examines the polarizing effects of electoral competition in
Kenya’s multiethnic democracy. I argue that polarization results from a combination of
the messages parties use to demonize opponents and the tendency by voters to accept
more readily messages from co-ethnic leaders. The argument starts with an investigation
of campaign targeting decisions. I show, contrary to much of the existing ethnic politics
literature, that in Kenya the competition for swing groups (ethnic communities that do not
have a co-ethnic leader in the presidential race) is at the heart of electoral contests. The
need to attract support across group lines drives message development, leading parties to
craft appeals that communicate their inclusive intentions while relying on negative ethnic
messages to vilify opponents as ethnic chauvinists. I argue that because of the strong
association between ethnicity and trust, voters in the ethnic communities associated with
the leading parties internalize messages offered by distinct sets of political elites during
campaigns. The result is that negative ethnic appeals exacerbate divisions across
communities during the race. To develop and test these claims, I draw on a wide range of

xiii
empirical evidence collected from Kenya’s four multiparty races since the reintroduction
of competitive presidential elections in 1991.

1
Chapter 1.
Introduction
1. The Puzzle
On December 31, 2007 approximately 50 people – mostly women and children –
were burned alive in a church in Eldoret, a small town in Kenya’s Rift Valley Province.
One report described the scene as follows:
After torching houses in the neighborhood, the raiders surrounded the church compound, doused blankets and mattresses with petrol and set the church ablaze. The few men who were at the scene attempted to defend the victims, but they were overpowered by the raiders who hacked them to death and shot others with arrows. Another group of the youth pursued those who tried to escape from the burning church and hacked them to death in cold blood. (KNCHR 2008, 61)
This chilling assault was part of a wave of ethnic violence sparked by a disputed election
that was widely believed to have been rigged by the incumbent president, Mwai Kibaki,
and his party, the Party of National Unity (PNU). Over a two-month period, more than
1,000 people were killed and another 350,000 displaced from their homes in clashes that
brought the country to the brink of civil war (KNCHR 2008). Survey data collected
shortly after the violence provide an estimate of the scale of the conflict: as shown in
Table 1.1, about a quarter of the Kenyan population was directly affected in one way or
another.1
1 Data come from an Afrobarometer survey (n=1,104) conducted on October 29 – November 17, 2008.

2
Table 1.1 Share of Population Affected by Post-Election Violence, 2007-2008 Type of Violence Percent Damage to personal property 13 Destruction of home / eviction from home 8 Destruction / closure of business 16 Personal injury 4 Death of a family member 7 Total 24
While many factors contributed to the violence, accounts routinely point to the
divisive campaigns that preceded the election as a central cause.2 A report by Human
Rights Watch, for example, concluded that, “the election campaign itself was virulently
divisive, with politicians on both sides characterizing their opponents in derogatory terms
linked to their ethnicity” (HRW 2008, 23). Similarly, the government committee charged
with investigating the violence found that incitement by politicians against Kenya’s
largest ethnic group, the Kikuyu, explained the intensity of the conflict (CIPEV 2008,
69). One long-time observer of Kenyan politics, Joel Barkan, likewise argued that, “the
elections polarized the country along ethnic lines, as both parties had mobilized ethno-
regional constituencies by appealing to voters’ sense of identity” (Barkan 2008, 147).3
These accounts point to the principal question of this dissertation: how do
candidates and parties – through their campaign strategies and tactics – exacerbate ethnic
divisions and heighten the risk of inter-communal violence? Answering this question is
important not only for making sense of Kenya’s experience but also for understanding
2 Studies of the violence point to a long list of contributing factors, including economic inequalities and poverty (IRIN 2009), a history of ethnic favoritism and marginalization by post-independence leaders (wa Githinji and Holmquist 2008), disputes over land (Kanyinga 2009; Kamungi 2009), the organization of militias and gangs (Kagwanja 2009), inflammatory speech on local radio stations (IRIN 2008), weak institutions (Mueller 2008), an overly centralized political system (HRW 2008), and an election that was widely perceived to be fraudulent (Dercon and Gutierrez-Romero 2010; HRW 2010; ICG 2008). 3 This conclusion is echoed in other studies of the post-election violence (e.g., Chege 2008; Kagwanja 2009; Klopp and Kamunji 2008).

3
broader patterns of ethnic conflict. There is widespread agreement that the introduction
of democratic competition in societies divided by race, ethnicity, or religion can increase
the risk of inter-communal violence (Rabushka and Shepsle 1972; Horowitz 1985;
Snyder 2000; Reilly 2001, 2006; Chua 2003; Figueiredo and Weingast 1999). Yet, the
mechanisms that link campaigns to polarization remain a black box. To date there have
been few efforts to investigate empirically campaign dynamics in the world’s emerging,
multiethnic states, and the connection between electoral competition and ethnic violence
is under-theorized.
The predominant explanation for the polarizing effects of campaigns in
multiethnic settings like Kenya is that parties seek support only from their respective
ethnic constituencies and as such have few incentives to moderate electoral appeals.
Donald Horowitz’s (1985) landmark study of ethnic politics, Ethnic Groups in Conflict,
for example, argues that it is the absence of swing voters that distinguishes ethnically-
oriented political systems like Kenya. He claims that in political systems where ethnicity
is less central, the pursuit of swing voters engenders “sweet reasonableness and
moderation” (1985, 332). In ethnic party systems, however, “it is far more important
to…reassure ethnic supporters than to pursue…voters across ethnic lines” (1985, 346).
The single-minded focus on mobilizing existing supporters leads parties to appeal to
ethnic interests, using messages that play on and exacerbate tensions between groups. In
short, the “sweet reasonableness and moderation” gives way to efforts to polarize and
divide the electorate.
While this image of ethnic mobilization is deeply engrained in the ethnic politics
literature, it does not explain campaign dynamics in Kenya. To be sure, ethnicity is

4
central to electoral politics, and mobilizing core ethnic supporters is an important part of
campaign strategy. But in Kenya, elections are won and lost based on whether parties
succeed in attracting support outside their ethnic strongholds. Indeed, data from Kenya’s
2007 election, described in Chapter Three, shows that the leading presidential candidates
spent the bulk of their time on the campaign trail courting non-co-ethnic swing voters.
Contrary to Horowitz’s assertion, then, it is the competition for swing voters, not the
mobilization of core supporters, that in large part defines Kenyan campaigns.
This finding presents a puzzle: if elections are not solely about ethnic
mobilization, how and why do campaigns contribute to polarization and violence? In this
dissertation I show that campaigns have polarizing effects even when the leading parties
focus their efforts on courting voters outside their core ethnic communities. I trace
campaign polarization to a combination of the negative ethnic messages parties use to
discredit their rivals and predispositions that lead voters to more readily accept campaign
claims made by co-ethnic leaders. As a result, ethnic communities – particularly those
groups that are aligned with the major parties – adopt increasingly negative beliefs about
the leaders and communities on the other side of the political divide over the course of
the campaign. The study of ethnic politics to date has focused almost exclusively on
parties’ attempts to shore up support within their core ethnic bases (e.g., Snyder 2000;
Figueiredo and Weingast 1999; Wilkinson 2005; Dickson and Scheve 2006). This
dissertation shows that it is equally important to examine how the competition for swing
voters affects campaign strategies, tactics, and outcomes in the world’s emerging,
multiethnic democracies.

5
2. Existing Approaches
Before outlining my own argument in greater detail, I review several existing
approaches. As noted, the standard explanation for the polarizing effects of campaigns in
divided societies is built on the proposition that parties focus exclusively on ethnic
mobilization. Why, though, should parties seek only to mobilize core ethnic supporters?
In this section I review three distinct accounts drawn from the existing literature and
argue that these approaches are incomplete. These accounts emphasize respectively 1)
the uniformity of voter preferences within ethnic communities; 2) credibility problems
inherent in cross-ethnic appeals; and 3) competitive pressures that lead to outbidding for
the support of particular ethnic groups.
The first approach, which traces campaign strategy to the uniformity of
preferences within ethnic communities, comes from Horowitz (1985), who argues that in
divided societies all voters line up behind the party that is best identified with their ethnic
group. Horowitz views parties as akin to interest groups that exist to advance the goals of
particular ethnic communities in competition for state-controlled resources with others.
For voters it makes little sense to support a party associated with an ethnic group other
than their own. The result is that members of each ethnic community share homogenous
preferences for the party that is most strongly associated with their group. This implies
that for parties it will be impossible to attract voters outside the ethnic group (or groups)
with which they are identified. The goal of electioneering therefore will be solely to
mobilize core ethnic constituents, and there will be no incentive to reach across the
dividing lines that separate ethnic communities into distinct political groupings. Given
this, parties will use divisive campaign appeals that heighten ethnic fears and resentments

6
in order to increase the perceived importance of the race and encourage voters to turn out
in large numbers on election day.
The problem with this argument is that it assumes voter preferences are always
homogenous within ethnic communities. In practice, however, members of ethnic groups
often hold divergent preferences. In Chapter Two, I show that in Kenya voters seeking to
identify the candidate who will best represent their group’s interests frequently arrive at
differing conclusions, leading to divergent voting intentions at the group level. This
divergence opens the door to campaign persuasion, and as I show in subsequent chapters
campaigns revolve in large part around parties’ competing efforts to attract voters outside
of their core communities. Contrary to Horowitz’s assertion, parties are not consigned to
engage solely in mobilizing existing core supporters.
A second approach emphasizes the difficulty of making credible distributional
promises across ethnic lines. Posner (2005), for example, argues that in Zambia the
widespread assumption that prospective leaders will favor their own ethnic groups makes
it “very difficult, or impossible, for politicians to build multi-ethnic coalitions” (p. 105).
The logic is that if voters believe that elected leaders will provide benefits to co-ethnic
citizens – and only to co-ethnic citizens – they will discount distributional promises made
by candidates from outside their own ethnic community. By implication, it will be
impossible for prospective candidates to attract voters outside of their core ethnic groups,
giving them no incentive to appeal across ethnic lines. A similar point is made by
Chandra (2004) who argues that in “patronage democracies” – political systems in which
elected leaders exercise control over the distribution of valuable goods – voters will learn
that cross-ethnic distributional promises are not reliable. Both authors conclude that

7
given the impossibility of making credible promises to out-groups, prospective leaders
will focus solely on mobilizing co-ethnics.
While these authors are right to point out the difficulty of establishing credibility
with non-co-ethnic voters, they overstate the problem. Candidates have a number of
strategies at their disposal to build credibility with target groups, including monetary
transfers, symbolic gestures, and elite recruitment. As Keefer (2007) argues, political
leaders can employ monetary transfers through vote buying to signal commitment to a
particular community. Similarly, Ferree and Horowitz (2010) contend that political
leaders, especially incumbents, can use the allocation of public expenditures to build
credibility across ethnic lines. Symbolic gestures offer another strategy. Leaders can
signal their commitment to a target group by demonstrating familiarity with and support
for the group’s traditions and practices. Popkin (1994), for example, notes that in the
U.S. candidates on the campaign trail work hard to communicate their understanding of
other groups’ cultural practices in order to signal commitment to representing the
interests of target communities. Finally, parties can gain credibility by recruiting leaders
from target groups. Keefer (2007) argues that co-opting local patrons can be an effective
way to establish credibility, a proposition confirmed by Baldwin’s (2009) study of
Zambia. Ferree (2011) and Chandra (2004) make a related point: recruiting leaders from
a target group signals a party’s intention to represent that group’s interests. Moreover,
data from recent elections in Kenya and other multiethnic democracies show that parties
routinely succeed in attracting support across ethnic lines, suggesting that credibility

8
problems are not insurmountable.4 Taken together, these studies indicate that while it
may be difficult to establish credibility with non-co-ethnics, it is not impossible.
A third perspective argues that parties are compelled to focus on mobilizing co-
ethnic voters because of competitive pressures that lead to outbidding within ethnic
segments of the electorate (Rabushka and Shepsle 1972). The outbidding model assumes
that in multiethnic societies all voters prefer leaders who offer their group a larger share
of state-controlled resources over leaders who promise to distribute goods more evenly
across ethnic communities. The model further assumes that candidate entry is costless.
A new candidate can enter the race, offer voters in a particular ethnic group a larger share
of the pie, and immediately attract all voters in that segment away from a more moderate
competitor. Outbidding – or its potential – therefore leads all parties to offer maximal
distributional promises to their core ethnic communities, eliminating the possibility of
appealing to or attracting support outside their core groups.
Two fundamental problems, however, limit the outbidding model. First, it
ignores voters’ incentives to behave strategically. A large body of research on strategic
voting in mature democracies shows that voters make electoral choices based both on
their sincere preferences and on beliefs about candidate viability (e.g., Abramson et al.
1992; Alvarez, Boehmke, and Nadler 2006; Ordeshook and Zeng 1997). While less is
known about newer democracies and multiethnic societies, viability concerns likely
preoccupy voters in these places as well (Chandra 2004). Though voters might prefer a
presidential candidate who offers their group a maximal share of government-controlled
4 The ability to attract support from multiple ethnic communities is documented in studies of electoral outcomes in Kenya (Ndegwa 2003), Zambia (Scarritt 2006), Malawi (Ferree and Horowitz 2010), and Ghana (Fridy 2007), among others.

9
resources, they will recognize that such a candidate will have little chance of winning in
an electoral context like Kenya where appealing across ethnic lines is crucial. Voters
should therefore prefer viable moderates to non-viable extremists.5 Equally important,
the outbidding model ignores the strategic incentives described in studies of elite
coordination (Cox 1997). In Kenya, where ethnic groups are relatively small, prospective
leaders understand that if two or more candidates divide a single ethnic group, each
candidate’s chances of winning at the national level will be diminished. As a result, the
leading presidential candidates rarely face competitors from their own ethnic groups.
Outbidding, in other words, does not compel candidates to focus solely on the pursuit of
co-ethnic voters.
In sum, the major strands of the ethnic politics literature provide limited insight
into electoral strategies and tactics in Kenya. Understanding the Kenyan case, therefore,
requires developing a fuller account of how aspiring leaders decide which ethnic groups
to target during campaigns, how these choices affect the types of messages they use, and
how their campaign appeals affect voters.
3. Overview of the Argument
If an exclusive focus on ethnic mobilization does not explain campaign
polarization in Kenya, what does? I argue that the types of appeals parties use,
5 In another paper (Horowitz and Long 2010), I show that many co-ethnic supporters of the third-place candidate in Kenya’s 2007 election, Kalonzo Musyoka, did not vote strategically. It should not be inferred from this, however, that Kenyans are impervious to concerns about viability. Indeed, the paper shows that Musyoka supporters who correctly estimated the candidate’s chances of victory generally abandoned him for one of the viable contenders. The weakness of strategic voting was a result of the fact that many Musyoka supporters believed (mistakenly) that he was a viable candidate, not indifference to viability concerns.

10
particularly their negative ethnic messages, and predisposition that lead voters to accept
claims made by co-ethnic messengers drive this outcome. I define ethnic appeals as
campaign messages that refer to the political relevance of ethnic differences. While
ethnic messages come in many forms, negative messages are particularly important to the
argument developed here. Negative ethnic messages emphasize the threat posed by an
opposing party or group to the material or physical well-being of other groups. These
appeals typically come in the form of claims about the intentions of opposing leaders, as
in the claim that a rival will favor his own ethnic group if elected. Negative ethnic
messages also relate to the intentions of other groups, as in the claim that a particular
group will pose a security threat to other communities if a candidate from that group
comes to power. In practice, messages about leaders and groups are often intertwined
such that negative claims about the intentions of a particular leader also convey negative
information about the aspirant’s ethnic community, and vice versa.
While campaign messages are an important part of the story, they do not provide
a sufficient explanation for polarization. Campaigns in Kenya, as in all democracies, are
filled with competing claims and counterclaims of all sorts. Why should the barrage of
conflicting ethnic messages result in divergence across ethnic groups, rather than
convergence? Why, in other words, should different communities adopt increasingly
negative beliefs about the leaders and groups on the other side of the political divide over
the course of the campaign? Understanding polarization requires explaining how voters
process the competing messages offered by rival parties. I show that voters in Kenya
generally view co-ethnic political leaders as trustworthy but are skeptical about non-co-
ethnics. This leads voters to more readily accept campaign claims made by co-ethnic

11
leaders while discounting messages from non-co-ethnics. The results is that different
blocs of voters internalize different sets of messages over the course of the campaign,
each side adopting increasingly negative perceptions of the other side. To develop this
argument, I start by examining the campaign strategies and tactics chosen by politicians
and parties. I then turn to campaign effects, investigating how campaign messages affect
voters.
3.1 Campaign Strategies and Tactics
The starting point for the argument is campaign targeting. As scholars of
campaigns routinely note, targeting is the foundation for everything the parties do and say
on the campaign trail (Herrnson 2008). During campaigns parties face a choice between
mobilization (seeking to increase turnout among existing supporters) and persuasion
(seeking to increase vote share by converting potential swing voters). Much of the
existing electoral politics literature, particularly research on distributive politics, argues
that parties should be expected to invest only in persuasion or mobilization, according to
the relative return on each strategy (Cox and McCubbins 1986; Dixit and Londregan
1996; Stokes 2005; Nichter 2008). I show, however, that in Kenya there are potential
gains to be realized both from persuasion and mobilization, and as a result of pervasive
uncertainty about which strategy will yield the greatest return, parties invest in both.
Further, I demonstrate that parties divide campaign labor between different types of
actors. Presidential candidates delegate the job of mobilizing co-ethnic supporters to
lower-level actors – candidates for parliamentary and local-government seats, interest
groups, and networks of supporters. This leaves the presidential aspirants free to allocate

12
the bulk of their time on the campaign trail to the job of courting potential swing voters
outside their ethnic strongholds.
At the center of the parties’ campaign strategies, then, are the twin goals of
persuasion and mobilization. Campaign messages are crafted to serve both purposes.
The need to appeal to swing voters from multiple non-co-ethnic communities leads
parties to avoid messages that might portray too close an association with any ethnic
community, particularly their own. For parties that aspire to win national office, it is the
kiss of death to be too closely allied with any one ethnic group. During campaigns
parties therefore stress their inclusive credentials in an effort to broaden their appeal
beyond their ethnic bases, eschewing the language of ethnic favoritism.
Of course, parties rely not only on positive messages about their own intentions
but also negative claims about opponents. Parties use negative ethnic messages as part of
a broader strategy designed to impugn opponents’ qualifications, competence, and
character. Negative claims are useful for persuasion: when a party is able to convince
voters in swing groups that a rival party is headed by an ethnic chauvinist, those voters
will be less likely to support the opposing party. Likewise, negative ethnic messages are
also useful for mobilizing the base: when core voters come to believe that the opposing
side poses a threat to their material or physical well-being, they will be more motivated to
turn-out on election day to support their co-ethnic leader.6
Parties tailor their ethnic messages according to the specific opportunities and
constraints of a given election cycle, drawing on both long-standing tensions in Kenyan 6 Several empirical studies from the U.S. have shown that perceived threat motivates political participation. Marcus, Neuman and MacKuen (2000), for example, show that people who feel threatened by a political candidate are more likely to become politically active than those who do not (also Miller and Krosnick 2004; Brader 2005; 2006).

13
society and the particular personalities who happen to be in the electoral contest. And
while the goal of negative messages is to raise doubts about opponents’ future behavior,
such messages typically draw on claims about the past. In Kenya, a long history of ethnic
competition and conflict provides a ready supply of raw material on which to draw.
To illustrate, I provide a brief overview of negative ethnic messages from the
2007 campaign. Opposition parties sought to portray the incumbent president, Kibaki, as
an ethnic chauvinist who served only his co-ethnic Kikuyu community at the expense of
other groups. The opposition claimed that during his first term Kibaki had favored
Kikuyus in myriad ways (government appointments, public expenditures, economic
opportunities, and so forth). These messages played on existing beliefs that Kenyan
leaders, particularly Kikuyus, tend to favor their own ethnic groups, tapping into a well-
worn script about “Kikuyu domination.” The Kikuyu are Kenya’s largest ethnic group
(roughly 21% of the overall population) and are relatively better off economically than
other communities. Kikuyu businessmen hold leading positions in the economy, and
Kikuyu leaders have held top political positions throughout the post-independence
period. The Kikuyu are therefore an easy target for charges of ethnic chauvinism. In the
2007 campaign opposition leaders portrayed the Kikuyu community as greedy, arrogant,
and selfish. In ethnically-mixed areas in the Rift Valley, opponents demonized the
Kikuyu as settlers who had stolen land that rightfully belonged to local communities. In
this way, anti-Kikuyu rhetoric was part and parcel of the opposition’s attempts to cast
doubt on Kibaki’s ethnic intentions. The opposition used negative messages to depict
Kibaki as an ethnic chauvinist and to heighten antipathy toward the broader Kikuyu
community in order to limit the appeal of a Kikuyu candidate.

14
The incumbent party in the 2007 race, Kibaki’s Party of National Unity, had to be
more creative. PNU’s main rival in the presidential race, Raila Odinga, was an ethnic
Luo. For PNU it would have made little sense to talk about “Luo domination” or to
appeal to resentment against the Luo community, since the Luo have been relatively
peripheral to Kenyan politics in the post-independence era and are not a dominant group
in the economy. PNU’s negative messages instead focused on Odinga’s background and
personal characteristics. The party portrayed Odinga as a violent man whose election
would plunge the country into an ethnic war. PNU leaders cited Odinga’s role in a failed
1982 coup as evidence of his violent proclivities, and PNU speakers claimed that Odinga
would exact revenge against other groups for past injustices that he and the Luo
community had allegedly suffered. At the same time, PNU drew on negative stereotypes
about Luos, portraying Luos as an uncivilized and violent group. In short, PNU used
negative claims about Odinga and his community in an effort to limit the appeal of a Luo
candidate with non-co-ethnic swing voters and to increase turnout among core co-ethnic
supporters. Thus, while the incumbent and opposition parties both used negative ethnic
messages to discredit their opponents, the substance of such messages varied according to
the opportunities available to each party.
3.2 The Polarizing Effects of Campaign Messages
As this brief sketch illustrates, Kenyan voters face a deluge of conflicting claims
and counterclaims during campaigns. Why should these messages heighten inter-
communal polarization? The answer has to do with how voters process information.
Like voters everywhere, Kenyans must figure out which claims are credible and which

15
are distortions or lies. The challenge is exacerbated in new democracies like Kenya
because campaign claims – particularly ethnic messages – are generally difficult or
impossible to verify. Consider the following example from the 2007 campaign. As
noted, the opposition routinely claimed that the incumbent president, Kibaki, had favored
his own community, alleging that Kibaki allocated a disproportionate share of
government funds to his home ethnic region, the Central Province. The president, on the
other hand, claimed to have treated all groups equally, pointing to investments that had
been made throughout the country during his first term. These alternative claims were
equally plausible but nearly impossible to verify. Whom, then, should voters believe?
Research on political communication emphasizes that voters learn from sources
they view as credible and trustworthy (Hovland et al., 1953; Lupia and McCubbins 1998;
Lupia 2002). Numerous studies show that voters rely on source cues – attributes such as
race, religion, gender, or partisanship – to form judgments about the trustworthiness of a
given speaker (Kuklinski and Hurley 1994; Lupia and McCubbins 1998; Gilens and
Murakawa 2002; Lupia 2002; Slothuus et al., 2010). In Kenya, where ideology and
partisanship provides less useful cues, ethnicity serves as a more ready source cue.
Building on recent work in the ethnic politics literature (especially Ferree 2011), I argue
that the belief that co-ethnic leaders favor their own communities predisposes voters to
view co-ethnic politicians as credible and to doubt the credibility of non-co-ethnics. The
result is that voters tend to accept campaign claims made by co-ethnic politicians and
discount those made by non-co-ethnics.
Party leaders recognize that as a result of the association between ethnicity and
trust their ability to influence voters’ attitudes and beliefs during campaigns depends on

16
recruiting trusted leaders from across Kenya’s diverse ethnic landscape. But while the
major parties are generally able to monopolize the recruitment of high-quality leaders
from their core ethnic communities, they are typically unable to recruit trusted leaders
from opponents’ ethnic groups. This pattern of elite recruitment means that the parties
often enjoy a near-monopoly on trusted messengers within their core ethnic group, giving
each party an advantage in influencing attitudes and beliefs among core supporters. But
because the parties have few trusted messengers working on their behalf in opponents’
ethnic strongholds, their messages have little effect on opponents’ core supporters. The
result is that ethnic blocs that are closely aligned to the main parties learn from different
sets of elites over the course of the campaign, each side taking in negative claims about
the other side, each adopting increasingly negative beliefs about the leaders and
communities on the opposing side of the political divide. As described in Chapter Six,
these campaign dynamics mirror the polarization process described in Zaller (1992).
Zaller demonstrates that when elites in the U.S. divide along ideological lines on national
policy issues, similar splits emerge in the electorate, as different segments of society take
cues from leaders who share their ideological orientations. The difference in Kenya is
that ethnicity, not ideology, structures political alignments.
In sum, I argue that polarization in Kenya occurs because of the negative
messages parties use to vilify opponents, and the tendency by voters to accept claims
made by co-ethnic leaders and reject counterclaims made by non-co-ethnic elites. One
objection that might be raised is that the account does not explain how ethnic polarization
leads to violence. While not examining the link between polarization and violence
directly, I assume that ethnic polarization increases the likelihood of conflict, all else

17
equal. Several studies suggest that ethnic grievances can motivate individuals to
participate in violence (Gurr 1970; Horowitz 2001; Cederman et al. 2011). Although
polarization on its own cannot explain the outbreak of violence in Kenya or elsewhere, if
campaigns increase perceived grievances, resentments, and antipathies between
communities, they likely increases the chances that individuals will engage in violence
when faced with a choice between participating or abstaining.
4. Ethnicity in Kenya
Before proceeding, I offer a brief overview of Kenya’s ethnic demography.
Throughout the dissertation I use the term “ethnic group” and “tribe” interchangeably,
following standard practice in Kenya. I use these terms to refer to the 42 ethnic
communities listed on the Kenyan census, following the common understanding of how
ethnic communities are defined. Table 1.2 shows the country’s ethnic profile, based on
the 1989 census. Kenya, like most African states, is a country of ethnic minorities.
There are eight groups that make up 5% or more of the population, and these eight
collectively account for about 85% of the population.
Table 1.2 Ethnic Groups (percent of total population) Kikuyu 21 Luhya 14 Luo 12 Kalenjin 11 Kamba 11 Kisii 6 Meru 5 Mijikenda 5 Other (each < 2%) 14

18
Recent research on ethnicity has emphasized the multidimensional nature of
identities: individuals simultaneously hold identities based on tribe, sub-tribe, clan,
religion, and so forth (Kasfir 1979; Chandra 2001, 2004; Posner 2005). In Kenya, most
ethnic categories can be disaggregated into lower-level units, such as sub-tribe and clan.
The Luhya, for example, include roughly 20 distinct sub-tribes (Kanyinga 2006, 353).
And in some cases the categories listed in Table 1.2 have only recently come to have
political meaning. Kalenjins, for example, are thought to have identified in terms of sub-
tribe (as Nandis, Keiyos, Tugens, and so forth) until recently. Only with the colonial
intervention and efforts by post-independence leaders to forge a shared identity has the
Kalenjin category taken on political relevance (Lynch 2006, 2008). While tribal groups
can be sub-divided, they can also be aggregated into larger groupings according to broad
linguistic families. For example, the Kikuyu, Luhya, Kamba, and many smaller
communities can be grouped together as Bantus, while the Kalenjin, Luo, and several
others can be grouped as Nilotes. In short, in Kenya’s ethnic landscape, multiple
overlapping categories exist, and the political salience of these ethnic dimensions is
hardly fixed.
Yet, throughout the dissertation I use “ethnic group” to refer only to the ethnic
categories listed in Table 1.2. The reason is that my focus is on national-level politics,
and at the national level it is tribal divisions that have taken center stage in recent
presidential elections. At the local level – e.g., in parliamentary and local-government
races – sub-tribe and clan may be highly salient. But, given my focus on national-level
politics, I largely ignore these local-level considerations. Likewise, it is entirely possible
that larger, linguistic categories related to ancestral origins (e.g., Bantu, Nilote, etc.)

19
could take on greater salience in the future. But to date, these categories have not
structured political dynamics, and I therefore do not dwell on them.
Finally, it is important to note that ethnic communities in Kenya, as in most parts
of Africa, remain geographically concentrated to a large extent. Table 1.3 provides a
measure of geographic concentration for Kenya’s eight largest ethnic communities. The
measure indicates the percentage of each ethnic group that lives in its home ethnic area,
which I define as the parliamentary constituencies where the group makes up at least 75%
of the population.7 As shown, at least 60% of each group lives within its home ethnic
area, and concentration is considerably higher for some communities, including the
Kamba, Kisii, and Meru.
Table 1.3 Ethnic Group Concentration Group Percent Kikuyu 63 Luhya 61 Luo 64 Kalenjin 61 Kamba 78 Kisii 68 Meru 78 Mijikenda 63
Note: Concentration is defined as the percent of each group living in constituencies where it makes up 75% or more of the population.
The geographic concentration of ethnic communities is important because, as
discussed more fully in Chapter Three, it allows me to track the ethnic targeting of 7 Group concentration estimates were created by merging 12 nationally-representative surveys (with a total sample size of 39,065) conducted between November 2006 and January 2009. Details are provided in Appendix 3.1.

20
campaign effort. By observing where the presidential candidates hold campaign rallies, I
am able to make inferences about which groups they target during campaigns.
5. Why Kenya?
While no single country can serve as representative of a broader class of cases,
Kenya shares a number of important features with other multiethnic countries,
particularly in Africa, that ensure the findings from this study will be relevant elsewhere.
First, as noted earlier, Kenya, like most African countries, is a country of minority ethnic
groups. Data from Fearon (2003) show that within Africa only 12 of 43 countries (28%)
contain an ethnic group that on its own makes up a majority of the population.8 In most
parts of Africa, therefore, parties will be compelled to compete across group lines if they
seek to be competitive at the national level, as in Kenya.
Second, Kenya employs the modal institutional setup used in African
democracies: a presidential system with single-member districts for electing members of
parliament. Nearly all countries in Africa use these institutional arrangements (Kuenzi
and Lambright 2005). And, as in other parts of Africa, Kenya’s institutions concentrate
power and authority in the hands of the presidency, making the presidential race the
central arena for contestation (Prempeh 2008).
Third, an important feature of presidential elections in Kenya is that the leading
presidential candidates typically come from different ethnic communities. In three of the
four multiparty races since the reintroduction of competitive politics in 1991, the two
8 This data set contains 332 distinct ethnic groups larger than one percent of the population within 43 countries in sub-Saharan Africa.

21
leading candidates have been from different communities, the exception being the 2002
race when Kibaki and Uhuru Kenyatta (both Kikuyus) squared off. In this regard, Kenya
is typical of other African cases. Data collected from multiparty presidential contests
across the continent between 1991 and 2010 show that the top two vote-getters came
from different ethnic communities 81% of the time.9 This finding justifies the focus on
electoral contests in which candidates from different communities face each other.
6. Implications
This dissertation contributes first and foremost to efforts to understand how and
why electoral competition exacerbates ethnic polarization and violence in emerging
democracies. Scholars have long been pessimistic about the prospects of democracy in
divided societies (Rustow 1970; Dahl 1971; Rabushka and Shepsle 1972; Lijphart 1977;
Horowitz 1985; Snyder 2000). Large-scale conflicts in cases like Rwanda, the former
Yugoslavia, and Sri Lanka confirm that ethnicity and democracy can be a volatile mix.
And one recent empirical study found that throughout Africa violence has become a
routine aspect of electoral competition, affecting about one in every five elections
between 1990 and 2007 (Strauss and Taylor 2009). Yet, despite the widespread concern
with the destabilizing potential of ethnic divisions in new democracies, scholars have
made little progress in unpacking the relationship between elite actions and ethnic
polarization and violence. As noted, much of the existing ethnic politics literature relies
9 Data come from 35 African countries that held competitive presidential elections between 1991 and 2010 for which it was possible to determine the ethnic identity of the two leading candidates in the race. Coding of candidate ethnicity was culled from newspaper coverage of the races and from country experts who were familiar with the races. Thanks go to Christine Goldrick, an Honors student in Dartmouth’s Government Department, for collecting much of the data.

22
on assumptions that do not hold in settings like Kenya, and there have been few empirical
studies that seek to understand campaign dynamics in emerging, multiethnic
democracies. The contribution made by this dissertation is to open the black box of
campaign polarization by unpacking the linkages between elite electoral goals, the
strategies and tactics they employ in pursuit of their goals, and how their actions affect
the electorate. Further, the account offered here contrasts with much of the existing
literature which has long assumed that polarization emerges from parties’ exclusive focus
on mobilizing ethnic constituents. I show that in multiethnic settings like Kenya,
attempts to court non-co-ethnic swing voters lie at the heart of electoral contests, and
campaigns have polarizing effects even when parties pursue voters from multiple ethnic
communities.
A second contribution is to distinguish between bottom-up and top-down
mechanisms through which electoral competition exacerbates group tensions. Existing
literature notes that elections can be divisive when ethnic communities align on opposing
sides of the political divide. In such cases, elections become high-stakes, zero-sum
competitions for control of state resources (Horowitz 1985). This “bottom-up” approach
affords little role to elite actions; elections are divisive simple because voters share
common preferences within communities and these preference diverge across
communities (Rabushka and Schepsle 1972). Studies also argue that elite actions can
exacerbate inter-communal tensions (e.g., Snyder 2000). This “top-down” approach
suggests that by “playing the ethnic card,” political leaders reinforce and sharpen ethnic
rivalries and antipathies. While these alternative mechanisms are often conflated, there is
both analytic and practical value in maintaining a distinction between these processes.

23
Analytically, it is important to understand whether elections are divisive because of the
preferences held by voters or the types of appeals candidates employ on the campaign
trail (or some mix of the two). Practically, these mechanisms suggest different types of
interventions for those seeking to mitigate the divisive potential of electoral competition.
My primary goal in this dissertation is to examine top-down effects, i.e., the polarizing
results of elite rhetoric. Other recent works offer compelling explanations for why ethnic
communities often hold divergent electoral preferences in multiethnic societies like
Kenya (e.g., Chandra 2004; Posner 2005; Ferree 2006, 2011). While I build on insights
from these works, the present study augments them by examining the effects of
campaigns in order to understand how and why elite rhetoric influences voter attitudes,
beliefs, and behaviors.
Third, this dissertation has implications for debates about institutional engineering
in divided societies. Several scholars argue that stability can be enhanced by putting in
place institutions, such as the alternative vote or other preferential voting systems, that
generate incentives for parties to appeal across ethnic lines (Horowitz 1990, 1991, 1997,
2004; Sisk 1995; Reilly 2001, 2006). These scholars assume that monoethnic parties rely
on particularistic distributive appeals that heighten ethnic tensions while multiethnic
parties use more moderate, inclusive appeals that downplay the importance of ethnic
differences. This dissertation demonstrates that in Kenya parties have strong incentives
to court voters from multiple ethnic groups but that the imperative of appealing across
group lines proves to be no panacea for the divisiveness of electoral competition. This
finding suggests that preferential voting systems on their own are unlikely to eliminate
the destabilizing effects of electoral competition in divided societies.

24
Finally, this study contributes to the comparative literature on campaign strategy,
much of which seeks to understand whether parties are better off focusing on persuasion
or mobilization (Cox and McCubbins 1986; Dixit and Londregan 1996; Stokes 2005;
Nichter 2008). This dissertation shows that parties have incentives to engage in both,
particularly in newer democracies where there is uncertainty about the potential benefits
of each strategy. Moreover, the Kenyan case shows that there is value in thinking about
how parties divide campaign labor between different types of actors. Existing research
typically treats parties as unified entities. Yet, as I show in this study, parties in Kenya
generally rely on their presidential candidates for persuasion while delegating the job of
co-ethnic mobilization to lower-level actors. To make sense of parties’ campaign
strategies, therefore, we must understand these complementary relationships.
7. Plan of the Dissertation
The dissertation begins by examining voters. Chapter Two explores the
connection between ethnicity and vote choice, setting the stage for the analysis of elite
electoral strategies presented in subsequent chapters. It shows how patterns of ethnic
bloc voting define core and swing groups, demonstrating that ethnic communities that
have a co-ethnic candidate in the race serve as the core support base for the presidential
candidates and groups that do not have a co-ethnic in the race constitute the swing. It
builds on existing research on ethnic voting to offer a micro-level explanation for these
group-level outcomes, and draws on survey data from Kenya’s 2007 race to provide
empirical support for the key propositions of the argument.

25
Next, I turn to the central task of the dissertation: developing and testing an
argument about the electoral strategies elites choose in Kenya. The argument is
presented in three chapters that explore related aspects of campaign strategy. Chapter
Three develops the argument about campaign strategy and uses data from the 2007
election to support its key claims. The empirical analysis draws on data on the location
of campaign rallies held by the three leading presidential contenders in the 2007 race to
document patterns of campaign targeting. I use survey data on household-level contact
by the leading parties to show the complementary relationship between presidential
rallies and grassroots mobilization efforts in the 2007 race.
Chapter Four examines campaign appeals, showing how targeting decisions affect
the types of ethnic messages parties use during campaigns. The chapter draws on content
analysis of over 90 hours of campaign speeches collected from rallies prior to the 2007
election. The data show that parties rarely make distributive promises to their core co-
ethnic supporters. Instead, parties work hard to communicate their inclusive intentions,
reassuring all ethnic groups that they will be treated fairly. At the same time, the parties
seek to demonize their opponents, using negative ethnic messages to limit their rivals’
appeal with swing voters and to motivate their core supporters.
Chapter Five examines a third aspect of electoral strategy: candidate recruitment.
The chapter argues that campaign persuasion requires not just developing the right
messages but also recruiting trusted local-level messengers from across multiple
communities. Using data on the recruitment of parliamentary candidates prior to the
2007 race, it shows that the major parties are generally able to monopolize the best talent
from their respective core ethnic communities but are typically unable to attract quality
26
representatives from their rivals’ communities. As a result, each party’s persuasive
efforts during campaigns have strong effects on co-ethnics but little impact on voters
from opponents’ ethnic communities.
After examining campaign strategies and tactics, I turn to campaign effects in
Chapter Six. I draw on multiple nationally-representative public opinion surveys
conducted in the six months prior to the 2007 election to examine polarization on a range
of indicators that measure attitudes, beliefs, and behavioral intentions. The chapter
provides consistent evidence of campaign polarization among the ethnic communities
that had a co-ethnic candidate in the presidential race.
The final chapter briefly restates that argument and main empirical findings and
examines the dissertation’s implications for the broader study of ethnic politics,
campaigns, and violence in emerging, multiethnic democracies.

27
Chapter 2.
The Ethnic Foundations of Electoral Politics
1. Introduction
Campaigns in Kenya take place in the context of well-established electoral
patterns. Before turning to the campaigns, this chapter accomplishes two tasks that set
the stage for the arguments presented in coming chapters. First, it explains how ethnic
voting patterns divide the electorate into core and swing groups. It shows that when
Kenyans voters have one or more co-ethnic candidates in presidential races, these groups
typically rally around their co-ethnic leaders, forming the core support base for the
leading contenders. Groups that do not have a co-ethnic in the race – generally at least
half the electorate – may also vote as communal blocs but are just as likely to divide
across multiple candidates. It is the potential for division and the greater uncertainty
associated with these communities that makes them a more attractive target for the
candidates’ efforts to increase vote share during the campaigns and defines these groups
as the swing.
Second, this chapter provides an account of voter preferences that links group-
level outcomes to individual electoral decisions. It shows that ethnicity matters to voters
because it serves as a useful predictor of how elites distribute resources across ethnic
communities. For a variety of historical reasons, Kenyans have come to expect that
leaders target benefits along ethnic lines, favoring core ethnic supporters at the expense

28
of other communities. The result is that Kenyans chose between alternative candidates
according to beliefs about the candidates’ prospective favoritism intentions – which
groups they will favor and which they will neglect. Bloc voting occurs when members of
an ethnic community hold shared beliefs about the favoritism intentions of the leading
presidential candidates, converging in their expectations of which candidate will best
represent the community’s interests. Bloc voting is weaker when members of a
community hold divergent expectations regarding the candidates’ favoritism intentions.
These arguments have important implications for the conduct of electoral
campaigns. As explained in Chapter Three, the division of the electorate into core and
swing influences campaign targeting decisions, generally leading presidential aspirants to
focus their persuasive efforts on non-co-ethnic swing voters. And, as explored in Chapter
Four, the importance voters attach to ethnic considerations leads parties to craft campaign
appeals that attest to their inclusive intentions while vilifying rivals as ethnic chauvinists.
The structure of this chapter is as follows. The next section draws on electoral
data from the four presidential elections since the return to multiparty competition in
1991 to demonstrate the strength of ethnic bloc voting among groups with one or more
co-ethnic leader in the race and to show that the extent of bloc voting is highly variable
for ethnic communities that do not have co-ethnic leaders in the races. The chapter then
turns to individual-level electoral decisions. It shows how expectations of ethnic
favoritism affect electoral choices, and examines the conditions under which bloc voting
occurs. Next, the chapter draws on survey data from the 2007 election to provide
empirical support for the key propositions of the argument that links individual decisions
to group-level outcomes. I estimate a series of vote choice models that demonstrate that

29
voters’ beliefs about candidates’ favoritism intentions are related to individual vote
choice in the expected way. I then show that variation in bloc voting in the 2007
presidential election can be explained by the extent to which voters from particular
communities held uniform beliefs about the candidates’ favoritism intentions. The final
section concludes.
2. From Ethnic Bloc Voting to Core and Swing Groups
This section explains how patterns of bloc voting divide the electorate into core
and swing groups. Using data from Kenya’s recent multiparty elections, it shows that
because presidential candidates typically enjoy strong support from co-ethnic voters,
candidates enter the race secure in the knowledge that they can rely on member of their
own ethnic communities. However, because ethnic groups are relatively small,
presidential aspirants must seek support outside their core co-ethnic bases. Groups that
do not have a co-ethnic in the race provide an appealing target for the candidates’ efforts
to gain votes during the campaign because these groups often hold less uniform
preferences.
I begin by examining patterns of ethnic bloc voting in Kenya’s recent presidential
elections. For the 1992, 1997, and 2002 races public opinion data is not available, and I
instead rely on aggregate electoral data. I use the ecological inference (EI) methods
developed by King (1997) and extended by Rosen et al. (2001) to generate estimates of
bloc voting for Kenya’s eight largest ethnic communities. Electoral data come from the
Electoral Commission of Kenya, and demographic information comes from the 1989
census. One limitation is that the census data can only be disaggregated to the district

30
level, a relatively large administrative unit. Fortunately, most districts are fairly
homogenous with regard to ethnicity and electoral outcomes, which improves the ability
to generate reasonably precise estimates using the EI approach. Full details of the EI
methods used here are provided in Appendix 2.1. Data for the 2007 race come from a
national survey of 6,111 respondents conducted roughly two weeks before the 2007
election.
Table 2.1 provides vote choice estimates for the 1992 election, Kenya’s first
competitive presidential race since the early 1960s. The ethnic groups with one or more
co-ethnic leader in the race are shaded. A clear pattern of ethnic bloc voting is evident
among these groups. Kalenjin voters overwhelmingly (98%) supported the incumbent
president, Daniel arap Moi; nearly all Kikuyus (97%) supported one of the two Kikuyu
opposition leaders, Kenneth Matiba and Mwai Kibaki; and Luos voted en masse (97%)
for the long-time Luo opposition leader, Oginga Odinga. Among groups without a co-
ethnic in the race, some (the Luhya, Kamba, Kisii, and Mijikenda) were divided across
the leading candidates, while others (the Meru) coalesced largely around a single
candidate.
Table 2.2 shows estimates for the 1997 election, in which the incumbent
president, Moi, again stood against a large pool of opposition candidates. A clear pattern
of ethnic bloc voting is again evident, with most Kalenjins (99%), Kikuyus (95%), and
Luos (88%) voting overwhelmingly for their respective co-ethnic leaders, Moi, Kibaki,
and Raila Odinga (son of Oginga Odinga). Ethnic bloc voting was more muted among
the Luhya (59% supported Kijana Wamalwa) and the Kamba (41% supported Charity
Ngilu), though in each case the co-ethnic candidate was the front-runner within his or her

31
own ethnic community. Among groups without a co-ethnic in the race, some
communities (particularly the Kisii) divided across the leading candidates, while others
(the Meru and Mijikenda) rallied around a single candidate.
Table 2.1 1992 Election Results (percentages)
Moi
(Kalenjin)
Kibaki / Matiba
(Kikuyu) O. Odinga
(Luo) Other Kikuyu 0 98 0 1 Luhya 27 32 33 8 Luo 1 1 97 2 Kalenjin 98 0 0 1 Kamba 33 60 2 5 Kisii 39 17 31 12 Meru 9 82 3 6 Mijikenda 62 12 17 9 Other (each < 5%) 77 15 4 3 TOTAL 36 26 18 1
Note: Groups with one or more co-ethnic in the race are shaded.
Table 2.2 1997 Election Results (percentages)
Moi
(Kalenjin) Kibaki
(Kikuyu) R. Odinga
(Luo) Wamalwa (Luhya)
Ngilu (Kamba)
Kikuyu 2 95 1 1 2 Luhya 35 1 1 59 4 Luo 6 2 88 1 4 Kalenjin 99 0 0 0 1 Kamba 23 28 5 4 41 Kisii 53 27 4 8 8 Meru 17 74 2 2 5 Mijikenda 77 8 4 3 8 Other (each < 5%) 2 11 1 2 3 Total 40 31 11 8 8
Note: Groups with one or more co-ethnic in the race are shaded.
32
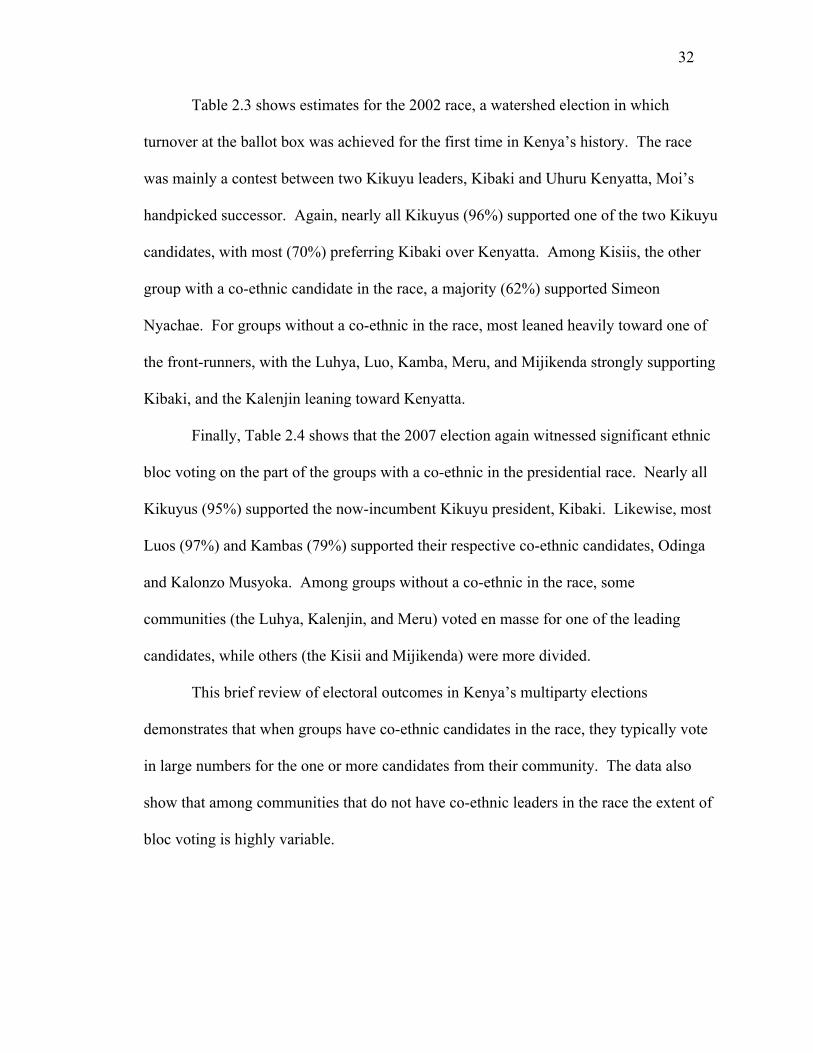
Table 2.3 shows estimates for the 2002 race, a watershed election in which
turnover at the ballot box was achieved for the first time in Kenya’s history. The race
was mainly a contest between two Kikuyu leaders, Kibaki and Uhuru Kenyatta, Moi’s
handpicked successor. Again, nearly all Kikuyus (96%) supported one of the two Kikuyu
candidates, with most (70%) preferring Kibaki over Kenyatta. Among Kisiis, the other
group with a co-ethnic candidate in the race, a majority (62%) supported Simeon
Nyachae. For groups without a co-ethnic in the race, most leaned heavily toward one of
the front-runners, with the Luhya, Luo, Kamba, Meru, and Mijikenda strongly supporting
Kibaki, and the Kalenjin leaning toward Kenyatta.
Finally, Table 2.4 shows that the 2007 election again witnessed significant ethnic
bloc voting on the part of the groups with a co-ethnic in the presidential race. Nearly all
Kikuyus (95%) supported the now-incumbent Kikuyu president, Kibaki. Likewise, most
Luos (97%) and Kambas (79%) supported their respective co-ethnic candidates, Odinga
and Kalonzo Musyoka. Among groups without a co-ethnic in the race, some
communities (the Luhya, Kalenjin, and Meru) voted en masse for one of the leading
candidates, while others (the Kisii and Mijikenda) were more divided.
This brief review of electoral outcomes in Kenya’s multiparty elections
demonstrates that when groups have co-ethnic candidates in the race, they typically vote
in large numbers for the one or more candidates from their community. The data also
show that among communities that do not have co-ethnic leaders in the race the extent of
bloc voting is highly variable.

33
Table 2.3 2002 Election Results (percentages)
Kikaki
(Kikuyu) Kenyatta (Kikuyu)
Nyachae (Kisii) Other
Kikuyu 70 26 1 3 Luhya 85 9 1 4 Luo 94 2 1 3 Kalenjin 16 79 1 4 Kamba 82 11 2 5 Kisii 26 6 62 7 Meru 76 16 2 6 Mijikenda 69 19 5 7 Other (each <5%) 33 62 1 3 Total 62 31 6 1
Note: Groups with one or more co-ethnic in the race are shaded.
Table 2.4 2007 Election Results (percentages)
Kibaki
(Kikuyu) R. Odinga
(Luo) Musyoka (Kamba)
Kikuyu 95 4 1 Luhya 26 73 1 Luo 2 97 1 Kalenjin 7 92 1 Kamba 15 6 79 Kisii 40 57 3 Meru 89 10 1 Mijikenda 36 62 2 Other (each <5%) 34 60 6 Total 42 47 10
Note: Groups with one or more co-ethnic in the race are shaded.
The key implication of these findings is that predictable patterns of voter support
can be anticipated at the start of presidential campaigns. Groups that have a co-ethnic in
the race can generally be expected to support their “own” leader in large numbers, and
these groups can therefore be seen as core support bases for the respective contenders. It
is unlikely that these voters will abandon their co-ethnic leader for a non-co-ethnic
opponent during the campaign, and there is generally little that opponents will be able to

34
do or say on the campaign trail to entice these voters to switch their vote. However,
because ethnic communities in Kenya are relatively small, parties cannot rely solely on
co-ethnic supporters if they are to be successful in presidential contests and must
therefore seek support from multiple communities.
While groups with a co-ethnic in the race are unattractive targets for the
candidates’ persuasive efforts during the campaign, groups that do not have a co-ethnic in
the race are more attractive.10 It is more difficult to anticipate how these communities
will vote at the start of the race. While they may coalesce around one candidate, they
may also split across multiple candidates. As a result, presidential aspirants anticipate
that their chances of winning new supporters will be greater in groups that do not have a
co-ethnic in the race, relative to groups that do. These groups, therefore, make up the
swing. Chapter Three builds on this observation to develop an explanation of how parties
allocate campaign effort across ethnic groups during campaigns. It demonstrates that
presidential aspirants (and their parties) have strong incentives to compete for swing
communities that do not have a co-ethnic in the race, and that presidential candidates
allocate the bulk of their time on the campaign trail to the pursuit of these groups.
A second implication is that core and swing groups change from election to
election depending on the ethnic identity of the candidates in the race. This can be seen
by looking at the Kalenjin community in the four elections described above. In 1992 and
1997, the Kalenjin had a co-ethnic leader, Moi, in the race, and in both elections Kalenjin
support for the co-ethnic option was nearly universal, with an estimated 98% and 99%
10 Data from Kenya’s four multiparty presidential elections since 1991 show that on average groups without a co-ethnic in the race have equaled 55% of the electorate.

35
supporting Moi respectively in the two races. In the 2002 and 2007 races, Kalenjins did
not have a co-ethnic candidate in the race, and the community was more divided. In 2002
the choice was between two Kikuyu candidates (Kibaki and Kenyatta). Most Kalenjins
(79%) supported Kenyatta, but the degree of bloc voting was considerably lower than in
the two previous races, and a non-trivial share (21%) sided with Kibaki. In 2007,
Kalenjins again faced a choice between multiple non-co-ethnic candidates. Survey data
collected at the start of the 2007 campaigns reveal that while most Kalenjins (76%)
expressed an intention to vote for Odinga, a significant share (13%) registered support for
Kibaki and another 9% were undecided.11 While most Kalenjins (92%) ultimately came
to support Odinga, the degree of bloc voting among Kalenjins was again lower than in the
two earlier races in which Kalenjins had a co-ethnic option.
3. The Ethnic Foundations of Bloc Voting
To explain the patterns of bloc voting described above, this section builds on
existing research – particularly works by Chandra (2004), Posner (2005), and Ferree
(2011) – to develop an account of electoral decision-making that connects individual vote
choice to group-level outcomes. It demonstrates that Kenyan voters have come to expect
that government leaders will favor some groups – particularly their own – at the expense
of others in the distribution of state-controlled benefits.12 As a result, Kenyans, like
11 Data come from a survey (n=2,020) conducted by the Steadman Group on September 8-20, 2007. 12 This point is emphasized throughout much of the existing literature on Kenyan voters, especially Oyugi (1997) and Kariuki (2005). Other recent studies suggest that non-ethnic factors – particularly performance evaluations – also matter to Kenyan voters (e.g., Bratton and Kimenyi 2009; Gibson and Long 2009). The account offered here does not address the relative salience of ethnicity and other factors; it only claims that ethnic considerations (specifically, beliefs about the candidates’ favoritism intentions) are a central determinant of vote choice.

36
voters in other similar settings, believe that their own welfare depends on the policies
government leaders adopt toward their ethnic communities. This leads voters to evaluate
alternative candidates according to the candidates’ favoritism intentions – which groups
they will favor and which they will neglect if elected. And it inclines voters to choose
co-ethnic leaders over non-co-ethnics when faced with a choice between the two. The
preference for co-ethnic leaders, however, does not lead to ethnic bloc voting in a
straightforward way. As Ferree (2006; 2011) has shown, ethnic bloc voting occurs only
when voters within a particular ethnic segment arrive at a shared conclusion regarding
which of the leading contenders will best represent the group’s interests.
3. 1 The Preference for Co-Ethnic Leaders
While the existing literature on ethnic voting suggests a number of alternative
explanations for ethnic preferences, I build on work that emphasizes the connection
between ethnicity and voters’ expectations about how state-controlled benefits will be
allocated across communities, especially Chandra (2003), Posner (2004), and Ferree
(2011).13 The link between ethnicity and vote choice in Kenya, I argue, stems from
deeply engrained beliefs that political leaders “favor their own.” This section shows that
such beliefs have been prevalent at least since the early years after Kenya’s transition to
independence, and explains how these expectations affect individual electoral decisions.
To explain the importance Kenyan voters attach to ethnicity, existing studies
routinely contend that ethnic favoritism lies at the heart of the political system (Throup
1987; Oyugi 1997; Branch and Cheeseman 2011). Government leaders, it is often
13 For a review of existing approaches to ethnic voting, see Ferree 2006 and 2011.
37
argued, serve as advocates for their ethnic communities, ensuring that co-ethnics receive
their rightful share of jobs, scholarships, business contracts, funds for roads, schools, and
clinics, and so forth. Groups that have co-ethnic leaders in top government positions –
above all the presidency – are thought to enjoy the myriad fruits of power while others
are left out. Existing quantitative studies of resource distribution in Kenya lend support
to these notions (Burgess et al. 2007; Rainer and Franck 2010; Jablonski 2011). Some
accounts, however, suggest that leaders in multiethnic settings like Kenya often have
compelling reasons not to favor co-ethnic communities (Rothchild 1986; Kasara 2007),
and at least one study (Leonard 1991) finds that ethnic favoritism in Kenya is less
common than often assumed by Kenyan citizens. While the actual extent of ethnic
favoritism remains open to debate, more important for the purposes of this chapter is the
subjective perceptions held by Kenyan voters. In the remainder of this section, I draw on
existing secondary literature and the available public opinion data to show how decisions
made by successive post-independence administrations have reinforced expectations of
ethnic bias in public policy.
Kenya’s first post-independence President, Jomo Kenyatta, a Kikuyu from the
Central Province, consolidated his hold on power in part by placing co-ethnic Kikuyus in
top positions within the army, security services, the police, and in key ministerial
positions (Tamarkin 1978; Throup 1987; Kyle 1999). While Kenyatta was careful to
maintain a degree of ethnic balance in the distribution of appointments, Kikuyus typically
held many of the top positions in the most important ministries and offices (Tamarkin

38
1978; Throup 1987).14 Observers argue that control of the state by a predominantly
Kikuyu elite led to policies that favored the broader Kikuyu community, enhancing their
privileged position in the economy and exacerbating the inter-ethnic inequalities that
existed at the time of independence. For example, Bates (1992) and Widner (1992) assert
that the land settlement scheme initiated by the Kenyatta administration was highly
favorable to Kikuyus seeking to acquire land made available by departing British settlers.
Likewise, Kanyinga (2006) claims that control of the government bureaucracy meant that
Kikuyus were advantaged in the distribution of jobs, loans, and business licenses, and
that public funds for infrastructure and social services were disproportionately channeled
to the Central Province, where Kikuyus are concentrated.
The few empirical studies that have been carried out on Kenyatta-era policies
support these conclusions. One study by Nellis (1974) examined appointments to senior
government positions during Kenyatta’s early years in office.15 He found that in 1969
Kikuyus, who make up about 21% of the Kenyan population, held 33% of top
government positions, and by 1972 this share had increased to 46%. A second study by
Leonard (1991) sought to uncover evidence of ethnic favoritism within the lower ranks of
the civil service. The author notes that during the four years he spent teaching at the
University of Nairobi (1969-73) his students widely perceived that their employment
14 Kenyatta’s inner circle of Kikuyu advisors included Charles Njonjo (Attorney General, 1963-79), Munyua Waiyaki (Minister of Foreign Affairs, 1974-79), James Gichuru (Minister of Defense), Njeroge Mungai (Minster of Defense, 1963-69; Minister of Foreign Affairs, 1969-74), Mbiyu Koinange (Minister of State in the Office of the President), and Mwai Kibaki (Minister of Finance, 1969-82), among others (Throup 1987). 15 Working with a team of six Kenyan research assistants, Nellis coded the ethnic identity of those in 161 senior-level positions in the Cabinet, government Ministries, the state bureaucracy, the armed services, and other positions that he and his team considered to be of “national importance.” Nellis used data from government publications, issued every three years, that provided the names and titles of most major positions in the government. His coding included 175 names from 1969 and 174 from 1972. The ethnic identity of office holders was coded based on their names.
39
prospects within government agencies would depend on their ethnic identities. He notes
that, “not only did they think that some groups (particularly the Kikuyu) were being
systematically favored over others, they also were convinced that the ethnicity of their
superiors in the civil service would shape their promotion prospects” (p. 303). To test
this proposition, Leonard and a team of research assistance collected data on salary
increases within several government ministries between 1968 and 1970.16 They
examined whether those who had a co-ethnic in superior positions (division head, the
department’s chief technical officer, the ministry’s personnel officer, etc.) received larger
salary increases than those who did not. The results are somewhat equivocal. They find
that those who had a co-ethnic permanent secretary in their ministry received a 1.9%
larger pay increase on average over the two-year period of the study relative to those who
did not. The study showed, however, that having a co-ethnic superior in other positions
was not associated with greater pay increases. Finally, a study by Marris and Somerset
(1971) looked at commercial lending by the Industrial and Commercial Development
Corporation, a government agency charged with providing capital to African
entrepreneurs. The authors found that between 1960 and 1966 51% of all loans were
made to Kikuyus.
The authors of these studies are careful not to infer an explicit policy of ethnic
favoritism from their findings. They note that Kikuyus may have advanced more quickly
in the administration and the commercial sector simply because Kikuyus were better
placed than other ethnic groups to take advantage of opportunities that arose after
16 Data came from the Ministries of Agriculture, Cooperatives, Economic Planning and Development, Education, Housing, Labour, Social Services, and Works.

40
independence. As a result of the geographic proximity to Nairobi, the nation’s capital,
Kikuyus were better educated and had developed stronger ties to the commercial sector
than members of other ethnic communities (Bates 1989; Leonard 1992).
Regardless of the extent to which Kikuyus did in fact receive preferential
treatment by the Kenyatta regime, members of other communities often concluded that
ethnic inequalities were the result of government favoritism. Nellis (1974) observed that
to many non-Kikuyus the ethnic imbalance within the Kenyatta government was taken as
evidence that Kenyatta favored his own community at the expense of other groups, and
cautioned that “the sheer existence of the imbalance, and widespread perception of its
existence, pose a threat to the continued stability and development of the country” (p.
23). Survey data collected around the same time supports these assertions. A study
conducted in 1967, four years after independence, by Marc Howard Ross (1975), found
that over three-quarters of respondents considered “tribalism” – the common term for
ethnic favoritism in Kenya – to be a serious problem.17 Based on this finding, Ross
concluded that, “there is a feeling of frustration on the part of other groups as government
funds are poured into Kikuyu-dominated Central Province to maintain government
hospitals, schools, and other services that are far skimpier in other areas of Kenya…At
the same time resentment against the Kikuyu is building up. Large numbers of Luo,
Luhya, and Kamba are despondent because they see jobs, promotions, trading licenses,
and loans awarded on the basis of tribal membership rather than ability” (Ross, 1975: 85).
Beliefs that the Kenyatta government favored the Kikuyu were also fueled by
opposition leaders. Rothchild (1969) shows that in the years following independence
17 Ross’s data come from a survey of 497 respondents in Nairobi, Kenya’s capital.

41
allegations of ethnic favoritism were regularly made by representatives – particularly
Members of Parliament – from less advantaged groups. He notes that, “the call for
increased tribal minority representation in high-level positions, in both the public and
private sectors, had been made with great frequency…Time and again these spokesmen
[Members of Parliament] for the less advantaged African peoples have alleged that
tribalism is a significant factor in determining appointments and promotions in the civil
service” (Rothchild 1969, 700). Similarly, Leonard (1991) concludes that the repetition
of allegations of favoritism against the Kenyatta administration affected the beliefs held
by Kenyans, arguing that the widespread perception that Kikuyus disproportionately
benefited under Kenyatta stemmed from the fact that opposition leaders “portrayed
almost all benefits as resulting from patronage” (p. 102).
Upon Kenyatta’s death in 1978 the presidency passed to the sitting vice president,
Daniel arap Moi, an ethnic Kalenjin from Rift Valley Province, despite the efforts of
several Kikuyu leaders to keep the office in Kikuyu hands (Throup 1987; Widner 1992).
The consensus in scholarly studies of the period, based mainly on anecdotal observations,
is that the transition from Kenyatta to Moi led to a redistribution of resources away from
the Kikuyu and toward Moi’s Kalenjin community and other allied groups, such as the
Maasai, Turkana, and Samburu (Throup 1987; Ajulu 2002; Cowen and Kanyinga 2002;
Lynch 2008b). Though Moi, like Kenyatta before him, was careful to maintain a degree
of ethnic balance in the cabinet, over time co-ethnic Kalenjins were increasingly
promoted within the government. Like Kenyatta, Moi relied heavily on an inner circle of

42
co-ethnic advisors, particularly after a failed coup attempt in 1982.18 Data on the ethnic
composition of the Kenyan cabinet from 1963 to 2004 corroborates the claim that under
Moi the share of Kalenjins in the cabinet grew significantly (Rainer and Trebbi 2011).
Throup (1987) argues that the number of Kalenjins in the state bureaucracy, parastatal
agencies, the armed forces, and the security service also increased dramatically during the
Moi era.
While information on policy making and implementation during the Moi era
(1978-2002) is spotty, the available data suggest that Kalenjins did benefit from Moi’s
patronage. For example, data on appointments shows that in 1990, 32 out of 41
Commissioners in the Provincial Administration were Kalenjin, and by 1991 Kalenjins
headed 40 out of 85 profitable parastatal agencies (Lynch 2006). Throup (1987) argues
that the advance of Kalenjins within the government often came at the expense of
Kikuyus. He notes that, “Middle-ranking Kikuyu officials, civil servants, and parastatal
managers…found themselves overtaken by less-qualified Kalenjin or other members of
Moi’s coalition” (p. 61). There is also evidence that pubic expenditures shifted toward
Moi’s ethnic base. Lynch (2007) reports that in education a quota system was
introduced, ostensibly to help remedy regional inequalities in access to schooling, that
had the effect of increasing expenditures for the Rift Valley, where Kalenjins and other
allied groups are concentrated. Likewise, data on road expenditures show that in the
1986-87 fiscal year, 52% of the national road-building budget was allocated to the Rift
Valley Province, where Moi’s political support base was concentrated (Barkan and Chege
18 Key leaders in Moi’s inner circle included Nicholas Biwott, Henry Kosgey, Jonathan Ng’eno, and Henry Cheboiwo (Throup 1987, 61).

43
1989). More systematic evidence comes from Burgess et al. (2010) who examine the
expansion of paved roads in the post-independence era and show that the length of paved
roads in Kalenjin districts increased dramatically after Moi came to power in 1979.
Anecdotal accounts indicate that the expectation that leaders favor their own
communities remained widespread during the Moi era. Oyugi (1997) notes that the
multiparty contests in the 1990s were perceived in explicitly ethnic terms. According to
his account, “during the 1992 elections, the Kalenjin (the ethnic group of President Moi)
believed that the capture of the state by the opposition would at once mean the loss of
economic privilege which they had enjoyed for over a decade. Similarly, every major
ethnic actor believed that their party’s victory would end their relative deprivation” (p.
40). In explaining the strength of ethnic bloc voting, the author concludes that, “the
masses followed their leaders because of the lingering belief that only ‘one of your own’
can best serve communal interests” (p. 41).
The election of Kibaki, an ethnic Kikuyu, in 2002 with support from a broad,
ethnically-diverse coalition was greeted by many as the beginning of a more inclusive era
in Kenyan politics (Anderson 2003; Ndegwa 2003). A number of subsequent decisions,
however, served to reinforce the notion that leaders can be expected to favor their own
communities. Like his predecessors, Kibaki filled several key ministries with co-ethnic
Kikuyus, as well as Merus and Embus, two related groups that live in close proximity to
the Kikuyu in the area around Mount Kenya.19 The president also failed to make good on
a pre-election promise to create a prime minister position that would be filled by a key
19 These included David Mwiraria (Meru), Minister of Finance; Chris Murungaru (Kikuyu), Minister of State – Provincial Administration and National Security; Kiraitu Murungi (Meru), Minister of Justice and Constitutional Affairs; Amos Kimunya (Kikuyu), Minister of Land and Settlement. Source: Throup 2003.

44
non-co-ethnic ally, Raila Odinga, whose support in the 2002 election had been
instrumental to Kibaki’s victory. And in the aftermath of a divisive referendum on
constitutional reform in 2005, Kibaki dismissed many of his one-time allies from the
cabinet. The reliance on an inner circle of co-ethnic leaders, coupled with the failure to
make good on promises to allies from other ethnic communities and the dissolution of the
broadly-inclusive alliance that brought him to power in 2002 led many voters to doubt
Kibaki’s inclusive credentials. As Barkan (2008) notes, “Many members of other ethnic
groups regarded…the Kibaki administration as favoring the Kikuyu at the expense of
their own communities…The same perception that had dogged the Kenyatta regime at the
end of the 1970s…now confronted Kibaki and his government—that the Kikuyu run the
country to serve themselves” (p. 150). Survey data supports this conclusion. An opinion
poll conducted near the end of Kibaki’s first term in 2007 found that a large share of
Kenyans (43%) thought that Kibaki’s government served the interests of certain ethnic
groups at the expense of others.20 Not surprisingly, views on this question were highly
polarized by ethnic group: most Kikuyu, Meru, and Embu respondents (90%) thought
that the government treated all ethnic groups equally, while a majority (55%) of
respondents from other communities held the opposite view. Among those who felt that
the government favored certain groups, the vast majority (93%) said that the government
favored Kikuyus.
In sum, this section demonstrates that the belief that political leaders use their
authority to channel benefits to their own ethnic communities has been widespread
20 The survey (n=2,025) was conducted in July 2007. The question was, “In your view does Kenya's government serve the interests of all ethnic groups, or does the government favor certain ethnic groups over others?”

45
throughout the post-independence era. Future quantitative research will help to clarify
the extent to which such beliefs reflect actual patterns of patronage targeting or
misperceptions fuelled by elite rhetoric, rumors, and engrained beliefs. For this chapter,
however, what maters is not the extent of ethnic favoritism but voters’ subjective
perceptions of the historical record. And, as shown in this section, there can be little
doubt that many Kenyans have come to believe that ethnic favoritism is a core feature of
national politics. It is this belief that leads individuals to evaluate alternative candidates
in terms of their prospective favoritism intentions and inclines voters to chose co-ethnic
leaders over non-co-ethnics when given the chance.
3.2. From Individual Preferences to Group-level Outcomes
While the preference for co-ethnic leaders is widespread in Kenya, these
preferences do not lead automatically to ethnic bloc voting. As Ferree (2006, 2011)
argues, voters may arrive at divergent conclusions about the intentions of the leading
contenders. Bloc voting occurs only when voters within a particular ethnic segment
arrive at a shared conclusion regarding the candidates’ intentions. This section explores
the conditions that lead voters in ethnic communities to hold common beliefs and
explains why groups with a co-ethnic leader in the race often do so. It builds on recent
research that demonstrates that voters in multiethnic settings like Kenya rely on ethnic
cues to form expectations about candidates.
As others have shown, ethnicity serves as a useful source of information about
candidates’ favoritism intentions in settings, like Kenya, where voters expect leaders to
favor their own communities. Chandra (2004) argues, based on the Indian case, that

46
when voters expect ethnic favoritism they form judgments about which party will best
look after their groups’ interests by tallying the number of co-ethnics in positions of
power and authority across competing parties, a process she refers to as “counting
heads.” Likewise, Posner’s (2005) study of Zambia argues that because individuals
expect leaders to favor their own ethnic communities, “ethnicity provides insight into
how candidates will distribute patronage if they are elected” (p. 104). Generalizing these
insights, Ferree (2011) argues that in South Africa candidates’ racial identity serves as a
useful shortcut for voters seeking to form expectations about how alternative parties will
treat their group, both with regard to distributional choices as well as policies that have
less direct bearing on material outcomes. Studies from Kenya indicate that Kenyan
voters likewise rely on candidate ethnicity as a cue. Haugerud (1993), for example,
reports that, “Kenyans I talked with in both town and countryside in mid-1993 discussed
the nation’s political future in explicit ethnic and regional terms, and assumed that the
ethnic identity of a new president would define patterns of favoritism” (p. 42, emphasis
added). For Kenyans – as for voters in India, South Africa, and Zambia – ethnicity
provides a useful source of information about how candidates are likely to behave if
elected. While cues never substitute fully for complete information, in contexts like
Kenya where voters lack access to more substantial information sources, the ethnicity of
prospective leaders provides an easily-observable predictor of candidate behavior.21
Survey data collected shortly before Kenya’s 2007 election provide evidence that
Kenyan voters make inferences based on candidate ethnicity in the way described here.
21 A large literature on the use of cues has been developed from the study of mature democracies. Some important contributions include Downs (1957); Lupia and McCubbins (1998); Lupia (2002); Lupia (1994); Kuklinski and Hurley (1994); and Kuklinski and Quirk (2000).

47
The survey, conducted roughly two weeks before the election, asked respondents whether
they expected each of the three main presidential candidates – Kibaki, Odinga, and
Musyoka – to represent the interests of “all tribes equally” or “just some tribes only.”22
Figure 2.1 presents data for the three ethnic groups that had a co-ethnic candidate in the
race, the Kikuyu, Luo, and Kamba. The data show that voters in each group generally
held positive beliefs about the favoritism intensions of their co-ethnic candidate and
negative beliefs about the intentions of non-co-ethnic candidates. Most Kikuyus (95%)
believed that Kibaki would treat all tribes equally, and large majorities thought that the
non-co-ethnic candidates would favor some tribes at the expense of others, with 85% and
58% holding such views for Odinga and Musyoka respectively. Likewise, most Luos
(95%) expected that Odinga would treat all groups evenly, and again large majorities
believed that the non-co-ethnic rivals would favor some groups over others, with 88%
and 65% holding such expectations for Kibaki and Musyoka. The same pattern is evident
among Kamba respondents: most (86%) anticipated equitable treatment by Musyoka and
inequitable treatment by non-co-ethnic rivals (51% and 85% saw Kibaki and Odinga,
respectively, as exclusive, believing that these leaders would favor some groups at the
expense of others). Only an experimental test could confirm that these beliefs stem from
voters’ use of cues and not other information sources. Nonetheless, the data points to the
plausibility of the claim that Kenyan voters form beliefs based on observations of
candidate ethnicity. To be clear, the argument is not that voters rely solely on cues to
22 The question was, “If [candidate X] and his group emerges as the winners during the forthcoming General Elections, do you think he will represent equally the interest of all tribes or just some tribes only?”

48
form beliefs, but that cues provide one information source that is useful particularly when
other types of information are unavailable or difficult to obtain.
0
.2.4
.6.8
1
KIKUYUS LUOS KAMBASKibaki Odinga Musyoka Kibaki Odinga Musyoka Kibaki Odinga Musyoka
No responseCandidate represents some tribes onlyCandidate represents all tribes equally
Figure 2.1 Beliefs about Candidate Favoritism Intensions, 2007 Election
Following previous studies, I argue that Kenyans look to the ethnic identity of the
presidential candidates and to the broader ethnic profiles of their parties to determine
which party better includes trusted representatives from their own ethnic communities.
And given the highly centralized nature of Kenyan parties and institutions, voters place
greatest weight on the senior-most leaders within the parties. Thus, a party headed by a
co-ethnic leader is likely to be seen as a better vehicle for advancing the group’s interests
than an alternative party that contains many co-ethnics in lower positions but is headed
by a non-co-ethnic presidential aspirant.
The key difference between core and swing groups is that for voters that have a
co-ethnic leader in the presidential race, ethnic cues are typically unambiguous, leading
members of the community to arrive at shared expectations. The ethnicity of the

49
presidential candidates provides a strong signal, and it is relatively unlikely that voters
within a particular ethnic segment will reach divergent conclusions when comparing a
party headed by a co-ethnic to a party headed by a non-co-ethnic. This convergence is
most likely when other senior political leaders from the group coordinate behind the
group’s presidential aspirant, as is often the case. In the 2007 race, for example, nearly
all senior Kikuyu political leaders allied with Kibaki’s Party of National Unity and most
members of the Luo political elite allied with Odinga’s Orange Democratic Movement.
Chapter Five, which examines candidate recruitment, shows that senior leaders generally
have strong electoral incentives to coordinate around co-ethnic presidential aspirants.
When this occurs, all signs point in the same direction, and there will typically be little
ambiguity about which party best represents to the community’s needs and wants.
For voters in groups that do not have a co-ethnic leader in the presidential race,
the electoral calculus is more complicated. Because these voters face a choice between
multiple non-co-ethnics, the identity of the presidential candidates is less useful. And
when trusted elites from their communities divide across multiple parties, ethnic cues
point in different directions. In such cases, voters within a particular ethnic segment may
reasonably arrive at divergent beliefs about which presidential candidate will best
represent the group’s interests, leading members of the group to divide their vote across
multiple parties.
To illustrate this point, consider Luhya voters in the 2007 race. The leading
presidential candidates in 2007, Kibaki and Odinga, both chose Luhyas as their vice-

50
presidential running mates.23 And both parties recruited a full slate of Luhya
parliamentary candidates to run on their tickets in Luhya-majority constituencies.24 Data
on beliefs about the candidates’ favoritism intentions among Luhya voters show that
Luhyas held divergent opinions. Figure 2.2 shows that while Luhyas generally held more
positive beliefs about Odinga’s intentions (68% believed that he would treat all groups
equally), a substantial share also held positive beliefs about Kibaki (36%). As a result,
Luhya voters were less uniform in their voting intentions, with 70% supporting Odinga
and 25% Kibaki.
0.2
.4.6
.81
LUHYASKibaki Odinga
No responseCandidate represents some tribes onlyCandidate represents all tribes equally
Figure 2.2 Beliefs about Candidate Intentions among Luhya Respondents
In sum, this section argues that the preference for co-ethnic politicians leads to
ethnic bloc voting when members of a particular community hold common expectations
about the candidates’ favoritism intentions. Ethnicity is no less important to swing
23 Kibaki’s running mate was Moody Awori, and Odinga’s was Musalia Mudavadi. 24 There were 22 Luhya-majority parliamentary constituencies in 2007. Kibaki’s party (PNU) and Odinga’s (ODM) both ran at least one candidate in each of these constituencies.

51
voters, who are equally attuned to the candidates’ favoritism intentions as core voters.
But for groups without a co-ethnic in the race, it is more difficult to predict from the
outset how these groups will vote. It is this difference that defines core and swing
communities in Kenya’s multiethnic democracy.
4. Empirical Support from the 2007 Election
This section draws on survey data to provide support for the argument outlined in
this chapter. The argument rests on the claims that 1) voters choose between alternative
candidates based on beliefs about the candidates’ favoritism intentions, and 2) that the
extent of bloc voting at the group level depends on the distribution of these beliefs within
ethnic communities. To support these claims, I first estimate a series of vote choice
models using survey data collected prior to Kenya’s 2007 election to demonstrate that
voters’ beliefs about candidates’ favoritism intentions are related to individual voting
intentions in the expected way. I then show that variation in ethnic bloc voting in 2007
can be explained by the extent to which voters from particular communities held uniform
beliefs about the candidates’ favoritism intentions.
Survey data come from the opinion poll of 6,111 respondents cited earlier. As
noted, the survey asked respondents whether they believed each of the three main
presidential candidates – Kibaki, Odinga, and Musyoka – would represent the interests of
“all tribes equally” or “just some tribes only.”25 I treat a response of “some tribes only”
to mean that the respondent viewed the candidate as exclusive and expected that the
25 The question was, “If [candidate X] and his group emerges as the winners during the forthcoming General Elections, do you think he will represent equally the interest of all tribes or just some tribes only?”

52
candidate would favor other ethnic communities at the expense of her own group.
Likewise, I interpret a response of “all tribes equally” to mean that the respondent viewed
the candidate as inclusive and expected that that the candidate would treat her ethnic
group at least as well as other groups.
To examine the link between these beliefs and electoral decisions, I use
multinomial logit, which is appropriate for vote choice models with three or more
candidates (Dow and Endersby 2004). The dependent variable comes from a question
that asked respondents who they would vote for “if the election were held now.” As
controls, I include two subjective measures of the president’s job performance that come
from questions about satisfaction with the government’s job performance and whether
respondents’ economic situation had improved over the last year.26 I also include several
demographic variables that have proven to be relevant in recent studies of electoral
behavior in Africa (e.g., Battle and Seely 2010; Bratton and Kimenyi 2008; Fridy 2007;
Norris and Mattes 2009). Education is an ordinal variable that takes seven possible
values.27 Wealth is measured by the survey enumerators using a four-point scale based
primarily on the type of dwelling in which respondents live. Age is dichotomized
between those over and under 40.28 Gender is a dichotomous variable that takes on a
value of 1 for female respondents. In all models, the incumbent president, Kibaki, is the
reference category. 26 Performance ratings come from a question that asked, “To what extent do you approve of the President’s performance?” Responses were measured on a four-point scale (highly approve, somewhat approve, somewhat disapprove, highly disapprove). Perceptions of economic well-being come from a question that asked, “Compared to one year ago, would you say that your family’s economic situation is better, about the same, or worse than it was a year ago?” 27 The coding is as follows: no formal education, primary school not completed, primary completed, secondary not complete, secondary completed, tertiary college, university and post university. 28 I also included age as a continuous variable and found that it was not significant in this form. The choice of 40 as a cut-off was arbitrary; other cut-offs in the range between 30 and 40 were also significant.

53
The results are shown in Table 2.5. Model 1, which includes only beliefs about
the candidates’ ethnic intentions, serves as the baseline, while Model 2 includes all
control variables. The results show that voters’ beliefs about the candidates’ favoritism
intentions are strongly associated with electoral decisions. Voters who saw any of the
three candidates as exclusive (expected the candidate to represent “some tribes only”)
were more likely to support the alternative choices. Specifically, voters who saw Kibaki
as exclusive were more likely to support Odinga and Musyoka. Those who saw Odinga
as exclusive were likewise more likely to support both alternatives, Kibaki and Musyoka.
And those who saw Musyoka as exclusive were more likely to embrace Kibaki (though
not more likely to support Odinga). Model 2 shows that these findings are robust to the
inclusion of the control variables.
Performance ratings are related to vote choice in the expected way: respondents
who gave the incumbent president high marks for performance were more likely to
support him over the opposition candidates, and those who reported that their family was
economically better off than a year ago were more likely to support the president over his
rivals. There is scattered evidence that demographic factors mattered: more educated
respondents were more likely to support Musyoka over Kibaki, and women were more
likely to support Odinga over Kibaki. Age and wealth were not associated with electoral
decisions.
The results indicate that beliefs about the candidates’ favoritism intentions can
account for a large share of variation between voters. The sparse baseline model,
containing only views about the candidates’ ethnic intentions, is quite powerful,

54
accurately predicting the voting intentions of 86.5% of the sample.29 The inclusion of
control variables in Model 2 increases the percent accurately predicted to 89.4%, a
modest increase of about 3%.
Table 2.5 Multinomial Logit Models of Vote Choice Model 1 Model 2 Odinga Musyoka Odinga Musyoka Believe Kibaki is exclusive 4.54** 3.84** 3.42** 2.86** (0.00) (0.00) (0.00) (0.00) Believe Odinga is exclusive -4.36** 0.85** -3.82** 1.25** (0.00) (0.00) (0.00) (0.00) Believe Musyoka is exclusive 0.00 -3.32** 0.14 -3.19** (0.98) (0.00) (0.45) (0.00) Approve of president’s performance -1.48** -1.49** (0.00) (0.00) Economy better -1.06** -0.61** (0.00) (0.00) Education 0.07 0.13* (0.17) (0.02) Age (under 41) 0.25 -0.02 (0.12) (0.92) Female 0.24+ -0.08 (0.09) (0.60) Wealth 0.12 0.17 (0.22) (0.12) Constant 0.16* -2.07** 2.46** 0.30 (0.04) (0.00) (0.00) (0.58) Observations 5742 5429 Pseudo R-squared .64 .70 % predicted correctly 86.5% 89.4% Robust p values in parentheses. + significant at 10%; * significant at 5%; ** significant at 1%
29 This measure was created by first generating the predicted probability of voting for each of the three candidates for each voter. I then counted the prediction as correct if the predicted probability of voting for the candidate actually preferred by the voter was greater than the predicted probability of voting for each of the alternative candidates.

55
To show that these beliefs are important both for core and swing groups, I rerun
the baseline model separately for groups that had a co-ethnic leader in the race (Kikuyus,
Luos, Kambas) and for groups that did not. The results, shown in Table 2.6, indicate that
beliefs about the candidates’ favoritism intentions are no less relevant to voters choosing
between multiple non-co-ethnic leaders. In fact, the results show that the model is
slightly better at predicting voting intentions for voters who did not have a co-ethnic in
the 2007 race (88.8%) than for those who did (84.9%).
Table 2.6 Multinomial Logit Models of Vote Choice Model 1: Co-ethnic
candidate in the race Model 2: No co-ethnic candidate in the race
Odinga Musyoka Odinga Musyoka Believe Kibaki is exclusive 5.72** 4.27** 3.92** 4.06** (0.00) (0.00) (0.00) (0.00) Believe Odinga is exclusive -5.46** 0.33 -3.69** 0.57+ (0.00) (0.17) (0.00) (0.06) Believe Musyoka is exclusive 0.09 -3.04** -0.19 -4.28** (0.80) (0.00) (0.28) (0.00) Constant -0.43** -1.28** 0.50** -3.18** (0.00) (0.00) (0.00) (0.00) Observations 2,185 3,557 Pseudo R-squared .65 .63 % accurately classified 84.9% 88.8% Robust p values in parentheses + significant at 10%; * significant at 5%; ** significant at 1%
It is not possible to rule out endogeneity in these results. Voters may choose their
preferred candidate for some other reason and then rationalize their expectations
regarding the candidates’ favoritism intentions. While there is no way to fully address
this concern with observational data, the results in this section are consistent with the
proposition that a strong relationship exists between voters’ beliefs about the candidates’

56
favoritism intentions and electoral decisions. And while the results show that other
factors – including performance ratings – also matter, beliefs about favoritism intentions
are a powerful predictor of individual voting decisions.
The second proposition of the argument outlined in this chapter is that the
distribution of voters’ beliefs at the group level explains the degree of bloc voting across
communities. To support this claim, I plot voting intentions against beliefs at the group
level. Voting intentions are expressed as the percentage of each group that supported the
incumbent president, Kibaki. Beliefs are measured as the percentage of group members
who held inclusive beliefs about Kibaki (i.e., that Kibaki would represent “all tribes
equally”). I include all ethnic groups for which the survey contains at least 50
observations. Figure 2.3, which shows a scatterplot of these group-level measures along
with fitted values, provides evidence of a strong association between beliefs and voting
intentions at the group level. Groups that were nearly unanimous in the belief that Kibaki
was inclusive (the Kikuyu, Meru, and Embu) were united in their intentions to support
the president. Groups that held the opposite beliefs (the Luo and Kalenjin) were nearly
uniform in their intentions to support the opposition. And groups that fell in the middle
(e.g., the Taita, Kisii, Somali) were less united in their voting intentions.

57
Kikuyu
Kamba
Luo
Kisii
Luhya
Somali
MeruEmbu
Kalenjin
MijikendaTaitaMaasai
Pokot
Turkana
0%10
%40
%60
%80
%10
0%Ki
baki
Vot
e Sh
are
0% 10% 40% 60% 80% 100%Percent believes Kibaki inclusive
Fitted values 95% CI
Figure 2.3 Vote Choice and Favoritism Beliefs at the Group Level
At the group level, then, the distribution of beliefs about the candidates’
favoritism intentions is an excellent predictor of the strength of ethnic bloc voting. As
with the individual-level findings reported earlier, the association in Figure 2.3 cannot
provide definitive evidence of a causal relationship. It is again possible that the causality
runs the other way – i.e., that voters’ electoral preferences drive their views about the
candidates’ favoritism intentions. Nonetheless, the results offered here are consistent
with the claim that beliefs about the candidates’ favoritism intentions drive electoral
choices at the individual and group level.

58
5. Conclusion
I have argued that elections in Kenya take place within the context of well-
established voting patterns that define core and swing groups and influence the types of
campaign appeals parties use. I show that the expectation that politicians will favor some
groups at the expense of others inclines voters to evaluate alternative candidates in terms
of the candidates’ favoritism intensions and leads voters to prefer co-ethnics over non-co-
ethnics. As a result of the preference for co-ethnic leaders, presidential candidates can
generally count on strong support from their own communities. For voters in these
groups, there is typically little confusion about which leader will best look after their
group’s interests. However, while presidential aspirants can generally count on strong
support from their own communities, the small size of ethnic groups means that they
must seek support beyond their core co-ethnic support bases if they are to be successful.
Groups without a co-ethnic in the race serve as the swing: relative to core groups, these
communities are more likely to hold divergent preferences and therefore to be receptive
to the parties’ persuasive efforts. As demonstrated in the next chapter, competition for
the hearts and minds of swing voters is at the center of electoral politics in Kenya, and to
a large extent this competition drives the campaign strategies and tactics chosen by
parties during the campaigns.

59
Appendix 2.1: Ecological Inference Methods
To estimate voter preferences in the 1992, 1997, and 2002 elections I use the
multinomial-dirichlet method of ecological inference (EI) from Rosen et al. (2001). The
method is designed to yield estimates from larger tables (i.e., where there are more than
two groups and outcomes). It is available as part of Zelig in R; the software package,
ei.RxC, was developed by Wittenberg, Alimadhi, Bhaskar, and Lau (2007).
The EI method works by first calculating bounds on possible values for quantities
of interest (e.g., the share of Kalenjins who voted for Moi in 1992) and then using
statistical methods to estimate where the actual value lies within the range proscribed by
the bounds. The method works best when the geographic units for which data is
available are relatively homogenous with regard to ethnic groups and electoral outcomes,
because this allows for the calculation of narrow bands in the first step. I match electoral
outcomes to census information at the district level, using the 1989 census data (the only
census from which sub-national data on ethnicity is available). Unfortunately, the census
data cannot be disaggregated below the district level, which means that the data for each
election includes information from 41 units. Fortunately, districts in Kenya are relatively
homogenous with regard to both ethnicity and electoral outcomes. As an example,
Figure 2.4 shows a histogram of the vote share for the leading presidential candidate at
the district level in the 1992 election. The data shows that the top candidate received
70% or more of the district-level vote in more than half (22 of 41) districts. Figure 2.5
shows data on the size of the largest ethnic group at the district level. The data shows
that the largest group makes up 70% or more of the population in 65% of districts (27 of
41).

60
I use data from the 1992 race to demonstrate that for most ethnic groups relatively
narrow bounds can be generated based on the available data. The race included four
main presidential candidates: Moi, Matiba, Kibaki, and Odinga. Because the goal is to
examine ethnic bloc voting, I combine the vote share for the two Kikuyu candidates,
Kibaki and Matiba. Figure 2.6 shows the upper and lower bounds for the leading
presidential candidate in each of Kenya’s eight largest ethnic groups. For example, for
the Kalenjin I show the bounds for the share that supported Moi (bounds on the share that
supported Kibaki/Matiba or Odinga are not shown for the sake of space). Each figure
shows the bounds for the 41 districts (each vertical line represents the range of possible
values for one district).
The figures in 2.6 show that the data for most groups contains considerable
information. Consider the plot for Kalenjin support for Moi. The figure shows that
Kalenjins make up 70% or more of the population share in five districts. And because
Moi was the overwhelming favorite in these districts, the range of the upper and lower
bounds for Kalenjin support for Moi in those districts is relatively narrow (ranging
05
1015
2025
Perc
ent
0 .2 .4 .6 .8 1Vote Share of Leading Candidate in District
Figure 2.4 Vote Share of Leading Candidate, 1992
Figure 2.5 Size of Largest Ethnic Group
010
2030
40Pe
rcen
t
0 .2 .4 .6 .8 1Largest Ethnic Group in District

61
between .9 and 1 in each of the five districts). This means, in other words, that within
those five districts it is possible to conclude with certainty that the true value lies
somewhere between .9 and 1. While this is highly informative for the five districts, the
goal is generate national-level estimates. King (1997) has shown that national-level
bounds are simply the weighted average of the district-level bounds. From the data in
Figure 2.6, it is therefore possible to conclude that the share of Kalenjins who voted for
Moi in 1992 lies somewhere between .73 and 1, simply by taking the weighted average of
the district-level bounds. Values for most other groups likewise fall within relatively
narrow bounds. The major exceptions is the Luhya. Electoral outcomes are less uniform
in the districts where Luhyas predominate, and Luhyas are less concentrated in particular
districts. As a result, the bounds on Luhya voting patterns are relatively wide.
The second step in the EI process is to estimate each quantity of interest within
the ranges provided by the bounds. As noted, I use the method developed by Rosen et al.
(2001). The results for the eight largest ethnic groups are presented in Table 2.7, which
also shows aggregate bounds for each group. For comparative purposes, I also present
estimates generated using the method developed by King (1997). The King method
requires that data be aggregated into a 2x2 table. Thus, for example, to estimate the share
of Kalenjins who supported Moi in 1992, I aggregate the ethnic data into Kalenjin / not
Kalenjin and the electoral data into Moi / not Moi. The results are reassuring: for all
groups the estimated values from Rosen et al. and King differ by no more than .11, and
for several groups the difference is much smaller.

62
Figure 2.6 Bounds on Support for Leading Candidates (1992)
0.2
.4.6
.81
Boun
ds
0 .2 .4 .6 .8 1Kalenjin Share
Kalenjin Support for Moi
0.2
.4.6
.81
Boun
ds
0 .2 .4 .6 .8 1Kikuyu Share
Kikuyu Support for Kibaki/Matiba0
.2.4
.6.8
1Bo
unds
0 .2 .4 .6 .8 1Luo Share
Luo Support for Odinga
0.2
.4.6
.81
Boun
ds
0 .2 .4 .6 .8 1Kamba Share
Kamba Support for Kibaki/Matiba
0.2
.4.6
.81
Boun
ds
0 .2 .4 .6 .8 1Kisii Share
Kisii Support for Kibaki/Matiba
0.2
.4.6
.81
Boun
ds
0 .2 .4 .6 .8 1Meru Share
Meru Support for Kibaki/Matiba
0.2
.4.6
.81
Boun
ds
0 .2 .4 .6 .8 1Luhya Share
Luhya Support for Kibaki/Matiba
0.2
.4.6
.81
Boun
ds
0 .2 .4 .6 .8 1Mijikenda Share
Mijikenda Support for Moi

63
Table 2.7 Comparison of EI Estimates
Aggregate
bounds EI Estimates
Lower Upper
Rosen et al. 2001
King 1997
Kalenjin support for Moi .73 1 .99 .99 Kikuyu support for Kibaki/Matiba .72 1 .98 .96 Luo support for Odinga .68 .97 .97 .87 Luhya support for Kibaki/Matiba .22 .55 .39 .33 Kamba support for Kibaki/Matiba .36 .63 .61 .50 Kisii support for Kibaki/Matiba .21 .43 .25 .31 Meru support for Kibaki/Matiba .67 .86 .76 .82 Mijikenda support for Moi .60 .93 .73 --
Note: The value for Mijikenda support for Moi could not be calculated using the King (1997) method.
Another way to validate the EI approach is to compare the results to survey data.
Table 2.8 shows a comparison between EI estimates generated using the Rosen et al.
(2001) method for the eight largest ethnic groups and a residual “other “category across
the three leading presidential candidates in the 2007 race, Kibaki, Odinga, and Musyoka.
The estimates are compared to those obtained from a nationwide survey conducted
roughly two weeks before the 2007 election. The results show a close correspondence
for most ethnic groups, with a difference of no more than .1 between the EI estimates and
the survey estimates. The one notable exception is again the Luhya, for which larger
discrepancies are noted in support for Kibaki and Odinga, relative to the survey data.
The reason is that in the 2007 race, as in previous races, the Luhya community was more
evenly divided across the leading candidates than other ethnic groups. As a result, the
upper and lower bounds for Luhyas are wider, and the resulting estimates generated by
the EI approach are less precise than for other groups.

64
Table 2.8 Comparison between EI Results and Survey Data for 2007
Kibaki Odinga Musyoka
EI Survey EI Survey EI Survey
Kikuyu .98 .95 .01 .04 .01 .01 Luhya .40 .26 .54 .73 .05 .01 Luo .01 .02 .98 .97 .02 .01 Kalenjin .02 .07 .94 .92 .04 .01 Kamba .18 .15 .10 .06 .72 .79 Kisii .32 .40 .56 .57 .13 .03 Meru .88 .89 .04 .10 .08 .01 Mijikenda .27 .36 .66 .62 .07 .02 Other .48 .39 .49 .57 .03 .04
Finally, it is important to note that data on turnout by ethnic group is not available
in Kenya, and I therefore assume constant turnout rates for all groups in the EI methods.
Survey data collected by the Afrobarometer on turnout rate from the 2002 election
suggest that this assumption is reasonable. The data, presented in Figure 2.7, come from
the Afrobarometer Round 3 survey (n=1,278), which was conducted on Sept. 6-28, 2005.
It shows little variation in self-reported turnout rates across communities.
0%20%
40%
60%
80%
100
Turnout
Kikuyu Luhya Luo Kalenjin Kamba Kisii Meru Mijikenda Other
Figure 2.7 Estimated Turnout Rates by Ethnic Group in 2002 (with 95% CIs)
65
Chapter 3.
Ethnic Groups and Campaign Strategy
1. Introduction
This chapter explains how presidential candidates and their parties allocate
campaign effort across ethnic communities in Kenya’s multiethnic democracy. Much of
the existing ethnic politics literature assumes that during elections in multiethnic settings
candidates focus their efforts solely on rallying voters around shared ethnic identities.
Snyder (2000), for example, argues that “political entrepreneurs who want to seize or
strengthen state power find that traditional cultural networks based on a common religion
or language provide convenient channels to mobilize backers” (p. 271). Similarly,
Chandra argues that in multiethnic countries where elected leaders have discretion over
state-controlled resources, “we should see a self-enforcing equilibrium of ethnic
favouritism, in which voters mainly target co-ethnic politicians for favours, and
politicians mainly target co-ethnic voters for votes” (Chandra 2004, 64, emphasis added).
These claims resonate with a long-standing tradition in the ethnic politics literature that
views the electoral game as one of “mobilizing your own” – not reaching across ethnic
lines to attract support from other communities (e.g., Horowitz 1985; Lijphart 1977;
Rothschild 1981).
In contrast to these accounts, I show that in Kenya presidential candidates focus
their campaign efforts on swing communities – ethnic groups that do not have a co-ethnic

66
candidate in the presidential race. As in most parts of Africa, ethnic groups in Kenya are
relatively small, and parties must garner support from multiple ethnic communities if
they seek to be competitive at the national level. The need to attract support from
multiple communities presents presidential candidates (and their parties) with a basic
dilemma: how much time and resources to devote to courting co-ethnics and how much
to allocate to out-groups during the campaign? I demonstrate that in Kenya parties have
incentives to invest in pursuing both, and that they divide labor between the two
activities. Presidential candidates delegate the job of mobilizing co-ethnic supporters to
lower-level actors in their ethnic strongholds, leaving them free to devote the bulk of
their time on the campaign trail to hunting for votes among out-groups. Moreover, I
show that the leading presidential candidates converge on the same sets of swing groups,
rather than courting divergent, non-overlapping coalitions. And, consistent with the
explanation developed below, the allocation of campaign effort between core co-ethnic
voters and non-co-ethnic swing voters varies according to the strength of candidates’ co-
ethnic support at the start of the race.
To support these intuitions, I draw on data collected during Kenya’s 2007
elections. To examine the allocation of campaign effort across ethnic groups, I use data
on the location of campaign rallies held by the leading presidential candidates in the four
months prior to the election. To complement this data, I draw on survey data collected
after the election to examine household-level contact by the parties during the race.
The structure of this chapter is as follows. The next section develops the
argument in greater detail. I then turn to data on the location of campaign rallies,
providing evidence of a consistent pattern of ethnic targeting during the 2007 race. Next,

67
I draw on survey data on campaign contact at the household level to show that while the
presidential candidates spent relatively little time in their home ethnic areas, their parties
did not neglect the important job of mobilizing co-ethnic voters. The final sections
explore an alternative explanation and concludes.
2. Campaign Strategy in Kenya’s Multiethnic Democracy
Candidates and parties work hard to reach particular sub-groups during
campaigns. Accounts from campaign strategists frequently note that the first step in any
campaign is to divide the electorate into groups: those who are solidly on your side, those
who you have little chance of reaching, and those who are somewhere in between. Based
on this, strategists then decide which groups to court and which to avoid. As one scholar
of campaigns notes, “Campaigns are not designed to reach everyone. Targeting involves
categorizing different groups of voters, identifying their political preferences, and
designing appeals to which they are likely to respond. It [targeting] is the foundation of
virtually every aspect of campaign strategy” (Herrnson 2000, 189). While there have
been a number of excellent studies of campaign targeting in mature democracies, much
less is known about emerging democracies like Kenya.
The argument offered here draws on the existing literature on distributional
politics (Cox and McCubbins 1986; Dixit and Londregan 1996; Stokes 2005; Diaz-
Cayeros et al. 2007) as well as research on the allocation of campaign resources (Bartels
1998, 1985; Brams and Davis 1974; Colantoni, Levesque and Ordeshook 1975; Snyder
1989; Stromberg 2008). These works distinguish between mobilization (efforts to
increase turnout among existing supporters) and persuasion (efforts to attract new

68
supporters). The core insight from these works, on which I build, is that if the goal of
campaigning is persuasion, parties ought to focus their efforts on areas where marginal
voters are concentrated. If, on the other hand, the goal is mobilization, candidates ought
to target areas where their existing supporters are found in large numbers. Given that
presidential candidates in Kenya typically enter the race with strong support from co-
ethnic voters, there will generally be few potential swing voters available for conversion
in their ethnic strongholds, or in opponents’ core ethnic areas. This means that if the goal
of the campaign is to attract new supporters, parties ought to target areas primarily
inhabited by non-co-ethnic swing groups that do not have a candidate in the race. If, on
the other hand, the goal is mobilization, then the parties ought to target areas where there
is a high density of strong supporters, and the highest concentration of existing supporters
is typically in their core co-ethnic areas.
Much of the existing literature argues that parties invest only in persuasion or
mobilization (Horowitz 1985; Rabushka and Shepsle 1972; Cox and McCubbins 1986;
Dixit and Londregan 1996; Stokes 2005; Nichter 2008). I argue, by contrast, that in
Kenya there are potential gains to be had both from persuasion and mobilization.
Typically at least half of the electorate does not have a co-ethnic candidate in the race,
making persuasion a viable strategy. At the same time, turnout rates in Kenya have
historically been relatively low, meaning that mobilization is also likely to yield positive
returns.30 Moreover, parties are likely to face considerable uncertainty regarding the
relative return on these alternative investments. Within the scholarly literature on
30 In the three elections since the re-introduction of multiparty elections in 1991, the official turnout rates have been 69% in 1992, 67% in 1997, and 57% in 2002.
69
campaigns, there are important on-going debates about the effectiveness of mobilization
and persuasion (Gerber and Green 2000; Imai 2005; Gerber and Green 2005; Finkel
1993; Hillygus and Shields 2008; Vavreck 2008). These debates attest to the fact that
even in mature democracies considerable uncertainty exists regarding the extent of
possible returns from each type of activity. In emerging democracies like Kenya,
uncertainty is often greater because parties are younger and have less experience and data
on which to draw. In this context, investing in both persuasion and mobilization is a way
for parties to hedge their bets under uncertain conditions. If the parties knew with
certainty that persuasion, for example, would yield the greater return, they might invest
solely in the pursuit of swing groups. Absent this knowledge, parties invest in both
persuasion and mobilization, anticipating positive returns from both.
In Kenya, then, the interesting question is not whether parties focus their
campaign efforts only on co-ethnics or out-groups, but how they use their time and
resources to reach both. They do so, I argue, by dividing campaign duties between
different actors. Presidential candidates delegate the job of mobilizing core co-ethnic
supporters to a variety of lower-level actors within their ethnic strongholds, leaving the
candidates free to focus their efforts on voters in swing groups.
There are three distinct benefits that come from delegating the mobilization of
core, co-ethnic supporters to lower-level actors. First, presidential candidates seek to
avoid being seen as too closely affiliated with their core ethnic bases. The need to garner
support across ethnic lines means that the candidates must project an inclusive image to
out-groups. If a candidate is viewed as the “champion” of his own group, he will have
little appeal to members of other groups. When the candidates hold rallies in their home

70
ethnic areas, these events tend to be well attended by the most loyal and ardent
supporters. The massive outpouring of support at these “homecoming” rallies conveys
the wrong message to the rest of the country, reinforcing the idea that the candidate is
closely linked to his own ethnic group. The need to project an inclusive image therefore
discourages the presidential candidates from campaigning extensively in their home
ethnic areas.
Second, candidates have less need to attend to campaign activities in their home
ethnic strongholds than in others parts of the country. As I will show in Chapter Five,
parties in Kenya are generally able to monopolize the recruitment of high-quality
candidates for lower-level races within their home ethnic areas. This means that within
their strongholds, the presidential candidates are assured that they have a competent team
working on their behalf, unlike the swing areas where the battle on the ground is more
evenly fought with rival parties. Given the advantage at home, the candidates can
delegate campaign duties in their strongholds to a greater extent than is possible in the
swing areas.
Within their ethnic strongholds, the presidential candidates can also rely on
interest groups and social networks to attend to mobilization. In the 2007 race, for
example, a number of loosely-affiliated groups formed to support President Kibaki’s re-
election drive. The main group, Kibaki Tena, was primarily made up of wealthy co-
ethnic Kikuyu businessmen, who operated largely in the candidate’s home ethnic area,
the Central Province. The parties can also tap strong social networks in their home areas.
The main opposition party in 2007, ODM, for example, employed a mobilization strategy
in its core Luo area in which voters were called upon to ensure that friends and family

71
made it to the polls on election day.31 Similarly, in PNU’s core ethnic area, there was an
organized effort to wake up voters early on election day and make sure they made it to
the polls, and many business owners closed their shops and bars until everyone had voted
(Kagwanja 2009, 375). The strength of these local actors allows the parties to send the
presidential candidates and other top leaders off to work on converting voters in the
swing communities while leaving the job of mobilizing co-ethnic supporters to others.
Third, different actors have comparative advantages in different types of
activities. Presidential aspirants are uniquely qualified to pursue potential swing voters.
In Kenya’s highly personalized political system, converting voters from out-groups
requires establishing credibility with members of the target communities. While
campaign promises can easily be dismissed as cheap talk, holding a rally in a target
group’s home area sends a more costly signal of the candidate’s commitment to that
group. At rallies in swing areas presidential candidates appear alongside local leaders
from the target group – a symbolic gesture that communicates that the candidates has
been endorsed by elites who have greater credibility with the local population. For this
signal to be effective, presidential candidates must be present. At the same time, lower-
level candidates, interest groups, and social networks are better suited for mobilizing core
supporters within the parties’ strongholds because they operate outside the media
spotlight. These actors therefore have greater latitude to engage in divisive ethnic
appeals that might increase voters’ motivation to show up on election day. Anecdotal
evidence from the 2007 race suggests that the most divisive and crude ethnic appeals
were often made by these lower-level actors rather than top party leaders (KNCHR
31 Interview with ODM senior campaign strategist, Nairobi, September 27, 2007.

72
2008). Unlike the presidential candidates, lower-level actors can engage in the dirty
work of whipping up the base without worrying about the need to attract support from
multiple communities. For all of these reasons, dividing labor between party leaders and
lower-level actors is a beneficial strategy.
To this point, the argument has assumed that presidential candidates enter the race
with universal support from co-ethnic voters. In practice, however, there may be
variation in this regard, as was the case in the 2007 race described below. The degree of
dominance with co-ethnic voters affects campaign strategies in two ways. First, when the
candidates’ co-ethnic support is less secure, there will be potential swing voters within
their own ethnic communities. As a result, candidates will have greater incentives to
invest in persuasion within their core ethnic strongholds, increasing the amount of time
they allocate to campaigning in their core ethnic areas. Second, when a candidate’s co-
ethnic support is weak, opponents are more likely to believe that the candidate’s group
will be available for conversion, increasing the likelihood of incursions on rivals’ home
terrain. In short, candidates that enter the race without the full support of their ethnic
community will spend more time in their ethnic strongholds and will face a greater
challenge from rivals on their home turf.
To summarize, I argue that in Kenya presidential candidates will spend relatively
little time in their own ethnic areas, given that they enter the race with strong support
from co-ethnics and can delegate the job of mobilizing these supporters to local-level
actors. At the same time, they will spend little time campaigning in each other’s home
ethnic areas, since they have little chance of garnering support in these areas. If these
claims are correct, then the candidates should spend the bulk of their time on the

73
campaign trail courting those groups that do not have a co-ethnic candidate in the race.
These propositions should hold most strongly for candidates that enter the race with the
full support of co-ethnic voters; those that do not will have greater incentive to allocate
campaign effort to their home ethnic areas. And, despite the focus on non-co-ethnic
swing groups, parties will not neglect the important job of mobilizing co-ethnic
supporters; this task will be left to lower-level actors in their respective ethnic
strongholds.
3. Data
I examine the observable implications of the argument outlined above using data
from Kenya’s 2007 election. The presidential race was a tightly-fought contest between
the incumbent president, Kibaki, and the main challenger, Odinga. The third-place
candidate, Musyoka, was never a viable contender; his share of the vote hovered around
8-10% throughout the campaign period. The final results showed Kibaki winning by a
narrow margin, though electoral fraud is thought to have been widespread and the best
available data suggest that Odinga was in all likelihood the actual winner (Gibson and
Long 2009).
Data collected prior to the start of the campaigns indicates that the two leading
candidates – Kibaki and Odinga – entered the race with near-universal support from co-
ethnic voters. Table 3.1 shows voting intentions by ethnic community from a survey
conducted in September 2007, about three months before the election and before the main
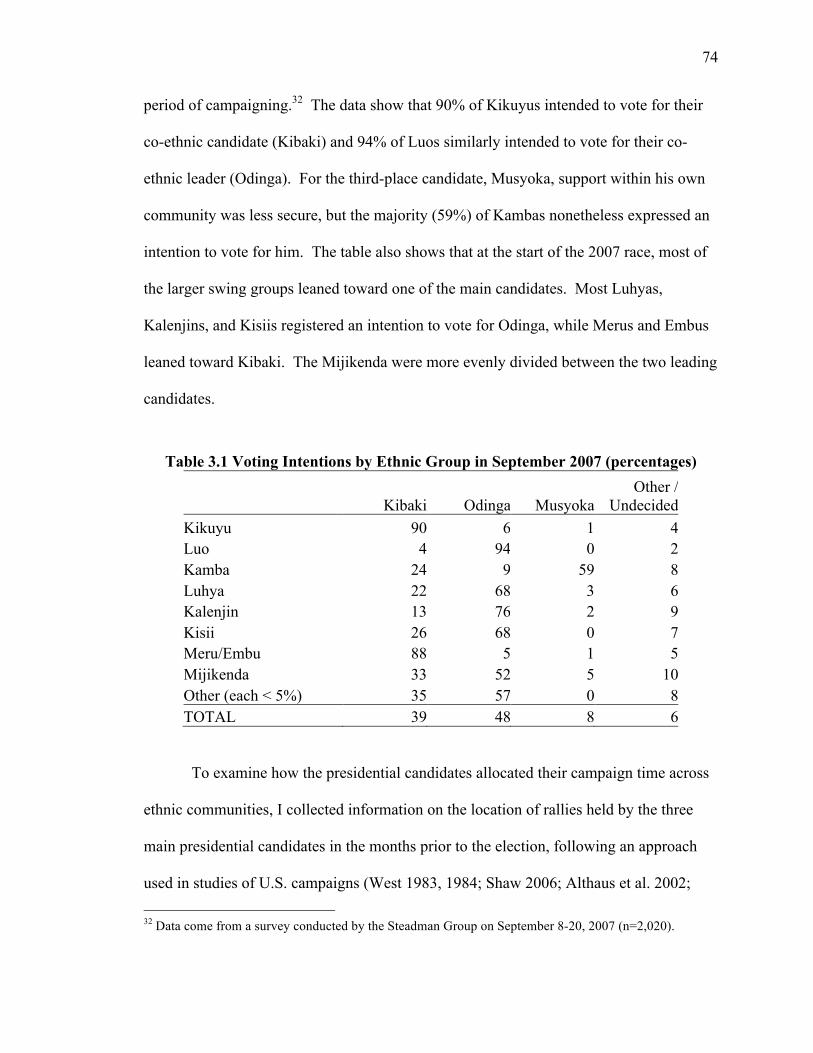
74
period of campaigning.32 The data show that 90% of Kikuyus intended to vote for their
co-ethnic candidate (Kibaki) and 94% of Luos similarly intended to vote for their co-
ethnic leader (Odinga). For the third-place candidate, Musyoka, support within his own
community was less secure, but the majority (59%) of Kambas nonetheless expressed an
intention to vote for him. The table also shows that at the start of the 2007 race, most of
the larger swing groups leaned toward one of the main candidates. Most Luhyas,
Kalenjins, and Kisiis registered an intention to vote for Odinga, while Merus and Embus
leaned toward Kibaki. The Mijikenda were more evenly divided between the two leading
candidates.
Table 3.1 Voting Intentions by Ethnic Group in September 2007 (percentages)
Kibaki Odinga Musyoka Other /
Undecided Kikuyu 90 6 1 4 Luo 4 94 0 2 Kamba 24 9 59 8 Luhya 22 68 3 6 Kalenjin 13 76 2 9 Kisii 26 68 0 7 Meru/Embu 88 5 1 5 Mijikenda 33 52 5 10 Other (each < 5%) 35 57 0 8 TOTAL 39 48 8 6
To examine how the presidential candidates allocated their campaign time across
ethnic communities, I collected information on the location of rallies held by the three
main presidential candidates in the months prior to the election, following an approach
used in studies of U.S. campaigns (West 1983, 1984; Shaw 2006; Althaus et al. 2002;
32 Data come from a survey conducted by the Steadman Group on September 8-20, 2007 (n=2,020).

75
Jones 1998; Herr 2002). Because ethnic groups are geographically concentrated, data on
the location of campaign rallies provides a useful indicator of which groups the
candidates targeted. I collected all articles about campaign events from Kenya’s two
largest daily newspapers, The Nation and The Standard, during the four months prior to
the election (August 27 to December 27, 2007).33 In total I collected 449 articles,
yielding a dataset with information on 279 individual rallies. I counted a rally as any
public event at which the candidates spoke to the public, regardless of the size of the
audience. Church attendance and funerals were not included, unless the candidate
addressed the crowd. Press conferences were not included, since these were geared
toward the media, not a local audience.
Before proceeding, it is important to address concerns about possible sources of
bias in the data. One concern is that the newspapers might have covered rallies in urban
areas more extensively than in hard-to-reach rural locations. Given that urban areas are
more ethnically diverse, over-reporting of rallies held in urban centers would bias the
data in favor of confirming the proposition that the leading candidates focus their
campaign efforts on swing areas. It seems unlikely, however, that this was the case. The
newspapers relied on an extensive network of freelance writers who were stationed
throughout the country and could be called upon to cover rallies in remote areas. For this
reason, coverage of rallies in outlying areas is likely to have been on par with coverage of
rallies in urban centers.
33 I was able to obtain nearly every edition of each newspaper during this period. On a few rare occasions, however, it was not possible to obtain one of the papers due to irregularities in their supply.

76
A second concern is that the papers may have devoted more space to particular
candidates. The data shows that the papers did report on more rallies held by the
incumbent president than the opposition challengers. Of the 279 rallies coded from the
papers, the distribution across the candidates was as follows: Kibaki 49%, Odinga 29%,
and Musyoka 25%. It is impossible to know whether this reflects bias on the part of the
papers, or whether Kibaki actually held more rallies than the other candidates. What
matters more than whether the papers covered the three candidates equally, however, is
whether the papers exhibited any systematic bias in covering rallies in different types of
areas. The argument outlined above is that the candidates focus their efforts on swing
areas and avoid holding rallies in core areas. Thus, the critical concern regarding bias is
whether the papers were more or less likely to report rallies in core or swing areas. If the
papers, for example, systematically under-reported rallies held in the parties’ core areas,
the tests below would be biased in favor of confirming the hypothesis. I suggest,
however, that the opposite was the case. When the parties held rallies in theirs
strongholds or in opponents’ strongholds, these rallies tended to be major events that
were carefully watched by the media. By contrast, a rally in a swing area was more
likely to be another in a long string of relatively similar events. Thus, to the extent that
coverage may have been biased, the papers in all likelihood over-reported rallies in the
parties’ strongholds relative to the swing areas, biasing the data against confirming the
argument outlined above.
To determine which groups the parties targeted at rallies, I match the location of
each event to demographic data. Unfortunately, Kenya’s census data is not sufficiently
detailed for this. The most recent census from which ethnic information is available,

77
conducted in 1989, provides data only at the district level, a relatively large
administrative unit. I therefore use survey data to create estimates of the ethnic
composition of parliamentary constituencies, a smaller geographic unit. Details on the
construction of these estimates can be found in Appendix 3.1. One limitation is that in
diverse constituencies, it is not possible to determine which group a candidate is
targeting. This problem, however, is mitigated by the relative homogeneity of
parliamentary constituencies. The average size of the largest ethnic group across all
constituencies is 81%, and most constituencies (178 out of 210) contain a majority ethnic
group. In most cases, then, it is possible to determine with a high degree of accuracy
which group the candidates targeted at their rallies.
4. The Allocation of Campaign Effort
Figure 3.1 maps the location of all rallies held by the presidential candidates over
population density data from the 1999 census. Not surprisingly, the map shows that the
candidates spent most of their time in the densely-populated area that runs from central to
western Kenya, and to a lesser extent on the coast. The candidates held relatively few
rallies in the northern half of the country, much of which is sparsely-populated desert.
Figure 3.2, which map the campaign rallies held by each of the three candidates
over their respective core ethnic areas, provide a first cut on ethnic targeting. The
candidates’ core ethnic areas are defined as all parliamentary constituencies in which
each candidate’s own community made up 75% or more of the population.34 For Kibaki,
34 The 75% cutoff point was chosen in order to ensure that candidates’ core ethnic areas included only those constituencies with an overwhelming majority of co-ethnic voters. While the 75% cutoff is somewhat

78
this included 32 constituencies in the Central Province;35 for Odinga, 20 constituencies in
Nyanza Province;36 and for Musyoka, 17 constituencies in Eastern Province.37 The maps
arbitrary, the analysis presented here is not sensitive to this definition. An alternative approach would be to define each candidate’s core ethnic area as those constituencies within which the candidate’s own community made up a majority of the population, rather than 75%. Using a 50% cutoff would increase the number of constituencies included in the Kikuyu core ethnic area by only two (from 32 to 34) and would not increase the number of constituencies included in the Luo or Kamba core ethnic areas. 35 Kinangop, Kipipiri, Olkalou, Ndaragwa, Tetu, Kieni, Mathira, Othaya, Mukurweini, Nyeri Town, Mwea, Gichugu, Ndia, Kerugoya/Kutus, Kangema, Mathioya, Kiharu, Kigumo, Maragwa, Kandara, Gatanga, Gatundu South, Gatundu North, Juja, Githunguri, Kiambaa, Kabete, Limuru, Lari, Laikipia West, Laikipia East, Subukia. 36 Ugenya, Alego, Gem, Bondo, Rarieda, Kisumu Town East, Kisumu Town West, Kisumu Rural, Nyando, Nyakach, Kasipul Kabondo, Karachuonyo, Rangwe, Ndhiwa, Rongo, Migori, Uriri, Nyatike, Mbita, Gwasi.
Figure 3.1 Presidential Rallies and Population Density

79
suggest that an ethnic logic was at work during the campaigns. They show that the
candidates focused their campaign efforts on areas inhabited primarily by swing groups
that did not have a candidate in the race, particularly targeting the populous areas in
western Kenya, around the capital city, Nairobi, and along the coast. The candidates held
relatively few rallies in their own ethnic areas and generally avoided their opponents’
core ethnic areas.
Table 3.2, which summarizes the data presented in the maps, provides greater
detail. It shows that the incumbent president, Kibaki, help most rallies (79%) in areas
inhabited predominantly by out-groups that did not have a candidate in the race. Kibaki
held only 11% of his rallies in the core Kikuyu ethnic area.38 The president completely
avoided Odinga’s core ethnic area, failing to visit the Luo section of Nyanza Province
even once during the campaign. Kibaki did, however, hold a number of rallies (10% of
the total) in Musyoka’s home ethnic area in Eastern Province. As noted earlier,
Musyoka’s standing among co-ethnics at the start of the race was less secure than for the
leading candidates. Because of this, Kibaki may have reasonably thought that he could
pick up votes in the Kamba area.
37 Mwingi North, Mwingi South, Kitui West, Kitui Central, Kitui South, Mutito, Masinga, Yatta, Kangundo, Kathiani, Machakos Town, Mwala, Mbooni, Kilome, Kaiti, Makueni, Kibwezi. 38 This data somewhat exaggerates the amount of time that Kibaki spent in his home region. Almost all of Kibaki’s campaigning in the Kikuyu area of the Central Province occurred on a single day, December 14, on which Kibaki held 10 small, roadside rallies in his home area. Aside from this day, Kibaki visited the core Kikuyu ethnic area only four times in the months prior to the election.

80
Figu
re 3
.2 M
ajor
Cam
paig
n R
allie
s
Kib
aki (
PNU
) O
ding
a (O
DM
) M
usyo
ka (O
DM
-K)

81
Table 3.2 Location of Presidential Rallies (percentages)
Kikuyu
core area Lou
core area Kamba
core area Swing
areas Kibaki (Kikuyu) 11 0 10 79 Odinga (Luo) 1 4 0 95 Musyoka (Kamba) 1 0 29 70
For Odinga the pattern was similar. The candidate avoided areas that had a co-
ethnic in race, including his own Luo region. Like Kibaki, Odinga held most rallies
(95%) in parts of the country mainly inhabited by groups that did not have a candidate in
the race. He spent relatively little time in his own ethnic area, holding only 4% of his
rallies in the core Luo area. Odinga also avoided his opponents’ ethnic areas, visiting the
Kikuyu core area only once and the Kamba core area not at all.
Finally, for Musyoka, the Kamba candidate, the general pattern was similar.
However, Musyoka, who entered the race with less universal support among co-ethnic
voters, allocated a larger portion of campaign time to his own ethnic area, holding 29% of
all rallies in the Kamba core area. Like the other candidates, though, he avoided his
opponents’ core ethnic areas, visiting the Kikuyu area only once and the Luo area not at
all. As with the frontrunners, Musyoka spent the lion’s share of his campaign time (70%)
in areas primarily inhabited by voters who did not have a co-ethnic candidate in the race.
5. Regression Analysis
While the results presented so far suggest that ethnic considerations influenced
the candidates’ decisions about where to hold rallies, there is a danger that these findings
could be spurious. It is possible, for example, that other factors may be correlated with

82
ethnic demographics and that these factors – not ethnicity – may be driving targeting
decisions. For example, it could be that the parties sought to hold rallies in densely
populated areas and that the communities that did not have a co-ethnic candidate in the
race happened to reside in more densely populated parts of the country.
To examine campaign targeting more carefully, I use negative binomial
regression models to estimate the relationship between ethnic factors and targeting
decisions for each of the three candidates. Negative binomial regression is appropriate
for event count data characterized by overdispersion (Long and Freese 2006). The
models take the parliamentary constituency as the unit of analysis. The dependent
variable is the number of rallies held by the candidate in each constituency during the
four months prior to the election. The key independent variables are measures of the
share of Kikuyus, Luos, and Kambas in each constituency. As noted earlier, because
census data is not available at the constituency level, I use survey data to estimate the
ethnic composition of constituencies. I control for the number of registered voters per
constituency and population density. I include a dummy variable for Starehe
constituency, which contains the central area of Nairobi. Starehe may be an outlier
because it encompasses Uhuru Grounds, the city park where candidates hold rallies
geared for broadcast on national television and radio, not local consumption. Finally, I
include a measure of the distance (in kilometers) from the capital city Nairobi, where all
parties’ headquarters were based, to each constituency. One complication is that distance
is correlated with measures of ethnic composition, particularly Kikuyu share, which

83
makes it difficult to identify the independent effect of these variables.39 For this reason, I
estimate each model first without distance and then rerun the estimates with the distance
measure.
The results, shown in Table 3.3, confirm that an ethnic logic was at work. Model
1 shows that Kibaki was less likely to hold rallies in constituencies with larger Kikuyu or
Luo populations, though he did not avoid Kamba areas. Model 3 likewise shows that
Odinga was less likely to hold rallies in constituencies where any of the three groups –
including his own Luo community – were concentrated. And Model 5 confirms that for
Musyoka the strategy was different: while he avoided his opponents’ ethnic areas, he was
more likely to hold rallies in constituencies dominated by his own ethnic group, the
Kamba.40 The results show that constituency size was highly significant in the way
expected: all three candidates were more likely to hold rallies in constituencies with
larger populations. Density was significant only in the model for Kibaki. The dummy on
Nairobi’s central area, Starehe constituency, falls short of statistical significance, though
this variable is highly correlated with density (corr=.64) and it attains significance when
the models are run without the density measure (results not shown).
39 The correlation between distance and Kikuyu share is -.57. This is less of a concern with the other ethnic composition measures: the correlation between distance and Luo share is .08 and Kamba share is .28. 40 After estimating each model, I conducted a test for the joint significance of the three ethnicity variables that measure the share of Kikuyus, Luos, and Kambas in each constituency. In each model, the three variables were jointly significant at the .01 level.

84
Table 3.3 Negative Binomial Regression Models of Rally Locations Kibaki Odinga Musyoka
(1) (2) (3) (4) (5) (6) Kikuyu share -0.67+ -0.43 -2.59** -2.64** -3.22** -2.79* (0.06) (0.31) (0.00) (0.00) (0.00) (0.01) Luo share -3.20* -3.24* -1.10* -1.10* -5.49+ -6.08+ (0.01) (0.01) (0.05) (0.05) (0.08) (0.09) Kamba share 0.38 0.57 -2.98* -3.00* 0.99** 1.28** (0.21) (0.11) (0.02) (0.02) (0.00) (0.00) Voters (10,000) 0.14** 0.15** 0.15** 0.14** 0.11* 0.14** (0.00) (0.00) (0.00) (0.00) (0.01) (0.00) Population density 1.04+ 1.05+ 0.75 0.75 0.75 0.70 (0.07) (0.06) (0.35) (0.35) (0.55) (0.57) Starehe constituency 1.07 1.15 1.20 1.18 1.87 2.13 (0.19) (0.16) (0.32) (0.33) (0.29) (0.22) Distance to Nairobi 0.10 -0.02 0.17 (0.29) (0.87) (0.17) Constant -1.42** -1.81** -1.52** -1.45** -1.53** -2.23** (0.00) (0.00) (0.00) (0.00) (0.00) (0.00) Pseudo R-squared .17 .17 .14 .14 .17 .18 Observations 210 210 210 210 210 210
p values in parentheses ** p<0.01, * p<0.05, + p<0.1
Models 2, 4, and 6 include the measure of each constituency’s distance from
Nairobi. The results show that distance was unrelated to the location of campaign rallies
for any of the candidates. However, because distance is highly (negatively) correlated
with Kikuyu share, its inclusion causes Kikuyu share to lose significance in the model for
Kibaki. Distance, however, does not affect the results for either Odinga or Musyoka, and
it does not affect the other measures of ethnic composition (Luo share and Kamba share)
for Kibaki. While the correlation between distance and Kikuyu share makes it difficult to
identify the independent effects of each variable, it seems reasonable to conclude that it
was ethnic composition and not distance that motivated Kibaki’s targeting decisions. It is
unlikely that Kibaki avoided constituencies made up primarily of co-ethnics because they
were close to Nairobi. More likely is that he avoided these areas because he foresaw few

85
gains from holding rallies in places where he enjoyed near-universal support, despite the
fact that Kikuyu-majority constituencies were a short distance from Nairobi. Moreover,
the finding that distance did not matter for the other candidates supports the conclusion
that ethnic composition, not convenience, was in all likelihood the more relevant factor
for Kibaki.
6. Targeting Swing Groups
The analysis presented so far demonstrates that the candidates spent the bulk of
their campaign time courting swing groups. One question that remains, however, is
whether they converged on the same swing groups or targeted different groups during the
campaign. For parties seeking to build a winning coalition, one plausible strategy might
be to assemble a support base made up of several distinct ethnic voting blocs. Indeed,
looking at the distribution of support in the 2007 race (Table 3.2), one might view PNU
as essentially a coalition of the Kikuyu, Meru, and Embu; ODM as a coalition of the Luo,
Kalenjin, and Luhya; and ODM-K as a Kamba party. It is possible that when deciding
where to hold rallies outside of their ethnic strongholds, candidates may focus their
efforts on groups that serve as coalition partners. It is therefore interesting to inquire
whether the parties targeted different swing groups, or whether they actively competed
for the same communities when they traveled outside their ethnic strongholds.
To answer this question I examine the share of the candidates’ rallies held in the
core ethnic areas of each of Kenya’s eight largest ethnic communities. Each group’s core
ethnic area is again defined as those parliamentary constituencies in which the group

86
made up 75% or more of the population.41 Figure 3.3 shows that outside the parties’
home ethnic regions, the candidates largely converged on the same communities. This
can be seen by looking at the Luhya, the largest ethnic community that did not have a co-
ethnic candidate in the presidential race. Figure 3.3 shows that the three candidates
devoted similar shares of campaign time to the Luhya core area: Kibaki held 10% of all
rallies there, Odinga 9%, and Musyoka 8%. The same is true for most other swing areas
(i.e., the Kalenjin, Meru, and Kisii areas), with the exception of Mijikenda area where
Kibaki and Odinga held a similar share of rallies but Musyoka held none. In sum, the
data indicate that the parties did not court unique, non-overlapping coalitions; outside of
their ethnic strongholds they actively competed for the same sets of voters.
Why do the parties converge on the same set of swing groups, rather than
focusing their efforts on particular communities where each might have an advantage
over their opponents? While it is beyond the scope of this chapter to offer a definitive
explanation, I point to two possible answers. First, as noted, there is likely to be
considerable uncertainty about how voters will react to the parties’ campaign efforts.
Because of this uncertainty, the candidates may prefer to cast a wide net, rather than
limiting their appeal to particular groups. In addition, each candidate’s campaign
decisions may reflect expectations about where opponents are likely to go. For example,
if Kibaki expected that Odinga would target the Kalenjin during the campaign, he might 41 For this analysis I exclude constituencies that do not have a dominant ethnic group (>75%) for the practical reason that when a candidate visits more diverse constituencies it is difficult to determine which group or groups the candidate is targeting. While the 75% cutoff is arbitrary, as noted earlier, the analysis presented here is not sensitive to this choice. An alternative approach would be to define each group’s core ethnic area as those constituencies in which the group makes up a majority of the population, rather than 75%. This has little effect, however. Doing so would increase the number of constituencies included in the Kikuyu ethnic area from 32 to 34, the Luhya area from 21 to 22, the Kalenjin area from 18 to 23, and the Mijikenda area from 7 to 9. The number of constituencies included in the Luo, Kamba, Kisii and Meru core areas would not change.

87
also hold rallies in the Kalenjin area in an attempt to offset Odinga’s efforts. Thus, to the
extent that decisions about where to hold rallies are made strategically, convergence may
result.
0
510
1520
Perc
ent o
f All R
allie
s (b
y pa
rty)
Kikuyu Luo Kamba Luhya Kalenjin Kisii Meru MijikendaEthnic Group Areas
Kibaki/PNU Odinga/ODM Musyoka/ODM-K
Figure 3.3 Share of Rallies in Major Ethnic Areas
7. What about Mobilization?
One might conclude from the results presented so far that the presidential
candidates – particularly the two front-runners – simply chose persuasion over
mobilization, focusing their campaign efforts on the pursuit of non-co-ethnic swing
voters and neglecting the mobilization of core co-ethnic supporters. I argued, however,
Swing Groups Core Groups

88
that rather than neglecting mobilization, the candidates delegated the job within their core
ethnic areas to other actors. To test this proposition, I turn to survey data on campaign
contact at the household level. The data come from a national opinion poll conducted
between December 2008 and January 2009, about a year after the 2007 election.42
Survey respondents were asked the following question: “Did a candidate or agent from
any party come to your home during the campaign before last year’s election?” The
survey found that 52% of respondents had been contacted by one or more party during
the election. In total, 37% of respondents were contacted by PNU; 41% by ODM; and
13% by ODM-K.
To examine the parties’ grassroots efforts, I estimate a logit model of campaign
contact for each of the three leading parties. The dependent variable is a dichotomous
measure of campaign contact. To ensure that the results are comparable with the tests of
rally location, I use the same measures of the ethnic composition of constituencies, and
again control for other relevant constituency characteristics: number of voters, population
density, Starehe constituency, and distance from Nairobi. Because these tests use
individual data, I also control for respondent characteristics to account for the possibility
that parties may be more likely to contact certain types of voters at the village level. I
control for the number of community groups that respondents belong to and whether
respondents serve as leaders within these groups. I do so to account for the possibility
42 This data come from a survey that was conducted as part of an evaluation of Kenya’s national civic education program (Finkel, Horowitz and Rojo-Mendoza 2012 provides additional details). The sample frame for the survey was all participants in the civic education program, not the overall Kenyan population. For this reason, it was necessary to weight the sample to approximate a sample of the Kenyan population. To determine how the sample should be weighted, I compared the data to a recent random-sample survey, conducted by the Afrobarometer in 2005. I found that it was necessary to weight by province, urban/rural location, and gender. On other variables – age, education, and community group membership – the data closely resembled the Afrobarometer sample, and no weighting was necessary.

89
that the parties may seek out influential community leaders and that group membership
rates might not be randomly distributed across ethnic groups. I also include basic
demographic variables: gender, age, and education.
Table 3.4 shows that the parties did not neglect voters in the constituencies where
their core co-ethnic communities were concentrated. The results for PNU, shown in
Model 7, reveal that the probability of being contacted by the party was higher in Kikuyu
strongholds than in swing areas. As Model 8 shows, the same finding holds for ODM:
the probability of being contacted by the party at the local level was higher for
individuals in Luo areas, relative to swing areas. It is important to contrast these finding
with the data provided in Table 3.4: while Kibaki and Odinga were less likely to hold
rallies in their respective ethnic strongholds, their parties were more likely to contact
voters through door-to-door mobilization efforts in these areas, relative to swing areas.
Model 9 shows that ODM-K, like the leading parties, was more likely to contact
individuals in its core ethnic area than in swing areas. For this party, the overall strategy
was different from the front-runners, though. It targeted core ethnic areas both with
presidential rallies and with its grassroots efforts.
The data also show that at the grassroots level the parties generally avoided their
opponents’ ethnic areas. PNU was less likely to contact voters in Kamba areas; ODM
was less likely to target voters in Kikuyu and Kamba areas; and ODM-K was less likely
to reach out to voters in Kikuyu and Luo areas. These results are consistent with the
arguments developed above: parties recognize that they have little to gain from targeting
opponents’ core ethnic supporters during the campaign and generally avoid these areas.
Few of the control variables exhibited any consistent effects. The one exception was

90
group membership, with individuals who belong to more local groups being contacted at
higher rates by all three parties.
Table 3.4 Logit Models of Campaign Contact (7) PNU (8) ODM (9) ODM-K Kikuyu share 0.71* -1.67** -1.02+ (0.02) (0.00) (0.07) Luo share 0.01 1.38** -1.59** (0.98) (0.00) (0.01) Kamba share -1.07** -1.73** 0.69+ (0.00) (0.00) (0.10) Voters (10,000) 0.09+ -0.00 0.05 (0.09) (0.97) (0.46) Population density -0.00 0.06 0.06 (0.97) (0.25) (0.31) Starehe constituency -0.03 0.03 -1.37** (0.87) (0.89) (0.00) Distance from Nairobi 0.00** 0.00 0.00 (0.00) (0.58) (0.38) Group memberships 0.12** 0.11* 0.19** (0.01) (0.01) (0.00) Group leader 0.16 0.08 0.26+ (0.18) (0.55) (0.09) Female -0.11 -0.05 -0.24 (0.35) (0.67) (0.15) Age -0.00 -0.00 0.01 (0.73) (0.78) (0.49) Education -0.00 -0.01 0.03 (0.96) (0.78) (0.33) Constant -2.32** -0.91+ -3.60** (0.00) (0.08) (0.00) Observations 3527 3527 3527 Pseudo R-squared .05 .09 .06 p values in parentheses, clustered by constituency ** p<0.01, * p<0.05, + p<0.1
In sum, the findings presented in this section confirm that while the presidential
aspirants spent relatively little time in their own ethnic areas during the race, their parties
did not ignore the need to mobilize co-ethnic voters. This job was left to lower-level

91
candidates and other agents acting in support of the parties within their ethnic
strongholds.
8. An Alternative Explanation?
The argument developed in this chapter describes campaign targeting decisions as
a function of voters’ pre-election alignments and incentives that lead the parties to divide
campaign duties between different types of actors. An alternative explanation points to a
unique feature of Kenya’s constitution, which at the time of the 2007 election stipulated
that to win the presidential race candidates must gain at least 25% of the vote in five of
Kenya’s eight provinces. If the leading candidate had not satisfied the “five of eight”
rule, then a second round run-off would have been held between the top two candidates.
It is possible that it is the need to satisfy this requirement, not the factors identified above,
that led candidates to spend a large portion of their time on the campaign trail outside of
their home ethnic areas.
This institutional explanation, however, is unable to explain the observed patterns
of campaign targeting in the 2007 race. First and foremost, data collected prior to the
campaign show that the rule was not a binding constraint. Table 3.5 shows voting
intentions by province in September 2007, before the main period of campaigning
started.43 The table shows that Kibaki had already cleared the 25% mark in at least five
provinces by the start of the campaign. Had Kibaki been concerned about the 25%
hurdle, he would have in all likelihood concentrated his campaign efforts on the two
provinces where his support was just above the 25% mark, Western and Northeastern.
43 Data come from a survey conducted by the Steadman Group on September 8-20, 2007 (n=2,020).
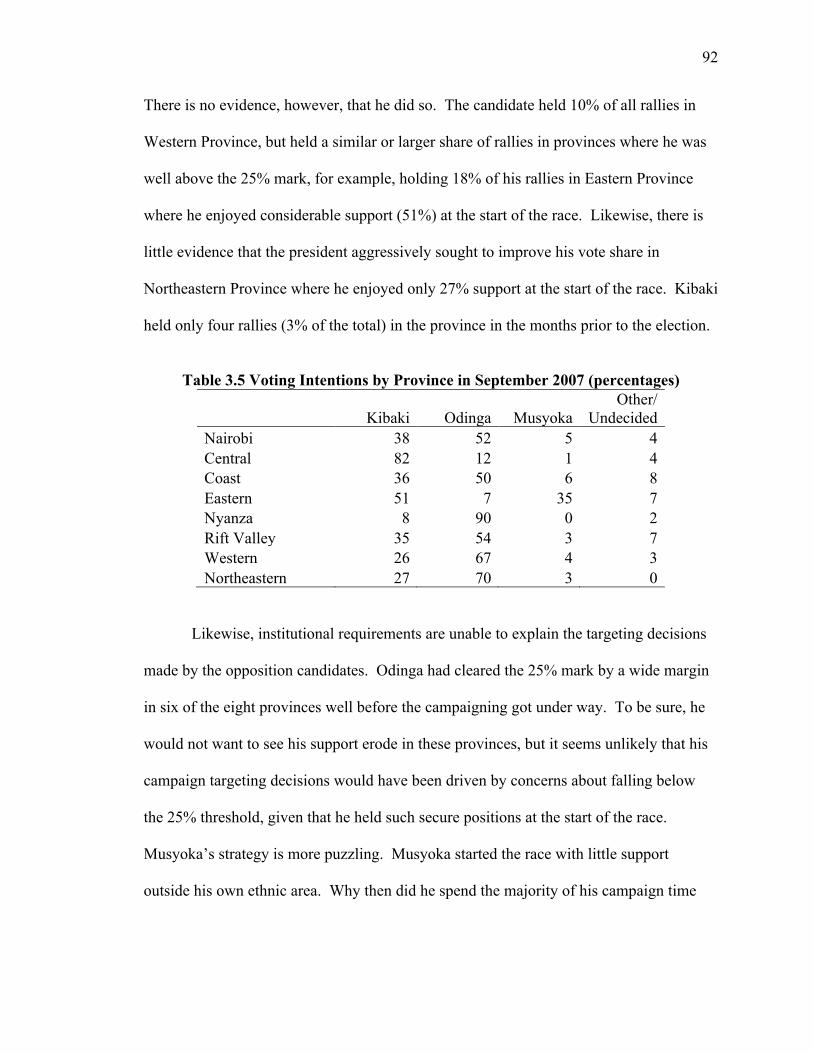
92
There is no evidence, however, that he did so. The candidate held 10% of all rallies in
Western Province, but held a similar or larger share of rallies in provinces where he was
well above the 25% mark, for example, holding 18% of his rallies in Eastern Province
where he enjoyed considerable support (51%) at the start of the race. Likewise, there is
little evidence that the president aggressively sought to improve his vote share in
Northeastern Province where he enjoyed only 27% support at the start of the race. Kibaki
held only four rallies (3% of the total) in the province in the months prior to the election.
Table 3.5 Voting Intentions by Province in September 2007 (percentages)
Kibaki Odinga Musyoka
Other/ Undecided
Nairobi 38 52 5 4 Central 82 12 1 4 Coast 36 50 6 8 Eastern 51 7 35 7 Nyanza 8 90 0 2 Rift Valley 35 54 3 7 Western 26 67 4 3 Northeastern 27 70 3 0
Likewise, institutional requirements are unable to explain the targeting decisions
made by the opposition candidates. Odinga had cleared the 25% mark by a wide margin
in six of the eight provinces well before the campaigning got under way. To be sure, he
would not want to see his support erode in these provinces, but it seems unlikely that his
campaign targeting decisions would have been driven by concerns about falling below
the 25% threshold, given that he held such secure positions at the start of the race.
Musyoka’s strategy is more puzzling. Musyoka started the race with little support
outside his own ethnic area. Why then did he spend the majority of his campaign time

93
and energy outside his home region? One possible explanation is that Musyoka simply
overestimated his ability to attract support during the race. Another possibility is that
Musyoka realized he would not win the 2007 race but sought to build a base for future
contests. Either way, his campaign decisions cannot easily be attributed to Kenya’s
institutional requirements.
Moreover, an institutional approach cannot explain why parties divide labor
between different types of actors. If the parties were concerned about clearing the 25%
hurdle in particular provinces, they would presumably have made a concerted effort to
deploy all campaign resources toward the same areas. Yet, as I have shown, the targeting
of presidential rallies and grassroots effort were deployed in complementary ways,
particularly by the two leading parties – ODM and PNU – that had a realistic chance of
winning the race in the first round. The institutional approach cannot explain why these
parties would have targeted swing areas with presidential rallies while allocating a
disproportionate share of local-level resources toward core co-ethnic areas.
9. Conclusion
This chapter examines campaign targeting. A key contribution made by the
analysis presented here is to show that the competition for swing voters is at the heart of
elections in Kenya. This finding challenges leading approaches to ethnic politics, nearly
all of which predict that campaigns in divided societies like Kenya should be mainly
about mobilizing the parties’ core ethnic support bases. Contrary to these accounts, the
analysis presented here demonstrates that while ethnic mobilization is an important part
of campaign strategy, the pursuit of non-co-ethnic swing voters is a critical aspect of

94
electoral competition. This finding provides the basis for understanding how parties
develop campaign messages and recruit lower-level candidates – questions that I address
in the next two chapters.

95
Appendix 3.1. Constructing Constituency-Level Ethnicity Estimates
To generate estimates of the ethnic composition of Kenya’s 210 parliamentary
constituencies, I merged data from 12 nationally-representative surveys conducted
between November 2006 and January 2009, yielding a total sample of 39,065
respondents. The data came from surveys conducted by three local survey firms.
Strategic Research provided data from four polls (November 2006, March 2007,
September 2007, December 2007); Steadman provided six (October 2007, mid-
November 2007, late November 2007, early December 2007, mid-December 2007,
December 2008); and Research International provided one (December 2008-January
2009). A final data set came from the Afrobarometer (December 2007), which was
conducted in Kenya by Steadman. All polls were nationally representative, and all
included a question about ethnic identification that asked, “What is your ethnic
community?” or a similar variation. The mean number of respondents per constituency
was 186.
To validate the approach, I compared the survey estimates to the 1989 census data
at the district level (at the time of the 1989 census, there were 41 districts). Because
parliamentary constituencies are nested within districts, it was possible to create district-
level estimates from the survey data and then compare these to the 1989 census figures.
Table 3.7 shows the largest group and its share of the total population for all districts,
taken both from the census and the survey estimates. Given that the survey data was
collected nearly 20 years after the 1989 census, I do not expect a perfect match. The
table shows, however, that the survey estimates match the census data surprisingly well.
In 40 out of 41 districts, the survey data correctly identified the largest group. And in

96
most districts (32 out of 41), the difference between the size of the largest group in the
census data and the survey estimates was less than 10%. The relatively close fit between
the survey estimates and the census data suggests that it is reasonable to use the survey
data for estimating sub-national ethnic demographics.

97
Table 3.6 Comparison between Survey Estimates and Census Data at District Level
1989 Census Survey Estimates
District
Largest group Size
Largest group Size Sample size Difference
Baringo Kalenjin .84 Kalenjin .78 529 .06 Bungoma Luhya .83 Luhya .74 1,113 .09 Busia Luhya .61 Luhya .65 793 .04 East Marakwet Kalenjin .91 Kalenjin .90 488 .01 Embu Embu .61 Embu .61 865 .00 Garissa Somali .91 Somali .91 682 .00 Isiolo Boran .34 Boran .43 291 .09 Kajiado Masai .57 Maasai .36 588 .21 Kakamega Luhya .95 Luhya .90 2,424 .05 Kericho Kalenjin .83 Kalenjin .86 1,330 .03 Kiambu Kikuyu .88 Kikuyu .84 1,478 .04 Kilifi Mijikenda .90 Mijikenda .78 1,056 .12 Kirinjaga Kikuyu .97 Kikuyu .96 641 .01 Kisii Kisii .98 Kisii .96 1,708 .02 Kisumu Luo .89 Luo .73 1,113 .16 Kitui Kamba .97 Kamba .95 1,111 .02 Kwale Mijikenda .83 Mijikenda .85 677 .02 Laikipia Kikuyu .68 Kikuyu .77 548 .09 Lamu Bajun .40 Bajun .31 150 .09 Machakos Kamba .97 Kamba .95 2,120 .02 Mandera Somali .97 Somali .95 303 .02 Marsabit Boran .28 Boran .58 358 .30 Meru Meru .89 Meru .94 1,846 .05 Mombasa Mijikenda .28 Mijikenda .29 1,249 .01 Muranga Kikuyu .96 Kikuyu .95 1,535 .01 Nairobi Kikuyu .32 Kikuyu .34 3,267 .02 Nakuru Kikuyu .60 Kikuyu .54 1,428 .06 Nandi Kalenjin .74 Kalenjin .86 628 .12 Narok Masai .47 Masai .64 742 .17 Nyandarua Kikuyu .96 Kikuyu .94 619 .02 Nyeri Kikuyu .97 Kikuyu .95 822 .02 Samburu Samburu .75 Samburu .55 164 .20 Siaya Luo .96 Luo .96 1,016 .00 South Nyanza Luo .86 Luo .8 1,792 .06 Taita Taveta Taita .72 Taita .73 452 .01 Tana River Pokomo .37 Mijikenda .35 279 .04 Transnzoia Luhya .52 Luhya .42 767 .10 Uasin Guishu Kalenjin .53 Kalenjin .47 882 .06 Turkana Turkana .95 Turkana .87 282 .08 Wajir Somali .97 Somali .73 544 .24 West Pokot Kalenjin .85 Kalenjin .84 385 .01
Note: “Difference” equals the absolute value of the difference between the size of the largest group from the 1989 census and the estimated size of the largest group from the survey data.

98
Chapter 4.
Ethnic Appeals
1. Introduction
The previous chapter showed that during campaigns in Kenya parties pursue
voters in non-co-ethnic swing communities while also seeking to mobilize core co-ethnic
supporters. This chapter examines how these goals affect the types of campaign
messages, particularly the ethnic appeals, parties use. Contrary to much of the existing
literature which predicts that campaign appeals in multiethnic settings like Kenya ought
to be filled with particularistic appeals to core ethnic constituents, I show that the
imperative of appealing to swing voters across multiple non-co-ethnic communities leads
parties to eschew narrowly-targeted distributional promises. Instead, parties rely on
universal appeals designed to communicate their inclusive intentions. At the same time,
parties seek to persuade voters of rivals’ exclusive intentions, using negative claims about
opponents.
The arguments presented in this chapter are based on a detailed content analysis
of over 90 hours of campaign speeches recorded from major campaign rallies during
Kenya’s 2007 election. With the help of a team of Kenyan research assistants, the
speeches were coded for four main appeal types: performance, issues priorities and
positions, candidate characteristics, and ethnic appeals. I show that while the campaigns
were not solely about ethnicity, ethnic appeals were central to the 2007 race. Further, the
data confirms that the major parties in the race employed a common strategy with regard

99
to ethnic messages, each seeking to convey their own inclusive intentions while raising
doubts about opponents’ intentions. Yet, the substance of the ethnic appeals –
particularly negative ethnic messages – differed across the parties. The incumbent party,
PNU, relied primarily on messages about group security, seeking to convince voters that
the election of Odinga, the main opposition leader, would plunge the country into an
ethnic war. By contrast, the opposition parties, ODM and ODM-K, relied more heavily
on messages about ethnic favoritism, seeking to portray the incumbent president as an
ethnic chauvinist who favored his own community at the expense of others. In short,
while all parties relied on a common strategy of using negative ethnic messages to
demonize their opponents, the content of these messages varied. This suggests that
parties in Kenya draw upon whatever raw material is available in a given election cycle,
playing both on long-standing communal resentments as well as more idiosyncratic
issues that relate to the particular context of an election cycle.
The chapter is divided into three sections. In the next section, I explain more
fully how campaign goals affect decisions about messages, juxtaposing the argument
offered here with prior ethnic politics research that emphasizes the use of distributional
promises to shore up support among core ethnic support bases. Section three describes
the sample of campaign recordings and the coding procedures used in the analysis. I then
present the results and conclude.

100
2. Ethnic Appeals
Much of the existing ethnic politics literature suggests that in settings like Kenya
parties should be expected to rely extensively on patronage promises. This view is
premised on the assumption that in multiethnic settings in Africa and elsewhere patron-
client relations are central to politics (Bratton and Van de Walle 1997; Chabal and Daloz
1999; Ekeh 1975; Joseph 1987). The patronage model suggests that leaders distribute
state-controlled resources to clients in exchange for support. Ethnicity is often thought to
serve as the organizing principle for patronage politics in multiethnic settings (Fearon
1999; Chandra 2004; Posner 2005). Once in power, leaders reward their core ethnic
supporters, maintaining durable ties to ethnic clients over time. Important debates exist
about why ethnicity and patronage should go together, and empirical studies of ethnic
favoritism in Africa have so far produced equivocal results (e.g., Kasara 2007; Burgess et
al., 2009; Frank and Rainer 2009). Yet, within much of the existing ethnic politics
literature, there is little disagreement about the centrality of ethnic favoritism to politics
across the African continent, as in multiethnic countries in other parts of the world.
The patron-client literature implies a clear model of campaign communication: if
politicians build and maintain support by targeting material resources to ethnic clients,
campaigns ought to be filled with promises to provide scarce resources to supporters in
the one (or more) ethnic communities that make up a politician’s core ethnic support
base. This model is at the heart of many well-known studies of political dynamics in
diverse societies (e.g., Rabushka and Shepsle 1972; Lijphart 1977; Horowitz 1985), and
anecdotal evidence seems to confirm this perspective. Beckett’s description of post-
independence elections in Nigeria, for example, notes that “electoral politics were ethnic

101
politics…Electoral appeals consequently were couched in terms of ethnic advancement
(or survival) and amenities for communities, and in terms of power, prestige, and
economic rewards for community leaders” (Beckett 1987, 91). Barkan likewise reports
that in Kenya’s early post-independence elections, the two leadings parties – KANU and
KADU – rarely competed for the same voters and instead “both coalitions sought to
mobilize the series of ethnically homogenous areas to which they laid claim into a series
of one-party fiefs” (Barkan 1987, 221). Moreover, Wantchekon’s (2004) experimental
study of campaign appeals in Benin shows that voters are more responsive to promises of
targeted transfers than public goods, suggesting that parties should be better off using,
particularistic appeals rather than inclusive broad-based promises.
While patronage models offer a compelling theoretical framework and examples
of targeted distributional appeals abound in existing studies, I argue that in Kenya the
need to attract support from multiple ethnic communities makes appeals to any particular
group or set of groups an unattractive strategy. A party that offers distributional promises
to one or more ethnic groups ensures that it will have little appeal to members of other
groups. While this strategy might be attractive to a party seeking support only from a
subset of the country’s ethnic communities, the previous chapter showed that in Kenya
parties do not seek support from distinct, non-overlapping ethnic coalitions. Rather,
parties compete intensely for gains within the same swing communities. As a result, they
design campaign appeals with an eye toward increasing support from many groups. For
this reason, parties seek to convince voters of their inclusive intentions, assuring voters in
all groups that their community will be treated equally and that none will face
discrimination as a result of their ethnic identities. Moreover, because parties typically

102
enter the race with near unanimous support from their core co-ethnic supporters, there is
little need to reassure their most loyal co-ethnic supporters that their interests will be
represented; this is well understood from the outset. For parties, then, there is little to
gain (and much to lose) from making particularistic distributional promises to specific
communities.
While particularistic appeals are costly, negative claims about opponents are more
beneficial. In Kenya, parties use negative ethnic messages in an effort to raise doubts
about the intentions of rivals. These messages emphasize the threat posed by an
opposing party or group to the material or physical well-being of other groups. They
typically come in the form of claims about the intentions of an opposing leader, as in
messages that claim an opponent will favor his own ethnic group at the expense of others
if elected. Negative ethnic messages also relate to the intentions of other groups, as in the
claim that an opponent’s group will pose a security threat to other communities if the
opponent comes to power. In practice, messages about leaders and groups are often
conflated such that a negative claim about the intentions of a particular leader also
conveys negative information about the aspirant’s ethnic community, and vice versa.
Negative ethnic messages are useful both for persuasion and mobilization. When
a party is able to convince voters in swing groups that a rival is headed by an ethnic
chauvinist, those voters will be less likely to support the opposing party. Likewise,
negative ethnic messages are useful for mobilizing the base. When core voters are
persuaded that a rival party poses a threat to their material or physical well-being, they
will be more motivated to turn-out on election day to support their co-ethnic candidate.

103
To summarize, the argument offered here is that parties in Kenya use ethnic
messages in an effort to shape voters’ perceptions of their own intentions and those of
their rivals. Parties avoid making particularistic distributional promises to specific ethnic
groups, seeking instead to project inclusive images. At the same time, they rely on
negative claims about the ethnic intentions of their competitors.
3. Content Analysis of Campaign Messages
3.1 The Sample
To examine the types of appeals used by the presidential candidates and other
members of their parties in the 2007 race, I collected recordings of campaign speeches
from public rallies held during the four months prior to the election. Studies of campaign
communication typically rely on content analysis of televised advertising or newspaper
accounts of campaign events (Goldstein and Freedman 2002; Sides 2003; Boas 2010;
Davis 2007; Ferree 2011). In Kenya, however, it was important to collect original
recordings of the candidates’ stump speeches. The use of paid campaign advertising is
much less prevalent in Kenya than in more developed democracies, and public rallies
remain the central means through which candidates communicate messages to voters.
Moreover, while the Kenyan media extensively covers campaign rallies, media outlets
typically avoid reporting messages that might be considered inflammatory, especially
messages with ethnic content. I therefore sought to obtain a sample of campaign
speeches unfiltered by the media.
The analysis presented in this paper draws on a sample of 92 hours of recordings
obtained from rallies held by the three leading parties in the 2007 race, PNU, ODM, and

104
ODM-K.44 The sample includes recordings from a total of 133 campaign events – 62
held by PNU, 60 by ODM, and 11 by ODM-K.
One important question is whether the sample can be considered representative of
the full population of campaign rallies held by each party. Unfortunately, there is no
record of all campaign events held by the parties against which to compare the sample
used here. However, newspaper coverage of the campaigns does provide a reasonably
comprehensive accounting of where the candidates held rallies. While the newspapers
did not always cover what the candidates said, they did provide extensive information
about where the candidates went. I used data on the location of presidential rallies
(described in the previous chapter) to estimate how the candidates divided their time on
the campaign trail between their core ethnic strongholds, opponents’ ethnic regions, and
areas that did not have a co-ethnic candidate in the race.45 Table 4.1 compares the share
of recordings collected from each of these areas with the share of presidential rallies held
in each area, for each party. The table shows a reasonably close match between the two,
providing assurance that the data used in this chapter is not likely to be skewed in any
serious way by sampling. It is important to note, as described in the previous chapter,
that the parties spent the vast majority of their time on the campaign trail in areas
primarily inhabited by ethnic groups that did not have a co-ethnic candidate in the
44 Rally recordings were obtained from three sources. First, a local human rights group, the Kenyan National Commission on Human Rights (KNCHR), employed a staff of approximately 20 people who were assigned to monitor rallies and record speeches during the campaign. The KNCHR made available their materials to all interested parties. Second, I employed 15 research assistants who were based throughout Kenya. Each research assistant was charged with recording any major rallies held in his or her geographical area, and RAs were paid a piece rate in order to encourage them to record as many rallies as possible. Finally, a small amount of material was also obtained from a local media organization. 45 Following the definition used in Chapter Three, I defined each party’s “core ethnic area” as the parliamentary constituencies in which the party leader’s group made up at least 75% of the population.

105
presidential race (marked as “Swing areas” in Table 4.1). The parties spent relatively
little time campaigning in their own ethnic strongholds, and spent even less time in their
rivals’ strongholds. For this reason, most recordings were obtained from swing areas.
Table 4.1 Recording Sample versus Estimated Population of Rallies (percentages) PNU ODM ODM-K
Sample Total Sample Total Sample Total PNU core ethnic area 7 11 0 1 1 9 ODM core ethnic area 0 0 3 4 0 0 ODM-K core ethnic area 7 10 0 0 29 18 Swing areas 86 79 97 95 70 73
A team of Kenyan research assistants transcribed and translated the campaign
speeches. While the speeches were mainly in Kiswahili, Kenya’s national language, or
English, the official language, speakers also used a variety of local languages. For this
reason, it was necessary to assemble a team of transcribers and translators who spoke the
main languages used in the campaigns. Once the transcription and translation process
was complete, content analysis was done with the help of five research assistants.
A key challenge was that campaign appeals, particularly ethnic messages, can be
subtle and potentially difficult to detect (Mendelberg 2001). To minimize this problem,
the coding team, which included native speakers from the country’s major ethnic groups,
worked with the transcripts in their original languages. The coding scheme included four
main types of messages: performance, issue priorities/positions, candidate characteristics,
and ethnic appeals (described more fully below). The Kenyan coders were charged with
identifying only ethnic appeals, and non-ethnic content was coded solely by the author.
For each speech, the research assistants coded the original-language version of the

106
transcript and the author coded the English-language version. Then, we compared the
two version and reconciled any discrepancies. A second challenge related to the danger
of inferring ethnic meaning where none was intended. Given Kenya’s long history of
ethnic competition and conflict, it was possible to infer an ethnic meaning in almost
everything that the candidates did and said. For this reason, we adopted conservative
coding rules: only statements that fell within a well-defined set of categories, explained
below, were coded as ethnic messages.
Finally, it is important to note that the analysis presented here covers only one
aspect of campaign communication – public rallies – during the 2007 race, which on its
own cannot capture all nuances of the messages that were conveyed by the parties and
their supporters during the lead-up to the election. Anecdotal evidence suggests that the
crudest ethnic language was reserved for less public means of communication, such as
text messages, which could be sent anonymously (KNCHR 2008). Yet, I argue that there
is value in focusing on the messages that the parties use at major public rallies. The
parties invest considerable resources – time and money – in organizing these rallies, a
reflection of the importance that the parties themselves attach to these events. Moreover,
large-scale rallies garner the greatest share of media attention, and it is therefore the
messages conveyed at these rallies that have the greatest national reach. And, unlike
messages spread by supporters through informal channels, the parties have direct control
over the content of appeals made at large rallies. For all of these reasons, the parties are
careful to craft messages for use at large-scale rallies that they believe will serve their
electoral goals. Studying these messages therefore provides a useful way to examine the
parties’ goals and strategies in the campaigns.

107
3.2 Coding Scheme
The coding scheme is based in part on existing approaches (especially Ferree
2011; Kahn and Kenney 2002; Druckman and Parkin 2005; Riffe, Lacy, and Fico 2005;
and Goldstein and Freedman 2002), and was also created to capture unique aspects of the
Kenyan context. The unit of analysis was the individual statement. Statements varied
considerably in length – some were only a few words, others were several hundred
words. Individual statements could be coded with more than one code, to account for the
multiple meanings sometimes found in a single statement. Only statements that fell
within the categories described below were included. Greetings, introductions, and other
incidental utterances were not coded. In total, the coding produced 1,536 coded
messages. Of these, 569 (37%) were from PNU speakers; 827 (54%) were from ODM;
and 140 (9%) were from ODM-K.
Messages were coded into four main categories, each of which contained multiple
sub-categories:
o Performance appeals include messages about a candidate or party’s accomplishments, and claims about the past performance of opponents. All performance messages were categorized according to the specific area mentioned in the appeal (education, economy, infrastructure, etc.), and whether the message was a positive statements or a negative claim.
o Issue priorities / positions include messages about the priorities that a candidate or party would address if elected, as well as statements about a candidate or party’s position on a particular issue.
o Candidate characteristics include both positive statements about a party’s presidential candidate and negative claims about the character of opponents.

108
o Ethnic appeals are defined as messages that refer to the political relevance of ethnic differences. This definition is a broad one that encompasses several different sub-types. I distinguish first between positive messages about the party or candidate, and negative claims about opponents. I then code positive message into three different types: promises to represent the party’s core ethnic group, promises to represent out-groups, and promises to treat all groups equally. Negative ethnic message are coded into two different types: messages that an opponent had or would favor some groups at the expense of others (ethnic favoritism), and messages that a rival party or group posed a security threat to others (group security).
4. Results
This section first describes how the parties’ messages were distributed across the
main categories and then examines each message category in greater detail. Table 4.2,
which presents the overall findings, indicates that the parties relied on a diverse set of
appeals. No single category accounted for more than 29% of all messages. The table
also reveals some noteworthy differences between the parties. The incumbent president
and his party (PNU) relied more heavily on performance messages than the opposition
parties (44% of all PNU messages mentioned performance in one way or another). For
ODM, the leading opposition party, messages were distributed more evenly across the
four categories, while ODM-K placed greater emphasis on issue priorities and positions
than the leading parties. The data also show that while ethnic appeals were not the only
messages used by the parties, ethnicity was central to the campaign, with about a quarter
of each party’s messages having ethnic content, as defined by the coding rules.

109
Table 4.2 Campaign Messages (percentages) PNU ODM ODM-K TOTAL Performance 44 22 9 29 Issue priorities / positions 23 27 48 27 Candidate characteristics 11 23 19 18 Ethnic appeals 22 28 24 25
4. 1 Performance
Performance messages are shown in Table 4.3. The parties’ performance
messages focused overwhelmingly on a few key areas: education (19%), infrastructure
(13%), economy/jobs/poverty (11%), and general performance claims (11%). These four
areas accounted for more than half of the parties’ performance messages. While other
areas were mentioned (e.g., healthcare, security, youth), none made up more than 10% of
the parties’ overall performance appeals.
The table shows a pronounced difference between the incumbent party and the
opposition regarding message tone. As the incumbent, Kibaki and PNU sought to
highlight the president’s accomplishments. Nearly all (99%) of PNU’s performance
messages were positive statements about the party’s accomplishments. The party focused
particularly on education reform (25%), citing the president’s decision during his first
term to implement free primary education. PNU also claimed credit for revitalizing the
country’s economy, noting that economic growth had accelerated rapidly during Kibaki’s
first terms (12% of all performance messages referenced economic growth). Another
main focus was investments in infrastructure, particularly roads, electricity, and water
(20%).

110
Table 4.3 Performance Messages (percentages) PNU ODM ODM-K TOTAL
pos neg pos neg pos neg Education 25 3 7 23 19 Infrastructure 20 2 2 15 15 13 Economy/job creation/poverty 12 1 18 11 General performance 17 1 2 9 8 11 Constituency Development Fund 4 1 8 8 Inflation 9 15 7 Constitutional Reform 13 6 Health care 10 6 Corruption 15 8 4 Security 1 3 4 Tribalism 7 3 Other 9 0 1 2 8 8 8 TOTAL 99 1 8 92 54 46
The opposition parties sought to counter PNU’s performance claims. Nearly all
of ODM’s performance messages (92%) and about half of ODM-K’s (46%) were
negative claims about PNU’s alleged failings. A persistent critique was that Kibaki had
failed to do enough to combat Kenya’s chronic unemployment and poverty (18% of
ODM’s performance messages fell into this category). ODM speakers claimed that while
the economy had grown in recent years, the benefits of growth had been enjoyed only by
the well-to-do, while most Kenyans continued to suffer in poverty. Both ODM and
ODM-K blamed Kibaki for failing to address inflation in food and transport costs. The
opposition also attacked PNU for failing to address high-level corruption, drawing
attention to a number of corruption scandals that plagued Kibaki’s first term. And ODM
repeatedly chastised Kibaki for reneging on his promise to reform Kenya’s constitution.
On education, the opposition charged that while primary school enrollment had

111
increased, the government had failed to provide adequate funding to accommodate the
influx of new students, undermining the quality of the public education system.
4.2 Issue Priorities/Positions
Table 4 shows the issue priorities and positions mentioned by the parties. Most
appeals in this category were statements about the priorities a candidate or party would
address if elected, not statements about ideology or explanations of how particular
problems would be tackled. Table 4.4 shows that the three parties focused on the same
issue areas mentioned in their performance appeals, namely education (21%),
economy/jobs/poverty (21%), and infrastructure (15%) – issues that perennially rank
among voters’ top concerns in poor countries like Kenya. In most cases, the parties
simply promised to respond to citizens’ needs and to do a better job than their opponents.
When specific details were provided, the parties generally mimicked each other’s
promises. For example, on education all three parties promised to introduce free
secondary education, building on the popularity of universal primary education.
There was, however, one major issue on which the parties staked out contrasting
positions: devolution. The opposition parties, particularly ODM, advocated the adoption
of a devolved system of government in which increased authority and resources would be
transferred to regional bodies. The data in Table 4.4 shows that for ODM, devolution
was the second-most-frequently mentioned policy issue (21%). Most speeches by
Odinga and other ODM leaders included a lengthy discussion of the benefits that a
devolved system of government would bring. ODM argued that it would lead to more
rapid economic growth, allow communities more control over how their resources were

112
used, and alleviate disparities between geographic regions. ODM-K echoed these claims.
By contrast, PNU argued that devolution would create expensive and unwieldy regional
bodies that would sap the treasury. As described below, the devolution debate was also
central to the parties’ ethnic appeals.
Table 4.4 Issue Priorities / Positions Messages (percentages) PNU ODM ODM-K TOTAL Education 32 15 15 21 Economy/jobs/poverty 25 29 27 21 Infrastructure 16 18 13 17 Devolution 4 21 4 15 Healthcare 4 5 5 Youth 2 4 13 4 Administration reform 8 0 3 Women 1 4 7 3 Land reform 5 1 3 Security 4 12 3 Other 3 8 7 7
4.3 Candidate Characteristics
Turning next to candidate characteristics, Table 4.5 shows that the campaigns
were filled with mudslinging – attacks against the character and qualifications of
opponents. The vast majority of messages (81%) in this category were negative claims
about opponents. The most common message (51% of the total) was simply that an
opposing leader was not trustworthy. To a lesser extent, the parties also sought to portray
their opponents as corrupt (20%) and incompetent (9%). The two leading parties – PNU
and ODM – focused nearly all of their attacks on each other, devoting less attention to the
third-placed candidate, Musyoka. For ODM-K, the strategy was slightly different. The

113
party sought to portray its leader, Musyoka, as the only “clean” candidate, asserting that
he had never engaged in corruption while alleging that both Kibaki and Odinga had dirty
hands.
Table 4.5 Candidate Characteristics Messages (percentages) PNU ODM ODM-K TOTAL
pos Neg pos neg pos neg pos neg Candidate trustworthy 5 12 11 Candidate competent 2 9 7 7 Candidate honest / not corrupt 5 2 48 1 Opponent not trustworthy 75 42 11 51 Opponent corrupt 6 26 33 20 Opponent not competent 8 9 9 Total 12 89 23 77 55 44 19 81
4.4 Ethnic Appeals
Table 4.6 shows the parties’ ethnic appeals. The data show that the parties rarely
made promises to represent their core co-ethnic groups (2% of ethnic messages). More
often, the parties sought to reassure out-groups that their interests would be protected
(15%) or that all groups would be treated equally (28%). Despite some minor differences
across the three parties, the data show that all three eschewed particularistic promises in
favor of more universal, inclusive appeals. The data in Table 4.6 indicate that in Kenya’s
multiethnic democracy it is far more important to reassure non-co-ethnic voters than to
reassure ethnic supporters.
Second, the table shows that about half of each party’s ethnic messages were
negative claims about the intentions of their opponents: 60% for PNU, 52% for ODM,

114
and 49% for ODM-K. However, while all three parties relied heavily on negative
messages about their opponents, the substance of these message differed between the
incumbent and the challengers in an important way. For the incumbent party, PNU,
almost all negative ethnic messages were about security concerns posed by its main rival,
Odinga. The opposition parties relied primarily on claims about ethnic favoritism. In the
remainder of this section, I explore these contrasting approaches, focusing primarily on
appeals used by the two leading parties in the race, PNU and ODM.
Table 4.6 Ethnic Appeals (percentages)
PNU ODM ODM-K TOTAL Positive messages about own party: Promises to represent core group 5 1 3 2 Promises to represent out-groups 19 13 21 15 Promises to treat all groups equally 16 34 27 28 Sub-total 40 48 51 45 Negative messages about opponent: Ethnic favoritism 3 47 39 32 Group security 57 5 9 22 Sub-total 60 52 49 55
The incumbent party, PNU, sought to convince voters that Odinga posed a
security threat to groups other than his own. The main strategy was to portray Odinga as
a violent man. PNU routinely mentioned that Odinga had studied in East Germany as
evidence of his extreme, communist tendencies, and PNU drew attention to Odinga’s
involvement in a failed 1982 coup to suggest that he would use violence to hold onto
power if elected. The party also claimed that Odinga would seek retribution for past
injustices if he came to office. Odinga had been imprisoned for nearly a decade as a

115
result of his involvement in the 1982 coup and his subsequent efforts to bring about a
multiparty system in the late 1980s. PNU hinted that Odinga would exact revenge
against the former president, Daniel arap Moi, and his ethnic community, the Kalenjin,
for this. PNU also played on the historical enmity that has at times existed between
Kikuyus and Luos, suggesting that if Odinga came to power, he would seek revenge
against Kikuyus. The following quote from a PNU rally exemplifies this strategy:
“ODM means ‘one dangerous man.’ This man [Odinga] is dangerous. At the time when Idi Amin of Uganda took over, people came and welcomed him, clapping for him. But a few years down the line, they cried. In Ethiopia, when Mariam [Mengistu Haile Mariam] took over, people clapped for him. They thought he was brave. But a few years down the line they cried. In Germany they elected Hitler. When Hitler started killing them, they couldn’t believe that it was the same person they elected. So let’s not elect our own Hitler in our nation!” (Unknown speaker, PNU rally in Mukurweini, October 13, 2007)
PNU’s central message in the devolution debate was that if Odinga were elected
those living outside their group’s “ethnic homeland” would be forced to leave, re-igniting
the inter-communal violence that occurred in Kenya in the 1990s. In the run-up to both
the 1992 and 1997 elections, Kikuyus were the victims of ethnic violence in the Rift
Valley Province and along the Coast (HRW 1993; Throup and Hornsby 1998; Kagwanja
1998). PNU’s messages about the divisive potential of devolution, therefore, touched on
very real security concerns. The following statement exemplifies this strategy:
“There are people who do not want Kibaki to continue to be our leader. The first person is called Raila Odinga…He wants to divide the country by introducing devolution…The last time we talked about devolution, what happened? In Likoni people were killed. We talked of devolution in Molo and people were killed. We talked of devolution in Subukia and

116
people were killed. And they [ODM] want to introduce something that is killing people. Kibaki says Kenya will be one country. And when his rival [Odinga] takes over, Kenya will be divided. It will be a divided and lost country, like Somali, Ethiopia, and Sudan.” (Mutahi Kagwe, Othaya Stadium, November 2007)
The opposition parties – ODM and ODM-K – used negative ethnic messages in
an attempt to convince voters that the incumbent president, Kibaki, was an ethnic
chauvinist who served only the Kikuyu community. The opposition claimed that during
his first term Kibaki had favored Kikuyus in the distribution of government
appointments, public expenditures, economic opportunities, and other state-controlled
benefits. These messages played on existing beliefs that Kenyan leaders tend to favor
their own ethnic groups and tapped into negative views of the Kikuyu, Kenya’s largest
and most economically advanced ethnic group. Opposition rhetoric portrayed the Kikuyu
as greedy and arrogant. In ethnically-mixed areas like the Rift Valley, opposition leaders
vilified Kikuyus as settlers who had wrongfully taken land belonging to local
communities, playing on tensions that date back to the colonial era (Kagwanja 2009;
Boone 2011). In this way, opposition leaders used anti-Kikuyu messages as part and
parcel of their attempts to cast doubt on Kibaki’s ethnic intentions. These leaders used
negative messages to portray Kibaki as a “tribalist” who served his own group’s interests,
and to heighten antipathy toward the broader Kikuyu community in order to limit the
appeal of a Kikuyu candidate. The following quote, from a rally in Mombasa,
exemplifies this strategy:
“Are we really going to believe those people [PNU]?…Their tribesmen are in the Ministry of Security, the Ministry of Finance, and the Ministry of Education…They should not forget that they are not the only Kenyans.
117
There are other tribes in Kenya other than Kikuyus.” (Najib Balala, Mvita, November 11, 2008).
Opposition leaders also alleged that Kibaki had discriminated against other groups
during his first term. Messages about ethnic discrimination were aimed in particular at
the Kalenjin ethnic community, a key swing group in the 2007 race. When Kibaki came
to power in 2002, he replaced several leading Kalenjin ministers, left over from the
previous administration. And, after taking office, Kibaki unceremoniously dismissed a
number of these Kalenjin leaders.46 Kibaki also made a controversial decision to evict
squatters, many of whom were Kalenjins, from a national preserve, the Mau Forest,
which provides an important watershed for some of Kenya’s most fertile agricultural
land. Ethnic considerations may well have had little to do with these decisions; yet, these
actions left Kibaki vulnerable to allegations of discrimination against the Kalenjin.
During the campaign, ODM candidates used emotive language to play on feelings of
ethnic persecution and injustice, as exemplified by the following quote from a rally in the
Kalenjin heartland:
“I hope you people will not vote for Kibaki. He is a traitor. Our people from Mau were chased away from their homes because they allegedly did not have title deeds. Then the government burned their homes and their church. After all of this, is there anyone who can still vote for Kibaki?” (William Ruto, Eldoret, December 6, 2007)
Opposition parties also used messages about ethnic discrimination in appealing to
Kenya’s Muslim community, which makes up about 10% of the population. ODM
alleged that Kibaki had deported dozens of Muslims who allegedly had ties to terrorist
46 These included Sally Kosgei (Head of Civil Service), Zakayo Cheruiyot (Private Secretary in the Office of the President), and others (Lynch 2008a).

118
organizations to Somalia. In the campaign, ODM sought to play on Muslim anxieties, as
in the following quote from a rally on the coast.
“Kibaki has taken our children off to Somali and Ethiopia. He is punishing our children. He has called us Al-Qaeda and said that we are terrorists. We won’t allow that!...We want freedom for our children; we want shelter for our children; we want economic growth; and we want devolution so that we can grow like other Kenyans.” (Najib Balala, Lamu, November 2007).
While seeking to portray Kibaki and the PNU as a party that would favor Kikuyus
and neglect other groups, the opposition parties promised to reduce ethnic inequalities
and put an end to ethnic discrimination, as in the following quote from Odinga:
“Kibaki has betrayed us. We took him as a Kenyan. We voted for him as a Kenyan. But when he got there, he stopped being a Kenyan and became a Kikuyu…I say that my government will be for all Kenyans. The Kikuyu will get jobs. Kambas will have opportunities. Luhyas, Digo, Durama, Arabs, Turkanas, Pokomos, Oromans, Merus, Embus, Luos, Pokots, Kalenjins, all. I have made an agreement with all Kenyans.” (Raila Odinga, Lamu, November 2007)
As noted above, one of ODM’s central promises in the campaign was that the party
would introduce a devolved system of government. ODM argued that devolution would
guarantee that all groups got a fair share of national resources, reducing domination by
those groups that controlled the central government, specifically Kibaki’s ethnic group,
the Kikuyu.
To summarize, the data show that all three parties employed negative ethnic
messages about their opponents but that the content of these messages varied between the
incumbent and the challenger. What accounts for the different messages used by the
parties to demonize each other? In all likelihood these disparities reflect the different

119
opportunities available to challengers and incumbents, as well as more idiosyncratic
factors related to the identities and the backgrounds of the candidates in the 2007 race.
Incumbents in Kenya are particularly vulnerable to charges of ethnic favoritism. For
historical reasons described in Chapter Two Kenyans are predisposed to believe that
leaders, particularly Kikuyus, engage in ethnic favoritism. Kibaki may have been
vulnerable to such claims, therefore, simply because of his identity as a Kikuyu and as an
incumbent. Moreover, Kibaki failed to adequately address concerns about ethnic
favoritism during his first term in office. The president relied overly on a core group of
advisors drawn from his own ethnic community and other closely-related groups (the
Meru and Embu), and failed to maintain the multiethnic coalition that brought him to
power in 2002 (Barkan 2008). These actions made him susceptible to charges that his
government acted only in the interest of certain communities.
Likewise, the main opposition leader, Odinga, was vulnerable to negative claims
about group security because of his personal background and his identity as a Luo.
Odinga’s father, Oginga Odinga, was long known as a radical advocate of socialist
policies in Kenya, and as noted, Odinga was implicated in a failed coup attempt in 1982 –
factors that made Odinga particularly susceptible to claims that he would engage in
violence and extremism. Moreover, Luos have long been seen as a marginalized
community that has been victimized by successive national leaders (Mueller 1984). Luo
politicians, including Odinga’s father, were systematically excluded from national
politics in the 1960s, and one of the main Luo leaders at independence, Tom Mboya, was
assassinated in 1969, allegedly by Kikuyu leaders who were threatened by his power
(Goldsworthy 1982). The bad blood between Luos and other groups, particularly the

120
Kikuyu, and Odinga’s own personal history, left the candidate vulnerable to appeals that
his election would lead to inter-communal violence.
This variation in the parties’ negative messages shows that parties design negative
ethnic claims to exploit their opponents’ weaknesses, using whatever material is likely to
resonate with voters. In some cases it may be advantageous to cast doubt about an
opponent’s distributional record or intentions; in other cases it may be more useful to
focus on security concerns. In short, the types of negative ethnic messages parties
employ are likely to be contingent on factors related to specific elections, as well as more
enduring tensions between ethnic communities in Kenya.
5. Conclusion
This chapter examines the use of ethnic appeals in Kenya. It shows, contrary to
much of the existing literature, that the imperative of attracting support from multiple
out-groups leads parties to avoid particularistic appeals that might portray too close an
association to specific ethnic communities. While particularistic appeals have little
benefit to Kenyan parties, negative claims about opponents’ ethnic intentions are more
useful. These messages, which are designed to demonize opponents as ethnic
chauvinists, serve the parties’ twin goals of gaining vote share among non-co-ethnic
swing voters and increasing turnout among core co-ethnic supporters. Content analysis
from a large sample of campaign speeches from the 2007 election confirms that the
leading candidates and their parties almost never made promises to favor their own ethnic
groups or a subset of ethnic communities, promises that would alienate potential
supporters from other groups. Instead, the parties sought to portray themselves as

121
inclusive, reassuring out-groups of their intentions to treat all ethnic communities fairly.
The parties used negative ethnic message to raise doubts about their rivals’ intentions, the
substance of which varied across parties according to the opportunities and constraints of
the race.

122
Chapter 5.
Recruiting Trusted Messengers
1. Introduction
The success of campaigns in Kenya depends not only on developing the right
messages but also on recruiting a diverse team of trusted messengers from across the
country’s ethnic communities. Parties rely on lower-level candidates – those running for
parliamentary and local-government seats – to manage and fund their grassroots
campaign activities and to lend their credibility to the candidates’ persuasive efforts.
This chapter examines candidate recruitment. It shows that while major parties in Kenya
have little difficulty constructing diverse slates, their ability to recruit high-quality
candidates for lower-level races varies in systematic ways across ethnic communities.
Specifically, I show that the leading parties are typically able to monopolize the
recruitment of high-quality candidates from their core ethnic communities but are
generally unable to recruit trusted leaders from their opponents’ ethnic communities. As
described more fully in the next chapter, these recruitment dynamics help to explain the
polarizing effects of electoral competition.
While the primary goal of this chapter is to set the stage for the examination of
campaign effects in the next chapter, the analysis of candidate recruitment also
contributes to debates about party building in multiethnic democracies. A central puzzle
in the existing literature is why parties in settings like Kenya diverge in their ethnic
composition. If all party leaders understand that their electoral success depends on

123
getting their “ethnic profiles” right, why should they differ in their ethnic make-up? Why
do parties fail to converge on some optimal ethnic mix that maximizes their electoral
prospects? While existing research points to institutional factors (Chandra 2004) or party
size (Ferree 2011), the argument offered here points instead to the strength of presidential
coattails in Kenya’s lower-level races. The expectation of coattail voting leads high-
quality candidates for parliamentary and local-government seats to seek nomination on
the party ticket of whichever presidential candidate is dominant in their constituencies
and wards. As a result, the main presidential candidates are able to attract the best local
candidates in the areas where they enjoy support. And because ethnic groups are
geographically concentrated, parties have little trouble monopolizing trusted local leaders
in their core ethnic communities.
The chapter is structured as follows. The next section argues that Kenyan parties
have multiple incentives to recruit diverse slates of candidates for lower-level races and
provides evidence from the 2007 election to demonstrate that they generally have little
difficulty doing so. Using data on the ethnic identity of all parliamentary candidates in
2007, I show that the leading parties presented highly-diverse slates of parliamentary
candidates. While this finding provides important insight into the parties’ recruitment
goals, it is not particularly revealing because the large number of low-quality candidates
in Kenya makes it easy for the parties to fill their ranks with a diverse array of candidates.
More important is the recruitment of quality candidates. The third section defines
candidate quality and explains why the ability to recruit quality leaders varies across
ethnic groups. The fourth section tests the observable implications of the argument using
data from the 2007 election. The final section concludes.

124
2. Building Multiethnic Parties
Constructing diverse parties that include lower-level candidates from multiple
ethnic communities serves a number of purposes. First, if party leaders seek to capture
seats in the parliament and local-government councils, they must field candidates from
across the country’s ethno-regional areas. These candidates are elected from single-
member districts, and because ethnic groups are geographically concentrated in Kenya,
most constituencies and wards are relatively homogenous with respect to ethnicity. To be
competitive in lower-level races parties must recruit candidates from the locally-
dominant ethnic community in each constituency and ward (Bennett and Rosberg
1961).47 Thus, if parties seek to contest lower-level races, they must recruit candidates
from multiple groups.
Second, candidate recruitment also plays an important signaling function. As
noted in Chapter Two, Kenyan voters form expectations about the favoritism intentions
of presidential candidates based in part on the ethnic profiles of the parties. One way that
presidential candidates can signal their inclusive intentions is by recruiting lower-level
candidates from outside their own ethnic groups. As Chandra (2004) and Ferree (2011)
argue, doing so communicates the party’s intention to be responsive to the needs and
wants of target communities. And, given the importance of attracting support from
multiple groups in Kenya, parties have a keen interest in demonstrating their inclusive
intentions.
47 Data on the ethnic identity of parliamentary candidates in the 2007 race (described more fully later in the chapter) show that 88% of all parliamentary candidates came from the largest ethnic group in the constituency in which they ran. And in constituencies where one ethnic group made up more than half of the population, 95% of candidates were from the largest ethnic group.

125
Recruiting a diverse slate of lower-level candidates is also important for the
conduct of campaigns. Lower-level candidates play a critical role in implementing
campaigns at the grassroots level. Kenyan parties are weakly institutionalized and
typically lack organizational structures that reach into the countryside. As a result,
parties rely on their parliamentary and local government candidates to manage and fund
election campaigns. At the local level, these candidates are expected to conduct rallies,
hold “town hall” meetings, and organize door-to-door canvassing. Moreover, these
candidates often have credibility in their local constituencies that the presidential
aspirants lack outside of their core ethnic areas. As described more fully in the next
chapter, credibility is an essential ingredient in campaign persuasion. Thus, if parties
seek to influence the attitudes and beliefs of voters in multiple ethnic communities, they
must recruit trusted leaders from these communities.
In sum, parties have strong incentives to recruit diverse slates of lower-level
representatives. Data from the 2007 election confirm this point. Figures 5.1, 5.2, and 5.3
show the ethnic identify of the parliamentary candidates on the three main party labels in
the race, PNU, ODM, and ODM-K.48 For comparative purpose the figures also show the
ethnic distribution of the population, taken from the 1989 census. The figures
demonstrate that each of the parties recruited a highly-diverse slate of parliamentary
candidates that mirrored the Kenyan electorate. Relative to the population, PNU’s slate
included a disproportionate number of candidates from its core ethnic group (the Kikuyu)
and was under-representative of some communities, particularly the Luo, the core group
of its main rival, ODM. Nonetheless, the data show that no more than 31% of all PNU
48 Coding was done by a team of Kenyan research assistants, based on the last names of the candidates.

126
candidates came from any one community. ODM’s slate of candidates was also highly
diverse, though some minor deviations are noteworthy. The party was under-
representative of candidates from its opponents’ core ethnic groups, the Kikuyu and
Kamba, and its slate was over-representative of candidates from the Kalenjin community
and smaller groups included in the residual “other” category. Finally, while ODM-K also
put forward a diverse slate of candidates, some clear discrepancies were again evident. In
particular, the party recruited few candidates from its opponents’ core ethnic groups,
attracting few Kikuyus or Luos. As a result, the party was over-representative of
candidates from its core group (the Kamba), the Kalenjin, and the smaller communities
labeled as “other.” Taken together, these findings confirm that despite some important
variations, parties generally have little trouble attracting diverse slates of candidates.
Figure 5.1 Ethnic Composition of PNU’s Parliamentary Slate

127
The ethnic composition of the parties’ slates, however, tells us little about their
ability to recruit quality candidates from target ethnic groups. In Kenya low-quality
candidates abound and parties generally have little trouble finding warm bodies to fill
their ranks. The real contest, however, is for high-quality candidates, those who bring
Figure 5.2 Ethnic Composition of ODM’s Parliamentary Slate
Figure 5.3 Ethnic Composition of ODM-K’s Parliamentary Slate

128
prestige and resources to the party. And it is in the recruitment of these highly-desirable
politicians where greater differences are observed between the parties.
3. Recruiting High-Quality Candidates
Why should parties differ in their ability to recruit quality candidates from
particular communities? One answer, from Chandra’s (2004) work on ethnic parties in
India, offers an institutional explanation. She argues that parties with competitive rules
for intraparty advancement are better able to incorporate elites from target ethnic groups,
relative to parties with more centralized decision-making structures. The logic is that in
parties with more competitive rules for advancement (elections for intraparty promotion
and open membership), party leaders are less inclined to block the advancement of new
recruits from other ethnic communities. The argument, however, does not apply well to
cases like Kenya, where parties are weakly institutionalized. Party leaders generally
invest little in developing durable rules for intraparty advancement; more often, such
rules are simply created or modified as needed to suit the particular circumstances of a
given electoral contest. And the main competitors in each election round generally
employ similar institutional rules to govern advancement within their ranks.
Ferree’s (2011) study of candidate recruitment in South Africa offers an
alternative approach that emphasizes party size. In explaining why party leaders in South
Africa’s traditionally “white” parties have been relatively unsuccessful in their efforts to
diversify their ranks in the post-Apartheid era, she argues that their small size, relative to
the country’s dominant party (the ANC), limits their ability to change their ethnic profiles
over time. Because smaller parties control only a handful of seats in the legislature,

129
incorporating new black candidates requires jettisoning senior leaders from their ranks.
By contrast, the ANC, which controls many more seats in the legislature, can more easily
offer a spot to an in-coming candidate without having to displace a senior party official.
At the same time, because smaller parties have fewer seats at their disposal they find it
difficult to cultivate and nourish new talent from within, making it hard to diversify their
ranks by developing a new cadre of black leaders under their own tutelage. And smaller
parties are also at a disadvantage because they have less to offer aspiring candidates.
While the ANC offers the prospects of influencing policy and benefiting from the many
perks of being in government, smaller parties are generally consigned to the margins of
the political system, having less influence over policy and less access to the benefits of
power. The Kenyan case, however, shows that size is not everything. As I demonstrate
below, even small parties have an advantage in recruiting quality lower-level candidates
from their core ethnic communities.
This section develops an alternative account of candidate recruitment that builds
on the insight that in Kenya’s lower-level races presidential coattails exert a powerful
influence on voter behavior. It shows how the anticipation of coattail effects leads
quality lower-level candidates to seek to run on the party ticket of whichever presidential
aspirant is dominant within their constituencies. The result is that each party is able to
monopolize the best local talent within the ethnic areas where its party leader is popular.
Coattail effects emerge when voters’ preferences in top-of-the-ticket races affect
their decisions in down-ballot races, leading to party-line voting. Anecdotal evidence
suggest that coattail voting has been common in Kenya’s recent multiparty elections. In
their analysis of Kenya’s 1992 election, for example, Throup and Hornsby (1998) note a

130
strong correlation between support for presidential and parliamentary candidates running
on the same party ticket at the constituency level, which they attribute to coattail voting.
They observe that, “good [parliamentary] candidates performed very badly if they were
in the wrong party, and little-known first-timers triumphed over established politicians.
Over most of the country…it was party and the presidential candidates’ ‘coat-tails’ that
determined the results” (p. 446). Similarly, Oloo (2001) notes that in the Rift Valley in
1992, “most aspirants…viewed the real battle to be at the primaries stage rather than
during the general election. This was based on the belief that once an aspirant won the
KANU nomination ticket, the general election would be a mere formality since that area
was a KANU stronghold” (Oloo 2001, 447). Likewise, Kimathi (2001) argues that in the
1997 race in Luo areas the key to electoral victory was gaining the nomination on the
NDP ticket, the party headed by Raila Odinga, who was the overwhelming favorite in the
presidential race (p. 504).
Why might presidential preferences affect decisions in lower-level races for
Kenyan voters? Existing research from studies of U.S. congressional elections suggests
that individuals engage in coattail voting when they lack information about down-ballot
elections (Mondak and McCurley 1991; Mondak 1993). In cases where the voter holds
clear preferences about the presidential race but knows relatively little about the
candidates in the congressional race, the party label of one’s preferred presidential
candidate provides a useful cue. From this cue, voters may infer that lower-level
candidates running on the same ticket as their preferred presidential aspirant hold similar
policy views and personal characteristics. Voters who lack more complete information
about the lower-level candidates thus rely on party cues as a second-best information

131
source.
This logic is likely to be operative in Kenya, where voters often confront
significant information constraints in down-ballot races. In parliamentary contests, voters
face a large number of alternative candidates, most of whom have no public record of
service. In the 2007 elections, for example, the average number of candidates per
parliamentary constituency was 12, with several constituencies having more than 30
competitors. Moreover, because communication infrastructure at the local level is poorly
developed in Kenya, voters have few opportunities to learn about the competitors during
the race. The candidates rarely advertise on national media outlets, relying instead on
local rallies and door-to-door canvassing, the reach of which is limited by financial
constraints for most candidates. Kenyan voters, however, tend to have strong preferences
about the presidential nominees. These national-level candidates are well-known
political figures and their campaigns are extensively covered by national media. For
Kenyan voters, then, coattail voting may stem the from informational constraints that
affect voters elsewhere.
The motivation for coattail voting may also arise from voters’ desire to ensure
that local representatives are well placed to access state-controlled resources on their
behalf after the election. As shown in Chapter Two, Kenyan voters have come to expect
that government leaders enjoy considerable discretion in the allocation of state-controlled
benefits. Barkan (1984) notes that the main demand Kenyan voters place on their MPs is
to bring resources from the central government back to the local constituency. As such,
voters may avoid minor-party candidates who are likely to have limited influence with
132
national leaders after the race, preferring candidates from major parties headed by the
leading presidential candidates.
The strength of presidential coattail effects means that for lower-level candidates,
gaining the nomination on the party ticket of a locally-popular presidential candidate
brings a reserve of electoral support. In areas where one presidential candidate is the
overwhelming favorite, the real contest is often at the nominations stage, and the
candidate who succeeds in gaining the desired nomination on the locally-dominant ticket
is virtually assured of winning the subsequent general election. For candidates who fail
to gain the desired nomination, the options are bleak. They may run under a different
party label (running as an independent is not allowed in Kenya), but being affiliated with
a party that has little local support in the presidential race typically means that the
candidate will fare poorly in the general election. And affiliation with the party of a
locally-unpopular presidential candidate can be detrimental.
While lower-level candidates seek to run on the party label of whichever
presidential candidate is most popular in their constituencies and wards, party leaders
seek to attract the best local talent – quality candidates – to run on their tickets.
Recruiting low-quality candidates from a target community does little to enhance a
party’s image in the eyes of the community (Ferree 2011). Low-quality candidates are
not likely to have much influence in their communities during the campaigns, nor are
they likely to be able to mobilize the substantial resources needed to implement an
effective ground game on behalf of the party in their parliamentary constituencies.
Parties, therefore, work hard to recruit quality local leaders to run on their tickets.
133
How is candidate quality defined in Kenya? A minimum requirement is that
local-level candidates be from the dominant ethnic community in the constituencies or
wards where they seek office. More fundamentally, though, the distinction between
high-quality candidates (those that have a chance of winning their seats and may be able
to deliver support for the party leader) and low-quality candidates (those who have little
chance of winning their races or influencing voters’ attitudes and beliefs) relates to
reputation. Specifically, high-quality candidates are those who have developed a
reputation for advancing local interests. As Barkan (1984) notes, in Kenya local leaders
build reputations by demonstrating their ability to marshal resources for local
development. For aspiring leaders, building local support depends on mobilizing funds
for local development projects (Barkan and Holmquist 1989). In their attempts to attract
quality candidates for lower-level races, the parties therefore seek to recruit leaders with
strong local reputations.
In Kenya, parties are likely to have little difficulty recruiting low-quality
candidates from target communities. Low-quality candidates, who have invested less
time and resources in building reputations, have little to lose from affiliation with a
locally-unpopular party. For low-quality candidates, affiliation with a major party – even
one headed by a presidential candidates who is unpopular in the area – may be better than
running on a minor-party ticket or sitting out the race. Although affiliating with an
unpopular party is not likely to help the candidate’s electoral chances, the candidate may
be rewarded (for example with an appointment to a government position) by the party
after the race if he or she succeeds in mobilizing support for the party’s leader.

134
A party’s ability to recruit high-quality candidates, however, depends on the
popularity of the party’s leader at the constituency level. Quality candidates who have
invested time and resources in establishing their local credentials as trusted community
leaders are averse to doing anything that might tarnish their reputations with local voters.
For these candidates, affiliation with an unpopular presidential candidate brings greater
risk, and they seek to avoid squandering the goodwill they have established with voters in
their constituencies and wards. Thus, when quality candidates fail to gain the nomination
on the locally-dominant party ticket, they generally run on a “neutral” party ticket that is
not headed by an unpopular presidential nominee or sit out the race. The result is that the
parties are typically unable to attract quality candidates in areas where their party head is
unpopular.
To summarize, the argument so far claims that while parties have little difficulty
recruiting low-quality candidates across ethnic areas, their ability to recruit high-quality
candidates varies with the popularity of their presidential nominee at the local level.
While the argument advances a proposition about the parties’ ability to recruit candidates
across constituencies and wards, it also has implications for their ability to recruit
candidates from target groups. The need to put forward candidates from the dominant
ethnic community in constituencies and wards means that a party seeking to recruit
candidates from a particular ethnic community must do so from the constituencies and
wards where that community is concentrated.
The geographic concentration of ethnic communities means that for parties the
ability to recruit quality candidates from any group is simply a function of the party
leader’s popularity with members of that group at the start of the race. When a

135
presidential candidate enjoys widespread support from members of an ethnic community,
his party will be the desirable ticket in the constituencies and wards where members of
the group are concentrated. Likewise, when a presidential candidate enjoys little support
from the group, his party will have little appeal to quality candidates in the areas where
members of the group are concentrated. A final implication of this argument is that when
presidential candidates enter the campaigns with strong support from co-ethnic voters, as
they frequently do, their parties will have an advantage in attracting quality candidates
from their own ethnic communities.
The above argument implies two testable hypotheses:
1. The ability to recruit high-quality candidates at the constituency-level will
vary in relation to the popularity of the party’s presidential nominee.
2. The ability to recruit high-quality candidates from ethnic groups will depend
on the popularity of the party’s presidential candidate with voters from each
community. As a result, the extent to which the major parties are able to
monopolize the recruitment of quality candidates from their core ethnic
groups will depend on the popularity of the party’s leader among co-ethnic
voters.
4. Data and Tests
To test the claims outlined above, I draw on data on the recruitment of
parliamentary candidates in Kenya’s 2007 election. For all tests, I focus on the three
major parties in the race: PNU, ODM, and ODM-K. It is important to note that as a

136
coalition of many smaller parties, PNU allowed multiple candidates to run on affiliated
party labels in most constituencies, while the opposition parties – ODM and ODM-K –
allowed only one candidate per constituency.49 In total, PNU and its coalition partners
put forward 1,033 candidates, while ODM ran 189 and ODM-K recruited 129.
Testing the claim that the ability to recruit quality candidates varies in relation to
the popularity of each party’s presidential candidate at the constituency level (Hypothesis
1) requires a measure of candidate quality. I follow existing studies from the U.S. (e.g.,
Jacobson 1989; Carson, Engstrom, and Roberts 2007) that measure quality in terms of
candidates’ past experience in elected office. I also leverage information revealed
through the 2007 primary election process, which provides an indication of the actual
support candidates enjoy within the constituencies where they sought election. For each
constituency, I code a high-quality candidate as the incumbent member of parliament – or
– the candidate who defeated the incumbent MP if he/she competed in an open primary
contest and lost. I identify the quality candidates for 194 out of the 210 constituencies.50
The data show that in total PNU recruited 119 high-quality candidates, ODM 62, and
ODM-K 11.
While this measure of candidate quality is relatively straightforward to construct
from the available data, one disadvantage is that I am only able to define one candidate as
high-quality in each constituency. Despite this limitation, examining the recruitment 49 PNU’s coalition partners included the following parties: DP, FORD-KENYA, FORD-PEOPLE, KANU, NARC-KENYA, New Ford-Kenya, Shirikisho, Agano, Community Development Party, Ford-Asili, Forepa, Kenya Republican Reformation Party, Kenya Union of National Alliance, Mazingira Green Party, National Alliance Party of Kenya, National Renewal People’s Party, New Aspirations Party of Kenya, New Generation Party, Republican Liberty Party, Saba Saba Asili, SAFINA, Sheda Party, Sisi Kwa Sisi, United People’s Congress, Vijana Progressive Alliance and Workers Congress. Source: PNU Manifesto. 50 Details on the primary elections was culled from newspaper accounts in Kenya’s two leading dailies, the Nation and the Standard.

137
choices made by this limited set of actors is still instructive, as it is reasonable to assume
that the decisions made by these candidates are likely to be representative of high-quality
candidates more broadly. A second limitation with the coding scheme used here is that
not all incumbents competed in primary elections; of the 209 sitting MPs who sought
reelection in 2007, 39 received direct nominations from PNU or ODM.51 In these cases, I
cannot use the primary election results as a measure of candidate quality. To ensure that
the results estimated below are not affected by this limitation, I rerun all tests excluding
the 39 constituencies in which the sitting incumbents received a direct nomination on one
of the leading party tickets.
To test Hypothesis 1, I run a bivariate logit model for each party. The dependent
variable is a dichotomous measure of whether the party succeeded in attracting the
quality candidate in each constituency. The independent variable is an estimate of the
presidential candidates’ support at the constituency level, which I generate from national-
level surveys conducted just prior to the parties’ primary elections for parliamentarians.
These estimates of constituency-level voter preferences were created by first estimating
group-level preferences for the 21 largest ethnic groups in Kenya using data from four
national surveys conducted between mid-September and early-November 2007.52 Then,
to estimate the support for each presidential candidate at the constituency level, I
multiplied the share of each ethnic group in each constituency by the national-level share
of the group that expressed an intention to vote for each of the candidates. I then
summed these values for all ethnic groups in the constituency.
51 PNU offered direct nominations to 33 incumbents and ODM to six. 52 All survey data come from public opinion polls conducted by Steadman. Details are provided in Appendix 4.1.

138
The results of the logit models, presented in Table 5.1, show a strong association
between each party’s success in recruiting quality candidates and the popularity of its
party leader at the constituency level.53 While I cannot rule out the possibility of
endogeneity (i.e., that the presidential aspirants are popular in constituencies where they
gained the endorsement of high-quality candidates before the nominations exercise),
these results support the plausibility of the argument outlined above.
Table 5.1 Logit Models of Candidate Recruitment (high-quality candidates) PNU ODM ODM-K Kibaki vote share 6.68*** (0.00) Odinga vote share 6.64*** (0.00) Musyoka vote share 9.22*** (0.00) Constant -1.64*** -4.67*** -5.47*** (0.00) (0.00) (0.00) Observations 194 194 194 Pseudo R2 .25 .31 .62 p-values in parentheses *** p<0.01, ** p<0.05, * p<0.1
To see the substantive effect of the party leader’s popularity on the ability to
recruit quality candidates, I use Clarify to generate predicted probabilities (King, Tomz,
and Wittenburg 2000). The results, shown in Figure 5.2, are superimposed over the raw
data from which the estimates are derived. The data show that PNU out-performed in
many constituencies, attracting quality candidates in areas where its party leader enjoyed
relatively little support, while ODM under-performed in a number of constituencies,
53 The exclusion of the 39 constituencies where incumbents received direct nominations does not affect the significance of the associations in Table 5.1 and the coefficients on the vote share variables are of similar magnitude.

139
failing to recruit high-quality candidates in areas where its leader was popular. As a
result, PNU’s probability of success is higher at all levels of support for its party leader.
This finding suggest that factors other than the popularity of the party’s presidential
candidate also affect the ability to recruit quality lower-level candidates. In all
likelihood, PNU enjoyed a recruiting advantage over its main rival because it was the
party of the incumbent president and may have had greater access to resources to entice
quality candidates to run on its label.
0.2
.4.6
.81
Prob
abilit
y of
Rec
ruiti
ng H
igh-
Qua
lity
Can
dida
te
0% 20% 40% 60% 80% 100%Estimated Support for Kibaki in Constituency
0.2
.4.6
.81
Prob
abilit
y of
Rec
ruiti
ng H
igh-
Qua
lity
Can
dida
te
0% 20% 40% 60% 80% 100%Estimated Support for Musyoka in Constituency
0.2
.4.6
.81
Prob
abilit
y of
Rec
ruitin
g Hi
gh-Q
uality
Can
dida
te
0% 20% 40% 60% 80% 100%Estimated Support for Odinga in Constituency
PNU ODM
ODM-K
Figure 5.4 Predicted Probability of Recruiting High-Quality Candidates (with 95% CI)

140
The results also show that although the third-place party, ODM-K, was headed by
a non-viable presidential candidate, the party was nonetheless successful in attracting
many of the high-quality candidates in the constituencies where Musyoka was the front-
runner. Specifically, in the 15 constituencies where Musyoka’s support exceeded 50%,
ODM-K attracted 67% (10 of 15) of the high-quality candidates. This finding
demonstrates that even small parties have an advantage in recruiting quality candidates in
areas where their supporters are concentrated.
These results lend support to the claim that the ability to recruit quality candidates
for parliamentary races varies in relation to the popularity of the party’s leader at the
constituency level. Building on this claim, Hypothesis 2 argued that because of the
geographic concentration of ethnic groups, the ability to recruit quality candidates from
particular communities varies in relation to the popularity of the party’s leader with
voters in each group. To confirm this claim, I plot the percent of quality candidates
recruited from each ethnic group against the popularity of the presidential candidates in
each group. The results are shown in Figure 5.3. Consistent with expectations, the
figures show a clear association. In communities where Kibaki enjoyed strong support
(the Kikuyu and Meru) PNU attracted most or all high-quality candidates. In groups
where Kibaki was less popular (the Luo, Kamba, and Kalenjin) PNU had less success
recruiting quality candidates. The same pattern holds for both opposition parties, ODM
and ODM-K. Some exceptions, however, are worth noting. PNU out-performed in
several communities, recruiting large numbers of quality candidates despite the relatively
weak support for Kibaki among voters in those groups. This was particularly true among
the Kisii and Mijikenda, where PNU recruited nearly all high-quality candidates despite

141
having less than 40% support from each community. Likewise, the data show that ODM
under-performed in several communities – particularly the Kisii and Mijikenda – where
its party leader (Odinga) was the favorite but the party recruited relatively few high-
quality candidates. Again, these findings reinforce the point made above that other
factors – in addition to the popularity of the party’s leader – also affect the ability to
recruit quality candidates from target ethnic groups. Nonetheless, the data show a strong
association between the popularity of each presidential candidate and the ability of their
parties to recruit quality candidates from target groups.
Finally, Hypothesis 2 claimed that the ability to monopolize the recruitment of
quality candidates from the parties’ core ethnic communities depends on the party
leader’s support among co-ethnic voters. The data reported in Figure 5.3 show that PNU,
whose party leader (Kibaki) was supported by 89% of co-ethnic voters prior to the
nomination process, recruited 38 of 39 high-quality Kikuyu candidates (97%). Likewise,
ODM, whose party leader (Odinga) enjoyed the support of 95% of co-ethnic voters,
succeeded in attracting 22 of 23 high-quality Luo candidates (96%). For ODM-K, the
success rate was lower: as noted above, the party recruited 10 of 15 quality candidates
(67%) from its core ethnic group (the Kamba). Consistent with the argument outlined
above, the data shows that co-ethnic support for the party’s leader (Musyoka) was lower
(70%) than for the two leading parties. In sum, the data confirm that when presidential
candidates enter the race with strong support from co-ethnic voters, their parties are able
to monopolize the recruitment of high-quality candidates from their own communities.
And the extent to which they are able to monopolize quality candidates varies in relations
to the presidential candidates’ co-ethnic support at the start of the race.

142
Kiku
yuLu
o
Kam
ba
Luhy
aKa
lenj
in
Kisi
i Mer
u Mijik
enda
020406080100Share of Quality Candidates Recruited
020
4060
8010
0Es
timat
ed S
uppo
rt fo
r Mus
yoka
PNU
O
DM
O
DM
-K
Kiku
yu
Luo
Kam
ba
Luhy
a
Kale
njin
Kisii
Mer
u
Mijik
enda
020406080100Share of Quality Candidates Recruited
020
4060
8010
0Es
timat
ed S
uppo
rt fo
r Odi
nga
Kiku
yu
Luo
Kam
ba
Luhy
a
Kale
njin
Kisi
i
Mer
u
Mijik
enda
020406080100Share of Quality Candidates Recruited
020
4060
8010
0Es
timat
ed S
uppo
rt fo
r Kib
aki
Figu
re 5
.5 S
hare
of Q
ualit
y C
andi
date
s Rec
ruite
d fr
om M
ajor
Eth
nic
Gro
ups

143
5. Conclusion
Campaigns are designed to influence voters’ attitudes and beliefs. While crafting
the right messages is an essential piece of campaign communication, so too is recruiting
the right messengers. The need to attract support from multiple ethnic communities leads
parties in Kenya to recruit local-level candidates from across the ethnic spectrum. This
chapter shows, however, that while the main parties generally have little difficulty
attracting candidates across ethnic lines, their ability to recruit high-quality candidates
from ethnic communities varies in relation to the popularity of each party’s leader within
particular groups. The result is that the leading parties are typically able to monopolize
the best local talent in their core ethnic areas, but generally fail to recruit quality local
leaders from their opponents’ core areas.

144
Appendix 5.1. Estimating Vote Share by Ethnic Group
To construct vote share estimates by ethnic group, I used survey data from four
opinion polls conducted between late-September and early November 2007. I included
only polls conducted after the major parties had finished their nominations exercises for
their presidential candidates and before the parties had begun the nominations process for
parliamentary candidates. The dates and sample size for the polls are as follows: 1)
September 21-25, n=2,020; 2) October 10-11, n=2,736; 3) October 20-23, 2,718; 4)
November 3-7, n=2,712.
All polls were conducted by a Kenyan survey firm, Steadman (now part of
Synovate). To probe voting intentions, the polls used a question that asked, “If an
election for president were held now, whom would you vote for if the person was a
candidate?” The polls also asked respondents about their ethnic identity. The merged
data set resulted in a total sample of 10,074 respondents. Table 5.2 reports the sample
size and the estimated distribution of voting intentions for each ethnic group.

145
Table 5.2. Estimated Vote Share by Ethnic Group Estimated Vote Share (%)
Group Sample Kibaki Odinga Musyoka Other /
Undecided Bajun 20 35 50 15 0 Borana 78 51 41 6 1 Embu 110 88 5 2 3 Kalenjin 1,186 12 82 2 3 Kamba 986 19 8 70 3 Kikuyu 2,077 89 6 1 2 Kisii 635 33 61 1 3 Kuria 26 42 54 0 4 Luhya 1,283 23 68 2 4 Luo 1,513 3 95 0 1 Maasai 155 19 79 1 1 Mbeere 47 96 2 2 0 Meru 615 83 11 3 1 Mijikenda 395 29 57 6 5 Pokomo 19 58 32 0 5 Pokot 25 4 84 12 0 Samburu 63 30 56 11 3 Somali 408 32 64 2 1 Taita 125 31 55 7 5 Teso 85 16 71 4 9 Turkana 165 32 52 5 8 Other 58 22 74 2 0

146
Chapter 6.
Campaigns and Ethnic Polarization
1. Introduction
Previous chapters have demonstrated that in Kenya the hunt for swing voters is
central to campaigns. This chapter shows that despite the vigorous competition for swing
voters, campaigns in Kenya have a polarizing effect. The reason stems from the
connection between ethnicity and information processing: because voters look to
ethnicity as a marker of credibility, they tend to internalize more readily campaign claims
made by co-ethnic leaders while discounting messages from non-co-ethnics. Campaign
polarization occurs, therefore, because different communities accept messages from
distinct sets of elites offering opposing views on the central issues of the campaign.
To demonstrate the polarizing effects of Kenyan campaigns, this chapter draws on
data from multiple cross-sectional surveys conducted in the months prior to Kenya’s
2007 election. I use data on attitudinal measures that correspond to the parties’ campaign
messages described in Chapter Four. I also examine trends in voting intentions. The data
demonstrate that while considerable polarization was already evident at the start of the
race, a consistent pattern of change can be observed over the course of the campaign.
The account developed here is distinct from previous studies of ethnic
polarization during electoral contests in two ways. First, much of the literature on racial
and ethnic campaign appeals comes from studies of the U.S. that emphasize the use of
subtle non-ethnic cues to prime existing racial stereotypes and antipathies (Mendelberg

147
2001; Valentino, Hutchings and White 2002). While these studies focus on the content of
ethnic messages, I emphasize instead the identity of the messenger. While content clearly
matters, so too does the credibility of the messenger. Second, the account offered here
extends the literature on the instrumental use of ethnic rhetoric by elites. Many existing
studies argue that ethnic appeals can have polarizing effects (Horowitz 1985; Horowitz
1991; de Figueiredo and Weingast 1999; Gagnon 2004). These works, however,
typically leave questions about information processing untheorized. This chapter seeks to
build a firmer foundation for the investigation of campaign effects in divided societies by
drawing on insights from the literature on information processing and persuasion.
The structure of the chapter is as follows. The next section develops an argument
that explains why campaigns in multiethnic settings like Kenya should have polarizing
effects across the ethnic communities associated with the leading parties in the race. The
third section draws on a wealth of survey data to support the argument, and the final
section concludes.
2. How Campaign Messages Polarize Ethnic Groups
Campaign appeals are designed to influence voters’ attitudes and beliefs. While
there are many ways through which campaign messages might affect voters, in this
chapter I focus on persuasion, which, following Lupia and McCubbins (1998, 40), I
define as a one person’s successful attempt to change the beliefs of another. Decades of
research on persuasion demonstrate that a listener’s willingness to internalize persuasive
messages depends on her assessment of the speaker’s credibility. This section outlines
the existing research on source credibility and argues that the connection between

148
ethnicity and beliefs about the trustworthiness of political leaders in multiethnic
democracies like Kenya leads to predictable patterns of belief polarization across ethnic
communities during campaigns.
One of the core insights from studies of information processing is that individuals
more willingly accept arguments made by sources that are perceived as credible. Zaller
(1992) argues that individuals do not simply evaluate elite messages based on the content
of the appeal. Rather, “people rely on cues about ‘source’ of the message in deciding
what to think of it” (p. 45). Citing work by McGuire (1969), Zaller notes that messages
are perceived as “fairer, more factual, more thoroughly documented” when ascribed to a
source that is seen as credible. Experimental studies from a wide range of contexts
support this claim (Hovland and Weiss 1951; Lupia and McCubbins 1998; Druckman
2001; Miller and Krosnick 2000; Callaghan and Schnell 2009).
How do individuals assess credibility? Lupia and McCubbins (1998) argue that
voters perceive a speaker to be credible when the speaker holds common interests with
the listener. The perception that a speaker shares one’s interests signals that the speaker
is unlikely to mislead the listener. The listener will therefore be receptive to the
information and arguments received from the speaker, and will be more inclined to pay
attention to the speaker’s claims and to give weight to them. By contrast, when a listener
believes that the speaker’s interests diverge from her own, she will tend to ignore or
discount claims made by the speaker.
While individuals may look to a variety of source cues – party, gender, age, race,
etc. – to evaluate whether a speaker holds common interest, scholarly research on the use
of source cues has to date focused primarily on partisanship and ideological orientations.

149
Observational studies from the U.S. provide evidence that citizens tend to be more
responsive to arguments made by elites who share their partisan and ideological
inclinations (Zaller 1992; Jacobson 2007). Experimental studies likewise demonstrate
that partisan and ideological match between messenger and listener increases adoption of
messages (Ladd 2009; Baum and Groeling 2009; Slothuus and de Vreese 2010; Hartman
and Weber 2009; Nelson and Garst 2005). Additionally, one recent study demonstrates
that mismatch on partisanship or ideology leads participants not only to ignore the
message but to shift their attitudes away from the position advocated by the messenger
(Aaroe 2012). Similar effects have been found in studies of the media. Coe et al. (2008)
and Levendusky (2011) demonstrate that individuals are more receptive to messages
attributed to media sources that are believed to share their partisan orientations.
In Kenya, however, party and ideology are less useful source cues. Ideological
divisions are relatively unimportant to Kenyan politics, and because of high levels of
volatility in the party system, voters generally do not hold durable partisan attachments.
A more useful marker of common interest is ethnicity. As described in Chapter Two,
Kenyans have come to expect that political leaders act as faithful representatives for their
own ethnic communities. It is this belief that inclines voters to exhibit higher levels of
trust for co-ethnics and to be more receptive to information and arguments advanced by
co-ethnic leaders. The expectation that non-co-ethnic politicians have divergent interests,
on the other hand, leads voters to doubt their intentions and to dismiss the information
and arguments they advance.
Survey data provide evidence of a strong association between ethnicity and
beliefs about the trustworthiness of political leaders. An opinion poll conducted shortly

150
before the 2007 election asked voters whether they saw each of the three leading
presidential candidates as trustworthy.54 The data, shown in Figure 6.1, reveal that over
90% of Kikuyus perceived Kibaki to be trustworthy while only 33% of non-co-ethnics
did, a differential of nearly 60%. The figures for the other candidates are similar, with a
differential of 55% for Odinga and 51% for Musyoka. This finding is consistent with
experimental research from Uganda by Habayarimana et al. (2009), who argue that norms
of inter-ethnic trust are learned, not intrinsic to ethnic diversity. In this light, the data in
Figure 6.1 might plausibly be seen as a reflection of Kenya’s long history of ethnic
politics, not a reflection of ethnic diversity per se. Voters in Kenya have learned over
time that co-ethnic leaders tend to be more trustworthy than non-co-ethnics.
Studies from other contexts confirm that in settings where ethnic divisions are
politically salient, voters employ ethnicity as a source cue. Experiments from the
communications field in the U.S. find that messages are more influential when attributed
to co-ethnic sources (Cohen and Peterson 1981; Noel and Allen 1976; Qualls and Moore
1990; Whittler and DiMeo 1991). And work by Kuklinski and Hurley (1994) found that
black American were more likely to internalize a message about racial self reliance when
it was attributed to a black speaker (Jesse Jackson or Clarence Thomas) than to a white
speaker (Ted Kennedy or George Bush). While similar studies have not been conducted
in Kenya or other emerging democracies, these works confirm that ethnicity and race
serve as useful sources cues in settings where ethnic identities have social and political
relevance.
54 Data from a survey (n=2718) conducted by Steadman on October 20-23, 2007.

151
92.3
35.8
96.8
44.2
90
42.7
020
4060
8010
0Pe
rcen
t Bel
ieve
s Ca
ndid
ate
To B
e Tr
ustw
orth
y
Kibaki Odinga Musyoka
Co-ethnics Non-co-ethnics
Figure 6.1 Beliefs about The Trustworthiness of Presidential Candidates
The use of ethnicity as a marker of source credibility by voters in Kenya means
that campaign appeals made by the leading presidential candidates have the greatest
effect on co-ethnic voters and have less effect on voters from rivals’ ethnic groups. The
candidate recruitment dynamics examined in the previous chapter magnify the persuasion
advantage enjoyed by each presidential candidate within his or her co-ethnic community.
Because the presidential candidates typically monopolize the recruitment of lower-level
candidates (those running for parliamentary and local government seats) from their core
ethnic groups, the candidates are generally able to corner the market on trusted elite
messengers from their own groups. Their inability to recruit trusted local elites from

152
their rivals’ ethnic communities, however, means that the presidential aspirants have little
influence on voters in opponents’ groups.
The result is that the groups that have a co-ethnic leader in the race internalize
messages from distinct sets of elites. And because elites from opposing political parties
typically offer divergent arguments on nearly every campaign issue, voters are pulled in
opposing directions. Though these communities may be highly polarized at the start of
the race, the persuasion dynamics described here increase polarization over the course of
the campaign. This argument is consistent with Zaller’s (1992) study of elite influence
on mass attitudes in the U.S., which demonstrates that when elites are divided on major
national issues, similar splits emerge at the popular level, as different segments of the
electorate take cues from political leaders on competing sides of the ideological divide.
The difference is that in Kenya it is ethnicity not ideology that structures electoral
divisions.
The argument developed here applies equally to swing groups that do not have a
co-ethnic leader in the presidential race. For these groups, what matters is the
distribution of trusted elites across the leading parties. When elites from a particular
community are united within one party, voters from the group will receive a unified set of
messages from co-ethnic sources. When elites from an ethnic group are divided across
multiple parties, voters from the group will be exposed to countervailing messages from
credible sources that will offset each other.
In sum, the argument offered here is that the correlation between ethnicity and
trust leads to campaign polarization. When elites from a different communities are
unequally arrayed across competing parties, voters will more readily internalize messages

153
received from the party that better includes representatives from their ethnic community,
leading to polarization with respect to groups that internalize messages offered by the
opposing side.
3. Data and Findings
This section draws on survey data collected during Kenya’s 2007 campaign to
explore the observable implications of the argument. The main period of campaigning
covered the four months between early September and December 27, the date of the
election. The principal claim developed above is that campaigns should produce
polarization across ethnic communities when elites from different groups are arrayed
unequally across the leading parties. I focus on the three ethnic groups that had a co-
ethnic leader in the 2007 presidential race, the Kikuyu, Luo, and Kamba. In line with the
polarization hypothesis, I expect to find a consistent pattern of change in beliefs and
attitudes, with each group adopting positions that reflect the appeals offered by the party
of their respective co-ethnic leader. Specifically, attitudes among Kikuyus (the group
associated with the incumbent president) ought to move in the opposite direction from
Luos and Kambas, the two groups associated with the leading opposition figures. I do
not examine other groups because I lack sufficient data on the distribution of trusted
communal leaders across the main parties to be able to generate predictions on how
beliefs and attitudes should be affected by the campaigns.
The data used in this chapter come from a series of seven surveys conducted by a
local polling company during the six months prior to the election. The data, however,
were collected for cross-sectional analysis, not the investigation of over-time trends. As

154
a result, there are several inherent limitations. First and foremost, because the data come
from repeated cross-sections (rather than a panel survey), I can only examine aggregate
trends at the group level and cannot explore individual-level factors that mediate
campaign effects. Second, the timing of the surveys is in some cases not ideal. The
interval between survey rounds varies for the tests conducted below according to when
questions where first included in a survey round and then repeated in a subsequent round.
This means that the interval between data collection points is not uniform and in some
cases does not correspond neatly to the start and end dates of the campaign. Third,
questions relating to some key aspects of the campaign were not included. For example,
the data do not provide sufficient measures of inter-group sentiments to examine whether
the campaigns heightened distrust, hostility, or antipathy across ethnic communities.
Despite these limitations, the data do provide useful measures of several attitudes and
beliefs that correspond to key aspects of the parties’ campaign messages. And although
the data are noisy, the results show consistent evidence of polarization, in line with the
argument outlined above. Moreover, the use of multiple indicators provides assurance
that the polarization hypothesis applies across attitudes and beliefs.
In the tests presented below I treat changes in the mean values of each variable as
evidence of campaign effects. I use t-tests to test for significant changes across survey
rounds, and I report p-values on all tests.
3.1 Beliefs about Prospective Performance
I begin with beliefs about the prospective performance of the three leading
candidates on two central issues, economic management and education. The content

155
analysis of campaign appeals in Chapter Four showed that about half of the parties’
messages during the 2007 campaigns focused on government performance. The
incumbent president, Kibaki, and his party, PNU, sought to make the election to a large
extent a referendum on his accomplishments, while the opposition sought to cast doubt
on Kibaki’s performance. The economy and education reform featured prominently in
the parties’ competing claims about government performance. As noted, Kibaki and
PNU sought to convince voters that the president’s economic reforms had produced
sustained economic growth, while the opposition parties countered that persistent
inequality meant that only the wealthy elite benefited from the growth of the economy
while most Kenyans remained mired in poverty. On education, Kibaki and PNU argued
that the introduction of free primary education expanded access, while the opposition
parties countered that over-crowding in classrooms meant that the government had failed
to address concerns about education quality.
To test whether these appeals affected voters’ beliefs, I draw on data from two
surveys that span the campaign period. The first (n=2,020) was conducted on September
21-25, and the second (n=6,111) was conducted on December 11-16, roughly two weeks
before the election on December 27. Both surveys include a question that asked
respondents about their satisfaction with the Kibaki government’s performance across
multiple sectors. The question then asked respondents whether they believed that future
performance in each sector would be better, the same, or worse if the current government
was not reelected.55
55 The question was, “Please tell me how satisfied you are with the way the government is dealing with each of the issues I read out. Are you very satisfied, somewhat satisfied, somewhat dissatisfied, or very

156
The data on economic reform, shown in Figure 6.2, reveals considerable
polarization across ethnic communities at the start of the race. Relatively few (25.1%)
voters from Kibaki’s own Kikuyu community believed that economic reform would
improve if Kibaki were not reelected, while most Luos (81.9%) and Kambas (60.1%) did.
Consistent with the polarization hypothesis, the trend data show that beliefs across these
groups moved in opposite directions over the course of the campaign. The share of
Kikuyus who thought economic management would improve if the president was not
reelected declined by 6.8% (p<.01), while the share of Luos and Kambas who held this
belief increased by 7.9% (p<.01) and 4.7% (p=.22) respectively.
The same pattern holds for education. At the start of the race, few Kikuyus
(27.3%) believed that education policy would improve if the president were not reelected,
and this share declined by 8.5% (p<.01) over the course of the campaign. By contrast,
most Luos (82.1%) believed that education policy would improve if the president were
not reelected, and this share increased by 6.9% (p<.01) during the campaign. Likewise,
for Kambas, a large portion of the group (49.4%) believed that education would improve
if Kibaki were defeated, and this share increased by 16.5% (p<.01) during the campaign.
These patterns conform with the expectation that the parties’ campaign efforts have
disparate effects across ethnic communities, with co-ethnic voters being more receptive
to each party’s messages.
dissatisfied with the way the government has dealt with the issue of [insert issue]? And if the current government is not re-elected in the forthcoming general elections do you think [insert issue] will change for the better, will not change, or will change for the worse?” The surveys asked about the following issues: corruption, economic reform, crime and insecurity, education, health management, unemployment, the agricultural sector, public transport, land reform and ownership, prisons reform, the constitutional review process, landlessness, housing, slum and squatter settlements, terrorism.

157
Figure 6.2 Beliefs about Economic and Education Reform
3.2 Support for Devolution
Next, I examine attitudes toward one of the central policy issues in the election:
devolution (majimbo in Kiswahili). This issue provides an ideal test of the polarization
hypothesis. As shown in Chapter Five, devolution was among the central themes in the
2007 campaigns. And, unlike many other policy issues, the parties staked out contrasting
positions on this issue. The opposition parties, ODM and ODM-K, advocated the
adoption of a devolved form of government, promising that devolution would end ethnic
imbalances in the distribution of resources and foster more rapid development. The
incumbent party, PNU, opposed devolution, arguing that its adoption would lead to the
expulsion of citizens living in areas primarily inhabited by other ethnic groups.
To examine trends in public opinion about devolution, I draw on data collected
from surveys conducted on October 20-23 (n=2,718) and December 1-3 (n=2,694), about
25.1
18.3
81.9
89.8
60.164.8
Kikuyus
Kambas
Luos0
2040
6080
100
Perc
ent
September 21-25 December 11-16
27.3
18.9
82.1
89
49.4
65.9
Kikuyus
Kambas
Luos
020
4060
8010
0Pe
rcen
t
September 21-25 December 11-16
Economic Reform Education

158
six weeks apart. Both surveys asked voters whether they supported the adoption of a
devolved system of government.56
The extent of polarization across communities in the first poll is notable. Figure
6.3 shows that while only about 10% of Kikuyus supported devolution in the October
poll, 82% of Luos and 28% of Kambas expressed support for the policy. This
polarization is not hard to understand: most Kikuyus associated devolution with the
creation of ethnically-homogenous regions, fearing that Kikuyus living outside the
Central Province would be subject to forced eviction. 57 Most Luos and many Kambas,
by contrast, associated devolution with increased equality in access to state-controlled
resources, expecting that devolution would protect their material interests. More
important for the current analysis, the trend data shows that the share of Kikuyus who
supported devolution declined by 3.9% (p<.05) between the two survey waves, while the
share of Luos supporting the policy increased by 12.6% (p<.01) and Kambas by 19.4%
(p<.01). The relatively short interval between the two surveys means that the results
shown here in all likelihood underestimate the size of the effects across the entire
campaign period. These trends are again consistent with the expectation that groups
move in opposing directions over the course of the campaign, as they internalize
messages from different sets of elites.
56 The surveys used slightly different questions. The October survey asked, “Do you think Kenya should adopt a majimbo system?” The December survey asked, “Do you support a majimbo form of government.” 57 Data from an October 20-23 survey provide insight into the reasons for divergent attitudes toward devolution. The survey included a question that asked, “What does the term ‘majimbo’ mean to you?” The most common answers among Kikuyu respondents were “tribal alienation” (42%) and “dividing the country into regional units” (14%). Among Luos, the most common answers were: “fair distribution of resources in regions” (37%), “devolving power to grass root level” (18%), and “each region manages its own resources” (13%). Kamba respondents held a more even mix of positive and negative expectations, with equal numbers choosing “tribal alienation” (18%) and “fair distribution of resources” (17%).

159
Figure 6.3 Support for Devolution
3.3 Beliefs about The President’s Favoritism Record
Next, I turn to beliefs about ethnic favoritism. Chapter Five showed that the
opposition sought to convince voters that Kibaki had favored co-ethnic Kikuyus during
the course of his first term and would continue to do so if reelected. Kibaki and PNU, on
the other hand, sought to project an inclusive image by pointing out the president’s record
of equitable treatment of Kenya’s diverse ethnic communities, while characterizing
Odinga as a dangerous and violent person whose election would endanger ethnic peace.
To examine whether these messages had any effect, I draw on retrospective
evaluations of Kibaki’s favoritism record from surveys conducted on June 28-July 7
(n=2,025) and October 20-23 (n=2,718). Both surveys included a two-part question that
asked voters first whether they thought the Kibaki government served the interests of all
ethnic groups or favored certain groups. A follow-up question asked those who said the
9.85.8
82.1
94.7
27.8
47.2
Kikuyus
Kambas
Luos
020
4060
8010
0Pe
rcen
t
October 20-23 December 1-3

160
government favored certain groups, which groups they believed were favored.58 From
these questions, I construct a measure of the share of voters who believe Kibaki’s
government favored the president’s own ethnic group. The timing of the surveys is less
than ideal in that the first was conducted roughly two months before the main period of
campaigning began and the second was conducted more than two months before the
conclusion of the campaigns. Nonetheless, the interval between the surveys does include
a period of heavy campaigning in September and October. The results are shown in
Figure 6.4.
Figure 6.4 Change in % Believing Government Favors Kikuyus
As with the previous measures, the data reveal considerable polarization prior to
the start of the campaign. In the July poll only about 9% of Kikuyus thought that the
Kibaki administration favored Kikuyus, while 74% of Luos and 39% of Kambas held this
58 The question was, “In your view, does Kenya's government serve the interests of all ethnic groups, or does the government favour certain ethnic groups over others? Which ethnic groups does the government favour?”
9.2 7.9
73.5
87
38.6
68.7
Kikuyus
Kambas
Luos
020
4060
8010
0Pe
rcen
t
June 28 - July 7 October 20-23

161
view. The trend data again show divergence across the three groups. Among Kikuyus,
the share that believed Kibaki favored his own group declined slightly (1.3%) between
the two polls (not statistically significant). By contrast, among Luos the share increased
by 13.6% (p<.01) and among Kambas by 30.2% (p<.01).
3.4 Anxiety about Out-Groups Gaining Power
Next, I turn to a question that examines voters’ anxiety about out-groups coming
to power. Chapter Four noted that in practice campaign messages about political leaders
are often intertwined with messages about their ethnic communities. In the attempt to
discredit opponents, parties demonize opponents and their ethnic communities. I argued
that these messages affect not only the beliefs voters hold about the presidential
candidates but also their attitudes toward the candidates’ ethnic communities. To test this
proposition, I draw on a question asked, “Would you be worried if any particular tribe is
in power? If yes, which tribe(s).” The question was included first on a survey conducted
on October 20-23 and then repeated again on a poll conducted on December 11-16, about
eight weeks later. This message taps into only one aspect of voters’ attitudes towards
other communities. While it would be preferable to examine a wider range of questions
that capture changes in antipathies and resentments between ethnic groups, this question
provides a first-cut measure of how attitudes between ethnic communities changed over
the course of the campaign.
Figures 6.5 shows the share of respondents that expressed concern about Kikuyus
and Luos being in power (few respondents expressed concern about other ethnic
communities). The data show that for Kikuyus and Luos – the groups associated with the

162
two leading presidential candidates – the share that expressed concern about the other
group being in power increased over the course of the campaign. Among Kikuyus, the
share worried about Luos being in power increased by 6.4% (p<.05), from 28% in
October to 34.6% in December. Among Luos, the share worried about Kikuyus being in
power likewise increased by 6% (p<.05), from 26.3% in October to 32.3% in December.
These data in all likelihood underestimate the magnitude of change during the campaign
since the first poll was taken well into the campaign period and the latter poll was
conducted two weeks before the actual vote.
.3 .5
28.2
34.6
26.3
32.3
.3 .3
23.8
10.8
37.135.6
010
2030
4050
Oct Dec Oct Dec Oct Dec
1. Kikuyus 2. Luos 3. Kambas
Worried about Kikuyus Being in PowerWorried about Luos Being in Power
Perc
ent
Figure 6.5 Anxiety about Out-Groups Being in Power

163
While The results for Kikuyus and Luos are consistent with the polarization
hypothesis, the findings for Kambas are not. Given the efforts by ODM-K to demonize
both Kibaki and Odinga, the polarization hypothesis would predict that the share of
Kambas expressing concerns about both Kikuyus and Luos being in power should
increase over the campaign period. The data, however, show that the share of Kambas
worried about Luos being in power declined by 1.5%, from 37.1% in October to 35.6% in
December. Though not statistically significant, the finding is at odds with expectations.
The results also show that the share expressing concern about Kikuyus being in power
declined by a substantial margin (13%, p<.01) between the two polls, again at odds with
the arguments outlined in this chapter. What accounts for these contrary findings?
One possible explanation is that ODM-K did not control communication flows in its
home ethnic area to the same extent as the leading parties did in their respective
strongholds. Because Musyoka entered the 2007 race with less dominant support among
co-ethnics, his party was less able to monopolize the best local talent in the Kamba core
area. As noted in the previous chapter, PNU succeeded in recruiting high-quality
parliamentary candidates in over a quarter of Kamba-majority constituencies, and data on
the location of presidential rallies from Chapter Three showed that Kibaki devoted a
considerable share of his campaign effort to the Kamba core area, holding 10% of all
rallies in the constituencies where Kambas make up 75% or more of the population.
Moreover, ODM succeeded in attracting one of the most senior Kamba leaders (Charity
Ngilu) as a key member of its top leadership council. ODM-K was therefore less fully
dominant with regard to information flows in the Kamba area, and may have been less
able to move co-ethnic voters in the desired direction on this indicators.
164
3.5. Voting Intentions
Finally, I examine voting intentions using data from polls conducted in mid-
September (Sept. 21 – 25) and mid-December (Dec. 11-16). The data, shown in Figure
6.6, demonstrates that voting intentions at the start of the race were as polarized as the
attitudinal measures examined above. Each candidate entered the race already having
secured the support of a large majority of co-ethnic voters. The trend data shows that
both of the front-runners – Kibaki and Odinga – registered small increases in co-ethnic
support: the share of Kikuyus expressing an intention to support Kibaki rose by 4.2%
(p<.01) and the share of Luos intending to support Odinga rose by 2.4% (p=.11). The
third-placed candidate, Musyoka, gained 18% (p<.01) among co-ethnic Kambas,
increasing his co-ethnic support from 60% to 78% during the 12 weeks between the
survey rounds.
Without individual-level panel data, it is not possible to attribute these shifts in
voting intentions to specific changes in attitudes or beliefs. It is plausible, however, that
these trends may reflect the group-level changes in attitudes described above. Over the
course of the campaign, Kikuyu voters as a group became increasingly convinced that
Kibaki would address key priorities like the economy and education more effectively
than his rivals. Kikuyus became increasingly supportive of Kibaki’s position on
devolution, a stance that contrasted with the positions adopted by rival candidates. Few
expressed concerns about Kibaki’s favoritism record, but an increasing share expressed
concerns about Luos being in power. These changes may well have led the few Kikuyu
voters who expressed support for rival leaders at the start of the race to rally around
Kibaki. By contrast, Luos and Kambas became increasingly convinced that the

165
opposition candidates were better suited to manage the economy and education reform.
They became increasingly supportive of devolution. They became more concerned that
Kibaki had favored his own group in the past, and a larger share of Luos expressed
concerns about Kikuyus being in power. For all of these reasons, opposition leaders may
have become increasingly appealing to members of these groups who initially expressed
an intention to support a non-co-ethnic candidate at the start of the election.
89.994.1 94.2 96.6
59.5
77.5
020
4060
8010
0
Kikuyu Luo Kamba
Sept. 21-25 Dec. 11-16
Figure 6.6 Voting Intentions, September - December 2007
4. Conclusion
This chapter argues that campaigns in Kenya have polarizing effects across ethnic
communities. Polarization occurs because voters tend to view co-ethnic leaders as more

166
trustworthy than non-co-ethnics and therefore more readily internalize arguments made
by politicians from their own ethnic communities. When political leaders are arrayed
unevenly across the leading parties, communities on opposite sides of the political divide
learn from distinct sets of elites, each side adopting different messages.
Data collected during Kenya’s 2007 campaign support these arguments. While
the data has many limitations, a consistent pattern of polarization emerges across multiple
measures of beliefs, attitudes, and intentions. In most cases the results show that the
magnitude of campaign effects to be relatively small, a reflection of the fact that attitudes
and beliefs were already highly polarized at the start of the race. While one might
interpret this to mean that campaigns in Kenya have only modest effects on voters, the
fact that the campaigns produced any movement at all is quite remarkable given that the
campaign period in Kenya is relatively short and that voters often enter the campaigns
with strong prior beliefs. More important than the magnitude of the observed changes in
attitudes and beliefs, though, is the direction. Rather than tempering the divergent views
held by members of the ethnic groups associated with the leading parties in the race,
campaigns push groups further apart.

167
Chapter 7
Conclusion 1. Introduction
This dissertation examines the polarizing effects of campaign competition in
multiethnic democracies. It shows that the campaign messages used by office-seeking
elites exacerbate the division of the electorate into opposing ethnic camps, leading to
greater divergence between groups on competing sides of the political divide. I trace
polarization to a combination of candidates’ negative messages and the tendency among
voters to more readily accept claims made by co-ethnic leaders. In this chapter, I briefly
restate the argument and main findings and then conclude by examining the dissertation’s
implications for the broader study of ethnic politics, campaigns, and violence in emerging
democracies.
2. The Argument and Findings
This dissertation was motivated by a desire to understand whether and how
democratic competition in ethnically-divided societies aggravates inter-group tensions.
Prominent works in the ethnic politics literature suggest that elections create incentives
for leaders to polarize and divide the electorate for electoral purposes, making democracy
and ethnicity an unstable mix. The introduction of multiparty competition in many
divided societies over the last two decades has added urgency to efforts to understand the

168
possible connections between democracy, polarization, and violence. However, efforts to
explain how and why elites contribute to ethnic polarization during campaigns have been
limited by the absence of empirical data from multiple countries or from individual cases.
While the existing literature offers no shortage of theoretical propositions related to the
effects of campaigns in divided societies, the core assumptions in much of the literature
remain untested. The goal of this project, therefore, has been to unpack the linkages
between campaigns and polarization through the detailed examination of a single country,
Kenya, where multiparty competition has come to be associated with inter-communal
conflict over the last two decades. My aim is to develop an argument about how and why
campaigns polarize ethnic communities that rests on firm microfoundations. To build the
argument, I collected a variety of micro-level data, employing methods and analytic
approaches pioneered in the study of campaigns in mature democracies, particularly the
U.S.
My argument begins with the premise that to understand campaign polarization,
we must first make sense of parties’ campaign goals. To this end, I began my study by
inquiring into campaign targeting. While much of the existing literature assumes that
parties focus their electoral efforts on mobilizing core ethnic supporters, I show that in
Kenya the pursuit of non-co-ethnic swing voters is at the heart of electoral competition.
Presidential races are won and lost based on which candidate is better able to attract
voters in swing groups that do not have a co-ethnic in the race. This insight sets the stage
for the remainder of the dissertation, which shows how targeting decisions affect the
types of messages parties employ and how these messages affect voters.

169
To explain the centrality of swing voters in Kenyan elections, I show that the
preference for co-ethnic politicians leads to predictable patterns of electoral support at the
start of campaigns. The leading presidential candidates can typically count on strong
support from co-ethnics. Yet, because ethnic groups are relatively small in Kenya,
parties must garner support from multiple communities to be competitive in presidential
contests. The result is that when the presidential candidates (and their parties) seek to
gain votes, they target communities that do not have a co-ethnic in the race. Consistent
with these claims, Chapter Three draws on data from the 2007 election to show that the
leading presidential candidates devoted the bulk of their time on the campaign trail to the
pursuit of swing voters. It further demonstrates that the candidates converged on the
same sets of swing communities, rather than pursuing support from distinct, non-
overlapping ethnic coalitions. Parties, however, do not focus exclusively on swing
voters. Campaigns are designed both to increase vote share among possible converts and
to increase turnout among existing supporters. In Chapter Three, I argue that parties
divide campaign duties between different actors, delegating the job of mobilizing the
faithful to lower-level actors and sending top party leaders off to work on swing voters.
Data from the 2007 race attest to the complementary role played by different actors
within parties.
Building on these insights, I turn to campaign messages. I argue that the twin
goals of appealing to non-co-ethnic swing voters and mobilizing co-ethnic core voters
drive choices about the types of appeals parties employ. The need to project an inclusive
image leads parties to avoid making patronage appeals to particular ethnic communities.
Parties understand that their electoral chances depend on communicating their inclusive

170
credentials, and for this reason, parties design campaign appeals that emphasize their
intention to treat all groups fairly. At the same time, parties seek to impugn their
opponents as ethnic chauvinists who care only for their core ethnic supporters, using
messages designed to ensure that opponents will have little appeal with swing voters.
They serve also the goal of mobilizing core co-ethnic supporters by increasing anxiety
about opponents’ intentions. Chapter Four draws on content analysis of over 90 hours of
campaign speeches from the 2007 election to support these claims.
The final piece of the argument explains why the many claims and counter-claims
offered by the parties lead to polarization over the course of the campaign. I draw on
studies familiar to students of political communication in mature democracies, a central
finding of which is that voters learn from trusted sources and rely on source cues to make
inferences about the credibility of individual speakers. I argue that in Kenya, ethnicity
serves as a useful source cue to voters, signaling whether political leaders can be trusted.
As a result of this association between ethnicity and trust, members of different ethnic
communities look to different political elites, each side internalizing different arguments
and views. This tendency is enhanced by the dynamics related to candidate recruitment
described in Chapter Five, which often lead political elites from groups that have a co-
ethnic leader in the presidential race to coordinate within the same party. Chapter Six
draws on a variety of data to show that during Kenya’s 2007 election, groups with a co-
ethnic leader in the race adopted increasingly polarized attitudes and beliefs.

171
3. Implications
This dissertation contributes to a number of related literatures. First, it contributes
to the literature on ethnicity and conflict by demonstrating empirically that elite campaign
rhetoric can have polarizing effects across ethnic communities. While this claim has
been advanced in previous studies, scholars have to date relied primarily on anecdotal
evidence (Horowitz 1985; Snyder 2000; Chua 2003). This project thus advances current
debates by offering micro-level data that track the changes in attitudes and beliefs at the
group level, and providing more precise estimates of the magnitude of campaign effects.
The findings confirm that electoral competition can have divisive effects in emerging
multiethnic democracies and call for greater attention to efforts to mitigate these effects.
Second, this study offers new insights into why campaigns polarize ethnic
communities. It shows that polarization occurs not because parties seek support from
distinct, non-overlapping ethnic coalitions and use particularistic appeals to mobilize
their respective support bases. Rather, the study shows that polarization occurs even
when parties converge in their pursuit of swing voters. This finding has important
implications for how scholars think about ethnically-oriented political systems. Scholars
have generally assumed that campaigns work differently in multiethnic democracies. In
settings like Kenya where ethnicity – not ideology – is central, moderation is thought to
give way to extremism, as parties seeks support from distinct, non-overlapping ethnic
coalitions (Rabushka and Shepsle 1972; Horowitz 1985). In ideologically-oriented
political systems, by contrast, the pursuit of swing voters is thought to create incentives
for parties to moderate their electoral appeals. This dissertation shows, however, that the

172
pursuit of the swing is no less central to electoral competition multiethnic democracies
like Kenya.
An additional contribution to the ethnic politics literature relates to campaign
messages. Existing scholarship – particularly work on Africa – generally assumes that
parties rely on targeted distributional promises to mobilize voters. This point is made in
early studies (Rabushka and Shepsle 1971 and Horowitz 1985) as well as more recent
works (Posner 2005; Wantchekon 2003). This dissertation shows, however, that when
parties compete for the support of swing group they prefer inclusive appeals to targeted
distributional promises. Paradoxically, the Kenyan case shows that where ethnicity is
highly salient, parties have few incentives to use particularistic ethnic appeals to mobilize
co-ethnic support.
This dissertation also contributes to studies of ethnic politics by distinguishing
between ethnic polarization that occurs prior to the campaign and polarization that occurs
because of the campaign. Typically, the existing literature fails to differentiate these
distinct phenomena. Political elites are blamed for dividing the electorate into competing
ethnic camps and exacerbating ethnic tensions. Yet, as I show, there is value in
examining these dynamics independently. In Kenya the preference for co-ethnic
politicians leads voters to line up behind co-ethnic presidential candidates when the field
of contenders becomes clear. Polarization, thus, occurs before the candidates hit the
campaign trail. Campaigns exacerbate polarization by pushing communities further
apart. Maintaining this distinction is important for efforts to make sense of how and why
elections are divisive in multiethnic societies like Kenya. Electoral tensions may result

173
both from the division of electorate into competing ethnic camps at the start of the race
and from the strategies and tactics parties use to reinforce these divisions.
This dissertation also contributes to the more general literature on campaign
strategy. Models of campaign targeting are divided between those that emphasize the
benefits of mobilizing existing supporters (e.g., Cox and McCubbins 1986) and those that
point to the benefits of pursuing swing voters (e.g., Dixit and Londregan 1996). This
study shows that in emerging democracies like Kenya, parties have incentives to pursue
both strategies. The project, moreover, extends existing scholarship by showing that
there are gains to be had from dividing labor within parties.
Finally, this dissertation contributes to debates about how best to mitigate the
divisive potential of electoral competition in multiethnic democracies. Numerous
scholars recommend the adoption of preference-voting institutions that create incentives
for parties to seek support outside their core ethnic support bases (Horowitz 1990, 1991,
1997, 2004; Sisk 1995; Reilly 2001, 2006). The assumption that underlies this
prescription is that parties seeking support from multiple groups rely on moderate,
inclusive campaign appeals that temper ethnic tensions while parties that mobilize only
their core ethnic supporters use extremist appeals that exacerbate ethnic tensions. The
Kenyan case, however, demonstrates that campaigns can be polarizing even when parties
focus their efforts on the pursuit of non-co-ethnic swing voters. This findings calls for
renewed attention to alternative strategies for ensuring that electoral competition does not
lead to instability in divided societies.

174
References
Aaroe, Lene. 2012. “When Citizens Go Against Elite Directions: Partisan Cues and
Contrast Effects on Citizens’ Attitudes.” Party Politics 18 (2): 215-233. Abramson, Paul R., John H. Aldrich, Phil Paolino, and David W. Rohde. 1992.
“‘Sophisticated’ Voting in the 1988 Presidential Primaries.” American Political Science Review 86 (1): 55–69.
Althaus, Scott, Peter Nardulli, and Daron Shaw. 2002. “Candidate Appearances in
Presidential Elections, 1972-2000.” Political Communication 19: 49-72. Alvarez, R. Michael, Frederick Boehmke, and Jonathan Nagler. 2006. “Strategic Voting
in British Elections.” Electoral Studies 25 (1): 1-19. Anderson, David. 2003. “Briefing: Kenya’s Elections 2002 – The Dawning of New Era?”
African Affairs 102: 331-342. Anderson, David and Emma Lochery. 2008. “Violence and Exodus in Kenya’s Rift
Valley, 2008: Predictable and Preventable?” Journal of East African Studies 2 (2): 328-343.
Baldwin, Kate. 2009. “Big Men and Ballots: Experimental Evidence on the Political
Power of Patrons.” Typescript. Barkan, Joel D. 2008. “Will the Kenyan Settlement Hold?” Current History (April 2008):
147-153. Barkan, Joel D. 1993. “Kenya: Lessons from a Flawed Election.” Journal of Democracy
4: 85-99. Barkan, Joel D. 1987. “The Electoral Process and Peasant-State Relation in Kenya.” In
Hayward, Fred M., ed., Elections in Independent Africa. Boulder, CO: Westview Press.
Barkan, Joel D. 1984. "Legislators, Elections and Political Linkage," in Barkan,
ed., Politics and Public Policy in Kenya and Tanzania. New York: Praeger. Barkan, Joel D. and Michael Chege. 1989. “Decentralising the State: District Focus and
the Politics of Reallocation in Kenya.” Journal of Modern African Studies 27 (3): 431-453.
175
Barkan, Joel D. and Frank Holmquist. 1989. “Peasant-State Relations and the Social Base of Self-Help in Kenya.” World Politics 41 (3): 359-380.
Barkan, Joel D. and Njuguna Ng’ethe. 1998. “Kenya Tries Again.” Journal of
Democracy 9: 32-48. Barkan, Joel D. and John J. Okumu. 1978. “‘Semi-competitive’ Elections, Clientelism,
and Political Recruitment in a No-party State: The Kenyan Experience.” In G. Hermt, R. Rose and A. Rouquie, eds., Elections without Choice. London: Macmillan Press.
Bartels, Larry. 1998. “Where the Ducks Are: Voting Power in a Party System.” In John
Geer, ed., Politicians and Party Politics. Baltimore: Johns Hopkins University Press.
Bartels, Larry. 1985. “Resource Allocation in a Presidential Campaign.” Journal of
Politics 47 (3): 928-936. Bates, Robert. 1989. Beyond the Miracle of the Market: The Political Economy of
Agrarian Development in Kenya. Cambridge: Cambridge University Press. Battle, Martin and Jennifer C. Seely. 2010. “It’s All Relative: Modeling Candidate
Support in Benin.” Nationalism and Ethnic Politics 16: 42-66. Baum, Matthew A. and Tim Groeling. 2009. “Shot by the Messenger: Partisan Cues and
Public Opinion Regarding National Security and War.” Political Behavior 31: 157-186.
Beckett, Paul A. 1987. “Elections and Democracy in Nigeria.” In Hayward, ed., Elections
in Independence Africa. Boulder, CO: Westview Press. Bennett, George. 1963. Kenya: A Political History: The Colonial Period. London:
Oxford University Press. Bennett, George and Carl Rosberg. 1961. The Kenyatta Election: Kenya 1960-61.
London: Oxford University Press. Bienen, Henry. 1974. Kenya: The Politics of Participation and Control. Princeton N.J.:
Princeton University Press. Boas, Taylor C. 2010. “Varieties of Electioneering: Success Contagion and Presidential
Campaigns in Latin America.” World Politics 62 (4): 636-675.

176
Bogaards, Matthijs. 2003. “Electoral Choices for Divided Societies: Multi-Ethnic Parties and Constituency Pooling in Africa.” Commonwealth and Comparative Politics 41 (3): 59-80.
Boone, Catherine. 2011. “Politically Allocated Land Rights and the Geography of
Electoral Violence: The Case of Kenya in the 1990s.” Comparative Political Studies 44 (10): 1311-1342.
Brader, Ted. 2006. Campaigning for Hearts and Minds: How Emotional Appeals in
Political Ads Work. Chicago: University of Chicago Press. Brader, Ted. 2005. “Striking a Responsive Chord: How Political Ads Motivate and
Persuade Voters by Appealing to Emotions.” American Journal of Political Science 49 (2) : 388-405.
Brams, Steven J. and Morton D. Davis. 1974. “The 3/2’s Rule in Presidential
Campaigning.” American Journal of Political Science 68 (1): 113-134. Branch, Daniel, Nic Cheeseman, and Leigh Gardner, eds. 2010. Our Turn to Eat: Politics
of Kenay Since 1950. Berlin: Lit Verlag. Bratton, Michael and Mwangi S. Kimenyi. 2009. “Voting in Kenya: Putting Ethnicity in
Perspective.” Journal of Eastern African Studies 2 (2): 272-289. Bratton, Michael and Nicolas van de Walle. 1997. Democratic Experiments in Africa:
Regime Transitions in Comparative Perspective. New York: Cambridge University Press.
Burgess, Robin, Remi Jedwab, Edward Miguel, and Ameet Morjaria. 2009. “Our Turn To
Eat: The Political Economy of Roads in Kenya.” Typescript. Callaghan, Karen and Frauke Schnell. 2009. “Who Says What to Whom: Why
Messengers and Citizen Beliefs Matter in Social Policy Framing.” Social Science Journal 46: 12-28.
Carson, Jamie L., Erik J. Engstrom and Jason M. Roberts. 2007. “Candidate Quality, the
Personal Vote, and the Incumbency Advantage in Congress.” American Political Science Review 101 (2): 289-301.
Cederman, Lars-Erik, Nils B. Weidmann, and Kristian Skrede Gleditsch. 2011.
“Horizontal Inequalities and Ethnonational Civil War: A Global Comparison. American Political Science Review 105 (3): 478-495.
Chabal, Patrick and J.P. Daloz. 1999. Africa Works: Disorder as Political Instrument.
Oxford: James Currey.

177
Chandra, Kanchan. 2005 “Ethnic Parties and Democratic Stability.” Perspectives on
Politics 3 (2): 235-252. Chandra, Kanchan. 2004. Why Ethnic Parties Succeed: Patronage and Ethnic
Headcounts in India. Cambridge: Cambridge University Press. Chandra, Kanchan, ed. 2001. “Cumulative Findings in the Study of Ethnic Politics.”
APSA-CP Newsletter 12 (1): 7–25. Chege, Michael. 2008. “Kenya: Back From the Brink?” Journal of Democracy 19 (4):
125-139. Chua, Amy. 2003. World on Fire: How Exporting Free Market Democracy Breeds
Ethnic Hatred and Global Instability. New York: Doubleday. Coe, Kevin, David Tewksbury, Bradley J. Bond, Kristin L. Drogos, Robert W. Porter,
Ashley Yahn, and Yuanyuan Zhang. 2008. “Hostile News: Partisan Use and Perceptions of Cable News Programming.” Journal of Communication 58: 201-219.
Cohen, David L. and John L. Peterson. 1981. “Bias in the Courtroom: Race and Sex
Effects of Attorneys on Juror Verdicts.” Social Behavior and Personality 9 (1): 81-99.
Commission of Inquiry into Post-Election Violence (CIPEV). 2008. Final Report. Colantoni, Claude S., Terrence J. Levesque, and Peter C. Ordeshook. 1975. “Campaign
Resource Allocation under the Electoral College.” American Political Science Review 69 (1): 141-154.
Cowen, Michael and Karuti Kanyinga. 2002. “The 1997 Elections in Kenya: The Politics
of Communality and Locality.” In Michael Cowen and Lisa Laakso, eds., Multi-Party Elections in Africa. Oxford: James Currey.
Cox, Gary W. 1997. Making Votes Count: Strategic Coordination in the World’s
Electoral Systems. New York: Cambridge University Press. Cox, Gary W., and Mathew D. McCubbins. 1986. “Electoral Politics as a Redistributive
Game.” Journal of Politics 48: 370-389. Dahl, Robert. 1971. Polyarchy: Participation and Opposition. New Haven: Yale
University Press.

178
Davis, Gavin. 2004. “Proportional Representation and Racial Campaigning in South Africa.” Nationalism and Ethnic Politics 10: 297-324.
Dercon, Stefan and Roxana Gutiérrez-Romero. 2010. “Triggers and Characteristics of the
2007 Kenyan Electoral Violence.” Typescript. Diaz-Cayeros, Alberto, Federico Estevez, and Beatriz Magaloni. 2007. “Strategies of
Vote Buying: Social Transfers, Democracy and Welfare in Mexico.” Typescript. Dickson, Eric and Kenneth Scheve. 2004. “Social Identity, Political Speech, and
Electoral Competition.” Journal of Theoretical Politics 18 (1):5-39. Dixit, Avinash and John Londregan. 1996. “The Determinants of Success of Special
Interests in Redistributive Politics.” Journal of Politics 58 (4): 1132-1155. Dow, Jay, and James W. Endersby. 2004. “Multinomial Probit and Multinomial Logit: A
Comparison of Choice Models for Voting Research.” Electoral Studies 23:107–122.
Druckman, James N. 2001. “Ont the Limits of Framing Effects: Who Can Frame?”
Journal of Politics 63 (4): 1041-1066. Druckman, James N. and Michael Parkin. 2005. “The Impact of Media Bias: How
Editorial Slant Affects Voters.” Journal of Politics 67 (4): 1030-1049. Downs, Anthony (1957). An Economic Theory of Democracy. New York: Harper. Ekeh, Peter P. 1975. “Colonialism and the Two Publics in Africa: A Theoretical
Statement.” Comparative Studies in Society and History 17 (1): 91–112. Fearon, James. 2003. “Ethnic and Cultural Diversity by Country.” Journal of Economic
Growth 8(2): 195-222. Fearon. James. 1999. “Why Ethnic Politics and ‘Pork’ Tend to Go Together.” Typescript. Figueiredo, Rui de and Barry R. Weingast. 1999. "The Rationality of Fear: Political
Opportunism and Ethnic Conflict." In Barbara Walter and Jack Snyder, eds., Civil Wars, Insecurity and Intervention. New York: Columbia University Press.
Finkel, Steven E. 1993. “Reexamining the ‘Minimal Effects’ Model in Recent
Presidential Campaigns.” Journal of Politics 55(1): 1-21. Finkel, Steven, Jeremy Horowitz and Reynaldo T. Rojo-Mendoza. 2012. “Civic
Education and Democratic Backsliding in the Wake of Kenya’s Post-2007 Election Violence.” Journal of Politics 74 (1): 52-65.

179
Ferree, Karen. 2011. Framing the Race in South Africa: The Political Origins of Racial
Census Elections. Cambridge: Cambridge University Press. Ferree, Karen E. 2006. "Explaining South Africa's Racial Census." Journal of Politics 68
(4): 803-815. Ferree, Karen and Jeremy Horowitz. 2010. “Ties That Bind? The Rise and Decline of
Ethno-Regional Partisanship in Malawi, 1994-2009.” Democratization 17(3): 534-563.
Franck, Raphael and Ilia Rainer. 2009. “Does the Leader’s Ethnicity Matter? Ethnic
Favoritism, Education and Health in Sub-Saharan Africa.” Typescript. Fridy, Kevin S. 2007. “The Elephant, Umbrella, and Quarrelling Cocks: Disaggregating
Partisanship in Ghana's Fourth Republic.” African Affairs 106: 281-305. Gagnon, V.P. 2004. The Myth of Ethnic War: Serbia and Croatia in the 1990s. Ithaca:
Cornell University Press. Gerber, Alan S. and Gregory Huber. 2010. “Partisanship, Political Control, and
Economic Assessments.” American Journal of Political Science 4(1): 153-173. Gerber, Alan S., and Donald P. Green. 2005. “Correction to Gerber and Green (2000),
Replication of Disputed Findings, and Reply to Imai (2004).” American Political Science Review 99(2): 301-313.
Gerber, Alan S., and Donald P. Green. 2000. “The Effects of Personal Canvassing,
Telephone Calls, and Direct Mail on Voter Turnout: A Field Experiment.” American Political Science Review 94 (3): 653–64.
Gibson, Clark C. and James D. Long. 2009. “The Presidential and Parliamentary
Elections in Kenya, December 2007.” Electoral Studies 28(3): 497-502. Gilens, M. and Murakawa, N. 2002. “Elite cues and political decision-making.” In M. X.
Delli Carpini, L. Huddy, and R. Y. Shapiro, eds., Research in Micropolitics: Political Decision-Making, Deliberation, and Participation (volume 6). New York: JAI Press.
Goldstein, Ken and Paul Freedman. 2002. “Lessons Learned: Campaign Advertising in
the 2000 Elections.” Political Communication 19: 5-28. Goldsworthy, David. 1982. Tom Mboya, The Man Kenya Wanted to Forget. New York:
Holmes and Meyer Publishers.

180
Gurr, Ted. 1970. Why Men Rebel. Princeton, NJ: Princeton University Press. Gutiérrez-Romero, Roxana. 2010. “The Role of Ethnic Identity and Economic Issues in
the 2007 Kenyan Elections.” Typescript. Habyarimana, James, Macartan Humphreys, Daniel N. Posner, and Jeremy M. Weinstein.
2009. “Coethnicity and Trust.” In Karen Cook, Margaret Levi and Russell Hardin, eds. Whom Can We Trust? New York: Russell Sage Foundation.
Hartman, Todd K. and Christopher Weber. 2009. “Who Said What? The Effects of
Source Cues in Issue Frames.” Political Behavior 31: 537-558. Haugerud, Angelique. 1993. The Culture of Politics in Modern Kenya. Cambridge:
Cambridge University Press. Herr, Paul. 2002. “The Impact of Campaign Appearances in the 1996 Election.” Journal
of Politics 64(3): 904-913. Herrnson, Paul S. 2000. Congressional Elections: Campaigning at Home and in
Washington. Washington, DC: CQ Press. Hillygus, Sunshine and Todd Shields. 2008. The Persuadable Voter: Wedge Issues in
Presidential Campaigns. Princeton: Princeton University Press. Holmquist, Frank and Michale Ford. 1994. “Kenya: State and Civil Society the First year
after the Election.” Africa Today 41 (4): 5-26. Horowitz, Donald L. 2004. “The Alternative Vote and Interethnic Moderation: A Reply
to Fraenkel and Grofman.” Public Choice 121: 507–516. Horowitz, Donald L. 1997. “Encouraging Electoral Accommodation in Divided
Societies” in Lal, B. V., Larmour, P., eds., Electoral Systems in Divided Societies: The Fiji Constitution Review. Canberra: National Centre for Development Studies
Horowitz, Donald L. 1991. A Democratic South Africa? Constitutional Engineering in a
Divided Society. Berkeley: University of California Press. Horowitz, Donald L. 1990. “Making Moderation Pay: The Comparative Politics of Ethnic
Conflict Management.” In J.V. Montville, ed., Conflict and Peacemaking in Multiethnic Societies. New York: Lexington Books.
Horowitz, Donald L. 1985. Ethnic Groups in Conflict. Berkeley: University of California
Press.

181
Horowitz, Jeremy and James Long. 2010. “Does Ethnicity Reduce Strategic Voting? Evidence from Kenya’s 2007 Election.” Typescript.
Hovland, Carl I., Irving L. Janis, and Harold H. Kelley. 1953. Communication and
Persuasion: Psychological Studies of Opinion Change. New Haven, CT: Yale University Press.
Hovland, Carl I. and Walter Weiss. 1951. “The Influence of Source Credibility on
Communication Effectiveness.” Public Opinion Quarterly 15 (4): 635-650. Human Rights Watch. 2010. Kenya: Opposition Officials Helped Plan Rift Valley
Violence. Retrieved on August 1, 2010, www.hrw.org/en/news/2008/01/23/kenya-opposition-officials-helped-plan-rift-valley-violence.
Human Rights Watch. 2008. Ballots to Bullets: Organized Political Violence and
Kenya’s Crisis of Governance. New York: Human Rights Watch. Human Rights Watch. 1993. Divide and Rule: State-Sponsored Ethnic Violence in Kenya.
New York: Human Rights Watch. Imai, Kosuke. 2005. “Do Get-Out-the-Vote Calls Reduce Turnout? The Importance of
Statistical Methods for Field Experiments.” American Political Science Review, 99 (2): 283–300.
International Crisis Group. 2008. Kenya in Crisis. Africa Report #137, February 21,
2008. IRIN. 2008. “Kenya: Spreading the Word of Hate,” February 11, 2008.
http://www.irinnews.org/Report.aspx?ReportId=76346. Iyengar, Shanto and Nicolas A. Valentino. 2000. “Who Says What? Source Credibility as
a Mediator of Campaign Advertising.” In Lupia, Arthur, Mathew D. McCubbins and Samuel L. Popkin, eds., Elements of Reason: Cognition, Choice, and the Bounds of Rationality. New York: Cambridge University Press.
Jablonski, Ryan S. 2011. “Does Aid Buy Votes? How Electoral Strategies Shape the
Distribution of Aid” Typescript. Jacobson, Gary C. 2007. A Divider, Not a Uniter: George W. Bush and the American
People. New York: Pearson Longman. Jacobson, Gary C. 1989. “Strategic Politicians and the Dynamics of U.S. House
Elections, 1946–1986.” American Political Science Review 83: 773–93.

182
Joseph, Richard. 1987. Democracy and Prebendal Politics in Nigeria: The Rise and Fall of the Second Republic. New York: Cambridge University Press.
Kagwanja, Peter. 2009. “Courting Genocide: Populism, Ethno-nationalism and the
Informalisation of Violence in Kenya's 2008 Post-Election Crisis.” Journal of Contemporary African Studies 27 (3): 365-387.
Kagwanja, Mwangi. 1998. Killing the Vote: State-Sponsored Violence and Flawed
Elections in Kenya. Nairobi: Kenya Human Rights Commission. Kahn, Kim Fridkin and Patrick J. Kenney. 2002. “The Slant of the News: How Editorial
Endorsements Influence Campaign Coverage and Citizens’ Views of the Candidates.” American Political Science Review 96 (2): 381-394.
Kanyinga, Karuti. 2009. “The Legacy of the White Highlands: Land Rights, Ethnicity
and the Post-2007 Election Violence in Kenya.” Journal of Contemporary African Studies 27 (3): 325-344.
Kanyinga, Karuti. 2006. Readings in Inequality in Kenya: Sectoral Dynamics and
Perspectives. Nairobi: Society for International Development. Kamungi, Prisca Mbura. 2009. “The Politics of Displacement in Multiparty Kenya.”
Journal of Contemporary African Studies (27) 3: 345-364. Kariuki, Joseph. 2005. “Choosing the President: Electoral Campaigns in Northern Central
Kenya.” In Maupeu, Katumanga, and Mitullah, eds., The Moi Succession: Elections 2002. Nairobi: Transafrica Press.
Kasara, Kimuli. 2007. “Tax Me If You Can: Ethnic Geography, Democracy, and the
Taxation of Agriculture in Africa.” American Political Science Review 101 (1): 159-172.
Kasfir, Nelson. 1979. “Explaining Ethnic Political Participation.” World Politics 31(3):
365-388. Keefer, Philip. 2007. “Clientelism, Credibility, and the Policy Choices of Young
Democracies.” American Journal of Political Science 51(4): 804-821. Kenya Human Rights Commission. 1997. Kaya’s of Deprivation, Kayas of Blood:
Violence and Ethnicity and the State in Coastal Kenya. Nairobi: Kenya Human Rights Commission
Kenya National Commission on Human Rights (KNCHR). 2008. On The Brink of The
Precipice: A Human Rights Account of Kenya’s Post-2007 Election Violence. Nairobi: Kenya National Commission on Human Rights.

183
Kimathi, Wambui. 1993. “A Strategic Seclusion – Yet Again! The 1997 General
Elections in Luo Nyanza.” In Marcel Rutten, Alamin Mazrui, and Francois Grignon, eds., Out for the Count: The 1997 General Elections and Prospects for Democracy in Kenya. Kampala: Fountain Publishers.
King, Gary, Michael Tomz, and Jason Wittenberg. 2000. “Making the Most of Statistical
Analyses: Improving Interpretation and Presentation.” American Political Science Review 44 (2): 347-361.
King, Gary. 1997. A Solution to the Ecological Inference Problem. Princeton, N.J.:
Princeton University Press. Klopp, Jacqueline and Prisca Kamungi. 2008. “Violence and Elections: Will Kenya
Collapse?” World Policy Journal Winter 2007/2007: 11-18. Kuenzi, Michelle and Gina Lambright. 2005. “Party Systems and Democratic
Consolidation in Africa’s Electoral Regimes.” Party Politics 11 (4): 423-446. Kuklinski, James H., and Norman L. Hurley. 1994. “On Hearing and Interpreting
Political Messages: A Cautionary Tale of Citizen Cue-Taking.” Journal of Politics 56 (3): 729-751.
James H. Kuklinski and Paul J. Quirk. 2000. “Reconsidering the Rational
Public: Cognition, Heuristics, and Mass Opinion.” In Arthur Lupia, Mathew McCubbins, and Samuel Popkin, eds., Elements of Reason. Cambridge University Press.
Kyle, Keith. 1999. The Politics of the Independence of Kenya. Hampshire: Palgrave Ladd, Jonathan M. 2007. “Predispositions and Public Support for the President during the
War on Terrorism." Public Opinion Quarterly 71 (4): 511-538. Levendusky, Matthew S. 2011. “Do Partisan Media Polarize Voters?” Typescript. Leys, Colin. 1975. Underdevelopment in Kenya: The Political Economy of Neo-
Colonialism. Nairobi: East African Educational Publishers Ltd. Leonard, David. 1991. African Successes: Four Public Managers of Kenyan Rural
Development. Berkeley: University of California Press. Lijphart, Arend. 1977. Democracy in Plural Societies. New Haven: Yale University
Press.

184
Long, Scott and Jeremy Freese. 2006. Regression Models for Categorical Dependent Variables Using Stata. College Station, TX: Stata Press.
Lupia, Arthur. 2002. "Who Can Persuade Whom? Implications from the Nexus of
Psychology and Rational Choice Theory." In James H. Kuklinski, ed., Thinking about Political Psychology. New York: Cambridge University Press.
Lupia, Arthur and Mathew D. McCubbins. 1998. The Democratic Dilemma: Can Citizens
Learn What They Need to Know? New York: Cambridge University Press. Lynch, Gabrielle. 2008a. “Moi: The Making of an African Big Man.” Journal of Eastern
African Studies 2 (1): 18-43. Lynch, Gabrielle. 2008b. Kenyan Politics and the Ethnic Factor: The Case of the
Kalenjin. D.Phil. thesis, University of Oxford. Lynch, Gabrielle. 2006. “Negotiation Ethnicity: Identity Politics in Contemporary
Kenya.” Review of African Political Economy 33 (107): 49-65. Marcus, George E., W. Russell Neuman, and Michael MacKuen. 2000. Affective
Intelligence and Political Judgment. Chicago: University of Chicago Press. Market Research Company of East Africa. 1961. Public Opinion Poll of Tribalism in
Kenya. Nairobi: Market Research Company of East Africa Marris, Peter and A. Somerset. 1971. African Businessmen: A Study of Entrepreneurship
and Development in Kenya. London: Routledge and Kegan Paul. McGuire, William J. 1985. “Attitudes and Attitude Change.” In G. Lindzey and E.
Aronson, eds., Handbook of Social Psychology. New York: Random House. McGuire, William J. 1969. “The Nature of Attitudes and Attitude Change.” In Borgatta,
E.F., and W.W. Lambert, eds., Handbook of Social Psychology, second edition. Reading, MA: Addision-Wesley.
Mendelberg, Tali. 2001. The Race Card: Campaign Strategy, Implicit Messages, and the
Norm of Equality. Princeton, NJ: Princeton University Press. Miller, Joanne M. and Jon A. Krosnick. 2004. “Threat as a Motivator of Political
Activism: A Field Experiment.” Political Psychology 25 (4): 507-523. Miller, Joanne M. and Jon A. Krosnick. 2000. “Media Impact on the Ingredients of
Presidential Evaluations: Politically Knowledgeable Citizens Are Guided by a Trusted Source.” American Journal of Political Science 44 (2): 310-315.

185
Mondak, Jeffrey. 1993. “Presidential Coattails and Open Seats: The District-Level Impact of Heuristic Processing,” American Politics Research 21 (3): 307-319.
Mondak, Jeffery J., and Carl McCurley. 1994. “Cognitive Efficiency and the
Congressional Vote: The Psychology of Coattail Voting.” Political Research Quarterly 47 (1): 151-75.
Mueller, Susanne D. 2008. “The Political Economy of Kenya's Crisis.” Journal of
Eastern African Studies 2 (2): 185-210. Muigai, Githu. 1995. “Ethnicity and the Renewal of Competitive Elections in Kenya.” In
H. Glickman, ed., Ethnic Conflict and Democratisation in Africa. Atlanta: African Studies Association.
Ndegwa, Stephen N. 2003. “Kenya: Third Time Lucky?” Journal of Democracy 14 (3):
145-158. Nellis, J. 1974. The Ethnic Composition of Leading Kenyan Government Positions.
Scandinavian Institute of African Studies, Research Report No. 24. Nichter, Simeon. 2008. “Vote Buying or Turnout Buying? Machine Politics and the
Secret Ballot.” American Political Science Review 102 (1): 19-31. Noel, Richard C. and Mary J. Allen. 1976. “Sex and Ethnic Bias in the Evaluation of
Student Editorials.” Journal of Psychology: Interdisciplinary and Applied 94 (1): 53-58.
Norris, Pippa and Robert Mattes. 2003. “Does Ethnicity Determine Support for the
Governing Party?” Afrobarometer Paper No. 26. Ordeshook, Peter, and Langche Zeng. 1997. “Rational Voters and Strategic Voting:
Evidence from the 1968, 1980, and 1992 Elections.” Journal of Theoretical Politics 9 (2): 167-187.
Oloo, Adam. 2001. “The Raila Factor in Luoland.” In Herve Maupeu, Musambayi
Katumanga, and Winnie Mitullah, eds., The Moi Succession: Elections 2002. Nairobi: Transafrica Press.
Oyugi, Walter O. 1997. “Ethnicity in the Electoral Process: The 1992 General Election in
Kenya.” African Journal of Political Science 2 (1): 41-69. Popkin, Samuel. 1994. The Reasoning Voter: Communication and Persuasion in
Presidential Campaigns. Chicago: University of Chicago Press.

186
Posner, Daniel N. 2005. Institutions and Ethnic Politics in Africa. Cambridge: Cambridge University Press.
Prempeh, Kwasi H. 2008. “Presidents Untamed.” Journal of Democracy 19 (2): 109-123. Qualls, William J. and David J. Moore. 1990. “Stereotyping Effects on Consumers’
Evaluations of Advertising: Impact of Racial Differences between Actors and Viewers.” Psychology and Marketing 7 (2): 135-151.
Rabushka, Alvin and Kenneth Shepsle. 1972. Politics in Plural Societies: A Theory of
Democratic Instability. Columbus, OH: Charles E. Merrill Publishing. Rainer, Ilia and Francesco Trebbi. 2011. “How Is Power Shared in Africa” Typescript. Reilly, Benjamin. 2006. “Political Engineering and Party Politics in Conflict-Prone
Societies.” Democratization 13 (5): 811-827. Reilly, Benjamin. 2001. Democracy in Divided Societies: Electoral Engineering for
Conflict Management. New York: Cambridge University Press. Reilly, Benjamin and Andrew Reynolds. 1999. Electoral Systems and Conflict in Divided
Societies. Washington DC: National Academy Press. Riffe, Daniel, Stephen Lacy, and Frederick Fico. 2005. Analyzing Media Messages:
Using Quantitative Content Analysis in Research. Hillsdale, NJ: Erlbaum Rosen, Ori, Wenxin Jiang, Gary King, and Martin A. Tanner. 2001. “Bayesian and
Frequentist Inference for Ecological Inference: the RxC Case." Statistca Neerlandica 55(2): 134-156.
Ross, Marc Howard. 1975. Grass Roots in an African City: Political Behavior in Nairobi.
Cambridge: MIT Press. Rothchild, Donald. 1969. “Ethnic Inequalities in Kenya.” Journal of Modern African
Studies 7(4): 689-711. Rothchild, Donald. 1986. “Hegemonial Exchange: An Alternative Model for Managing
Conflict in Middle Africa.” In D.L. Thompson and Dov Ronen, eds., Ethnicity, Politics, and Development. Boulder, CO: Lynn Rienner.
Rothschild, Joseph. 1981. Ethnopolitics: A Conceptual Framework. New York:
Columbia University Press. Rustow, Dankwart. 1970. “Transitions to Democracy: Towards a Dynamic Model.”
Comparative Politics 3 (2): 337-364.

187
Sanger, Clyde and John Nottingham. 1964. “The Kenya General Election of 1963.”
Journal of Modern African Studies 2(1): pp. 1-40. Scarritt, James. 2006. “The Strategic Choice of Multiethnic Parties in Zambia’s
Dominant and Personalist Party System.” Commonwealth and Comparative Politics 44 (2): 234-256.
Shaw, Daron R. 2006. The Race to 270: The Electoral College and the Campaign
Strategies of 2000 and 2004. Chicago: University of Chicago Press. Shaw, Daron R. 1999. “The Methods behind the Madness: Presidential Electoral College
Strategies, 1988-1996.” Journal of Politics 61(4): 893-913. Sisk, Timothy D. 1994. Democratization in South Africa: The Elusive Social Contract.
Princeton, NJ: Princeton University Press. Slothuus, Rune. 2010. “When Can Political Parties Lead Public Opinion? Evidence from
a Natural Experiment.” Political Communication 27 (2): 158-177. Slothuus, Rune and Claes H. de Vrees. 2010. “Political Parties, Motivated Reasoning,
and Issue Framing Effects.” Journal of Politics 72 (3): 630-645. Snyder, Jack. 2000. From Voting to Violence: Democratization and Nationalist Conflict.
New York: Norton. Snyder, James M. 1989. “Election Goals and the Allocation of Campaign Resources.”
Econometrica 57(3): 637-660. Stokes, Susan. 2005. “Perverse Accountability: A Formal Model of Machine Politics with
Evidence from Argentina.” American Political Science Review 99 (3), 315–25. Strauss, Scott and Charlie Taylor. 2009. “Democratization and Electoral Violence in Sub-
Saharan Africa, 1990-2007” Typescript. Tamarkin, M. 1978. “The Roots of Political Stability in Kenya.” African Affairs 77 (308):
297-320 Throup, David. 2008. “The Count.” Journal of East African Studies 2(2): 290-304. Throup, David. 1987. “The Construction and Destruction of the Kenyatta State.” In M.
Schatzberg, ed., The Political Economy of Kenya. New York: Praeger Publishers. Throup, David and Charles Hornsby. 1998. Multi-party Politics in Kenya. Oxford: James
Currey.

188
Valentino, Nicholas A., Vincent L. Hutchings and Ismail K. White. 2002. “Cues That
Matter: How Political Ads Prime Racial Attitudes During Campaigns.” American Political Science Review 96 (1): 75-90.
Vavreck, Lynn. 2009. The Message Matters: The Economy and Presidential Campaigns.
Princeton: Princeton University Press. wa Githinji, Mwangi and Frank Holmquist. 2008. “Kenya's Hopes and Impediments: The
Anatomy of a Crisis of Exclusion.” Journal of Eastern African Studies 2 (2): 344-358.
Wantchekon, Leonard. 2003. “Clientelism and Voting Behavior: Evidence from a Field
Experiment in Benin.” World Politics 55: 399-422. West, Darrell. 1984. Making Campaigns Count: Leadership and Coalition Building in
1980. Westport, CT: Greenwood Press. West, Darrell. 1983. “Constituencies and Travel Allocations in the 1980 Presidential
Campaign.” American Journal of Political Science 27(3): 515-529. Widner, Jennifer A. 1992. The Rise of a Party State in Kenya: From “Harambee” to
Nyayo.” Berkeley: University of California. Wilkinson, Steven. 2004. Votes and Violence: Electoral Competition and Ethnic Riots in
India. Cambridge: Cambridge University Press. Wittenberg, Jason, Ferdinand Alimadhi, Badri Narayan Bhaskar, and Olivia Lau. 2007.
“ei.RxC: Hierarchical Multinomial-Dirichlet Ecological Inference Model.” Software package.
Whittler, Tommy E. and Joan DiMeo. 1991. “Viewers’ Reactions to Racial Cues in
Advertising Stimuli.” Journal of Advertising Research 31 (6): 31-46. Zaller, John. 1992. The Nature and Origins of Mass Opinion. New York: Cambridge
University Press.