
PhD dissertation V25 after defence FINAL
263
Susana Cristina dos Santos Gomes Martins Moretto Licenciatura em Relações Internacionais, Universidade Lusíada Mestrado em Estudos Europeus, Collège d'Europe Technology Assessment and High-Speed Trains: facing the challenge of emergent digital society Dissertação para obtenção do Grau de Doutor em Avaliação de Tecnologia Orientador: Doutor António Paulo Brandão Moniz de Jesus, Professor Associado com Agregação, Departamento de Ciências Sociais Aplicadas, Faculdade de Ciências e Tecnologia, Universidade Nova de Lisboa Co-orientador: Doutora M. Rosário M. R. Macário, Professora Associada, Departamento de Engenharia Civil, Arquitectura e Georrecursos, Instituto Superior Técnico, Universidade de Lisboa Abril 2017
-
Upload
khangminh22 -
Category
Documents
-
view
2 -
download
0
Transcript of PhD dissertation V25 after defence FINAL

!
Susana Cristina dos Santos Gomes Martins Moretto Licenciatura em Relações Internacionais, Universidade Lusíada
Mestrado em Estudos Europeus, Collège d'Europe
Technology Assessment and High-Speed Trains: facing the challenge of emergent digital society
Dissertação para obtenção do Grau de Doutor em Avaliação de Tecnologia
Orientador: Doutor António Paulo Brandão Moniz de Jesus, Professor Associado com Agregação, Departamento de Ciências Sociais Aplicadas, Faculdade de Ciências e Tecnologia, Universidade Nova de Lisboa
Co-orientador: Doutora M. Rosário M. R. Macário, Professora Associada, Departamento de Engenharia Civil, Arquitectura e Georrecursos, Instituto Superior Técnico, Universidade de Lisboa
Abril 2017!


!
!iii!
Technology Assessment and High-Speed Trains:
facing the challenge of emergent digital society
Copyright! Susana Cristina dos Santos Gomes Martins Moretto, FCT/UNL and UNL
A Faculdade de Ciências e Tecnologia e a Universidade Nova de Lisboa tem o direito, perpétuo
e sem limites geográficos, de arquivar e publicar esta dissertação através de exemplares
impressos reproduzidos em papel ou de forma digital, ou por qualquer outro meio conhecido
ou que venha a ser inventado, e de a divulgar através de repositórios científicos e de admitir a
sua copia e distribuição com objetivos educacionais ou de investigação, não comerciais, desde
que seja dado crédito ao autor e editor.


!
!v!
In memory of my mother Luisa Martins


!
!vii!
Acknowledgements
During this PhD journey I have sourced from inspiring people met along the way. Here, I leave
my expression of gratitude to them by evoking their names and contributions.
The first person is my husband Luca Moretto. He is the most intelligent person I have ever met.
He is the main supporter of this enterprise and my main anchor to the corporate world which I
left at the early stage of my PhD. Also, my son Alessandro. He born and gown alongside this
dissertation. My mother Luisa Martins. The most intelligent woman, entrepreneur and friend.
She will eternally live in my heart.
This journey started because of Nuno Boavida. He was an old friend from the early times
working in Brussels. We re-encountered years later at a conference in Lisbon. He introduced
me to Technology Assessment (TA). The PhD was about to launch in Portugal by Professor
Brandão Moníz. Soon after we become PhD colleagues and co-author of papers. I shall say that
Nuno was a key element also for our research group with his TA Reading Labs. There he shared
a series of reference publications and promoted regular discussions between colleagues.
In its turn Professor Brandão Moníz became my dissertation principal supervisor. He was active
supporter of my research. His fulltime engagement was essential. His latter sabbatical period at
the Institute of Technology Assessment at the Karlsruhe Institute of Technology (ITAS-KIT)
in Germany, where significant research projects as PACITA, enlarged our research group. I
benefitted from the multiple exchanges with researchers at ITAS, visits to the institute, joint
participation in conferences and publications in journals and books. Today the PhD is dual with
ITAS-KIT.
Moreover, Professor Manuel Seabra Pereira, pioneer and distinguish element of ERRAC
European Railway Research Advisory Council, and Professor Rosário Macário, a woman I
admire and leader in transport research, were kind to accept the co-supervision of this
dissertation. It extended our long collaboration and friendship from early times in my career
when I worked for UNIFE (the European Association for the Railway Industry). Both were a
very important link to railway research.
Halfway through my PhD journey I was fortuned to meet Douglas K. R. Robinson, PhD, from
the LISIS of Paris Est Marne-la Vallee University. He was a former student of Professor Aire
Rip at Twente University. Douglas is a reference author in Technology Assessment and active
developer of Rip’s Constructive Technology Assessment (CTA) theory. Douglas became my
main and most valuable source of TA insides. He was kind enough to accept to be co-author in
various papers, opening doors for publication and presentations. He gave me unconditional

!
!viii!
support. Also, Jens Schippl, a researcher on Transport Scenarios at ITAS-KIT, became
influential in my work and co-author. Both Douglas and Jens directed me to the relevant
theoretical references and methods in TA.
My PhD was not only a theoretical journey crossing ways with people from TA and railways
as mentioned. It was also a geographical journey encompassing learnings on the broad of
strategic innovation management. Soon after I started my PhD in Portugal I moved for personal
reasons to Santiago de Queretaro in Mexico. There I entered the academic carrier as researcher
and lecturer at the Universidad Autónoma de Queretaro. This was only possible because
Professor Alberto Pastrana and Professor Luis Rodrigo Valencia Perez at the Business and
Administration School opened the door of their Innovation Lab. I am very much thankful to
them for this unique opportunity. In Mexico, I also met a very interesting Professor in
Philosophy of Innovation, Fernando Gonzales, PhD. Inspired by Mumford, Professor Fernando
Gonzales developed charts from his interpretations to the understanding of technology as tool
and process which were source of inspiration in my modeling on high-speed trains technical
and commercial trajectories (figures 4.11 and 4.12).
When I later moved to Shanghai, I was very fortunate to meet Professor Chen Song, Vice-Dean
of the School of Economics and Management of Tongji University. He was also Professor for
Innovation Management. He gave me the opportunity to continue my research and lecture at
Tongji. The writing of the final pages of this dissertation happened instead in Hong Kong,
where I subsequently moved afterwards. There, Professor Naubahar Sharif from the Social
Sciences Department of the Hong Kong University of Science and Technology challenged me
to exploit my research results to the Hong Kong Express Rail Link.
I would like to extend my gratitude to the members of the thesis evaluation committee (CAT -
Comité de Avaliação de Tese), in particular Professor José Nuno Varandas da Silva Ferreira
and Professor Zuzana Dimitrovová, also Professor Prof. Doutor Virgílio António Cruz
Machado, Professor Manuel Duarte Mendes Monteiro Laranja, Douglas Keith Raymond
Robinson, Nuno Filipe França Gouveia Boavida.
And finally, express my appreciation to the various comments received from anonymous peer
reviewers and responses to the survey from the various professionals in the railways and in the
Technology Assessment community.

!
!ix!
Abstract The present PhD dissertation addresses the extension of selective environments of new
technologies within the high-speed train technological system from business and regulations to
the wider society. And, it argues the recognition of society as an actor in that system.
Motivating it is the observed ever increase exposure of high-speed trains to public acceptance,
caused by empowered society from fast ICT advancements. They refer to digitalization - the
rise of social media and big data, combined with the widespread use of mobile technology -
changing if not revolutionizing our understanding of product and service selection.
Unprecedented societal demands, opening a new market segment, require new technologies to
integrate with the emergent digital system. Moreover, societal actors became themselves
innovators. Inevitable they have to become part of the value chain widening the collective of
stakeholders. However, such raises the dilemma of promotion and control and adds complexity
and uncertainty to the industry in deciding which technology to select.
Statistical evidence shows that businesses are figuring out ways to embed societal actors in
their value creation. In this dissertation, I demonstrate to the high-speed train industry how is it
falling short in addressing societal embedding in their product creation and argue why requires
improvement.
Technology Assessment provides the approach for the orchestration of the necessary dialogue
with societal actors for better anticipating potential development in the full system and for
embedding the resulting technology options within.
By exploiting it to the high-speed train industry innovation strategic management, the aim of
my dissertation is, borrowing the words of Douglas K. R. Robinson, to “arrive to a better
informed designs of future working worlds, which are structured by theory while empirically
well grounded, so they are usable by decision makers”.
With this work, I expect to contribute to the new governance structure for research and
development set buy the railway industry SHIFT2RAIL (Joint Undertaking for Rail Research
and Innovation).
Key words: Strategic Innovation Management, Technology Assessment, Constructive
Technology Assessment, High-speed trains


!
!xi!
Sumário
Com a presente tese de doutoramento proponho uma nova abordagem na seleção de novas
tecnologias integrantes do sistema da alta-velocidade-ferroviária, que efetive a extensão dos
tradicionais enquadramentos de triagem (condições de mercado e regulamentares) aos sociais
desde a fase inicial do desenvolvimento tecnológico.
O motivo encontra-se no observado fenómeno de crescente relevância social e seus revigorantes
atores emergentes da sem precedente digitalização que muda, se não revoluciona, a forma como
as novas tecnologias são selecionadas.
Por digitalização entende-se redes socias, “big data”, “cloud”, acompanhados pela utilização
de comunicações moveis em rede, geradoras de comunidades de partilha e usuários inovadores.
Com as resultantes novas procuras e ofertas sociais, a indústria de alta-velocidade-ferroviária
vê-se confrontada com o dilema da “promoção e controlo tecnológico” alargado, o que acresce
complexidade e incerteza às existentes praticas de triagem das suas novas ofertas.
Estatísticas demonstram que apesar das medidas exploratórias para a integração social estas
têm sido na sua maioria de imagem e marketing e menos no seu envolvimento na criação de
valor através da investigação e desenvolvimento.
Da análise desta problemática no sistema de alta-velocidade-ferroviária Europeia, é minha
ambição, (usando as palavras de Douglas K. R. Robinson) “chegar a designs mais informados
de futuros [tecnológicos] que funcionem, que sejam estruturados pela teoria enquanto
empiricamente bem fundados, utilizáveis pelos decisores”.
Para tal pretendo demonstrar como será possível nesta indústria introduzir a Avaliação de
Tecnologia, instrumento de apoio à decisão de politicas e estratégias tecnológicas socialmente
integradas, para uma orquestração do necessário diálogo entre os promotores das tecnologias e
os atores sociais, a implementar por antecipação e integração sistémica das soluções
tecnológicas desde a fase inicial de desenvolvimento.
Desta forma espero contribuir para a nova governança da investigação e desenvolvimento da
industria ferroviária na Europa recentemente lançada pela iniciativa SHIFT2RAIL (Joint
Undertaking for Rail Research and Innovation).
Palavras Chave: Gestão Estratégica da Inovação, Avaliação da Tecnologia, Avaliação da
Tecnologia Construtiva, Alta-Velocidade-Ferroviária.


!
!xiii!
Table of Contents
I.#INTRODUCTION#+++++++++++++++++++++++++++++++++++++++++++++++++++++++++++++++++++++++++++#1!1.1.#Changing#demands:#what#is#at#stake#for#the#high+speed#train#sector?#+++++++++#1!1.2.#The#dissertation#++++++++++++++++++++++++++++++++++++++++++++++++++++++++++++++++++++++++++++++#6!1.3.#Structure#++++++++++++++++++++++++++++++++++++++++++++++++++++++++++++++++++++++++++++++++++++++++#7!
II.#THEORETICAL#REFERENCES#++++++++++++++++++++++++++++++++++++++++++++++++++++++++++#9!2.1.#Technology#Assessment#++++++++++++++++++++++++++++++++++++++++++++++++++++++++++++++++++++#9!2.1.1.!Multiple!strands!333333333333333333333333333333333333333333333333333333333333333333333333333!9!2.1.2.!A!problem!of!selection!3333333333333333333333333333333333333333333333333333333333333333333!11!
2.2.#Constructive#Technology#Assessment#++++++++++++++++++++++++++++++++++++++++++++++++#14!2.2.1.!Selected!strand!and!its!implications!33333333333333333333333333333333333333333333333333!14!2.2.2.!Distinctive!theoretical!elements!3333333333333333333333333333333333333333333333333333333!15!2.2.3.!Origins!and!applications!3333333333333333333333333333333333333333333333333333333333333333!17!2.2.4.!Theoretical!aspects!of!relevance!for!the!high3speed!train!industry!333333333333!19!2.2.5.!Theoretical!elements!developed!333333333333333333333333333333333333333333333333333333!21!2.2.6.!Contribution!3333333333333333333333333333333333333333333333333333333333333333333333333333333!22!
III.#METHODOLOGY#++++++++++++++++++++++++++++++++++++++++++++++++++++++++++++++++++++++++#23!3.1.#Research#questions#and#propositions#++++++++++++++++++++++++++++++++++++++++++++++++#23!3.2.#Research#framework#++++++++++++++++++++++++++++++++++++++++++++++++++++++++++++++++++++++#25!
IV.#THE#CASES#OF#THE#AGV#AND#ICE+350E#DEVELOPMENT#PROCESS#++++++++#29!4.1.#Strategic#intelligence#++++++++++++++++++++++++++++++++++++++++++++++++++++++++++++++++++++++#30!4.1.1.!Introduction!3333333333333333333333333333333333333333333333333333333333333333333333333333333!30!4.1.2.!Strategic!function!of!TA!33333333333333333333333333333333333333333333333333333333333333333!33!4.1.3.!Data!collection!3333333333333333333333333333333333333333333333333333333333333333333333333333!35!4.1.4.!Organisational!structure!3333333333333333333333333333333333333333333333333333333333333333!36!4.1.5.!Technology!development!333333333333333333333333333333333333333333333333333333333333333!41!4.1.6.!Findings!333333333333333333333333333333333333333333333333333333333333333333333333333333333333!53!
4.2.#Technology#transitions#+++++++++++++++++++++++++++++++++++++++++++++++++++++++++++++++++++#56!4.2.1.!Introduction!3333333333333333333333333333333333333333333333333333333333333333333333333333333!56!4.2.2.!Theoretical!references! 333333333333333333333333333333333333333333333333333333333333333333!58!4.2.3.!Technology!transitions!AGV!and!ICE3350E!33333333333333333333333333333333333333333!61!4.2.4.!Findings!333333333333333333333333333333333333333333333333333333333333333333333333333333333333!71!
4.3.#Multi+level#Perspectives#++++++++++++++++++++++++++++++++++++++++++++++++++++++++++++++++++#73!4.3.1.!Introduction!3333333333333333333333333333333333333333333333333333333333333333333333333333333!73!4.3.2.!Analysis!3333333333333333333333333333333333333333333333333333333333333333333333333333333333333!73!4.3.3.!Findings!333333333333333333333333333333333333333333333333333333333333333333333333333333333333!80!
4.4.#Anticipation#through#future#strategic#formulations#++++++++++++++++++++++++++++++#82!4.4.1.!Introduction!3333333333333333333333333333333333333333333333333333333333333333333333333333333!82!4.4.2.!Methodology!3333333333333333333333333333333333333333333333333333333333333333333333333333333!84!4.4.3.!FTA!and!the!European!High!Speed!Railway!system!3333333333333333333333333333333!85!4.4.4.!Findings!333333333333333333333333333333333333333333333333333333333333333333333333333333333333!96!
V.#SURVEY#++++++++++++++++++++++++++++++++++++++++++++++++++++++++++++++++++++++++++++++++++++#99!5.1.!Introduction!333333333333333333333333333333333333333333333333333333333333333333333333333333333!99!5.2.!Data!collection!33333333333333333333333333333333333333333333333333333333333333333333333333333!102!5.3.!Unit!of!analysis!(Q1,!Q11,!Q12)!33333333333333333333333333333333333333333333333333333333!105!Results!(Q1,!Q11,!Q12)!333333333333333333333333333333333333333333333333333333333333333333333333!111!5.4.!Respondents!preliminary!view!on!the!survey!topic!3333333333333333333333333333333!112!Results!(Q2,!Q3)!33333333333333333333333333333333333333333333333333333333333333333333333333333333!118!5.5.!Results!33333333333333333333333333333333333333333333333333333333333333333333333333333333333333!119!A.!STRATEGIC!INNOVATION!MANAGEMENT!33333333333333333333333333333333333333333333!119!

!
!xiv!
i)!Technology!development!characterization!33333333333333333333333333333333333333333333!119!Q13.!R&D!expenditure!333333333333333333333333333333333333333333333333333333333333333333333333!120!Q14.!R&D!strategy!33333333333333333333333333333333333333333333333333333333333333333333333333333!121!Q15.!Technology!surveillance!333333333333333333333333333333333333333333333333333333333333333!123!Q16.!Posts!in!technological!surveillance!33333333333333333333333333333333333333333333333333!125!Results!(Q133Q16)!33333333333333333333333333333333333333333333333333333333333333333333333333333!127!ii)!Technological!development!multi3level!dynamics!3333333333333333333333333333333333!128!Q17.!The!purpose!for!undertaking!technology!developments!333333333333333333333333!129!Q18.!Existing!technology!development!practices!333333333333333333333333333333333333333!136!Q19.!Openness!to!collaborative!research!3333333333333333333333333333333333333333333333333!138!Q20.!Technological!partnerships!33333333333333333333333333333333333333333333333333333333333!139!Q21.!Relevant!factors!for!conducting!collaborative!research!3333333333333333333333333!141!Results!(Q17!–!Q21)!333333333333333333333333333333333333333333333333333333333333333333333333333!143!B.!SOCIETAL!EMBEDDING!3333333333333333333333333333333333333333333333333333333333333333333!144!iii)!Drivers!and!alignments!in!technology!change!333333333333333333333333333333333333333!145!Q22.!Drivers!for!technology!change!33333333333333333333333333333333333333333333333333333333!145!Q23.!Requirements!for!technology!change!33333333333333333333333333333333333333333333333!148!Q24.!Sources!of!drivers!and!requirements!33333333333333333333333333333333333333333333333!158!Q25.!Appraisal!instruments!333333333333333333333333333333333333333333333333333333333333333333!161!Results!(Q22!to!Q25)!33333333333333333333333333333333333333333333333333333333333333333333333333!162!iv)!Societal!elements!in!the!strategic!management!approach!333333333333333333333333!164!Q26.!What!represents!alignment!with!societal!actors?!33333333333333333333333333333333!165!Q27.!Management!for!societal!embedding!333333333333333333333333333333333333333333333333!167!Q28.!Dealing!with!the!anticipation!dilemma!333333333333333333333333333333333333333333333!170!Results!(Q263Q28)!33333333333333333333333333333333333333333333333333333333333333333333333333333!173!v)!Futures!3333333333333333333333333333333333333333333333333333333333333333333333333333333333333333!173!Q29.!Visioning!the!future!333333333333333333333333333333333333333333333333333333333333333333333!174!Q30.!Sources!of!future!reports!33333333333333333333333333333333333333333333333333333333333333!176!Q31.!Methods!to!access!futures!3333333333333333333333333333333333333333333333333333333333333!178!Q32.!Futures!should!consider!333333333333333333333333333333333333333333333333333333333333333!180!Q33.!Futures!expected!contribution!3333333333333333333333333333333333333333333333333333333!181!Results!(Q293Q33)!33333333333333333333333333333333333333333333333333333333333333333333333333333!183!5.6.!Survey!main!results!3333333333333333333333333333333333333333333333333333333333333333333333!184!A.!!Main!Results!–!Strategic!Innovation!Management!3333333333333333333333333333333333!184!B.!Main!Results!–!Societal!embedding!innovation!management!333333333333333333333!185!
VI.#FINDINGS#SUMMARY#++++++++++++++++++++++++++++++++++++++++++++++++++++++++++++++++#189!VII.#CONCLUSIONS,#RECOMMENDATIONS#and#IMPACTS#+++++++++++++++++++++++#195!
BIBLIOGRAPHY#+++++++++++++++++++++++++++++++++++++++++++++++++++++++++++++++++++++++++++#201!
ANNEXES#++++++++++++++++++++++++++++++++++++++++++++++++++++++++++++++++++++++++++++++++++++#215!Annex#1.#Map#of#the#high+speed#train#network#in#Europe#++++++++++++++++++++++++++#215!Annex#2.#Survey#questions##++++++++++++++++++++++++++++++++++++++++++++++++++++++++++++++++++#216#Annex#3.#Dissertation#summary#chart#++++++++++++++++++++++++++++++++++++++++++++++++++++#233#

!
!xv!
Figures
Figure 1.1.! Enterprise use of social networks, by purpose and sector, Europe 28, year 2013!...................!5!Figure 2.2.! Simplified taxonomy on the main TA strands!.......................................................................................!12!Figure 2.3.! Enactment and Selection adapted by Robinson (2010) from Garud and Ahlstrom (1997)!17!Figure 3.4. Research plan!.....................................................................................................................................................!26!Figure 4.5. Extended Product Construction Process to society referred in Deuten et al. (1997)!............!34!Figure 4.6. Societal embedding within strategic intelligence!.................................................................................!36!Figure 4.7. Societal embedding and the technology surveillance structure!......................................................!39!Figure 4.8. High-speed train multi-actor system!.........................................................................................................!42!Figure 4.9. Societal embedding within high-speed train multi-actor relations!...............................................!44!Figure 4.10. Societal embedding within the product technological system!.......................................................!47!Figure 4.11. Societal embedding within the technical trajectory!..........................................................................!49!Figure 4.12. Societal embedding within the commercial trajectory!.....................................................................!51!Figure 4.13. Overview of societal embedding in the different dimensions of the high-speed train
technology development!...................................................................................................................................!53!Figure 4.14. Technological transitions of the reference high-speed trains worldwide.!...............................!57!Figure 4.15. Rip and Kemp micro-meso-macro approach to locate technology transformations.!..........!60!Figure 4.16. The French TGV/AGV technology transition!......................................................................................!62!Figure 4.17. German ICE technology transitions!.......................................................................................................!67!Figure 4.18. The AGV and ICE-35E multi-level perspective from 2001 to 2008!............................................!74!Figure 4.19. High-speed trains technology innovation over time (s-curve)!......................................................!87!Figure 4.20. Future strategic reports and multi-level perspective since 2001 to our days!.........................!92!Figure 5.21. Product development process environments!......................................................................................!100!Figure 5.22. High-speed train product development process environments in time.!..................................!101!


!
!xvii!
Tables
Table!4.1.!Classification!of!reports!on!future!oriented!technology!assessment!(FTA)!referring!to!the!highFspeed!train!system!...................................................................................................................................!85!


!
!xix!
Graphs
Graph 5.1. Respondents categories (Q1)!......................................................................................................................!106!Graph!5.2.!Respondents!categories!resulting!from!their!institutional!affiliation!(Q11)!........................!107!Graph!5.3.!Breakdown!by!respondents’!institutional!affiliation!(Q11)!..........................................................!108!Graph!5.4.!Country!distribution!(Q12)!.........................................................................................................................!110!Graph!5.5.!Country!distribution!by!institutional!types!(Q12)!............................................................................!111!Graph!5.6.!Aspects!valued!when!decision!is!made!to!take!the!highFspeed!train!(Q2)!.............................!113!Graph!5.7.!Aspects!valued!when!decision!is!made!to!take!the!highFspeed!trai.!Breakdown!(Q2)!......!114!Graph!5.8.!Aspects!valued!when!decision!is!made!to!take!the!highFspeed!train.!Breakdown!(Q2)!...!114!Graph!5.9.!Should!users!and!wide!society!have!a!say!in!the!technology!development!(Q3)!.................!116!Graph!5.10.!Should!users!and!wide!society!have!a!say!in!the!technology!development.!Breakdown!
(Q3)!.........................................................................................................................................................................!117!Graph!5.11.!HighFspeed!train!industry!expenditure!on!R&D!as!a!%!of!total!turnover!(Q13)!..............!120!Graph!5.12.!HighFspeed!expenditure!on!R&D!as!a!%!of!annual!turnover.!Breakdown!(Q13)!..............!121!Graph!5.13.!Does!your!institution!have!an!explicit!R&D!strategy?!(Q14)!.....................................................!122!Graph!5.14.!Does!your!institution!have!an!explicit!R&D!strategy?!Breakdown!(Q14)!............................!122!Graph!5.15.!Does!your!institution!have!an!explicit!technology!surveillance!structure?!(Q15)!...........!124!Graph!5.16.!Does!your!institution!have!an!explicit!technological!surveillance!structure?!Breakdown!
(Q15)!......................................................................................................................................................................!124!Graph!5.17.!You!or!a!colleague!take!part!in!technological!surveillance!as!follows…!(Q16)!.................!126!Graph!5.18.!You!or!a!colleague!take!part!in!technological!surveillance!as!follows.!Breakdown!(Q16)!
….!..............................................................................................................................................................................!126!Graph!5.19.!Purpose!for!undertaking!technology!development!activities!(Q17)!......................................!129!Graph!5.20.!Purpose!for!undertaking!technology!development!activities:!Product!development!and!
design!(Q17a)!.....................................................................................................................................................!130!Graph!5.21.!Purpose!for!undertaking!technology!development!activities:!Manufacturing!process!
(Q17b)!...................................................................................................................................................................!131!Graph!5.22.!Purpose!for!undertaking!technology!development!activities:!Modelling!and!planning!
(Q17c)!....................................................................................................................................................................!131!Graph!5.23.!Purpose!for!undertaking!technology!development!activities:!Certification!and!
homologation!(Q17d)!.....................................................................................................................................!132!Graph!5.24.!Purpose!for!undertaking!technology!development!activities:!Cost!reduction!(Q17e)!...!133!Graph!5.25.!Purpose!for!undertaking!technology!development!activities:!Solve!technical!problems!
(Q17f)!.....................................................................................................................................................................!134!Graph!5.26.!Purpose!for!undertaking!technology!development!activities:!Make!the!final!product!
attractive!to!users!(Q17g)!............................................................................................................................!134!Graph!5.27.!Purpose!for!undertaking!technology!development!activities:!Enter!new!markets!or!gain!
market!from!competitors!(Q17h)!..............................................................................................................!135!Graph!5.28.!Purpose!for!undertaking!technology!development!activities:!Anticipate!new!societal!
challenges,!policies!and!market!conditions!(Q17i)!............................................................................!136!Graph!5.29.!Existing!technology!development!practices!(Q18)!........................................................................!137!Graph!5.30.!Existing!technology!development!practices.!Breakdown!(Q18)!..............................................!137!Graph!5.31.!Openness!to!collaborative!research!(Q19)!........................................................................................!138!Graph!5.32.!Openness!to!collaborative!research.!Breakdown!(Q19)!..............................................................!139!Graph!5.33.!Technological!partners!(Q20)!.................................................................................................................!140!Graph!5.34.!Technological!partners.!Breakdown!(Q20)!.......................................................................................!140!Graph!5.35.!Relevant!factors!for!conducting!collaborative!research!(Q21)!................................................!142!Graph!5.36.!Relevance!of!collaborative!research.!Breakdow.!(Q21)!...............................................................!142!Graph!5.37.!Rate!in!relevance!the!factors!driving!your!research!and!development!(Q22)!...................!146!Graph!5.38.!Drivers!for!technology!change.!Breakdown!(Q22)!........................................................................!147!Graph!5.39.!When!developing!a!new!technological!solution!(TRL)!which!requirement!for!alignment!
you!consider?!(Q23)!.........................................................................................................................................!148!Graph!5.40.!When!developing!a!new!technological!solution!for!the!highFspeed!train!at!which!
technological!readiness!levels!(TRL)!you!consider!identified!requirements!for!alignment?!(Q23)!......................................................................................................................................................................!149!
Graph!5.41.!Requirements!relevance!at!TRL!1.!Basic!principles!observed!and!reported!(Q23)!.........!150!Graph!5.42.!Requirements!relevance!at!TRL!2.!Technology!concept!formulated!(Q23)!........................!151!

!
!xx!
Graph!5.43.!Requirements!relevance!at!TRL!3.!Experimental!proof!of!concept!(Q23)!...........................!152!Graph!5.44.!Requirements!relevance!at!TRL!4.!Technology!validation!in!laboratory!(Q23)!...............!153!Graph!5.45.!Requirements!relevance!at!TRL!5.!Technology!validation!in!relevant!environment!
(Q23)..!....................................................................................................................................................................!154!Graph!5.46.!Requirements!relevance!at!TRL!6.!Technology!demonstration!in!a!relevant!environment!
(Q23)!......................................................................................................................................................................!154!Graph!5.47.!Requirements!relevance!at!TRL!7.!System!prototype!demonstration!in!an!operational!
environment!(Q23)!..........................................................................................................................................!155!Graph!5.48.!Requirements!relevance!at!TRL!8.!System!completed!and!qualified!through!test!and!
demonstration!(Q23)!......................................................................................................................................!156!Graph!5.49.!Requirements!relevance!at!TRL!9.!Actual!system!proven!through!successful!mission!
operations!(Q23)!..............................................................................................................................................!157!Graph!5.50.!Indicate!your!sources!of!information!on!technological!drivers!and!requirements!
(Q24)…..!................................................................................................................................................................!159!Graph!5.51.!Indicate!your!sources!of!information!on!technological!drivers!and!requirements.!
Breakdown!(Q24)!.............................................................................................................................................!160!Graph!5.52.!In!which!type!of!instruments!you!base!your!technology!decisions?!(Q25)!..........................!161!Graph!5.53.!You!base!your!technology!decision!on!which!type!of!instruments.!Breakdown!(Q25)!..!162!Graph!5.54.!What!represents!technology!alignment!with!societal!actors?!(Q26)!....................................!165!Graph!5.55.!What!represents!technology!alignment!with!societal!actors?!(Q26)!....................................!166!Graph!5.56.!Technology!management!includes!the!following!elements?!(Q27)!........................................!168!Graph!5.57.!Technology!management!includes!the!following!elements?!Breakdown!(Q27a)!............!169!Graph!5.58.!Technology!management!includes!the!following!elements?!Breakdown!(Q27b)!............!169!Graph!5.59.!Technology!management!included!the!following!elements?!Breakdown!(Q27c)!............!169!Graph!5.60.!Technology!management!included!the!following!elements?!Breakdown!(Q27b)!............!169!Graph!5.61.!Do!stakeholders!pay!attention!to!societal!embedding!when!setting!their!technology!
strategy?!(Q28)!..................................................................................................................................................!170!Graph!5.62.!Mapping!and!monitoring!relevant!environment!including!society?!(Q28a)!......................!171!Graph!5.63.!Articulation!of!scenarios!for!societal!embedding?!(Q28c)!.........................................................!172!Graph!5.64.!Stimulating!continuous!learning!during!societal!inclusion!process?!(Q28d)!....................!172!Graph!5.65.!Relevance!in!visioning!the!future!(Q29)!.............................................................................................!174!Graph!5.66.!Relevance!in!visioning!the!future.!Breakdown!(Q29)!...................................................................!175!Graph!5.67.!Futures!sources!of!information!(Q30)!.................................................................................................!176!Graph!5.68.!Futures!sources!of!information,!breakdown!internal!reports!(Q30)!.....................................!177!Graph!5.69.!Futures!sources!of!information.!Breakdown!by!institutions!(Q30)!........................................!178!Graph!5.70.!Methods!used!in!futures!(Q31)!................................................................................................................!179!Graph!5.71.!Methods!used!in!futures.!Breakdown!(Q31)!......................................................................................!179!Graph!5.72.!Aspects!futures!should!consider!(Q32)!................................................................................................!180!Graph!5.73.!Aspects!futures!should!consider.!Breakdown!(Q32)!......................................................................!181!Graph!5.74.!What!futures!should!consider!(Q33)!....................................................................................................!182!Graph!5.75.!What!futures!should!consider.!Breakdown!(Q33)!..........................................................................!182!

!
!xxi!
Acronyms
AGV - Automotrice à Grand Vitesse
CAM – Computer-Aided Manufacturing
CAD – Computer-Aided Design
CER – Community of European Railway and Infrastructure Companies
CTA – Constrictive Technology Assessment
DB - Deutsche Bahn AG
MLP – Multi-Level Perspective
MODTRAIN - Innovative Modular Vehicle Concepts for an Integrated European Railway System
EC – European Commission
EC FP – European Commission Framework Programme for Research
EIM – European Infrastructure Managers Association
ERA – European Railway Agency
EPTA – European Parliament Technology Assessment network
ERRAC – European Railway Research and Advisory Council
EUDD – European Modular Train Cabin Concepts
FTA – Future Oriented Technology Analysis
GDP – Gross Domestic Product
ICE - Inter City Express
ITA – Institute of Technology Assessment of the Austrian Academy of Sciences
ITAS - Institute for Technology Assessment and System Analysis, Karlsruhe Institute of Technology
NOTA - Netherlands Organization of Technology Assessment
NTV - Nouvo Transporto Viaggiatore
OTA - Office of Technology Assessment (United States of America)
PCP – Product Construction Process
R&D – Research & Development
RQ – Research Questions
SAFETRAIN - Safe Interiors
SERA - Single European Railway Area (COM(2011) 144 final)
SECP – Social Embedding Construction Process

!
!xxii!
SHIFT2RAIL – Joint Undertaking for Rail Research and Innovation (Council Regulation (EU) No. 642/2014 of 6 June 2014)
SNCF - Société Nationale des Chemins de Fer Français
STOA – Science and Technology Options Assessment panel of the European Parliament
SRQ – Sub-Research Questions
TA – Technology Assessment
TAB – Office Technology Assessment at the German Parliament
TA-SWISS – Swiss Center for Technology Assessment
TGV – Train à Grand Vitesse
TRL – Technology Readiness Levels
UNIFE – The Association of the European Rail Industry [Union Internationale des Industries Ferroviaire]
UIC –the International Union of Railways [Union Internationale des Chemins de Fer]

!!
1
I. INTRODUCTION
1.1. Changing demands: what is at stake for the high-speed train
sector?
In recent years, developments in high-speed trains are receiving greater exposure from non-
technical factors external to the traditional product design and business steaming from rapid
developments of digital society.
Society has become empowered through social media, big data and the cloud, which, combined
with the exponential rate of adoption of mobile technologies, is producing widespread service and
social innovations. Examples include connected travellers, car sharing, car-pooling, etc.
This pressure adds to other existent societal challenges such as the after-effects of the financial
crisis and the drive for sustainable innovation systems, with climate change, congestion, security
and the aging population in Western societies (COM (2011) 144 final1).
An example of empowered society by digitalization is BlaBlaCar 20 million users, overpassing
SNCF-Voyage market share (Chen 2015 and Casprini et al, 2015). The French railway company
operating the TGV, responded introducing mobility services beyond the high-speed train, reducing
tariffs and improving online information to travellers (Picard 2015, Steinmann 2014).
In turn manufacturers, such as Alstom Transport and Siemens Mobility2, have been responding in
the way they know best, through engineering. These firms are integrating lightweight and
recyclable materials into their trains as well as energy converter systems. They are also making the
train interiors attractive and further developing ICT solutions for better interfaces with travellers
(Brandes, 2015, Saint-Martin, 2015).
As it will be here demonstrated, in railways the need for innovating through digitalization is coming
strongly from the demand side, the so-called societal environments of new products selection
(Deuten, Rip & Jelsma 1997), and only to a less extent from business, regulation and product
1 The White Paper on a Roadmap to a Single European Transport Area (COM(2011) 144 final) stresses the need to create a Single European Railway Area (SERA) to achieve a more competitive and resource-efficient transport system capable to address the existent societal issues as here listed. 2 For simplification those manufactures will be here referred as Alstom and Siemens.

!!
2
development. This societal demand is challenging incumbents in railways to include resulting new
demands and requirements into the product development processes of high-speed trains.
This relatively recent societal pressure for digitalization, through the exponential growth and use
of mobile technology, has coincided with other industrial factors that are driving the directions of
transport innovation in the established European railway industry. These factors include high
expectations concerning the almost “certain” expansion of high-speed train networks, an increase
in international passenger traffic and, most relevant for this dissertation, the market uptake of new
technologies coming out from a decade of EU and member states stimulus3.
Notorious is the case of the latest generation of high-speed trains in Europe, the AGV4 and ICE-
350E, and their embedded sub-systems (train-control-command systems, coupling systems,
interiors, telematics and advanced materials, sub-systems interfaces, only to refer to some of the
examples)5.
The AGV and ICE-350E were designed and developed in response to the changing regulatory and
business environments from 2001 impacted by the European Commission initiative known as the
White Paper for Transport (COM (2001) 370). However, these trains were still far from including
digitalization in their design revealing a lack of exposure to and knowledge about the first signs of
the digital pressures of today.
At the time of development of the AGV and ICE-350E, the business environment was favoring the
emergence of economies of scale and entrance of new private train operators in competition with
incumbents, to provide market liberalization, interoperable networks and opening of infrastructure
access.
Also, the new regulatory requirements introduced in a sequence of railway-packages placed a heavy
focus on the integration of the different national systems across Europe. The vehicles had to be
3 EU and Member States investments since 2001 to 2014 added more than 6,000 km of high-speed track to the 1,000 km in 1990 on which trains travel at 250kph or above. Much more is under construction or planned (see UIC map in Annex 1). In December 2015 a new line from Leipzig to Erfurt was inaugurated (123km-long). A Milan-Brescia service is to begin during 2016 (39 km of high-speed track to be added). By 2017 four new French lines will come into service linking Bordeaux, Rennes, Strasbourg and Montpellier. The EU also plans to finance a €4.5 billion fast-rail link between Estonia, Latvia, Lithuania and Poland. Retrieved from http://www.economist.com/news/business/21638109-high-speed-networks-are-spreading-fast-face-rising-competition-problems-down-line see also https://en.wikipedia.org/wiki/High-speed_rail_in_Europe 4 AGV, Automotrice à Grand Vitesse, manufactured by the French firm Alstom presented in 2008 the European high-speed train in its true sense since it incorporates the results of a number of flagship European projects and also it was the first train developed to meet not a specific order from a train operator but to meet a new regulatory environment. Retrieved from link http://en.wikipedia.org/wiki/Automotrice_%C3%A0_grande_vitesse#Customers, date 11.03.2015. 5 This dissertation focus on vehicles only (rolling stock and its components). Excluded are other parts of the high-speed train system as infrastructure and signaling which have their own technologies and decision-making routines.

!!
3
capable of running in a trans-European high-speed network that was set to become modular,
interoperable, sustainable and safe.
In response the European high-speed train supply chain aligned in different collaborative research
projects such as MODTRAIN (European Commission, 2006a, p.336-338), EUDD (European
Commission, 2006a, p.330-332) and SAFEINTERIORS (European Commission, 2006a, p.414-
416) with financial support via the European Commission Framework Programme for Research
(EC FP). These and others projects represent a total budget of roughly 267 Million EUR6 of funding
by the European Commission allocated to railways between 2002 and 2013.
Manufacturers pushed for the technology development of their high-speed train platforms TGV and
ICE into standardised ones, beyond individual customer orders. They aimed to result in off-the-
shelf vehicles. A true novelty in this industry.
This way the AGV and the ICE-350E when introduced to the market, in 2008 and 2006 respectively,
integrated many of the results from those and other collaborative projects.
The market-uptake of these trains was however much lower than initial expectations. Alstom had
to wait approximately four years to deliver 25 units of the AGV to the private operator from Italy
NTV7, with no further orders since8. As for Siemens, it started suffering from increasing technology
capability pressure from the Chinese competitor CSR Qingdao Sifang, which itself resulted from a
previous decade worth of massive expansion of the Chinese high-speed network.
Manufacturers point the finger to the dominant conservative business culture of European railways.
Incumbent train operators were resistant to the opening of the market and to regulatory integration
(OECD, 2013). In addition, new emergent markets demonstrated a preference for lower cost trains
6 The budget here referred correspond to the sum of the EC funding allocated to rail, being EUR 117 Million in FP6 2002-2006 plus EUR 150 Million in FP7 2006-2013 retrieved from the link http://ec.europa.eu/research/transport/rail/index_en.htm (14.03.2016). 7 NTV (Nouvo Transporto Viaggiatore) is the Italian private high-speed train operator. Retrieved from link http://en.wikipedia.org/wiki/Automotrice_%C3%A0_grande_vitesse#Customers, date 11.03.2015. 8 Retrieved from link http://www.globalrailnews.com/2014/04/08/ntv-gains-access-to-roma-termini/, date 26.09.2014.

!!
4
from China. The most critical voices9 said that new technological solutions resulting from European
research projects did not manage more than a disappointing 30% of leverage effect 10,11.
To overcome these challenges, the railway industry, led by the train manufacturers, are now
promoting a new governance structure for the various European research projects with the Joint
Undertaking SHIFT2RAIL12. It focusses on technological demonstrators and is reviewing the
mandate of ERRAC Technology Platform13.
What seems to be left out from initiatives like SHIFT2RAIL and from developments such as AGV
and ICE-350E is the recent surge of a digitally empowered society which has specific expectations,
requirements and needs. Whilst the digital society is surging ahead, high-speed train industry is
rapidly being left behind14. Following this train metaphor, will innovation in the high-speed trains
take a different route and perhaps crash into these demands much further down the line? Or can
anticipation and integration of these new design requirements be included in the innovation
processes?
As it will be demonstrated, despite the industry’s initial steps in making the necessary connections
with the digital society and address their new emergent needs, they are still oriented towards
promoting image and marketing of high-speed trains. Secondary appears to be their interest
integrating this new phenomenon in the technology development process of the trains.
9 ERRAC questions in one of its reports if the research projects funded by the European Commission in the past years, representing millions of Euros of investment, have been actually useful or relevant. Sourced from ERRAC report working group six WG06, 2010. Retrieved from link www.errac.org/spip.php?article25 date 5.03.2013. 10 When enquired ERRAC WG06 by email (2 June 2014) the same figures were referred: “the percentage of successful projects in Europe (meaning EU part financed research) are around 30%; In Australia about 20%; In north America about 40%. All deals with collective partly governmental financed. The main reason for the poor figures are the complete lack of business perspective in creating ideas”. 11 European Commission, DG MOVE, Council Land Transport Working Party, Brussels 22 January 2014. Retrieved from link http://www.belspo.be/registration/shift2rail/SHIFT%C2%B2RAIL-O.%20Coppens-Brussels-021714.ppt date 26.09.2014. 12 SHIFT2RAIL (also S2R JU) was launched by the Council Regulation (EU) No. 642/2014 of 6 June 2014 extending to research and development funding prototyping and large-scale demonstration activities. The European Commission in its impact assessment refers that SHIFT2RAIL is justified because of “(…) the market uptake and impact of EU rail research and development projects under previous framework programmes has often been low and slow (…)” (COM(2013)922 final) Links http://ec.europa.eu/transport/modes/rail/shift2rail_en.htm and http://eur-lex.europa.eu/legal-content/EN/TXT/PDF/?uri=CELEX:52013SC0535&from=EN retrieved 11.03.2015. 13 www.errac.org 14 At the UIC 9th World Congress on High Speed Rail 2015 in Tokyo railways reflected the first signs of awareness on the disruptive power of digital society and ICT, in particular with the interventions of Rachel Picard, CEO, SNCF Voyages. According to Mrs Picard “digital society revolution” is triggering railways transition into a new technological era (…). In the last 15 years railways made a transition from the hardware into software era, entering today into the socialware, with the connected objects resulting in an exponential acceleration. She further states that this will open future fields of ICT application for railways as in vehicle/infrastructure interaction, maintenance and customer relations. But, as she continues, if for the automotive sector the response is already there with the automated vehicles, for railways one does not yet know what will happen (recorded round table 2, day 7/9/2015, time 10:35-12:45, ref. new record Picard 2/9/2015, from -2:13/00:11:58). Link www.uic-highspeed2015.com .
!!
5
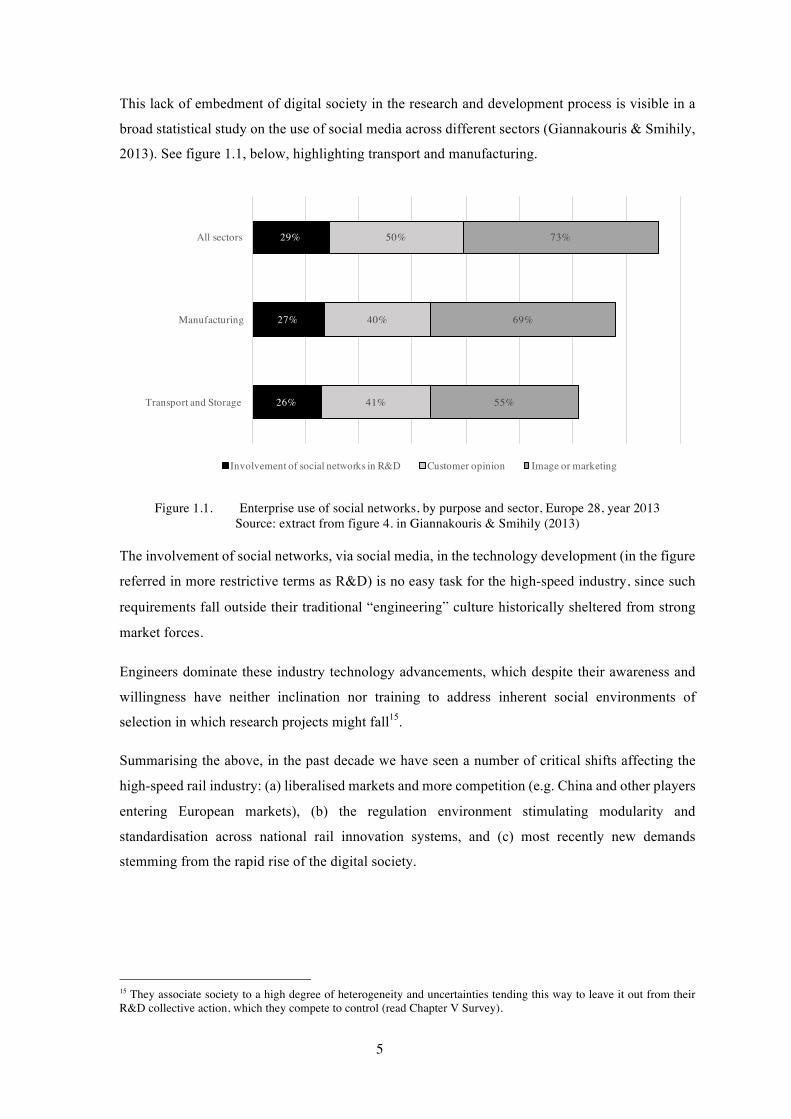
This lack of embedment of digital society in the research and development process is visible in a
broad statistical study on the use of social media across different sectors (Giannakouris & Smihily,
2013). See figure 1.1, below, highlighting transport and manufacturing.
!
Figure 1.1. Enterprise use of social networks, by purpose and sector, Europe 28, year 2013 Source: extract from figure 4. in Giannakouris & Smihily (2013)
The involvement of social networks, via social media, in the technology development (in the figure
referred in more restrictive terms as R&D) is no easy task for the high-speed industry, since such
requirements fall outside their traditional “engineering” culture historically sheltered from strong
market forces.
Engineers dominate these industry technology advancements, which despite their awareness and
willingness have neither inclination nor training to address inherent social environments of
selection in which research projects might fall15.
Summarising the above, in the past decade we have seen a number of critical shifts affecting the
high-speed rail industry: (a) liberalised markets and more competition (e.g. China and other players
entering European markets), (b) the regulation environment stimulating modularity and
standardisation across national rail innovation systems, and (c) most recently new demands
stemming from the rapid rise of the digital society.
15 They associate society to a high degree of heterogeneity and uncertainties tending this way to leave it out from their R&D collective action, which they compete to control (read Chapter V Survey).
26%
27%
29%
41%
40%
50%
55%
69%
73%
Transport and Storage
Manufacturing
All sectors
Involvement of social networks in R&D Customer opinion Image or marketing

!!
6
1.2. The dissertation
With this dissertation I attempt to respond to two central questions: (i) How the industry might be
falling short in embedding society in their product creation? and (ii) Why there is potential for
improvement?
To accomplish it I shall mobilise an approach of Technology Assessment (TA) which includes at
its heart design thinking. The approach called Constructive Technology Assessment (CTA)
introduces the tools for anticipating the societal embedding of new technologies and integrating
this knowledge into the design of products (Deuten et al 1997, Van Merkerk 2007, Robinson 2010),
or, at a broader meso-level, the design of industries (Robinson and Boon 2014, Parandian 2012,
Mazzucato and Robinson 2015). CTA often involves orchestrating collective anticipation and
design (Robinson 2010, te Kulve 2011, Krabbenborg 2013) when elaborating strategies, visions
and research projects.
Phrased in another way, in the words of Jens Schippl (interview protocol J. Schippl 20.5.2015) TA
provides the methodology for better anticipating potential development in the full system and for
embedding the resulting technology options within.
According to Douglas K. R. Robinson (interview protocol D. K. R. Robinson 20.5.2015) social
dialogue requires tailored interactions to suite the technology readiness level in which the research
project is (to optimise the value from such interaction) and move towards stabilizing design
trajectories by reviewing societal requirements at early stages of the research projects (as means to
reduce uncertainty and risk). This requires draw on a third party societal expertise to overcome
referred dilemmas of promotion and control.
It is this flavour of CTA I will draw upon, what Schippl and Robinson have called the system (or
meso) level of industries and railway systems16 .
As Robinson (2010)17, I shall locate my CTA at the meso-level of public-private consortia
anticipating and coordinating an evolving industry. I thus focus on providing strategic intelligence
for public-private consortia, such as SHIFT2RAIL (the Joint Undertaking for Rail Research and
Innovation), with an eye to creating increased reflexivity about societal dimensions.
In this dissertation, I build my argument from a case-based analysis on how societal embedding
“occurs” in the technology development process of two reference high-speed trains; the AGV and
16 As opposed to CTA applied to individual projects or technologies fields (see lab-on-a-chip work by Rutger van Merkerk 2007, or supply chain analysis by Alireza Parandian 2012). 17 Robinson (2010) located his work in nanotechnology R&D consortia to explore emerging and evolving value chains.

!!
7
the ICE-350E. To do this, I investigate both train manufacturers18 technological strategy
formulation and implementation activity, the high-speed train technology transitions over time and
at multiple scales of stakeholders’ dynamics. I also study the way that industry formulates their
visions of the future. To further ground and support these analyses, I have conducted a survey to
corroborate my findings in the other elements of my study.
I conclude this dissertation with a reflection on what can be learned from analysing societal
embedding in high-speed train development, and propose ways for supporting integrating ideas of
societal embedding into the agenda setting process, in particular when railways elaborate their
visions and undertake R&D projects in view of a next generation of high-speed trains.
1.3. Structure
This dissertation is the result of a journey. As I have already mentioned, my starting point was to
find evidences of societal embedding in railway technology development processes (or product
development processes) by doing case studies of the latest generation of high-speed trains, the AGV
and the ICE-350E (chapter IV). The goal is to present at the end reflexive19 guidelines for
embedding societal factors in new technology development processes in railways.
Intermediate steps between the start and finish of this journey include the study of Alstom and
Siemens strategic intelligence in the development process of the AGV and ICE-350E (section 4.1);
the vehicles technology transitions (section 4.2) and their multi-level perspectives (section 4.3.); as
well as industry future formulations on desirable futures (section 4.4).
Each of those steps intercepts and follows the footsteps of an emerging path of a constructivist
perspective of technology assessment – starting with Arie Rip (Schot and Rip 1997, Deuten, Rip &
Jelsma, 1997, and te Kulve & Rip, 2011), one of Rip’s students, Douglas K.R. Robinson (Robinson
& Propp, 2008, Robinson 2010, Robinson and Boon 2014), as well as Jens Schippl (Schippl and
Fleischer, 2012). My dissertation reflects not only what I have absorbed from their various papers
but also the multiple personal contacts and the privilege of joint works. I have also sourced from
scholars in innovation studies and evolutionary theories of (socio-)technical change such as Nelson
& Winter (1977), Dosi (1982), Pavitt (1984), Castellacci (2008), Lichtenthaler (2004) and Geels
(2002).
18 Alstom Transport and Siemens Mobility 19 “Reflexive” here refers to CTA reflexivity, as explained in Rip and Robinson (2013), from interactions and mutual learnings occurring between the broaden of institutions and approaches in society and sectors in society during co-developments of technologies.
!!
8
My preliminary findings were corroborated through a broad online-survey to the industry segments
of the value chain (Chapter V), with 74 stakeholders replying to the survey covering rolling stock
manufacturers, component suppliers, certification bodies, academia, governments and users.
Moreover, in parallel, the preliminary findings for each of the steps were presented at several
conferences held between 2010 and 2016. The most significant ones were PACITA 201320 and
201521, the JRC Conference on Future-Oriented Technology Analysis (FTA) 201422, the UIC World
Congress on High Speed Rail 201523, TRA 201624 and WCRR 201625. Those were organised
separately by the two different communities in which my research is anchored: the railway
conferences where actors from the railways supply chain were present, and the technology
assessment and foresight conferences where academia and R&D policy makers were present.
Those same preliminary finding have also been subject to scrutiny from anonymous peer reviewers
when published in conferences proceedings, peer-reviewed journals and as chapters in books. The
most relevant ones are the International Journal of Railway Technology26 and PACITA 2012
book27. These discussions and reviews have provided valuable inputs into the writing of this
dissertation as well as in my evolving research programme during this PhD.
Finally, findings are presented in Chapter VI. Conclusions, recommendations and impacts are found
in Chapter VII. The bibliography is given at the end.
20 Links http://pacita.strast.cz/en/conference/programme/ix-assessing-sustainable-mobility and http://pacita.strast.cz/files/prezentace/session_ix_moretto.pdf 21 Link http://berlinconference.pacitaproject.eu/preso/ 22 Link https://ec.europa.eu/jrc/en/event/site/fta2014 23 Link http://www.uic-highspeed2015.com/about/index.html 24 Link http://www.traconference.eu/programme/overall-programme/ 25 Link http://www.wcrr2016.org/ 26 Link http://www.ctresources.info/aresults.html?q=S.+Martins+Moretto 27 Link http://www.pacitaproject.eu/documentation/

!!
9
II. THEORETICAL REFERENCES
2.1. Technology Assessment
2.1.1. Multiple strands
The dissertation both mobilises and contributes to Technology Assessment (TA).. The rapid
growth of ever complex technologies and the increased visibility of technology’s role in
shaping society place TA as an approach of a number of fields in social science and humanities,
management and strategy.
Because of the ever increasing recognition on the importance of technological innovation on
the economy and on society, TA is becoming more mainstream, more formalised and more
embedded in institutions such as parliaments and firms28.
Common to all TA strands, it is the wish to reduce the potential negative consequences of new
and emerging technologies and to optimise the uptake and socio-economic impacts of new
technologies (Schot and Rip 1997, Rip 2001).
Rip (2001, p.15512:15515, based on Schot & Rip 1997) points to another important role of TA,
not entirely shared across all stands, that they contribute to the “(...) early identification and
assessment of eventual impacts of technology change and applications in order to reduce the
human and social costs of handling a technology in society compared when this happens by
trial-and-error”.
TA does have a history and one can describe it in terms of generations of TA.
-! First generation of TA strands
The first generation of TA strands was policy-oriented emerging in the 1960’s in the U.S. with
the advent of the Office of Technology Assessment (OTA). At the time U.S. Congress saw the
need to have advanced warnings on the potential societal, economic, ethical and political effects
of new technologies in the U.S. and elsewhere. Thus, TA has its origins in providing useful
intelligence for public policy.
28 For the history of TA refer to Smits and Leyten (1991), van den Ende et al. (1998), Smits et al. (2008).

!!
10
Around that period of time, TA was defined as “the name for a class of policy studies which
attempt to look at the widest possible scope of impacts in society of the introduction of a new
technology. Its goal was to inform the policy process by putting before the decision maker an
analysed set of options, alternatives and consequences” (Coates 1976, p139).
However, as Tran et al. (2008) pointed out, at the end of the 1970s, American industry picked
up the term of TA quite independently of the OTA definition, more in line with notions of
technology readiness assessment. This industry stand used TA as a means of anticipating what
was going on outside of their firm to see how it affected their own activities (as opposed to
anticipating the effect of their technology developments on markets and society).
Moreover, whilst in the U.S. the Congress dissolved OTA in 1995, policy oriented TA was
heterogeneously spreading across a number of public agencies in European countries with
participatory traditions such as in Germany, Denmark, Switzerland and the Netherlands (Van
den Ende et al. 1998, Rip 2001).
A branch of such activities can be defined as parliamentary TA. TAMI report (2004) and most
recently PACITA project (2011-2015)29 have been important European projects focusing
efforts on sharing best practices and harmonising parliamentary technology assessment, in spite
of the vast heterogeneity.
-! Second generation of TA strands
The second generation of TA strands, emerging in the mid-1980s and early 1990’s, shows an
uptake of TA by non-governmental institutions. In this wave, firms begun applying TA along
the same lines as the original OTA thrust, as opposed to TA as technology readiness assessment
(see earlier).
Here, TA acts as a tool in supporting strategies up to and including agenda building (Rip 2001,
Van Eijnshoven 1997). During this time, TA became process oriented developing tools and
methodologies targeted at shaping new technology developments in line with emerging
demands.
The variety of methods applied ranged from trend exploration and Delphi, through to
interventions in innovation networks and consensus meetings (Van den Ende et al. 1998).
It is no coincidence that this 2nd generation of TA coincided with the emergence of
biotechnology, which began to raise societal concerns in the mid-80s well into the 90s and
29 Link http://www.pacitaproject.eu/

!!
11
2000s, especially with regards to genetically modified organisms. A pressure to anticipate on
societal impacts became a pressing issue, which shaped motivations and approaches to TA.
Shedding light on the blurry borders between the different TA strands, Rip (2001) offers a
typology of TA including: “Public Service TA”, “TA for public arena”, “TA to specific
sectors”, “TA in firms and technological institutes” and “Constructive Technology
Assessment”.
Böhle & Moniz (2015), building on such a typology, characterise TA in terms of the different
spheres in which those strands might fall: the “Policy sphere”, dealing with the “political
system”; the “Public sphere” referring to “civil society” and the “Science & Technology
sphere” dealing with the research and innovation system.
2.1.2. A problem of selection
Rip, Böhle and Moniz suggest that the applicable sphere to the cases or problems under analysis
depends to whom TA addresses. It can be either decision-makers part of the policy system, civil
society from the public sphere or firms and non-governmental bodies from the innovation
system (Böhle & Moniz, 2015).
The authors contribute to overcome TA strands tenue boundaries. TA have multiplied in strands
often overlapping, making it no small task for those who wish selecting the appropriate one30.
To capture, and further develop, these authors efforts, I have created a simplified taxonomy on
the main TA strands, shown below in figure 2.2, which can help locate them.
30 In my research for literature on types of TA strands I also found Van den Ende et al. (1998) presenting a classification and methods. However I rather followed Rip (2001). This because Van den Ende et al. (1998) refers as types of approaches “Strategy Making” aside to CTA which is itself part of strategy making (in “supporting specific actors or groups of actors in formulating their (…) strategy” as said in van den Ende et al.1998, p.8:5-21). Van den Ende et al. (1998) also indicate backcasting as a type of TA, where in fact it seems to me rather a methodology. CTA in transport uses backcasting as in Schippl (STOA 2008). Moreover, Rip (2001) does not refer to this paper (van den Ende et al., 1998) following a classification based on the TA addressee. Nevertheless, Van den Ende et al. (1998) provide a useful explanation on the origins of TA and present a very comprehensive structure of TA methods.

!!
12
Figure 2.2. Simplified taxonomy on the main TA strands Source: Böhle & Moniz (2015) chart combined with Rip (2001)
Figure 2.2 shows, for each approach, their relevant aspects in terms of scope, the dominant
methods, key authors and, where possible, reference practitioners similar to those referred to in
Rip (2001); matched with the spheres concerned (from Böhle & Moniz, 2015) 31.
The spheres in figure 2.2 can be broadly describe as follows:
a)! Policy
In Policy predominate Public Service TA (Rip, 2001) and Parliamentary TA (Böhle & Moniz,
2015). These strands support decision making about projects or programmes that have a strong
technological component (Rip, 2001). The main addressees are National or European
Parliaments or governments including the European Commission. The main instruments used
are public consultations and sometimes involve TA participatory methods. Theoretical
references in the U.S. are Wood (1997) drawing on methods used by the now defunct OTA,
while in Europe are the TAMI reports and PACITA project, where methods, including
consensus conferences, guide TA applications by organisations such as the ETPA network,
31 In figure 2.2, for simplification reasons, I only refer to the main strands and intentionally exclude sub-strands that exist or are emerging (such as real-time TA).
Public Sphere
Civil Society
TA
TA
Public Service TA
Parliamentary TA
Policy making and policy decision about projects or broad programmes with strong technological component.
National/European Parliaments and/or national governments / European Commission.
Tend to include participatory TA methods.
Method: Public consultations.
USA OTA Wood (1997) ETPA network,
STOA (European parliament, TAB (Germany) TA-SWISS, ITA (Austria), The Danish Board of Technology, The Norwegian Board of Technology, The Rathenau Instituut TAMI Project PACITA Project
TA to specific sectors
Instrument to determine the acceptability of a project, or a new product or technological option in relation to the public interest in, or policies about, the sector (excludes wider societal impacts).
Method: Impact statements; Agenda building.
TA for public arena
Articulation and building agendas for handling new technologies in society.
Informed consultation processes to reach agreement on the value of new technology.
Method: Participatory methods, agenda building Guston and Bimber (1997)
TA in firms and technological institutes
Used as an input to strategy development and public-interest assessment.
Method: Future Oriented Analysis
ITAS-KIT, Hastbacka & Greenwald (1994)
Constructive Technology Assessment CTA
Focus on the wider interaction of actors from early stage of technology
Also addresses strategic niche-management.
Deuten, Rip, Jelsma (1997) NanoNed Technology Platform (Dutch).
Oriented towards mapping the future of technological developments and their value to the firm or institute.
development process though (“joint-products”) anticipation (“socio-technical scenarios”).!
Method: socio-technical scenarios
TA HEALTH, Environment!

!!
13
STOA (European parliament, TAB (Germany), TA-SWISS, ITA (Austria), the Danish Board
of Technology32, the Norwegian Board of Technology and the Rathenau Instituut.
b)! Public
In Public, concerning civil society, is dominant TA for public arenas (Rip, 2001). It refers to
the articulation and building of agendas for handling new technologies in society; it also
includes informed consensus processes to reach agreement on the value of a new technology
(Joss and Durant 1995), Kilver 1995). Here it is mainly used for participatory methods and
agenda building. Illustrative references include Guston and Bimber 1997, Guston 1999, Russell
et al. 2010.
c)! Science & Technology
In Science & Technology, concerning the innovation system, are included TA to specific sectors,
TA in firms and technology institutes and Constructive Technology Assessment.
TA to specific sectors, refers to instruments designed to determine the acceptability of a project,
new product or technological option, in relation to the public interest in, or policies about, the
sector, excluding wider societal impacts (Rip 2001). The most used methods include impact
statements and agenda building. These concern the formal strands of Health TA or Environment
TA.
TA in firms and technology institutes is oriented towards mapping the future of technological
developments and assessing (prospectively) their value to the firm or institute. Used as an input
into strategy development and public interest assessment. Recurrent method is Future Oriented
Analysis. Reference authors include Hastbacka & Greenwald (1994).
Constructive Technology Assessment (CTA) focuses on the wider interaction of the broad range
of actors (including society) that have a “stake” in the development, deployment and use of
new technology fields (Robinson 2010). CTA has often focused on technology fields in their
early stage of emergence, where uncertainty reigns and there is a need to both characterize
potential future developments and also to construct assessment approaches collectively to
assess these new developments (Robinson 2010). Originally developed in the Netherlands,
early 1980s, particularly through a dedicated programme organized by the national
nanotechnology initiative NanoNed (Rip and van Lente 2013), CTA has experienced periods
32 The Danish Board of Technology, after resources were withdrawn, has now become a foundation. Link http://www.tekno.dk/?lang=en

!!
14
of intense development and application, interspersed with periods of dormancy. In the past three
or so years, CTA has been less visible.
2.2. Constructive Technology Assessment
2.2.1. Selected strand and its implications
For this dissertation, the subject of the technology assessment is the high-speed train value
chain, and thus, a TA exercise falling within the innovation system part of the science &
technology sphere of railways.
The research problem presented in the introduction, concerns the strategic management of the
extended high speed rail value chain to include the broad of society at the early stage of
development of high speed vehicles. Thus, a TA to direct and shape ongoing developments of
emerging technologies.
From the families of TA that I have covered, the most relevant strand turns out to be CTA,
which emphasises anticipation and the feeding back of insights from TA activities into the
design of new technologies themselves by broaden of networks of actors. CTA is not done after
technologies have emerged, but is based on anticipation, reflection and intervention – highly
suited for strategic management of rapidly evolving (and uncertain) value chains.
The case of high speed trains looks both at the product level (the high-speed train vehicle) and
at the system level (the high-speed train value chain and infrastructures that support it).
CTA applies several methods which serve two main purposes (Schot and Rip 1997) the one of
analysis making (e.g. aiming at setting the scene through problem identification, phase in which
is the technological development is, actors involved and their expectations) and practice-
oriented (e.g. interventions allowing for future technology formulations embedding society).
CTA is informed by analysis of the dynamics of technical change, tracing the evolution of the
innovation journeys of new product developments (Van de Ven 1999, Rip 2012) or multi-level
perspective (Geels 2002, Robinson 2009) and multi-actor dynamics (Parandian 2012).
Common methods and approaches applied in CTA include socio-technical scenarios developed
by Robinson and Rip (see Rip and te Kulve 2008, Robinson 2009, Parandian and Rip 2013),
expectations mapping (van Merkerk and Robinson 2006), open-ended roadmapping (Robinson
et al. 2013), multi-stakeholder workshops (Krabbenborg 2013), bridging events (as formulated
by Robinson 2010, p13) and backcasting (Schippl 2008).

!!
15
For the case of high speed trains, the process of product creation (in the words of Deuten, Rip
& Jelsma 1997) is about strategic management of research projects through alignment (Schot
& Rip 1997) of all the stakeholders in the supply chain (or network), including their visions on
what the product should be. This requires a special attention to collective agenda building.
Therefore, in this dissertation, a CTA approach should be taken as to analyse the emergence of
the digital society in railways, the process of embedding society in the collective agenda
building and understand the anticipation of the technology areas most propitious for societal
embedding.
CTA will be mobilised in different ways in this dissertation. For example, in chapters IV and
V I apply CTA methodologies for the analyses of high speed trains and supply chain, whereas
in chapter VII I shift to CTA practice oriented to formulate my recommendations. Such in ways
that can be of use to strategic future-oriented formulations by the collective of stakeholders in
SHIFT2RAIL33.
2.2.2. Distinctive theoretical elements
The CTA strand34 extends the application of TA to a broader audience than public agencies,
such as firms, consultancies, non-governmental organizations, research centers and others. The
methods may change, but the motivation remains the same: to “assess the promise, and the
profit, of new technological options, and/or carry out a broad version of cost-benefit analysis,
sometimes also including risks” (Rip 2001, p.15512:15515).
CTA places an emphasis on the impact of the new technology as a joint product of interactions
between the broad range of actors involved; their connections beyond traditional stakeholders
in the supply chain towards a broader more extended mix of public and private actors.
In this multi-actor and multi-dimensional space, CTA aims can be located at supporting agenda
building through reflexive anticipation and assessment of new emerging technologies and the
innovation pathways that may emerge.
33 I chose to investigate the innovation system of high speed trains with a view to improving the design, development and embedding of high speed trains into society. However, another useful activity may have been in the other spheres shown in figure 2.2. For example, if the target audience would have been national or European governments or public agencies falling within the policy sphere, Parliamentary TA would have been a worthwhile strand. Parliamentary TA would have required an analysis on the formulation of policies for transport and research, including policy visions for a high-speed rail network, in Europe or in a specific country corridor. That would have required the analysis of the strategic intelligence of governments and public agencies in the process of regulatory forcing towards technology solutions (see Schot & Rip 1996, p.258:268). 34 In a skype interview I made to A. Rip by Skype he stated that CTA is not a theory nor a discipline but a perspective of TA.

!!
16
In this way, CTA can be used as a strategy support system, identifying key issues and elements
that may be important for decision making during early stages in the technology development
process (Rip 2001, p.15512:15515, Parandian 2013, van den Ende et al. 1998).
The extended network described in CTA has an actor role element (including more actors with
a variety of roles the process of technology emergence) and a chronological element, bringing
together actors from upstream, midstream and downstream in the value chain. Thus CTA can
be said to, temporarily, remove the chronological bias in terms of the power to shape
technological development, including its directions and adaptations (Van den Ende et al. 1998,
p.11:20).
In this way CTA has often been positioned as a way to “(…) overcome the institutionalised
division of labour between promotion and control of technology” (Rip & Te Kulve 2013),
known as Collingridge dilemma35.
It addresses with the inherent asymmetries between “impactors” (insiders, at the source of the
technology) and “impactees” (outsiders, impacted by the technology) with heterogeneous
powers, timings and interests and expectations (Parandian 201236, Robinson 2010, p. 114:1-
523).
CTA proposes doing it by bridging events between impactors and impactees (Parandian 2012),
orchestrated by a third party, to probe each other’s assessment worlds37 (supply-chain plus38),
and ultimately arrive to socio-technological scenarios of aligned visions (see figure 2.3 below).
35 Collingridge (1980) refers to: Information problem - at early stage of technology development is difficult to see their impacts and; Control power - control or change is difficult when the technology become widely disseminated and adopted. 36 Impactors detain the technological knowhow from design as they introduce it. They are insiders, focus on technological development, and know little about the outside. While Impactees acknowledge the technology only when it matures, so they are followers. They are outsiders, but relevant in the technology adoption and diffusion. They have different knowledge, expectations and interests. 37 Robinson (2010, p.114:1-523). 38 To which Robinson’s doctoral work have greatly contributed (Robinson 2012). See also paper Robinson (2009).

!!
17
ZONE OF COMPARATIVE SELECTION
ZONE OF ENACTMENT
ad-hoc bridging events when insiders and outsiders probe each others’ “realities”
shifts in the locus of assessment
enactment cycle •!scenario thinking •!small sample •!particularistic focus •!narrow criteria
selection cycle •!comparative thinking •!large sample •!generalistic focus •!broad criteria
common assessment criteria as comparative selectors attempt to regulate
several assessment criteria as enactors attempt to make sense of their approaches
time
!Figure 2.3. Enactment and Selection adapted by Robinson (2010) from Garud and Ahlstrom
(1997) Source: Robinson (2010, p.13)
Those scenarios not only take actors initiatives and interactions into account but also their
surroundings. They are not used to extrapolate particular developments into future (control
function) but rather to enhance the flexibility of stakeholders regarding their strategic decisions
(mutual-learnings), which in its turn modulate technology developments (Robinson 2010, p.
114:1-523).
As referred in Parandian (2012) overall “it is not the aim of CTA to push societal learning
process as a remedy for all evils, but to draw attention to the dimension of learning in
interaction, in particular in heterogeneous interactions”. This is done, in the words of Robinson
(2010), through CTA methodology tailored for supporting “better informed designs of "future
working worlds" which are learned by theory, but are empirically well grounded so they are
usable by decision makers”.
I take Robinson perspective on the goals of CTA as a core part of my dissertation.
2.2.3. Origins and applications
To understand the theory it is important to know its origins and applications. The main reference
I could find was in Schot and Rip (1997) work, making the argument for CTA in the broader
world of TA.

!!
18
In retrospect CTA has its origins in the modern TA strands in the field of science and technology
studies. It was introduced by the initiative of the Dutch government in the mid of the 1980’s39,
to broaden decision-making about science and technology in society, with societal aspects
becoming an additional design criteria.
At that time Netherlands Organization of Technology Assessment (NOTA), and now called the
Rathenau Institute, was established to implement CTA. According to Schot and Rip (1996,
p.253:268) two branches evolved. One oriented to public opinion (in Parliament) through public
debate, and yet very attached to the first wave of TA; The other, which I have been referring
to, on the “social learning how to handle technology” through devoting 1% of the funding in
every technological innovation simulation program to TA studies40.
The first branch of CTA was even subject to a policy document in the Organization for the
Economic Cooperation and Development (OECD) during 1988 related to the externalities of
technological changes (Schot & Rip 1996, p.254).
It is however the last referred CTA branch that is of the most relevance for my dissertation,
which initially appeared during the 1990’s as a component of the Dutch national programme
for biotechnology and in 2005 in the Dutch national nanotechnology consortium, NanoNed41
(te Kulve & Rip 2011). CTA methods have contributed to the agenda setting of future
technologies and mapping the value chain capabilities to bring the technologies to the market.
Schot and Rip (1997, p.253:268) refer also to the project PRISMA42, held at the end of the
1990’s, focusing on CTA deployment in “demonstration projects” in the field of environmental
friendly technologies in firms and other organizations. In this project developers simulate the
introduction of environmentally friendly technologies in firms and other organizations.
Also, during the early 1990’s, the authors refer to the Dutch institute for consumers (SWOKA)
project called “Future Images for Consumers” aiming at incorporating consumers and their
wishes into design processes. “The procedure consisted of a process of interactive meetings in
which room is created for discussions and negotiations on design criteria and visions of both
producers and consumers” (Schot and Rip 1996, p.253-254:268).
39 That emerged three decades after the first generation of TA was introduced in the U.S.A. in the 1950’s and 1960’s. 40 This could well be case for the new governance of research and development being set by SHIFT2RAIL. 41 NanoNed is a consortium of Dutch research institutes working in nanoscience and nanotechnology. Rip (2005) explains how constructive technology assessment was implemented in drug delivery and molecular machines. 42 For more information Schot and Rip (1997) and Dleieman and De Hoo (1993)

!!
19
The method was also extended in 1996 to the Dutch programme on sustainable technologies
(DTO) on the introduction of novel protein food replacing meat in the diet. CTA contributed to
identify consumer requirements and identification of new market opportunities.
CTA is not restricted to the Netherlands. Also in Denmark CTA emerged quite early, during
1980’s, reflecting this country tradition on public involvement. Monitoring it has been since
the Danish TA organization. CTA is also found, but not labelled as such, in other countries such
as Norway and Germany. CTA was introduced initially in the fields of telecoms and waste
disposals respectively (see references in Schot and Rip, 1997, p.254:268). In Germany CTA
has been mainly focusing on future technology assessment aiming at early awareness on the
risks and implications of future technologies and less on the technology development process
(most recent work Grin & Grunwald 2000, Grunwald 2011).
Since early 2000’s CTA is in the process of building its own identity across Europe, addressing
specific sectors or emerging niche technologies. There is an emancipation effort from the new
generation of authors applying the theory from the first authors at the origin of its concepts and
models.
Contributing to it is the new generation of “academics at the micro-level addressing better
designs for technologies through bringing more people and more dynamics” (source Robinson,
2015.05.15). They have been mainly applying CTA on open-ended technologies such as lab-
on-a-chip technology (van Merkerk and Robinson 2006, van Merkerk 2007), nano-drug
delivery (Robinson 2010, p. 303-348:1-523), tele-health systems for chronic diseases (Elwyn
et al. 2012), body area networks (Parandian 2012), deep brain stimulation devices (Robinson
et al. 2013) along with many other applications. But also matured technologies such as micro-
grid on energy distribution (see Manuel Baumman forthcoming dissertation with a view to the
German market) and railways (with this dissertation focusing on high-speed trains in Europe).
CTA has been as well part of research and development projects (Weil et al. 2014). Relevant
projects are TRANSFORUM43 (Schippl 2008) dealing with strategic formulation in transports
and the previously referred PACITA project44.
2.2.4. Theoretical aspects of relevance for the high-speed train industry
A central article is the one of Deuten, Rip & Jelsma (1997) on the “Societal Embedding and
Product Creation Management” where the authors advocate that, for new technologies to
43 http://www.transforum-project.eu/. 44 Link http://www.pacitaproject.eu/.

!!
20
succeed, there is a requirement to go beyond market uptake through the inclusion of societal
embedding processes as part of the product development process.
The authors in this paper address exactly the challenges currently faced by the high-speed train
industry as described in the introduction: the one of reorienting the promotion and control of
new technologies (dealing with business and regulatory environments) to the one of mutual-
learning and orchestration (dealing with the wider society).
Deuten, Rip & Jelsma (1997), inspired by actor-network theory (Callon 1986, 1992), state that
new technologies have to pass through different environments of selection, such as business,
regulation and wider society. Each scenario addresses different elements accordingly the one
of “integration” (business), “admissibility” (regulations) and “acceptance” (wider society).
These authors continue by saying that firms mostly tend to follow a sequential approach to
those environments and; once their technology developments reach the wider society it might
be too late to accommodate interests and values45.
The authors suggest that to succeed, firms approach to the different environments of selection
must be simultaneous and integrated in its product chain process from early stages of
technological development. There is also the need to know at which stage the development of
new technological products is. They call this the “extended innovation journey” (Deuten, Rip
& Jelsma 1997, p. 136:148). It includes the traditional “Product Construction Process” (PCP)
plus “Societal Embedding in Product Construction” (SEPC).
These authors recognise the “dilemma” it creates as it increases uncertainty in the product
development project through adding more factors (and more actors) and thus revealing much
of the previously unattended gaps46 between the technology developers and the wider world of
technology adopters.
Deuten, Rip and Jelsma (1997) suggest that firms should not fear market failure of new
technologies as this leads them to take anticipatory actions for promotion and for control of
acceptance of their new technology that are uncontrollable anyway. The authors rather suggest
that firms should adopt an approach of mutual learning through actions of anticipation mapping
what each actor can bring to the development.
In view, “orchestration” events, mediated by a CTA practitioner, should promote the necessary
pre-engagements which in its turn result in “scenarios of embedding”. Also referred as “socio-
technical scenarios” (Robinson 2009) they articulate how the new product can be embedded in
45 Deuten, Rip & Jelsma (1997) refer as wider society actor’s consumer organisations, environmental groups, animal protection organisations and also public opinion leaders, media, independent scientists. It should also include social networks connected by mobile telecommunications, not existing at the time the authors wrote the paper. 46 This gap refers to differences in knowledge, interests and culture.

!!
21
its environment; they “bridge” actors’ gaps in strategies & interests and they promote necessary
alignments (Paradian 2012).
The authors state that today, technological products are dominated by complex systems of
which no one has total knowledge, so firms are not alone. “Extended innovation journeys”
through societal embedding widens the collective action of product creation to societal actors,
bringing to the learning process new ways of viewing problems and finding solutions.
The authors (citing Argyris & Schöln 1997) refer that the learning process is continuous and
can happen in a single or double loop. They associate single loop to a control approach from
technology developers and double loop to the one of orchestration. Stakeholders’ openness to
the collective learning depends on their position in the supply chain.
This way once society is recognised as a stakeholder they get a constructive role in product
creation process (PCP), e.g. they become part in the creation of value. However, they also note
that the way firms manage “extended innovation journeys” depends on their positioning in the
supply chain, where each location in the supply chain exerts different learning pressures. The
authors state that practitioners of CTA have to address it.
2.2.5. Theoretical elements developed
Science and Technology Studies (STS) scholars, as well as engineers, have built on Deuten et
al. (1997) by practicing and reflecting on the different elements of the approach of broadening
product development processes.
Geels (2002) for example, addresses sector-level technological dynamics mobilising the work
of Callon et al. (1992). He develops a multi-level framework for analysing the technology
transitions, where this framework produces visualisations that are useful in showing the context
of the technology development and assisting in the anticipation of its future developments. He
demonstrates the framework through examining the ship industry and most recently electric
vehicles (Geels et al. 2011) in similar ways as Nelson & Winter (1977) did for aeronautics.
Robinson and Propp (2008) and Van Merkerk and Robinson (2006) extend Geels approach
through understanding the dynamics of path emergence, fuelled by promises and shaping the
future evolutions of the field. They show that such analyses can feed into engagements with
stakeholders, such as in CTA workshops (Krabbenborg 2013).
Te Kulve and Rip (2011) further reflect on how preparing pre-engagements between
technological stakeholders and civil society (i.e. “timely” analysis and structuring of actors
interactions) can be used for CTA purposes. The key point is that organizing and moderating
stakeholder interactions is not enough. The author calls for the substance in those events, which

!!
22
requires preparation. The authors suggest pre-engagements to be moderated by third party
agents (to avoid partiality) to address the heterogeneity between stakeholders and society. He
does that by examining the emergence of nanotechnologies in food packaging sector.
In their PhD theses, Parandian (2012) and Robinson (2010) look at processes that will enable
CTA to help bridge the gap between technology development and use. They suggest, following
Garud and Rappa (1994) an approach to bridge between the heterogeneous perspectives and
different timings enactors (proposing new options / push) and selectors (respond to promises /
compare). The approach aims at pulling the heterogeneous actors in the same direction.
Most recently Justen et al. (2014) reflect on the inclusion of unknown-unknowns stemming
from societal environment in futures analysis. This type of activity is visible elsewhere in
management studies of design (Agogué et al. 2012) where structured assessment of unknown
unknowns is supported as a management tool in the development of new products for new
industries.
2.2.6. Contribution
Rather than CTA applied to a niche technology steaming form science, amidst speculation on
open-ended futures, my PhD dissertation attempts to bring CTA into a mature technological
field of application: the one of high-speed trains innovation system. The incremental nature of
high-speed trains presents much more stable futures than many of the previous CTA studies
prevailing in the field of nanotechnology. In this way, this dissertation contributes to broaden
societal reflexive CTA into demonstration CTA.
In doing so, I will seek to verify the main propositions put forward by, of what is a central paper
in my dissertation, Deuten, Rip and Jelsma (1997) for the high-speed train technology
development process.

!!
23
III. METHODOLOGY
This chapter presents the research questions and propositions as well as the methodology
applied as to assure the scientific quality of results.
3.1. Research questions and propositions
The present research study arises from railway’s discussions at European forums on the urge in
the “market uptake” of new collective technological developments, in particular for high-speed
trains. From observations, discussions often overlook the magnitude of societal constraints for
effective market embedding of high speed trains, which becomes even more visible when taking
into consideration the emergent direct pressures arising with the exponential digitalization of
society. Such escalation in relevance, if one considers that those debates are at the heart of the
SHIFT2RAIL47 joint undertaking, sets a demand for new governance of research and
development in this area from which will result a “new wave” of collaborative research projects,
much more market oriented and potentially much more social oriented.
In order to positively contribute to this trend, it appears relevant the understanding on i) How
the industry might be falling short in considering embedding in society as part of their product
development processes? and ii) How can it be improved? Before however, it is imperative to
establish the relationship between the high-speed trains and TA as the theoretical framework of
my studies.
RQ.1. What is the relationship between the high-speed train technology and TA?
P.1. Proposition – Rail and TA intercepts at the level of actors’ technological decision making
(technology selection).
TA refers to “informed decision making” on new technologies as the ones being inclusive of
society. Those decisions are made by governments, non-governmental institutions,
corporations alone or in networks. Each one is covered by different TA strands.
Since 2001 high-speed train manufacturers became fully responsible for designing,
manufacturing and commercialising the vehicles in collaboration with their network of
suppliers.
47 New governance structure for collective research and development launched in 2014. Link http://shift2rail.org/
!!
24
TA presented different strands which selection depends on the addressee (governments, non-
governmental institutions, firms, or their networks) and level of application (policy-making,
science and technology, public engagements).
This proposition requires literature review on the various TA strands as to find the best suit.
RQ.2. How the industry might be falling short in embedding society in their product
development?
P.2. Proposition – The case of the AGV and the ICE-350E, as explained in the introduction,
appears relevant as the disappointing commercialisation of those trains after years of collective
investments in their development has raised concerns in the railway industry on the market
uptake of their new technologies, while fast emergent digitalisation of society is imposing new
challenges.
Here justifies a case study analysis. The object of analysis being therefore the development
process of those trains. The unit of analysis are their manufacturers, Alstom and Siemens, and
collective of stakeholders’ part in the technological chain.
CTA offers different layers for analysing the industry practices, which unfolds into four sub-
research questions (SRQ.2.1, SRQ.2.2, SRQ.2.3, SRQ.2.4):
SRQ.2.1. What happens in terms of innovation journey?
P.2.1. Proposition – the AGV and the ICE-350E innovation journeys are about technological
decisions made by Alstom and Siemens strategic intelligence feed from the aligned network of
actors involved in the supply chain (as a collective exercise). Deuten, Rip, Jelsma (1997) model
on social embedding in “new product creation” offer the analytical framework to understand if
and how Alstom and Siemens address society within their product development processes.
SRQ.2.2. What has been the evolution in time?
P.2.2. Proposition – Strategic decision-making has not always existed in the development of
high-speed trains. It is relevant to understand how decision-making in high-speed trains has
evolved over time focusing in the societal element. Geels (2002) offers a model to study
decision-making in the technological transitions. There is a strong link with the historical
analysis.
SRQ2.3. What happens in terms of multi-level perspectives?
P.2.3. Proposition - The AGV and ICE-350E resulted from the alignment of the different
technological perspectives from the various stakeholders. Geels and Schot (2007) analytical

!!
25
framework can be also applied here as to map stakeholders’ perspectives and at which level
alignments occur.
SRQ.2.4. What happens in terms of strategic formulations of future technological paths?
P.2.4. Proposition - The AGV and ICE-350E cases reveal the agendas of the industry in their
collective visions and roadmaps. Robinson and Propp (2008) classification method offers a
contribution for a taxonomy of those agendas.
RQ.3. Who in the R&D process has the propensity to address societal embedding?
P.2.3. Proposition – The actors that have a stake (direct or indirect decision makers) in the
technological development of the AGV and ICE-350E do not have the same approach towards
societal embedding. It is therefore relevant to conduct a survey around this issue build around
the previous findings.
RQ.4. What recommendations can be made?
P.4. Proposition – The industry led joint initiative SHIFT2RAIL most likely continues
overlooking society, which perhaps leads to a lack in the necessary instruments and expertise
to address societal demands. The necessary instruments can be found in practice oriented
exercises conducted under the banner of CTA (te Kulve and Rip 2011, Robinson 2010, Paradian
2012, Krabbenborg 2013, Justen et al. 2014). Here, ideas and approaches should be speculated
about the contribution that CTA in practice can bring to the high-speed train development
process.
3.2. Research framework
Constructive Technology Assessment (CTA) provided the analytical framework used to
structure the research plan, figure 3.4 below.

!!
26
Figure 3.4. Research plan
Before addressing the central research question it was necessary to understand the relation
between high-speed trains and Technology Assessment (RQ.1 in figure 3.4). With that purpose
literature review was conducted on Technology Assessment theory, strands, concepts and
models centred around decision-making.
The second step was to verify railway stakeholders approach towards societal embedding in the
decision-making process during the technology development (RQ.2 in figure 3.4). The study
was narrowed to the case of the high-speed train vehicles, the AGV manufactured by Alstom
and the ICE-350E by Siemens, because they absorb the highest volume of investment in
research.
Constructive Technology Assessment analytical framework lead to subdividing the central
research question in sub-questions about the high-speed trains innovation journey, technology
transitions, multi-level alignments and future formulations.
In terms of innovation journey (RQ.2.1 in figure 3.4) it was necessary to review literature on
the strategic function of technology assessment as support to decision-making and collect
empirical data on the manufacturers technology organisational structure and vehicles
technology development process. Such data was found in Alstom and Siemens reports plus in
other EU research projects. For the modulation and visualisation of the data collected support
was found in Deuten et al. (1997), Lichtenthaler (2004), Pavitt (1984) and Castellacci (2008).
In its turn, the study of the high-speed trains technology transitions (RQ.2.2 in figure 3.3),
required data collection mainly found in UIC reports and website, conference presentations and
history records. The modulation of data was based on Geels (2002a).
RQ.2How the rail industry might be falling short in embedding society in their
product development?(verify actors in technology selection dimensions)
Literature review on theories, concepts and models: • TA strands
Literature review: (i) Theoretical references TA at strategy level; (ii)Collection of empirical data from Alstom and Siemens reports, EU research projects; (iii) modulation from Deuten et al (1997); Lichtenthaler (2004); Pavitt (1984); Castellacci (2008)
RQ.1What is the relation between high-speed
trains technology and TA?
SRQ.2.1Innovation Journey?
Literature review: modulation Geels (2002); data collection from UIC reports, conferences and historical papers
SRQ.2.2Technology Transitions?
Literature review: modulation Geels(2002) and Geelsand Schot (2007).Empirical data from UNIFE and UIC reports, stakeholders EU/ position papers collectively and individually
SRQ.2.3Multilevel-
perspective?
Literature review: modulation Robinson & Propp(2011); data collection from future visions reports (ex.: ERRAC, STOA, UNIFE, CER/UIC, Siemens and Alstom, etc)
Survey: (i) strategic innovation management Schilling 2010; (ii) societal embedding from Deuten et al (1997), Geels(2002), Robinson & Propp (2008)
SRQ.2.4Futures
formulations?
RQ.3Which actor has propensity for
societal embedding?
Case study on High-Speed Trains technology development processAlstom AGV & Siemens ICE-350E
Decision-making

!!
27
The map on the multi-level perspectives of the various stakeholders involved in the AGV and
ICE-350E technology development process (RQ.2.3 in figure 3.4) was constructed from the
empirical data retrieved from UNIFE and UIC reports as well as stakeholders position papers
at European level. The modulation of the data was made recurring mainly to Geels (2002) and
Geels and Schot (2007).
The study on railways future formulations covering high-speed trains (RQ.2.4 in figure 3.4)
addressed the methodologies used in the various reports produced by the railway industry (as
from ERRAC, CER/UIC, UNIFE and Siemens) and the European institutions (the European
Commission and the European Parliament). The classification of found reports referred to
Robinson and Propp (2011) classification method.
A survey was conducted to extend the study to the broaden high-speed trains supply chain as
to identify which actor in the AGV and ICE-350E technology development process had
propensity for societal embedding while it was an instrument to validate the findings from
previous (RQ.2.5 in figure 3.4). The survey was constructed in two parts. The first mainly
referring to innovation management practices as found in Schilling (2010); and the second from
societal embedding elements as mentioned by Deuten et al (1997), Geels (2002), Robinson and
Propp (2008).
The construction of knowledge in this process was therefore a combination of the two dominant
epistemological currents dominant in social sciences being, according to Hennen, Weinstein
and Foard (2009), the interpretivism (qualitative), and positivism (quantitative). First by
applying qualitative techniques such as observations, interviewing and documentary analysis.
Here, Miles and Hubernam (1994) offered reference analytical tools and Yin (2003) a guidance
in conducting case studies for research purposes. On the quantitative side was applied a survey
as to extend the study to the broad of actors and validate results.


!!
29
IV. THE CASES OF THE AGV AND ICE-350E
DEVELOPMENT PROCESS
In this part of the dissertation I verify the propositions referred in the methodology chapter by
applying Constructive Technology Assessment strand framework of analysis to the reference
cases, the high-speed trains AGV and ICE-350E.
Therefore, it is covered in chapter 4.1. Alstom and Siemens strategic intelligence (section 4.1),
technological transitions from one generation of trains to the next one (section 4.2), actors
multi-level perspective during the development process (section 4.3) and future strategic
formulation (section 4.4).
This chapter follows a structure replicated in the sequent chapters: introduction, theoretical
reference, analysis and findings. Results in this and following chapters will be later validated
by the survey.

!!
30
4.1. Strategic intelligence
4.1.1. Introduction
Today design, development, assembly and supply of high-speed trains are in hands of the
European manufacturers48. They are renewed private multinationals whom are market oriented
in developing the trains in collaborative networks of suppliers49. Their technology management
rely more than ever on strategic innovation management tools to decode the complex system in
which they need to integrate their technologies under liberalised market conditions50.
This resulted from the previous reference to the European Commission regulatory push exerted
since 2001 on member states to make high-speed rail the backbone of a unified European long-
distance passenger transport system51. The main determinants for this directive were the grand
challenges of European foreign oil dependency, traffic congestion, climate change and
territorial integration yet far from the direct social pressures of today.
Looking at public data from the European Commission (2010) and the International Union for
Railways (2010a, 2010b, 2015) one can actually recognize the dimension that railways
revitalization took.
Over 40% of the European passenger transport traffic for medium-length distances is now made
by high-speed trains. The commercial speed has reached a maximum of about 300 km/h for the
majority of installed systems (Germany, Italy, United Kingdom), 310 km/h in Spain and
320km/h in France52.
48 The definition of High-Speed Train is found in the Council Directive 96/48: “A high-speed train is a train capable of reaching speeds of over 200 km/h on upgraded conventional lines and of over 250 km/h on new lines designed specifically for high speeds”. They are train set mainly serving cross border international routes. See also Campus et al. (2006, p.5-8:21). 49 Their origins are found in the under-invested metalwork-engineering firms dependent from their national governments. 50 Cadet, 2011. 51 Several initiatives on the liberalisation of the railway market took place, stating in 1991 with the Directive 91/440/EEC giving open access operations on railway lines by companies other than those that own the rail infrastructure, and later in 2001 with the European White Paper on Transport COM(2001)370 setting the strategy revitalising railways though an integrated trans-European network opened to competition, implemented so far by a sequence of four railway packages (2001, 2004, 2007 and 2013) and assessed by the EC Road Map COM(2011)144 also launching the Single European Railway Area (SERA). 52 Source: Wikipedia, http://en.wikipedia.org/wiki/High-speed_rail, viewed in August 20th, 2012. For a comparative exercise one could also refer to the Japanese case. The Shinkansen reaches also 300 km/h (Wikipedia, http://en.wikipedia.org/wiki/N700_Series_Shinkansen, viewed in October 31st, 2012) and by the end of 2012 the commercial speed will be 320 km/h ("Tohoku Shinkansen Speed Increase: Phased speed increase after the extension to Shin-Aomori Station". East Japan Railway Company. 6 November 2007. Retrieved October 31st, 2012).

!!
31
Europe doubled its fleet from approximately 620 operating units in 2000, to 1.243 in 2010,
becoming the largest fleet in the world only to be overpassed in 2014 by China exponential
growth; its dedicated network increased from less then 3.000km in 2000, to 6.214km in 2008
(European Commission, 2010), with an additional 8.705km planned (International Union of
Railways 2010a, 2010b).
The number of passengers on all existing lines (Germany, Belgium, Spain, France, Holland,
Italy and the United Kingdom) increased from 15.2 billion passengers per km in 1990 to 92.33
billion in 2008 (European Commission, 2010), a figure that is expected to triplicate by 2025
(International Union of Railways 2010a, 2010b).
In a circuit of major European cities (Paris, London, Amsterdam, Koln, Frankfurt and Brussels)
from 1989 to 2009, travelling time has been reduced from 4 hours and 2 minutes to 2 hours and
24 minutes53 - a 38% decrease (European Commission, 2010).
Moreover, there were the business and organizational reforms opening the industry to
competition and making it vulnerable to cost-pressures and customer demands, as well as
shifting the vehicles design, maintenance and R&D from train operators to the manufacturers54.
Besides the new regulatory and business demands, requiring for interoperable, modular and
safe high-speed trains, the industry was confronted in 2001 with issues of environment, safety,
public acceptability and other aspects of “social quality” (to use Schot and Rip1997
terminology).
To comply the rail manufactures were (and still are) investing about 500 million Euro a year in
new developments (not only in high-speed55) from which have resulted the latest generation of
high-speed trains with the ICE-350E in commercial operations since 2006 and the AGV since
2008.
Pressures on returns on investments and mitigation of market failure made their manufacturers
Siemens and Alstom to adopt a strategic management approach in their technological
development, putting aside the often used costly trail-and-error developments56.
53 The biggest reductions have been achieved in the routes London-Brussels (from 4 hours and 52 minutes to 1 hour and 55 minutes, -62%) and London-Paris (from 5 hours and 12 minutes to 2 hour and 15 minutes, -57%), in this case due to the Eurotunnel. Other significant reductions are Paris-Brussels (from 2 hours and 25 minutes to 1 hour and 22 minutes, -43%) and Köln-Frankfurt (from 2 hours and 10 minutes to 1 hour and 10 minutes, -46%). Today it is even possible to travel from Stuttgart to Paris in 3 hours and 41 minutes (source: Deutsche Bahn at http://reiseauskunft.bahn.de/bin/query.exe/d, viewed in June 8th, 2012). 54 Pereira 2011 and Cadet 2011. 55 Pereira 2011. 56 Pereira 2011.

!!
32
As referred already in the introduction, both manufacturers involved the collective of relevant
stakeholders in the supply chain to develop off-the-shelf vehicles capable of running in all
networks under the stimulus of the European Commission and Member States.
According to Pereira (2011) Alstom and Siemens had two main purposes in developing the
existing vehicle platforms TGV and ICE-3 into the AGV and ICE-350E: improve performance
and attractiveness (the last one, including compliance with regulations).
To solve performance problems, the manufactures together with the supply chain targeted
technology developments, for example, those which concern wheel/rail contact fatigue,
design/simulation tools, system integration, materials (lightweight), structures (optimization
and design for manufacture), aerodynamics (noise abatement), mechatronics (wheel/rail,
steering and suspensions).
To foster more specific research tailored to achieve defined outcomes to make the vehicle
attractive and compliant with the European Commission regulatory reforms and customer new
requirements, the industry targeted technology developments in areas such as energy power,
biomechanics, human/machine interface, environmental friendly technologies, safety and
comfort.
As I will further refer to in section 4.1.2 of this same chapter, Technology Assessment
constructivists (Deuten, Rip and Jelsma, 1997) argue that it is mainly on the attractiveness /
“acceptance from users” aspects of technology development that societal embedding occurs,
linked to the other dimensions as business and regulations.
At the time of development of AGV and ICE-350E social movements were limited to non-
governmental organizations, civic movements or opinion-makers influencing mainly policy-
making and regulations on specific interests. While travelers’ mobile connection to social
networks as we know it today emerged after those high-speed trains entered the market (in 2006
and 2008).
In this section of the dissertation I present the evidences found on the elements of CTA
framework for societal embedding, as constructed in Deuten, Rip, Jelsma (1997), in the various
dimensions of the innovation journeys of the AGV and the ICE-350E from 2001 to 2008.
This way the chapter starts by recalling on the relevant theoretical references covering CTA
analytical framework allowing to identify societal embedding in the technological decision-
making by Alstom and Siemens during the innovation journey of the trains (Section 4.1.2). A
reference is made to the data collection (Section 4.1.3).

!!
33
Societal embedding is then identified in manufacturers’ organisational structure covering
strategic intelligence and surveillance structure (Section 4.1.4) and development dimensions
referring to technology transfer, technological system and decision-making trajectories
(Section 4.1.5). Findings present a summary of the evidences found of societal embedding
(Section 4.1.6).
A final note is to say that although the drastically increasing figures here presented on the
growth of high-speed trains, this market-segment represents no more than 10% of
manufacturers annual turnover and its growth forecast in Europe is steady (Rolland Berger
2014). However high-speed trains are worth to be studied, as it is where the industry makes its
highest efforts embedding high-end technological solutions, due to the speeds the trains reach
subject to tight safety and quality standards.
4.1.2. Strategic function of TA
Literature refers to Technology Assessment (TA) as part in the strategic innovation
management of the technology promoters57. Kuhlmann et al. (1999) is the first conceptualizing
on TA function within “strategic intelligence”.
According to Kuhlmann TA providing the means to decode complex innovation systems is the
equivalent to other strategic intelligence forms, namely, technology forecasting, technology
foresight, evaluation and road mapping (Kuhlmann et al. 1999, Kuhlmann 2001).
Smits et al. (2008) further elaborates on TA distinctive elements from other forms such as: its
focus on decision-making support (instead of technology developments as in forecasting and
road mapping); problem orientation (as opposed to early-warning functions, or evaluation as in
foresight); and intensive interaction with a wide variety of actors.
The strategic function of TA in its turn is built from Schot & Rip (1997) earlier extension from
policy-making to non-governmental institutions. They transposed TA practices from impact
assessment to anticipation from the early stages of the technology development process. See
section 2.2.
Schot & Rip (1997) were responding to the required dialogue between the Dutch emergent
nano-technology firms and interest groups to address inherent societal issues. The authors use
anticipatory methods employing dialogue and early interaction between actors from an early
57 TA community commonly refers to new technologies instead of innovations. I will be referring to both.
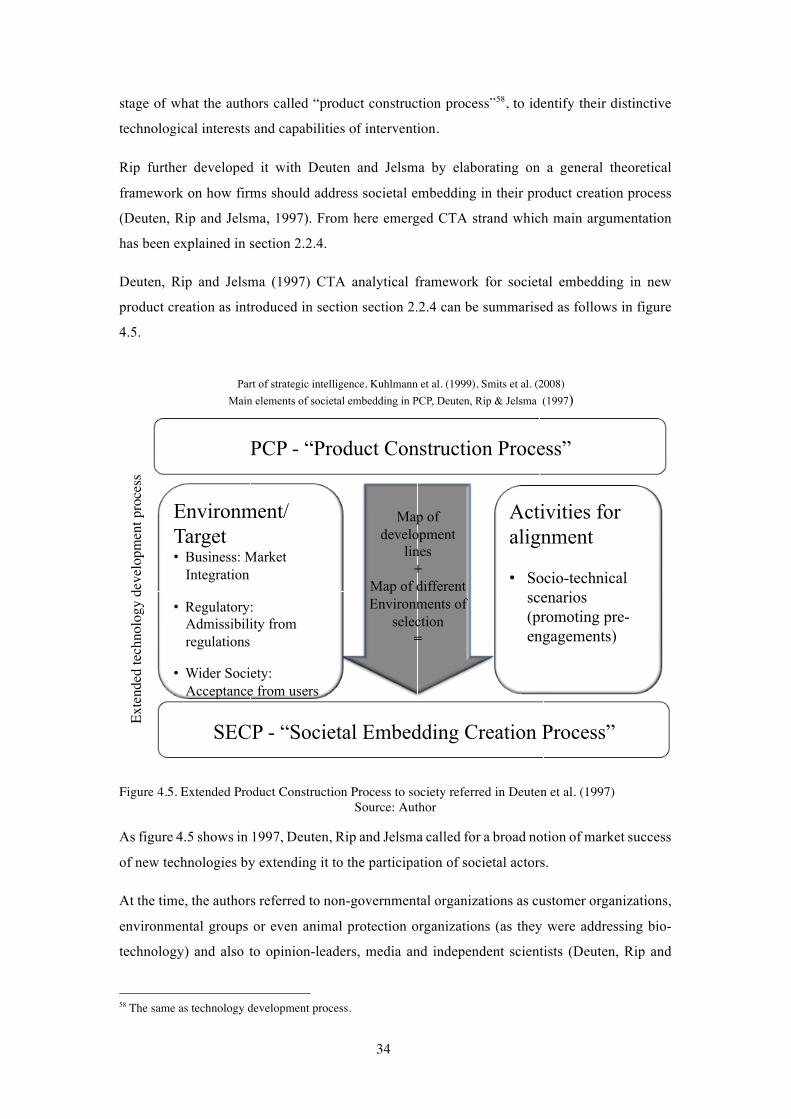
!!
34
stage of what the authors called “product construction process”58, to identify their distinctive
technological interests and capabilities of intervention.
Rip further developed it with Deuten and Jelsma by elaborating on a general theoretical
framework on how firms should address societal embedding in their product creation process
(Deuten, Rip and Jelsma, 1997). From here emerged CTA strand which main argumentation
has been explained in section 2.2.4.
Deuten, Rip and Jelsma (1997) CTA analytical framework for societal embedding in new
product creation as introduced in section section 2.2.4 can be summarised as follows in figure
4.5.
Figure 4.5. Extended Product Construction Process to society referred in Deuten et al. (1997)
Source: Author
As figure 4.5 shows in 1997, Deuten, Rip and Jelsma called for a broad notion of market success
of new technologies by extending it to the participation of societal actors.
At the time, the authors referred to non-governmental organizations as customer organizations,
environmental groups or even animal protection organizations (as they were addressing bio-
technology) and also to opinion-leaders, media and independent scientists (Deuten, Rip and
58 The same as technology development process.
Part of strategic intelligence, Kuhlmann et al. (1999), Smits et al. (2008) Main elements of societal embedding in PCP, Deuten, Rip & Jelsma (1997)
Map of development
lines +
Map of different Environments of
selection =
Environment/Target • Business: Market
Integration
• Regulatory: Admissibility from regulations
• Wider Society: Acceptance from users
Activities for alignment
• Socio-technical scenarios (promoting pre-engagements)
SECP - “Societal Embedding Creation Process”
PCP - “Product Construction Process”
Exte
nded
tech
nolo
gy d
evel
opm
ent p
roce
ss !

!!
35
Jelsma 1997). As it was also said for the AGV and ICE-350E, by the time these authors wrote
their paper digital social networks as we know today did not existed yet.
Figure 4.5 left column represents Deuten et al. (1997) recommendation stating that new
products to succeed have to meet three main targets each corresponding to specific
environments of selection: market integration part of the business environment, admissibility
with regulations in regulatory environment, and acceptance from users found in wider societal
environment.
The central arrow in figure 4.5, refers to the product development process where the authors
suggest that the firms should have a clear map on their product development organizational
lines, as to know at which stage in the development process the technology is, while
simultaneously addressing the three environments of selection.
The authors recognise that such simultaneous approaches towards the environments of selection
causes the Collingridge Dilema (already explained in section 2.2.4) in particular when
involving wider society from early stage of the development process.
As shown in the left column in Figure 4.5, the authors suggest activities for alignments which
promotes pre-engagements, supported by what was latter called by Te Kulve and Rip (2011)
socio-technical scenarios. Those scenarios should be constructed on bridging events
orchestrated by a third party to which Paradian (thesis 2012) have contributed.
Finally, I would like also to introduce here Lichtenthaler (2004) that, despite not being linked
to CTA authors, makes a very comprehensive structure on the technological surveillance frame
that feeds strategic intelligence, by studding corporations including Siemens.
4.1.3. Data collection
The findings here presented result from the analysis of data collected from the industry annual
reports and empirical data from informal interviews with privileged informers from Alstom and
Siemens, sector associations (UNIFE and UIC) and academia.
It also results from my previous research work in Boavida, Cabrita and Moretto (2010) and
Boavida and Moretto (2011). The first on the analysis of the decision-making process of the
high-speed train project in Portugal and the other on the innovation assessment on a railway
multinational subsidiary in Portugal.
It was observed that Alstom and Siemens presented similar patterns in the way they addressed
society during the development process of their trains AGV and the ICE-350E. Therefore,

!!
36
distinction will only be made between them in the presentation of results in the aspects they
differentiate.
4.1.4. Organisational structure
Societal embedding, if to be found in the AGV and ICE-350E technological development
process, is at the level of strategic intelligence (Schot and Rip, 1997) feed by their technology
surveillance structures (as conceptualised by Lichtenthaler, 2004).
a) Strategic intelligence
From corporate reports within the time period of the technology development of the AGV and
ICE-350E (between 2001 and 2008), strategic intelligence was found as a structured and
hierarchical process, allowing for some degree of informal practices, supported by a series of
instruments such as knowledge platforms and partnerships, networks, R&D projects and
education and training59.
Figure 4.6 below represents a matrix on the different levels of constrains those manufacturers’
strategic intelligence addressed. The circles and arrows highlights the societal elements found.
Figure 4.6. Societal embedding within strategic intelligence
Source: adapted from Moretto et al. (2012)
59 The reasons were mentioned at the introduction (sub-section 4.1.1.).
Product development
Train operator *5
Corporate level
Business level
Market & Technology Supply-chain*6
Instruments Programs*2 Policies*1
Corporate strategy Research Strategy
End-User*4 Transport*3 Economy & Society
STR
ATEG
IC IN
TELL
IGEN
CE
Dec
ode
Com
plex
Sys
tem
Policy & Regulatory level
*4 Journey Time Comfort, Design, Information System
CU
STO
MER
& E
ND
-USE
R
Socio-economic level
FIR
M
SOC
IETA
L EM
BED
DIN
G
*2 Mobility Competiveness
R&D
*3 Connectivity Trade
*1 Oil prices, Congestion, Safety, Territorial integration,
GDP, Environment
*5 Ergonomics, Seats, Capacity, Luggage space, Speed, Material, Weight, Drivers
desk, Environment, Energy, Speed, Comfort, Operation Costs, Availability
*6 Modularity, Standardization
Pred
icta
bilit
y of
futu
re m
arke
ts
Dec
reas
e m
arke
t fai
lure

!!
37
As figure 4.6 illustrates, Alstom and Siemens strategic intelligence aimed to decode complex
innovation systems, functioning as a filter of the different levels of external constraints that can
be grouped at business, policy & regulations and socio-economic levels. Results are then
instrument of management to support decision-making in preparing and implementing the
technology development. Society was found at socio-economic level.
These levels roughly match with the “external environment of selection in which a new product
has to survive”, referred in Deuten, Rip & Jelsma (1997), being “business environment”,
“regulation environment” and “wider society” as introduced before in section 2.2.4.
Corporate level (in figure 4.6 high middle part of the matrix) correspond to “product
development” in Deuten, Rip & Jelsma (1997) internal to the manufacturers organization. Not
referred to by the authors, this level falls outside strategic intelligence. Strategic intelligence
however feeds corporate strategies unfolding in R&D and commercial ones. Strategic
intelligence adds to the firms’ internal constraints (i.e. new product development process
organisational aspects, design, engineering and commercialization). Manufacturers at this level
focus on the internal elements that condition technology decision-making such as cost-
reduction and internal resources.
Coming back to the external constraints, at socio-technical level (in figure 4.6 at the lower
extreme of the matrix) is where wider society constraints were mostly found and addressed by
strategic intelligence. At this level, strategic intelligence aims to decode future transport trends,
in terms of connectivity and trade exchanges for instance, and end-users’ expectations, such as
journey time, comfort, design, and information system.
Societal constraints were also found at policy & regulatory level (in figure 4.6 at the top of the
matrix). The main purpose of strategic intelligence at this level is to filter governments’ policy
drivers, such as decreased oil dependency, climate change and territorial integration, as a mean
to anticipate programmatic and regulatory constraints, (e.g. specific norms targeting noise
reduction or increased safety of high-speed train vehicles and funding to develop technological
solutions). The societal aspects here addressed are demographics, GDP, internet penetration,
etc.
At the business level (in figure 4.6 lower middle part of the matrix), strategic intelligence mostly
filters market and technology constraints and surveys the activity of competitors with no direct
concern for societal aspects. Societal constraints were not found. At this level, manufactures
aim to decode the market structure and anticipate customers’ technical specifications, such as
train capacity and information systems. It is also used to detect new innovation trends within
and outside the sector, for example from component suppliers and knowledge centers.

!!
38
b) Technology surveillance
At organizational level feeding Alstom and Siemens strategic intelligence it was found
technology surveillance agents. They perform monitoring the different levels of constraints just
described, including wider society. They all have a common task: support decision making
(reporting to top management in the headquarters or subsidiary), problem-orientation and
intensive interaction with a wide variety of actors, using formal and informal communication
channels with internal or external information structures.
Deuten, Rip and Jelsma (1997) do not detail on the optimal organizational structure for better
addressing societal embedding in product creation; rather, they limit to mention that managers
are those who perform it and that bridging events between firms and societal actors should be
mediated by external parties. This part of the dissertation can be seen this way as a contribution
to the CTA framework. Here I will be applying Lichtenthaler (2004) technology surveillance
structure. Lichtenthaler’s structure results from his study of a pull of firms across different
sectors, which included Siemens.
From this work resulted figure 4.7 below which aimed at presenting a systematic overview of
technology surveillance agents. From there it will be identified the ones addressing society from
what was observed in Alstom and Siemens.
Technology surveillance agents according to Lichtenthaler (2004) are grouped in sub-structures
ranging from centralized, international, internal and external, which I have positioned in terms
of degree of strategic relevance and degree of openness to collaborative R&D60, as shown in
figure 4.7 below. As for the previous figure, circles and arrows highlight the agents found
dealing with societal aspects.
60 For example, technology surveillance agents at centralized structures such as headquarters deal with strategic relevant technologies for the firms with little openness for collaborative actions are found in figure 6 at the left high corner of the graph.

!!
39
Figure 4.7. Societal embedding and the technology surveillance structure
Source: adapted from Moretto et al. (2012)
- Centralized structures:
What was found for Alstom and Siemens, shown in figure 4.7, manufacturing centers of
excellence and design in core-technology areas were located at the headquarters or at the sites
where the trains were assembled. They combine the “central technology intelligence unit” and
the “central technology acquisition intelligence unit” who look at the business aspects of
technology strategy-making and alliance-management processes such as start-up companies,
university technology transfer and control of R&D projects. They are the higher structure to
which top-management refers to. The instruments they employ are: reporting analysis and
periodic meetings with the other structure forms, mapping of technology developments, R&D
projects, and future exercises such as forecasting, scenario and road mapping. Societal
embedding activities were not found as here agents mainly focus on the technology itself and
its business aspects.
- Internal structures:
Figure 4.7 shows the agents part of manufacturers internal structures as in “networks of internal
informants” in the different departments and subsidiaries spread around the world,
“decentralized technology intelligence units” focus on middle management and non-core
technology areas; additional information channels, such as “scanning structures” at different
locations. Those agents are in most of the cases top-management at subsidiaries. These internal
External expert networks Expert colloquia
Exploratory cooperation
External structures:
Decentralized technology intelligence units
Network of internal informants
Scanning structures
Internal structures:
Headquarters Centralized technology intelligence units and technology acquisition intelligence units
Centralized structures: International structures:
Technology envoy
Home based international intelligence
Listening post
Tech. intelligent units in international R&D centers
Lead users and lead suppliers
stra
tegi
c re
leva
nce
openness to collaborative innovation
!"#$%&'$()%$*+,-"./-."0+ Lichtenthaler (2004)
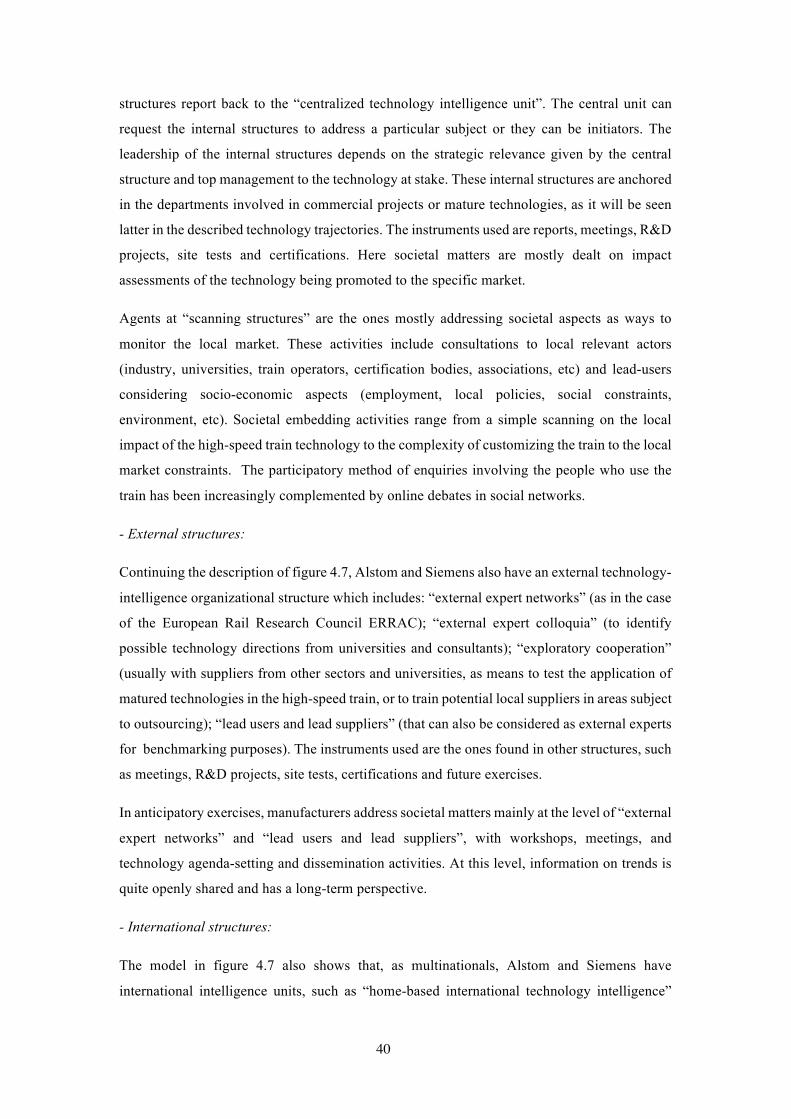
!!
40
structures report back to the “centralized technology intelligence unit”. The central unit can
request the internal structures to address a particular subject or they can be initiators. The
leadership of the internal structures depends on the strategic relevance given by the central
structure and top management to the technology at stake. These internal structures are anchored
in the departments involved in commercial projects or mature technologies, as it will be seen
latter in the described technology trajectories. The instruments used are reports, meetings, R&D
projects, site tests and certifications. Here societal matters are mostly dealt on impact
assessments of the technology being promoted to the specific market.
Agents at “scanning structures” are the ones mostly addressing societal aspects as ways to
monitor the local market. These activities include consultations to local relevant actors
(industry, universities, train operators, certification bodies, associations, etc) and lead-users
considering socio-economic aspects (employment, local policies, social constraints,
environment, etc). Societal embedding activities range from a simple scanning on the local
impact of the high-speed train technology to the complexity of customizing the train to the local
market constraints. The participatory method of enquiries involving the people who use the
train has been increasingly complemented by online debates in social networks.
- External structures:
Continuing the description of figure 4.7, Alstom and Siemens also have an external technology-
intelligence organizational structure which includes: “external expert networks” (as in the case
of the European Rail Research Council ERRAC); “external expert colloquia” (to identify
possible technology directions from universities and consultants); “exploratory cooperation”
(usually with suppliers from other sectors and universities, as means to test the application of
matured technologies in the high-speed train, or to train potential local suppliers in areas subject
to outsourcing); “lead users and lead suppliers” (that can also be considered as external experts
for benchmarking purposes). The instruments used are the ones found in other structures, such
as meetings, R&D projects, site tests, certifications and future exercises.
In anticipatory exercises, manufacturers address societal matters mainly at the level of “external
expert networks” and “lead users and lead suppliers”, with workshops, meetings, and
technology agenda-setting and dissemination activities. At this level, information on trends is
quite openly shared and has a long-term perspective.
- International structures:
The model in figure 4.7 also shows that, as multinationals, Alstom and Siemens have
international intelligence units, such as “home-based international technology intelligence”

!!
41
located at the central intelligence unit, responsible for scanning pro-actively for relevant
information from all the other organizational structures, including visiting those structures
around the world and demanding information, rather than waiting for reports; and “technology
envoys”, which are workers sent to a specific market to build up an external network with local
clients and institutions. International centers of competence and design may also have
technology intelligence units, if installed in a strategic leading market or region of knowledge.
The most common instruments are R&D projects, future scenarios and scanning activities.
Finally, societal embedding is also found at the level of “home-based international technology
intelligence” and “technology envoys”. Despite being oriented towards technology, like the
centralized technology units, their main focus is to support decision-making based on a problem
or project orientation in an intensive interaction with a wide variety of actors at national
(overlapping with “scanning structures”) or regional levels.
4.1.5. Technology development
The main elements of CTA analytical framework on societal embedding (Deuten, Rip and
Jelsma, 1997) can also be found in the different technology development dimensions of the
high-speed trains such as technology transfer patterns, product system and decision-making
trajectories (technological and commercial).
c) Technology transfer
In Alstom and Siemens development of the AGV and ICE-350E it was observed an increase in
outsourcing of technology sub-systems to third-party suppliers in respect to the previous
models, generating new patterns of technology transfer. Pavitt (1984) calls it “innovation
patterns”. Its application to Pavitt (1984) taxonomy as revised by Castellacci (2008) is
illustrated in figure 4.8 below.

!!
42
Figure 4.8. High-speed train multi-actor system
Source: adapted from Castellacci (2008)
Figure 4.8 aims at representing the AGV and ICE-350E supply-chain multi-actor technology
system (their complex and interlinked relations will be described after in figure 4.9). Pavitt
extended taxonomy to services (Castellacci 2008) is here applied to scale each actor’s position
within the value chain and the level of technology content their products and services provide.
The central actor of technology decision making found for the AGV and ICE-350E was the
manufacturers Alstom and Siemens (at the right-center of figure 4.8). They are the technology
integrator (or system integrator) assembling all the components into a vehicle capable of
running on the tracks, knowledgeable on the overall vehicle technological system and less on
its sub-systems as they subdivide. These manufacturers are found at the technology regime
“production of goods”, sub-pattern “scale and volume intensive”. It is an intermediate level of
the supply-chain, of high technology content61.
High-speed train manufacturers are typically large companies, worldwide suppliers, with
Siemens and Alstom sharing the market with few other players. They have a strong national
61 According to Castellacci (2008) at that regime, firms receive technological inputs from “advanced-knowledge providers”, including “specialized suppliers” and “knowledge intensive business services”, while in turn they provide technological outputs (new products), which are used by “infrastructure services”, as well as by “providers of goods and services”.
!

!!
43
identity defended by the headquarters (Boavida and Moretto, 2011). Profitability depends on
their standardized production volume (Castellacci, 2008).
Similar to the automotive industry studied by Castellacci (2008), high-speed manufacturers
have demonstrated capacity to develop new products and processes internally in their R&D
facilities and also in conjunction with suppliers, or clients, or end-users.
Another actor are the component suppliers. It is found in figure 4.8 in the “advanced knowledge
providers” technology regime (Castellacci, 2008), at the bottom of the vertical supply-chain.
Some of these suppliers are from the same sector as the high-speed train manufacturers,
working on an exclusive basis.
Also alike the automotive industry (referred in Castellacci, 2008), with the high-speed trains,
those component suppliers are majorly “specialized suppliers” of equipment and precision
instruments, with a high-level of technological capability, able to meet the tight requirements
imposed.
In a smaller but increasing scale there were also found “knowledge-intensive business services”
(Castellacci, 2008) such as providers of communication and navigation systems on board the
train or providers of virtual maintenance systems. But that is not all, with the greater technology
complexity of the AGV and the ICE-350E in respect to the previous models of trains and
associated costs, it was found that manufacturers expanded the range of contracted services and
relied more on these companies to design sub-systems.
In this same sub-pattern “knowledge-intensive business services” was also found academia in
the form of academic spin-offs or knowledge centers. In the AGV and the ICE-350E
development they become partners in commercial offers as contracted parts for knowledge-
services by both manufacturers and component suppliers.
Another type of actor are train operators. Despite not being referred to in any of Castellacci’s
technology regimes, they easily meet the characteristics of “personal goods and services”, sub-
pattern “supplier dominated services”, at the top-left of the chart in figure 4.8. It corresponds
to a regime with low technology content and receiver of technology from the other described
regimes.
It should be noted that the classification of the actors here presented is not so linear as traces
remain on the sector’s recent history, when the train operator steered the technology
development. That was the case of the first French TGV and the first and second generation of
the German ICE. However, the elements found for the AGV and the ICE-350E indicate that the

!!
44
role of train operators in this respect decreased (International Union of Railways 2010a)62 with
manufacturers taking the greater share.
Figure 4.9, below, adds to the previous figure knowledge exchanges between the identified
actors involved in the AGV and ICE-350E development process. They go beyond the supply
chain to include governments, end-users and educational institutions.
Figure 4.9. Societal embedding within high-speed train multi-actor relations
Source: adapted from Castellacci (2008)
Multi-actor technology relations in the AGV and ICE-350E development comprise mutual
dependencies (conferring complexity) and interactions (interlinking actors). Those
dependencies vary. They were found quite tight between manufacturers and the suppliers. But
they were rather vague between academia and manufacturers and between the academia and
suppliers, subject to discontinuities. Interactions, in its turn, occurred in all directions. They
were conferring dynamics to the different technology regimes. Those interactions were found
to be experimental or established.
The dominant type of multi-actor relations (of dependencies and interactions) was determined
by the stage of technology development: if in a pre-competitive stage (scanning for technology
developments and opportunities as well as for future market needs) or in a competitive stage
(preparing a commercial offer).
62 The reference is for Europe. Japan does not follow this trend as JRC combines in a single company engineering and operations as well as infrastructure and vehicle, developing their technology mainly in-house.
Public goods and services
Infrastructural services
Technology content
Vert
ical
Cha
in
Integrator
Component Supplier
Component Supplier
Integrator
Advanced Knowledge Providers
Train Operator
University University
End-user
Centers of Knowledge
Government
University
Production goods
Low High
!!
45
At pre-competitive stage (pre-tender) the combination of relations between actors revealed a
variable geometry, reflecting vague dependencies and exploratory interactions. Technology
relations were mainly focused at anticipating major technology needs, trends and opportunities
in the medium future. Actors envisaged to anticipate others technology capacity and interests
through collaborative research projects, market analysis and survey their competitors.
Information was flowing quite openly, but its disclosure was selective. Competitors appeared
in the same project, as for instance in collaborative research projects on non-core technologies
or relevant technologies to set common standards.
At the competitive stage of development of the AGV and the ICE-350E, multi-actor relations
and knowledge exchange revealed the form of a pyramid, reflecting tight dependencies and
established interactions. At the top of each pyramid was the consortium leader, e.g. Alstom or
Siemens as technology integrators (or assembly manufacturer). However, a pyramid can also
be lead by two major integrators as in the case of the AVE class S-102*, 2nd series,
manufactured by Talgo and Bombardier or the ETR1000 by Ansaldo and Bombardier, both not
addressed by this study.
The pattern followed by Alstom and Siemens shows that there are as many pyramid formations
as number of bids for a particular call for tender. They integrate actors with demonstrated
capacity of supplying the component or service required by the integrator, meeting tight
specifications at low prices. Relations of mutual-dependencies become dominant here as such
require a major technical and economic commitment from the supplier (in many cases a return
is only seen in a long-term relation).
It was observed for the AGV and ICE-35E that each pyramid leader, Alstom and Siemens
possesses almost all the technologies to bid and usually is the final interface with the customer,
the train operator. Such confers to the leader the ability to acquire the technological knowledge
and solutions required by the customer. The source of information is the tender specifications,
if available, or, if not, anticipated by strategic intelligence. Then, the leader passes the
information to the sub-levels, and those pass it on successively to the subsequent level of
supplier, and so on. The sub-system suppliers’ feedback the consortium leader with specific
know-how and technology solutions they have in their specific fields.
It was observed that Alstom and Siemens, to overcome the complex multi-actor relations as
described, practiced strategic intelligence in the terms already seen. It was observed mainly at
the pre-competitive stage of the technology development process of the AGV and the ICE-
350E.

!!
46
Without explicitly referring to CTA, an informer from the industry referred that strategic
intelligence actions developed at the time were mostly aimed at identifying actors interactions
and potential dependencies as well as unveil technology interests and capabilities; even in the
anticipation of end-users’ expectations, while addressing political and market conditions
(including to a certain extend tender specifications and certification processes); or even to scan
specific technology solutions being developed locally in the medium and long term.
It was found that Alstom and Siemens looked upon universities as a partner in scanning for
societal constraints as they appeared as a direct source of local users’ expectations, also of
emerging disruptive technologies, knowledgeable on local market constraints and they were in
direct relation with the local governments.
Manufacturers also looked up to component suppliers, as they held enquiries to end-users. In
particular, the ones supplying technologies impacting the riding experience of the train as
interiors, comfort and telematics.
I will come back to figure 4.9 when analysing AGV and ICE-350E multi-level perspective
(section 4.3.).
d) Product system
The high-speed train is a vehicle, defined as a highly sophisticated technology product system,
nested in a complex integration of technology sub-system of components, subdividing to arrive
to materials, each requiring different levels of technology intensity63. It was found that
manufacturers attribute different degrees of relevance to each one reflected in their openness to
collaborative developments, as represented in figure 4.10, below.
63 The high-speed trains form what is called a large-scale technology (LST). For further information see Geels (2002), p. 1259] which provides a list of research works on this matter: Hughes (1983, 1987), Mayntz and Hughes (1988), Summerton (1994).
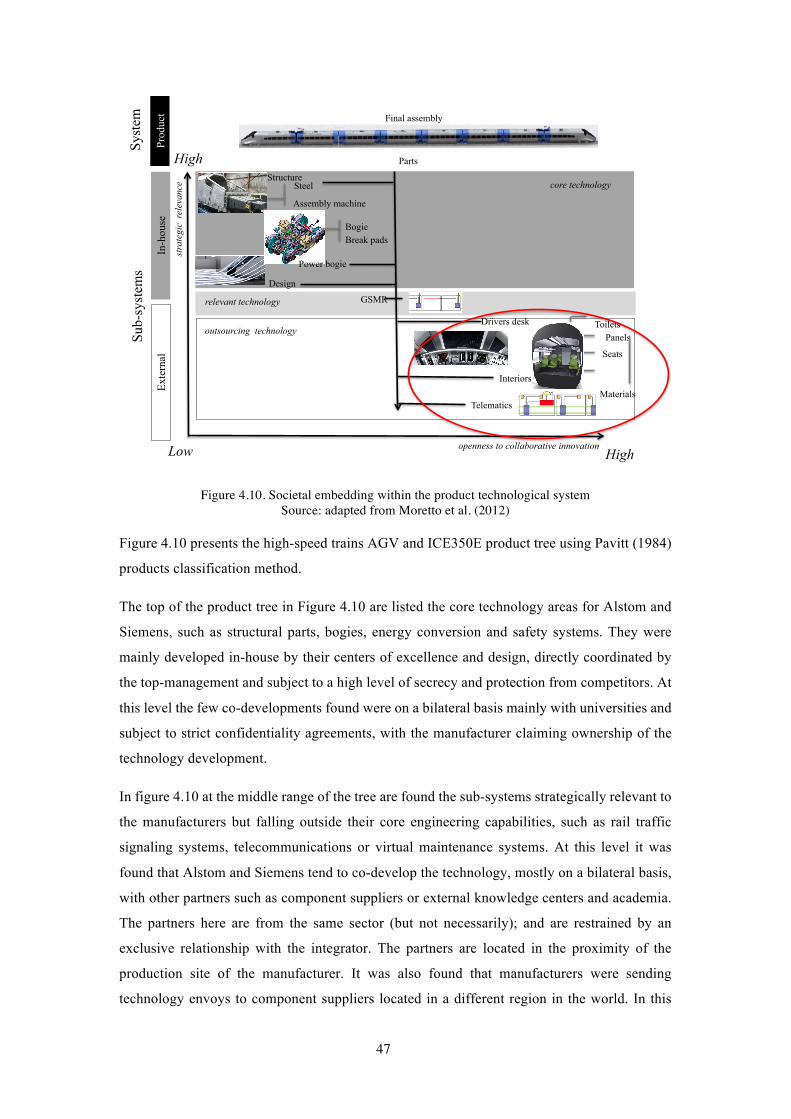
!!
47
Figure 4.10. Societal embedding within the product technological system Source: adapted from Moretto et al. (2012)
Figure 4.10 presents the high-speed trains AGV and ICE350E product tree using Pavitt (1984)
products classification method.
The top of the product tree in Figure 4.10 are listed the core technology areas for Alstom and
Siemens, such as structural parts, bogies, energy conversion and safety systems. They were
mainly developed in-house by their centers of excellence and design, directly coordinated by
the top-management and subject to a high level of secrecy and protection from competitors. At
this level the few co-developments found were on a bilateral basis mainly with universities and
subject to strict confidentiality agreements, with the manufacturer claiming ownership of the
technology development.
In figure 4.10 at the middle range of the tree are found the sub-systems strategically relevant to
the manufacturers but falling outside their core engineering capabilities, such as rail traffic
signaling systems, telecommunications or virtual maintenance systems. At this level it was
found that Alstom and Siemens tend to co-develop the technology, mostly on a bilateral basis,
with other partners such as component suppliers or external knowledge centers and academia.
The partners here are from the same sector (but not necessarily); and are restrained by an
exclusive relationship with the integrator. The partners are located in the proximity of the
production site of the manufacturer. It was also found that manufacturers were sending
technology envoys to component suppliers located in a different region in the world. In this
Exte
rnal
Bogie
Syst
em
Sub-
syst
ems
In-h
ouse
Pr
oduc
t
Design
Interiors
Drivers desk
Structure
Telematics
GSMR
Final assembly
Seats
Panels
Break pads
Steel
Toilets
Assembly machine
Low High
Parts
openness to collaborative innovation
Power bogie
Materials
stra
tegi
c re
leva
nce
High
core technology
relevant technology
outsourcing technology

!!
48
case, the level of co-development was rather low and ownership of end-results tended to be
high. The instruments often used were bilateral confidential agreements between a
manufacturer and a co-developer.
The technology subject to outsourcing, such as interiors and telematics is found in figure 4.10
at the bottom of the tree. For the AGV and the ICE-350E, Alstom and Siemens developed these
technologies quite openly. It was found that for both manufacturers the local branch or special
technology envoy informed the center of excellence and design of a technology development
opportunity. Specific targeted groups were consulted, which included user groups, referred in
CTA societal embedding activities, formed by end-users, customers, certification bodies, as
well as other relevant entities; and collaborative research was promoted. Collaborative research
was used to anticipate specific client needs, local market constraints and end-users’
expectations. Technology development of these sub-systems of the AGV and ICE-350E mainly
occurred in the world region of the potential client, with localy based suppliers. It was found
that the level of co-development was high, and ownership of end-results was low. The
relationship between Alstom and Siemens and their partners was dominated by consortium
agreements on a relative open basis, not subject to exclusivity. In particular cases, such as those
addressing modularization and standardization, technology development was also involving
competitors. So, Alstom and Siemens have been also found in the same R&D projects.
e) Decision-making trajectories
The empirical observation of Alstom and Siemens development practices of the AGV and ICE-
350E contrasted with the elements provided by anonymous informers. It was found that the
development path64 of the high-speed trains followed two different trajectories: technical and
commercial. Both paths involved specific decision-making steps set by internal procedures. For
one of the manufacturers here studied both paths occurred almost simultaneously.
Figures 4.11 and 4.12 describe decision-making steps in each trajectory. The circles in the
figure indicated where elements from CTA societal embedding are found.
- Technical trajectory
64 Technology path here refers to all the stages in the product creation from R&D development to product certification and operation (i.e. innovation journey).

!!
49
Figure 4.11. Societal embedding within the technical trajectory Source: Author
Figure 4.11 represents the AGV and the ICE-350E technical trajectory initiated from a
technology driver. This could have well been, for both Alstom and Siemens, the case of noise
and vibration abatement of the rail cars using innovative sandwich panels. The trajectory starts
in-house at the engineering platform located in one of the centers of excellence or design
specialized in the subject. The engineers worked on two or more technology solutions of
sandwich panels, with one on bio-materials and the other on synthetic materials. Neither Alstom
nor Siemens manufactured the panels. The solution had to be found externally and adapted to
the train.
As mentioned before, both manufacturers consider this type of technology a non-core
technology, subject to outsourcing. It was found that the technology development was carried
out in cooperation with panel suppliers (first-tier) and also at some point involved the materials
suppliers (second-tier). At this stage, the platform of engineers was found in a strategically
located center of excellence or design for one of the train manufacturers and in a geographically
close to the headquarters for the other.
Once one of the technical solutions became mechanically viable, the technical director made a
preliminary SWOT analysis, and a final verification of compliance with the manufacturer
compliance norms. In this case fire and smoke. Once it was approved, the technical director
presented it to the middle management responsible for decision-making, involving other units
such as design, purchase, production operations, marketing, sales and financing. At this level,
decision-making was found to be based on the sum of the different strategies guiding each one
HSV reduction Noise & Vibration OEM development
Engineering platform
Design, development, purchase, operations, marketing, sales, finance
Firm’s strategy (i. knowledge network, cost/benefit)
Top-management Mother-house
Market constraints
Client operator specifications / high-speed train procurement
PRODUCT
PROCESS
TECHNICAL WORK COMPONENT Technological solution (Product, Process)
Assessment PLANT
communication normative
energy
technical administration
Inov. market uptake Commercialization
TECHNOLOGY OUTPUT
Component development
R&D strategy Bio composite
Polyester
Bio-sandwich panels
Synthetic-sandwich panels Compliance
with norms
!"#$%&'&()*!+,-"#.&+)*

!!
50
of the units and on a cost-benefit analysis. In one of the manufacturers it was found a transversal
knowledge network formed internally, multiplying each individual knowledge network from
its individual departments with external partners.
After this stage, the new technology solution, (i.e.: reducing noise and vibration of the high-
speed train car) was no longer a technical matter only. In the case of one of the manufactures it
happened that the final provider turned out not to be the one co-developing the solution selling
the panel.
The new technical solution, accompanied with an interdepartmental analysis (normative, socio-
economic and financial) was then brought to the top management for final approval. It is at this
level that the technical decision-making trajectory crosses with the commercial one.
In figure 4.11 the circles show that at the technical trajectory the engineering platform was
supporting its decision-making using elements provided by CTA’s societal embedding
activities, in which concerned exploratory contacts with local universities and component
suppliers to solve the referred technological problem.
However, within this trajectory, these CTA activities were mainly found to support decision
making at top-management level when confronted with the final decision whether to integrate
or not the technology solution in the train. It was found that top management used such
information from “home-based international intelligent units” to confront the technology
solution developed by its team of engineers with technology mega-trends. It was also found
top-management using the information provided by technology envoys, scanning structures and
external structures, in targeted markets (lead markets or potential markets), to check whether
the technology developed in-house was meeting specific targeted market and expected
procurement specifications.
- Commercial trajectory

!!
51
Figure 4.12. Societal embedding within the commercial trajectory Source: adapted from Moretto et al. (2012)
Figure 4.12 represents the AGV and the ICE-350E commercial trajectory, initiated from a
business opportunity. The case here represented is the Portuguese government announced
intention in 200965 to buy high-speed trains for the planned high-speed rail link between Lisbon
and Madrid, to which both Alstom and Siemens were intending to bid. The Portuguese tender
end-up never taking place as the government suspended public investments in 2012 after
changes in the government and being severely impacted from the global financial crises.
As figure 4.12 shows, the commercial trajectory began at both Alstom and Siemens when the
local subsidiaries’ sales and marketing divisions located close to the customer signalled the
market opportunity to the headquarters. When doing it the subsidiary developed a series of
activities to collect information from local informers which were part of their network on the
technical and socio-economic elements of procurement, such as laws, partnerships and
technical specifications, also counterparts, job creation, know-how retention or attraction of
centers of excellence and design from the multinationals (Boavida and Moretto, 2011).
For both manufacturers, it was found that once the subsidiary (marketing and sales division)
collected the necessary elements to build the offer an internal mechanism was in place to allow
the headquarters to decide the vehicle model and the technology to adapt it to the local customer
requirements. At this stage, the relevant units from headquarters, i.e. design, technical,
65 "Railway Gazette: High speed programme axed". Railway Gazette International. Retrieved 23 March 2012.
Tender High Speed Train Portugal
Preparing the offer Train customization
Local subsidiary (Marketing)
Local constraints: laws, partnerships, technical specifications, counterparts
Client operator specifications / procurement
Design, development, purchase, operations, marketing, sales, finance
Firms strategy (Profit, cost/benefit)
Product platform
Product strategy
Network of suppliers
TECHNICAL
COMERCIAL
COMPONENT Products Processes
INEGRATRION Product platform Purchase / Operations
PLANT
!"#$%&'$%(&)*$+&
PRODUCT
STRATEGY Top-management Mother-house Strategic intelligence
,)--$+./"#&0+"1$.()+2&

!!
52
operations and finance, take part in the matter. Decision-making is supported by a cost/benefit
analysis in compliance with the manufacturer’s corporate strategy (a common practice for many
industries). Decisions at this level are then reported to the top-management in the headquarters.
As in the technical trajectory, it was found that it is the responsibility of top-management to
decide whether to go forward or not with the offer to supply their high-speed train, and to decide
on the strategy to follow for the bid.
Also here it was found that it is at the final stage where this trajectory meets the technical one.
It was up to the top-management of both Alstom and Siemens from the headquarters together
with top-management from the involved subsidiaries to match the technical developments with
the commercial offer, as way to build a competitive offer. In both trajectories, top-management
in the headquarters was found functioning as referee, reserving the final decision using strategic
intelligence.
Within the commercial trajectory, some elements from CTA framework for societal embedding
was found at Alstom and Siemens as a mean to promote local actors’ participatory and
constructive activities; and as means to collect end-users’ and clients’ information on the
technical and socio-economic elements of procurement.
Then, the results of this exercise were attempted by the subsidiaries of each manufacturer to be
embedded in the technology development of the high-speed train vehicles being offered. The
local subsidiaries in Portugal functioned for both manufacturers as a scanning structure, in
interaction with local informers and universities; and as a promoter of participatory and
collaborative activities to anticipate customers’ technical and socio-economic elements of
procurement and end-users’ expectations. Top management, in turn, used societal aspects to
some extent as an additional element for adapting the technical development of the high-speed
trains with the commercial specifications provided by the subsidiaries.
In line with the above description, societal embedding practices were found mostly performed
for both manufacturers when the two trajectories met, supporting top management’s final
decisions on the technology development options for their high-speed trains, by adding societal
information, collected by their strategic intelligence, which is added to the technical and
commercial ones. As already seen both trajectories also have in their process societal
embedding performed at some stage in the described processes.
The decision to implement a new high-speed line and operating it was and still is a highly
political matter for Portugal and for any other country. Constructing a new high-speed line and
acquiring a certain number of high-speed trains represents a significant investment and public
debt across generations. As a consequence, it is very often required that preferences, when

!!
53
possible, be given to the local industry and academia. In some countries such as in the United
States of America with the “buy American act” it is mandatory that 60% of the value to be
located in the country. Or the Portuguese law (Decreto-Lei n.º 18/2008) in place from 2008 to
2011 it required one percent of R&D investment for bids above 25 million Euro (Boavida and
Moretto 2011). This explains why manufacturers consider local societal constraints and co-
developments with local companies. Similar reasons are motivating cooperation with local
universities, as they are providers of local content, can demonstrate R&D in local conditions
and influence in decision-making at policy level.
4.1.6. Findings
Found evidences of societal embedding can be summarised as follows in figure 4.13 below.
Figure 4.13. Overview of societal embedding in the different dimensions of the high-speed train
technology development Source: author
Figure 4.13 feeds to the previous figure 4.5 with Alstom and Siemens identified activities
aligning with CTA framework for societal, as argued by constructive technology assessment
(Deuten, Rip & Jelsma, 1997).
Environment/ Target
• Business: Market Integration
• Regulatory: Admissibility by regulations
• Wider Society: Acceptance by customers, users and wider society
Activities for alignment
• Collaborative research
• Scientific papers • Conferences • Workshops • Tradeshows • Training sessions • Consultations in
social networks • Visions • Socio-Technical
Scenarios
PCP + SECP = • Strategic intelligence: filter
and alert on external constrains at societal and policy levels.
• Organization intelligence: scanning structures, external experts, lead users & suppliers, home-based int. TI, technology envoys
• Innovation Pattern: privileged actor Universities and suppliers
• Product System: found in non-core technologies
• Commercial trajectory: mainly performed by local informers.
Evidence of CTA societal embedding in technology development
*PCP – Product Construction Process **SEPC – Societal Embedding Construction Process
Exte
nded
tech
nolo
gy d
evel
opm
ent p
roce
ss !
Broad equation on new products selection

!!
54
Firstly, it was found that both manufacturers addressed the societal environment of selection
when developing the AGV and the ICE-350E as a means to cope with acceptance by customers,
end-users and wider public (see figure 4.13, first column).
Secondly, in terms of implementation, it was found that both Alstom and Siemens located it at
the level of strategic management of “product construction process” (PCP) (see figure 4.13, top
of the central column).
Continuing with the implementation at organisational level (figure 4.13 top of central column),
it was found that Alstom and Siemens strategic intelligence filters societal constraints mainly
at socio-economic environments of selection and to some extend also at policy level.
Filtering societal constraints (see figure 4.13, central column) both manufacturers relied on their
employees, agents at their technology surveillance structure mainly located at the subsidiary
“scanning structures”, and also on external “expert networks” and contacts with “lead users and
lead suppliers”. To a lesser extent were found employees at “home-based international
technology intelligence” and “technology envoys”.
At the level of technology transfer patters (see figure 4.13, middle of the central column), it
was found that Alstom and Siemens privileged source on societal constraints were Universities
and Knowledge Centers. Those actors have local knowledge on governments, customers, end-
users, and society. Another relevant actor was Component Suppliers implicitly knowledgeable
of societal constraints acquired, for example, from enquiries to travellers on specific
technologies impacting the raiding experience of the trains.
At product level alignment with CTA societal embedding was found in which refers to the
development of non-core technologies, such as interiors and telematics (see figure 4.13, low
end of the central column). Alstom and Siemens promoted collaborative research, which
included consultations to users group, customers, certification bodies and other relevant
entities, mainly occurring at the world region of the client, promoted by the technology envoy
or subsidiary scanning structure.
While in terms of decision making trajectories alignment with CTA societal embedding was
mainly found at the level of the technology commercial trajectory, in particular at the
interception point with the technical one (see figure 4.13, bottom of the central column). When
preparing for an offer, the manufactures’ subsidiary company interacted with local informers
and promoted local participatory activities to collect customers, end-users and local public
values and expectations that could impact its costumer’s procurement, that would then be used
to support top-management decision on which technology to offer.

!!
55
Finally, activities of alignments (figure 4.13, right column) ranged from a simple organization
of a workshop or the establishment of a local supply chain network to the complexity of
embedding social constraints into their R&D projects customizing the train to the local market
specific requirements.
Societal embedding type of activities were found in the practices of Alstom and Siemens
strategic-intelligence management of the technology development process of the trains mainly
associated to.
From above it can be concluded that Alstom and Siemens are strategically aligned with CTA,
except for the technological decision making trajectories as they mainly covered societal
alignments during the commercial trajectory and not during the technical trajectory. This might
be an indication on Alstom and Siemens aim of societal anticipation for “promotion” and
“control” (Deuten et al. 1997).
Moreover it is not clear at this stage to which extent societal constraints (filtered at strategic
level retro-feeding the commercial trajectory) were embedded in the technology development
process of the AGV and ICE-350E and at which technological readiness level it occurred66.
From this exercise were not covered the network of stakeholders contributing to the technology
development of the AGV and the ICE-350E.
66 TRL stands for Technology Readiness Level. For detailed definition see chapter V on the survey.

!!
56
4.2. Technology transitions
4.2.1. Introduction
Alstom AGV and Siemens ICE-350E build on the technology from its previous models.
Literature commonly refers to three generations of high-speed trains. According to Zhou &
Shen (2011) each generation is distinguished from its maximum commercial operation speed67:
The first generation corresponds to a maximum of 250 km/h; the second generation is that of
300 km/h; the third one is above 350 km/h.
According to Zhou & Shen (2011) the reference vehicles worldwide are the Japanese
Shinkansen, models S0, S500 and E5, manufactured by the Japanese consortium Hitachi,
Nippon Sharyo and Kawasaki Heavy Industries; the French TGV, models PSE, MED and AGV,
from the French Alstom; the German ICE, models 1, 3 and 350E, from the German Siemens;
and the Chinese CRH, models 1, 2 and 380B, manufactured accordingly by the Canadian
Bombardier, the German Siemens and the Chinese suppliers Tangshan Railway Vehicle and
Changchun Railway Vehicles68.
The combination between the different generations of trains and the reference units’ worldwide
is represented in the figure 4.14 below, plotting technology improvements measured in terms
of speed and adoption in time.
67 Giovoni (2006) argues that speed classification might be misleading and no longer valid for the next generation of high-speed trains. Commercial operation and track conditions already today do not allow maximum speeds as the one of 570Km/h reached by the AGV during tests. Such for reasons of safety, environment (noise) and costs associated. However, for simplification of analysis it was adopted Zhou & Shen (2011) classification. 68 Chinese high-speed train manufacturers management approach have fast evolved from introducing a first generation of high-speed trains fully relying on imported technology from Europe and Japan, followed by a second generation of vehicles co-developed in foreign joint ventures and finally arriving to the introducing of a third generation of trains with their own technology. This in less than 8 years. The CRH380A was manufactured by Sifang Locomotive and Rolling Stock (belonging to the China Southern Locomotive and Rolling stock industry group); CRH380B produced by Siemens and Tangshan Railway Vehicle (belonging to the China Northern Locomotive and Rolling stock industry group) and Changchun Railway Vehicles; CRH380CL by Changchun Railway Vehicles (belonging to the China Northern Locomotive and Rolling stock industry group). CRH380D, also named Zefiro, by Bombardier Sifang.
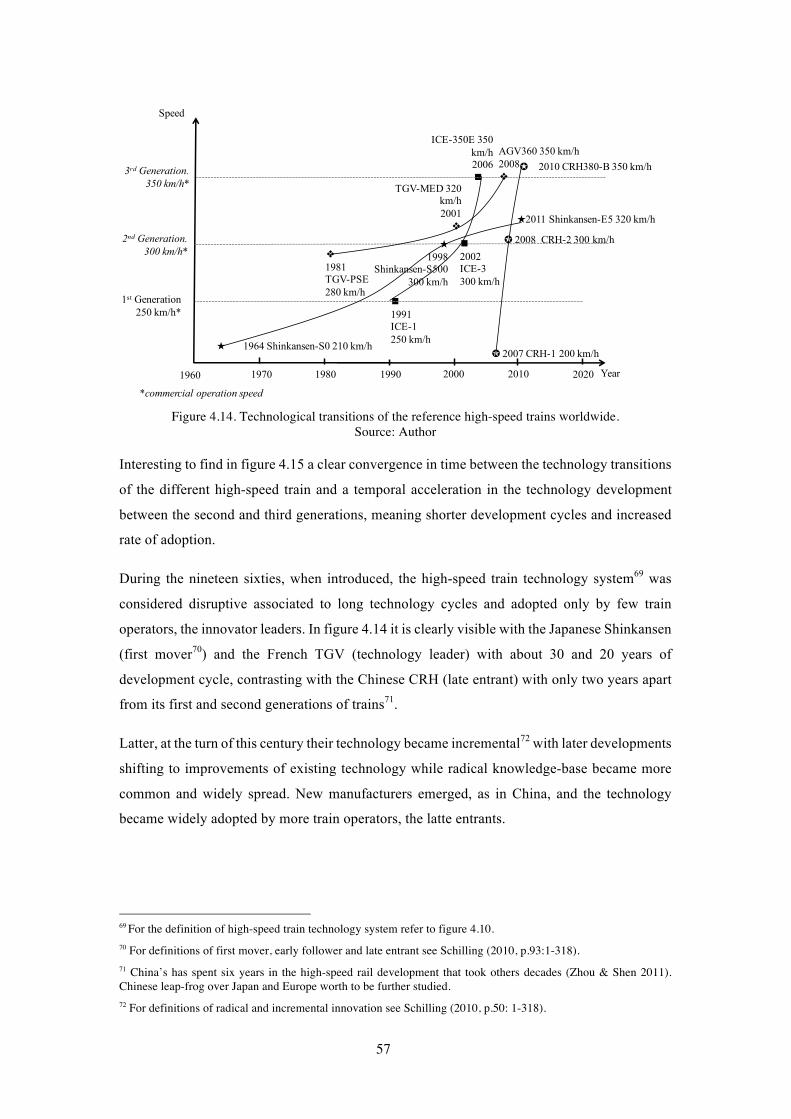
!!
57
!Figure 4.14. Technological transitions of the reference high-speed trains worldwide.
Source: Author
Interesting to find in figure 4.15 a clear convergence in time between the technology transitions
of the different high-speed train and a temporal acceleration in the technology development
between the second and third generations, meaning shorter development cycles and increased
rate of adoption.
During the nineteen sixties, when introduced, the high-speed train technology system69 was
considered disruptive associated to long technology cycles and adopted only by few train
operators, the innovator leaders. In figure 4.14 it is clearly visible with the Japanese Shinkansen
(first mover70) and the French TGV (technology leader) with about 30 and 20 years of
development cycle, contrasting with the Chinese CRH (late entrant) with only two years apart
from its first and second generations of trains71.
Latter, at the turn of this century their technology became incremental72 with later developments
shifting to improvements of existing technology while radical knowledge-base became more
common and widely spread. New manufacturers emerged, as in China, and the technology
became widely adopted by more train operators, the latte entrants.
69 For the definition of high-speed train technology system refer to figure 4.10. 70 For definitions of first mover, early follower and late entrant see Schilling (2010, p.93:1-318). 71 China’s has spent six years in the high-speed rail development that took others decades (Zhou & Shen 2011). Chinese leap-frog over Japan and Europe worth to be further studied. 72 For definitions of radical and incremental innovation see Schilling (2010, p.50: 1-318).
◼1991 ICE-1 250 km/h
World-wide reference high-speed trains technology transitions in time
Speed
Year
1st Generation 250 km/h*
2nd Generation. 300 km/h*
*commercial operation speed
1960 1990 2000
3rd Generation.350 km/h*
1970 1980 2010
ICE-350E 350 km/h2006 ◼�
★2011 Shinkansen-E5 320 km/h
✪ 2008 CRH-2 300 km/h
✪ 2007 CRH-1 200 km/h
✪ 2010 CRH380-B 350 km/h
2020
★ 1964 Shinkansen-S0 210 km/h
TGV-MED 320 km/h2001 �
AGV360 350 km/h 2008 ��
◼2002 ICE-3300 km/h
�1981 TGV-PSE 280 km/h
★
1998 Shinkansen-S500
300 km/h

!!
58
Most likely since the introduction of the AGV and ICE-350E in 2008 and 2006 the
technological curve will tend to flatten as for Japan, with Alstom and Siemens paying more
attention to the attractiveness aspects of the trains.
The section 4.2.3 presents the events pushing and pulling73 (emerging and stabilising
conditions) those technology transitions leading to the French AGV and the German ICE-350E.
From here should result a clear understanding on the drivers for the technological changes over
time and their promoters. While, it is identified possible links with societal aspects. Ultimately
this retrospective exercise will then allow to contextualise societal embedding as it was found
for the AGV and ICE-350E (in section 4.1.) while projecting it to the future.
4.2.2. Theoretical references
Understanding the process of the co-evolution of socio-technical systems is the central element
of CTA, and this is where the technology transition and the multi-level perspectives analytical
tools here introduced come in.
Spearheaded in the 1990s by Arie Rip, Rene Kemp (1998) and Johan Schot (1997) referred
analytical models combined different levels of analysis drawing on the quasi-evolutionary
model of technology and innovation (Dosi 1982, Nelson and Winter 1977, Abernathy & Clark
1985, van den Belt and Rip 1987, van Lente 1993) and combines it with actor-network theory
(Callon & Latour 1981) and theories of alignment and stabilisation (David 1985, Callon 1991).
Technology transitions and multi-level alignments prepares for socio-technical scenarios
(Geels 2002a, Elzen et al. 2005, Robinson 2009) by combining the CTA approach to future-
oriented technology analysis and evolutionary theory.
Looking at emerging and stabilising fields in this way, addressing a complex, heterogeneous,
and multi-level socio-technical world, shifts the attention to the socio-technical alignments as
the point to be addressed in this section 4.2 and also in the next section 4.3.
This section 4.2 is mainly supported by Geels (Geels 2002a, Geels & Schot 2007) technology
transitions model of analysis, that will be here proved relevant to anticipate future developments
in the development of high-speed trains. The model is a stylized visualization of the various
73 See “R&D push” and “Market pull” theories found in innovation and technology management literature (Schilling, 2010).

!!
59
arenas - landscape74, regime75 and niche76 - in which actors within can produce events pulling
and pushing for technology changes. Those events attributes can be hyper-turbulence, specific
shocks, disruptions, regular changes or avalanches77. Which in its turn can be exogenous78 or
endogenous79 to the technology regime. They can disrupt or produce incremental technology
changes. Such events can occur at landscape arena produced by policy actors, regime arena
produced by technological actors’ part of the supply chain and niche arena produced by
emergent specialized providers of technology both from and outside the technology regime.
Whilst the development of a high-speed train may be considered as an individual product
development project, it is embedded in a broader system of actors and infrastructures which
make up train-based transportation systems. New product development activities in the high-
speed train sector appear in an existing context of rules and best practices which one can call a
technological regime (Nelson and Winter 1977) will support the following section 4.3.
74 Macro: Evolving sociotechnical landsacapes (Geels 2002, figure 4, p. 1252:1274). 75 Mezo: A patchwork of regimes (Geels 2002, figure 4, p. 1252:1274). 76 Micro: novel configurations (Geels 2002, figure 4, p. 1252:1274). 77 For a detailed explanation and support graphics please refer to Geels & Schot 2007, figure 4, p. 404:417 78 Exogenous renewals result from outside regime actors. They can be emergent transformation which arises from uncoordinated pressures, outside the regime, often driven by small and new firms. They can also be purposive transitions which are intended and coordinated change processes that emerge from outside the existing regime (Geels & Schot 2007, p401:417). 79 Endogenous renewals result from regime actors making conscious and planned efforts in response to perceived pressures, using regime-internal resources In its turn those can be reorientation of trajectories which results from a shock, either inside or outside the incumbent regime, followed by a response from regime actors, using internal resources (Geels & Schot 2007, p401:417).

!!
60
A regime represents the ways of doing research and development, the way value is assessed, in
short, the rules and routines that embody action and use a technology. Rip and Kemp (1998)
described regimes as the “grammar” that shapes emerging technology development. See figure
4.15, below.
Figure 4.15. Rip and Kemp micro-meso-macro approach to locate technology transformations.
Source: Rip and Kemp (1998, figure 6.1, p. 339:329-399)
Figure 4.15 shows Rip and Kemp (1998) multi-level visualisation of the processes of socio-
technical change which brought together a number of perspectives on technology dynamics into
the same model. In his PhD thesis, Frank Geels took this work, as others such as Van de Poel
(1998), van Lente (1993) and Deuten et al. (1997), creating his own version of this multi-level
visualisation.
The Multi-Level Perspective (MLP) was developed to understand large socio-technical system
changes, such as transitions from sail boats to steam ships. In this perspective, Geels drew on
notions of strategic niche management (Schot and Rip 1997) to understand how new “protected
spaces” would emerge within established technology regimes, protecting new technology
options, until they were successfully embedded into existing regimes (fitting into existing
regimes) or changing the established regime to accommodate this new technology novelty
(stretching the regime). Thus, taking the figure above, Geels replaces “scripts and technical
fixes” with “niches” to create a niche- regime-landscape model.

!!
61
This MLP approach has been widely taken up since 2002 and even has its own journal80.
Therefore, I apply the MLP perspective as a way of understanding the evolution of new
technological options within the existing regime, with the benefit of the approach being used
quite widely in understanding transformations of large socio-technical systems.
The referred theories and models will be here applied to the high-speed trains AGV and ICE-
350E. The historical reconstruction of events and technological developments are built from
Constant (2006), Zhou & Shen (2011), Ebeling (2005), the International Union of Railways
(2010) and Giuntini (2011); also to some extend Meunier (2002) and Keseljevic (2015).
4.2.3. Technology transitions AGV and ICE-350E
a) From the TGV to the AGV:
Seventeen years after Japan, France was the second country who succeeded to commercially
run in 1981 high-speed trains, the TGV-PSE (or TGV Sud-Est), from Paris to Lyon at a top
operations speed of 280 km/h81. Twenty years after, in 2001, France over-passed Japan
becoming the technology leader in this train segment with the introduction of the TGV-MED
(or TGV-Atlantique), running at a commercial speed of 320 km/h from Valence to Marseille.
Technology leadership position was reassured in 2008 by the model AGV running at a
commercial speed of 350 km/h.
The vehicle technology transitions are represented in figure 4.16. The figure was built by
applying Geels (2002a, p. 1263:1257-1274) analytical model.
80 The journal of Environmental Innovation and Societal Transitions : http://www.journals.elsevier.com/environmental-innovation-and-societal-transitions/ 81 In 1989 and 1994 France completed TGV-A rolling at a speed of 280 km/h and TGV-N at 300 km/h. Both belong to the technology of first generation.

!!
62
!Figure 4.16. The French TGV/AGV technology transition
Source: Author
- The first generation of trains: the TGV-PSE
Starting with the description of figure 4.16, a series of events pushed and pulled in the 1960s
and 1970s the introduction of the high-speed train in France. Those events imposed competitive
pressures to the French railways even if in a monopolistic position.
The initial registered event during the 1960s was the increasing competition from faster and
attractive automotive and aeronautic transport modes accessible to travelers (Constant 2006).
It was a landscape “hyperturbulence” 82 event exogenous to the railway regime.
Another “hyperturbulence” 83 occurred this time within the regime arena in 1964 with the
success of the Japanese Shinkansen, running at a speed of 210 km/h; and in 1965 with the
German demonstration of the DB Class 103 hauled trains rolling at 200 km/h at the International
Transport Fair in Munich (Ebling 2005).
In response, the French government played a key role creating the necessary conditions
allowing for the technology race to happen in France. At niche arena it funded a disruptive
technology with the Aérotain84 (1965-1977). While, at the regime arena it funded SNCF’s
82 For the definition see Geels and Schot (2007, p. 404). 83 For the definition see Geels and Schot (2007, p. 404). 84 The Aérotain was invented and developed from 1965 to 1977, by a research team lead by the engineer Jean Bertin (Société Bertrin et Cie, founded in 1955) dedicated to aeronautics and innovative transports. The goal was the same as the magnetic levitation, to diminish vehicle resistance from track by suspending the train. This project was in parallel to other two incremental projects of SNCF.
Niche
Regime
Landscape
Time1960 1990 20001970 1980 2010(….) 2050
60’AutomotiveAeronautics
1973Oil shocks
2001EC White Paper
2008Start financial Crisis
1st Generation
ElectricElectric
Speed
Eco-design
Safety
Comfort
IT (telematics), info passengers
1994Eurostar
2008 AGV360350 km/h
New materials / light weight
1964 Japan Shinkansen
1965 German demonstrations
2nd Generation 3rd Generation
1993 Cross-Chanel
Serv
ice
Man
ufac
turin
gC
ompo
nent
s2005
Member StatesInvestments Plans
1981TGV-PSE280 km/h 2001
TGV-MED320 km/h
2007Start digitalization of society
4rd Generationto come
Social Innovations
Hyper-turbulence
Regular
Specific shock
Avalanche
Disruptive
Legend on type of events:
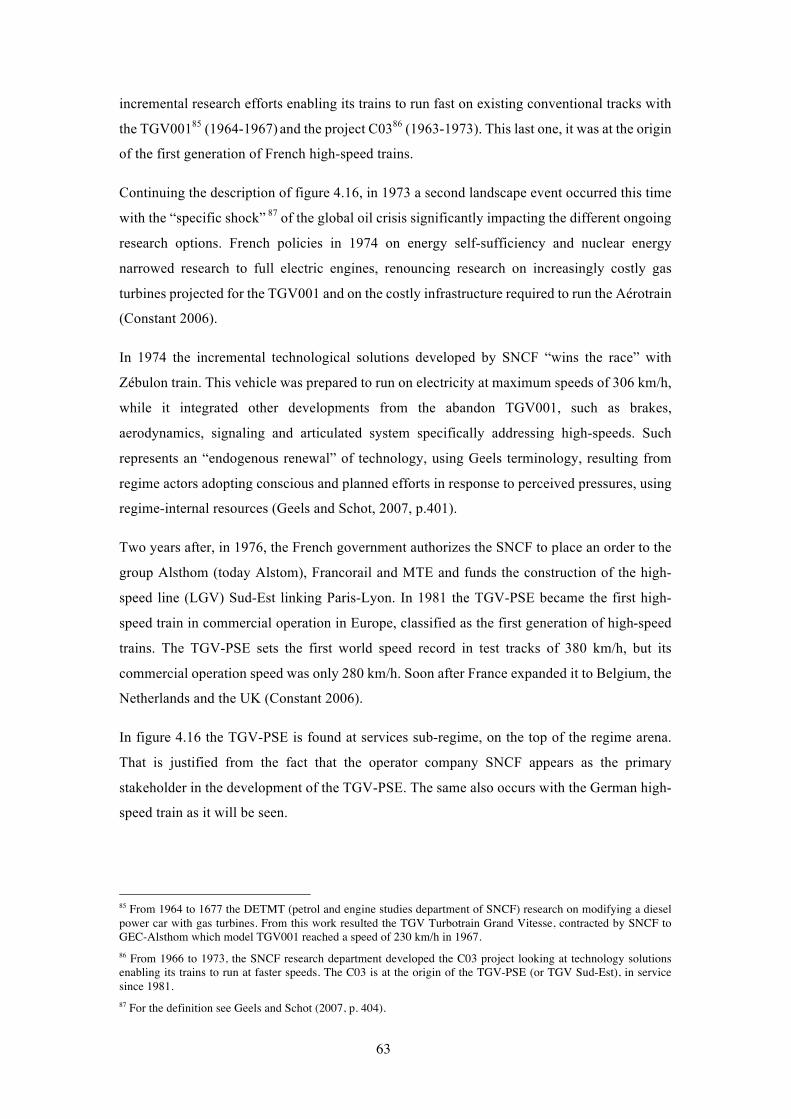
!!
63
incremental research efforts enabling its trains to run fast on existing conventional tracks with
the TGV00185 (1964-1967) and the project C0386 (1963-1973). This last one, it was at the origin
of the first generation of French high-speed trains.
Continuing the description of figure 4.16, in 1973 a second landscape event occurred this time
with the “specific shock” 87 of the global oil crisis significantly impacting the different ongoing
research options. French policies in 1974 on energy self-sufficiency and nuclear energy
narrowed research to full electric engines, renouncing research on increasingly costly gas
turbines projected for the TGV001 and on the costly infrastructure required to run the Aérotrain
(Constant 2006).
In 1974 the incremental technological solutions developed by SNCF “wins the race” with
Zébulon train. This vehicle was prepared to run on electricity at maximum speeds of 306 km/h,
while it integrated other developments from the abandon TGV001, such as brakes,
aerodynamics, signaling and articulated system specifically addressing high-speeds. Such
represents an “endogenous renewal” of technology, using Geels terminology, resulting from
regime actors adopting conscious and planned efforts in response to perceived pressures, using
regime-internal resources (Geels and Schot, 2007, p.401).
Two years after, in 1976, the French government authorizes the SNCF to place an order to the
group Alsthom (today Alstom), Francorail and MTE and funds the construction of the high-
speed line (LGV) Sud-Est linking Paris-Lyon. In 1981 the TGV-PSE became the first high-
speed train in commercial operation in Europe, classified as the first generation of high-speed
trains. The TGV-PSE sets the first world speed record in test tracks of 380 km/h, but its
commercial operation speed was only 280 km/h. Soon after France expanded it to Belgium, the
Netherlands and the UK (Constant 2006).
In figure 4.16 the TGV-PSE is found at services sub-regime, on the top of the regime arena.
That is justified from the fact that the operator company SNCF appears as the primary
stakeholder in the development of the TGV-PSE. The same also occurs with the German high-
speed train as it will be seen.
85 From 1964 to 1677 the DETMT (petrol and engine studies department of SNCF) research on modifying a diesel power car with gas turbines. From this work resulted the TGV Turbotrain Grand Vitesse, contracted by SNCF to GEC-Alsthom which model TGV001 reached a speed of 230 km/h in 1967. 86 From 1966 to 1973, the SNCF research department developed the C03 project looking at technology solutions enabling its trains to run at faster speeds. The C03 is at the origin of the TGV-PSE (or TGV Sud-Est), in service since 1981. 87 For the definition see Geels and Schot (2007, p. 404).

!!
64
In figure 4.16 one can see that this first generation of trains falls within the tactical decision
making approach, in response to (not in anticipation) the technical challenges raised from the
events at landscape arena. Here were found only ex-ante cost-benefit analysis.
Not so different from what happened with the introduction of the steam engine, the decision on
the TGV-PSE technology development was resources oriented determined by costs of
complements88 such as available infrastructure and energy prices essential to run the train. That
approach would remain until the second generation of trains.
- Between the first and the second generation of trains: The Eurostar
Eurostar (also called class 373 in the UK) entered in service in 1994 linking London Waterloo
International Station, Paris Gar du Nord, Brussels Midi and Lille Europe, crossing the channel
tunnel. As figure 4.16 illustrates such results from the “regular change” 89 registered at
landscape with the diplomatic agreement for a rail-channel-crossing between Britain and
France (1993 year of Eurotunnel construction). That is why in figure 4.16 this vehicle appears
at the very top of the regime arena at service level.
The Eurostar’s TGV new technical features were “endogenous renewals” 90 of incremental
innovations of the TGV-PSE as a way to address the UK’s and the tunnel crossing’s own
specificities (such as smaller cross section, British designed asynchronous traction motors and
fireproofing). That is why in figure 4.16 the Eurostar is illustrated as an intermediary step
between the first and the second generation of trains.
It also meant a new geopolitical alignment in the supply chain with the first formation of a
multi-national manufacturing consortium composed by GEC-Alsthom in La Rochelle (France),
Belfort (France) and Washwood Heath (England).
Alike for the TGV-PSE, the Eurostar results from a tactical decision, but driven this time by
the landscape event of a political agreement between countries imposing the technical challenge
of having a high-speed train running across different countries.
- The second generation of trains: The TGV-MED
88 For concepts see Schiling (2010) when referring to Porter (2001) five market forces. 89 For the definition see Geels and Schot (2007, p. 404). 90 See Geels and Schot (2007, p. 401).

!!
65
Zhou & Shen (2011) classify the TGV-MED (or Atlantique) introduced in 2001 as the second
generation of French high-speed trains due to its commercial speed of 320 km/h. This vehicle
broke the world record speed above 515 km/h during tests in 1990.
The transition to the second generation of trains resulting with the TGV-MED was due to
regime “regular” 91 events imposed by feedback from service operations, requiring improved
aerodynamics, larger wheels, improved brakes, reduced number of power cars and changes in
the articulation of carriage configurations.
The TGV-MED was this way an “endogenous renewal” 92 focused in enabling technologies
making the train sustaining a good performance at increased record speeds.
Also for this train technology decision-making was tactical. As in the past it was technical
oriented and resources driven. SNCF was still at the core of its development in cooperation
with French manufacturer Alstom integrating greater amount of knowledge than in the past
acquired from its international experience as described. This justifies that in figure 4.16 this
generation of trains appears at regime area in between sub-regimes service and manufacturing.
- The third generation of trains: The AGV
The AGV (Automotrice à Grand Vitesse) is the third generation of French high-speed trains
(Zhou & Shen 2011). It broke the world speed record of 574 km/h during tests in 2007. Despite
conclusion of its development in 2008 it only started commercially running in 2011 when
bought by the Italian private operator NTV (Nuovo Transporto Viaggiatori), servicing at a
commercial speed of 360 Km/h the lines Turin-Milan-Bologna, Rome-Venice, and Bologna-
Florence-Rome-Naples.
As figure 4.16 shows the AGV is a clear strategic response from the manufacturer Alstom to
the landscape arena “specific shock” 93 event of the European White Paper (COM(2001) 370
final, European Commission 2001) and associated “hypeturbulence” of landscape events
caused by European Member States announcing massive investment plans on their corridors
part of the integrated trans-European high-speed rail network. The most significant was in 2005
with the Spanish government investment plan (PEIT 2005-2010) visioning by 2020 the large
majority of the Spanish population (90%) being served by high-speed trains.
91 For the definition see Geels and Schot (2007, p. 404). 92 See Geels and Schot (2007, p. 401). 93 For the definition see Geels and Schot (2007, p. 404).

!!
66
Moreover, figure 4.16 shows that the AGV is also a clear reaction to regime arena
“hyperturbulence” resulting from increase competitive pressures mainly from the German
manufacturer Siemens, simultaneously developing its third generation of vehicles (in 2006 the
German manufacturer Siemens launched the ICE-350E slightly before Alstom’s conclusion of
the AGV). For the first time Alstom and Siemens were developing their high-speed trains in
direct competition. Their aim was to gain all the markets in the European countries converting
to high-speed networks.
In figure 4.16 the AGV is found at the level of manufacturers sub-regime. Differently from its
TGV relatives developed in collaboration with SNCF, the AGV was fully designed and build
by Alstom own teams and financial resources in a clear anticipation to the European Union’s
Railway Packages implementing the White Paper on Transport, ruling financial restrictions to
state aid, requirements for technical interoperability and high safety standards, standard gauge
and electric multiple units. Modularity is also an important element in the AGV, with the
manufacturing Alstom aiming at cost reduction, improved components technology interfaces,
as well reduction time for assembly and life cycle cost.
The AGV represents the “reorientation of trajectories” 94 towards European standard vehicles.
Behind AGV modern design relies hours of engineering work and strategic meetings at
European level between Alstom staff and other stakeholders mainly from the supply-chain at
regime level and even with its direct competitors, to promote adoption of Alstom technology
as European standard. The AGV integrates results from European research collaborative
projects, build up on Alstom and also Siemens technology, such as MODTRAIN95 and the
EUDD Drivers Desk96 and other technical joint works as from the former AIF (Association
Européenne pour l’interopérabilité Ferroviaire), which have become dominant standards.
94 See Geels and Schot (2007, p. 401: 399-417). 95 MODTRAIN stands for Innovative Modular Vehicle Concepts for an Integrated European Railway System. The integrated project was the first of its kind in the railway industry. Started in February 2004 and ended in April 2008 with a budget of 30Million Euros, 37 partners from the supply chain, associations and consultants, coming from 10 European countries. The project 8 work packages addressed the bogie and running gear (MODBOGIE), train control and architecture (MODCONTROL), onboard power systems (MODPOWER), man-machine and train to train interfaces (MODLINK), dissemination (MODUSER), driver’s interface (EUROCAB), passenger interfaces (EUPAX) and train interfaces (EUCOUPLER). From this project resulted relevant standards (prEN 15380) and harmonization of procedures. Another very important development was the unprecedented creation of new working relations between academia, the rail industry and operators, both complementary and competing between each other creating a new culture contrasting with the traditional reluctant to information sharing. While contributing to a more balanced distribution of traffic across modes, better service for travellers and stronger industrial base in Europe. Retrieved (March 2013) from http://www.modtrain.com. 96 EUDD European Driver’s Desk improving interoperability in European cross-border railway traffic. The research work involved 16 partners, 28 months (ended in 2008). Retrieved (March 2013) from http://ec.europa.eu/transport/projects/items/euddplus_en-htm.

!!
67
Without the traditional order from a specific client but rather a pre-commercial policy challenge
of a sustainable trans-European high-speed train network, decision-making on which
technology to embed in the train became strategic. As previously referred in the description of
figure 4.16 the emergence of manufacturers strategic intelligence and emergence of societal
assessment was introduced during the development of the AGV (2001-2008). They reflect
regime arena stakeholders’ alignments and present visions for technology transitions from the
second to the third generation of trains and beyond.
There is a paradigm shift in decision-making from technological/tacit to policy & regulatory
driven/strategic. Rachel Piccard from SNCF called it the transition from hardware to software
technological development.
b) From the ICE-1 to the ICE-350E
Ten years after France in 1991, Germany introduced its first high-speed train, the ICE-1
Intercity-Express running at a speed of 250 Km/h on the dedicated line Hannover-Wurzburg.
Eight years after, in 2000, it introduces the second generation of trains with the ICE-3 running
at a commercial speed of 300km/h, in line Frankfurt-Cologne. In 2006 the third generation
enters in service with the ICE-350E running in the Spanish line Barcelona-Madrid at a speed
of 350 km/h (Zhuo & Shen 2011).
!Figure 4.17. German ICE technology transitions
Source: Author
- First generation of trains: The ICE-1
40’WWII
Niche
Regime
Landscape
Time
1960 1990 20001970 1980 2010 (….) 2050
2nd Generation 3rd Generation
Serv
ice
Man
ufac
turin
gC
ompo
nent
s
2008
AG
V2002ICE-3(class 403 and 406)300 km/h
60’AutomotiveAeronautics
1973Oil shocks
2001EC White Paper
1993 Cross-Chanel
2005 Member States
Investments Plans
1964 Japan Shinkansen
1st Generation
1981 TGV-PSE
2005MAGLEV430 Km/h
(1922)
1965 DB Class 103200 km/h (test)
(50’-1990) Institutional impasse
1991ICE-1250 Km/h
2006ICE-350E350 km/h
Social Innovations
Hyper-turbulence
Regular
Specific shock
Avalanche
Disruptive
Legend on type of events:
4rd Generationto come
2007Start digitalization of society
2008Start financial Crisis

!!
68
In 1991 the first generation of German high-speed trains was introduced with the ICE-1 running
in Hannover-Würzburg line at a commercial speed of 250 km/h. Since Germany became the
second country in Europe to have a high-speed rail in service.
Sixty years passed from Germany’s early development tests of trains running at higher speeds
and the deployment of the ICE-1. Figure 4.17 clearly illustrates such long development
trajectory. That was due to two main obstacles at landscape arena, the Second World War and
later impasse between the operator company and the government in terms of adopting or not
dedicated lines for freight and passengers transport.
Similar to the French TGV, the first generation of the German high-speed train was pulled by
the “hyperturbulence” event at landscape by greater competition from automotive and air
transports (Ebeling 2005, is consensual with Constant 2006). Moreover, Germany was pushed
in 1964 by Japan’s Tokaido Shinkansen start operations and latter in 1981 also by the French
TGV.
The German ICE-1 deferred from the French TGV mainly on the use of the classical two bogies
per car and possibility of changing the length of the train.
The ICE-1 changed the fundamentals of the German railways (Ebeling 2005), resulting from
years of research, using the ICE-V prototype that broke the world speed record of 406 km/h in
1988. The prototype was fully developed by Deutsche Bundesbahn and Siemens.
The ICE-1 and latter model ICE-2 were very much oriented to the German high-speed network
with loading gauges exceeding that recommended by the UIC standards. It was after the ICE-2
that DB AG for costs reasons decided to develop new distributed-traction electric motor units
(EMUs) alike to the Japanese Shinkansen pushing the German high-speed train to its second
generation of trains.
As for the French vehicles, also for the German first and second generations of trains the
decision-making relied on the railway operator adopting a tactical approach responding to the
technical challenges, resources driven, with the train manufacturer increased technological
competence. That justifies the position of the ICE-1 at the level of service sub-regime and the
ICE-3 slightly down in between the sub-regimes of services and manufacturing.
- The second generation of trains: The ICE-3
The ICE-3 (also called Velaro) first full-scale model happened in 1996, known as ICE-M.
However, it only started operations in 2000 between Frankfurt and Cologne at a commercial
speed of 300 km/h, on time for the Hannover Expo. The ICE-3 overcomes its predecessors by

!!
69
its smaller loading gauge required outside Germany, meeting the UIC international standards.
It introduces electric multiple units (not locomotive power-trains) with motors distributed under
the floor, making it the first vehicle of this kind in Europe (Siemens 2010).
Siemens manufactured two classes of vehicles. The ICE-3 class 403, intended for domestic
operations and the ICE-3M class 406, prepared to run under four different railway
electrification systems existing in Europe assuring Deutsche Bahn’s international services.
Later, in 2006/2007, China used ICE-3 as carriage technology reference to build its own
technological capacity97. Also, in 2009 Deutsche Bahn received permission to run the ICE-3M
across the Channel Tunnel.
As in the past, also for the second generation of high-speed trains, Deutsche Bahn was at the
core of the technological development in cooperation with its flag-manufacturer Siemens. The
German operator followed the traditional technical approach, resources driven. As a result, the
ICE-3 new features essentially addressed the German national specific requirements and the
perspective of extending operations to neighboring countries. Siemens started during this period
its international co-development strategy gaining with it more technological competences
beyond its national customer (Siemens 2010).
- The third generation of trains: the ICE-350E
In 2006, ICE-350E, also called Velaro-E by its manufacturer Siemens or AVE-Class 103 by
the client Renfe Operadora, running in the line Barcelona-Madrid at a commercial speed of 350
km/h corresponds to the third generation of German high-speed trains.
The distributed power car is an incremental development of the technology used on the ICE-
3M/F manufactured by Siemens to Deutsche Bahn. In 2011 the improved model Velaro-D was
developed to assure Deutsche Bahn international services from Germany.
Alike with what was happening with the French AGV, the German ICE-350E is the result of
Siemens strategic technology decision to develop a train with no order or request for tender
(Siemens 2010). Motivating it were the series of turbulent events as described for the AGV
97 According to Takagi (2005) China used Siemens ICE-3 reference carriage technology as well as it used the Swedish high-speed commuter train Regina built by Bombardier of Canada and the JR East Hayate E2- 1000 built by Kawasaki Heavy Industries. The author refers that the method involves modifying the designs to suit Chinese needs in areas such as body width and interior fittings. The author continuous by referring that as part of China ambition to develop its worn high-speed technology for all models introduced, about 20% of the parts are made in the countries of origin and the other 80% are made in China under license.

!!
70
subsequent to the White Paper on Transport (COM(2001)370 final), with European countries,
in particular Spain announcing massive investments for rail projects.
To support the development of the ICE-350E in the described new conditions it was found that
Siemens adopted a strategic intelligence approach as described for Alstom’s AGV. Siemens
was promoter and partner in the industry emergent collective visions and proliferation of
collaborative research projects. Siemens was pushing for its technological solutions to become
widely adopted as European standards. The manufacture also integrated co-developments in
the ICE-350E development process. Besides the collective action, Siemens was also very active
in producing their own visions and expectations on the future technologies addressing the high-
speed trains, including links to other sectors such as energy98.
Both trains the French AGV and the German ICE-3050E trains represent a paradigm shift in
decision-making from technological to policy & regulatory driven. Rachel Piccard99 from
SNCF called it the transition from hardware to software technological development. Cross-
border corridor driven, Alstom and Siemens developed these trains in the race to dominate
vehicles supply to the trans-European high-speed networks and have their standards dominate.
- The Maglev
Continuing the description of figure 4.17 at the niche arena (bottom of the graph) the Maglev
technology slowly emerged in parallel to the ICE development, without however raising
technological competitive pressures over the different generations of the ICE.
In 1922, where the technology was invented, Hermann Kemper first considered replacing train
wheels by electromagnets. The idea of “flying zero altitude” was patented in 1934 (Ebeling
2005). Latter during 1971 the Japanese joined the German efforts. But just after, in 1977 DB
AG for economic reasons abandoned the project of building a magnetic train link Hamburg-
Berlin.
In 2001 China bought from Siemens the Maglev for the link Shanghai’s new district and Pudong
Airport, in operation since 2005 at a commercial speed of 430 km/h, while test records have
reached 500 km/h. Differently from the French Aérotrain the magnetic levitation was
commercialized.
d) The transition to the fourth generation of high-speed trains:
98 Should be noticed that Alstom does not make public their reports as Siemens. 99 Key-note speech at the opening ceremony of the UIC World Congress on High Speed Rail, Tokyo, 7.07.2015 (Picard, 2015).

!!
71
Currently we are at the technology transition to the fourth generation of high-speed trains
resulting from the “specific shock”100 with the financial crises occurred since 2008 and followed
by the hyper-connectivity from the increase digitalization of society and social innovation,
causing an “hyperturbulance” of events. The European Commission policy initiative on the
Roadmap to a Single European Transport Area is the first policy document pointing to the
emergence of this new trend (COM(2011)144 final, European Commission 2011).
As referred by Rachel Picard (2015) the digitalisation of society is precipitating railways into a
new transition, this time socialware driven technologies. To cope with, SNCF train operator
have announced major efforts to create a digital eco-system door-to-door for TGV travellers.
While, in its turn Alstom and Siemens are assessing how to integrate digitalization and social
innovation in the development process of their high-speed trains, which most likely will
produce a transition to a fourth generation of high-speed trains. This became very clear at the
9th UIC World Congress on High-speed Trains, 7-9 July 2015101, from the interventions by
Rachel Piccard, Director of SNCF Voyages; L. Baron, Alstom mainline technical director; and
Jurgen Bandes, Siemens CEO, mobility division.
Moreover as responses to these challenges, the collective of the industry, of which is part
Alstom and Siemens, is now setting a new governance structure for R&D in SHIFT2RAIL.
4.2.4. Findings
High-Speed trains technology transition from one generation to the other results from decisions
taken on which technology/technologies to support. Those decisions have shifted from tactic
responses to strategic. This way the transition from the first generation of high-speed trains to
the second respond to occurred events. They were driven from practices of a tactic management
approach. In its turn the most recent transition from the second to the third generation of trains
occurred as anticipation to emergent challenges, supported by a strategic management
approach.
This reflect the evolution of the drivers pulling and pushing the industry to develop new
technologies, from hardware innovation to software innovation and most recently to socialware
innovation, further developed in section 4.4.
100 For the definition of specific shock see Geels and Schot (2007, p. 404: 399-417). 101 link: http://www.uic-highspeed2015.com/

!!
72
The tactical approach addresses technical challenges, resource driven (past legacy). The
strategic approach addresses policy challenges, project driven (present-times) and most recently
emergent societal challenges, mobility driven (emergent). Those approaches coexist in time.
Strategic management including anticipatory activities surged here as support tool to
technology decision-making.
This way the commercialization of the German ICE-350E in 2006 and the French AGV in 2008
is a result of stakeholders alignment from 2001 in view of anticipatory co-engagements to meet
the set European policy challenge on interoperability, modularity, sustainability and safety
(COM (2001) 370 final), seeing it as an opportunity to promote their technology as European
standards. It corresponds to the first technology transition from traditional tactical decision-
making process to a strategic approach.
Moreover, it worth to note that the development cycle of these trains occurred only in 4 to 7
years, in contrast with the 15 to 20 years in the past generations TGV-MED (commercialised
in 2001) and ICE-3 (commercialised in 2002). Contributing was the strategic approach through
anticipation in obvious combination with computational advancements such as on virtual
testing, validations and homologations.
Soon after the commercialization of the ICE-350E and the AGV, the 2008 financial crises’ and
ICT advancements emergent digitalization of society is pushing the high-speed trains into
another technology transition from which can arise a fourth generation of vehicles. The vague
and unbound nature of resulting events is creating a new wave of unprecedented framework
conditions in this industry reinforcing the importance of the adopted strategic decision-making
approach to this new social pressures.
At this stage, it worth to extend the analyse in the next section 4.3 to the multi-level perspective
of the different stakeholders involved confined to the period of the technology development of
the AGV and ICE-350E.

!!
73
4.3. Multi-level Perspectives
4.3.1. Introduction
In this chapter my analysis focus on the multi-level perspective of the various technology actors
during the development of the AGV and ICE-350E (2001-2008), during which it was observed
the emergence of collectively aligned strategic decision-making approaches monitoring policy
challenges introduced by the 2001 White Paper (COM (2001) 370 final). The objective was to
identify how far out those multi-level-perspectives embedded society.
To modulate the data, I further apply Geels levels of system innovation (Geels and Schot 2007)
articulated with Pavitt revised taxonomy of innovation (Castellacci 2008). The result is a
visualization about the AGV and the ICE-350E multi-actor system (figure 4.8) and knowledge
exchanges within (figure 4.9).
4.3.2. Analysis
The shift to a collective strategic approach in support of decision making during the
development of the AGV and ICE-350E have produced a series of documents in the form of
strategic technological agendas ranging from individual stakeholders, as with Siemens reports,
or from groups of stakeholders, as with UNIFE’s railway market outlooks or ERRAC visions.
See figure 4.18 below.
!

!!
74
Figure 4.18. The AGV and ICE-35E multi-level perspective from 2001 to 2008
Source: author
From figure 4.18 it can be seen a hype in the production of strategic reports at regime level,
each reflecting stakeholders’ technological perspectives and expectations on the necessary
technology developments to meet the policy challenges set by the 2001 White Paper (COM
(2001) 370 final).
a) Landscape arena
At the top of the graph in figure 4.18 is the landscape arena, which is supra systemic to the
high-speed train regime framing national governments, the institutions of the European Union,
centers of knowledge, non-governmental organizations and end-users (Moretto et al. 2012).
Also visible are entities from other sector regimes, such as from energy, aeronautics,
automotive and materials impacting high-speed trains’ technology development.
At this arena interests and expectations are exogenous to the high-speed train technology
regime. Policy institutions are concerned about defining and meeting great challenges,
associated to policy initiatives (sustainable transport system, decoupling transport growth from
its negative environmental impact and energy dependency and boost competitiveness). End-
users (individuals) are concerned about meeting mobility needs (connectivity and accessibility,
reduction in travelling time and seamless journeys). Non-governmental organizations and
centers of knowledge are looking at specific interests within their areas of action.

!!
75
These actors are capable of producing framework changes. They can occur in different forms
such as “regular, hyper-turbulent, specific shock, disruptive and avalanche” (Geels and Schot
2007, p. 404). From what was described in the previous section for the AGV and the ICE-350E
technological transitions, landscape stakeholders produced changes at regime level impacting
sub-regime actors approaches towards technology decision-making, supply chain alignments
and technology transition from one generation of high-speed trains to the other.
Within the landscape arena strategic reports can be found, such as foresight exercises. They are
commissioned by policy actors to external bodies with the purpose of political guidance in
which technology to support meeting policy challenges and most recently meeting emergent
societal challenges.
One example found is the STOA report (Schippl, et al. 2008). The STOA report was
commissioned by the European Parliament aiming at presenting scenarios on the future of
medium to long distance transport system. From the bibliographic references and the list of
stakeholders participating in their workshops no evidence was found of links with the other
prospective exercises produced at the regime level. Instead report citations and stakeholders
invited appear to come from policy and research institutions acting within the landscape such
as the European Transport Conference and the European Commission Eurobarometer. This way
it can be considered as an exogenous assessment to the high-speed train industry on the future.
STOA is a report in which scenarios are constructed on an intended combination between
quantitative and qualitative indicators to address the societal dynamics of sustainability, using
backcasting, following a methodology aligned with constructive technology assessment.
b) Regime arena
Continuing the description of figure 4.18, at the middle of the graph is the regime arena
corresponding to the AGV and ICE-350E supply chain. It is formed by the sub-regimes
services, manufacturers and components, which have mutual and variable relations of
dependency (see sub-section 4.1.5 c) technology transfer). It is at the regime level where
knowledge is transferred between stakeholders from different sub-regimes (Moretto et al.
2012).
At the top of the regime arena, the sub-regime of public goods and services is visible.
Stakeholders located here are train operators, leasing companies and new entrants in railway
operations. They are service companies who establish the train-vehicle specifications required
to run the train in a dedicated national or international high-speed rail-corridor or just buying
or leasing the train out of the shelf (e.g. standardised). According to the released data by the

!!
76
UIC (2013) it exists in Europe over 20 high-speed train operators. They range from a private
open access operator as the Nouvo Transporto Viaggiatore102 (NTV) in Italy, to the franchising
schemes such as Virgin Trains103 in the UK, to consortia of national railway companies such as
Eurostar104 or Thalys105 and commercial branches of those same national operators such as
SNCF106 or Deutsche Bahn107.
The liberalization of the European railway has pushed aside train operators from controlling
technology decision-making process transferring it to the manufacturer. Operators now focus
on the service aspect of the business, with almost no technology ownership. This is even more
evident in leasing companies and new entrants from other sectors, which mainly look for
standardised trains and have no demands or competences for the technology development or
design. Overall, interests and expectations from these stakeholders are to overcome technical
operational problems, compliance with the track-infrastructure and regulations
(interoperability, safety, modularity, homologation, energy, weight, noise emissions, end-of
life, maintenance) as well as attractiveness to passengers (speed, comfort, availability, ticketing
prices).
102 NTV is a private company pioneer in open high-speed train access service existing since 2011. It runs the Italo ETR 575, AGV family manufactured by Alstom and Alstom Italia, at a commercial top speed of 360 Km/h, in the Italian high-speed network. It is in direct competition with the state-owned operator Trenitalia. Major stakeholders are MDP holdings 33,5%, IMI Investimenti S.p.A from Intesa Sanpaolo S.p.A (20%), SNCF French Railways (20%), Winged Lion Fund from Assicurazioni Generali (15%). Retrieved from Wikipedia (2013) NTV. 103 Virgin Trains UK is a franchising company who started in 1997, running the BR Class 390 (Pendulino manufactured by Fiat Ferriviária) at a speed of 201 km/h and BR Class 220, 221 and 222 at a speed of 201 km/h (also name Voyager by its manufacturer Bombardier). It is owned by Virgin Group (51%) and Stagecoach (49%). Retrieved from Wikipedia (2013) Virgin_Trains. 104 In 1994 it was launched Eurostar cross-channel services linking London Waterloo International Station, Paris Gar du Nord, Brussels Midi and Lille Europe. Until 2010 Eurostar was operated jointly by the national railways of France SNCF and Belgium NMBS/SNCB and the Eurostar UK Ltd (EUKL) a subsidiary of London and Continental Railways (LCR). By 2010 Eurostar became a single corporate entity called Eurostar International Limited (EIL). EIL is owned by LCR (40%), SNCF (55%), and NMBS/SNCB (5%). Eurostar fleet was build between 1992-1996, with TGV 373 units (named class 373 in the UK) manufactured by Alstom but assembled in different sites in France and UK, running at a top commercial speed of 300 km/h. In 2010 the fleet was extended to Velaro e320 manufactured by Siemens to operate in the extended rout network London, Cologne and Amsterdam, at a commercial top speed of 310 km/h. Retrieved from Wikipedia (2013) Eurostar. 105 Thalys International, based in Brussels, started operations in 1996, initialling servicing the link between Paris and Brussels. Today it reaches Amsterdam and Cologne. The trains run at a commercial speed of 300 km/h. Its fleet is composed by TGV units manufactured by Alstom. Its capital is divided between SNCF (62%), NMBS/SNCB (28%) and Deutsche Bahn (10%). Retrieved from Wikipedia (2013) Thalys. 106 SNCF Société Nationale des Chemins de Fer Français is the French national state-owned railway company. The SNCF operates the country national rail services including the TGV. As it will be further described it was SNCF during the nineteen seventies that began the development of the TGV, in collaboration with the French manufacturer Alstom. Latter in 1981 SNCF first started in Europe operations of high-speed trains. Retrieved from Wikipedia (2013) SNCF. 107 DB Deutsche Bahn AG, based in Berlin, a private joint-stock company (AG) with the German federal government as the main stakeholder. It is the holding of DB Fernverkehr that operates long-distance passenger travellers including high-speed Inter-City-Express (predominantly running in Germany) and EuroCity (international). It was founded in 1999 in the second stage of the privatisation of German Federal Railways. Its fleet is composed of ICE trains, or Velaro, manufactured by Siemens, running at a speed between 280km/h to 320km/h.
!!
77
These actors may cause technological “regular changes” to the framework conditions, but likely
to be confined to the regime arena, while tending to resist to events that change the status quo.
Such contrasts with their vulnerability to landscape “turbulences, specific shocks and
disruptions”, such as the European railway packages and changes in mobility patterns.
Continuing the description of the regime arena, in figure 4.18 in the center-right, the sub-regime
of production of goods is visible. Stakeholders here are the assemblers of high-speed train
technology (the vehicle manufacturer) capable of providing turnkey projects. In Europe they
are Alstom Transport (French), Ansaldo (Italian), Siemens Mobility (German) and Talgo
(Spanish)108. These firms are global players in today’s railway open markets but of a strong
national identity yet reflected by decades of nationalized business conditions.
High-speed train manufacturers are the technology owners inherited, in most of the cases, from
their national counterpart operator company. Their overall interests and expectations are the
reduction of costs, compliance with regulations and attractiveness to customers and most
recently to end-users (such as access to markets, low costs in development and manufacturing,
standardization, modularization, safety, recyclability and end of life, energy savings, weight,
noise abatement, power distribution, wheel rail contact fatigue, interiors, materials and
aerodynamics).
Also at this sub-regime manufacturers might introduce “regular changes” from landscape
pressures, but also and most important, they can cause technological “disruptive” changes to
gain strategic markets. They are subject to “avalanche” pressures from the sub-regime of
knowledge providers and in particular situations from the niche arena. However due to the large
and complex technology system is a demanding, costly and time consuming task for train
assemblers to integrate disruptive technologies in the vehicle. An invisible force can be also
felt from potential new entrants such as manufacturers from other parts of the world or
component suppliers with increasing technology capacity resulting from outsourcing or their
market scales.
Finally, at the bottom of the regime arena in figure 4.18, is found the advanced knowledge
providers’ sub-regime. Stakeholders here cover different tiers of the technology supply-chain,
ranging from tier one of component suppliers of the high-speed train technology sub-systems,
such as Knorr-Bremse (pneumatic, hydraulic and electronic braking systems), Bosh (coolers
and cooling systems, hydraulic travel drivers), Voith (wheel sets, couplings, gears, cooling
systems) MTU (engines), Efacec (telecommunication systems, power supply system)
Bochumer Verein and Bonatrans (wheel sets), Faiveley (air conditioning, coplers,
108 Despite the relevant presence of Bombardier in Europe it is a Canadian company, not an European one.

!!
78
electromechanic door and gates systems), Saft (accumulators, industrial cells and
supercapacitors), Selectron (control systems), to the tier two and so forward, such as Amorim
Corck Composites (bio-composites for car body sandwich panels, floor and isolation from noise
and vibration). This sub-regime also includes knowledge suppliers resulting from University
spin-offs.
In Europe component suppliers from tier one might even pair in turnover and technology
capability with their clients, the technology assemblers. In the past decade the increase in
outsourcing from train manufacturers conferred to them a greater weight in the technology
development. As a result those firms became capable of producing from “regular” to
“disruptive” pressures and changes to the arenas of regime and niche. At the same time they
became more vulnerable to landscape changes. Also here an invisible force comes from
potential new entrants and moreover from firms’ alliances and acquisitions.
Component suppliers of technology and knowhow main interests and expectations are similar
and might be confused with those of the train manufacturers, in which respects to reduction of
costs, compliance with regulations, reliability and attractiveness to customers. This occurs
because they are specialized suppliers of a particular technology sub-system of the high-speed
train. They are subject to tight quality standards requirements and certification procedures
imposed by the assemblers of the vehicle. With this purpose in mind, the International Railway
Industry Standard109 (IRIS) was formed in 2005.
Within the regime arena, stakeholders tend to cluster in professional associations at European
level, acting like clubs of shared visions, perceptions and interests. During the past two decades
they have multiplied and professionalised. Those include the UIC the International Union of
Railways (rail operators, leasers and infrastructure managers) and UNIFE the Union of
European Railway Industries (manufacturers and component suppliers of vehicles and
infrastructure). More targeted interest associations are ERWA the European Rail Wheel
Association of Manufacturers, EIM European Rail Infrastructure Managers, CER Community
of the European Railways and Infrastructure (policy wing of UIC), ETF European Transport
Workers Federation and EPITOLA the European Passenger Train and Traction Operating
Lessors Association. National associations have also to be considered as for example FIF the
French Railway Industry Association or RIA the United Kingdom Railway Industry
Association and the VDB, the German Railway Industry Association.
Each of those listed associations serve specific groups of stakeholders, which sometimes
overlap in members and mission. Others such as ERRAC, the European Rail Research Advisory
109 For more information see www.iris-rail.org.

!!
79
Council, combine all of the existing associations plus landscape stakeholders as member states
representatives and end-users, sharing the same goal of an integrated rail research area to foster
innovation in the rail sector.
At regime arena were found three types of future exercises. The first type is visions and road
maps, such as ERRAC110 visions (ERRAC 2001 and 2007), produced at regime level by the
railway community, combining interests and expectations of sub-regimes plus actors from
landscape and niche arenas. Forecasting exercises, such as UNIFE market outlook 2020 (BCG
2008) commissioned to consultants at sub-regime level by the association of providers of
services or manufacturers, as means to jointly anticipate market trends and future technology
needs. And finally individual market outlooks and forecasting, such as Siemens (reports 2006,
2009), with the same character as the previous one, differing only the fact that it results from
the interest of a stakeholder alone to anticipate its future positioning in the market and defend
its only interests and expectations.
It was found that those reports have in common a techno-centric vision about the future, in clear
contrast with the one found for STOA report. They are inclusive of each other prospective
exercises, meaning that for example UNIFE market outlook aggregates data from its members
individual forecasting exercises, combining them together at sub-regime level. In its turn
ERRAC visions integrates those professional associations forecasts in the specific area of
research and innovation at regime arena. Higher is the level in which prospective exercises are
produced in the technology innovation-chain wither is the engagement from different
stakeholders. However, the above seems to disregard results from exogenous prospective
exercises such as STOA. Only Siemens clearly referred to other sector’s Delphi results such as
for energy. Moreover, found reports methodology reflect commissioning stakeholders’ life
cycle cost approach based on quantitative indicators, bypassing qualitative elements inherent
to today’s emergent societal challenges.
c) Niche arena
At the arena stakeholders are mainly from academia and private research institutions, spin-offs
and SMEs, all of which are providers of basic and frontier research of potential application in
the railway vehicle technology system and sub-systems. They are quite diffused, as those
institutions do not dedicate exclusively to railways. The EurNEX European Rail Research
Network of Excellence is a joint initiative, driven by operators and industries supported by the
European Commission, to group such diffused scientific actors from all over Europe in the area
110 ERRAC comprises 45 representatives from each of the major European rail research stakeholders: manufacturers, operators, infrastructure managers, European Commission, European Union Member States.

!!
80
of transport and mobility. Among their members is Chalmers University of Technology,
Technical University of Lisbon, Technical University of Berlin, Newcastle University,
Politechnical University of Madrid, University of Valenciennes, Technical University of Viena,
Czech Railway Research Institute, to name a few. It was interesting to find spin-off companies
as INECO (transport engineering firm).
These types of stakeholders are classified as advanced knowledge providers but falling within
the specific niche arena (therefore outside regimes). However, the frontier between the two in
the specific case of the high-speed train is very blurred as stakeholders’ part of advanced
knowledge providers are motivated by the problems from existing sub-regimes. Specifically in
the railways radical novelties, even if stabilized, do not easily breakthrough in the regime arena.
Only if a window of opportunity arises from pressures from the landscape arena, radical
novelties are implemented and new players can enter.
The high-technology content and complexity of a high-speed train combines different areas
such as mechanical engineering, computational, materials, managerial expertise, finance, to
name a few. Moreover, due to the large scale of the technology system and traditional
protectionism towards information sharing, in many cases the technology has evolved from
already tested and matured solutions at regime arena rather than breakthrough research from
the niche one.
In contrast with the other two arenas, no prospective exercises were found. In fact, the
stakeholders from this arena are brought into regime or landscape level discussions to undertake
the studies or are invited to take part in the collective elaboration of visions. That is clearly the
case of the ERRAC visions or the STOA report.
4.3.3. Findings
From the analysis of the multi-level-perspective during the development period of the AGV
and ICE-350E it became evident that each report reflected the technological arena of the
commissioning stakeholders. Those reports were mainly produced at regime level to meet the
strategic purposes of understanding the future business conditions introduced by the
liberalization of the railway market in Europe, while aiming at influencing future technology
developments favorable to the commissioning stakeholders. Less covered by the reports were
the perspectives from landscape where societal actors could be found. During this particular
period those societal actors were mainly non-governmental organizations and specific interest
groups.

!!
81
It is relevant to note that two dominant groups of reports were observed: collective and
individual techno-centric visions (endogenous to the AGV and the ICE-350E supply chain),
and policy foresight reports (exogenous to the AGV and the ICE-350E supply chain). Such
represents a discontinuity in the alignment of the different multi-level perspectives. This
requires additional research, by extending the reports studied beyond the development period
of the AGV and the ICE-350E and further studding the methodology they apply and the
composition of their experts. These will be addressed in the next section (4.4) covering the
anticipation though future strategic formulations.

!!
82
4.4. Anticipation through future strategic formulations
4.4.1. Introduction
As it was seen in the section 4.2. about technology transitions, the White Paper on Transport
(COM (2001) 370) was widely seen as a wake-up call for railways to embrace modernisation
and foster new technological developments by developing the AGV and the ICE-350E high-
speed trains.
To tackle the announced new market conditions, those two high-speed trains reflect the new
technical requirements (of modularity, interoperability, sustainability and safety) and new
alignments in their manufacturers decision-making approach (from tactical to strategic).
From this phenomenon emerged in this industry greater anticipation (aiming and influencing
and knowledge exchange) in the form of prospective reports and visions, as introduced in
section 4.3 on multi-level-perspective. I found that over a dozen of relevant public reports had
been produced since111, such as STOA scenarios (2005, 2013) and TRANSvisions (2009)
commissioned by the European institutions; the European Railway Technology Platform
visions (2001 and update 2011), agendas (2002, 2007) and roadmaps (2012); UNIFE industrial
association market outlooks (2006, 2008, 2010, 2012, 2014) and train manufacturers’ internal
forecasts and future reports such as those of Siemens (2006, 2009, 2010, 2011).
Particularly striking, as it will be demonstrated, are the reports from the European Technology
Platform for railways (ERRAC)112,113. The platform’s visions from 2001 were the result of
unprecedented collective exercises towards a common envisaged future, which culminated in
the articulation of a unified direction, with new collective technological path dynamics in stark
contrast to the once nationalised and fragmented sector. We can call it a new “technological
path” (Robinson and Propp, 2008) due to the resulting realignment of stakeholders and newly
established interdependencies.
The technology areas suggested by the articulated vision documents were reflected in the
funding programmes of the European Commission’s 6th Framework Programme (FP6).
Collaborative research and development projects funded by FP6 significantly contributed to the
high-speed train technology transition towards the third generation of vehicles. With the ICE-
111 The wide spread of FTA across Europe has its origins in the UK, introducing scenarios in the late 1990s (Potter and Roy, 2000) to assist the privatization of its railways during 1993 (Armstrong and Preston, 2011). 112 http://www.errac.org. 113 Actually ERRAC scenarios directly benefitted from UK experience due to Network Rail Chairmanship.

!!
83
350E and the AGV series launched in 2006 by Siemens and in 2008 by Alstom, integrating
some of results from projects as MODTRAIN114 (modularity), EUDD115 (interoperability),
RAILENERGY116 (sustainability) and Safeinteriors117 (safety).
The promise of commercialization of the eagerly anticipated new generation of “champion-
trains” was soon after frustrated by the successive financial crises occurring from 2008, putting
on hold the planned investments with respect to rail tracks and orders for the new series of
vehicles. Parallel information and communication technological advancements further
challenged the railway system, particularly the rapid rise and societal uptake of digital
technologies, to include, for example, the connected traveller.
These supra-systemic and diffuse waves of events revealed a gap between techno-centric
exercises in future technological strategic formulations (e.g. Future Technology Analysis - FTA
– as referred by the European Comission Joint Research Center) of predicting technological
trajectories (Dosi 1982) and the new open-ended diffuse societal challenges.
New types of societal stakeholders that were previously unknown to the railways have emerged
as important. These include social networks or movements supporting specific causes, like “ride
sharing services” or “carbon footprints”. They might not be directly concerned in the
development of high-speed train technology but have the capability of impacting its technology
system.
Railway operators are responding by extending their service to door-to-door transportation and
looking to ICT to integrate services. Moreover DB and SNCF have been champions in
providing bicycles and car sharing to users of their train services. In their turn, train
manufacturers are now revising life cycle costs, as well manufacturing times and developing
maintenance free vehicles; while pushing for market uptake of results from the past decade of
collaborative research with the latest initiative SHIFT2RAIL joint undertaking occurring in
June 2014.
In this most recent process of reorientation in railways, future strategic formulations became
even more relevant, requiring this time to go beyond alignments within the techno-centric
supply chain.
114 http://modtrain.com/ 115 http://ec.europa.eu/research/transport/projects/items/euddplus_en.ht 116 http://www.railenergy.org/ 117 http://www.eurailsafe.net/

!!
84
In this section I will be further boarding the study of prospective reports extending the time
period from 2001 to our days, the methodology they apply and the composition of the experts.
The purpose is to understand if they miss the adequate methodlogies to bridge techno-centric
visions with the new emergent societal challenges.
4.4.2. Methodology
This section is about a qualitative study on FTA practice in the railways sector by referring to
the case of the AGV and ICE technology system. A characterization is made on the types and
role of FTA in the European high-speed railway technology system by analysing and
characterising found reports and contrasting them with actual developments of the high-speed
railway sociotechnical system. The analysis draws on a broad range of concept models arising
from different theoretical streams in the sociology of innovation, science and technology
studies and constructive technology assessment.
As a first step I classify public available FTA reports addressing the high-speed train technology
system, based on Robinson and Propp classification (2011, p.23, table 2) to which I added two
main elements “function” and “approach”, besides “year of issue” and “stakeholders” involved.
In the construction of the element “function” I bring in my interpretation on Schippl (2013, p.3)
function of scenarios. While for the “approach” I base on the type of stakeholders’ inputs to the
report. Calling on Grunwald (2011) I attribute “function” to “outputs” while “approach” to
“inputs” from stakeholders exogenous or endogenous to the supply chain.
I further proceed locating the types of activities on the high-speed train innovation trajectory
(transitions) over time using the s-curve model. I consider the high-speed train performance
based on the speed (Zhou and Shen 2011) and adoption (number of service providers operating
high-speed trains).
Then I contextualize FTA in the multi-level framework referring to the transition to the third
generation of high-speed trains. I make use of the multi-level framework of Geels (2002) in
combination with Pavitt (1984) technology transfer taxonomic model, extended to services by
Castellacci (2008).
I further narrow down the deployment of FTA in the high-speed train technology system by
referring to the specific collaborative research project MODTRAIN as ways to understand FTA
contribution.

!!
85
Finally, I conclude reflecting on constructive technology assessment bridging function between
technology and wider society (Schot and Rip 1997, Rip and Schot 2001), which will feed the
conclusions.
The data and facts here presented are based on secondary data retrieved from the identified
public available reports and inside views from the commissioning authors and drafters,
collected at different occasions.
4.4.3. FTA and the European High Speed Railway system
- Classification
Public FTA reports addressing high-speed trains were classified based on the table from
Robinson and Propp (2011, p.23, table 2) referring to “methodology, objectives, outcomes and
nature”, and to which I added the year of issue, function, stakeholders and approach.
FTA report
Year
Func
tion
Stakeholders Methodologies
Objectives
Outcomes
Nat
ure
App
roac
h
STOA scenarios
2008 2012
Polic
y-m
akin
g European Parliament, third party assessment, group of external experts mostly from academia and policy
Social, science analysis
Back casting Functions of expectations; relationships between emerging and incumbent technologies
Connections between technologies and grand challenges are mediated; they emerge from interactions between technically and socially enabling factors per future path
Pros
pect
ive
Ex
ogen
ous
TRANSvisions 2009 European Commission, third party assessment, group of external experts
Delphi
ERRAC vision 2001 2011
ERRAC Secretariat, ERRAC members: associations UNIFE, CER, EIM and individual value chain firms and national gov.
Rationale of expectations-mapping
Workshops (plenary)
Endogenous futures (techno-centric) and enabling conditions
Ongoing interactions in areas of concern
Des
crip
tive
Endo
geno
us
ERRAC Strategic research agendas* Roadmaps **
2000* 2007*
2012**
Stra
tegy
-mak
ing Techno-
organizational mapping
Working groups
Actors activities (and we should add competences)
Innovation Chain horizontal and vertical links and merging supply chains
UNIFE market-outlooks
2006 2008 2010 2012 2014
External Consultant, UNIFE secretariat and members from industry
Forecasts
Siemens futures
2006 2009 2010 2011
Internal Vary from scenarios, Science fiction, forecast
Table 4.1. Classification of reports on future oriented technology assessment (FTA) referring to the high-speed train system
From the classification of the reports in table 4.1 I found two types of reports: a) endogenous,
the great majority, with a total of 14 reports and b) exogenous, the minority, only 3 reports.

!!
86
The endogenous reports, of industry inputs and initiatives, are about techno-centric exercises,
serving mainly as output strategic purposes (selecting promising technologies, engagements,
influencing technological directions) and present these strategic aims in a descriptive nature
(communicating capabilities, expectations and values on certain issues, mutual learning).
The exogenous reports commissioned by the European Commission and the European
Parliament present both a policy-making function as outputs (legitimizing options) and a
prospective nature as input to improve understanding of possible cause-effect relations in a
broad sense within high-degrees of uncertainty.
a) Endogenous reports:
The endogenous reports as seen in table 4.1 include ERRAC visions (2001, 2011) strategic
agendas (2002, 2007) and roadmaps (2012), UNIFE market outlooks (2006, 2008, 2010, 2012,
2014) and Siemens futures (2006, 2009, 2010, 2011).
ERRAC visions are the only endogenous reports meeting a policy-making function, specifically
oriented to target the European Commission. While ERRAC agendas and roadmaps, UNIFE
market outlooks and Siemens futures are dominated by a strategic purpose of alignments within
the supply chain.
Following on Robinson and Propp (2011) classification, ERRAC visions are rationales of
expectations mapping; resulting from workshops in plenary prepared internally by the
secretariat of the platform; which objectives are endogenous futures (techno-centric) and
enabling conditions; producing ongoing interactions in areas of shared concern. ERRAC
strategic agendas and roadmaps as well as UNIFE market outlooks and Siemens futures, share
the same techno-organizational mapping, based on a variety of methodologies; which
objectives are actors’ activities and competencies. Only UNIFE market outlooks are actually
commissioned to a third party, with all the other endogenous reports being drafted internally.
b) Exogenous reports:
Passing to the exogenous FTA exercises, and continuing with Robinson and Propp (2011)
classification, they include STOA scenarios (2008, 2013) and TRANSvisions (2009). See table
4.1.
These reports present a clear policy function, of the initiative of the European Parliament and
European Commission, contracted to a third party, involving external experts to railways with
a broad knowledge on transport mainly coming from research centers. In particular, STOA
follows a social science analysis approach, using backcasting; objectives are functions of
expectations; relationships between emerging and incumbent technologies; producing
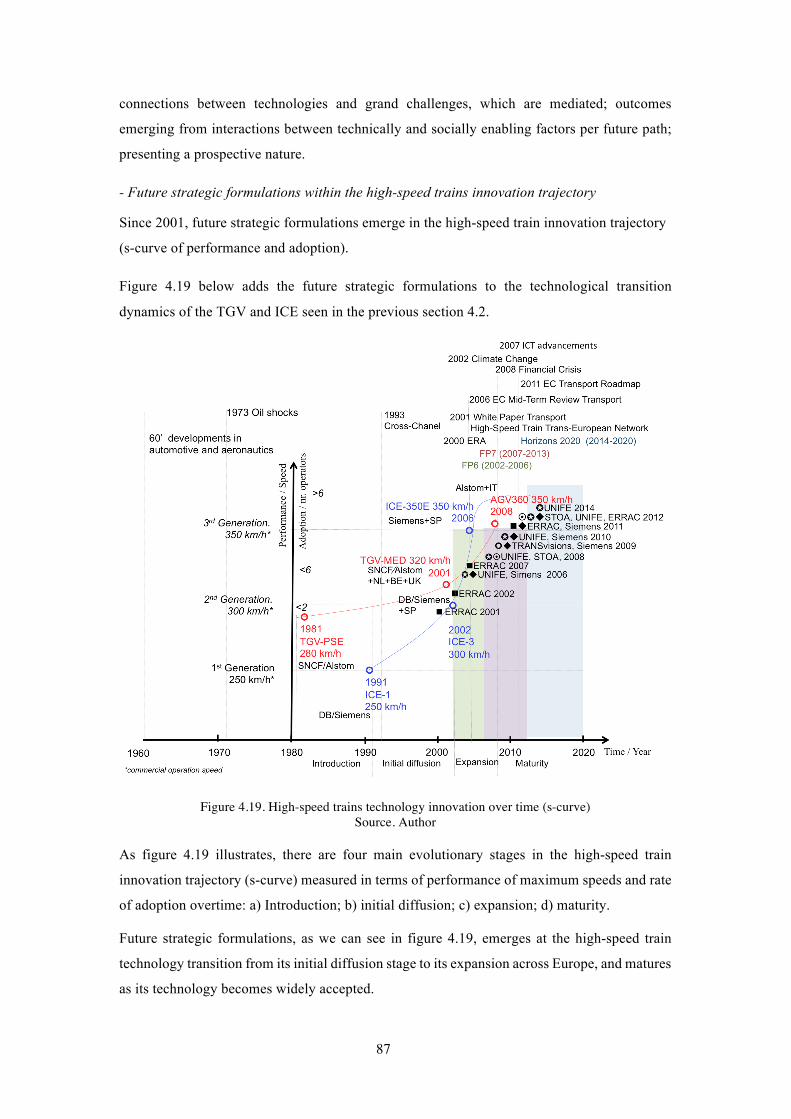
!!
87
connections between technologies and grand challenges, which are mediated; outcomes
emerging from interactions between technically and socially enabling factors per future path;
presenting a prospective nature.
- Future strategic formulations within the high-speed trains innovation trajectory
Since 2001, future strategic formulations emerge in the high-speed train innovation trajectory
(s-curve of performance and adoption).
Figure 4.19 below adds the future strategic formulations to the technological transition
dynamics of the TGV and ICE seen in the previous section 4.2.
Figure 4.19. High-speed trains technology innovation over time (s-curve) Source. Author
As figure 4.19 illustrates, there are four main evolutionary stages in the high-speed train
innovation trajectory (s-curve) measured in terms of performance of maximum speeds and rate
of adoption overtime: a) Introduction; b) initial diffusion; c) expansion; d) maturity.
Future strategic formulations, as we can see in figure 4.19, emerges at the high-speed train
technology transition from its initial diffusion stage to its expansion across Europe, and matures
as its technology becomes widely accepted.

!!
88
a) Introduction stage (late 50’s-1991): technology driven (increase train speeds)
As seen before in Europe the two train operators the French SNCF and the German BD have
been the pioneers in increasing the speeds of trains, lasting since the 1950’s to our days. They
introduced the first generation in 1981 with SNCF’s TGV-PSE, followed in 1991 by DB’s ICE-
1, running at commercial speeds of 289 km/h and 250km/h respectively.
The technology development at that time was done on their own, in-house, in cooperation with
flag manufacturer (SNCF / Alstom and DB / Siemens) requiring great efforts and progressing
very slowly (the SNCF started evaluating running at very high speeds since it received the first
CC7100 electric locomotives of higher power already in 1954 but only in 1981 the first high-
speed train was introduced to service).
At this stage future strategic formulations were not actively pursued, only cost and benefit
analysis ex-ante on specific corridor projects to justify governmental decisions. The technology
decisions here were tactical, based on the available resources (in France SNCF option to go for
incremental innovation of full electric power high-speed train Zebulon, the TGV prototype, was
precipitated by the oil shocks in 1973, putting aside contemporaneous developments as the
disruptive Aérotrain or even the turbo train TGV001; in Germany the introduction to service of
high-speed train was delayed during years because of disagreement between the government
and DB in relation to the type of lines in which it should run, mixed vs dedicated lines).
b) Initial diffusion (1981-2002): efficiency driven (adapting trains to different network
conditions)
When developing the second generation of high-speed trains SNCF and DB were looking for
efficiency while further increasing speeds. The SNCF/Alstom TGV-MED was introduced in
France in 1991 and the DB/Siemens ICE-3E in Spain in 2002, running at commercial speeds
of 320km/h and 300km/h respectively.
High-speed trains gained legitimacy, with Alstom and Siemens deeper understanding of the
technology system from national operations and expansion to other countries (in 1994 the
channel crossing link UK-France-Belgium, and in 2002 Spain).
Yet developments from the first to the second generation were slow (taking 20 years). They
were about endogenous renewals with manufacturers adapting the existing vehicle technology
platforms to specific orders requirements for cross-border operations or costumed to new clients
(example improvements in aerodynamics, wheels, breaks, power cars and articulation cars
configurations).
As in the first generation technological decisions were tactic, based on available resources,
supported by ex-ante cost-benefit analysis undertaken by governments. First step is however

!!
89
given towards future strategic formulations across railways in Europe when UK first introduces
scenarios (Potter and Roy, 2000) to identify innovation priorities in the liberalized railway
market happening from 1993.
c) Expansion (2001-2008): interoperability driven (removing technical bottle-necks across-
borders)
The transition to the third generation of high-speed trains culminates with the
commercialization of the AGV in Italy in 2008 and ICE350E in Spain in 2006 running at speeds
of 360 km/h and 350 km/h respectively.
Developments between 2001 to 2008 integrating fragmented technology systems in an
interoperable one was a clear response from the two dominant manufacturer, Alstom and
Siemens, to the liberalization of the railway market and announcements of massive investments
for the completion of the trans-European high-sped rail, announced in the White Paper on
Transport (COM (2001) 370).
The European Union’s Railway Packages implementing the White Paper in its turn were ruling
financial restrictions to state aid, requirements for technical interoperability, modularity and
high safety standards, standard gauge and electric multiple units, etc.
Cost reduction became an important element for the manufacturers, aiming to increase their
competitiveness in order to survive and expand business in the new open market conditions.
Including improved components technology interfaces; as well reduce time for assembly and
reduction of life cycle cost.
For the first time Alstom and Siemens came in direct competition developing simultaneously
the third generation of trains, the AGV and ICE350E. Siemens overpasses Alstom with the
commercialization of the train to the Spanish RENFE.
The AGV and the ICE350E, represented the reorientation of technology trajectories towards
out of the shelf vehicles capable of meeting a greater number of operators, overcoming a legacy
of costume-made vehicles.
The development of the third generation of trains accounted with many hours of strategic
meetings at European level between Alstom or Siemens staff and supply-chain stakeholders,
including direct competitors, ranging from component suppliers to service operators, including
academia and end-users.
Future strategic formulations surged here, opening the way for those interactions to happen.
The first exercise was ERRA vision (2001). It met a policy-making function to contribute to

!!
90
the European Commission drafting the successive calls of the six-framework programme for
research (from 2002 to 2006), instrument implementing its research policy. The vision
identified research areas reflecting the White Paper on Transport (COM (2001) 370) set targets
as modularization, standardization, improve environmental performance (noise and vibration,
CO2 emissions from diesel engines, end-of life) and safety. ERRAC strategic research agenda,
followed just after (2002) allowing for supply chain alignments.
Collaborative projects resulted such as MODTRAIN and the EUDD Drivers Desk and other
technical joint works as the former AIF which selected results were then integrated in the high-
speed trains.
In 2006 the European Commission mid-term review (COM (2006) 314) of the White Paper on
Transport reaffirms the strategy’s main guiding principles while directing the industry attention
to new landscape developments (EU enlargement, the acceleration of globalisation,
international commitments to fighting global warming and rising energy prices).
At this stage future strategic formulations significantly contributed to the acceleration of the
technology developments (only 7 years separating the second from the third generation of
trains). The industry saw in future strategic formulations a privileged instrument of anticipation,
influence and knowledge exchange to cope with this new market and regulatory conditions.
d) Maturity (from 2008): quality and capacity driven (attractiveness to passengers)
In our days the major issue for railways is quality, increase capacity and getting the core
business right.
In 2010 the market for international rail passenger services in the European Union opened up
to competition while emerging low-cost airlines.
The high-speed technology performance in terms of speed, reached its inherent limits (example
increase speeds beyond 350 km/h are limited by safety and infrastructure, flattening the
technology s-curve as shown in figure 4.19.
Alongside this technical limitation, railway market growth in Europe was inhibited by the
financial crisis, with railways struggling to have returns on the previous years of investment in
developing the third generation of trains and in the building of new corridors.
These uncertain conditions resulted in a proliferation of a second wave of future strategic
formulations reports, which were targeted at managing this uncertainty through anticipatory
coordination.

!!
91
Manufacturers and operators became aware of the strategic relevance of future strategic
formulations in this industry to deal with the changing conditions (Siemens issuing since 2006
a series of reports focusing on its capacity and UNIFE also from 2006 is producing market
outlooks every two years).
The breadth of the supply chain that participated in ERRAC also highlighted the importance of
sector dynamics including bottom-up alignments (this was reflected in their strategic research
agenda update in 2007 and introduction of a roadmap in 2011).
Also policy institutions such as the European Commission and the European Parliament
envisaged revising the setting of transport targets by contracting third parties to perform FTA
(STOA 2008 and TRANSvisions 2012).
This future strategic formulation provided input for the generation of new research projects
under the 7th framework programme such as TRIOTRAIN projects118 (towards common virtual
certification) and contributed to the 2011 the European Commission roadmap on Transport
(COM(2011)144), “Transport 2050”, aiming at increase mobility while reducing emissions,
reaffirming rail central role for medium-distance transport.
- Future strategic formulations and the high-speed train multi-level perspective
Future strategic formulations exercises are the expression of multi-level perspectives. They
reflect, collective or individual, assumptions (on users, markets, regulation and technical
progress), expectations, values and cultures, ultimately providing guidance to R&D activities,
especially when translated into agendas and search. Furthermore, FTA is a strategic instrument
used to attract attention and resources from other actors.
Figure 4.20 below develops figure 4.18 by introducing strategic reports issued after 2008.
118 TRIOTRAIN (2009-2013) http://www.triotrain.eu/index.htm

!!
92
!Figure 4.20. Future strategic reports and multi-level perspective since 2001 to our days
Source: author
From figure 4.20 one can observe that future strategic reports are for the majority industry
initiatives occurring in the regime arena at meso-level. Here I follow the multi-level framework
of Geels (2002). Evidences show that future strategic reports at this level describe the overall
interests and expectations from its participating stakeholders. Moreover it can be seen that the
larger the collective of stakeholders involved is, the lower the technology alignment between
them.
For example, the ERRAC visions, strategic research agendas (SRAs) and roadmap, are
alignments of the broad of interests of its members (ongoing interactions of common concerns).
Interests vary according to each member’s position in the supply chain. Another example,
operating companies envisaged that to overcome technical operations problems, compliance
with infrastructure and regulations (interoperability, safety, modularity, homologation, energy,
weight, noise emissions, end-of-life, maintenance) as well as attractiveness to passengers
(speed, comfort, availability, and ticketing prices) was necessary. Also deemed necessary was
that, while train manufacturers and their component suppliers aimed at production cost
reductions, compliance with regulations, customers (operators) requirements and most recently
attractiveness to end-users were thought of as a key driver. Alongside the manufacturing and

!!
93
production part of the system, academic scholars also were part of the ERRAC vision, with the
academy looking to further develop knowledge in this area; where member states are
considering territorial cohesion and GDP growth.
It was found that ERRAC reports are drafted internally by its secretariat. Their contents result
from plenary workshops and focus groups where ERRAC members meet. In these workshops,
members identify future technological areas of common interest and enabling conditions are
then further developed by ERRAC strategic research agendas (SRAs). They reflect the rational
of expectations, capabilities, alignments and knowledge exchange.
ERRAC reports however vary in their function. ERRAC vision for instance have a policy
function, targeting mainly the European Commission through the inclusion of its
recommendations in the policy agendas and instruments (mainly from the past Six frame-work
programme for research 2002-2006 and the Seventh 2007-2013; continuing to the current one
Horizon 2020 from 2014-2020); while the SRAs and roadmaps have a strategy function,
targeting the supply chain to indicate the technology path in the direction of the envisaged
future.
Less broad in stakeholders, UNIFE market outlooks or individual reports as from Siemens
cover a specific level of interests within the supply chain (the ones of the manufacturers and
their suppliers) naturally much more aligned in the technological areas of shared interest. Their
methodology is based on technological-organizational mapping of actors and their activities
and competences. In UNIFE collective market outlooks for instance it is clear that their reports
result from the integration of vertical and horizontal forecasts from its members.
These types of reports are inclusive of each other prospective exercises. Meaning that the
UNIFE market outlook integrates data from its members internal forecasting exercises,
combining them together at sub-regime level. In its turn the ERRAC visions integrate those
forecasts by professional associations in the specific area of research and innovation at regime
arena. Higher is the level in which prospective exercises are produced in the technology
innovation-chain lower is the engagement from different stakeholders.
However, the above said seems to disregard exogenous prospective exercises such as STOA or
TRANSvisions. Only Siemens clearly referred to other sector’s Delphi results as for Energy.
Moreover the methodology of endogenous reports’ reflect commissioning stakeholders life
cycle cost approach based on quantitative indicators, bypassing qualitative elements inherent
to today’s emergent societal challenge, such as sustainability and mobility.
Exogenous reports, such as STOA report and TRANSvisions, are commissioned by policy

!!
94
actors to a third party with the purpose of political guidance of technology development to
support responding to policy and societal grand challenges. They have a policy-making
function and in particular STOA introduce social sciences in its methodology. A third party,
accounting with the contributions from experts that are outside the railways supply chain,
conducts these reports. Despite using recognised intelligence tools such as Backcasting or
Delphi, both reports share common objectives of monitoring expectations and relationships
between emerging and incumbent technologies. To note is that in STOA report (2005, 2012)
the outcome results from the mediation on the connection between technologies and grand
challenges and from the interactions between technical and societal enabling factors. The level
of technological alignment in specific technology systems as the high-speed train is low. But
again, those reports do not make any reference to the industry ones and the involved
stakeholders are not the same.
- Future strategic formulations and the high-speed train technology system
The technical innovations introduced by the third generation of high-speed trains system AGV
and ICE-350E were driven from future strategic formulations.
As referred before (sub-section 4.1.5) the high-speed train vehicle is a very complex technology
system119 in itself, integrating hierarchical120 subsystems until it reaches a point at which
components are the minimal elements of the system, each of which manufactured by different
stakeholders at differed levels in the supply chain integrated by the system manufacturer.
Future strategic formulations coincide with the liberalization of the railway market placing the
technology development of high-speed train under the manufacturer’s responsibility. In this
situation, manufacturers become the sole actors who are knowledgeable of the overall
architecture of the interoperable trains and their sub-systems interfaces. However, as
outsourcing increases for costs-reduction, their knowledge decreases as the sub-systems
themselves sub-divide.
Manufacturers attribute different strategic relevance to sub-systems (as shown in figure 4.10).
Structural parts or bogie have high-strategic relevance, as they are in line with the
manufacturers core competencies. They are developed in-house and co-developments take
place under tight and restrictive confidentially agreements. On the other hand, outsourced
technologies such as interiors or materials provide a situation conducive to greater openness to
119 Simon (1962, p. 468) "Roughly, by a complex system I mean one made up of a large number of parts that interact in a non-simple way. In such systems, the whole is more than the sum of the parts, not in an ultimate, metaphysical sense, but in the important pragmatic sense that, given the properties of the parts and the laws of their inter- action, it is not a trivial matter to infer the properties of the whole”. 120 Simon (1962, p. 469) " (...) parts within parts structure”.

!!
95
collaborative innovation and broad consortiums exist which are ruled by cooperation
agreements.
As we mentioned previously, the ICE 350E and the AGV integrate collaborative research
projects results meeting FTA orientations. The most referred to example is MODTRAIN121
integrated collaborative project (FP6), conducted between 2004 to 2008, involving 36 partners,
of a total budget of 30 million Euros (which 16 Million were funded by the EU).
This highly technical project addressed performance improvements (affordable and attractive
interoperable rolling stock) identified in the business scenarios listed in the ERRAC Strategic
Rail Research Agenda (2002) as overall transport growth (40% for passengers to 7500 billion
passenger/km is expected in 2020) and transport demand increase (passenger market share will
almost double and market volume will triple in comparison to 2000).
At the time of its preparation (2002-2003), a new legal framework was being introduced with
the two first Railway Packages (High Speed and Conventional Rail Directives) supported by
the Technical Standards for Interoperability (TSIs) and voluntary norms.
Train manufacturers were particular concerned about the risk that new trains were being subject
of independent interpretations of the requirements set by the legal framework as well as on
unproven prototype sub-assemblies falling outside system integrators tight certification
procedures.
This way, main European railway systems manufacturers (Ansaldo Breda, Alstom, Siemens
and Bombardier), sub-systems suppliers (Knorr-Bremse, Deuta Werke, Lucchini, and others)
railway operators (SNCF, DB and FS) and professional associations (UNIFE, UIC, VBD, FIF,
ANIE and RIA) joined efforts to collectively identify the interoperable constituents, validate
and promote them at industry level122.
The project breaks down into four architectural parts (work packages) where possible
standardization could emerge: bogie and running gear (MODBOGIE), train control and
architecture (MODCONTROL), onboard power systems (MODPOWER), man-machine and
train to train interfaces (MODLINK), dissemination (MODUSER), driver’s interface
(EUROCAB), passenger interfaces (EUPAX) and train interfaces (EUCOUPLER).
As technical implications MODTRAIN provided the high-speed train market with a set of
agreed specifications that allowed for better inter-changeability of key components for
121 www.modtrain.org. MODTRAIN was concentrate on fixed formation passenger trains and universal locomotives capable running at 200 km/h and more. 122 Retrieved from www.transport-research.info/web/projects/project_details.cfm?id=36249

!!
96
maintenance, as well as for a higher level of standardisation at the interfaces of the main train
subsystems123.
At the operational level, some of MODTRAIN's technical results (module and interface
specifications) were introduced to the European Standardisation Organisations (CEN /
CENELEC) and have become European norms124.
The policy ramifications is that MODTRAIN builds on and adds to the European Commission's
previous legislative packages supporting the rail sector integration and increase its
competitiveness. In these legislative packages, the Commission developed the Interoperability
Directives introducing the essential requirements to ensure safe and uninterrupted rail traffic
on the Trans-European network125.
Moreover MODTRAIN also paved the way for a new type of cooperation between the different
actors in railways and proves possible in this industry voluntary harmonisation beyond the
mandatory requirements set in the European regulations126.
Despite the great accomplishment by MODTRAIN here referred as well as from other projects
(EUROPAC127, EUDD128, etc) the industry is still disappointed with the rate of adoption of EU
funded collaborative research results (about 30% against 40% in the north America)129. In
response to this, ERRAC introduced in their roadmap (2012) a new bottom-up governance
structure for research and development in the form of a joint undertaking, called SHIFT2RAIL.
4.4.4. Findings
As seen in this section visions, roadmaps and other forms of future strategic formulations are
playing an increasing role in the high-speed railway system, contributing to the revitalization
of railways as a facilitator of a new industrial dynamics and integration of policies mainly on
Transport and Research at European level, unprecedented in this particular industry. Such is
evident in the enhancement of the high-speed train innovation system transition to the third
123 Retrieved from www.transport-research.info/web/projects/project_details.cfm?id=36249 124 Retrieved from www.transport-research.info/web/projects/project_details.cfm?id=36249 125 Retrieved from www.transport-research.info/web/projects/project_details.cfm?id=36249 126 Retrieved from www.transport-research.info/web/projects/project_details.cfm?id=36249 127 EUROPAC on pantograph (2005-2007) http://www.transport-research.info/Upload/Documents/201203/20120315_103841_53919_Publishable%20Final%20Activity%20Report.pdf 128 http://ec.europa.eu/research/transport/projects/items/euddplus_en.ht 129 Source ERRAC informer.

!!
97
generation of vehicles (2001-2008) at an historical pace of only seven to five years, contrasting
with twenty years in the past.
Future strategic formulations have played a significant role in recent years, particularly as
certain technical and infrastructural elements began reaching their limits since early 2000s,
providing a need for more anticipatory coordination and targeted strategic intelligence to
minimise risk, and to stimulate the evolution of a high-speed railway system.
However, amidst this rise intelligence for anticipatory coordination, it has also been shown that
there is a dominance of endogenous future strategic formulations, where exogenous approaches
would provide intelligence necessary to encompass and speak to broader policy challenges,
including societal challenges.
Currently, the railway technology platform (ERRAC) provides a pre-competitive forum
(inclusive and dynamic), aiming and allowing for multi-level alignments in the liberalized
innovation chain. The visions, strategic agendas and roadmaps of ERRAC have been enablers
of technology dependencies by anticipating and influencing directions of the development
trajectory of high-speed rail (see the White Paper on Transport (COM (2001) 370) which has
since been periodically revised and updated). The share of common interests in this industry is
triggering and stimulating collaborative research projects, of which the first wave has been to
a certain extent embedded in AGV and ICE-350E trains becoming part of the dominant designs
and voluntary norms.
However, there is still a long way to go. The need for forums such as ERRAC and now
SHIFT2RAIL to move beyond the dominance of endogenous roadmaps (highlighted in this
paper) to a mix of endogenous and exogenous roadmaps and other forms of future strategic
formulations (such as the STOA type of activities) is becoming a pressing issue. This call for
more exogenous future strategic formulations is further amplified by other shifts in the socio-
technical system of high-speed railways. For example, I have shown in this section that initially
the railway operators and their manufacturers once held a strategically important position of
being knowledgeable of the whole supply chain. However today they are no longer
knowledgeable about the whole technological system. They moved from totally in-house
production by the major manufacturers to outsourcing, pressed by costs-reduction. Their
knowledge decreases as the sub-systems themselves sub-divide. This means there is no longer
an individual actor with a supra systemic view on the transport system.
Constructive Technology Assessment (CTA), which places an emphasis on designing socio-
technical systems by combining controlled foresight, with more stakeholders and with

!!
98
knowledge of how technological innovations and sectors co-evolve130, would allow for more
exogenous input into roadmaps, smart coordination and also advanced assessments of options
based on the whole value chain. Approaches like CTA, would be effective at the collective level
of industry associations, European technology platforms and other sector specific locations for
knowledge sharing and coordination (Robinson 2010). Being more specific, CTA could
certainly contribute to the ERRAC road-mapping process.
However, the inclusion of CTA as a support for high speed-railway system road-mapping also
brings with it challenges: key elements of the railway system show a high level of competition
between actors and scale and complexity of the technology system, and thus coordination in
such a setting is very difficult. It is a sensitive sector where technology is a competitive factor.
However, there are certain elements that are more conducive to collaboration. Europe plays an
important role where the fact of existing several different national railway companies should
not be an obstacle to common policy positions. It has been a very difficult exercise, but that can
provide robust intelligence for the anticipatory coordination of European high-speed rail
systems. Japan, Korea, China, US and Canada have their own policies for the high-speed
railway systems, but do not have to cooperate with each other to improve their model. That is
not the case in Europe. Each EU policy decision needs coordination with the national ones and
ability to bridge techno-centric visions. This gains further relevance from the empowered
society, liked by the digital networks, changing our perception of new technology selection and
becoming increasingly prominent on the policy agenda. This, I argue, is a “wake up call” in
road-mapping for the high-speed railway sector. It is possible to address it, especially if one
locates “CTA for sectoral roadmaps” at the meso-level of consortia contributing to the
European Technology Platforms and to the industry latest research governance initiative
SHIFT2RAIL (joint undertaking).
130 Constructive Technology Assessment (CTA) places an emphasis on contributing to the actual construction of new technologies and the way these become more or less embedded in society. The approach shifts the focus of future oriented technology assessment away from the reliance on processes of prediction in its strictest sense (and that which has been visible in the endogenous roadmaps in high-speed railway, see earlier) towards a process of better informed anticipation. CTA (Schot and Rip 1997, Rip and Schot 2001) was developed with an emphasis on anticipation, articulation and feedback into ongoing processes. While actors will always take enabling and constraining factors in the situation into account, CTA adds to this because of a broader & deeper understanding of socio-technical dynamics, thus, increase speed of technology developments and mitigation of market failures. To date, there have been a number of CTA activities in terms of lab-on-a-chip technology (Van Merkerk and Robinson 2006, van Merkerk 2007), nano drug delivery (Robinson 2010 p303 - 348) telehealth systems for chronic diseases (Elwyn et al 2012). Body Area Networks (Parandian 2013), Deep brain stimulation devices (Robinson et al 2013) and the many more applications.

!!
99
V. SURVEY
In this chapter the object of the study is extended from the two manufactures, Alstom and
Siemens, to the wide industry part in the AGV and ICE innovation chains. The aim is to assess
who in the innovation chain addresses societal embedding and at what stage in the technology
development process it occurs.
This chapter is divided into introduction (5.1), data collection (5.2), unit of analysis (5.3),
preliminary opinions from respondents on social embedding (5.4), results (5.5) on innovation
management (A.) and social embedding (B.) and summary of the main results (5.6).
5.1. Introduction
The concept of innovation has extended beyond products and processes to include other criteria
and values, as environment or ethics (Von Schomberg 2013, Robinson 2009). Thus, analysts of
technology emergence include wider non-market aspects into their conceptual frameworks and
theories (Nelson & Winter 1977, Dosi 1982, Rip and van der Belt 1987, Geels 2002).
Societal embedding has been suggested as a way of broadening analytical frameworks by
including in new product creation processes the broad notion of market success. The “one that
includes integration in relevant industries and markets, admissibility according to regulations
and acceptance by the public”, opening the possibility for actors to constructively “anticipate
and work towards a desirable societal embedding” (Deuten, Rip and Jelsma, 1997, page 131).
Social embedding in new product development requires anticipation (Deuten, Rip & Jelsma,
1997) by means of strategic intelligence (Huff, 1979). Firms’ central management and product
development teams are required to go beyond formal structure of the organization (including
regulatory affairs and public relations departments) to include direct interactions and
alignments with external stakeholders (Deuten, Rip and Jelsma, 1997 following on Rosenberg,
1979).
The environments in which new product development has to survive has been articulated as 3
components (Deuten, Rip and Jelsma, 1997): “Business environment”, which includes “input-
output” relations with firm’s suppliers, customers, research institutions, governments and its
agencies; “Regulation environment” where regulatory stakeholders (involve local, regional,
international actors); “Wider society” where stakeholders are consumers or social

!!
100
organizations, environmental groups, public opinion leaders, media and independent scientists
(Deuten, Rip & Jelsma, 1997, page 133). See figure 5.21 below.
!Figure 5.21. Product development process environments
Source: Deuten, Rip and Jelsma (1997, page 143, figure 2)
Deuten, Rip and Jelsma (1997) point out that, during product development, environments are
not dealt with simultaneously but sequentially accentuating the unbalances and asymmetries
with the other environments. For broad market success Deuten et al. (1997) recommend
simultaneously seeking alignments between environments, creating path dependencies from
early stage of product development. The high-speed train “broad market acceptance” is a new
trend for the industry, as observed previously on the technological transitions of the two main
models of high-speed trains, the French TGV/AGV and the German ICE, (see also Moretto et
al. 2014a, Moretto et al. 2014b). At this stage I am now in the condition of applying Deuten,
Rip and Jelsma figure to this technology. See figure 5.21 below.

!!
101
!Figure 5.22. High-speed train product development process environments of selection in time.
Source: adaptation from Deuten, Rip & Jelsma (1997, page 143, figure 2)
The adapted figure 5.22 from Deuten, Rip & Jeslama (1997) to the high-speed train product
development process in time shows that:
•! For the high-speed trains in Europe prior to 2001, technology was developed to
serve national transportation networks. Innovation was centred on the desire for
increasing speeds, leading to a linear and incremental development trajectory. This
was visible in 1981, in France with the TGV Paris-Lyon link and also visible in
1991 with the German ICE Hannover-Würzburg link. At that time railways were
addressing only (national) business and regulatory environments with train
developers applying a tactical responsive approach.
•! Since 2001, with the advent of the announcement of a trans-European network for
high-speed trains, vehicle technology development reached a phase where
integration between different national high-speed systems was required. This
notably involved co-developments of the TGV to run in trans-national links such as
the Eurostar operated in the Paris 3 Lille 3 London link and Thalys running the Paris
3 Brussels 3 Antwerp 3 Rotterdam 3 Amsterdam rail link. Product development
processes became dominated by European collaborative research and development
activities with overarching alignments between the (European) business and
regulatory environments.

!!
102
•! From 20l1, global financial shocks and proliferation of some new technology fields
(particularly new ICT developments) increase exposure of this industry to the wider
society during their considerations in new technology development process. Wider
society become less vague and unspecific, and clearly identifiable communities
became visible, such as car-sharing or connected travellers. New emergent demands
from wider society are less reactive to existing technology, but proactive in voicing
potential design requirements at an early stage of product development.
5.2. Data collection
This survey aims to understand, from the widest range of actors involved (directly or indirectly)
in the technology development process of high-speed trains, how far-close their institutions are
from societal embedding in the new product development process.
The survey was designed in 2012, having as main reference Deuten, Rip & Jelsma (1997) work
on the societal embedding in new products development process, as conceptualised in
Constructive Technology Assessment, as mentioned.
In April 2012, the survey was first tested, in a face-to-face format, on a sample of eight
stakeholders taking part in the technology development system of high-speed trains, speakers
at the Conference RAILWAYS 2012. Due to the nature of the conference the respondents were
mainly from research centers and academia. Yet some of them with overviewing the overall
technology development process as DHL, undertaking a research project on the future high-
speed train. In a smaller number there were component suppliers as Critical Software, also
interviewed.
The online survey131 was launched on the 24 February 2014.
Invitations were initially sent to the wider railway community (e.g. train operators,
manufacturers and component suppliers, infrastructure suppliers and managers, users, policy
makers, regulatory and certification bodies, railway associations, consultancies, academia and
research centers).
Later in August of the same year the survey was extended to the technology assessment
community, from which 80% of the respondents were affiliated to research centers and 20%
from national parliaments.
131 http://www.surveygizmo.com/s3/1542466/Innovation-Management-in-High-Speed-Trains-and-Societal-Aligment
!!
103
The survey closed on the 31 January 2015.
A total of 326 personalized invitations were sent by e-mail. For the first round of invitations I
used my “Linked In” database with 150 contacts in the railway sector (directly or indirectly
related to high-speed trains). For the second round of invitations I used my personal address
book with 60 contacts; I also used public available e-mails, 50, from the institutions
participating or coordinating research projects addressing high-speed trains, funded by the six
and the seven framework programmes for research from the European Commission DG RTD
(sustainable surface transport); I also contacted a group of 28 experts advising the European
Commission, DG MOVE responsible for transport policy132; Finally as a third round of
invitations, the survey was sent to 38 people from the technology assessment community, and
from research centers and national parliaments of members states of the EU. The majority
participants at the PACITA Conference 2013 in Prague. On the top of it, my PhD supervisors
supported disseminating the survey to their relevant contacts. Also, UNIFE and UIC secretariats
disseminated the survey to their members.
Due to the low rate of responses I did a second and, in some cases, a third request for reply.
The survey closed with 74 respondents registered, representing a 22% response rate.
The questionnaire was divided into eight major groups of questions, with none of the questions
being mandatory (meaning, respondents were given the option to skip questions) and allowing
for multiple responses.
The first group of questions (from Q1 to Q3) aimed at construct the unit of analysis by groups
of respondents and country distribution.
Respondents were asked in Q1 to choose the category of stakeholder they belong to from which
they could select “users of high-speed trains”, “technology stakeholders” or “policy makers”.
It was however observed that many respondents who had selected “users” continued replying
to the survey due to their professional affiliation (technological stakeholders and policy-makers
involved in the technological development of high-speed trains).
As a result, the unit of analysis was constructed not from the category groups resulting from
Q1, as initially planned, but from the institutional affiliation asked in Q11. This will be further
explained.
132 http://ec.europa.eu/transport/modes/rail/events/doc/2013-09-12-hearing-rail/minutes.pdf

!!
104
The second group of questions, from Q2 to Q3, collects respondents’ personal opinion on the
involvement users and wider society should have in the technology development of high-speed
trains. This group of questions is mostly targeting “end-users” of the high-speed trains for
whom it is not relevant to reply to the following group of questions designed to technology
stakeholders and policy makers directly or indirectly involved in the technology development
of high-speed trains. The results of this group of questions from technological stakeholders and
policy makers was also used to confront with their answers to some the questions addressing
specifically societal alignments in the technology development of the high-speed train.
The third group of questions from Q4 to Q9 aimed at detailing the identification of respondents,
such as name, affiliation, job-function, country and e-mail. To the respondents was assured the
confidentiality about their identity.
From this group of question onwards the survey was designed to address the railway
stakeholders and policy-makers involved in the technological development process of high-
speed trains.
The forth group of questions from Q10 to Q12 enquired about respondents’ institutional
affiliation and from Q13 to Q16 was profiling their institutional technological development
activities.
In this group, Q11 became the source of the unit of analysis for this survey, where respondents
were asked to select the type of institution they worked for, either “certification body”,
“component supplier”, “consultancy”, “government”, “infrastructure”, “manufacturing”,
“railway association”, “regulatory body”, “research center”, “train operator” or “university”.
Therefore, also the country of origin was based on respondents’ affiliation location, asked in
Q12.
The fifth group of questions, from Q17 to Q21 aimed at characterizing the respondents’
technological development approach. Respondents were asked to rank the frequency in the
purpose of their technology development activities, existing practices, if done alone or in
networks and the relevance given to collaborative research. The main objective in this group of
questions was to understand if innovation was mainly done in-house or open to collaborative
research, and how far the respondent was integrated in the innovation chain.
The sixth group of questions, from Q22 to Q25, addressed the technology drivers leading to the
technological change during planning and implementation. Respondents were asked to rate in
relevance the factors driving their research, at which technology readiness levels they were

!!
105
considered, and which support instruments they used. The objective here was to find a pattern
for each type of stakeholder.
The seventh group of questions, from Q26 to Q28, narrowed the above to societal drivers.
Questions were built on the elements addressed in Deuten, Rip & Jelsma (1997) on the
technology development process alignment with societal actors and their articulation with
future exercises. Again, the objective was to find a pattern for each type of stakeholder.
The last group of questions, from Q29 to Q32 focused on futures. This way questions aimed at
pattern the industry future formulations, by covering their sources of intelligence, methods used
and variables considered as well as expected outcomes.
The finally remark is to say that the weaknesses of the survey are the low rate of participation
from railway operators, 5%, and the high number of questions they did not respond, 11 out of
a total of 33 questions.
5.3. Unit of analysis (Q1, Q11, Q12)
The survey targeted professionals from railways and from the technology assessment
communities. From 326 invitations sent 74 replies were collected, of which 83% from railways
and 17% from technology assessment community.
As seen, the high-speed train is a complex technology system formed by a series of subsystems
hierarchically nested, covering competences ranging from the broad of providers of services to
the tiniest material used in the high-speed train. They form the supply chain, here covered, in a
nest of partnerships integrating specific knowledge. Societal embedding extends these
partnerships to non-railway actors as users and wider society.
The survey’s unit of analysis includes 13 types of stakeholders.
-! certification body,
-! component supplier,
-! consultancy,
-! government,
-! infrastructure manager,
-! infrastructure supplier,
-! manufacturing,
-! railway association,
-! regulatory body,
-! research center,

!!
106
-! train operator,
-! university,
-! end-user (including wider society).
This section presents the unit of analysis, determined by respondents’ institution type in Q1 and
Q11 and country of origin Q2.
Q1 and Q11 - Classification of respondents
The survey starts in Q1 by asking respondents if they were replying as “technological
stakeholders”, “policy makers” or “users”.
Each group included:
•! Technological stakeholders: manufacturers assembling the vehicle, the component
suppliers of sub-systems (parts and materials), the train operators providing the service,
the infrastructure managers and suppliers, the consultancies, the certification bodies
which ensure that new technologies comply with market requirements and regulations,
the railway associations, railway research centers and universities providers of very
specific knowledge on the high-speed train technology.
•! Policy makers: governments such as the European Commission and national
parliaments setting policies, also regulatory bodies implementing regulations for the
enforcement of those policies.
•! End-users and wider society: individuals that make the choice of taking the high-speed
trains when travelling, extended to the wider society, including consumers’
associations, environmental groups, virtual communities, etc.
As a result, 40% of the respondents selected “end-users”, 33% “technological stakeholders”,
11% “others”, 11% “policy makers” and 4% made no selection. See graph 5.1.
Graph 5.1. Respondents categories (Q1) (% total responses)
40%
33%
11%
12%
4%
End*User
Technological7 Stakeholder
Policy7Maker
Other7
No7reply

!!
107
“End-Users” appear with the highest representativeness accounting with 40% of respondents.
However it was noticed that some of the respondents selected both ”user” and “technological
stakeholders” and continued responding to the survey as “technological stakeholders”. Such
questioned the representativeness of results in Q1.
One can speculate on the reasons for which that happened, such as respondents non ownership
on technological developments of high-speed trains or simply because they were responding to
the survey on a personal basis and not on behalf of their institution.
To overcome this problem, Q1 results were crosschecked with respondents’ institutional
affiliation type asked in Q11. In Q11 respondents could only selected one of the categories
proposed being “certification body”, “component supplier”, “consultancy”, “government”,
“infrastructure”, “manufacturing”, “railway association”, “regulatory body”, “research center”,
“train-operator”, “university”, “user” and “others”.
In order to make Q11 comparable with Q1, the categories of stakeholders were then grouped in
the 3 categories “technology stakeholder” (including certification body, component supplier,
consultancy, infrastructure, manufacturing, railway association, regulatory body, research
center, train-operator, university), “policy maker” (including government) and “user”
(extended to wider society and including research centers advising policy not part in the high-
speed train industry).
Results are shown in graphs 5.2 and 5.3, below.
!Graph 5.2. Respondents categories resulting from their institutional affiliation (Q11)
(% total responses)
9%
72%
19%
Policy,maker
Technological, stakeholder
User

!!
108
Results in graph 5.2 were considerable different from graph 5.1. Here “technological
stakeholder” takes the largest share of respondents, 72%, embracing respondents from
institutions part in the high-speed train innovation chain. “End-users” drop to the second place
with 19% of respondents, from which respondents were affiliated to institutions not directly
involved in the technology development of the train. Finally, “Policy maker” take 9% share of
the respondents.
More details can be found below in graph 5.3 breaking down the three main groups of
respondents by their institutional affiliation.
Graph 5.3. Breakdown by respondents’ institutional affiliation (Q11)
(% total responses)
From graph 5.3 one can see that respondents as “users” are affiliated to research centers and
universities, where policy makers split between governmental and regulatory bodies as well as
research centers.
Continuing the analysis of the results from graph 5.2, in which respects the technological
stakeholders (including certification bodies, component suppliers, consultancies,
manufacturing, railway associations, research centers, train operators and universities) and
policy makers (governments, regulatory bodies and universities), one can also observe the
pyramidal structure of the sector.
This way “Component supplier” appears as the most participative institution of technological
stakeholders accounting with 23% of respondents. Component suppliers include providers of
interiors, ICT and materials, such as Montemiao, SISCOG and Thales.
Also in the group of technology stakeholders is “manufacturing”, the assemblers of the high-
speed trains, which come in second accounting with 11% of respondents. The institutional
affiliation of respondents is split between Alstom, Siemens and Bombardier. As there is a higher
7%
1% 1%1%
23%
8%
11%
7%
11%
5% 5%
14%
0%
5%
10%
15%
20%
25%
Policy0maker
Technological0stakeholder
User

!!
109
concentration of institutions in manufacturing there is more than one respondent per
manufacturer.
Moreover, part of technological stakeholders there are “research centers” running research
projects on railways and specifically to high-speed trains. They share the same place in terms
of representativeness as manufacturers accounting with 11% of respondents affiliated to
institutions such as DRL and Fraunhofer.
However, 14% of respondents from research centers participating in this survey are affiliated
to institutions not directly involved in the technological development of high-speed trains, such
as the Institute of Technology Assessment and System Analysis (ITAS) of the Karlsruhe
Institute of Technology (KIT), not technological stakeholders for this matter, participating as
end-users.
Coming back to technological stakeholders, in third place we find “consultancies” dedicated to
railways with 8% of respondents. Just after in fourth there are “railway associations” with 7%
of respondents affiliated to UNIFE133, UIC134/CER135 and EIM136.
“Train operators” and “universities” both take the fifth place representing 5% of respondents
each affiliated to the main train operators SNCF, DB and Ferrovie dello Statto and Universities
dedicated to railways and specifically to high-speed trains.
Finally, yet within technology stakeholders, respondents were found from “Certification Body”
with 1% participation.
Continuing with graph 5.3, the category “end-users” accounted with 19% of respondents
affiliated to “Research Centers” and 5% of “Universities” not involved with railways.
“Policy-Makers” in its turn accounts for the minority of respondents with 9%, split between
“governments” 7% such as the European Commission (DG RTD and DG MOVE) and national
parliaments, “regulatory bodies” 1% including the European Railway Agency and a University
dedicated to parliamentary technology assessment.
It should be noticed that there was more than one respondent per institution; and institution
types “infrastructure” and “others” accounting with 0% of selected responses.
133 UNIFE stands for the Association of the European Rail Industry [Union Internationale des Industries Ferroviaire]. 134 UIC stands for the International Union of Railways [Union Internationale des Chemins de Fer]. 135 CER stands for the Community of European Railway and Infrastructure Companies, the policy harm of UIC. 136 EIM stands for the European Infrastructure Managers Association.
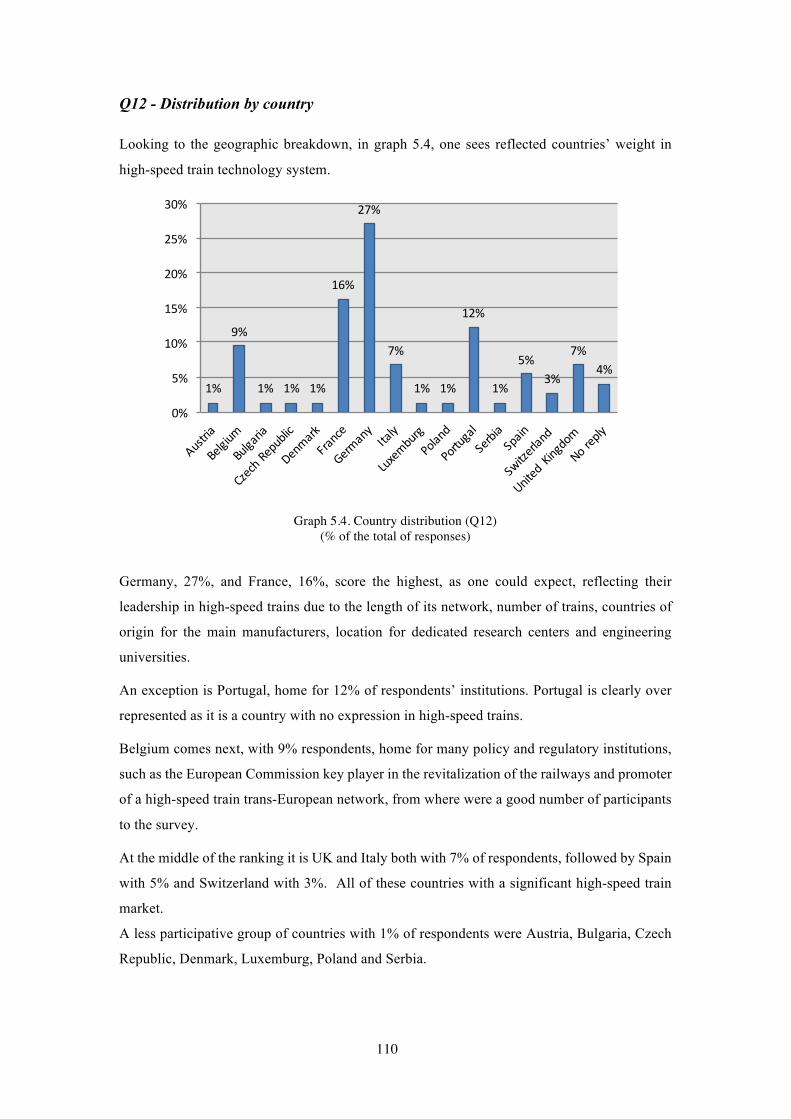
!!
110
Q12 - Distribution by country
Looking to the geographic breakdown, in graph 5.4, one sees reflected countries’ weight in
high-speed train technology system.
Graph 5.4. Country distribution (Q12)
(% of the total of responses)
Germany, 27%, and France, 16%, score the highest, as one could expect, reflecting their
leadership in high-speed trains due to the length of its network, number of trains, countries of
origin for the main manufacturers, location for dedicated research centers and engineering
universities.
An exception is Portugal, home for 12% of respondents’ institutions. Portugal is clearly over
represented as it is a country with no expression in high-speed trains.
Belgium comes next, with 9% respondents, home for many policy and regulatory institutions,
such as the European Commission key player in the revitalization of the railways and promoter
of a high-speed train trans-European network, from where were a good number of participants
to the survey.
At the middle of the ranking it is UK and Italy both with 7% of respondents, followed by Spain
with 5% and Switzerland with 3%. All of these countries with a significant high-speed train
market.
A less participative group of countries with 1% of respondents were Austria, Bulgaria, Czech
Republic, Denmark, Luxemburg, Poland and Serbia.
1%
9%
1% 1% 1%
16%
27%
7%
1% 1%
12%
1%
5%3%
7%4%
0%
5%
10%
15%
20%
25%
30%

!!
111
The breakdown of countries by institutional types, shown in graph 5.5, reinforces the results in
graph 5.3 reflecting the industry structure, and in addition it detects unbalances in respondents’
representation.
Graph 5.5. Country distribution by institution (Q12)
(% total of responses)
For instance, as one can read for graph 5.5, Germany covers the majority of stakeholders in the
supply chain, it is however over represented by “end-users” and it is under represented by
component suppliers. In its turn Portugal is over represented by component suppliers, mainly
from interiors and ICT, while Spain is under represented in terms of operators and
manufacturing. France is the most balanced country with a fair coverage of stakeholders part
of the supply chain.
Results (Q1, Q11, Q12)
The unit of analysis is robust because:
It is constructed from the institutional affiliation of respondents, where certification body,
component supplier, consultancy, government, infrastructure, manufacturing, railway
association, regulatory body, research center, train-operator, university, users” and others
(Q11).
The survey is representative of the universe of stakeholders concerned with the technological
development of high-speed trains and reflects the technological structure of the sector. That is
quite clear for the technological stakeholders, to whom this survey was designed (Q11).
1% 1% 1% 1% 3%
8%
4%1% 3%1%
1%
1%
1%
3%
4%
1% 1%
1% 7%
3%
1%
3%
1% 1%
1%
1% 1%
7%
1%
1%
1%
1%1%
1%
1% 3%
3%
1%
12%
1%
1%
1%
0%
5%
10%
15%
20%
25%
30%
Users
University3
Train3operator3
Research3Center3
Regulatory3body
Railway3association
Manufacturing
Government
Consultancy
Component3 supplier
Certification3 body

!!
112
Finally, the institutional representativeness of respondents is credible as they cover the
institutions participants in relevant EU integrated research projects, existent so far, on high-
speed trains such as MODTRAIN and RAIL ENERGY. Except for component suppliers as in
this survey they were mainly from materials, ICT and interiors.
Respondents were 11% from manufacturers of high-speed trains, from the main players in
Europe - Alstom, Siemens and Bombardier assembling and supplying the vehicles TGV/AGV,
Velaro and Zefiro. Also, 23% of respondents were affiliated to component suppliers, ranging
for example from materials to interiors and telematics. Moreover, 11% of participants were
affiliated to research centers plus 5% to universities, dedicated to high-speed trains, very
specialized knowledge providers to this industry like DLR and Fraunhofer.
5.4. Respondents preliminary view on the survey topic
Questions Q2 to Q3 collect respondents’ opinion on the involvement of users and wider society
in the technology development of high-speed trains from early stage (covered in the section
4.1.4 and referred in Deuten, Rip & Jeslma, 1997). Those two questions mainly target
respondents in the category of “end-users” of the high-speed trains, as it is the only questions
in the survey they were asked to reply. As referred before the survey was designed to technology
stakeholders and policy makers directly involved in the technology development of the train-
speed trains.
The results of this group of questions are latter used to confront with the ones from the questions
addressing specifically societal alignments in the technology development of the high-speed
train as it will be covered in part B of this survey137.
Q2 - Main aspects valued for taking the high-speed train
The survey asks in Q2 the aspects valued in the decision to take high-speed trains.
Respondents were given an open area of text where they could list their three top preferences.
Their responses where then coded as: speed, comfort, environment, intermodality and safety,
ticket price, frequency and time schedule, service reliable and efficient, destinations,
connectivity, convenience and lack of other alternatives.
Q2 places all the respondents as users of the train. Yet results show differences between the
different types of users’ institutional affiliation (to be further explained).
137 As mentioned at the introduction, the survey has two parts: part A enquiring about strategic innovation management and part B enquiring specifically about societal embedding on the relevant aspects of strategic innovation management.
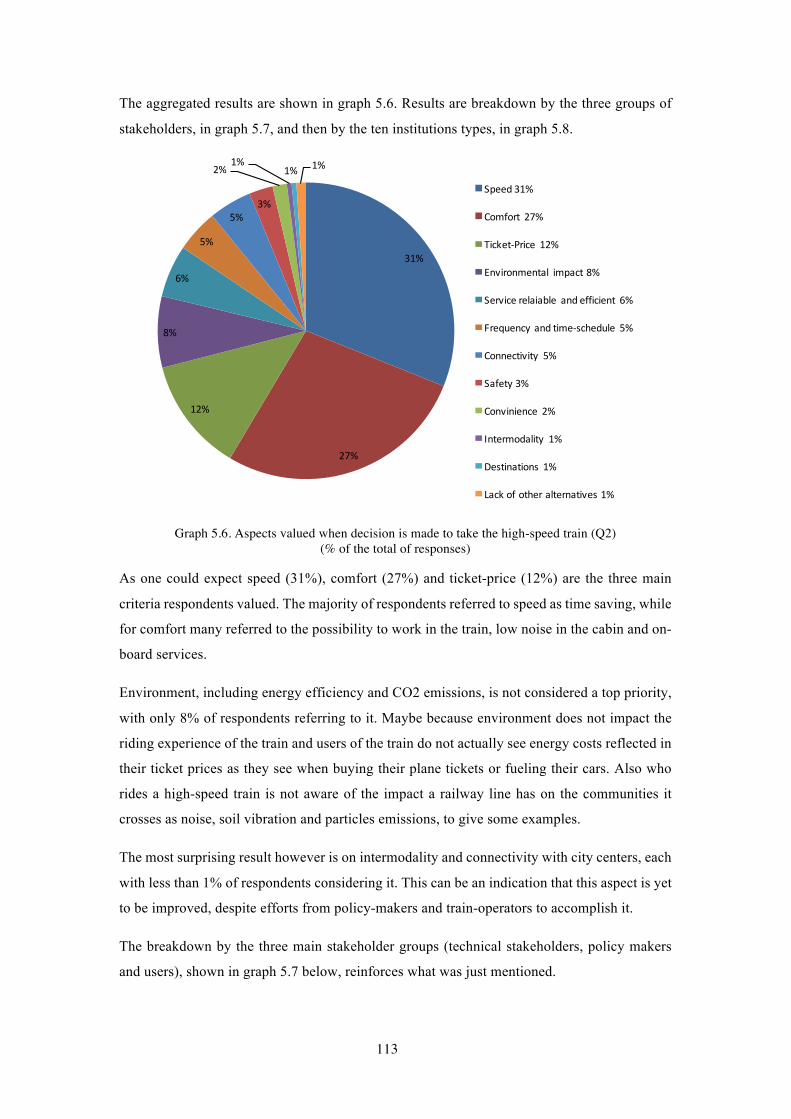
!!
113
The aggregated results are shown in graph 5.6. Results are breakdown by the three groups of
stakeholders, in graph 5.7, and then by the ten institutions types, in graph 5.8.
Graph 5.6. Aspects valued when decision is made to take the high-speed train (Q2)
(% of the total of responses)
As one could expect speed (31%), comfort (27%) and ticket-price (12%) are the three main
criteria respondents valued. The majority of respondents referred to speed as time saving, while
for comfort many referred to the possibility to work in the train, low noise in the cabin and on-
board services.
Environment, including energy efficiency and CO2 emissions, is not considered a top priority,
with only 8% of respondents referring to it. Maybe because environment does not impact the
riding experience of the train and users of the train do not actually see energy costs reflected in
their ticket prices as they see when buying their plane tickets or fueling their cars. Also who
rides a high-speed train is not aware of the impact a railway line has on the communities it
crosses as noise, soil vibration and particles emissions, to give some examples.
The most surprising result however is on intermodality and connectivity with city centers, each
with less than 1% of respondents considering it. This can be an indication that this aspect is yet
to be improved, despite efforts from policy-makers and train-operators to accomplish it.
The breakdown by the three main stakeholder groups (technical stakeholders, policy makers
and users), shown in graph 5.7 below, reinforces what was just mentioned.
31%
27%
12%
8%
6%
5%
5%3%
2%1%
1% 1%
Speed-31%
Comfort- 27%
Ticket8Price- 12%
Environmental- impact-8%
Service-relaiable- and-efficient- 6%
Frequency-and-time8schedule- 5%
Connectivity- 5%
Safety-3%
Convinience- 2%
Intermodality- 1%
Destinations- 1%
Lack-of-other-alternatives-1%

!!
114
Graph 5.7. Aspects valued when decision is made to take the high-speed train, breakdown by groups of
stakeholders (Q2) (% of responses per stakeholder group)
Graph 5.7 confirms speed, comfort and ticket price as the three main aspects for all the three
groups of stakeholders with a significantly high relevance attributed by technological
stakeholders. Environmental impact remains fourth listed preference. However, for policy
makers it has an equal relevance to frequency and time-table while for users it is paired with
service reliable and efficient.
The following graph 5.8 narrows the above results to the four most ratted categories and brakes
it by institution types.
Graph 5.8. Aspects valued when decision is made to take the high-speed train, breakdown by
institutions types (Q2) (% of the total responses per category of stakeholder)
22.3%
3.1%
5.7%
20.2%
2.1%
5.2%5.7%
0.5%1.6%
0.5%
2.1%
0.5%
8.3%
1.6%2.6%
3.6%
0.5% 0.5%
4.1%
1.6%0.5%
3.6%
0.0%1.0%
0.5% 0.5%
0.0%
5.0%
10.0%
15.0%
20.0%
25.0%
Technological6 stakeholder6Total Policy6Maker6Total User
Speed6
Comfort6
Environmental6 impact6
Intermodality
Safety
TicketHPrice
Frequency6and6timeHschedule6
Service6relaiable6 and6efficient
Destinations
Connectivity
Convinience6
Lack6of6other6alternatives6
0%10%20%30%40%50%60%70%80%90%
100%
Speed0
Comfort0
Ticket;Price
Environmental0impact0Safety

!!
115
Graph 5.8 splits results by user’s affiliation type. Speed if the most important criteria for all
stakeholders, except for regulatory bodies that give more importance to comfort 50% and ticket
price 50%.
There is no significant deviation from the responses provided by users affiliated to railway
stakeholders and users not affiliated. Such verify the technology areas highlighted for end-users
in figure 4.6, section 4.1.4.
It is interesting to observe that environmental impact is not considered by users affiliated to
governmental institutions, when those are the ones actually promoting environmental policies
and regulations. Opposite to them are respondents from train operators the ones considering as
the second most important criteria environmental impact 30%. The others showing some
interest in environmental impact are manufacturing research centers and university, all with
15%.
Another aspect is safety, only listed by component suppliers 9% and train operators 10% and
users with no affiliation to any of the stakeholders 3%. Surprising is that manufacturers do not
list safety if considered that in this industry safety is highly requested by customer requirements
and regulations.
Q3 - Should users and wide society have a say from early stage in the technology
development of the high-speed train
Often one sees references to user consultations, at times when train operators envisage to
improve services, or when governments plan the construction of a particular high-speed train
link. Less referred is the consultation to users and society in general from early stage of
technological development process. Graph 5.9 below shows respondents opinion about it.

!!
116
Graph 5.9. Should users and wide society have a say in the technology development of the train (Q3)
(% of the total of responses)
The great majority of respondents are supportive of consultations to users and society at large
from early development process of the high-seed trains. A respondent from a railway
association observed that “it is always useful to ask users for their opinion. Asking users might
lead to better use of the train as well as might lead to new ideas”. A component supplier also
comment that “if they [users] do not like the experience they can get other alternatives”.
Support to user consultations is not free from limitations. Only a small percentage of 15% of
respondents was supportive of a consultation in all aspects. While the great majority 45% stated
that it should exclude the mechanics of the train and 29% of respondents supported a more
restricted consultation limited to the technology directly impacting the riding experience of the
train. A respondent from a University mentioned that “dialogue with all stakeholders and
society at large is always interesting, but this is different from a kind of wide-spread popular
governance”, clearly indicating that the final decision should be left with the ones
knowledgeable of the technology.
Not supportive at all were found 9% of the respondents. A respondent from a regulatory body
referred that “for users the specific technology is not important, only the result counts”. Here
there is an anticipation of lack of interest and lack of whish from users to participate in the
technological development of high-speed trains, leaving the technology decision to the experts.
9%
15%
29%
47%
Not+at+all
Yes+in+all+aspects
Yes+but+excluding+ the+mechanics+of+the+train
Yes+but+only+if+the+technology+directly+impacts+the+riding+experience+ of+the+train

!!
117
Interesting to notice that in the open text box left for comments there is no reference to potential
costs of consulting users and wider society, as well as no reference to the economic and
technological limitations to accommodate their expectations and interests.
Graph 5.10. Should users and wide society have a say in the technology development of the train,
breakdown by respondent affiliation type (Q3) (% of the total responses per category of stakeholder)
Graph 5.10 shows that technological stakeholders do not support early consultation to users and
wider society in the same way.
Manufacturers are the least supportive of all. A greater percentage of manufacturers, 50%, gave
preference to consultations to users and wider society excluding the mechanics of the train. One
respondent justified stating that “User in terms of passenger does not have the competence to
deal with technical issues”. Moreover, 25% of manufacturers replied “no involvement at all”
from users and wider society. And other 25% “only if the technology directly impacts the riding
experience of the train”.
The most supportive stakeholder resulted the component suppliers, yet attributing higher
relevance to consultations “if the technology directly impacts the riding experience of the train”,
with 53% of them selecting this option against 20% “supporting in all aspects”. This high
support contrasts with a minority of them, 7%, “not supporting it at all”. Such result might
reflect the fact that the majority of components suppliers are providing technology solutions
directly impacting users, such as interiors, materials and information to passengers. One should
consider the possibility of a different outcome if other type of component suppliers happened
to participated to the survey.
0%10%20%30%40%50%60%70%80%90%
100%Yes/but/only/if/the/technology/directly/impacts/the/riding/experience/ of/the/train
Yes/but/excluding/ the/mechanics/of/the/train
Yes/in/all/aspects
Not/at/all

!!
118
Looking at policy makers, regulatory bodies are the least supportive to user consultations, with
100% of them selecting as response no support at all.
In which concerns users (with not affiliation to a rail institution), 14% of them were not
interested at all to be involved in consultations against 29% of them stating they were interested
to be involved “in all aspects” of the high-speed train technology development. Yet 11% are
supportive of their involvement in the “technological development impacting the riding
experience of the train” while 43% “excluding the mechanics of the train”.
Results (Q2, Q3)
Q2 and Q3 collecting respondents’ personal view on the survey topic (innovation management
and societal embedding) reveal the following:
Speed, comfort, and ticket-price were the most valued criteria by respondents when deciding
to take the high-speed train for their medium to long distance journeys (graph 5.6).
Contrastingly environment scored low in preferences. Such it was unexpected, if considered
that it has been the major comparative advantage of high-speed trains in relation to other
transport modes, and the policy argument for the revitalization of railways during early 2000’s.
In its turn, intermodality and connectivity, at the bottom of the list of preference, revealed that
such policy objectives are yet far from being accomplished.
Users not affiliated to any of the railway technological stakeholders or policy makers follow
the general pattern in terms of their top references (speed, comfort, ticket price, environment
and safety).
The aspects valued by the train users are related to specific technologies. Speed for example is
related to the traction-power, aerodynamics, weight of the vehicle, while comfort corresponds
to design, materials, telematics. Only ticket-price is not directly related to technological
solutions but with finance and economic models. This indicates that user preferences are
inevitably linked to technological matters and therefore compelling to involve them in the
technology development process.
As shown in graph 5.9 The majority of stakeholders from the industry supported societal
embedding, but limited to the aspects directly impacting to the riding experience of the train,
leaving to rail experts the decision on the core technical aspects of the vehicles.
The graph 5.10 reveals that manufacturers were quite reluctant to consultations to societal
actors. Half of them attributed preference to consultations in areas that excluded the mechanics
of the train and a quarter not supporting consolations at all.

!!
119
Moreover, one third of users replied not having interest to be consulted. That is a quite
representative percentage if considered that only one quarter of them were interested to be
consulted in all aspects of the technological development of the train.
In its turn, quite surprising to observe that components suppliers gave high relevance to users
and wider society consultation from early stage in the technology development of the trains, if
considered that they are not directly interfacing with them. As said this can result from the fact
that the majority of the component suppliers participating to the survey were mainly from
materials, interiors and ICT.
In conclusion, users (both affiliated and not affiliated to technology stakeholders) valued the
most technological aspects impacting the riding experience of the train (as speed and comfort)
in detriment of customer services (ticket price) and core technical aspects (environment and
safety) in their decision to take the high-speed train.
5.5. Results
A. STRATEGIC INNOVATION MANAGEMENT
This part of the survey refers to strategic innovation management literature found in Schilling
(2013) and organizational structure in Lichtenthaler (2004) covered in section 4.1.4 b)
technology surveillance. This body of literature informs ways to characterize industry product
creation management, here applied to high-speed trains.
i) Technology development characterization
High-speed trains are a high-end technology product for the railway industry, due to the speeds
it reaches, the trans-national corridors it serves and the medium to large distances it traverses
whilst transporting passengers. Safety, energy efficiency, signaling, distribution-power,
reduced noise and vibration are just a few examples of the most recent technological
advancements shaping and driving innovation in this industry.
In this part of the survey, a characterization of the technological development approach in the
high-speed train industry is made by asking the respondents about the percentage of turnover
invested per year in R&D (Q13), R&D strategy (Q14) and technology surveillance structure
(Q15) and technology surveillance agents (Q16).

!!
120
For the purpose of representing the results, in this part of the survey “end-users” affiliated to
institutions not representative of the sector who are not involved in the technology development
of high-speed trains have been excluded.
The main objective with this group of questions is to allow the characterisation of the high-
speed train technology development where the social dynamics addressed in part B of this
survey occurs.
Q13. R&D expenditure
R&D expenditure in terms of percentage of turnover has been widely used as an indicator
measuring innovation efforts and innovation capability of firms (OECD 2005). Very innovative
firms, such as pharmaceutical or consumer electronics, spend above 5% of their annual turnover
while more conservative firms, for example automotive, spend less. R&D is here considered in
a broad notion including products, services, processes and marketing (OECD 2005).
Graph 5.11 below, shows the levels of R&D expenditure from the respondents to this survey,
where respondents are either technological stakeholders or policy makers engaged in the
technology developments of high-speed trains.
Graph 5.11. High-speed train industry expenditure on R&D as a % of total turnover (Q13)
(% of the total of responses)
Graph 5.11 shows high-speed industry as R&D intensive, with more that 54% of respondents
spending above 5% of their annual turnover in such type of activities. One should be cautious
when interpreting these aggregated results, since they could be read as implying that the high-
54%
16%
20%
10%
Above-5%
Between-3%-and-5%
Between-1%-and-3%
Less-then-1%

!!
121
speed industry is very innovative. However, when breaking down the results by institution
types, as shown in graph 5.12 below, such aggregated results are only valid for component
suppliers and research centers.
Graph 5.12. High-speed industry expenditure on R&D as a % of annual turnover. Breakdown (Q13)
(% of the total responses per category of stakeholder)
In graph 5.12, the main R&D spenders (spending above 5% of their annual turnover) are
consultancies 75%, research centers 73%, component suppliers 69%, government 67% and
universities 67%. Manufacturers are divided between a medium-low expenditure with 57% of
respondents spending between 1% and 3% of their annual turnover in R&D and a 43% of them
declaring a medium-high expenditure of 3% to 5%. This is a clear indication that the surveyed
manufacturers outsource technologies to component suppliers and research centers.
Train operators, in contrast, are split between two extremes in levels of R&D expenditure, 50%
responded spending above 5% and the other 50% responded spending below 1%. This confirms
the previous sections of this dissertation referring to a shift in train operators technological path
from hardware technology to services. While, the split between two levels of R&D expenditure
reflect the heterogeneity in which that is happening. However, this results can be challenged as
train operators participation to this survey is low.
Q14. R&D strategy
According to Pisano (2012) “A strategy is a system approach in solving a problem. An R&D
strategy is defined as a coherent set of interrelated choices across decisions concerning:
organizational architecture, processes, people, and project portfolios”.
R&D strategies also include assessing a firms’ position and defining strategic directions,
whether the firm will collaborate on development activities, choosing a collaborative mode and
0%
10%
20%
30%
40%
50%
60%
70%
80%
90%
100%
Above15%
Between1 3%1and15%
Between1 1%1and13%
Less1then11%
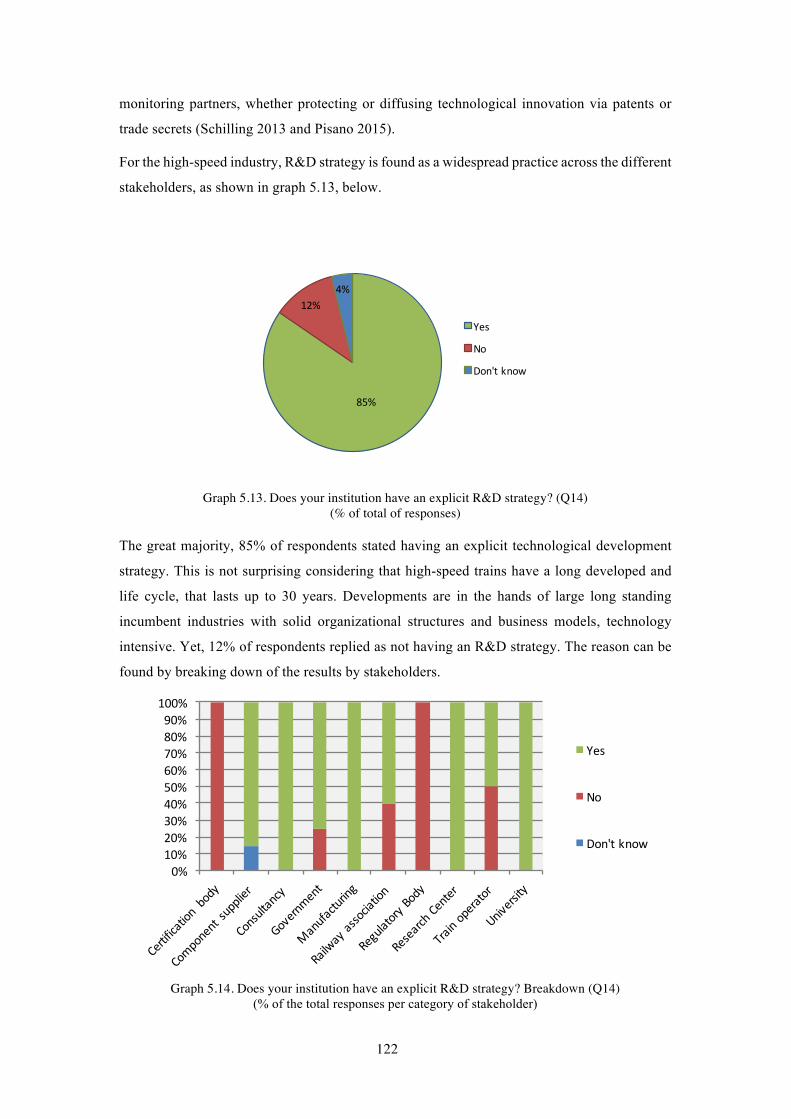
!!
122
monitoring partners, whether protecting or diffusing technological innovation via patents or
trade secrets (Schilling 2013 and Pisano 2015).
For the high-speed industry, R&D strategy is found as a widespread practice across the different
stakeholders, as shown in graph 5.13, below.
Graph 5.13. Does your institution have an explicit R&D strategy? (Q14)
(% of total of responses)
The great majority, 85% of respondents stated having an explicit technological development
strategy. This is not surprising considering that high-speed trains have a long developed and
life cycle, that lasts up to 30 years. Developments are in the hands of large long standing
incumbent industries with solid organizational structures and business models, technology
intensive. Yet, 12% of respondents replied as not having an R&D strategy. The reason can be
found by breaking down of the results by stakeholders.
Graph 5.14. Does your institution have an explicit R&D strategy? Breakdown (Q14)
(% of the total responses per category of stakeholder)
85%
12%4%
Yes
No,
Don't,know
0%10%20%30%40%50%60%70%80%90%100%
Yes
No1
Don't1know

!!
123
The breakdown in graph 5.14 revealed that found 12% respondents not having an R&D strategy
were mainly from the totality of respondents from certification and regulatory bodies, each with
100% of responses. To a less extend from railway associations 40%, governmental institutions
25% and train operators 50%.
The lack of a R&D strategy by regulatory and certification bodies is justified by the nature of
their mandate to implement regulations and standards set by industry and governments, either
driven from policies or sector strategies.
What is divergent is to find some respondents from governmental institutions and train
operators stating not having an explicit R&D strategy. That might be justified by the
respondents’ personal perception on their institutional practices or lack of understanding of the
question. There is evidence that governments and train operators have R&D strategies for high-
speed trains which results are accounted in their annual reports made available to public or
investors.
Q15. Technology surveillance
Often firms and governments develop and implement their R&D strategies through technology
surveillance agents. Lichtenhaler (2004) provides an excellent classification of those agents
here used as reference. This surveillance/intelligence refers to scanning activities seeking future
technology opportunities, anticipations on external market conditions, as well as to inform the
alignment of R&D strategies with other strategies internal to the organisation, such as sales and
marketing.
According to Lichtenhaler (2004), technology surveillance can be incorporated in the
organization structure of firms as tasks given to dedicated job positions, or hybrid when
performed in a particular R&D project lasting until the term of the project. They can also be
incorporated informally into the organization structure, not subject to an explicit nomination.
The high-speed train industry (as previously mentioned in section 4.1. b) has a tradition of using
technology surveillance practices as way to cope with the complexity of the technological
system of the vehicles it supplies. Those practices have been increasingly structured in the
organizations as ever-tighter regulations and requirements were imposed in terms of safety,
modularity and interpretability since 2001 as well as new customer specifications arising from
the liberalization of the railway market (Moretto et al. 2012). Graph 5.15, below, provides
evidence of this.

!!
124
Graph 5.15. Does your institution have an explicit technology surveillance structure? (Q15)
(% of total of responses)
As shown in graph 5.15, the majority of respondents, 76.5%, stated that their institution had an
explicit technology surveillance structure, which to certain extend reflects the previous explicit
R&D strategy. According to Lichtenhaler (2004) there are variations in terms of the structure,
which can be either centralised or more distributed, but all of which help to acquire external
expert know-how and acquire international intelligence.
The 23.5% of respondents not having a technology surveillance structure in their organization
should read in two ways. Such structure might not exist at all or that it can be informal or
specific to an R&D project.
Graph 5.16. Does your institution have an explicit technological surveillance structure? Breakdown
(Q15) (% of the total responses per category of stakeholder)
76.5%
23.5%
Yes
No
0%10%20%30%40%50%60%70%80%90%
100%
No
Yes
!!
125
In graph 5.16, the breakdown of the technological surveillance structure reveals that 100% of
respondents from consultancies, manufacturing and research centers had formal surveillance
structures. Their responses match with previous graph 5.14, with 100% of the same respondents
stating that had a formal R&D strategy Q14.
Non-existent or unstructured technology surveillance is found in the majority of railway
associations, with 80% of responses, and universities, with 75%. For these two stakeholders
technology surveillance tends, in its majority, to be hybrid and limited to specific R&D projects.
An indication of that that is a registered high percentage of responses, 60% for railway
associations and 100% for universities stating that they had an explicit R&D strategy in Q14,
graph 5.14.
In graph 5.16, manufacturing had no informal nor hybrid technology surveillance despite an
observed participation in research projects, described in the previous chapter. This might be
interpreted as a sign of centralisation of R&D activities.
Railway operators were even in practices of structured and informal technology surveillance,
with 50% each. Such reinforces the previous results in graph 5.14, referring to an explicit R&D
strategy. In its turn the totality of certification and regulatory bodies stated that their institution
had a formal surveillance structure contradicting their responses to the previous Q14, found in
graph 5.14, where the totality of them said their institution had explicit R&D strategy Q14.
Q16. Posts in technological surveillance
Technology surveillance is in its turn distributed between different posts in the organization
(Lichtenhaler, 2004). Individuals (also called agents) can be working at the technical unit of the
headquarters, or sent as an envoy to the customer or supplier facilities when engaged in a co-
development project. Those agents can also take part in networks that leverage knowledge and
resources from the all of the industry.
Graph 5.17 below shows the most recurrent technology surveillance posts in the high-speed
train industry according to the respondents.

!!
126
Graph 5.17. You or a colleague take part in technological surveillance as follows… (Q16)
(% of total of responses)
Graph 5.17 shows for the high-speed train industry a dominance of technology surveillance
performed by individuals participating in networks, accounting with 41.5% of responses. This
reflects many of the respondent’s involvements in European technology platform ERRAC and
participation in industry associations at European or national level.
In addition, also highly rated in the technology survey structure is the post of envoy to research
centers or scientific boards, with 26.4% of responses. This confirms for this industry found
dominance of collaborative research and development (e.g. technology development held by
industry networks).
The breakdown by institutions type is provided in graph 5.18 below.
Graph 5.18. You or a colleague take part in technological surveillance as follows… Breakdown (Q16)
(% of the total responses per category of stakeholder)
13.2%
7.5%
26.4%41.5%
11.3%
post.at.the.technical. unit.(headquarters. or.subsidiary).13.2%envoy.to.a.specific.supplier.or.customer. 7.5%
envoy.to.research.centers.or.scientific. boards.26.4%.
expert. participating. in.networks.41.5%
other. 11.3%
0%10%20%30%40%50%60%70%80%90%100%
post0at0the0technical0unit0(headquarters0 or0subsidiary)envoy0to0a0specific0supplier0 or0customer
envoy0to0research0centers0or0scientific0boardsexpert0 participating0in0networks
other

!!
127
Graph 5.18 reinforces what was observed in the previous graph 5.17 but this time across all the
institutions. Collective surveillance posts are the most recurrent among respondents, except for
regulatory bodies. Railway associations are the ones most represented in networks with 67% of
responses.
Other stakeholders distributed their responses through the various options yet selecting in
higher percentages their participation in network, as for governments 50%, consultancies 50%,
and manufacturing 36%.
Only component suppliers and manufacturing referred to the post of envoy to specific suppliers
or customers, with respectively 20% and 9% of responses, yet below participations in networks.
Results (Q13-Q16)
Technology development is a core part of the high-speed train business, as it is for any other
industries to survive in present market conditions. The high-speed train industry is R&D
intensive with more than half of respondents spending above 5% of their annual turnover in
such type of activities (graph 5.11). The main R&D spenders found (graph 5.12) were
consultancies 75%, research centers 73%, component suppliers 69%, government 67% and
universities 67% stating that their spending in R&D was above 5% of their annual turnover.
Manufacturing shows much lower expenditure, with 57% of respondents spending between 1%
to 3% and other 43% between 3% to 5%. This can be a clear indication of outsourcing in
development to component suppliers and research centers. Train operators were split between
the higher and lower rates of R&D investment, with half of them spending below 1% and the
other half above 5%. Operators reflected higher focus on service developments and demand for
turnkey trains.
Elaboration and implementation of R&D strategies is a wide spread activity in this industry
(graph 5.13), practiced by the majority of respondents. High-speed trains are a long existing
technology, developed since the late 60’s and running since 1981 in Europe. Technology
developments are in hands of large incumbent industries present in the market for over a century
with solid organizational structures and business models.
R&D strategies are supported by technology surveillance practices as way to cope with the
complexity of the technological system of the trains. Those practices have been increasingly
structured in the organizations as, since 2001, tight regulations and requirements were imposed
in terms of safety, modularity and interpretability and new customer specifications arise from
the liberalization of the railway market (as it was observed in section 4.1.4 of this dissertation
and can also be found in Moretto et al. 2012).

!!
128
As of today, 76.5% of respondents replied having an explicit technology surveillance structures
(graph 5.15). The totality of manufacturing, consultancies, research centers and a majority of
component suppliers stated having formal surveillance structures (graph 5.16). The remaining
ones from railway associations and universities responding in its majority not having an explicit
technology surveillance structure (graph 5.16). Such reflecting an unstructured technology
surveillance, which can be of an informal character or hybrid when associated to a specific
research project (Lichtenhaler, 2004). Train operators responses break even between
technology surveillance as structured, hybrid or informal.
Technology surveillance is mostly performed by individuals (e.g. agents) participating in
networks (graph 5.17). This reflects many of the respondents involvements in ERRAC
technology platform and participation in industry associations at European or national level.
Railway associations are the most participative in networks (graph 5.18). They are the house
for the industry research networks and serve a secretariat for collaborative research projects at
European level. Also with a significant participation in networks are consultancies,
governments, universities and research centers (graph 5.18). Only component suppliers and
manufacturing have referred to the post of envoy to specific suppliers or customers. However,
manufacturers preferred in participating in networks was higher than sending envoys,
reinforcing in this industry the collective relevance of technology developments and
collaborative exchanges.
ii) Technological development multi-level dynamics
New technologies arise from various sources to meet many different requirements. They may
emerge from individuals, as the classic image of the inventor solving a particular problem or
even users who design solutions for their own needs. More often, innovation is a collective
process, which evolves over time in multiple interactions within an evolving network (both
intra and inter-firm). Thus, looking at actor-networks and the relationships between them are
important, particularly with a view to an understanding of the dynamics pulling and pushing
technological transitions (Rip 2012, Schilling 2013).
Technology development dynamics is here explored in the high-speed train. Respondents were
asked for the reasons that drive their development of new technologies (Q17), including
existing practices (Q18) ranging from basic and applied research to market entry, on their own
or in networks (Q20) covering different stages of the technology development process (Q21).
The main objective in this group of questions was to understand the dynamics of technology
development in the high-seed train industry across the different stakeholders in the innovation
chain. This way users were excluded from the unit of analysis.

!!
129
Q17. The purpose for undertaking technology developments
For any industry in an open market the main purpose for technical advancements are market
entry or survival and to gain or maintain competitive advantage (Schilling 2013).
The high-speed train industries however have historically been incumbent oligopolies, serving
national railway systems. Only in the past 16 years the industry has started its transition to a
liberalized market for passengers, with the concerned European directive in force since 2010,
requiring technology developments addressing the integration between those national systems
(for example Eurostar Paris 3 Lille 3 London and Thalys Paris 3 Brussels 3 Antwerp 3 Rotterdam
3 Amsterdam). Moreover this industry is using innovation to maintain their market position and
enforce their technologies as dominant standards.
Graph 5.19, below, reveals the railway industry main purposes when undertaking technology
development activities.
Graph 5.19. Purpose for undertaking technology development activities (Q17)
(% for each option of responses)
Graph 5.19 shows that the “anticipation of new societal challenges, policies and market
constraints” take the highest share, with 59.2% of responses stating that they are frequently a
reason to embark on anticipation activities and 26.5% stating that they are always a purpose for
undertaking technological developments. The least selected reason is the improvement in
manufacturing process. Overall graph 5.19 shows less technical are the purposes most
frequently they are considered by respondents.
The graphs below, from 5.20 to 5.28, break down results by “purpose” and institutions type.
36.4%
61.4%
35.6%
44.7%41.3%
36.2%
31.3%
38.3%
14.3%
34.1%31.8%
51.1%
38.3%
43.5%46.8%
52.1%48.9%
59.2%
29.5%
6.8%
13.3%17.0% 15.2% 17.0% 16.7%
12.8%
26.5%
0%
10%
20%
30%
40%
50%
60%
70%
Product4
development4
and4design
Manufacturing4
process
Modeling4and4
planning
Certification4
and4
homologation4
(make4
products4 and4
methods4
compliant4 with4
regulations4
and4customer4
requirements)
Cost4reduction4
(product,4
process4and4
operations)
Solve4technical4
problems
Make4the4final4
product4
attractive4to4
the4end4users
Enter4in4new4
markets4or4
gain4market4
share4from4
competitors
Anticipate4 new4
social4
challenges,4
policies4 and4
market4
constraints
Not4frequently
Frequently
Always

!!
130
Graph 5.20. Purpose for undertaking technology development activities: Product development and
design (Q17a) (% of the total responses per category of stakeholder)
Product development process and design purposes (Q17a) appears at the middle of the
aggregated results in the previous graph 5.19.
The brake down of results on product design, in graph 5.20, reveals that universities,
manufacturers and component suppliers deviate from the general pattern, “always” considering
product development and design as a purpose to undertake technology development activities,
with 78%, 57% and 33% of respective responses.
The very high percentage of responses from universities justify from the fact those responding
to the survey were mainly from engineering schools. While for component suppliers can be
interpreted as an indication on the outsourcing from manufacturing.
These results contrast with the dominant “not always” responses given by respondents affiliated
to the other types of stakeholders. The most striking contrasts being governments and train
operators each with the totality, 100%, of their respondents “not” considering it as a reason for
undertaking technology development activities. Just is well justified by their focus of activity,
once services and the other policy-making.
This shows that component suppliers and manufacturers have in hands the technology
development of the high-speed train either as a full system or sub-systems.
0%10%20%30%40%50%60%70%80%90%
100%Always
Frequently
Not;frequently;

!!
131
Graph 5.21. Purpose for undertaking technology development activities: Manufacturing process (Q17b)
(% of the total responses per category of stakeholder)
Improvements in the manufacturing process as purpose for technology development in this
industry were the least considered in graph 5.19 aggregating the total of results.
In line with the product development and design, also here one can see in graph 5.21
manufacturing and component suppliers high percentage of positive replies contrasting with
the negative ones from other types of stakeholders. Those two “frequently” and “always”
considering it, with 29% plus 43% and 50% plus 8% of responses respectively. Manufacturers
are the ones that most frequently pursue this purpose, as shows the greater differential between
the “not frequently” and “always” & “frequently” replies. They are constantly looking for more
efficient integration and assembling of components.
Graph 5.22. Purpose for undertaking technology development activities: Modelling and planning
(Q17c) (% of the total responses per category of stakeholder)
0%10%20%30%40%50%60%70%80%90%
100% Always
Frequently
Not;frequently;
0%10%20%30%40%50%60%70%80%90%100% Always
Frequently
Not;frequently;

!!
132
Modelling and planning purpose appears in graph 5.19 of aggregated results as the third purpose
out of the nine mostly considered.
Graph 5.22 shows component suppliers, “frequently” 67%, manufacturing, “frequently” 86%,
research centers, “frequently” 50%, and universities, “always” 75%, were the main
stakeholders in pursuing developments in planning and modelling (including simulation
software and other computational methods) in product design, data analysis, and manufacturing
processes.
Traditionally, manufacturers have addressed technology development of the high-speed trains
by trial-and-error but with the introduction of software such as CAM and CAD and other
computational tools they have reduced development times as well as labor and mock-up costs.
Also high percentage of responses from governments, with 67% responding frequently perusing
technology development activities for modelling and planning. This is not a surprising result if
considered that transport planning and modelling is one of their main tasks.
Graph 5.23. Purpose for undertaking technology development activities: Certification and
homologation (Q17d) (% of the total responses per category of stakeholder)
Certification and homologation appeared in graph 5.19 of aggregated results as the least of the
purposes in pursuing technology developments in this industry.
Graph 5.23 reveals manufacturing and component suppliers highly perusing technological
improvements to comply with certification and homologation requirements. Certification and
homologation is always peruse by 71% of the manufacturers and frequently peruse by 67% of
component suppliers.
0%10%20%30%40%50%60%70%80%90%100% Always
Frequently
Not;frequently;

!!
133
For certification bodies this purpose is the only one they look at when involved in technology
developments (certification bodies have not responded to the other purposes). This reflects their
systemic function within the innovation chain.
It should be noted that from components suppliers and manufacturing this is the most frequent
of the listed purposes for undertaking technology development. Demonstrating that in this
industry technology advancements are incremental and not radical.
Graph 5.24. Purpose for undertaking technology development activities: Cost reduction (Q17e)
(% of the total responses per category of stakeholder)
Cost reduction appeared in graph 5.19 of aggregated results as one of the least considered
purposes in pursuing technology developments in this industry.
However, as graph 5.24 shows, in contradiction to the general trend, finding ways for cost
reduction are highly perused by manufacturing, with total responses distributed between 57%
frequently and 43% always, reflecting their business based on narrow profit margins. Half of
Research centers, component suppliers and consultancies were also found pursuing frequently.
0%10%20%30%40%50%60%70%80%90%100%
Always
Frequently
Not;frequently;

!!
134
Graph 5.25. Purpose for undertaking technology development activities: Solve technical problems
(Q17f) (% of the total responses per category of stakeholder)
Solving technical problems appeared already in graph 5.19 as the least of the purposes in
pursuing technology developments in this industry.
Graph 5.25 clearly shows that manufacturers and component suppliers are the ones most
concerned in solving technical problems. Manufacturers were unanimous in responding that
they frequently pursue this purpose, accounting with 100% of all their responses. While
component suppliers were split in their responses between 50% frequently pursuing this
purpose, and always & not always pursuing it both with 25% of responses. This way it can be
said that technological developments for vehicle enhancements is the pattern for the
stakeholders bearing the technological task of producing and assembling the technology in a
system which sub-systems interface and work.
Graph 5.26. Purpose for undertaking technology development activities: Make the final product
attractive to users (Q17g) (% of the total responses per category of stakeholder)
0%10%20%30%40%50%60%70%80%90%100% Always
Frequently
Not;frequently;
0%10%20%30%40%50%60%70%80%90%100%
Always
Frequently
Not;frequently;

!!
135
Making the final product attractive to end users appeared in graph 5.19 of aggregated results
the second most frequent reason for pursuing technology development in this industry.
Railway associations and component suppliers have the highest rate of responses in frequently
making the final product attractive to end users with 80% and 75% of responses respectively.
Followed by manufacturing with 57% of respondents frequently doing it and 43% always
pursing it.
Train operators here shift their pattern in their purposes for technology developments as they
increase their positive responses. They are however split between frequently and not frequently
pursing technology developments for product attractiveness, 50% each.
Component suppliers here score high as the majority responding to this survey are supplying
interiors components or ICT solutions. Those are technologies visible by the user of the train
and directly impact their travel journey. Maybe these results could change if there had been
greater participation from others types of component suppliers.
Graph 5.27. Purpose for undertaking technology development activities: Enter new markets or gain
market from competitors (Q17h) (% of the total responses per category of stakeholder)
Entering new markets or gain market share from competitors appeared in graph 5.19 of
aggregated results at the middle of the reasons for pursuing technology developments in this
industry.
Manufacturers are the ones pursuing it the most it with 57% of respondents frequently doing it
and 43% always doing it. Followed quite close by component suppliers with 83% frequently,
and 8% always doing it.
0%10%20%30%40%50%60%70%80%90%100%
Always
Frequently
Not;frequently;

!!
136
This is an indication of competition introduced since the liberalisation of the railway market in
2001, with incumbents in the supply chain aiming at maintain their dominant position. Whilst
for manufacturing, they have fewer numbers of direct competitors with only two to three, which
dominate the market. This reflects the industry history as well as the complexity of the
technology at stake (Moretto et al. 2014 and referred in section 4.3 multi-level perspective).
Graph 5.28. Purpose for undertaking technology development activities: Anticipate new societal
challenges, policies and market conditions (Q17i) (% of the total responses per category of stakeholder)
Anticipating new societal challenges, policies and market conditions appeared in graph 5.19 of
aggregated results as the most frequent reason of all in the technology development of high-
speed trains.
Graph 5.28 shows governments, manufacturing and research centers the ones following the
most this purpose, trailed closely by component suppliers. Train operators split between 50%
“not always” and 50% “frequently” pursuing it.
Q18. Existing technology development practices
Technology development embraces a series of practices such as basic research, concept and
development feasibility, product and process development, regulations, public affairs, market
entry, among others. The predominance of each one of those depends on the stakeholder
positions within the innovation supply chain and the objectives it wants to accomplish
(Schilling 2013).
Graph 5.29 shows the overall results for the high-speed train industry.
0%10%20%30%40%50%60%70%80%90%100% Always
Frequently
Not;frequently;

!!
137
Graph 5.29. Existing technology development practices (Q18)
(% of total of responses)
Graph 5.29 shows that for the high-speed train industry technological development practices
mainly occur on concept and development feasibility of new solutions with 49.2% of replies
and on product and process development with 44.1%. Basic research, regulatory alignments
and societal assessments come in third, each with 39% of responses. Research for market entry
has one of the lowest percentage of responses, 35.5%, reflecting the monopolistic positions of
incumbent stakeholders and limited new market opportunities.
Graph 5.30. Existing technology development practices. Breakdown (Q18)
(% of the total responses per category of stakeholder)
Graph 5.30 shows that concept development and feasibility is a wide spread practice by all the
stakeholders represented in the survey, but not the dominant one at individual level.
As one could expect, components suppliers and manufacturers higher percentage of responses
on developing products & processes, with 25% and 21% of responses respectively. Component
suppliers also attributed relevance to concept development, accounting with 22%. Also
expected was research centers and universities prevalence on basic research with 23% and 27%
39.0%
49.2%44.1%
39.0%
25.4%
39.0%
30.5%
3.4%
0
0.1
0.2
0.3
0.4
0.5
0.6
Basic0research0or0applied0research
Concept0development0and0feasibility
Product0 &0Process0
development0
Regulations Public0 affairs0and0public0relations
Societal0assessment0
(formulation0 of0scenarios)
Market0entry0(chanel,0 band,0
service,0costumer0
engagement)
Other
0%
10%
20%
30%
40%
50%
60%
70%
80%
90%
100% Basic1research1or1applied1research
Concept1 development1and1feasibility
Product1 &1Process1development1
Regulations
Societal1assessment1
Other
Market1entry1(chanel,1band,1service,1costumer1 engagement)
Public1 affairs1and1public1relations

!!
138
of responses. To note that research centers was high in responses on societal assessment, with
23%, resulting even with basic research.
Also as expected governments are split between social assessment and regulations both at the
top if their replies with 21% each.
Train operators did not reply to this question.
Q19. Openness to collaborative research
Stakeholders often face decisions about the scope of activities to perform in-house or in
collaboration with other partners (Schilling, 2013). Such decisions are recurrent in high-speed
trains having a significant portion of technological developments arising from the integration
of different solutions requiring different capabilities. Graph 5.31 below aims at assessing to
which extent that results from collaborative efforts between the multiple stakeholders, bilateral
collaborations, involvement of specific groups as users or in-house.
Graph 5.31. Openness to collaborative research (Q19)
(% of total of responses)
Graph 5.31 shows prevalence in this industry of collaborative R&D, with 35% of respondents
doing it in consortium and 25% bilaterally, against 28% of them doing it by themselves in
house.
28%
25%
35%
7%
5% In)house)with)my)engineering)team)or)colleagues
Bilateral) collaboration) with)an)external) partner
Consortium) with)external)partners
Users?group
Other

!!
139
Graph 5.32. Openness to collaborative research. Breakdown (Q19)
(% of the total responses per category of stakeholder)
The breakdown of results reveal that for component suppliers give preference for performing
technology developments in-house, with 41% of responses. Only 27% of them stated doing it
in consortium of multiple partners and 23% bilaterally. They go against the overall trend
resulting in higher number of responses on research in consortium.
Such is the case of manufacturers, with collaborative developments in a consortium prevailing,
with 35% of replies, above in-house or on a bilateral basis, each with 30% of responses. These
results can be read as an indication of outsourcing practices by manufacturers, looking for the
integration of subsystems they buy from suppliers or looking for specific knowledge falling
outside their competences in collaboration with their component suppliers and train operators.
It can also be interpreted a way to ensure the dominance of their design and standards trough
collaborative projects.
Research centers follow the same pattern as manufacturing. In this industry, research centers
have specific knowledge and the complexity of the high-speed train technology system requires
interface with other providers of complementary know-how.
As expected governments are the ones who pursue the most user engagements, with 25% of
responses in this category.
Q20. Technological partnerships
Technological partnerships involve a number of stakeholders with a variety of competences.
Graphs 5.33 below reveal the most prominent partnerships in the development of high-speed
trains as overall industry and graph 5.34 breaks results down by stakeholder.
0%10%20%30%40%50%60%70%80%90%100% In.house.with.my.
engineering.team.or.colleagues
Bilateral. collaboration.with.an.external.partner
Consortium. with.external. partners
UsersDgroup
Other

!!
140
Graph 5.33. Technological partners (Q20)
(% of total of responses)
Partnerships with specialised technological providers as universities and research centers
prevail in high-speed trains industry, with 19.3% of responses. Also in-house partnerships with
colleagues are prominent with 17.3% of responses. This confirms previous results, where
prevailing collaborative activities with external partners to the institutions.
In which refers to the split made between collaboration with component suppliers from the rail
or other sectors, graph 5.33 shows a greater preference for component suppliers from the same
sector, with 11.4% of responses, over the ones from other sectors, with 5%, such as aeronautics,
automotive, ICT, materials and energy. This reveals this industry distance from external
technology advancements from other sectors.
Graph 5.34. Technological partners. Breakdown (Q20) (% of the total responses per category of stakeholder)
17.3%
10.4%11.4%
5.0%3.0%
19.3%
10.9%
7.9%5.9%
7.4%
1.5%
0%
5%
10%
15%
20%
25%
0%
10%
20%
30%
40%
50%
60%
70%
80%
90%
100% Colleagues4(in8house)
Manufacturers
Component4 suppliers4 from4the4rail4sectorComponent4 suppliers4 from4other4 sectors4(specify)Direct4 competitors
Universities4 &4Research4CentersCustomer
End8user
Certification4 bodies
Railway4Associations
Other

!!
141
Graph 5.34 shows component suppliers mostly favoring in-house research and development,
with 23% of responses. While research centers, were found to split their preferences between
in-house and collaboration with other universities and research centers, with 26% of responses
each.
In manufacturing prevails collaborative research and development with component suppliers
as well as with universities and research centers, each with 14% of responses. Manufacturers
also shows a high percentage on collaboration with component suppliers from other sectors,
with 11% of responses, significantly above other stakeholders.
Collaboration with customers and end-users scores quite differently between respondents’
types. While component suppliers and manufacturing privilege collaborations with customers,
respectively fifth in their ranking, end-users were privileged mainly by consultancies 20%,
governments and research centers, both with 14% of responses. Here manufacturers score the
lowest with only 2% of replies and train operators not even replying. This clearly indicates a
distance of the major players in this industry from users and society in the technological
development of the train. This will be further addressed in the survey by the questions
specifically addressing societal embedding.
Direct competitors were selected only by manufacturing, 9% of responses, and by component
suppliers with 2%.
Train operators did not reply to this question.
Q21. Relevant factors for conducting collaborative research
Collaborative research is better known as a way to understand complex problems or anticipate
then and how to design and implement research-based responses to those problems (Schilling
2013).
Graph 5.35 shows that for the high-speed industry the relevant factors for conducting
collaborative research.

!!
142
Graph 5.35. Relevant factors for conducting collaborative research (Q21) (Ranking: sum of attributed points)
In graph 5.35 the anticipation of new societal challenges, policies and market constraints”] was
ranked as the most relevant factor. They corresponded to the environments of technological
selection listed in Deuten et al. (1997).
Graph 5.36. Relevance of collaborative research. Breakdown. (Q21)
(Ranking: sum of attributed points per category of stakeholder)
In graph 5.36 the breakdown by stakeholders is homogeneous. The most considered of factors,
anticipation of new societal challenges, policies and market constraints are the first for
governments, 25%, researcher centers 23%, manufacturing railway association and universities
169
193
160145
154172
0
50
100
150
200
250
to,elaborate,new,solutions,matching,customer,
requirements
to,anticipate,new,social,challenges,,policies, and,market,
constraints
to,solve,a,technical,
problem, in,a,core,technology,subBsystem
to,solve,a,technical,
problem, in,an,outsourced,
technology,subBsystem
to,make,the,final,product,compliant, and,attractive,with,
customer,requirements
to,transfer,technology,or,
absorb,technology,
0%10%20%30%40%50%60%70%80%90%100% to.elaborate.new.solutions.
matching.customer.requirementsto.anticipate. new.social.challenges,.policies. and.market.constraintsto.solve.a.technical. problem. in.an.outsourced. technology.subDsystemto.solve.a.technical. problem. in.a.core.technology. subDsystem
to.make.the.final.product.compliant. and.attractive.with.customer. requirementsto.transfer.technology. or.absorb.technology.
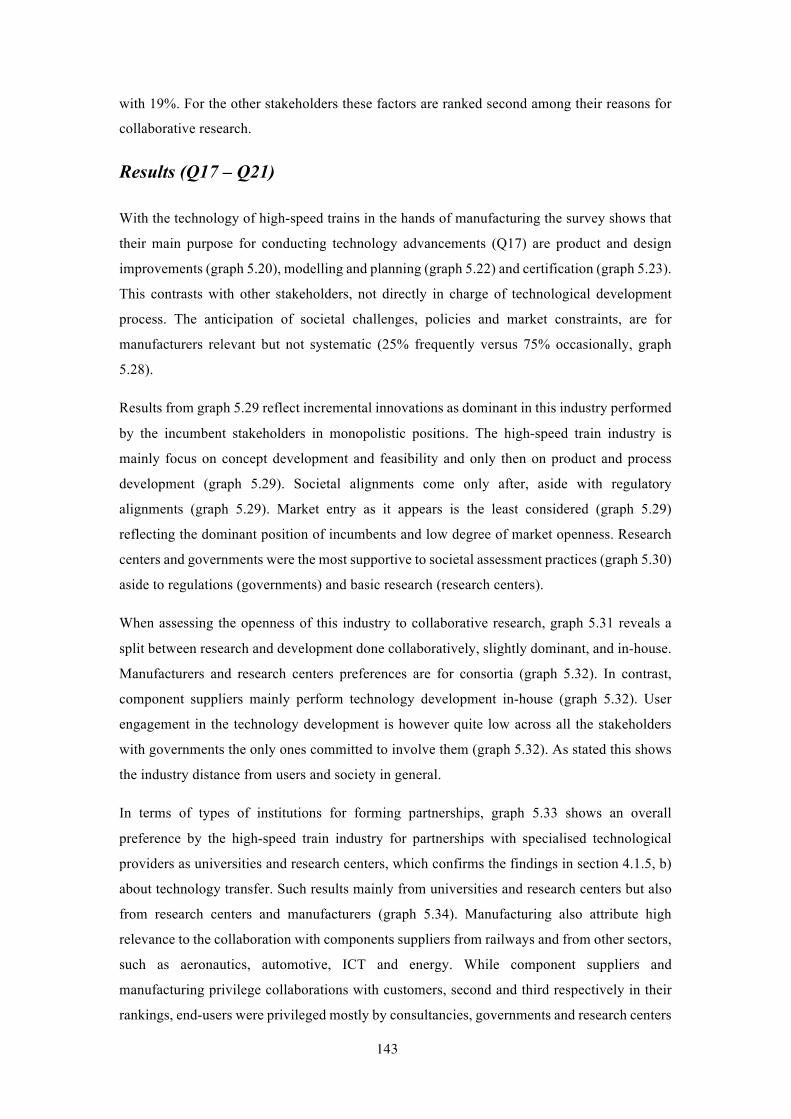
!!
143
with 19%. For the other stakeholders these factors are ranked second among their reasons for
collaborative research.
Results (Q17 – Q21)
With the technology of high-speed trains in the hands of manufacturing the survey shows that
their main purpose for conducting technology advancements (Q17) are product and design
improvements (graph 5.20), modelling and planning (graph 5.22) and certification (graph 5.23).
This contrasts with other stakeholders, not directly in charge of technological development
process. The anticipation of societal challenges, policies and market constraints, are for
manufacturers relevant but not systematic (25% frequently versus 75% occasionally, graph
5.28).
Results from graph 5.29 reflect incremental innovations as dominant in this industry performed
by the incumbent stakeholders in monopolistic positions. The high-speed train industry is
mainly focus on concept development and feasibility and only then on product and process
development (graph 5.29). Societal alignments come only after, aside with regulatory
alignments (graph 5.29). Market entry as it appears is the least considered (graph 5.29)
reflecting the dominant position of incumbents and low degree of market openness. Research
centers and governments were the most supportive to societal assessment practices (graph 5.30)
aside to regulations (governments) and basic research (research centers).
When assessing the openness of this industry to collaborative research, graph 5.31 reveals a
split between research and development done collaboratively, slightly dominant, and in-house.
Manufacturers and research centers preferences are for consortia (graph 5.32). In contrast,
component suppliers mainly perform technology development in-house (graph 5.32). User
engagement in the technology development is however quite low across all the stakeholders
with governments the only ones committed to involve them (graph 5.32). As stated this shows
the industry distance from users and society in general.
In terms of types of institutions for forming partnerships, graph 5.33 shows an overall
preference by the high-speed train industry for partnerships with specialised technological
providers as universities and research centers, which confirms the findings in section 4.1.5, b)
about technology transfer. Such results mainly from universities and research centers but also
from research centers and manufacturers (graph 5.34). Manufacturing also attribute high
relevance to the collaboration with components suppliers from railways and from other sectors,
such as aeronautics, automotive, ICT and energy. While component suppliers and
manufacturing privilege collaborations with customers, second and third respectively in their
rankings, end-users were privileged mostly by consultancies, governments and research centers

!!
144
(graph 5.34). Collaboration with direct competitors was selected only by manufacturing and by
component suppliers (graph 5.34).
The anticipation of new societal challenges, policies and market constraints was ranked by the
sum of all respondents scores as the most relevant factor for conducting collaborative research
(graph 5.35), ranked as first or second by all stakeholders (graph 5.36). From the low rating in
collaborative research and development “to solve a technical problem in a core technology sub-
system” one could assume that this is a type of development mainly done in-house or in a
bilateral cooperation as found in section 4.1.5 d) on the vehicle technological system.
B. SOCIETAL EMBEDDING
This part of the survey draws from the literature of innovation studies, in particular innovation
journeys as found in Van de Ven et al. (1999), Schot and Geels (2008), Robinson and Propp
(2011), Rip (2012). These authors share that innovation is journey like, traversing different
landscapes of development. A journey that traces on innovations history, its dynamics and
tools for managing them. By revisiting innovation journeys these scholars assesses what
successful innovations are about.
Deuten, Rip & Jelsma (1997, p.133) refers to the broad notion of success of an innovation
journey by including three dimensions: integration of new products in relevant industries and
markets, admissibility by rules and standards set by governments and agencies, acceptance by
the public. The authors consider public acceptance as key dimension embedding technology in
markets, but often ignored, which is then linked to the other two dimensions.
The authors recognize that anticipating on societal embedding brings with this the challenge of
uncertainty and vague collective action, and thus are often omitted from firm strategies, as they
are difficult to control. To overcome the challenge the authors suggest mapping internal and
external alignments through interactions with societal actors, as it creates mutual learnings. For
this to succeed it should be as an orchestration activity for learning and managing directions
better rather than a control, with emphasis on anticipation. This is directly related to
Constructive Technology Assessment literature (Rip et al 1995, Rip and Schot 1997, Robinson
2010, Rip and Robinson 2013) emphasizing on managing innovation processes in real-time,
through collective anticipation and a knowledge of dynamics of technical change fed into the
process to improve both anticipation and learning. In this way it is a reflexive support tool.
Reflexive in terms of learning about different perspectives, and reflexive in terms of learning
about other actor’s motivations and practices.

!!
145
For this reason, societal embedding, as defined by Deuten et al. (1997) provides a framework
for the next part of the survey on the iii) drivers and alignments in technology change. The
question on societal embedding is explored during two main periods of technology
development: (a) the strategic planning (aiming anticipation of societal drivers) and (b) the
technology development process (aiming interventions on alignments based on societal
requirements).
In part vii) societal alignments in the strategic management approach questions focus on the
institutionalization of societal embedding during development practices, as to understand if
they are formally structured or informal.
iii) Drivers and alignments in technology change
Design and development drivers define the agenda for technology change. Drivers, as agendas,
for technical change become requirements when a new product is created (Deuten, Rip, Jelsma,
page 134, 1997). Both refer to two different moments for strategic management of
technological innovation. It corresponds (a) to the timing of anticipation and (b) to
requirements for the timing of alignment.
The survey asked respondents to rank in relevance the drivers that could trigger a technology
change (Q22) and then to rate their relevance in terms of alignment at the different levels of the
technological development (Q23) known as Technology Readiness Levels (TRL). Also in this
part of the survey, respondents were asked about drivers as sources of information (Q24) and
the type of alignment appraisal instruments frequently used (Q25).
The objective of this group of questions is to understand the relevance attributed to alignment
with the wider society environment by the high-speed train industry during the technology
development process of the vehicle, from its early stage of concept to its readiness for entering
the market.
Q22. Drivers for technology change
Drivers that trigger firms’ technology changes may have their origin external to the industry,
or internal to the industry or even intra-organizational.
External drivers to the industry are mainly societal including demographic changes, shifts in
mobility patterns, climate change and energy, connected travelers, etc.
While those internal to the industry are mostly related to policy changes, such as the
introduction of new regulations, liberalization of markets, funding schemes, and business &

!!
146
engineering drivers, including access to new markets, threat from new entrants or new customer
requirements.
Intra-organizational events correspond to firm’s change in strategy, cost reduction, acquisitions,
new operation practices, etc.
Respondents were asked to rate in relevance the drivers for technology change. Results are
found in graph 5.37 below.
Graph 5.37. Rate in relevance the factors driving your research and development (Q22)
(Ranking: 1 low to 10 high)
Graph 5.37 shows business & engineering as the most relevant of the drivers with 7.3 points.
Other drivers follow closely with less than a point difference. Societal drivers with 7.1 points,
policy with 6.7 and internal to the organization with 6.4 points.
Each driver is related with different aspects considered in the technology development, as seen
before. Policy is related with compliance, societal drivers with attractiveness, business &
engineering with competitiveness and intra-organizational with efficiency. This way, from the
scores in graph 5.37 the main driver is competitiveness, followed by attractiveness and
compliance. Efficiency is the last of drivers.
6.7 7.1 7.36.4
0
1
2
3
4
5
6
7
8
9
10
Policy2&2Regulations Societal Business2&2Engineering
Internal2to2the2organization

!!
147
Graph 5.38. Drivers for technology change. Breakdown by institutions (Q22)
(% of the total responses per category of stakeholder)
For simplicity of analysis graph 5.38 focus on the three main drivers for technology change as
identified in the previous graph 5.38, being policy, societal and business & engineering.
Graph 5.38 reflects railway stakeholders’ position in the supply chain. As one could expect
manufacturing, 28%, and component suppliers, 28%, attribute higher relevance to business &
engineering (competitiveness) when monitoring for technology changes. Manufacturing
registered a slightly lower response rate on policy and societal drivers, 24% each. While
component suppliers, selected societal drivers 24% over policy and regulations 21%.
In graph 5.38, governments and regulatory bodies rate of responses was higher for policy and
regulations drivers, 31% and 29% respectively, followed by societal drivers 29% and 26%, and
only after business and engineering 27% and 21%.
Universities are the only group of stakeholders responding to this question considering societal
drivers the most relevant factor for technology change, 34%. It reinforces findings in chapter
4.1 referring to universities as the privileged partners of manufacturers to scan for wider society.
Research centers would be expected to align with universities however they do not. They
aligned with governments’ responses.
Train operators have a low participation to this question (Q22) attributing the same score to all
of the drivers, which makes it difficult to arrive to any conclusion on their respect.
0%10%20%30%40%50%60%70%80%90%100%
Societal
Policy6&6regulations
Business6&6Engineering

!!
148
Q23. Requirements for technology change
Drivers become requirements when a new research project is launched and they are integrated
as assessment criteria in the technology development process.
Each technology development process is framed by a project, which foresees different readiness
levels (TRL), ultimately leading to the technological maturity. Those levels are gated by
requirements of alignment (or indicators) aimed at control the quality of research and
development project and ensure that it is being executed in an efficient manner (Schilling 2013).
The following graph 5.38 presents the aggregated results on the relevance attributed to the
identified drivers at the different TRL. This question differs from the previous as its focus is on
the actual process of technology development, while the other was on the anticipation during
strategic formulations (meaning, respondents’ perceptions on the drivers leading to technology
change).
Graph 5.39. When developing a new technological solution (TRL) which requirement for alignment
you consider? (Q23) (% of total of responses)
Graph 5.39 shows that at the time of implementation business & engineering requirements
accentuates importance, synonym of this industry techno-centricity.
In the following graph 5.40 the relevance on the requirements for technology change are
detailed for each TRL, with graph 5.41 to 5.49 further showing results by institution types.
21.7%
56.1%
22.2%
0%
10%
20%
30%
40%
50%
60%
Policy1drivers Business1&1engineering1drivers
Societal1drivers

!!
149
Graph 5.40. When developing a new technological solution for the high-speed train at which technological readiness levels (TRL) you consider identified requirements for alignment? (Q23)
(% of total of responses)
Graph 5.40 shows that business & engineering requirements change in an inverted “U” shape
curve while societal and policy requirements vary in an imperfect “U” curve. This means that
at early stage of technology development, in TRL1, where basic principles are considered and
reported business & engineering score their lowest in relation to other TRL, 36.8%, and societal
and policy requirements score their highest, 35.1% and 28.1%. Then business & engineering
requirements increases relevance to a maximum 75.7% in TRL4 while societal and policy
driver decrease to a minimum 10.8% and 13.5% respectively also in TRL 4. Business &
engineering lose momentum in particular in TRL8 and TR9 while societal and policy
requirements regain.
Such fluctuation in the relevance of environments confirms the sequential alignment in firms
practice as detected in Deuten, Rip & Jelsma (1997) studies and here referred.
It is important to note that TRL1 results are similar to the ones in graph 5.37 referring to the
drivers for technology change, with business & engineering slightly above societal and then
policy requirements. This happens because of the anticipatory character of TRL1 where
developers look for the societal trends required to bring basic research principles to applied
research. Also for TRL8, by the time technology becomes matured, societal requirements
aiming in this case at impact assessments also regain relevance but not to the levels of TRL1.
This implies that societal requirements are in demand as anticipatory function rather than for
impact assessments.
28%22%
15% 14% 17%
28%
22%
30%27%
37%
57%61%
76%
63%54% 53%
43% 46%
35%24%
11%
20%17%
24% 27%
0%
10%
20%
30%
40%
50%
60%
70%
80%
Policy1&1Regulations
Business1&1Engineering
Societal1

!!
150
A respondent underlined that TRL 4 corresponds to the engineering process selection
conditioned by business & engineering requirements. Another respondent comment added that
societal requirements are brought back only in TRL 8 and 9 when the technology matures,
requiring assessing the technology impacts.
In TRL8 it is observed a higher attention to policy requirements then to societal as at this stage
technology developers are looking at compliance with regulations and standards of the new
technology being developed.
The following graphs 5.41 to 5.49 further breakdown each TRL by institution types.
Graph 5.41. Requirements relevance at TRL 1. Basic principles observed and reported (Q23)
(% of the total responses per category of stakeholder)
TRL 1 corresponds to the initial stage of technology development when basic principles are
observed and reported. It is when basic research begins to be translated in applied research and
development. Examples might include paper studies of a technology’s basic properties138. The
main outputs are reports and papers.
As it was seen previously in graph 5.39, at this level, policy and societal drivers scored their
highest, 28.1% and 35.1% accordingly, yet below that of business & engineering 36.8%.
The breakdown of results by institution type provides an indication of the practices in the
industry. At this level consultancies scan for societal trends 60% and railway associations
mainly policy drivers 43%, such as new regulations, standards and funding. Also component
suppliers are looking to policy 36% and societal drivers 36% as internal exercises. While
manufacturers mostly look at responses to a technical problem or scanning new business
138 http://ec.europa.eu/research/participants/data/ref/h2020/wp/2014_2015/annexes/h2020-wp1415-annex-g-trl_en.pdf
0%10%20%30%40%50%60%70%80%90%100%
Societal4drivers
Policy4drivers
Business4&4engineering4drivers

!!
151
opportunities 46% at this stage. Research centers and universities are equally split between
societal drivers and business & engineering, 36% and 50%.
Contrasting with manufacturers, component suppliers attribute, at this TRL, a higher relevance
to policy & regulations 36% and societal requirements 36% than to business & engineering
29%. This is because component suppliers to this survey are mainly on interiors, materials and
ICT, supplying also for aviation and automotive. Component suppliers are required to develop
and adapt their technologies to societal trends and policy/regulations specific to high-speed
trains. While for the manufacturers, in its turn, societal and policy/regulations pressures are
attenuated by their dominant position and relative direct competition.
Contrary to what one would expect governments mostly consider in TRL1 business &
engineering requirements 60% instead of policy 20% and societal 20%. This may be explained
as, at this stage, there is little intervention or knowledge from governments on the technology
being developed by component suppliers and manufacturers.
Graph 5.42. Requirements relevance at TRL 2. Technology concept formulated (Q23)
(% of the total responses per category of stakeholder)
TRL2 corresponds to the moment when the technology concept (and/or application) is
formulated. Developers are looking to fields of application. Examples might include
publications or other documents that outline the application being considered and that provide
analysis to support the concept139.
As it was seen previously in graph 5.40, at TRL2 policy and societal requirements reduce their
scores, 21.6% each, while business & engineering increase 56.9%. This is particularly striking
139 http://ec.europa.eu/research/participants/data/ref/h2020/wp/2014_2015/annexes/h2020-wp1415-annex-g-trl_en.pdf
0%10%20%30%40%50%60%70%80%90%100%
Societal4drivers
Policy4drivers
Business4&4engineering4drivers
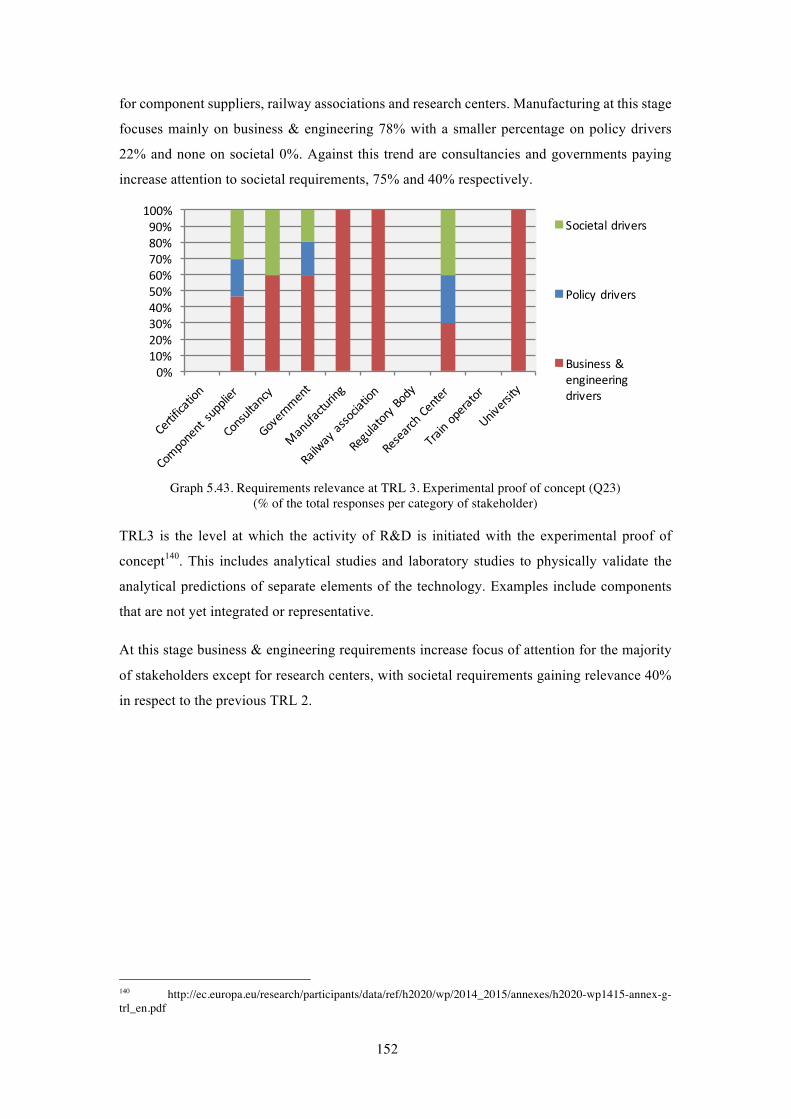
!!
152
for component suppliers, railway associations and research centers. Manufacturing at this stage
focuses mainly on business & engineering 78% with a smaller percentage on policy drivers
22% and none on societal 0%. Against this trend are consultancies and governments paying
increase attention to societal requirements, 75% and 40% respectively.
Graph 5.43. Requirements relevance at TRL 3. Experimental proof of concept (Q23)
(% of the total responses per category of stakeholder)
TRL3 is the level at which the activity of R&D is initiated with the experimental proof of
concept140. This includes analytical studies and laboratory studies to physically validate the
analytical predictions of separate elements of the technology. Examples include components
that are not yet integrated or representative.
At this stage business & engineering requirements increase focus of attention for the majority
of stakeholders except for research centers, with societal requirements gaining relevance 40%
in respect to the previous TRL 2.
140 http://ec.europa.eu/research/participants/data/ref/h2020/wp/2014_2015/annexes/h2020-wp1415-annex-g-trl_en.pdf
0%10%20%30%40%50%60%70%80%90%100%
Societal4drivers
Policy4drivers
Business4&4engineering4drivers

!!
153
Graph 5.44. Requirements relevance at TRL 4. Technology validation in laboratory (Q23)
(% of the total responses per category of stakeholder)
TRL 4 is the peak of engineering where technology is validated in laboratories or workshops141.
Basic technological components are integrated to establish whether they will work together.
Examples include integration of ad hoc hardware in the laboratory.
At this level manufacturers and component suppliers are mostly concerned with proving the
functionality of the solution while ensuring compliance with technical requirements. This is
clearly reflected in the graph 5.44 with business & engineering at their maximum level of
relevance for component suppliers 79% and manufacturing 88% as well as for research centers
83% and universities 67%.
As was already seen for graph 5.40, societal and policy drivers are at their minimum of
relevance for all the stakeholders 13.5% and 10.8% respectively. Yet policy requirements score
a bit higher than societal for manufacturers, 23% vs 0%, railway associations, 20% vs 0%, and
universities, 33% vs 0%, looking at compliance with regulations. Societal requirements were
only considered by components suppliers 20%, consultancies 25% and research centers 17%.
141 http://ec.europa.eu/research/participants/data/ref/h2020/wp/2014_2015/annexes/h2020-wp1415-annex-g-trl_en.pdf
0%10%20%30%40%50%60%70%80%90%100%
Societal4drivers
Policy4drivers
Business4&4engineering4drivers

!!
154
Graph 5.45. Requirements relevance at TRL 5. Technology validation in relevant environment (Q23)
(% of the total responses per category of stakeholders)
TRL5 refers to the technology validation in relevant environments142. Breadboard systems (a
base for prototyping) are integrated with other supporting elements in a simulated operational
environment.
In graph 5.40 business & engineering requirements slightly decrease in relevance to 63.4% and
societal and policy slightly increase to 19.5%. Graph 5.45 results per stakeholders shows
societal and policy requirements registered a high percentage of responses from research
centers 38% and consultancies 60%.
Graph 5.46. Requirements relevance at TRL 6. Technology demonstration in a relevant environment
(Q23) (% of the total responses per category of stakeholders)
142 http://ec.europa.eu/research/participants/data/ref/h2020/wp/2014_2015/annexes/h2020-wp1415-annex-g-trl_en.pdf
0%10%20%30%40%50%60%70%80%90%100%
Societal4drivers
Policy4drivers
Business4&4engineering4drivers
0%10%20%30%40%50%60%70%80%90%100%
Societal4drivers
Policy4drivers
Business4&4engineering4drivers

!!
155
TRL 6 is when technologies (system and subsystems models or prototypes) are demonstrated
in a relevant environment143. They are tested on their readiness to enter a market and reach
society. Examples include testing a prototype in a laboratory environment or even in a simulated
operational environment.
Technology at this stage is maturing. Stakeholders shift their attention from business &
engineering requirements to policy compliance and societal alignment, both concerned with
ensuring the technology readiness for introduction in market. Policy requirements reaches the
same relevance as in TRL1 in graph 5.40, 28.1%
Graph 5.46 shows that for the majority of the stakeholders’ business & engineering are yet kept
high in respect to other requirements. Universities are the exception, pairing all of the three
requirements in terms of relevance, 33%.
Governments increase their interest from TRL6 on societal requirements as they are concerned
at this stage with acceptance and impacts of the technology solution by wider society – it is
becoming a more pressing policy concern.
Graph 5.47. Requirements relevance at TRL 7. System prototype demonstration in an operational
environment (Q23) (% of the total responses per category of stakeholders)
143 http://ec.europa.eu/research/participants/data/ref/h2020/wp/2014_2015/annexes/h2020-wp1415-annex-g-trl_en.pdf
0%10%20%30%40%50%60%70%80%90%
100%Societal4drivers
Policy4drivers
Business4&4engineering4drivers

!!
156
In TRL 7 the prototype is getting closer to an operational system144. It represents a major step
up from TRL 6 by requiring demonstration of an actual system prototype in an operational
environment (e.g. in a train vehicle or on a track).
Following TRL6 trend, business & engineering and policy requirements decreases but only
slightly, 22.2% and 53.3% accordingly, while societal requirements increase 24.4%, as shown
in graph 5.40.
The breakdown of these results by stakeholder in graph 5.47 show that for manufacturing
business & engineering further decrease in relevance to 50%, while societal drivers emerge to
13%. Policy drivers remain at 38%. At this stage manufacturing confirms compliance with
specific regulations and customer requirements.
Component suppliers keep their attention high with regards to business & engineering, 50%,
especially if supplying parts in non-core technologies for high-speed trains operations such as
interiors.
Graph 5.48. Requirements relevance at TRL 8. System completed and qualified through test and
demonstration (Q23) (% of the total responses per category of stakeholders)
In TRL8145 the technology is proven to work in its final form and under expected conditions. It
represents the end in the development process. Examples include developmental tests and
evaluation (DT&E) of the technology system in its intended operations to determine if it meets
design specifications.
144 http://ec.europa.eu/research/participants/data/ref/h2020/wp/2014_2015/annexes/h2020-wp1415-annex-g-trl_en.pdf 145 http://ec.europa.eu/research/participants/data/ref/h2020/wp/2014_2015/annexes/h2020-wp1415-annex-g-trl_en.pdf
0%10%20%30%40%50%60%70%80%90%100%
Societal4drivers
Policy4drivers
Business4&4engineering4drivers

!!
157
At TRL 8, as it was found in graph 5.40, policy requirements regain momentum reaching its
maximum of relevance with 30% of responses, over passing its relevance in TRL1. Policy
requirements also overpassed societal aspects even though there was an increase of the last to
27%. Business & engineering requirements decrease to 30%.
In which concerns the same results by stakeholder, in graph 5.48, one sees that the increase in
policy driver relevance is mainly an outcome of universities paying greater attention in TRL8
to regulations and standards, with 100% of responses, above all the others. Also component
suppliers increase their attention to policy requirements in ways of impact assessment, 43%.
Contrasting manufacturers registered an accentuated increase in attention to business &
engineering climbing to 70% of responses. Policy and societal drivers droped to 20% and 10%
of responses as these stakeholders start considering placing the technology in the market and
scan for opportunities.
At TRL8 governments significantly increase their attention to societal constraints, 43%
overpassing for the first time policy and business. The same will apply to TRL9, as it will be
shown.
Graph 5.49. Requirements relevance at TRL 9. Actual system proven through successful
mission operations (Q23) (% of the total responses per category of stakeholders)
In TRL 9146 the actual application of the technology in its final form occurs under mission
conditions, such as those encountered in operational test and evaluation (OT&E). Examples
include using the system under operational conditions.
146 http://ec.europa.eu/research/participants/data/ref/h2020/wp/2014_2015/annexes/h2020-wp1415-annex-g-trl_en.pdf
0%10%20%30%40%50%60%70%80%90%100%
Societal4drivers
Policy4drivers
Business4&4engineering4drivers

!!
158
For the high-speed train industry TRL 9 might even correspond to the stage when a tender has
been issued by a train operator wishing to buy high-speed trains to serve in a specific corridor,
requiring homologation by certification bodies and customisation to the operator image and
end-users culture.
As could be expected, results in graph 5.49 show manufacturers, the ones making the
technology offer to the train operator, considering the most business & engineering
requirements 60% (yet slighting decreasing from TRL8 which registered 43%). Manufacturers
increased their attention to societal requirements 20% to the percentage of policy making (while
in TRL 8 societal was 10% and policy 20%).
Component suppliers at this TRL pair their business & engineering with regulations at the top
of their concerns, each with 38%. At this stage they are quite concerned to prove compliance
with all the standards and homologations when required.
Research centers and universities are now favoring more business & engineering with 40% and
100% respectively. While governments have the same percentage of responses as in TRL8,
28%, favoring societal constraints.
Q24. Sources of drivers and requirements
Firm’s or government drivers and requirements of alignments for technology change originate
from different sources ranging from personal contacts to conferences and trade shows. They
can be specific to the industry or external, covering technological matters to soft issues such as
management, or addressing specific topics as environment and energy or broader societal
trends.
Respondents were asked to indicate their sources of information. Results are shown in graph
5.50, below.
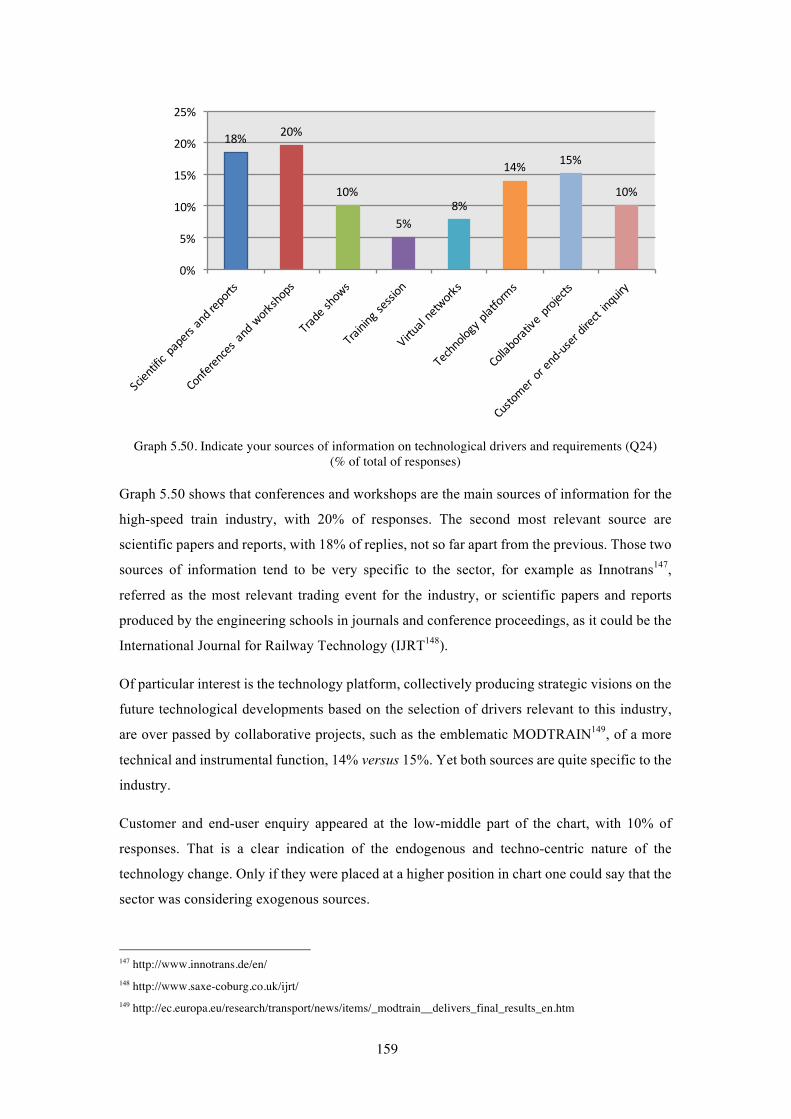
!!
159
Graph 5.50. Indicate your sources of information on technological drivers and requirements (Q24)
(% of total of responses)
Graph 5.50 shows that conferences and workshops are the main sources of information for the
high-speed train industry, with 20% of responses. The second most relevant source are
scientific papers and reports, with 18% of replies, not so far apart from the previous. Those two
sources of information tend to be very specific to the sector, for example as Innotrans147,
referred as the most relevant trading event for the industry, or scientific papers and reports
produced by the engineering schools in journals and conference proceedings, as it could be the
International Journal for Railway Technology (IJRT148).
Of particular interest is the technology platform, collectively producing strategic visions on the
future technological developments based on the selection of drivers relevant to this industry,
are over passed by collaborative projects, such as the emblematic MODTRAIN149, of a more
technical and instrumental function, 14% versus 15%. Yet both sources are quite specific to the
industry.
Customer and end-user enquiry appeared at the low-middle part of the chart, with 10% of
responses. That is a clear indication of the endogenous and techno-centric nature of the
technology change. Only if they were placed at a higher position in chart one could say that the
sector was considering exogenous sources.
147 http://www.innotrans.de/en/ 148 http://www.saxe-coburg.co.uk/ijrt/ 149 http://ec.europa.eu/research/transport/news/items/_modtrain__delivers_final_results_en.htm
18% 20%
10%
5%8%
14% 15%
10%
0%
5%
10%
15%
20%
25%

!!
160
It is worth exploring in the next graph 5.51 below, the breakdown of sources of drivers by
institution type, to see which actors are considering endogenous or exogenous sources of
information.
Graph 5.51. Indicate your sources of information on technological drivers and requirements.
Breakdown (Q24) (% of the total responses per category of stakeholders)
All the stakeholders are quite endogenous and techno-centric in their sources of information.
However, as graph 5.51 shows manufacturers the highest of responses for consultations to
customers and end-users, with 16% of responses. The results pair with scientific papers and
reports, also with 16%, quite technical and produced by universities or research centers
covering a specific field. Yet at the top of manufacturers preferences are conferences and
technology platforms with 18% each of responses.
Component suppliers also pay attention to consultations to customers and users however this
one appears 4th place in their list, with 11%, even with collaborative projects and technology
platforms.
It should be noted that governments attribute the highest attention to technology platforms, such
as ERRAC, and reports from collaborative projects, with 23% each. This is a reflection of the
participation to this survey of respondents from the European Commission DG RTD and DG
MOVE, promoters and funding entities for these types of activities. As referred, also
manufacturers consider technology platforms as the most relevant source of information a side
with conferences and trade shows, each with 18%.
Another aspect relates to train operators not selecting technology platforms, collaborative
projects and direct consultations to end-users as source of information. They rather concentrate
their responses on scientific papers and reports, conferences and workshops as well as trade
shows, with 33% each.
0%
10%
20%
30%
40%
50%
60%
70%
80%
90%
100% Scientific3 papers3and3
reports
Conferences3 and3
workshops
Trade3shows
Training3session
Virtual3networks
Technology3platforms
Collaborative3 projects
Customer3 or3endHuser3
direct3 inquiry

!!
161
Component suppliers clearly scan for drivers and requirements at business and engineering
level from its prioritization to conferences 18% and trade shows 16%.
Regulatory bodies were the only stakeholders not replying to Q24, which could be explained
by their regulatory function implementing policies set by governments or the European
Commission, rather than scanning for technology changes.
Q25. Appraisal instruments
Developing new technologies is expensive, time-consuming and risky. Firms have to take
decisions on which technology option to support. To make such choices, firms use a series of
appraisal instruments, often in combination, that vary from informal to well-structured and from
entirely quantitative to strictly qualitative (Schilling 2013).
The following two graphs 5.52 and 5.53 show the results for the high-speed train industry on
their preferences on the appraisal instruments.
Graph 5.52. In which type of instruments you base your technology decisions? (Q25)
(% of total of responses)
As graph 5.52 shows, the high-speed train industry seems to equally consider qualitative and
qualitative indicators as main instruments. Distinctions arise when breaking down the graph by
institution type as shown graph 5.53 below.
30.7% 30.7%
19.3%
12.3%
7.0%
0%
5%
10%
15%
20%
25%
30%
35%
Quantitative2indicators
Qualitative2indicators
Best2practices Informal2appraisals
Influence2from2others

!!
162
Graph 5.53. You base your technology decision on which type of instruments. Breakdown (Q25)
(% of the total responses per category of stakeholders)
In graph 5.53, stakeholders seem to use a mix of methods. Component suppliers, governments,
railway associations, regulatory bodies, research centers and universities, break-even between
decision-making supported by quantitative and qualitative indicators, prioritizing them in
respect to the remaining instruments.
Manufacturers in their turn have a more distinctive prioritization of appraisal instruments
valuing quantitative indicators over qualitative, 29% vs 25%, followed by best practices, with
21% of the preferences.
None of the train operators and certification bodies replied to this question.
Results (Q22 to Q25)
At the time of anticipating technology changes, respondents attributed very similar degrees of
relevance to the different drivers presented, with business & engineering slightly higher in
relevance than societal aspects and policy (graph 5.37). From this, one could say that at strategic
level, societal anticipation is highly considered by the high-speed industry.
The breakdown of results by institution type (graph 5.38) reveals that business & engineering
drivers were highly rated by component suppliers and manufacturing. In its turn policy drivers
were highly ranked by governments and regulatory bodies (graph 5.38). A better result would
have been expected for societal drivers, as they appeared second in the aggregated results (graph
5.37). Universities were in greater number ranking them higher than the other drivers (graph
5.38). Manufacturing scored policy equally above societal drivers (graph 5.38).
0%10%20%30%40%50%60%70%80%90%100%
Quantitative4indicators
Qualitative4indicators
Best4practices
Informal4appraisals
Influence4from4others

!!
163
When referring to time in implementing the technological development process (or product
creation according to Deuten, Rip & Jelsma, 1997), at the time when drivers become
requirements for alignment, business & engineering were the most considered by respondents
(graph 5.39). Societal and policy requirements got a much lower percentage of responses (graph
5.39). There is therefore an observable difference between strategy and development.
From the breakdown of the results by technology readiness levels (graph 5.40) it was observed
an inverse relation between responses on business & engineering and responses on societal and
policy requirements. Across the different technology readiness levels (TRL) business &
engineering fluctuate in an inverted “U” curve while society and policy present a normal “U”
shape (graph 5.40). Concerning business & engineering requirements, stakeholders attributed
a lower relevance in TRL1 (the early stage of technology development when basic principles
are observed and reported) which then progressively increases arriving to its maximum in TRL4
(corresponding to the pick of engineering activities with the validation of results) and then
decreases to a minimum in TRL8 (corresponding to the stage when the actual technological
system is completed and qualified through tests and demonstrations). Business & engineering
requirements slightly increase in TRL9 when the actual system has been proven successful is
matured and ready to be introduced in the market. The opposite happens for societal and policy
requirements across the TRL (graph 5.40). They are highly considered at TRL1 and TRL8 and
the least considered at TRL4. It should be highlighted that societal requirements reach their
maximum percentage at TRL1 (almost the same percentage of responses as for business &
engineering). In TRL1 societal requirements yet have an anticipatory function while in TRL8
and also in TRL9 they serve an impact assessment purpose.
Moving to the breakdown of the listed requirements for technology change at the different
TRLs, from graphs 5.41 to 5.49, it was found that manufacturing have, from all stakeholders,
the highest rate of responses on business & engineering requirements at all the TRLs and the
lowest on societal requirements. Only in TRL1 manufacturing register a higher percentage of
responses on societal requirements, even above policy yet below business & engineering, which
demonstrates that manufacturers seem to value only the anticipation function of societal
requirements at the early stage of the technology development process, not considering so
relevant its impact assessment at a later stage of development. Also component suppliers and
universities value the anticipatory character of societal requirements in TRL1. While
governments value the impact assessment function of societal requirements with their highest
percentage of responses in TRL8 and TRL9. Consultancies and research centers have the
highest percentage of responses of all stakeholders on societal requirements across all stages of
the development. Train operators did not reply to the relevance of the listed requirements in
new technology developments (Q23).

!!
164
Now passing to the sources of information on drivers and requirements for technology change,
results (in graph 5.50) show that respondents are quite endogenous and techno-centric in their
search. They mostly refer to their own industry conferences and workshops followed by
scientific papers and reports, collaborative projects and technology platforms visions and
agendas. Customers and end-users direct inquiry account with a less percentage of responses in
respect to other sources for each stakeholder, except for manufacturing (graph 5.51) where they
appear in the second place even with scientific papers and reports.
In terms of appraisal instruments, (in graph 5.52) respondents equally considered qualitative
and quantitative methods, using a mix of both. Manufacturing however stands out from other
stakeholders by prioritizing quantitative methods (as financial and economic) over qualitative
ones (graph 5.53).
iv) Societal elements in the strategic management approach
Deuten, Rip & Jelsma (1997, p.143-148:219-236) state that firms openness to societal
alignments (mutual learning and exploration of interactions) is dependent on two elements: the
firm’s “learning pressure” and “room for learning”, which can occur in a “single loop” or
“double loop”.
The authors consider that “learning pressures” are high when it is about a core technology for
a firm or they are close to the consumer or even if their technology is easy to reproduce by
competitors. In its turn the authors say that “room for learning” is small if firms depend on one
or few products or services or also are pioneering new technologies due to scare management
resources. The authors continue saying that room for learning is small when technologies
require a fast product development, against the ones with 10 years or more to develop a new
product.
Citing Argyris & Schöln (1978) the authors say that “single loop learning” aims to improve
ways and means to achieve firm’s goals; while “double loop learning” experience and reflection
lead to the consideration of one goals. They further refer that those interactions between firms
and wide society are strategic games.
This part aims at addressing the underlying aspects on high-speed train industry strategic games
and necessary alignments with wider society. To this end, respondents were asked what societal
alignment represents for them (Q26); how formal or informal their interactions with societal
actors are (Q27); and if respondents include societal requirements gates in their technology
strategic planning and development activities (Q28).

!!
165
Q26. What represents alignment with societal actors?
A broader consideration of market success of new technologies implies that society has or gets
a stake in their development and introduction. Consequently, societal actors become a
stakeholder (Deuten, Rip & Jelsma, 1997).
It is expected that societal stakeholders have different interests, culture and expectations than
the ones developing the technology imposing difficulties to introduce them in the technology
development process. Respondents were asked what societal alignment represented for them.
Results are shown in graph 5.54 below.
Graph 5.54. What represents technology alignment with societal actors? (Q26)
(% of total of responses)
Graph 5.54 results show that respondents are positive towards societal actors inclusion in the
technology development. A relevant percentage of respondents, 28.2%, considered that
alignment with societal actors a way for risk mitigation of technology failure when new
technology enters the market. Nevertheless 24.2% of respondents limit the benefit to the stage
when it is still possible to incorporate their expectations during the development process.
The minority of respondents, who have shown concerns over societal actors inclusion in the
technology development of the train, fear mostly the risk of disclosure of confidential
information and creation of premature negative reactions, with 10.5% of responses, over the
additional costs that it could bring to the development process 7.3%.
10.5%
7.3%
24.2%
13.7%
16.1%
28.2%
0%
5%
10%
15%
20%
25%
30%
a-risk-at-early-stage-as-confidential-
information- can-become-public- or-raise-premature-negative-reactions
a-risk-at-latter-stage-as-it-can-increase-
costs-of-reenginering-product- and-
processes-as-there-might-be-little- room-
for-change
beneficial- when-it-is-still-possible- to-incorporate- their-expectations
beneficial- if-the-dilemma-of-
unbalances-and-desalignments-are-
successfully-overcome
beneficial- if-creates-shared-technological-
paths
beneficial- as-societal-actors-can-provide-indications- on-the-degree-of-public-
acceptance-of-new-technologies

!!
166
The breakdown of results in graph 5.55, below, shows the differences between respondents.
These differences result from respondents learning pressures and room for learning (Deuten,
Rip & Jelsma, 1997).
Graph 5.55. What represents technology alignment with societal actors? (Q26)
(in % of the total responses per category of stakeholders)
Graph 5.55 shows that manufacturers considered the most alignments with societal actors
beneficial for public acceptance, 32%, and beneficial when it is still possible to incorporate
their expectations, 20%. Which is in line with the aggregated values in the previous graph 5.54.
However, manufacturers registered less responses, 12%, recognising the benefits in the creation
of development paths with societal actors. Only universities resulted in the most supportive
stakeholder with 36% of responses.
Most likely societal alignment represents for manufacturing a “single loop of learning”,
providing single ways of meeting their goals as being the degree of public acceptance of a new
technology and their ambition of control rather than orchestrating the uncertainties and
collective actions.
Differently, component suppliers rather consider societal alignment relevant if it is still possible
to accommodate their expectations, 32%. This clearly links with their lower learning pressures
from wider society than for the manufacturers as described, reflecting their position far from
direct contact with customers of the train, the train operators, and the end users. Their room for
learning is even lower than the manufacturing industry as many of them are dependent on a
single technology subsystem with a shorter technology development cycle than for the
assembly of a full train.
Yet for component suppliers the path creation with societal actors is considered by a greater
percentage of respondents than for manufacturing, 16% vs 12%. For component suppliers this
0%
10%
20%
30%
40%
50%
60%
70%
80%
90%
100%a-risk-at-early-stage-as-confidential-information- can-become-public- or-raise-premature- negative-reactions
a-risk-at-latter-stage-as-it-can-increase-costs-of-reenginering- product- and-processes- as-there-might-be-little-room- for-change
beneficial- when-it-is-still-possible- to-incorporate- their- expectations
beneficial- if-the-dilemma-of-unbalances-and-desalignments-are-successfully-overcome
beneficial- if-creates-shared-technological-paths
beneficial- as-societal-actors-can-provide-indications- on-the-degree-of-public-acceptance-of-new-technologies

!!
167
might mean a “double loop of learning” considering one’s requirements and their ambition to
accommodate rather than control.
In its turn train operators unanimously, 100%, considered the benefit in the involvement of
societal actors in the technology development process as provider of acceptance for new
technologies. One can speculate that one of the reasons is mostly exposed to customer and
wider societal pressures as providers of the service. Room for learning is high with train
operators looking for pre-acceptance of their train services. The lack of reference to path
creation can be interpreted as an indication of the single loop learning as mentioned for
manufacturing, as they bare no risks with societal actors involvement during the technology
development process in hands of manufacturers and component suppliers.
Governments, the guardians of society, equally considered the benefits of societal involvement
for public acceptance of new technologies and the benefice it brings when it is still possible to
incorporate their expectations, each with 33%. Their pressures for learning are high. Alike for
train operators no reference to path creation can be interpreted as an indication of the single
loop learning as mentioned for manufacturing and train operators.
Q27. Management for societal embedding
Supporting dialog with societal actors to increase mutual learning is not straightforward. Firms
and societal actors often have conflicting interests, different norms and values and different
ways of interpreting the situation (Deuten et al. 1997). In addition, societal actors have little or
no interest to discuss with firms unless they see that their involvement triggers a change (Rip
et al. 1995). When exposure and openness to societal embedding is high large firms employ
individuals who are responsible for communicating with societal actors and institutionalise the
practice in their organizational structure.
In order to assess the above referred in the high-speed train industry respondents were asked if
they consider or not distinctive stage gates during technology development process to align
with societal actors; if they have someone in their institution responsible for societal alignment;
if they treat societal actors as a stakeholder; if they are open and pro-active to interact with
societal actors.
The questions were retrieved from part of table 2 in Deuten, Rip and Jelsma paper (1997, table
2, page 145) where the authors list the elements of societal inclusion approach in the
management of product creation. The second part of the table is used latter in this survey in
Q28. The authors call attention to the relevance of the mix, rather than considering them
separately.

!!
168
The results are presented in graph 5.56 below.
Graph 5.56. Technology management includes the following elements? (Q27)
(% of total of responses)
Graph 5.56 can be split into two parts. On the left side of the graph are two informal
management elements of embedding societal actors in technology development refereeing to
“openness and pro-attractiveness to interact with societal actors” and “treatment of societal
actors as stakeholders” as they do not imply an institutionalized nor formal structure inside the
organization. While on the right side of the graph are the two formal elements referring to
“inclusion of someone responsible for societal alignment” and “consideration of gates for
societal alignment” requiring the institutionalization and a formalization of societal inclusion
in the management of technology.
Graph 5.56 shows a clear inflection between informal elements and formal elements. Meaning
that positive responses (Yes) have higher scores on informal elements and negative answers
(No) have higher scores on formal elements.
Graph 5.56 reveals that a high percentage of respondents replied positively to informal elements
covering their institution openness and pro-activeness to interact with societal actors, 66.7%,
as well as in considering societal stakeholders per se as a stakeholder, against a small percentage
of negative responses, 10.3% and 13.2% respectively.
On the other hand, results from graph 5.56 reveal that a high percentage of respondents replied
negatively to formal elements, namely the nomination of an employee in their institution
responsible for societal alignment, 43.2%, and distinguishing separate assessment gates in
66.7%60.5%
35.1%
16.2%10.3%
13.2%
43.2%45.9%
23.1%26.3%
21.6%
37.8%
0%
10%
20%
30%
40%
50%
60%
70%
Shows2openness2and2pro9activeness2to2interact2 with2societal2actors?
Treats2societal2actors2as2
stakeholders?
Includes2someone2responsible2 for2
societal2alignment2in2cross9functional2
team?
Distinguishes2separate2
development2lines2(gates)2for2societal2
alignment?
Yes
No
Maybe

!!
169
technology development for societal alignment 45.9%, against a fewer percentage of positive
replies, 35.1% and 16.2% respectively.
When analyzing the results breakdown by the different institution types one can find differences
between them for the reasons referred in the previous section (greater exposure to societal
actors, competition pressures, technology complexity, etc). See graphs 5.57, 5.58, 5.59 and 5.60
below, grouped in two, informal and formal elements.
a) Informal
Graph 5.57. Technology management includes the
following elements? Breakdown (Q27a) (% of total responses per category of stakeholders)
Graph 5.58. Technology management includes the
following elements? Breakdown (Q27b) (% of total responses per category of stakeholders)
b) Formal
Graph 5.59. Technology management included the
following elements? Breakdown (Q27c) (% of total responses per category of stakeholders)
Graph 5.60. Technology management included the
following elements? Breakdown (Q27b) (% of total responses per category of stakeholders)
Focusing on formal practices of societal embedding in technology management, graphs 5.59
and 5.60, research centers were the most supportive. The majority of them 83% stated
employing someone responsible for societal embedding. It was also found 67% of consultants
employing a person who is responsible for societal alignment. Those consultants are often
commissioned to undertake public consultations and assessments of behalf of the clients mostly
for national governments.
Finally, it should be noted that in relation to graphs 5.59 and 5.60, manufacturing and
component suppliers, even if in a small percentage, have someone employed to address societal
embedding (25% and 17%). Manufacturers do not consider gates for societal alignment in
0%10%20%30%40%50%60%70%80%90%100%
Yes
No
Maybe
Showsopeness: and:pro=activeness:to:interact:with:societal:actors?:
0%10%20%30%40%50%60%70%80%90%100%
Yes
No
Maybe
Treats societal;actors;as;stakeholders?;
0%10%20%30%40%50%60%70%80%90%100%
Yes
No
Maybe
Includes;someone;responsible;for;alignment;in;a;crossCfucntional;team?;
0%10%20%30%40%50%60%70%80%90%100%
Yes
No
Maybe
Distinguishes<separate<development<lines<(gates)< for<societal<alignment?<

!!
170
technology development process 0%. Component suppliers however have a small percentage
of respondents considering it 14% referring to end-user surveys.
Q28. Dealing with the anticipation dilemma
Societal embedding in the technology development process introduces greater uncertainties,
unknown-unknowns of vague constraints, creating the dilemma of anticipation (or Collingridge
dilemma). According to Deuten, Rip & Jelsma (1997) the dilemma can be overcome by the
articulation and monitoring of scenarios for societal embedding, mapping the relevant societal
environment and stimulating alignments. The existence of these elements extends technology
management traditional environments (business & engineering and policy & regulations) to the
societal environment.
Question 28 was retrieved from the second part of table 2 in Deuten, Rip & Jelsma paper (1997,
table 2, page 145), where the authors present the element for management of societal inclusion
in the product construction process.
Graph 5.61 below presents the results for the high-speed train industry on the extended
management to include the societal environment.
A “Yes” reply means that such activities are an institutionalised practice at the institution to
which the respondent is affiliated. A “No” reply means that they are non existent. A “Maybe”
means that they exist but informally.
Graph 5.61. Do stakeholders pay attention to societal embedding when setting their technology
strategy? (Q28) (% of total of responses for each question)
68.4%64.1%
43.6%
7.9% 10.3% 12.8%
23.7% 25.6%
43.6%
0%
10%
20%
30%
40%
50%
60%
70%
80%
Mapping3and3monitoring3society
Scenarios3for3societal3inclusion
Stimulating3mutual3learning3
Yes
No
Maybe

!!
171
During technological strategy setting, respondents replied that they are paying higher attention
to mapping and monitoring relevant environments including societal actors with 68.4% of
replies, but much less in the interaction with them with 43.6% of replies.
Also in graph 5.61 at strategic level there is a distinction between the intention and
implementation of societal embedding less accentuated than it was at technology development
level in the graph before (graph 5.56).
Results breakdown by institution type of respondents are shown in the graphs 5.62 to 5.64,
below.
Graph 5.62. Mapping and monitoring relevant environment including society? (Q28a)
(% of total responses per category of stakeholders)
From graph 5.62 results one can say that mapping and monitoring societal environment is a
wide institutionalised practice across all stakeholders. In particular, for research centers 88%
and railway associations 80%.
The only negative responses to this question were from manufacturing 14% and component
suppliers 13%, yet much below the positive ones 57% and 67%. Also from Universities, which
registered a high percentage of negative responses 23% contrasting with the high percentage of
positive ones 77%.
0%10%20%30%40%50%60%70%80%90%100%
Yes
No
Maybe
Mapping9and9monitoring9relevant9environment9including9society?9
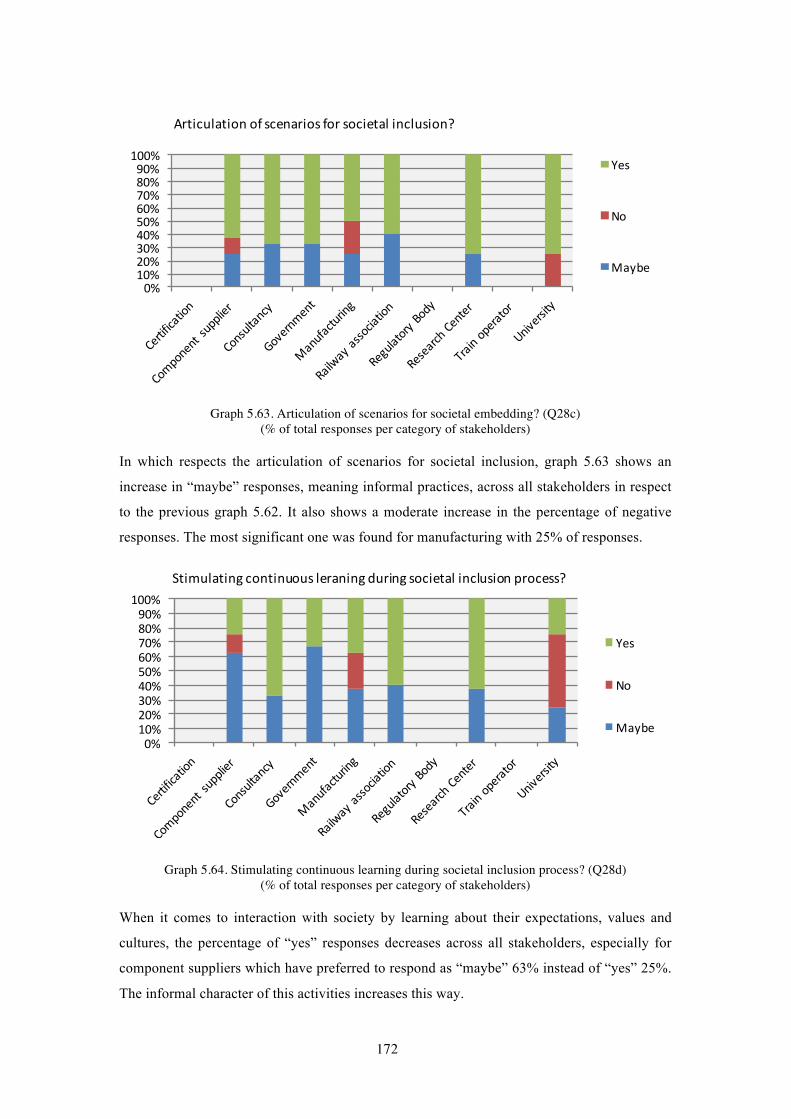
!!
172
Graph 5.63. Articulation of scenarios for societal embedding? (Q28c)
(% of total responses per category of stakeholders)
In which respects the articulation of scenarios for societal inclusion, graph 5.63 shows an
increase in “maybe” responses, meaning informal practices, across all stakeholders in respect
to the previous graph 5.62. It also shows a moderate increase in the percentage of negative
responses. The most significant one was found for manufacturing with 25% of responses.
Graph 5.64. Stimulating continuous learning during societal inclusion process? (Q28d)
(% of total responses per category of stakeholders)
When it comes to interaction with society by learning about their expectations, values and
cultures, the percentage of “yes” responses decreases across all stakeholders, especially for
component suppliers which have preferred to respond as “maybe” 63% instead of “yes” 25%.
The informal character of this activities increases this way.
0%10%20%30%40%50%60%70%80%90%100%
Yes
No
Maybe
Articulation=of scenarios=for=societal=inclusion?
0%10%20%30%40%50%60%70%80%90%
100%
Yes
No
Maybe
Stimulating=continuous=leraning=during=societal=inclusion=process?

!!
173
Results (Q26-Q28)
The overall balance for the high-speed train industry is positive towards societal actors
inclusion and their recognition as a stakeholder (graph 5.56).
They adopt an extended technology management approach to address societal environment,
during the technology development process (graph 5.56) and strategic planning (Q61), which
is informal and unstructured.
The break down by institutions however has shown that there are differences between each
stakeholder group, reflecting that each one has different learning pressures and room for
learning depending on their positioning in the supply chain.
In terms of technology development process (graphs 5.57 to 5.60) the formal extended approach
is practiced by a much smaller percentage of stakeholders (graph 5.59 and 5.60). Responses
referring to the “inclusion of someone to address societal embedding” is mostly selected by
research centers (graph 5.59). Governments, railway associations, manufacturers and
component suppliers also accounted with positive replies but with a much smaller percentage.
Manufacturers and component suppliers negative responses overtook the positive ones (graph
5.59). When referring to the inclusion of “societal assessment gates” during technology
development (TRL), positive responses decreased to even smaller percentages, especially for
component suppliers, governments and railway associations (graph 5.60).
In terms of the breakdown by respondents institutional affiliation of the extended strategic
planning to societal environment (in graphs 5.61 to 5.64) results here show that if mapping and
monitoring societal environment is relevant (graph 5.62), it is not so much so when it comes to
the articulation of scenarios allowing for societal embedding, especially in which concerns for
manufacturing, and stimulation of learning from societal actors, especially for component
suppliers. Stakeholders in the railway industry reveal this way not having this practices
institutionalized in their organizations lacking a structured approach.
v) Futures
Social embedding in new product development requires anticipation (Deuten, Rip & Jelsma,
1997) by means of strategic intelligence (Huff, 1979). Besides enquiring the high-speed train
industry on the societal inclusion in the setting of technology strategies and development
process it is also relevant to enquire on their practices on future technology assessment and how
they interlink with societal environment.
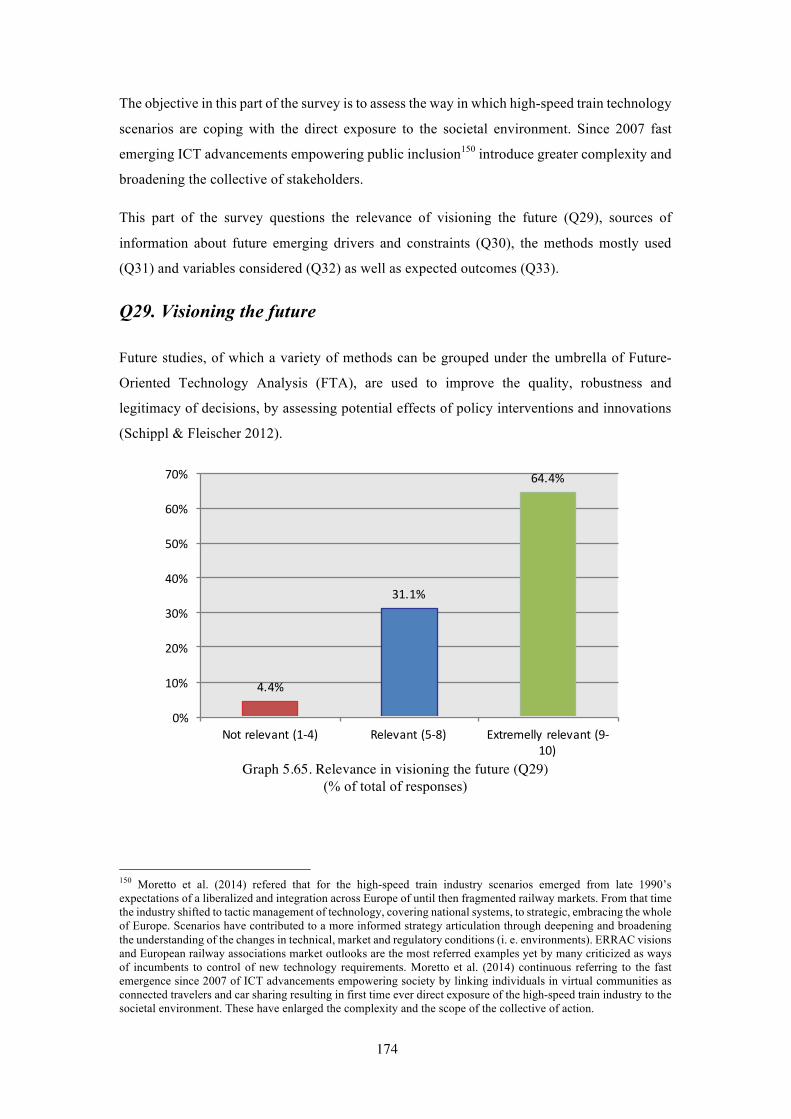
!!
174
The objective in this part of the survey is to assess the way in which high-speed train technology
scenarios are coping with the direct exposure to the societal environment. Since 2007 fast
emerging ICT advancements empowering public inclusion150 introduce greater complexity and
broadening the collective of stakeholders.
This part of the survey questions the relevance of visioning the future (Q29), sources of
information about future emerging drivers and constraints (Q30), the methods mostly used
(Q31) and variables considered (Q32) as well as expected outcomes (Q33).
Q29. Visioning the future
Future studies, of which a variety of methods can be grouped under the umbrella of Future-
Oriented Technology Analysis (FTA), are used to improve the quality, robustness and
legitimacy of decisions, by assessing potential effects of policy interventions and innovations
(Schippl & Fleischer 2012).
Graph 5.65. Relevance in visioning the future (Q29)
(% of total of responses)
150 Moretto et al. (2014) refered that for the high-speed train industry scenarios emerged from late 1990’s expectations of a liberalized and integration across Europe of until then fragmented railway markets. From that time the industry shifted to tactic management of technology, covering national systems, to strategic, embracing the whole of Europe. Scenarios have contributed to a more informed strategy articulation through deepening and broadening the understanding of the changes in technical, market and regulatory conditions (i. e. environments). ERRAC visions and European railway associations market outlooks are the most referred examples yet by many criticized as ways of incumbents to control of new technology requirements. Moretto et al. (2014) continuous referring to the fast emergence since 2007 of ICT advancements empowering society by linking individuals in virtual communities as connected travelers and car sharing resulting in first time ever direct exposure of the high-speed train industry to the societal environment. These have enlarged the complexity and the scope of the collective of action.
4.4%
31.1%
64.4%
0%
10%
20%
30%
40%
50%
60%
70%
Not.relevant.(164) Relevant.(568) Extremelly.relevant.(9610)

!!
175
Graph 5.65 above shows that the majority of enquired stakeholders consider futures extremely
relevant (64.4%) compared to a small minority considering it not relevant (4.4%). Results
breakdown by institution types are shown below.
Graph 5.66. Relevance in visioning the future. Breakdown (Q29)
(% of total responses per category of stakeholders)
The small percentage of respondents attributing no relevance to futures corresponds to
certification bodies 100% and manufacturing 13%.
One could expect from certification bodies less relevance given to future exercises, as their
mission is to enforce new technologies compliance with existing technical requirements at the
time of their entry in the market. Certification bodies have an operational function, less of a
strategic one. However, the same cannot be said for manufacturers, even the percentage was
quite low, if considered that they develop technologies lasting 30 to 35 years.
Train operators here have not replied to this question. This might well reflect their dominant
positions with some of the manufacturers and train operators seeing in futures a threat rather
than an opportunity.
The highest percentage of responses attributing extreme relevance to futures comes from
component suppliers 78% and research centers 100%.
Results from research centers are inflated due to the high participation from non-engineering
ones, dominated by providers of technology assessment which includes futures as part of their
core activities. High consideration of futures is expected from them. Universities provide a
more realistic picture on the relevance of futures from its participation of respondents affiliated
to both social and engineering schools, with 50% responses on relevant and 50% on extremely
relevant.
0%10%20%30%40%50%60%70%80%90%100%
Extremelly4relevant4(9910)
Relevant4(598)
Not4relevant4(194)

!!
176
Component suppliers, with 78% of responses considering it extremely relevant, also attribute
high-relevance to futures from their increased learning pressures and room for learning
(discussed before).
Q30. Sources of future reports
There are many different sources of future reports. They can be internal or external to the
industry or even a mix of both.
The graph 5.67 below presents the relevant sources of information on futures according to
respondents from the high-speed train industry.
Graph 5.67. Futures sources of information (Q30)
(% of total of responses)
Reports elaborated by the railway industry stand in graph 5.67 as the main source of information
71.9%. They range from collective visions as the ones issued by the European railway
technology platform ERRAC, or the manufacturers association UNIFE outlooks and railway
operators scenarios as from CER-UIC, to individual foresight exercises as from Siemens made
public or internal. They produce endogenous and techno-centric orientations for future
technology developments and are dominated by incumbent stakeholders.
Future reports external to the industry have less percentage of replies. They include reports
from third parties such as consultancies, multidisciplinary research centers or other sectors as
from energy, materials and disciplines as social sciences. They also include reports
commissioned by governmental bodies as the European Commission, European Parliament and
national parliaments. They tend to cover a broad societal environment addressing greater
uncertainties and broad spectrum of actors.
71.9%
23.1%
5.0%
0%
10%
20%
30%
40%
50%
60%
70%
80%
Reports4 from4the4railways Reports4 external4 to4the4railways
Other
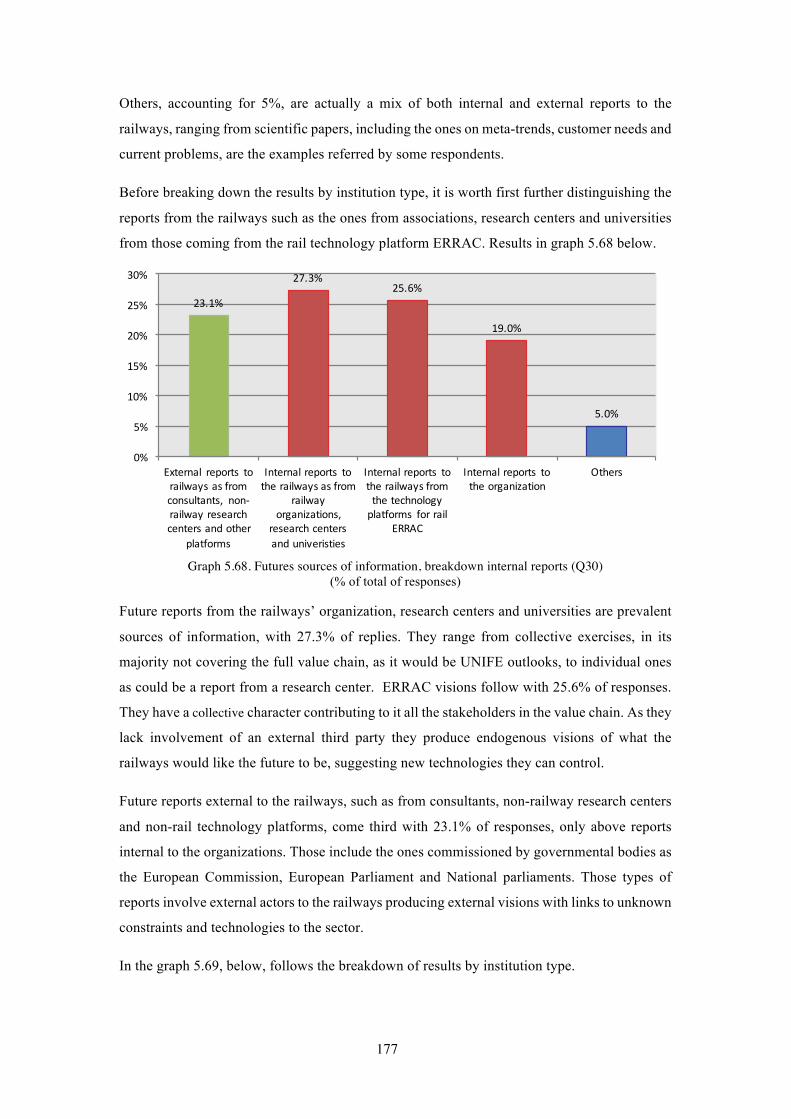
!!
177
Others, accounting for 5%, are actually a mix of both internal and external reports to the
railways, ranging from scientific papers, including the ones on meta-trends, customer needs and
current problems, are the examples referred by some respondents.
Before breaking down the results by institution type, it is worth first further distinguishing the
reports from the railways such as the ones from associations, research centers and universities
from those coming from the rail technology platform ERRAC. Results in graph 5.68 below.
Graph 5.68. Futures sources of information, breakdown internal reports (Q30)
(% of total of responses)
Future reports from the railways’ organization, research centers and universities are prevalent
sources of information, with 27.3% of replies. They range from collective exercises, in its
majority not covering the full value chain, as it would be UNIFE outlooks, to individual ones
as could be a report from a research center. ERRAC visions follow with 25.6% of responses.
They have a collective character contributing to it all the stakeholders in the value chain. As they
lack involvement of an external third party they produce endogenous visions of what the
railways would like the future to be, suggesting new technologies they can control.
Future reports external to the railways, such as from consultants, non-railway research centers
and non-rail technology platforms, come third with 23.1% of responses, only above reports
internal to the organizations. Those include the ones commissioned by governmental bodies as
the European Commission, European Parliament and National parliaments. Those types of
reports involve external actors to the railways producing external visions with links to unknown
constraints and technologies to the sector.
In the graph 5.69, below, follows the breakdown of results by institution type.
23.1%
27.3%25.6%
19.0%
5.0%
0%
5%
10%
15%
20%
25%
30%
External3 reports3 to3railways3as3from3consultants,3 non?railway3research3centers3and3other3
platforms
Internal3reports3 to3the3railways3as3from3
railway3organizations,3
research3centers3and3univeristies
Internal3reports3 to3the3railways3from3the3technology3platforms3 for3rail3
ERRAC
Internal3reports3 to3the3organization
Others

!!
178
Graph 5.69. Futures sources of information. Breakdown by institutions (Q30)
(% of total responses per category of stakeholders)
Graph 5.69 shows that all stakeholders recurred to external reports, with consultancies having
the highest percentage of all 43%. It is the only stakeholder which external reports are their
main source of information.
Governments also attribute relevance to external reports, even to ERRAC visions, each their
main source of information with 30% of responses. Here one could speculate that ERRAC
meets its purposes as their visions mostly target policy-making.
Component suppliers 29%, manufacturing 26%, railways associations 31%, research centers
26%, train operators 100% and universities 27% showed preference for reports from railways.
With manufacturing, research centers and universities attributing the same percentages to
ERRAC visions. It is interesting to notice that train operators did not refer at all to ERRAC
visions while the remaining respondents did.
Q31. Methods to access futures
Future studies include a wide range of methods such as Delphi, forecasting, foresight,
evaluation, road-maps, life-cycle-assessments, brain-storming. Respondents were asked which
ones they used. Results are presented in the graph 5.70 below.
0%10%20%30%40%50%60%70%80%90%
100%Reports3 internal3 to3the3organization
Reports3external3 to3the3railways3as3from3consultants,3nonCrailway3research3centers3and3other3platforms
Reports3 from3from3railway3organizations,3 research3 centers3and3univeristies
ERRAC3visions
Other
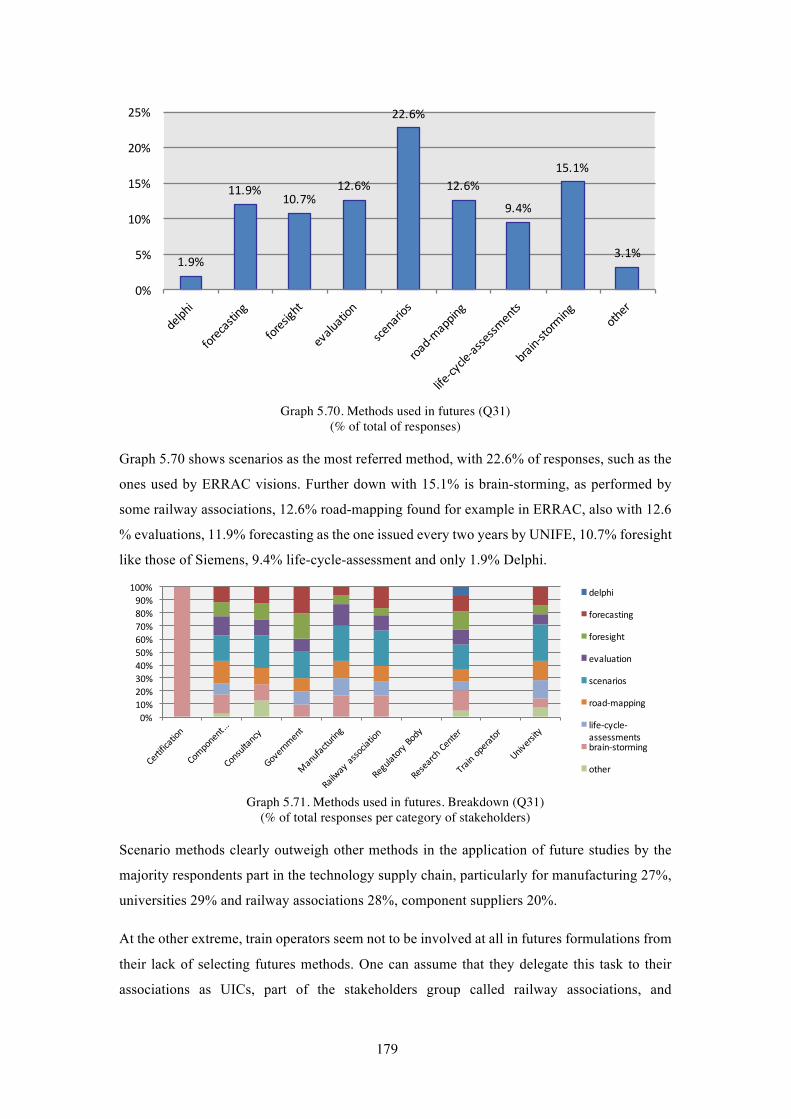
!!
179
Graph 5.70. Methods used in futures (Q31)
(% of total of responses)
Graph 5.70 shows scenarios as the most referred method, with 22.6% of responses, such as the
ones used by ERRAC visions. Further down with 15.1% is brain-storming, as performed by
some railway associations, 12.6% road-mapping found for example in ERRAC, also with 12.6
% evaluations, 11.9% forecasting as the one issued every two years by UNIFE, 10.7% foresight
like those of Siemens, 9.4% life-cycle-assessment and only 1.9% Delphi.
Graph 5.71. Methods used in futures. Breakdown (Q31)
(% of total responses per category of stakeholders)
Scenario methods clearly outweigh other methods in the application of future studies by the
majority respondents part in the technology supply chain, particularly for manufacturing 27%,
universities 29% and railway associations 28%, component suppliers 20%.
At the other extreme, train operators seem not to be involved at all in futures formulations from
their lack of selecting futures methods. One can assume that they delegate this task to their
associations as UICs, part of the stakeholders group called railway associations, and
1.9%
11.9%10.7%
12.6%
22.6%
12.6%
9.4%
15.1%
3.1%
0%
5%
10%
15%
20%
25%
0%10%20%30%40%50%60%70%80%90%
100% delphi
forecasting
foresight
evaluation
scenarios
road=mapping
life=cycle=assessmentsbrain=storming
other
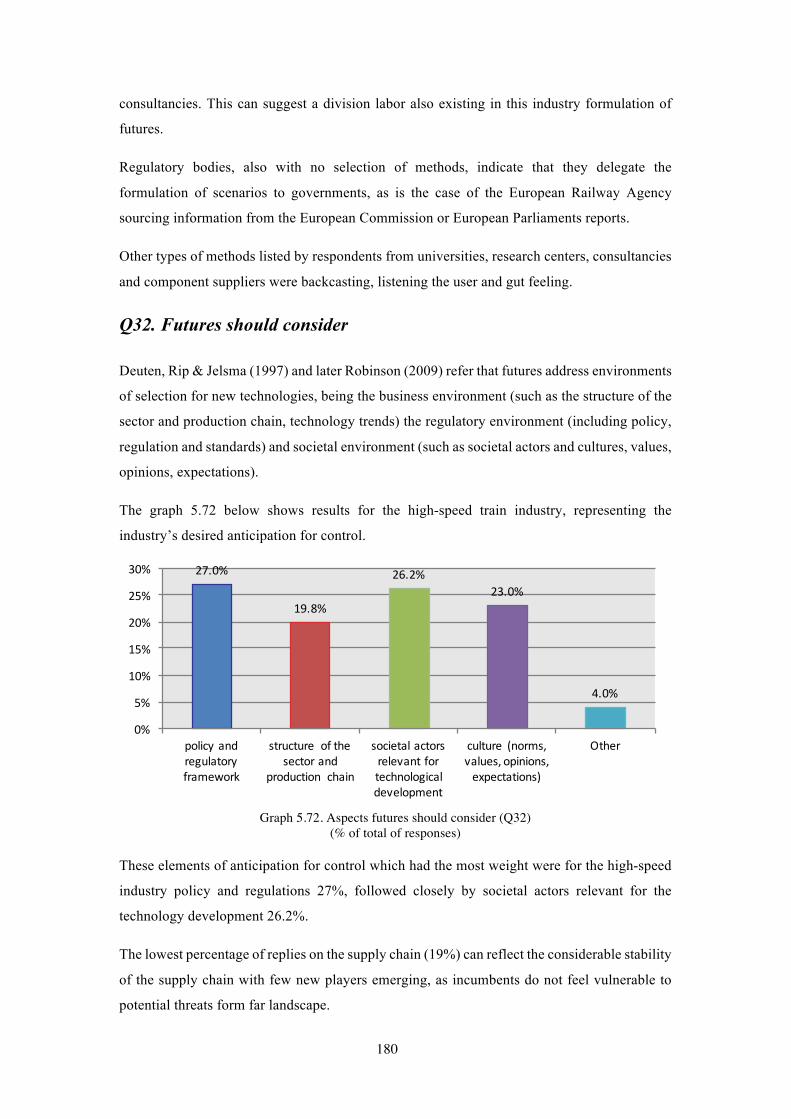
!!
180
consultancies. This can suggest a division labor also existing in this industry formulation of
futures.
Regulatory bodies, also with no selection of methods, indicate that they delegate the
formulation of scenarios to governments, as is the case of the European Railway Agency
sourcing information from the European Commission or European Parliaments reports.
Other types of methods listed by respondents from universities, research centers, consultancies
and component suppliers were backcasting, listening the user and gut feeling.
Q32. Futures should consider
Deuten, Rip & Jelsma (1997) and later Robinson (2009) refer that futures address environments
of selection for new technologies, being the business environment (such as the structure of the
sector and production chain, technology trends) the regulatory environment (including policy,
regulation and standards) and societal environment (such as societal actors and cultures, values,
opinions, expectations).
The graph 5.72 below shows results for the high-speed train industry, representing the
industry’s desired anticipation for control.
Graph 5.72. Aspects futures should consider (Q32)
(% of total of responses)
These elements of anticipation for control which had the most weight were for the high-speed
industry policy and regulations 27%, followed closely by societal actors relevant for the
technology development 26.2%.
The lowest percentage of replies on the supply chain (19%) can reflect the considerable stability
of the supply chain with few new players emerging, as incumbents do not feel vulnerable to
potential threats form far landscape.
27.0%
19.8%
26.2%23.0%
4.0%
0%
5%
10%
15%
20%
25%
30%
policy3and3regulatory3framework
structure3 of3the3sector3and3
production3 chain
societal3actors3relevant3for3technological3development
culture3 (norms,3values,3opinions,3expectations)
Other

!!
181
Graph 5.73. Aspects futures should consider. Breakdown (Q32)
(% of total responses per category of stakeholders)
Graph 5.73 reveals policy and regulatory framework the priority for governments 40%, research
centers 31% and universities 30%, with the highest rate of responses. Also train operators
highly consider it but aside to culture, each with 38% of responses.
Manufacturers, component suppliers and railway associations place a high weighting on
societal aspects above the other options. A reason for this could be because, in the case of
manufacturing and component suppliers they feel societal technological selection pressure
much more than other stakeholders
This is not the case for the train operators. They equally prioritize policy and regulatory
framework as well culture, 38%, each above societal actors and structure of the sector both
13%.
Q33. Futures expected contribution
Expectations in relation to contributions of futures studies reflect two main attitudes from
stakeholders, the one of control and the one of orchestration. According to Robinson (2009)
control refers to futures for the articulation and emphasis on desirable end points, while
orchestration focuses on revealing underlying dynamics of co-evolutions and supporting
mutual learning. Formalised expectations on the future, such as roadmaps, alert on emergent
constraints and opportunities reflecting a position of control (Robinson and Propp 2008).
Orchestration usually occurs through structured interactions and between stakeholders through
brainstorming, horizon scanning workshops and other forms of interactive future assessment.
The graph 5.74 shows the results for the high-speed industry.
0%10%20%30%40%50%60%70%80%90%100% policy2and2regulatory2
framework
structure2 of2the2sector2and2production2 chain
societal2actors2 relevant2for2technological2development
culture2 (norms,2 values,2opinions,2 expectations)
Other

!!
182
Graph 5.74. What futures should consider (Q33)
(% of total of responses)
Graph 5.74 shows stakeholders expectations when formulating scenarios are dominated by
control of emergent constraints 22.6%. Yet the stabilization character of futures comes just after
with the orchestration of alignments with wider society with 21.1%.
Interesting to note is that none of the respondents selected others nor gave comments, which
might be an indication that did not well understood the question.
Graph 5.75. What futures should consider. Breakdown (Q33)
(% of total responses per category of stakeholders)
For each stakeholder group, dominant expectations reflect its positioning in the technology
supply chain.
18.8% 19.5%22.6%
21.1%18.0%
0%
5%
10%
15%
20%
25%
Enlightenment3 on3what3the3future3might3be3(static3
futures)
Enlightenment3 on3the3path3for3the3
envisaged3scenario3by3providing3
alignments3with3supply3chain3and3societal3actors
Alert3on3emergent3constraints
Orchestrate3alignments3with3wider3society3(account3
positions3 and3interests3 of3other3
actors)
Actors3preEengagement3through3 socioE
technical3 scenario3building
0%10%20%30%40%50%60%70%80%90%
100% Enlightenment5 on5what5the5future5 might5be5(static5futures)
Enlightenment5 on5the5path5for5the5envisaged5scenario5by5providing5 alignments5with5supply5chain5and5societal5actorsAlert5on5emergent5constraints
Orchestrate5 alignments5with5wider5society5(account5 positions5and5interests5of5other5 actors)
Actors5preGengagement5through5socioGtechnical5 scenario5building

!!
183
For example, components suppliers expect futures to establish pre-engagements and alignments
on technological developments they control 25%.
While on the other hand manufacturers expect anticipation of emergent constraints from areas
outside their control, as they might not see it from where they are at regime level 24%.
Manufacturers have a control position across the supply chain, which justify orchestration and
pre-engagements the lowest of their concerns both with 17% of responses.
Train operators, in their turn, value the alert mechanism 50% it provides as well as orchestration
50%, which one could speculate on futures as a tool of direction.
Railway associations’ expectations actually reflect their mission towards serving their members
interests by enlightening their members on the possible futures and engage them on a common
direction with an approximated distribution of responses across all the criteria.
Results (Q29-Q33)
Futures are considered by the highs-speed train industry as extremely relevant 64.4% against a
small minority considering it not relevant 4.4% (Q29).
The most referred type of reports were those endogenous to the industry with (Q30) with 71.9%
of respondents referring to them against 23.1% referring to external reports. They range from
collective visions such as the ones issued by the European railway technology platform
ERRAC, or the manufacturers association UNIFE outlooks and railway operator scenarios as
from CER-UIC, to individual foresight exercises as from Siemens made public or internal. They
produce endogenous and techno-centric orientations for future technology developments and
are dominated by incumbent stakeholders. Of those internal reports to the industry the most
referred to where the ones from railway organizations, research centers and universities 27.3%,
ERRAC visions 25%. External reports only came after with 25% of responses, considered the
most by consultancies, governments and regulating bodies.
Scenario methods clearly top other methods with 22.6% of responses for key stakeholders in
the technology supply chain, which are research centers, manufacturing, universities,
component suppliers and railway associations (Q31).
The elements of anticipation for control (Q32) are for the high-speed industry policy the
regulations 27%, followed closely by societal actors relevant for the technology development
26.2%. The lowest percentage of replies on the supply chain 19% can reflect the considerable
stability of the supply chain with few new players emerging, as incumbents do not feel
vulnerable to potential threats from areas distant from their expertise and core action space.

!!
184
Component suppliers are actually the ones mostly concerned about societal aspects in future
visioning in relation to the other listed aspects they consider. Maybe because they feel much
more their selection pressure from the type of technology they supply, in this survey mainly on
interiors, ICT and materials impacting comfort.
Respondents expect from futures exercises to control for emergent constraints 22.6%, followed
by stabilization of the future through orchestration of alignments with wider society with
21.1%. Each respondent dominant expectation reflects its positioning in the technology supply
chain. For example, components suppliers expect futures to establish pre-engagements and
alignments on technological developments they control. While on the other hand manufacturers
expect anticipation of emergent constraints from far landscape as they might not see it from
where they are at regime level. As manufacturers have a control position over the supply chain
orchestration and pre-engagements are at the lowest of their concerns. Train operators in their
turn value the alert mechanism it provides as well as orchestration, which one could speculate
on futures as a tool of direction.
5.6. Survey main results
Technological related aspects, - speed, comfort and ticket faire - are the main reasons for
making people deciding to take a high-speed train in their medium to long distances travel.
The survey corroborates that the development of those technologies are in hands of component
suppliers, manufacturers and research centers (Q11), mainly from Germany and France (Q12).
They have a relative interest to involve users and wider society (Q3), except for component
suppliers. Also users have expressed little interest to be consulted on the technical aspect of the
train unless they impact their riding experience (Q3).
A. Main Results – Strategic Innovation Management
This part of the survey validates the finding in chapters 4.1 dedicated to technological strategic
intelligence and chapters 4.3. on multi-level perspective in knowledge exchange and deepened
the learnings there captured.
-! The survey demonstrates that higher levels of R&D spending (Q13) are found not
within the manufacturers but within component suppliers and research centers and that
train operators are heterogeneous in their spending.
-! The industry reports to strategic intelligence guidelines (Q14) informed by formal
channels of technology surveillance (Q15) mainly positioned in networks (Q16).

!!
185
-! Their main purpose for undertaking technological developments is to survive in open
market conditions mainly by anticipating societal changes, policies and market
constraints and then to make the final product attractive to the end-user (Q17).
Manufacturers, however, are in contrast by mainly pursuing technological development
for product and design improvements, manufacturing optimization and cost reduction
(Q17).
-! The industry is dominated by incremental innovations, reflecting the monopolistic and
incumbent nature of their stakeholders (Q18).
-! The industry is split in their openness for collaborative research (Q19) with
manufacturers and research centers mainly expressing preferences for R&D in
consortia while component suppliers in-house. User engagement in the technology
development is however quite low across all the stakeholders enquired (Q20), with
research centers expressing the highest interest to involve them. Preference goes to
collaborative research performed with specialized knowledge providers as research
centers and universities (Q20).
-! Societal challenges, policies and market constraints are the main factors leading for
collaborative research with technical problems left to be solved by in-house research
(Q21). At collaborative level manufacturers are aligned with the general trend (this did
not occur in Q17).
B. Main Results – Societal embedding innovation management
This part of the survey narrows strategic technology management to societal aspects, related to
a high degree of “reflexive” anticipation and therefore validates the finding in chapters 4.4
dedicated to future oriented technology assessment.
-! The high-speed train industry attributes high levels of relevance to the societal
environment, above policy & regulations. However business & engineering dominates
(Q22).
-! Societal requirements are relevant at the initial stage (Q23) of technology development
process (TRL1) when basic principles are observed and data collected. Then their
relevance progressively declines to its minimum (TRL4) when the technology is
validated. Latter they regain momentum when the new technology has matured, ready

!!
186
to market (TRL8 & TRL9). Different from manufacturing, component suppliers tend
to consider societal requirements in all stages of development.
-! Alignment with societal actors are considered by a great majority of respondents as
way of risk mitigation of technology failure (Q26). Manufacturing and researcher
centers showing the highest of support but also of concerns. The benefits of shared
technological paths it is the least considered by manufacturing.
-! Societal embedding is dominated by informal practices (Q27) with a great percentage
of respondents stating openness for interaction with societal actors and their
recognition as a stakeholder in the technology development. Only a few however
referred employing someone responsible for societal alignment, mainly coming from
research centers. Even fewer mentioned technology assessment gates to address them,
such as a minority of component suppliers, consultancies and railway associations.
-! (Q28) Mapping and monitoring societal environment is relevant for the industry.
However the articulation of scenarios allowing for societal embedding and stimulation
of learning from societal actors is the least referred, except for research centers. The
industry rather controls than orchestrates their dialogue with societal actors.
-! Results here show that the most referred type of Future Technology Assessments are
endogenous to the railways presenting their techno-centric visions to an envisaged
future they aim to control (Q.30). Exception goes to governments and some
consultancies referring the most to external reports more inclusive of the wider society
and capable of covering wider collective of stakeholders.
-! In terms of methods used (Q25) respondents equally considered qualitative and
quantitative approaches. Manufacturing however standout from other stakeholders by
prioritizing quantitative methods, less appropriated in assessing vague and not-known
for the industry societal requirements.
In the broadening of selection environments of new high-speed train technologies to the wider
society it was not observed that technology options assessment nor strategic agenda setting
shifting in the same way. Today assessment of technology remains focused on market uptake
of new products and services, overlooking opportunities that can arise from embedding societal
capabilities in the product development process and review them at all stages of development.
Strategy intelligence in this industry requires this way to adapt to the brother equation of
product selection by promoting a reflexive systemic anticipation of controlled speculation

!!
187
based on exploring the co-evolution of the high-speed train socio technical system of an
extended spectrum of stakeholders, which ultimately generates value.


!!
189
VI. FINDINGS SUMMARY
In this chapter relevant findings are presented, with the purpose to contribute to the railways
debate on the urge for the market-uptake of new technologies. I do it by calling attention to the
societal environments of technology selection requiring the bridging of the network of high-
speed train technology stakeholders and the emergent digital society (as connected travelers
and sharing communities) in ways that creates value for the industry.
To meet that purpose Constructive Technology Assessment (CTA) stood-out from the various
TA strands identified, providing the adequate framework of analysis. This is because it
addresses technology as the construction of networks of actors, which act at the level of science
and technology, constraint by different environments of technology selection (business,
regulatory and societal). CTA is therefore applicable to the high-speed train technology
development which results itself from the assembling of various stakeholders’ technological
capabilities in a system that works.
CTA proposes a strategic intelligence model to extend the network of technological
stakeholders to society from early stage of development process. CTA has been positioning
itself as a way to overcome the institutionalised division of labor between promotion and
control of technology, referred to as the Collingridge dilemma. It deals with the inherent
asymmetries between “impactors” (insiders, at the source of the technology) and “impactees”
(outsiders, impacted by the technology) with heterogeneous expectations and capabilities (as
well as different powers, timings, interests, resources, etc).
CTA proposes doing it by bridging events between those heterogeneous actors orchestrated by
a third party, to probe each others assessment worlds (supply-chain plus in Robinson & Propp
2008), and ultimately arrive to socio-technological scenarios of aligned visions (Te Kulve &
Rip 2011). Those scenarios not only take actors initiatives and interactions into account but
also their surroundings. They are not used to extrapolate particular developments into future
(control function) but rather to enhance the flexibility of stakeholders regarding their strategic
decisions (mutual-learnings), which in its turn is what modulates technology developments.
As it was seen CTA offers a two-fold application (i) analysis making (e.g. setting the scene:
problem identification, phase in which is the technological development, actors involved and
mapping on their expectations); and (ii) practice-oriented (e.g. models for interventions
allowing for technological future formulations embedding society).

!!
190
CTA methods for analysis range from data collection and interviews allowing placing
concerned innovation journey in context (main reference Deuten, Rip & Jelsma 1997), to define
multi-level-perspectives (as further developed by Geels 2002) and to determine collective
strategy formulations (elaborated by Robinson & Propp 2008). CTA practice-oriented methods
refer to socio-technical scenarios (elaborated by Te Kulve & Rip 2011) supported by methods
including bridging events (Parandian 2013); third party mediation of pre-engagements (te
Kulve and Rip 2012); bridging gaps between technology development and use (Paridian 2012,
Robinson 2010); backcasting (Schippl 2008); inclusion of unknown unknowns (Justen et al.
2014).
In this dissertation I apply CTA analysis-making function to the high-speed train technology
development process, as to find evidences of societal embedding practices in this industry. CTA
practice-oriented on strategic future agendas was left out from this dissertation. Such because
in itself constitutes another research enterprise as could well be a post-doc that could be
conducted within SHIFT2RAIL or even ERRAC.
This dissertation fills a gap in CTA literature, which has been mainly focused on basic research
in nano-technology, by extending it to mature innovations and further bring its application from
the science domain to the technology area.
Moreover, the analytic framework structure of the dissertation could be tested in other train
models, as light-rail and rapid transit, or even other sectors as e-mobility.
The application of the theoretical framework of analysis offered by CTA to the cases of the
AGV and ICE-350E unfolded in manufacturers strategic intelligence, technology transitions,
multi-level perspective and future formulations.
Theory places Technology Assessment in strategic intelligence. Kuhlmann (1999) is the first
conceptualising it. Smits et al. (2008) further elaborate on its distinctive elements (as focus on
decision-making support, problem orientation, intensive interaction with the wide of actors.
Schot and Rip (1997) reinforce the element of anticipation from early stage of development.
While Deuten et al. (1997) formulate the previous on the new product creation process extended
to society. I found however that Deuten et al. (1997) do not detail the optimal organisational
structure of firms or its networks to conduct societal embedding. To overcome such a theoretical
gap, I referred to Lichtenthaler (2004) technology surveillance studies.
By studding Alstom and Siemens strategic intelligence organizational structure and technology
development process it was found that Alstom and Siemens strategic intelligence broadly aligns
with CTA societal embedding recommendation. Both manufacturers filter societal constrains

!!
191
at socio-economic and to some extent policy levels; they have in place surveillance structures
of employees working mainly at the subsidiaries; they also have professionals participating in
external expert networks and in contact with lead users and suppliers; their privileged partner
for societal surveillance are universities and component suppliers; and they give preference for
societal embedding in non-core-technologies as interiors and telematics.
In which Alstom and Siemens did not seem aligned with CTA societal embedding principle
was on the technological decision-making trajectory. For both manufacturers it was found
societal alignments occurred mainly during the commercial trajectory at the interception with
the technical, by the time the technology was matured and ready to commercialise.
Constructivists advocate that it should rather occur much earlier in the development process
(Deuten et al. 1997). This is an indication that during the development of the AGV and the ICE-
350E Alstom and Siemens monitored societal constraints for a purpose of “promotion” and
“control” rather than product alignments (Deuten et al. 1997).
Despite the above referred, evidence was not found at which technological readiness level
societal embedding actually occurred. Also missing was the study on other stakeholders part of
the supply chain of Alstom and Siemens. Both aspects were later covered by the survey.
Technology transition and the multi-level perspective are central analytical tools as they feed
the main function of CTA in the understanding of the co-evolution of socio-technical systems.
They were introduced in the 1990’s. Technology transition by Rip and Kemp (1998) and Johan
Schott (1997) and Multi-Level Perspective by Rip and Kemp (1998). It was proved very useful
with Geels visualisations (2002a and Geels & Schot 2007) further developing both models.
By applying CTA technology transition model it became evident that both trains, the French
AGV and the German ICE-3050E, represented a shift in Alstom and Siemens strategic decision-
making. They refer to the transition from hardware to software technological developments as
policy and regulatory constraints became the primary trigger for technology change. Alstom
and Siemens developed these trains in the race to champion supply to the trans-European high-
speed networks and have their standards a reference in interoperability. It was also possible to
visualise the first signs in the emergence of a new approach in Alstom and Siemens technology
decision-making that most likely will precipitate them to socialware developments driven from
the exponential digitalisation of society and social innovations they arise.
To explore the multi-level perspective between the various actors in terms of technological
knowledge exchanges happening during the development process of the AGV and ICE 350E
(2001-2008) I further applied Geels levels of analysis (niche, regime, landscape arenas, in Geels

!!
192
and Schot 2007, to which Robinson 2009 refers as arenas-of-action) combining it with Pavitt
revised taxonomy of innovation.
From this exercise it became evident that the AGV and ICE-350E were developed in a period
of emergence of strategic reports where technology actors aligned their perspectives. Each
reflected the technological arena of the commissioning stakeholders; they were mainly
produced at regime level; and feeding on each other reports. Less covered in this alignment of
perspectives where societal actors at landscape. During this particular period those societal
actors were mainly non-governmental organizations and specific interest groups.
It is relevant to note that two main typologies of reports were observed: dominant techno-centric
visions produced at regime level (e.g. endogenous to the AGV and the ICE-350E supply chain),
and policy foresight reports covering perspectives of actors produced at landscape level (e.g.
exogenous to the AGV and the ICE-350E supply chain). Such indicates a discontinuity in the
alignment of perspectives between actors at regime level and landscape which were further
deepened when studding railway futures formulations.
Robinson and Propp (2011) adapted classification methods proved to be a good tool to classify
railways future assessment reports addressing the high-speed train technology system and
diagnose the extension of societal embedding within the formulation of the collective socio-
technical scenarios.
It was found that visions, roadmaps and other forms of future strategic formulations were
relevant in contributing to the revitalization of railways since 2001. However the
methodological gap found between railway endogenous techno-centric visions and policy
exogenous visions signal that railways future formulations might risk to miss their function if
overpassing the emergent new societal challenges occurring at landscape from digitalisation
producing social innovations.
Notorious was the case of ERRAC visions and road maps. They provide a pre-competitive
forum (inclusive and dynamic), aiming and allowing for multi-level perspective alignments in
the liberalized market conditions. The visions, strategic agendas and roadmaps of ERRAC have
been enablers of technology dependencies by anticipating, influencing directions of the
development trajectory of high-speed rail (see the White Paper on Transport (COM (2001) 370)
which has since been periodically revised and updated). The share of common interests in this
industry triggered and stimulated collaborative research projects, of which the first wave has
been to a certain extent embedded in AGV and ICE-350E trains becoming part of the dominant
designs and voluntary norms.

!!
193
However, there is still a long way to go. The need for forums such as ERRAC to move beyond
the dominance of endogenous roadmaps (highlighted in this paper) to a mix of endogenous and
exogenous roadmaps and other forms of future strategic formulations (such as the STOA type
activities) is becoming a pressing issue. SHIFT2RAIL recently launched will inevitably have
to address it. This call for more exogenous future strategic formulations is further amplified by
other shifts in the socio-technical system of high-speed railways. For example, as I have shown
initially the railway operators and their manufacturers once held a strategically important
position of being knowledgeable of the whole supply chain. However today they are no longer
knowledgeable about the whole technology system. They moved from in-house production by
the major manufacturers to outsourcing, pressed by costs-reduction. Their knowledge decreases
as the sub-systems themselves sub-divide. This means there is no longer an individual actor
with a supra systemic view on the transport system.
The survey conducted to the breadth of the technological stakeholders confirms that societal
embedding through technology assessment fits the strategic innovation management of the
high-speed train technological network as found individually for Alstom and Siemens. Overall
respondents have proved that railways are an R&D intensive industry, with the majority of them
stating that reported to strategic intelligence guidelines (Q14) informed by formal channels of
technology surveillance (Q15), mainly positioned in industry networks (Q16).
The survey also confirmed that railways main purpose for undertaking technological
developments is to survive in open market conditions by anticipating societal changes, policies
and market constraints and then to make the final product attractive to the end-user (Q17).
Manufacturers, however contrasting, mainly pursue technology development for product and
design improvements, manufacturing optimization and cost reduction (Q17). The industry is
dominated by incremental innovations, reflecting the monopolistic and incumbent nature of
their stakeholders (Q18).
The industry is split however in their openness for collaborative research (Q19) with
manufacturers and research centers expressing preferences for R&D in consortia while for
component suppliers is in-house. User engagement in the technology development is however
quite low across all the stakeholders enquired (Q20), with research centers expressing the
highest interest to involve them while preferences go to collaborative research performed with
specialized knowledge providers as research centers and universities (Q20).
All stakeholders consider societal challenges, policies and market constraints the main factors
leading for collaborative research with technical problems left to be solved by in-house research
(Q21). At collaborative level manufacturers are aligned with the general trend (this did not
occur in Q17).

!!
194
Significant was to find from the survey that in terms of societal embedding the broad of high-
speed train industry attributes high levels of relevance to the societal environment, above policy
& regulations. Yet business & engineering dominates (Q22). Societal requirements are relevant
at the initial stage (Q23) of technology development process (TRL1) when basic principles are
observed and data collected. Then their relevance progressively declines to its minimum
(TRL4) when the technology is validated. Latter they regain momentum when the new
technology has matured, ready to market (TRL8 & TRL9). Different from manufacturing,
component suppliers tend to consider societal requirements in all stages of development, which
places them in line with the arguments presented by CTA.
Alignment with societal actors are considered by a great majority of respondents a way of risk
mitigation of technology failure (Q26). Manufacturing and researcher centers showing the
highest of support but also of concerns. The benefits of shared technological paths are the least
considered by manufacturing, confirming the tendency for social embedding for the purpose of
promotion and control and the evident division of labour between the technology initiator and
the impactee.
Societal embedding is dominated by informal practices (Q27) with a great percentage of
respondents stating openness for interaction with societal actors and their recognition as a
stakeholder in the technology development. Only a few, mainly coming from research centers,
however referred employing someone responsible for societal alignment. Even fewer, as a
minority of component suppliers, consultancies and railway associations, mentioned
technology assessment gates to address societal constraints.
Mapping and monitoring societal environment (Q28) is relevant for the industry. However, the
articulation of scenarios allowing for societal embedding and stimulation of learning from
societal actors is the least referred, except for research centers. The industry rather controls than
orchestrates their dialogue with societal actors.
Results from the survey confirm my previous findings showing that the most referred type of
future formulations are endogenous to the railways presenting their techno-centric visions to an
envisaged future they aim to control (Q30). Exception goes to governments and some
consultancies referring the most to external reports more inclusive of the wider society and
capable of covering wider collective of stakeholders.
In terms of methods used (Q25) respondents equally considered qualitative and quantitative
approaches. Manufacturing however standout from other stakeholders by prioritizing
quantitative methods, less appropriated in assessing vague and not-known for the industry
societal requirements.
!!
195
VII. CONCLUSIONS, RECOMMENDATIONS and
IMPACTS
-! In#conclusion:#
Looking back, this dissertation reflects and benefits from the turning point in society, becoming
digital and hyper-connected; the inevitable shift in the strategic direction of high-speed rail
innovation in Europe; and Technology Assessment (TA) entry in a new period of ferment.
Society gained an active role in technological innovation from its digitalisation and hyper-
connectivity. It shifted from prescriptive, such as Green Peace NGO awareness campaigns on
Environment, to interventive, capable of producing innovations that impact high-speed trains,
as intuitive apps creating share communities of travellers looking for cheaper and seamless
transport solutions.
The railway industry became aware of the relevance to enter this new emergent “socialware”
era (Rachel Pacard 2015); while the European Union policies on transport and research
prioritise societal demands, with the Forth Railway Package (agreed in April 2016151) and
Horizons 2020 (framing the period between 2014 to 2020152). Railways also institutionalise
R&D collective governance structure in SHIFT2RAIL Joint Technology Undertaking pushing
technology developments closer to the market.
In its turn Technology Assessment, addressing technological advancements in society, is in a
ferment period and consolidating its position across Europe as a theoretical current within the
governance of science and technology. It accounts with an increased number of scholars and
practitioners jointly reflecting, studying and publishing about it. The often evoked, PACITA153
project (2012-2015) is impressive in terms of number of attendants to their conferences and
number of published papers. TA tools have gained a solid critical-mass and are becoming an
institutionalised practice across a wider number of European parliaments and industries, and
being exported to emergent economies such as China.
The implementation moment for the recommendations here presented is now. This is to, if
railways do not want to miss socialware train, raise their market share in Europe that has been
151 Link http://ec.europa.eu/transport/modes/rail/news/2016-04-20-fourth-railway-package_en.htm. Retrieved May 2016. 152 Link https://ec.europa.eu/programmes/horizon2020/en/h2020-section/smart-green-and-integrated-transport. Retrieved May 2016. 153 Link http://www.pacitaproject.eu/. Retrieved May 2016.

!!
196
flat if not declining154 and go beyond the sole commercial purpose of market uptake of their
technologies.
With this dissertation I hope I have planted the seeds for the effective leveraging of social
innovations from digitalisation into the high-speed train vehicles while informing on the
constructive strand of TA as provider of the necessary tools and mediation agents that enable
those seeds to grow.
The impact of this dissertation can be even greater if the railway industry commits and wants
to take action in addressing societal actors as technological actors; be capable of mapping their
capabilities and expectations in ways that can be usable and constructive to their business;
converge in pre-engagements and mutual learnings experiences; including societal actors in the
construction of their joint social-technical scenarios; and ultimately shape and integrate societal
contributions in ways that can be embedded from early stage in the technology development
process of the trains (either full system, components or even materials).
In my study on Alstom and Siemens technology development process of their high-speed trains
AGV and ICE-350E, their technology transitions, multi-level alignments and future technology
formulations, I demonstrate that the high-speed train, but also any other rail vehicle, for its
complexity is a collective developed product, subject of different levels of technology
interactions, which exchanges are however yet limited to the level of the railway regime (as
demonstrated landscape and niche have little if none interactions).
As recommended, societal embedding implementation should be lead by SHIFT2RAIL Joint
Technology Undertaking, because it is the product of this collective of actors and its R&D
mission is strongly market oriented. SHIFT2RAIL has both arms in the strategic and
operational. Strategic from its future agenda setting mandate; operational from its rules setting
capability to which research and development projects they fund have to comply. There is also
room for implementation by ERRAC and individually by governments, manufacturers and
component suppliers.
This dissertation is not limited to envisaged impacts in the railway industry, it is also impacting
TA, in particular, the constructivist strand (CTA). With my study on societal embedding in the
technology development of high-speed trains I bring CTA application from niche technologies
and open ended futures, to a very clear field of application with much more stable futures. In
154 According to FOSTER-RAIL project railways market share growth in Europe has been flat at about 6% for years. Link http://www.errac.org/wp-content/uploads/2016/04/CER_FosterRail_publication_2016_DEF.pdf. Retrieved May 2016.

!!
197
this way this dissertation contributes to broaden societal reflexive CTA into demonstration
CTA.
I am confident that very soon railways and TA will be able to collect the fruits from this
dissertation, taken from the positive feedback and acceptance I have had in the various
presentations and publications I made at each advancement of my research.
From what was here said I can only finalise by saying that my PhD is just the starting point
framing the necessary next step in collectively making the high-speed train and railways a
societal success.
-! Recommendations#and#impacts:#
For societal success of railways to happen the following recommendations could apply and
related impacts could be expected:
Recommendation 1: There is potential for adding value to the technology development process
by enlarging the business network to include social actors, capable themselves of innovating,
when elaborating collective visions and undergoing collaborative R&D.
Impact 1: This way one could expect broadening stakeholder involvement and extend
environments of technology selection beyond customers and user to include the wider society.
This would be from the early stage of product development.
Recommendation 2: The above recommendation requires treating society not only as a
technological impactee but also impactor, opening new markets and itself capable of bringing
innovating from its digitalization and hyper connectivity. Technological interactions should be
tailored to suit the TRL development stage of the R&D project, as to optimize the value from
mutual interactions to occur.
Impact 2: Such would lead to a coherent application of societal embedding, by adapting the
structure of the relations to the research project maturity.
Recommendation 3: It also requires drawing on third parties to orchestrate such interactions.
A number of types of third parties are possible, but must be chosen with care as it is more than
marketing and requires targeted and informed orchestration.
Impact 3: This way it can be assured impartiality, reduction of inherent complexities,
reflexivity of actors’ roles, allow for mutual interactions and learning.

!!
198
Recommendations 4: Railways have to move towards stabilizing design trajectories (reducing
uncertainty and risk) by reviewing societal requirements and capabilities at early stages of the
R&D projects.
Impact 4: Increase attractiveness to passengers and wider society; allow for constructive pre-
engagements from societal actors; early identification of unknown-unknowns.
Recommendations 5: It can also be suggested to draw on expertise in linking societal
engagement to technology design processes.
Impact 5: Railways can learn from others success, overcome techno-centric agendas and
research and development projects.
Recommendations 6: The collective R&D strategic platforms as ERRAC and operational
organisations as SHIFT2RAIL (S2R) offers good grounds to embed societal actors in the
collective technology development process of high-speed trains (and not limited to). This can
also happen at individual level, mainly by railways technological initiators as manufacturers,
component suppliers and also railway operators. Below I will further detail this
recommendation.
Impact 6: Extending railway research to society meets the EU research policy objectives as
stated in HORIZONS 2020155 prioritizing research that meets fast emergent societal demands,
which became guiding principles followed by ERRAC and the Rail Joint Undertaking
SHIFT2RAIL and individual stakeholders if envisaging collaborative research under EU
funding.
By further detailing Recommendation 6 my approach is not to be prescriptive but rather open
the debate on how the above listed recommendation could be applied to high-speed trains (and
beyond).
SHIFT2RAIL Joint Technology Undertaking stands as railways first collective strategic step in
the direction of socialware offering therefore a good ground for the formalisation of the
practices of societal embedding in the technology development process.
For example the regulation156 establishing SHIFT2RAIL heightens an objective already
pursued in ERRAC by adding the adjective radical to the need of “enhance the attractiveness
155 Regulation of the European Parliament and of the Council establishing Horizon 2020-The Framework Programme for Research and Innovation (2014-2020), SEC(2011) 1427-Volume 1 and SEC(2011) 1428-Volume 1. 156 Council Regulation (EU) No 642/2014 of 16 June 2014 establishing the Shift2Rail Joint Undertaking. See also SHIFT2RAIL open call day link https://webcast.ec.europa.eu/shift2rail-joint-undertaking-open-call-day . Retrieved in May 2016.

!!
199
and competitiveness of the European railway system to ensure a modal shift towards rail”.
Moreover its Multiannual Annual Action Plan157 features “extended stakeholders network”,
while its first issued Annual Action Plan, in 2015158, introduces in its open call a cross-cutting
activity (CCA) on the “long term needs of different actors in the railway sector” (S2R-OC-
CCA-01-2015)159.
Despite that the Multiannual Annual Action Plan it is yet missing a reference to how cross
cutting activities actually link and are embedded in the technology innovation programmes (IP)
as could well be the “IP4 - IT Solutions for Attractive Railway Services” introducing the
“semantic web for transportation” and “IP1 - Cost Effective and Reliable Trains (including high
capacity trains and high-speed trains)” from which are expected projects tackling digitalization,
big data and prospective market studies.
A first step could be therefore ensuring that a resulting CCA project would actually be a third
party study representative of the extended network of actors to society. It should build on
ERRAC extensive work yet limited to the railways regime by extending it to the societal actors
from landscape. As a result, a map of societal expectations and capabilities should be proposed.
This should feed SHIFT2RAIL Annual Work Plan call for a cross cutting activity establishing
railways socio-technical scenarios extended to society and a road map defining specific
technological areas for experimenting identified societal innovations.
The CCA call should then leverage to technological large scale demonstrator projects under the
innovation programmes of SHIFT2RAIL Annual Work Plan. One way could be for example
introducing a work-package or a project task in a large demonstrator project where railway
actors and relevant societal actors could be called to experiment their innovations in relation
the specific technology being demonstrated. The technology readiness level (TRL) of the
technology demonstrated would set the approach for such interaction to occur.
ERRAC also offers an opportunity for the extension of railway research network to societal
actors in ways that produce mutual interchanges, however due to its mandate it is limited to
strategic agendas and road maps. Actual development and testing would have to be covered by
the calls in HORIZONS 2020, in the same terms as suggested for SHIFT2RAIL. The added
value of ERRAC is the possibility to interlink with other transport modes technological
157 Link http://shift2rail.org/wp-content/uploads/2013/07/MAAP-final_final.pdf . Consulted in May 2016 158 Link http://shift2rail.org/wp-content/uploads/2013/07/MAAP-final_final.pdf . Consulted in May 2016 159 This cross-cutting activity, granting 400 thousand Euros, could well be the continuing of ERRAC funding rather than the commission of this task to a third party. By the time I write this paragraph (June 2016) the call is closed but the results of the evaluation are not yet known.

!!
200
platforms, as with aeronautics, waterborne and road. This is also a fertile ground for societal
embedding in future technologies that target intermodal bottle necks. Also ERRAC would
allow to have societal embedding on the science side of developments as SHIFT2RAIL is
mainly focusing on the one of technology.
In terms of individual stakeholders, as governments, manufacturers, component suppliers and
train operators, societal embedding should be implemented by their strategic intelligence in
ways that it would leave room for mutual learnings relations to happen with societal actors.
This means allowing for strategic consultations with societal actors that lead to joint technology
paths and mutual engagements (not only promotion or legitimacy on technology options being
promoted); for governments for example establish an observatory for technology assessment;
while for industry include in their organisational structures someone responsible for societal
alignments, maybe by creating cross functional research teams and distinguish in project
evaluation gates societal constraints. This in a way that its implementation should be adjusted
to the technology readiness level of the technology being addressed and by mediation of a third
part.

!!
201
BIBLIOGRAPHY
Agogué, M., Le Masson, P., & Robinson, D. K. (2012). “Orphan innovation, or when path-
creation goes stale: a design framework to characterise path-dependence in real time”.
Technology Analysis & Strategic Management, 24(6), 603-616.
Abernathy, W. J. & Clark, K. B (1985) “Innovation: Mapping the Winds of Creative
Destruction”. Research Policy.
Argyris, C., & Schöln, D., (1978) “Organizational Learning: A theory of action perspective”.
Reading, MA, Addison-Wesley Publishing Co. 1978.
Armstrong, J., Preston, J. (2011) “Alternative railway futures: growth and/or specialization?”.
J. Transp. Geogr. (2011), doi: 10.1016/j.trangeo.2011.03.12.
Baron, L (2015) “The permanent adaptation of trains to operators and users”. Parallel Session
on Technology Rolling Stock (B) – Performance, 7 July 2015. 9th UIC World Congress on
High-Speed Rail, 7-9 July 2015, Tokyo.
BCG Boston Consulting Group (2010) “Worldwide Rail Market Study – status quo and outlook
2020”. Study Commissioned by the European Rail Industry Association (UNIFE).
BCG Boston Consulting Group (2008) “World Rail Market Study. Status quo and outlook
2020”. Study Commissioned by the European Rail Industry Association (UNIFE).
Becker, P. (2002) “Corporate Foresight in Europe: A First Overview”. Working Paper
European Commission: 31. Brussels: European Commission.
Beyazit, E., Givoni, M. (2013) “Technology Development of High-Speed Rail”. In
Transportation Technologies for Sustainability, Ehsani, M., Wand, F. Y., Brosch, G. L.,
editors, pp 537-553, Springer New York. Doi 10.1007/978-1-4614-5844-9_902
Bimber, B., & Guston, D. H. (1997). “Introduction: The end of OTA and the future of
technology assessment”. Technological Forecasting and Social Change, 54(2), 125-130.
Boavida, N., Cabrita, N., Moretto, S. (2010) “Análise do processo de participação pública no
projecto da Alta Velocidade Ferroviária”. IET Working Papers Series, WPS06/2010:25.
Universidade Nova de Lisboa, IET- Research Center on Enterprise and Work Innovation,
Faculty of Science and Technology.

!!
202
Boavida, N., Moretto, S. (2011) “Innovation Assessment of a Portuguese railway branch of a
foreign multinational: A case study”, Proceedings of the XIV Congreso Latino-
Iberoamericano de Gestión Tecnológica – ALTEC 2011 (19-21 October 2011), Lima, Perú,
Asociación Latino-Iberoamericana de Gestión Tecnológica, Pontificada Universidad
Católica del Perú, Pages 339-587, 2011. ISBN 978-612-4057-48-9.
Böhle, K., Moniz, A. (2015) “No Countries for Old Technology Assessment? Sketching the
Efforts and Opportunities to Establish Parliamentary TA in Spain and Portugal”, TATuP -
Journal by ITAS on Technology Assessment, 2015.
Brandes, J. (2015) “The next 50 years for high-speed rail”, Siemens key-note speech, round
table, at UIC World Congress on High Speed Rail, Tokyo, 7-9 July 2015.
Cadet, D. (2011) “Industry Vision”, Presentation at the First Doctoral Conference on
Technology Assessment, Panel Railways, 9 July 2011, PhD Programme on Technology
Assessment, IET- Research Center on Enterprise and Work Innovation. Faculdade de
Ciências e Tecnologia, Universidade Nova de Lisboa, 2011.
Callon, M. (1991) “Techno-economic Networks and Irreversibility”. In John Law (ed.) A
Sociology of Monsters? Essays on Power, Technology and Domination, pp. 132-61,
London: Routledge.
Callon, M. (1986). “The sociology of an actor-network: The case of the electric vehicle”. In
Mapping the dynamics of science and technology (pp. 19-34). Palgrave Macmillan UK.
Callon, M., Laredo, P., Rabeharisoa, V., Gonard, T., & Leray, T. (1992). “The management
and evaluation of technological programs and the dynamics of techno-economic
networks: The case of the AFME”. Research policy, 21(3), 215-236.
Callon, M. & Latour, B. (1981) “Unscrewing the big Leviathan or how do actors
macrostructure reality and how sociologists help them to do so”. In K. Knorr-Cetina and
A.V. Cicourel, Advances in Social Theory and Methodology: Toward an Integration of
Micro and Macro Sociologies, London, Routledge & Kegan Paul, pp. 277-303.
Campus, J., de Rus, G., Barrón, I. (2006) “Some stylized facts about high speed rail around the
world: an empirical approach”. Proceedings 4th Annual Conference on Railroad Industry
Structure, Competition and Investment, Universidad Carlos III de Madrid, October 19-21,
2006.

!!
203
Casprini, E., Paraboschi, A., & Di Minin, A. (2015) “Web 2.0 enabled business models: An
empirical investigation on the BlaBlaCar case”. In Academy of Management Proceedings
(Vol. 2015, No. 1, p. 18509). Academy of Management.
Castellacci, F. (2008) "Technological paradigms, regimes and trajectories: Manufacturing and
service industries in a new taxonomy of sectoral patterns of innovation", Research Policy
37 (6-7): 978–994, 2008. doi:10.1016/j.respol.2008.03.011.
Chen, L. (2015) “Meet Europe's Newest Unicorn: BlaBlaCar Raises $200 Million At $1.6
Billion Valuation”. Forbes 16 September 2015. Link
http://www.forbes.com/sites/liyanchen/2015/09/16/meet-europes-newest-unicorn-
blablacar-raises-200-million-at-1-4-billion-valuation/#7bd930fa158a
Coates, J.F. (1976) “The role of formal models in technology assessment”, Technology Forecast
and Social Change Vol 9 (Issues 1–2) 139–190.
Collingridge, D., (1980) “The Social Control of Technology”. Printer London.
Comtois, C., Loo, B. P. Y. (2015) “Sustainable Railway Futures: Issues and Challenges”,
Transport and Mobility Series, London: Ashgate.
Constant, O. (2006) “TGV”. Éditions E.P.A. ISBN 2851206435.
Cooper, R. G. (1990) “Stage-gate systems: a new tool for managing new products”. Business
horizons, 33(3), 44-54.
David, P.A. (1985) “Clio and the economics of QWERTY”. In American Economic Review 75:
332-337.
Deuten, J. Jasper and Rip, Arie and Jelsma, Jaap (1997) “Societal embedding and product
creation management”. Technology Analysis & Strategic Management, 9 (2). pp. 131-148.
ISSN 0953-7325
Dosi, G. (1982) “Technical paradigms and technological trajectories – a suggested
interpretation of the determinants and directions of technological change”. Research Policy,
11 (3), 147-162.
Ebeling, K. (2005) “High Speed rail in Germany”. Japan Railway & Transport Review nr.40.
March 2005.
Elwyn, G., Hardisty, A. R., Peirce, S. C., May, C., Evans, R., Robinson, D. K.R., Gray, W. A.
(2012). “Detecting deterioration in patients with chronic disease using telemonitoring:
!!
204
navigating the ‘trough of disillusionment”. Journal of evaluation in clinical practice, 18(4),
896-903.
Elzen, B., Geels F. W., Hofman P. S., Green K. (2005) “Sociotechnical scenarios as a tool for
transition policy: an example from the traffic and transport domain”, in Boelie Elzen, Frank
W. Geels and Ken Green (eds.), System Innovation and the Transition to Sustainability,
Cheltenham: Edward Elgar Publishing Ltd., pp.251-281.
European Commission (2001) “White Paper - European Transport Policy for 2010: Time to
Decide”. COM(2001) 370 final. Brussels, 12.9.2001.
European Commission (2002) “Land transport and marine technologies. RTD activities
supported under the Growth Programme”. ISBN: 92-894-2077-4
European Commission (2006a) “Sustainable Surface Transport Research Technological
Development and Integration: 2002-2006 Projects Synopses”. ISBN: 92-79-04584-9.
European Commission (2006b) “Communication from the Commission to the Council and the
European Parliament. Keep Europe moving. Sustainable mobility for our continent. Mid-
term review of the European Commission’s 2001 Transport White paper”
{SEC(2006)768} COM(2006)314 final.
European Commission (2009) “Communication from the Commission. A sustainable future for
transport: Towards an integrated, technology-led and user”. COM(2009)279/4.
European Commission (2010) “High-speed Europe. A sustainable link between citizens”,
Luxembourg: Publications Office of the European Union, 2010. doi: 10.2768/17821.
European Commission (2011) “White paper – Roadmap to a Single European Transport Area
– Towards a competitive and resource efficient transport system”. COM(2011) 144 final.
European Commission (2013) “European Commission Staff Working Document. Impact
Assessment - Accompanying the document proposal for a Council Regulation establishing
the Shift2Rail Joint Undertaking” (COM(2013) 922 final).
European Council (1996) “Council Directive 96/48/EC of 23 July 1996 on the interoperability
of the trans-European high-speed rail system”. Retrieved 7 March 2012, Link http://eur-
lex.europa.eu/LexUriServ/LexUriServ.do?uri=CELEX:31996L0048:EN:HTML.
European Rail Research Advisory Council (2012) “Roadmaps on WP01 Greening of Surface
Transport, WP02 Encouraging Modal Shift and decongestion of transport corridors,
WP03 Ensuring sustainable urban transport, WP04 Improving safety and security, WP05

!!
205
Strengthening Competition”. Published by ERRAC Roadmaps, The FP7 project ERRAC.
Link http://errac.uic.org/spip.php?article13#outil_sommaire_2
European Rail Research Advisory Council (2011) “Rail Route 2050: the sustainable backbone
of the single European Transport Area”. Published by ERRAC Roadmaps, The FP7
project ERRAC. Update of the ERRAC vision (2001).
European Rail Research Advisory Council (2007) “Strategic Rail Research Agenda 2020”.
Published by the FP7 project ERRAC. May 2007.
European Rail Research Advisory Council (2002) “SRRA Strategic Rail Research Agenda
2020: A turning point for European railway research”. First report of ERRAC. Published
by ERRAC. September 2002.
European Rail Research Advisory Council (2001) “A joint strategy for European rail research
2020: Towards a single European railway system”. Published by UNIFE, UIC, CER,
UITP.
Garud, R., & Ahlstrom, D. (1997) “Technology assessment: a socio-cognitive perspective”.
Journal of Engineering and Technology Management, 14(1), 25-48.
Garud, R., Rappa, M. A. (1994) ”A socio-cognitive model of technology evolution: The case of
cochlear implants”. Organization Science, 5(3), 344-362.
Geels, F. W. (2002a) “Technological transitions as evolutionary reconfiguration processes: A
multi-level perspective and a case-study”. Research Policy, Vol. 31, No. 8/9, pp. 1257-1274.
Geels, F.W. (2002b) “Understanding the dynamics of technological transitions: a co-
evolutionary and socio-technical analysis”. Doctoral dissertation, Universiteit Twente, 1-
426. Enschede: Twente University Press.
Geels, F.W., Kemp, R., Dudley, G., Lyons, G. (2012). “Automobility in transition: A socio-
technical analysis of sustainable transport”. In Routedge. ISBN13:98-0-415-88505-8(hbk).
Geels, F. W., Schot, J. (2007) “Typology of sociotechnical transition pathways”. Research
Policy 36 399–417. doi 10.1016/j.respol.2007.01.003.
Giannakouris, K., Smihily, M. (2013) “Businesses raise their internet profile by using social
media”, Statistics in focus 28/2013, Eurostat, ISSN: 2314-9647, Catalogue number: KS-SF-
13-028-EN-N.
Giuntini, A. (2011) “Will railways save Europe? Past and present of high-speed trains the old
continent”. Proceedings Coloquio Internacional 150 anos de cominho de ferro no Barreiro.

!!
206
Historia, Patrimonio e Perspectivas Actuais e Futuras do Caminho de Ferro. 4-5 Fevereiro
de 2011. Barreiro Portugal.
Given, L. M. (2008) “The SAGE encyclopaedia of qualitative research methods”. Vol. 1&2.
Sage Publications. ISBN 978-1-4129-4163-1.
Givoni, M. (2006) “Development and Impact of the Modern High-speed Train: A Review”.
Transport Reviews, Vol. 26, No. 5, 593–611, September 2006.
Grin, J., Grunwald, A. (2000) (eds): “Vision assessment: shaping technology in 21st century
society”. Berlin, Heidelberg, New York: Springer 2000. 190 pp.
Grin, J., van de Graaf, H. (1996) “Implementation as communicative action. An interpretive
understanding of interactions between policy actors and target groups”. Policy Sciences,
29, p. 291-319.
Grin, J., van de Graaf, H., Hoppe R. (1997) “Technology Assessment through Interaction. A
guide”. With a contribution from P. Groenewegen. Den Haag: Rathenau Institute.
Grunwald, A. (2011) “Energy futures; Diversity and the need for assessment”, Futures 43,
2011, p.820-830.
Guston, D. H. (1999) “Evaluating the first US consensus conference: The impact of the citizens’
panel on telecommunications and the future of democracy”. Science, Technology & Human
Values, 24(4), 451-482.
Guston, D.H. and D. Sarewitz (2002) “Real-Time Technology Assessment”. Technology in
Culture, v. 24, pp. 93-109.
Hastbacka, M. A., Greenwald, C. G. (1994) “Technology Assessment – Are you doing it right?”
Arthur D. Little – PRISM (Fourth Quarter): 35-45.
Henn, M., Weinstein, M., Foard, N. (2009) “A critical Introduction to Social Research”. Second
edition. London. Sage. ISBN 9781848601796
International Union of Railways (2015) “High-speed rail facts and figures”, High-speed
department, UIC, Paris, May 2015.
International Union of Railways (2013) “Data of high-speed trains 2013”, UIC High-Speed.
International Union of Railways (2010a) “Necessities for future high speed rolling stock”.
Report of the International Union of Railways (UIC), 2010.

!!
207
International Union of Railways (2010b) “High speed rail. Fast track to sustainable mobility”.
Brochure of the International Union of Railways (UIC). 2010. ISBN 978-2-7461-1887-4.
International Union of Railways, CER, EIM (2013) “Challenge 2050, The rail sector Vision”.
Date: February 2013.
Joss, S., & Durant, J. (1995) “Public participation in science: The role of consensus
conferences in Europe”. NMSI Trading Ltd.
Justen, A., Schippl, J., Lenz, B., & Fleischer, T. (2014) “Assessment of policies and detection
of unintended effects: Guiding principles for the consideration of methods and tools in
policy-packaging”. Transportation Research Part A: Policy and Practice, 60, 19-30.
Keseljevic, C. (2015) “The cross fertilization of French and Japanese high-speed models
trough mutual technical influence in the past 50 years”. Presentation at the panel Culture &
Society – Rail Policy, Congress UIC HIGHSPEED 2015, Tokyo, 7-10 July 2015.
Kliiver, L. (1995) “Consensus conferences at the Danish Board of Technology. In Public
participation in science: The role of consensus conferences in Europe”. London: Science
Museum.
Krabbenborg, L. (2013) “Involvement of civil society actors in nanotechnology: creating
productive spaces for interaction”. Groningen: PhD Thesis RU Groningen.
Kuhlmann, S., (2001) “Distributed Techno-Economic Intelligence for Policymaking”. Science
and Technology, 2001.
Kuhlmann, S., et al. (1999) “Improving Distributed Intelligence in Complex Innovation
Systems”, Brussels/Luxembourg, Office for Official Publications of the European
Commission, 1999. http://ideas.repec.org/p/pra/mprapa/6426.html.
Lente, H. V. (1993) “Promising technology: the dynamics of expectations in technological
developments”. Doctoral dissertation, Universiteit Twente. Enschede: Twente University
Press.
Lichtenthaler, E. (2004) “Coordination of Technology Intelligence Processes: A Study in
Technology Intensive Multinationals”, Technology Analysis & Strategic Management,
16(2), 197-221, 2004. doi:10.1080/09537320410001682892.
Mazzucato, M. and Robinson, D.K.R. (2015) “NASA’s changing innovation policy: challenges
and opportunities of ‘directing’ and ‘facilitating’ a new public-private innovation system in
Low Earth Orbit”. Commissioned Report for the Office of the Chief technologist, NASA
HQ.

!!
208
Meunier, J. (2002) “On the fast track – French Railway Modernisation and the origins of the
TGV, 1944-1983”. Forward by Dukakis, M. S. Praeger. ISBN 0-275-97377
Miles, M. B., Huberman, A. M. (1994) “An expanded Sourcebook. Qualitative Data Analysis”
Second Edition. Sage Publications. ISBN 0-8039-4653-8 (cl).
Moretto, S., Palma, A. P., Moniz, A. B. (2012) "Technology Assessment in the High-Speed
Train Manufacturing Industry: Evidence from a Case Study", in J. Pombo, (Editor),
Proceedings of the First International Conference on Railway Technology: Research,
Development and Maintenance, Civil-Comp Press, Stirlingshire, UK, Paper 167, 2012.
doi:10.4203/ccp.98.167.
Moretto, S., Robinson, D.K.R., Moniz A.B. (2014) “The role of Endogenous and Exogenous
Future Oriented Technology Assessment in the European High-Speed Innovation System:
Constructive Technology Assessment as the Next step?”. Proceedings at the 5th International
Conference on Future Technology Assessment Analysis (FTA), - Engage Today to Shape
Tomorrow. European Joint Research Center (European Commission). 27-28 November,
Brussels.
Moretto. S., Pastrana Palma, A., Moniz, A.B (2012) "Constructive Technology Assessment in
Railways: The case of the High-speed Train Industry", in J. Pombo, (Editor), International
Journal of Railways Technology, Volume 1 – Issue 3, Pages 73-95, 2012. Saxe-Coburg
Publications. Doi: 10.4203/ijrt.1.3.5 Link journal http://www.ctresources.info/ijrt/
Nelson, R. & Winter, S. (1977) “Towards a theory of innovation”. Research Policy 6.
OECD (2013) “Policy round tables. Recent Developments in Rail Transportation Services
2013”. OECD Competition Committee report. DAF/COMP(2013)24.
OECD (2009) “Innovation in firms. A microeconomic perspective”. OECD innovation strategy.
20 Nov 2009. ISBN 9789264056206 (print). DOI 10.1787/9789264056213-en. Retrieved
from http://www.oecd-ilibrary.org/science-and-technology/innovation-in-
firms_9789264056213-en;jsessionid=48pbim01tc53r.x-oecd-live-03
Parandian, A. (2013) “Anticipating Ethical, Legal, and Social Aspects of Emerging Technology
Gaps in Innovation Chain: The Case of Body Area Networks”. Nanotechnology and Human
Health, 281.
Parandian, A. (2012) “Constructive TA of Newly Emerging Technologies. Stimulating learning
by anticipation through bridging events”. PhD thesis, Technical University Delft, defended
12 March 2012.

!!
209
Parandian, A., & Rip, A. (2013) “Scenarios to explore the futures of the emerging technology
of organic and large area electronics”. European Journal of Futures Research, 1(1), 1-18.
Pavitt, K. (1984) “Sectoral Patterns of Technical Change: Towards a Taxonomy Model and a
Theory”, Research Policy 13, 343-373.
Pereira, M. S. (2011) “Railway Trends”. Presentation at the First Doctoral Conference on
Technology Assessment, Panel Railways, 9 July 2011, PhD Programme on Technology
Assessment, IET- Research Center on Enterprise and Work Innovation, Faculdade de
Ciência e Tecnologia, Universidade Nova de Lisboa, 2011.
Petersen M.S., Enei R., Hansen C.O., Larrea E., Obisco O., Sessa C., Timms P.M., Ulied A.
(2009) “TRANSvisions - Report on Transport Scenarios with a 20 and 40 year Horizon”.
Final report. Funded by DG TREN. Copenhagen, Denmark.
Picard, R. (2015) “Celebrating the past”, SNCF invited speaker, opening ceremony, UIC World
Congress on High Speed Rail, Tokyo. 7-9 July 2015.
Pisano, G. P (2012) “Creating an R&D strategy”, Executive summary, Working papers,
Harvard School, 11 May 2012. Retrieved from link http://hbswk.hbs.edu/item/7014.html
Pisano, G. P (2015) “You Need an Innovation Strategy”, Harvard Business Review, Issue June
2015.
Preston, J. (2009) “Trends in European Railways over the last two decades”. Built Environment
35 (1), 11-23.
Rip (2015) “Training module of managing technology in society”. University of Stellenbosch.
South Africa.
Rip, A. (2012) “The context of innovation journeys”. Creativity and innovation management,
21(2), 158-170.
Rip, A. (2001) “Technology Assessment”, in Smelser, N. J., Batle, P. B. (eds). International
Encyclopaedia of the Social & Behavioural Sciences. Oxford, Vol. 23, pp. 15512-15515.
Rip, A. (2005) “Technology Assessment as Part of the Co- Evolution of Nanotechnology and
Society: the Thrust of the TA Program in NanoNed”. Paper contributed to the Conference
on “Nanotechnology in Science, Economy and Society”, Marburg, 13-15 January 2005
Rip, A., Kemp, R. (1998) “Technological change”. S. Rayner & E.L. Malone (Eds), Human
choice and climate change (Columbus, Batelle Press, 2).
!!
210
Rip, A., Misa, T. J., & Schot, J. (Eds.). (1995) “Managing technology in society. The Approach
of Constructive Technology Assessment”. London, New York: Pinter Publishers.
Rip, A., Robinson, D. K. R (2013) “Constructive technology assessment and the methodology
of insertion”. In Early engagement and new technologies: Opening up the laboratory (pp.
37-53). Springer Netherlands.
Rip, A. and Schot, J. W. (2002) “Identifying Loci for Influencing the Dynamics of
Technological Development”. In Williams, R. and Soerensen, K. (ed) Shaping
Technology. Guiding Policy; concepts Spaces and Tools. Cheltenham: Edward Elgar.
Rip, A., van Lente, H. (2013). “Bridging the gap between innovation and ELSA: The TA
program in the Dutch Nano-R&D program”. NanoNed. NanoEthics, 7(1), 7-16.
Robinson, D. K. R. (2011) “Value chains as a linking-pin framework for exploring governance
and innovation in nano-involved sectors: illustrated for nanotechnologies and the food
packaging sector”. European Journal of Law and Technology, 2(3).
Robinson, D. K. R. (2010) “Constructive Technology Assessment of Emerging
Nanotechnologies. Experiments in Interactions”. PhD thesis, Universiteit Twente,
Enschede, The Netherlands, defended 25 November 2010.
Robinson, D. K. R. (2009) “Co-evolutionary Scenarios: An application to prospecting futures
of responsible development of nanotechnology”. Technological Forecasting and Social
Change, 76 (2009.07.15) 1222-1239. Doi: 10.1016/j.techfore 2009.07.15.
Robinson, D. K. R. and Boon, W.P.C. (2014) “Does 3D Bioprinting mean business? Making
explicit the assumed industry scenarios for the assessment of business cases for
breakthrough technologies”. 5th International Conference on Future-Oriented Technology
Analysis (FTA) - Engage today to shape tomorrow Brussels, 27-28 November 2014.
Robinson, D. K. R., Huang, L., Guo, Y., Porter, A. L. (2013). “Forecasting Innovation
Pathways (FIP) for new and emerging science and technologies”. Technological
Forecasting and Social Change, 80(2), 267-285.
Robinson, D. K. R., Propp, T. (2011) “Innovation-Chain+ approach to prospecting technology
embedment in society: An Illustration for potential nano-enabled agrifood sector
transformations”. Fourth International Seville Conference on Future-Oriented Technology
Analysis (FTA). FTA and Grand Societal Challenges – Shaping and Driving Structural and
Systemic Transformations Seville 12-13 May 2011, 1-27.

!!
211
Robinson, D. K. R., Propp, T. (2008) “Multi-path mapping as a tool for reflexive alignment in
emerging science and technologies”. Technological Forecasting and Social Change, 75(4),
517-538.
Robinson, M., Velardi, L., Ulianoz, C. (2011) “Market impact evaluation – the way to judge
the success of completed rail research”, Procedia – Social and Behavioral Sciences.
Transport Research Arena – Europe 20112.
Rolland Berger (2014) “UNIFE World Rail Market Study – Forecast 2014 to 2019”.
Commissioned by UNIFE and Conducted by Rolland Berger.
Roland Berger (2012) “Worldwide Rail Market Study – forecast 2012 – 2017”. Study
Commissioned by the European Rail Industry Association (UNIFE).
Roland Berger (2008) “Worldwide Rail Market Study – status quo and outlook 2016”. Study
Commissioned by the European Rail Industry Association (UNIFE).
Rosenberg, N. (1979) “Technology Interdependence in the American Economy”, Technology
and Culture, January 1979, pp.25:50. Reprinted in Rosenberg, N., “Inside the Black Box:
The Technology and Economics (Cambridge, Univeristy Press, 1982, pp55:80, at p. 59
Russell, A.W., Vanclay, F.M., & Aslin, H.J. (2010) “Technology assessment in social context:
The case for a new framework for assessing and shaping technological developments”.
Impact Assessment and Project Appraisal, 28(2), 109-116.
Saint-Martin, N. C. (2015) “Alstom view of the next 50 years ahead”, Alstom invited panellist,
round table, UIC World Congress on High Speed Rail, Tokyo, 9.07.2015.
Schilling, M. A., (2010) “Strategic Management of Technological Innovation” (3rd edition),
New York University, McGraw Hill International Edition.
Schippl, J., et al. (2013) “Eco-efficient Transport, Final report”. STOA Project Eco-efficient
Transport, deliverable nr. 5, Karlsruhe, April 2013.
Schippl, J. (2013) “Participative scenarios on eco-efficient transport: methodological
challenges, results and relevance for policy making”. Paper submitted for the IFA Seminar
2013.
Schippl, J. et al. (2008) “The future of the European long distance transport – Scenario report”.
European Parliament, Science and Technology Options Assessment (STOA).
IP/A/STOA/FWC-2005-28/SC27.

!!
212
Schippl, J., Fleischer, T. (2012) “A problem-oriented categorization of FTA methods for
transport planning”, Foresight, Vol 14, No. 4, 2012,, pp. 288-293. ISSN 1463-6689.
Schot, J., & Geels, F. W. (2008). “Strategic niche management and sustainable innovation
journeys: theory, findings, research agenda, and policy”. Technology Analysis &
Strategic Management, 20(5), 537-554.
Schot, J., Rip, A. (1997) “The past and the future of Constructive Technology Assessment”.
Technology Forecasting and Social Change 54(2), p. 2551:268. PII S0040-1625(96)00180-
1.
Siemens (2010) “Designing the future - How mobility tomorrow is taking shape – complete
mobility – facts, trends, stories”. Issue 05 | September 2010. Transportation Systems.
Siemens AG. www.siemens.com/mobility.
Siemens (2011) “Pictures of the future”. Magazine for Research and Innovation / Fall 2011.
Siemens. Link www. Siemens.com/proof.
Siemens (2010) “Designing the future - How mobility tomorrow is taking shape”. Complete
Mobility. Facts, trends, stories. Issue 05 | September 2010. Transportation Systems. Siemens
AG. www.siemens.com/mobility.
Siemens (2009) “The future needs the railways for a cleaner environment”. Green Mobility.
Transportation Systems. Siemens AG.
Siemens (2006) “The future needs mobility - Completely in detail”. Complete Mobility
Transportation Systems. Siemens AG.
Simon, H. (1962) “The architecture of Complexity”. Proceedings of the American Philosophical
Society 106, pp. 467-82.
Smits, R. E. H. M., Leyten, J. (1991) “Technology assessment: Waakhond of speurhond: Naar
een integraal technologiebeleid”. Zeist: Kerckebosch bv.
Smits, R., van Merkerk, R., Guston, D. H., Sarewitz, D. (2008) “The Role of Technology
Assessment in Systemic Innovation Policy”, Innovation Studies Utrecht -Working Papers
Series ISU Working Paper #08.01, University of Utrecht, p.27.
Steinmann, L. (2014) “Le succès de Blablacar bouscule la SNCF”. LesEchos.fr, 2 July 2014.
Link http://www.lesechos.fr/02/07/2014/lesechos.fr/0203613823111_le-succes-de-
blablacar-bouscule-la-sncf.htm#Xta83r3ZesumGtfF.99

!!
213
TAMI (2004) “Technology Assessment in Europe; Between the Method and Impact”, 9, 1-99,
EC-STARA, Brussels, 2004.
Takagi, R. (2005) “High-speed railways: the last 10 years”. Japan Railway and Transport
Review, 2005(48): 22-29.
te Kulve, H. (2011). “Anticipatory interventions and the co-evolution of nanotechnology and
society”. PhD thesis. University of Twente.
te Kulve, H., Rip, A. (2013). “Economic and societal dimensions of nanotechnology-enabled
drug delivery”. Expert opinion on drug delivery, 10(5), 611-622.
te Kulve, H., Rip, A. (2011) “Constructing Productive Engagement: Pre-engagement Tools for
Emerging Technologies”. Science Engineering Ethics (2011) 17:699-714. Doi
10.1007/s11948-011-9304-0.
van de Ven, A., Polley, D. E., Garud, R., Venkataraman, S. (1999). “The innovation journey”.
ISBN-13: 978-0195341003.
van den Belt, H., Rip, A. (1987) “The Nelson-Winter-Dosi model and the synthetic dye
chemistry”. In W.E. Bijker, T.P. Hughes and T.J. Pinch (eds). The social construction of
technological systems: New Directions in the Sociology and History of Technology,
Cambridge Massachusetts: The MIT Press, 1987, 135‒58, quotes on 143‒44. 6.
van den Ende, J., Mulder, K., Knot, E. M., Vergragt, P. (1998) “Traditional and Modern
Technology Assessment: Toward a Toolkit”. Technological Forecasting and Social Change
58, p.5:21. PII S0040-1625(97)0052-8.
van Eijndhoven, J.C.M., (1997) “Technology assessment: Product or process?”, in
Technological Forecasting and Social Change 54 (1997) 269-286.
van Lente, H. (1993) “Promising Technology - The Dynamics of Expectations in Technological
Developments”. Ph.D Thesis, University of Twente. Delft: Eburon Press.
van Merkerk, R. O. (2007) “Intervening in emerging nanotechnologies: a CTA of Lab on a chip
technology” (Vol. 367) Utrecht University, Royal Dutch Geographical Society.
van Merkerk, R. O., & Robinson, D.K.R. (2006) “Characterizing the emergence of a
technological field: Expectations, agendas and networks in Lab-on-a-chip technologies”.
Technology Analysis & Strategic Management, 18(3-4), 411-428.

!!
214
van de Poel, I. R. (1998) “Changing technologies: a comparative study of eight processes of
transformation of technological regimes”. Twente University Press.
von Schomberg, R. (2013). “A vision of responsible research and innovation”. Responsible
Innovation: Managing the Responsible Emergence of Science and Innovation in Society,
51-74.
Weil, M., Dura, H., Ziemann, S., Baumann, M., Zimmermann, B., Simon, B., Decker, M.
(2014, March). “Constructive technology assessment (CTA) for nano-enabled
technologies”. In abstracts of papers of the American chemical society (vol. 247). 1155 16th
ST, NW, Washington, dc 20036 USA: Amer Chemical Soc.
Wood, F. B. (1997) “Lessons in technology assessment methodology and management at OTA”.
Technological Forecasting and Social Change 54:145-62.
Yin, R. K. (2003) “Case Study Research – Design and Methods”. Third Edition. Editors
Leonard Bickman and Debra J. Rog. Applied Social Research Methods Series. Vol 5. Sage
Publications. ISBN 978-0-7619-2552-1.
Zhou L., Shen, Z. (2011) “Progress in high-speed train technology around the world”. Journal
of Modern Transportation, Vol. 19, Nr. 1, March 2011, Page 16. doi 10.3969/j.issn.2095-
087X.2011.01.01.

!!
215
ANNEXES
Annex 1. Map of the high-speed train network in Europe
High-Speed Train Network in Europe, retrieved from the presentation of Iñaki Baron de
Angoiti, Open Ceremony, UIC HIGHSPEED Congress 2015, Tokyo. Link http://www.uic-
highspeed2015.com/

!!
216
Annex 2. Survey questions
4/5/2017 Assessing High-Speed Trains Innovation Management and Societal Alignment
http://www.surveygizmo.com/s3/1542466/Innovation-Management-in-High-Speed-Trains-and-Societal-Aligment 1/1
Assessing High-Speed Trains Innovation
Management and Societal Alignment
Introduction page
Dear colleague, You are invited to take part in the academic survey on "Assessing HighSpeed Trains Innovation
Management and Societal Alignment". Your answers are of great relevance to further knowledge about innovation
management while identifying societal assessment practices in such a complex technological system of an
important high socioeconomic impact. Expected results aim at further contribute to the market success of future
generations of such vehicles in view of increase dependence of this technology on public acceptance and
capacity to cope with fast emerging global challenges. The survey has a total of 30 questions and will take about
15 minutes to reply. Thank you for your cooperation. Susana Moretto PhD candidate on technology assessment
applied to the highspeed trains, Faculty of Sciences and Technology, New University of Lisbon, Portugal, also
visiting School of Economics and Management, Tongji University, Shanghai, China, E/mail
Next
Survey Software powered by SurveyGizmo
22%

!!
217
4/8/2017 Assessing High-Speed Trains Innovation Management and Societal Alignment
http://www.surveygizmo.com/s3/1542466/Innovation-Management-in-High-Speed-Trains-and-Societal-Aligment 1/1
Save and continue later
Assessing High-Speed Trains Innovation
Management and Societal Alignment
Confidentiality assurance
All information you list is kept confidential. You may which to stay anonymous or protect the identity of yourinstitution by leaving in blank the concern boxes.
Back Next
Survey Software powered by SurveyGizmo
11%

!!
218
4/8/2017 Assessing High-Speed Trains Innovation Management and Societal Alignment
http://www.surveygizmo.com/s3/1542466/Innovation-Management-in-High-Speed-Trains-and-Societal-Aligment 1/2
Save and continue later
Assessing High-Speed Trains Innovation
Management and Societal Alignment
Correspondent type
Comments
1. You reply to this survey in the role of
User (you might want to skip questions which not apply)
Technological stakeholder
Policy Maker
Other
2. List 3 aspects that you value in your decision to take a highspeed train (ex.: comfort, speed, energy efficiency,
ticketprice, etc)
3. Should users have a say in the technology development of the vehicle?
Not at all
Yes in all aspects
Yes but excluding the mechanics of the train
Yes but only if the technology directly impacts the riding experience of the train

!!
219
4/8/2017 Assessing High-Speed Trains Innovation Management and Societal Alignment
http://www.surveygizmo.com/s3/1542466/Innovation-Management-in-High-Speed-Trains-and-Societal-Aligment 1/2
Save and continue later
Assessing High-Speed Trains Innovation
Management and Societal Alignment
Correspondent identification
First Surname
4. Your name (optional)
5. Your job title *
6. Your functional area inside your institution *
Operations
Engineering
Sales and Marketing
Management
Researcher
Professor
PhD Student
Other
7. Your report line
Don't report
Headquarters topmanagement
Subsidiary topmanagement
Headquarters technical director
Subsidiary technical director
Headquarters commercial director
Subsidiary commercial director
Operations director
Director of University or Research Center or NGOor governmental agency or department
Other

!!
220
4/8/2017 Assessing High-Speed Trains Innovation Management and Societal Alignment
http://www.surveygizmo.com/s3/1542466/Innovation-Management-in-High-Speed-Trains-and-Societal-Aligment 2/2
Please Select
Back Next
Survey Software powered by SurveyGizmo
8. Country where you are currently working *
9. Your email
33%

!!
221
4/8/2017 Assessing High-Speed Trains Innovation Management and Societal Alignment
http://www.surveygizmo.com/s3/1542466/Innovation-Management-in-High-Speed-Trains-and-Societal-Aligment 1/2
Save and continue later
Assessing High-Speed Trains Innovation
Management and Societal Alignment
Institutional profile
Please Select
10. Name of your institution (optional)
11. Type of institution you work for
Manufacturing industry(assembly)
Component supplier
Train operator
Rail infrastructure
University
Research Center
Railway association
Government
Certification Body
EndUser
Other
12. Home base country of your institution
13. Which percentage per year of revenue your institution invests in research and development?
Less then 1%
Between 1% and 3%
Between 3% and 5%
Above 5%
14. Your institution has an explicit research and development strategy

!!
222
4/8/2017 Assessing High-Speed Trains Innovation Management and Societal Alignment
http://www.surveygizmo.com/s3/1542466/Innovation-Management-in-High-Speed-Trains-and-Societal-Aligment 2/2
Don't know No Yes
Don't know No Yes
Back Next
Survey Software powered by SurveyGizmo
15. Does your institution has a technology surveillance structure? (scan for future technology opportunities,external market conditions, as well as to align with the other internal strategies)
16. You or a colleague take part in your institution research and technology observation as
centralized technical unit at the headquarters
local technology observation unit at thesubsidiary company
headquarter international technology unit
technology envoy to a specific supplier orsubsidiary company
listening post (scientific boards, etc)
research centers
expert participating in networks
lead user or lead supplier
not applicable
other
44%

!!
223
4/8/2017 Assessing High-Speed Trains Innovation Management and Societal Alignment
http://www.surveygizmo.com/s3/1542466/Innovation-Management-in-High-Speed-Trains-and-Societal-Aligment 1/4
Save and continue later
Assessing High-Speed Trains Innovation
Management and Societal Alignment
Technology Development Approach
1
Never 2 3 4 5 6 7 8 9
10
Always
Product development and design
Manufacturing process
Modeling and planning
Certification and homologation (make products and
methods compliant with regulations and customer
requirements)
Cost reduction (product, process and operations)
Solve technical problems
Make the final product attractive to the end users
Enter in new markets or gain market share from
competitors
Anticipate new social challenges, policies and market
constraints
Comments
17. Rank the frequency in the purposes of your technology development activities
18. Existing practices in your technology development projects
basic research, applied research
concept development and feasibility
product development and processing
regulations

!!
224
4/8/2017 Assessing High-Speed Trains Innovation Management and Societal Alignment
http://www.surveygizmo.com/s3/1542466/Innovation-Management-in-High-Speed-Trains-and-Societal-Aligment 2/4
Strongly
disagree Disagree Neutral Agree
Strongly
agree
Not
Applicable
public affairs and public relations
societal assessment (formulation of scenarios)
market entry
Other
19. Your research and development work is held as follows
in house with my engineering team or colleagues
in bilateral collaboration with an external partner
in consortium with external partners
call upon usergroups
Other
20. Your research work is done in partnership with
colleagues (inhouse)
train manufacturing industry
suppliers from the rail sector
direct competitors
universities and research centers
customer
enduser
certification bodies
railway associations
suppliers from other sectors (specify)
Other
21. Collaborative research and development is relevant (collaborative here means doing research with one or
more external partners)

!!
225
4/8/2017 Assessing High-Speed Trains Innovation Management and Societal Alignment
http://www.surveygizmo.com/s3/1542466/Innovation-Management-in-High-Speed-Trains-and-Societal-Aligment 3/4
to elaborate new solutions matching
customer requirements
to anticipate new social challenges,
policies and market constraints
to solve a technical problem in a core
technology subsystem
to solve a technical problem in an
outsourced technology subsystem
to make the final product compliant and
attractive with customer requirements
to transfer technology or absorb
technology
Comments
Back Next
Survey Software powered by SurveyGizmo
56%

!!
226
4/8/2017 Assessing High-Speed Trains Innovation Management and Societal Alignment
http://www.surveygizmo.com/s3/1542466/Innovation-Management-in-High-Speed-Trains-and-Societal-Aligment 1/3
Save and continue later
Assessing High-Speed Trains Innovation
Management and Societal Alignment
Technology Development Contextualization
Not
relevant
1 2 3 4 5 6 7 8 9
Extremely
relevant
10
Policy (European and national policies,
regulations, funding)
Society (environment, mobility, endusers)
Business (direct and indirect competitors,
supply chain, customer requirements, costs)
Internal drivers to the institution (strategy,
resources, operations, etc)
Comments
Policy
drivers
Business
drivers
Societal
drivers
TRL 1. Basic principles observed and reported
TRL 2. Technology concept and/or application formulated
TRL 3. Analytical and experimental critical function and/or
characteristic proof of concept
TRL 4. Component and/or breadboard validation in laboratory
environment
TRL 5. Component and/or breadboard validation in relevant
environment
22. Rate in relevance the factors driving your research and development
23. When developing a new technological solution for the highspeed train, at which technological readiness
levels (TRLs) you consider the listed drivers

!!
227
4/8/2017 Assessing High-Speed Trains Innovation Management and Societal Alignment
http://www.surveygizmo.com/s3/1542466/Innovation-Management-in-High-Speed-Trains-and-Societal-Aligment 2/3
Policy
drivers
Business
drivers
Societal
drivers
TRL 6. System/subsystem model or prototype demonstration in a
relevant environment
TRL 7. System prototype demonstration in its environment
TRL 8. Actual system completed and 'qualified' through test and
demonstration
TRL 9. Actual system 'proven' through successful mission
operations
Never
Comments
24. Your sources of information on technology drivers, opportunities and constraints are
Scientific papers and reports
Conferences and workshops
Trade shows
Training session
Virtual networks
Technology platforms
Collaborative projects
Customer or enduser direct inquiry
Other
25. You base your technology decisions on
Quantitative indicators
Qualitative indicators
Best practices
Informal appraisals
Influence from others
Other

!!
228
4/8/2017 Assessing High-Speed Trains Innovation Management and Societal Alignment
http://www.surveygizmo.com/s3/1542466/Innovation-Management-in-High-Speed-Trains-and-Societal-Aligment 1/2
Save and continue later
Assessing High-Speed Trains Innovation
Management and Societal Alignment
Technology Development Societal Alignment
Comments
Yes No Maybe
Distinguishes separate development lines (gates) for societal alignment?
Includes someone responsible for societal alignment in crossfunctional team?
Treats societal actors as stakeholders?
Shows openness and proactiveness to interact with societal actors?
26. In your opinion technological development alignment with societal actors (consumer organizations, user
groups, environmental groups, citizens groups) is
a risk at early stage as confidential information can become public or raise premature negative reactions
a risk at latter stage as it can increase costs of reenginering product and processes as there might be
little room for change
beneficial when it is still possible to incorporate their expectations
beneficial if the dilemma of unbalances and desalignments are successfully overcome
beneficial if creates shared technological paths
beneficial as societal actors can provide indications on the degree of public acceptance of new
technologies
Other
27. Technology management in your institution considers
28. Technology management in your institution pays enough attention to

!!
229
4/8/2017 Assessing High-Speed Trains Innovation Management and Societal Alignment
http://www.surveygizmo.com/s3/1542466/Innovation-Management-in-High-Speed-Trains-and-Societal-Aligment 2/2
Yes No Maybe
Articulation of scenarios for societal inclusion?
Mapping and monitoring relevant environment including society?
Stimulating continuous learning during societal inclusion process?
Back Next
Survey Software powered by SurveyGizmo
78%

!!
230
4/8/2017 Assessing High-Speed Trains Innovation Management and Societal Alignment
http://www.surveygizmo.com/s3/1542466/Innovation-Management-in-High-Speed-Trains-and-Societal-Aligment 1/2
Save and continue later
Assessing High-Speed Trains Innovation
Management and Societal Alignment
Technology Management and Future Prospective
1 Not
relevant 2 3 4 5 6 7 8 9
10
Extremely
important
29. In your research work you consider visioning the future (anticipation of drivers and constraints)
30. Your sources of information about future emerging drivers and constraints are
internal reports
external reports from consultants
external reports from railway organizations or research centers
external reports from technology platforms as the one for rail (ERRAC)
Other
31. The methods you mostly rely upon to predict the future are
don't know
delphi
forecasting
foresight
evaluation
scenarios
roadmapping
lifecycleassessments
brainstorming
other
32. In your opinion future exercises should consider
policy and regulatory framework culture (norms, values, opinions)

!!
231
4/8/2017 Assessing High-Speed Trains Innovation Management and Societal Alignment
http://www.surveygizmo.com/s3/1542466/Innovation-Management-in-High-Speed-Trains-and-Societal-Aligment 2/2
Back Submit
Survey Software powered by SurveyGizmo
structure of the sector and production chain
societal actors relevant for technological
development
Other
33. In your opinion future exercises should result in
enlightenment on what the future might be (static futures)
enlightenment on the path for the envisaged scenario by providing alignments with supply chain and
societal actors
alert on emergent constraints
orchestrate alignments with wider society (account positions and interests of other actors)
actors preengagement through sociotechnical scenario building
Other
89%


!!
233
Annex 3. Dissertation summary chart
Chapter I: Railways are yet struggling with market uptake of their new technologies despite almost two decades of investments in collaborative research. To maintain their dominant position under the new market conditions, manufacturers introduced in railways strategic intelligence to technology management, extended to the supply chain. The result has been an increase institutionalisation of their strategic technological networks in ERRAC and most recent SHIF2RAIL. They aim at “promoting” jointly agreed solutions at pre-competitive stage while “controlling” (steering) future technological developments. The recent digitalisation of society has broadened the notion of technological selection to a wider spectrum of new social actors, themselves capable of creating new market demands and innovating, moving further away manufacturers and their networks from controlling the market uptake of their technological solutions. How can TA support the high-speed train industry embrace this new socialware era?
Ref. Question Proposition High-Speed Trains & TA interceptions
Method Findings
RQ.1. What is the relation between high-speed trains technology and TA?
P.1. Proposition:
Rail and TA intercepts at the level of actors technological decision-making (technology selection).
TA refers to “informed decision making” on new technologies as the ones being inclusive of society. Those decisions are made by governments, non-governmental institutions, corporations alone or in networks. Each one is covered by different TA strands.
Since 2001 high-speed train manufacturers became fully responsible for designing, manufacturing and commercialising the vehicles in collaboration with their network of suppliers.
TA presented different strands which selection depends on the addressee (governments, non-governmental institutions, firms, or their networks) and level of application (policy-making, science and technology, public engagements).
This requires literature review on TA as to find the best suit.
TA stands Literature review on TA theories concepts and models
Findings from Chapter II:
TA is in a period of ferment of renewed methods. The EU funded project PACITA (2011-2015) reflected that and it was a major source of information.
For the purpose of this dissertation CTA - Constructive Technology Assessment - standsout from other strands. This because, inspired in actors-network theory, it is the stand that addresses technology as the construction of networks of actors, which act at the level of science and technology, constraint by different environments of technology selection (business, regulatory and societal).
CTA, proposes a strategic intelligence model to extend that network of actors to society from early stage of the development process.
CTA has been positioning itself as a way to overcome the institutionalised division of labour between promotion and control of technology referred as the Collingridge dilemma. It deals with the inherent asymmetries between “impactors” (insiders, at the source of the technology) and “impactees” (outsiders , impacted by the technology) with heterogeneous expectations and capabilities (as well as different powers, timings, interests, resources, etc). CTA proposes doing it by bridging events between those heterogeneous actors orchestrated by a third party, to probe each others assessment worlds (supply-chain plus in Robinson & Propp 2008), and ultimately arrive to socio-technological scenarios of aligned visions (Te Kulve & Rip 2011). Those scenarios not only take actors initiatives and interactions into account but also their surroundings. They are not used to extrapolate particular developments into future (control function)

!!
234
but rather to enhance the flexibility of stakeholders regarding their strategic decisions (mutual-learnings), which in its turn is what modulates technology developments.
As it was seen CTA offers a two-fold application (i) analysis making (e.g. setting the scene: problem identification, phase in which is the technological development, actors involved and mapping on their expectations); and (ii) practice-oriented (e.g. models for interventions allowing for technological future formulations embedding society).
CTA methods for analysis range from data collection and interviews allowing placing concerned innovation journey in context (main reference Deuten, Rip & Jelsma 1997), to define multi-level-perspectives (as further developed by Geels 2002) and to determine collective strategy formulations (elaborated by Robinson & Propp 2008).
CTA practice-oriented methods refer to socio-technical scenarios (elaborated by Te Kulve & Rip 2011) supported by methods including bridging events (Parandian 2013); third party mediation of pre-engagements (te Kulve and Rip 2012); bridging gaps between technology development and use (Paridian 2012, Robinson 2010); backcasting (Schippl 2008); inclusion of unknown unknowns (Justen et al. 2014).
So far, PhD students applying CTA have been on basic research, as in nano-technology, addressing scientific developments. My research contributes extending CTA to mature innovations and further bring its application to the technology domain.
RQ.2. How the industry might be falling short in embedding society in their product development? (this requires to verify how technologies are selected)
RQ1 P.2. Proposition:
The case study of AGV and the ICE-350E is addressed. The disappointing commercialisation of those trains after years of collective investments in their development has raised concerns in the railway industry on the market uptake of their new technologies, while fast emergent digitalisation of society is raising new challenges.
The object of analysis is therefore the development process. The unit of analysis are their manufacturers, Alstom and Siemens, and collective of stakeholders’ part in the technological chain.
CTA offers different layers for analysing the industry practices, which unfolds into four sub-research questions (SRQ.2.1, SRQ.2.2, SRQ.2.3, SRQ.2.4)
CTA presents analytical frameworks which intercepts the case study in terms of strategic intelligence formulation (SRQ.2.1), technology transitions (SRQ.2.2), multi-level perspectives (SRQ.2.3) and
Case studies supported by literature review on and unstructured interviews with manufacturers informants.
Findings in Chapter IV are referred in the sections below.

!!
235
futures assessment (SRQ2.4).
SRQ.2.1. What happens in terms of innovation journey?
P.2.1. Proposition:
Once in liberalised market conditions the manufactures Alstom and Siemens relay on strategic intelligence to support decision-making in the technological development of the AGV and the ICE-350E.
Strategic intelligence is found in their organisational structure and technological paths.
In this part it is relevant to address evidence of societal embedding in those two manufacturers’ strategic formulation during the development of the AGV and the ICE-350E.
Strategic function of TA Deuten, Rip, Jelsma (1997) [build on Kuhlmann (1999) Schot and Rip (1997) and later developed in Smits et al. (2008)].
Case studies supported by literature review.
Findings chapter IV, section 4.1. Strategic intelligence:
Theory:
Theory places Technology Assessment in strategic intelligence. Kuhlmann (1999) is the first conceptualising it. Smits et al. (2008) further elaborate on its distinctive elements (as focus on decision-making support, problem orientation, intensive interaction with the wide of actors. Schot and Rip (1997) reinforce the element of anticipation from early stage of development. While Deuten et al. (1997) formulate the previous on the new product creation process extended to society. I found however that Deuten et al. (1997) do not detail the optimal organisational structure of firms or its networks to conduct societal embedding. To overcome such theoretical gap I recurred to Lichtenthaler (2004) technology surveillance studies.
Case:
It was found that Alstom and Siemens strategic intelligence broadly aligns with CTA societal embedding recommendation. Both manufacturers filter societal constrains at socio-economic and to some extend policy levels; they have in place surveillance structures of people working mainly at the subsidiaries; they also have people part in external expert networks and in contact with lead users and suppliers; their privileged partner for societal surveillance are universities and component suppliers; and they give preference for societal embedding in non-core-technologies as interiors and telematics.
In which Alstom and Siemens did not seem aligned with CTA societal embedding principle was on the technological decision-making trajectory. For both manufacturers it was found societal alignments occurred mainly during the commercial trajectory at the interception with the technical, by the time the technology was matured and ready to commercialise. Constructivists advocate that it should rather occur much earlier in the development process (Deuten et al. 1997). This is an indication that during the development of the AGV and the ICE-350E Alstom and Siemens monitored societal constraints for a purpose of “promotion” and “control” rather than producing alignments (Deuten et al. 1997).
Despite the above refreed, evidences were not found at which technological readiness level societal embedding actually occurred. Also missing was the study on other stakeholders part of Alstom and Siemens supply chain. Both aspects were later covered by the survey.

!!
236
SRQ.2.2. What has been the evolution in time?
P.2.2. Proposition:
During the technology transitions from one generation of high-speed trains to the other strategic decision-making nor societal constrains have been considered in the same way. It is relevant to understand how decision-making in high-speed trains have evolved by focusing on the societal element.
Technological transitions Geels (2002a), [see also Rip and Kemp (1996, 1998), Constant (1978), Rosenkopft Tushman (1993), Nelson 1994]
Case studies supported by literature review.
Findings chapter IV 4.2. Technology Transitions:
Theory:
Technology transition, here covered, and the Multi-Level Perspective (MLP), to be covered in the next section, are core analytical tools as they feed the main function of CTA in the understanding of the co-evolution of socio-technical systems. They were introduced in the 1990’s. Technology transition by Aire Rip, Rene Kemp (1998) and Johan Schott (1997) and Multi-Level Perspective by Rip and Kemp (1998). In this section and in the next one were very useful Geels visualisations (2002a and Geels & Schot 2007) further developing both models.
Case:
By using CTA technology transition model it became evident that both trains the French AGV and the German ICE-3050E represented a shift in Alstom and Siemens decision-making. They refer to the transition from hardware to software technological developments as policy and regulatory constraints became the primary trigger for technology change. Alstom and Siemens developed these trains in the race to champion supply to the trans-European high-speed networks and have their standards a reference in interoperability. It was also possible to visualise the first signs in the emergence of a new approach in Alstom and Siemens technology decision-making that most likely will precipitate them to socialware developments driven from the exponential digitalisation of society and social innovations they arise.
SRQ.2.3. What happens in terms of multi-level perspective?
P.2.3. Proposition:
The AGV and ICE-350E result from the sum of the technological decisions, and their alignment, occurring between different stakeholders. They are produced from the alignment of multi-level perspectives on what the technology direction should be; and those alignments are mainly occurring at regime level.
Multi-level perspective Geels and Schot (2007)
Case studies supported by literature review.
Findings chapter IV 4.3. Multi-level perspective:
Theory:
To explore the multi-level perspective between the various actors in terms of technological knowledge exchanges happening during the development process of the AGV and ICE 350E (2001-2008) I further applied Geels levels of analysis (niche, regime, landscape arenas, in Geels and Schot 2007, to which Robinson 2009 refers as arenas-of-action) combining it with Pavitt revised taxonomy of innovation.
Case:
From this exercise it became evident that the AGV and ICE-350E were developed in a period of emergence of strategic reports where technology actors aligned their perspectives. Each reflected the technological arena of the commissioning stakeholders; they were mainly produced at regime level; and feeding on each other reports. Less covered in this alignment of perspectives where societal actors at landscape. During this particular period those societal actors were mainly non-governmental organization and specific interest groups.

!!
237
Relevant to note that two main typologies of reports were observed: dominant collective and individual techno-centric visions produced at regime level (e.g. endogenous to the AGV and the ICE-350E supply chain), and policy foresight reports covering perspectives of actors produced at landscape level (e.g. exogenous to the AGV and the ICE-350E supply chain). Such indicates a discontinuity in the alignment of perspectives between actors at regime level and landscape which I further studied and results are presented in the next section.
SRQ.2.4. What happens in terms of formulations of future technological paths?
P.2.4. Proposition:
The AGV and ICE-350E technologies reflects the industry collective visions and roadmaps. They are simultaneously the result and determinant of the collective technology path in Europe post-2001 (envisaged railway market liberalisation and completion of the trans-European network).
Future strategic formulations Robinson, Propp (2011) [see also Te Kulve, Rip (2011)]
Case studies supported by literature review and unstructured interviews with report commissioners.
Findings chapter IV 4.4. Formulations on future technology assessment:
Theory:
Robinson and Propp adapted classification methods (2011, p.23, table 2, of levels of innovation chain+ analysis) was proved to be a good tool to classify railways future assessment reports addressing the high-speed train technology system and diagnose the extension of societal embedding within the formulation of the collective socio-technical scenarios.
Case:
It was found that if the visions, roadmaps and other forms of future strategic formulations were found relevant in contributing to the revitalization of railways since 2001 they might risk to miss their function if overpassing the emergent new societal challenges occurring at landscape from digitalisation producing social innovations
Notorious it was the case of ERRAC visions and road maps. They provide a pre-competitive forum (inclusive and dynamic), aiming and allowing for multi-level perspective alignments in the liberalized market conditions. The visions, strategic agendas and roadmaps of ERRAC have been enablers of technology dependencies by anticipating, influencing directions of the development trajectory of high-speed rail (see the White Paper on Transport (COM (2001) 370) which has since been periodically revised and updated). The share of common interests in this industry is triggering and stimulating collaborative research projects, of which the first wave has been to a certain extent embedded in AGV and ICE-350E trains becoming part of the dominant designs and voluntary norms.
However, there is still a long way to go. The need for forums such as ERRAC to move beyond the dominance of endogenous roadmaps (highlighted in this paper) to a mix of endogenous and exogenous roadmaps and other forms of future strategic formulations (such as the STOA type activities) is becoming a pressing issue. SHIFT2RAIL recently launched will inevitably have to address it. This call for more exogenous future strategic formulations is further amplified by other shifts in the socio-technical system of high-speed railways. For example, I have shown in this section that initially the railway operators and their manufacturers once held a strategically important position of being

!!
238
knowledgeable of the whole supply chain. However today they are no longer knowledgeable about the whole technology system. They moved from in-house production by the major manufacturers to outsourcing, pressed by costs-reduction. Their knowledge decreases as the sub-systems themselves sub-divide. This means there is no longer an individual actor with a supra systemic view on the transport system.
RQ.3. Who in the R&D process has propensity to address societal embedding?
P.3. Proposition:
A survey to the broad of stakeholders apply as not all the actors involved in the AGV and ICE-350E development have the same approached towards societal embedding.
Deuten, Rip, Jelsma (1997), Geels (2002), Robinson and Propp (2008)
Survey Findings chapter IV 4.5. Survey:
A.! Strategic+innovation+Management++
The high-speed train industry overall is R&D intensive, lead by component suppliers and research centers spending above 5% of their turnover. Contrasting, manufacturers split their levels of R&D spending between 1%-3% and 3%-5%, which reflects outsourcing.
The industry reports to strategic intelligence guidelines (Q14) fed by formal channels of technology surveillance (Q15) mainly positioned in networks (Q16).
Their main purpose for undertaking technological developments is to survive in open market conditions mainly by anticipating societal changes, policies and market constraints and then to make the final product attractive to the end-user (Q17). Manufacturers however contrast mainly pursuing technology development for product and deign improvements, manufacturing optimization and cost reduction (Q17).
The industry is dominated by incremental innovations, reflecting the monopolistic and incumbent nature of their stakeholders (Q18).
The industry is split however in their openness for collaborative research (Q19) with manufacturers and research centers expressing preferences for R&D in consortia while for component suppliers is in-house. User engagement in the technology development is however quite low across all the stakeholders enquired (Q20), with research centers expressing the highest interest to involve them. Preference goes to collaborative research performed with specialized knowledge providers as research centers and universities (Q20).
All stakeholders consider societal challenges, policies and market constraints the main factors leading for collaborative research with technical problems left to be solved by in-house research (Q21). At collaborative level manufacturers are aligned with the general trend (this did not occur in Q17).
B.! Societal+embedding:+

!!
239
The high-speed train industry attributes high levels of relevance to the societal environment, above policy & regulations. Yet business & engineering dominates (Q22).
Societal requirements are relevant at the initial stage (Q23) of technology development process (TRL1) when basic principles are observed and data collected. Then their relevance progressively declines to its minimum (TRL4) when the technology is validated. Latter they regain momentum when the new technology has matured, ready to market (TRL8 & TRL9). Different from manufacturing, component suppliers tend to consider societal requirements in all stages of development.
Alignment with societal actors are considered by a great majority of respondents a way of risk mitigation of technology failure (Q26). Manufacturing and researcher centers showing the highest of support but also of concerns. The benefits of shared technological paths it is the least considered by manufacturing.
Societal embedding is dominated by informal practices (Q27) with a great percentage of respondents stating openness for interaction with societal actors and their recognition as a stakeholder in the technology development. Only a few however referred employing someone responsible for societal alignment, mainly coming from research centers. Even fewer mentioned technology assessment gates to address them, such as a minority of component suppliers, consultancies and railway associations.
(Q28) Mapping and monitoring societal environment is relevant for the industry. However, the articulation of scenarios allowing for societal embedding and stimulation of learning from societal actors is the least referred, except for research centers. The industry rather controls than orchestrates their dialogue with societal actors.
Results here show that the most referred type of Future Technology Assessments are endogenous to the railways presenting their techno-centric visions to an envisaged future they aim to control (Q.30). Exception goes to governments and some consultancies referring the most to external reports more inclusive of the wider society and capable of covering wider collective of stakeholders.
In terms of methods used (Q25) respondents equally considered qualitative and quantitative approaches. Manufacturing however standout from other stakeholders by prioritizing quantitative methods, less appropriated in assessing vague and not-known for the industry societal requirements.


!
!