Hong Kong as an Information Society - Census and Statistics ...
120
-
Upload
khangminh22 -
Category
Documents
-
view
1 -
download
0
Transcript of Hong Kong as an Information Society - Census and Statistics ...


序言 Foreword
「資訊社會」泛指一個差不多所有活
動均應用資訊的社會。科技上的轉變以及
電子與電訊的廣泛使用,促使資訊得以在
先進經濟體系內流通。
The expression “information society” generally refers to a society in which information is used in almost all forms of activities. Technological changes and the increased utilisation of electronics and telecommunications contribute to information flow in all advance economies.
較明確來說,資訊社會可定義為一個
廣泛使用資訊網絡及資訊科技,生產大量
資訊與通訊的產品和服務,並擁有多元化
內容行業結構的社會。這觀點強調資訊基
建的實踐與發展對社會帶來的社會及經
濟影響,而不僅是實際的科技發展。
More specifically, the information society can be defined as one which makes extensive use of information networks and information technology, produces large quantities of information and communication products and services and has an industrial structure with diversified contents. This approach emphasises the social and economic effects that information infrastructure applications and development will have on society in addition to actual technological development.
以面積或人口計算,香港都是一個相
對細小的地區。香港的人口為六百七十多
萬,較世界上很多大城市為少。但若論資
訊科技的發展,則香港仍有足以自豪的成
績。
Hong Kong is a relatively small community in terms of area and with a population of some 6.7 million which is less than many large cities in the world. But so far as development in information technology is concerned, Hong Kong has some proud results to show.
本刊主要目的是介紹從各種來源匯
集與資訊社會發展有關的統計數據,包括
資訊科技在工商業及住戶的使用情況和
普及程度,特別是政府內使用此等設施的
情況,以及電訊服務的發展。至於業內的
人力資源需求和相關教育課程的分析,亦
包括在內。若讀者希望獲得更詳細的統計
資料,可聯絡載列於附件的有關資料來
源。
This publication aims at presenting statistical data compiled from a variety of sources relevant to the development of the information society, ranging from the usage and penetration of information technology both in the business sector and in households, with particular emphasis on the adoption of such facilities in the government, to developments in telecommunications services. Analyses on the demand for manpower in the field and developments of relevant educational programmes are also included. Readers who wish to obtain more detailed statistical information could contact the relevant sources of information given in the Annex.
政府統計處處長 何永
二零零二年九月
Frederick W. H. HO Commissioner for Census and Statistics
September 2002


v
目 錄 Contents
頁數 Page
統計表一覽 List of Tables vi
統計圖一覽 List of Charts xii
特別註釋及代號 Special Notes and Symbols xiii
第 1 章 資訊科技在住戶的使用情況
和普及程度 Chapter 1 Information Technology Usage
and Penetration in Households 1
第 2 章 資訊科技在工商業的使用 情況和普及程度
Chapter 2 Information Technology Usage and Penetration in the Business Sector
27
第 3 章 資訊科技在政府的使用情況
和普及程度 Chapter 3 Information Technology Usage
and Penetration in the Government
55
第 4 章 資訊科技及電訊業的營運 特徵
Chapter 4 Operating Characteristics of the Information Technology and Telecommunications Sector
57
第 5 章 電訊服務 Chapter 5 Telecommunications Services 61
第 6 章 電腦產品及電訊器材的 進出口
Chapter 6 Imports and Exports of Computer Products and Telecommunications Equipment
73
第 7 章 資訊科技的人力資源 Chapter 7 Human Resources in Information Technology
85
第 8 章 資訊科技的教育 Chapter 8 Education in Information Technology
89
定義及詞彙 Definitions and Terms 97
附件 查詢電話 Annex List of Enquiry Telephone Numbers
105

vi
統 計 表 一 覽 List of Tables
頁數
Page
1. 資訊科技在住戶的使用情況和普及程度 1. Information Technology Usage and Penetration in Households
表1.1 家中有個人電腦及家中有個人電腦
接駁互聯網的住戶 Table 1.1 Households with personal computer
(PC) at home and with PC at home connected to Internet
10
表1.2 按接駁上互聯網的方法劃分的家中
有個人電腦接駁上互聯網的住戶 Table 1.2 Households with personal computer
(PC) at home connected to Internet by mode of connection to Internet
11
表1.3 按年齡組別及性別劃分的在統計前
十二個月內曾使用個人電腦的十歲
及以上人士
Table 1.3 Persons aged 10 and over who had used personal computer (PC) in the twelve months before enumeration by age group and sex
12
表1.4 按教育程度劃分的在統計前十二個
月內曾使用個人電腦的十歲及以上
人士
Table 1.4 Persons aged 10 and over who had used personal computer (PC) in the twelve months before enumerationby educational attainment
13
表1.5 按經濟活動身分劃分的在統計前十
二個月內曾使用個人電腦的十歲及
以上人士
Table 1.5 Persons aged 10 and over who had used personal computer (PC) in the twelve months before enumerationby economic activity status
14
表1.6 按年齡組別劃分的在統計前十二個
月內曾使用個人電腦最少每星期一
次的十歲及以上人士每星期使用個
人電腦的平均時間
Table 1.6 Average duration of time spent in using personal computer (PC) per week of persons aged 10 and over who had used PC at least once a week in the twelve months before enumeration by age group
15
表1.7 按經濟活動身分劃分的在統計前十
二個月內曾使用個人電腦最少每星
期一次的十歲及以上人士每星期使
用個人電腦的平均時間
Table 1.7 Average duration of time spent in using personal computer (PC) per week of persons aged 10 and over who had used PC at least once aweek in the twelve months before enumeration by economic activity status
15
表1.8 按年齡組別及性別劃分的在統計前
十二個月內曾使用互聯網服務的十
歲及以上人士
Table 1.8 Persons aged 10 and over who had used Internet service in the twelve months before enumeration by age group and sex
16

vii
頁數Page
表1.9 按教育程度劃分的在統計前十二個
月內曾使用互聯網服務的十歲及以
上人士
Table 1.9 Persons aged 10 and over who had used Internet service in the twelve months before enumeration by educational attainment
17
表1.10 按經濟活動身分劃分的在統計前十
二個月內曾使用互聯網服務的十歲
及以上人士
Table 1.10 Persons aged 10 and over who had used Internet service in the twelve months before enumeration by economic activity status
18
表1.11 按年齡組別劃分的在統計前十二個
月內曾使用互聯網服務最少每星期
一次的十歲及以上人士每星期使用
互聯網服務的平均時間
Table 1.11 Average duration of time spent in using Internet service per week of persons aged 10 and over who had used Internet service at least once a week in the twelve months before enumeration by age group
19
表1.12 按曾使用的電子商業服務類別劃分
的在統計前十二個月內曾使用電子
商業服務的十五歲及以上人士
Table 1.12 Persons aged 15 and over who had used electronic business services in the twelve months before enumeration by type of electronic business services used
20
表1.13 按教育程度劃分的在統計前十二個
月內曾使用電子商業服務的十五歲
及以上人士
Table 1.13 Persons aged 15 and over who had used electronic business services in the twelve months before enumeration by educational attainment
22
表1.14 按經濟活動身分劃分的在統計前十
二個月內曾使用電子商業服務的十
五歲及以上人士
Table 1.14 Persons aged 15 and over who had used electronic business services in the twelve months before enumeration by economic activity status
23
表1.15 按年齡組別/性別劃分的認識「公共
服務電子化計劃」的十五歲及以上
人士
Table 1.15 Persons aged 15 and over who were aware of the Electronic Service Delivery (ESD) scheme by age group/sex
24
表1.16 二零零一年按曾否使用「公共服務
電子化計劃」所包括的服務/曾使用
的服務類別劃分的認識「公共服務
電子化計劃」的十五歲及以上人士
Table 1.16 Persons aged 15 and over who were aware of the Electronic Service Delivery (ESD) scheme by whether had used the services covered by the ESD scheme/type of services used, 2001
25
viii
頁數Page
2. 資訊科技在工商業的使用情況和普及程
度 2. Information Technology Usage and
Penetration in the Business Sector
表2.1 按行業/就業人數類別劃分的有使用
個人電腦的機構單位百分比 Table 2.1 Percentage of establishments having
used personal computer (PC) by industry sector/employment size
35
表2.2 按行業/就業人數類別劃分的有連接
互聯網的機構單位百分比 Table 2.2 Percentage of establishments having
Internet connection by industry sector/employment size
36
表2.3 按使用互聯網的一般功能劃分的有
連接互聯網的機構單位分布 Table 2.3 Distribution of establishments having
Internet connection by general function of Internet used
37
表2.4 二零零一年按行業/就業人數類別及
連接互聯網的方式劃分的機構單位
分布
Table 2.4 Distribution of establishments having Internet connection by method of connection by industry sector/ employment size, 2001
38
表2.5 二零零一年按行業/就業人數類別及
連接互聯網的通訊線路速度劃分的
機構單位分布
Table 2.5 Distribution of establishments having Internet connection by speed of transmission line being used for Internet access by industry sector/employment size, 2001
39
表2.6 互聯網服務 Table 2.6 Internet services 40
表2.7 按行業/就業人數類別劃分的有設立
網頁/網站的機構單位百分比 Table 2.7 Percentage of establishments having
Web page/Web site by industry sector/employment size
41
表2.8 二零零一年按行業/就業人數類別及
有設立網頁/網站劃分的有無線應用
協定(WAP)版本的網頁/網站;有
網絡伺服器;有把機構的網頁/網站
連接到機構內的資料庫;有把機構
的網頁/網站連接到商業伙伴的電腦
系統的機構單位分布
Table 2.8 Distribution of establishments having Web page/Web site by having Wireless Application Protocol (WAP)version of Web page/Web site; having Web server; having Web page/Web site connected to related in-firm database; having Web page/Web site connected to business partners’ computer systems by industry sector/employment size, 2001
42
表2.9 按行業/就業人數類別劃分的透過電
子途徑預訂、購買或獲取產品/服務
/資料的機構單位分布
Table 2.9 Distribution of establishments having ordered, purchased or receivedgoods/services/information through electronic means by industry sector/employment size
43

ix
頁數Page
表2.10 按預訂或購買的產品/服務/資料種
類劃分的透過電子途徑預訂或購買
產品/服務/資料的機構單位
Table 2.10 Establishments having ordered or purchased goods/services/informationthrough electronic means by type of goods/services/information orderedor purchased
44
表2.11 二零零一年按行業/就業人數類別劃
分的透過電子途徑獲取產品/服務/
資料的機構單位分布
Table 2.11 Distribution of establishments having received goods/services/information through electronic means by industry sector/employment size, 2001
45
表2.12 二零零一年按有關電子途徑種類劃
分的透過電子途徑獲取政府產品/服
務/資料的機構單位
Table 2.12 Establishments having received government goods/services/informationthrough electronic means by type of electronic means, 2001
46
表2.13 二零零一年按獲取的產品/服務/資
料種類劃分的透過電子途徑獲取產
品/服務/資料(非政府的產品/服務
/資料)的機構單位
Table 2.13 Establishments having received goods/services/information (other than from government goods/services/ information) through electronic means by type of goods/services/information received, 2001
47
表2.14 二零零一年按行業/就業人數類別劃
分的透過電子途徑售賣產品/服務/
資料的機構單位
Table 2.14 Establishments having sold goods/services/information through electronicmeans by industry sector/employmentsize, 2001
48
表2.15 按透過電子途徑售賣或遞送產品/服
務/資料劃分的機構單位 Table 2.15 Establishments having sold or
delivered goods/services/informationthrough electronic means
49
表2.16 按有關電子途徑種類劃分的透過電
子途徑售賣產品/服務/資料的機構
單位
Table 2.16 Establishments having sold goods/services/information through electronicmeans by type of electronic means
49
表2.17 按電子途徑種類/顧客類別劃分的售
賣產品/服務/資料所帶來的業務收
益
Table 2.17 Business receipts received through selling goods/services/information through electronic means by type of electronic means/customer group
50
表2.18 按互聯網接駁服務劃分的業務收益 Table 2.18 Business receipts of Internetconnection services by type of product
51
表2.19 二零零一年按行業/就業人數類別劃
分的有使用數碼證書的機構單位 Table 2.19 Establishments having used e-Certs
by industry sector/employment size, 2001
52
表2.20 二零零一年按行業/就業人數類別劃
分的預計使用數碼證書的時間劃分
的有此計劃的機構單位
Table 2.20 Establishments intending to use e-Certs by expected time of using by industry sector/employment size, 2001
53

x
頁數Page
3. 資訊科技在政府的使用情況和普及程度 3. Information Technology Usage and Penetration in the Government
表3.1 政府的資訊科技開支 Table 3.1 Government spending on information technology (IT)
56
表3.2 政府電腦化 Table 3.2 Computerisation in the Government 56
表3.3 政府資訊科技人員 Table 3.3 Government information technology staff
56
4. 資訊科技及電訊業的營運特徵 4. Operating Characteristics of the Information Technology and Telecommunications Sector
表4.1 有關資訊科技及電訊業的統計數字 Table 4.1 Statistics pertaining to the information technology and telecommunications sector
59
5. 電訊服務 5. Telecommunications Services
表5.1 二零零零年按服務類別劃分的電訊
業總額比重 Table 5.1 Contributions of the
telecommunications industry by type of services, 2000
66
表5.2 提供固定電話、電報及流動電話服
務的機構單位的主要統計數字 Table 5.2 Principal statistics for establishments
rendering fixed telephone, telegraph and mobile phone services
66
表5.3 公共流動無線電話服務 Table 5.3 Public mobile radio-telephone services
67
表5.4 提供傳呼服務機構單位的主要統計
數字 Table 5.4 Principal statistics for establishments
rendering radio paging services 68
表5.5 公共無線電傳呼服務 Table 5.5 Public radio paging services 68
表5.6 其他電訊服務機構單位的主要統計
數字 Table 5.6 Principal statistics for establishments
rendering other telecommunications services
70
表5.7 有線電話服務 Table 5.7 Wireline telephone services 71
表5.8 對外電訊通訊量 Table 5.8 External telecommunications traffic 72

xi
頁數Page
6. 電腦產品及電訊器材的進出口 6. Imports and Exports of Computer Productsand Telecommunications Equipment
表6.1 按進口主要供應地及出口主要目的
地劃分的電腦硬件貨值 Table 6.1 Imports by main supplier and exports
by main destination of computer hardware
76
表6.2 按進口主要供應地及出口主要目的
地劃分的電腦軟件貨值 Table 6.2 Imports by main supplier and exports
by main destination of computer software
79
表6.3 按進口主要供應地及出口主要目的
地劃分的電訊器材貨值 Table 6.3 Imports by main supplier and exports
by main destination of telecommunications equipment
82
8. 資訊科技的教育 8. Education in Information Technology
表8.1 按修課程度劃分的大學教育資助委
員會資助的資訊科技課程的畢業生 Table 8.1 Graduates of information technology
programmes funded by University Grants Committee by level of study
92
表8.2 按修課程度劃分的大學教育資助委
員會資助的資訊科技課程的新收學
生人數
Table 8.2 Student intake of information technology programmes funded by University Grants Committee by level of study
92
表8.3 按修課程度劃分的大學教育資助委
員會資助的資訊科技課程的學生人
數
Table 8.3 Student enrolment of information technology programmes funded by University Grants Committee by level of study
93
表8.4 按院校類別及開支類別劃分的政府
在資訊科技教育及電腦科目方面的
開支
Table 8.4 Government spending on information technology education and computer subjects by type of institute and type of expenditure
94
表8.5 按小學及中學劃分的資訊科技培訓
課程數目及教師參與人數 Table 8.5 Number of information technology
(IT) courses and teachers attending those courses by primary education and secondary education
95
表8.6 按小學及中學劃分的資訊科技統籌
員人數 Table 8.6 Information technology coordinators
by primary education and secondary education
96
表8.7 以資訊科技及通訊科技輔助教學的
課程數目 Table 8.7 School curriculums with the
assistance of information and communication technologies
96
表8.8 任教資訊科技/電腦的中學教師人數 Table 8.8 Secondary school teachers teaching information technology/computer studies
96
xii
統 計 圖 一 覽 List of Charts
頁數
Page
1. 資訊科技在住戶的使用情況和普及程度 1. Information Technology Usage and Penetration in Households
圖1.1 按曾使用的電子商業服務類別劃分
的在統計前十二個月內曾使用個別
電子商業服務類別的十五歲及以上
人士的比率
Chart 1.1 Rate of persons aged 15 and over who had used various types of electronic business services in the twelve months before enumeration by type of electronic business services used
21
5. 電訊服務 5. Telecommunications Services
圖5.1 公共流動無線電話用戶系統及公共
無線電傳呼接收器數目 Chart 5.1 Number of public mobile radio-
telephone subscriber units and public radio paging receivers
69
6. 電腦產品及電訊器材的進出口
6. Imports and Exports of Computer Products and Telecommunications Equipment
圖6.1 電腦硬件的進出口貨值 Chart 6.1 Imports and exports of computer hardware
78
圖6.2 電腦軟件的進出口貨值 Chart 6.2 Imports and exports of computer software
81
圖6.3 電訊器材的進出口貨值 Chart 6.3 Imports and exports of telecommunications equipment
84
7. 資訊科技的人力資源 7. Human Resources in Information Technology
圖7.1 二零零零年三月按技能等級劃分的
資訊科技業人力結構 Chart 7.1 Manpower structure of the
information technology (IT) sector by job level, March 2000
86
圖7.2 二零零零年三月按行業分類的資訊
科技僱員分布 Chart 7.2 Distribution of information
technology (IT) employees bysector, March 2000
87

xiii
特 別 註 釋 及 代 號 Special Notes and Symbols
數字的進位 Rounding of figures 由於進位原因,統計表及統計圖內個別
項目的數字加起來可能與總數略有出入。 There may be a slight discrepancy between the sum of individual items and the total as shown in the tables and charts owing to rounding.
代號 Symbols 本刊內各代號的含意如下: The following symbols are used
throughout the publication: - 不適用 N.A. 沒有數字
- Not applicable N.A. Not available


1
第 1 章 資訊科技在住戶的使用情況和普及程度 Chapter 1 Information Technology Usage and
Penetration in Households
背景 Background 1.1 政府統計處分別在二零零零年一
月至三月期間及二零零一年四月至六月
期間,進行了兩項有關資訊科技的使用情
況和普及程度的主題性住戶統計調查。該
兩項統計調查旨在搜集有關個人電腦及
互聯網在住戶中的普及程度,以及住戶成
員使用個人電腦/互聯網服務及電子商業
服務情況的資料。
1.1 The Census and Statistics Department (C&SD) has conducted two Thematic Household Surveys on IT usage and penetration during January to March 2000 and April to June 2001 respectively to collect information on the penetration of personal computer (PC) and Internet amongst households as well as the utilisation of PC, Internet service and electronic business services amongst household members.
個人電腦及互聯網的普及程度 Penetration of personal computer (PC) and
Internet 1.2 在二零零一年統計調查中,約
1 258 400個住戶家中有個人電腦(包括桌
面電腦、便攜式/筆記簿型電腦及個人數
碼助理),佔全香港所有住戶的60.6%。當
中,約有1 009 800個住戶家中有個人電腦
(不包括個人數碼助理)接駁互聯網。換
言之,在全香港所有住戶中,有48.7%的
住戶家中有個人電腦接駁互聯網。(表 1.1)
1.2 In the 2001 Survey, some 1 258 400 households had PC (including desktop computer, laptop/notebook computer and Personal Digital Assistant (PDA)) at home at the time of enumeration, constituting 60.6% of all households in Hong Kong. Among them, some 1 009 800 households had their PC (excluding PDA) at home connected to Internet. In other words, 48.7% of all households in Hong Kong had their PC at home connected to Internet. (Table 1.1)
1.3 家中擁有個人電腦的住戶百分比
及家中有個人電腦接駁互聯網的住戶百
分比在過去兩年均顯著增加。在二零零零
年統計調查中,估計當時家中擁有個人電
腦的住戶佔全香港所有住戶的49.7%;而
當時在家中有個人電腦的住戶中,73.3%有接駁互聯網。換言之,在二零零零年的
統計調查中,估計家中有個人電腦接駁互
聯網的住戶佔當時全香港所有住戶的
36.4%,而在二零零一年統計調查中,相
應的百分比估計為48.7%。(表 1.1)
1.3 Both the percentage of households with PC at home and the percentage of households with their PC at home connected to Internet had increased significantly over the past two years. In the 2000 Survey, the survey results showed that 49.7% of the households in Hong Kong had PC at home at that time and among those households with PC at home, 73.3% had Internet connection. In other words, only 36.4% of all households had PC at home connected to Internet at the time of the 2000 Survey, as against 48.7% estimated in the 2001 Survey. (Table 1.1)

2
接駁上互聯網的方法 Mode of connection to Internet 1.4 在二零零一年統計調查中,家中的
個人電腦有接駁上互聯網的住戶中,約三
分之二(65.9%)是透過住宅電話線接駁,
而有39.4%則透過寬頻接駁上互聯網。在
二零零零年的相應數字分別為94.2%及
5.7%。(表 1.2)
1.4 In the 2001 Survey, about two-thirds (65.9%) of those households that had their PC connected to Internet were connected via household telephone line, while 39.4% did so via broadband. The corresponding figures in 2000 were 94.2% and 5.7% respectively. (Table 1.2)
曾使用個人電腦的十歲及以上人士 Persons aged 10 and over who had used PC 1.5 在二零零一年統計調查中,約
3 020 000名十歲及以上的人士在統計前
十二個月內曾使用個人電腦。十歲及以上
人士在統計前十二個月內曾使用個人電
腦的整體比率為50.3%。在二零零零年的
相應比率為43.1%。(表 1.3)
1.5 In the 2001 Survey, some 3 020 000 persons aged 10 and over had used PC in the twelve months before enumeration. The overall rate of persons having used PC in the twelve months before enumeration was 50.3% among all persons aged 10 and over. The corresponding rate in 2000 was 43.1%. (Table 1.3)
年齡及性別 Age and sex 1.6 按年齡組別分析,在二零零一年統
計調查中,十至十四歲人士在統計前十二
個月內曾使用個人電腦的比率最高,達
90.8%。緊隨的是十五至二十四歲人士
( 88.0%)及二十五至三十四歲人士
(73.6%)。年齡較長的人士使用個人電腦
的比率較低,其中五十五至六十四歲人士
的比率為8.8%,而六十五歲及以上人士的
比率則為1.2%。這分布大致與二零零零年
時的相若。(表 1.3)
1.6 Analysed by age group, persons aged 10-14 in the 2001 Survey had the highest rate of having used PC in the twelve months before enumeration, at 90.8%. This was closely followed by persons aged 15-24 (88.0%) and those aged 25-34 (73.6%). Lower rates were recorded for older persons. In particular, only 8.8% of persons aged 55-64 and 1.2% of persons aged 65 and over had used PC in the twelve months before enumeration. The profile is broadly similar to that in 2000. (Table 1.3)
1.7 在二零零一年統計調查中,男性在
統計前十二個月內曾使用個人電腦的比
率(51.7%)與女性(49.0%)的比率很相
近。兩者均高於二零零零年的相應比率,
當時的比率 分 別 為 44.1% 及 42.0% 。 (表 1.3)
1.7 In the 2001 Survey, the rates of having used PC in the twelve months before enumeration for males (51.7%) and females (49.0%) were similar. Both were higher than their corresponding rates in 2000 which were 44.1% and 42.0% respectively. (Table 1.3)

3
教育程度 Educational attainment 1.8 具有專上教育程度的人士在統計
前十二個月內曾使用個人電腦的比率最
高(在二零零一年為91.1%,相對二零零
零年為89.5%)。具有中學/預科教育程度
的人士與具有小學或以下教育程度的人
士在二零零一年的相應比率分別為60.0%(相對二零零零年的52.3%)及14.3%(相
對二零零零年的8.4%)。(表 1.4)
1.8 The rate of having used PC in the twelve months before enumeration was the highest for persons with tertiary education (91.1% in 2001, as compared to 89.5% in 2000). The corresponding rates in 2001 for those with secondary/ matriculation educational attainment and primary or lower educational attainment were 60.0% (as compared to 52.3% in 2000) and 14.3% (as compared to 8.4% in 2000) respectively. (Table 1.4)
經濟活動身分 Economic activity status 1.9 按經濟活動身分分析,學生在統計
前十二個月內曾使用個人電腦比率最高
(在二零零一年為93.3%,相對二零零零
年為81.6%)。其次為從事經濟活動人士
(在二零零一年為57.8%,相對二零零零
年為51.1%)。料理家務者及退休人士在統
計前十二個月內曾使用個人電腦的比率
較低,分別為18.0%(相對二零零零年為
12.4% )及 2.6% (相對二零零零年為
1.6%)。(表 1.5)
1.9 Analysed by economic activity status, students had the highest rate of having used PC in the twelve months before enumeration (93.3% in 2001, as compared to 81.6% in 2000). This was followed by economically active persons (57.8% in 2001, as compared to 51.1% in 2000). Home-makers and retired persons had relatively lower rates of having used PC in the twelve months before enumeration, at 18.0% (as compared to 12.4% in 2000) and 2.6% (as compared to 1.6% in 2000) respectively. (Table 1.5)
曾使用個人電腦最少每星期一次的十歲及以上人士
Persons aged 10 and over who had used PC at least once a week
1.10 在二零零一年統計調查中,在統計
前十二個月內曾使用個人電腦最少每星
期一次的十歲及以上人士中,他們每星期
使用個人電腦的平均時間為23.1小時。在
二零零零年,相應數字則為22.1小時。 (表 1.6)
1.10 In the 2001 Survey, among those persons aged 10 and over who had used PC at least once a week in the twelve months before enumeration, their average time spent in using PC per week was 23.1 hours. The corresponding figure in 2000 was 22.1 hours. (Table 1.6)
年齡 Age 1.11 按年齡組別分析,在二零零一年統
計調查中,年齡介乎二十五至三十四歲的
人士每星期使用個人電腦的時間最長,平
均為30.5小時;其次是三十五至四十四歲
人士(25.0小時)及十五至二十四歲人士
(22.4小時)。二零零零年的相應數字分別
為29.5小時、23.5小時及20.3小時。(表 1.6)
1.11 Analysed by age group, in the 2001 Survey, persons aged 25-34 spent the longest time using PC per week, with 30.5 hours on average. This was followed by persons aged 35-44 (25.0 hours) and those aged 15-24 (22.4 hours). The corresponding figures in 2000 were 29.5 hours, 23.5 hours and 20.3 hours respectively. (Table 1.6)

4
經濟活動身分 Economic activity status 1.12 按經濟活動身分分析,在二零零一
年統計調查中,從事經濟活動的人士每星
期使用個人電腦的平均時間為28.3小時;
在二零零零年,此數字則為27.2小時。至
於非從事經濟活動的人士中,學生及料理
家務者每星期使用個人電腦的平均時間
分別為12.5小時及8.9小時;在二零零零年
時的相應數字分別為10.9小時及7.8小時。(表 1.7)
1.12 Analysed by economic activity status, in the 2001 Survey, the average time spent in using PC per week of economically active persons was 28.3 hours. In 2000, the corresponding figure was 27.2 hours. Among those economically inactive persons, the average time spent in using PC per week for students and home-makers were 12.5 hours and 8.9 hours respectively. The corresponding figures in 2000 were 10.9 hours and 7.8 hours respectively. (Table 1.7)
曾使用互聯網服務的十歲及以上人士 Persons aged 10 and over who had used
Internet service 1.13 在二零零一年統計調查中,約
2 601 300名十歲及以上的人士在統計前
十二個月內曾使用互聯網服務,佔所有十
歲及以上人士的43.3%(亦即佔所有在統
計前十二個月內曾使用個人電腦的十歲
及以上人士的86.1%)。(表 1.8)
1.13 In the 2001 Survey, some 2 601 300 persons aged 10 and over had used Internet service in the twelve months before enumeration, accounting for 43.3% of all persons aged 10 and over (or 86.1% of all persons aged 10 and over who had used PC in the twelve months before enumeration). (Table 1.8)
年齡及性別 Age and sex 1.14 按年齡組別分析,十五至二十四歲
人士在統計前十二個月內曾使用互聯網
服務的比率最高(在二零零一年是
81.1%,相對二零零零年時是64.5%)。其
次是十至十四歲人士(在二零零一年是
79.4%,相對二零零零年時是43.1%)及二
十五歲至三十四歲人士(在二零零一年是
65.1%,相對二零零零年時是48.1%)。年
齡較長的人士使用互聯網服務的比率較
低,六十五歲及以上人士的比率少於1%。
(表 1.8)
1.14 Analysed by age group, persons aged 15-24 had the highest rate of having used Internet service in the twelve months before enumeration (81.1% in 2001, as compared to 64.5% in 2000). This was followed by persons aged 10-14 (79.4% in 2001, as compared to 43.1% in 2000) and persons aged 25-34 (65.1% in 2001, as compared to 48.1% in 2000). Lower rates were recorded for older persons. In particular, less than 1% of those aged 65 and over had used Internet service in the twelve months before enumeration. (Table 1.8)
1.15 在二零零一年統計調查中,男性在
統計前十二個月內曾使用互聯網服務的
比率(45.0%)較女性(41.7%)稍高。在
二零零零年時的相應比率分別為32.0%及
28.5%。(表 1.8)
1.15 In the 2001 Survey, the rate of having used Internet service in the twelve months before enumeration for males (45.0%) was slightly higher than their female counterparts (41.7%). The corresponding rates in 2000 were 32.0% and 28.5% respectively. (Table 1.8)

5
教育程度 Educational Attainment
1.16 在二零零一年統計調查中,具有專
上教育程度的人士在統計前十二個月內
曾使用互聯網服務的比率最高,為
86.9%,具有中學/預科教育程度的人士與
具有小學或以下教育程度的人士的相應
比率分別為50.1%及11.1%。(表 1.9)
1.16 In the 2001 Survey, the rate of having used Internet service in the twelve months before enumeration was the highest for persons with tertiary education, at 86.9%. The corresponding rates for those with secondary/matriculation educational attainment and primary or lower educational attainment were 50.1% and 11.1% respectively. (Table 1.9)
經濟活動身分 Economic activity status 1.17 按經濟活動身分分析,在二零零一
年統計調查中,學生在統計前十二個月內
曾使用互聯網服務的比率最高,達
84.7% 。 其 次 為 從 事 經 濟 活 動 人 士
(49.4%)。料理家務者及退休人士使用互
聯網服務的比率較低,分別為12.7%及
1.8%。(表 1.10)
1.17 Analysed by economic activity status, in the 2001 Survey, students had the highest rate of having used Internet service in the twelve months before enumeration, at 84.7%. This was followed by economically active persons (49.4%). Home-makers and retired persons had relatively lower rates of having used Internet service, at 12.7% and 1.8% respectively. (Table 1.10)
曾使用互聯網服務最少每星期一次的十歲及以上人士
Persons aged 10 and over who had used Internet service at least once a week
每星期使用互聯網服務的時間 Time spent in using Internet service per week
1.18 在二零零一年統計調查中,在統計
前十二個月內曾使用互聯網服務最少每
星期一次的十歲及以上人士中,他們每星
期使用互聯網服務的平均時間為12.1小時。在二零零零年時的相應數字是8.8小時。(表 1.11)
1.18 In the 2001 Survey, among those persons aged 10 and over who had used Internet service at least once a week in the twelve months before enumeration, their average time spent in using Internet service per week was 12.1 hours. The corresponding figure in 2000 was 8.8 hours. (Table 1.11)
年齡 Age 1.19 按年齡組別分析,在二零零一年統
計調查中,二十五至三十四歲人士每星期
平均使用互聯網服務的時間最長,他們每
星期平均使用互聯網服務14.8小時。其次
為十五至二十四歲人士(13.6小時)及三
十五至四十四歲人士( 11.3小時)。
(表 1.11)
1.19 Analysed by age group, in the 2001 Survey, persons aged 25-34 spent the longest time using Internet service per week on average. Their average time spent in using Internet service was 14.8 hours per week. This was followed by persons aged 15-24 (13.6 hours) and those aged 35-44 (11.3 hours). (Table 1.11)

6
曾使用電子商業服務的十五歲及以上人士
Persons aged 15 and over who had used electronic business services
1.20 在二零零零及二零零一統計調查
中,十五歲及以上人士被問及他們在統計
前十二個月內有否為個人事務而使用下
列各項電子商業服務:
1.20 In the 2000 and 2001 Surveys, persons aged 15 and over were asked whether they had used the following types of electronic business services for personal matters in the twelve months before enumeration:
透過自動櫃員機提款、存款、轉賬
或查詢戶口結餘 Withdrawing/depositing/transferring money or
checking account balance via Automatic Teller Machine (ATM)
透過自動櫃員機繳費 Settling payment by ATM 使用電話透過「繳費聆」服務繳費
Using telephone to settle payment by Payment
by Phone Service (PPS)
使用電子現金/易辦事服務 Using e-cash/Easy Pay System (EPS)
使用八達通咭 Using Octopus card
透過自動電話接聽系統購物或獲
取服務 Purchasing goods or acquiring services via
Interactive Voice Response System (IVRS)
透過流動電訊網絡以互動短訊服
務方式進行交易或獲取服務(例
如:銀行服務、股票報價等)
Making transactions or acquiring services via interactive short message services of mobile telecommunications network (e.g. banking services, checking stock prices, etc.)
上網搜尋財經資料(例如:股票價
格) Searching for financial information online
(e.g. stock prices)
上網搜尋貨物/服務資料 Searching for information on goods/services online
上網搜尋職位空缺資料 Searching for job vacancies online
上網買賣股票 Trading stock online
上網訂座/訂票 Making reservation/booking tickets online
上網購買/訂購貨物及服務 Purchasing/ordering goods and services online
使用網上拍賣服務 Using auction service online
使用網上銀行服務(例如:轉賬) Using cyber-banking services (e.g. transferring money)
上網繳費 Settling payment online
上網要求客戶服務(例如:安排送
貨) Requesting customer services online
(e.g. arranging product delivery)
1.21 在二零零一年統計調查中,約
4 933 600名十五歲及以上人士在統計前
十二個月內曾為個人事務而使用一項或
多項上述的電子商業服務,佔全港所有十
五歲及以上人士的88.5%。(表 1.12)
1.21 In the 2001 Survey, some 4 933 600 persons aged 15 and over had used one or more types of the above-mentioned electronic business services for personal matters in the twelve months before enumeration, constituting 88.5% of all persons aged 15 and over in Hong Kong. (Table 1.12)

7
曾使用的電子商業服務類別 Type of electronic business services used 1.22 在二零零一年統計調查中,約
4 687 700人在統計前十二個月內曾使用
八達通咭,佔所有十五歲及以上人士的
84.1%。其他較普遍被使用的電子商業服
務為「透過自動櫃員機提款、存款、轉賬
或查詢戶口結餘」(63.5%)、「使用電子現
金/易辦事服務」(31.4%)及「使用電話
透過繳費聆服務繳費」(21.0%)。曾使用
電子商業服務的分布大致與二零零零年
時的相若。(表 1.12 及圖 1.1)
1.22 In the 2001 Survey, some 4 687 700 persons had used the Octopus card in the twelve months before enumeration, accounting for 84.1% of all persons aged 15 and over. The other commonly used electronic business services were “withdrawing/depositing/transferring money or checking account balance via ATM” (63.5%), “using e-cash/EPS” (31.4%) and “using telephone to settle payment by PPS” (21.0%). The distribution is broadly similar to that in 2000. (Table 1.12 and Chart 1.1)
教育程度 Educational attainment
1.23 十五歲及以上人士在統計前十二
個月內曾使用電子商業服務的比率隨
教育程度增加。在二零零一年統計調查
中,具有小學或以下教育程度人士的比率
為70.7%,具有中學/預科教育程度人士的
比率為95.2%,而具有專上教育程度人士
的比率則為98.9%。(表 1.13)
1.23 The rate of persons aged 15 and over having used electronic business services in the twelve months before enumeration increased with educational attainment. In the 2001 Survey, it was 70.7% for persons with primary or lower educational attainment, 95.2% for those with secondary/matriculation educational attainment and 98.9% for those with tertiary educational attainment. (Table 1.13)
經濟活動身分 Economic activity status
1.24 在二零零一年統計調查中,約三分
之二(68.2%)在統計前十二個月內曾使
用電子商業服務的人士為從事經濟活動
人士。另外有12.2%為料理家務者;8.6%為退休人士及8.3%為學生。曾使用電子商
業服務的比率以從事經濟活動人士
(96.0%)及學生(94.3%)較高。(表 1.14)
1.24 In the 2001 Survey, about two-thirds (68.2%) of the persons who had used electronic business services in the twelve months before enumeration were economically active. Another 12.2% were home-makers, 8.6% were retired persons and 8.3% were students. The rates of having used electronic business services were relatively higher for economically active persons (96.0%) and students (94.3%). (Table 1.14)
8
認識「公共服務電子化計劃」的十五歲及以上人士
Persons age 15 and over who were aware of the ESD scheme
1.25 政府在二零零零年十二月推出「公
共服務電子化計劃」,透過互聯網及其他
電子方式提供公共服務予市民。有見及
此,在二零零零年及二零零一年統計調查
中,所有十五歲及以上的人士均被問及他
們是否認識此項計劃。在二零零一年統計
調查中,對該計劃有所認識的人士再被問
及他們曾否使用該計劃所包括的服務。
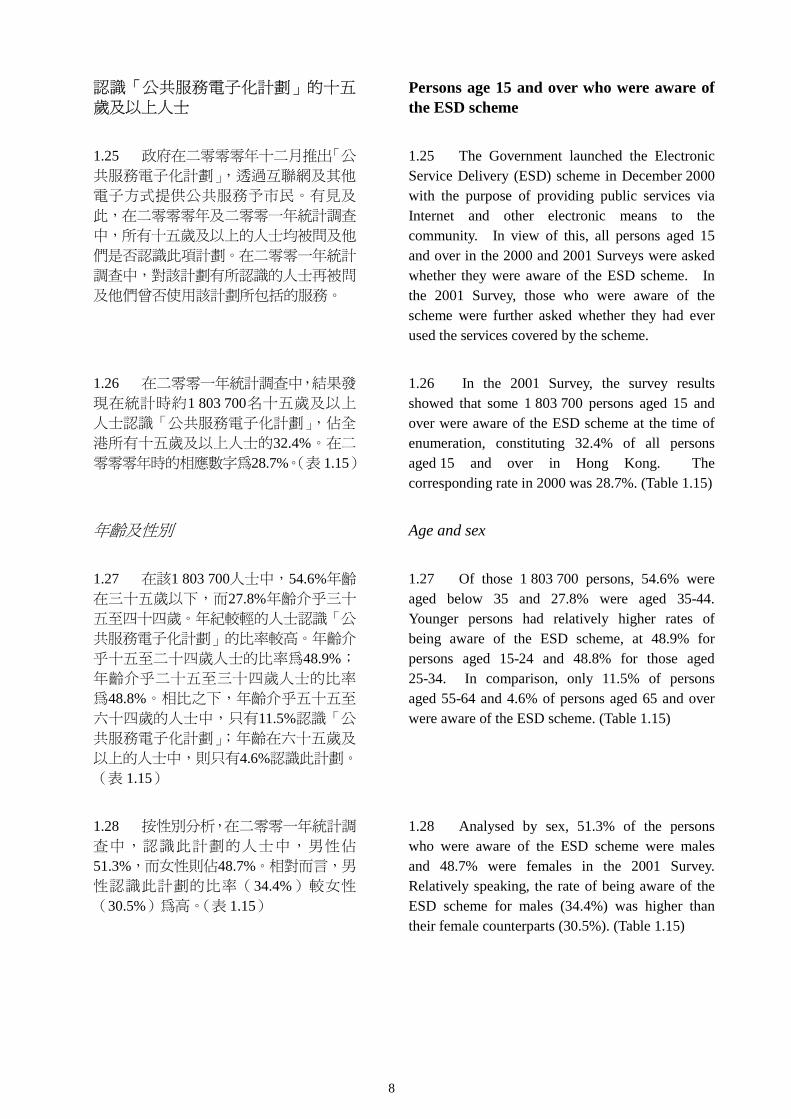
1.25 The Government launched the Electronic Service Delivery (ESD) scheme in December 2000 with the purpose of providing public services via Internet and other electronic means to the community. In view of this, all persons aged 15 and over in the 2000 and 2001 Surveys were asked whether they were aware of the ESD scheme. In the 2001 Survey, those who were aware of the scheme were further asked whether they had ever used the services covered by the scheme.
1.26 在二零零一年統計調查中,結果發
現在統計時約1 803 700名十五歲及以上
人士認識「公共服務電子化計劃」,佔全
港所有十五歲及以上人士的32.4%。在二
零零零年時的相應數字為28.7%。(表 1.15)
1.26 In the 2001 Survey, the survey results showed that some 1 803 700 persons aged 15 and over were aware of the ESD scheme at the time of enumeration, constituting 32.4% of all persons aged 15 and over in Hong Kong. The corresponding rate in 2000 was 28.7%. (Table 1.15)
年齡及性別 Age and sex
1.27 在該1 803 700人士中,54.6%年齡
在三十五歲以下,而27.8%年齡介乎三十
五至四十四歲。年紀較輕的人士認識「公
共服務電子化計劃」的比率較高。年齡介
乎十五至二十四歲人士的比率為48.9%;
年齡介乎二十五至三十四歲人士的比率
為48.8%。相比之下,年齡介乎五十五至
六十四歲的人士中,只有11.5%認識「公
共服務電子化計劃」;年齡在六十五歲及
以上的人士中,則只有4.6%認識此計劃。
(表 1.15)
1.27 Of those 1 803 700 persons, 54.6% were aged below 35 and 27.8% were aged 35-44. Younger persons had relatively higher rates of being aware of the ESD scheme, at 48.9% for persons aged 15-24 and 48.8% for those aged 25-34. In comparison, only 11.5% of persons aged 55-64 and 4.6% of persons aged 65 and over were aware of the ESD scheme. (Table 1.15)
1.28 按性別分析,在二零零一年統計調
查中,認識此計劃的人士中,男性佔
51.3%,而女性則佔48.7%。相對而言,男
性認識此計劃的比率(34.4%)較女性
(30.5%)為高。(表 1.15)
1.28 Analysed by sex, 51.3% of the persons who were aware of the ESD scheme were males and 48.7% were females in the 2001 Survey. Relatively speaking, the rate of being aware of the ESD scheme for males (34.4%) was higher than their female counterparts (30.5%). (Table 1.15)

9
曾否使用「公共服務電子化計劃」所包括的服務
Whether had used the services covered by the ESD scheme
1.29 由於二零零一年統計調查是在「公
共服務電子化計劃」推出只數月後進行,
所以在該1 803 700名認識該計劃的人士
中,只有3.9%過往曾使用該計劃所包括的
服務。他們當中,最普遍提及曾使用的服
務類別為「詢問服務」(46.6%),其次為
「求職及招聘」(30.6%)及「電子理財」
(23.7%)。(表 1.16)
1.29 As the 2001 survey was conducted only several months after the launching of the ESD scheme, only 3.9% of the 1 803 700 persons who were aware of the ESD scheme had ever used the services covered by the scheme. Among them, the most commonly cited type of services used was “enquiry services” (46.6%), followed by “job seeking and recruitment” (30.6%) and “financial management” (23.7%). (Table 1.16)

10
表 1.1 家中有個人電腦及家中有個人電腦接駁互聯網的住戶 Table 1.1 Households with personal computer (PC) at home and with PC at home connected to Internet
訪問期間 Enquiry period
家中有個人電腦@
的住戶數目
No. of households with PC@ at home
(’000)比率*Rate*
家中有個人電腦接駁互聯網的住戶數目
No. of households with PC at home connected to Internet
(’000)比率* Rate*
二零零零年一月至三月 Jan – Mar 2000
1 051.1 49.7 770.2(73.3)
36.4
二零零一年四月至六月 Apr – Jun 2001
1 258.4 60.6 1 009.8(80.4)**
48.7**
註釋: 括號內的數字是指佔家中有個人電腦的住戶的百分比。 @ 個人電腦包括桌面電腦、便攜式/筆記簿型電腦及個人數碼助理。 * 在有關訪問期間佔所有住戶的百分比。 ** 不包括住戶成員只使用個人數碼助理接駁互聯網的住戶。
Notes: Figures in brackets denote the percentage share of households with PC at home. @ PC includes desktop computer, laptop/notebook computer and Personal Digital Assistant (PDA). * As a percentage of all households in the respective enquiry periods. ** Excluding households with household members using only the Personal Digital Assistant (PDA) for connection
to Internet.
資料來源: 政府統計處社會統計調查組 Source: Social Surveys Section, Census and Statistics Department

11
表 1.2 按接駁上互聯網的方法劃分的家中有個人電腦接駁上互聯網的住戶 Table 1.2 Households with personal computer (PC) at home connected to Internet by mode of connection to
Internet
2000 2001#
接駁上互聯網的方法 Mode of connection to Internet
住戶數目No. of households
(’000)百分比
%
住戶數目No. of households
(’000)百分比
%
透過住宅電話線 Via household telephone line
725.7 94.2 665.4 65.9
透過寬頻 Via broadband
43.7 5.7 397.7 39.4
透過流動電話網絡(例如:流動電話) Via mobile telecommunications network (e.g. mobile phones)
3.4 0.3
其他 Others
0.8 0.10.8 0.1
合計 Overall
770.2 1 009.8
註釋: # 在二零零一年調查中,回應接駁上互聯網的方法可選擇多項答案。 Note: # Multiple answers were allowed in response to the mode of connection to Internet in the 2001 survey.
資料來源: 政府統計處社會統計調查組 Source: Social Surveys Section, Census and Statistics Department

12
表 1.3 按年齡組別及性別劃分的在統計前十二個月內曾使用個人電腦的十歲及以上人士 Table 1.3 Persons aged 10 and over who had used personal computer (PC) in the twelve months before
enumeration by age group and sex
2000 2001
男 Male
女 Female
合計 Overall
男 Male
女 Female
合計 Overall
年齡組別 Age group
人數 No. of
persons (’000)
比率* Rate*
人數 No. of
persons (’000)
比率* Rate*
人數No. of
persons(’000)
比率*Rate*
人數No. of
persons(’000)
比率*Rate*
人數 No. of
persons (’000)
比率* Rate*
人數No. of
persons(’000)
比率*Rate*
10 – 14 155.8 73.0 147.8 72.6 303.6 72.8 201.6 91.1 188.6 90.5 390.2 90.8
15 – 24 339.2 76.1 374.8 81.7 713.9 78.9 391.1 86.0 415.6 90.1 806.7 88.0
25 – 34 348.2 63.6 407.1 66.2 755.3 65.0 364.7 74.1 446.2 73.2 810.9 73.6
35 – 44 347.1 48.6 286.0 40.4 633.0 44.5 356.7 55.3 349.0 49.0 705.6 52.0
45 – 54 127.5 25.2 66.8 14.6 194.4 20.2 153.5 31.3 99.8 21.0 253.3 26.2
55 – 64 25.9 9.1 9.1 3.7 35.0 6.6 32.6 12.1 11.7 5.0 44.2 8.8
≥ 65 3.6 1.0 0.8 0.2 4.4 0.6 6.4 1.9 2.6 0.7 8.9 1.2
合計 Overall
1 347.3 44.1 1 292.4 42.0 2 639.7 43.1 1 506.5 51.7 1 513.5 49.0 3 020.0 50.3
註釋: *
在個別年齡組別及性別分組中佔該組別所有人士的百分比。以二零零零年所有十至十四歲的男性為例,73.0%在統計前十二個月內曾使用個人電腦。
Note: * As a percentage of all persons in the respective age and sex sub-groups. For example, among all males aged 10–14 in 2000, 73.0% had used PC in the twelve months before enumeration.
資料來源: 政府統計處社會統計調查組 Source: Social Surveys Section, Census and Statistics Department

13
表 1.4 按教育程度劃分的在統計前十二個月內曾使用個人電腦的十歲及以上人士 Table 1.4 Persons aged 10 and over who had used personal computer (PC) in the twelve months before
enumeration by educational attainment
2000 2001
教育程度 Educational attainment
人數No. of persons
(’000)比率*Rate*
人數No. of persons
(’000)比率*Rate*
未受教育/幼稚園/小學 No schooling/kindergarten/primary
166.8 8.4 268.7 14.3
中學/預科 Secondary/matriculation
1 727.0 52.3 1 941.5 60.0
專上教育 Tertiary
745.9 89.5 809.8 91.1
合計 Overall
2 639.7 43.1 3 020.0 50.3
註釋: * 在個別教育程度組別中佔該組別所有十歲及以上人士的百分比。以二零零零年所有具有專上教育程度人
士為例,89.5%在統計前十二個月內曾使用個人電腦。 Note: * As a percentage of all persons aged 10 and over in the respective educational attainment groups. For
example, among all persons with tertiary educational attainment in 2000, 89.5% had used PC in the twelve months before enumeration.
資料來源: 政府統計處社會統計調查組 Source: Social Surveys Section, Census and Statistics Department

14
表 1.5 按經濟活動身分劃分的在統計前十二個月內曾使用個人電腦的十歲及以上人士 Table 1.5 Persons aged 10 and over who had used personal computer (PC) in the twelve months before
enumeration by economic activity status
2000 2001
經濟活動身分 Economic activity status
人數No. of persons
(’000)比率*Rate*
人數No. of persons
(’000)比率*Rate*
從事經濟活動+ Economically active+
1 795.4 51.1 2 027.9 57.8
非從事經濟活動 Economically inactive
844.3 32.3 992.1 39.7
學生 Students
714.3 81.6 807.3 93.3
退休人士 Retired persons
13.0 1.6 19.0 2.6
料理家務者 Home-makers
110.1 12.4 129.3 18.0
其他 Others
7.0 15.4 36.6 20.3
合計 Overall
2 639.7 43.1 3 020.0 50.3
註釋: * 在個別經濟活動身分組別中佔該組別所有十歲及以上人士的百分比。以二零零零年所有從事經濟活動人
士為例,51.1 %在統計前十二個月內曾使用個人電腦。 + 從事經濟活動人士包括就業人士及失業人士。
Notes: * As a percentage of all persons aged 10 and over in the respective economic activity status groups. For example, among all economically active persons in 2000, 51.1% had used PC in the twelve months before enumeration.
+ Economically active persons comprise employed persons and unemployed persons.
資料來源: 政府統計處社會統計調查組 Source: Social Surveys Section, Census and Statistics Department

15
表 1.6 按年齡組別劃分的在統計前十二個月內曾使用個人電腦最少每星期一次的十歲及以上人士每星期使用個人電腦的平均時間
Table 1.6 Average duration of time spent in using personal computer (PC) per week of persons aged 10 and over who had used PC at least once a week in the twelve months before enumeration by age group
每星期使用個人電腦的平均時間(小時) Average duration (hours) of time spent in using PC per week
年齡組別 Age group 2000 2001
10 – 14 6.3 7.9
15 – 24 20.3 22.4
25 – 34 29.5 30.5
35 – 44 23.5 25.0
45 – 54 19.7 21.3
≥ 55 15.8 15.2
合計 Overall
22.1 23.1
資料來源: 政府統計處社會統計調查組 Source: Social Surveys Section, Census and Statistics Department
表 1.7 按經濟活動身分劃分的在統計前十二個月內曾使用個人電腦最少每星期一次的十歲及以上人士每星期使用個人電腦的平均時間
Table 1.7 Average duration of time spent in using personal computer (PC) per week of persons aged 10 and over who had used PC at least once a week in the twelve months before enumeration by economic activity status
每星期使用個人電腦的平均時間(小時) Average duration (hours) of time spent in using PC per week
經濟活動身分 Economic activity status 2000 2001
從事經濟活動人士+ Economically active persons+
27.2 28.3
非從事經濟活動人士 Economically inactive persons
學生 Students
10.9 12.5
料理家務者 Home-makers
7.8 8.9
其他 Others
13.6 14.1
合計 Overall
22.1 23.1
註釋: + 從事經濟活動人士包括就業人士及失業人士。 Note: + Economically active persons comprise employed persons and unemployed persons.
資料來源: 政府統計處社會統計調查組 Source: Social Surveys Section, Census and Statistics Department

16
表 1.8 按年齡組別及性別劃分的在統計前十二個月內曾使用互聯網服務的十歲及以上人士 Table 1.8 Persons aged 10 and over who had used Internet service in the twelve months before enumeration
by age group and sex
2000 2001
男 Male
女 Female
合計 Total
男 Male
女 Female
合計 Total
年齡組別 Age group
人數 No. of
persons (’000)
比率* Rate*
人數
No. of persons
(’000)比率*Rate*
人數No. of
persons(’000)
比率*Rate*
人數No. of
persons(’000)
比率*Rate*
人數No. of
persons(’000)
比率*Rate*
人數No. of
persons(’000)
比率*Rate*
10 – 14 89.8 42.1 90.1 44.3 179.9 43.1 172.5 77.9 168.8 81.0 341.2 79.4
15 – 24 279.1 62.6 304.3 66.3 583.4 64.5 353.5 77.7 389.5 84.4 743.0 81.1
25 – 34 275.0 50.2 284.7 46.3 559.7 48.1 329.0 66.8 388.1 63.7 717.1 65.1
35 – 44 240.0 33.6 162.4 23.0 402.4 28.3 307.1 47.6 266.9 37.5 574.0 42.3
45 – 54 79.3 15.7 31.8 6.9 111.1 11.5 122.3 24.9 67.5 14.2 189.8 19.6
55 – 64 13.6 4.8 3.5 1.4 17.1 3.2 23.1 8.6 6.7 2.9 29.8 6.0
≥ 65 1.7 0.5 - - 1.7 0.2 4.4 1.3 1.8 0.5 6.2 0.8
合計 Overall
978.5 32.0 876.7 28.5 1 855.2 30.3 1 311.8 45.0 1 289.5 41.7 2 601.3 43.3
註釋: *
在個別年齡組別及性別分組中佔該組別所有人士的百分比。以二零零零年所有十至十四歲的男性為例,42.1%在統計前十二個月內曾使用互聯網服務。
Note: * As a percentage of all persons in the respective age and sex sub-groups. For example, among all males aged 10–14 in 2000, 42.1% had used Internet service in the twelve months before enumeration.
資料來源: 政府統計處社會統計調查組 Source: Social Surveys Section, Census and Statistics Department

17
表 1.9 按教育程度劃分的在統計前十二個月內曾使用互聯網服務的十歲及以上人士 Table 1.9 Persons aged 10 and over who had used Internet service in the twelve months before enumeration
by educational attainment
2000 2001
教育程度 Educational attainment
人數No. of persons
(’000)比率*Rate*
人數No. of persons
(’000)比率*Rate*
未受教育/幼稚園/小學 No schooling/kindergarten/primary
66.6 3.3 207.4 11.1
中學/預科 Secondary/matriculation
1 135.2 34.4 1 621.5 50.1
專上教育 Tertiary
653.4 78.5 772.4 86.9
合計 Overall
1 855.2 30.3 2 601.3 43.3
註釋: * 在個別教育程度組別中佔該組別所有十歲及以上人士的百分比。以二零零零年所有具有專上教育程度的
人士為例,78.5%在統計前十二個月內曾使用互聯網服務。 Note: * As a percentage of all persons aged 10 and over in the respective educational attainment groups. For
example, among all persons with tertiary educational attainment in 2000, 78.5% had used Internet service in the twelve months before enumeration.
資料來源: 政府統計處社會統計調查組 Source: Social Surveys Section, Census and Statistics Department

18
表 1.10 按經濟活動身分劃分的在統計前十二個月內曾使用互聯網服務的十歲及以上人士 Table 1.10 Persons aged 10 and over who had used Internet service in the twelve months before
enumeration by economic activity status
2000 2001
經濟活動身分 Economic activity status
人數No. of persons
(’000)比率*Rate*
人數No. of persons
(’000)比率*Rate*
從事經濟活動+ Economically active+
1 251.6 35.6 1 732.8 49.4
非從事經濟活動 Economically inactive
603.6 23.1 868.4 34.8
學生 Students
532.3 60.8 733.3 84.7
退休人士 Retired persons
5.9 0.7 13.4 1.8
料理家務者 Home-makers
60.4 6.8 91.5 12.7
其他 Others
5.0 11.2 30.2 16.8
合計 Overall
1 855.2 30.3 2 601.3 43.3
註釋: * 在個別經濟活動身分組別中佔該組別所有十歲及以上人士的百分比。以二零零零年所有從事經濟活動人
士為例,35.6 %在統計前十二個月內曾使用互聯網服務。 + 從事經濟活動人士包括就業人士及失業人士。
Notes: * As a percentage of all persons aged 10 and over in the respective economic activity status groups. For example, among all economically active persons in 2000, 35.6% had used Internet service in the twelve monthsbefore enumeration.
+ Economically active persons comprise employed persons and unemployed persons.
資料來源: 政府統計處社會統計調查組 Source: Social Surveys Section, Census and Statistics Department

19
表 1.11 按年齡組別劃分的在統計前十二個月內曾使用互聯網服務最少每星期一次的十歲及以上人士每星期使用互聯網服務的平均時間
Table 1.11 Average duration of time spent in using Internet service per week of persons aged 10 and over who had used Internet service at least once a week in the twelve months before enumeration by age group
每星期使用互聯網服務的平均時間(小時) Average duration (hours) of time spent in using Internet service per week
年齡組別 Age group 2000 2001
10 – 14 3.5 5.1
15 – 24 9.2 13.6
25 – 34 10.2 14.8
35 – 44 8.6 11.3
45 – 54 8.2 10.3
≥ 55 9.0 8.5
合計 Overall
8.8 12.1
資料來源: 政府統計處社會統計調查組 Source: Social Surveys Section, Census and Statistics Department

20
表 1.12 按曾使用的電子商業服務類別劃分的在統計前十二個月內曾使用電子商業服務的十五歲及 以上人士
Table 1.12 Persons aged 15 and over who had used electronic business services in the twelve months before enumeration by type of electronic business services used
2000 2001
曾使用的電子商業服務類別# Type of electronic business services used#
人數No. of persons
(’000)比率*Rate*
人數 No. of persons
(’000) 比率*Rate*
使用八達通咭 Using Octopus card
4 510.7 78.9 4 687.7 84.1
透過自動櫃員機提款、存款、轉賬或查詢戶口結餘 Withdrawing/depositing/transferring money or checking account balance via Automatic Teller Machine (ATM)
3 676.4 64.3 3 540.2 63.5
使用電子現金/易辦事服務 Using e-cash/Easy Pay System (EPS)
1 978.8 34.6 1 752.0 31.4
使用電話透過「繳費聆」服務繳費 Using telephone to settle payment by Payment by Phone Service (PPS)
1 115.0 19.5 1 168.2 21.0
透過自動電話接聽系統購物或獲取服務 Purchasing goods or acquiring services via Interactive Voice Response System (IVRS)
1 114.5 19.5 1 112.1 20.0
透過自動櫃員機繳費 Settling payment by ATM
769.7 13.5 1 085.8 19.5
上網搜尋職位空缺資料 Searching for job vacancies online
188.1 3.3 396.9 7.1
上網搜尋財經資料(例如:股票價格) Searching for financial information online (e.g. stock prices)
264.5 4.6 390.8 7.0
使用網上銀行服務(例如:轉帳) Using cyber-banking services (e.g. transferring money)
39.3 0.7 281.5 5.1
上網搜尋貨物/服務資料 Searching for information on goods/services online
228.7 4.0 254.2 4.6
上網購買/訂購貨物及服務 Purchasing/ordering goods and services online
105.1 1.8 190.4 3.4
上網繳費 Settling payment online
32.4 0.6 177.0 3.2
上網訂座/訂票 Making reservation/booking tickets online
66.1 1.2 163.6 2.9
透過流動電訊網絡以互動短訊服務方式進行交易或獲取服務(例如:銀行服務、股票報價等) Making transactions or acquiring services via interactive short message services of mobile telecommunications network (e.g. banking services, checking stock prices, etc.)
N.A. N.A. 156.6 2.8
上網要求客戶服務(例如:安排送貨) Requesting customer services online (e.g. arranging product delivery )
29.3 0.5 83.7 1.5
上網買賣股票 Trading stock online
40.8 0.7 82.7 1.5
使用網上拍賣服務 Using auction service online
33.3 0.6 67.9 1.2
合計 Overall
4 852.1 84.9 4 933.6 88.5
註釋: # 可選擇多項答案。 * 佔所有十五歲及以上人士的百分比。 Notes: # Multiple answers were allowed. * As a percentage of all persons aged 15 and over.
資料來源: 政府統計處社會統計調查組 Source: Social Surveys Section, Census and Statistics Department

21
19.5%
20.0%
21.0%
31.4%
63.5%
84.1%
13.5%
19.5%
19.5%
34.6%
64.3%
78.9%
0% 10% 20% 30% 40% 50% 60% 70% 80% 90% 100%
曾使用的電子商業服務類別 Type of electronic business services used
2000 2001
圖 1.1 按曾使用的電子商業服務類別劃分的在統計前十二個月內曾使用個別電子商業服務類別的十五歲及以上人士的比率
Chart 1.1 Rate of persons aged 15 and over who had used various types of electronic business services in thetwelve months before enumeration by type of electronic business services used
註釋: * 佔所有十五歲及以上人士的百分比。 Note: * As a percentage of all persons aged 15 and over.
資料來源: 政府統計處社會統計調查組 Source: Social Surveys Section, Census and Statistics Department
使用八達通咭Using Octopus card
透過自動櫃員機提款、存款、轉賬或查詢戶口結餘
Withdrawing/depositing/transferring money or checking
account balance via ATM
使用電子現金/易辦事服務Using e-cash/EPS
使用電話透過「繳費聆」服務繳費
Using telephone to settle payment by PPS
透過自動電話接聽系統購物或獲取服務
Purchasing goods or acquiring services via Interactive Voice
Response System (IVRS)
透過自動櫃機繳費Settling payments by ATM
十五歲及以上人士的比率* Rate of persons aged 15 and over*

22
表 1.13 按教育程度劃分的在統計前十二個月內曾使用電子商業服務的十五歲及以上人士 Table 1.13 Persons aged 15 and over who had used electronic business services in the twelve months before
enumeration by educational attainment
2000 2001
教育程度 Educational attainment
人數No. of persons
(’000)比率*Rate*
人數No. of persons
(’000)比率*Rate*
未受教育/幼稚園/小學 No schooling/kindergarten/primary
1 138.9 63.3 1 161.3 70.7
中學/預科 Secondary/matriculation
2 892.7 93.9 2 893.3 95.2
專上教育 Tertiary
820.4 98.5 878.9 98.9
合計 Overall
4 852.1 84.9 4 933.6 88.5
註釋: * 在個別教育程度組別中佔該組別所有十五歲及以上人士的百分比。以二零零零年所有具有專上教育程度
的人士為例,98.5%在統計前十二個月內曾使用電子商業服務。 Note: * As a percentage of all persons aged 15 and over in the respective educational attainment groups. For
example, among all persons with tertiary educational attainment in 2000, 98.5% had used electronic business services in the twelve months before enumeration.
資料來源: 政府統計處社會統計調查組 Source: Social Surveys Section, Census and Statistics Department

23
表 1.14 按經濟活動身分劃分的在統計前十二個月內曾使用電子商業服務的十五歲及以上人士 Table 1.14 Persons aged 15 and over who had used electronic business services in the twelve months
before enumeration by economic activity status
2000 2001
經濟活動身分 Economic activity status
人數No. of persons
(’000)比率*Rate*
人數No. of persons
(’000)比率*Rate*
從事經濟活動+ Economically active+
3 308.0 94.1 3 364.5 96.0
非從事經濟活動 Economically inactive
1 544.1 70.2 1 569.1 75.9
學生 Students
423.1 92.2 410.9 94.3
退休人士 Retired persons
397.8 49.1 425.9 58.3
料理家務者 Home-makers
701.2 79.1 601.4 83.6
其他 Others
22.0 49.2 130.9 72.8
合計 Overall
4 852.1 84.9 4 933.6 88.5
註釋: * 在個別經濟活動身分組別中佔該組別所有十五歲及以上人士的百分比。以二零零零年所有從事經濟活動
人士為例,94.1%在統計前十二個月內曾使用電子商業服務。 + 從事經濟活動人士包括就業人士及失業人士。
Notes: * As a percentage of all persons aged 15 and over in the respective economic activity status groups. For example, among all economically active persons in 2000, 94.1% had used electronic business services in the twelve months before enumeration.
+ Economically active persons comprise employed persons and unemployed persons.
資料來源: 政府統計處社會統計調查組 Source: Social Surveys Section, Census and Statistics Department

24
表 1.15 按年齡組別/性別劃分的認識「公共服務電子化計劃」的十五歲及以上人士 Table 1.15 Persons aged 15 and over who were aware of the Electronic Service Delivery (ESD) scheme by
age group/sex
2000 2001
年齡組別/性別 Age group/sex
人數No. of persons
(’000)比率*Rate*
人數No. of persons
(’000)比率*Rate*
年齡組別 Age group
15 – 24 300.9 33.3 447.9 48.9
25 – 34 453.3 39.0 537.2 48.8
35 – 44 495.0 34.8 501.0 36.9
45 – 54 238.8 24.8 226.4 23.4
55 – 64 88.5 16.7 57.5 11.5
≥ 65 63.3 8.6 33.7 4.6
性別 Sex
男 Male
903.5 31.8 926.1 34.4
女 Female
736.2 25.6 877.6 30.5
合計 Overall
1 639.7 28.7 1 803.7 32.4
註釋: * 在個別年齡組別/性別分組中佔該組別所有人士的百分比。以二零零零年所有十五至二十四歲的人士為
例,33.3%認識「公共服務電子化計劃」。 Note: * As a percentage of all persons in the respective age/sex groups. For example, among all persons aged 15–24
in 2000, 33.3% were aware of the ESD scheme.
資料來源: 政府統計處社會統計調查組 Source: Social Surveys Section, Census and Statistics Department

25
表 1.16 二零零一年按曾否使用「公共服務電子化計劃」所包括的服務/曾使用的服務類別劃分的認識「公共服務電子化計劃」的十五歲及以上人士
Table 1.16 Persons aged 15 and over who were aware of the Electronic Service Delivery (ESD) scheme by whether had used the services covered by the ESD scheme/type of services used, 2001
曾否使用「公共服務電子化計劃」所包括的服務/ 曾使用的服務類別 #
Whether had used the services covered by the ESD scheme/type of services used #
人數No. of persons
(’000)百分比
%
有 Yes
71.1 3.9
詢問服務 Enquiry services
33.2 (46.6)
求職及招聘 Job seeking and recruitment
21.7 (30.6)
電子理財 Financial management
16.8 (23.7)
申請牌照 / 證書 Application for licences/certificates
12.0 (16.8)
預約申請 Appointment booking
8.7 (12.2)
登記服務 Registration
8.5 (12.0)
更改個人資料 Change of personal particulars
6.3 (8.8)
商業管理 Business management
4.4 (6.2)
沒有 No
1 732.6 96.1
總計 Total
1 803.7 100.0
註釋: # 可選擇多項答案。 括號內的數字顯示在所有曾使用「公共服務電子化計劃」所包括的服務的十五歲及以上人士中所佔的百
分比。
Notes: # Multiple answers were allowed. Figures in brackets represent the percentages in respect of all persons aged 15 and over who had used the
services covered by the ESD scheme.
資料來源: 政府統計處社會統計調查組 Source: Social Surveys Section, Census and Statistics Department


27
第 2 章 資訊科技在工商業的使用情況和普及程度 Chapter 2 Information Technology Usage and
Penetration in the Business Sector
背景 Background 2.1 政府統計處於二零零零年三月至
六月及二零零一年四月至六月進行了兩
次有關資訊科技在工商業的使用情況和
普及程度的統計調查。本章內大部分的數
據均摘錄自這兩次統計調查。在適合情況
下,兩次統計調查的結果會作出比較。
2.1 The Census and Statistics Department (C&SD) has conducted two surveys on Information Technology Usage and Penetration in the Business Sector in March to June 2000 and in April to June 2001. Almost all the data given in this chapter are extracted from the two surveys. Comparisons of findings from these two surveys would be given where appropriate.
統計調查的範圍 Survey coverage 2.2 這兩次統計調查以政府統計處備
存的機構單位紀錄庫為抽樣框。此紀錄庫
是根據稅務局商業登記處的資料更新。統
計調查所涵蓋的行業以「香港標準行業分
類」(HSIC)作為分類依據。「香港標準行
業分類」則是根據聯合國「國際標準產業
分類」加以修訂而成。這兩次統計調查涵
蓋下列行業的機構單位︰
2.2 The sampling frame for the two surveys is the Central Register of Establishments, which is a comprehensive register maintained by the C&SD and updated by reference to records of the Business Registration Office of the Inland Revenue Department. Industries covered in the surveys are classified according to the “Hong Kong Standard Industrial Classification” (HSIC) which is an adapted version of the United Nation’s “International Standard Industrial Classification”. The two surveys cover establishments engaged in the following sectors:
行業類別
(HSIC) 包括的行業 Industry Sector
(HSIC) Sectors covered
3 製造業 3 Manufacturing 4 電力及燃氣業 4 Electricity and gas 5 建造業 5 Construction 6 批發、零售、進出口貿易、
飲食及酒店業 6 Wholesale, retail and
import/export trades, restaurants and hotels
7 運輸、倉庫及通訊業 7 Transport, storage and communications
8 金融、保險、地產及 商用服務業
8 Financing, insurance, real estate and business services
9 社區、社會及個人服務業 9 Community, social and personal services

28
2.3 在這兩次統計調查中,機構單位按
照下表分為小型、中型及大型︰ 2.3 In the two surveys, establishments are categorised into small, medium and large as follows:
就業人數
No. of persons engaged 機構單位規模 Size of establishments
經濟活動 Economic activity
小型 Small
中型 Medium
大型 Large
製造業(行業類別 3) Manufacturing (Industry Sector 3)
< 10 10 – 99 ≧100
非製造業(行業類別 4 至 9) Non-manufacturing (Industry Sectors 4-9)
< 10 10 – 49 ≧50
機構單位的特徵 Characteristics of establishments 2.4 在二零零一年統計調查中,統計調
查範圍內的機構單位估計有335 000間。按
行業類別分析,過半數(177 000)的機構
單位從事批發、零售、進出口貿易、飲食
及酒店業。約88.6%為小型機構單位。機
構單位的分布大致與二零零零年相若。
(表 2.1)
2.4 In the 2001 Survey, a total of 335 000 establishments were estimated to fall within the scope of the survey. Analysed by industry sector, over half (177 000) of the establishments were engaged in the wholesale, retail and import/export trades, restaurants and hotels sector. About 88.6% of the establishments were of small size. The distribution is similar to that in 2000. (Table 2.1)
個人電腦的應用 Personal computers usage 2.5 在二零零一年統計調查中,約
49.7%的機構單位有使用個人電腦。在主
要行業類別中,使用個人電腦的百分比最
高的是金融、保險、地產及商用服務業
(76.1%),其次是批發、零售、進出口貿
易、飲食及酒店業(49.5%),而最低的則
是運輸、倉庫及通訊業(29.2%)。(表 2.1)
2.5 In the 2001 Survey, about 49.7% of the establishments used personal computers (PCs). Among the major industry sectors, the percentage of establishments using PCs was highest in the financing, insurance, real estate and business services sector (76.1%), followed by the wholesale, retail and import/export trades, restaurants and hotels (49.5%) and was lowest in the transport, storage and communications sector (29.2%). (Table 2.1)
2.6 機構單位的規模越大,個人電腦的
使用率越高。在二零零一年統計調查中,
約93.4%的大型機構單位有使用個人電
腦,而中、小型機構單位的百分比則分別
為79.2%及45.7%。(表 2.1)
2.6 PCs usage increased with the size of establishments. In the 2001 Survey, some 93.4% of the large establishments had used PCs. For the medium and small establishments, the percentages were 79.2% and 45.7% respectively. (Table 2.1)

29
互聯網的應用 Internet usage
2.7 在二零零一年,約37.2%的機構單
位已連接互聯網,佔有使用個人電腦的機
構單位的74.9%。在大型機構單位中,所
佔的百分比則更高(在二零零一年是
86.0%,相對二零零零年時是77.9%)。按
行業類別分析,金融、保險、地產及商用
服務業的百分比最高(在二零零一年是
61.5%,相對二零零零年時是56.9%),而
最低的則為運輸、倉庫及通訊業(在二零
零一年是21.0%,相對二零零零年時是
18.6%)。(表 2.2)
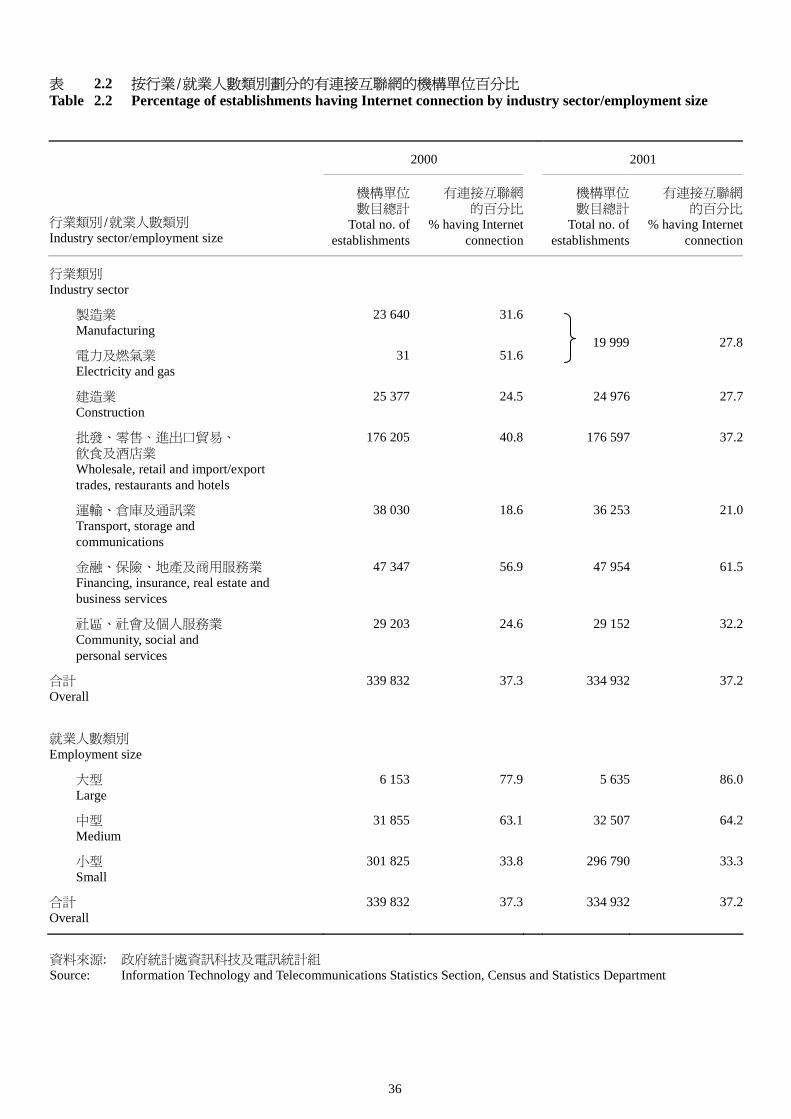
2.7 In 2001, some 37.2% of all establishments or 74.9% of establishments using PCs had Internet connection. The percentage was much higher for large establishments (86.0% in 2001, as compared to 77.9% in 2000). Analysed by industry sector, the percentage was highest for the financing, insurance, real estate and business services sector (61.5% in 2001, as compared to 56.9% in 2000) and lowest for the transport, storage and communications sector (21.0% in 2001, as compared to 18.6% in 2000). (Table 2.2)
2.8 在互聯網的各項功能中,「電子郵
件」是最普遍被應用的一項。在二零零一
年,93.6%有連接互聯網的機構單位均有
使用這項功能,而有使用「網上資料搜集」
功能的則為87.5%。「使用政府網上服務」
功能則錄得最顯著的增幅。在二零零一
年,42.9%有連接互聯網的機構單位有使
用這項功能,相對二零零零年時是
29.3%。(表 2.3)
2.8 Among the general functions of Internet usage, “E-mail” was the most common one. It was used by 93.6% of the establishments having Internet connection in 2001, followed by “on-line source of information” (87.5%). The most significant growth was noted in the “access to on-line government services” function which was used by 42.9% of the establishments having Internet connection in 2001, as compared to 29.3% in 2000. (Table 2.3)
2.9 按連接互聯網的方法分析,利用撥
號式調解器上網仍是最為普及。在二零零
一年,73.1%有連接互聯網的機構單位均
有採用。至於連接互聯網的通訊線路速
度,約35.4%的機構單位所用的通訊線路
是每秒傳送1兆位元或以上(即寬頻)的。
(表 2.4 及 2.5)
2.9 Analysed by method of connection, dial-up connection was still most common. This was used by 73.1% of the establishments having Internet connection in 2001. As regards the speed of transmission line, 35.4% were connected at the speed of 1 megabit per second or above (i.e. broadband). (Tables 2.4 and 2.5)

30
2.10 截至二零零一年底,香港有259間持牌的互聯網服務公司,而以撥號接駁及
私人租用線路接駁上網的已登記客戶戶
口數目分別為二百萬個及七千個。另一方
面,以寬頻連接互聯網亦漸趨普及。二零
零一年,寬頻互聯網接駁客戶戶口數目為
六十萬個,較二零零零年上升59%。互聯
網的使用量於過去數年亦持續增長。透過
公共電話網絡接駁的互聯網使用量由一
九九七年的12億分鐘增加至二零零零的
150億分鐘,而二零零一年則下跌至111億分鐘。這主要是由於寬頻互聯網接駁服務
逐漸普及。(表 2.6)
2.10 As at the end of 2001, Hong Kong had 259 licensed Internet Service Providers (ISP) and the number of registered customer accounts with dial-up access and with leased line access were 2 million and 7 000 respectively. On the other hand, the use of Internet with broadband connection also became popular. In 2001, registered broadband Internet access customer accounts was 0.6 million, representing a 59% increase over 2000. Internet usage also maintained continued growth in the past several years. Internet usage through Public Switched Telephone Network (PSTN) increased from 1.2 billion minutes in 1997 to 15 billion minutes in 2000, then decreased to 11.1 billion minutes in 2001. The decline is due to the growing popularity of Internet access via broadband networks. (Table 2.6)
2.11 在二零零一年,約10.7%的機構單
位有設立網頁或網站,相對於二零零零年
的7.3%增加了約三個百分點。在大型機構
單 位 , 設 有 網 頁 或 網 站 的 百 分 比
(57.2%),明顯較中型(29.1%)及小型
(7.8%)機構單位的百分比高。在已設立
網頁或網站的機構單位中,27.2%同時擁
有本身的網絡伺服器;13.8%已把網頁或
網站連接到本身的資料庫;5.8%已把網頁
或網站連接到商業伙伴的電腦系統;而
2.7%擁有無線應用協定(WAP)版本的網
頁或網站。(表 2.7 及 2.8)
2.11 In 2001, about 10.7% of the establishments had their own Web page or Web site, an increase of about 3 percentage points as compared to 7.3% in 2000. The percentage was much higher for large establishments (57.2%) than medium establishments (29.1%) and small establishments (7.8%). Among establishments having Web pages or Web sites, 27.2% had their own Web servers; 13.8% had their Web pages or Web sites connected to their related in-firm database; 5.8% had their Web pages or Web sites connected to business partners’ computer systems; and 2.7% had Wireless Application Protocol (WAP) version of Web pages or Web sites. (Tables 2.7 and 2.8)
電子商業 Electronic business
2.12 這部分是以四個層面去分析不同
形式的商業活動,分別為預訂或購買、獲
取、售賣及遞送,並分析每個層面在交易
時使用電子途徑的情況。電子途徑包括互
聯網,交互式應答系統及專用私人網絡等
媒介。
2.12 In this section, various business activities are analysed under four categories, viz. order or purchase, receipt, sale and delivery. For each category, the extent of transactions made through electronic means is analysed. Electronic means include media such as the Internet, interactive response system and designated private network.

31
(a) 透過電子途徑預訂或購買產品、服
務或資料 (a) Order or purchase of goods, services or
information through electronic means 2.13 在資訊科技在工商業的使用情況
和普及程度統計調查中,機構單位透過電
子途徑確認整個預訂或購買過程,即視為
透過電子途徑預訂或購買產品、服務或資
料。
2.13 In the Survey on Information Technology Usage and Penetration in the Business Sector, an establishment is regarded to have ordered or purchased goods, services or information through electronic means if the confirmation of order or purchase is done completely through electronic means.
2.14 在二零零一年,透過電子途徑預訂
或購買及獲取產品、服務或資料的機構單
位所佔的百分比均較二零零零年為高。在
訪問前的十二個月內曾透過電子途徑預
訂或購買產品、服務或資料的機構單位佔
6.2%。金融、保險、地產及商用服務業
(13.7%)和一般大型機構單位(26.2%)
的百分比均較高。在曾透過電子途徑預訂
或購買產品、服務或資料的機構單位中,
82.0%表示主要預訂或購買一般網上產
品、服務或資料。(表 2.9 及 2.10)
2.14 In 2001, the proportion of establishments ordering or purchasing and receiving goods, services or information through electronic means had increased over a year earlier. 6.2% of the establishments had ordered or purchased goods, services or information through electronic means in the 12 months before enumeration. The percentages were higher for the financing, insurance, real estate and business services sector (13.7%) and for large establishments (26.2%). For those establishments that had ordered or purchased through electronic means, 82.0% expressed that the major use was for general on-line order or purchase of goods, services or information. (Tables 2.9 and 2.10)
(b) 透過電子途徑獲取產品、服務或資
料 (b) Receipts of goods, services or information
through electronic means
2.15 網上瀏覽資料亦視為透過電子途
徑獲取資料。至於透過電子途徑獲取的產
品及服務,就只限於能以電子途徑傳遞的
產品及服務,如套裝軟件及歌曲。在二零
零一年的統計調查中,政府產品、服務或
資料及其他產品、服務或資料的數據,是
分別記錄的。
2.15 Browsing of information on the Internet is also regarded as receiving information through electronic means. As for goods and services received through electronic means, only products which could be transmitted through electronic media, such as software packages and songs, are included. Separate data on government goods, services or information and other goods, services or information are collected in the 2001 Survey.
2.16 在二零零一年,約40.0%的機構單
位在訪問前的十二個月內曾透過電子途
徑獲取產品、服務或資料。其中64%曾透
過電子途徑獲取政府產品、服務或資料,
91%曾獲取其他產品、服務或資料。
(表 2.11)
2.16 In 2001, some 40.0% of the establishments had received goods, services or information through electronic means in the 12 months before enumeration. Among those establishments, 64% had received government goods, services or information through electronic means and 91% had received other goods, services or information. (Table 2.11)

32
政府產品、服務或資料 Government goods, services or information
2.17 在曾透過電子途徑獲取政府產
品、服務或資料的機構單位中,約39.8%透過電子資料聯通獲取,35.1%透過互聯
網(公共服務電子化計劃除外)獲取及
22.7%透過公共服務電子化計劃獲取。
(表 2.12)
2.17 Of those establishments having received government goods, services or information through electronic means, 39.8% had received through Electronic Data Interchange, 35.1% through the Internet outside the Electronic Service Delivery (ESD) scheme and 22.7% through the ESD scheme. (Table 2.12)
其他非政府提供的產品、服務或資料 Goods, services or information other than
from the government
2.18 在二零零一年,約36.3%的機構單
位在訪問前的十二個月內曾透過電子途
徑獲取其他非政府提供的產品、服務或資
料。(表 2.11)
2.18 In 2001, about 36.3% of the establishments had received goods, services or information (other than from the government) through electronic means in the 12 months before enumeration. (Table 2.11)
2.19 在曾透過電子途徑獲取其他非政
府提供的產品、服務或資料的機構單位
中,幾乎全部(95.2%)的機構表示曾獲
取、瀏覽或尋找資料。10.9%表示曾獲取
金融交易服務,8.6%曾獲取數碼形式的產
品及服務。(表 2.13)
2.19 Of those establishments having received goods, services or information (other than from the government) through electronic means, nearly all (95.2%) of them had received, browsed or searched information. 10.9% expressed that they had received on-line financial transaction services and 8.6% had received services and products in digital form. (Table 2.13)
(c) 透過電子途徑售賣產品、服務或資
料 (c) Sales of goods, services or information
through electronic means
2.20 機構單位透過電子途徑提供並接
納整個預訂或購買其產品及服務,即視為
透過電子途徑售賣其產品、服務或資料。
2.20 An establishment is regarded to have sold their goods, services or information through electronic means if it offers and accepts orders or purchases that are placed completely through electronic means.

33
2.21 在二零零一年,只有很少百分比
(1.1%)的機構單位在訪問前的十二個月
內曾透過電子途徑售賣產品、服務或資
料。金融、保險、地產及商用服務業(2.6%)
和一般大型機構單位(8.5%)的百分比較
高。互聯網是最普遍的電子銷售途徑。在
曾透過電子途徑銷售的機構單位中,約
79.0%是透過互聯網的。 (表 2.14、2.15 及 2.16)
2.21 In 2001, only a small percentage (1.1%) of the establishments had sold goods, services or information through electronic means in the 12 months before enumeration. The percentages were higher for the financing, insurance, real estate and business services (2.6%) and for large establishments (8.5%). Internet was the most common electronic means for selling through electronic means. About 79.0% of those establishments having sold through electronic means had used it. (Tables 2.14, 2.15 and 2.16)
2.22 在二零零零年透過電子途徑售賣
產品、服務或資料所獲取的業務收益為76億港元,佔所有涵蓋行業類別總業務收益
的0.17%。在透過電子途徑售賣產品、服
務或資料所獲取的收益中,經專用私人網
絡及互聯網售賣所佔的百分比分別為
46.3%及39.7%。按顧客類別分析,商業對
商業電子商貿的收益佔電子商貿總收益
的49.9%。(表 2.17)
2.22 The value of business receipts from selling goods, services or information through electronic means totalled at HK$7.6 billion in 2000, representing 0.17% of the total business receipts of all selected industry sectors. Analysed by type of electronic means, about 46.3% of the e-commerce business receipts were through designated private network and 39.7% were through Internet. As regards the customer group, business receipts from business-to-business e-commerce contributed 49.9% of the total e-commerce receipts. (Table 2.17)
(d) 透過電子途徑遞送產品、服務或資
料 (d) Delivery of goods, services or information
through electronic means
2.23 機構單位以數碼形式遞送產品及
服務及放置有關機構或其所售賣產品及
服務的資料於互聯網上,均視為透過電子
途徑遞送產品、服務或資料。
2.23 Delivery of products and services in digital form and placing information about an establishment or the products and services sold on the Internet are both considered to be delivery of goods, services or information through electronic means.
2.24 在二零零一年,約12.4%的機構單
位在訪問前的十二個月內曾透過電子途
徑遞送其產品、服務或資料。(表 2.15)
2.24 In 2001, about 12.4% of the establishments had delivered their goods, services or information through electronic means in the 12 months before enumeration. (Table 2.15)

34
互聯網接駁服務的業務收益 Business receipts of Internet connection services
2.25 根據倉庫、通訊、財務、保險及商
用服務按年統計調查的結果顯示,互聯網
服務供應商在二零零零年的互聯網相關
業務收益為33億港元。其中,基本接駁費
在二零零零年佔所有與互聯網相關收益
的45.8%,是互聯網供應商的主要互聯網
相關收益。(表 2.18)
2.25 According to the results of the Annual Survey of Storage, Communication, Financing, Insurance and Business Services, the Internet Service Providers (ISPs) generated HK$3.3 billion business receipts from Internet related services in 2000. Basic connection charges, being the principal line of Internet business receipts for ISPs, contributed 45.8% of the total Internet related service receipts in 2000. (Table 2.18)
數碼證書的使用 Use of digital certificates (e-Certs) 2.26 至於在二零零一年工商業使用數
碼證書的情況,只有1.0%的機構單位曾於
訪問前的十二個月內有使用數碼證書。在
那些並未使用數碼證書的機構單位中,有
1.7%計劃使用。(表 2.19 及 2.20)
2.26 As regards the use of e-Certs in the business sector in 2001, only 1.0% of the establishments had used e-Certs in the 12 months before enumeration. Of those not having used e-Certs, 1.7% had planned to do so. (Tables 2.19 and 2.20)
認可核證機關及數碼證書 Recognised Certificate Authority and e-Certs 2.27 至二零零一年六月底,香港郵政為
香港唯一的認可核證機關。截至二零零一
年十二月底,他們共發出47 000張數碼證
書。
2.27 As at end-June 2001, Hongkong Post was the only recognised Certification Authority in Hong Kong. It has issued a total of 47 000 e-Certs as at end-December 2001.

35
表 2.1 按行業/就業人數類別劃分的有使用個人電腦的機構單位百分比 Table 2.1 Percentage of establishments having used personal computer (PC) by industry sector/
employment size
2000 2001
行業類別/就業人數類別 Industry sector/employment size
機構單位數目總計
Total no. of establishments
有使用個人電腦的百分比% havingused PCs
個人電腦數量
No. of PCs
機構單位數目總計
Total no. of establishments
有使用個人電腦的百分比% having used PCs
個人電腦數量
No. of PCs
行業類別 Industry sector
製造業 Manufacturing
23 640 48.5 75 725
電力及燃氣業 Electricity and gas
31 100.0 6 265
19 999
39.6 81 424
建造業 Construction
25 377 45.3 52 072 24 976 45.8 48 015
批發、零售、進出口貿易、 飲食及酒店業 Wholesale, retail and import/export trades, restaurants and hotels
176 205 53.1 517 112 176 597 49.5 422 614
運輸、倉庫及通訊業 Transport, storage and communications
38 030 27.6 128 874 36 253 29.2 113 498
金融、保險、地產及商用服務業 Financing, insurance, real estate and business services
47 347 74.5 371 399 47 954 76.1 355 768
社區、社會及個人服務業 Community, social and personal services
29 203 43.5 190 573 29 152 43.4 209 820
合計 Overall
339 832 51.5 1 342 020 334 932 49.7 1 231 139
就業人數類別 Employment size
大型 Large
6 153 92.0 674 872 5 635 93.4 609 357
中型 Medium
31 855 78.2 269 731 32 507 79.2 286 616
小型 Small
301 825 47.9 397 417 296 790 45.7 335 167
合計 Overall
339 832 51.5 1 342 020 334 932 49.7 1 231 139
資料來源: 政府統計處資訊科技及電訊統計組 Source: Information Technology and Telecommunications Statistics Section, Census and Statistics Department
36
表 2.2 按行業/就業人數類別劃分的有連接互聯網的機構單位百分比 Table 2.2 Percentage of establishments having Internet connection by industry sector/employment size
2000 2001
行業類別/就業人數類別 Industry sector/employment size
機構單位數目總計
Total no. of establishments
有連接互聯網的百分比
% having Internet connection
機構單位數目總計
Total no. of establishments
有連接互聯網的百分比
% having Internet connection
行業類別 Industry sector
製造業 Manufacturing
23 640 31.6
電力及燃氣業 Electricity and gas
31 51.619 999 27.8
建造業 Construction
25 377 24.5 24 976 27.7
批發、零售、進出口貿易、 飲食及酒店業 Wholesale, retail and import/export trades, restaurants and hotels
176 205 40.8 176 597 37.2
運輸、倉庫及通訊業 Transport, storage and communications
38 030 18.6 36 253 21.0
金融、保險、地產及商用服務業 Financing, insurance, real estate and business services
47 347 56.9 47 954 61.5
社區、社會及個人服務業 Community, social and personal services
29 203 24.6 29 152 32.2
合計 Overall
339 832 37.3 334 932 37.2
就業人數類別 Employment size
大型 Large
6 153 77.9 5 635 86.0
中型 Medium
31 855 63.1 32 507 64.2
小型 Small
301 825 33.8 296 790 33.3
合計 Overall
339 832 37.3 334 932 37.2
資料來源: 政府統計處資訊科技及電訊統計組 Source: Information Technology and Telecommunications Statistics Section, Census and Statistics Department

37
表 2.3 按使用互聯網的一般功能劃分的有連接互聯網的機構單位分布 Table 2.3 Distribution of establishments having Internet connection by general function of Internet used
2000 2001
互聯網的一般功能類別 General function of Internet
有使用互聯網一般功能的
機構單位數目(1)
No. of establishments
that used the general function
of Internet *
佔連接互聯網的機構單位總數的
百分比As a % of total no.
of establishments having Internet
connection
有使用互聯網一般功能的
機構單位數目(1)
No. of establishments
that used the general function
of Internet *
佔連接互聯網的機構單位總數的
百分比As a % of total no.
of establishments having Internet
connection
電子郵件 E-mail
120 264 94.9 116 660 93.6
網上資料搜集 On-line source of information
117 027 92.3 109 068 87.5
使用政府網上服務 Access to on-line government services
37 107 29.3 53 490 42.9
下載軟件 Software downloads
49 618 39.1 32 572 26.1
網上購買/獲取/預訂商品及服務 On-line purchase/receipt/ ordering of goods and services
48 470 38.2 31 489 25.3
網上付款 On-line payments
3 690 2.9 8 127 6.5
其他 Others
98 0.1 579 0.5
註釋: * 可選擇多於一項功能。 Note: * May select more than one function.
資料來源: 政府統計處資訊科技及電訊統計組 Source: Information Technology and Telecommunications Statistics Section, Census and Statistics Department

38
表 2.4 二零零一年按行業/就業人數類別及連接互聯網的方式劃分的機構單位分布 Table 2.4 Distribution of establishments having Internet connection by method of connection by industry
sector/employment size, 2001
連接互聯網的方式*(百分比) Method of Internet connection* (%)
行業類別/就業人數類別 Industry sector/employment size
有連接互聯網的機構單位數目
No . of establishments having Internet
connection
撥號式調解器(透過電話線)
Dial-up modem(through
telephone line) 租用專線
Leased line
流動電訊網絡Mobile
telecommunications network
其他Others
行業類別 Industry sector 製造業、電力及燃氣業
Manufacturing, electricity and gas 5 562 66.8 33.7 1.2 0.0
建造業 Construction
6 906 79.6 21.8 0.5 0.2
批發、零售、進出口貿易、 飲食及酒店業 Wholesale, retail and import/export trades, restaurants and hotels
65 681 73.7 31.3 0.6 #
運輸、倉庫及通訊業 Transport, storage and communications
7 604 65.0 38.6 5.6 0.8
金融、保險、地產及商用服務業 Financing, insurance, real estate and business services
29 516 73.2 30.7 1.2 0.2
社區、社會及個人服務業 Community, social and personal services
9 381 73.9 32.2 0.1 0.1
合計 Overall
124 651 73.1 31.3 1.0 0.1
就業人數類別 Employment size
大型 Large
4 844 48.5 71.6 2.6 0.5
中型 Medium
20 880 57.7 48.6 0.4 0.6
小型 Small
98 927 77.5 25.6 1.1 0.0
合計 Overall
124 651 73.1 31.3 1.0 0.1
註釋: * 可選擇多於一種連接方式。 # 少於 0.05%。
Notes: * May select more than one connection method. # Less than 0.05%.
資料來源: 政府統計處資訊科技及電訊統計組 Source: Information Technology and Telecommunications Statistics Section, Census and Statistics Department

39
表 2.5 二零零一年按行業/就業人數類別及連接互聯網的通訊線路速度劃分的機構單位分布 Table 2.5 Distribution of establishments having Internet connection by speed of transmission line being
used for Internet access by industry sector/employment size, 2001
互聯網的通訊線路速度(百分比) Speed of transmission line (%)
行業類別/就業人數類別 Industry sector/employment size
有連接互聯網的機構單位數目
No. of establishments having Internet
connection
每秒傳送 1 兆位元或以上(即寬頻)
1 Megabit per second (Mbps)
or above (i.e. broadband)
每秒傳送少於1 兆位元
(即窄頻)Below 1 Mbps
(i.e. narrow-band)
寬頻及窄頻並用Both broadband
and narrow-band available
行業類別 Industry sector
製造業、電力及燃氣業 Manufacturing, electricity and gas
5 562 28.5 69.8 1.8
建造業 Construction
6 906 35.9 62.7 1.4
批發、零售、進出口貿易、 飲食及酒店業 Wholesale, retail and import/export trades, restaurants and hotels
65 681 32.5 63.5 4.0
運輸、倉庫及通訊業 Transport, storage and communications
7 604 40.3 56.4 3.4
金融、保險、地產及商用服務業 Financing, insurance, real estate and business services
29 516 27.6 68.2 4.3
社區、社會及個人服務業 Community, social and personal services
9 381 31.3 65.5 3.2
合計 Overall
124 651 31.7 64.6 3.7
就業人數類別 Employment size
大型 Large
4 844 37.8 49.0 13.2
中型 Medium
20 880 42.4 52.3 5.3
小型 Small
98 927 29.2 67.9 2.9
合計 Overall
124 651 31.7 64.6 3.7
資料來源: 政府統計處資訊科技及電訊統計組 Source: Information Technology and Telecommunications Statistics Section, Census and Statistics Department

40
表 2.6 互聯網服務 Table 2.6 Internet services
1996 1997 1998 1999 2000 2001
持牌互聯網服務供應商數目 No. of licensed Internet Service Providers (ISPs)
94(+67.9)
124(+31.9)
133(+7.3)
159(+19.5)
235(+47.8)
259(+10.2)
互聯網使用量 Internet traffic volume
客戶透過公共電話網絡接駁(1)(百萬分鐘)
Customer access via public switched telephone networks(1) (million minutes)
--
1 246-
5 359(+330.1)
10 923(+103.8)
14 989(+37.2)
11 056(-26.2)
客戶透過寬頻網絡接駁(2)(兆兆比特)
Customer access via broadband networks(2) (terabits)
--
--
--
--
2 909-
73 607-
持牌互聯網服務供應商客戶數目(3) No. of customer of licensed ISPs (3)
以撥號接駁的已登記客戶戶口 (不包括互聯網儲值卡)(4)
Registered customer accounts with dial-up access (excluding Internet pre-paid calling cards) (4)
--
--
--
1 734 254-
2 283 047(+31.6)
2 018 238(-11.6)
作撥號接駁用途的互聯網儲值卡
Internet pre-paid calling cards for dial-up access
--
--
--
117 496-
38 708(-67.1)
18 569(-52.0)
以私人租用線路接駁的已登記客戶戶口(4) Registered customer accounts with leased line access (4)
--
--
--
7 495-
11 527(+53.8)
7 066(-38.7)
寬頻互聯網接駁客戶戶口(5)
Registered broadband Internet access customer accounts(5)
--
--
--
--
392 118-
623 302(+59.0)
註釋: 括號內的數字是與上年比較的變動百分率。 (1) 數字由電訊管理局自一九九七年八月開始提供,不包括透過私人租用線路及使用寬頻服務接駁的客戶。
(2) 數字由電訊管理局自二零零零年十一月開始提供,數字並未與二零零一年的全年數據作比較。 (3) 數字由電訊管理局自一九九九年開始提供。根據互聯網服務供應商申報的估計數字,不包括不屬於持牌
互聯網服務供應商客戶的使用者。 (4) 已登記客戶戶口指互聯網服務供應商的客戶戶口(包括免費的客戶戶口)。擁有超過一個客戶登入識別
碼的登記客戶戶口只算作一個已登記的客戶戶口。數字不包括只獲提供電郵地址的客戶戶口。 (5) 數字由電訊管理局自二零零零年二月開始提供。
Notes: Figures in brackets denote percentage changes over the preceding year. (1) Figures were first available from the Office of the Telecommunications Authority in August 1997. Not
including customer access via leased circuits and broadband services. (2) Figures were first available from the Office of the Telecommunications Authority in November 2000 and no
comparison was made against the full year figure for 2001. (3) Figures were first available from the Office of the Telecommunications Authority in 1999. Estimated figures
based on the return from the ISPs and do not include users who are not customers of the licensed ISPs. (4) Registered customer accounts refer to the customer accounts of ISPs (including those free-of-charge customer
accounts). For a registered customer account which has more than one user login ID, it is counted as one registered customer account only. Figures do not include customer accounts which are provided with e-mail addresses only.
(5) Figures were first available from the Office of the Telecommunications Authority in February 2000.
資料來源: 電訊管理局 Source: Office of the Telecommunications Authority

41
表 2.7 按行業/就業人數類別劃分的有設立網頁/網站的機構單位百分比 Table 2.7 Percentage of establishments having Web page/Web site by industry sector/employment size
2000 2001
行業類別/就業人數類別 Industry sector/employment size
機構單位數目總計
Total no. of establishments
有設立網頁/網站的百分比
% having Web page/Web site
機構單位數目總計
Total no. of establishments
有設立網頁/網站的百分比
% having Web page/Web site
行業類別 Industry sector
製造業 Manufacturing
23 640 5.0
電力及燃氣業 Electricity and gas
31 19.4 19 999 8.0
建造業 Construction
25 377 4.8 24 976 3.1
批發、零售、進出口貿易、 飲食及酒店業 Wholesale, retail and import/export trades, restaurants and hotels
176 205 7.8 176 597 11.8
運輸、倉庫及通訊業 Transport, storage and communications
38 030 3.3 36 253 3.4
金融、保險、地產及商用服務業 Financing, insurance, real estate and business services
47 347 10.3 47 954 17.6
社區、社會及個人服務業 Community, social and personal services
29 203 8.9 29 152 10.3
合計 Overall
339 832 7.3 334 932 10.7
就業人數類別 Employment size
大型 Large
6 153 43.2 5 635 57.2
中型 Medium
31 855 18.5 32 507 29.1
小型 Small
301 825 5.4 296 790 7.8
合計 Overall
339 832 7.3 334 932 10.7
資料來源: 政府統計處資訊科技及電訊統計組 Source: Information Technology and Telecommunications Statistics Section, Census and Statistics Department

42
表 2.8 二零零一年按行業/就業人數類別及有設立網頁/網站劃分的有無線應用協定(WAP)版本的網頁/網站;有網絡伺服器;有把機構的網頁/網站連接到機構內的資料庫;有把機構的網頁/網站連接到商業伙伴的電腦系統的機構單位分布
Table 2.8 Distribution of establishments having Web page/Web site by having Wireless Application Protocol (WAP) version of Web page/Web site; having Web server; having Web page/Web site connected to related in-firm database; having Web page/Web site connected to business partners’ computer systems by industry sector/employment size, 2001
設有下列項目的機構單位的百分比 % of establishments having
行業類別/就業人數類別 Industry sector/employment size
有設立網頁/網站的機構
單位數目No. of
establishments having Web page/
Web site
WAP 版本的網頁/網站
WAP version of Web page/
Web site
網絡伺服器
Web server
把網頁/網站 連接到機構內
的資料庫 Web page/Web site connected
to related in-firm database
把機構的網頁/網站連接到商業伙伴的電腦系統
Web page/Web site connected to
business partners’ computer systems
行業類別 Industry sector
製造業、電力及燃氣業 Manufacturing, electricity and gas
1 606 10.5 32.6 19.0
15.9
建造業 Construction
776 0.1 14.3 4.4 1.1
批發、零售、進出口貿易、 飲食及酒店業 Wholesale, retail and import/export trades, restaurants and hotels
20 799 1.2 21.5 10.3 4.2
運輸、倉庫及通訊業 Transport, storage and communications
1 238 3.4 41.4 27.2 13.6
金融、保險、地產及商用服務業 Financing, insurance, real estate and business services
8 444 3.6 38.9 20.4 8.3
社區、社會及個人服務業 Community, social and personal services
3 015 6.3 28.9 13.7 2.3
合計 Overall
35 879 2.7 27.2 13.8 5.8
就業人數類別 Employment size
大型 Large
3 226 3.9 55.8 21.4 8.4
中型 Medium
9 451 5.5 28.5 13.2 4.5
小型 Small
23 202 1.4 22.8 13.0 6.0
合計 Overall
35 879 2.7 27.2 13.8 5.8
資料來源: 政府統計處資訊科技及電訊統計組 Source: Information Technology and Telecommunications Statistics Section, Census and Statistics Department

43
表 2.9 按行業/就業人數類別劃分的透過電子途徑預訂、購買或獲取產品/服務/資料的機構單位分布 Table 2.9 Distribution of establishments having ordered, purchased or received goods/services/information
through electronic means by industry sector/employment size
2000 2001
產品/服務/資料透過電子途徑Goods/services/information
through electronic means
產品/服務/資料透過電子途徑Goods/services/information
through electronic means
行業類別/就業人數類別 Industry sector/employment size
機構單位數目總計
Total no. of establishments
預訂或購買的百分比
% of having ordered or purchased
獲取的百分比
% ofhaving
received
機構單位 數目總計
Total no. of establishments
預訂或購買的百分比
% of having ordered or purchased
獲取的百分比
% of having
received
行業類別 Industry sector
製造業 Manufacturing
23 640 6.1 30.4
電力及燃氣業 Electricity and gas
31 16.1 51.6
19 999
5.3 31.7
建造業 Construction
25 377 1.2 25.5 24 976 3.8 31.9
批發、零售、進出口貿易、 飲食及酒店業 Wholesale, retail and import/export trades, restaurants and hotels
176 205 3.8 38.2 176 597 5.0 40.1
運輸、倉庫及通訊業 Transport, storage and communications
38 030 2.6 16.7 36 253 4.4 24.7
金融、保險、地產及商用服務業 Financing, insurance, real estate and business services
47 347 11.9 55.0 47 954 13.7 62.8
社區、社會及個人服務業 Community, social and personal services
29 203 5.4 23.1 29 152 5.5 33.4
合計 Overall
339 832 4.9 35.3 334 932 6.2 40.0
就業人數類別 Employment size
大型 Large
6 153 18.5 77.2 5 635 26.2 85.1
中型 Medium
31 855 10.4 59.1 32 507 13.9 65.1
小型 Small
301 825 4.0 32.0 296 790 4.9 36.4
合計 Overall
339 832 4.9 35.3 334 932 6.2 40.0
資料來源: 政府統計處資訊科技及電訊統計組 Source: Information Technology and Telecommunications Statistics Section, Census and Statistics Department

44
表 2.10 按預訂或購買的產品/服務/資料種類劃分的透過電子途徑預訂或購買產品/服務/資料的機構單位
Table 2.10 Establishments having ordered or purchased goods/services/information through electronic means by type of goods/services/information ordered or purchased
2000 2001
透過電子途徑預訂或購買下列產品/服務/資料*
Having ordered or purchased the following types of goods/services/information
through electronic means *
透過電子途徑預訂或購買下列產品/服務/資料*
Having ordered or purchased the following types of goods/services/information
through electronic means*預訂或購買產品/ 服務/資料的種類 Type of goods/services/information ordered or purchased
機構單位數目No. of establishments
百分比%
機構單位數目No. of establishments
百分比%
預訂、購買或申請政府 的產品/服務/資料 Order, purchase of or application for government goods/services/information
4 332 26.1 4 854 23.5
預訂或補購存貨 Order or purchase for replenishment of inventory
3 402 20.5 3 168 15.3
金融交易服務 Financial transaction services
1 744 10.5 2 940 14.2
預訂、購買旅遊服務 Order or purchase of travel services
2 127 10.3
預訂或購買其他產品/資料/服務 Order or purchase of other goods/ information/services
14 121 84.916 951 82.0
註釋: * 可選擇多過一個種類。 Note: * May select more than one type.
資料來源: 政府統計處資訊科技及電訊統計組 Source: Information Technology and Telecommunications Statistics Section, Census and Statistics Department

45
表 2.11 二零零一年按行業/就業人數類別劃分的透過電子途徑獲取產品/服務/資料的機構單位分布 Table 2.11 Distribution of establishments having received goods/services/information through electronic
means by industry sector/employment size, 2001
透過電子途徑獲取產品/服務/ 資料的機構單位所佔的百分比
% having received goods/services/ information through electronic means
行業類別/就業人數類別 Industry sector/employment size
機構單位數目總計
Total no. of establishments
政府產品/服務/資料
Government goods/services/
information
其他產品/服務/資料
Other types of goods/services/
information
任何產品/服務/資料
Any type of goods/services/
information
行業類別 Industry sector
製造業、電力及燃氣業 Manufacturing, electricity and gas
19 999 21.2 25.6 31.7
建造業 Construction
24 976 23.2 29.5 31.9
批發、零售、進出口貿易、 飲食及酒店業 Wholesale, retail and import/export trades, restaurants and hotels
176 597 26.6 35.7 40.1
運輸、倉庫及通訊業 Transport, storage and communications
36 253 16.5 22.2 24.7
金融、保險、地產及商用服務業 Financing, insurance, real estate and business services
47 954 36.8 59.8 62.8
社區、社會及個人服務業 Community, social and personal services
29 152 16.3 31.7 33.4
合計 Overall
334 932 25.5 36.3 40.0
就業人數類別 Employment size
大型 Large
5 635 65.6 82.6 85.1
中型 Medium
32 507 46.2 60.4 65.1
小型 Small
296 790 22.5 32.8 36.4
合計 Overall
334 932 25.5 36.3 40.0
資料來源: 政府統計處資訊科技及電訊統計組 Source: Information Technology and Telecommunications Statistics Section, Census and Statistics Department

46
表 2.12 二零零一年按有關電子途徑種類劃分的透過電子途徑獲取政府產品/服務/資料的機構單位 Table 2.12 Establishments having received government goods/services/information through electronic means
by type of electronic means, 2001
電子途徑種類 Type of electronic means
透過該電子途徑獲取政府產品/服務/資料的機構單位數目*
No. of establishments having receivedgovernment goods/services/information
through that type of electronic means*
佔透過電子途徑獲取政府產品/服務/資料的機構單位數目百分比As a % of total no. of establishments
having received government goods/services/information
through electronic means
電子資料聯通 (例如透過貿易通遞交報關文件) Electronic data interchange (EDI), e.g. submission of trade documents through TradeLink
33 982 39.8
經個人電腦或流動裝置連接互聯網 (公共服務電子化計劃除外), 例如透過互聯網遞交申請 Internet via PCs/mobile devices outside the Electronic Service Delivery scheme, e.g. electronic submissions through the Internet
29 993 35.1
經電話網絡的交互式話音應答系統 Interactive voice response system through telephone network
26 262 30.8
公共服務電子化計劃 Electronic Service Delivery scheme
19 345 22.7
其他 Others
627 0.7
註釋: * 可選擇多於一個種類。 Note: * May select more than one type.
資料來源: 政府統計處資訊科技及電訊統計組 Source: Information Technology and Telecommunications Statistics Section, Census and Statistics Department

47
表 2.13 二零零一年按獲取的產品/服務/資料種類劃分的透過電子途徑獲取產品/服務/資料(非政府的產品/服務/資料)的機構單位
Table 2.13 Establishments having received goods/services/information (other than from government goods/services/information) through electronic means by type of goods/services/information received, 2001
獲取的產品/服務/資料種類 Type of goods/services/ information received
透過該電子途徑獲取下列產品/服務/資料的機構單位數目*
No. of establishments having received the following types of goods/services/
information through electronic means*
佔透過電子途徑獲取下列產品/服務/資料的機構單位數目百分比As a % of total no. of establishments having received the following types
of goods/services/information through electronic means
金融交易服務 Financial transaction services
13 217 10.9
獲取數碼形式的產品及服務 Receipt of services and products in digital form
10 397 8.6
獲取、瀏覽或尋找其他資料 Receipt, browsing or searching of other information
115 736 95.2
其他 Others
1 398 1.2
註釋: * 可選擇多於一個種類。 Note: * May select more than one type.
資料來源: 政府統計處資訊科技及電訊統計組 Source: Information Technology and Telecommunications Statistics Section, Census and Statistics Department

48
表 2.14 二零零一年按行業/就業人數類別劃分的透過電子途徑售賣產品/服務/資料的機構單位 Table 2.14 Establishments having sold goods/services/information through electronic means by industry
sector/employment size, 2001
行業類別/就業人數類別 Industry sector/employment size
機構單位數目總計
Total no. of establishments
透過電子途徑售賣產品/服務/資料的百分比
% having sold goods/services/information through electronic means
行業類別 Industry sector
製造業、電力及燃氣業 Manufacturing, electricity and gas
19 999 0.8
建造業 Construction
24 976 #
批發、零售、進出口貿易、 飲食及酒店業 Wholesale, retail and import/export trades, restaurants and hotels
176 597 0.9
運輸、倉庫及通訊業 Transport, storage and communications
36 253 0.6
金融、保險、地產及商用服務業 Financing, insurance, real estate and business services
47 954 2.6
社區、社會及個人服務業 Community, social and personal services
29 152 1.2
合計 Overall
334 932 1.1
就業人數類別 Employment size
大型 Large
5 635 8.5
中型 Medium
32 507 2.4
小型 Small
296 790 0.8
合計 Overall
334 932 1.1
註釋: # 少於 0.05%。 Note: # Less than 0.05%.
資料來源: 政府統計處資訊科技及電訊統計組 Source: Information Technology and Telecommunications Statistics Section, Census and Statistics Department

49
表 2.15 按透過電子途徑售賣或遞送產品/服務/資料劃分的機構單位 Table 2.15 Establishments having sold or delivered goods/services/information through electronic means
2000 2001
機構單位數目
No. of establishments
佔機構單位總數的百分比
As a % of total no.of establishments
機構單位數目
No. of establishments
佔機構單位總數的百分比
As a % of total no.of establishments
透過電子途徑售賣產品/服務/資料 Having sold goods/services/information through electronic means
1 175 0.3 3 540 1.1
透過電子途徑遞送產品/服務/資料 Having delivered goods/services/information through electronic means
27 688 8.1 41 608 12.4
資料來源: 政府統計處資訊科技及電訊統計組 Source: Information Technology and Telecommunications Statistics Section, Census and Statistics Department
表 2.16 按有關電子途徑種類劃分的透過電子途徑售賣產品/服務/資料的機構單位
Table 2.16 Establishments having sold goods/services/information through electronic means by type of electronic means
2000 2001
電子途徑種類 Type of electronic means
透過電子途徑售賣產品/服務/資料的
機構單位數目*No. of establishments
having sold goods/ services/information
through electronic means*
佔透過電子途徑售賣產品/服務/資料的
機構單位數目的百分比
As a % of total no. of establishments having
sold goods/services/ information through
electronic means
透過電子途徑售賣產品/服務/資料的
機構單位數目*No. of establishments
having sold goods/ services/information
through electronic means*
佔透過電子途徑售賣產品/服務/資料的
機構單位數目的百分比
As a % of total no. of establishments having
sold goods/services/ information through
electronic means
互聯網 Internet
934 79.5 2 795 79.0
專用私人網絡 Designated private network
285 24.3 294 8.3
經電話網絡的交互式 話音應答系統 Interactive voice response system through telephone network
253 21.6 293 8.3
其他透過流動電訊網絡的 交互式應答系統 Other interactive response system through mobile telecommunications network
- - 228 6.4
註釋: * 可選擇多於一個種類。 Note: * May select more than one type.
資料來源: 政府統計處資訊科技及電訊統計組 Source: Information Technology and Telecommunications Statistics Section, Census and Statistics Department

50
表 2.17 按電子途徑種類/顧客類別劃分的售賣產品/服務/資料所帶來的業務收益 Table 2.17
Business receipts received through selling goods/services/information through electronic meansby type of electronic means/customer group
百萬港元
HK$ million
年份 Year
變動百分率 % change
電子途徑種類/顧客類別 Type of electronic means/customer group 1998 1999 2000 1999/1998 2000/1999
電子途徑種類 Type of electronic means
專用私人網絡 Designated private network
1,073(36.3)
1,950(42.1)
3,499(46.3)
81.8 79.4
互聯網 Internet
98(3.3)
954(20.6)
3,001(39.7)
871.5 214.6
經電話線的互動式應答系統 Interactive response system through telephone lines
1,782(60.4)
1,729(37.3)
1,060(14.0)
-3.0 -38.7
總計 Total
2,953(100.0)
4,633(100.0)
7,559(100.0)
56.9 63.2
顧客類別 Customer group
商業及其他機構 Business and other establishments
- - 3,775(49.9)
- -
消費者 Consumers
- - 3,014(39.9)
- -
政府及有關機構
Government and related organisations
- - 770(10.2)
- -
總計 Total
- - 7,559(100.0)
- -
透過電子途徑所帶來的業務收益 佔總業務收益的百分比 Business receipts through electronic means/Total business receipts (%)
0.07 0.11 0.17 - -
註釋: 括號內的數字是佔個別總計的百分比。 Note: Figures in brackets denote the percentage shares to their respective totals.
資料來源: 政府統計處資訊科技及電訊統計組 Source: Information Technology and Telecommunications Statistics Section, Census and Statistics Department

51
表 2.18 按互聯網接駁服務劃分的業務收益 Table 2.18 Business receipts of Internet connection services by type of product
百萬港元
HK$ million
年份 Year
變動百分率 % change
產品類別 Type of product 1997 1998 1999 2000 1998/1997 1999/1998 2000/1999
入會/登記/開戶服務 Membership/registration/ account set-up services
9 (1.1)
7(0.4)
4(0.2)
29(0.9)
-23.1 -47.3 671.0
基本接駁服務 Basic connection services
撥號線路賬戶 for dial-up account
434 (51.9)
659(40.5)
714(42.7)
683(20.5)
52.0 8.3 -4.3
直駁專線賬戶 for leased line account
159 (19.0)
382(23.5)
494(29.5)
841(25.3)
139.5 29.4 70.2
儲存網站及有關服務 Web site hosting and related services
32 (3.8)
276(17.0)
103(6.2)
314(9.4)
754.8 -62.7 204.8
其他與互聯網有關的服務 Other Internet related services
203 (24.3)
302(18.6)
358(21.4)
1,458(43.8)
48.9 18.7 307.5
總計 Total
837 (100.0)
1,626(100.0)
1,673(100.0)
3,326(100.0)
94.2 2.9 98.8
註釋: 括號內的數字是佔個別總計的百分比。 Note: Figures in brackets denote the percentage shares to their respective totals.
資料來源: 政府統計處經銷及服務業統計組(二)甲 Source: Distribution & Services Statistics Section (2) A, Census and Statistics Department

52
表 2.19 二零零一年按行業/就業人數類別劃分的有使用數碼證書的機構單位 Table 2.19 Establishments having used e-Certs by industry sector/employment size, 2001
行業類別/就業人數類別 Industry sector/employment size
機構單位數目總計Total no. of establishments
有使用數碼證書的百分比% having used e-Certs
行業類別 Industry sector
製造業、電力及燃氣業 Manufacturing, electricity and gas
19 999 1.7
建造業 Construction
24 976 0.5
批發、零售、進出口貿易、 飲食及酒店業 Wholesale, retail and import/export trades, restaurants and hotels
176 597 0.9
運輸、倉庫及通訊業 Transport, storage and communications
36 253 0.2
金融、保險、地產及商用服務業 Financing, insurance, real estate and business services
47 954 1.9
社區、社會及個人服務業 Community, social and personal services
29 152 0.7
合計 Overall
334 932 1.0
就業人數類別 Employment size
大型 Large
5 635 5.5
中型 Medium
32 507 3.5
小型 Small
296 790 0.6
合計 Overall
334 932 1.0
資料來源: 政府統計處資訊科技及電訊統計組 Source: Information Technology and Telecommunications Statistics Section, Census and Statistics Department

53
表 2.20 二零零一年按行業/就業人數類別劃分的預計使用數碼證書的時間劃分的有此計劃的機構單位 Table 2.20 Establishments intending to use e-Certs by expected time of using by industry sector/employment
size, 2001
預計使用數碼證書的時間(百分比) Expected time of using e-Certs (%)
行業類別/就業人數類別 Industry sector/employment size
沒有使用數碼證書的
機構單位數目
No. ofestablishments
not havingused e-Certs
有計劃使用數碼證書的
百分比
% intendingto use e-Certs
2001 年In 2001
2002 年 In 2002
2002 年後或沒有預計時間
After 2002 or no expected time
總計Total
行業類別 Industry sector
製造業、電力及燃氣業 Manufacturing, electricity and gas 19 651 1.9 96.8 3.2 0.0 100.0
建造業 Construction
24 841 1.4 98.8 1.2 0.0 100.0
批發、零售、進出口貿易、 飲食及酒店業 Wholesale, retail and import/export trades, restaurants and hotels
174 986 1.7 43.0 31.5 25.5 100.0
運輸、倉庫及通訊業 Transport, storage and communications
36 198 0.1 32.2 60.9 6.9 100.0
金融、保險、地產及商用服務業 Financing, insurance, real estate and business services
47 063 3.9 68.1 20.5 11.4 100.0
社區、社會及個人服務業 Community, social and personal services
28 947 0.5 56.5 42.8 0.7 100.0
合計 Overall
331 686 1.7 58.1 24.9 17.0 100.0
就業人數類別 Employment size
大型 Large
5 326 5.6 77.7 20.4 1.9 100.0
中型 Medium
31 360 2.7 53.2 34.5 12.3 100.0
小型 Small
294 999 1.6 57.8 23.4 18.8 100.0
合計 Overall
331 686 1.7 58.1 24.9 17.0 100.0
資料來源: 政府統計處資訊科技及電訊統計組 Source: Information Technology and Telecommunications Statistics Section, Census and Statistics Department


55
第 3 章 資訊科技在政府的使用情況和普及程度 Chapter 3 Information Technology Usage and
Penetration in the Government
政府的資訊科技開支 Government spending on information
technology (IT) 3.1 政府的資訊科技開支在過去十年
有顯著增長。在二零零一/零二年,政府
在資訊科技的開支為25億港元,較一九九
二/九三的6億港元上升了307%。(表 3.1)
3.1 Government spending on IT has been increasing significantly during the past decade. In 2001/02, Government spending on IT amounted to HK$2.5 billion, representing an increase of 307% over the HK$0.6 billion in 1992/93. (Table 3.1)
政府電腦化 Computerisation in the Government 3.2 在二零零一年,電腦工作站對公務
員的比例為每千名公務員有586台電腦工
作站,遠較一九九二年的比例(每千名公
務員有77台電腦工作站)為高。(表 3.2)
3.2 In 2001, the ratio of workstations to civil servants was 586 workstations per 1 000 civil servants, which represented a significant increase compared with the ratio of 77 workstations per 1 000 civil servants in 1992. (Table 3.2)
3.3 在二零零一年,有56%受僱於政府
的人員有使用個人電腦,35%人員的個人
電腦有連接互聯網及22%人員為內部電子
郵件用戶。(表 3.2)
3.3 In 2001, 56% of staff employed by the government used personal computers (PC), 35% of staff had Internet connection and 22% had internal e-mail accounts. (Table 3.2)
政府資訊科技人員 Government IT staff
3.4 政府設有三個資訊科技人員職
系,分別為系統分析/程式編製主任職
系、電腦操作員職系及資料處理員職系。
在二零零二年,這三個職系的人數分別為
775人,492人及233人。(表 3.3)
3.4 There are three grades of IT staff within the government. They are the analyst/ programmer grade, the computer operator grade and the data processor grade. In 2002, the corresponding numbers of staff in these three grades were 775, 492 and 233 respectively. (Table 3.3)

56
表 3.1 政府的資訊科技開支 Table 3.1 Government spending on information technology (IT)
百萬港元
HK$ million
1992/93 1994/95 1996/97 1997/98 1998/99 1999/2000 2000/01 2001/02
政府的資訊科技開支 Government spending on IT
610 1,065 1,646 1,871 2,028 2,160 2,466 2,483
資料來源: 資訊科技署 Source: Information Technology Services Department
表 3.2 政府電腦化 Table 3.2 Computerisation in the Government
截至每年十二月止
As at December each year
1992 1996 1997 1998 1999 2000 2001
每千名公務員的電腦工作站數目 No. of workstations per 1 000 civil servants
77 305 369 406 424 482 586
使用個人電腦的公務員的百分率 % of civil servants being PC users
- 27 34 38 40 46 56*
可接駁互聯網的人員的百分率 % of staff with Internet access
- - - - - - 35*
可使用內部電子郵件的人員的百分率 % of staff with internal e-mail access
- - - - - - 22*
註釋: * 自 2001 年起,除公務員外,數據並包括以其他聘用條件(例如合約形式)受僱於政府的人員。 Note: * As from 2001, apart from civil servants, figures also include staff employed by the government under other
terms (e.g. contract terms).
資料來源: 資訊科技署 Source: Information Technology Services Department
表 3.3 政府資訊科技人員 Table 3.3 Government information technology staff
截至每年的三月三十一日止的人數
No. of persons as at 31 March of each year
職系 Grade 1992 1996 1997 1998 1999 2000 2001 2002
系統分析/程式編製主任職系 Analyst/programmer grade
493 675 721 802 895 851 790 775
電腦操作員職系 Computer operator grade
431 440 464 493 506 503 493 492
資料處理員職系 Data processor grade
459 330 299 273 262 259 250 233
資料來源: 資料科技署 Source: Information Technology Services Department

57
第 4 章 資訊科技及電訊業的營運特徵 Chapter 4 Operating Characteristics of the Information
Technology and Telecommunications Sector
緒言 Introduction 4.1 在這資訊年代,資訊及通訊科技的
急速發展對社會有很大影響。為了反映這
方面的最新發展,政府統計處近年開始編
製有關的統計數字。本章提供資訊科技及
電訊業營運特徵的主要統計數字。
4.1 The rapid development of information and telecommunications technologies has been impacting the society at large in this information age. To reflect the latest development in this area, the Census and Statistics Department (C&SD) started compiling relevant statistics in recent years. This chapter presents key statistics on the operating characteristics of the information technology and telecommunications (IT&T) sector.
資訊科技及電訊業的涵蓋範圍 Coverage of the IT&T Sector 4.2 在轉化到電子經濟的過程中,出現
一些生產資訊科技及電訊產品以及提供
資訊科技及電訊服務的行業。這類行業可
統稱為「資訊科技及電訊業」。直至現時
為止,國際間對「資訊科技及電訊業」尚
未有一致的定義。不同的經濟體系採用各
自的一套定義。在本章中,資訊科技及電
訊業包括以下行業:
4.2 In changing over to an “e-economy”, industries producing IT&T goods and providing IT&T services emerged. These industries may be grouped together as the “IT&T sector”. So far, there is no international standard definition on IT&T sector. Different economies adopt their own definitions. In this chapter, the IT&T sector covers the following industries:
(1) 計算及會計器材、電話及其他通
訊設備及電腦及電訊設備用的電
子零件的製造;
(1) manufacturing of computing machinery and equipment; telephone and communication equipment; and electronic parts and components of computer and telecommunications equipment;
(2) 閉路通訊系統及電訊系統保養; (2) maintenance of intercommunication system and telecommunications system;
(3) 電訊設備、電腦、電腦周邊設備及軟
件批發/零售; (3) wholesale/retail of telecommunications equipment, computer, computer peripherals and software packages;
(4) 電腦、電腦周邊設備、軟件及電話系
統進出口貿易; (4) imports and exports of computer, computer peripherals, software packages and telephone system;
(5) 電訊服務如傳呼服務、固網及流動電
話服務、互聯網接駁服務等; (5) telecommunications services such as radio paging services, fixed and mobile telephone services, Internet access services etc;

58
(6) 軟件開發及保養服務、資料處理及製
表服務、與互聯網有關的技術服務及
其他與電腦有關的服務;及
(6) software development and maintenance; data processing and tabulation services; Internet related technical services and other computer related services; and
(7) 與電腦及電訊設備有關的工程及技術
服務。 (7) engineering and technical supporting services related to computer and telecommunications equipment.
資訊科技及電訊業的主要營運特徵 Major Operating Characteristics of the IT&T
Sector 4.3 政府統計處編製了資訊科技及電
訊業的機構單位數目、就業人數、業務收
益和增加價值。
4.3 The contributions of the IT&T sector in Hong Kong in terms of number of establishments, number of persons engaged, business receipts and value added were compiled by the Census and Statistics Department.
4.4 在一九九八年,資訊科技及電訊業
約有5 800間機構單位,就業人數共66 500人。有關機構單位數目在二零零零年增加
至約8 100間,而就業人數增加至78 800人,較一九九八年分別上升 41.6%及
18.5%。讀者須注意資訊科技及電訊業就
業人數的統計數字包括從事資訊科技僱
員及從事其他職業僱員。(表 4.1)
4.4 In 1998, there were some 5 800 establishments and 66 500 persons engaged in the IT&T sector. The numbers increased to about 8 100 and 78 800 respectively in 2000, representing increases of 41.6% and 18.5% respectively over 1998. It should be noted that statistics on the number of persons engaged in the IT&T sector include IT personnel as well as personnel in other occupations. (Table 4.1)
4.5 雖然使用資訊科技及電訊服務的
用戶數目急速上升,但該行業的業務收益
卻只由一九九八年的965億港元輕微上升
至二零零零年的992億港元。這主要是由
於長途電話收費大幅調低以及流動電話
網絡商降低服務收費,抵消了使用量增加
造成的增長。(表 4.1)
4.5 Despite the strong growth in the number of subscribers, total business receipts of the IT&T sector only increased marginally from HK$96.5 billion in 1998 to HK$99.2 billion in 2000. This was due to the marked reduction in charges for international calls and competitive pricing packages offered by mobile phone operators, which offset the increase due to increased transaction volume. (Table 4.1)
4.6 資訊科技及電訊業的增加價值由
一九九八年的381億港元微升1.3%至二零
零零年的386億港元。資訊科技及電訊業
的增加價值佔本地生產總值的百分比由
一九九八年的3.2%輕微下降至二零零零
年的3.1%。(表 4.1)
4.6 The value added for the IT&T sector increased slightly by 1.3% from HK$38.1 billion in 1998 to HK$38.6 billion in 2000. The contribution of the IT&T sector to GDP decreased marginally from 3.2% in 1998 to 3.1% in 2000. (Table 4.1)

59
表 4.1 有關資訊科技及電訊業的統計數字 Table 4.1 Statistics pertaining to the information technology and telecommunications sector
1998 1999 2000
機構單位數目 No. of establishments
5 751 6 579 (+14)
8 141(+24)
就業人數 No. of persons engaged
66 500 70 800 (+6)
78 800(+11)
業務收益(十億港元) Business receipts (HK$ billion)
96.5 96.7 (#)
99.2(+3)
增加價值(十億港元) Value added (HK$ billion)
38.1 32.9 (-14)
38.6(+17)
在以要素成本計算的 本地生產總值內所佔比率 (%) Contribution to GDP at factor cost (%)
3.2 2.8
3.1
註釋: 括號內的數字是與上年比較的變動百分率。 # 表示變動百分率在增減 0.5%以內。
Notes: Figures in brackets denote percentage changes over the preceding year. # Denotes change within ± 0.5%. 資料來源: 政府統計處資訊科技及電訊統計組 Source: Information Technology and Telecommunications Statistics Section, Census and Statistics Department


61
第 5 章 電訊服務 Chapter 5 Telecommunications Services
緒言 Introduction 5.1 良好的電訊基建一向是香港經濟
成功的因素之一。電訊業在九十年代的迅
速發展,成功地鞏固香港作為亞太區的電
訊及互聯網樞紐的地位。
5.1 Sound telecommunications infrastructure has been contributing to the success of Hong Kong’s economy. With the rapid growth of the telecommunications industry in the 90’s, Hong Kong has successfully strengthened its status as a regional telecommunications and Internet hub.
5.2 本章描述過去十年間電訊業在業
務表現及經營特色的一些較明顯的發
展。當中的分析主要是根據政府統計處的
倉庫、通訊、財務、保險及商用服務按年
統計調查所得的資料進行分析。本章亦展
示一些電訊管理局所編製有關電訊業的
統計數字,以作參考。
5.2 This chapter describes some of the more prominent development in the business performance and operating characteristics of the telecommunications industry in the past decade. Analyses are based mainly on the data collected from the Annual Survey of Storage, Communication, Financing, Insurance and Business Services of the Census and Statistics Department. Selected statistics on telecommunications services compiled by the Office of the Telecommunications Authority are also presented for reference.
5.3 就編製統計數字而言,電訊業包括
提供固定電話及電報服務、流動電話服
務、傳呼服務、及其它電訊服務的機構單
位。售賣電話、流動電話及有關配件的機
構單位,則屬於批發/零售業,因此並不
包括在電訊業內。
5.3 The telecommunications industry comprises, for statistical compilation purposes, establishments engaged in the provision of fixed telephone and telegraph services, mobile phone services, radio paging services, and other telecommunications services. Establishments engaged in sales of telephone sets, mobile phones and related accessories are, however, in the wholesale/retail sector and are therefore not included in the telecommunications industry.
62
電訊業的主要服務類別 Major services rendered by the telecommunications industry
5.4 按服務類別劃分,電訊業大致分為
四個組別。這四個組別的經營特色各有不
同。首兩個組別,即固定電話及電報服務
及流動電話服務,只有為數不多的大機構
單位。於二零零零年,每機構單位的平均
就業人數約為1 550人。這兩個組別的機構
單位數目只佔整個電訊業總數的5.9%。但
這些機構單位所賺取的業務收益及其他
收入卻佔整個電訊業總數的 80.6%。
(表 5.1)
5.4 According to the services rendered, the telecommunications industry can be broadly classified into the four sub-groups. These four sub-groups are rather diversified in their operating characteristics. For the first two sub-groups, viz., fixed telephone and telegraph services and mobile phone services, there were only a few large establishments. In 2000, the average number of persons engaged per establishment was about 1 550. These two sub-groups constituted only about 5.9% of all establishments in the telecommunications industry. Yet they together generated about 80.6% of the business receipts and other income of the entire telecommunications industry. (Table 5.1)
5.5 相對地,從事其他兩個組別,即傳
呼服務及其他電訊服務(包括互聯網服務
及對外通訊服務等)的機構單位的規模則
相對較小。於二零零零年,每個機構單位
的平均就業人數分別約為140人和40人。
傳呼服務佔電訊業6.3% 的機構單位,賺
取2.7% 的業務收益及其他收入。其他電
訊服務佔電訊業87.8% 的機構單位,賺取
16.7% 的業務收益及其他收入。(表 5.1)
5.5 In contrast, establishments in the other two sub-groups, viz., radio paging services and other telecommunications services (including Internet services and external telecommunications services etc.) were relatively smaller in scale. In 2000, the average numbers of persons engaged per establishment in these two sub-groups were about 140 and 40 respectively. Radio paging services constituted about 6.3% of all establishments in this industry, generating about 2.7% of total business receipts and other income. Other telecommunications services constituted about 87.8% of all establishments in this industry, generating 16.7% of total business receipts and other income. (Table 5.1)
固定電話、電報及流動電話服務 Fixed telephone, telegraph and mobile
phone services 5.6 固定電話、電報及流動電話服務的
業務於九十年代初期及中期急速增長。在
一九九一至一九九七年間,這兩個組別的
機構單位由5間增至13間,就業人數在同
期的平均每年增長率為6.9%。(表 5.2)
5.6 Business in the fixed telephone, telegraph and mobile phone services grew rapidly in early to mid-90’s. During the period from 1991 to 1997, the number of establishments engaged in these two sub-groups increased from 5 to 13. The number of persons engaged recorded an average annual growth rate of 6.9% during the same period. (Table 5.2)

63
5.7 在該期間內,僱員薪酬的累積升幅
達163.7%,平均每年增長率為17.5%,反
映從事這兩個組別的人員的人均收入在
同期內得到普遍改善。(表 5.2)
5.7 A cumulative increase of 163.7% in compensation of employees was recorded during the period. The average annual growth rate was 17.5%, reflecting a general improvement in per capita earnings for job-holders in these two sub-groups. (Table 5.2)
5.8 營運開支則以更快的速度增長,在
期內的平均每年增長率為27.6%。其中,
利息支出部分的增長非常強勁,反映在新
的通訊器材上的投資不斷增加。(表 5.2)
5.8 Operating expenses increased at an even faster pace, with an average annual growth rate of 27.6% during the period. In particular, robust growth was recorded in the interest payment component, reflecting an expanding capital investment in new telecommunications equipment. (Table 5.2)
5.9 這兩個組別的業務收益及其他收
入在期內錄得兩位數字(17.4%)的平均
每年增長率。這與期內電話市場不斷拓展
有關。(表 5.2)
5.9 Business receipts and other income of these two sub-groups showed double-digit (17.4%) average annual growth rate during the same period. This was related to the continuous expansion of the telephone market during the period. (Table 5.2)
5.10 由一九九七年的高鋒期開始,這兩
個組別的就業人數,僱員薪酬及業務收益
及其他收入均下跌。(表 5.2)
5.10 The number of persons engaged, compensation of employees and business receipts and other income of these two sub-groups declined since the peak in 1997. (Table 5.2)
5.11 截至二零零一年底,流動無線電話
用戶的數目較一年前增加8.9%至570萬。
每百名人口中便有84.4個是流動無線電話
服務的用戶,使香港成為全球最普遍使用
該項服務的地區之一。(表 5.3 及圖 5.1)
5.11 At the end of 2001, the number of mobile telephone subscribers increased by 8.9% over a year earlier to 5.7 million. In every 100 population, there were on average 84.4 mobile telephone service subscribers, making Hong Kong one of the places with the highest penetration of this service in the world. (Table 5.3 and Chart 5.1)
傳呼服務 Radio paging services 5.12 在一九九一至一九九五年間,傳呼
服務的業務穩健增長,但在近年由於客戶
流失往流動電話服務,該組別經歷了明顯
的收縮。此組別的業務收益及其他收入由
一九九五年的40億港元下降至二零零零
年的16億港元。(表 5.4)
5.12 During the period from 1991 to 1995, business in the radio paging services showed steady growth. However, this sub-group experienced a significant setback in recent years because of the shift of customers to the mobile phone services. Its business receipts and other income decreased from HK$4.0 billion in 1995 to HK$1.6 billion in 2000. (Table 5.4)

64
5.13 傳呼服務業的機構單位數目、就業
人數及僱員薪酬亦自一九九五年起持續
下降。與一九九五年的高峰期比較,二零
零零年的就業人數及僱員薪酬分別下跌
81.5%及66.7%。(表 5.4)
5.13 The number of establishments, persons engaged and compensation of employees also showed persistent decline since 1995. Comparing 2000 with 1995 when this sub-group was at its peak, the number of persons engaged decreased by 81.5% while the compensation of employees by 66.7%. (Table 5.4)
5.14 無線電傳呼接收器數目的變動亦
顯示傳呼服務市場在一九九一至一九九
四年間擴張,然後在一九九五年進入鞏固
期。自一九九五年開始,主要由於流動電
話服務漸趨普及,傳呼服務市場明顯收
縮。(圖 5.1)
5.14 As reflected by the number of radio paging receivers, the market of radio paging services expanded during the period from 1991 to 1994 and then consolidated in 1995. Since 1995, the market showed a marked shrinkage, largely due to the increasing popularity of mobile phone services. (Chart 5.1)
5.15 一九九一至一九九四年期間,傳呼
服務機構單位的增加價值錄得雙位數字
的平均每年增長率。在一九九三年,傳呼
服務用戶數目強勁增長,而該年傳呼業的
增加價值亦相應錄得35.7% 的高增長。之
後,由於客戶數目減少,這行業的增加價
值亦開始下降。(表 5.4)
5.15 Between 1991 and 1994, the value added of establishments rendering radio paging services increased with a double digit average annual growth rate. A high year-on-year growth of 35.7% in value added was recorded in 1993 when a significant rise in the number of radio paging subscribers took place. Thereafter, the value added decreased along with a setback in the number of radio paging subscribers. (Table 5.4)
5.16 按每百名人口計算的無線電傳呼
接收器數目由一九九六年的16.9下跌至二
零零一年的3.7。這主要是由於公共流動無
線電話服務逐漸普及。(表 5.5 及圖 5.1)
5.16 The number of radio paging receivers per 100 population decreased from 16.9 in 1996 to 3.7 in 2001. The decline is due to the growing popularity of public mobile radio-telephone services. (Table 5.5 and Chart 5.1)
其他電訊服務 Other telecommunications services 5.17 因科技上的進步,互聯網服務、
對外通訊服務及其他電訊服務的業務在
近年快速增長。此組別的收益及其他收
入由一九九六年的38億港元增至二零零
零年的100億港元。(表 5.6)
5.17 Along with technological advancement, business in Internet services, external telecommunications services and other telecommunications services expanded by leaps and bounds in recent years. The business receipts and other income of this sub-group increased from HK$3.8 billion in 1996 to HK$10.0 billion in 2000. (Table 5.6)

65
5.18 此組別的機構單位數目由一九九
六年的110間增至二零零零年的178間。就
業人數及僱員薪酬亦分別增加了221.4%及180.9%,營運開支及業務收益及其他收
入則分別上升264.4%及165.3%。(表 5.6)
5.18 The number of establishments engaged in this sub-group increased from 110 in 1996 to 178 in 2000. The number of persons engaged and compensation of employees in related services increased by 221.4% and 180.9% respectively. Operating expenses and business receipts and other income also surged by 264.4% and 165.3% respectively. (Table 5.6)
固定電訊網絡服務 Fixed telecommunications network services 5.19 近年,逐步開放市埸成為電訊業發
展的重要趨勢。固定電訊網絡營辦商的數
目由一九九二年的1間增加至二零零一年
的32間,以提供各項固定電訊服務,包括
本地有線固網服務、本地無線固網服務、
衛星對外固網服務、混合光纖同軸電纜網
絡的固網服務及電纜對外固網服務。
5.19 In recent years, progressive liberalisation became an important trend in the development of the telecommunications industry. The number of fixed telecommunications network operators increased significantly from 1 in 1992 to 32 in 2001 for providing various fixed telecommunications services, including local wireline-based fixed network services, local wireless fixed network services, satellite based external fixed network services, fixed network service over the hybrid fibre coaxial cable network and cable-based external fixed network services.
5.20 在二零零一年,4間固定有線電話
網絡營辦商提供超過390萬條電話線。人
均電話密度為每百名人口有58.1條電話
線,位於亞洲最高之列。(表 5.7)
5.20 In 2001, 4 wireline based fixed telecommunications network operators provided services to over 3.9 million telephone lines. The telephone density in 2001 stood at 58.1 exchange lines per 100 population, and was among the highest in Asia. (Table 5.7)
對外電訊服務 External telecommunications services 5.21 除本地電話服務,用戶可透過本地
固網營辦商及其他網絡營辦商,例如流動
電話服務營辦商,獲提供對外電話服務。
在二零零一年,共錄得34.9億分鐘由本港
撥出及19.4億分鐘由外地撥入的通訊量。
(表 5.8)
5.21 Apart from local telephone services, external telephone services are accessible by customers through local fixed network operators and other network operators such as mobile phone service operators. In 2001, a total of 3.49 billion minutes of outgoing traffic and 1.94 billion minutes of incoming traffic were recorded. (Table 5.8)

66
表 5.1 二零零零年按服務類別劃分的電訊業總額比重 Table 5.1 Contributions of the telecommunications industry by type of services, 2000
百萬港元(另有註明除外)
HK$ million (unless otherwise specified)
服務類別 Type of services
機構單位數目Number of
establishments
就業人數Number of
persons engaged
僱員薪酬Compensation of employees
營運開支Operating expenses
業務收益及其他收入
Business receipts and other income
增加價值Value added
固定電話及電報服務 Fixed telephone and telegraph services
6(3.0%)
10 295(38.3%)
3,630(43.9%)
12,540(39.9%)
26,818(44.6%)
14,125(67.4%)
流動電話服務 Mobile phone services
6(3.0%)
8 272(30.8%)
2,347(28.4%)
10,948(34.8%)
21,648(36.0%)
4,544(21.7%)
傳呼服務 Radio paging services
13(6.3%)
1 807(6.7%)
395(4.8%)
835(2.7%)
1,613(2.7%)
565(2.7%)
其他電訊服務 Other telecommunications services
178(87.8%)
6 513(24.2%)
1,889(22.9%)
7,114(22.6%)
10,027(16.7%)
1,724(8.2%)
總數 Total
203(100.0%)
26 887(100.0%)
8,261(100.0%)
31,436(100.0%)
60,105(100.0%)
20,959(100.0%)
註釋: 括號內的數字表示該服務類別佔整個電訊業的百分比。 Note: Figures in bracket denote percentage contributions to the entire telecommunications industry.
資料來源: 政府統計處經銷及服務業統計組(二)甲 Source: Distribution and Services Statistics Section (2) A, Census and Statistics Department
表 5.2 提供固定電話、電報及流動電話服務的機構單位的主要統計數字 Table 5.2 Principal statistics for establishments rendering fixed telephone, telegraph and mobile phone services
百萬港元 (另有註明除外)
HK$ million (unless otherwise specified)
1991 1992 1993 1994 1995 1996 1997 1998 1999 2000
機構單位數目 Number of establishments
5 4 5 5 8 11 13 11 11 12
就業人數 Number of persons engaged
14 531 17 162 17 218 16 997 17 480 18 307 21 651 19 249 18 573 18 567
僱員薪酬 Compensation of employees
2,620 3,639 3,931 4,403 5,152 5,607 6,908 6,614 6,363 5,978
營運開支 Operating expenses
6,032 10,093 11,200 12,473 14,098 19,664 25,981 24,156 27,420 23,488
業務收益及其他收入 Business receipts and other income
20,543 24,533 27,448 31,169 36,032 45,162 53,718 49,250 48,545 48,465
增加價值 Value added
10,823 13,408 15,178 16,931 19,408 21,212 21,104 18,844 13,758 18,669
資料來源: 政府統計處經銷及服務業統計組(二)甲 Source: Distribution and Services Statistics Section (2) A, Census and Statistics Department

67
表 5.3 公共流動無線電話服務 Table 5.3 Public mobile radio-telephone services
1996 1997 1998 1999 2000 2001
公共流動無線電話用戶系統數目(1)(千)
No. of public mobile radio-telephone subscriber units(1) (thousands)
1 211(+76.1)
2 128(+75.8)
2 898(+36.2)
3 990(+37.7)
5 234(+31.2)
5 702(+8.9)
不包括儲值智能咭 Excluding Pre-paid SIM cards
1 211(+76.1)
2 086(+72.3)
2 768(+32.7)
3 650(+31.9)
4 173(+14.3)
4 256(+2.0)
儲值智能咭(2)
Pre-paid SIM cards(2) --
42-
130(+207.4)
340(+160.9)
1 061(+212.5)
1 445(+36.2)
按每百名人口計算的公共流動無線電話用戶系統數目 No. of public mobile radio-telephone subscriber units per 100 population
18.7 32.7 44.0 60.1 78.0 84.4
公共流動無線電話服務營辦商數目 No. of Public Mobile Radio-telephone Services (PMRS) operators
4 4 3 3 3 3
個人通訊服務營辦商數目 No. of Personal Communications Services (PCS) operators
6 6 6 6 6 6
註釋: 括號內的數字是與上年比較的變動百分率。 (1) 包括儲值智能咭及個人通訊服務的用戶。 (2) 數字由電訊管理局自一九九七年開始提供。
Notes: Figures in brackets denote percentage changes over the preceding year. (1) Including Pre-paid SIM cards and PCS subscribers. (2) Figures were first available from the Office of the Telecommunications Authority since 1997.
資料來源: 電訊管理局 Source: Office of the Telecommunications Authority

68
表 5.4 提供傳呼服務機構單位的主要統計數字 Table 5.4 Principal statistics for establishments rendering radio paging services
百萬港元 (另有註明除外)
HK$ million (unless otherwise specified)
1991 1992 1993 1994 1995 1996 1997 1998 1999 2000
機構單位數目 Number of establishments
20 13 18 20 21 20 19 19 14 13
就業人數 Number of persons engaged
6 508 7 011 8 411 8 882 9 785 7 431 6 883 3 197 2 103 1 807
僱員薪酬 Compensation of employees
527 652 848 1,017 1,187 1,144 1,037 652 426 395
營運開支 Operating expenses
527 687 926 1,071 1,229 1,082 1,335 1,415 1,331 835
業務收益及其他收入 Business receipts and other income
1,952 2,380 3,411 3,834 4,026 3,263 3,339 2,819 2,486 1,613
增加價值 Value added
1,103 1,281 1,738 1,985 1,799 1,358 1,265 576 581 565
資料來源: 政府統計處經銷及服務業統計組(二)甲 Source: Distribution and Services Statistics Section (2) A, Census and Statistics Department
表 5.5 公共無線電傳呼服務 Table 5.5 Public radio paging services
1996 1997 1998 1999 2000 2001
公共無線電傳呼服務牌照數目 No. of public radio paging service licenses
32 30 29 29 26 22
公共無線電傳呼服務頻道數目 No. of public radio paging service channels
73 81 79 75 72 57
公共無線電傳呼接收器數目(千) No. of public radio paging receivers (thousands)
1 090(-17.7)
933(-14.4)
572(-38.7)
342(-40.2)
328(-4.2)
253(-22.9)
按每百名人口計算的無線電 傳呼接收器數目 No. of radio paging receivers per 100 population
16.9 14.3 8.7 5.2 4.9 3.7
註釋: 括號內的數字是與上年比較的變動百分率。 Note: Figures in brackets denote percentage changes over the preceding year.
資料來源: 電訊管理局 Source: Office of the Telecommunications Authority

69
用戶系統 / 接收器數目(千) Number of subscriber units / receivers (thousands)
圖 5.1 公共流動無線電話用戶系統及公共無線電傳呼接收器數目 Chart 5.1 Number of public mobile radio-telephone subscriber units and public radio paging receivers
資料來源: 政府統計處經銷及服務業統計組(二)甲 Source: Distribution and Services Statistics Section (2) A, Census and Statistics Department
0
1 000
2 000
3 000
4 000
5 000
6 000
1991 1992 1993 1994 1995 1996 1997 1998 1999 2000 2001
無線電傳呼接收器 Radio paging receivers
流動無線電話用戶系統 Mobile radio-telephone subscriber units

70
表 5.6 其他電訊服務機構單位的主要統計數字# Table 5.6 Principal statistics for establishments rendering other telecommunications services#
百萬港元 (另有註明除外)
HK$ million (unless otherwise specified)
1996 1997 1998 1999 2000
機構單位數目 Number of establishments
110 141 151 156 178
就業人數 Number of persons engaged
2 026 2 602 2 694 4 286 6 513
僱員薪酬 Compensation of employees
673 902 888 1,237 1,889
營運開支 Operating expenses
1,952 2,646 3,143 4,236 7,114
業務收益及其他收入 Business receipts and other income
3,780 4,955 4,877 6,571 10,027
增加價值 Value added
1,797 2,155 1,605 2,128 1,725
註釋: # 其他電訊服務機構單位的有關統計數字由一九九六年起開始編製。 Note: # Relevant statistics of other telecommunications services were compiled since 1996.
資料來源: 政府統計處經銷及服務業統計組(二)甲 Source: Distribution and Services Statistics Section (2) A, Census and Statistics Department

71
表 5.7 有線電話服務 Table 5.7 Wireline telephone services
1996 1997 1998 1999 2000 2001
電話線數目(1)(千)
No. of exchange lines(1) (thousands) 3 402(+4.5)
3 624(+6.5)
3 708(+2.3)
3 839 (+3.5)
3 946(+2.8)
3 926(-0.5)
商用電話線(千) Business lines (thousands)
1 374(+6.7)
1 526 (+11.1)
1 549(+1.5)
1 649 (+6.5)
1 736(+5.3)
1 765(+1.6)
住宅電話線(千) Residential lines (thousands)
2 028(+3.1)
2 098 (+3.5)
2 159(+2.9)
2 190 (+1.4)
2 210(+0.9)
2 161(-2.2)
按每百名人口計算的 電話線數目 No. of exchange lines per 100 population
52.6 55.6 56.3 57.8 58.8 58.1
電話數目(2)(千)
No. of telephone sets(2) (thousands) 4 446(+5.0)
4 685(+5.4)
4 763(+1.7)
4 910 (+3.1)
5 020(+2.2)
4 941(-1.6)
按每百名人口計算的電話數目 No. of telephone sets per 100 population
68.8 71.9 72.3 74.0 74.8 73.1
固定有線電話網絡營辦商數目 No. of wireline based fixed telephone network operators
4 4 4 4 4 4
註釋: 括號內的數字是與上年比較的變動百分率。 (1) 包括直通內線式電話線、圖文傳真線及電文線路的直撥服務。 (2) 估計數字。
Notes: Figures in brackets denote percentage changes over the preceding year. (1) Including direct dialing in lines, facsimile lines and datel lines. (2) Estimated figures.
資料來源: 電訊管理局 Source: Office of the Telecommunications Authority

72
表 5.8 對外電訊通訊量 Table 5.8 External telecommunications traffic
1996 1997 1998 1999 2000 2001
對外電話總通訊量(百萬分鐘) Total external telephone traffic volume (million minutes)
3 582.1(+11.6)
3 858.7(+7.7)
3 676.1(-4.7)
4 229.3(+15.0)
4 932.9(+16.6)
5 429.6(+10.1)
撥出總數 Total outgoing
1 737.5(+4.1)
1 738.2(#)
1 718.5(-1.1)
2 550.1(+48.4)
3 074.9(+20.6)
3 487.3(+13.4)
由接線生接駁的撥出 Operator assisted outgoing
55.5(-26.4)
41.3(-25.6)
29.8(-27.8)
21.7(-27.0)
12.5(-42.4)
N.A.
對外直撥電話撥出(1)
IDD outgoing(1) 1 682.0
(+5.6)1 696.9
(+0.9)1 688.7
(-0.5)2 528.4(+49.7)
3 062.4(+21.1)
N.A.
撥入總數(2)
Total incoming (2) 1 844.6(+19.7)
2 120.5(+15.0)
1 957.6(-7.7)
1 679.2(-14.2)
1 858.0(+10.6)
1 942.3(+4.5)
對外專用電報總通訊量(3)(千分鐘)
Total external telex traffic volume(3) (thousand minutes)
27 289(-14.8)
17 376(-36.3)
11 877(-31.6)
8 202(-30.9)
6 277(-23.5)
4 424(-29.5)
對外電報總通訊量(4)(以千件計)
Total external telegram traffic volume(4) (thousand messages)
121(-26.7)
86(-28.9)
57(-33.7)
39(-31.6)
29(-25.6)
27(-6.9)
國際電話卡服務商數目(5)
No. of international calling card service providers(5)
20(+150.0)
31(+55.0)
44(+41.9)
12(-72.7)
-
3(-75.0)
2(-33.3)
對外電訊服務營辦商數目(5)
No. of external telecommunications service operators(5)
--
--
--
160-
183(+14.4)
199(+8.7)
註釋: 括號內的數字是與上年比較的變動百分率。 (1) 包括圖文傳真及數據撥出。 (2) 估計數字。 (3) 不包括轉發的專用電報。 (4) 不包括船舶與陸地之間的通訊。 (5) 國際電話卡服務於一九九三年推出。對外電訊服務於一九九九年推出,並逐步取代國際電話卡服務。
# 表示變動百分率在增減 0.05%以內。
Notes: Figures in brackets denote percentage changes over the preceding year. (1) Including facsimile and data outgoing traffic. (2) Estimated figures. (3) Not including telex refile traffic. (4) Not including ship/shore traffic. (5) International calling card service was launched in 1993. External telecommunications service was
launched in 1999 to replace the international calling card service. # Denotes change within ± 0.05%.
資料來源: 電訊管理局 Source: Office of the Telecommunications Authority

73
第 6 章 電腦產品及電訊器材的進出口 Chapter 6 Imports and Exports of Computer Products
and Telecommunications Equipment
電腦硬件及軟件 Computer hardware and software 6.1 香港是外國公司與中國內地或亞
洲其他國家之間的電腦硬件及軟件貿易
的主要中介中心。有關電腦產品的貿易活
動貨值在過去十年間顯著增長。
6.1 Hong Kong is a major intermediary centre for the trading of computer hardware and software between foreign firms and the mainland of China or other Asian countries. The value of trading activities related to computer products grew remarkably in the past decade.
電腦硬件 Computer hardware 6.2 在二零零一年,香港的電腦硬件的
進口貨值達1,289億港元,較一九九二年
(272億港元)增加374%。其整體出口貨
值(包括港產品出口及轉口)為1,146億港
元,較一九九二年的343億港元上升了
234%。(表 6.1 及圖 6.1)
6.2 In 2001, Hong Kong’s imports of computer hardware reached HK$128.9 billion, 374% greater than the figure (HK$27.2 billion) in 1992. The corresponding total exports (including domestic exports and re-exports) reached HK$114.6 billion, representing an increase of 234% over the HK$34.3 billion in 1992. (Table 6.1 and Chart 6.1)
6.3 香港的電腦硬件進口大部分來自
中國內地、美國、新加坡、馬來西亞及台
灣。二零零一年的電腦硬件進口中,來自
中國內地的貨品佔電腦硬件進口總貨值
的31.5%,而有關的比率在一九九二年則
為21.7%。美國是香港的電腦硬件的第二
大供應地。然而,其所佔香港電腦硬件進
口的比重已由一九九二年的18.7%減至二
零零一年的14.6%。(表 6.1)
6.3 Most of Hong Kong’s imports of computer hardware came from the mainland of China, the USA, Singapore, Malaysia and Taiwan. In 2001, the mainland of China accounted for 31.5% of the total import value of computer hardware, compared with 21.7% in 1992. The USA was the second largest supplier of computer hardware of Hong Kong. However, its share in Hong Kong’s imports of computer hardware decreased from 18.7% in 1992 to 14.6% in 2001. (Table 6.1)
6.4 在二零零一年,香港的電腦硬件整
體出口的首兩個目的地是中國內地和美
國,合共佔香港電腦硬件整體出口總貨值
的57.0%。(表 6.1)
6.4 In 2001, the mainland of China and the USA, the top two destinations of total exports of computer hardware, together accounted for 57.0% of Hong Kong’s total export value of computer hardware. (Table 6.1)

74
電腦軟件 Computer Software 6.5 在二零零一年,香港的電腦軟件的
進口貨值達22億港元,較一九九二年(11億港元)增加96%。其整體出口貨值(包
括港產品出口及轉口)為30億港元,較一
九九二年的6億港元上升了371%。 (表 6.2 及圖 6.2)
6.5 In 2001, Hong Kong’s imports of computer software reached HK$2.2 billion, 96% greater than the figure (HK$1.1 billion) in 1992. The corresponding total exports (including domestic exports and re-exports) reached HK$3.0 billion, representing an increase of 371% over the HK$0.6 billion in 1992. (Table 6.2 and Chart 6.2)
6.6 香港的電腦軟件進口大部分來自
新加坡、美國、中國內地、台灣及加拿大。
在二零零一年,新加坡是香港的電腦軟件
的第一大供應地。其所佔香港電腦軟件進
口的比重已由一九九二年的5.7%增加至
二零零一年的26.8%。美國是香港的電腦
軟件的第二大供應地,但其所佔香港電腦
軟件進口的比重則由一九九二年的36.5%減至二零零一年的20.6%。(表 6.2)
6.6 Most of Hong Kong’s imports of computer software came from Singapore, the USA, the mainland of China, Taiwan and Canada. In 2001, Singapore was the largest supplier of computer software of Hong Kong. Its share in Hong Kong’s imports of computer software increased from 5.7% in 1992 to 26.8% in 2001. The USA was the second largest supplier of computer software of Hong Kong in 2001. However, its share in Hong Kong’s imports of computer software decreased from 36.5% in 1992 to 20.6% in 2001. (Table 6.2)
6.7 在二零零一年,香港的電腦軟件整
體出口的首兩個目的地是中國內地和美
國,合共佔香港電腦軟件整體出口總值的
61.0%。(表 6.2)
6.7 In 2001, the mainland of China and the USA, the top two destinations of total exports of computer software, together accounted for 61.0% of Hong Kong’s total export value of computer software. (Table 6.2)
電訊器材 Telecommunications equipment 6.8 有關電訊器材的貿易活動貨值在
過去十年間也顯著增長。在二零零一年,
電訊器材的進口貨值達677億港元,較一
九九二年(145億港元)增加368%。其整
體出口貨值(包括港產品出口及轉口)為
414億港元,較一九九二年的126億港元上
升了228%。(表 6.3 及圖 6.3)
6.8 The value of trading activities related to telecommunications equipment also grew remarkably in the past decade. In 2001, imports of telecommunications equipment reached HK$67.7 billion, 368% greater than the figure (HK$14.5 billion) in 1992. The corresponding total exports (including domestic exports and re-exports) reached HK$41.4 billion, representing an increase of 228% over the HK$12.6 billion in 1992. (Table 6.3 and Chart 6.3)

75
6.9 香港的電訊器材進口大部分來自
中國內地、大韓民國、新加坡、美國及英
國。二零零一年電訊器材進口中,來自中
國內地的貨品佔電訊器材進口總貨值的
39.6%,而有關的比率在一九九二年為
33.2%。(表 6.3)
6.9 Most of Hong Kong’s imports of telecommunications equipment came from the mainland of China, Republic of Korea, Singapore, the USA and the UK. In 2001, the mainland of China accounted for 39.6% of the total import value of telecommunications equipment, compared with 33.2% in 1992. (Table 6.3)
6.10 在二零零一年,香港電訊器材整體
出口的首兩個目的地是中國內地和美
國,合共佔香港電訊器材整體出口總貨值
的52.0%。(表 6.3)
6.10 In 2001, the mainland of China and the USA, the top two destinations of total exports of telecommunications equipment, together accounted for 52.0% of Hong Kong’s total export value of telecommunications equipment. (Table 6.3)
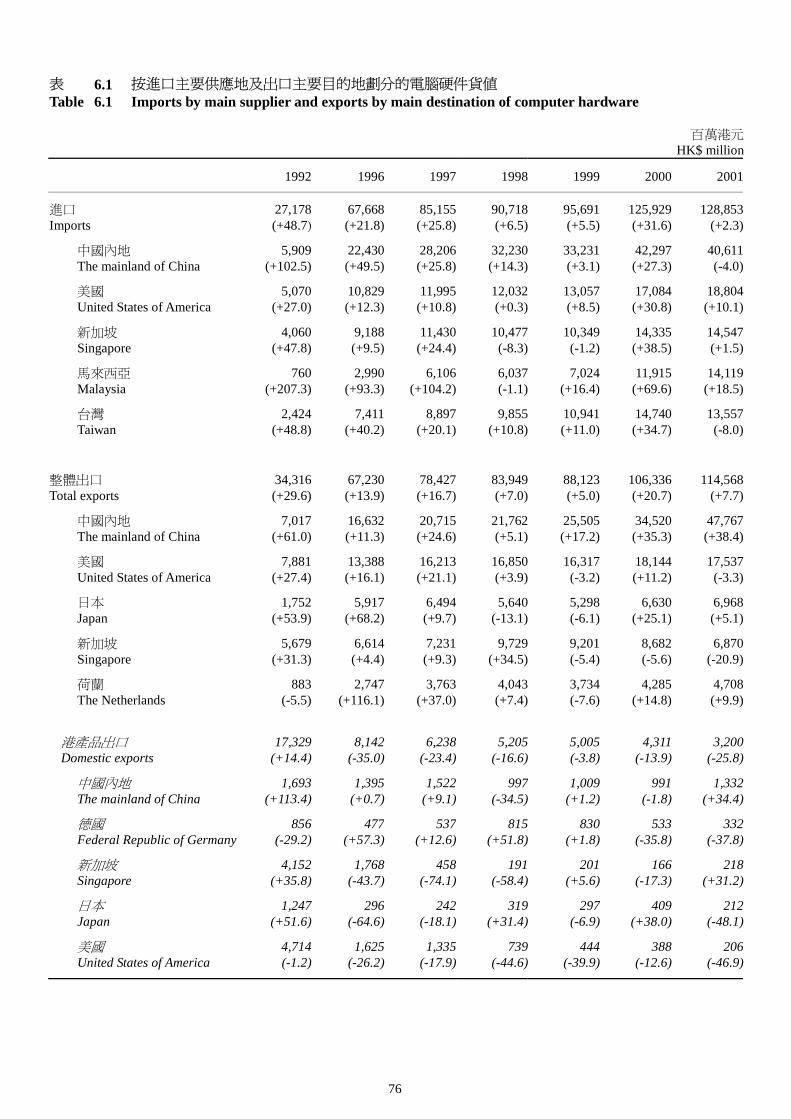
76
表 6.1 按進口主要供應地及出口主要目的地劃分的電腦硬件貨值 Table 6.1 Imports by main supplier and exports by main destination of computer hardware
百萬港元
HK$ million
1992 1996 1997 1998 1999 2000 2001
進口 Imports
27,178 (+48.7)
67,668(+21.8)
85,155(+25.8)
90,718(+6.5)
95,691(+5.5)
125,929(+31.6)
128,853(+2.3)
中國內地 The mainland of China
5,909 (+102.5)
22,430(+49.5)
28,206(+25.8)
32,230(+14.3)
33,231(+3.1)
42,297(+27.3)
40,611(-4.0)
美國 United States of America
5,070 (+27.0)
10,829(+12.3)
11,995(+10.8)
12,032(+0.3)
13,057(+8.5)
17,084(+30.8)
18,804(+10.1)
新加坡 Singapore
4,060 (+47.8)
9,188(+9.5)
11,430(+24.4)
10,477(-8.3)
10,349(-1.2)
14,335(+38.5)
14,547(+1.5)
馬來西亞 Malaysia
760 (+207.3)
2,990(+93.3)
6,106(+104.2)
6,037(-1.1)
7,024(+16.4)
11,915(+69.6)
14,119(+18.5)
台灣 Taiwan
2,424 (+48.8)
7,411(+40.2)
8,897(+20.1)
9,855(+10.8)
10,941(+11.0)
14,740(+34.7)
13,557(-8.0)
整體出口 Total exports
34,316 (+29.6)
67,230(+13.9)
78,427(+16.7)
83,949(+7.0)
88,123(+5.0)
106,336(+20.7)
114,568(+7.7)
中國內地 The mainland of China
7,017 (+61.0)
16,632(+11.3)
20,715(+24.6)
21,762(+5.1)
25,505(+17.2)
34,520(+35.3)
47,767(+38.4)
美國 United States of America
7,881 (+27.4)
13,388(+16.1)
16,213(+21.1)
16,850(+3.9)
16,317(-3.2)
18,144(+11.2)
17,537(-3.3)
日本 Japan
1,752 (+53.9)
5,917(+68.2)
6,494(+9.7)
5,640(-13.1)
5,298(-6.1)
6,630(+25.1)
6,968(+5.1)
新加坡 Singapore
5,679 (+31.3)
6,614(+4.4)
7,231(+9.3)
9,729(+34.5)
9,201(-5.4)
8,682(-5.6)
6,870(-20.9)
荷蘭 The Netherlands
883 (-5.5)
2,747(+116.1)
3,763(+37.0)
4,043(+7.4)
3,734(-7.6)
4,285(+14.8)
4,708(+9.9)
港產品出口 Domestic exports
17,329 (+14.4)
8,142(-35.0)
6,238(-23.4)
5,205(-16.6)
5,005(-3.8)
4,311(-13.9)
3,200(-25.8)
中國內地 The mainland of China
1,693 (+113.4)
1,395(+0.7)
1,522(+9.1)
997(-34.5)
1,009(+1.2)
991(-1.8)
1,332(+34.4)
德國 Federal Republic of Germany
856 (-29.2)
477(+57.3)
537(+12.6)
815(+51.8)
830(+1.8)
533(-35.8)
332(-37.8)
新加坡 Singapore
4,152 (+35.8)
1,768(-43.7)
458(-74.1)
191(-58.4)
201(+5.6)
166(-17.3)
218(+31.2)
日本 Japan
1,247 (+51.6)
296(-64.6)
242(-18.1)
319(+31.4)
297(-6.9)
409(+38.0)
212(-48.1)
美國 United States of America
4,714 (-1.2)
1,625(-26.2)
1,335(-17.9)
739(-44.6)
444(-39.9)
388(-12.6)
206(-46.9)

77
表 6.1 按進口主要供應地及出口主要目的地劃分的電腦硬件貨值(續) Table 6.1 Imports by main supplier and exports by main destination of computer hardware (Cont’d)
百萬港元
HK$ million
1992 1996 1997 1998 1999 2000 2001
轉口 Re-exports
16,987 (+49.7)
59,088(+27.0)
72,189(+22.2)
78,743(+9.1)
83,117(+5.6)
102,025(+22.7)
111,368(+9.2)
中國內地 The mainland of China
5,324 (+49.3)
15,237(+12.4)
19,194(+26.0)
20,765(+8.2)
24,496(+18.0)
33,529(+36.9)
46,435(+38.5)
美國 United States of America
3,167 (+123.9)
11,762(+26.1)
14,878(+26.5)
16,111(+8.3)
15,873(-1.5)
17,756(+11.9)
17,331(-2.4)
日本 Japan
505 (+59.8)
5,621(+109.7)
6,251(+11.2)
5,321(-14.9)
5,002(-6.0)
6,221(+24.4)
6,755(+8.6)
新加坡 Singapore
1,526 (+20.3)
4,845(+51.9)
6,773(+39.8)
9,538(+40.8)
9,000(-5.6)
8,516(-5.4)
6,652(-21.9)
荷蘭 The Netherlands
449 (+79.6)
2,439(+115.1)
3,302(+35.4)
3,679(+11.4)
3,454(-6.1)
4,179(+21.0)
4,678(+11.9)
註釋: 括號內的數字是與上年比較的變動百分率。 Note: Figures in brackets denote percentage changes over the preceding year.
資料來源: 政府統計處貿易統計資料發布組 Source: Trade Statistics Dissemination Section, Census and Statistics Department

78
0
20,000
40,000
60,000
80,000
100,000
120,000
140,000
1992 1993 1994 1995 1996 1997 1998 1999 2000 2001
百萬港元
HK$ million
圖 6.1 電腦硬件的進出口貨值 Chart 6.1 Imports and exports of computer hardware
註釋:
(1)
包括港產品出口及轉口。
Note: (1) Including domestic exports and re-exports.
資料來源: 政府統計處貿易統計資料發布組 Source: Trade Statistics Dissemination Section, Census and Statistics Department
進口 Imports
整體出口 (1)
Total exports (1)

79
表 6.2 按進口主要供應地及出口主要目的地劃分的電腦軟件貨值 Table 6.2 Imports by main supplier and exports by main destination of computer software
百萬港元
HK$ million
1992 1996 1997 1998 1999 2000 2001
進口 Imports
1,139 (+40.7)
1,305(-35.9)
1,459(+11.7)
1,166(-20.0)
1,329(+14.0)
1,458(+9.7)
2,234(+53.2)
新加坡 Singapore
65 (+0.1)
157(+22.2)
310(+96.9)
247(-20.3)
212(-14.2)
333(+57.0)
598(+79.9)
美國 United States of America
416 (+39.4)
528(-35.0)
592(+12.1)
387(-34.6)
431(+11.3)
414(-3.8)
460(+11.1)
中國內地 The mainland of China
7 (+165.8)
52(+14.0)
37(-29.3)
37(+1.3)
132(+253.7)
328(+149.1)
428(+30.4)
台灣 Taiwan
73 (+99.5)
152(-20.6)
100(-33.9)
96(-4.0)
148(+53.3)
131(-11.2)
309(+135.6)
加拿大 Canada
9 (+34.7)
24(+8.4)
17(-29.3)
15(-12.7)
25(+71.9)
15(-39.9)
136(+793.7)
整體出口 Total exports
635 (+60.0)
711(-37.2)
604(-15.0)
781(+29.3)
1,537(+96.7)
1,723(+12.1)
2,989(+73.5)
中國內地 The mainland of China
90 (+97.0)
295(+20.0)
291(-1.5)
353(+21.2)
670(+90.0)
880(+31.3)
1,166(+32.4)
美國 United States of America
81 (+52.0)
58(-55.5)
58(-0.5)
197(+242.1)
536(+172.4)
484(-9.8)
658(+35.9)
台灣 Taiwan
77 (+41.7)
32(-73.8)
23(-26.8)
36(+57.2)
46(+26.9)
129(+179.6)
621(+382.6)
日本 Japan
45 (+51.8)
92(-50.8)
82(-11.0)
42(-47.9)
36(-14.3)
48(+32.8)
259(+434.8)
大韓民國 Republic of Korea
43 (-0.4)
11(-62.3)
18(+58.9)
3(-82.4)
105(+3 209.4)
46(-56.5)
95(+107.6)
港產品出口 Domestic exports
199 (+210.6)
149(-57.1)
155(+3.8)
339(+119.0)
809(+138.9)
844(+4.4)
1,358(+60.9)
美國 United States of America
44 (+154.7)
21(-57.5)
26(+22.0)
165(+541.9)
456(+177.1)
424(-7.1)
538(+26.9)
中國內地 The mainland of China
15 (+332.5)
5(-89.2)
14(+190.5)
75(+443.3)
244(+226.1)
321(+31.3)
275(-14.3)
日本 Japan
24 (+99.4)
84(-23.1)
62(-25.7)
41(-35.1)
28(-31.4)
40(+42.6)
247(+522.7)
台灣 Taiwan
16 (+124.9)
7(-58.8)
7(+4.7)
19(+150.0)
11(-39.5)
13(+16.7)
157(+1 096.4)
大韓民國 Republic of Korea
3 (-8.0)
3(+511.0)
2(-43.4)
*(-74.2)
4(+716.0)
4(+5.3)
35(+747.6)

80
表 6.2 按進口主要供應地及出口主要目的地劃分的電腦軟件貨值(續) Table 6.2 Imports by main supplier and exports by main destination of computer software (Cont’d)
百萬港元
HK$ million
1992 1996 1997 1998 1999 2000 2001
轉口 Re-exports
436 (+31.0)
562(-28.3)
449(-20.0)
443(-1.5)
728 (+64.5)
878(+20.7)
1,631(+85.7)
中國內地 The mainland of China
75 (+77.5)
291(+43.8)
277(-4.6)
278(+0.2)
426 (+53.3)
560(+31.4)
891(+59.2)
台灣 Taiwan
61 (+29.3)
24(-76.3)
16(-35.9)
18(+13.1)
35 (+96.7)
116(+232.3)
464(+301.5)
美國 United States of America
37 (+3.5)
37(-54.4)
32(-13.4)
32(+0.7)
80 (+148.5)
60(-24.8)
120(+100.0)
大韓民國 Republic of Korea
40 (+0.2)
8(-72.8)
16(+101.1)
3(-83.3)
101 (+3 658.4)
42(-58.9)
60(+43.5)
日本 Japan
22 (+20.3)
8(-90.0)
19(+148.8)
2(-89.9)
9 (+344.8)
9(+1.1)
11(+32.1)
註釋: 括號內的數字是與上年比較的變動百分率。 * 少於五十萬。
Notes: Figures in brackets denote percentage changes over the preceding year. * Less than 0.5 million.
資料來源: 政府統計處貿易統計資料發布組 Source: Trade Statistics Dissemination Section, Census and Statistics Department

81
0
500
1,000
1,500
2,000
2,500
3,000
3,500
1992 1993 1994 1995 1996 1997 1998 1999 2000 2001
百萬港元
HK$ million
圖 6.2 電腦軟件的進出口貨值 Chart 6.2 Imports and exports of computer software
註釋:
(1)
包括港產品出口及轉口。
Note: (1) Including domestic exports and re-exports.
資料來源: 政府統計處貿易統計資料發布組 Source: Trade Statistics Dissemination Section, Census and Statistics Department
進口 Imports
整體出口 (1)
Total exports (1)

82
表 6.3 按進口主要供應地及出口主要目的地劃分的電訊器材貨值 Table 6.3 Imports by main supplier and exports by main destination of telecommunications equipment
百萬港元
HK$ million
1992 1996 1997 1998 1999 2000 2001
進口 Imports
14,463 (+33.2)
43,968(+10.8)
58,478(+33.0)
51,727(-11.5)
44,252 (-14.5)
62,083(+40.3)
67,682(+9.0)
中國內地 The mainland of China
4,796 (+16.0)
14,905(+23.6)
16,873(+13.2)
16,362(-3.0)
20,744 (+26.8)
29,415(+41.8)
26,815(-8.8)
大韓民國 Republic of Korea
172 (+179.2)
879(+40.7)
3,146(+258.1)
5,597(+77.9)
5,797 (+3.6)
8,197(+41.4)
9,598(+17.1)
新加坡 Singapore
1,065 (+152.4)
5,416(-16.6)
6,796(+25.5)
4,937(-27.4)
1,940 (-60.7)
2,226(+14.7)
3,531(+58.6)
美國 United States of America
1,343 (+13.1)
5,321(-8.2)
6,581(+23.7)
4,654(-29.3)
3,045 (-34.6)
3,192(+4.8)
3,346(+4.8)
英國 United Kingdom
632 (+62.5)
2,592(-12.2)
4,403(+69.9)
3,061(-30.5)
1,884 (-38.5)
2,896(+53.7)
3,316(+14.5)
整體出口 Total exports
12,608 (+14.7)
29,410(+12.8)
31,612(+7.5)
34,180(+8.1)
34,880 (+2.0)
42,339(+21.4)
41,360(-2.3)
中國內地 The mainland of China
3,403 (+40.1)
8,617(+29.9)
9,646(+11.9)
10,865(+12.6)
9,517 (-12.4)
10,390(+9.2)
12,080(+16.3)
美國 United States of America
4,359 (+6.4)
7,663(-6.7)
8,937(+16.6)
9,325(+4.3)
11,080 (+18.8)
13,438(+21.3)
9,408(-30.0)
德國 Federal Republic of Germany
739 (+31.9)
1,378(+10.0)
1,174(-14.8)
791(-32.6)
1,289 (+62.9)
1,706(+32.4)
3,719(+117.9)
新加坡 Singapore
271 (+3.9)
604(-28.3)
703(+16.4)
1,057(+50.3)
1,097 (+3.8)
1,104(+0.7)
1,522(+37.8)
菲律賓 The Philippines
26 (-19.6)
968(+101.2)
590(-39.0)
468(-20.8)
475 (+1.5)
887(+86.7)
1,359(+53.3)
港產品出口 Domestic exports
2,320 (-16.3)
1,946(+5.2)
2,555(+31.3)
1,898(-25.7)
1,284 (-32.4)
1,456(+13.4)
1,448(-0.6)
中國內地 The mainland of China
1,012 (+10.1)
1,088(+21.5)
1,696(+55.9)
1,340(-20.9)
989 (-26.2)
1,217(+23.1)
1,311(+7.7)
美國 United States of America
707 (-18.9)
362(-47.3)
300(-17.1)
199(-33.5)
168 (-15.6)
123(-27.1)
42(-66.1)
荷蘭 The Netherlands
17 (-48.2)
82(+828.3)
69(-15.6)
48(-30.5)
26 (-46.9)
*(-98.6)
14(+3 932.4)
日本 Japan
44 (-65.4)
91(+708.2)
203(+121.8)
124(-38.7)
17 (-86.3)
13(-25.4)
11(-11.8)
英國 United Kingdom
70 (-60.6)
70(+309.1)
53(-24.8)
23(-57.4)
12 (-47.0)
29(+139.7)
11(-62.8)

83
表 6.3 按進口主要供應地及出口主要目的地劃分的電訊器材貨值(續) Table 6.3 Imports by main supplier and exports by main destination of telecommunications equipment
(Cont’d)
百萬港元 HK$ million
1992 1996 1997 1998 1999 2000 2001
轉口 Re-exports
10,289 (+25.1)
27,464(+13.4)
29,057(+5.8)
32,282(+11.1)
33,596(+4.1)
40,883(+21.7)
39,912(-2.4)
中國內地 The mainland of China
2,391 (+58.3)
7,530(+31.2)
7,951(+5.6)
9,525(+19.8)
8,528(-10.5)
9,173(+7.6)
10,769(+17.4)
美國 United States of America
3,652 (+13.2)
7,301(-3.0)
8,637(+18.3)
9,125(+5.7)
10,912(+19.6)
13,315(+22.0)
9,366(-29.7)
德國 Federal Republic of Germany
689 (+44.8)
1,353(+12.3)
1,158(-14.4)
778(-32.9)
1,284(+65.2)
1,704(+32.7)
3,713(+117.8)
新加坡 Singapore
257 (+10.1)
583(-30.2)
688(+17.9)
1,039(+51.2)
1,083(+4.2)
1,085(+0.2)
1,516(+39.7)
菲律賓 The Philippines
24 (-14.8)
950(+98.9)
543(-42.8)
454(-16.4)
463(+2.0)
875(+88.7)
1,350(+54.4)
註釋: 括號內的數字是與上年比較的變動百分率。 * 少於五十萬。
Notes: Figures in brackets denote percentage changes over the preceding year. * Less than 0.5 million.
資料來源: 政府統計處貿易統計資料發布組 Source: Trade Statistics Dissemination Section, Census and Statistics Department

84
0
10,000
20,000
30,000
40,000
50,000
60,000
70,000
80,000
1992 1993 1994 1995 1996 1997 1998 1999 2000 2001
百萬港元
HK$ million
圖 6.3 電訊器材的進出口貨值 Chart 6.3 Imports and exports of telecommunications equipment
註釋:
(1)
包括港產品出口及轉口。
Note: (1) Including domestic exports and re-exports.
資料來源: 政府統計處貿易統計資料發布組 Source: Trade Statistics Dissemination Section, Census and Statistics Department
進口 Imports
整體出口 (1)
Total exports (1)
85
第 7 章 資訊科技的人力資源 Chapter 7 Human Resources in Information
Technology
資訊科技範疇現時的人力需求 Existing manpower requirement in the
information technology (IT) field 7.1 資訊科技是預期在未來數十年有
所發展的範疇。與資訊科技有關的職業
(或從事這些職業的資訊科技人員)存在
於差不多每一個行業,但參與程度各有不
同。因此,從職業角度探討資訊科技人力
需求,較從行業角度更為適合。
7.1 IT is an area which is expected to expand in the coming decades. As IT-related occupations (or IT personnel engaged in these occupations) can be found in nearly every industry but at varying degree of participation, it should therefore be more appropriate to tackle the issue from the occupation perspective rather than from industry in assessing IT manpower requirement.
7.2 職業訓練局屬下資訊科技訓練發
展委員會在二零零零年三月進行資訊科
技業人力調查。調查顯示,二零零零年三
月時,本港共有61 356人從事資訊科技有
關的主要職務。(圖 7.1)
7.2 The committee on Information Technology Training and Development of the Vocational Training Council conducted manpower survey of the IT sector in March 2000. The survey revealed that in March 2000, a total of 61 356 persons were employed in the principal IT-related jobs in Hong Kong. (Chart 7.1)
7.3 在61 356人資訊科技僱員中,應用
系統開發人員有16 706人(27.2%);硬件
支援人員有10 526人(17.2%);系統程式
編製人員有7 998人(13.0%);資訊科技管
理人員有7 191人(11.7%);電訊及網絡人
員有6 197人(10.1%);其餘為系統操作、
資訊科技教育及訓練、互聯網/多媒體/內
容開發、資料庫及資訊科技研究及產品開
發人員。(圖 7.1)
7.3 Among the 61 356 IT employees, 16 706 (27.2%) were in application systems development, 10 526 (17.2%) in hardware support, 7 998 (13.0%) in systems programming, 7 191 (11.7%) in IT management, 6 197(10.1%) in telecommunications and networking, and the rest in systems operation, IT education and training, Internet/multimedia/ contents development, database, and IT research and product development. (Chart 7.1)
7.4 該調查顯示,僱用最多資訊科技員
工的行業為批發、零售、進出口貿易、飲
食及酒店業,有21 755人,佔資訊科技僱
員總數的35.5%;其次為金融、保險、地
產及商用服務行業有18 230人(29.7%);
再其次為社區、社會及個人服務行業,有
6 209人(10.1%)。(圖 7.2)
7.4 The survey showed that the wholesale, retail and import/export trades, restaurants and hotels sector had 21 755 IT employees, accounting for 35.5% of the total IT manpower, followed by the financing, insurance, real estate and business services sector (18 230 or 29.7%) and the community, social and personal services sector (6 209 or 10.1%). (Chart 7.2)

86
應用系統開發
Application systems development
硬件支援
Hardware support
系統程式編製 Systems programming
資訊科技管理 IT management
電訊及網絡 Telecommunications and
networking
系統操作 System operation
資訊科技教育及訓練 IT education and training
互聯網/多媒體/內容開發 Internet/multimedia/
contents development
資料庫 Database
資訊科技研究及產品開發
IT research and product development
技能類別 Job nature
僱員總人數 : 61 356 Total number of IT employees : 61 356
圖 7.1 二零零零年三月按技能類別劃分的資訊科技業人力結構 Chart 7.1 Manpower structure of the information technology (IT) sector by nature of job, March 2000
註釋: 括號內的數字為佔資訊科技僱員總數的百分比。 Note: Figures in brackets denote the percentage share of the total number of IT employees.
資料來源: 職業訓練局 Source: Vocational Training Council
7 998 (13.0%)
10 526 (17.2%)
16 706 (27.2%)
7 191 (11.7%)
6 197 (10.1%)
4 374 (7.1%)
3 261 (5.3%)
2 669 (4.4%)
1 330 (2.2%)
1 104 (1.8%)
0 2 000 4 000 6 000 8 000 10 000 12 000 14 000 16 000 18 000
資訊科技僱員人數 Number of IT employees

87
圖 7.2 二零零零年三月按行業分類的資訊科技僱員分布 Chart 7.2 Distribution of information technology (IT) employees by sector, March 2000
註釋: 括號內的數字是資訊科技僱員總數的百分比。 Note: Figures in brackets denote the percentage share of the total number of IT employees.
資料來源: 職業訓練局 Source: Vocational Training Council
批發、零售、
進出口貿易、
飲食及酒店業
Wholesale, retail andimport/export trades,restaurants and hotels21 755 (35.5%)
軟件銷售業
Software vendor3 985 (6.5%)
電力、燃氣及
水務業
Electricity,gas and water376 (0.6%)
金融、保險、地產
及商用服務業
Financing, insurance,real estate andbusiness services18 230 (29.7%)
建造業
Construction851 (1.4%)
運輸、倉庫及
通訊業
Transport, storageand communications4 846 (7.9%) 製造業
Manufacturing2 789 (4.5%)
政府決策局/部門
Governmentbureaux/departments2 315 (3.8%)
社區、社會及
個人服務業
Community, socialand personal services6 209 (10.1%)
僱員總人數 : 61 356 Total number of IT employees : 61 356


89
第 8 章 資訊科技的教育 Chapter 8 Education in Information Technology
大學教育資助委員會(教資會)資助的資訊科技課程的畢業生
Graduates of information technology (IT) programmes funded by the University Grants Committee (UGC)
8.1 在香港,受教資會資助的八間大專
院校中,六間大專院校現時有開辦與資訊
科技有關的副學位、學士學位及研究院課
程。
8.1 Among the eight UGC–funded institutions in Hong Kong, six institutions are currently offering IT-related programmes at sub-degree, undergraduate and postgraduate levels.
8.2 教資會資助的資訊科技有關課程
的畢業生(包括全日制和兼讀制學生)總
人數,由一九九六/九七年的2 007人增加
至二零零零/零一年的2 641人,平均每年
增加7.1%。(表 8.1)
8.2 The total number of graduates (including both full-time and part-time students) of UGC-funded IT-related programmes increased from 2 007 in 1996/97 to 2 641 in 2000/01, representing an average annual growth rate of 7.1%. (Table 8.1)
8.3 在二零零零/零一年的2 641名畢
業生中,1 672人(63.3%)是學士學位畢
業生,508人(19.2%)是副學位畢業生,
另外461人(17.5%)是研究院課程的畢業
生。(表 8.1)
8.3 Among the 2 641 graduates in 2000/01, 1 672 (63.3%) were first degree graduates, 508 (19.2%) were sub-degree graduates and 461 (17.5%) were graduates of postgraduate programmes. (Table 8.1)
大學教育資助委員會(教資會)資助
的資訊科技課程的新收學生 Student intake of information technology (IT) programmes funded by the University Grants Committee (UGC)
8.4 教資會資助的資訊科技有關課程
的新收學生(包括全日制和兼讀制學生)
的總人數,由一九九六/九七年的2 346人增加至二零零零/零一年的2 993人,平均
每年增加6.3%。(表 8.2)
8.4 The total student intake (including both full-time and part-time students) of UGC-funded IT-related programmes increased from 2 346 in 1996/97 to 2 993 in 2000/01, representing an average annual growth rate of 6.3%. (Table 8.2)

90
大學教育資助委員會(教資會)資助的資訊科技課程的學生
Student enrolment of information technology (IT) programmes funded by the University Grants Committee (UGC)
8.5 教資會資助的資訊科技有關課程
的學生(包括全日制和兼讀制學生)總人
數,由一九九六/九七年的7 066人增加至
二零零零/零一年的8 533人,平均每年增
加4.8%。(表 8.3)
8.5 The student enrolment (including both full-time and part-time students) of UGC-funded IT-related programmes increased from 7 066 in 1996/97 to 8 533 in 2000/01, representing an average annual growth rate of 4.8%. (Table 8.3)
政府在資訊科技教育及電腦科目方面的開支
Government spending on information technology (IT) education and computer subjects
8.6 政府一向在教育和培訓方面投入
龐大資源,近來更特別專注發展資訊科技
教育。
8.6 The Government has consistently made substantial investments in education and training, and has in recent years increased its focus on IT.
8.7 為推動資訊科技教育的發展,「與
時並進–善用資訊科技學習」的五年策略
(一九九八/九九至二零零二/零三年度)
已在中小學實施。其目的在於把學校變成
充滿活力和創意的學習場所,培訓學生有
效及迅速處理資訊的能力,及養成終身學
習的態度。
8.7 A five-year (1998/99 to 2002/03) strategy “Information Technology for Learning in a New Era” in primary and secondary schools has been launched to drive the development of IT in education. The aim is to turn schools into dynamic and innovative learning institutions where students can develop capabilities to process information effectively and efficiently, and to acquire the mindset required for independent life-long learning.
8.8 在一九九八/九九至二零零一/零
二年度,政府在小學、中學、特殊學校及
教育署的資訊科技教育及電腦科目方面
的開支為31億港元,當中23億港元為非經
常開支,而8億港元為經常開支。(表 8.4)
8.8 During 1998/99 to 2001/02, the Government has spent HK$3.1 billion on IT education and computer subjects in primary schools, secondary schools, special schools and the Education Department, including HK$2.3 billion in capital expenditure and HK$0.8 billion in recurrent expenditure. (Table 8.4)
資訊科技教育 Information technology (IT) education 8.9 在推動資訊科技教育五年(一九九
八/九九至二零零二/零三年度)策略方
面,政府擔當領導和統籌的角色;學校則
可因應本身的需要而自行擬定資訊科技
計劃及制訂把資訊科技融入課程的進度。
8.9 Under the five year (1998/99 – 2002/03) strategy on IT education, the Government assumes a leading and co-ordinating role in the promotion of IT in education, and schools are given the flexibility to devise their own IT plans and to set the pace for incorporating IT in their curriculum.

91
8.10 以下列出幾個資訊科技教育的特
點﹕ 8.10 The following highlights some of the features of IT in education:
在二零零零/零一學年,小學及中
學教師曾參與2 183個資訊科技培
訓課程。(表 8.5)
For the school year 2000/01, 2 183 IT courses were attended by primary and secondary teachers. (Table 8.5)
在二零零一/零二學年,1 127名資
訊科技統籌員獲分配到小學及中
學,其中626名在小學及501名在中
學。(表 8.6)
For the school year 2001/02, 1 127 information technology coordinators were allocated to primary and secondary schools, with 626 in primary schools and 501 in secondary schools. (Table 8.6)
在二零零零/零一學年,22個課程
以資訊科技及通訊科技輔助教
學。(表 8.7)
For the school year 2000/01, 22 school curriculums were assisted with information and communication technologies. (Table 8.7)
在二零零一/零二學年,100%的小
學及中學已接駁上互聯網。 For the school year 2001/02, 100% primary
and secondary schools were connected to Internet.
在二零零零/零一學年,2 584名中
學教師任教資訊科技/電腦科目。
(表 8.8)
For the school year 2000/01, 2 584 secondary school teachers were teaching IT/computer studies. (Table 8.8)

92
表 8.1 按修課程度劃分的大學教育資助委員會資助的資訊科技課程的畢業生 Table 8.1 Graduates of information technology programmes funded by University Grants Committee by
level of study
畢業生人數 Number of graduates
學年 School year
修課程度 Level of study 1996/97 1997/98 1998/99 1999/2000 2000/01
副學位程度 Sub-degree
310 388 445 460 508
學士學位程度 Undergraduate
1 439 1 512 1 494 1 730 1 672
研究院修課課程 Taught postgraduate
156 211 236 241 269
研究院研究課程 Research postgraduate
102 99 124 129 192
總計 Total
2 007 2 210 2 299 2 560 2 641
資料來源: 大學教育資助委員會 Source: University Grants Committee
表 8.2 按修課程度劃分的大學教育資助委員會資助的資訊科技課程的新收學生人數 Table 8.2 Student intake of information technology programmes funded by University Grants Committee
by level of study
學生人數 Number of students
學年 School year
修課程度 Level of study 1996/97 1997/98 1998/99 1999/2000 2000/01
副學位程度 Sub-degree
421 396 533 554 580
學士學位程度 Undergraduate
1 553 1 541 1 603 1 766 1 854
研究院修課課程 Taught postgraduate
212 229 234 224 353
研究院研究課程 Research postgraduate
160 178 190 205 206
總計 Total
2 346 2 344 2 560 2 749 2 993
資料來源: 大學教育資助委員會 Source: University Grants Committee

93
表 8.3 按修課程度劃分的大學教育資助委員會資助的資訊科技課程的學生人數 Table 8.3 Student enrolment of information technology programmes funded by University Grants
Committee by level of study
學生人數 Number of students
學年 School year
修課程度 Level of study 1996/97 1997/98 1998/99 1999/2000 2000/01
副學位程度 Sub-degree
1 098 1 115 1 211 1 357 1 412
學士學位程度 Undergraduate
5 113 5 213 5 286 5 685 6 012
研究院修課課程 Taught postgraduate
523 558 548 537 674
研究院研究課程 Research postgraduate
332 357 410 436 435
總計 Total
7 066 7 243 7 455 8 015 8 533
資料來源: 大學教育資助委員會 Source: University Grants Committee

94
表 8.4 按院校類別及開支類別劃分的政府在資訊科技教育及電腦科目方面的開支 Table 8.4 Government spending on information technology education and computer subjects by type of
institute and type of expenditure
百萬港元 HK$ million
學年 School year
院校類別 Type of institute
開支類別 Type of expenditure 1998/99 1999/2000 2000/01 2001/02
非經常開支 Capital expenditure
149.25 383.64 294.93 56.57小學 Primary
經常開支 Recurrent expenditure
25.60 66.42 125.23 163.72
非經常開支 Capital expenditure
173.55 638.53 433.82 87.64中學 Secondary
經常開支 Recurrent expenditure
25.03 68.73 113.64 166.64
非經常開支 Capital expenditure
9.07 36.79 40.21 10.34特殊學校 Special schools
經常開支 Recurrent expenditure
2.44 7.26 10.80 12.79
非經常開支 Capital expenditure
1.27 4.23 1.48 1.31教育署 Education Department
經常開支 Recurrent expenditure
0.09 0.09 0.09 0.09
非經常開支 Capital expenditure
333.13 1,063.19 770.44 155.86小計 Sub-total
經常開支 Recurrent expenditure
53.16 142.50 249.77 343.24
總計 Total
386.29 1,205.68 1,020.21 499.10
資料來源: 教育署統計組 Source: Statistics Section, Education Department

95
表 8.5 按小學及中學劃分的資訊科技培訓課程數目及教師參與人數 Table 8.5 Number of information technology (IT) courses and teachers attending those courses by primary
education and secondary education
學年 School year
1996/97 1997/98 1998/99 1999/2000 2000/01
課程數目
No. of courses
教師 人數
Number of
teachers
課程數目
No. of courses
教師人數
Number of
teachers
課程數目
No. of courses
教師人數
Number of
teachers
課程 數目
No. of courses
教師人數
Number of
teachers
課程數目
No. of courses
教師人數
Number of
teachers
由課程發展處提供的資訊科技培訓課程 IT courses offered by Curriculum Development Institute
小學 Primary education
22 660 6 211 28 840 1 30 - -
中學 Secondary education
46 1 487 37 1 205 53 1 992 30 1 292 27 805
由課程發展處「為小學提供多媒體電腦」計劃提供的資訊科技培訓課程(1) IT courses under “Provision of Multimedia Computers for Primary Schools” offered by Curriculum Development Institute(1)
小學 Primary education
- - - - - 42 681 - 22 744 - -
由基礎設施科提供的資訊科技培訓課程 IT courses offered by Infrastructure Division
小學 Primary education
- - - - - - 307 5 124 642 10 269
中學 Secondary education
- - - - - - 287 4 970 564 9 010
由基礎設施科提供的資訊科技教育複修課程 IT in Education Refresher Training Courses offered by Infrastructure Division
小學 Primary education
- - - - 70 1 343 1 232 24 561 560 11 767
中學 Secondary education
- - - - 0 0 441 8 618 390 8 542
註釋: (1) 由課程發展處「為小學提供多媒體電腦」計劃提供的資訊科技培訓課程的數字是以財政年度劃分的。Note: (1) Figures for IT courses under “Provision of Multimedia Computers for Primary Schools” offered by Curriculum
Development Institute are presented by financial year.
資料來源: 教育署課程發展處及基礎設施科 Source: Curriculum Development Institute and Infrastructure Division, Education Department

96
表 8.6 按小學及中學劃分的資訊科技統籌員人數 Table 8.6 Information technology coordinators by primary education and secondary education
資訊科技統籌員人數
Number of information technology coordinators
學年 School year
小學/中學 Primary/secondary education 1998/99 1999/2000 2000/01 2001/02
小學 Primary education
10 63 164* 626*
中學 Secondary education
10 77 269* 501*
總計 Total
20 140 433* 1 127*
註釋: * 包括由優質教育基金資助的額外人力資源。 Note: * Include additional human resources funded by the Quality Education Fund.
資料來源: 教育署基礎設施科 Source: Infrastructure Division, Education Department
表 8.7 以資訊科技及通訊科技輔助教學的課程數目 Table 8.7 School curriculums with the assistance of information and communication technologies
課程數目
Number of school curriculums
學年 School year
1982/83 1987/88 1992/93 1995/96 1997/98 2000/01
中學 Secondary education
1 2 4 5 6 22
資料來源: 教育署統計組 Source: Statistics Section, Education Department
表 8.8 任教資訊科技/電腦的中學教師人數 Table 8.8 Secondary school teachers teaching information technology/computer studies
教師人數
Number of teachers
學年 School year
1996/97 1997/98 1998/99 1999/2000 2000/01
中學 Secondary education
1 883 1 961 2 088 2 291 2 584
資料來源: 教育署統計組 Source: Statistics Section, Education Department

97
定 義 及 詞 彙 Definitions and Terms
1. 資訊科技在住戶的使用情況和普
及程度 1. Information Technology Usage and Penetration in Households
1.1 電子商業服務 泛指透過電子方法、方
式及程序進行的各種商業活動。這些活動基
本上包括網上訂購貨品及服務、網上搜尋貨
品/服務資料、自動操作的客戶諮詢熱線及處
理網上繳費及交易(例如﹕處理銀行事務)。
1.1 Electronic business services are broadly defined as the use of electronic methods, means and procedures to conduct various forms of business activity. These basically include online ordering of goods and services, online searching of information on goods/services, automated customer account inquiries and handling of online payment and transactions (e.g. banking transactions).
1.2 公共服務電子化計劃 是香港特別行
政區政府「數碼21」資訊科技策略下的一項
重要措施,透過互聯網及其他電子途徑為市
民提供一百多項電子公共服務,包括遞交報
稅表,申請個人獨資經營業務的商業登記,
繳交政府收費,登記職位空缺及挑選求職者
等。
1.2 Electronic Service Delivery Scheme is a key initiative under the “Digital 21” Information Technology Strategy of the Government of the Hong Kong Special Administrative Region to provide over 100 types of online public services to the community through the Internet and other electronic means. Examples of services include filing of tax returns, application for business registration certificate by sole proprietors, paying of Government bills, registration of job vacancies, and searching for job applicants, etc.
1.3 個人電腦 是指為個人使用而設的電
腦,包括桌面電腦、便攜式/筆記簿型電腦及
個人數碼助理。不包括伺服器及用於主機或
小型電腦的工作站和終端機。
1.3 Personal computer refers to a computer designed for individual use. Personal computer includes desktop computer, laptop/notebook computer and Personal Digital Assistant. Servers, workstations and terminals of mainframe or minicomputer are not included.

98
2. 資訊科技在工商業的使用情況和
普及程度 2. Information Technology Usage and Penetration in the Business Sector
2.1 寬頻互聯網接駁 指利用導線解調
器、異步傳輸模式(ATM)、非對稱數碼用戶
線路(ADSL)、數碼用戶線路(DSL)或其
他技術而下載速度達每秒一兆比特或以上的
服務。
2.1 Broadband Internet access refers to services with downloading speed of 1 Mbps or above using cable modem, ATM (asynchronous transfer mode), ADSL (asymmetric digital subscriber line), DSL (digital subscriber line) or other technology.
2.2 業務收益 是指某機構透過銷售產品
及服務所賺取的收入。 2.2 Business receipts refer to income received through sales of goods and services.
2.3 專用私人網絡 是某機構內或某組特
定機構之間的通訊網絡。 2.3 Designated private network is a communications network within an organisation or among a group of designated organisations.
2.4 數碼證書(亦稱作電子證書)是指由
核證機關(例如香港郵政)發出及數碼簽署
的電子文檔,以核實證書持有人之身份。
2.4 A digital certificate (also called e-Cert) is an electronic file issued and digitally signed by a Certification Authority (e.g. Hongkong Post), vouching for the identity of the certificate holder.
2.5 公共服務電子化計劃 — 請參閱本章
第1.2段。 2.5 Electronic Service Delivery Scheme — please refer to paragraph 1.2 of this chapter.
2.6 機構單位 是指在單一擁有權或控制
權(即單一公司名義)下,在單一地點從事
一種或主要從事一種經濟活動(即生產貨物
或提供服務)的經濟單位。
2.6 An establishment is defined as an economic unit (i.e. a unit engaged in the production of goods or services) which engages, under a single ownership or control (i.e. under a single company name), in one or predominantly one kind of economic activity at a single physical location.
2.7 把有關機構單位或其所售賣產品或所
提供服務的資料放置於互聯網上即視為 透過電子途徑遞送產品/服務/資料。
2.7 Placing information about an establishment or the products sold or services provided on the Internet is considered to have delivered their goods/services/information through electronic means.
2.8 機構單位如有透過電子途徑確認整個
預訂或購買過程,便會視為 透過電子途徑預
訂或購買產品/服務/資料。
2.8 An establishment is considered to have ordered or purchased goods/services/information through electronic means if the confirmation of order or purchase is completely done through electronic means.

99
2.9 網上瀏覽資料亦視為 透過電子途徑
獲取資料。至於能透過電子途徑獲取的產
品,就只限可以經由電子途徑傳遞的產品,
如套裝軟件及歌曲。
2.9 Browsing of information on the Internet is also considered as receiving information through electronic means. Goods received through electronic means are only restricted to products which could be transmitted through electronic means, such as software packages and songs.
2.10 透過電話線的交互式應答系統 指經
電話線或流動電訊網絡自動以話音應答客戶
需求的程序系統。
2.10 Interactive Response System through telephone lines refers to an automated system which deals with clients with voice response through telephone lines or mobile telecommunications network.
2.11 互聯網 是指可提供多項服務的全球
性公眾電腦網絡,包括萬維網、電子郵件、
新聞組及檔案傳遞等服務。
2.11 Internet is the world-wide public computer network which provides access to a wide range of services, including the world wide web, email, newsgroup and file transfer.
2.12 租用專線 是由公眾電訊公司出租給
客戶的一種通訊線路。透過這種專線,終端
機或電腦整天可與網絡相連。
2.12 Leased line is a transmission line leased from a telecommunication company. It enables round the clock connection by terminals and computers.
2.13 個人電腦 — 請參閱本章第1.3段。 2.13 Personal computer — please refer to
paragraph 1.3 of this chapter. 2.14 網頁 是一種可在互聯網上開啟的電
子文件,提供文字、圖像或多媒體形式的資
訊。
2.14 Web page is an electronic document accessible in the Internet, which provides information in a textual, graphical or multimedia format.
2.15 網絡伺服器 是一組電腦硬件和軟
件,應用戶要求提供及傳送網頁給互聯網上
的用戶。
2.15 Web server is the hardware and software that provide and transmit Web pages to users in the Internet upon request.
2.16 網站 是一組以首頁為首網頁的相關
網頁。每一網站通常都有一個獨一無二的網
上地址,以供用戶尋找所需的首網頁。
2.16 Web site is a related collection of Web pages that includes a beginning page called a home page. A Web site has an address (often unique) to facilitate the users to get their intended home page.

100
2.17 無線應用協定 是一組通訊協定的標
準規格,使流動通訊器材如流動電話和無線
電收發器能使用互聯網提供的服務,包括電
子郵件、萬維網、新聞組和互聯網交談室。
2.17 Wireless Application Protocol (WAP) is a specification for a set of communication protocol to standardise the way that wireless devices, such as cellular telephones and radio transceivers, can be used for Internet access, including email, the world wide web, newsgroups and the Internet Relay Chat.
3. 資訊科技在政府的使用情況和普
及程度 3. Information Technology Usage and Penetration in the Government
3.1 電子郵件 是一種提供本地和全球性
網絡用戶互換訊息(包括文字和附件)的設
施。
3.1 Electronic-mail (e-mail) is a facility which allows network users locally and world-wide to exchange messages, including text and attachments.
3.2 互聯網 — 請參閱本章第2.11段。 3.2 Internet — please refer to paragraph
2.11 of this chapter. 3.3 個人電腦 — 請參閱本章第1.3段。 3.3 Personal computers — please refer to
paragraph 1.3 of this chapter. 4. 資訊科技及電訊業的營運特徵 4. Operating Characteristics of the
Information Technology and Telecommunications Sector
4.1 業務收益 — 請參閱本章第2.2段。 4.1 Business receipts — please refer to
paragraph 2.2 of this chapter. 4.2 本地生產總值 是指一個國家或地區
的所有常住生產單位,在一個指定的期間
內,未扣除固定資本消耗的生產總價值。
4.2 Gross Domestic Product (GDP) is a measure of the total value of production of all resident producing units of a country or territory in a specified period, before deducting allowance for consumption of fixed capital.

101
4.3 就業人數 包括經常參與機構單位業
務的在職東主及股東;在統計日期由機構單
位直接支取薪酬的全職受薪僱員,包括長期
或臨時聘用的,無論這些僱員正在本港或其
他地方工作或暫時缺勤(即正在放病假、分
娩假、年假、事假的工人及罷工者);及在統
計日期工作最少一小時的兼職僱員及夜班或
通宵班的僱員和無酬家屬幫工。由一九九九
年三月開始,有關點算就業人數的工作時數
定義由原有的「在統計日期工作最少三小時」
改為「在統計日期工作最少一小時」。
4.3 Persons engaged in an establishment include individual proprietors and partners actively engaged in the work of the establishment; full-time salaried personnel or employees, directly paid by the establishment, both permanent and temporary, who are either at work (whether in Hong Kong or outside Hong Kong) or temporarily absent from work (viz. those on sick leave, maternity leave, annual vacation or casual leave, and on strike) on the survey reference date; and part-time employees and employees on night/irregular shifts and unpaid family workers for at least one hour on the survey reference date. Starting from March 1999, the rule for counting the number of persons engaged has been changed from the previous definition of “working for at least three hours on the survey reference date” to a new definition of “working for at least one hour on the survey reference date”.
4.4 增加價值 是生產總額減去中間投產
消耗(生產過程中所耗用的貨物和服務的價
值)。
4.4 Value added is defined as the value of gross output less the value of intermediate consumption (the value of goods and services used up in the course of production).
5. 電訊服務 5. Telecommunications Services 5.1 業務收益 — 請參閱本章第2.2段。 5.1 Business receipts — please refer to
paragraph 2.2 of this chapter. 5.2 機構單位 — 請參閱本章第2.6段。 5.2 An establishment — please refer to
paragraph 2.6 of this chapter. 5.3 個人通訊服務 是一種在1.7/1.8吉赫
頻段操作的數碼式流動電話網絡,其特點是
成本低而可為大量客戶提供服務。
5.3 Personal Communications Services (PCS) is a kind of digital mobile telephone network which operates in the 1.7/1.8GHz band, generally characterised by low cost and the ability to serve a very large number of customers.
5.4 公共流動無線電話服務 是由採用數
碼式系統的蜂窩式流動電話營辦商所提供的
流動電話服務。
5.4 Public Mobile Radio-telephone Service (PMRS) is a kind of mobile phone service provided by licensed cellular phone operators using digital system.

102
5.5 增加價值 — 請參閱本章第4.4段 5.5 Value added — please refer to paragraph 4.4 of this chapter.
6. 電腦產品及電訊器材的進出口 6. Imports and Exports of
Computer Products and Telecommunications Equipment
6.1 電腦硬件 的貿易統計數字包括自動
資料處理機及其儲存、輸入或輸出部份、磁
性或光學閱讀器、將資料以代碼形式轉錄到
資料媒體的機器及處理這些資料的機器、網
絡裝置設備以及其他有關的零件及附件的進
口及出口貨值。
6.1 Trade statistics on computer hardware includes imports and exports of automatic data processing machines and storage, input or output units thereof, magnetic or optical readers, machines for transcribing data onto data media in coded form, machines for processing such data, network units equipment and other related parts and accessories.
6.2 一九九二年 電腦軟件 的貿易統計數
字包括已錄製信息(聲音或影像除外)的磁
帶及其他媒體的進口及出口貨值。由一九九
六年起,電腦軟件 的貿易統計數字包括已錄
製信息(聲音或影像除外)的激光閱讀系統
用的圓盤、磁帶及其他媒體的進口及出口貨
值。
6.2 For 1992, trade statistics on computer software includes imports and exports of tapes and other recorded media reproducing phenomena other than sound or image. From 1996 onwards, trade statistics on computer software includes imports and exports of discs for laser reading systems, magnetic tapes and other recorded media for producing phenomena other than sound or image.
6.3 電訊器材 的貿易統計數字包括有線
電話或有線電報用的電動器具、無線電話或
電報傳送器具及其他裝有接收器的傳送器具
的進口及出口貨值。
6.3 Trade statistics on telecommunications equipment includes imports and exports of electrical apparatus for line telephony or line telegraphy, transmission apparatus for radio-telephony, radio-telegraphy and other apparatus incorporating reception apparatus.
7. 資訊科技人力資源 7. Human Resources in
Information Technology 7.1 互聯網 — 請參閱本章第2.11段。 7.1 Internet — please refer to paragraph
2.11 of this chapter. 7.2 系統操作 包括以下員工﹕ 7.2 Systems operation includes the
following personnel:
求助台主任 help desk supervisors
操作主任 operations supervisors
電腦操作員 computer operators
求助中心操作員 help desk centre operators

103
8. 資訊科技教育 8. Education in Information Technology
8.1 互聯網 — 請參閱本章第2.11段。 8.1 Internet — please refer to paragraph
2.11 of this chapter.


105
查 詢 電 話 List of Enquiry Telephone Numbers
章 Chapter
資料來源 Source of information
查詢電話 Enquiry
telephone numbers
1. 資訊科技在住戶的使用情況和普
及程度 Information Technology Usage and Penetration in Households
(i) 政府統計處社會統計調查組 Social Surveys Section, Census and Statistics Department
2887 5103
2. (i) 政府統計處資訊科技及電訊統計組 Information Technology and Telecommunications Statistics Section, Census and Statistics Department
2887 5559
資訊科技在工商業的使用情況和
普及程度 Information Technology Usage and Penetration in the Business Sector (ii) 電訊管理局
Office of the Telecommunications Authority 2961 6333
(iii) 政府統計處經銷及服務業統計組(二)甲 Distribution & Services Statistics Section (2) A, Census and Statistics Department
2802 1269
3. 資訊科技在政府的使用情況和普
及程度 Information Technology Usage and Penetration in the Government
(i) 資訊科技署 Information Technology Services Department
2582 4511
4. 資訊科技及電訊業的營運特徵 Operating Characterisitcs of the Information Technology and Telecommunications Sector
(i) 政府統計處資訊科技及電訊統計組 Information Technology and Telecommunications Statistics Section, Census and Statistics Department
2887 5559
5. 電訊服務 Telecommunications Services
(i) 電訊管理局 Office of the Telecommunications Authority
2961 6333
(ii) 政府統計處經銷及服務業統計組(二)甲 Distribution & Services Statistics Section (2) A, Census and Statistics Department
2802 1269
(iii) 政府統計處經銷及服務業統計組(二)乙 Distribution & Services Statistics Section (2) B, Census and Statistics Department
2894 8402
附件
Annex

106
章 Chapter
資料來源 Source of information
查詢電話 Enquiry
telephone numbers
6. 電腦產品及電訊器材的進出口 Imports and Exports of Computer Products and Telecommunications Equipment
(i) 政府統計處貿易統計資料發布組 Trade Statistics Dissemination Section, Census and Statistics Department
2582 5041
7. 資訊科技的人力資源 Human Resources in Information Technology
(i) 政府統計處就業統計組 Employment Statistics Section, Census and Statistics Department
2582 4751
(ii) 職業訓練局 Vocational Training Council
2836 1000
8. (i) 大學教育資助委員會 University Grants Committee
2524 4210
資訊科技的教育 Education in Information Technology (ii) 教育署
Education Department
(a) 基礎設施科 Infrastructure Division
3123 8111
(b) 課程發展處 Curriculum Development Institute
2762 1675
(c) 統計組 Statistics Section
2892 6351