HIV Diagnosis Trends Tables, 2012-2021 - State of Michigan
30
HIV Trends Report, New diagnoses 2012-2021 Data as of July, 2022 Michigan Department of Health and Human Services Bureau of Infectious Disease Prevention Division of HIV & STD Programs HIV & STD Surveillance & Epidemiology Section www.Michigan.gov/HIVSTI
-
Upload
khangminh22 -
Category
Documents
-
view
0 -
download
0
Transcript of HIV Diagnosis Trends Tables, 2012-2021 - State of Michigan

HIV Trends Report,New diagnoses 2012-2021Data as of July, 2022
Michigan Department of Health and Human ServicesBureau of Infectious Disease PreventionDivision of HIV & STD ProgramsHIV & STD Surveillance & Epidemiology Sectionwww.Michigan.gov/HIVSTI

Notes and Definitions ........................................................................................................................................................................ ii
Statewide InformationGeographic stratification:
Region & Local Health Department (LHD) Jurisdiction ..................................................................................................... 2Metropolitan Statistical Areas (MSAs) ...................................................................................................................... 5City ........................................................................................................................................................................ 7
Demographic stratification:Sex, gender, race, ethnicity, country of birth, age at diagnosis .................................................................................... 9Risk ........................................................................................................................................................................ 11Special populations: MSM, PWID, young Black/AA men ..................................................................................................... 12
Testing and linkage information ....................................................................................................................................... 13
Detroit Metro Area (DMA)Geographic stratification:
Region & Local Health Department (LHD) Jurisdiction ..................................................................................................... 15City ........................................................................................................................................................................ 16
Demographic stratification:Sex, gender, race, ethnicity, country of birth, age at diagnosis .................................................................................... 17Risk ........................................................................................................................................................................ 19Special populations: MSM, PWID, young Black/AA men ..................................................................................................... 20
Testing and linkage information ....................................................................................................................................... 21
Detroit Local Health Department (LHD) JurisdictionGeographic stratification:
City ........................................................................................................................................................................ 23Demographic stratification:
Sex, gender, race, ethnicity, country of birth, age at diagnosis .................................................................................... 23Risk ........................................................................................................................................................................ 25Special populations: MSM, PWID, young Black/AA men ..................................................................................................... 26
Testing and linkage information ....................................................................................................................................... 27
Tables of Contents i

Notes & Key definitions ii
The HIV Trend Report includes persons diagnosed with HIV while living in Michigan. When available, census data are used to calculate rates of new diagnoses. For populations where census data are not available (for example, number of persons who inject drugs), the proportion of newly diagnosed persons who fall into a given category are assessed. Using rates and proportions (rather than counts) when comparing regions, demographic groups, or changes over time is critical. For further explanation, see our 5 minute Epidemiology 101 video. Negative binomial regression and Poisson distributions are utilized to determine statistically significant changes in new diagnoses over the preceding 10 years. This report is meant to guide care and prevention strategies by observing long term trends. Changes in short term trends - such as an outbreak - are monitored by the HIV Surveillance Program monthly.
The following measures are displayed in this report:Count: The number of persons newly diagnosed during the given year.
Pop: The total population (census) during the given year.Est pop: Estimated population for men who have sex with men (MSM). It is estimated at 5.8% of Michigan's adult male population1. Rate: The new diagnosis rate per 100,000 persons in the specified population during the given year
(count/pop x 100,000 or count/est pop x 100,000).
MI %: Of persons newly diagnosed in Michigan during a given year, the percent who fall into the specified group (count/total new diagnoses among Michigan residents).
DMA %: Of persons newly diagnosed in the Detroit Metro Area (DMA) during a given year, the percent who fall into the specified group. The DMA includes Lapeer, Macomb, Monroe, Oakland, St. Clair, and Wayne Counties.(count/total new diagnoses among DMA residents).
DLHD %: Of persons newly diagnosed in Detroit Local Health Department Jurisdiction (DLHD) during a given year, the percent whofall into the specified group. The Detroit LHD includes the cities of Detroit, Highland Park, Hamtramck, Harper Woods, and the Grosse Pointes(count/total new diagnoses among Detroit LHD jurisdiction residents).
% change (95CI): Average annual percent change and 95% confidence interval. This measure is only displayed when statistically significant changes are observed (p<0.05) or if a trend is marginally significant or deemed important. Average annual percent change is calculated by assessing the count offset by the underlying population (either census populations when available or regional new diagnosis totals when census data are not available). Essentially, the average annual percent change refers to the rate, MI%, DMA% or Detroit LHD %. Be careful when interpreting percent changes of percents. A decrease in MI % from 10% to 9% is a -0.1% change (not -1%). The calculation is (9%-10%)/10% = -0.1%.
COVID-19, 2020 diagnoses, and Trends COVID-19 affected many aspects of HIV testing and care. The extent of the impact and recovery among different populations will help guide strategies to continue improving HIV outcomes. During 2020, new HIV diagnoses were significantly lower than expected, likely to due to an interruption of testing. Therefore, 2020 was excluded from the statistical calculations. In 2021, new diagnoses remained low, but fell within the normal limits. This Trends report was deemed worthwhile to update this year, however interpret significantly declining trends with caution. Artificially low diagnoses in some populations during 2021 may be amplifying modest declines.
1Lieb S, Fallon S, Friedman S, Thompson D, Gates G, Liberti T, et al. (2011) Statewide Estimation of Racial/Ethnic Populations of Men Who Have Sex with Men in the U.S. ASPH Public Health Reports vol 126 pg 60-72

Persons living in Michigan at time of HIV diagnosis
The state of Michigan, 2012 - 2021

Region Measure 2012 2013 2014 2015 2016 2017 2018 2019 2020 2021count 792 746 782 722 737 766 710 666 518 638pop 9,898,289 9,914,802 9,932,033 9,934,483 9,954,117 9,976,752 9,987,286 9,984,795 9,966,555 9,966,555rate 8.0 7.5 7.9 7.3 7.4 7.7 7.1 6.7 5.2 6.4 -2.2% (-3.0%, -1.3%)count 548 498 520 481 498 510 477 427 350 411pop 4,268,953 4,271,737 4,275,840 4,272,364 4,277,709 4,282,090 4,282,820 4,277,767 4,262,369 4,262,369rate 12.8 11.7 12.2 11.3 11.6 11.9 11.1 10.0 8.2 9.6 -2.7% (-3.7%, -1.6%)count 235 237 254 230 229 247 219 229 165 214pop 5,629,336 5,643,065 5,656,193 5,662,119 5,676,408 5,694,662 5,704,466 5,707,028 5,704,186 5,704,186rate 4.2 4.2 4.5 4.1 4.0 4.3 3.8 4.0 2.9 3.8 No significant changecount 9 11 8 11 10 9 14 10 3 12MI % 1.1% 1.5% 1.0% 1.5% 1.4% 1.2% 2.0% 1.5% 0.6% 1.9% No significant change
Local Health Department (LHD) Jurisdictioncount 1 1 1 3 2 7 3 3 2 5pop 111,506 112,020 113,361 114,122 115,018 116,393 117,137 118,045 118,927 118,927rate 0.9 0.9 0.9 2.6 1.7 6.0 2.6 2.5 1.7 4.2 +16.5% (1.2%, 34.0%)count 2 7 9 7 5 3 5 4 2 13pop 167,038 167,382 167,973 168,135 169,021 170,168 170,879 171,600 172,209 172,209rate 1.2 4.2 5.4 4.2 3.0 1.8 2.9 2.3 1.2 7.5 No significant changecount 10 15 10 6 5 9 3 2 5 8pop 156,669 156,205 156,074 155,136 154,451 154,264 153,892 153,352 153,025 153,025rate 6.4 9.6 6.4 3.9 3.2 5.8 1.9 1.3 3.3 5.2 -10.6% (-18.8%, -1.5%)count 4 3 5 2 1 2 5 2 1 4pop 151,047 150,707 150,684 150,338 150,001 149,879 149,991 149,818 149,930 149,930rate 2.6 2.0 3.3 1.3 0.7 1.3 3.3 1.3 0.7 2.7 No significant changecount 6 8 8 6 6 3 9 11 5 5pop 134,755 134,782 134,845 134,377 134,343 134,127 133,858 133,806 133,580 133,580rate 4.5 5.9 5.9 4.5 4.5 2.2 6.7 8.2 3.7 3.7 No significant changecount 16 21 22 19 14 20 20 27 19 17pop 1,200,780 1,199,754 1,199,014 1,198,249 1,198,503 1,201,391 1,204,044 1,204,708 1,205,275 1,205,275rate 1.3 1.8 1.8 1.6 1.2 1.7 1.7 2.2 1.6 1.4 No significant changecount 286 265 263 248 267 239 236 207 177 191pop 812,311 796,613 784,791 779,098 771,883 768,073 765,192 762,454 759,542 759,542rate 35.2 33.3 33.5 31.8 34.6 31.1 30.8 27.1 23.3 25.1 -3.2% (-4.7%, -1.7%)count 32 24 20 27 36 33 30 30 22 31pop 418,243 415,713 412,950 410,574 409,054 407,673 406,626 405,702 404,794 404,794rate 7.7 5.8 4.8 6.6 8.8 8.1 7.4 7.4 5.4 7.7 No significant change
LHD Jurisdictions continued on next page
Detroit LHD5
Genesee Co.
New Michigan HIV diagnoses 2012 - 2021: Geographic Stratification (last reported address each year)
1Detroit Metro Area (DMA) includes Lapeer, Macomb, Monroe, Oakland, St. Clair, and Wayne Counties. Prisons are excluded. 2Outstate includes Michigan residents outside the DMA. Prisons are excluded. 3Persons in prisons (state or federal) located in Michigan. Reported separately for geographic stratification. 4Central Michigan LHD includes all otherwise unlisted counties in the lower peninsula. 5Detroit LHD includes the cities of Detroit, Hamtramck, Harper Woods, Highland Park, & the Grosse Pointes. Detroit, under "select cities" (page 7), includes only residents of the city of Detroit.
Central Michigan4
Outstate2
Prison3
% change (95CI)Michigan
DMA1
Allegan Co.
Barry-Eaton
Berrien Co.
Branch-Hillsdale-St. Joseph
Calhoun Co.
page 2

Region Measure 2012 2013 2014 2015 2016 2017 2018 2019 2020 2021Local Health Department (LHD) Jurisdiction, continued from previous page
count 24 18 25 14 27 26 15 17 21 23pop 283,592 284,226 285,760 287,255 289,633 291,678 291,267 291,426 290,609 290,609rate 8.5 6.3 8.7 4.9 9.3 8.9 5.1 5.8 7.2 7.9 No significant changecount 1 2 1 2 1 2 2 1 1 2pop 63,890 64,001 64,246 64,073 64,215 64,293 64,290 64,654 64,553 64,553rate 1.6 3.1 1.6 3.1 1.6 3.1 3.1 1.5 1.5 3.1 No significant changecount 3 7 14 8 6 10 0 4 1 8pop 159,988 159,672 159,464 159,325 158,345 158,653 158,594 158,357 156,920 156,920rate 1.9 4.4 8.8 5 3.8 6.3 0 2.5 0.6 5.1 No significant changecount 26 12 19 18 10 18 16 27 20 15pop 255,413 257,399 259,063 259,816 261,584 263,387 265,120 265,531 265,988 265,988rate 10.2 4.7 7.3 6.9 3.8 6.8 6 10.2 7.5 5.6 No significant changecount 47 40 51 42 46 46 39 41 33 37pop 615,871 624,409 631,464 637,333 644,219 649,722 653,636 656,800 658,708 658,708rate 7.6 6.4 8.1 6.6 7.1 7.1 6 6.2 5 5.6 No significant changecount 1 1 0 1 3 3 4 2 2 1pop 88,200 88,299 88,202 88,376 88,227 88,218 87,987 87,808 87,635 87,635rate 1.1 1.1 0 1.1 3.4 3.4 4.5 2.3 2.3 1.1 No significant changecount 1 2 3 2 2 4 8 2 0 2pop 99,041 98,850 98,774 98,432 98,595 98,511 98,118 98,519 97,808 97,808rate 1 2 3 2 2 4.1 8.2 2 0 2 No significant changecount 4 6 4 7 3 3 3 7 2 1pop 182,805 184,238 185,567 187,221 188,585 189,923 191,259 192,058 192,335 192,335rate 2.2 3.3 2.2 3.7 1.6 1.6 1.6 3.6 1 0.5 No significant changecount 59 53 50 62 54 70 76 54 47 62pop 849,761 857,146 862,914 865,031 868,329 870,867 872,089 872,389 870,791 870,791rate 6.9 6.2 5.8 7.2 6.2 8 8.7 6.2 5.4 7.1 No significant changecount 5 3 1 6 4 7 2 6 2 4pop 310,613 309,438 307,627 305,439 302,850 302,009 300,680 298,836 296,181 296,181rate 1.6 1 0.3 2 1.3 2.3 0.7 2 0.7 1.4 No significant changecount 6 3 4 6 3 4 9 4 4 9pop 150,835 150,193 149,919 149,439 149,278 149,523 150,218 150,412 150,568 150,568rate 4 2 2.7 4 2 2.7 6 2.7 2.7 6 No significant changecount 2 6 8 6 5 4 9 4 5 4pop 170,191 172,312 172,304 172,506 173,342 173,804 173,719 173,645 173,883 173,883rate 1.2 3.5 4.6 3.5 2.9 2.3 5.2 2.3 2.9 2.3 No significant changecount 108 101 103 84 90 102 82 75 58 75pop 1,223,723 1,235,656 1,243,076 1,244,895 1,251,563 1,256,478 1,257,472 1,257,726 1,253,459 1,253,459rate 8.8 8.2 8.3 6.7 7.2 8.1 6.5 6 4.6 6 -4.2% (-6.6%, -1.8%)
LHD Jurisdictions continued on next page1Marquette LHD includes the entire upper peninsula
Muskegon Co.
Oakland Co.
Lapeer Co.
Lenawee Co.
Livingston Co.
Macomb Co.
Marquette1
Monroe Co.
Kent Co.
New Michigan HIV diagnoses 2012 - 2021: Geographic Stratification (last reported address each year)
% change (95CI)
Ingham Co.
Ionia Co.
Jackson Co.
Kalamazoo Co.
page 3
Region Measure 2012 2013 2014 2015 2016 2017 2018 2019 2020 2021Local Health Department (LHD) Jurisdiction, continued from previous page
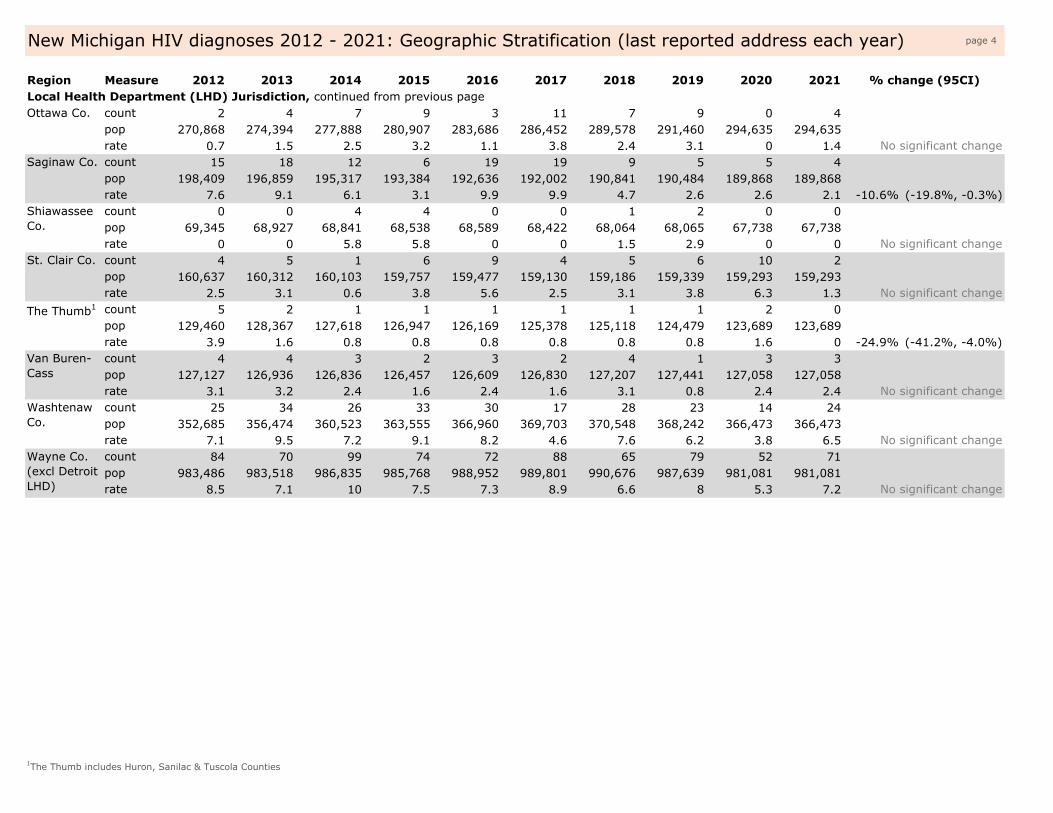
count 2 4 7 9 3 11 7 9 0 4pop 270,868 274,394 277,888 280,907 283,686 286,452 289,578 291,460 294,635 294,635rate 0.7 1.5 2.5 3.2 1.1 3.8 2.4 3.1 0 1.4 No significant changecount 15 18 12 6 19 19 9 5 5 4pop 198,409 196,859 195,317 193,384 192,636 192,002 190,841 190,484 189,868 189,868rate 7.6 9.1 6.1 3.1 9.9 9.9 4.7 2.6 2.6 2.1 -10.6% (-19.8%, -0.3%)count 0 0 4 4 0 0 1 2 0 0pop 69,345 68,927 68,841 68,538 68,589 68,422 68,064 68,065 67,738 67,738rate 0 0 5.8 5.8 0 0 1.5 2.9 0 0 No significant changecount 4 5 1 6 9 4 5 6 10 2pop 160,637 160,312 160,103 159,757 159,477 159,130 159,186 159,339 159,293 159,293rate 2.5 3.1 0.6 3.8 5.6 2.5 3.1 3.8 6.3 1.3 No significant changecount 5 2 1 1 1 1 1 1 2 0pop 129,460 128,367 127,618 126,947 126,169 125,378 125,118 124,479 123,689 123,689rate 3.9 1.6 0.8 0.8 0.8 0.8 0.8 0.8 1.6 0 -24.9% (-41.2%, -4.0%)count 4 4 3 2 3 2 4 1 3 3pop 127,127 126,936 126,836 126,457 126,609 126,830 127,207 127,441 127,058 127,058rate 3.1 3.2 2.4 1.6 2.4 1.6 3.1 0.8 2.4 2.4 No significant changecount 25 34 26 33 30 17 28 23 14 24pop 352,685 356,474 360,523 363,555 366,960 369,703 370,548 368,242 366,473 366,473rate 7.1 9.5 7.2 9.1 8.2 4.6 7.6 6.2 3.8 6.5 No significant changecount 84 70 99 74 72 88 65 79 52 71pop 983,486 983,518 986,835 985,768 988,952 989,801 990,676 987,639 981,081 981,081rate 8.5 7.1 10 7.5 7.3 8.9 6.6 8 5.3 7.2 No significant change
1The Thumb includes Huron, Sanilac & Tuscola Counties
St. Clair Co.
The Thumb1
Van Buren-Cass
Washtenaw Co.
Wayne Co. (excl Detroit LHD)
New Michigan HIV diagnoses 2012 - 2021: Geographic Stratification (last reported address each year)
% change (95CI)
Ottawa Co.
Saginaw Co.
Shiawassee Co.
page 4
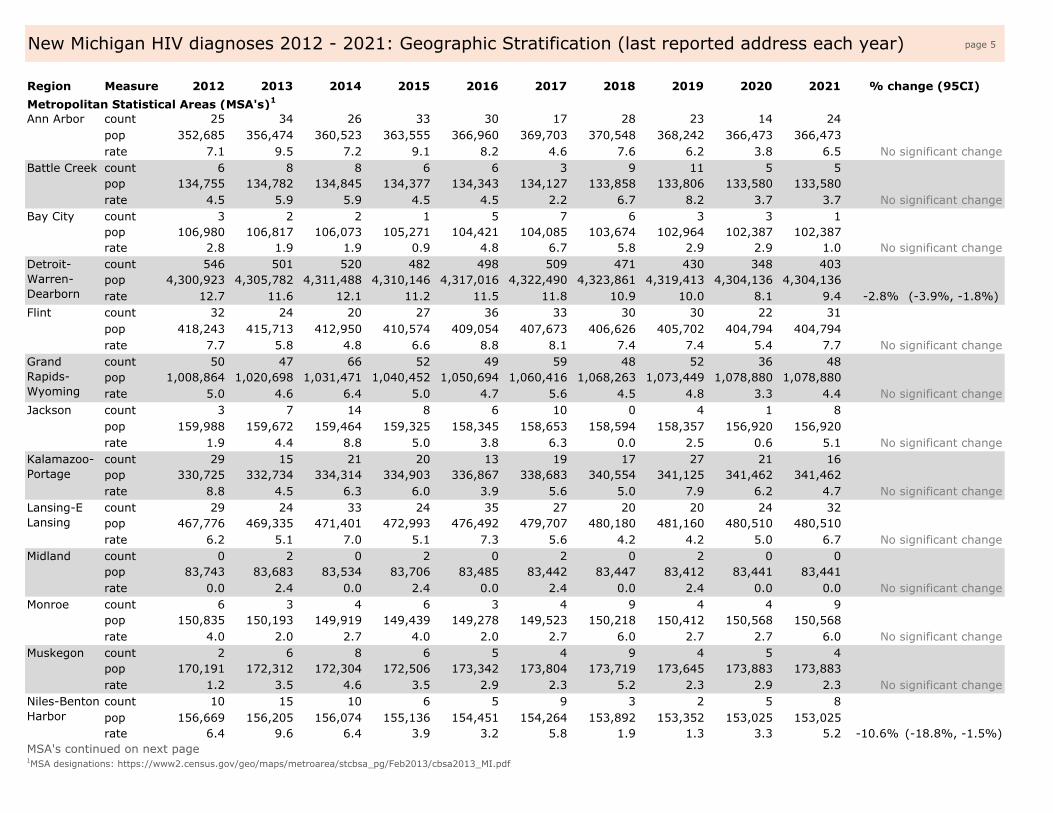
Region Measure 2012 2013 2014 2015 2016 2017 2018 2019 2020 2021Metropolitan Statistical Areas (MSA's)1
count 25 34 26 33 30 17 28 23 14 24pop 352,685 356,474 360,523 363,555 366,960 369,703 370,548 368,242 366,473 366,473rate 7.1 9.5 7.2 9.1 8.2 4.6 7.6 6.2 3.8 6.5 No significant changecount 6 8 8 6 6 3 9 11 5 5pop 134,755 134,782 134,845 134,377 134,343 134,127 133,858 133,806 133,580 133,580rate 4.5 5.9 5.9 4.5 4.5 2.2 6.7 8.2 3.7 3.7 No significant changecount 3 2 2 1 5 7 6 3 3 1pop 106,980 106,817 106,073 105,271 104,421 104,085 103,674 102,964 102,387 102,387rate 2.8 1.9 1.9 0.9 4.8 6.7 5.8 2.9 2.9 1.0 No significant changecount 546 501 520 482 498 509 471 430 348 403pop 4,300,923 4,305,782 4,311,488 4,310,146 4,317,016 4,322,490 4,323,861 4,319,413 4,304,136 4,304,136rate 12.7 11.6 12.1 11.2 11.5 11.8 10.9 10.0 8.1 9.4 -2.8% (-3.9%, -1.8%)count 32 24 20 27 36 33 30 30 22 31pop 418,243 415,713 412,950 410,574 409,054 407,673 406,626 405,702 404,794 404,794rate 7.7 5.8 4.8 6.6 8.8 8.1 7.4 7.4 5.4 7.7 No significant changecount 50 47 66 52 49 59 48 52 36 48pop 1,008,864 1,020,698 1,031,471 1,040,452 1,050,694 1,060,416 1,068,263 1,073,449 1,078,880 1,078,880rate 5.0 4.6 6.4 5.0 4.7 5.6 4.5 4.8 3.3 4.4 No significant changecount 3 7 14 8 6 10 0 4 1 8pop 159,988 159,672 159,464 159,325 158,345 158,653 158,594 158,357 156,920 156,920rate 1.9 4.4 8.8 5.0 3.8 6.3 0.0 2.5 0.6 5.1 No significant changecount 29 15 21 20 13 19 17 27 21 16pop 330,725 332,734 334,314 334,903 336,867 338,683 340,554 341,125 341,462 341,462rate 8.8 4.5 6.3 6.0 3.9 5.6 5.0 7.9 6.2 4.7 No significant changecount 29 24 33 24 35 27 20 20 24 32pop 467,776 469,335 471,401 472,993 476,492 479,707 480,180 481,160 480,510 480,510rate 6.2 5.1 7.0 5.1 7.3 5.6 4.2 4.2 5.0 6.7 No significant changecount 0 2 0 2 0 2 0 2 0 0pop 83,743 83,683 83,534 83,706 83,485 83,442 83,447 83,412 83,441 83,441rate 0.0 2.4 0.0 2.4 0.0 2.4 0.0 2.4 0.0 0.0 No significant changecount 6 3 4 6 3 4 9 4 4 9pop 150,835 150,193 149,919 149,439 149,278 149,523 150,218 150,412 150,568 150,568rate 4.0 2.0 2.7 4.0 2.0 2.7 6.0 2.7 2.7 6.0 No significant changecount 2 6 8 6 5 4 9 4 5 4pop 170,191 172,312 172,304 172,506 173,342 173,804 173,719 173,645 173,883 173,883rate 1.2 3.5 4.6 3.5 2.9 2.3 5.2 2.3 2.9 2.3 No significant changecount 10 15 10 6 5 9 3 2 5 8pop 156,669 156,205 156,074 155,136 154,451 154,264 153,892 153,352 153,025 153,025rate 6.4 9.6 6.4 3.9 3.2 5.8 1.9 1.3 3.3 5.2 -10.6% (-18.8%, -1.5%)
MSA's continued on next page1MSA designations: https://www2.census.gov/geo/maps/metroarea/stcbsa_pg/Feb2013/cbsa2013_MI.pdf
Monroe
Muskegon
Niles-Benton Harbor
Midland
New Michigan HIV diagnoses 2012 - 2021: Geographic Stratification (last reported address each year)
% change (95CI)
Ann Arbor
Battle Creek
Bay City
Detroit-Warren-DearbornFlint
Grand Rapids-WyomingJackson
Kalamazoo-Portage
Lansing-E Lansing
page 5

Region Measure 2012 2013 2014 2015 2016 2017 2018 2019 2020 2021Metropolitan Statistical Areas (MSA's)1, continued from previous page
count 24 18 25 14 27 26 15 17 21 23pop 283,592 284,226 285,760 287,255 289,633 291,678 291,267 291,426 290,609 290,609rate 8.5 6.3 8.7 4.9 9.3 8.9 5.1 5.8 7.2 7.9 -10.6% (-19.8%, -0.3%)count 1 2 1 2 1 2 2 1 1 2pop 63,890 64,001 64,246 64,073 64,215 64,293 64,290 64,654 64,553 64,553rate 1.6 3.1 1.6 3.1 1.6 3.1 3.1 1.5 1.5 3.1 No significant changecount 3 7 14 8 6 10 0 4 1 8pop 159,988 159,672 159,464 159,325 158,345 158,653 158,594 158,357 156,920 156,920rate 1.9 4.4 8.8 5 3.8 6.3 0 2.5 0.6 5.1 No significant change
1MSA designations: https://www2.census.gov/geo/maps/metroarea/stcbsa_pg/Feb2013/cbsa2013_MI.pdf
Micropolitan Area
Rural
New Michigan HIV diagnoses 2012 - 2021: Geographic Stratification (last reported address each year)
% change (95CI)
Saginaw
page 6

Region Measure 2012 2013 2014 2015 2016 2017 2018 2019 2020 2021Select cities: cities with at least 50 new HIV diagnoses over the 10 year period.
count 16 12 8 6 11 6 15 8 5 9pop 120,544 121,341 123,293 124,487 125,635 126,234 126,236 124,617 123,778 123,778rate 13.3 9.9 6.5 4.8 8.8 4.8 11.9 6.4 4.0 7.3 No significant changecount 6 7 7 6 6 3 9 7 4 9pop 51,865 51,787 51,779 51,562 51,439 51,243 51,017 50,948 50,799 50,799rate 11.6 13.5 13.5 11.6 11.7 5.9 17.6 13.7 7.9 17.7 No significant changecount 12 7 5 6 12 11 7 8 6 10pop 98,019 98,737 99,413 99,911 100,462 100,626 100,458 100,286 99,792 99,792rate 12.2 7.1 5.0 6.0 11.9 10.9 7.0 8.0 6.0 10.0 No significant changecount 7 8 6 3 7 3 4 9 6 2pop 96,885 96,073 95,984 95,502 95,079 94,758 94,470 93,988 93,367 93,367rate 7.2 8.3 6.3 3.1 7.4 3.2 4.2 9.6 6.4 2.1 No significant changecount 272 254 252 237 253 227 224 197 170 181pop 700,289 691,986 682,746 679,562 677,379 675,031 673,658 670,442 665,369 665,369rate 38.8 36.7 36.9 34.9 37.3 33.6 33.3 29.4 25.5 27.2 -3.5% (-5.0%, -2.0%)count 4 9 10 3 2 6 15 10 6 5pop 32,512 32,672 32,739 32,612 32,621 32,495 32,254 32,021 31,720 31,720rate 12.3 27.5 30.5 9.2 6.1 18.5 46.5 31.2 18.9 15.8 No significant changecount 14 8 10 3 6 5 3 3 2 3pop 20,178 20,299 20,319 20,232 20,222 20,174 20,054 20,037 20,198 20,198rate 69.4 39.4 49.2 14.8 29.7 24.8 15.0 15.0 9.9 14.9 -17.6% (-26.0%, -8.2%)count 25 19 15 15 27 28 24 19 15 21pop 131,730 130,785 129,705 128,694 127,859 127,078 126,373 125,833 125,158 125,158rate 19.0 14.5 11.6 11.7 21.1 22.0 19.0 15.1 12.0 16.8 No significant changecount 31 27 40 31 34 36 29 35 26 24pop 208,021 210,532 212,127 213,134 214,985 217,650 218,821 219,692 218,884 218,884rate 14.9 12.8 18.9 14.5 15.8 16.5 13.3 15.9 11.9 11.0 No significant changecount 6 6 4 6 10 7 8 5 5 6pop 11,143 11,052 11,030 10,974 10,921 10,876 10,828 10,787 10,712 10,712rate 53.8 54.3 36.3 54.7 91.6 64.4 73.9 46.4 46.7 56.0 No significant changecount 9 9 8 6 8 9 4 10 3 3pop 25,102 24,873 24,858 24,731 24,623 24,530 24,425 24,291 24,115 24,115rate 35.9 36.2 32.2 24.3 32.5 36.7 16.4 41.2 12.4 12.4 No significant changecount 11 11 21 13 9 9 9 10 3 9pop 33,194 33,135 33,028 32,942 32,732 32,724 32,575 32,411 32,374 32,374rate 33.1 33.2 63.6 39.5 27.5 27.5 27.6 30.9 9.3 27.8 No significant changecount 25 11 13 17 6 14 13 23 16 14pop 97,841 98,237 98,621 98,386 98,519 98,606 99,288 99,022 98,617 98,617rate 25.6 11.2 13.2 17.3 6.1 14.2 13.1 23.2 16.2 14.2 No significant change
Select cities continued on next page
Detroit
Eastpointe
Ferndale
Flint
Grand Rapids
Highland Park
Inkster
Jackson
Kalamazoo
Dearborn
New Michigan HIV diagnoses 2012 - 2021: Geographic Stratification (last reported address each year)
% change (95CI)
Ann Arbor
Battle Creek
Clinton Township
page 7

Region Measure 2012 2013 2014 2015 2016 2017 2018 2019 2020 2021Select cities, continued from previous page
count 16 18 24 18 26 22 13 13 15 22pop 122,904 122,999 123,367 123,629 124,757 125,857 126,046 126,029 125,700 125,700rate 13 14.6 19.5 14.6 20.8 17.5 10.3 10.3 11.9 17.5 No significant changecount 3 6 4 8 4 7 4 7 3 6pop 29,836 30,024 30,058 29,924 29,895 29,805 29,595 29,434 29,293 29,293rate 10.1 20 13.3 26.7 13.4 23.5 13.5 23.8 10.2 20.5 No significant changecount 14 15 14 10 13 23 13 16 9 8pop 60,305 60,458 60,476 60,275 60,247 60,147 59,776 59,441 58,911 58,911rate 23.2 24.8 23.1 16.6 21.6 38.2 21.7 26.9 15.3 13.6 No significant changecount 5 9 5 5 4 5 3 5 6 6pop 47,808 47,448 47,504 47,364 47,220 47,068 46,908 46,641 46,291 46,291rate 10.5 19 10.5 10.6 8.5 10.6 6.4 10.7 13 13 No significant changecount 8 3 5 6 7 4 3 7 4 9pop 47,503 47,741 47,816 47,651 47,618 47,474 47,232 46,930 46,535 46,535rate 16.8 6.3 10.5 12.6 14.7 8.4 6.4 14.9 8.6 19.3 No significant changecount 12 7 6 8 5 8 5 4 2 7pop 60,585 61,027 61,241 61,221 61,709 61,845 61,828 61,704 61,355 61,355rate 19.8 11.5 9.8 13.1 8.1 12.9 8.1 6.5 3.3 11.4 No significant changecount 15 18 11 6 19 18 8 4 4 4pop 91,427 90,660 89,842 88,888 88,499 88,170 87,563 87,246 86,832 86,832rate 16.4 19.9 12.2 6.8 21.5 20.4 9.1 4.6 4.6 4.6 -11.4% (-20.9%, -0.9%)count 16 21 16 18 16 17 13 12 9 11pop 87,463 88,093 88,350 88,258 88,368 88,286 87,836 87,454 86,822 86,822rate 18.3 23.8 18.1 20.4 18.1 19.3 14.8 13.7 10.4 12.7 -5.3% (-11.0%, -0.6%)count 7 4 5 10 0 11 11 5 5 6pop 130,677 131,527 132,141 132,051 132,489 132,599 132,612 132,187 131,709 131,709rate 5.4 3 3.8 7.6 0 8.3 8.3 3.8 3.8 4.6 No significant changecount 5 4 8 10 7 9 6 6 5 9pop 62,469 61,963 62,075 61,786 61,594 61,431 61,216 60,949 60,576 60,576rate 8 6.5 12.9 16.2 11.4 14.7 9.8 9.8 8.3 14.9 No significant changecount 14 15 11 18 11 19 16 10 13 15pop 134,596 135,319 135,673 135,393 135,206 135,011 134,248 133,667 132,877 132,877rate 10.4 11.1 8.1 13.3 8.1 14.1 11.9 7.5 9.8 11.3 No significant change
Saginaw
Southfield
Sterling Heights
Taylor
Warren
Oak Park
Pontiac
Redford
Roseville
Royal Oak
Lansing
New Michigan HIV diagnoses 2012 - 2021: Geographic Stratification (last reported address each year)
% change (95CI)
page 8

Measure 2012 2013 2014 2015 2016 2017 2018 2019 2020 2021Sex at birth
count 646 625 639 593 625 625 569 557 435 538pop 4,859,376 4,869,738 4,881,058 4,885,706 4,898,650 4,912,208 4,918,489 4,918,052 4,907,813 4,907,813rate 13.3 12.8 13.1 12.1 12.8 12.7 11.6 11.3 8.9 11.0 -2.1% (-3.0%, -1.1%)count 146 121 143 129 112 141 141 109 83 100pop 5,038,913 5,045,064 5,050,975 5,048,777 5,055,467 5,064,544 5,068,797 5,066,743 5,058,742 5,058,742rate 2.9 2.4 2.8 2.6 2.2 2.8 2.8 2.2 1.6 2.0 -2.8% (-5.1%, -0.4%)
count 22 14 19 10 21 17 19 16 13 12MI % 2.8% 1.9% 2.4% 1.4% 2.9% 2.2% 2.7% 2.4% 2.5% 1.9% No significant change
Race by sex at birth2
count 485 476 468 438 415 447 406 383 318 344pop 1,452,245 1,450,973 1,451,656 1,451,144 1,452,397 1,454,778 1,456,965 1,458,479 1,456,824 1,456,824rate 33.4 32.8 32.2 30.2 28.6 30.7 27.9 26.3 21.8 23.6 -3.6% (-4.7%, -2.4)count 383 395 366 352 350 350 320 315 260 283pop 690,416 689,940 690,510 690,619 691,613 692,457 693,206 693,689 691,951 691,951rate 55.5 57.3 53.0 51.0 50.6 50.5 46.2 45.4 37.6 40.9 -3.4% (-4.6%, -2.1%)count 102 81 102 86 65 97 86 68 58 61pop 761,829 761,033 761,146 760,525 760,784 762,321 763,759 764,790 764,873 764,873rate 13.4 10.6 13.4 11.3 8.5 12.7 11.3 8.9 7.6 8.0 -4.4% (-7.4%, -1.2%)count 38 39 50 46 53 66 51 57 38 47pop 459,013 468,717 478,157 486,925 498,873 509,922 521,419 533,351 542,105 542,105rate 8.3 8.3 10.5 9.4 10.6 12.9 9.8 10.7 7.0 8.7 No significant changecount 30 34 45 37 47 57 43 52 33 43pop 233,064 237,909 242,786 247,239 253,512 259,122 264,973 271,042 275,468 275,468rate 12.9 14.3 18.5 15.0 18.5 22.0 16.2 19.2 12.0 15.6 No significant changecount 8 5 5 9 6 9 8 5 5 4pop 225,949 230,808 235,371 239,686 245,361 250,800 256,446 262,309 266,637 266,637rate 3.5 2.2 2.1 3.8 2.4 3.6 3.1 1.9 1.9 1.5 No significant changecount 233 203 227 209 227 235 221 209 143 218pop 7,632,935 7,627,784 7,621,895 7,604,621 7,596,932 7,593,504 7,582,182 7,562,401 7,534,869 7,534,869rate 3.1 3.3 3.0 2.7 3.0 3.1 2.9 2.8 1.9 2.9 No significant changecount 204 172 199 179 194 203 180 176 125 184pop 3,763,497 3,762,932 3,762,123 3,756,169 3,754,138 3,754,388 3,749,663 3,740,681 3,726,688 3,726,688rate 5.4 4.6 5.3 4.8 5.2 5.4 4.8 4.7 3.4 4.9 No significant changecount 29 31 28 30 33 32 41 33 18 34pop 3,869,438 3,864,852 3,859,772 3,848,452 3,842,794 3,839,116 3,832,519 3,821,720 3,808,181 3,808,181rate 0.7 0.8 0.7 0.8 0.9 0.8 1.1 0.9 0.5 0.9 No significant change
Race by sex at birth continued on next page
Male
Female
Latinx males
Latinx females
1Transgender persons are also included in the sex at birth categories. Sex at birth is used in Trends in order to calculate rates as gender census data are not available. 2Latinx persons may be of any race. Black/AA, Latinx, White, & Multi/Other are mutually exclusive categories. Persons with unknown race are not included: 1 in 2014, 2016, and 2021.
White overall
White males
White females
Black/AA overall
Black/AA males
Black/AA females
Latinx overall
New Michigan HIV diagnoses 2012 - 2021: Demographic Stratification
% change (95CI)
Trans-gender1
page 9

Measure 2012 2013 2014 2015 2016 2017 2018 2019 2020 2021Race by sex at birth, continued from previous page
count 36 28 36 29 41 18 32 17 19 28pop 354,096 367,328 380,325 391,793 405,915 418,548 426,720 430,564 432,757 432,757rate 10.2 7.6 9.5 7.4 10.1 4.3 7.5 3.9 4.4 6.5 -6.5% (-11.6%, -1.0%)count 29 24 28 25 33 15 26 14 17 27pop 172,399 178,957 185,639 191,679 199,387 206,241 210,647 212,640 213,706 213,706rate 16.8 13.4 15.1 13.0 16.6 7.3 12.3 6.6 8.0 12.6 -5.4% (-10.6%, -0.1%)count 7 4 8 4 8 3 6 3 2 1pop 181,697 188,371 194,686 200,114 206,528 212,307 216,073 217,924 219,051 219,051rate 3.9 2.1 4.1 2.0 3.9 1.4 2.8 1.4 0.9 0.5 -12.7% (-22.0%, -2.2%)
Ethnicity and country of birthcount 1 11 3 4 6 5 7 8 6 4MI % 0.1% 1.5% 0.4% 0.6% 0.8% 0.7% 1.0% 1.2% 1.2% 0.6% No significant changecount 40 40 44 47 49 39 30 35 17 18MI % 5.1% 5.4% 5.6% 6.5% 6.7% 5.1% 4.2% 5.3% 3.3% 2.8% No significant change
Age (yrs) at HIV diagnosiscount 3 0 3 2 1 2 2 0 0 2pop 1,859,546 1,842,671 1,827,015 1,807,735 1,795,231 1,787,642 1,777,598 1,763,545 1,748,988 1,748,988rate 0.2 0.0 0.2 0.1 0.1 0.1 0.1 0.0 0.0 0.1 No significant changecount 64 57 44 36 55 49 41 43 21 31pop 701,731 689,422 679,240 673,348 669,622 661,892 652,633 644,542 633,603 633,603rate 9.1 8.3 6.5 5.3 8.2 7.4 6.3 6.7 3.3 4.9 -4.6% (-7.9%, 1.1%)count 328 292 341 315 315 333 301 270 210 230pop 1,309,647 1,329,996 1,350,444 1,361,626 1,373,552 1,385,554 1,387,849 1,379,772 1,358,033 1,358,033rate 25.0 22.0 25.3 23.1 22.9 24.0 21.7 19.6 15.5 16.9 -3.4% (-4.9%, -1.8%)count 152 142 159 140 141 158 166 178 136 186pop 1,154,771 1,157,209 1,161,361 1,167,312 1,179,755 1,189,888 1,201,063 1,213,625 1,229,514 1,229,514rate 13.2 12.3 13.7 12.0 12.0 13.3 13.8 14.7 11.1 15.1 +2.0% (0.1%, 4.0%)count 138 133 122 120 105 112 89 90 66 87pop 1,351,274 1,316,951 1,280,527 1,249,326 1,224,272 1,206,477 1,192,689 1,178,852 1,163,203 1,163,203rate 10.2 10.1 9.5 9.6 8.6 9.3 7.5 7.6 5.7 7.5 -3.9% (-6.1%, -1.7%)count 82 85 88 85 95 88 74 58 64 73pop 1,469,423 1,471,353 1,468,331 1,454,391 1,433,197 1,405,869 1,376,584 1,350,178 1,328,150 1,328,150rate 5.6 5.8 6.0 5.8 6.6 6.3 5.4 4.3 4.8 5.5 No significant changecount 25 37 25 24 25 24 37 27 21 29pop 2,051,897 2,107,200 2,165,115 2,220,745 2,278,488 2,339,430 2,398,870 2,454,281 2,505,064 2,505,064rate 1.2 1.8 1.2 1.1 1.1 1.0 1.5 1.1 0.8 1.2 No significant change
1Persons of Arab/Middle Eastern descent may be of any race and are not excluded from the race categories. 2Foreign born persons include those diagnosed with HIV while living in Michigan.
20-29
30-39
40-49
50-59
60+
Multi/ other malesMulti/ other females
00-14
15-19
Arab/Mid E descent1
Foreign born2
New Michigan HIV diagnoses 2012 - 2021: Demographic Stratification
% change (95CI)
Multi/ other overall
page 10

Measure 2012 2013 2014 2015 2016 2017 2018 2019 2020 2021HIV transmission risk by gender1
count 571 507 597 512 546 573 510 502 340 383MI % 72.1% 68.0% 76.3% 70.9% 74.1% 74.8% 71.8% 75.4% 65.6% 60.0% No significant changecount 452 411 466 414 438 447 378 397 285 322MI % 57.1% 55.1% 59.6% 57.3% 59.4% 58.4% 53.2% 59.6% 55.0% 50.5% No significant changecount 101 85 114 88 89 110 115 90 42 51MI % 12.8% 11.4% 14.6% 12.2% 12.1% 14.4% 16.2% 13.5% 8.1% 8.0% No significant changecount 18 11 17 10 19 16 17 15 13 10MI % 2.3% 1.5% 2.2% 1.4% 2.6% 2.1% 2.4% 2.3% 2.5% 1.6% No significant changecount 27 35 17 25 24 31 38 21 15 21MI % 3.4% 4.7% 2.2% 3.5% 3.3% 4.0% 5.4% 3.2% 2.9% 3.3% No significant changecount 16 16 12 12 11 11 23 12 8 10MI % 2.0% 2.1% 1.5% 1.7% 1.5% 1.4% 3.2% 1.8% 1.5% 1.6% No significant changecount 11 19 5 13 13 20 15 9 7 11MI % 1.4% 2.5% 0.6% 1.8% 1.8% 2.6% 2.1% 1.4% 1.4% 1.7% No significant changecount 0 0 0 0 0 0 0 0 0 0MI % 0.0% 0.0% 0.0% 0.0% 0.0% 0.0% 0.0% 0.0% 0.0% 0.0% No significant changecount 15 17 20 16 27 22 22 20 16 24MI % 1.9% 2.3% 2.6% 2.2% 3.7% 2.9% 3.1% 3.0% 3.1% 3.8% +6.6% (1.1%, 12.3%)count 12 14 18 16 27 22 20 18 16 23MI % 1.5% 1.9% 2.3% 2.2% 3.7% 2.9% 2.8% 2.7% 3.1% 3.6% +7.8% (2.1%, 13.9%)count 3 3 2 0 0 0 2 2 0 1MI % 0.4% 0.4% 0.3% 0.0% 0.0% 0.0% 0.3% 0.3% 0.0% 0.2% No significant changecount 28 43 29 36 32 34 29 25 19 9MI % 3.5% 5.8% 3.7% 5.0% 4.3% 4.4% 4.1% 3.8% 3.7% 1.4% -6.2% (-11.8%, -0.2%)count 28 43 29 36 32 34 29 25 19 9MI % 3.5% 5.8% 3.7% 5.0% 4.3% 4.4% 4.1% 3.8% 3.7% 1.4% -6.2% (-11.8%, -0.2%)count 0 0 0 0 0 0 0 0 0 0MI % 0.0% 0.0% 0.0% 0.0% 0.0% 0.0% 0.0% 0.0% 0.0% 0.0% No significant changecount 2 0 3 0 1 1 2 0 0 0MI % 0.3% 0.0% 0.4% 0.0% 0.1% 0.1% 0.3% 0.0% 0.0% 0.0% No significant changecount 1 0 2 0 0 0 1 0 0 0MI % 0.1% 0.0% 0.3% 0.0% 0.0% 0.0% 0.1% 0.0% 0.0% 0.0% No significant changecount 1 0 1 0 1 1 1 0 0 0MI % 0.1% 0.0% 0.1% 0.0% 0.1% 0.1% 0.1% 0.0% 0.0% 0.0% No significant changecount 0 0 0 0 0 0 0 0 0 0MI % 0.0% 0.0% 0.0% 0.0% 0.0% 0.0% 0.0% 0.0% 0.0% 0.0% No significant changecount 149 144 116 133 107 105 109 98 128 201MI % 18.8% 19.3% 14.8% 18.4% 14.5% 13.7% 15.4% 14.7% 24.7% 31.5% No significant change
Trans-gender
Cis women
Trans-gender
Other risk
Cis men
Cis women
1Risk/Gender Notes: PWID (persons who inject drugs). Persons included under "Sex w women" have no reported risk other than sex with a woman living with HIV, or a woman at high risk for HIV. Nearly all with "Other risk" are perinatal or pediatric cases.
Cis men
Trans-gender
New Michigan HIV diagnoses 2012 - 2021: Demographic Stratification
% change (95CI)
Trans-gender
Unknown risk
Sex w women
Sex w men/PWID
Cis men
Sex w men
Cis men
Cis women
Trans-gender
PWID
Cis men
page 11

Measure 2012 2013 2014 2015 2016 2017 2018 2019 2020 2021Special populationsMen who have sex with men (MSM) including MSM/PWID (persons who inject drugs)
count 464 425 484 430 465 469 398 415 301 345est pop 281,844 282,445 283,101 283,371 284,122 284,908 285,272 285,247 284,653 284,653rate 164.6 150.5 171.0 151.7 163.7 164.6 139.5 145.5 105.7 121.2 -2.6% (-4.2%, -1.0%)count 190 199 192 185 193 184 162 161 120 120est pop 10,124 10,197 10,281 10,356 10,390 10,370 10,294 10,182 9,904 9,904rate 1,876.7 1,951.5 1,867.6 1,786.5 1,857.6 1,774.4 1,573.7 1,581.3 1,211.6 1,211.6 -4.1% (-5.8%, -2.3%)
Persons who inject drugs (PWID) including MSM/PWIDcount 42 52 37 41 51 53 60 41 31 45MI % 5.3% 7.0% 4.7% 5.7% 6.9% 6.9% 8.5% 6.2% 6.0% 7.1% No significant changecount 9 21 18 14 16 25 20 15 14 15MI % 1.1% 2.8% 2.3% 1.9% 2.2% 3.3% 2.8% 2.3% 2.7% 2.4% +7.7% (1.7%, 14.0%)
Young (15-29) Black/AA men compared to otherscount 222 232 219 216 219 224 190 180 138 144pop 174,552 175,811 177,254 178,547 179,134 178,789 177,486 175,544 170,761 170,761rate 127.2 132.0 123.6 121.0 122.3 125.3 107.1 102.5 80.8 84.3 -3.9% (-5.6%, -2.3%)count 170 117 166 135 151 158 152 133 93 117pop 1,836,826 1,843,607 1,852,430 1,856,427 1,864,040 1,868,657 1,862,996 1,848,770 1,820,875 1,820,875rate 9.3 6.3 9.0 7.3 8.1 8.5 8.2 7.2 5.1 6.4 No significant changecount 397 397 394 369 366 382 366 353 287 375pop 6,027,365 6,052,713 6,075,334 6,091,774 6,115,712 6,141,664 6,169,206 6,196,936 6,225,931 6,225,931rate 6.6 6.6 6.5 6.1 6.0 6.2 5.9 5.7 4.6 6.0 -1.4% (-2.6%, -0.2%)
30+ yrs old
15-29 yr old PWID
New Michigan HIV diagnoses 2012 - 2021: Demographic Stratification
% change (95CI)
PWID
MSM
15-29 yr old Black/AA MSM (YBMSM)
15-29 yr old Black/AA men (YBM)
Other youth 15-29
page 12

Measure 2012 2013 2014 2015 2016 2017 2018 2019 2020 2021
count 438 367 479 397 453 489 414 384 200 281MI % 55.3% 49.2% 61.3% 55.0% 61.5% 63.8% 58.3% 57.7% 38.6% 44.0% No significant change
count 339 263 354 314 321 338 251 264 147 224MI % 42.8% 35.3% 45.3% 43.5% 43.6% 44.1% 35.4% 39.6% 28.4% 35.1% No significant change
count . . 109 137 164 115 116 77 106MI % . . 15.1% 18.6% 21.4% 16.2% 17.4% 14.9% 16.6% No significant changecount 171 203 177 156 171 147 164 146 96 109MI % 21.6% 27.2% 22.6% 21.6% 23.2% 19.2% 23.1% 21.9% 18.5% 17.1% -2.6% (-4.8%, -0.3%)
count 36 33 25 23 36 47 50 57 26 22MI % 4.5% 4.4% 3.2% 3.2% 4.9% 6.1% 7.0% 8.6% 5.0% 3.4% No significant changecount 119 81 88 83 71 96 49 59 21 34MI % 15.0% 10.9% 11.3% 11.5% 9.6% 12.5% 6.9% 8.9% 4.1% 5.3% -8.10% (-11.7%, -4.5%)count 53 40 40 52 55 57 53 58 59 49MI % 6.7% 5.4% 5.1% 7.2% 7.5% 7.4% 7.5% 8.7% 11.4% 7.7% +4.2% (0.8%, 7.7%)count 121 132 131 107 121 111 82 115 67 78MI % 15.3% 17.7% 16.8% 14.8% 16.4% 14.5% 11.5% 17.3% 12.9% 12.2% -2.60% (-5.1%, -0.1%)
count 324 307 340 326 347 378 357 325 268 337MI % 40.9% 41.2% 43.5% 45.2% 47.1% 49.3% 50.3% 48.8% 51.7% 52.8% +3.0% (1.7%, 4.3%)count 576 541 584 550 585 644 566 550 412 534MI % 72.7% 72.5% 74.7% 76.2% 79.4% 84.1% 79.7% 82.6% 79.5% 83.7% +1.8% (0.8%, 2.9%)count 280 271 369 389 445 522 479 496 361 475MI % 35.4% 36.3% 47.2% 53.9% 60.4% 68.1% 67.5% 74.5% 69.7% 74.5% +9.6% (7.1%, 12.1%)count 421 409 523 523 547 609 559 555 414 514MI % 53.2% 54.8% 66.9% 72.4% 74.2% 79.5% 78.7% 83.3% 79.9% 80.6% +5.1% (3.3%, 6.9%)
ER
Facility of diagnosis. The proportion of persons newly diagnosed at blood/plasma centers was stable. Diagnoses at ER's, and outpatient care facilities significantly increased while the proportion diagnosed at Community Based Organizations (CBO's), ID/HIV clinics, inpatient facilities, insurance screenings, and LHD's significantly decreased. The increase at ER's is due to hospitals implementing opt-out HIV testing. Not all facility types are displayed below.
Linkage and VS indicators have improved across the majority of geographic and demographic groups statewide.
VS in 12mo of diagnosis
The proportion of persons newly diagnosed with HIV who had ever tested negative appeard to drop drastically during 2020. This is likely a reflection of a decline in negative tests reported rather than a true decline in lifetime HIV testing.
8-30 day linkage8-90 day linkage
Linkage to Care. Persons who receive a CD4, viral load, and/or genotype lab test are considered linked to care. Early linkage improves prognosis and reduces transmission risk. Ideally, both linkage measures will increase. Time between diagnosis and first virally suppressed (VS) lab is also presented, as this gives more context to the linkage goal. Early viral suppression indicate an individual has been linked, and was also retained in care early on.
VS in 6mo of diagnosis
Early diagnosisLate diagnosis
HIV Stage at diagnosis. This measure indicates recency of HIV infection. Early diagnoses include persons who were diagnosed within 180 days of infection (acute and Stage 0, available after 2014). Late diagnoses include persons who progressed to Stage 3 within 90 days of initial diagnosis. Early diagnoses improve patient prognosis and reduce transmission risk. Ideally, early diagnoses will increase while late diagnoses decrease.
Blood/Plasma centerCBO
Local Health Department
The decrease in late diagnoses was driven by Outstate MI (outside the DMA).
Testing history & linkage among new Michigan HIV diagnoses 2012 - 2021
% change (95CI)Previously tested negative for HIV. This measure is derived mostly from self report at time of diagnosis. Ideally the proportion of newly diagnosed individuals who tested negative within the preceding 2 years will increase. Recent negative tests can indicate persons at high risk for HIV may be testing routinely. Ever tested HIV negativeNegative test w/in 2yrs of diagnosis
page 13

Persons living in the Detroit Metro Area (DMA) at time of HIV diagnosis(DMA: Lapeer, Macomb, Monroe, Oakland, St. Clair, & Wayne Counties).Includes persons in prisons located in the DMA
The Detroit Metro Area, 2012 - 2021
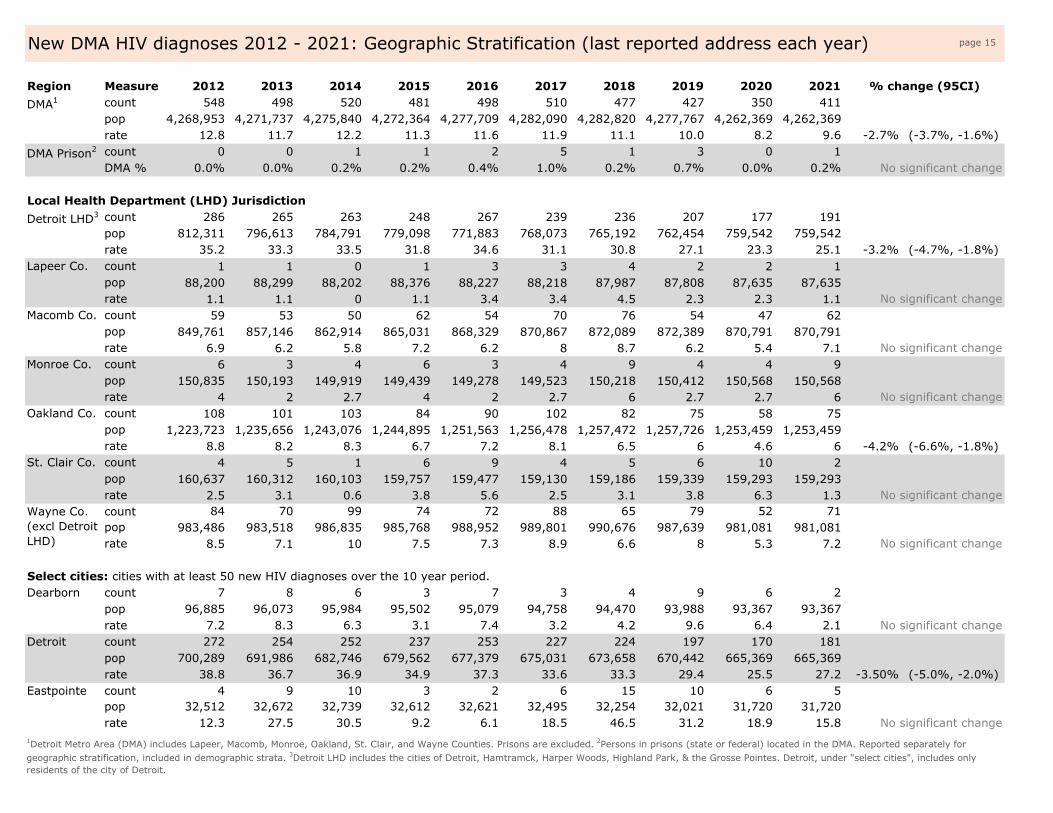
Region Measure 2012 2013 2014 2015 2016 2017 2018 2019 2020 2021count 548 498 520 481 498 510 477 427 350 411pop 4,268,953 4,271,737 4,275,840 4,272,364 4,277,709 4,282,090 4,282,820 4,277,767 4,262,369 4,262,369rate 12.8 11.7 12.2 11.3 11.6 11.9 11.1 10.0 8.2 9.6 -2.7% (-3.7%, -1.6%)count 0 0 1 1 2 5 1 3 0 1DMA % 0.0% 0.0% 0.2% 0.2% 0.4% 1.0% 0.2% 0.7% 0.0% 0.2% No significant change
Local Health Department (LHD) Jurisdictioncount 286 265 263 248 267 239 236 207 177 191pop 812,311 796,613 784,791 779,098 771,883 768,073 765,192 762,454 759,542 759,542rate 35.2 33.3 33.5 31.8 34.6 31.1 30.8 27.1 23.3 25.1 -3.2% (-4.7%, -1.8%)count 1 1 0 1 3 3 4 2 2 1pop 88,200 88,299 88,202 88,376 88,227 88,218 87,987 87,808 87,635 87,635rate 1.1 1.1 0 1.1 3.4 3.4 4.5 2.3 2.3 1.1 No significant changecount 59 53 50 62 54 70 76 54 47 62pop 849,761 857,146 862,914 865,031 868,329 870,867 872,089 872,389 870,791 870,791rate 6.9 6.2 5.8 7.2 6.2 8 8.7 6.2 5.4 7.1 No significant changecount 6 3 4 6 3 4 9 4 4 9pop 150,835 150,193 149,919 149,439 149,278 149,523 150,218 150,412 150,568 150,568rate 4 2 2.7 4 2 2.7 6 2.7 2.7 6 No significant changecount 108 101 103 84 90 102 82 75 58 75pop 1,223,723 1,235,656 1,243,076 1,244,895 1,251,563 1,256,478 1,257,472 1,257,726 1,253,459 1,253,459rate 8.8 8.2 8.3 6.7 7.2 8.1 6.5 6 4.6 6 -4.2% (-6.6%, -1.8%)count 4 5 1 6 9 4 5 6 10 2pop 160,637 160,312 160,103 159,757 159,477 159,130 159,186 159,339 159,293 159,293rate 2.5 3.1 0.6 3.8 5.6 2.5 3.1 3.8 6.3 1.3 No significant changecount 84 70 99 74 72 88 65 79 52 71pop 983,486 983,518 986,835 985,768 988,952 989,801 990,676 987,639 981,081 981,081rate 8.5 7.1 10 7.5 7.3 8.9 6.6 8 5.3 7.2 No significant change
Select cities: cities with at least 50 new HIV diagnoses over the 10 year period.count 7 8 6 3 7 3 4 9 6 2pop 96,885 96,073 95,984 95,502 95,079 94,758 94,470 93,988 93,367 93,367rate 7.2 8.3 6.3 3.1 7.4 3.2 4.2 9.6 6.4 2.1 No significant changecount 272 254 252 237 253 227 224 197 170 181pop 700,289 691,986 682,746 679,562 677,379 675,031 673,658 670,442 665,369 665,369rate 38.8 36.7 36.9 34.9 37.3 33.6 33.3 29.4 25.5 27.2 -3.50% (-5.0%, -2.0%)count 4 9 10 3 2 6 15 10 6 5pop 32,512 32,672 32,739 32,612 32,621 32,495 32,254 32,021 31,720 31,720rate 12.3 27.5 30.5 9.2 6.1 18.5 46.5 31.2 18.9 15.8 No significant change
New DMA HIV diagnoses 2012 - 2021: Geographic Stratification (last reported address each year)
1Detroit Metro Area (DMA) includes Lapeer, Macomb, Monroe, Oakland, St. Clair, and Wayne Counties. Prisons are excluded. 2Persons in prisons (state or federal) located in the DMA. Reported separately for geographic stratification, included in demographic strata. 3Detroit LHD includes the cities of Detroit, Hamtramck, Harper Woods, Highland Park, & the Grosse Pointes. Detroit, under "select cities", includes only residents of the city of Detroit.
DMA Prison2
% change (95CI)DMA1
Dearborn
Detroit
Eastpointe
Detroit LHD3
Monroe Co.
Lapeer Co.
Macomb Co.
Oakland Co.
Wayne Co. (excl Detroit LHD)
St. Clair Co.
page 15

Region Measure 2012 2013 2014 2015 2016 2017 2018 2019 2020 2021Select cities: cities with at least 50 new HIV diagnoses over the 10 year period.
count 14 8 10 3 6 5 3 3 2 3pop 20,178 20,299 20,319 20,232 20,222 20,174 20,054 20,037 20,198 20,198rate 69.4 39.4 49.2 14.8 29.7 24.8 15.0 15.0 9.9 14.9 -17.6% (-26.0%, -8.2%)count 6 6 4 6 10 7 8 5 5 6pop 11,143 11,052 11,030 10,974 10,921 10,876 10,828 10,787 10,712 10,712rate 53.8 54.3 36.3 54.7 91.6 64.4 73.9 46.4 46.7 56.0 No significant changecount 9 9 8 6 8 9 4 10 3 3
pop 25,102 24,873 24,858 24,731 24,623 24,530 24,425 24,291 24,115 24,115rate 35.9 36.2 32.2 24.3 32.5 36.7 16.4 41.2 12.4 12.4 No significant changecount 3 6 4 8 4 7 4 7 3 6pop 29,836 30,024 30,058 29,924 29,895 29,805 29,595 29,434 29,293 29,293rate 10.1 20.0 13.3 26.7 13.4 23.5 13.5 23.8 10.2 20.5 No significant changecount 14 15 14 10 13 23 13 16 9 8pop 60,305 60,458 60,476 60,275 60,247 60,147 59,776 59,441 58,911 58,911rate 23.2 24.8 23.1 16.6 21.6 38.2 21.7 26.9 15.3 13.6 No significant changecount 5 9 5 5 4 5 3 5 6 6pop 47,808 47,448 47,504 47,364 47,220 47,068 46,908 46,641 46,291 46,291rate 10.5 19 10.5 10.6 8.5 10.6 6.4 10.7 13 13 No significant changecount 12 7 6 8 5 8 5 4 2 7pop 60,585 61,027 61,241 61,221 61,709 61,845 61,828 61,704 61,355 61,355rate 19.8 11.5 9.8 13.1 8.1 12.9 8.1 6.5 3.3 11.4 No significant changecount 16 21 16 18 16 17 13 12 9 11pop 87,463 88,093 88,350 88,258 88,368 88,286 87,836 87,454 86,822 86,822rate 18.3 23.8 18.1 20.4 18.1 19.3 14.8 13.7 10.4 12.7 No significant changecount 7 4 5 10 0 11 11 5 5 6pop 130,677 131,527 132,141 132,051 132,489 132,599 132,612 132,187 131,709 131,709rate 5.4 3 3.8 7.6 0 8.3 8.3 3.8 3.8 4.6 No significant changecount 5 4 8 10 7 9 6 6 5 9pop 62,469 61,963 62,075 61,786 61,594 61,431 61,216 60,949 60,576 60,576rate 8 6.5 12.9 16.2 11.4 14.7 9.8 9.8 8.3 14.9 No significant changecount 14 15 11 18 11 19 16 10 13 15pop 134,596 135,319 135,673 135,393 135,206 135,011 134,248 133,667 132,877 132,877rate 10.4 11.1 8.1 13.3 8.1 14.1 11.9 7.5 9.8 11.3 No significant changecount 9 10 18 9 5 11 8 10 6 8pop 83,340 82,666 82,634 82,328 82,132 81,980 81,828 81,558 81,116 81,116rate 10.8 12.1 21.8 10.9 6.1 13.4 9.8 12.3 7.4 9.9 No significant change
Pontiac
Redford
Royal Oak
Oak Park
New DMA HIV diagnoses 2012 - 2021: Geographic Stratification (last reported address each year)
% change (95CI)
Ferndale
Highland Park
Inkster
Southfield
Sterling Heights
Taylor
Warren
Westland
page 16
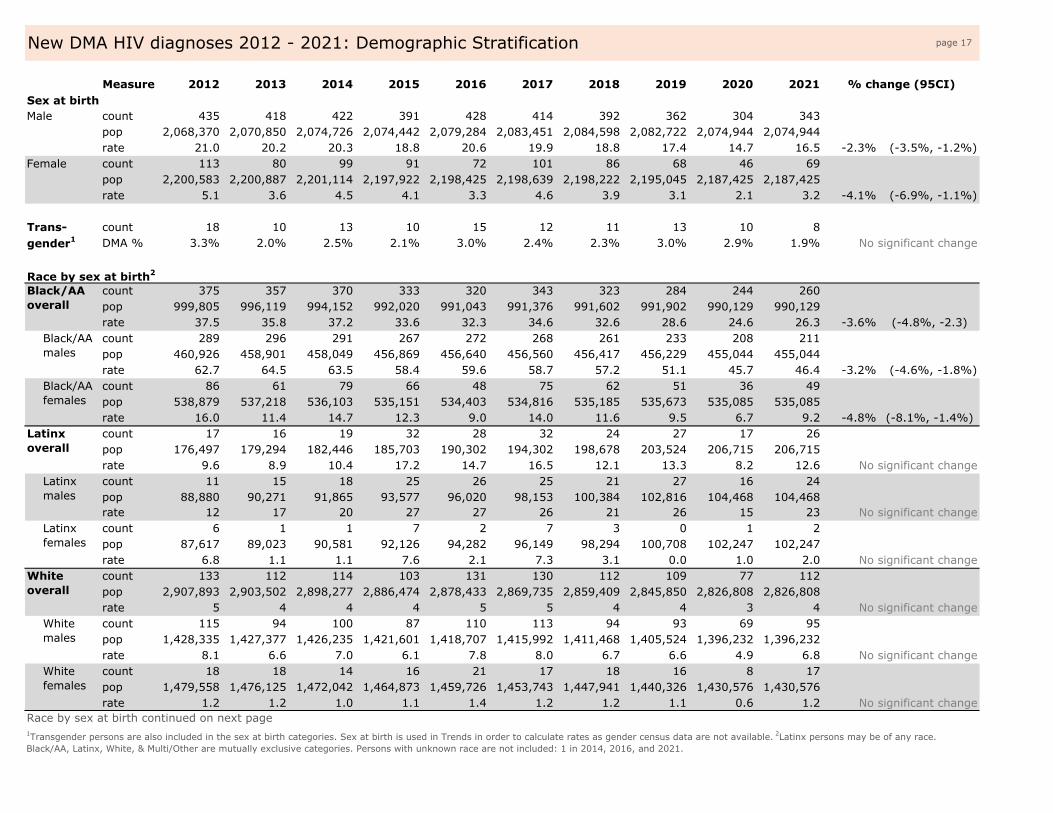
Measure 2012 2013 2014 2015 2016 2017 2018 2019 2020 2021Sex at birth
count 435 418 422 391 428 414 392 362 304 343pop 2,068,370 2,070,850 2,074,726 2,074,442 2,079,284 2,083,451 2,084,598 2,082,722 2,074,944 2,074,944rate 21.0 20.2 20.3 18.8 20.6 19.9 18.8 17.4 14.7 16.5 -2.3% (-3.5%, -1.2%)count 113 80 99 91 72 101 86 68 46 69pop 2,200,583 2,200,887 2,201,114 2,197,922 2,198,425 2,198,639 2,198,222 2,195,045 2,187,425 2,187,425rate 5.1 3.6 4.5 4.1 3.3 4.6 3.9 3.1 2.1 3.2 -4.1% (-6.9%, -1.1%)
count 18 10 13 10 15 12 11 13 10 8DMA % 3.3% 2.0% 2.5% 2.1% 3.0% 2.4% 2.3% 3.0% 2.9% 1.9% No significant change
Race by sex at birth2
count 375 357 370 333 320 343 323 284 244 260pop 999,805 996,119 994,152 992,020 991,043 991,376 991,602 991,902 990,129 990,129rate 37.5 35.8 37.2 33.6 32.3 34.6 32.6 28.6 24.6 26.3 -3.6% (-4.8%, -2.3)count 289 296 291 267 272 268 261 233 208 211pop 460,926 458,901 458,049 456,869 456,640 456,560 456,417 456,229 455,044 455,044rate 62.7 64.5 63.5 58.4 59.6 58.7 57.2 51.1 45.7 46.4 -3.2% (-4.6%, -1.8%)count 86 61 79 66 48 75 62 51 36 49pop 538,879 537,218 536,103 535,151 534,403 534,816 535,185 535,673 535,085 535,085rate 16.0 11.4 14.7 12.3 9.0 14.0 11.6 9.5 6.7 9.2 -4.8% (-8.1%, -1.4%)count 17 16 19 32 28 32 24 27 17 26pop 176,497 179,294 182,446 185,703 190,302 194,302 198,678 203,524 206,715 206,715rate 9.6 8.9 10.4 17.2 14.7 16.5 12.1 13.3 8.2 12.6 No significant changecount 11 15 18 25 26 25 21 27 16 24pop 88,880 90,271 91,865 93,577 96,020 98,153 100,384 102,816 104,468 104,468rate 12 17 20 27 27 26 21 26 15 23 No significant changecount 6 1 1 7 2 7 3 0 1 2pop 87,617 89,023 90,581 92,126 94,282 96,149 98,294 100,708 102,247 102,247rate 6.8 1.1 1.1 7.6 2.1 7.3 3.1 0.0 1.0 2.0 No significant changecount 133 112 114 103 131 130 112 109 77 112pop 2,907,893 2,903,502 2,898,277 2,886,474 2,878,433 2,869,735 2,859,409 2,845,850 2,826,808 2,826,808rate 5 4 4 4 5 5 4 4 3 4 No significant changecount 115 94 100 87 110 113 94 93 69 95pop 1,428,335 1,427,377 1,426,235 1,421,601 1,418,707 1,415,992 1,411,468 1,405,524 1,396,232 1,396,232rate 8.1 6.6 7.0 6.1 7.8 8.0 6.7 6.6 4.9 6.8 No significant changecount 18 18 14 16 21 17 18 16 8 17pop 1,479,558 1,476,125 1,472,042 1,464,873 1,459,726 1,453,743 1,447,941 1,440,326 1,430,576 1,430,576rate 1.2 1.2 1.0 1.1 1.4 1.2 1.2 1.1 0.6 1.2 No significant change
Race by sex at birth continued on next page
Black/AA overall
Black/AA males
Black/AA females
Latinx overall
New DMA HIV diagnoses 2012 - 2021: Demographic Stratification
% change (95CI)
Trans-gender1
Male
Female
Latinx males
Latinx females
1Transgender persons are also included in the sex at birth categories. Sex at birth is used in Trends in order to calculate rates as gender census data are not available. 2Latinx persons may be of any race. Black/AA, Latinx, White, & Multi/Other are mutually exclusive categories. Persons with unknown race are not included: 1 in 2014, 2016, and 2021.
White overall
White males
White females
page 17
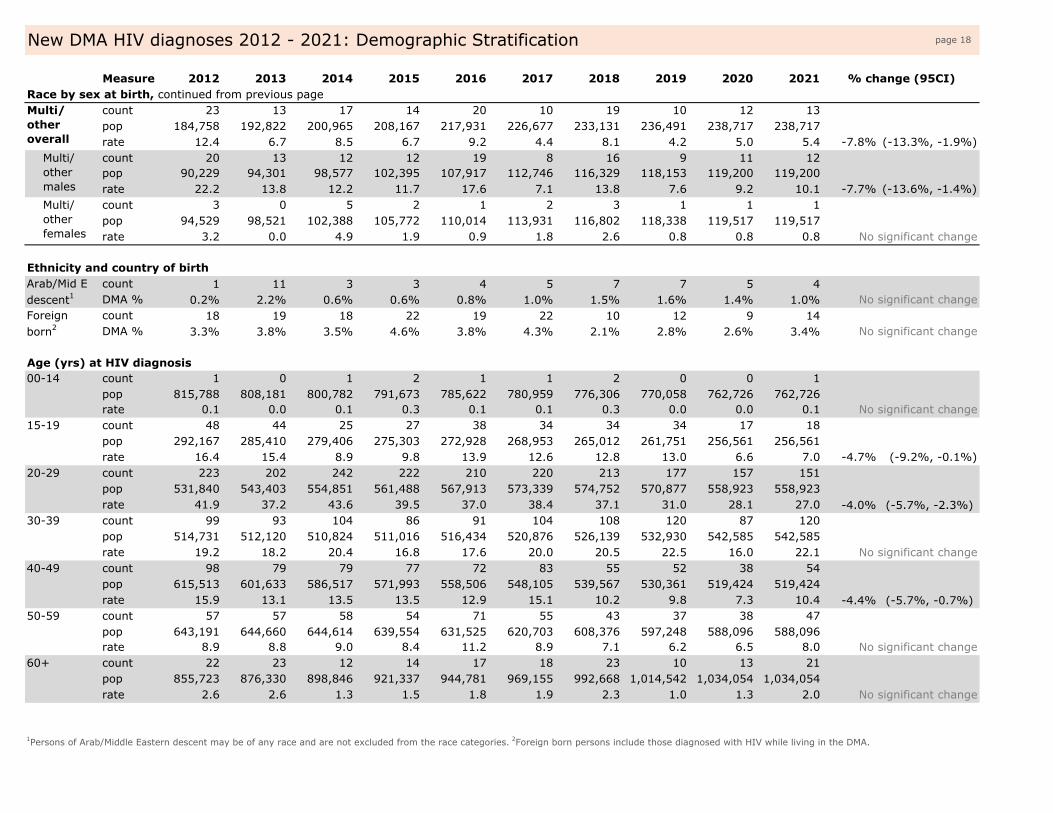
Measure 2012 2013 2014 2015 2016 2017 2018 2019 2020 2021Race by sex at birth, continued from previous page
count 23 13 17 14 20 10 19 10 12 13pop 184,758 192,822 200,965 208,167 217,931 226,677 233,131 236,491 238,717 238,717rate 12.4 6.7 8.5 6.7 9.2 4.4 8.1 4.2 5.0 5.4 -7.8% (-13.3%, -1.9%)count 20 13 12 12 19 8 16 9 11 12pop 90,229 94,301 98,577 102,395 107,917 112,746 116,329 118,153 119,200 119,200rate 22.2 13.8 12.2 11.7 17.6 7.1 13.8 7.6 9.2 10.1 -7.7% (-13.6%, -1.4%)count 3 0 5 2 1 2 3 1 1 1pop 94,529 98,521 102,388 105,772 110,014 113,931 116,802 118,338 119,517 119,517rate 3.2 0.0 4.9 1.9 0.9 1.8 2.6 0.8 0.8 0.8 No significant change
Ethnicity and country of birthcount 1 11 3 3 4 5 7 7 5 4DMA % 0.2% 2.2% 0.6% 0.6% 0.8% 1.0% 1.5% 1.6% 1.4% 1.0% No significant changecount 18 19 18 22 19 22 10 12 9 14DMA % 3.3% 3.8% 3.5% 4.6% 3.8% 4.3% 2.1% 2.8% 2.6% 3.4% No significant change
Age (yrs) at HIV diagnosiscount 1 0 1 2 1 1 2 0 0 1pop 815,788 808,181 800,782 791,673 785,622 780,959 776,306 770,058 762,726 762,726rate 0.1 0.0 0.1 0.3 0.1 0.1 0.3 0.0 0.0 0.1 No significant changecount 48 44 25 27 38 34 34 34 17 18pop 292,167 285,410 279,406 275,303 272,928 268,953 265,012 261,751 256,561 256,561rate 16.4 15.4 8.9 9.8 13.9 12.6 12.8 13.0 6.6 7.0 -4.7% (-9.2%, -0.1%)count 223 202 242 222 210 220 213 177 157 151pop 531,840 543,403 554,851 561,488 567,913 573,339 574,752 570,877 558,923 558,923rate 41.9 37.2 43.6 39.5 37.0 38.4 37.1 31.0 28.1 27.0 -4.0% (-5.7%, -2.3%)count 99 93 104 86 91 104 108 120 87 120pop 514,731 512,120 510,824 511,016 516,434 520,876 526,139 532,930 542,585 542,585rate 19.2 18.2 20.4 16.8 17.6 20.0 20.5 22.5 16.0 22.1 No significant changecount 98 79 79 77 72 83 55 52 38 54pop 615,513 601,633 586,517 571,993 558,506 548,105 539,567 530,361 519,424 519,424rate 15.9 13.1 13.5 13.5 12.9 15.1 10.2 9.8 7.3 10.4 -4.4% (-5.7%, -0.7%)count 57 57 58 54 71 55 43 37 38 47pop 643,191 644,660 644,614 639,554 631,525 620,703 608,376 597,248 588,096 588,096rate 8.9 8.8 9.0 8.4 11.2 8.9 7.1 6.2 6.5 8.0 No significant changecount 22 23 12 14 17 18 23 10 13 21pop 855,723 876,330 898,846 921,337 944,781 969,155 992,668 1,014,542 1,034,054 1,034,054rate 2.6 2.6 1.3 1.5 1.8 1.9 2.3 1.0 1.3 2.0 No significant change
00-14
15-19
Arab/Mid E descent1
Foreign born2
New DMA HIV diagnoses 2012 - 2021: Demographic Stratification
% change (95CI)
Multi/ other overall
1Persons of Arab/Middle Eastern descent may be of any race and are not excluded from the race categories. 2Foreign born persons include those diagnosed with HIV while living in the DMA.
20-29
30-39
40-49
50-59
60+
Multi/ other malesMulti/ other females
page 18

Measure 2012 2013 2014 2015 2016 2017 2018 2019 2020 2021HIV transmission risk by gender1
count 390 350 406 342 375 380 346 324 228 257DMA % 71.2% 70.3% 78.1% 71.1% 75.3% 74.5% 72.5% 75.9% 65.1% 62.5% No significant changecount 301 284 316 271 304 290 264 257 196 212DMA % 54.9% 57.0% 60.8% 56.3% 61.0% 56.9% 55.3% 60.2% 56.0% 51.6% No significant changecount 75 58 79 61 57 79 72 55 22 38DMA % 13.7% 11.6% 15.2% 12.7% 11.4% 15.5% 15.1% 12.9% 6.3% 9.2% No significant changecount 14 8 11 10 14 11 10 12 10 7DMA % 2.6% 1.6% 2.1% 2.1% 2.8% 2.2% 2.1% 2.8% 2.9% 1.7% No significant changecount 22 18 9 18 13 21 24 14 9 11DMA % 4.0% 3.6% 1.7% 3.7% 2.6% 4.1% 5.0% 3.3% 2.6% 2.7% No significant changecount 13 8 6 7 4 6 16 8 4 4DMA % 2.4% 1.6% 1.2% 1.5% 0.8% 1.2% 3.4% 1.9% 1.1% 1.0% No significant changecount 9 10 3 11 9 15 8 6 5 7DMA % 1.6% 2.0% 0.6% 2.3% 1.8% 2.9% 1.7% 1.4% 1.4% 1.7% No significant changecount 0 0 0 0 0 0 0 0 0 0DMA % 0.0% 0.0% 0.0% 0.0% 0.0% 0.0% 0.0% 0.0% 0.0% 0.0% No significant changecount 14 10 15 8 16 13 13 8 13 12DMA % 2.6% 2.0% 2.9% 1.7% 3.2% 2.5% 2.7% 1.9% 3.7% 2.9% No significant changecount 11 8 13 8 16 13 12 7 13 11DMA % 2.0% 1.6% 2.5% 1.7% 3.2% 2.5% 2.5% 1.6% 3.7% 2.7% No significant changecount 3 2 2 0 0 0 1 1 0 1DMA % 0.5% 0.4% 0.4% 0.0% 0.0% 0.0% 0.2% 0.2% 0.0% 0.2% No significant changecount 16 25 12 25 20 23 18 12 16 7DMA % 2.9% 5.0% 2.3% 5.2% 4.0% 4.5% 3.8% 2.8% 4.6% 1.7% No significant changecount 16 25 12 25 20 23 18 12 16 7DMA % 2.9% 5.0% 2.3% 5.2% 4.0% 4.5% 3.8% 2.8% 4.6% 1.7% No significant changecount 0 0 0 0 0 0 0 0 0 0DMA % 0.0% 0.0% 0.0% 0.0% 0.0% 0.0% 0.0% 0.0% 0.0% 0.0% No significant changecount 1 0 1 0 1 1 2 0 0 0DMA % 0.2% 0.0% 0.2% 0.0% 0.2% 0.2% 0.4% 0.0% 0.0% 0.0% No significant changecount 1 0 1 0 0 0 1 0 0 0DMA % 0.2% 0.0% 0.2% 0.0% 0.0% 0.0% 0.2% 0.0% 0.0% 0.0% No significant changecount 0 0 0 0 1 1 1 0 0 0DMA % 0.0% 0.0% 0.0% 0.0% 0.2% 0.2% 0.2% 0.0% 0.0% 0.0% No significant changecount 0 0 0 0 0 0 0 0 0 0DMA % 0.0% 0.0% 0.0% 0.0% 0.0% 0.0% 0.0% 0.0% 0.0% 0.0% No significant changecount 105 95 78 89 75 77 75 72 84 125DMA % 19.2% 19.1% 15.0% 18.5% 15.1% 15.1% 15.7% 16.9% 24.0% 30.4% No significant change
1Risk/Gender Notes: PWID (persons who inject drugs). Persons included under "Sex w women" have no reported risk other than sex with a woman living with HIV, or a woman at high risk for HIV. Nearly all with "Other risk" are perinatal or pediatric cases.
Cis men
Trans-gender
New DMA HIV diagnoses 2012 - 2021: Demographic Stratification
% change (95CI)
Trans-gender
Unknown risk
Sex w women
Sex w men/PWID
Cis men
Sex w men
Cis men
Cis women
Trans-gender
PWID
Cis men
Trans-gender
Cis women
Trans-gender
Other risk
Cis men
Cis women
page 19

Measure 2012 2013 2014 2015 2016 2017 2018 2019 2020 2021Special populationsMen who have sex with men (MSM) including MSM/PWID (persons who inject drugs)
count 312 292 329 279 320 303 276 264 209 223est pop 119,965 120,109 120,334 120,318 120,598 120,840 120,907 120,798 120,347 120,347rate 260.1 243.1 273.4 231.9 265.3 250.7 228.3 218.5 173.7 185.3 -3.0% (-4.6%, -1.4%)count 137 151 154 142 149 135 135 115 100 86est pop 6,469 6,490 6,518 6,528 6,524 6,485 6,414 6,312 6,102 6,102rate 2,117.8 2,326.8 2,362.6 2,175.4 2,283.8 2,081.7 2,104.6 1,822.1 1,638.8 1,409.4 -3.8% (-5.8%, -1.8%)
Persons who inject drugs (PWID) including MSM/PWIDcount 36 28 24 26 29 34 37 22 22 23DMA % 6.6% 5.6% 4.6% 5.4% 5.8% 6.7% 7.8% 5.2% 6.3% 5.6% No significant changecount 8 12 15 9 8 15 12 7 12 6DMA % 1.5% 2.4% 2.9% 1.9% 1.6% 2.9% 2.5% 1.6% 3.4% 1.5% No significant change
Young (15-29) Black/AA men compared to otherscount 162 174 175 165 170 166 161 131 116 102pop 111,533 111,890 112,385 112,545 112,486 111,812 110,593 108,819 105,207 105,207rate 145.2 155.5 155.7 146.6 151.1 148.5 145.6 120.4 110.3 97.0 -3.7% (-5.6%, -1.7%)count 109 72 92 84 78 88 86 80 58 67pop 712,474 716,923 721,872 724,246 728,355 730,480 729,171 723,809 710,277 710,277rate 15.3 10.0 12.7 11.6 10.7 12.0 11.8 11.1 8.2 9.4 -3.0% (-5.5%, -0.4%)count 276 252 253 231 251 260 229 219 176 242pop 2,629,158 2,634,743 2,640,801 2,643,900 2,651,246 2,658,839 2,666,750 2,675,081 2,684,159 2,684,159rate 10.5 9.6 9.6 8.7 9.5 9.8 8.6 8.2 6.6 9.0 -1.7% (-3.2%, -0.3%)
30+ yrs old
15-29 yr old PWID
New DMA HIV diagnoses 2012 - 2021: Demographic Stratification
% change (95CI)
PWID
MSM
15-29 yr old Black/AA MSM (YBMSM)
15-29 yr old Black/AA men (YBM)
Other youth 15-29
page 20

Measure 2012 2013 2014 2015 2016 2017 2018 2019 2020 2021
count 302 246 311 269 313 326 285 266 146 192DMA % 55.1% 49.4% 59.8% 55.9% 62.9% 63.9% 59.7% 62.3% 41.7% 46.7% No significant change
count 240 179 240 220 224 232 185 184 102 146DMA % 43.8% 35.9% 46.2% 45.7% 45.0% 45.5% 38.8% 43.1% 29.1% 35.5% No significant change
count . . . 80 90 115 83 86 53 71DMA % . . . 16.6% 18.1% 22.5% 17.4% 20.1% 15.1% 17.3% No significant changecount 109 119 116 100 114 89 99 89 54 75DMA % 19.9% 23.9% 22.3% 20.8% 22.9% 17.5% 20.8% 20.8% 15.4% 18.2% No significant change
count 27 26 16 14 19 28 35 35 19 8DMA % 4.9% 5.2% 3.1% 2.9% 3.8% 5.5% 7.3% 8.2% 5.4% 1.9% No significant changecount 82 58 57 60 45 68 31 40 13 24DMA % 15.0% 11.6% 11.0% 12.5% 9.0% 13.3% 6.5% 9.4% 3.7% 5.8% -7.7% (-11.7%, -3.5%)count 49 35 37 42 52 54 45 52 50 46DMA % 8.9% 7.0% 7.1% 8.7% 10.4% 10.6% 9.4% 12.2% 14.3% 11.2% +5.0% (1.4%, 8.8%)count 69 84 75 57 68 65 53 70 42 53DMA % 12.6% 16.9% 14.4% 11.9% 13.7% 12.7% 11.1% 16.4% 12.0% 12.9% No significant change
count 225 195 217 200 224 246 220 196 172 210DMA % 41.1% 39.2% 41.7% 41.6% 45.0% 48.2% 46.1% 45.9% 49.1% 51.1% +2.7% (1.0%, 4.4%)count 384 351 367 359 382 429 373 342 271 337DMA % 70.1% 70.5% 70.6% 74.6% 76.7% 84.1% 78.2% 80.1% 77.4% 82.0% +2.1% (0.8%, 3.4%)count 169 166 226 245 295 344 318 312 239 301DMA % 30.8% 33.3% 43.5% 50.9% 59.2% 67.5% 66.7% 73.1% 68.3% 73.2% +10.9% (7.9%, 14.0%)count 262 269 326 340 372 404 369 352 273 328DMA % 47.8% 54.0% 62.7% 70.7% 74.7% 79.2% 77.4% 82.4% 78.0% 79.8% +5.9% (3.8%, 8.0%)
Testing history & linkage among new DMA HIV diagnoses 2012 - 2021
% change (95CI)Previously tested negative for HIV. This measure is derived mostly from self report at time of diagnosis. Ideally the proportion of newly diagnosed individuals who tested negative within the preceding 2 years will increase. Recent negative tests can indicate persons at high risk for HIV may be testing routinely. Ever tested HIV negativeNegative test w/in 2yrs of diagnosis
ER
Facility of diagnosis. The proportion of persons newly diagnosed at blood/plasma centers, HIV/ID Clinics, and LHD's were stable. Diagnoses at ER's, and outpatient care facilities significantly increased while the proportion diagnosed at Community Based Organizations (CBO's), and inpatient facilities significantly decreased. The increase at ER's is due to hospitals implementing opt-out HIV testing. Not all facility types are displayed below.
Linkage and VS indicators have improved across the majority of geographic and demographic groups statewide.
VS in 12mo of diagnosis
The proportion of persons newly diagnosed with HIV who had ever tested negative appeard to drop drastically during 2020. This is likely a reflection of a decline in negative tests reported rather than a true decline in lifetime HIV testing.
8-30 day linkage8-90 day linkage
Linkage to Care. Persons who receive a CD4, viral load, and/or genotype lab test are considered linked to care. Early linkage improves prognosis and reduces transmission risk. Ideally, both linkage measures will increase. Time between diagnosis and first virally suppressed (VS) lab is also presented, as this gives more context to the linkage goal. Early viral suppression indicate an individual has been linked, and was also retained in care early on.
VS in 6mo of diagnosis
Early diagnosisLate diagnosis
HIV Stage at diagnosis. This measure indicates recency of HIV infection. Early diagnoses include persons who were diagnosed within 180 days of infection (acute and Stage 0, available after 2014). Late diagnoses include persons who progressed to Stage 3 within 90 days of initial diagnosis. Early diagnoses improve patient prognosis and reduce transmission risk. Ideally, early diagnoses will increase while late diagnoses decrease.
Blood/Plasma centerCBO
Local Health Department
page 21

Persons living in the Detroit Health Department's Jurisdiction at time of HIV diagnosis(Detroit LHD: Detroit, Hamtramck, Harper Woods, Highland Park, & the Grosse Pointes).Includes persons in prisons located in the Detroit LHD Jurisdiction
Detroit LHD Jurisdiction, 2012 - 2021
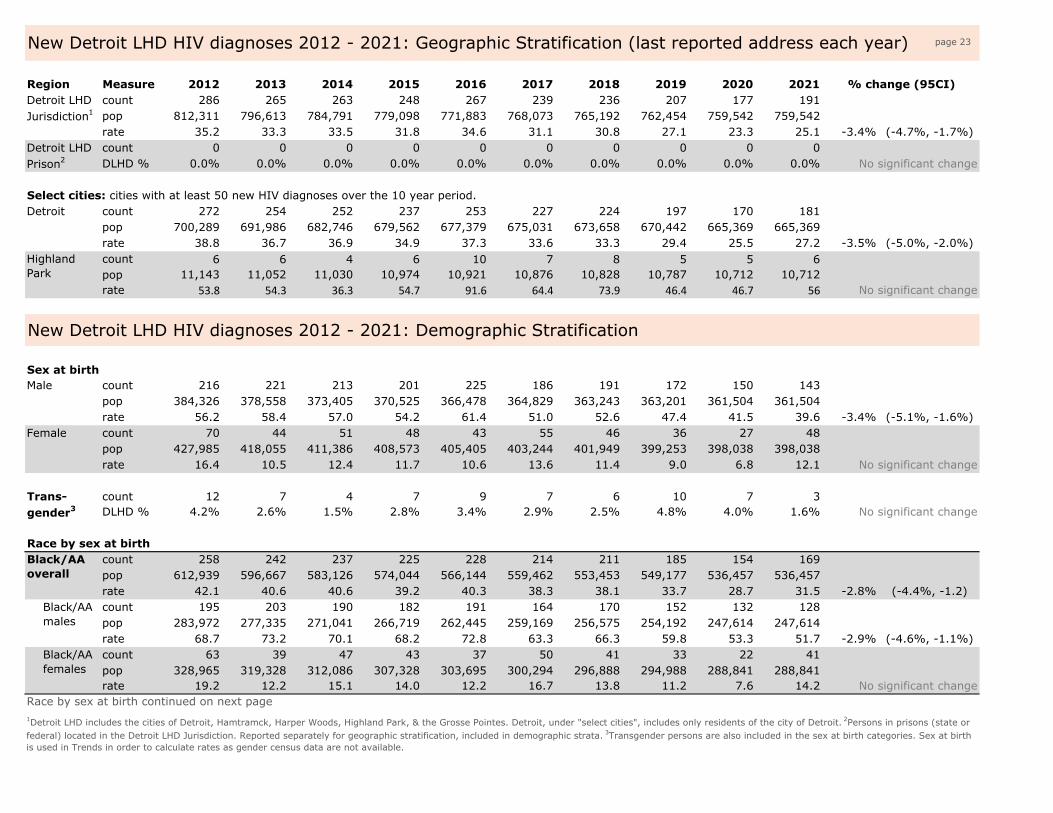
Region Measure 2012 2013 2014 2015 2016 2017 2018 2019 2020 2021count 286 265 263 248 267 239 236 207 177 191pop 812,311 796,613 784,791 779,098 771,883 768,073 765,192 762,454 759,542 759,542rate 35.2 33.3 33.5 31.8 34.6 31.1 30.8 27.1 23.3 25.1 -3.4% (-4.7%, -1.7%)count 0 0 0 0 0 0 0 0 0 0DLHD % 0.0% 0.0% 0.0% 0.0% 0.0% 0.0% 0.0% 0.0% 0.0% 0.0% No significant change
Select cities: cities with at least 50 new HIV diagnoses over the 10 year period.count 272 254 252 237 253 227 224 197 170 181pop 700,289 691,986 682,746 679,562 677,379 675,031 673,658 670,442 665,369 665,369rate 38.8 36.7 36.9 34.9 37.3 33.6 33.3 29.4 25.5 27.2 -3.5% (-5.0%, -2.0%)count 6 6 4 6 10 7 8 5 5 6pop 11,143 11,052 11,030 10,974 10,921 10,876 10,828 10,787 10,712 10,712rate 53.8 54.3 36.3 54.7 91.6 64.4 73.9 46.4 46.7 56 No significant change
Sex at birthcount 216 221 213 201 225 186 191 172 150 143pop 384,326 378,558 373,405 370,525 366,478 364,829 363,243 363,201 361,504 361,504rate 56.2 58.4 57.0 54.2 61.4 51.0 52.6 47.4 41.5 39.6 -3.4% (-5.1%, -1.6%)count 70 44 51 48 43 55 46 36 27 48pop 427,985 418,055 411,386 408,573 405,405 403,244 401,949 399,253 398,038 398,038rate 16.4 10.5 12.4 11.7 10.6 13.6 11.4 9.0 6.8 12.1 No significant change
count 12 7 4 7 9 7 6 10 7 3DLHD % 4.2% 2.6% 1.5% 2.8% 3.4% 2.9% 2.5% 4.8% 4.0% 1.6% No significant change
Race by sex at birthcount 258 242 237 225 228 214 211 185 154 169pop 612,939 596,667 583,126 574,044 566,144 559,462 553,453 549,177 536,457 536,457rate 42.1 40.6 40.6 39.2 40.3 38.3 38.1 33.7 28.7 31.5 -2.8% (-4.4%, -1.2)count 195 203 190 182 191 164 170 152 132 128pop 283,972 277,335 271,041 266,719 262,445 259,169 256,575 254,192 247,614 247,614rate 68.7 73.2 70.1 68.2 72.8 63.3 66.3 59.8 53.3 51.7 -2.9% (-4.6%, -1.1%)count 63 39 47 43 37 50 41 33 22 41pop 328,965 319,328 312,086 307,328 303,695 300,294 296,888 294,988 288,841 288,841rate 19.2 12.2 15.1 14.0 12.2 16.7 13.8 11.2 7.6 14.2 No significant change
Race by sex at birth continued on next page
Black/AA females
1Detroit LHD includes the cities of Detroit, Hamtramck, Harper Woods, Highland Park, & the Grosse Pointes. Detroit, under "select cities", includes only residents of the city of Detroit. 2Persons in prisons (state or federal) located in the Detroit LHD Jurisdiction. Reported separately for geographic stratification, included in demographic strata. 3Transgender persons are also included in the sex at birth categories. Sex at birth is used in Trends in order to calculate rates as gender census data are not available.
New Detroit LHD HIV diagnoses 2012 - 2021: Geographic Stratification (last reported address each year)
Detroit LHD Prison2
% change (95CI)Detroit LHD Jurisdiction1
Detroit
Highland Park
New Detroit LHD HIV diagnoses 2012 - 2021: Demographic Stratification
Male
Female
Trans-gender3
Black/AA overall
Black/AA males
page 23

Measure 2012 2013 2014 2015 2016 2017 2018 2019 2020 2021Race by sex at birth1 (continued from previous page)
count 6 8 7 8 14 9 9 9 5 7pop 50,937 51,712 52,482 54,568 52,752 53,004 52,841 53,215 53,635 53,635rate 11.8 15.5 13.3 14.7 26.5 17.0 17.0 16.9 9.3 13.1 No significant changecount 2 8 7 6 13 7 7 9 4 6pop 26,227 26,352 26,713 27,536 26,781 27,009 26,951 27,486 27,668 27,668rate 7.6 30.4 26.2 21.8 48.5 25.9 26.0 32.7 14.5 21.7 No significant changecount 4 0 0 2 1 2 2 0 1 1pop 24,710 25,360 25,769 27,032 25,971 25,995 25,890 25,729 25,967 25,967rate 16.2 0.0 0.0 7.4 3.9 7.7 7.7 0.0 3.9 3.9 No significant changecount 15 12 16 11 17 15 13 10 11 13pop 118,546 116,570 117,108 117,952 118,936 120,904 122,650 124,218 127,330 127,330rate 12.7 10.3 13.7 9.3 14.3 12.4 10.6 8.1 8.6 10.2 No significant changecount 12 7 12 9 13 13 10 7 8 8pop 59,349 59,052 59,675 60,224 60,534 61,794 62,387 63,976 65,629 65,629rate 20.2 11.9 20.1 14.9 21.5 21.0 16.0 10.9 12.2 12.2 No significant changecount 3 5 4 2 4 2 3 3 3 5pop 59,197 57,518 57,433 57,728 58,402 59,110 60,263 60,242 61,701 61,701rate 5.1 8.7 7.0 3.5 6.8 3.4 5.0 5.0 4.9 8.1 No significant changecount 7 3 4 5 8 3 4 4 7 2pop 29,891 31,668 32,074 32,531 34,055 34,702 36,238 35,841 42,122 42,122rate 23.4 9.5 12.5 15.4 23.5 8.6 11.0 11.2 16.6 4.7 No significant changecount 7 3 4 4 7 2 4 4 6 1pop 14,778 15,819 15,976 16,046 16,718 16,857 17,330 17,547 20,593 20,593rate 47.4 19.0 25.0 24.9 41.9 11.9 23.1 22.8 29.1 4.9 -11.9% (-22.1%, -0.4%)count 0 0 0 1 1 1 0 0 1 1pop 15,113 15,849 16,098 16,485 17,337 17,845 18,908 18,294 21,529 21,529rate 0.0 0.0 0.0 6.1 5.8 5.6 0.0 0.0 4.6 4.6 No significant change
Ethnicity and country of birthcount 1 3 1 0 1 1 0 1 1 2DLHD % 0.4% 1.1% 0.4% 0.0% 0.4% 0.4% 0.0% 0.5% 0.6% 1.0% No significant changecount 7 3 4 3 5 3 0 2 1 5DLHD % 2.4% 1.1% 1.5% 1.2% 1.9% 1.3% 0.0% 1.0% 0.6% 2.6% No significant change
Age (yrs) at HIV diagnosisCity census data are not available in 10 year age groups. See following page for breakdown among those diagnosed before and after 30 years of age.
1Latinx persons may be of any race. Black/AA, Latinx, White, & Multi/Other are mutually exclusive categories. Persons with unknown race are not included: 1 in 2016. 2Persons of Arab/Middle Eastern descent may be of any race and are not excluded from the race categories. 3Foreign born persons include those diagnosed with HIV while living in the Detroit LHD area.
Latinx overall
New Detroit LHD HIV diagnoses 2012 - 2021: Demographic Stratification
% change (95CI)
Arab/Mid E descent2
Foreign born3
Multi/ other overall
Latinx males
Latinx females
White overall
White males
White females
Multi/ other malesMulti/ other females
page 24

Measure 2012 2013 2014 2015 2016 2017 2018 2019 2020 2021HIV transmission risk by gender1
count 182 183 203 174 202 179 172 158 108 114DLHD % 63.6% 69.1% 77.2% 70.2% 75.7% 74.9% 72.9% 76.3% 61.0% 59.7% No significant changecount 129 147 161 135 157 127 125 120 91 84DLHD % 45.1% 55.5% 61.2% 54.4% 58.8% 53.1% 53.0% 58.0% 51.4% 44.0% No significant changecount 44 30 38 32 37 45 41 28 10 28DLHD % 15.4% 11.3% 14.4% 12.9% 13.9% 18.8% 17.4% 13.5% 5.7% 14.7% No significant changecount 9 6 4 7 8 7 6 10 7 2DLHD % 3.1% 2.3% 1.5% 2.8% 3.0% 2.9% 2.5% 4.8% 4.0% 1.1% No significant changecount 15 9 7 8 5 9 11 4 4 5DLHD % 5.2% 3.4% 2.7% 3.2% 1.9% 3.8% 4.7% 1.9% 2.3% 2.6% No significant changecount 9 3 5 3 3 3 8 2 1 2DLHD % 3.1% 1.1% 1.9% 1.2% 1.1% 1.3% 3.4% 1.0% 0.6% 1.1% No significant changecount 6 6 2 5 2 6 3 2 3 3DLHD % 2.1% 2.3% 0.8% 2.0% 0.7% 2.5% 1.3% 1.0% 1.7% 1.6% No significant changecount 0 0 0 0 0 0 0 0 0 0DLHD % 0.0% 0.0% 0.0% 0.0% 0.0% 0.0% 0.0% 0.0% 0.0% 0.0% No significant changecount 5 3 7 3 8 5 6 1 2 5DLHD % 1.7% 1.1% 2.7% 1.2% 3.0% 2.1% 2.5% 0.5% 1.1% 2.6% No significant changecount 3 2 7 3 8 5 6 1 2 4DLHD % 1.0% 0.8% 2.7% 1.2% 3.0% 2.1% 2.5% 0.5% 1.1% 2.1% No significant changecount 2 1 0 0 0 0 0 0 0 1DLHD % 0.7% 0.4% 0.0% 0.0% 0.0% 0.0% 0.0% 0.0% 0.0% 0.5% No significant changecount 7 10 5 15 13 12 6 6 13 3DLHD % 2.4% 3.8% 1.9% 6.0% 4.9% 5.0% 2.5% 2.9% 7.3% 1.6% No significant changecount 7 10 5 15 13 12 6 6 13 3DLHD % 2.4% 3.8% 1.9% 6.0% 4.9% 5.0% 2.5% 2.9% 7.3% 1.6% No significant changecount 0 0 0 0 0 0 0 0 0 0DLHD % 0.0% 0.0% 0.0% 0.0% 0.0% 0.0% 0.0% 0.0% 0.0% 0.0% No significant changecount 1 0 1 0 1 0 0 0 0 0DLHD % 0.3% 0.0% 0.4% 0.0% 0.4% 0.0% 0.0% 0.0% 0.0% 0.0% No significant changecount 1 0 1 0 0 0 0 0 0 0DLHD % 0.3% 0.0% 0.4% 0.0% 0.0% 0.0% 0.0% 0.0% 0.0% 0.0% No significant changecount 0 0 0 0 1 0 0 0 0 0DLHD % 0.0% 0.0% 0.0% 0.0% 0.4% 0.0% 0.0% 0.0% 0.0% 0.0% No significant changecount 0 0 0 0 0 0 0 0 0 0DLHD % 0.0% 0.0% 0.0% 0.0% 0.0% 0.0% 0.0% 0.0% 0.0% 0.0% No significant changecount 76 60 41 49 39 36 42 39 50 64DLHD % 26.6% 22.6% 15.6% 19.8% 14.6% 15.1% 17.8% 18.8% 28.2% 33.5% No significant change
Trans-gender
Cis women
Trans-gender
Other risk
Cis men
Cis women
1Risk/Gender Notes: PWID (persons who inject drugs). Persons included under "Sex w women" have no reported risk other than sex with a woman living with HIV, or a woman at high risk for HIV. Nearly all with "Other risk" are perinatal or pediatric cases.
Cis men
Trans-gender
New Detroit LHD HIV diagnoses 2012 - 2021: Demographic Stratification
% change (95CI)
Trans-gender
Unknown risk
Sex w women
Sex w men/PWID
Cis men
Sex w men
Cis men
Cis women
Trans-gender
PWID
Cis men
page 25

Measure 2012 2013 2014 2015 2016 2017 2018 2019 2020 2021Special populationsMen who have sex with men (MSM) including MSM/PWID (persons who inject drugs)
count 132 149 168 138 165 132 131 121 93 88est pop 22,291 21,956 21,657 21,490 21,256 21,160 21,068 21,066 20,967 20,967rate 592.2 678.6 775.7 642.1 776.3 623.8 621.8 574.4 443.5 419.7 -3.7% (-6.8%, 0.5%)count 91 97 103 90 97 80 81 73 58 44est pop 3,926 3,843 3,755 3,685 3,694 3,603 3,572 3,507 3,349 3,349rate 2,318.2 2,524.2 2,742.8 2,442.5 2,626.0 2,220.4 2,267.4 2,081.5 1,732.1 1,314.0 -4.6% (-7.4%, 1.8%)
Persons who inject drugs (PWID) including MSM/PWIDcount 20 12 14 11 13 14 17 5 6 10DLHD % 7.0% 4.5% 5.3% 4.4% 4.9% 5.9% 7.2% 2.4% 3.4% 5.2% No significant changecount 5 3 7 3 4 5 6 1 2 3DLHD % 1.7% 1.1% 2.7% 1.2% 1.5% 2.1% 2.5% 0.5% 1.1% 1.6% No significant change
Young (15-29) Black/AA men compared to otherscount 111 113 118 105 111 100 103 85 69 54pop 67,681 66,255 64,746 63,531 63,686 62,119 61,592 60,468 57,734 57,734rate 164.0 170.6 182.3 165.3 174.3 161.0 167.2 140.6 119.5 93.5 -4.2% (-6.8%, 01.6%)count 43 30 32 31 29 27 38 35 22 23pop 114,002 112,960 112,326 112,497 113,429 114,130 114,123 114,313 115,303 115,303rate 37.7 26.6 28.5 27.6 25.6 23.7 33.3 30.6 19.1 19.9 No significant changecount 131 122 113 112 127 114 96 88 86 113pop 455,037 447,412 442,044 439,495 432,412 429,937 429,008 428,201 427,190 427,190rate 28.8 27.3 25.6 25.5 29.4 26.5 22.4 20.6 20.1 26.5 No significant change
30+ yrs old
15-29 yr old PWID
New Detroit LHD HIV diagnoses 2012 - 2021: Demographic Stratification
% change (95CI)
PWID
MSM
15-29 yr old Black/AA MSM (YBMSM)
15-29 yr old Black/AA men (YBM)
Other youth 15-29
page 26
Measure 2012 2013 2014 2015 2016 2017 2018 2019 2020 2021
count 149 137 164 143 185 160 163 148 85 93DLHD % 52.1% 51.7% 62.4% 57.7% 69.3% 66.9% 69.1% 71.5% 48.0% 48.7% No significant change
count 111 103 130 117 133 116 109 104 55 60DLHD % 38.8% 38.9% 49.4% 47.2% 49.8% 48.5% 46.2% 50.2% 31.1% 31.4% No significant change
count . . . 36 55 62 55 50 32 34DLHD % . . . 14.5% 20.6% 25.9% 23.3% 24.2% 18.1% 17.8% No significant changecount 56 62 54 52 55 33 39 35 16 34DLHD % 19.6% 23.4% 20.5% 21.0% 20.6% 13.8% 16.5% 16.9% 9.0% 17.8% No significant change
count 18 17 8 8 12 12 21 17 12 3DLHD % 6.3% 6.4% 3.0% 3.2% 4.5% 5.0% 8.9% 8.2% 6.8% 1.6% No significant changecount 55 40 40 40 31 46 24 25 9 12DLHD % 19.2% 15.1% 15.2% 16.1% 11.6% 19.2% 10.2% 12.1% 5.1% 6.3% -7.6% (-12.0%, -3.0%)count 39 29 31 26 40 40 37 40 37 37DLHD % 13.6% 10.9% 11.8% 10.5% 15.0% 16.7% 15.7% 19.3% 20.9% 19.4% +6.5% (2.4%, 10.9%)count 32 47 31 20 28 24 26 38 21 20DLHD % 11.2% 17.7% 11.8% 8.1% 10.5% 10.0% 11.0% 18.4% 11.9% 10.5% No significant change
count 95 91 109 91 115 100 103 83 79 97DLHD % 33.2% 34.3% 41.4% 36.7% 43.1% 41.8% 43.6% 40.1% 44.6% 50.8% +3.9% (-1.4%, 6.4%)count 178 177 179 175 195 189 183 155 127 155DLHD % 62.2% 66.8% 68.1% 70.6% 73.0% 79.1% 77.5% 74.9% 71.8% 81.2% +2.8% (1.0%, 4.7%)count 81 89 97 109 149 144 147 146 109 132DLHD % 28.3% 33.6% 36.9% 44.0% 55.8% 60.3% 62.3% 70.5% 61.6% 69.1% +11.1% (8.4%, 14.0%)count 126 141 149 159 192 176 174 165 126 148DLHD % 44.1% 53.2% 56.7% 64.1% 71.9% 73.6% 73.7% 79.7% 71.2% 77.5% +6.3% (4.3%, 8.4%)
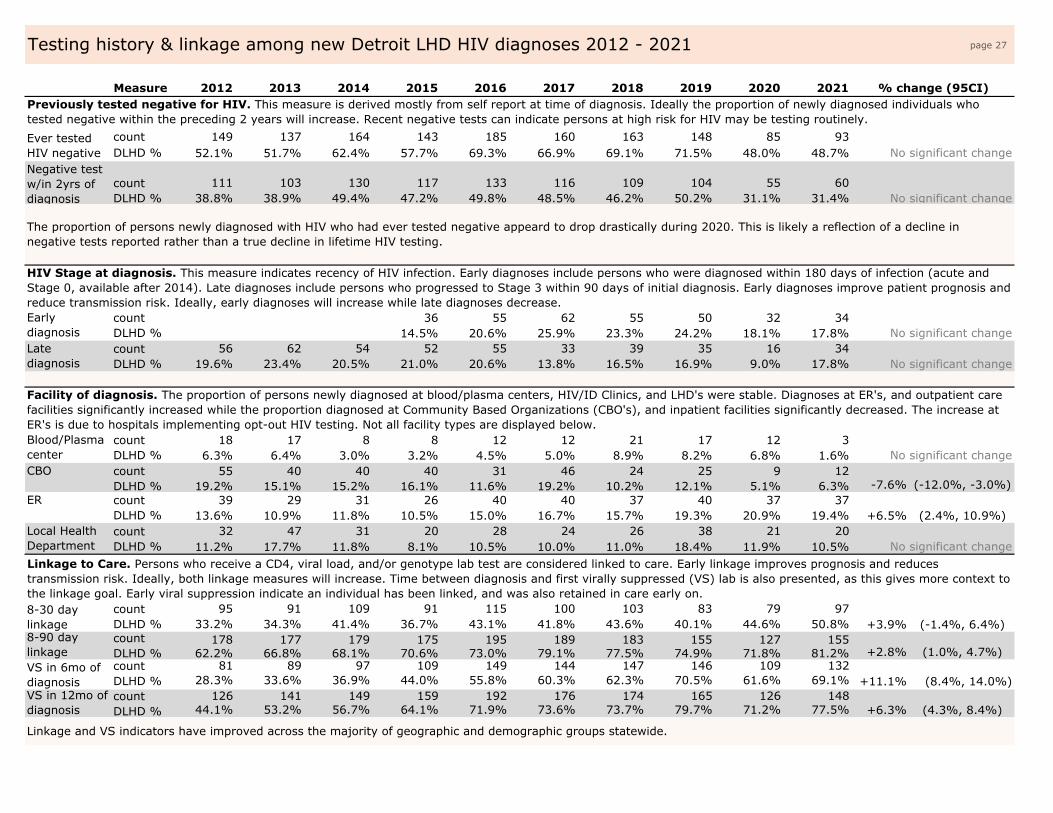
ER
Facility of diagnosis. The proportion of persons newly diagnosed at blood/plasma centers, HIV/ID Clinics, and LHD's were stable. Diagnoses at ER's, and outpatient care facilities significantly increased while the proportion diagnosed at Community Based Organizations (CBO's), and inpatient facilities significantly decreased. The increase at ER's is due to hospitals implementing opt-out HIV testing. Not all facility types are displayed below.
Linkage and VS indicators have improved across the majority of geographic and demographic groups statewide.
VS in 12mo of diagnosis
The proportion of persons newly diagnosed with HIV who had ever tested negative appeard to drop drastically during 2020. This is likely a reflection of a decline in negative tests reported rather than a true decline in lifetime HIV testing.
8-30 day linkage8-90 day linkage
Linkage to Care. Persons who receive a CD4, viral load, and/or genotype lab test are considered linked to care. Early linkage improves prognosis and reduces transmission risk. Ideally, both linkage measures will increase. Time between diagnosis and first virally suppressed (VS) lab is also presented, as this gives more context to the linkage goal. Early viral suppression indicate an individual has been linked, and was also retained in care early on.
VS in 6mo of diagnosis
Early diagnosisLate diagnosis
HIV Stage at diagnosis. This measure indicates recency of HIV infection. Early diagnoses include persons who were diagnosed within 180 days of infection (acute and Stage 0, available after 2014). Late diagnoses include persons who progressed to Stage 3 within 90 days of initial diagnosis. Early diagnoses improve patient prognosis and reduce transmission risk. Ideally, early diagnoses will increase while late diagnoses decrease.
Blood/Plasma centerCBO
Local Health Department
Testing history & linkage among new Detroit LHD HIV diagnoses 2012 - 2021
% change (95CI)Previously tested negative for HIV. This measure is derived mostly from self report at time of diagnosis. Ideally the proportion of newly diagnosed individuals who tested negative within the preceding 2 years will increase. Recent negative tests can indicate persons at high risk for HIV may be testing routinely. Ever tested HIV negativeNegative test w/in 2yrs of diagnosis
page 27