HIV-1 fitness landscape models for indinavir treatment pressure using observed evolution in...
12
HIV-1 fitness landscape models for indinavir treatment pressure using observed evolution in longitudinal sequence data are predictive for treatment failure Raphael Z. Sangeda a , Kristof Theys a , Gertjan Beheydt a , Soo-Yon Rhee a,b , Koen Deforche c , Jurgen Vercauteren a , Pieter Libin a,c , Stijn Imbrechts a , Zehava Grossman d , Ricardo J. Camacho e,f , Kristel Van Laethem a,p , Alejandro Pironti g , Maurizio Zazzi h , Anders Sönnerborg i , Francesca Incardona j , Andrea De Luca k , Carlo Torti l , Lidia Ruiz m , David A.M.C. Van de Vijver n , Robert W. Shafer b , Bianca Bruzzone o , Eric Van Wijngaerden p , Anne-Mieke Vandamme a,f,⇑ , for the Virolab and EuResist projects a Rega Institute for Medical Research, Department of Microbiology and Immunology, KU Leuven, 3000 Leuven, Belgium b Division of Infectious Diseases, Stanford University, Stanford, CA 94305, USA c Mybiodata, Biomedical IT Solutions, 3110 Rotselaar, Belgium d Central Virology Lab, MOH, Sheba Medical Center, Ramat-Gan 52621, Israel e Molecular Biology Laboratory, Centro Hospitalar de Lisboa Ocidenta, 1169-050 Lisbon, Portugal f Centro de Malária e outras Doenças Tropicais, Instituto de Higiene e Medicina Tropical, Universidade Nova de Lisboa, 1349-008 Lisbon, Portugal g Max Planck Institute for Informatics, 80804 Munich, Germany h Department of Molecular Biology, University of Siena, 53100 Siena, Italy i Division of Infectious Diseases, Department of Medicine, Karolinska Institute, Sweden j EuResist Network GEIE – Informapro s.r.l., Rome, Italy k University Division of Infectious Diseases, Siena University Hospital, Siena, Italy l Institute of Infectious and Tropical Diseases, University of Brescia, 25123 Brescia, Italy m Retrovirology Laboratory IrsiCaixa Foundation, 08916 Badalona, Spain n Department of Virology, Erasmus Medical Centre, Erasmus University, Rotterdam, The Netherlands o Hygiene Unit, S. Martino University Hospital, Genova, Italy p University Hospitals, KU Leuven, 3000 Leuven, Belgium article info Article history: Available online 21 March 2013 Keywords: HIV-1 drug resistance Antiretrovirals Treatment response Evolution Bioinformatics abstract We previously modeled the in vivo evolution of human immunodeficiency virus-1 (HIV-1) under drug selective pressure from cross-sectional viral sequences. These fitness landscapes (FLs) were made by using first a Bayesian network (BN) to map epistatic substitutions, followed by scaling the fitness land- scape based on an HIV evolution simulator trying to evolve the sequences from treatment naïve patients into sequences from patients failing treatment. In this study, we compared four FLs trained with different sequence populations. Epistatic interactions were learned from three different cross-sectional BNs, trained with sequence from patients experienced with indinavir (BNT), all protease inhibitors (PIs) (BNP) or all PI except indinavir (BND). Scaling the fitness landscape was done using cross-sectional data from drug naïve and indinavir experienced patients (Fcross using BNT) and using longitudinal sequences from patients failing indinavir (FlongT using BNT, FlongP using BNP, FlongD using BND). Evaluation to predict the failing sequence and therapy outcome was performed on independent sequences of patients on indinavir. Parameters included estimated fitness (LogF), the number of generations (GF) or mutations (MF) to reach the fitness threshold (average fitness when a major resistance mutation appeared), the number of generations (GR) or mutations (MR) to reach a major resistance mutation and compared to genotypic susceptibility score (GSS) from Rega and HIVdb algorithms. In pairwise FL comparisons we found significant correlation between fitness values for individual sequences, and this correlation improved after correcting for the subtype. Furthermore, FLs could predict the failing sequence under indinavir-containing combinations. At 12 and 48 weeks, all parameters from 1567-1348/$ - see front matter Ó 2013 Elsevier B.V. All rights reserved. http://dx.doi.org/10.1016/j.meegid.2013.03.014 ⇑ Corresponding author at: Rega Institute for Medical Research, Department of Microbiology and Immunology, KU Leuven, Minderbroedersstraat 10, B-3000 Leuven, Belgium. Tel.: +32 16 332160; fax: +32 16 332131. E-mail address: [email protected] (A.-M. Vandamme). Infection, Genetics and Evolution 19 (2013) 349–360 Contents lists available at SciVerse ScienceDirect Infection, Genetics and Evolution journal homepage: www.elsevier.com/locate/meegid
-
Upload
independent -
Category
Documents
-
view
1 -
download
0
Transcript of HIV-1 fitness landscape models for indinavir treatment pressure using observed evolution in...

Infection, Genetics and Evolution 19 (2013) 349–360
Contents lists available at SciVerse ScienceDirect
Infection, Genetics and Evolution
journal homepage: www.elsevier .com/locate /meegid
HIV-1 fitness landscape models for indinavir treatment pressure usingobserved evolution in longitudinal sequence data are predictivefor treatment failure
1567-1348/$ - see front matter � 2013 Elsevier B.V. All rights reserved.http://dx.doi.org/10.1016/j.meegid.2013.03.014
⇑ Corresponding author at: Rega Institute for Medical Research, Department of Microbiology and Immunology, KU Leuven, Minderbroedersstraat 10, B-3000Belgium. Tel.: +32 16 332160; fax: +32 16 332131.
E-mail address: [email protected] (A.-M. Vandamme).
Raphael Z. Sangeda a, Kristof Theys a, Gertjan Beheydt a, Soo-Yon Rhee a,b, Koen Deforche c,Jurgen Vercauteren a, Pieter Libin a,c, Stijn Imbrechts a, Zehava Grossman d, Ricardo J. Camacho e,f,Kristel Van Laethem a,p, Alejandro Pironti g, Maurizio Zazzi h, Anders Sönnerborg i, Francesca Incardona j,Andrea De Luca k, Carlo Torti l, Lidia Ruiz m, David A.M.C. Van de Vijver n, Robert W. Shafer b,Bianca Bruzzone o, Eric Van Wijngaerden p, Anne-Mieke Vandamme a,f,⇑, for the Virolab and EuResistprojectsa Rega Institute for Medical Research, Department of Microbiology and Immunology, KU Leuven, 3000 Leuven, Belgiumb Division of Infectious Diseases, Stanford University, Stanford, CA 94305, USAc Mybiodata, Biomedical IT Solutions, 3110 Rotselaar, Belgiumd Central Virology Lab, MOH, Sheba Medical Center, Ramat-Gan 52621, Israele Molecular Biology Laboratory, Centro Hospitalar de Lisboa Ocidenta, 1169-050 Lisbon, Portugalf Centro de Malária e outras Doenças Tropicais, Instituto de Higiene e Medicina Tropical, Universidade Nova de Lisboa, 1349-008 Lisbon, Portugalg Max Planck Institute for Informatics, 80804 Munich, Germanyh Department of Molecular Biology, University of Siena, 53100 Siena, Italyi Division of Infectious Diseases, Department of Medicine, Karolinska Institute, Swedenj EuResist Network GEIE – Informapro s.r.l., Rome, Italyk University Division of Infectious Diseases, Siena University Hospital, Siena, Italyl Institute of Infectious and Tropical Diseases, University of Brescia, 25123 Brescia, Italym Retrovirology Laboratory IrsiCaixa Foundation, 08916 Badalona, Spainn Department of Virology, Erasmus Medical Centre, Erasmus University, Rotterdam, The Netherlandso Hygiene Unit, S. Martino University Hospital, Genova, Italyp University Hospitals, KU Leuven, 3000 Leuven, Belgium
a r t i c l e i n f o
Article history:Available online 21 March 2013
Keywords:HIV-1 drug resistanceAntiretroviralsTreatment responseEvolutionBioinformatics
a b s t r a c t
We previously modeled the in vivo evolution of human immunodeficiency virus-1 (HIV-1) under drugselective pressure from cross-sectional viral sequences. These fitness landscapes (FLs) were made byusing first a Bayesian network (BN) to map epistatic substitutions, followed by scaling the fitness land-scape based on an HIV evolution simulator trying to evolve the sequences from treatment naïve patientsinto sequences from patients failing treatment.
In this study, we compared four FLs trained with different sequence populations. Epistatic interactionswere learned from three different cross-sectional BNs, trained with sequence from patients experiencedwith indinavir (BNT), all protease inhibitors (PIs) (BNP) or all PI except indinavir (BND). Scaling the fitnesslandscape was done using cross-sectional data from drug naïve and indinavir experienced patients(Fcross using BNT) and using longitudinal sequences from patients failing indinavir (FlongT using BNT,FlongP using BNP, FlongD using BND). Evaluation to predict the failing sequence and therapy outcomewas performed on independent sequences of patients on indinavir. Parameters included estimated fitness(LogF), the number of generations (GF) or mutations (MF) to reach the fitness threshold (average fitnesswhen a major resistance mutation appeared), the number of generations (GR) or mutations (MR) to reacha major resistance mutation and compared to genotypic susceptibility score (GSS) from Rega and HIVdbalgorithms.
In pairwise FL comparisons we found significant correlation between fitness values for individualsequences, and this correlation improved after correcting for the subtype. Furthermore, FLs could predictthe failing sequence under indinavir-containing combinations. At 12 and 48 weeks, all parameters from
Leuven,
350 R.Z. Sangeda et al. / Infection, Genetics and Evolution 19 (2013) 349–360
all FLs and indinavir GSS (both for Rega and HIVdb) were predictive of therapy outcome, except MR forFlongT and FlongP. The fitness landscapes have similar predictive power for treatment response underindinavir-containing regimen as standard rules-based algorithms, and additionally allow predictinggenetic evolution under indinavir selective pressure.
� 2013 Elsevier B.V. All rights reserved.
1. Introduction
Prediction of human immunodeficiency virus-1 (HIV) drugresistance is useful to clinicians caring for HIV-1 patients, giventhe multitude of possible highly active antiretroviral therapy com-binations using the more than 25 available antiretroviral drugs andtaking into account the drug resistance profiles (Altmann et al.,2007; Shafer and Schapiro, 2008). Prospective controlled studieshave shown that patients whose physicians have access to drugresistance data, particularly genotypic-resistance data, respondbetter to therapy than patients of physicians without such access(Van Laethem and Vandamme, 2006; Liu and Shafer, 2006). Thiskind of data has led several experts in North America and Europeto recommend drug resistance testing in the management ofHIV-1 infected patients (Liu and Shafer, 2006; Hirsch et al., 2008;Vandamme et al., 2011).
Genotyping is preferentially used to detect resistance relatedmutations and the resistance pattern is then interpreted using sev-eral publicly available algorithms (Van Laethem et al., 2002; VanLaethem and Vandamme, 2006; Liu and Shafer, 2006; Vercauterenand Vandamme, 2006). The currently available interpretation sys-tems are however subject to variability and discordances whichmay affect the choice of the proposed therapy and ultimately thetreatment success. Another drawback of genotypic drug resistancetesting is the difficulty to accurately predict the effect of complexinteractions among the many mutations that contribute to drugresistance and inability to detect minor, but clinically relevant,drug-resistant variants in a patient’s virus quasispecies (Liu andShafer, 2006; Vercauteren and Vandamme, 2006; Shafer andSchapiro, 2008). Thus, it is important to update the current inter-pretation algorithms to correctly predict virological response totreatment.
We previously described a method that models mutationalresistance pathways and estimates a fitness landscape (FL) basedon in vivo virus genetic data and treatment information. The mod-eled FLs were made by using first a Bayesian network (BN) to mapepistatic substitutions, followed by scaling the fitness landscapebased on an HIV evolution simulator trying to evolve the sequencesfrom treatment naïve patients into sequences from patients failingtreatment. We showed that this fitness function significantly pre-dicts resistance development and virological response (Deforcheet al., 2008b; Theys et al., 2010). However, the current method re-quires a large amount of genotypic data to model a FL. Especially inthe case of newly approved drugs that are initially administered insalvage regimens, viral sequences from patients treated with oneof these drugs as the only drug in its drug class are rare or notyet available. Longitudinal sequence data obtained from patientstreated with new drugs in salvage therapy offer a valuable solu-tion. Since these sequences reduced the problem of inter-patientvariability, they are more informative and therefore can overcomethe need for more sequences.
This study aimed to develop longitudinal FLs and to comparethe different designs to the conventional cross-sectional FL forthe protease inhibitor (PI) indinavir with respect to their clinicalapplicability. Three strategies for the FL model design were evalu-ated with respect to how robust they can be used in the predictionof treatment outcome. The three strategies differ in how epistaticmutational interaction is learned in a first step from extensive
cross sectional data available in an entire drug class, while usingin a second step a limited set of longitudinal data for a potentialnew drug in the class to scale the fitness landscape. Indinavirwas chosen because sufficient cross-sectional and longitudinaldata of patients failing indinavir with resistance mutations in firstand salvage therapy are available to both construct and evaluatethe different models.
2. Materials and methods
2.1. Data and sequence populations
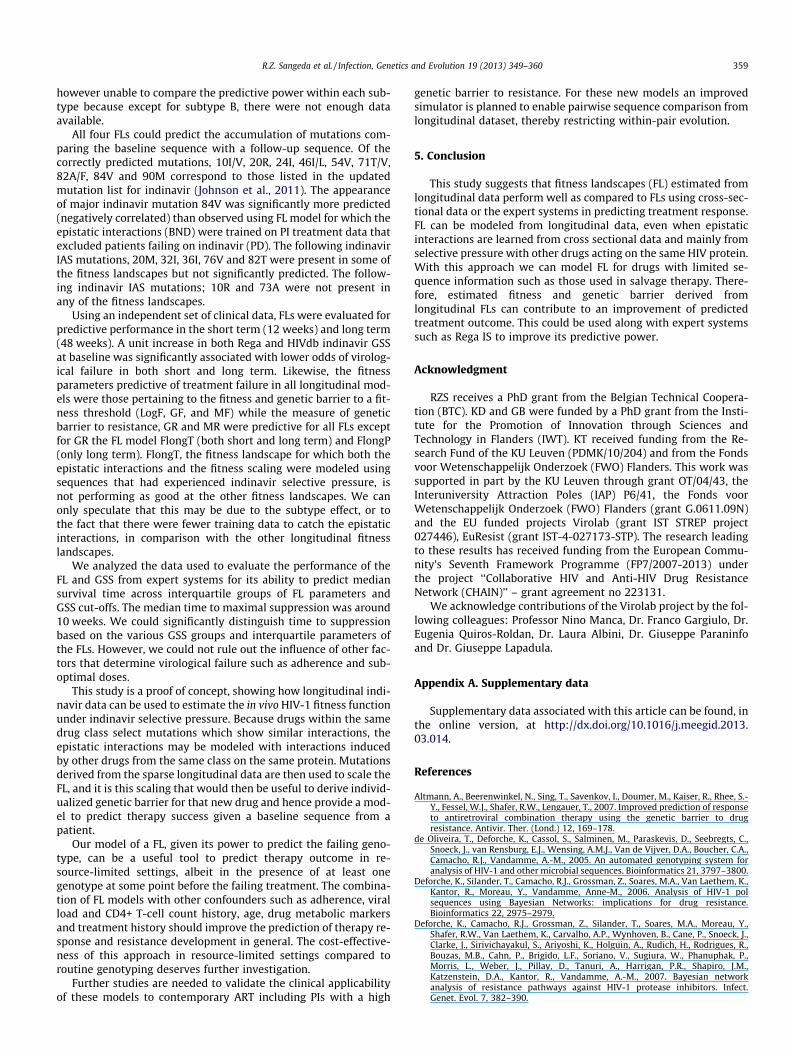
Two data sets of HIV-1 clinical data were used in this analysis.The first data set was primarily used to build the fitness modelsand was pooled from the Stanford HIV drug resistance Database(Kantor et al., 2001), Hospital Egas Moniz Lisbon, Portugal andthe University Hospitals, Leuven, Belgium. The second data set pro-vided independent data to evaluate the performance of the modelsin predicting resistance evolution and therapy response and wasobtained from the European research consortiums EuResist andVirolab and from Israel’s HIV Reference Laboratory (Fig. 1). Se-quence data were locally stored in a RegaDB instance to facilitatedata management and analysis (Libin et al., 2007). Differentsources were chosen to investigate the robustness of the modelswith respect to the varying treatment strategies and the varyingprevalence of HIV-1 subtypes. For each sequence, the subtypewas determined using the Rega HIV-1 Subtyping Tool v2 (de Oli-veira et al., 2005).
In total, 8 protease sequence populations were extracted fromthese two sources. From the first source, the following 5 trainingand 1 evaluation populations were derived. Training populationswere as follows; the population PN represented 9116 sequencesfrom PI-naive patients, the population PT represented 1181 se-quences from patients treated with indinavir as their first PI, thepopulation. PP represented 2883 sequences from patients treatedwith any PI and only included for each patient the last available se-quence after PI experience, the population PD represented 1726 se-quences from patients treated with any PI except indinavir andincluded only the last available sequenced per patient. The popula-tion PL represented pairs of 438 longitudinal sequences from 219patients consisting of a baseline sequence before and a follow-upsequences after indinavir treatment. There was no overlap of se-quences from this latter population with the other sequence pop-ulations. The evaluation population PE represented 3690 PIexperienced sequences independent from those described above,which were used for comparison of absolute fitness values derivedfrom various fitness landscapes.
From the second source, two non-overlapping evaluation popu-lations were derived from indinavir treated patients, irrespectiveof previous PI experience. The population PV consisted of 626 longi-tudinal sequences paired from 313 patients and was used for evalu-ating predicted evolution against observed evolution. Thepopulation PC represented 320 baseline sequences from indinavirtreated patients for whom a treatment change episode (TCE) accom-panied by baseline genotype, baseline and follow-up viral load wasavailable. TCEs were from patients receiving an indinavir-contain-ing treatment regimen whether or not the patient was failing or

Fig. 1. Schema used in modeling fitness landscapes and its evaluation. Training data used to make epistatic interaction models using Bayesian Network Learning (BN) and toscale the Fitness Landscape (FL). Three types of BN (BNT, BNP and BND) were constructed trained with sequence populations PT, PP and PD respectively, which differ inprotease inhibitor (PI) exposure. PT sequences were from patients with indinavir experience as the first PI, PP from patients experienced with any PI and PD from patientswith any PI except indinavir. The population PN consisted of sequences naive to PI. To scale the fitness landscape Fcross, the evolution simulator was used to train Fcross suchthat evolution of PN over Fcross ended up in a population of sequences resembling PT. Population PL consisted of pairs of each a baseline and a follow-up sequence from thesame patient before and after experience with indinavir, and these were used to train the scaling of all longitudinal FLs, such that baseline sequences evolved over the FLresulted in simulated follow-up sequences closely resembling the observed follow-up sequences after evolution over the FLs. Thus, four fitness functions Fcross, FlongT (usingBNT), FlongP (using BNP) and FlongD (using BND) were scaled by simulating evolution of naïve or baseline sequence to treated sequence. Population PE, contained a set ofsequences independent from the training set to evaluate the FL. Population PV, contained a set of longitudinal pairs of sequences independent of the training set to evaluatethe prediction of evolution using the FL. Sequences of patients (PC) with treatment change episode (TCE) at week 12 and week 48 were used to derive selective pressure andgenetic barrier parameters from each FL and its predictive power on virological failure determined and compared with that of Rega and HIVdb interpretation systems (IS).Selective pressure parameter: logarithm of absolute fitness (LogF) and genetic barrier parameters: number of viral generations to fitness threshold (GF), number of viralmutations to fitness threshold (MF), number of viral generations (GR) to a major drug resistance mutation (DRM) and number of viral mutations to major DRM (MR). Theseparameters are computed for each baseline sequence using the evaluation data over the respective FLs. For IS, genotypic susceptibility score (GSS) is calculated for eachbaseline sequence assigning a score for each drug. Summing up the individual drug scores gives total GSS for the background regimen.
R.Z. Sangeda et al. / Infection, Genetics and Evolution 19 (2013) 349–360 351
had received indinavir before. Each TCE contained baseline param-eters taken as close as possible to week 0. Both baseline genotypeand viral load were taken not earlier than 12 weeks before or laterthan the start of TCE and a follow-up viral load at 12 (the closest va-lue falling between 4 and 16, median 8.9 with interquartile range5.7–12.6) weeks and/or 48 (16–52, median 40 with interquartilerange 28.3–46.4) weeks (Supplementary Fig. 1). For endpoint one,endpoint two and both endpoints together, data from 281, 247and 208 patients were available respectively (Supplementary Fig. 2).
2.2. Learning qualitative epistatic interactions between proteaseamino acids
Bayesian Network (BN) learning was performed in order to mapthe epistatic dependencies between mutations and/or polymor-phisms due to selective pressure from a particular drug as de-scribed previously (Deforche et al., 2006; Deforche et al., 2007)and Fig. 1. BN learning used probability computations to learnthe associations between mutations and the resulting BN can berepresented graphically by nodes denoting amino acids and arcs(arrows) denoting direct dependencies between the joined nodes.BN learning was done using the B-course software (Myllymäkiet al., 2002) and adapted by (Deforche et al., 2006), scoring modelsby maximizing the posterior probability of the model. Boolean
variables were used to represent the presence or absence of aminoacid mutations. Networks were learned including all polymorphicamino acids with prevalence greater than 1% in the sequence pop-ulation of untreated patients. Mutations related to indinavir or PItreatment were selected after testing for significant independencefrom treatment using Mantel–Haenszel v2 test while correcting formultiple tests using Benjamini & Hochberg with a False DiscoveryRate (FDR) of 0.05.
In total, three BNs were learned using the three training se-quence populations from treatment experienced patients. The net-work BNT was learned using the population PT to map interactionsbetween indinavir mutations, the network BNP was learned usingthe population PP to map interactions between PI mutations andthe network BND was learned using the population PD to mapinteractions between PI mutations not selected by indinavir. AllBNs are available upon request.
2.3. Construction and scaling of the fitness landscape models
HIV-1 fitness functions were estimated as described previously(Deforche et al., 2008a). The general method used to derive the fit-ness landscapes (FLs) is depicted in Fig. 1. The first step wasmodeling the qualitative epistatic interactions by the respectiveBNs as described above, which served as a template for the fitness

352 R.Z. Sangeda et al. / Infection, Genetics and Evolution 19 (2013) 349–360
function structure. In a second step, the fitness landscape is scaledby simulating the evolution of viral sequences from naïve patientsinto sequences from treated patients. In an iterative procedure, se-quences from naive patients (PN) are evolved over the FL, and sim-ulated treated sequences are compared with the real observedsequences. Parameters of the fitness landscapes are incrementallyimproved to converge to the optimal fitness function. After conver-gence, the obtained fitness function provides a model for HIV-1evolution under indinavir selective pressure. We therefore callthese fitness functions, ‘fitness landscapes’, where the ‘flat dimen-sions’ of the landscape represent the genetic variability and theepistatic interactions between amino acids as described by theBN, and the scaling, the ‘height of the peaks’ or ‘fitness’ representsthe predicted fitness of a particular sequence under the modeledselective pressure. A FL is normalized relative to a fitness valueof 1 for reference sequence HIV-1 HXB2.
Here, we estimated one cross-sectional and three longitudinalindinavir fitness functions, using epistatic interactions that werelearned by BNT, BNP and BND networks.
The cross-sectional FL model Fcross was estimated using cross-sectional sequences with indinavir experience by first deriving thenetwork structure of BNT and second modeling the evolution of PNinto PT. Given that the naive population (PN) included more se-quences compared to the treated population (PT), a naive datasetwas created by sampling sequences from PN as described before(Deforche et al., 2008a). This sampling was guided by a NeighbourJoining phylogenetic tree built with PAUP on the training data, andassigned more weight to sequences from the naïve population thatwere epidemiologically linked to the treated population. This pro-cedure allowed for selection of sequences from naïve patients thatmore closely resemble the epidemiology background of the se-quences from treated patients, thus learning amino acid changesthat are mainly a consequence of evolution under drug selectivepressure, thereby correcting for different epidemiologicaldependencies.
The longitudinal FLs (FlongT, FlongP and FlongD) were esti-mated using the same population (PL) of longitudinal sequencepairs of patients on indinavir treatment to scale the fitness land-scape in the second step. No sampling procedure to correct for epi-demiological bias was needed because sequence pairs werederived from the same patient. The respective longitudinal modelsdiffered in the sequence population from which the epistatic inter-actions were learned in the first step. The model FlongT used thenetwork structure of BNT, the model FlongP used the networkstructure of the BNP and the model FlongD used the network struc-ture of BND.
2.4. Calculating parameters for genotypic prediction
2.4.1. From longitudinal and cross-sectional fitness landscapesFor each sequence and per fitness landscape, one parameter
denoting viral fitness and four parameters related to the geneticbarrier to resistance were computed (Fig. 1). Predicted viral fitnesstaken as the common logarithm scale (LogF), was considered as thequantification of drug susceptibility. The genetic barrier representsthe evolutionary distance required for the virus to become a drugresistant virus. The genetic barrier to indinavir resistance was cal-culated by simulating the evolution over a FL until it was consid-ered resistant, and defined as the average time of 100simulations. The criterion for indinavir resistance was the selectionof a Major Resistance Mutations (MRM) 46I, 46L, 82A, 82F, 82T or84V (Johnson et al., 2011). Measures of the genetic barrier were thenumber of generations (GR) and number of mutations (MR) to theappearance of any indinavir-MRM. Another measure of geneticbarrier to resistance was the number of generations and the num-ber of mutations during simulated evolution to reach a fitness
threshold (GF and MF respectively). The fitness threshold was de-fined as the average fitness after the appearance of a major resis-tance mutation during the 100 simulations and over all sequences.
2.4.2. GSS from Rega V8.0.1 and HIVdb V2.4.9Genotypic Susceptibility Scores (GSS) were calculated using two
publicly available genotypic resistance interpretation system (IS)(Rega v8.0.1 and HIVdb v4.2.9). According to Rega v8.0.1 (http://regaweb.med.kuleuven.be/software/rega_algorithm), a baselinesequence was assigned a weighted score for each drug based onthe 3 level categories. Susceptible (S): GSS = 1 for all drugs except1.5 for a boosted PI; intermediate resistant (I): GSS = 0.5 (un-boosted PI, nucleoside reverse transcriptase inhibitors (NRTIs)and nucleotide reverse transcriptase inhibitors (NtRTIs) and etravi-rine) or 0.75 (boosted PI) or 0.25 (Non-nucleoside reverse trans-criptase inhibitors (NNRTIs) except etravirine or entry inhibitors(EI)); otherwise assigned resistant (R): GSS = 0. According to HIVdb(http://hivdb.stanford.edu/DR/asi/index.html), a baseline genotypewas assigned a GSS according one of the five levels that are in-cluded in the algorithm. The score was 1 for susceptible, 0.75 forpotential low-level resistance, 0.5 for low-level resistance, 0.25for intermediate resistance and 0 for high resistance. The drug zal-citabine (DDC) is not featured in the current Rega and HIVdb ver-sions since it was removed from the market due to safetyconcerns. However, since this drug was used by patients in ourevaluation dataset the scores from the last Rega algorithm (Regav6.4.1) that included DDC were used. Similarly, the score for thedrug amprenavir, also no longer supported by the current algo-rithms, was substituted by scores of its pro-drug fosamprenavir(Figs. 1–3).
2.5. Evaluating the fitness landscapes
The performance of the four fitness models was evaluated indifferent validation experiments performed on three evaluation se-quence populations that were not included in the training data.These experiments encompassed the comparison of estimated fit-ness, predicting evolution and prediction of virological outcome.
2.5.1. Pairwise comparison of estimated fitness valuesThe three longitudinal and one cross-sectional FLs were applied
to the PI experienced sequence population PE to compute viral fit-ness (LogF). Pairwise comparisons of fitness values were done by alinear regression model and corrected for the effect of subtype.Goodness of fit for the FL models was assessed by the squared cor-relation coefficient (R2) and further explored by scatter plots.Descriptive statistics was used to analyze results from each ofthe fitness function.
2.5.2. Evaluating evolution predicted by the fitness landscapeThe evaluation population PV of longitudinal sequences was
used to predict mutation evolution. The population PV consistedof pairs of 626 longitudinal sequences from 313 patients. The abil-ity to predict observed evolution during indinavir treatment,according to models Fcross, FlongT, FlongP and FlongD was ex-plored using the baseline sequence from the dataset PV. Correla-tion between predicted evolution and the observed evolution inthe follow-up sequence from PV was done using a linear modelcorrecting for multiple testing.
2.5.3. Prediction of treatment outcome in short and long termA third evaluation was done based on the parameters LogF, GR,
MT, GR and GF of the cross-sectional and longitudinal FLs com-pared to Rega IS and HIVdb IS GSS parameters (Fig. 1) for their pre-dictive performance on a risk of virological failure at short (week12) and long term (week 48) using logistic regression. A baseline
0 0.5 0.75 1 1.5 1.75 2 2.25 2.5 2.75 3 3.5 4 4.5 5
Num
ber
of T
CE
s
020
4060
80
Failure (85)Success (162)
100.00 77.78 100.00 47.37 53.33 66.67 34.78 0.00 14.29 0.00 30.43 24.00 0.00 37.50 57.140.00 22.22 0.00 52.63 46.67 33.33 65.22 100.00 85.71 100.00 69.57 76.00 100.00 62.50 42.86
GSS scoreFailure (%)
Success (%)
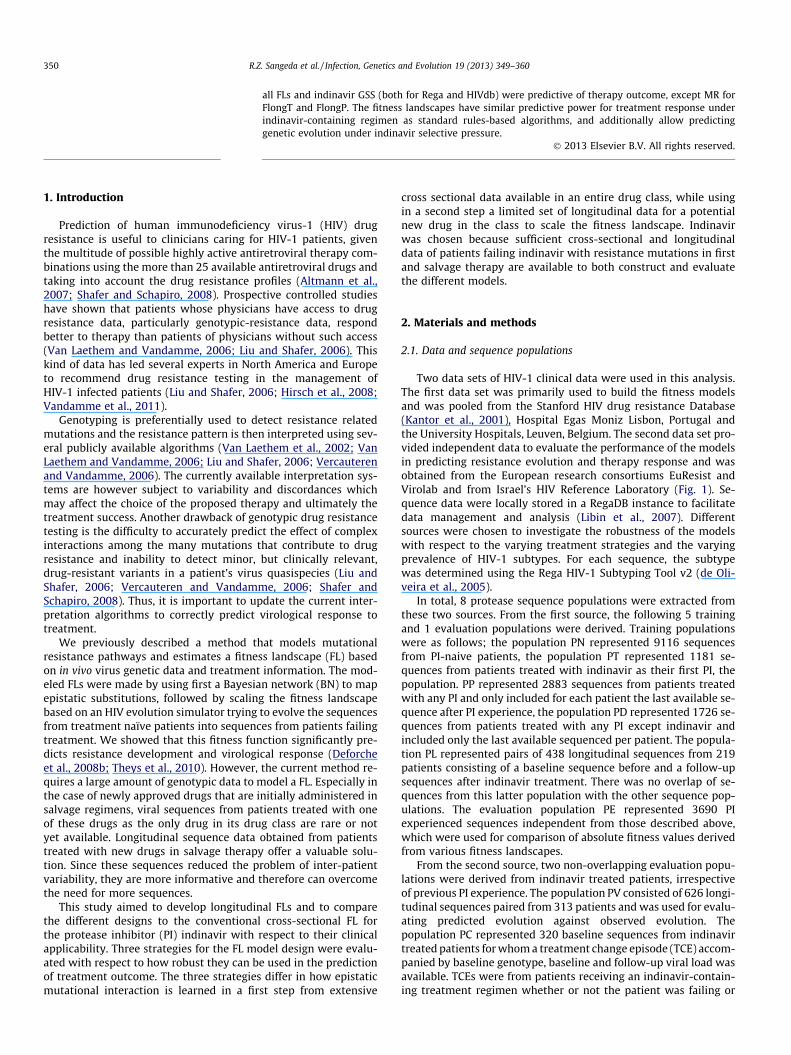
Fig. 2. Description of the total regimen genotypic susceptibility score as determined by the Rega v8.0.1 weighted algorithm for all treatment change episodes (TCEs) used forprediction of week 48 virological outcome. The distribution was similar to that of week 12 TCEs (Supplementary Fig. 9).
0 0.5 0.75 1 1.5
Num
ber
of T
CE
s
020
4060
8010
012
014
0
Failure (85)Success (162)
71.88 100.00 33.33 32.53 22.7628.12 0.00 66.67 67.47 77.24
GSS scoreFailure (%)
Success (%)
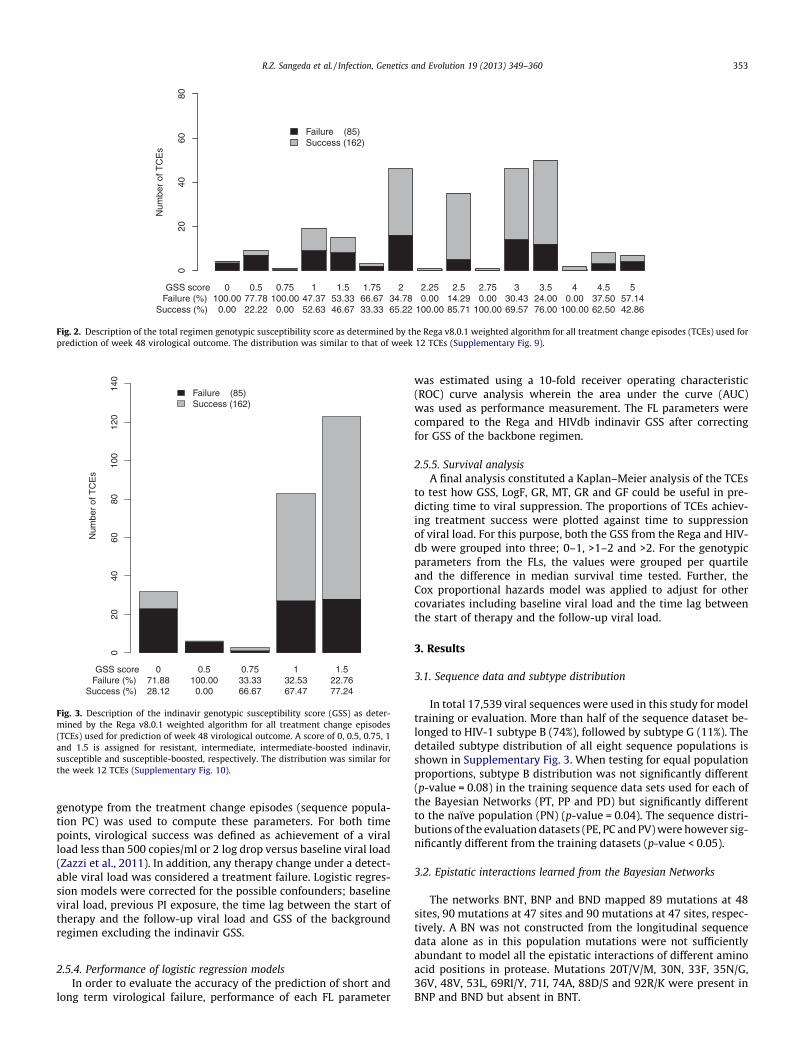
Fig. 3. Description of the indinavir genotypic susceptibility score (GSS) as deter-mined by the Rega v8.0.1 weighted algorithm for all treatment change episodes(TCEs) used for prediction of week 48 virological outcome. A score of 0, 0.5, 0.75, 1and 1.5 is assigned for resistant, intermediate, intermediate-boosted indinavir,susceptible and susceptible-boosted, respectively. The distribution was similar forthe week 12 TCEs (Supplementary Fig. 10).
R.Z. Sangeda et al. / Infection, Genetics and Evolution 19 (2013) 349–360 353
genotype from the treatment change episodes (sequence popula-tion PC) was used to compute these parameters. For both timepoints, virological success was defined as achievement of a viralload less than 500 copies/ml or 2 log drop versus baseline viral load(Zazzi et al., 2011). In addition, any therapy change under a detect-able viral load was considered a treatment failure. Logistic regres-sion models were corrected for the possible confounders; baselineviral load, previous PI exposure, the time lag between the start oftherapy and the follow-up viral load and GSS of the backgroundregimen excluding the indinavir GSS.
2.5.4. Performance of logistic regression modelsIn order to evaluate the accuracy of the prediction of short and
long term virological failure, performance of each FL parameter
was estimated using a 10-fold receiver operating characteristic(ROC) curve analysis wherein the area under the curve (AUC)was used as performance measurement. The FL parameters werecompared to the Rega and HIVdb indinavir GSS after correctingfor GSS of the backbone regimen.
2.5.5. Survival analysisA final analysis constituted a Kaplan–Meier analysis of the TCEs
to test how GSS, LogF, GR, MT, GR and GF could be useful in pre-dicting time to viral suppression. The proportions of TCEs achiev-ing treatment success were plotted against time to suppressionof viral load. For this purpose, both the GSS from the Rega and HIV-db were grouped into three; 0–1, >1–2 and >2. For the genotypicparameters from the FLs, the values were grouped per quartileand the difference in median survival time tested. Further, theCox proportional hazards model was applied to adjust for othercovariates including baseline viral load and the time lag betweenthe start of therapy and the follow-up viral load.
3. Results
3.1. Sequence data and subtype distribution
In total 17,539 viral sequences were used in this study for modeltraining or evaluation. More than half of the sequence dataset be-longed to HIV-1 subtype B (74%), followed by subtype G (11%). Thedetailed subtype distribution of all eight sequence populations isshown in Supplementary Fig. 3. When testing for equal populationproportions, subtype B distribution was not significantly different(p-value = 0.08) in the training sequence data sets used for each ofthe Bayesian Networks (PT, PP and PD) but significantly differentto the naïve population (PN) (p-value = 0.04). The sequence distri-butions of the evaluation datasets (PE, PC and PV) were however sig-nificantly different from the training datasets (p-value < 0.05).
3.2. Epistatic interactions learned from the Bayesian Networks
The networks BNT, BNP and BND mapped 89 mutations at 48sites, 90 mutations at 47 sites and 90 mutations at 47 sites, respec-tively. A BN was not constructed from the longitudinal sequencedata alone as in this population mutations were not sufficientlyabundant to model all the epistatic interactions of different aminoacid positions in protease. Mutations 20T/V/M, 30N, 33F, 35N/G,36V, 48V, 53L, 69RI/Y, 71I, 74A, 88D/S and 92R/K were present inBNP and BND but absent in BNT.
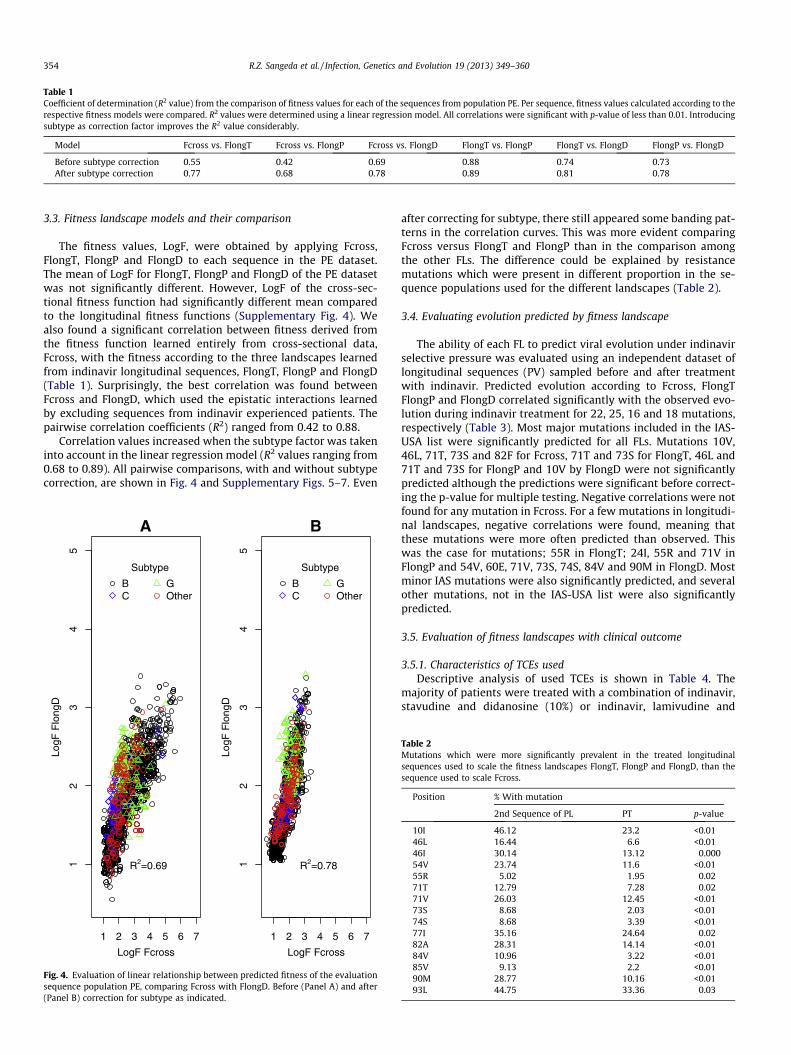
Table 1Coefficient of determination (R2 value) from the comparison of fitness values for each of the sequences from population PE. Per sequence, fitness values calculated according to therespective fitness models were compared. R2 values were determined using a linear regression model. All correlations were significant with p-value of less than 0.01. Introducingsubtype as correction factor improves the R2 value considerably.
Model Fcross vs. FlongT Fcross vs. FlongP Fcross vs. FlongD FlongT vs. FlongP FlongT vs. FlongD FlongP vs. FlongD
Before subtype correction 0.55 0.42 0.69 0.88 0.74 0.73After subtype correction 0.77 0.68 0.78 0.89 0.81 0.78
354 R.Z. Sangeda et al. / Infection, Genetics and Evolution 19 (2013) 349–360
3.3. Fitness landscape models and their comparison
The fitness values, LogF, were obtained by applying Fcross,FlongT, FlongP and FlongD to each sequence in the PE dataset.The mean of LogF for FlongT, FlongP and FlongD of the PE datasetwas not significantly different. However, LogF of the cross-sec-tional fitness function had significantly different mean comparedto the longitudinal fitness functions (Supplementary Fig. 4). Wealso found a significant correlation between fitness derived fromthe fitness function learned entirely from cross-sectional data,Fcross, with the fitness according to the three landscapes learnedfrom indinavir longitudinal sequences, FlongT, FlongP and FlongD(Table 1). Surprisingly, the best correlation was found betweenFcross and FlongD, which used the epistatic interactions learnedby excluding sequences from indinavir experienced patients. Thepairwise correlation coefficients (R2) ranged from 0.42 to 0.88.
Correlation values increased when the subtype factor was takeninto account in the linear regression model (R2 values ranging from0.68 to 0.89). All pairwise comparisons, with and without subtypecorrection, are shown in Fig. 4 and Supplementary Figs. 5–7. Even
1 2 3 4 5 6 7
12
34
5
LogF Fcross
LogF
Flo
ngD
Subtype
BC
GOther
A
R2=0.69
1 2 3 4 5 6 7
12
34
5
LogF Fcross
LogF
Flo
ngD
Subtype
BC
GOther
B
R2=0.78
Fig. 4. Evaluation of linear relationship between predicted fitness of the evaluationsequence population PE, comparing Fcross with FlongD. Before (Panel A) and after(Panel B) correction for subtype as indicated.
after correcting for subtype, there still appeared some banding pat-terns in the correlation curves. This was more evident comparingFcross versus FlongT and FlongP than in the comparison amongthe other FLs. The difference could be explained by resistancemutations which were present in different proportion in the se-quence populations used for the different landscapes (Table 2).
3.4. Evaluating evolution predicted by fitness landscape
The ability of each FL to predict viral evolution under indinavirselective pressure was evaluated using an independent dataset oflongitudinal sequences (PV) sampled before and after treatmentwith indinavir. Predicted evolution according to Fcross, FlongTFlongP and FlongD correlated significantly with the observed evo-lution during indinavir treatment for 22, 25, 16 and 18 mutations,respectively (Table 3). Most major mutations included in the IAS-USA list were significantly predicted for all FLs. Mutations 10V,46L, 71T, 73S and 82F for Fcross, 71T and 73S for FlongT, 46L and71T and 73S for FlongP and 10V by FlongD were not significantlypredicted although the predictions were significant before correct-ing the p-value for multiple testing. Negative correlations were notfound for any mutation in Fcross. For a few mutations in longitudi-nal landscapes, negative correlations were found, meaning thatthese mutations were more often predicted than observed. Thiswas the case for mutations; 55R in FlongT; 24I, 55R and 71V inFlongP and 54V, 60E, 71V, 73S, 74S, 84V and 90M in FlongD. Mostminor IAS mutations were also significantly predicted, and severalother mutations, not in the IAS-USA list were also significantlypredicted.
3.5. Evaluation of fitness landscapes with clinical outcome
3.5.1. Characteristics of TCEs usedDescriptive analysis of used TCEs is shown in Table 4. The
majority of patients were treated with a combination of indinavir,stavudine and didanosine (10%) or indinavir, lamivudine and
Table 2Mutations which were more significantly prevalent in the treated longitudinalsequences used to scale the fitness landscapes FlongT, FlongP and FlongD, than thesequence used to scale Fcross.
Position % With mutation
2nd Sequence of PL PT p-value
10I 46.12 23.2 <0.0146L 16.44 6.6 <0.0146I 30.14 13.12 0.00054V 23.74 11.6 <0.0155R 5.02 1.95 0.0271T 12.79 7.28 0.0271V 26.03 12.45 <0.0173S 8.68 2.03 <0.0174S 8.68 3.39 <0.0177I 35.16 24.64 0.0282A 28.31 14.14 <0.0184V 10.96 3.22 <0.0185V 9.13 2.2 <0.0190M 28.77 10.16 <0.0193L 44.75 33.36 0.03
Table 3Mutations for which predicted variation correlated significantly with observedevolution during indinavir treatment (correcting for false discovery rate of 0.05), inthe evaluation sequence pairs (PV) using Fcross, FlongT, FlongP and FlongD fitnessfunctions. The number (N) of baseline sequences without the mutation (M) of which ndeveloped the mutation during treatment. P: p-values for correlation betweenpredicted probability for selection of the mutation and observed selection. IndinavirIAS-USA mutations are shown in bold; the major indinavir IAS-USA mutations are inbold italics. NS: mutation not significantly predicted and -; mutation not present inthis particular fitness landscape.
M N N Fcross FlongT FlongP FlongDP P P P
10F 309 9 NS 1.31E-04 NS 7.21E-0310I 251 67 9.23E-16 2.21E-11 8.37E-09 1.99E-0810V 302 13 NS 5.99E-04 1.47E-03 NS13V 262 24 1.60E-02 NS NS NS15V 251 21 9.52E-05 1.06E-02 6.57E-03 NS20I 303 18 1.35E-02 1.98E-10 1.66E-09 3.16E-0720R 297 19 1.36E-03 2.73E-09 4.20E-07 2.95E-0624I 305 17 6.78E-07 1.02E-02 2.10E-03 –33I 312 5 NS NS NS 2.41E-0335D 247 18 1.09E-02 NS 4.21E-03 NS36L 308 2 1.57E-04 NS NS NS37D 246 17 2.37E-04 3.34E-03 7.52E-05 NS37E 305 5 NS 7.42E-07 NS NS43T 312 15 1.35E-02 NS – –46I 281 63 2.42E-09 7.52E-07 1.14E-11 6.64E-1046L 294 23 NS 5.01E-02 NS 1.05E-0354V 288 46 7.56E-16 3.68E-02 9.64E-09 2.02E-0255R 307 20 4.22E-07 1.47E-06 4.97E-05 6.09E-0757K 285 11 – 2.40E-05 4.73E-05 2.02E-0258E 305 12 1.03E-02 NS 3.48E-05 5.34E-0260E 284 15 NS NS NS 3.34E-0262V 236 54 4.91E-08 1.01E-09 3.43E-10 6.64E-1063H 310 2 4.02E-03 NS NS NS63P 107 34 4.32E-03 4.55E-03 NS 7.21E-0363T 291 3 NS 6.80E-03 3.28E-03 7.21E-0364V 264 20 NS NS NS NS65D 303 4 NS NS NS 3.15E-0266F 310 3 NS 4.72E-02 NS NS69Q 308 4 NS 5.39E-02 NS NS71T 282 15 NS NS NS 1.20E-0271V 266 59 9.52E-16 3.24E-17 8.62E-05 9.23E-0972L 304 18 1.79E-04 3.00E-03 – –72T 300 5 NS NS NS 2.63E-0273S 293 36 NS NS NS 3.15E-0274S 311 13 NS NS NS 3.15E-0282A 278 58 2.66E-08 7.00E-09 2.04E-06 4.53E-0682F 308 4 NS 6.02E-04 – –84V 297 21 8.65E-07 1.57E-04 2.25E-05 6.77E-0485V 307 15 NS NS NS 4.53E-0690M 255 73 2.36E-14 1.22E-05 2.25E-05 1.08E-0993L 216 32 NS 5.01E-02 NS NS
R.Z. Sangeda et al. / Infection, Genetics and Evolution 19 (2013) 349–360 355
zidovudine (9%) at the first time-point (Supplementary Fig. 8).These therapies were administered in the period 1996–2006.
Table 4Description of TCE parameters used for evaluation of fitness landscape mod
Parameter Median (inter
Week 12
Baseline total GSS (Rega) 2.50 (2.00–3.5Baseline IDV GSS (Rega) 1.50 (1.00–1.5Baseline total GSS (HIVdb) 2.00 (1.50–3.0Baseline IDV GSS (HIVdb) 1.00 (0.75–1.0Baseline VL 23,110 (4239Follow-up VL 400 (80–2,169Time lag between start of TCE and follow-up VL 8.86 (5.71–12Follow-up duration 91 (64–107) dTherapy duration 315 (144–573Therapy year 2000 (1999–2
GSS, genotypic susceptibility score; IDV, indinavir; VL, viral load; TCE, tre
The frequency of the regimen-specific GSS made by combiningGSS of the backbone regimen with that of indinavir is shown inFig. 2 and Supplementary Fig. 9. The majority of patients had a reg-imen-specific GSS greater than 2 and responded well to therapy.Baseline sequences were mainly predicted as susceptible to indina-vir and were responders (Fig. 3 and Supplementary Fig. 10). Therewas a significant but weak correlation between regimen-specificGSS and the indinavir GSS (R2 = 0.43; p-value < 0.01 andR2 = 0.33; p-value < 0.01 for Rega and HIVdb, respectively).
3.5.2. Prediction of virological failure in the 12 weeks analysisFor the FL parameters used, the median score (Interquartile
range) for the baseline sequences of the week12 dataset are shownin Table 5.
A logistic regression model was used to evaluate the performanceof each of these FL parameters and the indinavir GSS in predictingtherapy failure at week 12. A higher Rega indinavir and HIVdb indi-navir GSS at baseline was associated with lower odds of virologicalfailure at week 12, i.e. 0.44 (0.27–0.70, p-value < 0.01) and 0.24(0.11–0.53, p-value < 0.01), respectively. Concerning the FL parame-ters, for all models, a higher fitness was associated with higher oddsof virological failure (Table 6). A higher genetic barrier to resistance,measured as GR, GF, MF and MR were significantly associated withlower odds of virological failure in all FLs (except MR from FlongT).
3.5.3. Prediction of virological failure in the 48 weeks analysisSimilarly, for patients who had a follow-up viral load at end-
point two, we analyzed the association between the parametersabove with risk of therapy failure at week 48.
A unit increase in both Rega indinavir GSS and HIVdb indinavirGSS was associated with lower probability of virological failure,with an odds ratio of 0.22 (0.11–0.39 p-value < 0.01) and 0.12(0.05–0.32 p-value < 0.01), respectively.
For the FL parameters, a unit change of LogF, GF, MF and GRwere predictive of virological failure for all models (Table 6). Withthese models a higher fitness was associated with higher odds ofvirological failure, and an increase in genetic barrier parametersGF, MF and GR were associated with lower odds ratio of virologicalfailure (Table 6).
In case of genetic barrier to resistance measured as MR, theywere only predictive in the models Fcross, FlongD (Table 6). MRfrom FlongT and FlongP could not significantly predict virologicalfailure, although the trend was there (p-value = 0.07).
3.6. Performance of logistic regression models
For week 48, the mean of the AUC of 10-fold cross-validation foreach FL parameter in the four FLs model, and indinavir GSS for Rega
els.
quartile range)
Week 48
0) 2.50 (2.00–3.50)0) 1.00 (1.00–1.50)0) 2.25 (1.50–3.00)0) 1.00 (1.00–1.00)
.00–129,000) copies/ml 23,110 (3,395–112,216) copies/ml) copies/ml 100 (50–6,965) copies/ml
.57) weeks 40.00 (28.29–46.43) weeksays 300.00 (231–353) days) days 413 (276–728) days002) 2000 (1999–2002)
atment change episode.

Table 5Median values (interquartile range (IQR)) for fitness landscape (FL) parameters derived from treatment change episodes used to predict virological failure at 12 and 48 weeks.
Parameter FL Fcross FlongT FlongP FlongDWeek Median (IQR) Median (IQR) Median (IQR) Median (IQR)
Log F 12 1.66 (1.44–2.11) 1.24 (1.12–1.48) 1.28 (1.15–1.52) 1.37 (1.18–1.73)48 1.63 (1.43–2.03) 1.23 (1.11–1.45) 1.27 (1.15–1.50) 1.36 (1.18–1.68)
GR 12 163.22 (67.98–201.10) 191.8 (104.8–245.5) 183.1 (142.60–228.70) 170.9 (137.2–198.7)48 166.75 (78.23–201.26) 199.9 (109.20–187.7) 181.1 (140.1–228.7) 170.60 (141.80–197.40)
MR 12 3.86 (1.92–4.62) 3.01 (1.96–3.78) 2.93 (2.37–3.68) 3.22 (2.64–3.81)48 3.92 (2.02–4.55) 2.99 (1.93–3.70) 2.89 (2.35–3.63) 3.04 (2.71–3.76)
GF 12 166.01 (74.96–209.37) 559.8 (372.7–673.5) 587.40 (406.40–695.30) 390.4 (257.0–468.70)48 170.07 (91.04–209.56) 559.2 (394.70–686.70) 592.50 (430.0–696.70) 405.30 (281.70–475.60)
MF 12 4.06 (2.27–5.08) 8.90 (6.23–10.32) 9.12 (6.64–10.43) 7.5 (5.01–8.80)48 4.19 (2.58–5.11) 8.99 (6.63–10.47) 9.33 (6.88–10.49) 7.68 (5.38–8.84)
Table 6Logistic regression analysis for predicting risk of virological failure at week 12 and 48 using each parameter of the fitness landscapes (FL) separately. The odds ratio (OR) and its95% confidence interval (CI) are calculated per unit increase in LogF, MR and MF or per 100 generations in case of GR and GF. The model was adjusted for the confounders, baselineviral load, time lag between the start of treatment change episode, previous protease inhibitor exposure and the time of follow-up viral load and for the total genotypicsusceptibility score of the background regimen.
FL Fcross FlongT FlongP FlongD
Parameter Week OR (95% CI) p-value OR (95% CI) p-value OR (95% CI) p-value OR (95% CI) p-value
Log F 12 1.74 (1.12–2.69) 0.01 2.13 (1.07–4.35) 0.03 2.09 (1.11–4.12) 0.03 2.02 (1.08–3.77) 0.0348 2.63 (1.53–4.51) <0.01 3.77 (1.73–8.64) <0.01 4.16 (1.89–9.86) <0.01 3.18 (1.52–6.64) <0.01
GR 12 0.60 (0.44–0.83) <0.01 0.78 (0.62–0.98) 0.04 0.67 (0.50–0.88) <0.01 0.68 (0.49–0.95) 0.0248 0.58 (0.40–0.83) <0.01 0.77 (0.59–0.99) 0.05 0.73 (0.54–0.98) 0.04 0.65 (0.45–0.94) 0.02
MR 12 0.79 (0.69–0.92) <0.01 0.87 (0.75–1.01) 0.07 0.82 (0.69–0.96) 0.02 0.82 (0.69–0.98) 0.0348 0.77 (0.66–0.91) <0.01 0.86 (0.72–1.01) 0.07 0.84 (0.71- 1.01) 0.07 0.80 (0.67–0.97) 0.02
GF 12 0.82 (0.71–0.94) <0.01 0.86 (0.76–0.97) 0.01 0.85 (0.75–0.96) <0.01 0.78 (0.64–0.94) 0.0148 0.56 (0.39–0.80) <0.01 0.82 (0.72–0.93) <0.01 0.80 (0.70–0.92) <0.01 0.69 (0.56–0.87) <0.01
MF 12 0.82 (0.71- 0.94) <0.01 0.89 (0.82–0.97) 0.01 0.89 (0.82–0.97) <0.01 0.88 (0.79–0.97) 0.0148 0.77 (0.66–0.90) <0.01 0.86 (0.78–0.95) <0.01 0.85 (0.78–0.94) <0.01 0.82 (0.72–0.92) 0.02
Table 7Area under the curve (AUC) for prediction models from the Receiver OperatingCharacteristic (ROC) analysis for week 12 and 48 (a) the expert systems and (b)genotypic parameters of each fitness landscape (FL). Wilcoxon rank test was donebetween Rega IDV GSS with HIVdb IDV GSS (A) or Rega IDV GSS with Log F, GR, MR,GF and MF. All models were not significantly different in their AUC. IDV, indinavir;GSS, genotypic susceptibility score).
A
Algorithm Week AUC for IDV GSS
Rega 12 0.6748 0.71
HIVdb 12 0.6748 0.69
B
Week Fcross FlongT FlongP FlongD
LogF 12 0.65 0.67 0.66 0.6648 0.65 0.67 0.66 0.66
GR 12 0.66 0.65 0.6 0.6548 0.65 0.66 0.62 0.65
MR 12 0.66 0.64 0.63 0.6548 0.65 0.66 0.63 0.65
GF 12 0.67 0.66 0.66 0.6648 0.65 0.65 0.66 0.66
MF 12 0.68 0.65 0.65 0.6648 0.65 0.65 0.66 0.65
356 R.Z. Sangeda et al. / Infection, Genetics and Evolution 19 (2013) 349–360
and HIVdb are shown in Table 7 and ROC curve in SupplementaryFigs. 11 and 12. All models were predictive, but neither model wasbetter than the other in predicting treatment response in bothweek 12 (data not shown) and week 48 datasets.
3.7. Survival analysis
To further illustrate the genotypic characteristics of the dataused for predicting virological outcome, we used Kaplan–Meier
curves (Fig. 5). The median time to reach viral-suppression below500 copies/ml or a decrease of 2 or more logs of viral load duringfollow-up was 10 weeks. The median survival time of the threeGSS groups according to Rega indicated that patients with higherbaseline GSS reached an undetectable viral load significantly ear-lier than those with a lower GSS (Table 8). A similar significanttrend was shown by the interquartile groups of the GR and MRFL parameters indicating that the higher the remaining geneticbarrier the earlier undetectable viral load was reached. For theGF, the less fit viruses required a shorter time to be suppressed.The discriminative power of the interquartile groups of LogF andMF with p-value 0.08 and 0.09, respectively was not significant.
The overall models remained significant after adjusting forcovariates using the Cox proportional hazard model, although theindividual FL parameters became insignificant when combined inthe model (data not shown).
4. Discussion
In this study, novel longitudinal fitness landscapes (FLs) werecompared to the more conventional cross-sectional FL for patientreceiving indinavir-containing combination treatment, and foundto have the power to predict both the failing genotype and virolog-ical outcome. The technique of Bayesian Network (BN) Learningwas used to investigate which mutations and polymorphisms ap-pear together more than due to chance and epidemiology alone,a characteristic assumed to reflect epistatic interactions betweenthe amino acids at these different positions of the HIV protein inquestion. Consequently, the BN denotes the qualitative representa-tion of epistatic interactions mapped from statistical associationsbetween amino acids. Longitudinal sequences from patients failingindinavir were then used to scale the fitness landscape. The fitnessfunction representing the fitness landscape allows obtaining aquantitative estimate of the fitness of a particular sequence. Thus,

0 10 20 30 40 50
020
4060
80
Rega
Weeks to VL suppression
% o
f pat
ient
s w
ith V
L su
ppre
ssio
n
Rega GSS groups
0 <= GSS < 11 <= GSS < 2GSS >= 2
0 10 20 30 40 50
020
4060
80
HIVdb
Weeks to VL suppression
% o
f pat
ient
s w
ith V
L su
ppre
ssio
n
HIVdb GSS groups
0 <= GSS < 11 <= GSS < 2GSS >= 2
0 10 20 30 40 50
020
4060
80
Log F
Weeks to VL suppression
% o
f pat
ient
s w
ith V
L su
ppre
ssio
n
Log F quartiles
0 <= Log F < 1.41.4 <= Log F < 1.61.6 <= Log F < 2.0Log F >= 2.0
0 10 20 30 40 50
020
4060
80
GR
Weeks to VL suppression
% o
f pat
ient
s w
ith V
L su
ppre
ssio
n
GR quartiles
0 <= GR< 8383 <= GR< 168168 <= GR< 205GR>= 205
0 10 20 30 40 50
020
4060
80
GF
Weeks to VL suppression
% o
f pat
ient
s w
ith V
L su
ppre
ssio
n
GF quartiles
0 <= GF< 9595 <= GF< 174174 <= GF< 210GF>= 210
0 10 20 30 40 50
020
4060
80
MR
Weeks to VL suppression
% o
f pat
ient
s w
ith V
L su
ppre
ssio
n
MR quartiles
0 <= MR< 22 <= MR< 44 <= GF< 5MR>= 5
0 10 20 30 40 50
020
4060
80
MF
Weeks to VL suppression
% o
f pat
ient
s w
ith V
L su
ppre
ssio
n
MF quartiles
0 <= GR< 33 <= GR< 44 <= GR< 5GR>= 5
Fig. 5. Kaplan–Meier curve to show associations between the three indinavir genotypic susceptibility score (GSS) groups from Rega and HIVdb derived indinavir GSS or thequartile-groups of the indinavir cross-sectional FL parameters (LogF, GR, MR, GF and MF) derived from the treatment change episodes at 48 weeks, versus the time to viral-suppression below 500 copies per ml or a decrease in viral load of 2 logs or more. Adding all the FL parameters to a Cox proportional hazard model resulted in an overallsignificant model, although the individual parameters became insignificant.
R.Z. Sangeda et al. / Infection, Genetics and Evolution 19 (2013) 349–360 357
the fitness landscape has to be viewed as a map representing thisfitness for the entire sequence space; it also allows quantifyingthe genetic barrier to resistance.
HIV-1 fitness is a parameter that defines the replicative capacityin the context of environmental conditions like the presence of
drug in a patient. The terms epistasis and fitness in this paper referto statistical properties as conceptualized in population genetics.Our estimated in vivo fitness value is calculated based on theassumption that the increase in the prevalence of a mutation orpattern of mutations in sequences from treated compared to drug

Table 8Time to virological suppression below 500 copies/ml or a decrease of 2 or more logs ofviral load for groups of parameters. For Rega and HIVdb genotypic susceptibility score(GSS), the cut off was 0–1, >1–2 and >2 for group 1, 2 and 3, respectively. FLparameters were divided into 4 groups according to interquartile values. For Rega andHIVdb GSS 4th group was not applicable (NA).
Parameters Time to virological suppression in weeks p-value
Group1 Group 2 Group 3 Group 4
Rega – 17.71 8.79 NA <0.01HIVdb – 8.71 9.14 NA 0.01Log F 8.14 5.71 7.71 8.71 0.08GR 21.14 9.14 8.29 9.00 0.01GF 14.14 10.86 8.86 8.71 0.05MR 21.86 8.86 8.36 7.86 <0.01MF 16.86 10.93 8.00 9.71 0.09
358 R.Z. Sangeda et al. / Infection, Genetics and Evolution 19 (2013) 349–360
naive patients reflects an increase in fitness of the virus under drugselective pressure. The drug-pressure exerted on the virus drivesadaptive evolution and selects for resistant viruses with higher fit-ness. In the past, using a dataset of genotype–phenotype pairs, wehave shown that in vivo fitness estimated from a fitness landscapefor the drug nelfinavir correlated well with in vitro resistance foldchange phenotype (Deforche et al., 2008a). Not only major drugresistance mutations, but also polymorphic mutations contributeto this fitness, since they can increase fitness both in the presenceand absence of drug. In the past we also showed that the estimatedfitness in our protease fitness landscape models correlated signifi-cantly with viral load in drug naïve patients, and this correlationwas linked to the presence of such polymorphic mutations (Theyset al., 2012). Thus, our fitness estimate can be considered an in vivoresistance phenotype, capturing both phenotypic resistance andintrinsic replication capacity (in the absence of drug). The fitnesslandscapes also allow quantifying the genetic barrier to resistance.A FL is therefore a good tool for evaluating both the susceptibilityof the virus for a drug and the individualized genetic barrier of thatvirus for that drug, both of which can be predictive of therapy fail-ure, because drugs with lower genetic barrier are more likely tocause therapy failure. We have previously reported that a highergenetic barrier derived from such a FL was significantly associatedwith higher viral load reduction in the short term and with lowerodds of virological failure on long term (Deforche et al., 2008b;Theys et al., 2010).
Our previous FLs were constructed using cross-sectional data,comparing sequences from drug-naïve patients with sequencesfrom patients experienced with the drug being investigated. Toavoid a bias from the epidemiological connection between muta-tions rather than epistatic fitness interaction, a phylogenetic treecan be used to sample sequences from naïve patients that are epi-demiologically related to sequences from treated patients. How-ever, to completely remove this bias, FLs should be learned fromlongitudinal sequences (Deforche et al., 2006). These sequencesare more informative than cross-sectional data because all differ-ences in the longitudinal sequence pairs represent mutations thatsurvived under the selective pressure of the therapy, even thoughthey might arise in two ways, through stochastic effects or throughpositive selective pressure from the drugs. With such sequencescoming from the same patient, the analysis was not subjected toepidemiological bias, e.g. a difference in evolutionary history. Dif-ferences in cross-sectional data also include the natural variation(which can be considered noise in this context) of the entire drugnaïve HIV-1 population and hence modeling the fitness functionrequires a lot more sequences to separate significant signal fromthe noise. Nevertheless, longitudinal sequences are more difficultto obtain compared to the cross-sectional sequences due to theinherent difficulty in following the patient and the confidentialnature of patient data.
We hypothesized that in the absence of sufficient cross-sec-tional or longitudinal sequence data from patients failing a newdrug, we can map epistatic interactions in the targeted proteinby training a BN based on cross sectional sequences from patientsexperienced with other drugs targeting the same protein, whileusing the scarce longitudinal sequences from patients treated withthe new drug under investigation to scale the FL. The essence ofusing these sequence populations was that more amino acid inter-actions can be learned from drug selective pressure with otherdrugs acting on the same HIV protein, than from the limited num-ber of longitudinal data available of only the drug under investiga-tion. This is a valuable option for new drugs for which sequencedata are limited but that inhibit a protein for which extensive datafrom other drugs is available. The drug indinavir was chosen as amodel drug, because sufficient data were available for bothcross-sectional and longitudinal FL construction and evaluation.
For all models, epistatic interactions were learned from threesets of cross-sectional data of HIV-1 sequences: from patients (i)failing the drug under investigation, in this case indinavir (BNTused in Fcross and FlongT), (ii) failing any drug that targets thesame gene as the drug under investigation (BNP used in FlongP),or (iii) failing any drug that targets the same gene except data frompatients failing the drug under investigation (BND used in FlongD).In the cross-sectional fitness landscape, cross-sectional sequenceswere then used to scale Fcross, while for all the longitudinal land-scapes, we used the same small set of longitudinal data (Flong) forthis scaling step. The FL FlongD mimics the situation of a salvagedrug for which not sufficient cross-sectional data are available tobuild a BN. Although most of the mutations known to be involvedin indinavir drug resistance are included in our longitudinal orcross-sectional FLs, the mutation lists are slightly different. Thiscan be explained by the different mutations included in the BN.Essentially our three BNs modeled the same mutations, except thatsome mutations present in BNP and BND were absent in BNT.These extra mutations correspond to mutations known to be asso-ciated with resistance to PIs other than indinavir for instance 20T/V/M, 33F, 53L and 71Y are selected by the drug atazanavir, 30N ispredominantly a major and 88D/S a minor nelfinavir resistancemutation, 48V is selected by atazanavir and saquinavir. This showsthat more interactions can be captured when pooling data frommore than one protease inhibitor.
Cross-sectional and longitudinal models were compared to eachother in terms of the estimated fitness predicted from the same setof sequences. Since the BN maps epistatic interactions amongresistance mutations and polymorphic amino acids including fromdifferent subtypes, we anticipated that the FL should be able tocapture the effect of drug selective pressure in different subtypes.To investigate how reproducible the FLs were across subtypes, weused an evaluation sequence set with a different treatment historyand subtype distribution than the training dataset. Despite a signif-icant subtype difference between the training and evaluation se-quences the estimated fitness according to the different FLscorrelated well with each other. However, at log fitness valuesabove 1.5 there appeared to be some banding pattern in the plots(Supplementary Fig. 6). Separate correlation bands for fitness val-ues of subtype B sequences versus other subtypes clearly indicatethat the linear regression model needs to be corrected for a sub-type factor (right panels of Fig. 4 and Supplementary Figs. 5–7). Be-cause our FL models inferred fitness for mutation patterns ofevolutionary information, the inter-subtype variability may intro-duce a bias. We assume this is because one subtype will not evolveinto a different subtype due to drug selective pressure only, andwithin a patient in a short time interval, such that the impact ofsubtype dependent polymorphisms that are not selected for duringtherapy (for example because they are the wildtype in thatsubtype) will not be present in our fitness landscapes. We were
R.Z. Sangeda et al. / Infection, Genetics and Evolution 19 (2013) 349–360 359
however unable to compare the predictive power within each sub-type because except for subtype B, there were not enough dataavailable.
All four FLs could predict the accumulation of mutations com-paring the baseline sequence with a follow-up sequence. Of thecorrectly predicted mutations, 10I/V, 20R, 24I, 46I/L, 54V, 71T/V,82A/F, 84V and 90M correspond to those listed in the updatedmutation list for indinavir (Johnson et al., 2011). The appearanceof major indinavir mutation 84V was significantly more predicted(negatively correlated) than observed using FL model for which theepistatic interactions (BND) were trained on PI treatment data thatexcluded patients failing on indinavir (PD). The following indinavirIAS mutations, 20M, 32I, 36I, 76V and 82T were present in some ofthe fitness landscapes but not significantly predicted. The follow-ing indinavir IAS mutations; 10R and 73A were not present inany of the fitness landscapes.
Using an independent set of clinical data, FLs were evaluated forpredictive performance in the short term (12 weeks) and long term(48 weeks). A unit increase in both Rega and HIVdb indinavir GSSat baseline was significantly associated with lower odds of virolog-ical failure in both short and long term. Likewise, the fitnessparameters predictive of treatment failure in all longitudinal mod-els were those pertaining to the fitness and genetic barrier to a fit-ness threshold (LogF, GF, and MF) while the measure of geneticbarrier to resistance, GR and MR were predictive for all FLs exceptfor GR the FL model FlongT (both short and long term) and FlongP(only long term). FlongT, the fitness landscape for which both theepistatic interactions and the fitness scaling were modeled usingsequences that had experienced indinavir selective pressure, isnot performing as good at the other fitness landscapes. We canonly speculate that this may be due to the subtype effect, or tothe fact that there were fewer training data to catch the epistaticinteractions, in comparison with the other longitudinal fitnesslandscapes.
We analyzed the data used to evaluate the performance of theFL and GSS from expert systems for its ability to predict mediansurvival time across interquartile groups of FL parameters andGSS cut-offs. The median time to maximal suppression was around10 weeks. We could significantly distinguish time to suppressionbased on the various GSS groups and interquartile parameters ofthe FLs. However, we could not rule out the influence of other fac-tors that determine virological failure such as adherence and sub-optimal doses.
This study is a proof of concept, showing how longitudinal indi-navir data can be used to estimate the in vivo HIV-1 fitness functionunder indinavir selective pressure. Because drugs within the samedrug class select mutations which show similar interactions, theepistatic interactions may be modeled with interactions inducedby other drugs from the same class on the same protein. Mutationsderived from the sparse longitudinal data are then used to scale theFL, and it is this scaling that would then be useful to derive individ-ualized genetic barrier for that new drug and hence provide a mod-el to predict therapy success given a baseline sequence from apatient.
Our model of a FL, given its power to predict the failing geno-type, can be a useful tool to predict therapy outcome in re-source-limited settings, albeit in the presence of at least onegenotype at some point before the failing treatment. The combina-tion of FL models with other confounders such as adherence, viralload and CD4+ T-cell count history, age, drug metabolic markersand treatment history should improve the prediction of therapy re-sponse and resistance development in general. The cost-effective-ness of this approach in resource-limited settings compared toroutine genotyping deserves further investigation.
Further studies are needed to validate the clinical applicabilityof these models to contemporary ART including PIs with a high
genetic barrier to resistance. For these new models an improvedsimulator is planned to enable pairwise sequence comparison fromlongitudinal dataset, thereby restricting within-pair evolution.
5. Conclusion
This study suggests that fitness landscapes (FL) estimated fromlongitudinal data perform well as compared to FLs using cross-sec-tional data or the expert systems in predicting treatment response.FL can be modeled from longitudinal data, even when epistaticinteractions are learned from cross sectional data and mainly fromselective pressure with other drugs acting on the same HIV protein.With this approach we can model FL for drugs with limited se-quence information such as those used in salvage therapy. There-fore, estimated fitness and genetic barrier derived fromlongitudinal FLs can contribute to an improvement of predictedtreatment outcome. This could be used along with expert systemssuch as Rega IS to improve its predictive power.
Acknowledgment
RZS receives a PhD grant from the Belgian Technical Coopera-tion (BTC). KD and GB were funded by a PhD grant from the Insti-tute for the Promotion of Innovation through Sciences andTechnology in Flanders (IWT). KT received funding from the Re-search Fund of the KU Leuven (PDMK/10/204) and from the Fondsvoor Wetenschappelijk Onderzoek (FWO) Flanders. This work wassupported in part by the KU Leuven through grant OT/04/43, theInteruniversity Attraction Poles (IAP) P6/41, the Fonds voorWetenschappelijk Onderzoek (FWO) Flanders (grant G.0611.09N)and the EU funded projects Virolab (grant IST STREP project027446), EuResist (grant IST-4-027173-STP). The research leadingto these results has received funding from the European Commu-nity’s Seventh Framework Programme (FP7/2007-2013) underthe project ‘‘Collaborative HIV and Anti-HIV Drug ResistanceNetwork (CHAIN)’’ – grant agreement no 223131.
We acknowledge contributions of the Virolab project by the fol-lowing colleagues: Professor Nino Manca, Dr. Franco Gargiulo, Dr.Eugenia Quiros-Roldan, Dr. Laura Albini, Dr. Giuseppe Paraninfoand Dr. Giuseppe Lapadula.
Appendix A. Supplementary data
Supplementary data associated with this article can be found, inthe online version, at http://dx.doi.org/10.1016/j.meegid.2013.03.014.
References
Altmann, A., Beerenwinkel, N., Sing, T., Savenkov, I., Doumer, M., Kaiser, R., Rhee, S.-Y., Fessel, W.J., Shafer, R.W., Lengauer, T., 2007. Improved prediction of responseto antiretroviral combination therapy using the genetic barrier to drugresistance. Antivir. Ther. (Lond.) 12, 169–178.
de Oliveira, T., Deforche, K., Cassol, S., Salminen, M., Paraskevis, D., Seebregts, C.,Snoeck, J., van Rensburg, E.J., Wensing, A.M.J., Van de Vijver, D.A., Boucher, C.A.,Camacho, R.J., Vandamme, A.-M., 2005. An automated genotyping system foranalysis of HIV-1 and other microbial sequences. Bioinformatics 21, 3797–3800.
Deforche, K., Silander, T., Camacho, R.J., Grossman, Z., Soares, M.A., Van Laethem, K.,Kantor, R., Moreau, Y., Vandamme, Anne-M., 2006. Analysis of HIV-1 polsequences using Bayesian Networks: implications for drug resistance.Bioinformatics 22, 2975–2979.
Deforche, K., Camacho, R.J., Grossman, Z., Silander, T., Soares, M.A., Moreau, Y.,Shafer, R.W., Van Laethem, K., Carvalho, A.P., Wynhoven, B., Cane, P., Snoeck, J.,Clarke, J., Sirivichayakul, S., Ariyoshi, K., Holguin, A., Rudich, H., Rodrigues, R.,Bouzas, M.B., Cahn, P., Brigido, L.F., Soriano, V., Sugiura, W., Phanuphak, P.,Morris, L., Weber, J., Pillay, D., Tanuri, A., Harrigan, P.R., Shapiro, J.M.,Katzenstein, D.A., Kantor, R., Vandamme, A.-M., 2007. Bayesian networkanalysis of resistance pathways against HIV-1 protease inhibitors. Infect.Genet. Evol. 7, 382–390.

360 R.Z. Sangeda et al. / Infection, Genetics and Evolution 19 (2013) 349–360
Deforche, K., Camacho, R.J., Van Laethem, K., Lemey, P., Rambaut, A., Moreau, Y.,Vandamme, A.-M., 2008a. Estimation of an in vivo fitness landscape experiencedby HIV-1 under drug selective pressure useful for prediction of drug resistanceevolution during treatment. Bioinformatics 24, 34–41.
Deforche, K., Cozzi-Lepri, A., Theys, K., Clotet, B., Camacho, R.J., Kjaer, J., VanLaethem, K., Phillips, A., Moreau, Y., Lundgren, J.D., Vandamme, A.-M., 2008b.Modelled in vivo HIV fitness under drug selective pressure and estimatedgenetic barrier towards resistance are predictive for virological response.Antivir. Ther. (Lond.) 13, 399–407.
Hirsch, M.S., Günthard, H.F., Schapiro, J.M., Brun-Vézinet, F., Clotet, B., Hammer,S.M., Johnson, V.A., Kuritzkes, D.R., Mellors, J.W., Pillay, D., Yeni, P.G., Jacobsen,D.M., Richman, D.D., 2008. Antiretroviral drug resistance testing in adult HIV-1infection: 2008 recommendations of an International AIDS Society-USA panel.Clin. Infect. Dis. 47, 266–285.
Johnson, V.A., Calvez, V., Günthard, H.F., Paredes, R., Pillay, D., Shafer, R., Wensing,A.M., Richman, D.D., 2011. 2011 update of the drug resistance mutations in HIV-1. Top. Antivir. Med. 19, 156–164.
Kantor, R., Machekano, R., Gonzales, M.J., Dupnik, K., Schapiro, J.M., Shafer, R.W.,2001. Human immunodeficiency virus reverse transcriptase and proteasesequence database: an expanded data model integrating natural languagetext and sequence analysis programs. Nucleic Acids Res. 29, 296–299.
Libin, P., Deforche, K., van Laethem, K., Camacho, R.J., Vandamme, A.-M., 2007.Regadb: An open source, community-driven HIV data and analysis managementenvironment. In 13th International Bioinformatics Workshop on VirusEvolution and Molecular Epidemiology, Lisbon, Portugal.
Liu, T.F., Shafer, R.W., 2006. Web resources for HIV type 1 genotypic-resistance testinterpretation. Clin. Infect. Dis. 42, 1608–1618.
Myllymäki, P., Silander, Tomi., Tirri, H., Uronen, P., 2002. B-course: a web-basedtool for Bayesian and causal data analysis. Int. J. Artif. Intel. Tools 11, 369–387.
Shafer, R.W., Schapiro, J.M., 2008. HIV-1 drug resistance mutations: an updatedframework for the second decade of HAART. AIDS Rev. 10, 67–84.
Theys, K., Deforche, K., Beheydt, G., Moreau, Y., van Laethem, K., Lemey, P., Camacho,R.J., Rhee, S.-Y., Shafer, R.W., Van Wijngaerden, E., Vandamme, A.-M., 2010.Estimating the individualized HIV-1 genetic barrier to resistance using anelfinavir fitness landscape. BMC Bioinformatics 11, 409.
Theys, K., Deforche, K., Vercauteren, J., Libin, P., Van de Vijver, D.A.M.C., Albert, J.,Asjö, B., Balotta, C., Bruckova, M., Camacho, R.J., Clotet, B., Coughlan, S.,Grossman, Z., Hamouda, O., Horban, A., Korn, K., Kostrikis, L.G., Kücherer, C.,Nielsen, C., Paraskevis, D., Poljak, M., Puchhammer-Stockl, E., Riva, C., Ruiz, L.,Liitsola, K., Schmit, J.-C., Schuurman, R., Sönnerborg, A., Stanekova, D.,Stanojevic, M., Struck, D., Van Laethem, K., Wensing, A.M., Boucher, C.A.B.,Vandamme, A.-M., 2012. Treatment-associated polymorphisms in protease aresignificantly associated with higher viral load and lower CD4 count in newlydiagnosed drug-naive HIV-1 infected patients. Retrovirology 9, 81.
Van Laethem, K., De Luca, A., Antinori, A., Cingolani, A., Perna, C.F., Vandamme, A.-M., 2002. A genotypic drug resistance interpretation algorithm that significantlypredicts therapy response in HIV-1-infected patients. Antivir. Ther. (Lond.) 7,123–129.
Van Laethem, K., Vandamme, A.-M., 2006. Interpreting resistance data for HIV-1therapy management-know the limitations. AIDS Rev. 8, 37–43.
Vandamme, A.-M., Camacho, R.J., Ceccherini-Silberstein, F., de Luca, A., Palmisano,L., Paraskevis, D., Paredes, R., Poljak, M., Schmit, J.-C., Soriano, V., Walter, H.,Sönnerborg, A., 2011. European recommendations for the clinical use of HIVdrug resistance testing: 2011 update. AIDS Rev. 13, 77–108.
Vercauteren, J., Vandamme, A.-M., 2006. Algorithms for the interpretation of HIV-1genotypic drug resistance information. Antivir. Res. 71, 335–342.
Zazzi, M., Kaiser, R., Sönnerborg, A., Struck, D., Altmann, A., Prosperi, M., Rosen-Zvi,M., Petroczi, A., Peres, Y., Schülter, E., Boucher, C.A, Brun-Vezinet, F., Harrigan,P.R., Morris, L., Obermeier, M., Perno, C.-F., Phanuphak, P., Pillay, D., Shafer, R.W.,Vandamme, A.-Mieke, Van Laethem, K., Wensing, A.M.J., Lengauer, T., Incardona,F., 2011. Prediction of response to antiretroviral therapy by human experts andby the EuResist data-driven expert system (the EVE study). HIV Med. 12, 211–218.