Dissipative Spherical Gravitational Collapse of Isotropic Fluid
Historical Overfishing and the RecentCollapse of Coastal Ecosystems
Jeremy B. C. Jackson,1,2* Michael X. Kirby,3 Wolfgang H. Berger,1 Karen A. Bjorndal,4 Louis W. Botsford,5
Bruce J. Bourque,6 Roger H. Bradbury,7 Richard Cooke,2 Jon Erlandson,8 James A. Estes,9 Terence P. Hughes,10
Susan Kidwell,11 Carina B. Lange,1 Hunter S. Lenihan,12 John M. Pandolfi,13 Charles H. Peterson,12
Robert S. Steneck,14 Mia J. Tegner,1† Robert R. Warner15
Ecological extinction caused by overfishing precedes all other pervasivehuman disturbance to coastal ecosystems, including pollution, degrada-tion of water quality, and anthropogenic climate change. Historical abun-dances of large consumer species were fantastically large in comparisonwith recent observations. Paleoecological, archaeological, and historicaldata show that time lags of decades to centuries occurred between theonset of overfishing and consequent changes in ecological communities,because unfished species of similar trophic level assumed the ecologicalroles of overfished species until they too were overfished or died ofepidemic diseases related to overcrowding. Retrospective data not onlyhelp to clarify underlying causes and rates of ecological change, but theyalso demonstrate achievable goals for restoration and management ofcoastal ecosystems that could not even be contemplated based on thelimited perspective of recent observations alone.
Few modern ecological studies take into ac-count the former natural abundances of largemarine vertebrates. There are dozens of placesin the Caribbean named after large sea turtleswhose adult populations now number in thetens of thousands rather than the tens of mil-lions of a few centuries ago (1, 2). Whales,
manatees, dugongs, sea cows, monk seals, croc-odiles, codfish, jewfish, swordfish, sharks, andrays are other large marine vertebrates that arenow functionally or entirely extinct in mostcoastal ecosystems (3–10). Place names foroysters, pearls, and conches conjure up otherecological ghosts of marine invertebrates thatwere once so abundant as to pose hazards tonavigation (11), but are witnessed now only bymassive garbage heaps of empty shells.
Such ghosts represent a far more profoundproblem for ecological understanding andmanagement than currently realized. Evi-dence from retrospective records stronglysuggests that major structural and functionalchanges due to overfishing (12) occurredworldwide in coastal marine ecosystems overmany centuries. Severe overfishing drivesspecies to ecological extinction because over-fished populations no longer interact signifi-cantly with other species in the community(5). Overfishing and ecological extinctionpredate and precondition modern ecologicalinvestigations and the collapse of marine eco-systems in recent times, raising the possibil-ity that many more marine ecosystems maybe vulnerable to collapse in the near future.
Importance of Historical DataMost ecological research is based on local fieldstudies lasting only a few years and conductedsometime after the 1950s without longer termhistorical perspective (1, 8, 13). Such observa-tions fail to encompass the life-spans of manyecologically important species (13, 14) and crit-ically important environmental disturbancessuch as extreme cyclones or ENSO (El Nino–Southern Oscillation) events (8), as well as
longer term cycles or shifts in oceanographicregimes and productivity (15–17). To help ad-dress this problem, we describe ecosystemstructure predating modern ecological studiesusing well-dated time series based on biological(18, 19), biogeochemical (20, 21), physical(22), and historical (23) proxies that are infor-mative over a variety of spatial scales and bio-geographic realms (24). Although proxies varyin precision and clarity of the signals they mea-sure, the use of multiple proxies that give thesame ecological signal greatly increases confi-dence in results. Precision in age dating variesfrom centuries to a single year, season, or eventin the exceptional case of varved sediments, icecores, and written historical records (25). Pre-cision decreases with the amount of biologicalor physical disturbance to the sediment ana-lyzed (26).
We exploited data from many disciplinesthat span the period over which anthropogen-ic changes may have occurred. Because ourhypothesis is that humans have been disturb-ing marine ecosystems since they firstlearned how to fish, our time periods need tobegin well before the human occupation orEuropean colonization of a coastal region.Broadly, our data fall into four categories andtime periods:
1) Paleoecological records from marinesediments from about 125,000 years ago tothe present, coinciding with the rise of mod-ern Homo sapiens.
2) Archaeological records from humancoastal settlements occupied after about10,000 years before the present (yr B.P.)when worldwide sea level approachedpresent levels. These document human ex-ploitation of coastal resources for food andmaterials by past populations that range fromsmall-scale aboriginal societies to towns, cit-ies, and empires.
3) Historical records from documents,journals, and charts from the 15th century tothe present that document the period from thefirst European trade-based colonial expansionand exploitation in the Americas and theSouth Pacific (23).
4) Ecological records from the scientificliterature over the past century to the presentcovering the period of globalized exploitationof marine resources. These also help to cali-brate the older records.
1Scripps Institution of Oceanography, University ofCalifornia, San Diego, La Jolla, CA 92093–0244, USA.2Center for Tropical Paleoecology and Archeology,Smithsonian Tropical Research Institute, Box 2072,Balboa, Republic of Panama. 3National Center forEcological Analysis and Synthesis, 735 State Street,Suite 300, Santa Barbara, CA 93101, USA. 4ArchieCarr Center for Sea Turtle Research and Departmentof Zoology, University of Florida, Gainesville, FL32611, USA. 5Department of Wildlife, Fish, and Con-servation Biology, University of California, Davis, CA95616, USA. 6Department of Anthropology, 155 Pet-tengill Hall, Bates College, Lewiston, ME 04240, USA.7Centre for Resource and Environmental Studies, Aus-tralian National University, Canberra, ACT 0200, Aus-tralia. 8Department of Anthropology, University ofOregon, Eugene, OR 97403, USA. 9U.S. GeologicalSurvey, A-316 Earth and Marine Sciences Building,University of California, Santa Cruz, CA 95064, USA.10Center for Coral Reef Biodiversity, Department ofMarine Biology, James Cook University, Townsville,QLD 4811, Australia. 11Department of GeophysicalSciences, University of Chicago, 5734 South Ellis Av-enue, Chicago, IL 60637, USA. 12Institute of MarineSciences, University of North Carolina at Chapel Hill,3431 Arendell Street, Morehead City, NC 28557, USA.13Department of Paleobiology, National Museum ofNatural History, Smithsonian Institution, Washington,DC 20560–0121, USA. 14School of Marine Sciences,University of Maine, Darling Marine Center, Orono,ME 04573, USA. 15Department of Ecology, Evolution,and Marine Biology, University of California, SantaBarbara, CA 93106, USA.
*To whom correspondence should be addressed. E-mail: [email protected]†Deceased.
www.sciencemag.org SCIENCE VOL 293 27 JULY 2001 629
E C O L O G Y T H R O U G H T I M E
R E V I E W
on
Janu
ary
3, 2
008
ww
w.s
cien
cem
ag.o
rgD
ownl
oade
d fr
om
Time Periods, Geography, and AnalysisWe recognize three different but overlappingperiods of human impact on marine ecosys-tems: aboriginal, colonial, and global. Ab-original use refers to subsistence exploitationof near-shore, coastal ecosystems by humancultures with relatively simple watercraft andextractive technologies that varied widely inmagnitude and geographic extent. Colonialuse comprises systematic exploitation and de-pletion of coastal and shelf seas by foreign
mercantile powers incorporating distant re-sources into a developing market economy.Global use involves more intense and geo-graphically pervasive exploitation of coastal,shelf, and oceanic fisheries integrated intoglobal patterns of resource consumption, withmore frequent exhaustion and substitution offisheries. In Africa, Europe, and Asia, thesecultural stages are strongly confounded intime and space, so that their differential sig-nificance is difficult to establish. However, in
the Americas, New Zealand, and Australiathe different stages are well separated in time,and the aboriginal and colonial periods beganat different times in the different regions.Thus, we can distinguish between culturalstages, as well as between human impacts andnatural changes due to changing climate.
The addition of a deep historical dimen-sion to analyze and interpret ecological prob-lems requires that we sacrifice some of theapparent precision and analytical eleganceprized by ecologists (1, 13, 14 ). Paleoeco-logical, archaeological, and historical datawere collected for many purposes, vary wide-ly in methods of collection and quality, andare less amenable to many types of statisticalanalysis than well-controlled experiments.But none of these problems outweighs thebenefits of a historical approach. Clearly, wecannot generate realistic null hypothesesabout the composition and dynamics of eco-systems from our understanding of thepresent alone, since all ecosystems have al-most certainly changed due to both humanand natural environmental factors (8, 16, 27,28). Here, we briefly review long-term hu-man impacts in several key marine ecosys-tems. These reconstructions provide insightinto the nature and extent of degraded eco-systems that point to new strategies for mit-igation and restoration that are unlikely toemerge from modern monitoring programs.
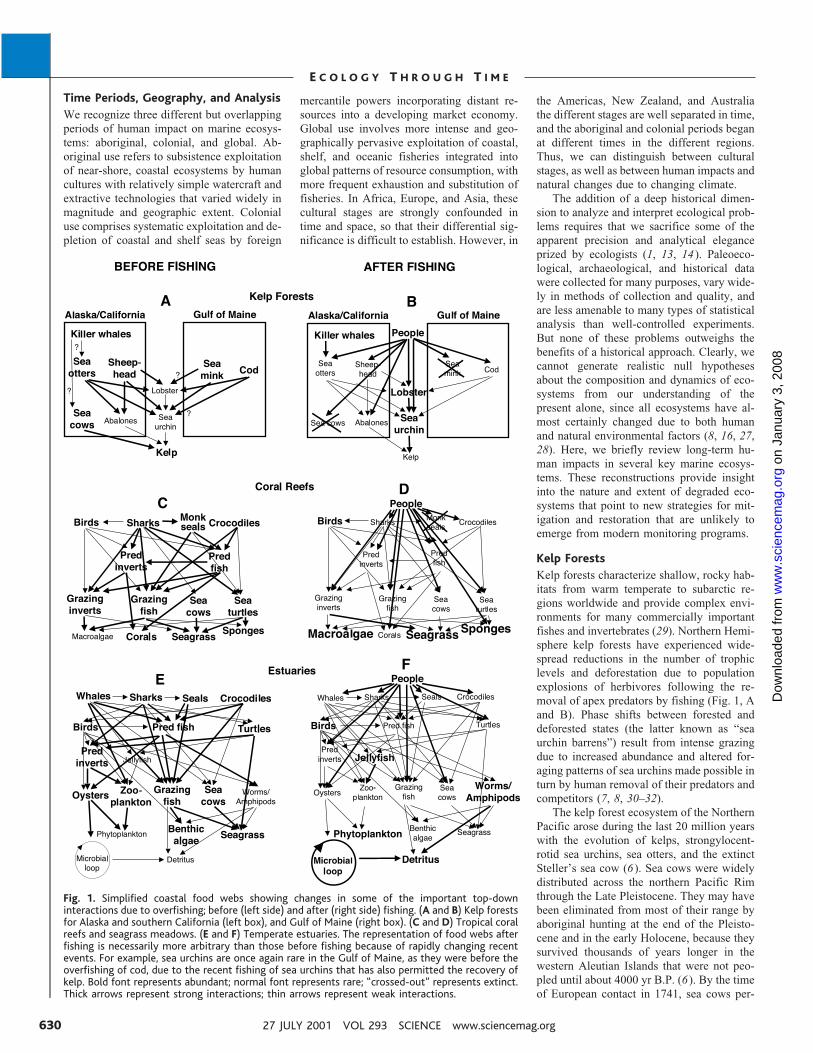
Kelp ForestsKelp forests characterize shallow, rocky hab-itats from warm temperate to subarctic re-gions worldwide and provide complex envi-ronments for many commercially importantfishes and invertebrates (29). Northern Hemi-sphere kelp forests have experienced wide-spread reductions in the number of trophiclevels and deforestation due to populationexplosions of herbivores following the re-moval of apex predators by fishing (Fig. 1, Aand B). Phase shifts between forested anddeforested states (the latter known as “seaurchin barrens”) result from intense grazingdue to increased abundance and altered for-aging patterns of sea urchins made possible inturn by human removal of their predators andcompetitors (7, 8, 30–32).
The kelp forest ecosystem of the NorthernPacific arose during the last 20 million yearswith the evolution of kelps, strongylocent-rotid sea urchins, sea otters, and the extinctSteller’s sea cow (6 ). Sea cows were widelydistributed across the northern Pacific Rimthrough the Late Pleistocene. They may havebeen eliminated from most of their range byaboriginal hunting at the end of the Pleisto-cene and in the early Holocene, because theysurvived thousands of years longer in thewestern Aleutian Islands that were not peo-pled until about 4000 yr B.P. (6 ). By the timeof European contact in 1741, sea cows per-
Fig. 1. Simplified coastal food webs showing changes in some of the important top-downinteractions due to overfishing; before (left side) and after (right side) fishing. (A and B) Kelp forestsfor Alaska and southern California (left box), and Gulf of Maine (right box). (C and D) Tropical coralreefs and seagrass meadows. (E and F) Temperate estuaries. The representation of food webs afterfishing is necessarily more arbitrary than those before fishing because of rapidly changing recentevents. For example, sea urchins are once again rare in the Gulf of Maine, as they were before theoverfishing of cod, due to the recent fishing of sea urchins that has also permitted the recovery ofkelp. Bold font represents abundant; normal font represents rare; “crossed-out” represents extinct.Thick arrows represent strong interactions; thin arrows represent weak interactions.
27 JULY 2001 VOL 293 SCIENCE www.sciencemag.org630
E C O L O G Y T H R O U G H T I M E
on
Janu
ary
3, 2
008
ww
w.s
cien
cem
ag.o
rgD
ownl
oade
d fr
om

sisted only in the Commander Islands, theonly islands of the Aleutians unoccupied byaboriginal people. European fur traders killedthe last sea cow 27 years later in 1768. Wehave no idea to what extent abundant seacows grazed kelp forests, although their ap-parent inability to dive deeply probably lim-ited their grazing to the surface canopy ofkelps and to seaweeds lining the shore (6 ).
Northern Pacific kelp forests presum-ably flourished before human settlementbecause predation by sea otters on sea ur-chins prevented the urchins from overgraz-ing kelp (30). Aboriginal Aleuts greatlydiminished sea otters beginning around2500 yr B.P., with a concomitant increasein the size of sea urchins (31). Fur traderssubsequently hunted otters to the brink ofextinction in the 1800s with the attendantcollapse of kelp forests grazed away by seaurchins released from sea otter predation.Legal protection of sea otters in the 20thcentury partially reversed this scenario.However, kelp forests are again being de-pleted in areas of Alaska because of in-creased predation on sea otters by killerwhales (33). The whales shifted their diet tosea otters from seals and sea lions, whichare in drastic decline.
A similar sequence of events occurred inkelp forests of the Gulf of Maine (7, 34 ). Seaotters were never present, but Atlantic codand other large ground fish are voraciouspredators of sea urchins. These fishes keptsea urchin populations small enough to allowpersistence of kelp forests despite intensiveaboriginal and early European hook-and-linefishing for at least 5000 years. New mecha-nized fishing technology in the 1920s set offa rapid decline in numbers and body size ofcoastal cod in the Gulf of Maine (7 ) (Fig. 2Aand Table 1) that has extended offshore toGeorges Bank (35). Formerly dominant pred-atory fish are now ecologically extinct andhave been partially replaced by smaller andcommercially less important species. Lob-sters, crabs, and sea urchins rose in abun-dance accordingly (7 ). Kelp forests disap-peared with the rise in sea urchins due toremoval of predatory fish, and then reap-peared when sea urchins were in turn reducedto low abundance by fishing.
The more diverse food web of southernCalifornia kelp forests historically includedspiny lobsters and large sheephead labrid fishin addition to sea otters as predators of seaurchins, as well as numerous species of aba-lone that compete with sea urchins for kelps(Fig. 1, A and B) (36 ). Aboriginal exploita-tion began about 10,000 yr B.P. and mayhave had local effects on kelp communities(37 ). The fur trade effectively eliminated seaotters by the early 1800s (38), but kelp forestsdid not begin to disappear on a large scaleuntil the intense exploitation and ecological
extinction of sheephead, spiny lobsters, andabalone starting in the 1950s (8, 36 ) (Table 1and Fig. 1, A and B). Subsequent fishing ofthe largest sea urchin species in the 1970s and1980s resulted in the return of well-devel-oped kelp forests in many areas that, as in theGulf of Maine, effectively lack trophic levelshigher than that of primary producers (36,39).
Coral ReefsCoral reefs are the most structurally complexand taxonomically diverse marine ecosys-tems, providing habitat for tens of thousandsof associated fishes and invertebrates (40).Aboriginal fishing in coral reef environmentsbegan at least 35,000 to 40,000 years ago inthe western Pacific (41) but appears to havehad limited ecological impact. Recently, cor-al reefs have experienced dramatic phaseshifts in dominant species due to intensifiedhuman disturbance beginning centuries ago(1) (Fig. 1, C and D). The effects are mostpronounced in the Caribbean (42) but are alsoapparent on the Great Barrier Reef in Austra-lia despite extensive protection over the pastthree decades (43).
Large species of branching Acropora cor-als dominated shallow reefs in the tropicalwestern Atlantic for at least half a millionyears (44–46 ) until the 1980s when theydeclined dramatically (42, 47 ) (Fig. 2B and
Table 1). Patterns of community membershipand dominance of coral species were alsohighly predictable (44 ), so that there is a clearbaseline of pristine coral community compo-sition before human impact.
Western Atlantic reef corals suffered sud-den, catastrophic mortality in the 1980s dueto overgrowth by macroalgae that explodedin abundance after mass mortality of the su-perabundant sea urchin Diadema antillarumthat was the last remaining grazer of macroal-gae (42, 47 ). Early fisheries reports suggestthat large herbivorous fishes were alreadyrare before the 20th century (48). However,macroalgae were held in check until the lastmajor herbivore, Diadema, was lost from thesystem through disease (42, 47 ).
Corals on the Great Barrier Reef haveexperienced recurrent mass mortality since1960 due to spectacular outbreaks of thecrown-of-thorns starfish Acanthaster plancithat feeds on coral (49). The causes of out-breaks are controversial, but they are almostcertainly new phenomena. There are no earlyrecords of Acanthaster in undisturbed fossildeposits, in aboriginal folklore, or in accountsof European explorers and fishers. Now, inrecent decades, the frequency and intensity ofoutbreaks have exceeded the capability oflonger lived species to recover as outbreakshave become more chronic than episodic(50).
Fig. 2. Retrospective data showing baselinesbefore ecosystem collapse. (A) Time series ofmean body length of Atlantic cod from kelpforests in the coastal Gulf of Maine. The earlierfive data points are derived from archaeologicalrecords, whereas the last three points are fromfisheries data (113). Vertical bars represent thestandard error. Horizontal bars represent thetime range of data for a single interval ofobservations. (B) Paleoecological and ecologicaldata showing the percentage of Caribbean lo-calities with Acropora palmata (Œ) or A. cervi-cornis (■) as the dominant shallow-water coralin the Late Pleistocene, Holocene, before 1983,and after 1983 (114). Percentages of localitiesare significantly different over the four timeperiods for A. palmata (�2 � 34.0, P �0.0001,df � 3) and A. cervicornis (�2 � 22.4, P�0.0001, df � 3). Vertical and horizontal barsare as in (A). (C) Paleoecological and fisheriesdata from Chesapeake Bay showing the ratioin abundance of planktonic to benthic dia-toms (dotted line) (77) and landings of theoyster Crassostrea virginica (solid line) (80).The planktonic to benthic diatom ratio is aproxy for eutrophication that shows the rel-ative amount of planktonic to benthic prima-ry production (77). For over 1200 years thisratio remained fairly constant at about 1:1,but then increased threefold coincidentallywith increased runoff of sediments and nutrients due to European agriculture after 1750. Theratio remained at about 3 :1 between 1830 and 1930, after which it increased dramatically toabout 8 :1. Oyster landings show an initial increase in the early 19th century, peak in 1884, andsubsequent collapse as deep channel reefs were destroyed by mechanical dredging (80). Thesedata strongly imply that oysters were able to limit the potential for eutrophication induced byincreased inputs of nutrients between 1750 and 1930 until oyster populations collapsed as aresult of overfishing.
www.sciencemag.org SCIENCE VOL 293 27 JULY 2001 631
E C O L O G Y T H R O U G H T I M E
on
Janu
ary
3, 2
008
ww
w.s
cien
cem
ag.o
rgD
ownl
oade
d fr
om
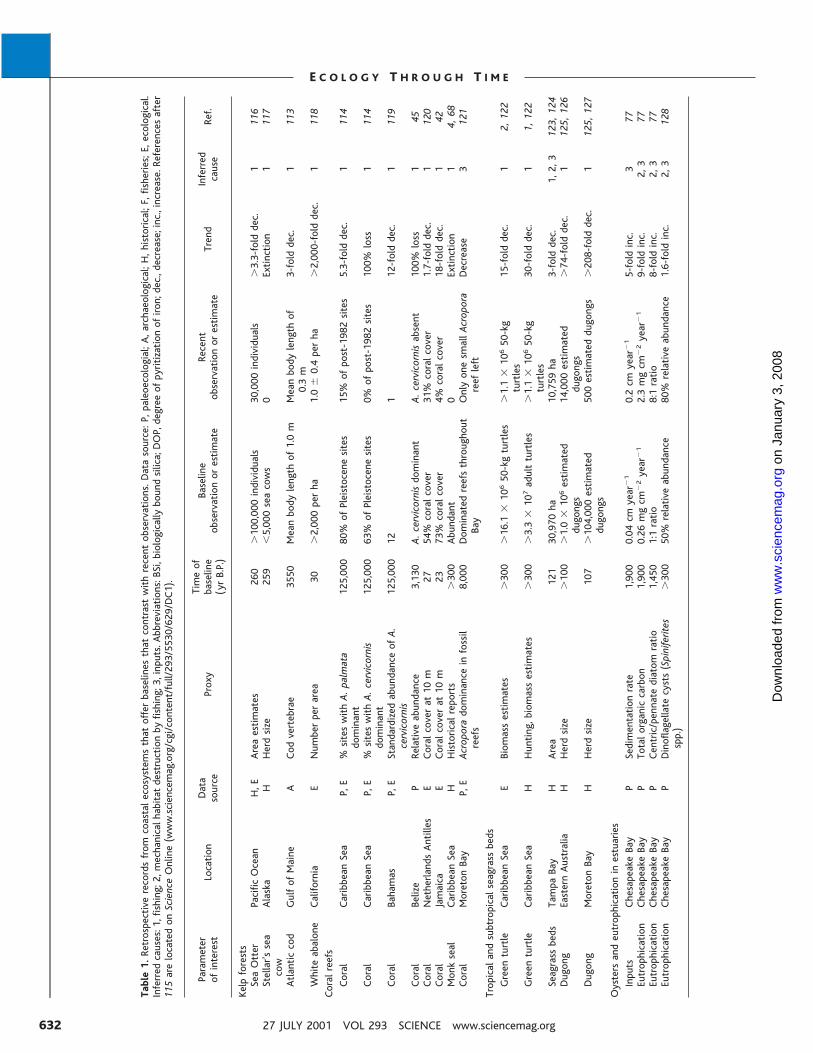
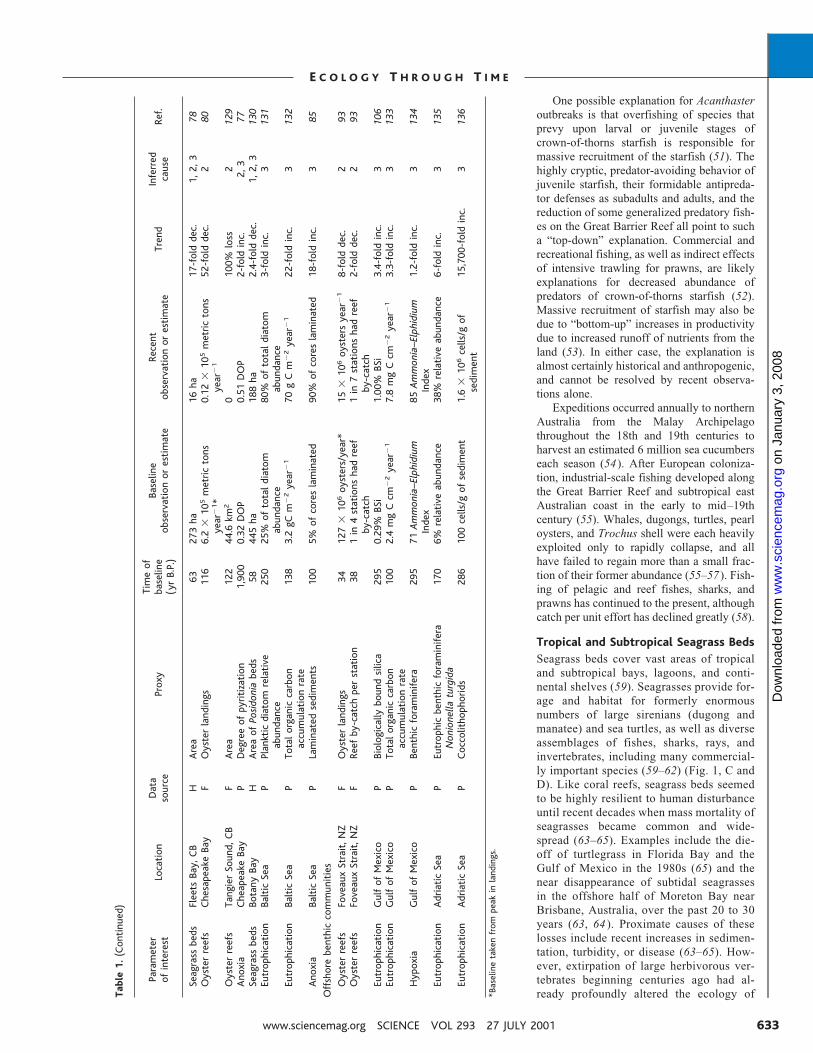
Table1.Retrospectiverecordsfromcoastalecosystemsthatofferbaselinesthatcontrastwithrecentobservations.Datasource:P,paleoecologial;A,archaeological;H,historical;F,fisheries;E,ecological.
Inferredcauses:1,fishing;2,mechanicalhabitatdestructionbyfishing;3,inputs.Abbreviations:BSi,biologicallyboundsilica;DOP,degreeofpyritizationofiron;dec.,decrease;inc.,increase.Referencesafter
115arelocatedonScienceOnline(www.sciencemag.org/cgi/content/full/293/5530/629/DC1).
Parameter
ofinterest
Location
Data
source
Proxy
Timeof
baseline
(yrB.P.)
Baseline
observationorestimate
Recent
observationorestimate
Trend
Inferred
cause
Ref.
Kelpforests
SeaOtter
PacificOcean
H,E
Areaestimates
260
�100,000individuals
30,000individuals
�3.3-folddec.
1116
Stellar’ssea
cow
Alaska
HHerdsize
259
�5,000seacows
0Extinction
1117
Atlanticcod
GulfofMaine
ACodvertebrae
3550
Meanbodylengthof1.0m
Meanbodylengthof
0.3m
3-folddec.
1113
WhiteabaloneCalifornia
ENumberperarea
30�2,000perha
1.0
�0.4perha
�2,000-folddec.
1118
Coralreefs
Coral
CaribbeanSea
P,E
%siteswithA.palmata
dominant
125,00080%ofPleistocenesites
15%ofpost-1982sites
5.3-folddec.
1114
Coral
CaribbeanSea
P,E
%siteswithA.cervicornis
dominant
125,00063%ofPleistocenesites
0%ofpost-1982sites
100%loss
1114
Coral
Bahamas
P,E
StandardizedabundanceofA.
cervicornis
125,00012
112-folddec.
1119
Coral
Belize
PRelativeabundance
3,130
A.cervicornisdominant
A.cervicornisabsent
100%loss
145
Coral
NetherlandsAntilles
ECoralcoverat10m
2754%coralcover
31%coralcover
1.7-folddec.
1120
Coral
Jamaica
ECoralcoverat10m
2373%coralcover
4%coralcover
18-folddec.
142
Monkseal
CaribbeanSea
HHistoricalreports
�300
Abundant
0Extinction
14,68
Coral
MoretonBay
P,E
Acroporadominanceinfossil
reefs
8,000
Dominatedreefsthroughout
Bay
OnlyonesmallAcropora
reefleft
Decrease
3121
Tropicalandsubtropicalseagrassbeds
Greenturtle
CaribbeanSea
EBiomassestimates
�300
�16.1
�10650-kgturtles
�1.1
�10650-kg
turtles
15-folddec.
12,122
Greenturtle
CaribbeanSea
HHunting,biomassestimates
�300
�3.3
�107adultturtles
�1.1
�10650-kg
turtles
30-folddec.
11,122
Seagrassbeds
TampaBay
HArea
121
30,970ha
10,759ha
3-folddec.
1,2,3
123,124
Dugong
EasternAustralia
HHerdsize
�100
�1.0
�106estimated
dugongs
14,000estimated
dugongs
�74-folddec.
1125,126
Dugong
MoretonBay
HHerdsize
107
�104,000estimated
dugongs
500estimateddugongs
�208-folddec.
1125,127
Oystersandeutrophicationinestuaries
Inputs
ChesapeakeBay
PSedimentationrate
1,900
0.04cmyear
�1
0.2cmyear
�1
5-foldinc.
377
Eutrophication
ChesapeakeBay
PTotalorganiccarbon
1,900
0.26mgcm
�2year
�1
2.3mgcm
�2year
�1
9-foldinc.
2,3
77Eutrophication
ChesapeakeBay
PCentric/pennatediatomratio
1,450
1:1ratio
8:1ratio
8-foldinc.
2,3
77Eutrophication
ChesapeakeBay
PDinoflagellatecysts(Spiniferites
spp.)
�300
50%relativeabundance
80%relativeabundance
1.6-foldinc.
2,3
128
27 JULY 2001 VOL 293 SCIENCE www.sciencemag.org632
E C O L O G Y T H R O U G H T I M E
on
Janu
ary
3, 2
008
ww
w.s
cien
cem
ag.o
rgD
ownl
oade
d fr
om
One possible explanation for Acanthasteroutbreaks is that overfishing of species thatprevy upon larval or juvenile stages ofcrown-of-thorns starfish is responsible formassive recruitment of the starfish (51). Thehighly cryptic, predator-avoiding behavior ofjuvenile starfish, their formidable antipreda-tor defenses as subadults and adults, and thereduction of some generalized predatory fish-es on the Great Barrier Reef all point to sucha “top-down” explanation. Commercial andrecreational fishing, as well as indirect effectsof intensive trawling for prawns, are likelyexplanations for decreased abundance ofpredators of crown-of-thorns starfish (52).Massive recruitment of starfish may also bedue to “bottom-up” increases in productivitydue to increased runoff of nutrients from theland (53). In either case, the explanation isalmost certainly historical and anthropogenic,and cannot be resolved by recent observa-tions alone.
Expeditions occurred annually to northernAustralia from the Malay Archipelagothroughout the 18th and 19th centuries toharvest an estimated 6 million sea cucumberseach season (54 ). After European coloniza-tion, industrial-scale fishing developed alongthe Great Barrier Reef and subtropical eastAustralian coast in the early to mid–19thcentury (55). Whales, dugongs, turtles, pearloysters, and Trochus shell were each heavilyexploited only to rapidly collapse, and allhave failed to regain more than a small frac-tion of their former abundance (55–57 ). Fish-ing of pelagic and reef fishes, sharks, andprawns has continued to the present, althoughcatch per unit effort has declined greatly (58).
Tropical and Subtropical Seagrass BedsSeagrass beds cover vast areas of tropicaland subtropical bays, lagoons, and conti-nental shelves (59). Seagrasses provide for-age and habitat for formerly enormousnumbers of large sirenians (dugong andmanatee) and sea turtles, as well as diverseassemblages of fishes, sharks, rays, andinvertebrates, including many commercial-ly important species (59–62) (Fig. 1, C andD). Like coral reefs, seagrass beds seemedto be highly resilient to human disturbanceuntil recent decades when mass mortality ofseagrasses became common and wide-spread (63–65). Examples include the die-off of turtlegrass in Florida Bay and theGulf of Mexico in the 1980s (65) and thenear disappearance of subtidal seagrassesin the offshore half of Moreton Bay nearBrisbane, Australia, over the past 20 to 30years (63, 64 ). Proximate causes of theselosses include recent increases in sedimen-tation, turbidity, or disease (63–65). How-ever, extirpation of large herbivorous ver-tebrates beginning centuries ago had al-ready profoundly altered the ecology ofT
able1.(Continued)
Parameter
ofinterest
Location
Data
source
Proxy
Timeof
baseline
(yrB.P.)
Baseline
observationorestimate
Recent
observationorestimate
Trend
Inferred
cause
Ref.
Seagrassbeds
FleetsBay,CB
HArea
63273ha
16ha
17-folddec.
1,2,3
78Oysterreefs
ChesapeakeBay
FOysterlandings
116
6.2
�105metrictons
year
�1*
0.12
�105metrictons
year
�1
52-folddec.
280
Oysterreefs
TangierSound,CB
FArea
122
44.6km2
0100%loss
2129
Anoxia
CheapeakeBay
PDegreeofpyritization
1,900
0.32DOP
0.51DOP
2-foldinc.
2,3
77Seagrassbeds
BotanyBay
HAreaofPosidoniabeds
58445ha
188ha
2.4-folddec.
1,2,3
130
Eutrophication
BalticSea
PPlankticdiatomrelative
abundance
250
25%oftotaldiatom
abundance
80%oftotaldiatom
abundance
3-foldinc.
3131
Eutrophication
BalticSea
PTotalorganiccarbon
accumulationrate
138
3.2gCm
�2year
�1
70gCm
�2year
�1
22-foldinc.
3132
Anoxia
BalticSea
PLaminatedsediments
100
5%ofcoreslaminated
90%ofcoreslaminated
18-foldinc.
385
Offshorebenthiccommunities
Oysterreefs
FoveauxStrait,NZ
FOysterlandings
34127
�106oysters/year*
15�106oystersyear
�18-folddec.
293
Oysterreefs
FoveauxStrait,NZ
FReefby-catchperstation
381in4stationshadreef
by-catch
1in7stationshadreef
by-catch
2-folddec.
293
Eutrophication
GulfofMexico
PBiologicallyboundsilica
295
0.29%BSi
1.00%BSi
3.4-foldinc.
3106
Eutrophication
GulfofMexico
PTotalorganiccarbon
accumulationrate
100
2.4mgCcm
�2year
�1
7.8mgCcm
�2year
�1
3.3-foldinc.
3133
Hypoxia
GulfofMexico
PBenthicforaminifera
295
71Ammonia–Elphidium
Index
85Ammonia–Elphidium
Index
1.2-foldinc.
3134
Eutrophication
AdriaticSea
PEutrophicbenthicforaminifera
Nonionellaturgida
170
6%relativeabundance
38%relativeabundance
6-foldinc.
3135
Eutrophication
AdriaticSea
PCoccolithophorids
286
100cells/gofsediment
1.6
�106cells/gof
sediment
15,700-foldinc.
3136
*Baselinetakenfrompeakinlandings.
www.sciencemag.org SCIENCE VOL 293 27 JULY 2001 633
E C O L O G Y T H R O U G H T I M E
on
Janu
ary
3, 2
008
ww
w.s
cien
cem
ag.o
rgD
ownl
oade
d fr
om

seagrass beds in ways that increased theirvulnerability to recent events.
Vast populations of very large green turtleswere eliminated from the Americas before the19th century (1, 2) (Table 1). Formerly greatpopulations of green turtles in Moreton Bay,Australia, also were greatly reduced by theearly 20th century (66). Moreover, there are noestimates of abundances of turtles in Australiaat the dawn of European exploitation, so thatreported reductions must be only a small frac-tion of the total numbers lost. All turtle speciescontinue to decline at unsustainable rates alongthe Great Barrier Reef today (67).
Abundant green turtles closely cropturtlegrass and greatly reduce the flux oforganic matter and nutrients to sediments(59–62, 68). In the near absence of greenturtles today, turtlegrass beds grow longerblades that baffle currents, shade the bot-tom, start to decompose in situ, and providesuitable substrate for colonization by theslime molds that cause turtlegrass wastingdisease (65). Deposition within the beds ofvastly more plant detritus also fuels micro-bial populations, increases the oxygen de-mand of sediments, and promotes hypoxia(65). Thus, all the factors that have beenlinked with recent die-off of turtlegrassbeds in Florida Bay (65), except for chang-es in temperature and salinity, can be at-tributed to the ecological extinction ofgreen turtles (27 ).
European colonists did not exploit tropicalAmerican manatees as systematically as theyexploited green turtles, so the data related tofisheries are poor. We know, however, thatmanatees were extensively fished by aboriginalpeople and by early colonists (68). In Australia,aboriginal people also harvested dugongs ex-tensively long before European colonization(3), yet the numbers reported by early colonistswere vast. Three- or four-mile-long herds com-prising tens of thousands of large individualswere observed in Wide Bay in about 1870 (69)and in Moreton Bay as recently as 1893 (70).Widespread colonial exploitation of dugongsfor their flesh and oil along the southernQueensland coast resulted in the crash of thedugong fishery by the beginning of the 20thcentury (3) (Table 1). Ironically, scientists re-cently reported the “discovery of a large popu-lation” of dugongs in Moreton Bay—a mere300 individuals (71). Further north, numbers ofdugongs in the vast southern half of the GreatBarrier Reef had dwindled to fewer than 4000when they were first accurately counted in1986–87, with a further 50 to 80% decline inrecent years (72). These increasingly fragment-ed populations represent the last remnants ofthe vast herds of the early 19th century andbefore.
The ecological implications of these re-ductions are at least as impressive as those forgreen turtles. Moderate sized herds of dug-
ongs remove up to 96% of above-groundbiomass and 71% of below-ground biomassof seagrasses (73). Their grazing rips up largeareas of seagrass beds, providing space forcolonization by competitively inferior speciesof seagrasses. Dugong grazing also producesmassive amounts of floating debris and dungthat are exported to adjacent ecosystems. Thedecline in seagrasses in Moreton Bay is cer-tainly due in large part to the dramatic declinein water quality due to eutrophication andrunoff of sediment (63, 64 ). Nevertheless, asnoted for green turtles and turtlegrass in Flor-ida Bay, the cessation of systematic plowingof the bay floor by once abundant dugongsmust also have been a major factor.
Oysters and Eutrophication inEstuariesTemperate estuaries worldwide are undergo-ing profound changes in oceanography andecology due to human exploitation and pol-lution, rendering them the most degraded ofmarine ecosystems (74–76 ) (Fig. 1, E and F).The litany of changes includes increased sed-imentation and turbidity (77 ); enhanced epi-sodes of hypoxia or anoxia (74, 75, 77 ); lossof seagrasses (78) and dominant suspensionfeeders (79), with a general loss of oyster reefhabitat (80); shifts from ecosystems oncedominated by benthic primary production tothose dominated by planktonic primary pro-duction (77 ); eutrophication (74–76 ) and en-hanced microbial production (81); and higherfrequency and duration of nuisance algal andtoxic dinoflagellate blooms (82, 83), out-breaks of jellyfish (79), and fish kills (83).Most explanations for these phenomena em-phasize “bottom-up” increases in nutrientslike nitrogen and phosphorus as causes ofphytoplankton blooms and eutrophication(74–76 ), an interpretation consistent with therole of estuaries as the focal point and sewerfor many land-based, human activities. Nev-ertheless, long-term records demonstrate thatreduced “top-down” control resulting fromlosses in benthic suspension feeders predatedeutrophication.
The oldest and longest records come fromcores in sediments from Chesapeake Bay(77 ) and Pamlico Sound (84 ) in the easternUnited States and from the Baltic Sea (85)that extend back as far as 2500 yr B.P. (Fig.2C and Table 1). A general sequence ofecological change is apparent in all threecases, but the timing of specific ecologicaltransitions differs among estuaries in keepingwith their unique histories of land use, ex-ploitation, and human population growth—adifference that rules out a simple climaticexplanation. Increased sedimentation andburial of organic carbon began in the mid–18th century in Chesapeake Bay, coincidentwith widespread land clearance for agricul-ture by European colonists (77 ). The main
ecological response was a gradual shift in thetaxa responsible for primary production thatbegan in the late 18th century. Seagrasses andbenthic diatoms on the bay floor declined,while planktonic diatoms and other phyto-plankton in the water column corresponding-ly increased. However, anoxia and hypoxiawere not widespread until the 1930s whenphytoplankton populations and the flux oforganic matter to the bay floor increaseddramatically with concomitant loss of benthicfauna (75, 77 ) (Fig. 2C and Table 1). Similarchanges began in the 1950s in the Baltic Sea,with widespread expansion of the extent ofanoxic laminated sediments (74, 85), and inthe 1950s to 1970s in Pamlico Sound (84 ).
Vast oyster reefs were once prominentstructures in Chesapeake Bay (11), wherethey may have filtered the equivalent of theentire water column every 3 days (79). De-spite intensive harvesting by aboriginal andearly colonial populations spanning severalmillennia, it was not until the introduction ofmechanical harvesting with dredges in the1870s that deep channel reefs were seriouslyaffected (79, 80). Oyster catch was rapidlyreduced to a few percent of peak values bythe early 20th century (79, 80) (Fig. 2C andTable 1). Only then, after the oyster fisheryhad collapsed, did hypoxia, anoxia, and othersymptoms of eutrophication begin to occur inthe 1930s (75, 77 ), and outbreaks of oysterparasites became prevalent only in the1950s (80). Thus, fishing explains the bulkof the decline, whereas decline in waterquality and disease were secondary factors(80). However, now that oyster reefs aredestroyed, the effects of eutrophication,disease, hypoxia, and continued dredginginteract to prevent the recovery of oystersand associated communities (86 ). Field ex-periments in Pamlico Sound demonstratethat oysters grow well, survive to maturity,and resist oyster disease when elevatedabove the zone of summer hypoxia— evenin the presence of modern levels of eu-trophication and pollution (87 ).
Overfishing of oysters to the point of eco-logical extinction is just one example in ageneral pattern of removal of species capableof top-down control of community structurein estuaries. Dense populations of oysters andother suspension-feeding bivalves grazeplankton so efficiently that they limit bloomsof phytoplankton and prevent symptoms ofeutrophication (88, 89), just as occurs withgrazing by zooplankton in freshwater ecosys-tems (90). The ecological consequences ofuncounted other losses are unknown. Graywhales (now extinct in the Atlantic), dol-phins, manatees, river otters, sea turtles, alli-gators, giant sturgeon, sheepshead, sharks,and rays were all once abundant inhabitantsof Chesapeake Bay but are now virtuallyeliminated.
27 JULY 2001 VOL 293 SCIENCE www.sciencemag.org634
E C O L O G Y T H R O U G H T I M E
on
Janu
ary
3, 2
008
ww
w.s
cien
cem
ag.o
rgD
ownl
oade
d fr
om

Offshore Benthic CommunitiesContinental shelves cover more of the oceanfloor than all previously discussed environ-ments combined. Commercially importantcod, halibut, haddock, turbot, flounder,plaice, rays, and a host of other ground fishes,scallops, cockles, and oysters have beenfished intensively for centuries from conti-nental shelves of Europe and North America,and more recently throughout the world (5, 7,10, 91). Hook-and-line fishing was replacedby intensive use of the beam trawl during the18th century, and industrialized fishing wasfurther intensified with the advent of largesteam- and diesel-powered vessels and theotter trawl at the end of the 19th century.Reports of severely depleted fish stocks andshifting of fishing grounds farther and fartherfrom home ports into the North Sea and theouter Grand Banks were commonplace by thebeginning of the 19th century. Scientific in-vestigation consistently lagged behind eco-nomic realities of depleted stocks and inexo-rable exploitation of more-distant fishinggrounds. As late as 1883, Thomas Huxleyclaimed that fish stocks were inexhaustible(92), a view discredited by the beginning ofthe 20th century (5). Today, several formerlyabundant, large fish as well as formerly denseassemblages of suspension feeders are eco-logically extinct over vast areas (7–10, 93).
The Primacy of Overfishing in HumanDisturbance to Marine EcosystemsOverfishing of large vertebrates and shellfishwas the first major human disturbance to allcoastal ecosystems examined (Table 1). Eco-logical changes due to overfishing are strik-ingly similar across ecosystems despite theobvious differences in detail (Fig. 1, A to F).Everywhere, the magnitude of losses wasenormous in terms of biomass and abundanceof large animals that are now effectively ab-sent from most coastal ecosystems world-wide. These changes predated ecological in-vestigations and cannot be understood exceptby historical analysis. Their timing in theAmericas and Pacific closely tracks Europeancolonization and exploitation in most cases.However, aboriginal overfishing also had ef-fects, as exemplified by the decline of seaotters (and possibly sea cows) in the northeastPacific thousands of years ago.
There are three important corollaries tothe primacy of overfishing. The first is thatpollution, eutrophication, physical destruc-tion of habitats, outbreaks of disease, inva-sions of introduced species, and human-induced climate change all come much laterthan overfishing in the standard sequenceof historical events (Fig. 3). The patternholds regardless of the initial timing ofcolonial overfishing that began in theAmericas in the 16th and 17th centuries andin Australia and New Zealand in the 19th
century. The full sequence of events is mostcharacteristic of temperate estuaries likeChesapeake Bay. Not all the human distur-bances illustrated in Fig. 3 have affected allecosystems yet. But wherever these eventshave occurred, the standard chronologicalsequence of human disturbance and modi-fication of ecosystems is recognizable.
The second important corollary is thatoverfishing may often be a necessary precon-dition for eutrophication, outbreaks of dis-ease, or species introductions to occur (27 ).For example, eutrophication and hypoxia didnot occur in Chesapeake Bay until the 1930s,nearly two centuries after clearing of land foragriculture greatly increased runoff of sedi-ments and nutrients into the estuary (77 ).Suspension feeding by still enormous popu-lations of oysters was sufficient to removemost of the increased production of phyto-plankton and enhanced turbidity until me-chanical harvesting progressively decimatedoyster beds from the 1870s to the 1920s (77,80) (Fig. 2C).
The consequences of overfishing for out-breaks of disease in the next lower trophic levelfall into two categories. The most straightfor-ward is that populations in the lower levelbecome so dense that they are much moresusceptible to disease as a result of greatlyincreased rates of transmission (94). This waspresumably the case for the sea urchin Diademaon Caribbean reefs and the seagrass Thalassiain Florida Bay. In contrast, among oysters dis-ease did not become important in ChesapeakeBay until oysters had been reduced to a fewpercent of their original abundance (80), a pat-tern repeated in Pamlico Sound (86, 87) andFoveaux Strait, New Zealand (93). Two factorsmay be responsible. First, oysters may havebecome less fit owing to stresses like hypoxiaor sedimentation, making them less resistant todisease (87). Alternatively, suspension feedingby dense populations of oysters and associatedspecies on oyster reefs may have indirectlylimited populations of pathogens by favoringother plankton—an explanation that may ex-tend to blooms of toxic plankton and most other
outbreaks of microbial populations (88).The third important corollary is that
changes in climate are unlikely to be theprimary reason for microbial outbreaks anddisease. The rise of microbes has occurred atdifferent times and under different climaticconditions in different places, as exemplifiedby the time lag between events in ChesapeakeBay and Pamlico Sound (77, 79, 80, 84 ).Anthropogenic climate change may now bean important confounding factor, but it wasnot the original cause. Rapid expansion ofintroduced species in recent decades (95)may have a similar explanation, in addition toincrease in frequency and modes of transport.Massive removal of suspension feeders, graz-ers, and predators must inevitably leave ma-rine ecosystems more vulnerable to invasion(96, 97 ).
Synergistic Effects of HumanDisturbanceEcological extinction of entire trophic levelsmakes ecosystems more vulnerable to othernatural and human disturbances such as nu-trient loading and eutrophication, hypoxia,disease, storms, and climate change. Expan-sion and intensification of different forms ofhuman disturbance and their ecological ef-fects on coastal ecosystems have increasedand accelerated with human populationgrowth, unchecked exploitation of biologicalresources, technological advance, and the in-creased geographic scale of exploitationthrough globalization of markets. Moreover,the effects are synergistic, so that the wholeresponse is much greater than the sum ofindividual disturbances (98). This is perhapsmost apparent in the rise of eutrophication,hypoxia, and the outbreak of toxic bloomsand disease following the destruction of oys-ter reefs by mechanical harvesting of oysters(79, 80, 86 ). Other possible examples areoutbreaks of seagrass wasting disease due tothe removal of grazers of seagrasses like thegreen turtle (27 ).
A striking feature of such synergistic effectsis the suddenness of the transition in abundance
Fig. 3. Historical se-quence of human distur-bances affecting coastalecosystems. Fishing (step1) always preceded otherhuman disturbance in allcases examined. This isthe basis for our hypoth-esis of the primacy ofoverfishing in the deterio-ration of coastal ecosys-tems worldwide. Subse-quent steps 2 through 5have not been observed inevery example and mayvary in order.
www.sciencemag.org SCIENCE VOL 293 27 JULY 2001 635
E C O L O G Y T H R O U G H T I M E
on
Janu
ary
3, 2
008
ww
w.s
cien
cem
ag.o
rgD
ownl
oade
d fr
om

of different kinds of organisms and com-munity composition due to threshold ef-fects (99). Ecological diversity and redun-dancy within trophic levels is probably themost important reason for the delay or timelag between the onset of fishing and thesubsequent threshold response (42, 100).The importance of biodiversity in the formof ecological redundancy is clearly appar-ent for the delay in the collapse of kelpforests in southern California comparedwith Alaska after the extirpation of seaotters. Sheephead fish, spiny lobsters, andabalone in the more diverse Californiankelp forests kept sea urchin populations incheck until these predators and competitorsof sea urchins had also been effectivelyeliminated (8, 36 ). Similarly, the sea urchinDiadema kept macroalgae in check longafter the extreme overfishing of herbivo-rous fishes on Caribbean coral reefs (42).
A second potentially important mecha-nism for the suddenness of ecosystem col-lapse is the elimination of previously un-fished refuges that were protected historicallybecause of distance or expense of access. Forexample, reef fishes all around Jamaica in the1960s rarely reached reproductive maturityso that the abundant recruits of fishes onJamaican reefs at that time must have comefrom undiscovered populations in Jamaica orelsewhere (101). But as more and more reefshave been overfished, the potential sources ofsuch recruits must have effectively disap-peared over wider areas (102). A similar sce-nario has been proposed for the Americanlobster with regard to loss of larvae fromdeep-water offshore stocks (103).
Microbialization of the Global CoastalOceanMost recent changes to coastal marine eco-systems subsequent to overfishing involvepopulation explosions of microbes responsi-ble for increasing eutrophication (74–76, 81),diseases of marine species (104 ), toxicblooms (82, 83), and even diseases such ascholera that affect human health (104, 105).Chesapeake Bay (81) and the Baltic Sea (74 )are now bacterially dominated ecosystemswith a trophic structure totally different fromthat of a century ago. Microbial dominationalso has expanded to the open ocean off themouth of the Mississippi River (106 ) and tothe Adriatic Sea (107 ).
Nowhere is the lack of historical perspec-tive more damaging to scientific understand-ing than for microbial outbreaks. Plans forremediation of eutrophication of estuaries arestill based on the belief that eutrophication iscaused only by increased nutrients withoutregard to overfishing of suspension feeders.Even more remarkable is the attribution ofthe rise in marine diseases to climate changeand pollution (104 ) without regard to the
pervasive removal of higher trophic levelsand the asynchronous outbreaks of disease indifferent ecosystems that belie a simple cli-matic explanation.
Historical Perspectives for EcosystemRestorationThe characteristic sequence of human distur-bance to marine ecosystems (Fig. 3) providesa framework for remediation and restorationthat is invisible without a historical perspec-tive. More specific paleoecological, archaeo-logical, and historical data should be obtainedto refine the histories of specific ecosystemsand as a tool for management, but the overallpatterns are clear. The historical magnitudesof losses of large animals and oysters were sogreat as to seem unbelievable based on mod-ern observations alone (Table 1). Even seem-ingly gloomy estimates of the global percent-age of fish stocks that are overfished (108)are almost certainly far too low. The shiftingbaseline syndrome is thus even more insidi-ous and ecologically widespread than is com-monly realized.
On the other hand, recognition of theselosses shows what coastal ecosystems couldbe like, and the extraordinary magnitude ofeconomic resources that are retrievable if weare willing to act on the basis of historicalknowledge. The central point for successfulrestoration is that loss of economically im-portant fisheries, degradation of habitat at-tractive to landowners and tourists, and emer-gence of noxious, toxic, and life-threateningmicrobial diseases are all part of the samestandard sequence of ecosystem deteriorationthat has deep historical roots (27 ). Respond-ing only to current events on a case-by-casebasis cannot solve these problems. Instead,they need to be addressed by a series of boldexperiments to test the success of integratedmanagement for multiple goals on the scaleof entire ecosystems. With few exceptions,such as the Caribbean monk seal and Steller’ssea cow, most species that are ecologicallyextinct probably survive in sufficient num-bers for successful restoration. This optimismis in stark contrast with the state of manyterrestrial ecosystems where many or mostlarge animals are already extinct (28). More-over, we now have the theoretical tools (109)to roughly estimate per capita interactionstrengths of surviving individuals of now rareanimals like sea turtles, sirenians, sharks, andlarge groupers. We can then use these data tobuild tentative models of the consequences ofthe renewed abundance of these species intheir native environments that can in turn beused to design large-scale, adaptive experi-ments for ecosystem restoration, exploitation,and management (96, 108, 110).
One obviously timely and overdue exper-iment is to attempt the amelioration of eu-trophication, hypoxia, and toxic blooms in
Chesapeake Bay by massive restoration of oys-ter reefs (79). Experiments in Pamlico Soundshow that this is possible (86, 87, 96), andmodeling of food webs suggests that even par-tial restoration of oysters would reduce eu-trophication substantially (110). Aquaculture ofsuspension-feeding bivalves like oysters mightbe promoted to reverse the effects of eutrophi-cation and to restore water quality in degradedestuaries. Other important examples include therestoration of coral reefs and seagrass beds byprotection of fishes, sharks, turtles, and sire-nians in very large reserves on the scale of all ofFlorida Bay and the Florida Keys—an ap-proach recently advocated for terrestrial ecosys-tems (111). Once again, small-scale grazingexperiments with reef fishes (112) show thatfishes could reverse the overgrowth of corals bymacroalgae on a massive scale. The potentialfor reducing diseases of corals and turtlegrassby restoring natural levels of grazing is unprov-en but consistent with historical evidence (27).
In summary, historical documentation of thelong-term effects of fishing provides a hereto-fore-missing perspective for successful man-agement and restoration of coastal marine eco-systems. Previous attempts have failed becausethey have focused only on the most recentsymptoms of the problem rather than on theirdeep historical causes. Contrary to romanticnotions of the oceans as the “last frontier”and of the supposedly superior ecologicalwisdom of non-Western and precolonialsocieties, our analysis demonstrates thatoverfishing fundamentally altered coastalmarine ecosystems during each of the cul-tural periods we examined. Changes in eco-system structure and function occurred asearly as the late aboriginal and early colo-nial stages, although these pale in compar-ison with subsequent events. Human im-pacts are also accelerating in their magni-tude, rates of change, and in the diversity ofprocesses responsible for changes overtime. Early changes increased the sensitiv-ity of coastal marine ecosystems to subse-quent disturbance and thus preconditionedthe collapse we are witnessing.
References and Notes1. J. B. C. Jackson, Coral Reefs 16, S23 (1997).2. K. A. Bjorndal, A. B. Bolten, M. Y. Chaloupka, Ecol.Appl. 10, 269 (2000).
3. G. C. L. Bertram, C. K. Ricardo Bertram, Biol. J. Linn.Soc. 5, 297 (1973).
4. K. W. Kenyon, J. Mammal. 58, 97 (1977).5. D. H. Cushing, The Provident Sea (Cambridge Univ.Press, Cambridge, UK, 1988).
6. J. A. Estes, D. O. Duggins, G. B. Rathbun, Conserv.Biol. 3, 252 (1989).
7. R. S. Steneck, in Proceedings of the Gulf of MaineEcosystem Dynamics Scientific Symposium andWorkshop (RARGOM Report 91-1, Regional Associ-ation for Research in the Gulf of Maine, Hanover,NH, 1997), pp. 151–165.
8. P. K. Dayton, M. J. Tegner, P. B. Edwards, K. L. Riser,Ecol. Appl. 8, 309 (1998).
9. J. M. Casey, R. A. Myers, Science 228, 690 (1998).10. J. A. Hutchings, Nature 406, 882 (2000).
27 JULY 2001 VOL 293 SCIENCE www.sciencemag.org636
E C O L O G Y T H R O U G H T I M E
on
Janu
ary
3, 2
008
ww
w.s
cien
cem
ag.o
rgD
ownl
oade
d fr
om

11. E. Ingersoll, in The History and Present Condition ofthe Fishery Industries, G. B. Goode, Ed. (U.S. Depart-ment of the Interior, Tenth Census of the UnitedStates, Washington, DC, 1881), pp. 1–252.
12. “Fishing” is the original and most general term inthe English language for hunting and gathering allkinds of organisms in the oceans, including plants,invertebrates, and vertebrates ranging from sharksto true fishes to whales. “Overfishing” is the reduc-tion of a species well below the sustainable yield orto such low abundance that it may not recover evenif fishing ceases.
13. J. H. Brown, Macroecology (Univ. of Chicago Press,Chicago, IL, 1995).
14. J. B. C. Jackson, BioScience 41, 475 (1991).15. R. C. Francis, S. R. Hare, Fish. Oceanogr. 3, 279(1994).
16. A. D. MacCall, Calif. Coop. Fish. Invest. 37, 100(1996).
17. C. B. Lange, S. K. Burke, W. H. Berger Clim. Change16, 319 (1990).
18. J. B. C. Jackson, in Biotic Interactions in Recent andFossil Benthic Communities, M. J. S. Tevesz, P. L.McCall, Eds. (Plenum, New York, 1983), pp. 39–120.
19. S. J. M. Davis, The Archaeology of Animals (YaleUniv. Press, New Haven, CT, 1987).
20. G. Wefer, W. H. Berger, J. Bijima, G. Fischer, in Useof Proxies in Paleoceanography: Examples from theSouth Atlantic, G. Fischer, G. Wefer, Eds. (Springer-Verlag, Berlin, 1999), pp. 1–68.
21. D. S. Jones, Paleontol. Soc. Pap. 4, 37 (1998).22. C. W. Finkl Jr., J. Coast. Res. Spec. Iss. 17, 402(1995).
23. A. W. Crosby, Ecological Imperialism: The BiologicalExpansion of Europe 900-1900 (Cambridge Univ.Press, Cambridge, UK, 1986).
24. Biological proxies include fossils or archaeologicalremains that may indicate presence, abundance,age, growth rate, health, or body size, among otherfactors, of selected taxa. Biogeochemical proxiesinclude concentrations of inorganic or organic con-stituents and isotopic ratios in sediments or skele-tons that track former abundances of unpreservedorganisms and variations in parameters such astemperature, salinity, oxygen, nutrient chemistry,and productivity. Physical proxies include sedimen-tary structures and composition that reflect watermovements, runoff from the land, and rate of sed-imentation. Historical proxies include demographic,customs, and commercial records, as well as explor-ers’ and naturalists’ descriptions of sights andevents and nautical charts marking reefs, coastalwetlands, and other landmarks.
25. R. S. Bradley, Paleoclimatology: Reconstructing Cli-mates of the Quaternary (Academic Press, San Di-ego, ed. 2, 1999).
26. S. M. Kidwell, K. W. Flessa, Annu. Rev. Ecol. Syst. 26,269 (1995).
27. J. B. C. Jackson, Proc. Natl. Acad. Sci. U.S.A. 98,5411 (2001).
28. D. H. Janzen, P. S. Martin, Science 215, 19 (1982).29. P. K. Dayton, Annu. Rev. Ecol. Syst. 16, 215 (1985).30. J. A. Estes, J. F. Palmisano, Science 185, 1058 (1974).31. C. A. Simenstad, J. A. Estes, K. W. Kenyon, Science200, 403 (1978).
32. E. Sala, C. F. Boudouresque, M. Harmelin-Vivien,Oikos 82, 425 (1998).
33. J. A. Estes, M. T. Tinker, T. M. Williams, D. F. Doak,Science 282, 473 (1998).
34. B. J. Bourque, Diversity and Complexity in PrehistoricMaritime Societies: A Gulf of Maine Perspective (Ple-num, New York, 1995).
35. K. Sherman, Ecol. Appl. 1, 349 (1991).36. M. J. Tegner, P. K. Dayton, ICES (Int. Counc. Expl.Sea) J. Mar. Sci. 57, 579 (2000).
37. J. M. Erlandson et al., Radiocarbon 38, 355 (1996).38. A. Ogden, The California Sea Otter Trade (Univ. ofCalifornia Press, Berkeley, 1941).
39. M. J. Tegner, P. K. Dayton, Mar. Ecol. Prog. Ser. 77,49 (1991).
40. N. Knowlton, Proc. Natl. Acad. Sci. U. S. A. 98, 5419(2001).
41. J. Allen, C. Gosden, J. P. White, Antiquity 63, 548(1989).
42. T. P. Hughes, Science 265, 1547 (1994).
43. R. A. Kenchington, Managing Marine Environments(Taylor and Francis, New York, 1990).
44. J. M. Pandolfi, J. B. C. Jackson, Ecol. Monogr. 71, 49(2001).
45. R. B. Aronson, W. F. Precht, I. G. MacIntyre, CoralReefs 17, 223 (1998).
46. J. Geister, Proc. 3rd Int. Coral Reef Symp. 1, 23(1977).
47. H. A. Lessios, Annu. Rev. Ecol. Syst. 19, 371 (1988).48. J. E. Duerden, West Indian Bull. 1901, 121 (1901).49. J. Sapp, What Is Natural? Coral Reef Crisis (OxfordUniv. Press, New York, 1999).
50. R. M. Seymour, R. H. Bradbury, Mar. Ecol. Prog. Ser.176, 1 (1999).
51. R. Ormond et al., in Acanthaster and the Coral Reef:A Theoretical Perspective, R. H. Bradbury, Ed.(Springer-Verlag, Berlin, 1990), pp. 189–207.
52. A. Steven, An Analysis of Fishing Activities on Possi-ble Predators of the Crown of Thorns Starfish (Acan-thaster planci) of the Great Barrier Reef (Preparedfor the Great Barrier Reef Marine Park Authority,Townsville, Australia, 1988).
53. C. Birkeland, Mar. Biol. 69, 175 (1982).54. C. C. MacKnight, The Voyage to Marege: MacassanTrepangers in Northern Australia (Melbourne Univ.Press, Melbourne, Australia, 1976).
55. D. T. Neil, in Moreton Bay and Catchment, I. R.Tibbetts, N. J. Hall, W. C. Dennison, Eds. (Univ. ofQueensland, Brisbane, Australia, 1998), pp. 3–54.
56. D. Jones, The Whalers of Tangalooma (Nautical As-sociation of Australia, Melbourne, 1980).
57. R. Ganter, The Pearl-Shellers of Torres Strait: Re-source Use, Development and Decline, 1860s–1960s(Melbourne Univ. Press, Melbourne, Australia, 1994).
58. R. H. Quinn, Fisheries Resources of the Moreton BayRegion (Queensland Fish Management Authority,Brisbane, Australia, 1993).
59. J. C. Ogden, in Handbook of Seagrass Biology: AnEcosystem Perspective, R. C. Phillips, C. P. McRoy,Eds. (Garland STPM, New York, 1980), pp. 173–198.
60. G. W. Thayer, D. W. Engel, K. A. Bjorndal, J. Exp. Mar.Biol. Ecol. 62, 173 (1982).
61. J. C. Ogden, L. Robinson, H. Whitlock, H. Daganhart,R. Cebula, J. Exp. Mar. Biol. Ecol. 66, 199 (1983).
62. G. W. Thayer, K. A. Bjorndahl, J. C. Ogden, S. L.Williams, J. C. Zieman, Estuaries 7, 351 (1984).
63. H. Kirkman, Aquat. Bot. 5, 63 (1978).64. E. G. Abal, W. C. Dennison,Mar. Freshw. Res. 47, 763(1996).
65. J. C. Zieman, J. W. Fourqurean, T. A. Frankovich,Estuaries 22, 460 (1999).
66. C. J. Limpus, P. J. Couper, M. A. Read, Mem. Queens-land Mus. 35, 139 (1994).
67. C. J. Limpus, in State of the Great Barrier Reef WorldHeritage Area Workshop, D. Wachenfeld, J. Oliver, K.Davis, Eds. (Great Barrier Reef Marine Park Author-ity, Townsville, Australia, 1995), pp. 258–265.
68. W. Dampier, A New Voyage around the World (Do-ver, New York, 1968).
69. E. Thorne, The Queen of the Colonies (Sampson Low,Marson, Searle, and Rivington, London, 1876).
70. G. M. Allen, Am. Comm. Int. Wildl. Protect. Spec.Pub. 11, 1 (1942).
71. G. E. Heinsohn, R. J. Lear, M. M. Bryden, H. Marsh,B. R. Gardner, Environ. Conserv. 5, 91 (1978).
72. H. Marsh, P. Corkeron, I. Lawler, J. Lanyon, A. Preen,Great Barrier Reef Marine Park Authority Rep. 41, 1(1996).
73. A. Preen, Mar. Ecol. Prog. Ser. 124, 201 (1995).74. R. Elmgren, Ambio 18, 326 (1989).75. C. B. Officer et al., Science 223, 22 (1984).76. S. W. Nixon, Ophelia 41, 199 (1995).77. S. R. Cooper, G. S. Brush, Estuaries 16, 617 (1993).78. R. J. Orth, K. A. Moore, Science 222, 51 (1983).79. R. I. E. Newell, in Understanding the Estuary: Advanc-es in Chesapeake Bay Research, M. P. Lynch, E. C.Krome, Eds. (Chesapeake Bay Research Consortium,Baltimore, MD, 1988), pp. 536–546.
80. B. J. Rothschild, J. S. Ault, P. Goulletquer, M. Heral,Mar. Ecol. Prog. Ser. 111, 29 (1994).
81. R. B. Jonas, Am. Zool. 37, 612 (1997).82. T. J. Smayda, in Toxic Marine Phytoplankton, E.Graneli et al., Eds. (Elsevier Science, New York,1990), pp. 29–40.
83. J. M. Burkholder et al., Nature 358, 407 (1992).
84. S. R. Cooper, The History of Water Quality in NorthCarolina Estuarine Waters as Documented in theStratigraphic Record (Univ. of North Carolina WaterResources Research Institute, Raleigh, NC, 2000).
85. J. Persson, P. Jonsson, Mar. Pollut. Bull. 40, 122(2000).
86. H. S. Lenihan, C. H. Peterson, Ecol. Appl. 8, 128(1998).
87. H. S. Lenihan, F. Micheli, S. W. Shelton, C. H. Peter-son, Limnol. Oceanogr. 44, 910 (1999).
88. C. B. Officer, T. J. Smayda, R. Mann, Mar. Ecol. Prog.Ser. 9, 203 (1982).
89. J. E. Cloern, Mar. Ecol. Prog. Ser. 9, 191 (1982).90. S. R. Carpenter et al., Ecol. Monogr. 71, 163 (2001).91. D. Pauly, V. Christensen, J. Dalsgaard, R. Froese, F.Torres Jr., Science 279, 860 (1998).
92. T. H. Huxley, Fish. Exhib. Lit. 4, 1 (1884).93. H. J. Cranfield, K. P. Michael, I. J. Doonan, AquaticConserv. Mar. Freshw. Ecosyst. 9, 461 (1999).
94. W. M. Hochachka, A. A. Dhondt, Proc. Natl. Acad.Sci. U. S. A. 97, 5303 (2000).
95. J. T. Carlton, J. B. Geller, Science 261, 78 (1993).96. H. S. Lenihan, Ecol. Monogr. 69, 251 (1999).97. J. J. Stachowicz, R. B. Whitlatch, R. W. Osman,Science 286, 1577 (1999).
98. N. Myers, Science 269, 358 (1995).99. N. Knowlton, Am. Zool. 32, 674 (1992).100. S. Naeem, Conserv. Biol. 12, 39 (1998).101. J. Munro, ICLARM (Int. Cent. Living Aquat. Resour.
Manag.) Stud. Rev. 7, 1 (1983).102. J. L. Munro, in Fish and Fisheries Series; Reef Fisher-
ies, N. V. C. Polunin, C. M. Roberts, Eds. (Chapman &Hall, New York, 1996), pp. 1–14.
103. M. J. Fogarty, Can. Spec. Publ. Fish. Aquat. Sci. 125,273 (1998).
104. C. D. Harvell et al., Science 285, 1505 (1999).105. R. R. Colwell, Science 274, 2025 (1996).106. R. E. Turner, N. N. Rabalais, Nature 368, 619 (1994).107. D. Justic, in Modern and Ancient Continental Shelf
Anoxia, R. V. Tyson, T. H. Pearson, Eds. (GeologicalSociety, London, 1991), pp. 95–105.
108. L. W. Botsford, J. C. Castilla, C. H. Peterson, Science277, 509 (1997).
109. R. T. Paine, Nature 355, 73 (1992).110. R. E. Ulanowicz, J. H. Tuttle, Estuaries 15, 298
(1992).111. M. E. Soule, J. Terborgh, Eds., Continental Conserva-
tion (Island, Washington, DC, 1999).112. S. M. Lewis, Ecol. Monogr. 56, 183 (1986).113. Cod body length for samples older than 50 years was
derived from cod vertebrae collected at the TurnerFarm shell midden, North Haven, Maine. Five occupa-tions are recognized: Occupations 1 (5300 to 4900 yrB.P.), 2 (4500 to 4200 yr B.P.), 3 (3700 to 3500 yr B.P.),and 4 (� Ceramic Period, 3000 to 1000 yr B.P.), andPlow Zone (mixed from earlier occupations but mostlypostdating 1000 yr B.P.). Regression of body length onvertebra diameter of living cod allowed estimation ofbody lengths from vertebrae of ancient cod [ y �61.0 204.6log(x)]. This model assumes that we areusing the largest vertebra for each fish, and will there-fore tend to underestimate actual body size in caseswhere smaller vertebrae are used. Data from the past50 years are actual body lengths reported from coastalzones [H. B. Bigelow, W. C. Schroeder, Fish. Bull. FishWildl. Serv. 53, 1 (1953); J. S. Hacunda, Fish. Bull. 79,775 (1981); F. P. Ojeda, thesis (Univ. of Maine, 1987)].
114. Percent Caribbean localities with A. palmata or A.cervicornis as the dominant or codominant coralswere derived from 50 studies from Antigua, Ba-hamas, Barbados, Belize, Bonaire, Cayman Islands,Colombia, Dominican Republic, Florida, Haiti, Ja-maica, Mexico, Netherlands Antilles, Panama,Puerto Rico, and U.S. Virgin Islands. Studies con-tained either paleoecological data from outcropsof fossil reefs or from sediment cores, or ecolog-ical data. For A. palmata, only localities describedas reef crest or between 0- and 10-m water depthwere included (131 localities). For A. cervicornis,only localities described as forereef, reef slope, orbetween 10- and 20-m water depth were included(72 localities). Leeward and windward environ-ments were not distinguished. The percentage oflocalities that contained A. palmata or A. cervi-cornis as the most abundant coral was estimated
www.sciencemag.org SCIENCE VOL 293 27 JULY 2001 637
E C O L O G Y T H R O U G H T I M E
on
Janu
ary
3, 2
008
ww
w.s
cien
cem
ag.o
rgD
ownl
oade
d fr
om

for four time intervals: Late Pleistocene (beforehumans arrived in the Americas), Holocene (whenonly aboriginal populations were present), pre-1983 (before the mass mortality of Diademaantillarum), and post-1983 (after the Diademamortality).
115. We dedicate this paper to the memory of Mia
Tegner who died while diving after this paper wassubmitted. This work was conducted as part of theLong-Term Ecological Records of Marine Environ-ments, Populations and Communities WorkingGroup supported by the National Center for Eco-logical Analysis and Synthesis (funded by NSF grantDEB-0072909, the University of California, and the
University of California, Santa Barbara). Additionalsupport was also provided for the Postdoctoral As-sociate MXK in the Group. L.W.B. was also support-ed by NSF grant OCE-9711448. We thank A. Bolten,S. Cooper, N. Knowlton, B. Mitterdorfer, E. Sala, andtwo anonymous reviewers for discussions and com-ments on the manuscript.
R E V I E W
Noisy Clockwork: Time Series Analysis ofPopulation Fluctuations in Animals
Ottar N. Bjørnstad1* and Bryan T. Grenfell2
Both biotic interactions and abiotic random forcing are crucial influenceson population dynamics. This frequently leads to roughly equal impor-tance of deterministic and stochastic forces. The resulting tension be-tween noise and determinism makes ecological dynamics unique, withconceptual and methodological challenges distinctive from those in otherdynamical systems. The theory for stochastic, nonlinear ecological dynam-ics has been developed alongside methods to test models. A range ofdynamical components has been considered—density dependence, envi-ronmental and demographic stochasticity, and climatic forcing—as well astheir often complex interactions. We discuss recent advances in under-standing ecological dynamics and testing theory using long-term data andreview how dynamical forces interact to generate some central field andlaboratory time series.
The century of studies in population ecologyhas been dominated by a nested set of debatesregarding the importance of various dynami-cal forces. The first controversy concernedthe relative impact of biotic versus abioticcontrol of population fluctuations. The keyquestion was the relative importance of“noise” (small-scale, high-frequency stochas-tic influences) versus climatic forcing (larger-scale, often lower-frequency signals) versusnonlinear interactions between individualsof the same or different species. The secondquestion concerned the impact of intrinsic(i.e., intraspecific) processes, as opposed toextrinsic or community-level interactions,an argument that has been particularly heat-ed with reference to population cycles. Athird debate, nested within the latter, con-cerns the “dimensionality” of populationfluctuations; given that most populationsare embedded in rich communities and af-fected by numerous interspecific interac-tions, can simple (low-dimensional) modelsinvolving one or a few species capture thepatterns of fluctuations? All these questionshave been studied through a number ofdetailed analyses of specific systems inwhich theoretical models are linked with
long-term studies (often 10 or more gener-ations) through time series analysis.
There has been much parallel and inter-twined development of these three dynamicalthemes, and history testifies to a successionof popularity of the various positions (1).Crudely summarized, early focus on extrinsicinfluences was replaced by the “density-de-pendent paradigm” (2) in the 1950s and1960s. This accelerated in the late 1970s,with May’s cri de coeur (3) about the poten-tial of dynamical complexity even in simplemodels, leading to a focus in the 1980s onnonlinearity and the detection of determinis-tic chaos (Taken’s embedology, Lyapunovexponents, etc.). Research has focused ontwo fronts in the past decade: (i) the impact oflarge-scale climatic forcing, coinciding withthe rise in popularity of climate change stud-ies through the early 1990s, and (ii) stochas-tic nonlinear models that combine the nonlin-ear deterministic and (largely) linear stochas-tic theories. The goal in synthesizing theseapproaches in recent years is to understandhow population fluctuations arise from theinterplay of noise, forcing, and nonlinear dy-namics. The comparable importance of deter-ministic and stochastic forces makes ecolog-ical dynamics unique. In particular, the inter-action between noise and nonlinear determin-ism in ecological dynamics adds an extralevel of complexity compared with the large-ly stochastic dynamics of, say, economic sys-tems or the largely deterministic dynamics ofmany physical and chemical processes.
The dynamics of marine stocks serve asan illustration of the current paradigm. Mostcommercial fish stocks vary greatly in abun-dance and the associated time series exhibitcomplex spectra, with combinations of high-frequency oscillations and longer term trends(4, 5) (Fig. 1). High-frequency oscillationsare thought to arise from environmental vari-ability particularly affecting reproduction[through expatriation of eggs, temperature-induced mortality, etc. (4 )], as well as inter-actions between individuals (competition andcannibalism) or between species (fish-fish orplankton-fish interactions). The low-frequen-cy oscillations and trends are usually relatedto external forcing such as overfishing, cli-matic changes, and decadal, supra-, or super-decadal oscillations in climate. The most re-cent studies that combine theoretical model-ing with time series analysis indicate that thefull variability in marine stocks can only beexplained by considering the interaction be-tween nonlinear dynamics and stochasticforcing (5, 6 ), often in the face of stronghuman influences (7, 8) and obscured bymeasurement error (5, 7 ).
The relative importance of different com-ponents of ecological dynamics differs some-what between systems—notably between ter-restrial versus marine, vertebrate versus in-vertebrate, simple versus complex life-cycle,etc. However, evidence is mounting that allcomponents contribute and interact at partic-ular spatial and temporal scales in most sys-tems. Here we review the current understand-ing of the different forces that drive ecolog-ical dynamics.
Simple density-dependent interactions.Nonlinear, density-dependent interactions canpotentially stabilize or promote fluctuationsin abundance because such interactions caneither result in stable equilibria (point attrac-tors, namely “the carrying capacity”) or cy-clic or chaotic attractors, associated withstrongly overcompensatory density depen-dence (3). About 25 years ago, Hassell et al.(9) and Gurney et al. (10) took the bold stepof insisting that the then-qualitative, strategictheory ought to be testable by analyses of
1Department of Entomology, 501 ASI Building, PennState University, University Park, PA 16802, USA.2Department of Zoology, University of Cambridge,Cambridge CB2 3EJ, UK.
*To whom correspondence should be addressed. E-mail: [email protected]
27 JULY 2001 VOL 293 SCIENCE www.sciencemag.org638
E C O L O G Y T H R O U G H T I M E
on
Janu
ary
3, 2
008
ww
w.s
cien
cem
ag.o
rgD
ownl
oade
d fr
om
Copyright © 2022 FDOKUMEN