Historical and contemporary biological diversity of Minnesota caddisflies: a case study of...
16
Historical and contemporary biological diversity of Minnesota caddisflies: a case study of landscape-level species loss and trophic composition shift David C. Houghton 1 Department of Biology, 33 East College Street, Hillsdale College, Hillsdale, Michigan 49242 USA Ralph W. Holzenthal 2 Department of Entomology, 219 Hodson Hall, 1980 Folwell Ave., University of Minnesota, Saint Paul, Minnesota 55108 USA Abstract. The biological diversity reflected by nearly 300,000 caddisfly specimens collected throughout Minnesota since 1985 was compared with that of 25,000 specimens recorded prior to 1950 and was analyzed based on the 5 caddisfly regions of Minnesota. In the Lake Superior, Northern, and Southeastern regions, .90% of species known historically from each region were recovered and additional species were discovered. In the Northwestern and Southern regions—the most disturbed areas of Minnesota—species recovery ranged from 60 to 70%. Historical and contemporary assemblages were similar to each other in the former 3 regions and markedly different in the latter 2. Prior to 1950, species in all trophic functional groups were widespread in all regions. A similar pattern still exists in the Lake Superior, Northern, and Southeastern regions, whereas the Northwestern and Southern regions are now dominated by filtering collectors in all sizes of lakes and streams. Over 65% of species extirpated from any region were in the long-lived families Limnephilidae and Phryganeidae, and 70% of these same species were in the shredder functional group. Almost 30% of the statewide fauna has been found from ,5 localities since 1950, suggesting a degree of imperilment on par with that of freshwater bivalves, gastropods, and fish. These observed losses of biodiversity and changes in trophic composition have probably occurred as a result of anthropogenic disturbance throughout most of the northcentral US. Key words: Trichoptera, Minnesota, aquatic, biodiversity, caddisfly, extirpation, insect, conservation. The biological diversity of aquatic insects—particu- larly that of endangered and threatened taxa— remains poorly studied relative to that of vertebrates. The International Union for Conservation of Nature (IUCN) Red List of Threatened Species, for example, lists only 623 threatened insects, 0.07% of the total described insect fauna (IUCN 2009). In contrast, 20% (1098 species) of described mammals are considered threatened by the IUCN. Among the threatened insects, only 19% (118 species) are freshwater species, and nearly 90% (106 species) of those are in the order Odonata (IUCN 2009). The IUCN only lists 4 species of threatened caddisfly, all of which are European species currently believed to be extinct. The US Fish and Wildlife Service has implemented Species Re- covery Plans (SRPs) for only 3 endangered aquatic insects, none of them caddisflies. In contrast, several hundred SRPs have been established for mammals, birds, and fish, including 28 for the bull trout (Salvelinus confluentus) alone (USFWS 2009). Among the states of the north-central US (Illinois, Indiana, Iowa, Michigan, Minnesota, North Dakota, South Dakota, Wisconsin), ,5% of the respective caddisfly faunas are considered imperiled or extir- pated (NatureServe 2009). In contrast, mammal listings for these same states range from 10 to 40%. In Minnesota, only 0.7% (2 species) of the fauna is considered imperiled or extirpated, but .95% of these species simply lack enough conservation data to assign them a rank (Fig. 1A). The Minnesota Depart- ment of Natural Resources (MNDNR 2009b) lists 13 species of caddisfly as Endangered or Special Concern in the state; 4 of these are either invalid species or are listed based on misidentified specimens (Houghton and Holzenthal 2003). 1 E-mail addresses: [email protected] 2 [email protected] J. N. Am. Benthol. Soc., 2010, 29(2):480–495 ’ 2010 by The North American Benthological Society DOI: 10.1899/09-029.1 Published online: 2 March 2010 480
Transcript of Historical and contemporary biological diversity of Minnesota caddisflies: a case study of...
Historical and contemporary biological diversity of Minnesotacaddisflies: a case study of landscape-level species loss and trophic
composition shift
David C. Houghton1
Department of Biology, 33 East College Street, Hillsdale College, Hillsdale, Michigan 49242 USA
Ralph W. Holzenthal2
Department of Entomology, 219 Hodson Hall, 1980 Folwell Ave., University of Minnesota, Saint Paul,Minnesota 55108 USA
Abstract. The biological diversity reflected by nearly 300,000 caddisfly specimens collected throughoutMinnesota since 1985 was compared with that of 25,000 specimens recorded prior to 1950 and wasanalyzed based on the 5 caddisfly regions of Minnesota. In the Lake Superior, Northern, and Southeasternregions, .90% of species known historically from each region were recovered and additional species werediscovered. In the Northwestern and Southern regions—the most disturbed areas of Minnesota—speciesrecovery ranged from 60 to 70%. Historical and contemporary assemblages were similar to each other inthe former 3 regions and markedly different in the latter 2. Prior to 1950, species in all trophic functionalgroups were widespread in all regions. A similar pattern still exists in the Lake Superior, Northern, andSoutheastern regions, whereas the Northwestern and Southern regions are now dominated by filteringcollectors in all sizes of lakes and streams. Over 65% of species extirpated from any region were in thelong-lived families Limnephilidae and Phryganeidae, and 70% of these same species were in the shredderfunctional group. Almost 30% of the statewide fauna has been found from ,5 localities since 1950,suggesting a degree of imperilment on par with that of freshwater bivalves, gastropods, and fish. Theseobserved losses of biodiversity and changes in trophic composition have probably occurred as a result ofanthropogenic disturbance throughout most of the northcentral US.
Key words: Trichoptera, Minnesota, aquatic, biodiversity, caddisfly, extirpation, insect, conservation.
The biological diversity of aquatic insects—particu-larly that of endangered and threatened taxa—remains poorly studied relative to that of vertebrates.The International Union for Conservation of Nature(IUCN) Red List of Threatened Species, for example,lists only 623 threatened insects, 0.07% of the totaldescribed insect fauna (IUCN 2009). In contrast, 20%
(1098 species) of described mammals are consideredthreatened by the IUCN. Among the threatenedinsects, only 19% (118 species) are freshwater species,and nearly 90% (106 species) of those are in the orderOdonata (IUCN 2009). The IUCN only lists 4 speciesof threatened caddisfly, all of which are Europeanspecies currently believed to be extinct. The US Fishand Wildlife Service has implemented Species Re-covery Plans (SRPs) for only 3 endangered aquatic
insects, none of them caddisflies. In contrast, severalhundred SRPs have been established for mammals,birds, and fish, including 28 for the bull trout(Salvelinus confluentus) alone (USFWS 2009).
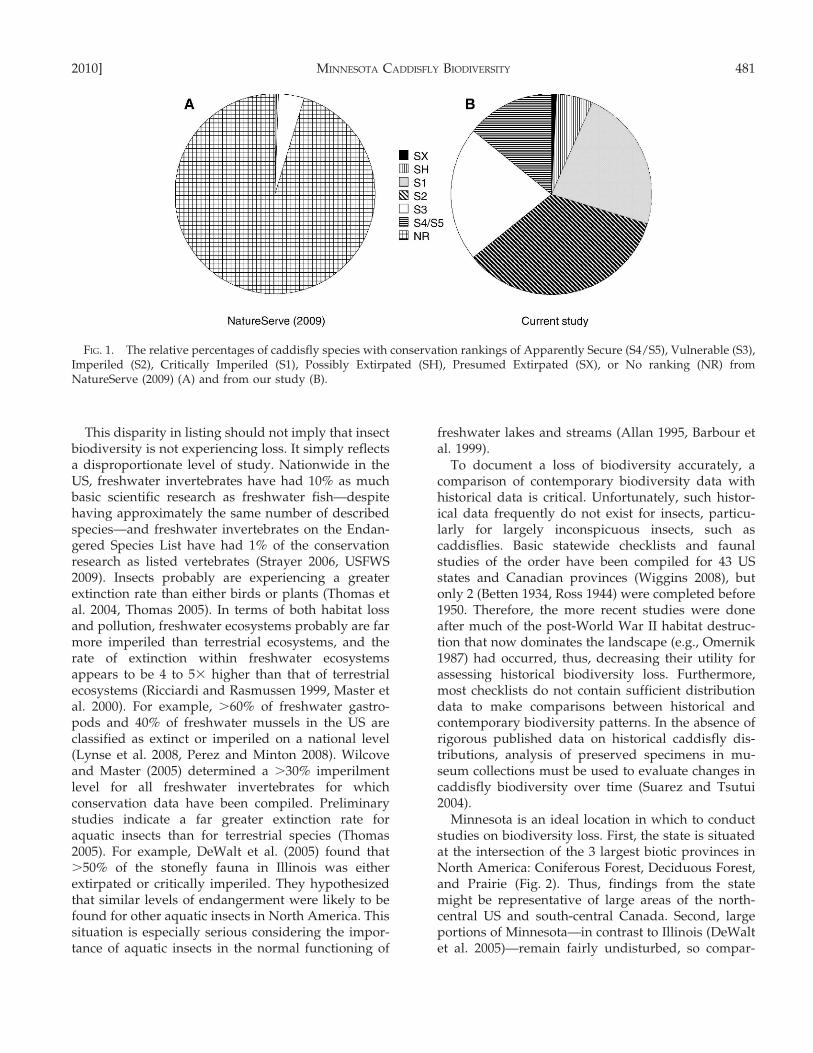
Among the states of the north-central US (Illinois,Indiana, Iowa, Michigan, Minnesota, North Dakota,South Dakota, Wisconsin), ,5% of the respectivecaddisfly faunas are considered imperiled or extir-pated (NatureServe 2009). In contrast, mammallistings for these same states range from 10 to 40%.In Minnesota, only 0.7% (2 species) of the fauna isconsidered imperiled or extirpated, but .95% of thesespecies simply lack enough conservation data toassign them a rank (Fig. 1A). The Minnesota Depart-ment of Natural Resources (MNDNR 2009b) lists 13species of caddisfly as Endangered or Special Concernin the state; 4 of these are either invalid species or arelisted based on misidentified specimens (Houghtonand Holzenthal 2003).
1 E-mail addresses: [email protected] [email protected]
J. N. Am. Benthol. Soc., 2010, 29(2):480–495’ 2010 by The North American Benthological SocietyDOI: 10.1899/09-029.1Published online: 2 March 2010
480
This disparity in listing should not imply that insectbiodiversity is not experiencing loss. It simply reflectsa disproportionate level of study. Nationwide in theUS, freshwater invertebrates have had 10% as muchbasic scientific research as freshwater fish—despitehaving approximately the same number of describedspecies—and freshwater invertebrates on the Endan-gered Species List have had 1% of the conservationresearch as listed vertebrates (Strayer 2006, USFWS2009). Insects probably are experiencing a greaterextinction rate than either birds or plants (Thomas etal. 2004, Thomas 2005). In terms of both habitat lossand pollution, freshwater ecosystems probably are farmore imperiled than terrestrial ecosystems, and therate of extinction within freshwater ecosystemsappears to be 4 to 53 higher than that of terrestrialecosystems (Ricciardi and Rasmussen 1999, Master etal. 2000). For example, .60% of freshwater gastro-pods and 40% of freshwater mussels in the US areclassified as extinct or imperiled on a national level(Lynse et al. 2008, Perez and Minton 2008). Wilcoveand Master (2005) determined a .30% imperilmentlevel for all freshwater invertebrates for whichconservation data have been compiled. Preliminarystudies indicate a far greater extinction rate foraquatic insects than for terrestrial species (Thomas2005). For example, DeWalt et al. (2005) found that.50% of the stonefly fauna in Illinois was eitherextirpated or critically imperiled. They hypothesizedthat similar levels of endangerment were likely to befound for other aquatic insects in North America. Thissituation is especially serious considering the impor-tance of aquatic insects in the normal functioning of
freshwater lakes and streams (Allan 1995, Barbour etal. 1999).
To document a loss of biodiversity accurately, acomparison of contemporary biodiversity data withhistorical data is critical. Unfortunately, such histor-ical data frequently do not exist for insects, particu-larly for largely inconspicuous insects, such ascaddisflies. Basic statewide checklists and faunalstudies of the order have been compiled for 43 USstates and Canadian provinces (Wiggins 2008), butonly 2 (Betten 1934, Ross 1944) were completed before1950. Therefore, the more recent studies were doneafter much of the post-World War II habitat destruc-tion that now dominates the landscape (e.g., Omernik1987) had occurred, thus, decreasing their utility forassessing historical biodiversity loss. Furthermore,most checklists do not contain sufficient distributiondata to make comparisons between historical andcontemporary biodiversity patterns. In the absence ofrigorous published data on historical caddisfly dis-tributions, analysis of preserved specimens in mu-seum collections must be used to evaluate changes incaddisfly biodiversity over time (Suarez and Tsutui2004).
Minnesota is an ideal location in which to conductstudies on biodiversity loss. First, the state is situatedat the intersection of the 3 largest biotic provinces inNorth America: Coniferous Forest, Deciduous Forest,and Prairie (Fig. 2). Thus, findings from the statemight be representative of large areas of the north-central US and south-central Canada. Second, largeportions of Minnesota—in contrast to Illinois (DeWaltet al. 2005)—remain fairly undisturbed, so compar-
FIG. 1. The relative percentages of caddisfly species with conservation rankings of Apparently Secure (S4/S5), Vulnerable (S3),Imperiled (S2), Critically Imperiled (S1), Possibly Extirpated (SH), Presumed Extirpated (SX), or No ranking (NR) fromNatureServe (2009) (A) and from our study (B).
2010] MINNESOTA CADDISFLY BIODIVERSITY 481

isons of variable species loss can be made within afairly small area (Houghton 2004a). Third, the statehas an amazing wealth of freshwater resources,including nearly 12,000 natural lakes .4 ha in size,.100,000 km of streams and rivers, and nearly 4million ha of wetlands (MNDNR 2009a). Last,caddisflies have been collected regularly in Minnesotasince the 1890s, with the first statewide checklistcompiled in 1936 (Elkins 1936). Nearly 25,000 speci-mens, most of them unpublished, have been collectedfrom 1890 to 1950 and deposited in the University ofMinnesota Insect Museum (UMSP).
In 2000 to 2001, Houghton (2004a) sampled theentire state representatively and collected .200,000
adult specimens. He used detrended correspondenceanalysis and a flexible unweighted pair-groupmethod using arithmetic averages (UPGMA) algo-rithm to group 58 secondary watersheds into 5caddisfly regions (Fig. 3A, B) based on relativeabundance data. These regions had ,23 the classifi-cation strength of any a priori classification based onecological data or primary catchment (Houghton2003) and, therefore, are the most appropriate unitsfor sampling caddisflies within Minnesota (e.g.,Hawkins et al. 2000). The Northwestern and Southernregions had markedly lower overall species richnessrelative to their size than did the other regions.Indeed, some single samples from the Northernregion contained more species than all combinedsamples of the Northwestern region. Furthermore,ecosystems in the Northwestern and Southern regionsof the state were dominated by fine-particle filteringcollectors in all sizes of lakes and streams (Houghton2007).
Houghton (2004a, 2007) hypothesized that thelower species richness and ecosystem homogeniza-tion observed in the Northwestern and Southernregions were caused, in large part, by the high level ofhabitat disturbance in these 2 regions (USGS 2002).However, in the absence of historical data, thishypothesis was tentative. Therefore, the objective ofour study was to compare contemporary Minnesotacaddisfly distribution data to that reflected by speci-mens stored in the UMSP before 1950 and to assesspotential loss of biodiversity and changes in trophicfunctioning throughout the state. Because of Minne-sota’s location at the intersection of 3 biotic provinces,
FIG. 3. Collecting localities for Minnesota caddisflies based on 5 predetermined caddisfly regions (Houghton 2004a) before1950 (A) and after 1985 (B). Smaller regions are Minnesota watersheds. LS = Lake Superior, NO = Northern, NW =
Northwestern, SE = Southeastern, SO = Southern.
FIG. 2. The USA and southern Canada showing theconvergence of the Coniferous Forest, Deciduous Forest,and Prairie biotic provinces within the state of Minnesota(Bailey 1980). Misc. = miscellaneous biotic provinces.
482 D. C. HOUGHTON AND R. W. HOLZENTHAL [Volume 29
100+ y of collecting history, and varying levels ofhabitat disturbance, results probably will be applic-able to many other areas in north-central US andsouth-central Canada.
Materials and Methods
A total of 24,167 specimens collected from the 1890sthrough the 1940s and deposited into the UMSP wereentered into the UMSP BIOTA database (Colwell2007). These dates reflect the collecting of manyworkers, including W. Elkins, A. A. Granovsky, O.Lugger, and, especially, D. G. Denning. They alsoprecede most habitat degradation in Minnesota(Omernik 1987, Tester 1995), and allow a 35-ywindow of time between historical and contemporarycollections.
A total of 288,717 specimens collected since 1985—the year that we began investigating the state fauna—also were entered in the BIOTA database. Collectingtechniques included malaise trapping, sweep netting,aspirating from riparian rocks and vegetation, andsuspending several 8-W ultraviolet lights in front of awhite sheet for ,2 h after dusk, with subsequentcapture in a cyanide kill jar. From 2000 to 2001, wesampled representatively with light traps. For thistechnique, an 8-W portable ultraviolet light was set ontop of a white enamel pan filled with 80% ethanol.Lights placed near aquatic habitats for ,2 h after duskattract most caddisfly species (Houghton 2004a).Traps were placed near §1 small stream (width ,
4 m), §1 medium-sized stream (4–15 m), §1 largeriver (.15 m), and §1 lake or wetland for most of the58 watersheds in Minnesota (Fig. 3B). Our objectivewas to collect adult caddisflies more representativelyand with greater effort than they have been collectedhistorically. All specimens analyzed in our study aredeposited in the UMSP, and their locality data areaccessible on the USMP website (http://www.entomology.umn.edu/museum/databases/).
A mean similarity dendrogram was calculated byan UPGMA algorithm using the program PC-ORD forWindowsH (version 3.0; MjM Software Design, Gle-neden Beach, Oregon). The dendrogram was com-puted on a 2-dimensional data matrix of speciespresence or absence by caddisfly region, both pre-1950 and post-1985. UPGMA is a phenetic clusteringmethod that calculates between-group similarities asthe average of all possible pairs within each group(Oswood et al. 2000, McCune and Grace 2002). Itproduced a branching diagram of groups of caddisflyregions based on species composition with distancesbetween groups expressed as % similarity (e.g.,Gauch 1982). The UPGMA algorithm in PC-ORD
automatically sets the base node of the tree to 0%
similarity and the end nodes to 100%. Longer branchlengths indicate a greater degree of dissimilarity andsuggest that clusters at the end of such long branchesconstitute distinct groups (Oswood et al. 2000).
To construct species conservation rankings, wefollowed criteria adapted from NatureServe (2009):SX = Presumed Extirpated: species is believed to beextirpated from the state and not located despiteintensive searches of historical sites and other appro-priate habitat, and there is virtually no likelihood thatit will be rediscovered; SH = Possibly Extirpated(Historical): species occurred historically in the state,and some possibility exists that it might be redis-covered, but its presence has not been verified in thepast 30–40 y; S1 = Critically Imperiled: criticallyimperiled in the state because of extreme rarity (ƒ5occurrences); S2 = Imperiled: imperiled in the statebecause of rarity resulting from very few populations(ƒ20); S3 = Vulnerable: vulnerable in the statebecause of relatively few populations (ƒ80); S4/S5= Apparently Secure: species might be uncommon,but engenders minimal cause for concern.
Results
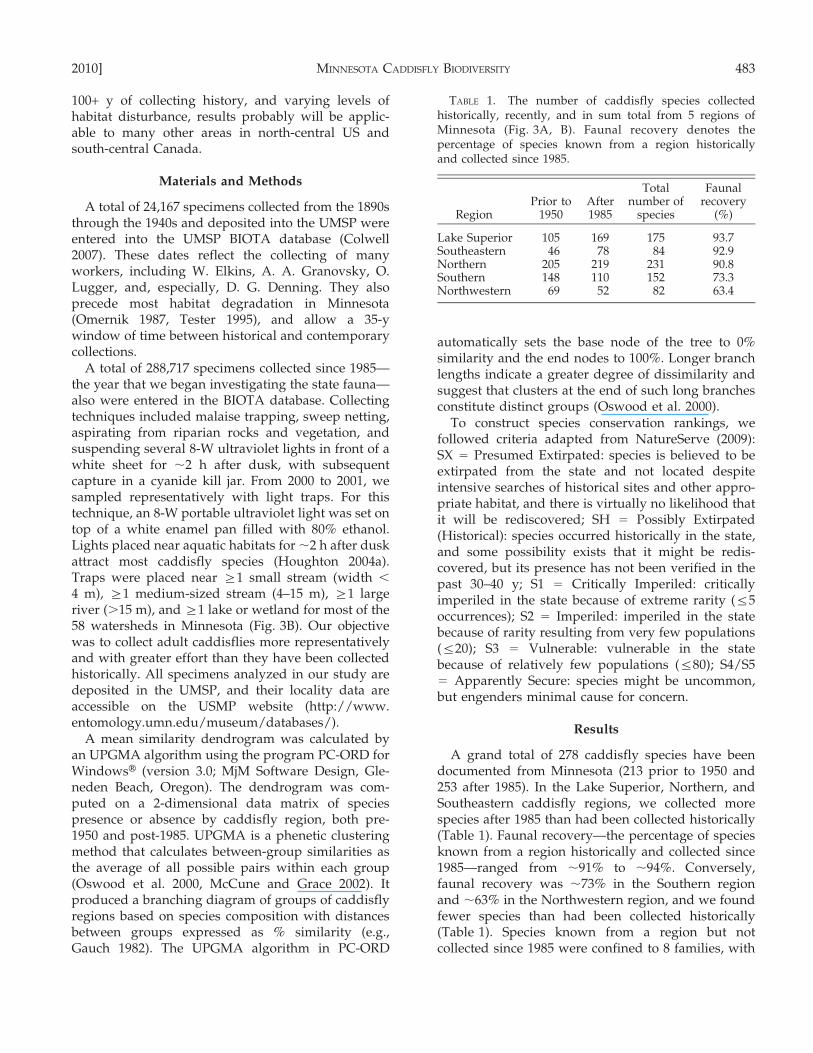
A grand total of 278 caddisfly species have beendocumented from Minnesota (213 prior to 1950 and253 after 1985). In the Lake Superior, Northern, andSoutheastern caddisfly regions, we collected morespecies after 1985 than had been collected historically(Table 1). Faunal recovery—the percentage of speciesknown from a region historically and collected since1985—ranged from ,91% to ,94%. Conversely,faunal recovery was ,73% in the Southern regionand ,63% in the Northwestern region, and we foundfewer species than had been collected historically(Table 1). Species known from a region but notcollected since 1985 were confined to 8 families, with
TABLE 1. The number of caddisfly species collectedhistorically, recently, and in sum total from 5 regions ofMinnesota (Fig. 3A, B). Faunal recovery denotes thepercentage of species known from a region historicallyand collected since 1985.
RegionPrior to
1950After1985
Totalnumber of
species
Faunalrecovery
(%)
Lake Superior 105 169 175 93.7Southeastern 46 78 84 92.9Northern 205 219 231 90.8Southern 148 110 152 73.3Northwestern 69 52 82 63.4
2010] MINNESOTA CADDISFLY BIODIVERSITY 483
the Arctopsychidae, Limnephilidae, and Phryganei-dae experiencing species loss at a level greater thantheir relative proportion of the statewide fauna(Table 2).
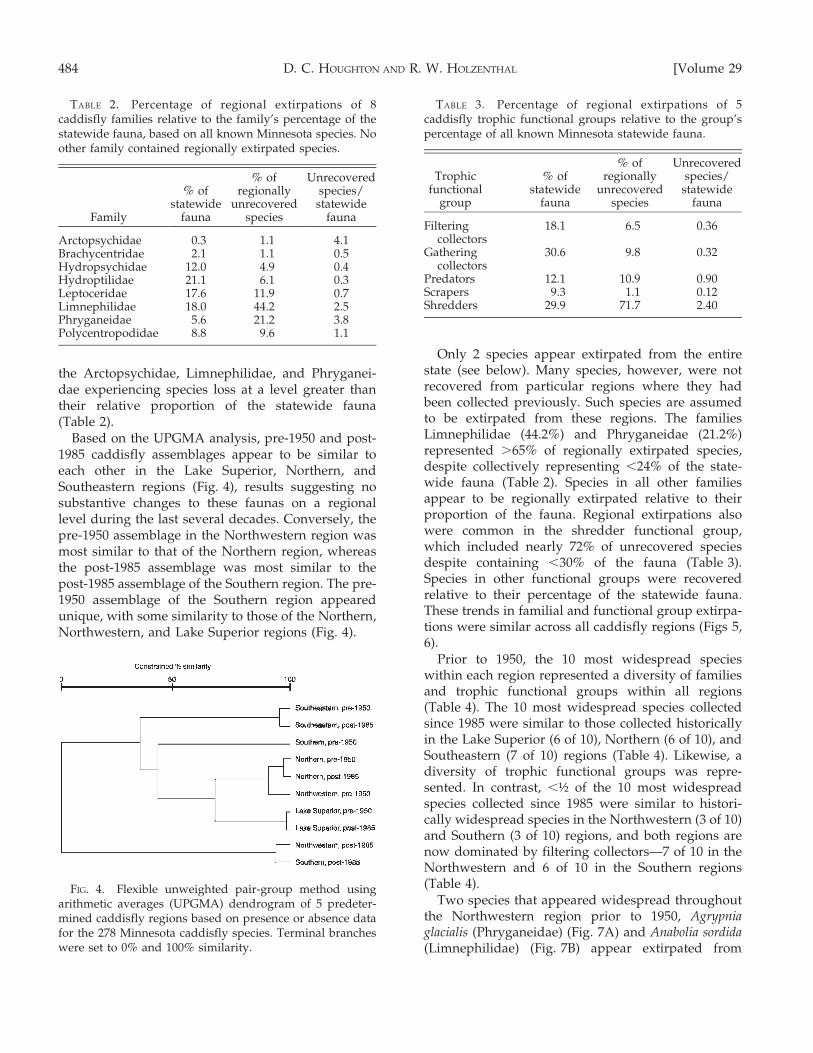
Based on the UPGMA analysis, pre-1950 and post-1985 caddisfly assemblages appear to be similar toeach other in the Lake Superior, Northern, andSoutheastern regions (Fig. 4), results suggesting nosubstantive changes to these faunas on a regionallevel during the last several decades. Conversely, thepre-1950 assemblage in the Northwestern region wasmost similar to that of the Northern region, whereasthe post-1985 assemblage was most similar to thepost-1985 assemblage of the Southern region. The pre-1950 assemblage of the Southern region appearedunique, with some similarity to those of the Northern,Northwestern, and Lake Superior regions (Fig. 4).
Only 2 species appear extirpated from the entirestate (see below). Many species, however, were notrecovered from particular regions where they hadbeen collected previously. Such species are assumedto be extirpated from these regions. The familiesLimnephilidae (44.2%) and Phryganeidae (21.2%)represented .65% of regionally extirpated species,despite collectively representing ,24% of the state-wide fauna (Table 2). Species in all other familiesappear to be regionally extirpated relative to theirproportion of the fauna. Regional extirpations alsowere common in the shredder functional group,which included nearly 72% of unrecovered speciesdespite containing ,30% of the fauna (Table 3).Species in other functional groups were recoveredrelative to their percentage of the statewide fauna.These trends in familial and functional group extirpa-tions were similar across all caddisfly regions (Figs 5,6).
Prior to 1950, the 10 most widespread specieswithin each region represented a diversity of familiesand trophic functional groups within all regions(Table 4). The 10 most widespread species collectedsince 1985 were similar to those collected historicallyin the Lake Superior (6 of 10), Northern (6 of 10), andSoutheastern (7 of 10) regions (Table 4). Likewise, adiversity of trophic functional groups was repre-sented. In contrast, ,½ of the 10 most widespreadspecies collected since 1985 were similar to histori-cally widespread species in the Northwestern (3 of 10)and Southern (3 of 10) regions, and both regions arenow dominated by filtering collectors—7 of 10 in theNorthwestern and 6 of 10 in the Southern regions(Table 4).
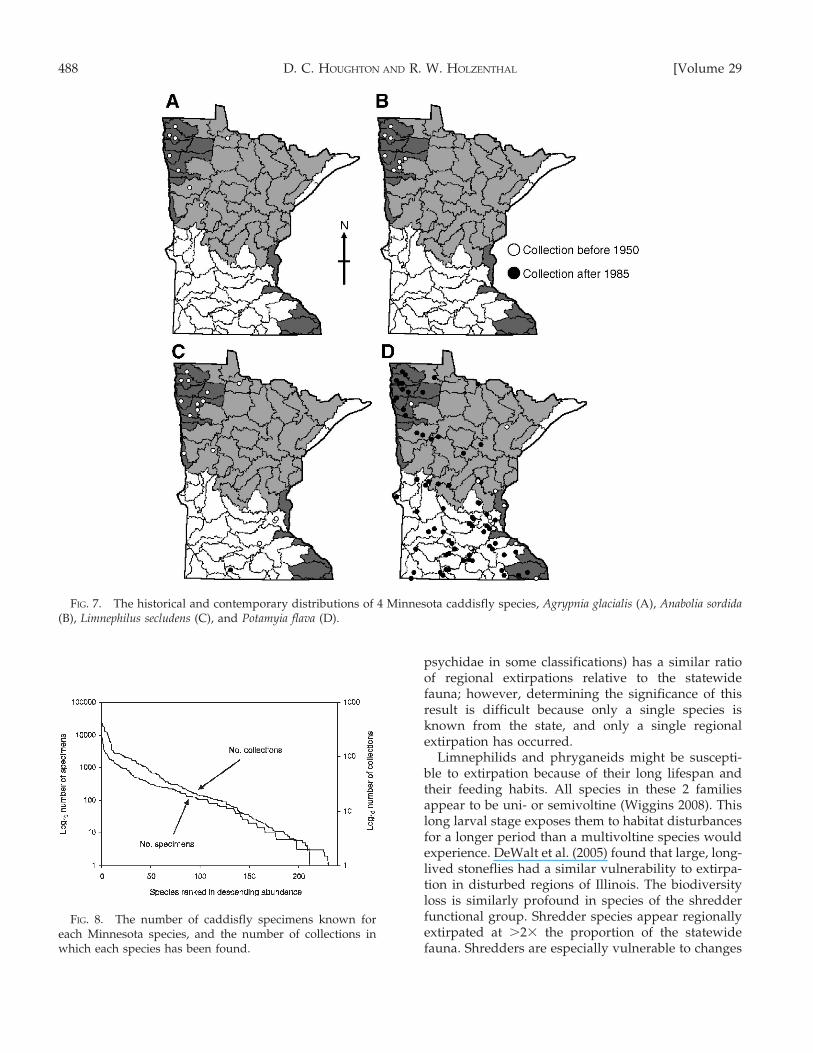
Two species that appeared widespread throughoutthe Northwestern region prior to 1950, Agrypniaglacialis (Phryganeidae) (Fig. 7A) and Anabolia sordida(Limnephilidae) (Fig. 7B) appear extirpated from
TABLE 2. Percentage of regional extirpations of 8caddisfly families relative to the family’s percentage of thestatewide fauna, based on all known Minnesota species. Noother family contained regionally extirpated species.
Family
% ofstatewide
fauna
% ofregionally
unrecoveredspecies
Unrecoveredspecies/
statewidefauna
Arctopsychidae 0.3 1.1 4.1Brachycentridae 2.1 1.1 0.5Hydropsychidae 12.0 4.9 0.4Hydroptilidae 21.1 6.1 0.3Leptoceridae 17.6 11.9 0.7Limnephilidae 18.0 44.2 2.5Phryganeidae 5.6 21.2 3.8Polycentropodidae 8.8 9.6 1.1
FIG. 4. Flexible unweighted pair-group method usingarithmetic averages (UPGMA) dendrogram of 5 predeter-mined caddisfly regions based on presence or absence datafor the 278 Minnesota caddisfly species. Terminal brancheswere set to 0% and 100% similarity.
TABLE 3. Percentage of regional extirpations of 5caddisfly trophic functional groups relative to the group’spercentage of all known Minnesota statewide fauna.
Trophicfunctional
group
% ofstatewide
fauna
% ofregionally
unrecoveredspecies
Unrecoveredspecies/
statewidefauna
Filteringcollectors
18.1 6.5 0.36
Gatheringcollectors
30.6 9.8 0.32
Predators 12.1 10.9 0.90Scrapers 9.3 1.1 0.12Shredders 29.9 71.7 2.40
484 D. C. HOUGHTON AND R. W. HOLZENTHAL [Volume 29

FIG. 5. The number of caddisfly species within 8 families known historically from each of the 5 caddisfly regions and notcollected after 1985 (Fig. 3A, B).
FIG. 6. The number of caddisfly species within 5 trophic functional groups known historically from each of 5 caddisfly regionsand not collected after 1985 (Fig. 3A, B).
2010] MINNESOTA CADDISFLY BIODIVERSITY 485

TA
BL
E4.
Th
e10
mo
stfr
equ
entl
yco
llec
ted
cad
dis
flie
sin
each
cad
dis
fly
reg
ion
bef
ore
1950
and
afte
r19
85(F
ig.
3A,
B).
FC
=fi
lter
ing
coll
ecto
rs,
GC
=g
ath
erin
gco
llec
tors
,P
r=
pre
dat
ors
,S
c=
scra
per
s,S
r=
shre
dd
ers.
Reg
ion
Ran
k
Bef
ore
1950
Aft
er19
85
Sp
ecie
sF
amil
yF
un
ctio
nal
gro
up
Sp
ecie
sF
amil
yF
un
ctio
nal
gro
up
Lak
eS
up
erio
r1
Glo
ssos
oma
nig
rior
Glo
sso
som
atid
aeS
cR
hy
acop
hil
afu
scu
laR
hy
aco
ph
ilid
aeP
r2
Rh
yac
oph
ila
fusc
ula
Rh
yac
op
hil
idae
Pr
Glo
ssos
oma
nig
rior
Glo
sso
som
atid
aeS
c3
Oec
etis
inco
nsp
icu
aL
epto
ceri
dae
Pr
Cer
acle
atr
ansv
ersa
Lep
toce
rid
aeG
C4
Cer
acle
aca
nce
llat
aL
epto
ceri
dae
GC
Oec
etis
inco
nsp
icu
aL
epto
ceri
dae
Pr
5C
erac
lea
tran
sver
saL
epto
ceri
dae
GC
Lep
idos
tom
ato
gat
um
Lep
ido
sto
mat
idae
Sr
6A
nab
olia
con
soci
aL
imn
eph
ilid
aeS
rP
tilo
stom
isse
mif
asci
ata
Ph
ryg
anei
dae
Sr
7C
him
arra
feri
aP
hil
op
ota
mid
aeF
CH
yd
rop
sych
esp
arn
aH
yd
rop
sych
idae
FC
8P
oly
cen
trop
us
cin
ereu
sP
oly
cen
tro
po
did
aeP
rD
olop
hil
odes
dis
tin
ctu
sP
hil
op
ota
mid
aeF
C9
Ch
imar
raso
cia
Ph
ilo
po
tam
idae
FC
Ban
ksio
lacr
otch
iP
hry
gan
eid
aeS
r10
Dol
oph
ilod
esd
isti
nct
us
Ph
ilo
po
tam
idae
FC
Cer
acle
aca
nce
llat
aL
epto
ceri
dae
GC
No
rth
ern
1O
ecet
isin
con
spic
ua
Lep
toce
rid
aeP
rO
ecet
isin
con
spic
ua
Lep
toce
rid
aeP
r2
Ph
ryg
anea
cin
erea
Ph
ryg
anei
dae
Sr
Oec
etis
cin
eras
cen
sL
epto
ceri
dae
Pr
3P
oly
cen
trop
us
cin
ereu
sP
oly
cen
tro
po
did
aeP
rT
riae
nod
esm
arg
inat
aL
epto
ceri
dae
Sr
4C
erac
lea
tran
sver
saL
epto
ceri
dae
GC
Ban
ksio
lacr
otch
iL
imn
eph
ilid
aeS
r5
Oec
etis
avar
aL
epto
ceri
dae
Pr
Cer
acle
atr
ansv
ersa
Lep
toce
rid
aeG
C6
Ban
ksio
lacr
otch
iL
imn
eph
ilid
aeS
rA
nab
olia
con
soci
aL
imn
eph
ilid
aeS
r7
An
abol
iaco
nso
cia
Lim
nep
hil
idae
SC
Ph
ryg
anea
cin
erea
Ph
ryg
anei
dae
Sr
8P
oly
cen
trop
us
inte
rru
ptu
sP
oly
cen
tro
po
did
aeP
rL
epto
ceru
sam
eric
anu
sL
epto
ceri
dae
Sr
9M
yst
acid
esin
terj
ecta
Lep
toce
rid
aeG
CM
olan
na
un
iop
hil
aM
ola
nn
idae
Sc
10L
epto
ceru
sam
eric
anu
sL
epto
ceri
dae
Sr
Cer
acle
aca
nce
llat
aL
epto
ceri
dae
GC
So
uth
east
ern
1B
rach
yce
ntr
us
amer
ican
us
Bra
chy
cen
trid
aeS
rB
rach
yce
ntr
us
amer
ican
us
Bra
chy
cen
trid
aeS
r2
Glo
ssos
oma
inte
rmed
ium
Glo
sso
som
atid
aeS
cG
loss
osom
ain
term
ediu
mG
loss
oso
mat
idae
Sc
3O
ecet
isin
con
spic
ua
Lep
toce
rid
aeP
rH
yd
rop
sych
esl
osso
nae
Hy
dro
psy
chid
aeF
C4
Hel
icop
sych
ebo
real
isH
elic
op
sych
idae
SC
Oec
etis
inco
nsp
icu
aL
epto
ceri
dae
Pr
5H
yd
rop
sych
esl
osso
nae
Hy
dro
psy
chid
aeF
CC
erac
lea
tars
ipu
nct
ata
Lep
toce
rid
aeG
C6
Hy
dro
pti
laco
nsi
mil
isH
yd
rop
tili
dae
GC
Mic
rase
ma
gel
idu
mB
rach
yce
ntr
idae
Sr
7C
erac
lea
tars
ipu
nct
ata
Lep
toce
rid
aeG
CL
epto
ceru
sam
eric
anu
sL
epto
ceri
dae
Sr
8A
gra
yle
am
ult
ipu
nct
ata
Hy
dro
pti
lid
aeG
CP
sych
omy
iafl
avid
aP
sych
om
yii
dae
GC
9L
epto
ceru
sam
eric
anu
sL
epto
ceri
dae
Sr
Hy
dro
psy
che
alh
edra
Hy
dro
psy
chid
aeF
C10
Oec
etis
cin
eras
cen
sL
epto
ceri
dae
Pr
Hel
icop
sych
ebo
real
isH
elic
op
sych
idae
Sc
486 D. C. HOUGHTON AND R. W. HOLZENTHAL [Volume 29
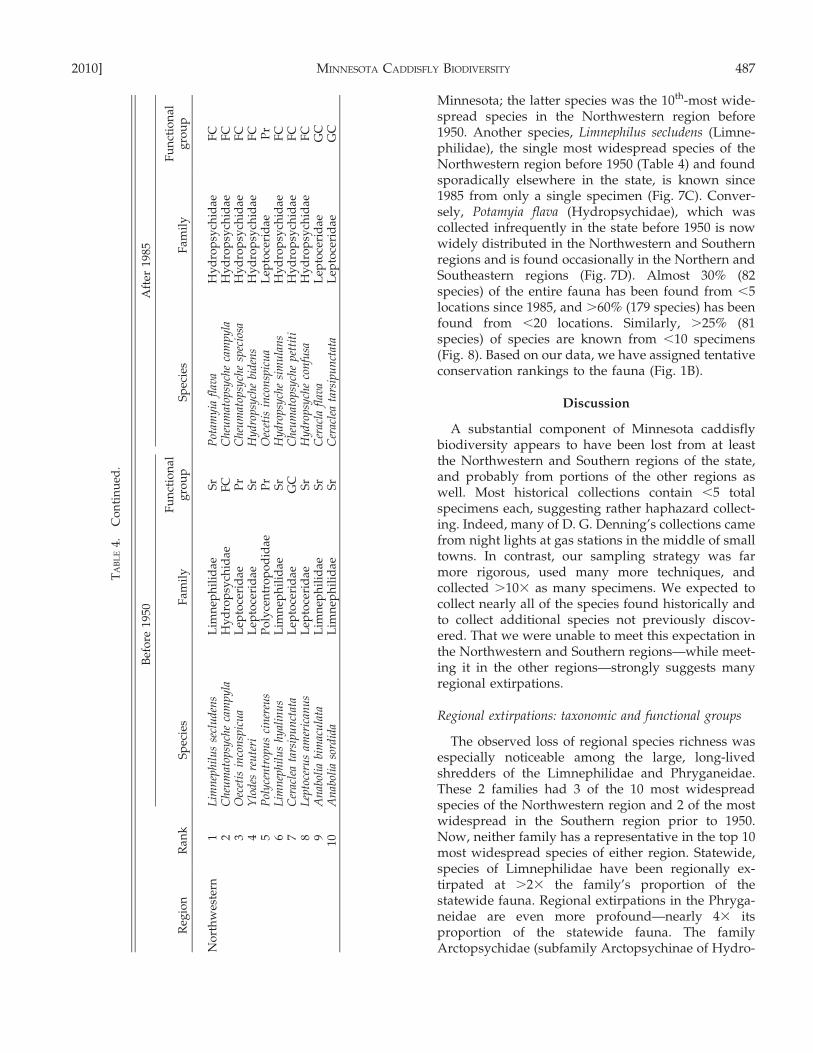
Minnesota; the latter species was the 10th-most wide-spread species in the Northwestern region before1950. Another species, Limnephilus secludens (Limne-philidae), the single most widespread species of theNorthwestern region before 1950 (Table 4) and foundsporadically elsewhere in the state, is known since1985 from only a single specimen (Fig. 7C). Conver-sely, Potamyia flava (Hydropsychidae), which wascollected infrequently in the state before 1950 is nowwidely distributed in the Northwestern and Southernregions and is found occasionally in the Northern andSoutheastern regions (Fig. 7D). Almost 30% (82species) of the entire fauna has been found from ,5locations since 1985, and .60% (179 species) has beenfound from ,20 locations. Similarly, .25% (81species) of species are known from ,10 specimens(Fig. 8). Based on our data, we have assigned tentativeconservation rankings to the fauna (Fig. 1B).
Discussion
A substantial component of Minnesota caddisflybiodiversity appears to have been lost from at leastthe Northwestern and Southern regions of the state,and probably from portions of the other regions aswell. Most historical collections contain ,5 totalspecimens each, suggesting rather haphazard collect-ing. Indeed, many of D. G. Denning’s collections camefrom night lights at gas stations in the middle of smalltowns. In contrast, our sampling strategy was farmore rigorous, used many more techniques, andcollected .103 as many specimens. We expected tocollect nearly all of the species found historically andto collect additional species not previously discov-ered. That we were unable to meet this expectation inthe Northwestern and Southern regions—while meet-ing it in the other regions—strongly suggests manyregional extirpations.
Regional extirpations: taxonomic and functional groups
The observed loss of regional species richness wasespecially noticeable among the large, long-livedshredders of the Limnephilidae and Phryganeidae.These 2 families had 3 of the 10 most widespreadspecies of the Northwestern region and 2 of the mostwidespread in the Southern region prior to 1950.Now, neither family has a representative in the top 10most widespread species of either region. Statewide,species of Limnephilidae have been regionally ex-tirpated at .23 the family’s proportion of thestatewide fauna. Regional extirpations in the Phryga-neidae are even more profound—nearly 43 itsproportion of the statewide fauna. The familyArctopsychidae (subfamily Arctopsychinae of Hydro-
TA
BL
E4.
Co
nti
nu
ed.
Reg
ion
Ran
k
Bef
ore
1950
Aft
er19
85
Sp
ecie
sF
amil
yF
un
ctio
nal
gro
up
Sp
ecie
sF
amil
yF
un
ctio
nal
gro
up
No
rth
wes
tern
1L
imn
eph
ilu
sse
clu
den
sL
imn
eph
ilid
aeS
rP
otam
yia
flav
aH
yd
rop
sych
idae
FC
2C
heu
mat
opsy
che
cam
py
laH
yd
rop
sych
idae
FC
Ch
eum
atop
sych
eca
mp
yla
Hy
dro
psy
chid
aeF
C3
Oec
etis
inco
nsp
icu
aL
epto
ceri
dae
Pr
Ch
eum
atop
sych
esp
ecio
saH
yd
rop
sych
idae
FC
4Y
lod
esre
ute
riL
epto
ceri
dae
Sr
Hy
dro
psy
che
bid
ens
Hy
dro
psy
chid
aeF
C5
Pol
yce
ntr
opu
sci
ner
eus
Po
lyce
ntr
op
od
idae
Pr
Oec
etis
inco
nsp
icu
aL
epto
ceri
dae
Pr
6L
imn
eph
ilu
sh
yal
inu
sL
imn
eph
ilid
aeS
rH
yd
rop
sych
esi
mu
lan
sH
yd
rop
sych
idae
FC
7C
erac
lea
tars
ipu
nct
ata
Lep
toce
rid
aeG
CC
heu
mat
opsy
che
pet
titi
Hy
dro
psy
chid
aeF
C8
Lep
toce
rus
amer
ican
us
Lep
toce
rid
aeS
rH
yd
rop
sych
eco
nfu
saH
yd
rop
sych
idae
FC
9A
nab
olia
bim
acu
lata
Lim
nep
hil
idae
Sr
Cer
acla
flav
aL
epto
ceri
dae
GC
10A
nab
olia
sord
ida
Lim
nep
hil
idae
Sr
Cer
acle
ata
rsip
un
ctat
aL
epto
ceri
dae
GC
2010] MINNESOTA CADDISFLY BIODIVERSITY 487
psychidae in some classifications) has a similar ratioof regional extirpations relative to the statewidefauna; however, determining the significance of thisresult is difficult because only a single species isknown from the state, and only a single regionalextirpation has occurred.
Limnephilids and phryganeids might be suscepti-ble to extirpation because of their long lifespan andtheir feeding habits. All species in these 2 familiesappear to be uni- or semivoltine (Wiggins 2008). Thislong larval stage exposes them to habitat disturbancesfor a longer period than a multivoltine species wouldexperience. DeWalt et al. (2005) found that large, long-lived stoneflies had a similar vulnerability to extirpa-tion in disturbed regions of Illinois. The biodiversityloss is similarly profound in species of the shredderfunctional group. Shredder species appear regionallyextirpated at .23 the proportion of the statewidefauna. Shredders are especially vulnerable to changes
FIG. 7. The historical and contemporary distributions of 4 Minnesota caddisfly species, Agrypnia glacialis (A), Anabolia sordida(B), Limnephilus secludens (C), and Potamyia flava (D).
FIG. 8. The number of caddisfly specimens known foreach Minnesota species, and the number of collections inwhich each species has been found.
488 D. C. HOUGHTON AND R. W. HOLZENTHAL [Volume 29

in riparian habitat—especially a loss of canopy coverand an increase in sedimentation—because theydepend on coarse allochthonous debris for their foodsource (Barbour et al. 1999, Wiggins 2008). Before1950, 6 and 4 of the 10 most widespread species in theNorthwestern and Southern regions, respectively,were shredders. Now no species in the top 10 ofeither region is a shredder. Many limnephilids andphryganeids are shredders (e.g., Wiggins 2008), aconcurrence suggesting that both their feeding habitsand their long lifespan are contributing to theirdecline.
Conversely, species in the Hydropsychidae, parti-cularly Potamyia flava, appear far more widespread inMinnesota now than they were historically. Currentlythis family has 60% and 70% of the most widespreadspecies of Southern and Northwestern regions,respectively. Hydropsychids are all within the filter-ing-collector trophic functional group, and they tendto be tolerant of habitat disturbance (Barbour et al.1999). Some species even increase in streams pollutedby agriculture because they use fine (,0.25 mm)particulate organic matter input as a food resource(Barbour et al. 1999, Houghton 2007, Wiggins 2008).Therefore, agricultural disturbance might promote anincrease in the abundance of some filtering collectorspecies while decreasing overall species richness(Allan 1995, Roth et al. 1996, Barbour et al. 1999),phenomena that appear to be occurring in at least theNorthwestern and Southern regions. Houghton(2004b) found that the presence of 3 hydropsychids,Cheumatopsyche campyla, Hydropsyche simulans, andPotamyia flava, was a strong indicator of habitatdisturbance throughout Minnesota, particularly insmall to medium streams. All 3 of these speciestypically are abundant in large rivers, a resultsuggesting that the presence of agricultural input intosmaller streams is giving such streams the character-istics of larger rivers. In particular, Potamyia flavaappears to have increased markedly in incidencethroughout the state since 1950, especially in theNorthwestern and Southern regions.
Prairies, forests, and disturbance
In the absence of historical data, the observed lowspecies richness, high incidence of filtering collectors,and low incidence of shredders in the Northwesternand Southern regions could have been attributed tothe predominance of the Prairie biotic province withinthese regions (Houghton 2004a). Prairie aquaticecosystems in Minnesota tend to be low gradient,flood-prone, and with relatively little heterogeneity insubstrate or stream flow relative to those of the
Coniferous and Deciduous Forest biotic provinces,which predominate in the other regions (Matthews1988, Tester 1995). Several authors (Statzner andHigler 1985, Wiley et al. 1990, Dodds et al. 1996, Gray1997) have suggested that streams in natural prairieecosystems do not fit into the normal stream models,but instead exhibit increasing relative canopy coverinto the middle stream reaches. Erosion of nutrient-rich prairie soil might lead to naturally high levels ofdissolved N and P in prairie streams (Buol et al. 1989,Anderson et al. 2001). The combination of limitedcanopy cover and high nutrient availability couldpromote ecosystem autotrophy, a lower-than-ex-pected abundance of shredders, and a higher-than-expected abundance of filtering collectors.
However, a comparison of contemporary data withhistorical data suggests that, despite the abundance ofprairie habitats in the Northwestern and Southernregions, the observed low species richness, lowabundance of shredders, and high abundance offiltering collectors is recent and predominantly theresult of anthropogenic disturbance, not naturalfactors. Before 1950, the Northwestern and Southernregions had disparate caddisfly faunas. The North-western region was most similar to the Northernregion, and the Southern region formed its ownunique branch. Now Northwestern and Southernregions have faunas most similar to each other. Thiscontemporary similarity probably is the result of anoverall low species richness within the 2 regions,which was caused by ecosystem homogenization(Houghton 2007).
The most likely cause of the observed homogeniza-tion in the Northwestern and Southern regions isagriculture. Intensive agriculture probably has themost extensive impact of any human land use onaquatic ecosystems (Allan 1995, Wang et al. 1997,Sponseller et al. 2001, Williams et al. 2003, Zimmer-man et al. 2003, Allan 2004). Agriculture often leads tostream channelization, draining of wetlands, modifi-cation or loss of the surrounding floodplain, andremoval of riparian canopy cover with subsequentloss of coarse allochthonous input (Gregory et al.1991, Allan 1995, Delong and Brusven 1998, Quinn2000, Brinson and Malvarez 2002). Agricultural runoffinto aquatic habitats often contains large amounts ofsediment and fine organic matter (Turner andRabalais 1991, Zweig and Rabeni 2001). Collectively,these impacts promote homogenization of streammicrohabitats and an increase in secondary produc-tion, especially in small to medium streams. Essen-tially, small streams develop the characteristics oflarge rivers (Delong and Brusven 1992, 1993, Pringleet al. 1993, Houghton 2007). Riparian disturbance with
2010] MINNESOTA CADDISFLY BIODIVERSITY 489

subsequent nutrient and sediment input was found tobe the most widespread stressor of streams through-out the US (Paulsen at al. 2008). The Northwesternand Southern regions are dominated by agriculturalland use, whereas much of the Northern, LakeSuperior, and portions of the Southeastern regionare forested (USGS 2002).
It is unlikely that the caddisfly faunas of the LakeSuperior, Northern, and Southeastern regions arecompletely natural. Many of the watersheds through-out Minnesota that are now forested were previouslylogged or cultivated, with resulting loss of woodydebris and sediment, and floodplain and channelmodification, effects that can last for tens or hundredsof years (Naiman et al. 1988, Perkins 1994, Bierley etal. 1999, Johnson et al. 2003, Allan 2004). How mucheffect historical disturbance has on contemporarybiological diversity is not clear. In a study ofAppalachian forests, Harding et al. (1998) found thatthe fauna of former agricultural landscapes was moresimilar to that of current agricultural landscapes thanit was to that of primary forest. Wang et al. (2001)attributed differences in fish diversity along anurbanization gradient to the effects of prior agricul-ture along the stream. Conversely, Wang et al. (2003)found that anthropogenic disturbance was less im-portant than natural features in predicting fishassemblages in the relatively undisturbed ecosystemsof northern Michigan and Wisconsin, a landscapesimilar to that of northern Minnesota. Allan (2004)suggested that when human disturbance is ‘‘minor,’’biological diversity is more affected by natural factorsthan by land use. It is difficult to address changes incaddisfly diversity within a region because of thelimitations of the historical data (see below), but theLake Superior, Northern, and Southeastern regions ofMinnesota appear in obvious contrast to the North-western and Southern regions.
Statewide extirpations
Nineteen caddisfly species have not been collectedin Minnesota since 1950. Seventeen of these species(e.g., Philarctus quaeris, Banksiola smithi) are knownfrom ,10 specimens in historical collections. Thus, itis difficult to know whether their absence now reflectsextirpation, natural rarity, or difficulty of collection.Therefore, we have ranked these species as SH(possibly extirpated; Fig. 1B). In contrast, 2 histori-cally common species, Anabolia sordida (Limnephili-dae) and Agrypnia glacialis (Phryganeidae), do appearextirpated (SX) from Minnesota. Both were commonthroughout the Northwestern region through the1940s but have not been collected since. These species
are large and readily attracted to lights, so it isunlikely that they have been overlooked. Anotherspecies, Limnephilus secludens (Limnephilidae), wascommonly collected throughout the Northwesternand Southern caddisfly regions, but has been foundrecently only from a single site. Historically, L.secludens was known predominantly from very smallstreams. Its only recent Minnesota collection was neara stream of width ,0.5 m. Such habitats are nowextremely rare in the Northwestern and Southernregions of Minnesota (e.g., Houghton 2004a).
Regional implications
If the patterns found in our study hold truethroughout the north-central portion of the US, thenit is likely that a large amount of regional caddisflybiological diversity has already been lost. Nature-Serve (2009) considers any species known from ,5locations within a state to be Critically Imperiled andany from ,20 to be Imperiled. By these definitions,almost 30% of the Minnesota caddisfly fauna iscritically imperiled and .60% is imperiled, anincrease of nearly 2 orders of magnitude over theofficial NatureServe ranking (Fig. 1A). The increase inthe number of caddisfly species at risk in Minnesotaclearly reflects a lack of rigorous conservationresearch before our study because the vast majorityof Minnesota species have no previous ranking. Asimilar situation exists in other states of the north-central US, where .90% of species cannot be rankedbecause of insufficient conservation data.
Overextrapolating our results is a possible danger,but we suspect that caddisfly faunas are in worsecondition in other north-central states than inMinnesota. Minnesota has far more refuge habitats,especially in the Northern and Lake SuperiorRegions, than do most other north-central states.Indeed, .80% of the original Coniferous Forest and,60% of the Deciduous Forest in Minnesota remainstanding, albeit fragmented in places and subjected tohistorical logging (USGS 2002). Conversely, .95% ofMinnesota’s prairie has been converted to agricultureor urban environments. This latter situation is foundin most other north-central states. For example, Iowa,Illinois, and Indiana are some of the most disturbedstates in the country, with large-scale agriculture andurbanization accounting for 80–90% of the land useand with few refuge habitats remaining (USGS 2002).More generally, .70% of the wadeable streams of thePlains and Lowlands region of the US—whichincludes the states mentioned in our study as wellas others—are in Fair or Poor condition (Paulson etal. 2008).
490 D. C. HOUGHTON AND R. W. HOLZENTHAL [Volume 29

If our results can be extrapolated to areas of thenorth-central US with similar land use, then the levelof caddisfly imperilment is probably at least as highas that of crayfish, mussels, gastropods, or fish on thenational level (Master et al. 2000, Lynse et al. 2008,Perez and Minton 2008). Other aquatic insects,especially those normally classified as intolerant, suchas stoneflies and mayflies, probably have experiencedsimilar losses of biodiversity. This hypothesis issupported by DeWalt et al.’s (2005) finding of .50%
extirpation or imperilment of stoneflies in Illinois.The ecosystem homogenization and shift in trophic
functional composition seen in areas of Minnesotadominated by large-scale agriculture probably areoccurring in a large portion of the north-central US.Large-scale agriculture covers .90% of the Prairiebiotic province, 95% of the Minnesota River basin,and nearly 70% of the upper Mississippi River basin(Tester 1995, Allan 2004, Benke and Cushing 2004). Alarge amount of biological diversity probably alreadyhas been lost as diverse ecosystems became homo-genized into ecosystems dominated by pollution-tolerant filtering collectors.
Limitations of historical data
Collections of caddisfly specimens before 1950appear to have been done in a haphazard manner.Thus, any possible collector bias from this era isdifficult to ascertain. Such a bias, if it existed, couldhave influenced our results. For example, both theLimnephilidae and Phryganeidae contain large, con-spicuous, and strong-flying adults that are readilyattracted to lights (Houghton 2004a). Thus, they couldhave been overrepresented in historical collectionsrelative to their actual abundance. If so, then themagnitude of their decline might be overstated in ourpaper. Conversely, our observed increase in hydro-psychids, such as Potamyia flava, also might beoverstated because collector disinterest could causesuch species to be underrepresented in historicalcollections. However, we mitigated such potentialconcerns by analyzing species incidence rather thanspecies abundance. Furthermore, we evaluated ex-tirpations on a regional level, rather than in smallerareas, such as watersheds. Thus, a single collection ofa species and multiple collections of a species wereboth recorded as species presence within a region,regardless of the abundance of that species. Therefore,over- and underrepresentation of species because ofcollector bias probably had minimal effect on ouranalyses.
Indeed, because of our concerns about possiblehistorical collecting bias and our subsequent conser-
vative approach to analysis, we are not convinced thatcaddisfly biodiversity has remained stable since 1950even in the Lake Superior, Northern, and South-eastern regions, despite our stated conclusions. In ourstudy, a single collection from a region counted as aspecies recovery even if the distribution of thatspecies had been reduced elsewhere in the region.For example, species recovery was .90% in theSoutheastern region despite large-scale disturbancethroughout the region. This recovery rate was almostentirely because of the state park system that protectsthe forested headwaters of many small and mediumstreams (USGS 2002). Other areas of the region nowcontain very little caddisfly diversity and, thus, wesuspect that many species have been locally extir-pated. However, rigorously assessing such potentialchanges in subregional distributions is impracticalbecause of the limitations of the historical data. Withgood baseline data now in place for Minnesota andavailable online, any future changes to the fauna canbe evaluated with greater confidence and precision.
Taxonomy, museums, and conservation
Any scientific species recovery plan must beginwith a well-established taxonomy (Wheeler 2004). Forexample, terrestrial birds and mammals are almostcertainly listed as Threatened (IUCN 2009) morefrequently than are insects simply because they areconspicuous, well known, and easier to identify. Inthe case of birds, scientific contributions from ama-teurs with field guides are as important as those fromprofessionals (e.g., LeBaron 2008). In contrast, insectsare difficult to identify to the species level withoutsubstantial training, and the number of such trainedtaxonomists is in decline (Moulton 2004). Further-more, many bird and mammal faunas have beenstudied for .100 y—often without substantialchanges to their taxonomy—yielding many publishedhistorical data to compare with contemporary data. Incontrast, insect systematics is far more dynamic,rendering nearly all published data obsolete exceptto the diminishing number of taxonomic experts.Indeed, both the NatureServe and Minnesota Depart-ment of Natural Resources lists of at-risk Minnesotacaddisflies contain many taxonomic errors, includingmisidentified specimens, synonymized species, andnomina dubia (Houghton and Holzenthal 2003).
In the absence of a well-established taxonomy orample historical published data and with the biologi-cal integrity of freshwater ecosystems continuing todecline (Karr and Chu 1999, Paulsen at al. 2008,Shapiro et al. 2008), the aquatic insect conservationbiologist faces a serious challenge. In fact, some
2010] MINNESOTA CADDISFLY BIODIVERSITY 491

authors (e.g., Wishart and Davies 2003, Strayer 2006)have argued that traditional species-based conserva-tion is impractical for aquatic invertebrates because ofthe lack of conservation data, the high degree ofimperilment of the faunas, and the need to protectlarge drainage basins instead of merely the localhabitats where aquatic invertebrates occur. However,before the protection of such large habitats can bejustified realistically to a skeptical public, conserva-tionists must first clearly demonstrate that declines inaquatic insect biological diversity have occurred.Ultimately, museums remain the single best sourceof historical data for assessing changes in biologicaldiversity, especially as is the case of the UMSP, whensuch data are in a database and available to thescientific community (Krishtalka and Humphrey2000, Guralnick and Van Cleve 2005, Flemons et al.2007). Unfortunately, support for such collections isdecreasing worldwide (Graham et al. 2004, Suarezand Tsutui 2004, Winkler 2004, Gaubert et al. 2006).Considering the large number of collections andspecimens, extensive database, and distributionalanalyses (Houghton 2004a, 2007), the Minnesotacaddisfly fauna is as well known as any US aquaticinsect fauna. We sincerely hope that research on thefaunas of other states and taxonomic groups isimplemented quickly, so that science-based conserva-tion strategies for this extremely important assem-blage of organisms can be implemented on a largescale.
Acknowledgements
Primary funding for this research came from a USEnvironmental Protection Agency Science to AchieveResults Fellowship to DCH and substantial supportfrom the Minnesota Nongame Wildlife Tax Checkoffand Minnesota State Park Nature Store Sales throughthe MNDNR Natural Heritage and Nongame Re-search Program. Special thanks are due to R. J. Baker,MNDNR, for assistance with the latter fundingsource. Further support to DCH came from a DoctoralDissertation Special Grant from the Graduate School,University of Minnesota (UM); several grants fromthe Dayton and Wilkie Fund, Bell Museum of NaturalHistory, UM; and from grants from the Chiang TravelFund, Department of Entomology, UM. Furthersupport to RWH came from the UM Insect Collectiongrants AES0017015 and AES0017017.
We sincerely thank the many workers, from the1890s to the 2000s, who have collected Minnesotacaddisflies and deposited them into the University ofMinnesota Insect Collection, especially R. J. Blahnik,D. G. Denning, D. A. Etnier, W. Elkins, A. A.
Granovsky, J. Huisman, O. Lugger, D. B. MacLean,and M. P. Monson. Furthermore, we thank G. D.Archibald, M. L. Galatowitsch, K. A. Egerman, C. C.Fenendael, P. A. Gillis, K. Ha, A. S. Haughland, T. J.Ling, E. A. Malcolm, N. J. O’Neil, R. C. Stephen, J. M.Zaspel, and J. L. Zeglin for laboratory assistance; andM. Carroll, D. A. Etnier, E. Etnier, K. Ghandi, and R.Suranyi for field assistance. A permit to collect in StatePark habitats was provided by E. Quinn, MNDNR,Division of Parks and Recreation. A conversation withW. E. DeWalt stimulated several of our analyses. Thevaluable comments of R. J. Blahnik and 2 anonymousreferees improved earlier versions of the manuscript.
Literature Cited
ALLAN, J. D. 1995. Stream ecology: structure and function ofrunning waters. Chapman and Hall, London, UK.
ALLAN, J. D. 2004. Landscapes and riverscapes: the influenceof land use on stream ecosystems. Annual Review ofEcology, Evolution, and Systematics 35:257–284.
ANDERSON, J. L., J. C. BELL, T. H. COOPER, AND D. F. GRIGAL.2001. Soils and landscapes of Minnesota. AG-FO-02331.University of Minnesota Extension Service, St. Paul,Minnesota. (Available from: http://www.extension.umn.edu/distribution/cropsystems/DC2331.html)
BAILEY, R. G. 1980. Descriptions of the ecoregions of theUnited States. U.S. Forest Service Miscellaneous Pub-lications 1391:1–58.
BARBOUR, M. T., J. GERRITSEN, B. D. SNYDER, AND J. B. STRIBLING.1999. Rapid bioassessment protocols for use in streamsand rivers: periphyton, benthic macroinvertebrates, andfish. 2nd edition. EPA 841-B-99-002. Office of Water, USEnvironmental Protection Agency, Washington, DC.
BENKE, A. C., AND C. E. CUSHING. 2004. Rivers of NorthAmerica. Academic/Elsevier, San Diego, California.
BETTEN, C. 1934. The caddis flies or Trichoptera of New YorkState. Bulletin of the New York State Museum 292:1–576.
BIERLEY, G. J., T. COHEN, K. FRYIRS, AND A. BROOKS. 1999. Post-European changes to the fluvial geomorphology of Begacatchment, Australia: implications for river ecology.Freshwater Biology 41:839–848.
BRINSON, M. M., AND A. I. MALVAREZ. 2002. Temperatefreshwater wetlands: types, status, and threats. Envir-onmental Conservation 29:115–133.
BUOL, S. W., F. D. HOLE, AND R. J. MCCRACKEN. 1989. Soilgenesis and classification. 3rd edition. Iowa StateUniversity Press, Ames, Iowa.
COLWELL, R. K. 2007. Biota II: The biodiversity databasemanager. Sinauer Associates, Ltd., Sunderland, Massa-chusetts.
DELONG, M. D., AND M. A. BRUSVEN. 1992. Patterns ofchlorophyll a in an agricultural non-point sourceimpacted stream. Water Resources Bulletin 28:731–741.
DELONG, M. D., AND M. A. BRUSVEN. 1993. Storage anddecomposition of particulate organic matter along the
492 D. C. HOUGHTON AND R. W. HOLZENTHAL [Volume 29
longitudinal gradient of an agriculturally-impactedstream. Hydrobiologia 262:77–88.
DELONG, M. D., AND M. A. BRUSVEN. 1998. Macroinvertebratecommunity structure along the longitudinal gradient ofan agriculturally impacted stream. EnvironmentalManagement 22:445–457.
DEWALT, D. E., C. FAVRET, AND D. W. WEBB. 2005. Just howimperiled are aquatic insects? A case study of stoneflies(Plecoptera) in Illinois. Annals of the EntomologicalSociety of America 98:941–950.
DODDS, W. K., R. E. HUSTON, A. C. EICHEM, M. A. EVANS, D. A.GUDDER, K. M. FRITZ, AND L. J. GRAY. 1996. The relation-ship between flow and light to primary production andproducer biomass in a prairie stream. Hydrobiologia333:151–159.
ELKINS, W. A. 1936. The immature stages of some MinnesotaTrichoptera. Annals of the Entomological Society ofAmerica 29:656–682.
FLEMONS, P., R. GURALNICK, J. KRIEGER, A. RANIPETA, AND D.NEUFELD. 2007. A web-based GIS tool for exploring theworld’s biodiversity: The Global Biodiversity Informa-tion Facility Mapping and Analysis Portal Application(GBIF-MAPA). Ecological Informatics 2:49–60.
GAUBERT, P., M. PAPES, AND A. T. PETERSON. 2006. Naturalhistory collections and the conservation of poorlyknown taxa: ecological niche modeling in centralAfrican rainforest genets (Genetta spp.). BiologicalConservation 130:106–117.
GAUCH, H. G. 1982. Multivariate analysis in communityecology. Cambridge University Press, New York.
GRAHAM, C. H., S. FERRIER, F. HUETTMAN, C. MORITZ, L.TOWNSEND, AND A. PETERSON. 2004. New developments inmuseum-based informatics and applications in biodi-versity analysis. Trends in Ecology and Evolution 19:497–503.
GRAY, L. J. 1997. Organic matter dynamics in King’s Creek,Konza Prairie, Kansas, USA. Pages 50–54 in J. R.Webster and J. L. Meyer (editors). Stream organicmatter budgets. Journal of the North American Bentho-logical Society 16.
GREGORY, S. V., F. J. SWANSON, W. A. MCKEE, AND K. W.CUMMINS. 1991. An ecosystem perspective of riparianzones. BioScience 41:540–551.
GURALNICK, R., AND J. VAN CLEVE. 2005. Strengths andweaknesses of museum and national survey sets forpredicting regional species richness: comparative andcombined approaches. Diversity and Distributions 11:349–359.
HARDING, J. S., E. F. BENFIELD, P. V. BOLSTAD, G. S. HELFMAN,AND E. B. D. JONES. 1998. Stream biodiversity: the ghostof land use past. Proceedings of the National Academyof Sciences of the United States of America 95:14843–14847.
HAWKINS, C. P., R. H. NORRIS, J. GERRITSEN, R. N. HUGHES, S. K.JACKSON, R. K. JOHNSON, AND R. J. STEVENSON. 2000.Evaluation of the use of landscape classifications forthe prediction of freshwater biota: synthesis andrecommendations. Journal of the North AmericanBenthological Society 19:541–556.
HOUGHTON, D. C. 2003. Evaluation of Minnesota geographicclassifications based on caddisfly (Insecta: Trichoptera)data. Great Lakes Entomologist 36:76–92.
HOUGHTON, D. C. 2004a. Minnesota caddisfly biodiversity(Insecta: Trichoptera): delineation and characterizationof regions. Environmental Monitoring and Assessment95:53–182.
HOUGHTON, D. C. 2004b. Utility of caddisflies (Insecta:Trichoptera) as indicators of habitat disturbance inMinnesota. Journal of Freshwater Ecology 19:97–108.
HOUGHTON, D. C. 2007. The effects of landscape-leveldisturbance on the composition of Minnesota caddisflies(Insecta: Trichoptera) trophic functional groups: evi-dence for ecosystem homogenization. EnvironmentalMonitoring and Assessment 135:253–264.
HOUGHTON, D. C., AND R. W. HOLZENTHAL. 2003. Updatedconservation status of Minnesota caddisflies. GreatLakes Entomologist 36:35–40.
IUCN (INTERNATIONAL UNION FOR NATURE AND NATURAL
RESOURCES). 2009. Red list of threatened species. Version2009.2. International Union for Nature and NaturalResources, Cambridge, UK. (Available from: http://www.iucnredlist.org/)
JOHNSON, L. B., D. H. BRENEMAN, AND C. RICHARDS. 2003.Macroinvertebrate community structure and functionassociated with large wood in low gradient streams.River Research and Applications 19:199–218.
KARR, J. K., AND E. CHU. 1999. Restoring life to runningwaters: better biological monitoring. Island Press,Washington, DC.
KRISHTALKA, L., AND P. S. HUMPHREY. 2000. Can natural historymuseums capture the future? BioScience 50:611–617.
LEBARON, G. S. 2008. The 108th Christmas bird count.American Birds 61:1–9.
LYNSE, S. J., K. E. PEREZ, K. M. BROWN, R. L. MINTON, AND J. D.SIDES. 2008. A review of freshwater gastropod conserva-tion: challenges and opportunities. Journal of the NorthAmerican Benthological Society 27:463–470.
MASTER, L. L., B. A. STEIN, L. S. KUTNER, AND G. A.HAMMERSON. 2000. Vanishing assets. Conservation statusof U.S. species. Pages 93–118 in B. A. Stein, L. S. Kutner,and J. S. Adams (editors). Precious heritage, the status ofbiodiversity in the United States. The Nature Conser-vancy and Association for Biodiversity Information,Oxford Press, Oxford, UK.
MATTHEWS, W. J. 1988. North American prairie streams assystems for ecological study. Journal of the NorthAmerican Benthological Society 7:387–409.
MCCUNE, B., AND J. B. GRACE. 2002. Analysis of ecologicalcommunities. MjM Software Design, Gleneden Beach,Oregon.
MNDNR (MINNESOTA DEPARTMENT OF NATURAL RESOURCES).2009a. Minnesota Department of Natural Resourceslakes, rivers, and wetland facts. Minnesota Departmentof Natural Resources, St. Paul, Minnesota. (Availablefrom: http://www.dnr.state.mn.us/faq/mnfacts/water.html)
MNDNR (MINNESOTA DEPARTMENT OF NATURAL RESOURCES).2009b. Minnesota Department of Natural Resources
2010] MINNESOTA CADDISFLY BIODIVERSITY 493
Rare Species Guide, Caddisflies. (Available from:http://www.dnr.state.mn.us/rsg/index.html)
MOULTON, S. R. 2004. NABS selects new taxonomic certifica-tion program coordinator. Bulletin of the North Amer-ican Benthological Society 21:449.
NAIMAN, R. J., C. A. JOHNSTON, AND J. C. KELLEY. 1988.Alteration of North American streams by beaver.BioScience 38:752–762.
NATURESERVE. 2009. NatureServe Explorer: an online ency-clopedia of life [web application]. Version 7.1. Nature-Serve, Arlington, Virginia. (Available from: http://www.natureserve.org/explorer)
OMERNIK, J. M. 1987. Ecoregions of the conterminous UnitedStates. Annals of the Association of American Geolo-gists 77:118–125.
OSWOOD, M. W., J. B. REYNOLDS, J. G. IRONS, AND A. M. MILNER.2000. Distributions of freshwater fishes in ecoregionsand hydroregions of Alaska. Journal of the NorthAmerican Benthological Society 19:405–418.
PAULSEN, S. G., A. MAYIO, D. V. PECK, J. L. STODDARD, E.TARQUINIO, S. M. HOLDSWORTH, J. VAN SICKLE, L. L. YUAN,C. P. HAWKINS, A. T. HERLIHY, P. R. KAUFMANN, M. T.BARBOUR, D. P. LARSEN, AND A. R. OLSEN. 2008. Conditionof stream ecosystems in the US: an overview of the firstnational assessment. Journal of the North AmericanBenthological Society 27:812–821.
PERKINS, S. J. 1994. The shrinking Cedar River: channelchanges following flow regulation and bank armoring.Pages 649–658 in R. A. Marston and V. Haffurther(editors). Effects of human-induced changes on hydro-logic systems. Annual Summer Symposium, 1994.American Water Resources Association, Vernon, Virgi-nia.
PEREZ, K. E., AND R. L. MINTON. 2008. Practical applicationsfor systematics and taxonomy in North Americangastropod conservation. Journal of the North AmericanBenthological Society 27:471–483.
PRINGLE, C., G. VELLIDIS, F. HELIOTIS, D. BANDACU, AND S.CRISTOFOR. 1993. Environmental problems for the Da-nube delta. American Scientist 81:350–361.
QUINN, J. M. 2000. Effects of pastoral development.Pages 209–229 in K. J. Collier and M. J. Winterbourn(editors). New Zealand stream invertebrates: ecologyand implications for management. Caxton, Christch-urch, New Zealand.
RICCIARDI, A. J., AND B. RASMUSSEN. 1999. Extinction rates ofNorth American freshwater fauna. Conservation Biol-ogy 13:1220–1222.
ROSS, H. H. 1944. The caddis flies, or Trichoptera, of Illinois.Bulletin of the Illinois Natural History Survey 23:1–326.
ROTH, N. E., J. D. ALLAN, AND D. E. ERICKSON. 1996. Landscapeinfluences on stream biotic integrity assessed at multi-ple spatial scales. Landscape Ecology 11:141–156.
SHAPIRO, M. H., S. M. HOLDSWORTH, AND S. G. PAULSEN. 2008.The need to assess the condition of aquatic resources inthe US. Journal of the North American BenthologicalSociety 27:808–811.
SPONSELLER, R. A., E. F. BENFIELD, AND R. M. VALETT. 2001.Relationships between land use, spatial scale, and
stream macroinvertebrate communities. FreshwaterBiology 46:1409–1424.
STATZNER, B., AND B. HIGLER. 1985. Questions and commentson the river continuum concept. Canadian Journal ofFisheries and Aquatic Sciences 42:1038–1044.
STRAYER, D. L. 2006. Challenges for freshwater invertebrateconservation. Journal of the North American Bentholo-gical Society 25:271–287.
SUAREZ, A. V., AND N. D. TSUTSUI. 2004. The value of museumcollections for research and study. BioScience 54:66–74.
TESTER, J. R. 1995. Minnesota’s natural heritage, an ecologicalperspective. University of Minnesota Press, Minneapo-lis, Minnesota.
THOMAS, J. A. 2005. Monitoring change in the abundance anddistribution of insects using butterflies and otherindicator groups. Philosophical Transactions of theRoyal Society of London Series B: Biological Sciences360:339–357.
THOMAS, J. A., M. G. TELFER, D. B. ROY, C. D. PRESTON, J. J. D.GREENWOOD, J. ASHER, R. FOX, R. T. CLARKE, AND J. H.LAWTON. 2004. Comparative losses of British butterflies,birds, and plants and the global extinction crisis. Science303:1879–1881.
TURNER, R. E., AND N. N. RABALAIS. 1991. Changes inMississippi River water quality this century. BioScience41:140–147.
USFWS (US FISH AND WILDLIFE SERVICE). 2009. Listed FWS/Joint FWS and NMFS species and populations withrecovery plans. US Fish and Wildlife Service, Depart-ment of the Interior, Washington, DC. (Available from:http://www.fws.gov/endangered/recovery/index.html#program/)
USGS (US GEOLOGICAL SURVEY). 2002. Water resources of theUnited States. US Geological Survey, Reston, Virginia.(Available from: http://water.usgs.gov/)
WANG, L., J. LYONS, AND P. KANEHL. 2001. Impacts ofurbanization on stream habitat and fish across multiplespatial scales. Environmental Management 28:255–266.
WANG, L., J. LYONS, P. KANEHL, AND R. GATTI. 1997. Influencesof watershed land use on habitat quality and bioticintegrity in Wisconsin streams. Fisheries 22(6):6–12.
WANG, L., J. LYONS, P. RASMUSSEN, AND P. SEELBACH. 2003.Watershed, reach, and riparian influences on streamfish assemblages in the Northern Lakes and ForestEcoregion, USA. Canadian Journal of Fisheries andAquatic Sciences 60:491–505.
WHEELER, Q. D. 2004. Taxonomic triage and the poverty ofphylogeny. Philosophical Transactions of the RoyalSociety of London Series B: Biological Sciences 359:571–583.
WIGGINS, G. B. 2008. Trichoptera families. Pages 439–480 inR. W. Merritt, K. W. Cummins, and M. B. Berg (editors).An introduction to the aquatic insects of North America.4th edition. Kendall/Hunt, Dubuque, Iowa.
WILCOVE, D. S., AND L. L. MASTER. 2005. How manyendangered species are there in the United States?Frontiers in Ecology and the Environment 3:414–420.
WILEY, M. J., L. L. OSBORNE, AND R. W. LARIMORE. 1990.Longitudinal structure of an agricultural prairie river
494 D. C. HOUGHTON AND R. W. HOLZENTHAL [Volume 29

system and its relationship to current stream ecosystemtheory. Canadian Journal of Fisheries and AquaticSciences 47:373–384.
WILLIAMS, P., M. WHITFIELD, J. BIGGS, S. BRAY, G. FOX, P. NICOLET,AND D. SEAR. 2003. Comparative biodiversity of rivers,streams, ditches, and ponds in an agricultural landscapein southern England. Biological Conservation 115:329–341.
WINKLER, K. 2004. Natural history museums in a postbiodi-versity era. BioScience 54:455–459.
WISHART, M. J., AND B. R. DAVIES. 2003. Beyond catchmentconsiderations in conservation of lotic biodiversity.Aquatic Conservation 13:429–437.
ZIMMERMAN, J. K., B. VONDRACEK, AND J. V. WESTRA. 2003.Agricultural land use effects on sediment loading andfish assemblages in two Minnesota (USA) watersheds.Environmental Management 32:93–105.
ZWEIG, L. D., AND C. F. RABENI. 2001. Biomonitoring effects ofdeposited sediment in streams. Journal of the NorthAmerican Benthological Society 20:643–657.
Received: 5 March 2009Accepted: 12 January 2010
2010] MINNESOTA CADDISFLY BIODIVERSITY 495