Minnesota Report Card User Guide
29
Minnesota Report Card User Guide Revised February 2019, Version 2 Find the Minnesota Report Card at two locations: • Minnesota Report Card website (http://rc.education.state.mn.us/); or • Minnesota Department of Education website (https://education.mn.gov) > Data Center > Minnesota Report Card
-
Upload
khangminh22 -
Category
Documents
-
view
1 -
download
0
Transcript of Minnesota Report Card User Guide

Minnesota Report Card User Guide
Revised February 2019, Version 2
Find the Minnesota Report Card at two locations:
• Minnesota Report Card website (http://rc.education.state.mn.us/); or • Minnesota Department of Education website (https://education.mn.gov) > Data Center > Minnesota Report Card

Minnesota Report Card User Guide | Revised February 2019, Version 2 Page 2 of 29
Educators in Minnesota schools work hard each day to provide every student with an excellent education. Many factors and programs combine to make each school and student’s experience unique. The Minnesota Report Card is a tool to help inform families and communities about their schools, so they can make important decisions and meaningfully engage with schools and educators. Using the report card, you can find a school’s demographics, see if students attend school regularly, or understand how students are doing on standardized tests. You can learn about the people working in our schools, whether students feel safe and engaged, and how many are graduating and going on to postsecondary. You can even read a message from a school’s leader that might give you insight into the school’s programs, culture or climate.
Federal and state laws require certain information to be available on the report card. For example, you can see if a school is recognized for excellence, or if they have been prioritized for support through Minnesota’s North Star accountability system. Other data are included because we have heard from stakeholders that having access to clear information about schools allows the public to understand how our schools are working to ensure an equitable education for every child. Find more information on Minnesota’s North Star accountability system on the Minnesota Department of Education (MDE)’s School and District Accountability webpage.
MDE collects the required information from various sources and publishes it in separate reports in the Minnesota Report Card. The report card represents various data for Minnesota public schools, students and staff in preschool through grade 12. While the Minnesota Report Card provides a wealth of data, nothing can replace the value of speaking directly to a student’s teacher, or sitting down with a school leader to understand what is going on in a school or the needs of a student.
Note: The Minnesota Report Card is mobile friendly, so the screen, menu and reports adjust to your device.
Table of Contents
Open Reports | Navigate the Report Card ................................................................................................................................................................ 3
View Reports ............................................................................................................................................................................................................ 10
Understand Data in the Reports .............................................................................................................................................................................. 18
Find Reports Alphabetically ..................................................................................................................................................................................... 28
Troubleshooting ....................................................................................................................................................................................................... 29

Minnesota Report Card User Guide | Revised February 2019, Version 2 Page 3 of 29
Open Reports | Navigate the Report Card
The Minnesota Report Card contains a menu, reports and panes (sections) within each report.
You have four options to open a report. Each option is outlined below, and overlaps with the other options. On most reports, you will search for a school or district name or “statewide,” so this guide uses those terms. Some reports allow you to search for counties, charter school authorizers and Head Start agencies; replace these organization names for the “school or district name, or statewide” labels throughout this guide, as appropriate.
Once you have opened a report, go to the View Reports or Understand Data in the Reports section for more information.
Option A: Start with a school or district name, or statewide ........................................................................................................................................ 4
Option B: Start with a report ......................................................................................................................................................................................... 5
Option C: Compare school, district and statewide results ............................................................................................................................................ 7
Option D: Search the map .............................................................................................................................................................................................. 8

Minnesota Report Card User Guide | Revised February 2019, Version 2 Page 4 of 29
Option A: Start with a school or district name, or statewide
Once you select your school or district, you can search for its related reports (see Option B, below). Statewide results default (or you can search for statewide) if you don’t search for a school or district. The label to the left of the search field indicates what you can search for (school, district, county, charter school authorizer or Head Start agency).
1. Click the magnifying glass to open the search field, if it is not already open.
2. Type a school or district name in the search field. As you type, a list of schools, then districts, appears. Or, type “statewide.”
3. Select the school or district from the list (the selection highlights green), or press Enter when the correct choice is in the search field.
4. Click Done, if filters and categories appear. Or, see the Filter Data and Select Categories section for further instructions.
Notes: • To clear typed text, click the gray X in the search field. • After you type a name in the search field, it remains as you search and view reports. Type a new school or district name to begin a
new search, or compare results (see Option C, below).
5. To open a report, follow the steps in Option B, below. 6. Go to the View Reports section in this guide.

Minnesota Report Card User Guide | Revised February 2019, Version 2 Page 5 of 29
Option B: Start with a report
Once you select a report on the left menu, you can search for the school, district and statewide data on that report (see Option A, above). When you type a name in the search field, it remains as you search and view all its reports. The menu contains categories, questions and their reports.
1. View/open the menu categories and questions for the desired report name. Optional: Go to the Find Reports Alphabetically section in this guide to see a list of reports and their menu locations, then return here.
My School report
Categories are shaded blue and cannot be selected.
The categories’ question(s) are shaded gray. Questions are selectable; each opens its related report(s).
The menu remains open on computers, and collapses and expands on phones and tablets.
Minnesota Report Card User Guide | Revised February 2019, Version 2 Page 6 of 29
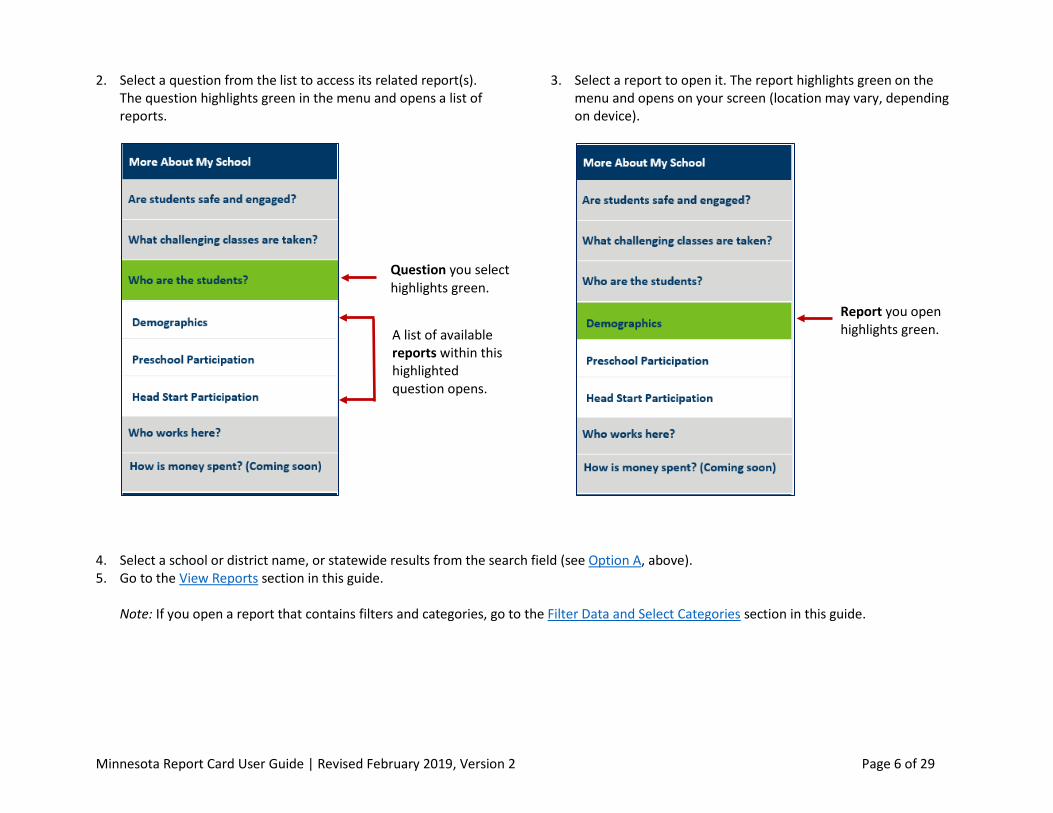
2. Select a question from the list to access its related report(s). The question highlights green in the menu and opens a list of reports.
3. Select a report to open it. The report highlights green on the menu and opens on your screen (location may vary, depending on device).
4. Select a school or district name, or statewide results from the search field (see Option A, above). 5. Go to the View Reports section in this guide.
Note: If you open a report that contains filters and categories, go to the Filter Data and Select Categories section in this guide.
A list of available reports within this highlighted question opens.
Question you select highlights green.
Report you open highlights green.

Minnesota Report Card User Guide | Revised February 2019, Version 2 Page 7 of 29
Option C: Compare school, district and statewide results
In a report, view and compare results for up to six schools or districts, or compare up to five schools or districts with statewide results (choose a combination of results within six, maximum views). Views appear side-by-side or top-to-bottom, depending on your device.
1. Open the desired report by following the instructions in Option B, above, for the first school or district. 2. Click the Add Another View button to the right of or below the report. Statewide results default. 3. Click the magnifying glass to type a new school or district name in the search field. Or, keep the statewide default results. 4. Click Done. 5. Repeat steps 2-4 to add a new view, if desired (three views are shown in the screenshot below).
Notes:
• To change the number of views: Click the Settings (gear) icon in the top, right corner. Slide the counter or type a number (between two and six) in the Maximum number of boxes area. Click Close.
• To close a view: Click the X to the left of the school or district name or “Statewide” in the gray bar.
6. Go to the View Reports section in this guide.

Minnesota Report Card User Guide | Revised February 2019, Version 2 Page 8 of 29
Option D: Search the map
View a list or location pins of schools and districts within a map location. This feature is not available in all reports.
1. Open the desired report, if needed (see Option B, above). 2. Click the magnifying glass if the search feature doesn’t automatically open. 3. Click the Map Search button under the search field (disregard the default “Statewide” text). The map view opens.
4. In the top left of the map screen, do the following:
a. In the Enter an Address field, type either an exact address or a city and state. b. Change the Miles field, if needed (you can request results within 1, 5, 10 or 20 miles from your location).
c. Press Enter. The available results appear in the School/District/Miles list at the bottom of the screen. Red pins appear on the map; each pin represents a school and its district. Notes:
• To zoom in and out on the map, click the plus and minus symbols (under the Miles field). • To clear text in the address field, click the X in the Enter an Address field. • To close the map view and return to the Minnesota Report Card, click the X on the right side of the map.
d. Scroll through the list to find a school or district, or click a red pin for more information.
Clear text Close map

Minnesota Report Card User Guide | Revised February 2019, Version 2 Page 9 of 29
e. Select a school or district either from the list or the link in the red pin results. The report you started on (in steps 1-2) populates. If needed, switch to a different report (see Option B, above).
f. Go to the View Reports section in this guide.

Minnesota Report Card User Guide | Revised February 2019, Version 2 Page 10 of 29
View Reports
Once you open a report, you can view it. Optionally, you can filter data and select categories, print or save an image of a report pane (section), or change the report’s language.
Go to the Open Reports | Navigate the Report Card or Understand Data in the Reports section for more information.
Open and Close Report Panes ...................................................................................................................................................................................... 11
Filter Data and Select Categories ................................................................................................................................................................................. 12
Print or Save an Image of a Report Pane ..................................................................................................................................................................... 14
Change the Language ................................................................................................................................................................................................... 15
My School Report ......................................................................................................................................................................................................... 16

Minnesota Report Card User Guide | Revised February 2019, Version 2 Page 11 of 29
Open and Close Report Panes
Each report contains one or many panes (rectangular sections) of different topics and data. Every school or district has a School Contact Information pane. Panes contain graphs, tables or general information.
• Open a pane to see its details by clicking the plus sign in its gray bar (a plus sign means the pane is closed). • Close a pane by clicking the minus sign (a minus sign means the pane is open).
In the following screenshot of the Test Results and Participation report, the filtered 2018 Participation pane is open; three panes are closed.
Closed pane
Closed panes
Open pane

Minnesota Report Card User Guide | Revised February 2019, Version 2 Page 12 of 29
Filter Data and Select Categories
In some reports, you can select filters (e.g., subjects, grades, years, etc.) and categories (e.g., student groups, staff, etc.) to narrow the search results to the specific data you need. Filters and categories appear if they’re connected to a report. Filters have drop-down lists; categories have boxes. Filters and categories you choose stay selected as you search for and open other reports, if they’re available in the new reports (a specific filter or category may or not be available in another report). When you open a new report, adjust the filters and categories, as needed.
1. Open the desired report. 2. Click the magnifying glass. Filters and categories will appear, if available (see example, on right).
• If you do not see filters and categories, disregard this section. • If you do see filters and categories, continue with these instructions.
3. Search for a specific school or district, or type “statewide,” if one is not already selected or you need to change what was selected before.
4. Follow Option A or B; read the Tip section, below.
Option A: Select or change filters and categories to customize your results
Filters: a. Select the desired filter from the drop-down list (e.g., “Cohort” in example, on right).
or
b. Change a filter by selecting another one from the drop-down list. c. Click Done. The report populates with the new filter criteria. See the Examples section, below. Categories: a. Select one or more categories from the category boxes. Categories are labeled to choose
either one or as many as you like (e.g., “Gender” and “Other Criteria” in example, on right). or
b. Change a category either by clicking it again to clear it, or selecting another one. c. Click Done. The report populates with the new filter criteria. See the Examples section, below.
Option B: Bypass the filters or categories to maintain previously selected filters or view default (recently published) data
a. Select nothing. b. Click Done. The report populates with either your previously selected filters or the default data.
Minnesota Report Card User Guide | Revised February 2019, Version 2 Page 13 of 29
Tip
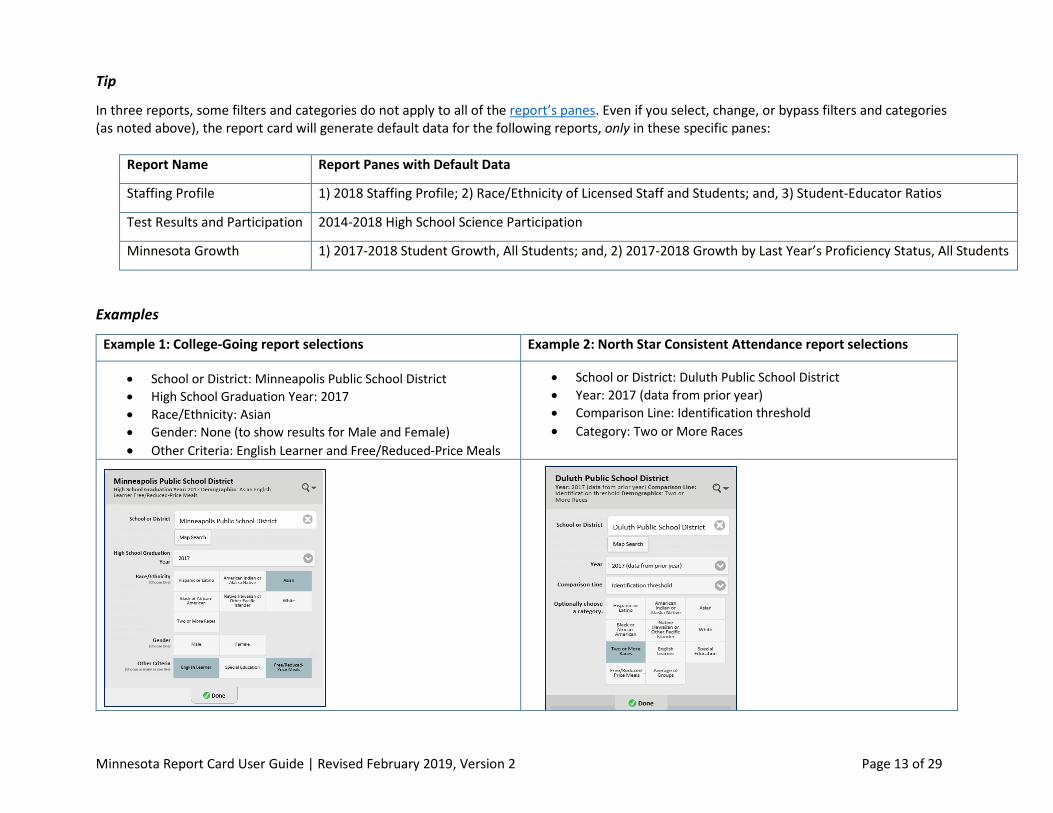
In three reports, some filters and categories do not apply to all of the report’s panes. Even if you select, change, or bypass filters and categories (as noted above), the report card will generate default data for the following reports, only in these specific panes:
Report Name Report Panes with Default Data
Staffing Profile 1) 2018 Staffing Profile; 2) Race/Ethnicity of Licensed Staff and Students; and, 3) Student-Educator Ratios
Test Results and Participation 2014-2018 High School Science Participation
Minnesota Growth 1) 2017-2018 Student Growth, All Students; and, 2) 2017-2018 Growth by Last Year’s Proficiency Status, All Students
Examples
Example 1: College-Going report selections Example 2: North Star Consistent Attendance report selections
• School or District: Minneapolis Public School District • High School Graduation Year: 2017 • Race/Ethnicity: Asian • Gender: None (to show results for Male and Female) • Other Criteria: English Learner and Free/Reduced-Price Meals
• School or District: Duluth Public School District • Year: 2017 (data from prior year) • Comparison Line: Identification threshold • Category: Two or More Races

Minnesota Report Card User Guide | Revised February 2019, Version 2 Page 14 of 29
Print or Save an Image of a Report Pane
1. Open a report’s pane (see the Open and Close Report Panes section, above). 2. Click the three-line menu button in the top, right corner of the pane. A list of options opens.
3. Select the desired option to print a chart or download an image or document. The acronym definitions are:
• PNG (portable network graphics); • JPEG (Joint Photographics Network Group); • PDF (portable document format); or, • SVG (scalable vector graphics).
4. Follow your computer or device prompts to print or save the image. Note: The saved image will not include a table below it. You can save the table in your browser or take a screenshot of it.

Minnesota Report Card User Guide | Revised February 2019, Version 2 Page 15 of 29
Change the Language
You can change the language to English, español, Somali or Hmoob.
1. Click the Language Assistance drop-down menu at the top of the screen.
2. Select the desired language from the list.
3. Click Close.

Minnesota Report Card User Guide | Revised February 2019, Version 2 Page 16 of 29
My School Report
The My School Report provides an overview of your school or district’s data. To open, print or save the report, see below.
Categories in the My School Report
• Message from the school (Information provided by the school or district to MDE; some schools might not have submitted information.); • The number of students attending school regularly; • At my school, teachers care about students; • The number of students meeting standards in math, reading and science over time; • Graduation rate over time; and • Contact information.
Open the My School Report
1. Click My School in the menu. The report name highlights green. 2. Type the school or district name in the search field, then select it from the list. Optionally, search for a school or district from the map (see
the Open Reports | Navigate the Report Card, Option D section, above). The report populates on your screen.
Print or Save the My School Report
3. Follow the steps in the Open the My School Report section, above. 4. Click the PDF Version button in the top, right corner of the report (under the magnifying glass).
5. Do one of the following options at the “open or save” prompt:
a. To print the report, click the Open button. A PDF version opens. b. To save the report, click the Save button.
6. Print or save the report.

Minnesota Report Card User Guide | Revised February 2019, Version 2 Page 17 of 29
My School Report example
PDF Version button

Minnesota Report Card User Guide | Revised February 2019, Version 2 Page 18 of 29
Understand Data in the Reports
There are two options (A and B, below) to help you understand the data in a report.
Note the following for report data:
• Most data is based on a minimum of 10 students. Data affiliated with Minnesota’s North Star accountability system and the Minnesota Student Survey have a minimum of 20 students.
• On some reports, you may see CTSTR (Count Too Small to Report), which means there were fewer than the minimum number of students required in the category of data you selected. CTSTR data cannot be publicly reported due to data privacy concerns.
Option A: Click the question mark icon ( ) at the top of the report or in a report pane.
An informational pop-up opens. The question mark at the top of the report contains general report information. A question mark in a report pane explains the pane’s specific information. To close a pop-up, either click the gray X in the top, right corner, or click outside a pop-up.
Close a pop-up
Open the top pop-up
Open a report-pane pop-up

Minnesota Report Card User Guide | Revised February 2019, Version 2 Page 19 of 29
Option B: Reference the table below.
The table contains each menu category (in top-to-bottom order), its question(s) and related report(s) in the Minnesota Report Card.
• To open or view a report, go to the Open Reports | Navigate the Report Card or View Reports section. • If you can’t find a report you need, go to the Find Reports Alphabetically section. • Reports related to student discipline will be available in spring 2019. School financial data will be available in spring 2020.
Menu Category Menu Question Report Name Report Information
My School n/a My School The My School report includes narrative information provided by the school and an overview of a school’s climate, academic performance, graduation rates, consistent attendance, and information on whether or not the school or district has been prioritized for support or recognized for performance under Minnesota’s North Star accountability system. View information at a school, district or statewide level. The My School report’s individual sections populate from and update in conjunction with their source reports.
n/a n/a n/a n/a
Using the Report Card n/a n/a n/a n/a n/a n/a n/a
More About My School
Are Students Safe and Engaged?
North Star Consistent Attendance
Consistent attendance is one indicator in Minnesota’s North Star accountability system. A student is considered consistently attending if they attend more than 90 percent of the time they are enrolled during the year. Schools and districts report attendance and enrollment data to the state using Minnesota Automated Reporting Student System (MARSS). For more information about how these data are calculated, go to the School and District Accountability webpage. The North Star Consistent Attendance report is released annually in August.

Minnesota Report Card User Guide | Revised February 2019, Version 2 Page 20 of 29
Menu Category Menu Question Report Name Report Information
More About My School
Are Students Safe and Engaged?
Engagement and Safety State legislation requires the Minnesota Department of Education to report summary data on students’ educational engagement, connections at school and school safety. Data in the Engagement and Safety report are taken from the Minnesota Student Survey, which is given every three years to students in fifth, eighth, ninth and 11th grades. The survey is voluntary and anonymous, and covers a wide variety of topics regarding students’ behaviors, experiences, attitudes and beliefs. For more information, go to the Minnesota Student Survey webpage. Or, find Minnesota Student Survey Reports and Tables on the Data Reports and Analytics webpage, under Student Data. The Engagement and Safety report is released every three years in December.
More About My School
What challenging classes are taken?
Rigorous Course Taking This report provides information about Minnesota public high school graduates who enrolled in rigorous courses at any point while in high school. Rigorous Course Taking is defined as enrollment in Postsecondary Enrollment Options (PSEO), Concurrent Enrollment, Advanced Placement (AP) courses, or International Baccalaureate (IB) courses. Upon completion of AP and IB courses, students can take exams to assess their level of course mastery. AP and IB Exam data are included in some of the rigorous course taking reports. If a school does not show any rigorous course taking data, it does not mean that the school does not offer rigorous courses; instead, it means that the data are not currently being reported to MDE. For more information about courses offered in Minnesota schools, go to the Minnesota Common Course Catalogue (MCCC) on the Data Reports and Analytics webpage, under Minnesota Common Course Catalogue (MCCC) Reports. The Rigorous Course Taking report is released annually in April.

Minnesota Report Card User Guide | Revised February 2019, Version 2 Page 21 of 29
Menu Category Menu Question Report Name Report Information
More About My School
Who are the students?
Demographics View demographics data for the state, schools and districts. Charter authorizers cannot be selected in this report. Demographics is grouped by the seven federal race/ethnicity categories, and English learners, students in special education, students receiving free and reduced-price meals, and students experiencing homelessness. Demographics of students enrolled on October 1 of the most recent year of data available are reported here. For more information, go to the Data Reports and Analytics webpage. Under Student Data, click Student. In the Category field, select Enrollment. The Demographics report is released annually in February.
More About My School
Who are the students?
Preschool Participation This report shows kindergartners who participated in a public preschool program prior to kindergarten entry. This includes school district-funded programs, such as School Readiness, school readiness plus, voluntary prekindergarten and Early Childhood Special Education (ECSE). Any kindergartner who participated in any of these programs in the two years prior to kindergarten entry is considered participating in public preschool. For more information about children’s experiences prior to kindergarten, go to the Early Care and Education section of the Early Childhood Longitudinal Data System website. The Preschool Participation report is released annually in February.
More About My School
Who are the students?
Head Start Participation This report shows kindergartners who participated in a Head Start or Early Head Start program prior to kindergarten entry. Head Start and Early Head Start promote the readiness of children from birth to age 5 from low-income families. For more information about Head Start and Early Head Start programs, go to the Head Start webpage. The Head Start Participation report is released annually in February.
Minnesota Report Card User Guide | Revised February 2019, Version 2 Page 22 of 29
Menu Category Menu Question Report Name Report Information
More About My School
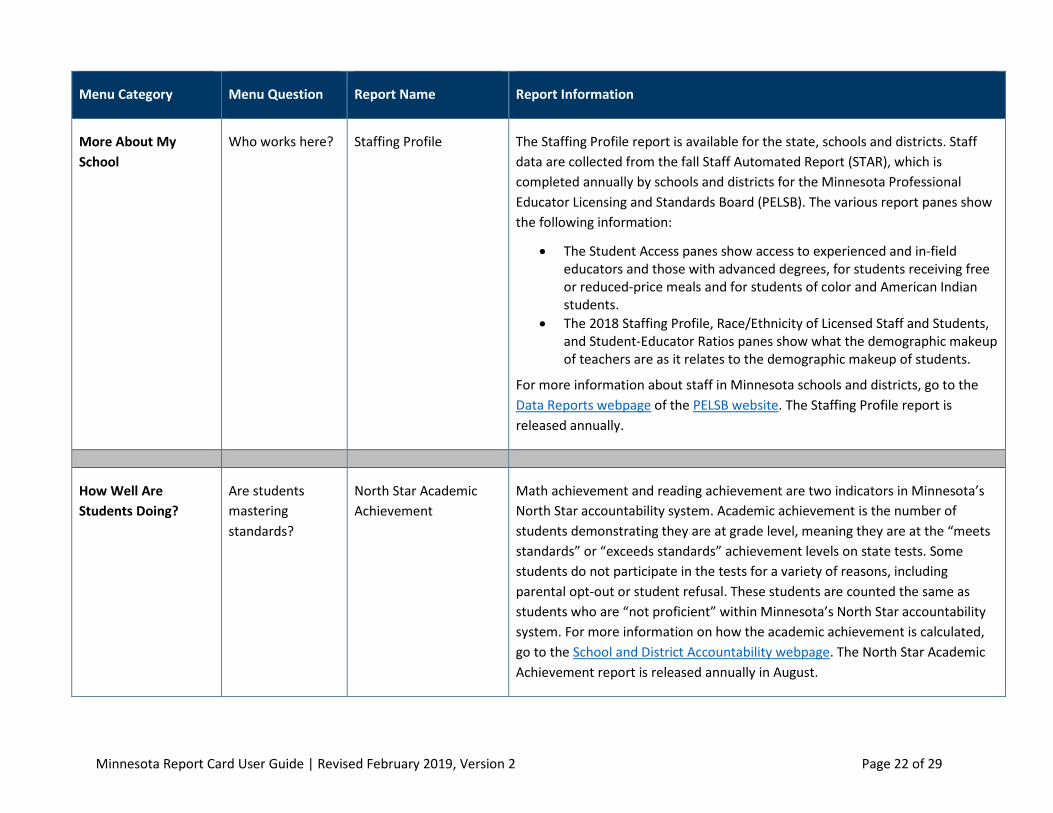
Who works here? Staffing Profile The Staffing Profile report is available for the state, schools and districts. Staff data are collected from the fall Staff Automated Report (STAR), which is completed annually by schools and districts for the Minnesota Professional Educator Licensing and Standards Board (PELSB). The various report panes show the following information:
• The Student Access panes show access to experienced and in-field educators and those with advanced degrees, for students receiving free or reduced-price meals and for students of color and American Indian students.
• The 2018 Staffing Profile, Race/Ethnicity of Licensed Staff and Students, and Student-Educator Ratios panes show what the demographic makeup of teachers are as it relates to the demographic makeup of students.
For more information about staff in Minnesota schools and districts, go to the Data Reports webpage of the PELSB website. The Staffing Profile report is released annually.
n/a n/a n/a n/a
How Well Are Students Doing?
Are students mastering standards?
North Star Academic Achievement
Math achievement and reading achievement are two indicators in Minnesota’s North Star accountability system. Academic achievement is the number of students demonstrating they are at grade level, meaning they are at the “meets standards” or “exceeds standards” achievement levels on state tests. Some students do not participate in the tests for a variety of reasons, including parental opt-out or student refusal. These students are counted the same as students who are “not proficient” within Minnesota’s North Star accountability system. For more information on how the academic achievement is calculated, go to the School and District Accountability webpage. The North Star Academic Achievement report is released annually in August.

Minnesota Report Card User Guide | Revised February 2019, Version 2 Page 23 of 29
Menu Category Menu Question Report Name Report Information
How Well Are Students Doing?
Are students mastering standards?
North Star Academic Progress
Math progress and reading progress are two indicators in Minnesota’s North Star accountability system. Academic progress is a score based on students’ achievement levels from one year to the next. For more information on how the progress is calculated, go to the School and District Accountability webpage. The North Star Academic Progress report is released annually in August.
How Well Are Students Doing?
Are students mastering standards?
Test Results and Participation
This report contains the results and participation for the following: Minnesota Comprehensive Assessments (MCAs); Minnesota Test of Academic Skills (MTAS); MCA-Modified (MOD); and, ACCESS for ELLs. About the tests:
• MCAs are state tests in reading, mathematics and science that measure student performance relative to the Minnesota Academic Standards.
• MTAS is an alternate test based on alternate achievement standards for students with the most significant cognitive disabilities.
• MCA-Modified was an alternate test based on modified achievement standards for a limited group of students with special education needs. The test is no longer given, but you can view data from 2014.
• ACCESS for ELLs (English language learners) are tests given to English learners to measure progress toward meeting Minnesota’s standards for English language development.
Each test connects to specific, selectable years, subjects and grades. For more information about what years the tests are given, go to the Statewide Testing webpage.
The 2014-2018 Proficiency pane shows students who performed at the “meets standards” or “exceeds standards” achievement levels. The participation panes show all students who received a valid score, had their tests invalidated, or did not complete the entirety of the test. The Test Results and Participation report is released annually in August.

Minnesota Report Card User Guide | Revised February 2019, Version 2 Page 24 of 29
Menu Category Menu Question Report Name Report Information
How Well Are Students Doing?
Are students mastering standards?
Test Achievement Levels View test achievement levels for the Minnesota Comprehensive Assessments (MCAs) and Minnesota Test of Academic Skills (MTAS). Students who do not take the test or who do not have a valid score are not included in these data. Students at the “meets standards” and “exceeds standards” achievement levels are considered to be performing at or above grade level. For more information, go to the Data Reports and Analytics webpage. Under Accountability and Assessment, click Assessment and Growth Files. The Test Achievement Levels report is released annually in August.
How Well Are Students Doing?
Are students mastering standards?
Minnesota Growth The Minnesota Growth model compares changes in students’ test scores to the historical performance of students with similar scores. Only students taking the Minnesota Comprehensive Assessment (MCA) are included. The growth result tells whether students are progressing from year to year at expected rates. Expectations for students are set based on average improvements from year to year on statewide assessments. Student growth is categorized as low, medium or high. All students with high growth are considered “on track” to success, as are students with medium growth who were also proficient (that is, were at the “meets standards” or “exceeds standards” achievement level on last year’s tests). For more information, go to the Data Reports and Analytics webpage. Under Accountability and Assessment, click Assessment and Growth Files. In the Test Name field, select Growth. The Minnesota Growth report is released annually in August.
Minnesota Report Card User Guide | Revised February 2019, Version 2 Page 25 of 29
Menu Category Menu Question Report Name Report Information
How Well Are Students Doing?
Are English learners Progressing?
North Star Progress Toward ELP
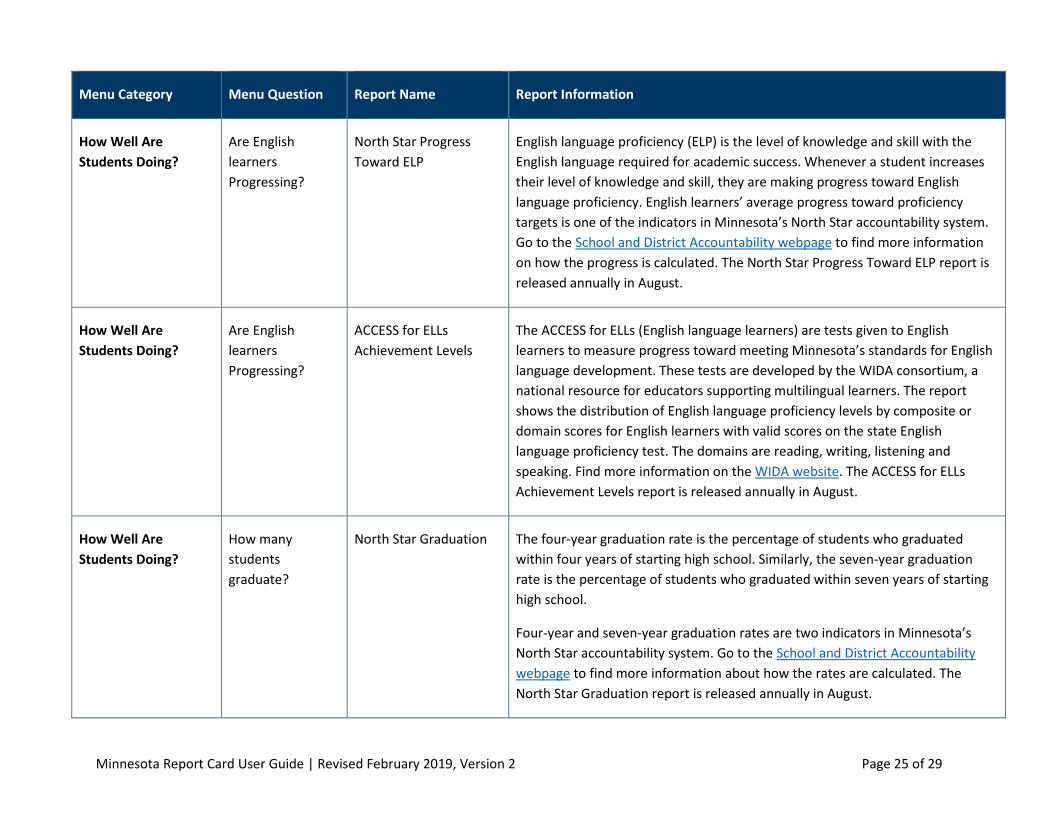
English language proficiency (ELP) is the level of knowledge and skill with the English language required for academic success. Whenever a student increases their level of knowledge and skill, they are making progress toward English language proficiency. English learners’ average progress toward proficiency targets is one of the indicators in Minnesota’s North Star accountability system. Go to the School and District Accountability webpage to find more information on how the progress is calculated. The North Star Progress Toward ELP report is released annually in August.
How Well Are Students Doing?
Are English learners Progressing?
ACCESS for ELLs Achievement Levels
The ACCESS for ELLs (English language learners) are tests given to English learners to measure progress toward meeting Minnesota’s standards for English language development. These tests are developed by the WIDA consortium, a national resource for educators supporting multilingual learners. The report shows the distribution of English language proficiency levels by composite or domain scores for English learners with valid scores on the state English language proficiency test. The domains are reading, writing, listening and speaking. Find more information on the WIDA website. The ACCESS for ELLs Achievement Levels report is released annually in August.
How Well Are Students Doing?
How many students graduate?
North Star Graduation The four-year graduation rate is the percentage of students who graduated within four years of starting high school. Similarly, the seven-year graduation rate is the percentage of students who graduated within seven years of starting high school.
Four-year and seven-year graduation rates are two indicators in Minnesota’s North Star accountability system. Go to the School and District Accountability webpage to find more information about how the rates are calculated. The North Star Graduation report is released annually in August.

Minnesota Report Card User Guide | Revised February 2019, Version 2 Page 26 of 29
Menu Category Menu Question Report Name Report Information
How Well Are Students Doing?
How many students graduate?
Graduation The four-year graduation rate is the percentage of students who graduated within four years of starting high school. The five-, six-, and seven-year rates work similarly, counting students who graduate within five, six, or seven years of starting high school.
In nearly all cases, students are counted at the school where they were last enrolled. Find more information in the summary of graduation rates and graduation rates FAQ.
• The 4-Year Graduation Rate pane provides information about four categories. Graduated students were officially reported as having graduated. Continuing students are taking additional time to complete graduation requirements. Students who officially dropped out are included in the Dropped Out count. The Unknown category includes those students who entered the cohort, but whose status cannot be known from district records.
• The Graduation Rate Trend provides the graduation rate trend for the last five years.
For more information, go to the Data Reports and Analytics webpage. Under Student Data, click Student. In the Category field, select Graduation Rate. Data for additional student groups, such as students experiencing homelessness or students with limited or interrupted formal education, are available here. The Graduation report is released annually in February; in 2019, it is released in April.
How Well Are Students Doing?
How many students go to college?
College-Going This report shows the number of Minnesota public high school graduates who enroll in postsecondary education, and how many have successfully completed 30 or more semester credits in the first 16 months. For more information, go to the Statewide Longitudinal Education Data System (SLEDS) website to find other reports on high school to college transitions using SLEDS data. The College-Going report is released annually in April.

Minnesota Report Card User Guide | Revised February 2019, Version 2 Page 27 of 29
Menu Category Menu Question Report Name Report Information
n/a n/a n/a n/a
How is Minnesota doing?
How do we do on national tests?
NAEP The National Assessment of Educational Progress (NAEP)—The Nation’s Report Card—measures what students across the nation know and are able to do in various subjects in fourth, eighth, and 12th grades. NAEP provides results of student achievement over time and allows for comparisons between states and to the nation as a whole. In the odd-numbered years, NAEP reports state and national results in mathematics and reading for fourth and eighth grade, public school students. Each pane is described below:
• Achievement Level: the NAEP achievement levels are performance standards that describe what students should know and be able to do. Results are reported as percentages of students performing at each level.
• Scale Score Trend: the trend of NAEP average scores for Minnesota and the nation, which represents how students performed on the assessment.
• All Students, English learner (EL), Special Education Participation (Inclusion Rates): to ensure NAEP results are accurately reflecting the educational achievement of all students, NAEP adopted a policy that defines specific inclusion goals. The goal is to include 95 percent of all selected students, and 85 percent of those students who are identified as special education and/or English learners.
Find more information on NAEP at https://nationsreportcard.gov. The NAEP report is released every other year in September.

Minnesota Report Card User Guide | Revised February 2019, Version 2 Page 28 of 29
Find Reports Alphabetically
Each report in the Minnesota Report Card is listed below, alphabetically, with its menu location.
• To open or view a report, go to the Open Reports | Navigate the Report Card or View Reports section. • For more detail on each report, go to the Understand Data in the Reports section. • Reports related to student discipline will be available in spring 2019. School financial data will be available in spring 2020.
Report Name Report Location (within its Menu Category and Question)
ACCESS for ELLs Achievement Levels How Well are Students Doing? > Are English learners progressing?
College-Going How Well are Students Doing? > How many students go to college?
Demographics More About My School > Who are the students?
Engagement and Safety More About My School > Are students safe and engaged?
Graduation How Well are Students Doing? > How many students graduate?
Head Start Participation More About My School > Who are the students?
Minnesota Growth How Well are Students Doing? > Are students mastering standards?
My School My School
NAEP How is Minnesota doing? > How do we do on national tests?

Minnesota Report Card User Guide | Revised February 2019, Version 2 Page 29 of 29
Report Name Report Location (within its Menu Category and Question)
North Star Academic Achievement How Well are Students Doing? > Are students mastering standards?
North Star Academic Progress How Well are Students Doing? > Are students mastering standards?
North Star Consistent Attendance More About My School > Are students safe and engaged?
North Star Graduation How Well are Students Doing? > How many students graduate?
North Star Progress Toward ELP How Well are Students Doing? > Are English learners progressing?
Preschool Participation More About My School > Who are the students?
Rigorous Course Taking More About My School > What challenging classes are taken?
Staffing Profile More About My School > Who works here?
Test Achievement Levels How Well are Students Doing? > Are students mastering standards?
Test Results and Participation How Well are Students Doing? > Are students mastering standards?
Troubleshooting
• We recommend using a Google Chrome or Firefox browser to view the report card; Internet Explorer/Microsoft Edge may produce some technical glitches.
• For questions or issues, contact the MDE Communications Team ([email protected]) or 651-582-8200 (MDE’s main number).