How Credit Card Payments Increase Unhealthy Food Purchases: Visceral Regulation of Vices
Upload
khangminh22Category
view
1download
0
Optimising the use of Credit Card behaviour within risk scorecards
CSCXVI August 2019
Gergana AtanasovaChris Curtis

2 © Experian
Consumer Perspective- Have better understanding of their Credit Card
Portfolios. - Use it as a risk management tools.- Offer the right products to the right customers.
Commercial Perspective
The amount of Credit Card data collected in the recent years allows for more in-depth analysis of customers.
More DataThe variety of analytics techniques available in the recent
years allow for the development and implementation of new solutions.
Tools
Why Classifying Credit Card Users?
- Receive better products and services.- Increased product satisfaction.- Increased incentive to pay Credit Card debt.

3 © Experian
ContentsCredit Card data available within the UK Credit Bureau
Credit Card User Types
Classifying Customer Behaviour
Implementation
Results

4 © Experian
Credit Card data within the Credit Bureau
There are 60.1 million credit cards in the UK (January 2019)
The average number of credit cards per person is 1.7
Average credit card debt per household is £2,649 or £1,386 per person
In credit bureau a snapshot is used traditionally and therefore no information on statement balance/payments
Introduction of APACS data (behavioural Data Sharing) addressed this

5 © Experian
Behavioural Data Sharing (BDS) Overview
BDS is an account level database holding information supplied by credit card companies as part of CAIS
It includes up to six years of credit card information on statement balances, payments, cash advances,
promotional rates, credit card limits, balance transfers.
The information available allows for the investigation of customer behavior and finding patterns in their use
of credit cards.

6 © Experian
Delphi Generation
Gini Coefficients of Banking & Finance
Scores% Uplift in Gini
10 83.4 4.64%
9 79.7 1.66%
8 78.4 1.82%
7 77.0 N/A
Behavioural Data Sharing Usage
BDS data has been firstly introduced in the development of the Generation 10 Bureau Scores.
The addition of CC data in scorecards has resulted in improved scorecard discrimination (based on Gini
coefficient).
How can we make even more use of this data?

7 © Experian
Business-Driven Credit Card User Types Classification

8 © Experian
Credit Card Risk Groups Overview
Focus on Credit Card debt rather than overall
customer performance.
Investigation on how customers are using their
Credit Cards from raw BDS data.
Customers have been split into groups with different level of risk based on the Credit Card Usage in the
last 6 months.
The groups have been converted into an index
and aggregated on customer level by taking
the highest index for each customer.

9 © Experian
Credit Card Risk Groups Performance
0.00%
5.00%
10.00%
15.00%
20.00%
25.00%
700
750
800
850
900
950
1000
1050
1100
0 - No EligibleCC
1 - Inactive 2 - InfrequentUser
3 - Transactor 4 - RecentPromotional
balance
5 - PromotionalBalance
6 - PromotionalBalance - Roll
Over
7 - InfrequentRevolver
8 - Revolver 9 - HardcoreRevolvoer
% B
ad R
ate
Bure
au S
core
Average Bureau Score % Bad Rate
Higher bad rate for groups with lower Bureau score and lower bad rate for groups with higher Bureau score.

10 © Experian
0.00%
10.00%
20.00%
30.00%
40.00%
50.00%
60.00%
70.00%
80.00%
90.00%
low - 500 501 - 700 701 - 800 801 - 900 901 - 980 981 - 1020 1021 - 1050 1051 - 1080 1081 - 1120 1121 - high
Bad
Rat
e
Bureau Score 10% bands
Bad Rate across the Bureau Score bands
Bureau Score 1 - Inactive 2 - Infrequent User 3 - Transactor 4 - Recent Promotional Balance5 - Promotional Balance 6 - Promotional Balance - Roll Over 7 - Infrequent Revolver 8 - Revolver 9 - Hardcore Revolver
Credit Card Risk Groups Alignment
Around equal level of bad rate across the different groups in all bureau score bands
11 © Experian
Data-Driven Credit Card User Types Classification
12 © Experian
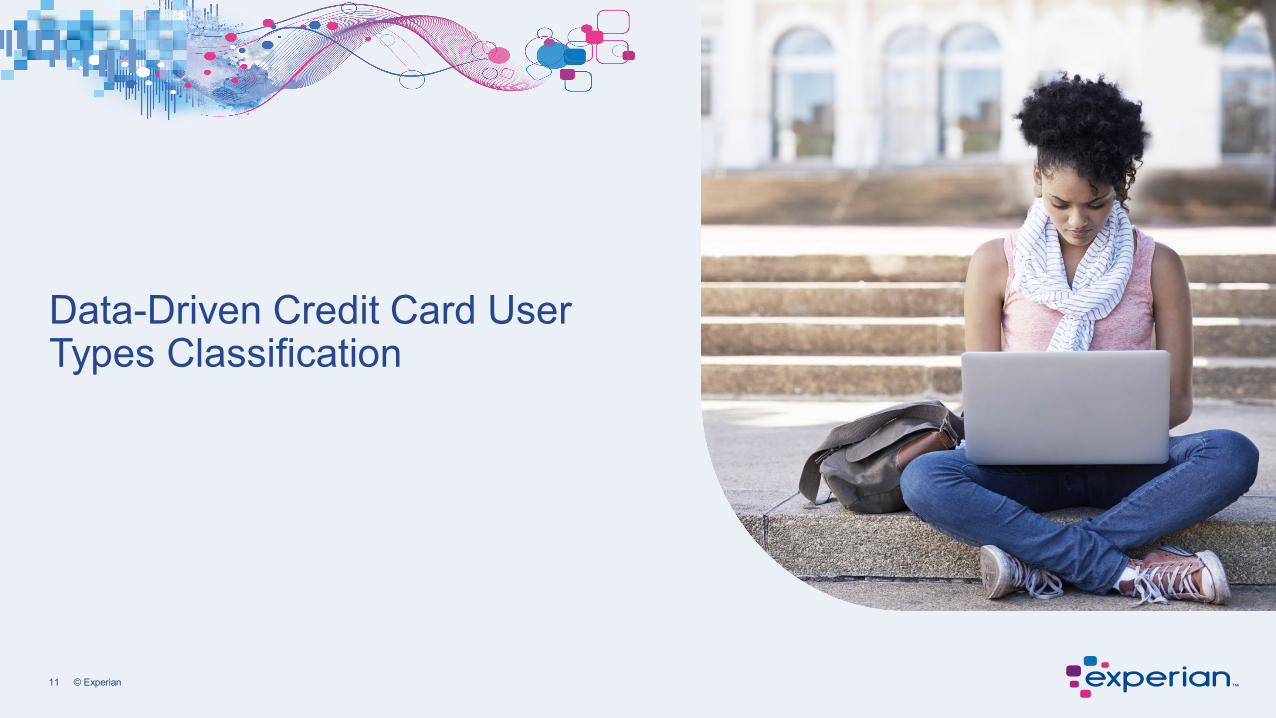
Data Used
Aggregated data has been used instead of account level data.
Transactors
Limited CC Users
High CC Users
CC Users with Low Utilisation
CC Users with
Revolving and
Consistent Debt
In order to fully understand how customers use credit cards, many different dimensions need to be considered, so
along with BDS data, summary variables from other data sources have also been used.
The additional data sources helped to identify groups based not only on the credit card activity,
but also other factors like age, overall indebtedness and likelihood of taking out new credit cards.

13 © Experian
An alternative method for segmenting customers based on the way they are using their credit cards.
Relatively simple approach and easy to understand compared to other classification methods.
Let data decides what groups of customers could be created without referring to known, or labelled
outcome.
The k-means algorithm groups similar data points together, forming clusters of customers that share
similar behavior.
K-means for Credit Card Users Classification
14 © Experian
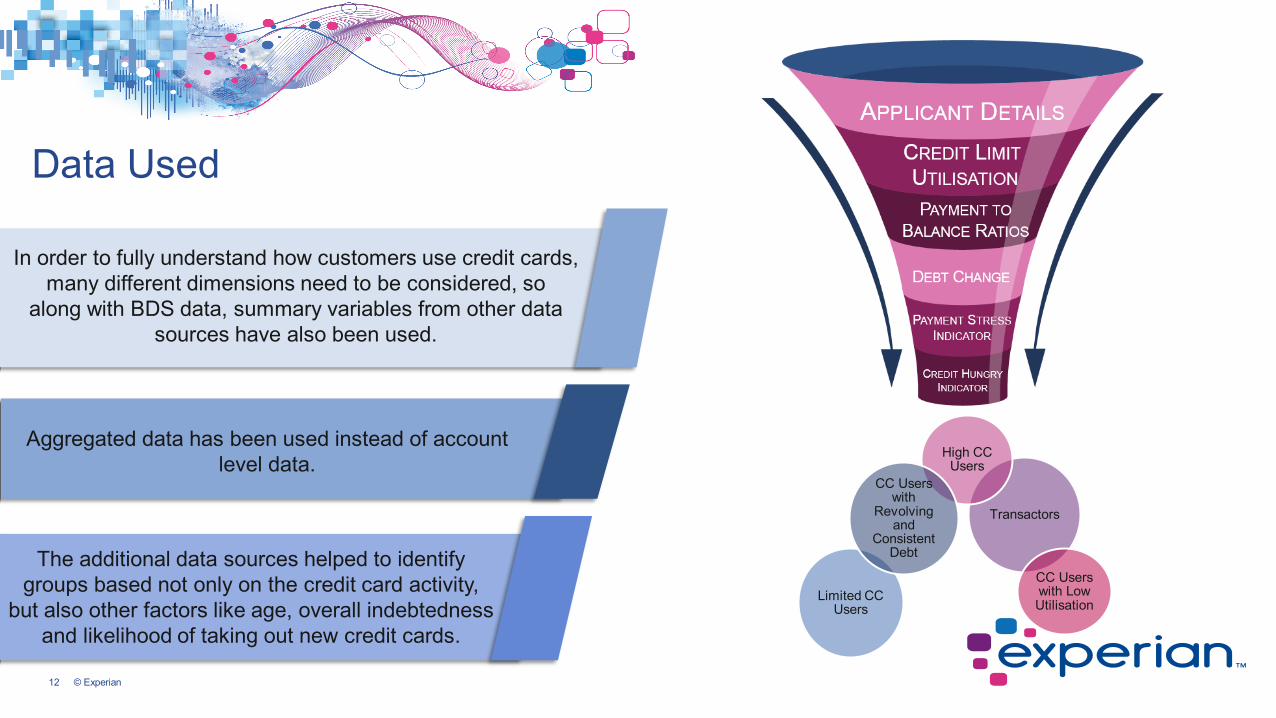
Choosing the Number of Groups
Several versions of k-means with different number of clusters have been tested.
Most versions showed overlapping clusters – customers with similar behaviour were entering different clusters.
The results were showing that the optimal version is k-means with 5 clusters.
15 © Experian
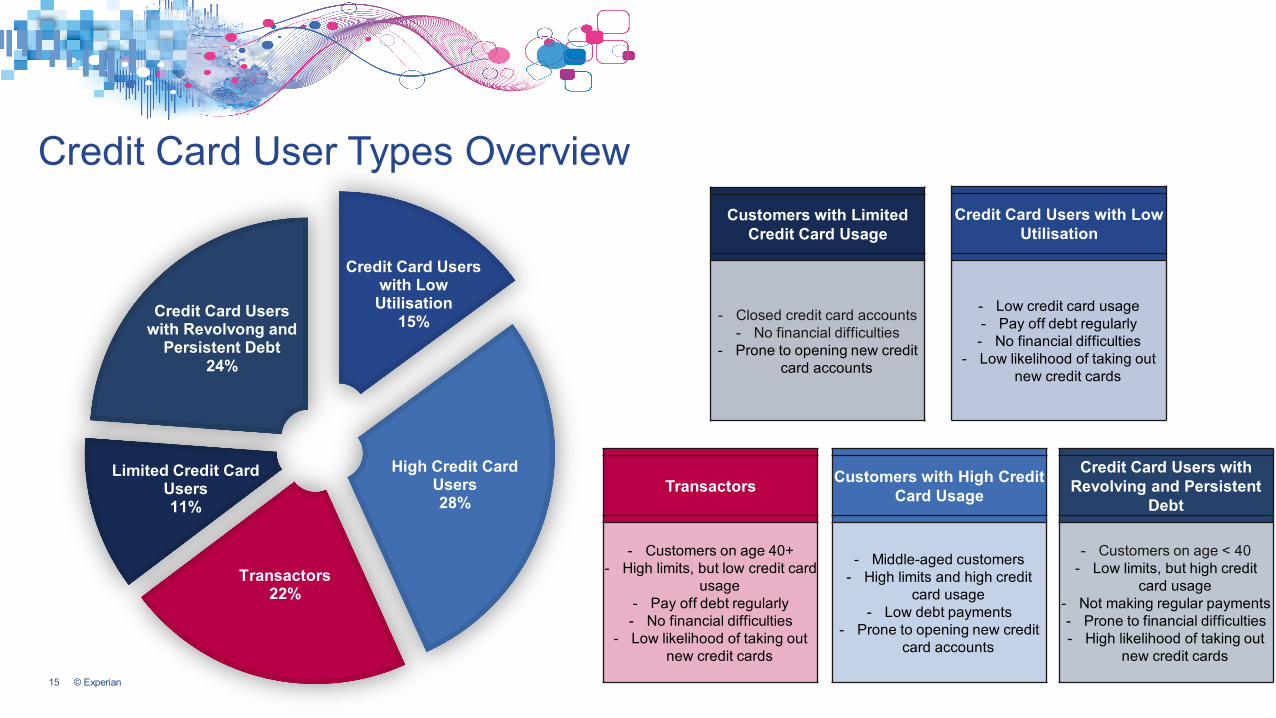
Credit Card User Types Overview
Credit Card Users with Low
Utilisation15%
High Credit Card Users28%
Transactors22%
Limited Credit Card Users11%
Credit Card Users with Revolvong and
Persistent Debt24%
Customers with Limited Credit Card Usage
- Closed credit card accounts- No financial difficulties
- Prone to opening new credit card accounts
Credit Card Users with Low Utilisation
- Low credit card usage- Pay off debt regularly- No financial difficulties
- Low likelihood of taking out new credit cards
Transactors
- Customers on age 40+- High limits, but low credit card
usage- Pay off debt regularly- No financial difficulties
- Low likelihood of taking out new credit cards
Customers with High Credit Card Usage
- Middle-aged customers- High limits and high credit
card usage- Low debt payments
- Prone to opening new credit card accounts
Credit Card Users with Revolving and Persistent
Debt
- Customers on age < 40- Low limits, but high credit
card usage- Not making regular payments- Prone to financial difficulties- High likelihood of taking out
new credit cards

16 © Experian
0.82% 3.13%6.27%
20.31%
37.22%
Transactors Low Utilisation High CC Use and BT Surfers
Limited CC Use Revolving and Persistent Debt
BAD RATE
1045 1066 918 876631
Transactors Low Utilisation High CC Use and BT Surfers
Limited CC Use Revolving and Persistent Debt
AVG BUREAU SCORE
£1,397 £142
£8,135
£193 £2,113
Transactors Low Utilisation High CC Use and BT Surfers
Limited CC Use Revolving and Persistent Debt
AVG BALANCE
11.15% 8.78%
30.29%
0.01%
18.83%
Transactors Low Utilisation High CC Use and BT Surfers
Limited CC Use Revolving and Persistent Debt
AVG CLU
Credit Card User Types Performance Statistics

17 © Experian
0.00%10.00%20.00%30.00%40.00%50.00%60.00%70.00%80.00%90.00%
low - 500 501 - 700 701 - 800 801 - 900 901 - 980 981 - 1020 1021 - 1050 1051 - 1080 1081 - 1120 1121 - high
Bad
Rat
e
Bureau Score 10% Bands
Bad Rate across the Bureau Score bands
Bureau Score Transactors Low Utilisation High CC Use Limited CC Use Revolving and Persistent Debt
Credit Card User Types Alignment
Different level of risk for the different Credit Card User Type groups across the Bureau score bands.

18 © Experian
Implementation

19 © Experian
Implementation with Random Forest
The testing showed that the k-means method can give different results when performed multiple times on the same data.
Therefore the unsupervised approach has been converted into supervised using a Random Forest model.
The Random Forest model predicts the probability of a customer being in any of the groups defined by the k-means method and assigns a customer to the group with highest probability.
Use k-means classification
method to determine the five
clusters
Take the assigned groups
Put them as an outcome
into a Random
Forest model

20 © Experian
Results
97% of the observations on the test sample have been correctly assigned to their actual group.
Group
Actual Groups
Low Utilisation
High CC Use Transactors Limited CC
Use
Revolving and
Persistent Debt
Pred
icte
d G
roup
s
Low Utilisation 95% 0% 2% 0% 1%
High CC Use 1% 96% 2% 0% 2%
Transactors 2% 2% 96% 0% 0%
Limited CC Use 0% 0% 0% 100% 0%
Revolving and
Persistent Debt
1% 2% 0% 0% 97%
21 © Experian
Conclusion
Different techniques could be used for the classification of Credit Card Users.
The output could be used in credit score modelling, or as a separate tool for risk management.
In the future Open Banking data for Credit Cards will provide more information but as this is used to ‘boost’ scores it may be of limited use for risk.

Copyright © 2022 FDOKUMEN