City of Austin, Minnesota
192
Comprehensive Annual Financial Report For the Year Ended December 31, 2018 City of Austin, Minnesota
-
Upload
khangminh22 -
Category
Documents
-
view
2 -
download
0
Transcript of City of Austin, Minnesota

Comprehensive Annual Financial Report
For the Year Ended
December 31, 2018
City of Austin, Minnesota

Special thanks to Nate Howard/Post-Bulletin and Austin 150, Inc. for the use of pictures and logos.

City of Austin, Minnesota
Comprehensive Annual Financial Report
For the Year Ended December 31, 2018
Prepared by:
Finance Department
City of Austin, Minnesota
Comprehensive Annual Financial Report
For The Year Ended December 31, 2018
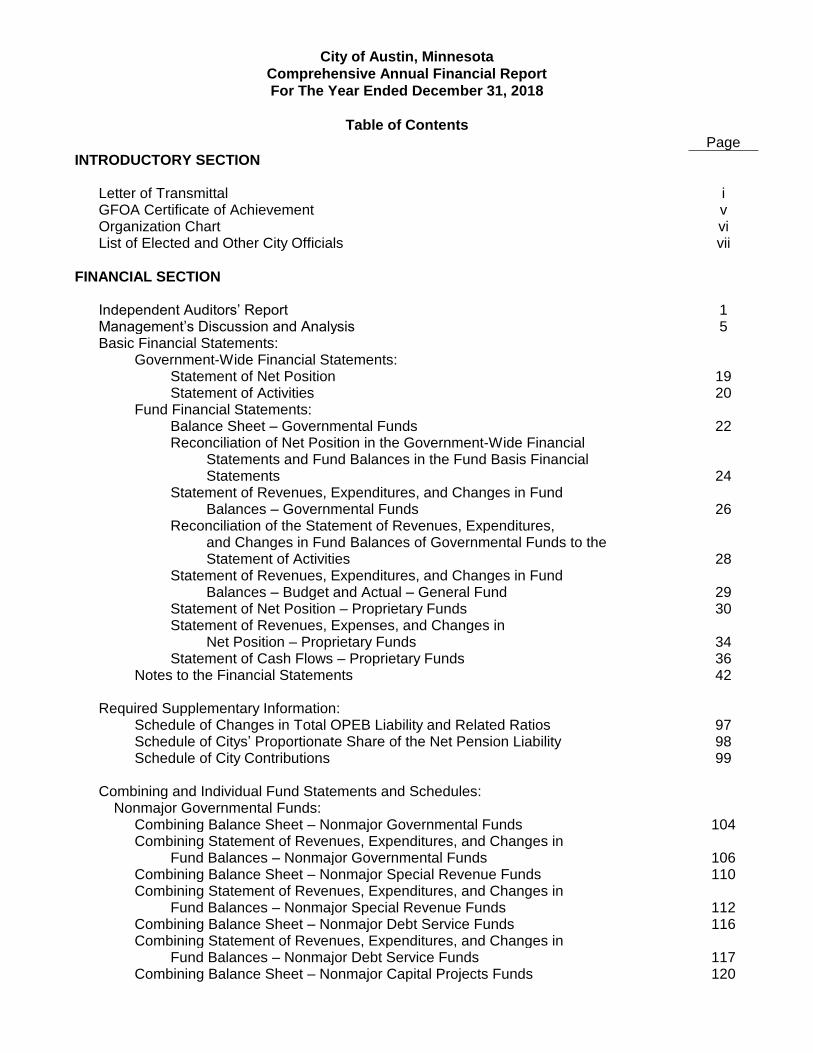
Table of Contents
Page
INTRODUCTORY SECTION
Letter of Transmittal i GFOA Certificate of Achievement v Organization Chart vi List of Elected and Other City Officials vii
FINANCIAL SECTION
Independent Auditors’ Report 1 Management’s Discussion and Analysis 5 Basic Financial Statements: Government-Wide Financial Statements: Statement of Net Position 19 Statement of Activities 20 Fund Financial Statements: Balance Sheet – Governmental Funds 22 Reconciliation of Net Position in the Government-Wide Financial Statements and Fund Balances in the Fund Basis Financial Statements 24 Statement of Revenues, Expenditures, and Changes in Fund Balances – Governmental Funds 26 Reconciliation of the Statement of Revenues, Expenditures, and Changes in Fund Balances of Governmental Funds to the Statement of Activities 28 Statement of Revenues, Expenditures, and Changes in Fund Balances – Budget and Actual – General Fund 29 Statement of Net Position – Proprietary Funds 30 Statement of Revenues, Expenses, and Changes in Net Position – Proprietary Funds 34 Statement of Cash Flows – Proprietary Funds 36 Notes to the Financial Statements 42 Required Supplementary Information: Schedule of Changes in Total OPEB Liability and Related Ratios
Schedule of Citys’ Proportionate Share of the Net Pension Liability Schedule of City Contributions
97 98 99
Combining and Individual Fund Statements and Schedules: Nonmajor Governmental Funds: Combining Balance Sheet – Nonmajor Governmental Funds 104 Combining Statement of Revenues, Expenditures, and Changes in Fund Balances – Nonmajor Governmental Funds 106 Combining Balance Sheet – Nonmajor Special Revenue Funds 110 Combining Statement of Revenues, Expenditures, and Changes in Fund Balances – Nonmajor Special Revenue Funds 112 Combining Balance Sheet – Nonmajor Debt Service Funds 116 Combining Statement of Revenues, Expenditures, and Changes in Fund Balances – Nonmajor Debt Service Funds 117 Combining Balance Sheet – Nonmajor Capital Projects Funds 120

City of Austin, Minnesota
Comprehensive Annual Financial Report
For The Year Ended December 31, 2018
Table of Contents
Page
FINANCIAL SECTION (CONTINUED)
Combining and Individual Fund Statements and Schedules (continued):
Combining Statement of Revenues, Expenditures, and Changes in Fund Balances – Nonmajor Capital Projects Funds
121
Combining Balance Sheet – Nonmajor Permanent Funds 124 Combining Statement of Revenues, Expenditures, and Changes in Fund Balances – Nonmajor Permanent Funds 125 Budgetary Comparisons – Governmental Funds: Schedule of Revenues – Budget and Actual – General Fund 128 Schedule of Expenditures – Budget and Actual – General Fund 130 Schedule of Revenues, Expenditures, and Changes in Fund Balances – Budget and Actual – Library Fund 132 Schedule of Revenues, Expenditures, and Changes in Fund Balances – Budget and Actual – Recreation Programs Fund 134 Schedule of Revenues, Expenditures, and Changes in Fund Balances – Budget and Actual – Fire PERA Fund 136 Nonmajor Enterprise Funds: Combining Statement of Net Position – Nonmajor Enterprise Funds 138 Combining Statement of Revenues, Expenses, and Changes in Net Position – Nonmajor Enterprise Funds 139 Combining Statement of Cash Flows – Nonmajor Enterprise Funds 140 Internal Service Funds: Combining Statement of Net Position – Internal Service Funds 142 Combining Statement of Revenues, Expenses, and Changes in Net Position – Internal Service Funds 143 Combining Statement of Cash Flows – Internal Service Funds 144 Combining Schedule of Net Position – Internal Service Funds - Central Garage Fund 145 Combining Schedule of Revenues, Expenses, and Changes in Net Position – Internal Service Funds – Central Garage Fund 146 Combining Schedule of Net Position – Internal Service Funds - Risk Management Fund 147 Combining Schedule of Revenues, Expenses, and Changes in Net Position – Internal Service Funds – Risk Management Fund 148 Supplementary Information: Debt Service Requirements to Maturity
150

City of Austin, Minnesota
Comprehensive Annual Financial Report
For The Year Ended December 31, 2018
Table of Contents
Page
STATISTICAL SECTION
Net Position by Component Changes in Net Position Fund Balance of Governmental Funds Changes in Fund Balances of Governmental Funds Assessed Value and Estimated Actual Value of Taxable Property Property Tax rates – Direct and Overlapping Governments
157 158 160 161 162 163
Principal Property Taxpayers 164 Property Tax Levies and Collections 165 Ratios of Outstanding Debt by Type 166 Ratios of General Bonded Debt Outstanding 167 Direct and Overlapping Governmental Activities Debt 168 Legal Debt Margin Information 169 Pledged-Revenue Coverage 170 Demographic and Economic Statistics 171 Principal Employers 172 Full-time Equivalent City Government Employees by Function 173 Operating Indicators by Function 174 Capital Asset Statistics by Function 175

Introductory Section

i
City of Austin
500 Fourth Avenue N.E.
Austin, Minnesota 55912-3773
507-437-9959
Fax 507-433-1693
www.ci.austin.mn.us
April 23, 2019 Honorable Mayor and Members of the City Council City of Austin Austin, Minnesota Minnesota statutes require all cities publish within six months of the close of the year a complete set of audited financial statements. This report is published to fulfill that requirement for the year ended December 31, 2018. Management assumes full responsibility for the completeness and reliability of the information contained in this report, based upon a comprehensive framework of internal controls that it has established for this purpose. Because the cost of internal control should not exceed anticipated benefits, the objective is to provide reasonable, rather than absolute, assurance that the financial statements are free of any material misstatements. CliftonLarsonAllen, LLP has issued an unmodified (“clean”) opinion on the City of Austin’s financial statements for the year ended December 31, 2018. The independent auditor’s report is located at the front of the financial section of this report. Management’s discussion and analysis (MD&A) immediately follows the independent auditor’s report and provides a narrative introduction, overview, and analysis of the basic financial statements. MD&A complements this letter of transmittal and should be read in conjunction with it.
PROFILE OF THE GOVERNMENT
The City of Austin, incorporated on February 28, 1876, is located in the southeastern part of the state and is the County seat of Mower County. Federal interstates 90 and 35 serve the City. The City of Austin is located within 100 miles of the Twin Cities and 45 miles of Rochester and is among the larger cities in “outstate” Minnesota. The City of Austin currently occupies a land area of 11 square miles and serves a population of 24,800. The City of Austin is empowered to levy a property tax on both real and personal properties located within its boundaries. It is also empowered by state statute to extend its corporate limits by annexation, which occurs periodically when deemed appropriate by the governing council. The City of Austin has operated under a Home Rule Charter since its adoption on March 10, 1903 pursuant to the general laws of Minnesota. Policy-making and legislative authority are vested in a governing council consisting of the mayor and seven council members. The governing council is responsible, among other things, for passing ordinances, adopting the budget, appointing committees, and hiring both the City’s administrator and attorney. The City’s administrator is responsible for carrying out the policies and ordinances of the governing council, for overseeing the day-to-day operations of the City, and for appointing the heads of the various departments. The council is elected on a non-partisan basis to serve four-year staggered terms. The six council members are elected by three different wards. The mayor and council member-at-large are elected at large.

ii
The City of Austin provides a full range of services including police and fire protection; the construction and maintenance of streets and infrastructure; recreational facilities; library and cultural events; sewer utilities, and airport services. Electric, water, and gas services are provided through the legally separate Austin Utilities, which functions, in essence, as a department of the City of Austin and therefore has been included as an integral part of the City of Austin’s financial statements. The Council is required to adopt an initial budget for the year no later than December 31 preceding the beginning of the year on January 1. This annual budget serves as the foundation for the City of Austin’s financial planning and control. The budget is prepared by fund, function (e.g., public safety), and department (e.g., police). Department heads may make transfers of appropriations within a department. Transfers of appropriations between funds, however, require the special approval of the city council.
LOCAL ECONOMY
The City of Austin functions as a major regional center for greater Minnesota. The City of Austin is headquarters for a major corporation, and functions as a regional shopping center for the immediate area. Major industries located within the government’s boundaries or in close proximity includes hospitals, food manufacturers, retail stores, and a community college. The school district within the City of Austin also have a significant economic presence, employing in total more than 926 teachers, professionals, and support staff. Austin’s strong economy is built around the corporate headquarters of a Fortune 500 company, Hormel Foods Corporation. Hormel Foods Corporation currently employs over 2,900 people in the local area. Additionally, Quality Pork Processors employs another 1,250 people within the meat packing facility owned by Hormel Foods Corporation. Because of its location in a region with a varied economic base, unemployment has been relatively stable. During the past ten years, the unemployment rate rose from an initial low of 6.4 percent (2009) to a decade high of 6.6 percent (2010). The City of Austin continues to experience unemployment rates consistently lower than national averages. The City of Austin’s unemployment rate as of December 31, 2018 was 3.1 percent compared to 3.7 percent nationally. The continued stability in unemployment rates during the current year reflect the current demand for workers in our region. Increases may occur in the near future, however, based on economic forecasts, a continued stabilization in unemployment rates are anticipated in calendar year 2020. Median household incomes within the City of Austin are significantly lower than for the state as a whole. According to the current economic data, the City’s median family income was $44,403, matching the county’s median family income, while the states was $54,442. The City’s population remains at 24,800 as of December 31, 2018, in part because of continued employment opportunities. Despite the softening of the housing market nationwide, housing prices in the vicinity of the City of Austin continue to remain strong. At the end of the fourth quarter of 2018, the median value of a single-family home in the vicinity of the City of Austin was $137,000. Due to its strong and healthy local economy, the City of Austin has maintained a credit rating of Aa2 from Moody’s Investor Service since 2009, and AA- from Standard and Poor’s since 2010. Moody’s recently completed a rating review, reaffirming the Aa2 credit rating. The Hormel Institute, a cooperative venture between the University of Minnesota, Mayo Medical Center, and the Hormel Foundation completed a $25+ million facility for cancer research in 2009. The facility has added numerous research and support staff in their quest to find a cure for cancer and during 2016 completed phase two of the expansion with the construction of a $27 million additional expansion that will add over 125 jobs to the local economy. During 2018, The Hormel Institute continued the recruitment process to hire the additional scientists to fill up their new research facility. Residential construction continues to show improvement, with single home family dwellings expecting to continue to increase over the 10 units built in 2018. A 5% increase is expected in this area as the Austin economy continues to show strength. Local government agencies approved a housing abatement program in 2016 that has spurred additional housing growth within the community and

iii
surrounding areas in the last year. Additionally, a 38-unit townhome project started during 2018 is expected to open in 2019 to provide additional housing opportunities. The local option sales tax collections continue to remain strong. The final results for 2018 include an increase in revenue of over $500,000 over the 2017 amounts. The 2017 revenue was reduced due to a misreporting issue in another Minnesota community, however the 2018 revenue still is exceeding $1.4 million on an annual basis. Minimal flood projects happened in 2018 as the City has been working on plans for the next phased construction of the flood program in the Turtle Creek area that will occur in 2019.
LONG-TERM FINANCIAL PLANNING AND MAJOR INITIATIVES Assigned and unassigned fund balance in the general fund increased to 53.8 percent of total general fund expenditures and is above the informal policy guidelines (between 40 and 48 percent of total general fund expenditures) set by the Council for budgetary and planning purposes. State aid revenues did not realize any reductions in 2018 and current budget projections for the State of Minnesota show surpluses. These surpluses will take pressure off of the legislature to reduce the state aid that Austin receives. The City of Austin also adopted an updated 5-Year Capital Improvement Plan covering the period of 2019 through 2023. Over $123.2 million will be spent over the next five years on capital improvements within the City. Included in the planned improvements are nearly $42.4 million for Wastewater Treatment Plant upgrades, $18.9 million for flood mitigation projects, and over $17 million for street projects. The City is utilizing grants, interest earnings, and funds on hand to accomplish the improvements over the next five-year period. The City of Austin continues to monitor the economic issues faced by the State of Minnesota and the federal government as this affects both the revenues and expenditures that are anticipated for the following years. The elected officials, along with staff, are creating long-term financial plans and departmental reviews in order to provide long-term planning for the municipality. A community wide effort to enhance the lifestyle of citizens has continued during 2018. This effort, known as Vision 2020, embarked on getting citizen involvement to focus on areas that could be improved within the community to enhance the way of life for our citizens. Ten projects have been selected through a community-wide voting process that will be the focus of the Vision 2020 efforts for the next five years. The largest of the Vision 2020 projects is a new Community Recreation Center to be constructed on the former Austin Utilities turbine site in downtown Austin. This $35 million project will utilize private contributions for the entire project, $30 million of which has already been raised. The local YMCA and the City Park and Recreation Department will partner on operations of the facility for the benefit of the citizens of the area. This facility has all of the needed contributions pledged, and many of the required use agreements have been signed and are just waiting for the grand opening expected at the end of 2019. Flood awareness continues to be a major concern of the citizens and business of Austin. A $10 million flood barrier project was completed in 2015 to protect local businesses including a hospital, a food production facility, and Hormel Corporate Office South. The local option sales tax will be in effect for several more years with the goal that these funds will be matched with state and federal grants to further eliminate the loss that Austin has realized from past flooding events. The City recently received a state Department of Natural Resources grant for the next major phase of the flood control project along Turtle Creek. Additional flood projects including the construction of berms to fortify the City’s wastewater treatment facility and acquisition of single-family homes are included in the long-term flood prevention program.

iv
The City of Austin continues to work on economic development issues in order to further grow the community. The City of Austin is aggressively working with local leaders on the Hormel Institute expansion project, as now that it is completed the recruitment of researchers will be ramping up to add another 125 jobs to rural Minnesota. As noted earlier, the Hormel Institute facility is a leading-edge cancer research center that currently employs over 100 scientists and support staff with a goal to eventually end this disease. The City also has been aggressively working with a few developers of apartment complexes. A lack of housing availability in the community has resulted in the city taking an aggressive stance on recruiting developers for all sorts of housing options, including apartments, townhomes, and single-family dwellings.
RELEVANT FINANCIAL POLICIES
The City of Austin has adopted a comprehensive set of financial policies, both formally and informally through recommended practices. The City of Austin’s policy of maintaining assigned and unassigned fund balance between 40 and 48 percent of total general fund expenditures was exceeded during 2018. An unscheduled interest payment receipt and a legislative change the city pursued to reduce a state fire aid expenditure resulted in an unscheduled $735,000 increase in the fund balance.
AWARDS AND ACKNOWLEDGEMENTS
The Government Finance Officers Association of the United States and Canada (GFOA) awarded a Certificate of Achievement for Excellence in Financial Reporting to the City of Austin, Minnesota, for its comprehensive annual financial report (CAFR) for the year ended December 31, 2017. This was the thirty-third consecutive year that the City has received this prestigious award. In order to be awarded a Certificate of Achievement, the City published an easily readable and efficiently organized CAFR that satisfied both generally accepted accounting principles and applicable program requirements. A Certificate of Achievement for Excellence in Financial Reporting is valid for a period of one year only. However, we believe that our current CAFR continues to meet the Certificate of Achievement for Excellence in Financial Reporting Program’s requirements, and we are submitting it to the GFOA to determine its eligibility for another certificate. The preparation of this report would not have been possible without the skill, effort, and dedication of the entire staff of the finance department. We wish to thank all City departments for their assistance in providing the data necessary to prepare this report. Credit also is due to the mayor and the city council for their unfailing support for maintaining the highest standards of professionalism in the management of the City of Austin’s finances. Respectfully Submitted,
Tom Dankert Director of Administrative Services


vi
City of Austin, Minnesota
Organization Chart
CITIZENS
MAYOR COUNCIL MEMBER
ADMINISTRATOR
UTILITY BOARD
PARK & RECREATION BOARD
LIBRARY BOARD
POLICE ATTORNEY ENGINEER RECORDER FIRE TREASURER
The City of Austin is governed by a Home Rule Charter, which was framed and adopted March 10, 1903, pursuant to the General Laws of Minnesota. A Home Rule Charter is a charter drawn by the City itself tailored to its own needs and desires under authority given by the constitution of the state. Many state legislatures make the laws under which the cities are governed, but Minnesota is one of the states whose constitution has provisions by which cities can adopt Home Rule Charters. The elective officers of the City are the Mayor, Council Member-at-Large and six Council Members. The Council Members are elected, two from each of three wards, on staggered terms during general elections in November of even numbered years. The terms of office are: Mayor Four Years Council Member-at-Large Four Years Council Member Four Years

vii
City of Austin, Minnesota
List of Elected and Other City Officials
2018
Elected Officials
Thomas Stiehm Mayor
Janet Anderson Council Member-at-Large
Jeff Austin Council Member First Ward
Laura Helle Council Member First Ward
Steve King Council Member Second Ward
David Hagen Council Member Second Ward
Judy Enright Council Member Third Ward
Paul Fischer Council Member Third Ward
Other City Officials
Craig Clark City Administrator
Tom Dankert Director of Administrative Services
David Hoversten City Attorney
Steven Lang Public Works Director
Jim McCoy Fire Chief
Brian Krueger Police Chief
Julie Clinefelter Library Director
Kim Underwood Parks and Recreation Director
Mark Nibaur Austin Utilities General Manager

Financial Section

(This page intentionally left blank.)


(4)
(This page intentionally left blank.)

City of Austin, Minnesota
Management’s Discussion and Analysis
December 31, 2018
(5)
As management of the City of Austin, Minnesota, we offer readers of the City of Austin’s financial statements this narrative overview and analysis of the financial activities of the City of Austin for the year ended December 31, 2018. We encourage readers to consider the information presented here in conjunction with additional information that we have furnished in our letter of transmittal, which can be found on pages i-iv of this report.
FINANCIAL HIGHLIGHTS:
The assets and deferred outflows of resources of the City of Austin exceeded its liabilities and deferred inflows of resources at the close of the most recent year by $250,024,894 (net position). Of this amount $30,215,522 (unrestricted net position) may be used to meet the City’s ongoing obligations to citizens and creditors in accordance with the City’s fund designations and fiscal policies.
The City’s total net position increased by $9,058,926 during the current period.
As of the close of the current year, the City of Austin’s governmental funds reported combined ending fund balance of $22,628,158, an increase of $3,274,189 in comparison with the prior year. Approximately 68% of this total amount, or $15,394,660, is available for spending at the City’s discretion (assigned and unassigned fund balance).
At the end of the current year, the assigned and unassigned fund balance for the general fund was $8,272,001, or 53.8% of total general fund expenditures.
The City of Austin’s total net bonded debt decreased by $2,120,000 (8.8 percent) during the current period. No new debt was issued during 2018.
A restatement of prior period net position due to the implementation of GASB 75 resulted in a decrease of net position of the beginning net position by $13,754,083. Changes in required accounting for other post-employment benefits mandated this implementation.
OVERVIEW OF THE FINANCIAL STATEMENTS: The discussion and analysis provided here are intended to serve as an introduction to the City of Austin’s basic financial statements. The City of Austin’s basic financial statements consist of three components:
1. Government-wide financial statements 2. Fund financial statements 3. Notes to the financial statements
This report also includes supplementary information intended to furnish additional detail to support the basic financial statements themselves.
Government-wide financial statements. The government-wide financial statements are designed to provide readers with a broad overview of the City of Austin’s finances, in a manner similar to private-sector business.

City of Austin, Minnesota
Management’s Discussion and Analysis
December 31, 2018
(6)
The statement of net position presents financial information on all of the City of Austin’s assets and deferred outflows of resources and liabilities and deferred inflows of resources, with the difference reported as net position. Over time, increases or decreases in net position may serve as a useful indicator of whether the financial position of the City of Austin is improving or deteriorating. The statement of activities presents information showing how the City of Austin’s net position changed during the most recent year. All changes in net position are reported as soon as the underlying event giving rise to the change occurs, regardless of the timing of related cash flows. Thus, revenues and expenses are reported for some items that will only result in cash flows in future periods (e.g., uncollected taxes and earned, but unused compensated absences). Both of the government-wide financial statements distinguish functions of the City of Austin that are principally supported by taxes and intergovernmental revenues (governmental activities) from other functions that are intended to recover all or a significant portion of their costs through user fees and charges (business-type activities). The governmental activities of the City of Austin include general government, public safety, streets and highways, culture and recreation, public service, economic development, and community development. The business-type activities of the City of Austin include a sewer utility, waste transfer station, storm water utility, and a municipal electric, water, and gas utility. The electric, water, and gas utility, comprising the Austin Utilities, are under the direction of the Board of Commissioners. The government-wide financial statements include not only the City of Austin itself (known as the primary government), but also a legally separate port authority and housing and redevelopment authority for which the City of Austin is financially accountable. Financial information for these component units is reported separately from the financial information presented for the primary government itself. The municipal electric, water, and gas utility, although also legally separate, functions for all practical purposes as a department of the City of Austin, and therefore has been included as an integral part of the primary government. The government-wide financial statements can be found on pages 19-21 of this report.
Fund financial statements. A fund is a grouping of related accounts that is used to maintain control over resources that have been segregated for specific activities or objectives. The City of Austin, like other state and local governments, uses fund accounting to ensure and demonstrate compliance with finance-related legal requirements. All of the funds of the City of Austin can be divided into two categories: governmental funds and proprietary funds.
Governmental funds. Governmental funds are used to account for essentially the same functions reported as governmental activities in the government-wide financial statements. However, unlike the government-wide financial statements, governmental fund financial statements focus on near-term inflows and outflows of spendable resources, as well as on balances of spendable resources available at the end of the year. Such information may be useful in evaluating a government’s near-term financing requirements. Because the focus of governmental funds is narrower than that of the government-wide financial statements, it is useful to compare the information presented for governmental funds with similar information presented for governmental activities in the government-wide financial statements. By doing so, readers may better understand the long-term impact of the government’s near-term financing decisions. Both the governmental fund balance sheet and the governmental fund statement of revenues, expenditures, and changes in fund balances provide a reconciliation to facilitate this comparison between governmental funds and governmental activities.

City of Austin, Minnesota
Management’s Discussion and Analysis
December 31, 2018
(7)
The City of Austin maintains nineteen individual governmental funds. Information is presented separately in the governmental fund balance sheet and in the governmental fund statement of revenues, expenditures, and changes in fund balances for the general fund, local option sales tax fund, and the building fund, all of which are considered to be major funds. Data from the other sixteen governmental funds are combined into a single, aggregate presentation. Individual fund data for each of these nonmajor governmental funds is provided in the form of combining statements in the combining and individual fund statements and schedules section of this report. The City of Austin adopts an annual appropriated budget for its general fund. A budgetary comparison statement has been provided for the general fund to demonstrate compliance with this budget. The basic governmental fund financial statements can be found on pages 22-29 of this report.
Proprietary funds. The City of Austin maintains two different proprietary funds. Enterprise funds are used to report the same functions presented as business-type activities in the government-wide financial statements. The City of Austin uses enterprise funds to account for its sewer utility, waste transfer station, storm water utility, and electric, water and gas utilities. Internal service funds are an accounting device used to accumulate and allocate costs internally among the City of Austin’s various functions. The City of Austin uses internal service funds to account for its fleet of vehicles, its risk management program, and for its management information systems. Because all of these services predominantly benefit governmental rather than business-type functions, they have been included within governmental activities in the government wide financial statements. Proprietary funds provide the same type of information as the government-wide financial statements, only in more detail. The proprietary fund financial statements provide separate information for the sewer user fund and the utilities fund, both of which are considered to be major funds of the City of Austin. Data from the other nonmajor enterprise funds are combined into a single, aggregate presentation. Individual fund data for each of these nonmajor enterprise funds is provided in the form of combining statements elsewhere in this report. Conversely, all three internal service funds are combined into a single aggregated presentation in the proprietary fund financial statements. Individual fund data for the internal service funds is also provided in the form of combining statements in the combining and individual fund statements and schedules section of this report. The basic proprietary fund financial statements can be found on pages 30-39 of this report.
Notes to the financial statements. The notes provide additional information that is necessary to acquire a full understanding of the data provided in the government-wide and fund financial statements. The notes to the financial statements can be found on pages 42-93 of this report.
Other information. In addition to the basic financial statements and accompanying notes, this report also presents required supplementary information concerning the City of Austin’s OPEB liability plus progress in funding its Net Pension Liability. Required supplementary information can be found on pages 97-99 of this report. The combining statements and schedules referred to earlier in connection with nonmajor governmental funds, enterprise funds, and internal service funds are presented immediately following the required supplementary information on OPEB and the Net Pension Liability. Combining and individual fund statements and schedules can be found on pages 104-148 of this report.

City of Austin, Minnesota
Management’s Discussion and Analysis
December 31, 2018
(8)
GOVERNMENT-WIDE FINANCIAL ANALYSIS: As noted earlier, net position over time, may serve as a useful indicator of a government’s financial position. In the case of the City of Austin, assets and deferred outflows of resources exceeded liabilities and deferred inflows of resources by $250,024,894 at the close of the most recent year. By far the largest portion of the City of Austin’s net position (85 percent) reflects its investment in capital assets (e.g. land, buildings, machinery, equipment, and infrastructure), less any related debt used to acquire those assets that is still outstanding. The City of Austin uses these capital assets to provide a variety of services to its citizens. Accordingly, these assets are not available for future spending. Although the City of Austin’s investment in its capital assets is reported net of related debt, it should be noted that the resources used to repay this debt must be provided from other sources, since the capital assets themselves cannot be used to liquidate these liabilities. An additional portion of the City of Austin’s net position (3 percent) represents resources that are subject to external restrictions on how they may be used. The remaining balance of $30,215,522 is unrestricted and may be used to meet the government’s ongoing obligations to citizens and creditors. At the end of the current year, the City of Austin is able to report positive balances in all reported categories of net position, both for the government as a whole, as well as for its separate governmental and business-type activities. The same situation held true for the prior year.
CITY OF AUSTIN’S NET POSITION
2018 2017 2018 2017 2018 2017
Current and other assets 37,199,755$ 34,426,077$ 44,853,150$ 44,587,844$ 82,052,905$ 79,013,921$
Capital assets 129,826,619 128,162,905 105,646,329 104,951,006 235,472,948 233,113,911
Total assets 167,026,374 162,588,982 150,499,479 149,538,850 317,525,853 312,127,832
Deferred Outflows
of Resources 5,110,972 6,975,355 1,896,262 1,784,429 7,007,234 8,759,784
Total assets and deferred
outflows of resources 172,137,346 169,564,337 152,395,741 151,323,279 324,533,087 320,887,616
Long-term liabilities
outstanding 10,486,227 11,354,674 45,917,567 35,523,127 56,403,794 46,877,801
Other liabilities 2,921,529 2,992,200 5,913,170 6,773,644 8,834,699 9,765,844
Total liabilities 13,407,756 14,346,874 51,830,737 42,296,771 65,238,493 56,643,645
Deferred Inflows
of Resources 7,397,871 7,871,706 1,871,829 1,652,214 9,269,700 9,523,920
Net position:
Net investment in
capital assets 128,915,686 127,073,132 84,112,732 82,148,457 213,028,418 209,221,589
Restricted 6,780,954 6,373,158 - - 6,780,954 6,373,158
Unrestricted 15,635,079 13,899,467 14,580,443 25,225,837 30,215,522 39,125,304
Total net position 151,331,719$ 147,345,757$ 98,693,175$ 107,374,294$ 250,024,894$ 254,720,051$
Business-Type Activities TotalGovernmental Activities

City of Austin, Minnesota
Management’s Discussion and Analysis
December 31, 2018
(9)
The City of Austin’s net position increased by $9,058,926 during the current year, before the restatement of the beginning net position. The increase in net invested in capital assets of $3,806,829 (42% of the increase) is a result of various street projects, wastewater treatment plant upgrades, and the continued purchase of flood properties and construction of flood related improvements. Restricted net position increased $407,796 mainly due to funding set aside through the local option sales tax for flood relief efforts. The increase in unrestricted net position (53% of the increase) largely reflects the degree to which expenses have outstripped similar revenues. During 2018, the City implemented Governmental Accounting Standards Board (GASB) number 75. The implementation of this standard required a restatement of net position by reducing the beginning balance by $13,754,083. This reduction in net position is a result of the City recording their share of the unfunded other post-employment benefits resulting from an actuarial valuation of the health insurance program.
Governmental activities. During the current year, net position for governmental activities increased as a result of operations by $4,852,284 from the prior year. However, the implementation of GASB 75 resulted in restatement of the beginning net position by $866,322 for an ending balance of $151,331,719. Consistency among departments to not spend their entire budgets are the major reason for the increase in net position due to operations, along with a prepayment of interest on a loan and a legislative change the City pushed forward to reduce some expenses related to state fire aid. Total governmental revenues actually decreased during 2018 from 2017, primarily as a result of fewer capital grants the City received towards recreational activities during 2018. Capital grants received in 2017 financed a new $6 million nature center facility, causing a spike in capital contributions during that year. Other factors affecting the increase in governmental net position are:
Property tax revenues increased $681,804 as a result of the city council increasing the tax levy to finance future capital projects and expand operational programs. Other tax revenue increased from 2017 to 2018 as a result of a full-year of local option sales tax receipts. In 2017 a portion of the local option sales tax receipts had to be remitted back to the state as we had been overpaid over a five-year time frame.
Public safety expenditures decreased $742,441 (77% of the expense decrease) as capital costs decreased in 2018 as projects were wrapped up, plus a significant decrease due to a city requested legislative change in the relief association pension expense helped reduce overall expenses in this function.
Community development expenditures decreased $234,253 as fewer flood improvement projects were done during 2018. The City is finalizing plans for the next phase of the flood control project around the Turtle Creek area and is saving up local options sales tax collections to then provide a local match with grants from the State of Minnesota.
Transfers from business-type activities in the amount of $1,844,615 (38% of the change in net position), primarily from a payment in lieu of tax, also increased the change in net position for governmental funds.

City of Austin, Minnesota
Management’s Discussion and Analysis
December 31, 2018
(10)
The following chart summarizes the changes in net position for the current year:
CITY OF AUSTIN’S CHANGES IN NET POSITION
Condensed statements of revenues, expenses, and changes in net position highlights are as follows for the years ended December 31, 2018 and 2017:
2018 2017 2018 2017 2018 2017
Revenues:
Program revenues:
Charges for services 2,553,643$ 1,998,683$ 65,819,275$ 63,869,146$ 68,372,918$ 65,867,829$
Operating grants and
contributions 1,091,641 984,257 - - 1,091,641 984,257
Capital grants and contributions 3,566,943 6,601,283 2,596,998 593,434 6,163,941 7,194,717
General revenues:
Property taxes 6,461,424 5,779,620 - - 6,461,424 5,779,620
Other taxes 1,927,168 1,376,351 - - 1,927,168 1,376,351
Grants and contributions not
restricted to specific programs 8,185,269 8,030,033 - - 8,185,269 8,030,033
Other 601,699 630,222 446,212 382,484 1,047,911 1,012,706
Total revenues 24,387,787$ 25,400,449$ 68,862,485$ 64,845,064$ 93,250,272$ 90,245,513$
Expenses:
General government 2,887,408$ 2,655,024$ -$ -$ 2,887,408$ 2,655,024$
Public safety 6,561,588 7,304,029 - - 6,561,588 7,304,029
Streets and highways 5,270,917 5,294,742 - - 5,270,917 5,294,742
Culture and recreation 5,213,298 5,311,447 - - 5,213,298 5,311,447
Public service 387,317 375,465 - - 387,317 375,465
Economic development 505,254 608,226 - - 505,254 608,226
Community development 539,363 773,616 - - 539,363 773,616
Interest on long-term debt 14,973 25,729 - - 14,973 25,729
Sewer - - 5,157,970 5,315,668 5,157,970 5,315,668
Waste transfer station - - 31,342 39,856 31,342 39,856
Storm water utility - - 315,603 372,669 315,603 372,669
Electric - - 37,584,354 35,196,329 37,584,354 35,196,329
Water - - 4,112,784 4,420,292 4,112,784 4,420,292
Gas - - 15,609,175 16,565,068 15,609,175 16,565,068
Total expenses 21,380,118$ 22,348,278$ 62,811,228$ 61,909,882$ 84,191,346$ 84,258,160$
Increase in net position 3,007,669$ 3,052,171$ 6,051,257$ 2,935,182$ 9,058,926$ 5,987,353$
before transfers
Transfers 1,844,615 1,710,331 (1,844,615) (1,710,331) - -
Increase in net position 4,852,284$ 4,762,502$ 4,206,642$ 1,224,851$ 9,058,926$ 5,987,353$
Net position - beginning 147,345,757 142,583,255 107,374,294 106,149,443 254,720,051 248,732,698
Restatement (866,322) - (12,887,761) - (13,754,083) -
Net position - beginning, as restated 146,479,435$ 142,583,255$ 94,486,533$ 106,149,443$ 240,965,968$ 248,732,698$
Net position - ending 151,331,719$ 147,345,757$ 98,693,175$ 107,374,294$ 250,024,894$ 254,720,051$
TotalGovernmental Activities Business-Type Activities

City of Austin, Minnesota
Management’s Discussion and Analysis
December 31, 2018
(11)
Below are specific graphs that provide comparisons of the government activities’ direct program revenues with their expenditures. Any shortfalls in direct revenues are primarily supported by property tax levy or general state aid.
Expenses and Program Revenues – Governmental Activities
$-
$1,000,000
$2,000,000
$3,000,000
$4,000,000
$5,000,000
$6,000,000
$7,000,000
Expenses
Revenues
Revenues by Source – Governmental Activities
Charges for services11%
Operating grants and contributions
5%
Capital grants and contributions
15%
Property taxes27%
Other taxes8%
Grants and contributions not restricted to certain
programs34%

City of Austin, Minnesota
Management’s Discussion and Analysis
December 31, 2018
(12)
Below are specific graphs that provide comparisons of the business-type activities’ direct program revenues with their expenditures. Excess revenues are retained within each fund until such time that capital replacement is needed.
Expenses and Program Revenues – Business-type Activities
$-
$5,000,000
$10,000,000
$15,000,000
$20,000,000
$25,000,000
$30,000,000
$35,000,000
$40,000,000
$45,000,000
Sewer user Wastetransferstation
Storm waterutility
Electric Water Gas
Expenses
Revenues
Revenues by Source – Business-type Activities
Charges for services
95%
Capital grants and contributions
4%
Other1%

City of Austin, Minnesota
Management’s Discussion and Analysis
December 31, 2018
(13)
Business-type activities. For the City of Austin’s business-type activities, the results for the current year operations were positive in that overall net position increased, however, the implementation of GASB 75 resulted in a restatement of the beginning net position downward by $12,887,761 for an ending balance of $98,693,175. Key elements of this operational increase are as follows:
Overall rate increases in the electric, water and sewer departments drove the increase in charges for services for 2018. These rate increases, coupled with increased usage amongst all facets of the water, sewer, electric, and gas business units increased revenue by 3%.
Electric expenses increased by $2,388,025 primarily due to costs incurred as a result of the demolition of the downtown power plant, garages, and site preparation for the new community rec center.
Gas expenses decreased by $955,893 due to a 7.8% decrease in the price of natural gas that was purchased in 2018.
FINANCIAL ANALYSIS OF GOVERNMENTAL FUNDS:
As noted earlier, the City of Austin uses fund accounting to ensure and demonstrate compliance with finance-related legal requirements.
Governmental Funds. The focus of the City of Austin’s governmental funds is to provide information on near-term inflows, outflows, and balances of spendable resources. Such information is useful in assessing the City of Austin’s financing requirements. In particular, unassigned fund balance may serve as a useful measure of a government’s net resources available for discretionary use as they represent the portion of fund balance which has not yet been limited to use for a particular purpose by either an external party, the City of Austin itself, or a group or individual that has been delegated authority to assign resources for use for particular purposes by the City of Austin’s Council. As of the end of the current year, the City of Austin’s governmental funds reported combined fund balances of $22,628,158, an increase of $3,274,189. Approximately 37% of this total amount, or $8,272,001, constitutes unassigned fund balance, which is available for spending at the government’s discretion. The remainder of fund balance is either nonspendable, restricted, committed, or assigned to indicate that it is not available for new spending. The general fund is the chief operating fund of the City of Austin. At the end of the current year, assigned and unassigned fund balance of the general fund was $8,272,001, while the total fund balance increased to $8,508,993. As a measure of the general fund’s liquidity, it may be useful to compare assigned and unassigned fund balance and total fund balance to total fund expenditures. Assigned and unassigned fund balance represents 53.8 percent of total general fund expenditures, while total fund balance represents 55.4 percent of that same amount. The fund balance of the City of Austin’s general fund increased by $1,582,072 during the current year. During 2018, departments did not spend their full allotment of budget dollars, saving $1,293,240 in the process. Included in this savings is nearly $369,000 from a legislative change the City sought and received relating to state fire aid expenditures. The City also collected more revenue than originally budgeted during 2018 resulting in a $488,392 windfall. Included in this windfall, was an unexpected interest payment on an outstanding loan for nearly $370,000. Transfers in came in $8,085 under budget additionally. The combination of the budget expenditure savings, revenue windfall, and transfers in resulted in the net increase in the fund balance of the general fund.

City of Austin, Minnesota
Management’s Discussion and Analysis
December 31, 2018
(14)
The local option sales tax fund has been accumulating funds for the city share of flood relief projects. Statutory authority was given to the city, and an approved voter referendum soon followed in 2006 allowing the city to levy a sales tax of .50% on taxable purchases within the city limits for a maximum of 20 years. Total fund balance of $4,147,473 exists for the city’s share of future flood projects. The fund balance increased $457,166 as the city is starting to bank up some revenue for the next major flood project scheduled in 2019. The building fund has a total fund balance of $2,051,391, all of which is assigned for capital projects. The increase in fund balance during the current year was $429,975 and was the result of future planning for construction projects as part of the 5-Year Capital Improvement Plan.
Proprietary funds. The City of Austin’s proprietary funds provide the same type of information found in the government-wide financial statements, but in more detail. Unrestricted net position in the sewer user and utility funds are $7,504,412 (sewer user) and $5,829,042 (utility fund). Both the sewer user and utility funds had increases in their respective net position. The sewer user fund realized an increase of $835,606 mainly due to capital contributions and an overall rate increase of 25%. The utility fund’s increase in net position of $2,931,864 was a direct result of recouping higher electric/gas/water rates from the customers that were above the cost of providing the service. The implementation of GASB 75 required a restatement of net position by reducing the beginning balance by $147,909 (sewer user) and $12,724,693 (utility fund). This reduction in net position is a result of the City recording their share of the unfunded other post-employment benefits resulting from an actuarial valuation of the health insurance program. The water, sewer, and electric utility rates were all increased during 2018.
GENERAL FUND BUDGETARY HIGHLIGHTS:
Original budget compared to final budget. During the year there was $224,975 of increases in appropriations between the original and final amended budget. Following is the component of the appropriation increase:
$224,975 supplemental appropriations for minor capital to be funded by fund balance.
Final budget compared to actual results. The most significant differences between estimates and actual amounts were as follows:
Overall revenues came in at $15,257,618 on a budget of $14,769,226. The increased revenues over budget included a one-time $370,000 unexpected interest payment. There were minor fluctuations amongst the difference categories, but overall the revenue target was achieved.
Expenditures amongst the different governmental activities were below the amended budget for all activities except one (economic development) due to some capital items being re-evaluated and not purchased, plus some department staff vacancies were not immediately filled. Only 92% of the amended expenditure budget was spent during 2018, resulting in an increase to the fund balance.
During the year $191,475 was budgeted to be used from fund balance. However, expenditures came in under the budgeted amounts by $1,293,240 (7.76%) as a direct result of expenditure reductions amongst all departments. Additionally, revenues collected were $488,392 higher than budgeted. Transfers in were $8,085 under budget. This resulted in a net fund balance increase of $1,582,072 for the year.

City of Austin, Minnesota
Management’s Discussion and Analysis
December 31, 2018
(15)
CAPITAL ASSETS AND DEBT ADMINISTRATION:
Capital assets. The City of Austin’s investment in capital assets for its governmental and business-type activities as of December 31, 2018, amounts to $235,472,948 (net of accumulated depreciation). This investment in capital assets includes land, buildings, improvements other than buildings, machinery and equipment, construction in progress, and infrastructure. The total increase in the City of Austin’s investment in capital assets (net of accumulated depreciation) was 1.01% percent. Most of this increase within the governmental activities can be found in the addition of construction in progress. Within the business-type activities the most significant increases occurred in machinery and equipment related to the electric department of the Austin Utilities.
CITY OF AUSTIN’S CAPITAL ASSETS
(net of depreciation)
2018 2017 2018 2017 2018 2017
Land 24,778,543$ 24,632,996$ 781,210$ 883,910$ 25,559,753$ 25,516,906$
Buildings 19,114,539 19,680,391 39,649,503 40,461,048 58,764,042 60,141,439
Improvements 20,528,094 21,088,239 1,042,699 1,088,550 21,570,793 22,176,789
Machinery and equipment 9,588,881 8,986,620 47,313,829 46,300,266 56,902,710 55,286,886
Construction in progress 11,288,024 8,014,929 2,310,244 2,250,287 13,598,268 10,265,216
Infrastructure 44,528,538 45,759,730 14,548,844 13,966,945 59,077,382 59,726,675
Total capital assets 129,826,619$ 128,162,905$ 105,646,329$ 104,951,006$ 235,472,948$ 233,113,911$
Business-Type Activities TotalGovernmental Activities
Additional information on the City of Austin’s capital assets can be found in Note 2E on pages 63-65 of this report.
Long-term debt. At the end of the current year, the City of Austin had total bonded debt outstanding of $21,840,000. Of this amount $375,000 comprises tax increment debt and for which the government is liable in the event of default by the property owners subject to the tax increment. Additionally, $16,295,000 comprises capital improvement plan debt that was issued for the Austin Utilities for their new Central Facility. The remainder of the City of Austin’s long-term obligations represents bonds secured solely by specified revenue sources.
CITY OF AUSTIN’S OUTSTANDING DEBT General Obligation and Revenue Bonds
2018 2017 2018 2017 2018 2017
G.O. tax increment debt 375,000$ 410,000$ -$ -$ 375,000$ 410,000$
G.O. special
assessment debt - 250,000 - - - 250,000
G.O. capital improvement
plan debt - - 16,295,000 16,970,000 16,295,000 16,970,000
Revenue debt - - 5,170,000 6,330,000 5,170,000 6,330,000
Total liabilities 375,000$ 660,000$ 21,465,000$ 23,300,000$ 21,840,000$ 23,960,000$
Business-Type Activities TotalGovernmental Activities

City of Austin, Minnesota
Management’s Discussion and Analysis
December 31, 2018
(16)
The City of Austin’s total net bonded debt decreased by $2,120,000 (8.8 percent) during the current year. There was no new debt issued during 2018. The City of Austin and its component units maintains a rating of Aa2 year from Moody’s Investors Services for general obligation debt. Additionally, the City of Austin maintains an AA- rating from Standard and Poor’s for general obligation debt. Additional information on the City’s long-term debt can be found in note 2G on pages 67-75 of this report.
ECONOMIC FACTORS AND NEXT YEAR’S BUDGETS AND RATES:
The unemployment rate for the City of Austin is currently 3.1 percent, which is 0.7% higher than it was a year ago. This is slightly lower than the state’s average unemployment rate of 3.2 percent, and is favorable compared to the national average of 3.7 percent.
The City of Austin continues to see increased commercial construction growth. Residential growth continues to have increases in the number of homes being built in the last few years.
Interest rates have started to increase slightly over the past year, and consequently the city’s investment earnings are expected to see slight increases.
The State of Minnesota appears to have gotten past their budget struggles from the past few years. A projected budget surplus by the State of Minnesota should stabilize state aid and eliminate any drastic reductions for the near future.
REQUESTS FOR INFORMATION: This financial report is designed to provide a general overview of the City of Austin’s finances for all of those with an interest in the government’s finances. Questions concerning any of the information provided in this report or requests for additional financial information should be addressed to the Director of Administrative Services, City of Austin, 500 4th Avenue NE, Austin, Minnesota, 55912.

Basic Financial Statements

(This page intentionally left blank.)

City of Austin, Minnesota
Statement of Net Position
December 31, 2018
Primary Government Component Units
Governmental Business-type Housing Port
Activities Activities Total Authority Authority
Assets
Cash and investments 29,472,549$ 33,992,954$ 63,465,503$ 4,803,099$ 2,296,434$
Taxes receivable 227,369 - 227,369 - 1,812
Accounts receivable (net) 427,662 4,524,505 4,952,167 - 200,000
Special assessments receivable 2,962,065 1,276,846 4,238,911 - -
Other receivables - - - 22,141 -
Interest receivable 149,633 212 149,845 262 484
Due from other governments 882,200 21,721 903,921 340,536 1,350
Internal balances (101,597) 101,597 - - -
Notes receivable (net) 326,239 838,281 1,164,520 160,218 334,622
Prepaid items 264,390 150,095 414,485 - -
Inventory 76,800 1,616,019 1,692,819 - -
Other assets - 550,139 550,139 - -
Restricted cash and investments 1,725,479 1,780,781 3,506,260 2,170,631 -
Advances to component units 786,966 - 786,966 - -
Land held for resale - - - 295,513 1,077,694
Capital assets (net of accumulated
depreciation):
Land 24,778,543 781,210 25,559,753 2,550,940 -
Buildings 19,114,539 39,649,503 58,764,042 12,292,248 21,702,576
Improvements 20,528,094 1,042,699 21,570,793 - 440,468
Machinery and equipment 9,588,881 47,313,829 56,902,710 227,783 1,609,545
Construction in progress 11,288,024 2,310,244 13,598,268 636,386 -
Infrastructure 44,528,538 14,548,844 59,077,382 - -
Total assets 167,026,374$ 150,499,479$ 317,525,853$ 23,499,757$ 27,664,985$
Deferred Outflows of Resources
Loss on bond refunding -$ -$ -$ 54,464$ -$
Pension related 5,110,972 1,017,103 6,128,075 - -
OPEB related - 879,159 879,159 - -
Total deferred outflows
of resources 5,110,972$ 1,896,262$ 7,007,234$ 54,464$ -$
Total assets and deferred
outflows of resources 172,137,346$ 152,395,741$ 324,533,087$ 23,554,221$ 27,664,985$
Liabilities
Vouchers payable 451,810$ 3,971,862$ 4,423,672$ 249,049$ 9,468$
Contractors' retained percentage 567,330 5,665 572,995 - -
Interest payable 5,845 - 5,845 65,036 -
Deposits 102,578 - 102,578 - -
Accrued expenses 946,385 1,414,988 2,361,373 35,463 -
Due to other governments 311,428 - 311,428 123,357 45,000
Unearned revenues 536,153 - 536,153 7,610 7,791
Other current liabilities - 520,655 520,655 237,998 -
Noncurrent liabilities:
Due within one year 559,360 2,706,253 3,265,613 661,036 -
Due in more than one year 9,926,867 43,211,314 53,138,181 7,167,248 -
Advances from primary gov't - - - - 786,966
Total liabilities 13,407,756$ 51,830,737$ 65,238,493$ 8,546,797$ 849,225$
Deferred Inflows of Resources
Community Solar Related -$ 54,600$ 54,600$ -$ -$
Pension related 7,346,730 1,808,249 9,154,979 - -
OPEB related 51,141 8,980 60,121 - -
Total deferred inflows
of resources 7,397,871$ 1,871,829$ 9,269,700$ -$ -$
Net Position
Net investment in capital assets 128,915,686$ 84,112,732$ 213,028,418$ 8,072,798$ 23,752,589$
Restricted for:
Police 86,696 - 86,696 - -
Fire 285,265 - 285,265 - -
Parks and recreation 2,343 - 2,343 - -
Debt service 973,391 - 973,391 1,859,987 -
Other capital projects 4,259,590 - 4,259,590 - -
Other purposes - - - - 280,711
Library purposes 1,014,300 - 1,014,300 - -
Permanent funds:
Expendable 23,317 - 23,317 - -
Non-expendable 136,052 - 136,052 - -
Unrestricted 15,635,079 14,580,443 30,215,522 5,074,639 2,782,460
Total net position 151,331,719$ 98,693,175$ 250,024,894$ 15,007,424$ 26,815,760$
Total liabilities, deferred inflows of
resources, and net position 172,137,346$ 152,395,741$ 324,533,087$ 23,554,221$ 27,664,985$
See accompanying Notes to Financial Statements. (19)

City of Austin, Minnesota
Statement of Activities
For the Year Ended December 31, 2018
Net (Expense) Revenue and
Program Revenues Changes in Net Position
Operating Capital
Charges for Grants and Grants and
Functions/Programs Expenses Services Contributions Contributions
Primary government
Governmental activities:
General government 2,887,408$ 1,120,057$ -$ 13,036$
Public safety 6,561,588 741,367 679,554 9,502
Streets and highways 5,270,917 42,281 106,257 1,931,428
Culture and recreation 5,213,298 584,877 255,862 773,730
Public service 387,317 39,161 49,968 4,296
Economic development 505,254 25,900 - -
Community development 539,363 - - 834,951
Interest on long-term debt 14,973 - - -
Total governmental activities 21,380,118$ 2,553,643$ 1,091,641$ 3,566,943$
Business-type activities:
Sewer user 5,157,970$ 5,768,857$ -$ 165,221$
Waste transfer station 31,342 42,673 - -
Storm water utility 315,603 684,087 - 100,362
Electric 37,584,354 37,326,080 - 2,244,882
Water 4,112,784 4,850,518 - 55,646
Gas 15,609,175 17,147,060 - 30,887
Total business-type activities 62,811,228$ 65,819,275$ -$ 2,596,998$
Total primary government 84,191,346$ 68,372,918$ 1,091,641$ 6,163,941$
Component units:
Housing and Redevelopment Authority 4,735,041$ 3,003,112$ 1,134,618$ 615,529$
Port Authority 1,046,656 90,772 - 477,003
Total component units 5,781,697$ 3,093,884$ 1,134,618$ 1,092,532$
General revenues:
Property taxes
Other taxes
Grants and contributions not restricted to certain programs
Unrestricted investment earnings
Miscellaneous
Transfers
Total general revenues and transfers
Change in net position
Net position - beginning
Restatement
Net position - beginning, as restated
Net position - ending
See accompanying Notes to Financial Statements.
(20)

Net (Expense) Revenue and
Changes in Net Position
Primary Government Component Units
Governmental Business-type Housing Port
Activities Activities Total Authority Authority
(1,754,315)$ -$ (1,754,315)$ -$ -$
(5,131,165) - (5,131,165) - -
(3,190,951) - (3,190,951) - -
(3,598,829) - (3,598,829) - -
(293,892) - (293,892) - -
(479,354) - (479,354) - -
295,588 - 295,588 - -
(14,973) - (14,973) - -
(14,167,891)$ -$ (14,167,891)$ -$ -$
-$ 776,108$ 776,108$ -$ -$
- 11,331 11,331 - -
- 468,846 468,846 - -
- 1,986,608 1,986,608 - -
- 793,380 793,380 - -
- 1,568,772 1,568,772 - -
-$ 5,605,045$ 5,605,045$ -$ -$
(14,167,891)$ 5,605,045$ (8,562,846)$ -$ -$
-$ -$ -$ 18,218$ -$
- - - - (478,881)
-$ -$ -$ 18,218$ (478,881)$
6,461,424$ -$ 6,461,424$ 338,409$ 40,157$
1,927,168 - 1,927,168 - -
8,185,269 - 8,185,269 - -
518,772 446,212 964,984 43,987 37,947
82,927 - 82,927 164,079 109,316
1,844,615 (1,844,615) - - -
19,020,175$ (1,398,403)$ 17,621,772$ 546,475$ 187,420$
4,852,284$ 4,206,642$ 9,058,926$ 564,693$ (291,461)$
147,345,757 107,374,294 254,720,051 14,442,731 27,107,221
(866,322) (12,887,761) (13,754,083) - -
146,479,435$ 94,486,533$ 240,965,968$ 14,442,731$ 27,107,221$
151,331,719$ 98,693,175$ 250,024,894$ 15,007,424$ 26,815,760$
(21)

City of Austin, Minnesota
Balance Sheet
Governmental Funds
December 31, 2018
Local Option Building
General Sales Tax Fund
Assets
Cash and investments 8,812,598$ 4,114,627$ 1,032,253$
Taxes receivable 120,258 - -
Accounts receivable 267,129 - 120,000
Notes receivable, net of allowance for uncollectibles 101,155 - 145,698
Special assessments receivable 115,778 - -
Accrued interest receivable 143,547 - -
Due from other funds 270,749 - 2,304
Due from other governments 267,246 265,007 -
Advances to component unit - - 786,336
Total assets 10,098,460$ 4,379,634$ 2,086,591$
Liabilities
Vouchers payable 184,566$ 1,206$ -$
Contractors' retained percentage - 70,026 -
Deposits 102,578 - -
Accrued expenditures 588,155 - -
Due to other funds 145,304 - -
Due to other governments 231,133 - -
Unearned revenues 540 160,929 -
Total liabilities 1,252,276$ 232,161$ -$
Deferred inflows of resources
Unavailable revenue 337,191$ -$ 35,200$
Total deferred inflows of resources 337,191$ -$ 35,200$
Fund balance
Nonspendable:
Permanent fund principal -$ -$ -$
Restricted for:
Police - operations 86,696 - -
Fire - operations - - -
Parks and recreation - capital projects - - -
Debt service reserve - - -
Other capital projects 112,117 4,147,473 -
Library - programming 12 - -
Committed to:
Other capital projects 38,167 - -
Library - programming - - -
Parks and recreation - programming - - -
Assigned to:
Police - capital projects - - -
Streets and highways - capital projects - - -
Other capital projects - - 2,051,391
Library - programming - - -
Unassigned: 8,272,001 - -
Total fund balance 8,508,993$ 4,147,473$ 2,051,391$
Total liabilities, deferred inflows of
resources, and fund balance 10,098,460$ 4,379,634$ 2,086,591$
See accompanying Notes to Financial Statements.
(22)

Other Total
Governmental Governmental
Funds Funds
8,804,460$ 22,763,938$
107,111 227,369
36,164 423,293
79,386 326,239
2,846,287 2,962,065
6,086 149,633
34,638 307,691
349,947 882,200
- 786,336
12,264,079$ 28,828,764$
164,007$ 349,779$
497,304 567,330
- 102,578
42,600 630,755
3,951 149,255
80,295 311,428
374,684 536,153
1,162,841$ 2,647,278$
3,180,937$ 3,553,328$
3,180,937$ 3,553,328$
136,052$ 136,052$
- 86,696
285,265 285,265
2,343 2,343
677,290 677,290
- 4,259,590
1,014,288 1,014,300
23,350 61,517
554,471 554,471
155,974 155,974
746 746
2,493,065 2,493,065
2,554,886 4,606,277
22,571 22,571
- 8,272,001
7,920,301$ 22,628,158$
12,264,079$ 28,828,764$
(23)

City of Austin, Minnesota
Reconciliation of Net Position in the
Amounts reported for governmental activities in the statement of net position are
different because:
Total governmental fund balances (page 23) 22,628,158$
Capital assets used in governmental activities are not financial
resources and, therefore, are not reported in the funds. This
represents the net effect of capital assets ($ 171,612,167) and
accumulated depreciation ($ 50,346,965). 121,265,202
Other long-term assets are not available to pay for current-period
expenditures and, therefore, are deferred in the funds. 8,612,330
Internal service funds are used by management to charge the
costs of equipment, information technology and insurance to
individual funds. The assets and liabilities of the internal service
funds are included in governmental activities in the statement
of net position 16,343,872
Noncurrent liabilities, including bonds payable, are not due and payable
in the current period and therefore are not reported in the funds.
Noncurrent liabilities consist of bonds payable ($ 375,000),
vacation payable ($ 557,885), sick leave payable ($ 1,510,980),
interest payable ($ 5,845), OPEB payable ($ 1,118,462).
net pension liability ($ 6,630,510), and deferred inflows of
resources ($ 7,319,161). (17,517,843)
Net position of governmental activities (page 19) 151,331,719$
See accompanying Notes to Financial Statements.
Government-Wide Financial Statements and Fund Balances
in the Fund Basis Financial Statements
December 31, 2018
(24)

(This page intentionally left blank.)

City of Austin, Minnesota
Statement of Revenues, Expenditures, and Changes in Fund Balances
Governmental Funds
For the Year Ended December 31, 2018
Local Option Building
General Sales Tax Fund
Revenues
Taxes 3,931,589$ 1,410,251$ -$
Special assessments 29,167 - -
Licenses and permits 476,812 - -
Intergovernmental 8,981,071 834,951 -
Charges for services 933,175 - -
Fines and forfeits 159,118 - -
Miscellaneous 746,686 24,620 1,092,635
Total revenues 15,257,618$ 2,269,822$ 1,092,635$
Expenditures
Current
General government 2,039,277$ -$ -$
Public safety 6,449,125 - -
Streets and highways 3,456,573 - -
Culture and recreation 3,063,561 - -
Public service 93,133 - -
Economic development 270,792 - -
Capital outlay - 1,812,656 662,660
Debt service
Principal retirement - - -
Interest and fiscal charges - - -
Total expenditures 15,372,461$ 1,812,656$ 662,660$
Excess (deficiency) of revenues
over expenditures (114,843)$ 457,166$ 429,975$
Other financing sources (uses)
Transfers in 1,696,915$ -$ -$
Transfers out - - -
Total other financing sources (uses) 1,696,915$ -$ -$
Net change in fund balance 1,582,072$ 457,166$ 429,975$
Fund balance - beginning 6,926,921 3,690,307 1,621,416
Fund balance - ending 8,508,993$ 4,147,473$ 2,051,391$
See accompanying Notes to Financial Statements.
(26)

Other Total
Governmental Governmental
Funds Funds
2,830,888$ 8,172,728$
772,367 801,534
- 476,812
1,151,129 10,967,151
110,815 1,043,990
18,441 177,559
337,463 2,201,404
5,221,103$ 23,841,178$
-$ 2,039,277$
17,966 6,467,091
- 3,456,573
1,297,354 4,360,915
- 93,133
- 270,792
2,554,344 5,029,660
285,000 285,000
256,463 256,463
4,411,127$ 22,258,904$
809,976$ 1,582,274$
-$ 1,696,915$
(5,000) (5,000)
(5,000)$ 1,691,915$
804,976$ 3,274,189$
7,115,325 19,353,969
7,920,301$ 22,628,158$
(27)

City of Austin, Minnesota
Reconciliation of the Statement of Revenues,
Amounts reported for governmental activities in the statement of activities are
different because:
Net change in fund balances - total governmental funds (page 27) 3,274,189$
Governmental funds report capital outlays as expenditures. However, in the
statement of activities the cost of those assets is allocated over their estimated
useful lives and reported as depreciation expense. This is the amount by which
capital outlays $ 5,289,842 exceeded depreciation ($ 4,007,760) in the
current period. 1,282,082
The net effect of various miscellaneous transactions involving capital assets
(i.e., donations, sales, trade-ins, and disposals) is to decrease net position.
This consists of disposals of capital assets ($ 33,667). (33,667)
Revenues in the statement of activities that do not provide current financial
resources are not reported as revenues in the funds 60,866
Some expenses reported in the statement of activities do not require the use
of current financial resources and, therefore, are not reported as expenditures
in governmental funds. 77,239
Internal service funds are used by management to charge the costs of fleet
management and management information systems to individual funds.
The net revenue of certain activities of internal service funds is reported
with governmental activities. (98,153)
The issuance of long-term debt (e.g., bonds, lease) provides current financial
resources to governmental funds, while the repayment of the principal of
long-term consumes the current financial resources of governmental funds.
Neither transaction, however, has any effect on net position. Also, governmental
funds report the effect of premiums, discounts, and similar
items when debt is first issued, whereas these amounts are deferred and
amortized in the statement of activities. This amount consists of
bond repayments of $ 285,000, and changes in interest payable of $ 4,728. 289,728
Change in net position of governmental activities (page 21) 4,852,284$
See accompanying Notes to Financial Statements.
Expenditures, and Changes in Fund Balances of
Governmental Funds to the Statement of Activities
For the Year Ended December 31, 2018
(28)

City of Austin, Minnesota
General Fund
Statement of Revenues, Expenditures, and
Changes in Fund Balances - Budget and Actual
For the Year Ended December 31, 2018
Variance with
Final Budget -
Budgeted Amounts Actual Positive
Original Final Amounts (Negative)
Revenues
Taxes 4,020,825$ 4,020,825$ 3,931,589$ (89,236)$
Special assessments 26,000 26,000 29,167 3,167
Licenses and permits 465,775 465,775 476,812 11,037
Intergovernmental 8,911,233 8,911,233 8,981,071 69,838
Charges for services 527,080 527,080 933,175 406,095
Fines and forfeits 177,700 248,700 159,118 (89,582)
Miscellaneous 569,613 569,613 746,686 177,073
Total revenues 14,698,226$ 14,769,226$ 15,257,618$ 488,392$
Expenditures
Current
General government 2,204,773$ 2,197,460$ 2,039,277$ 158,183$
Public safety 6,901,298 6,964,669 6,449,125 515,544
Streets and highways 3,670,472 3,699,264 3,456,573 242,691
Culture and recreation 3,355,632 3,485,257 3,063,561 421,696
Public service 97,000 97,000 93,133 3,867
Economic development 191,551 222,051 270,792 (48,741)
Total expenditures 16,420,726$ 16,665,701$ 15,372,461$ 1,293,240$
Excess (deficiency) of revenues
over expenditures (1,722,500)$ (1,896,475)$ (114,843)$ 1,781,632$
Other financing sources (uses)
Transfers in 1,705,000$ 1,705,000$ 1,696,915$ (8,085)$
Total other financing sources (uses) 1,705,000$ 1,705,000$ 1,696,915$ (8,085)$
Net change in fund balance (17,500)$ (191,475)$ 1,582,072$ 1,773,547$
Fund balance - beginning 6,926,921 6,926,921 6,926,921 -
Fund balance - ending 6,909,421$ 6,735,446$ 8,508,993$ 1,773,547$
See accompanying Notes to Financial Statements.
(29)

City of Austin, Minnesota
Statement of Net Position
Proprietary Funds
December 31, 2018
Business-type Activities - Enterprise Funds
Other
Sewer Enterprise
Assets User Utilities Funds
Current assets
Cash and investments 6,601,741$ 26,413,907$ 977,306$
Accounts receivable 540,823 3,883,559 100,123
Accrued interest receivable 212 - -
Due from employees - - -
Special assessments receivable, current portion 117,909 - -
Notes receivable, current portion 292,664 3,643 -
Due from other funds 312,009 248,961 56,515
Due from other governments 21,721 - -
Inventory - 1,616,019 -
Prepaid items - 150,095 -
Other current assets 9,046 - -
Total current assets 7,896,125$ 32,316,184$ 1,133,944$
Noncurrent assets
Restricted investments -$ 1,780,781$ -$
Special assessments receivable, noncurrent portion 1,158,937 - -
Notes receivable, noncurrent portion 541,974 - -
Other assets - 541,093 -
Capital assets:
Capital assets 52,110,780$ 117,517,308$ 5,460,431$
Accumulated depreciation (17,937,639) (52,851,853) (962,942)
Net 34,173,141$ 64,665,455$ 4,497,489$
Construction in progress 1,389,827 - 920,417
Net capital assets 35,562,968$ 64,665,455$ 5,417,906$
Total noncurrent assets 37,263,879$ 66,987,329$ 5,417,906$
Total assets 45,160,004$ 99,303,513$ 6,551,850$
Deferred outflows of resources
Pension related 168,485$ 832,692$ 15,926$
OPEB related - 879,159 -
Total deferred outflows of resources 168,485$ 1,711,851$ 15,926$
Total assets and deferred outflows
of resources 45,328,489$ 101,015,364$ 6,567,776$
See accompanying Notes to Financial Statements.
(30)

City of Austin, Minnesota
Statement of Net Position
Proprietary Funds
December 31, 2018
Business-type Activities - Enterprise Funds Governmental
Activities -
Internal Service
Totals Funds
33,992,954$ 8,434,090$
4,524,505 259
212 -
- 4,110
117,909 -
296,307 -
617,485 -
21,721 -
1,616,019 76,800
150,095 264,390
9,046 -
41,346,253$ 8,779,649$
1,780,781$ -$
1,158,937 -
541,974 -
541,093 -
175,088,519$ 16,587,155$
(71,752,434) (8,073,218)
103,336,085$ 8,513,937$
2,310,244 47,480
105,646,329$ 8,561,417$
109,669,114$ 8,561,417$
151,015,367$ 17,341,066$
1,017,103$ 51,970$
879,159 -
1,896,262$ 51,970$
152,911,629$ 17,393,036$
(continued)
(31)

City of Austin, Minnesota
Statement of Net Position (continued)
Proprietary Funds
December 31, 2018
Business-type Activities - Enterprise Funds
Other
Sewer Enterprise
User Utilities Funds
Liabilities
Current liabilities
Vouchers payable 279,771$ 3,679,660$ 12,431$
Contractors' retained percentage 5,665 - -
Accrued expenses 125,968 1,284,720 4,300
Bonds payable, current portion 455,000 1,055,000 -
Compensated absences, current portion 82,253 220,000 -
Other postemployment benefits payable, current portion - 894,000 -
Due to other funds 84,857 676,215 7,681
Other current liabilities - 520,655 -
Total current liabilities 1,033,514$ 8,330,250$ 24,412$
Noncurrent liabilities
Bonds payable 1,180,000$ 19,122,643$ -$
Net pension liability 951,151 4,981,736 89,910
Other postemployment benefits payable 179,849 15,095,512 16,546
Compensated absences 9,153 1,584,814 -
Total noncurrent liabilities 2,320,153$ 40,784,705$ 106,456$
Total liabilities 3,353,667$ 49,114,955$ 130,868$
Deferred inflows of resources
Community Solar Program Related -$ 54,600$ -$
Pension related 255,172 1,528,955 24,121
OPEB related 8,224 - 757
Total deferred inflows of resources 263,396$ 1,583,555$ 24,878$
Net position
Net investment in capital assets 34,207,014$ 44,487,812$ 5,417,906$
Unrestricted 7,504,412 5,829,042 994,124
Total net position 41,711,426$ 50,316,854$ 6,412,030$
Total liabilities, deferred inflows of
resources, and net position 45,328,489$ 101,015,364$ 6,567,776$
Amounts reported by business-type activities in the statement of net position (page 19) are different because:
Adjustment to reflect the consolidation of internal service funds activities related to enterprise funds.
Net position of business-type activities
See accompanying Notes to Financial Statements.
(32)

City of Austin, Minnesota
Statement of Net Position (continued)
Proprietary Funds
December 31, 2018
Business-type Activities - Enterprise Funds Governmental
Activities -
Internal Service
Totals Funds
3,971,862$ 102,031$
5,665 -
1,414,988 315,630
1,510,000 -
302,253 -
894,000 -
768,753 7,168
520,655 -
9,388,176$ 424,829$
20,302,643$ -$
6,022,797 293,390
15,291,907 -
1,593,967 -
43,211,314$ 293,390$
52,599,490$ 718,219$
54,600$ -$
1,808,248 78,710
8,981 -
1,871,829$ 78,710$
84,112,732$ 8,561,417$
14,327,578 8,034,690
98,440,310$ 16,596,107$
17,393,036$
252,865
98,693,175$
(33)

City of Austin, Minnesota
Statement of Revenues, Expenses, and
Changes in Net Position - Proprietary Funds
For the Year Ended December 31, 2018
Business-type Activities - Enterprise Funds
Other
Sewer Enterprise
User Utilities FundsOperating revenues
Charges for services 5,668,653$ 58,344,290$ 684,338$
Other operating revenues - 979,368 42,672
Total operating revenues 5,668,653$ 59,323,658$ 727,010$
Operating expenses
Salaries and benefits 1,564,177$ -$ 127,650$
Supplies and maintenance 2,161,746 - 90,606
Administrative and general 216,577 - 83,702
Claims - - -
Retirement benefits - - -
Insurance premiums - - -
Utilities expense - 54,128,879 -
Total operating expenses, excluding depreciation 3,942,500$ 54,128,879$ 301,958$
Depreciation 1,118,245 2,543,974 98,765
Total operating expenses 5,060,745$ 56,672,853$ 400,723$
Operating income (loss) 607,908$ 2,650,805$ 326,287$
Non-operating revenues (expenses)
Investment income 58,683$ 377,719$ 9,810$
Interest earnings on note 55,687 - -
Interest expense (96,410) (599,908) -
Loss on disposal of capital assets - (33,552) -
Miscellaneous revenues 44,517 50,300 100,111
Total non-operating revenues (expenses) 62,477$ (205,441)$ 109,921$
Net income (loss) before contributions and transfers 670,385$ 2,445,364$ 436,208$
Capital contributions 165,221$ 2,281,115$ -$
Transfers out - (1,794,615) -
Change in net position 835,606$ 2,931,864$ 436,208$
Total net position - beginning 41,023,729 60,109,683 5,990,981
Restatement (147,909) (12,724,693) (15,159)
Total net position - beginning, as restated 40,875,820 47,384,990 5,975,822
Total net position - ending 41,711,426$ 50,316,854$ 6,412,030$
Amounts reported by business-type activities in the statement of activities (page 21) are different because:
Adjustment to reflect the consolidation of internal service funds activities related to enterprise funds.
Change in net position of business-type activities
See accompanying Notes to Financial Statements.
(34)

Business-type Activities - Enterprise Funds Governmental
Activities -
Internal Service
Totals Funds
64,697,281$ 4,510,241$
1,022,040 -
65,719,321$ 4,510,241$
1,691,827$ 510,403$
2,252,352 490,397
300,279 209,100
- 2,198,424
- 121,808
- 1,042,264
54,128,879 -
58,373,337$ 4,572,396$
3,760,984 718,817
62,134,321$ 5,291,213$
3,585,000$ (780,972)$
446,212$ 73,142$
55,687 -
(696,318) -
(33,552) -
194,928 612,576
(33,043)$ 685,718$
3,551,957$ (95,254)$
2,446,336$ -$
(1,794,615) -
4,203,678$ (95,254)$
16,691,361
-
16,691,361
16,596,107$
2,964
4,206,642$
(35)

City of Austin, Minnesota
Statement of Cash Flows
Proprietary Funds
For the Year Ended December 31, 2018
Business-type Activities - Enterprise Funds
Sewer
User Utilities
Cash flows from operating activities
Receipts from customers and users 5,602,458$ 58,042,408$
Payments to suppliers (2,072,836) (49,078,319)
Payments to employees (1,658,031) (6,667,288)
Payments to retirees - -
Other receipts 44,517 -
Other expenses - (926,376)
Net cash provided by operating activities 1,916,108$ 1,370,425$
Cash flows from capital and related financing activities
Capital asset acquisitions (908,135)$ (3,219,929)$
Capital contributions 240,439 326,115
Proceeds from the sales of capital assets - 40,999
Other grants - 2,005,000
Reduction of long-term debt (800,000) (1,035,000)
Interest paid on bonds and notes (105,443) (621,117)
Net cash used by capital and
related financing activities (1,573,139)$ (2,503,932)$
Cash flows from investing activities
Investment income 59,074$ 449,783$
Principal and interest received on note receivable 399,549 -
Decrease in investments - (2,510,501)
Net cash flows provided (used) by investing activities 458,623$ (2,060,718)$
Net increase (decrease) in cash and cash equivalents 801,592$ (3,194,225)$
Cash and cash equivalents - beginning 5,800,149 11,364,216
Cash and cash equivalents - ending 6,601,741$ 8,169,991$
See accompanying Notes to Financial Statements.
(36)

Statement of Cash Flows
Proprietary Funds
For the Year Ended December 31, 2018
Business-type Activities - Enterprise Funds Governmental
Other Activities -
Enterprise Internal Service
Funds Totals Funds
626,601$ 64,271,467$ 4,513,370$
(173,068) (51,324,223) (4,139,162)
(149,029) (8,474,348) (481,518)
- - (121,808)
100,111 144,628 612,576
- (926,376) -
404,615$ 3,691,148$ 383,458$
(505,494)$ (4,633,558)$ (1,134,115)$
- 566,554 -
- 40,999 -
- 2,005,000 -
- (1,835,000) -
- (726,560) -
(505,494)$ (4,582,565)$ (1,134,115)$
9,810$ 518,667$ 73,142$
- 399,549 -
- (2,510,501) -
9,810$ (1,592,285)$ 73,142$
(91,069)$ (2,483,702)$ (677,515)$
1,068,375 18,232,740 9,111,605
977,306$ 15,749,038$ 8,434,090$
(continued)
(37)

City of Austin, Minnesota
Statement of Cash Flows (continued)
Proprietary Funds
For the Year Ended December 31, 2018
Business-type Activities - Enterprise Funds
Sewer
User Utilities
Reconciliation of operating income (loss) to net cash
provided by operating activities:
Operating income (loss) 607,908$ 2,650,805$
Adjustments to reconcile operating income (loss)
to net cash provided by operating activities:
Depreciation and amortization 1,118,245 2,543,974
Miscellaneous revenues 44,517 300
Miscellaneous expenses - (6,160)
Change in net pension liability (237,295) (1,000,010)
Change in deferred inflows of resources - pension related 37,627 161,519
Change in deferred inflows of resources - OPEB related 8,224 -
Change in deferred outflows of resources - pension related 128,015 624,613
Change in deferred outflows of resources - OPEB related - 35,206
Change in deferred inflows of resources - community solar related - 9,836
Change in other postemployment benefits payable (10,509) (290,798)
Operating transfers out - (1,691,915)
(Increase) decrease in assets:
Accounts receivable (1,518) (297,795)
Due from employees/FSA - -
Due from other funds (59,345) (224,099)
Due from other governments (5,332) -
Inventory - (277,909)
Prepaid items - (8,997)
Other assets - 168,954
Increase (decrease) in liabilities:
Vouchers payable 233,352 (1,074,784)
Contractors' retained percentage (11,494) -
Accrued expenses (19,916) 73,307
Due to other funds 83,629 (6,532)
Other current liabilities - (19,090)
Net cash provided by operating activities 1,916,108$ 1,370,425$
Noncash investing, capital, and financing activities:
Change in fair value of investments -$ (90,127)$
Reconciliation of total cash and cash equivalents
to cash and investments:
Cash and cash equivalents 6,601,741$ 8,169,991$
Other unrestricted investments - 18,243,916
Total cash and investments 6,601,741$ 26,413,907$
See accompanying Notes to Financial Statements.
(38)

Statement of Cash Flows (continued)
Proprietary Funds
For the Year Ended December 31, 2018
Business-type Activities - Enterprise Funds Governmental
Other Activities -
Enterprise Internal Service
Funds Totals Funds
326,287$ 3,585,000$ (780,972)$
98,765 3,760,984 718,817
100,111 144,928 612,576
- (6,160) -
(32,840) (1,270,145) (30,224)
1,652 200,798 19,470
757 8,981 -
14,698 767,326 28,768
- 35,206 -
- 9,836 -
(2,964) (304,271) -
- (1,691,915) -
(100,123) (399,436) 7,239
- - (4,110)
(286) (283,730) -
- (5,332) -
- (277,909) 4,648
- (8,997) (264,390)
- 168,954 -
3,545 (837,887) 82,497
(3,864) (15,358) -
(5,119) 48,272 (18,029)
3,996 81,093 7,168
- (19,090) -
404,615$ 3,691,148$ 383,458$
-$ (90,127)$ -$
977,306$ 15,749,038$ 8,434,090$
- 18,243,916 -
977,306$ 33,992,954$ 8,434,090$
(39)

(This page intentionally left blank.)

Notes to the Financial Statements

City of Austin, Minnesota
Notes to the Financial Statements
December 31, 2018
(42)
NOTE 1 SUMMARY OF SIGNIFICANT ACCOUNTING POLICIES
A. Description of Government-wide Financial Statements
The government-wide financial statements (i.e., the statement of net position and the statement of activities) report information on all of the activities of the primary government and its component units. Governmental activities, which normally are supported by taxes, intergovernmental revenues, and other nonexchange transactions, are reported separately from business-type activities, which rely to a significant extent on fees and charges to external customers for support. Likewise, the primary government is reported separately from certain legally separate component units for which the primary government is financially accountable.
B. Reporting Entity
The City of Austin, Minnesota is a municipal corporation governed by an elected mayor and seven-member council. The accompanying financial statements present the government and its component units, entities for which the government is considered to be financially accountable. Each discretely presented component unit is reported in a separate column in the government-wide financial statements (see note below for description) to emphasize that it is legally separate from the government. The City of Austin was incorporated February 28, 1876, and is governed by a Home Rule Charter adopted March 10, 1903 pursuant to the general laws of Minnesota.
Discretely Presented Component Units
Housing and Redevelopment Authority of Austin
The Housing and Redevelopment Authority of Austin (HRA) is legally separate from the City of Austin. The City of Austin appoints a voting majority of the HRA’s board and is able to impose its will on the HRA. However, the HRA does not provide services exclusively to the City of Austin; therefore, the HRA is a discrete presentation in this report. The fund structure of the HRA consists of seven enterprise funds. The HRA’s fiscal year end is September 30; therefore, balances in this report are as of September 30, 2018. Copies of the HRA’s financial statements may be obtained at 308 2nd Avenue NE, Austin, Minnesota 55912.
Austin Port Authority The Austin Port Authority (Port Authority) is legally separate from the City of Austin. However, the City appoints a voting majority of the Port Authority Board, and the City is able to impose its will on the Port Authority. The two boards are not substantially the same, and the Port Authority does not provide services exclusively to the City of Austin; therefore, the Port Authority is also a discrete presentation in this report. The Port Authority maintains only one enterprise fund. Copies of the Port Authority’s financial statements may be obtained at 500 4th Avenue NE, Austin, Minnesota 55912.

City of Austin, Minnesota
Notes to the Financial Statements
December 31, 2018
(43)
NOTE 1 SUMMARY OF SIGNIFICANT ACCOUNTING POLICIES (CONTINUED)
B. Reporting Entity (continued)
Excluded from Entity
Austin/Mower County Homeownership Fund The City of Austin and Mower County have entered into an agreement to provide home ownership opportunities to low and moderate income families in Mower County, Minnesota. This jointly governed organization meets all of the criteria of a joint venture (i.e. a legal entity under joint control with a specific activity), except there is no ongoing financial responsibility. Accordingly, the City of Austin has not reported either the balance sheet or operating statement in these financial statements. Copies of the Austin/Mower County Homeownership Fund’s financial statements may be obtained at 500 4th Avenue NE, Austin, Minnesota 55912.
C. Basis of Presentation - Government-wide Financial Statements
While separate government-wide and fund financial statements are presented, they are interrelated. The governmental activities column incorporates data from governmental funds and internal service funds, while business-type activities incorporate data from the government’s enterprise funds. Separate financial statements are provided for governmental funds and proprietary funds. As discussed earlier, the City has two discretely presented component units. While neither the Housing and Redevelopment Authority of Austin or the Austin Port Authority are considered to be a major component unit, they are nevertheless shown in separate columns in the government-wide financial statements. As a general rule, the effect of interfund activity has been eliminated from the government-wide financial statements. Exceptions to this general rule are charges between the City’s water, electric, and gas function and various other functions of the City. Elimination of these charges would distort the direct costs and program revenues reported for the various functions concerned.

City of Austin, Minnesota
Notes to the Financial Statements
December 31, 2018
(44)
NOTE 1 SUMMARY OF SIGNIFICANT ACCOUNTING POLICIES (CONTINUED)
D. Basis of Presentation - Fund Financial Statements
The fund financial statements provide information about the government’s funds. Separate statements for each fund category – governmental and proprietary – are presented. The emphasis of fund financial statements is on major governmental and enterprise funds, each displayed in a separate column. All remaining governmental and enterprise funds are aggregated and reported as nonmajor funds. Major individual governmental and enterprise funds are reported as separate columns in the fund financial statements. The City reports the following major governmental funds:
The general fund is the government’s primary operating fund. It accounts for all financial resources of the City, except those required to be accounted for in another fund. The local option sales tax fund accounts for the financial resources to be used for various flood control projects. The building fund accounts for the financial resources to be used directly for various building projects, or as a resource for debt retirement related to building projects. The primary revenue source is an annual appropriation of interest earnings on investments.
The City reports the following major proprietary funds:
The sewer user fund accounts for the operations of the City owned wastewater treatment plant. The utilities fund accounts for the operations of Austin Utilities.
Additionally, the City reports the following fund types:
Internal service funds account for insurance, data processing equipment and fleet management services provided to other departments of the City on a cost reimbursement basis.
During the course of operations, the government has activity between funds for various purposes. Any residual balances outstanding at year end are reported as due from/to other funds and advances to/from other funds. While these balances are reported in fund financial statements, certain eliminations are made in the preparation of the government-wide financial statements. Balances between the funds included in governmental activities (i.e., the governmental and internal service funds) are eliminated so that only the net amount is included as internal balances in the governmental activities column. Similarly, balances between the funds included in business-type activities (i.e., the enterprise funds) are eliminated so that only the net amount is included as internal balances in the business-type activities column.

City of Austin, Minnesota
Notes to the Financial Statements
December 31, 2018
(45)
NOTE 1 SUMMARY OF SIGNIFICANT ACCOUNTING POLICIES (CONTINUED)
D. Basis of Presentation - Fund Financial Statements (continued)
Further, certain activity occurs during the year involving transfers of resources between funds. In fund financial statements these amounts are reported at gross amounts as transfers in/out. While reported in fund financial statements, certain eliminations are made in the preparation of the government-wide financial statements. Transfers between the funds included in governmental activities are eliminated so that only the net amount is included as transfers in the governmental activities column. Similarly, balances between the funds included in business-type activities are eliminated so that only the net amount is included as transfers in the business-type activities column.
E. Measurement Focus and Basis of Accounting
The accounting and financial reporting treatment is determined by the applicable measurement focus and basis of accounting. Measurement focus indicates the type of resources being measured such as current financial resources or economic resources. The basis of accounting indicates the timing of transactions or events for recognition in the financial statements. The government-wide financial statements are reported using the economic resources measurement focus and the accrual basis of accounting. Revenues are recorded when earned and expenses are recorded when a liability is incurred, regardless of the timing of related cash flows. Property taxes are recognized as revenues in the year for which they are levied. Grants and similar items are recognized as revenue as soon as all eligibility requirements imposed by the provider have been met. The governmental fund financial statements are reported using the current financial resources measurement focus and the modified accrual basis of accounting. Revenues are recognized as soon as they are both measurable and available. Revenues are considered to be available when they are collectible within the current period or soon enough thereafter to pay liabilities of the current period. For this purpose, the government considers revenues to be available if they are collected within 60 days of the end of the current period. Expenditures generally are recorded when a liability is incurred, as under accrual accounting. However, debt service expenditures, as well as expenditures related to compensated absences, and claims and judgments, are recorded only when payment is due. General capital asset acquisitions are reported as expenditures in governmental funds. Issuance of long-term debt and acquisitions under capital leases are reported as other financing sources. Property taxes, sales, taxes, franchise taxes, hotel-motel taxes, licenses and permits, and interest associated with the current period are all considered to be susceptible to accrual and so have been recognized as revenues of the current period. Only the portion of special assessments receivable due within the current period is considered to be susceptible to accrual as revenue of the current period. Expenditure-driven grants are recognized as revenue when the qualifying expenditures have been incurred and all other eligibility requirements have been met, and the amount is received during the period or within the availability period for this revenue source (within 60 days of year-end). All other revenue items are considered to be measurable and available only when cash is received by the City.

City of Austin, Minnesota
Notes to the Financial Statements
December 31, 2018
(46)
NOTE 1 SUMMARY OF SIGNIFICANT ACCOUNTING POLICIES (CONTINUED)
E. Measurement Focus and Basis of Accounting (continued)
The proprietary funds are reported using the economic resources measurement focus and the accrual basis of accounting.
F. Budgetary Information
1. Budgetary Basis of Accounting
Annual budgets are adopted on a basis consistent with generally accepted accounting principles for the General Fund and the Special Revenue Funds of Library, Recreation Programs, and Fire PERA. The Special Revenue Funds of Floral Club, Memorial & Gift, Shaw Gym, and Minnesota Foundation are more grant-type budgets and are not “annually legally adopted budgets”.
Budgets for Community Development Funds are prepared in accordance with Housing and Urban Development grant regulations. These are grant or project length budgets and not "annual legally adopted budgets."
Formal budgetary integration is not used for the Debt Service Funds because effective budgetary control is achieved through the use of the resolutions and ordinances that issue the bonds.
Budgetary control for the Capital Projects Funds is based on project-length financial plans rather than annual plans, therefore budgetary comparisons are not presented within the financial statements.
The City follows these legal compliance procedures in establishing the budgetary data reflected in the financial statements:
1. Revenue projections are prepared by the Finance Department and presented to
the City Council. 2. Departmental line item budgets are submitted to the City Administrator from which
a proposed budget document is compiled and submitted to the City Council. A proposed budget and tax levy must be certified to the County Auditor by September 30 in accordance with state statutes. The adopted tax levy cannot exceed the proposed levy.
3. Public hearings are conducted by the City Council with departments and with the
general public in order to adopt a final budget and tax levy. A public hearing is required by state statute (Truth in Taxation).
4. The final budget and property tax levy must be adopted by resolution on or before
December 31. The resolution includes total revenues and expenditures, or expenses, by fund and the amount to be raised by property taxes. Copies of this resolution are submitted to the County Auditor.

City of Austin, Minnesota
Notes to the Financial Statements
December 31, 2018
(47)
NOTE 1 SUMMARY OF SIGNIFICANT ACCOUNTING POLICIES (CONTINUED)
F. Budgetary Information (continued)
1. Budgetary Basis of Accounting (continued)
The legally enacted budget can be amended only by action of the City Council and budgetary information presented is as amended. The legal level of control for which expenditures may not exceed budget is at the department level. Department heads and management may transfer amounts within their department without seeking the approval of the City Council.
Appropriations in all funds lapse at the end of the year. The Council may take specific action to carry over certain appropriations to be expended in the next year.
2. Excess of Expenditures Over Appropriations
For the year ended December 31, 2018, the Recreation Programs Fund had expenditures over budget by $4,360 as a result of some unexpected operational costs. This expenditure in excess of the 2018 budget was funded by excess revenues collected during the year.
G. Assets, Liabilities, Deferred Outflows/Inflows of Resources, and Net Position/Fund
Balance
1. Cash and Investments
Cash balances from all funds are pooled and invested to the extent available in investments as authorized by resolution of the City Council. Earnings from such investments are allocated quarterly to respective funds based on month end balances of cash and investments. Investments are stated at fair value, based upon quoted market prices at the reporting date.
For purposes of the statement of cash flows, the enterprise and internal service funds includes amounts in demand deposits as well as unrestricted investments.
2. Receivables and Payables Activity between funds that are representative of lending/borrowing arrangements outstanding at the end of the year are referred to as either “due to/from other funds” (i.e., the current portion of interfund loans) or “advances to/from other funds” (i.e., the non-current portion of interfund loans). All other outstanding balances between funds are reported as “due to/from other funds.” Any residual balances outstanding between the governmental activities and business-type activities are reported in the government-wide financial statements as “internal balances.” Advances between funds, as reported in the fund financial statements, are offset by nonspendable fund balance in applicable governmental funds to indicate that they are not available for appropriation and are not expendable available financial resources.

City of Austin, Minnesota
Notes to the Financial Statements
December 31, 2018
(48)
NOTE 1 SUMMARY OF SIGNIFICANT ACCOUNTING POLICIES (CONTINUED)
G. Assets, Liabilities, Deferred Outflows/Inflows of Resources, and Net Position/Fund
Balance (continued)
2. Receivables and Payables (continued) Property tax levies are set by the City Council in December of each year and are certified to Mower County for collection in the following year. In Minnesota, counties act as collection agents for all property taxes. The County spreads all levies over taxable property. Such taxes become a lien on January 1, of the following year, and are recorded as receivables by the City at that date. Taxes are due and payable on May 15 and October 15, and collections are remitted from Mower County in January, June, and December. Revenues from property taxes are accrued and recognized as revenues in the year collectible, net of delinquencies. Taxes that remain unpaid at December 31 are classified as delinquent taxes receivable. The amount of delinquent taxes receivable is fully offset by unavailable revenue in the governmental funds of the fund financial statements as they are not known to be available to finance current expenditures. Provisions are made in the annual budgets to recognize delinquent taxes as revenue and are used for expenditures in the year received. Assessments are levied at various times upon City Council resolution for improvements made by the city to various properties. The assessment collections are generally deferred for up to fifteen years with interest rates set at approximately 2% above the cost of issuing bonds. Revenue from these assessments is recognized when assessed in the government-wide financial statements and as the annual installments become collectible in the government funds of the fund financial statements. Annual installments of assessments not collected at year-end are classified as delinquent assessments receivable. The amount of delinquent assessments receivable is fully offset by unavailable revenue in the government funds of the fund financial statements as they are not known to be available to finance current expenditures.
3. Allowance for Uncollectible Accounts
The City calculates its allowance for uncollectible accounts using specific account analysis. The allowance at December 31, 2018 is composed of the following:
Governmental Funds: Notes Receivable $ 2,201,789
Total Allowance for Uncollectible Accounts $ 2,201,789
The Utilities fund records allowances of $200,000 for accounts receivable and $2,000 for other accounts receivable. The other Enterprise Funds’ and Governmental Funds’ accounts receivable are considered fully collectible and therefore an allowance for uncollectible accounts is not applicable to those receivables.

City of Austin, Minnesota
Notes to the Financial Statements
December 31, 2018
(49)
NOTE 1 SUMMARY OF SIGNIFICANT ACCOUNTING POLICIES (CONTINUED)
G. Assets, Liabilities, Deferred Outflows/Inflows of Resources, and Net Position/Fund
Balance (continued)
4. Inventories and Prepaid Items All inventories of supplies are valued at cost, except for the utilities fund, which uses the moving weighted average method. Certain payments to vendors reflect costs applicable to future accounting periods and are recorded as prepaid items in both government-wide and fund financial statements.
5. Restricted Assets
Certain assets in governmental activities are classified as restricted on the statement of net position because they are limited as to use by donors, Federal, State, or local law. Restricted assets consist of cash and investments, which are stated at fair value. Certain assets in proprietary funds are restricted for specific purposes. Restricted assets consist of investments, which are stated at fair value.
6. Capital Assets
Capital assets, which include property, plant, equipment, and infrastructure assets (e.g., roads, sidewalks, and similar items), are reported in the applicable government or business-type activities columns in the government-wide financial statements. The government defines capital assets as assets with an initial, individual cost of more than $5,000 for governmental-type and business-type assets. An estimated useful life of two years or more is also required before an asset is capitalized. Such assets are recorded at historical cost or estimated historical cost if purchased or constructed. Donated capital assets, donated works of art and similar items, and capital assets received in a service concession arrangement are reported at acquisition value. The costs of normal maintenance and repairs that do not add to the value of the asset or materially extend assets lives are not capitalized. Major outlays for capital assets and improvements are capitalized as projects are constructed. Interest incurred during the construction phase of capital assets of business-type activities is included as part of the capitalized value of the assets constructed. Property, plant, and equipment of the primary government, as well as the component units, is depreciated using the straight-line method over the following estimated lives: Useful Life In Years Buildings 10-60 Improvements Other than Buildings 10-50 Infrastructure 25-75 Machinery and Equipment 3-40

City of Austin, Minnesota
Notes to the Financial Statements
December 31, 2018
(50)
NOTE 1 SUMMARY OF SIGNIFICANT ACCOUNTING POLICIES (CONTINUED)
G. Assets, Liabilities, Deferred Outflows/Inflows of Resources, and Net Position/Fund
Balance (continued)
7. Deferred Outflows/Inflows of Resources
In addition to assets, the statement of financial position will sometimes report a separate section for deferred outflows of resources. This separate financial statement element, deferred outflows of resources, represents a consumption of net position that applies to a future period (s) and so will not be recognized as an outflow of resources (expense/expenditure) until then. The City has three items that qualify for reporting. The first item that qualifies as this reporting element is pension related. The second item that qualifies is OPEB related. The third item is under the Component Unit Housing Authority for the loss on bond refunding that relates to the 2010 General Obligation Governmental Housing Refunding Bonds and is being amortized over the life of the bonds. In addition to liabilities, the statement of financial position will sometimes report a separate section for deferred inflows of resources. This separate financial statement element, deferred inflows of resources, represents an acquisition of net position that applies to a future period(s) and so will not be recognized as an inflow of resources (revenue) until that time. The government has four types of this item. The first item that qualifies as this reporting element is pension related. The second item that qualifies as this reporting element is a community solar program. The third item is OPEB related. The fourth item that qualifies for reporting in this category is only under modified accrual basis of accounting. Accordingly, the item, unavailable revenue, is reported only in the governmental funds balance sheet. The governmental funds report unavailable revenues from two sources: property taxes and special assessments. These amounts are deferred and recognized as an inflow of resources in the period that the amounts became available.
8. Long-term Obligations
In the government-wide financial statements, and proprietary fund types in the fund financial statements, long-term debt and other long-term obligations are reported as liabilities in the applicable governmental activities, business-type activities, or proprietary fund type statement of net position. Bond premiums and discounts are deferred and amortized over the life of the bonds using the effective interest method. Bonds payable are reported net of the applicable bond premium or discount. Bond issuance costs are recognized as an expense in the period they are incurred. In the fund financial statements, government fund types recognize bond premiums and discounts, as well as bond issuance costs, during the current period. The face amount of debt issued is reported as other financing sources. Premiums received on debt issuances are reported as other financing sources while discounts on debt issuances are reported as other financing uses. Issuance costs, whether or not withheld from the actual debt proceeds received, are reported as debt service expenditures.

City of Austin, Minnesota
Notes to the Financial Statements
December 31, 2018
(51)
NOTE 1 SUMMARY OF SIGNIFICANT ACCOUNTING POLICIES (CONTINUED)
G. Assets, Liabilities, Deferred Outflows/Inflows of Resources, and Net Position/Fund
Balance (continued)
9. Pensions For purposes of measuring the net pension liability, deferred outflows/inflows of resources, and pension expense, information about the fiduciary net position of Public Employees Retirement Association (PERA) and additions to/deductions from PERA’s fiduciary net position have been determined on the same basis as they are reported by PERA except that PERA’s fiscal year end is June 30. For this purpose, plan contributions are recognized as of employer payroll paid dates and benefit payments and refunds are recognized when due and payable in accordance with the benefit terms. Investments are reported at fair value.
10. Postemployment Benefits Other than Pensions (OPEB) For purposes of measuring the total OPEB liability, deferred outflows of resources and deferred inflows of resources related to OPEB, and OPEB expense, information about the City’s Retiree Benefits Plan (CRBP) and Austin Utilities Retiree Benefits Plan (AURBP) have been determined on the same basis as they are reported by the CRBP and AURBP. For this purpose, the City recognizes benefit payments when due and payable in accordance with the benefit terms.
11. Net Position Flow Assumption Sometimes the City will fund outlays for a particular purpose from both restricted (e.g. restricted bond or grant proceeds) and unrestricted resources. In order to calculate the amounts to report as restricted – net position and unrestricted – net position in the government-wide and proprietary fund financial statements, a flow assumption must be made about the order in which the resources are considered to be applied. It is the City’s policy to consider restricted – net position to have been depleted before unrestricted – net position is applied.
12. Fund Balance Flow Assumptions Sometimes the City will fund outlays for a particular purpose from both restricted and unrestricted resources (the total of committed, assigned, and unassigned fund balance). In order to calculate the amounts to report as restricted, committed, assigned, and unassigned fund balance in the governmental fund financial statements a flow assumption must be made about the order in which the resources are considered to be applied. It is the City’s policy to consider restricted fund balance to have been depleted before using any of the components of unrestricted fund balance. Further, when the components of unrestricted fund balance can be used for the same purpose, committed fund balance is depleted first, followed by assigned fund balance. Unassigned fund balance is applied last.

City of Austin, Minnesota
Notes to the Financial Statements
December 31, 2018
(52)
NOTE 1 SUMMARY OF SIGNIFICANT ACCOUNTING POLICIES (CONTINUED)
G. Assets, Liabilities, Deferred Outflows/Inflows of Resources, and Net Position/Fund
Balance (continued)
13. Fund Balance Policies Fund balance of governmental funds is reported in various categories based on the nature of any limitations requiring the use of resources for specific purposes. The City itself can establish limitations on the use of resources through either a commitment (committed fund balance) or an assignment (assigned fund balance). The committed fund balance classification includes amounts that can be used only for specific purposes determined by a formal action of the City’s highest level of decision-making authority. The governing council is the highest level of decision-making authority for the City that can, by adoption of a resolution prior to the end of the year, commit fund balance. Once adopted, the limitation imposed by the resolution remains in place until a similar action is taken (the adoption of another resolution) to remove or revise the limitation. Amounts in the assigned fund balance classification are intended to be used by the government for specific purposes but do not meet the criteria to be classified as committed. The governing council (city council) has by resolution authorized the finance director to assign fund balance. The council may also assign fund balance as it does when appropriating fund balance to cover a gap between estimated revenue and appropriations in the subsequent year’s appropriated budget. Unlike commitments, assignments generally only exist temporarily. In other words, an additional action does not normally have to be taken for the removal of an assignment. Conversely, as discussed above, an additional action is essential to either remove or revise a commitment.

City of Austin, Minnesota
Notes to the Financial Statements
December 31, 2018
(53)
NOTE 1 SUMMARY OF SIGNIFICANT ACCOUNTING POLICIES (CONTINUED)
H. Revenues and Expenditures/Expenses
1. Program Revenues Amounts reported as program revenues include 1) charges to customers or applicants who purchase, use, or directly benefit from goods, services, or privileges provided by a given function or segment and 2) grants and contributions (including special assessments) that are restricted to meeting the operational or capital requirements of a particular function or segment. All taxes, including those dedicated for specific purposes, and other internally dedicated resources are reported as general revenues rather than as program revenues.
2. Property Taxes Property taxes attach as an enforceable lien on real property and are levied as of January 1st. The tax levy is divided into two billings: the first-half billing is due May 15; the second-half billing is due October 15. The billings are considered past due if payment does not occur on or before the 15th of either May or October of each year, at which time the applicable property is subject to lien, and penalties and interest are assessed.
3. Compensated Absences It is the City’s policy to permit certain employees to accumulate earned but not used vacation, compensatory overtime and sick pay benefits. All vacation, compensatory time, and sick pay is accrued when earned in the government-wide financial statements and the proprietary fund types. A liability for these amounts is reported in governmental funds only if they have matured, for example, as a result of employee resignations and retirements. A maximum of one year’s salary exists for payment of unused sick pay benefits. In accordance with certain employee contracts, some employees are allowed to carryover up to 40 hours of unused vacation time into the next year. Hourly employees are allowed to accumulate up to 240 hours of compensatory overtime in accordance with federal fair labor standards.
4. Proprietary Funds Operating and Nonoperating Revenues and Expenses Proprietary funds distinguish operating revenues and expenses from nonoperating items. Operating revenues and expenses generally result from providing services and producing and delivering goods in connection with a proprietary fund’s principal ongoing operations. The principal operating revenues of the sewer fund, water, electric, and gas funds, the storm water utility fund, and the waste transfer station fund, and the internal service funds are charges to customers for sales and services. Operating expenses for enterprise funds and internal service funds include the cost of sales and services, administrative expenses, and depreciation on capital assets. All revenues and expenses not meeting this definition are reported as nonoperating revenues and expenses.

City of Austin, Minnesota
Notes to the Financial Statements
December 31, 2018
(54)
NOTE 2 DETAILED NOTES ON ALL ACTIVITIES AND FUNDS
A. Deposits and investments
The City maintains a cash and investment pool that is available for use by all funds. Earnings from such investments are first allocated to the respective funds on the basis of applicable balance participation by each fund. Secondly, legal and other requirements are applied to determine which funds must retain interest earnings and thirdly, earnings not required to be retained are allocated to the Building Fund. Each fund type's portion of this pool is displayed on the combined balance sheet as "Cash and Investments."
Deposits
Custodial credit risk is the risk that in the event of a bank failure, the City’s deposits may not be returned to it in full. The City has an investment policy which follows the Minnesota Statutes for deposits. In accordance with Minnesota statutes the City of Austin maintains deposits at banks, which are authorized by the Austin City Council. Minnesota statutes require that all City deposits be protected by insurance, surety bond or collateral. The fair value of the collateral pledged must be equal to 110% of the deposits not covered by insurance or bonds. Authorized collateral includes certain U.S. government securities, state or local government obligations, and other securities authorized by Minn. Stat. 118.A.03. Minnesota statutes require that securities pledged as collateral be held in safekeeping by the City Treasurer or in a financial institution other than that furnishing the collateral.
The City’s deposits in banks at December 31, 2018 were entirely covered by federal depository insurance or by collateral held by the City’s custodial bank in the City’s name.
Investments
The City may also invest idle funds as authorized investments by Minnesota Statutes as follows:
a. Direct obligations or obligations guaranteed by the United States or its agencies. b. Shares of investment companies registered under the Federal Investment
Company Act of 1940 and has received the highest credit rating and is rated in one of two highest rating categories by a statistical rating agency, and all the investments have a final maturity of thirteen months or less.
c. General obligations rated “A” or better; revenue obligations rated “AA” or better.

City of Austin, Minnesota
Notes to the Financial Statements
December 31, 2018
(55)
NOTE 2 DETAILED NOTES ON ALL ACTIVITIES AND FUNDS (CONTINUED)
A. Deposits and investments (continued)
Investments (continued)
d. Bankers acceptances of the United States banks eligible for purchase by the
Federal Reserve System. e. Commercial paper issued by United States corporations or their Canadian
subsidiaries, of the highest quality category by at least two nationally recognized rating agencies, and maturing in 270 days or less.
f. Repurchase or reverse repurchase agreements and securities lending
agreements financial institutions qualified as a “depository” by the Government entity with banks that are members of the Federal Reserve System with capitalization exceeding $10,000,000, a primary reporting dealer in U.S. government securities to the Federal Reserve Bank of New York, or certain Minnesota securities broker-dealers.
g. Guaranteed investment contracts (gic’s) issued or guaranteed by United States
commercial banks or domestic branches of foreign banks or United States insurance company and with a credit quality in one of the top two highest categories.
Investment balances for the City of Austin as of December 31, 2018 are as follows:
Investments Held at Amortized Cost
Bankers Acceptances 2,609,504$
Commercial Paper 2,973,768
Mutual Funds (4M Fund) 4,332,562
Total 9,915,834$
Investments Held at Fair Value
Federal Home Loan Bank Notes 8,350,680$
Federal National Mortgage
Association Notes 6,283,050
Federal Home Loan Mortgage
Corporate Discount Notes 16,850,225
Federal Farm Credit Bank Notes 3,653,393
U.S. Treasury Securities 155,254
Development Bonds 3,444,914
Repurchase Agreement 3,832,535
USB Select Treasury
Institutional Fund 1,061,083
Total 43,631,134$

City of Austin, Minnesota
Notes to the Financial Statements
December 31, 2018
(56)
NOTE 2 DETAILED NOTES ON ALL ACTIVITIES AND FUNDS (continued)
A. Deposits and investments (continued)
Investments (continued)
Maturities for investments held by the City of Austin as of December 31, 2018 are as
follows:
Investment Maturities in Years
Total Less Than 1 1-5 Years 6-10 Years More than 10
Federal Home Loan Bank Notes 8,350,680$ -$ 5,710,181$ 2,640,499$ -$
Federal National Mortgage
Association Notes 6,283,050 - 3,573,662 2,709,388 -
Federal Home Loan Mortgage
Corporate Discount Notes 16,850,225 - 14,230,918 1,650,487 968,820
Federal Farm Credit Bank Notes 3,653,393 486,635 1,737,230 485,448 944,080
U.S. Treasury Securities 155,254 10,335 144,919 - -
Development Bonds 3,444,914 339,684 878,385 2,226,845 -
Repurchase Agreement 3,832,535 3,832,535 - - -
Bankers Acceptances 2,609,504 2,609,504 - - -
Commercial Paper 2,973,768 2,973,768 - - -
USB Select Treasury
Institutional Fund 1,061,083 1,061,083 - - -
Mutual Funds (4M Fund) 4,332,562 4,332,562 - - -
53,546,968$ 15,646,106$ 26,275,295$ 9,712,667$ 1,912,900$
Interest rate risk The City has a formal investment policy that addresses permissible investments, portfolio diversification, and instrument maturities, but this policy does not address interest rate risk. Investment maturities are scheduled to coincide with projected cash flow needs. Within these parameters, it is the City’s policy to stagger portfolio maturities to avoid undue concentration of assets, provide for stability of income, and limit exposure to fair value losses related to rising interest rates. However, the City's investment policy does not specifically limit investment maturities as a means of managing its exposure to fair value losses arising from increasing interest rates.
Credit Risk The City does not have a formal policy regarding credit risk other than following the Minnesota State Statute described on pages 54-55 of these notes. As of December 31, 2018, the City’s investments in Federal Home Loan Bank obligations were rated Aaa and AA+ by Moody’s Investor Services and Standard & Poor’s respectively; the investments in Federal National Mortgage Association Notes were rated Aaa, AA+ and AAA by Moody’s Investor Services, Standard & Poor’s and Fitch Ratings, respectively; and the investments in Federal Home Loan Mortgage Corporate Discount Notes were rated Aaa, AA+ and AAA by Moody’s Investor Services, Standard & Poor’s and Fitch Ratings, respectively; and the City’s investments in the Federal Farm Credit Bank Notes were rated Aaa and AA+ by Moody’s Investor Services and Standard & Poor’s respectively. The City’s investments in bonds were rated Aaa and AAA by Moody’s Investor Services and Standard & Poor’s, respectively.

City of Austin, Minnesota
Notes to the Financial Statements
December 31, 2018
(57)
NOTE 2 DETAILED NOTES ON ALL ACTIVITIES AND FUNDS (CONTINUED)
A. Deposits and investments (continued)
Credit Risk (continued) As of December 31, 2018 the City had invested $4,332,562 in the Minnesota Municipal Money Market (4M fund). This investment fund is not individually rated but each underlying investment in the fund is allowable under Minnesota State Statute and is top rated. Additionally, the City had invested $1,061,083 in the USB Select Treasury Institutional Fund. This investment fund is rated AAAm by Standard & Poor’s and Aaa-mf by Moody’s Investor Services.
Concentration of Credit Risk The City does not have a formal policy limiting the amount of the portfolio that may be invested in any one depository or issuer. The Finance Department is responsible for investment decisions and activities under the direction of the City’s investment policy and the City Council. More than 5 percent of the City’s investments are in Federal Home Loan Bank Notes, Federal National Mortgage Association Notes, Federal Home Loan Mortgage Corporate Discount Notes, Federal Farm Credit Bank Notes, Development Bonds, Repurchase Agreements, Commercial Paper, and the 4M mutual fund. These investments are 15.60%, 11.73%, 31.47%, 6.82%, 6.43%, 7.16%, 5.55%, and 8.09%, respectively, of the City’s total investments.
Custodial Credit Risk For an investment, custodial credit risk is the risk that, in the event of the failure of the counterparty, the City will not be able to recover the value of its investments or collateral securities that are in the possession of an outside party. At December 31, 2018 all investments and collateral were listed in the name of the City.
Balance Sheet Presentation The following is a reconciliation of cash and investments as shown on the Statement of Net Position. Deposits $ 13,422,995
Petty Cash 1,800
Investments 53,546,968Total $ 66,971,763
Statement of Net Position:
Cash and Investments – Primary Government $ 63,465,503
Restricted Cash and Investments – Primary Government 3,506,260Total $ 66,971,763
Repurchase Agreement The Utilities entered into a repurchase sweep agreement with U.S, Bank. The sweep account invests in commercial paper issued by U.S. Bank NA with ratings of P-1, A-1+, and F1+ by Moody’s Investors Services, Standard & Poor’s and Fitch, respectively. The securities will be owned and held in safekeeping by U.S. Bank.

City of Austin, Minnesota
Notes to the Financial Statements
December 31, 2018
(58)
NOTE 2 DETAILED NOTES ON ALL ACTIVITIES AND FUNDS (CONTINUED)
A. Deposits and investments (continued)
Fair Value Measurement The City uses fair value measurements to record fair value adjustments to certain assets and liabilities and to determine fair value disclosures. The City follows an accounting standard that defines fair value, establishes a framework for measuring fair value, establishes a fair value hierarchy based on the quality of inputs used to measure fair value, and requires expanded disclosures about fair value measurements. In accordance with this standard, the City has categorized its investments, based on the priority of the inputs to the valuation technique, into a three-level fair value hierarchy. The fair value hierarchy gives the highest priority to quoted prices in active markets for identical assets of liabilities (Level 1) and the lowest priority to unobservable inputs (Level 3). If the inputs used to measure the financial instruments fall within different levels of the hierarchy, the categorization is based on the lowest level input that is significant to the fair value measurement of the instrument. Financial assets and liabilities recorded on the statements of financial position are categorized based on the inputs to the valuation techniques as follows:
Level 1 – Financial assets and liabilities are valued using inputs that are unadjusted quoted prices in active markets accessible at the measurement date of identical financial assets and liabilities. Level 2 – Financial assets and liabilities are valued based on quoted prices for similar assets, or inputs that are observable, either directly or indirectly for substantially the full term through corroboration with observable market data. Level 3 – Financial assets and liabilities are valued using pricing inputs which are unobservable for the asset, inputs that reflect the reporting entity’s own assumptions about the assumptions market participants would use in pricing the asset.
Assets of the City measured at fair value on a recurring basis:
As of December 31, 2018 Level 1 Level 2 Level 3 Total
Federal Home Loan Bank Notes -$ 8,350,680$ -$ 8,350,680$
Federal National Mortgage
Association Notes - 6,283,050 - 6,283,050
Federal Home Loan Mortgage
Corporate Discount Notes - 16,850,225 - 16,850,225
Federal Farm Credit Bank Notes - 3,653,393 - 3,653,393
U.S. Treasury Securities - 155,254 - 155,254
Development Bonds - 3,444,914 - 3,444,914
Repurchase Agreement - 3,832,535 - 3,832,535
-$ 42,570,051$ -$
Investments measured at Net Asset Value (NAV) 1,061,083
Total 43,631,134$

City of Austin, Minnesota
Notes to the Financial Statements
December 31, 2018
(59)
NOTE 2 DETAILED NOTES ON ALL ACTIVITIES AND FUNDS (CONTINUED)
A. Deposits and investments (continued)
Fair Value Measurement (continued) The UBS Select Treasury Institutional Fund is an external investment pool that is managed to maintain a dollar-weighted average portfolio maturity of not greater than 60 days and seeks to maintain a constant net asset value (NAV) per share of $1.00. The UBS Select Treasury Institutional Fund has no redemption requirements. The 4M Fund is an external investment pool (Pool) that is not registered with the SEC. The Pool elects to measure its investments at amortized cost in accordance with accounting statements issued by the Government Accounting Standards Board. The City participates in the Liquid Asset class, which has no redemption requirements.

City of Austin, Minnesota
Notes to the Financial Statements
December 31, 2018
(60)
NOTE 2 DETAILED NOTES ON ALL ACTIVITIES AND FUNDS (CONTINUED)
B. Receivables
In the government-wide financial statements, receivables consist of all revenues earned at year-end and not yet received. Major receivable balances for the governmental activities include assessments, notes, franchise fees, loans, and miscellaneous other charges. Business-type activities report utility earnings as their major receivables at year-end, and are reported net of related allowance for uncollectible accounts of $200,000. Notes receivable balances for the City of Austin as of December 31, 2018 can be summarized as follows: Governmental Activities:
General Fund
Murphy Creek Townhomes of Austin Limited Partnership $ 2,201,789
Murphy’s Creek Homes, LLC 101,155
Less: allowance for uncollectibles (2,201,789)
Subtotal General Fund $ 101,155
Building Fund
Cooperative Response Center, Inc. -- Land $ 110,498
Marcusen Park Baseball Association 35,200
Subtotal Building Fund $ 145,698
Other Nonmajor Governmental Funds
Fett Properties (Nemitz's exterior) $ 12,986
Fett Properties (Nemitz's interior) 66,400
Subtotal Other Nonmajor Governmental Funds $ 79,386
Subtotal Governmental Activities $ 326,239
Business-type Activities:
Enterprise Funds
Hormel Foods Corporation – Equalization Tank Project $ 792,287
G & R Truck Wash 42,351
Partnering in Energy Solutions loan 3,643
Subtotal Enterprise Funds $ 838,281
Less: allowance for uncollectibles -
Subtotal Business-type Activities, net of allowance $ 838,281
Total Notes Receivable, net of allowance $ 1,164,520

City of Austin, Minnesota
Notes to the Financial Statements
December 31, 2018
(61)
NOTE 2 DETAILED NOTES ON ALL ACTIVITIES AND FUNDS (CONTINUED)
B. Receivables (continued)
Murphy’s Creek Townhomes of Austin Limited Partnership The City of Austin issued a note receivable to Murphy’s Creek Townhomes of Austin Limited Partnership on June 28, 2001. The $2,184,000 note was issued to help finance the construction of an 88-unit affordable living townhouse development. The note accrues interest at one percent simple interest with payment to be made on June 28, 2031.
Murphy’s Creek Homes, LLC The City of Austin issued a note receivable to Murphy’s Creek Homes, LLC on November 15, 2001. The $46,000 note was issued to help finance the development of eighteen single family homes. The note accrues interest at seven percent simple interest with payment to be made out of the available tax increments that are to be generated from the property.
Cooperative Response Center, Inc. The City issued a note receivable to Cooperative Response Center, Inc. (CRC) for the purchase of land and public improvements on that land. The land portion of the note was issued on September 1, 2000, for $196,210 at six percent interest. The improvement portion was issued on December 1, 2000, for $41,768 at 7.5% interest. The note receivable will be paid off via tax increments received by the City on the development. The loan agreement contains job creation criteria which CRC must meet. If the criteria are not met, penalty provisions will be applied to the repayment of the loan.
Marcusen Park Baseball Association On November 30, 2017, the City issued a note receivable in the amount of $56,675 to the Marcusen Park Baseball Association to assist in the lighting and sound system improvements at Marcusen Park. The note is at zero percent, and annual payments ranging from $8,800 to $12,675 exist through 2022.
Nemitz’s Interior (Fett Properties) On September 15, 2010, the City issued a note receivable in the amount of $116,200 to Randall J. and Tamara B. Fett (Fett Properties) to assist in the interior renovation of a downtown building. The note is secured by the building. The note is at zero percent, and $16,600 will be forgiven annually as long as during the preceding year, the property has been occupied by the business. If the forgiveness does not occur, then the balance shall be carried forward to the next year, or it may be paid off by Randall J. and Tamara B. Fett.
Nemitz’s Exterior (Fett Properties) On September 15, 2010, the City issued a note receivable in the amount of $30,300 to Randall J. and Tamara B. Fett (Fett Properties) to assist in the exterior renovation of a downtown building. The note is secured by the building. The note is at zero percent, and $4,329 will be forgiven annually as long as during the preceding year, the property has been occupied by the business. If the forgiveness does not occur, then the balance shall be carried forward to the next year, or it may be paid off by Randall J. and Tamara B. Fett.

City of Austin, Minnesota
Notes to the Financial Statements
December 31, 2018
(62)
NOTE 2 DETAILED NOTES ON ALL ACTIVITIES AND FUNDS (CONTINUED)
B. Receivables (continued)
Hormel Foods Corporation On February 5, 2001 the City of Austin issued a note receivable with Hormel Foods Corporation to finance the Wastewater Treatment Plant’s Equalization Tank Project. Hormel Foods is paying the City monthly installments based on the estimated construction cost. The interest rate is 5.658% based on interest rates on the general obligation utility revenue bonds issued to finance the project. The balance of the note at December 31, 2018 is $841,328. The current portion is $272,994 as of December 31, 2018.
G & R Truck Wash The City issued a note receivable with G & R Truck Wash on February 28, 2018. The $58,147 note was issued to help refinance a note that originated from unpaid strong waste charges the company incurred during the prior years’ operations. The note accrues interest at six percent with payments to be made on a monthly basis beginning March 1, 2018. The balance of the note at December 31, 2018 is $42,351. The current portion is $19,670 as of December 31, 2018.
C. Due from Other Governments
Amounts due from other governments are composed primarily of aid for street projects from the State of Minnesota, state community development grant funds, and flood clean up grants. The balance also includes unremitted property taxes.
D. Restricted Cash and Assets
Restricted assets are deposits held for specifically required purposes. Balances at December 31, 2018, and descriptions are as follows:
Governmental activities
Fire PERA $ 284,535
Other purposes - expendable 194,697
Other police purposes - nonexpendable 2,048
Library purposes – expendable 1,046,368
Library purposes – Nonexpendable 157,321
Senior Citizens Center 38,167
Shaw Gym trust fund 2,343
Total governmental activities $ 1,725,479
Business-type activities
Utilities employee sick pay benefits fund $ 1,780,781
Total business-type activities $ 1,780,781
Total Restricted Assets $ 3,506,260

City of Austin, Minnesota
Notes to the Financial Statements
December 31, 2018
(63)
NOTE 2 DETAILED NOTES ON ALL ACTIVITIES AND FUNDS (CONTINUED)
E. Capital Assets
Capital asset activity for the year ended December 31, 2018 was as follows:
Primary Government
Governmental activities:
Beginning
Balance Increases Decreases
Ending
Balance
Capital assets, not being depreciated:
Land $ 24,632,996 $ 145,547 $ - $ 24,778,543
Construction in progress 8,014,929 4,526,828 1,253,733 11,288,024
Total capital assets, not being depreciated $ 32,647,925 $ 4,672,375 $ 1,253,733 $ 36,066,567
Capital assets, being depreciated:
Buildings $ 29,690,288 $ 197,507 $ 147,328 $ 29,740,467
Improvements other than buildings 25,436,912 123,072 20,100 25,539,884
Infrastructure 75,636,681 923,300 - 76,559,981
Machinery and Equipment 19,238,573 1,769,680 668,349 20,339,904
Total capital assets, being depreciated $ 150,002,454 $ 3,013,559 $ 835,777 $ 152,180,236
Less accumulated depreciation for:
Buildings $ 10,009,897 $ 731,001 $ 114,970 $ 10,625,928
Improvements other than buildings 4,348,673 683,217 20,100 5,011,790
Infrastructure 29,876,951 2,154,492 - 32,031,443
Machinery and Equipment 10,251,953 1,157,867 658,797 10,751,023
Total accumulated depreciation $ 54,487,474 $ 4,726,577 $ 793,867 $ 58,420,184
Total capital assets, being depreciated, net $ 95,514,980 $ (1,713,018) $ 41,910 $ 93,760,052
Governmental activities capital assets, net $ 128,162,905 $ 2,959,357 $ 1,295,643 $ 129,826,619
Business-type activities:
Beginning
Balance Increases Decreases
Ending
Balance
Capital assets, not being depreciated:
Land $ 883,910 $ - $ 102,700 $ 781,210
Construction in progress 2,250,287 1,337,534 1,277,577 2,310,244
Total capital assets, not being depreciated $ 3,134,197 $ 1,337,534 $ 1,380,277 $ 3,091,454
Capital assets, being depreciated:
Buildings $ 60,261,324 $ 448,655 $ 2,223,489 $ 58,486,490
Improvements other than buildings 1,825,862 - - 1,825,862
Infrastructure 15,356,099 847,892 - 16,203,991
Machinery and Equipment 94,844,619 3,277,050 330,707 97,790,962
Total capital assets, being depreciated $ 172,287,904 $ 4,573,597 $ 2,554,196 $ 174,307,305
Less accumulated depreciation for:
Buildings $ 19,800,276 $ 1,220,622 $ 2,183,911 $ 18,836,987
Improvements other than buildings 737,312 45,851 - 783,163
Infrastructure 1,389,154 265,993 - 1,655,147
Machinery and Equipment 48,544,353 2,228,514 295,734 50,477,133
Total accumulated depreciation $ 70,471,095 $ 3,760,980 $ 2,479,645 $ 71,752,430
Total capital assets, being depreciated, net $ 101,816,809 $ 812,617 $ 74,551 $ 102,554,875
Business-type activities capital assets, net $ 104,951,006 $ 2,150,151 $ 1,454,828 $ 105,646,329

City of Austin, Minnesota
Notes to the Financial Statements
December 31, 2018
(64)
NOTE 2 DETAILED NOTES ON ALL ACTIVITIES AND FUNDS (CONTINUED)
E. Capital Assets (continued)
Depreciation expense was charged to the functions/programs of the primary government as follows:
Governmental activities:
General government $ 148,414
Public safety 322,109
Streets and highways 1,883,824
Culture and recreation 865,569
Public Service 292,537
Community development 495,307
Capital assets held by the government’s internal
service funds are charged to the various functions
based on their usage of the assets 718,817
Total depreciation expense – governmental activities $ 4,726,577
Business-type activities:
Sewer $ 1,118,245
Waste Transfer Station 16,934
Storm Water 81,831
Utilities 2,543,974
Total depreciation expense – business-type activities $ 3,760,984
Construction Commitments
The City has active construction projects as of December 31, 2018. The projects include street improvements, building improvements and wastewater treatment improvements. At year-end the City’s commitments with contractors are as follows:
Project Spent-to-Date
Remaining
Commitment
Street improvements $ 6,304,454 $ 1,276,059
Flood improvements 1,400,512 282,228
Sewer System improvements 113,310 25,240
Total $ 7,818,276 $ 1,583,527
The commitment for street improvements is being funded primarily by fund balance and by State and Federal grants. The flood improvements are being financed by state grants and local option sales tax collections. The sewer system improvements are being financed by the use of fund balance.

City of Austin, Minnesota
Notes to the Financial Statements
December 31, 2018
(65)
NOTE 2 DETAILED NOTES ON ALL ACTIVITIES AND FUNDS (CONTINUED)
E. Capital Assets (continued)
Capital asset activity for the year ended December 31, 2018 was as follows:
Discretely presented component units
Housing Authority:
Beginning
Balance Increases Decreases
Ending
Balance
Capital assets, not being depreciated:
Land $ 2,550,940 $ - $ - 2,550,940$
Construction in progress 20,857 615,529 - 636,386
Total capital assets, not being depreciated 2,571,797$ 615,529$ -$ 3,187,326$
Capital assets, being depreciated:
Buildings and Improvements $ 32,281,553 $ - $ 205,384 32,076,169$
Equipment 1,355,110 - 7,109 1,348,001
Total capital assets, being depreciated 33,636,663$ -$ 212,493$ 33,424,170$
Less accumulated depreciation for:
Buildings and Improvements $ 18,925,186 $ 1,058,148 $ 199,413 19,783,921$
Equipment 1,055,990 71,335 7,107 1,120,218
Total accumulated depreciation 19,981,176$ 1,129,483$ 206,520$ 20,904,139$
Total capital assets, being depreciated, net 13,655,487$ (1,129,483)$ 5,973$ 12,520,031$
Housing Authority capital assets, net 16,227,284$ (513,954)$ 5,973$ 15,707,357$
Port Authority:
Beginning
Balance Increases Decreases
Ending
Balance
Capital assets, being depreciated:
Buildings $ 23,460,425 $ - $ - 23,460,425$
Improvements other than buildings 524,714 - - 524,714
Machinery and Equipment 2,108,645 - - 2,108,645
Total capital assets, being depreciated 26,093,784$ -$ -$ 26,093,784$
Less accumulated depreciation for:
Buildings $ 1,170,771 $ 587,078 $ - 1,757,849$
Improvements other than buildings 58,341 25,905 84,246
Machinery and Equipmentr 312,727 186,373 - 499,100
Total accumulated depreciation 1,541,839$ 799,356$ -$ 2,341,195$
Port Authority capital assets, net $ 24,551,945 $ (799,356) $ - $ 23,752,589

City of Austin, Minnesota
Notes to the Financial Statements
December 31, 2018
(66)
NOTE 2 DETAILED NOTES ON ALL ACTIVITIES AND FUNDS (CONTINUED)
F. Interfund Balances and Transfers
The composition of interfund balances as of December 31, 2018 is as follows:
Due to/from other funds:
Receivable Fund Payable Fund Amount
General Utilities 270,749$
Sewer User Utilities 312,009
Utilities General 145,304
Utilities Sewer User 84,857
Utilities Nonmajor Enterprise Funds 7,681
Utilities Nonmajor Internal Service Funds 7,168
Utilities Nonmajor Governmental Funds 3,951
Nonmajor Enterprise Funds Utilities 56,515
Nonmajor Governmental Funds Utilities 36,942
Total 925,176$
The amounts listed above are amounts due for interfund services provided, and were paid after year end. Advances to/from component units:
Receivable Fund/Component Payable Component/Fund Amount
Building Fund Port Authority 786,336$
Advances were made to component units to finance various projects. The amount reported as advances to component units is $786,966. This amount varies from the amount listed above because the allocation of the profit in the internal service funds back to the Port Authority is included on the government wide statement. A reconciliation of transfers for the year ended December 31, 2018 is as follows:
Transfers Out (Fund)
Nonmajor
Transfers to (Fund): Governmental Utilities Total
General 5,000$ 1,691,915$ 1,696,915$
Total 5,000$ 1,691,915$ 1,696,915$
Throughout the year, the City has to make occasional interfund transfers. These transfers are usually approved so that the fund receiving the money can continue to operate. Other transfers were made between funds for financing various purchases or to close out funds that are no longer required to be maintained. Transfers between the governmental funds and the proprietary funds (Utilities) will not reconcile due to conversion entries to record the effects of a transfer of land between the two fund types.

City of Austin, Minnesota
Notes to the Financial Statements
December 31, 2018
(67)
NOTE 2 DETAILED NOTES ON ALL ACTIVITIES AND FUNDS (CONTINUED)
G. Long-term debt
Primary Government
General Obligation Tax Increment Bonds
The City issues general obligation tax increment bonds to provide financing for projects located within the applicable tax increment districts. These bonds are backed by the full faith, credit and taxing power of the City and are serviced by Tax Increment Debt Service Funds. The General Obligation Tax Increment Bond outstanding is as follows:
Governmental Activities Matures Interest Rates Balance
Refunding Bonds, Series 2009A 2027 2.00 – 4.00% 375,000$
Total 375,000$
Annual debt service requirements to maturity for general obligation bonds are as follows:
Governmental Activities
Year Ending December 31 Principal Interest
2019 35,000$ 13,432$
2020 35,000 12,243
2021 40,000 10,967
2022 40,000 9,537
2023 45,000 7,944
2024 - 2027 180,000 14,950
Total 375,000$ 69,073$

City of Austin, Minnesota
Notes to the Financial Statements
December 31, 2018
(68)
NOTE 2 DETAILED NOTES ON ALL ACTIVITIES AND FUNDS (CONTINUED)
G. Long-term debt (continued)
Primary Government (continued)
Revenue Bonds
The City also issues bonds where the City pledges income derived from the acquired or constructed asset to pay debt service. These bonds are recorded in the fund according to the purpose for which they were issued. The Sewer Fund is carrying two issues of debt that were issued to construct various industrial improvements at the wastewater treatment plant. These bonds are being paid off via monthly payments by the industrial user over twenty years. In 2010, the City issued $2,865,000 of revenue bonds to finance construction projects to install sewer services into some recently annexed property. These bonds are being paid off over fifteen years solely by the assessments on the affected property. In 2012 the City issued $5,600,000 of revenue bonds to finance construction projects to enhance the water distribution system throughout the community. The revenue bonds currently outstanding are as follows: Business-type Activities Matures Interest Rates Balance
Utility Revenue Bonds, Series 2000B 2019 5.00 – 5.50% 270,000
Utility Revenue Bonds, Series 2010A 2026 1.00 – 4.75% 1,365,000
Water Revenue Bonds, Series 2012A 2027 2.00 - 2.50% 3,535,000
Total 5,170,000$
Annual debt service requirements to maturity for revenue bonds are as follows:
Business-type Activities
Year Ending December 31 Principal Interest
2019 820,000$ 143,928$
2020 550,000 115,756
2021 555,000 101,606 2022 560,000 87,006
2023 560,000 71,981
2024 - 2027 2,125,000 131,943
Total 5,170,000$ 652,220$

City of Austin, Minnesota
Notes to the Financial Statements
December 31, 2018
(69)
NOTE 2 DETAILED NOTES ON ALL ACTIVITIES AND FUNDS (CONTINUED)
G. Long-term debt (continued)
Primary Government (continued)
General Obligation Capital Improvement Bonds
On June 1, 2015, the City issued a general obligation capital improvement bond to provide financing to construct a central facility for the Utilities. This bond is backed by the full faith, credit and taxing power of the City and is covered by a tax levy upon all citizens. The general obligation capital improvement bond currently outstanding is as follows: Business-type Activities Matures Interest Rates Balance
Utility Capital Improvement Bonds, Series 2015A 2036 2.00 – 3.625% 16,295,000$
Total 16,295,000$
Annual debt service requirements to maturity for the general obligation capital improvement bond are as follows:
Business-type Activities
Year Ending December 31 Principal Interest
2019 690,000$ 520,913$ 2020 710,000 499,913
2021 735,000 481,913
2022 745,000 467,113
2023 760,000 448,263
2024 - 2028 4,240,000 1,798,113
2029 - 2033 4,995,000 1,032,192
2034 - 2036 3,420,000 186,038
Total 16,295,000$ 5,434,458$
Compensated Absences Compensated absences consist of unused vacation, sick leave, and compensatory time for eligible employees at December 31, 2018.

City of Austin, Minnesota
Notes to the Financial Statements
December 31, 2018
(70)
NOTE 2 DETAILED NOTES ON ALL ACTIVITIES AND FUNDS (CONTINUED)
G. Long-term debt (continued)
Primary Government (continued)
Long-term Liability Activity (continued)
Long-term liability activity for the year ended December 31, 2018, was as follows:
Governmental activities:
Beginning
Balance Increases Decreases
Ending
Balance
Due Within
One Year
Bonds Payable
G.O. Tax Increment Bonds $ 410,000 $ - $ 35,000 $ 375,000 $ 35,000
G.O. Special Assessment Bonds 250,000 - 250,000 - -
Total Bonds Payable 660,000$ -$ 285,000$ 375,000$ 35,000$
Compensated Absences 2,019,317 1,185,609 1,136,062 2,068,864 524,360
Governmental activities
Long-term liabilities $ 2,679,317 $ 1,185,609 $ 1,421,062 $ 2,443,864 $ 559,360
Business-type activities:
Revenue Bonds $ 6,330,000 $ - $ 1,160,000 $ 5,170,000 $ 820,000
Capital Improvement Plan Bonds 16,970,000 - 675,000 16,295,000 690,000
Bond Premium 370,698 - 23,055 347,643 23,055
Compensated Absences 1,871,435 291,859 267,074 1,896,220 279,198
Business-type activities
Long-term liabilities $ 25,542,133 $ 291,859 $ 2,125,129 $ 23,708,863 $ 1,812,253
Internal Service funds predominantly serve the governmental funds. Accordingly, long-term liabilities for them are included as part of the above totals for governmental activities. The sick leave portion of compensated absences payable is liquidated through the Sick Leave Program Internal Service fund. Unused vacation and compensatory time are charged to each department as they are used. For governmental activities, vacation and compensatory time are generally liquidated through the General fund.
Conduit Debt Obligations From time to time, the City has issued Industrial Revenue Bonds to provide financial assistance to private sector entities for the acquisition and construction of industrial and commercial facilities deemed to be in the public interest. The bonds are secured by the property financed and are payable solely from payments received on the underlying mortgage loans. Upon repayment of the bonds, ownership of the acquired facilities transfers to the private-sector entity served by the bond issuance. The City is not obligated in any manner for repayment of the bonds. Accordingly, the bonds are not reported as liabilities in the accompanying financial statements. As of December 31, 2018, there were two series of Industrial Revenue Bonds outstanding, with original issue amounts of $14,437,000 and an aggregate principal amount outstanding of $13,359,236.

City of Austin, Minnesota
Notes to the Financial Statements
December 31, 2018
(71)
NOTE 2 DETAILED NOTES ON ALL ACTIVITIES AND FUNDS (CONTINUED)
G. Long-term debt (continued)
Primary Government (continued)
Long-term Liability Activity (continued)
Tax Increment District Disclosure The City has four pay-as-you-go tax increment financing districts with local businesses to promote development within the City. The City is currently collecting tax increments that are paid through the property tax collection process. The requirement for businesses to receive the excess tax increments from the City was to perform improvements on the owned property. The increment taxes are based on the increase of the property value after the improvements are made. No other commitments were made by the City as part of these agreements. The City of Austin or the Austin Housing and Redevelopment Authority administer the following tax increment financing districts. Minnesota Statutes Section 469.175, Subdivision 6 requires the following disclosures for each district:
Tax Increment District No. 8, Cedar View Housing, is located within Municipal Development District No. 1. This housing district was established in 1998 pursuant to Minnesota Statutes Chapter 469. The first tax increment was received in 2000, and the duration of the district is through the year 2025. The agreement calls for 90% of the property tax increments collected to be returned to the developers. Tax Increment District No. 10, CBD Redevelopment, is located within Municipal Development District No. 1. This redevelopment district was established in 1999 pursuant to Minnesota Statutes Chapter 469. The first tax increment was received in 2002, and the duration of the district is through the year 2027. Tax Increment District No. 11, CRC Project, is located within Municipal Development District No. 1. This redevelopment district was established in 2000 pursuant to Minnesota Statutes Chapter 469. The first tax increment was received in 2003, and the duration of the district is through the year 2028. The agreement calls for 100% of the property tax increments collected to be maintained by the City to repay infrastructure costs. Tax Increment District No. 12, Murphy’s Creek Townhomes of Austin Project, is located within Municipal Development District No. 1. This housing district was established in 2001 pursuant to Minnesota Statutes Chapter 469. The first tax increment was received in 2003, and the duration of the district is through the year 2028. The agreement calls for 96.4% of the property tax increments collected to be maintained by the City to repay infrastructure costs.

City of Austin, Minnesota
Notes to the Financial Statements
December 31, 2018
(72)
NOTE 2 DETAILED NOTES ON ALL ACTIVITIES AND FUNDS (CONTINUED)
G. Long-term debt (continued)
Primary Government (continued)
Tax Increment District Disclosure (continued) Tax Increment District No. 13, Oak Park Mall, is located within Municipal Development District No. 1. This redevelopment district was established in 2015 pursuant to Minnesota Statutes Chapter 469. The first tax increment was received in 2018, and the duration of the district is through the year 2043. The agreement calls for 100% of the property tax increments collected to be maintained by the City to repay infrastructure costs. Tax Increment District No. 14, North Pointe, is located within Municipal Development District No. 1. This housing district was established in 2017 pursuant to Minnesota Statutes Chapter 469. The first tax increment is estimated to be received in 2020, and the duration of the district is through the year 2045. The agreement calls for 90% of the property tax increments collected to be returned to the developers. Tax Increment District No. 8 No. 10 No. 11
Original net tax capacity 686$ 15,565$ 5,103$
Current net tax capacity 14,970$ 56,498$ 73,936$
Captured net tax capacity:
Retained by authority 14,284$ 40,933$ 68,833$
Shared with other taxing
districts -$ -$ -$
Tax Increment returned to developers 7,204$ -$ 23,470$
Bonds Outstanding:
General obligation tax
increment bonds issued -$ 1,405,000$ -$
Bond principal retired - 1,030,000 -
Bonds outstanding 12/31/18 -$ 375,000$ -$
No. 12 No. 13 No. 14
Original net tax capacity 2,261$ 29,757$ 1,626$
Current net tax capacity 51,649$ 172,913$ 1,626$
Captured net tax capacity:
Retained by authority 49,388$ 143,156$ -$
Shared with other taxing
districts -$ -$ -$
Tax Increment returned to developers 51,322$ 159,270$ -$
Bonds Outstanding:
General obligation tax
increment bonds issued -$ -$ -$
Bond principal retired - - -
Bonds outstanding 12/31/18 -$ -$ -$

City of Austin, Minnesota
Notes to the Financial Statements
December 31, 2018
(73)
NOTE 2 DETAILED NOTES ON ALL ACTIVITIES AND FUNDS (CONTINUED)
G. Long-term debt (continued)
Discretely presented component unit – Housing and Redevelopment Authority
Components of General Long-Term Debt
The HRA has issued general obligation and gross revenue bonds to finance the construction of Courtyard and Chauncey Apartments and to refund previous issues. Issue and
Maturity Dates
Interest Rate Due Within
One Year
Total
Gross Revenue
Refunding Bonds 2010 – 2031 0.85 – 5.00% $ 290,000 $ 4,980,000 General Obligation Refunding Bonds
2013 – 2023
0.30 – 2.70% 185,000 955,000
General Obligation Refunding Bonds
2016 – 2023
0.85 – 1.55%
140,000
720,000
Total Bonds 615,000 6,655,000
Reoffering Premium 9,334 121,337
Publicly Owned Housing Program
Loan Agreement - 877,686
Deferred Loan Agreement - 35,000
PTO Payable 36,702 36,702
Banked PTO Payable - 102,559
Total Long-Term Liabilities $ 661,036 $ 7,828,284
Minimum Debt Payments
Minimum annual principal and interest payments required to retire General Obligation and Gross Revenue Bonds Payable and loan agreement payable are as follows:
Year Ending
September 30 Principal Interest
2019 615,000$ 257,765$
2020 620,000 243,963
2021 650,000 227,796
2022 670,000 210,215
2023 690,000 191,362
2024-2028 1,975,000 665,000
2029-2031 1,435,000 145,750
6,655,000$ 1,941,851$
Bonds Payable

City of Austin, Minnesota
Notes to the Financial Statements
December 31, 2018
(74)
NOTE 2 DETAILED NOTES ON ALL ACTIVITIES AND FUNDS (CONTINUED)
G. Long-term debt (continued)
Discretely presented component unit – Housing and Redevelopment Authority
(continued)
Description of Long-Term Debt
General Obligation and Gross Revenue Bonds
On September 28, 2010, the HRA issued $6,615,000 of Governmental Housing Gross Revenue Refunding Bonds, Series 2010A. The bond issue advance refunded the remaining maturities of the Governmental Housing Gross Revenue Bonds, Series 2000A. Revenues generated from the rental of the Chauncey Apartment units are dedicated to the retirement of these bonds.
On August 20, 2013, the HRA issued $1,830,000 of General Obligation Governmental Housing Refunding Bonds, Series 2013A. The proceeds of the issue were used to refund in advance of maturity, $1,780,000 of the outstanding maturities of the General Obligation Governmental Housing Refunding Bonds, Series 2003A. Revenues generated from the rental of the Austin Courtyard units are dedicated to the retirement of these bonds.
On March 1, 2016, the HRA issued $1,000,000 of General Obligation Governmental Housing Refunding Bonds, Series 2016A. The proceeds of the issue were used for a current refund in advance of maturity, $1,350,000 of the outstanding maturities of the General Obligation Governmental Housing Refunding Bonds, Series 2005A. Revenues generated from the rental of the Austin Courtyard units are dedicated to the retirement of these bonds.
Unamortized Discounts and Premiums
Unamortized discounts and premiums on the General Obligation and Gross Revenue Bonds are being amortized over the life of the bonds.
Deferred Loan Repayment Agreement
On May 16, 2013, the HRA entered into a Deferred Loan Repayment Agreement and Mortgage with MHFA for $35,000 for the purpose of making upgrades to the Transitional House. The loan is non-interest bearing and will be forgiven by MHFA if no event of default, as outlined in the loan agreement, occurs within twenty years from the date of the agreement. On August 2, 2016, the HRA entered into a Publicly Owned Housing Program Deferred Loan repayment agreement with MHFA for $877,686 for the purpose of replacing all of the Twin Tower’s windows. The HRA started drawing on the loan on June 5, 2017. The loan is noninterest bearing and will be forgiven by MHFA if no event of default, as outlined in the loan agreement, occurs within twenty years from the date of the agreement.

City of Austin, Minnesota
Notes to the Financial Statements
December 31, 2018
(75)
NOTE 2 DETAILED NOTES ON ALL ACTIVITIES AND FUNDS (CONTINUED)
G. Long-term debt (continued)
Discretely presented component unit – Housing and Redevelopment Authority
(continued)
Compensated Absences
Compensated absences consist of paid-time off (PTO) payable and banked paid time off payable. Both consist of balances that are earned but unused at September 30, 2018.
Changes in Long-Term Debt
Beginning
Balance Additions Retirements
Ending
Balance
Deferred Loan Agreement $ 35,000 $ - $ - $ 35,000
POHP Loan Agreement 877,686 - - 877,686
Bonds 7,245,000 - 590,000 6,655,000
Reoffering Premium 130,670 - 9,333 121,337
Total Bonds and Loans Payable 8,288,356$ -$ 599,333$ 7,689,023$
PTO Payable 43,813 - 7,111 36,702
Banked PTO Payable 92,955 9,604 - 102,559
Total business-type activities $ 8,425,124 $ 9,604 $ 606,444 $ 7,828,284
Business-type activities
Long-term liability activity for the year ended December 31, 2018, was as follows:
Beginning Ending Due Within
Balance Increases Decreases Balance One Year
Business-type activities:
Advances with City of Austin 843,150 8,186 65,000 786,336 -
Long-Term Liabilities 843,150$ 8,186$ 65,000$ 786,336$ -$

City of Austin, Minnesota
Notes to the Financial Statements
December 31, 2018
(76)
NOTE 3 OTHER INFORMATION
A. Contingent liabilities
Amounts received or receivable from federal and state agencies are subject to agency audit and adjustment. Any disallowed claims, including amounts already collected, may constitute a liability of the applicable funds. The amount, if any, of funds which may be disallowed by the agencies cannot be determined at this time although the City expects such amounts, if any, to be immaterial. The federal financial assistance received is subject to an audit pursuant to the Uniform Grant Guidance or audits by the grantor agency.
The City is subject to potential litigation involving various personal injury and property loss claims. The City intends to contest vigorously any litigation, which may result from these claims. In addition, management believes no material uninsured loss will result from these claims. The City has Operating Deficit Guarantee Agreements with the Housing and Redevelopment Authority of Austin (HRA) for the Courtyard Apartments and the Chauncey Apartments. Under these agreements, the City of Austin is responsible for paying US Bank Trust National Association (the Trustee) an amount equal to any projected operating deficits, as properly budgeted for. In addition, the City must also make payment to the Trustee to restore the balance in the Operating Reserve Account, as defined in the bond agreement, to equal six months operating expenses. The above payments shall be made from the available general funds of the City, and the City covenants that, to the extent necessary to raise such funds from time to time, it will levy a tax on all taxable property within its boundaries. The HRA must repay the City all amounts that were advanced to the Trustee at an agreed upon rate of 6% per year.
The Austin Utilities purchases power from Southern Minnesota Municipal Power Agency (SMMPA) under a power sales contract that extends to April 1, 2030. Under the terms of this contract, the Utilities is obligated to buy all the electrical power and energy needed to operate the electric utility.
B. Retirement systems
Defined Benefit Pension Plans – Statewide
Plan Description The City of Austin participates in the following cost-sharing multiple-employer defined benefit pension plans administered by the Public Employees Retirement Association of Minnesota (PERA). PERA’s defined benefit pension plans are established and administered in accordance with Minnesota Statutes, Chapters 353 and 356. PERA’s defined benefit pension plans are tax-qualified plans under Section 401 (a) of the Internal Revenue Code. 1. General Employees Retirement Fund (GERF) All full-time and certain part-time employees of the City of Austin are covered by the General Employees Retirement Fund (GERF). GERF members belong to the Coordinated Plan. Coordinated Plan members are covered by Social Security.

City of Austin, Minnesota
Notes to the Financial Statements
December 31, 2018
(77)
NOTE 3 OTHER INFORMATION (CONTINUED)
B. Retirement systems (continued)
Defined Benefit Pension Plans – Statewide (continued)
Plan Description (continued) 2. Public Employees Police and Fire Fund (PEPFF) The PEPFF, originally established for police officers and firefighters not covered by a local relief association, now covers all police officers and firefighters hired since 1980. Effective July 1, 1999, the PEPFF also covers police officers and firefighters belonging to local relief associations that elected to merge with and transfer assets and administration to PERA.
Benefits Provided PERA provides retirement, disability and death benefits. Benefit provisions are established by state statute and can only be modified by the state legislature. Vested terminated employees who are entitled to benefits, but not receiving them yet, are bound by the provisions in effect at the time they last terminated public service. 1. GERF Benefits Benefits are based on a member’s highest average salary for any five successive years of allowable service, age, and years of credit at termination of service. Two methods are used to compute benefit’s for PERA’s Coordinated and Basic Plan members. Members hired prior to July 1, 1989, receive the higher of Method 1 or Method 2 formulas. Only Method 2 is used for members hired after June 30, 1989. Under Method 1, the accrual rate for Coordinated members is 1.2% for each of the first 10 years of service and 1.7% for each additional year. The rates are 2.2% and 2.7%, respectively, for Basic members. Under Method 2, the accrual rate for Coordinated members is 1.7% for all years of service, and 2.7% for Basic members. The accrual rates for former MERF members is 2.0% for each of the first 10 years of service and 2.5% for each additional year. For members hired prior to July 1, 1989 a full annuity is available when age plus years of service equal 90 and normal retirement age is 65. For members hired on or after July 1, 1989 normal retirement age is the age for unreduced Social Security benefits capped at 66. Beginning January 1, 2019, benefit recipients will receive a future annual increase equal to 50 percent of the Social Security Cost of Living Adjustment, not less than 1.0 percent and not more than 1.5 percent. For retirements on or after January 1, 2024, the first benefit increase is delayed until the retiree reaches Normal Retirement Age (not applicable to Rule of 90 retirees, disability benefit recipients, or survivors). A benefit recipient who has been receiving a benefit for at least 12 full months as of June 30 will receive a full increase. Members receiving benefits for at least one month but less than 12 full months as of June 30 will receive a pro rata increase.

City of Austin, Minnesota
Notes to the Financial Statements
December 31, 2018
(78)
NOTE 3 OTHER INFORMATION (CONTINUED)
B. Retirement systems (continued)
Defined Benefit Pension Plans – Statewide (continued)
Benefits Provided (continued) 2. PEPFF Benefits Benefits for PEPFF members first hired after June 30, 2010, but before July 1, 2014, vest on a prorated basis from 50% after five years up to 100% after ten years of credited service. Benefits for PEPFF members first hired after June 30, 2014, vest on a prorated basis from 50% after ten years up to 100% after twenty years of credited service. The annuity accrual rate is 3% of average salary for each year of service. For PEPFF members who were first hired prior to July 1, 1989, a full annuity is available when age plus years of service equal at least 90. Beginning in 2019, the COLA will be fixed at 1.0%. Under funding measurements from 2017, the 2.5% COLA trigger was never expected to occur and was subsequently removed from law. Post retirement increases are given each year except for annuitants who have been receiving a benefit for only 31 to 41 months. These annuitants will receive a prorated amount of the increase on a sliding scale.
Contributions Minnesota Statutes Chapter 353 sets the rates for employer and employee contributions. Contribution rates can only be modified by the state legislature. 1. GERF Contributions Coordinated Plan members were required to contribute 6.50% of their annual covered salary in calendar year 2018. The City was required to contribute 7.50% for Coordinated Plan members in calendar year 2018. The City’s contributions to the GERF for the year ended December 31, 2018, were $885,319. The City’s contributions were equal to the required contributions as set by state statute. 2. PEPFF Contributions Legislation increased both employee and employer contribution rates in the Police and Fire Plan. Employee rates increased from 10.80 percent of pay to 11.30 percent and employer rates increase from 16.20 percent to 16.95 percent on January 1, 2018. On January 1, 2020 employee rates increase to 11.80 percent and employer rates increase to 17.70 percent. The City’s contributions to the Police and Fire Fund for the year ended December 31, 2018 were $527,013. The City’s contributions were equal to the required contributions as set by state statute.

City of Austin, Minnesota
Notes to the Financial Statements
December 31, 2018
(79)
NOTE 3 OTHER INFORMATION (CONTINUED)
B. Retirement systems (continued)
Defined Benefit Pension Plans – Statewide (continued)
Pension Costs 1. GERF Pension Costs At December 31, 2018 the City reported a liability of $9,713,830 for its proportionate share of the GERF’s net pension liability. The City’s net pension liability reflected a reduction due to the State of Minnesota’s contribution of $16 million to the fund in 2018. The State of Minnesota is considered a non-employer contributing entity and the State’s contribution meets the definition of a special funding situation. The State of Minnesota ‘s proportionate share of the net pension liability associated with the City totaled $318,554. The net pension liability was measured as of June 30, 2018, and the total pension liability used to calculate the net pension liability was determined by an actuarial valuation as of that date. The City’s proportion of the net pension liability was based on the City’s contributions received by PERA during the measurement period for employer payroll paid dates from July 1, 2017 through June 30, 2018, relative to the total employer contributions received from all of PERA’s participating employers. At June 30, 2018, the City’s proportion was 0.0853, which is a decrease of 0.0021% from its June 30, 2017 proportionate share of 0.0874%. The Austin Utilities’ proportion was 0.0898 at June 30, 2018, which is a decrease of 0.0039% from its June 30, 2017 proportionate share of 0.0937%. Post-retirement benefit increases were changed from 1.0% per year with a provision to increase to 2.5% upon attainment of a 90% funding ratio to 50% of the Social Security Cost of Living Adjustment, not less than 1.0% and not more than 1.5%, beginning January 1, 2019. For the year ended December 31, 2018, the City recognized pension expense of $656,024 for its proportionate share of the GERF’s pension expense. In addition, the City recognized an additional $74,297 as pension expense (and grant revenue) for its proportionate share of the state of Minnesota’s contribution of $16 million to the General Employees Fund.

City of Austin, Minnesota
Notes to the Financial Statements
December 31, 2018
(80)
NOTE 3 OTHER INFORMATION (CONTINUED)
B. Retirement systems (continued)
Defined Benefit Pension Plans – Statewide (continued)
Pension Costs (continued) At December 31, 2018, the City reported its proportionate share of the GERF’s deferred outflows of resources and deferred inflows of resources related to pensions from the following sources:
Deferred Deferred
Outflows of Inflows of
Description Resources Resources
Differences Between Expected and
Actual Economic Experience 257,110$ 283,311$
Changes in Actuarial Assumptions 927,917 1,091,452
Net Difference Between Projected and
Actual Earnings on Pension Plan
Investments - 992,599
Changes in Proportion and Differences
Between City Contributions and
Proportionate Share of Contributions 39,537 431,106
City Contributions Subsequent to the
Measurement Date 446,361 -
1,670,925$ 2,798,468$
$446,361 reported as deferred outflows of resources related to pensions resulting from City contributions subsequent to the measurement date will be recognized as a reduction of the net pension liability in the year ended December 31, 2019. Other amounts reported as deferred outflows and inflows of resources related to pensions will be recognized in pension expense as follows:
Pension
Expense
Year Ended June 30 Amount
2019 169,885
2020 (661,003)
2021 (880,043)
2022 (202,743)

City of Austin, Minnesota
Notes to the Financial Statements
December 31, 2018
(81)
NOTE 3 OTHER INFORMATION (CONTINUED)
B. Retirement systems (continued)
Defined Benefit Pension Plans – Statewide (continued)
Pension Costs (continued) 2. PEPFF Pension Costs At December 31, 2018 the City reported a liability of $3,232,866 for its proportionate share of the PEPFF’s net pension liability. The net pension liability was measured as of June 30, 2018, and the total pension liability used to calculate the net pension liability was determined by an actuarial valuation as of that date. The City’s proportion of the net pension liability was based on the City’s contributions received by PERA during the measurement period for employer payroll paid dates from July 1, 2017, through June 30, 2018, relative to the total employer contributions received from all of PERA’s participating employers. At June 30, 2018, the City’s proportion was 0.3033, which is a decrease of 0.0047 from its June 30, 2017 proportionate share of 0.3080%. The City also recognized $27,297 for the year ended December 31, 2018 as revenue and an offsetting reduction of net pension liability for its proportionate share of the State of Minnesota’s on-behalf contributions to the PEPFF. Legislation passed in 2013 required the State of Minnesota to begin contributing $9 million to the PEPFF each year, starting in fiscal year 2014. Beginning in January 1, 2019, the COLA will be fixed at 1%. Under funding measurements from 2017, the 2.5% COLA trigger was never expected to occur and was subsequently removed from the law. For the year ended December 31, 2018, the City recognized pension expense of $348,384 for its proportionate share of the PEPFF’s pension expense. At December 31, 2018, the City reported its proportionate share of the PEPFF’s deferred outflows of resources and deferred inflows of resources related to pensions from the following sources:
Deferred Deferred
Outflows of Inflows of
Description Resources Resources
Differences Between Expected and
Actual Economic Experience 130,302$ 793,104$
Changes in Actuarial Assumptions 4,019,256 4,759,201
Net Difference Between Projected and
Actual Earnings on Pension Plan
Investments - 677,138
Changes in Proportion and Differences
Between City Contributions and
Proportionate Share of Contributions 39,818 127,072
City Contributions Subsequent to the
Measurement Date 267,776 -
4,457,152$ 6,356,515$

City of Austin, Minnesota
Notes to the Financial Statements
December 31, 2018
(82)
NOTE 3 OTHER INFORMATION (CONTINUED)
B. Retirement systems (continued)
Defined Benefit Pension Plans – Statewide (continued)
Pension Costs (continued) $267,776 reported as deferred outflows of resources related to pensions resulting from City contributions subsequent to the measurement date will be recognized as a reduction of the net pension liability in the year ended December 31, 2019. Other amounts reported as deferred outflows and inflows of resources related to pensions will be recognized in pension expense as follows:
Pension
Expense
Year Ended June 30 Amount
2019 (94,189)
2020 (244,299)
2021 (498,726)
2022 (1,305,072)
2023 (24,853)
The total pension expense for all plans that the City participates in is $1,078,705.
Actuarial Assumptions The total pension liability in the June 30, 2018, actuarial valuation was determined using the following actuarial assumptions: Inflation 2.50% per year Active Member Payroll Growth 3.25% per year after 25 years of service Investment Rate of Return 7.50% The total pension liability for each of the defined benefit cost-sharing plans was determined by an actuarial valuation as of June 30, 2018, using the entry age normal actuarial cost method. Inflation is assumed to be 2.50 percent for the GERF and PEPFF Plans. Salary growth assumptions in the GERF Plan decrease in annual increments from 11.25 percent after one year of service, to 3.25 percent after 26 years of service. In the PEPFF Plan, salary growth assumptions decrease from 12.25 percent after one year of service to 3.25 percent after 25 years of service. Mortality rates for all plans are based on RP-2014 mortality tables. The tables are adjusted slightly to fit PERA’s experience. Actuarial assumptions for the GERF Plan are reviewed every four to six years. The most recent six-year experience study for the GERF Plan was completed in 2015. The most recent four-year experience study for the PEPFF Plan was completed in 2016. Economic assumptions were updated in 2014 based on a review of inflation and investment return assumptions.

City of Austin, Minnesota
Notes to the Financial Statements
December 31, 2018
(83)
NOTE 3 OTHER INFORMATION (CONTINUED)
B. Retirement systems (continued)
Defined Benefit Pension Plans – Statewide (continued)
Actuarial Assumptions (continued) The following changes in actuarial assumptions occurred in 2018
GERF Plan
The mortality projection scale was changed from MP-2015 to MP-2017.
The assumed benefit increase was changed from 1.00 percent per year through 2044
and 2.50 percent per year thereafter to 1.25 percent per year.
PEPFF Plan
The morality projection scale was changed from MP-2016 to MP-2017.
The State Board of Investment, which manages the investments of PERA, prepares an analysis of the reasonableness of the long-term expected rate of return on a regular basis using a building-block method in which best-estimate ranges of expected future rates of return are developed for each major asset class. These ranges are combined to produce an expected long-term rate of return by weighing the expected future rates of return by the target asset allocation percentages. The target allocation and best estimates of arithmetic real rates of return for each major class are summarized in the following table:
Long-Term
Expected
Target Real Rate of
Asset Class Allocation Return
Domestic Equity 36% 5.10%
International Equity 17% 5.30%
Bonds 20% 0.75%
Alternative Assets 25% 5.90%
Cash 2% 0.00%
100%
Discount Rate The discount rate used to measure the total pension liability in 2018 was 7.50%. The projection of cash flows used to determine the discount rate assumed that contributions from plan members and employers will be made at the rate set in Minnesota Statutes. Based on these assumptions, the fiduciary net position of all plans was projected to be available to make all projected future benefit payments of current plan members. Therefore, the long-term expected rate of return on pension plan investments was applied to all periods of projected benefit payments to determine the total pension liability.

City of Austin, Minnesota
Notes to the Financial Statements
December 31, 2018
(84)
NOTE 3 OTHER INFORMATION (CONTINUED)
B. Retirement systems (continued)
Defined Benefit Pension Plans – Statewide (continued)
Pension Liability Sensitivity The following presents the City’s proportionate share of the net pension liability for all plans it participates in, calculated using the discount rate disclosed in the preceding paragraph, as well as what the City’s proportionate share of the net pension liability would be if it were calculated using a discount rate 1 percentage point lower or 1 percentage point higher than the current discount rate:
1% Decrease Current 1% Increase
in Discount Discount in Discount
Description Rate Rate Rate
Discount Rate 6.5% 7.5% 8.5%
City's Proportionate share of the
GERF Net Pension Liability 15,786,218$ 9,713,830$ 4,701,248$
Discount Rate 6.5% 7.5% 8.5%
City's Proportionate share of the
PEPFF Net Pension Liability 6,931,467$ 3,232,866$ 174,276$
Pension Plan Fiduciary Net Position Detailed information about each pension plan’s fiduciary net position is available in a separately-issued PERA financial report that includes financial statements and required supplementary information. That report may be obtained on the Internet at www.mnpera.org.
C. Other Postemployment Benefit Plan
Plan Description The City’s defined benefit OPEB plan, City Retiree Benefits Plan (CRBP), provides OPEB for eligible employees and their spouses. CRBP is a single-employer defined benefit OPEB plan administered by the City. Benefit and eligibility provisions are established through negotiations between the City and various unions representing the City employees and are renegotiated each bargaining period. CRBP does not issue a publicly available financial report. Benefits Provided CRBP provides healthcare benefits for retirees and their spouses. Benefits are provided through a third-party insurer. Employees receive no direct monetary benefit, but are allowed to stay on the City’s health insurance program until death, paying 100% of the blended rate premiums.
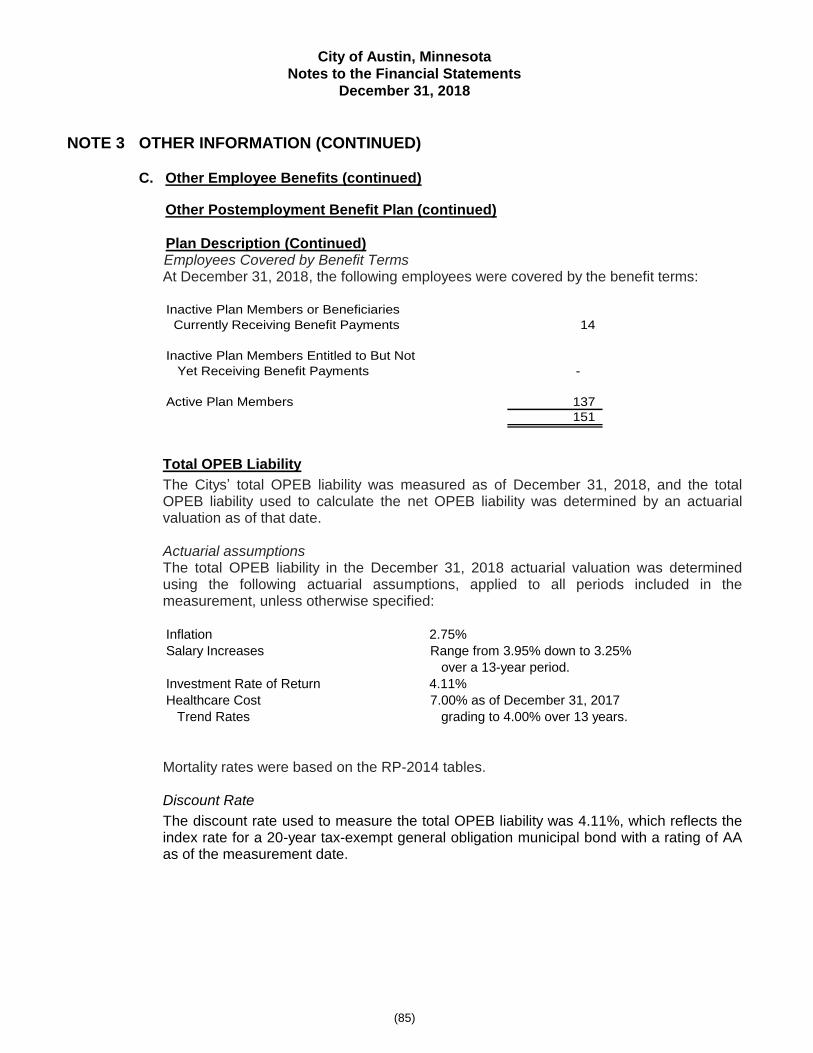
City of Austin, Minnesota
Notes to the Financial Statements
December 31, 2018
(85)
NOTE 3 OTHER INFORMATION (CONTINUED)
C. Other Employee Benefits (continued)
Other Postemployment Benefit Plan (continued)
Plan Description (Continued) Employees Covered by Benefit Terms At December 31, 2018, the following employees were covered by the benefit terms: Inactive Plan Members or Beneficiaries
Currently Receiving Benefit Payments 14
Inactive Plan Members Entitled to But Not
Yet Receiving Benefit Payments -
Active Plan Members 137
151
Total OPEB Liability
The Citys’ total OPEB liability was measured as of December 31, 2018, and the total OPEB liability used to calculate the net OPEB liability was determined by an actuarial valuation as of that date. Actuarial assumptions The total OPEB liability in the December 31, 2018 actuarial valuation was determined using the following actuarial assumptions, applied to all periods included in the measurement, unless otherwise specified: Inflation 2.75%
Salary Increases Range from 3.95% down to 3.25%
over a 13-year period.
Investment Rate of Return 4.11%
Healthcare Cost 7.00% as of December 31, 2017
Trend Rates grading to 4.00% over 13 years.
Mortality rates were based on the RP-2014 tables. Discount Rate
The discount rate used to measure the total OPEB liability was 4.11%, which reflects the index rate for a 20-year tax-exempt general obligation municipal bond with a rating of AA as of the measurement date.

City of Austin, Minnesota
Notes to the Financial Statements
December 31, 2018
(86)
NOTE 3 OTHER INFORMATION (CONTINUED)
B. Other Employee Benefits (continued)
Other Postemployment Benefit Plan (continued)
Changes in Total OPEB Liability
2018
Balance at December 31, 1,324,818$
Changes for the year:
Service Cost 81,174
Interest 47,189
Changes in Assumptions (69,335)
Benefit Payments (68,989)
Balance at December 31, 2018 1,314,857$ Sensitivity of the net OPEB liability to changes in the discount rate. The following presents the total OPEB liability of the City, as well as what the Citys’ total OPEB liability would be if it were calculated using a discount rate that is 1-percentage-point lower (3.11 percent) or 1-percentage-point higher (5.11 percent) than the current discount rate:
1% Decrease Current 1% Increase
(3.11%) (4.11%) (5.11%)
Total OPEB Liability 1,418,842$ 1,314,857$ 1,219,980$
Sensitivity of the net OPEB liability to changes in the healthcare cost trend rates. The following presents the total OPEB liability of the City, as well as what the Citys’ total OPEB liability would be if it were calculated using healthcare cost trend rates that are 1-percentage-point lower (6.00% decreasing to 3.00%) or 1-percentage-point higher (8.00% decreasing to 5.00%) than the current healthcare cost rates:
1% Decrease Current 1% Increase
(6.00% decreasing (7.00% decreasing (8.00% decreasing
to 3.00%) to 4.00%) to 5.00%)
Total OPEB Liability 1,188,283$ 1,314,857$ 1,461,292$

City of Austin, Minnesota
Notes to the Financial Statements
December 31, 2018
(87)
NOTE 3 OTHER INFORMATION (CONTINUED)
C. Other Employee Benefits (continued)
Other Postemployment Benefit Plan (continued)
OPEB Expense and Deferred Outflows of Resources and Deferred Inflows of
Resources Related to OPEB
For the year ended December 31, 2018, the City recognized OPEB expense of $119,149. At December 31, 2018, the City reported deferred outflows of resources and deferred inflows of resources related to OPEB from the following sources:
Deferred Deferred
Outflows of Inflows of
Description Resources Resources
-$ 60,121$ Changes in Actuarial Assumptions
Amounts reported as deferred inflows of resources related to OPEB will be recognized in OPEB expense as follows:
Year Ended Pension Expense
December 31, Amount
2019 (9,214)
2020 (9,214)
2021 (9,214)
2022 (9,214)
2023 (9,214)
2024 (9,214)
2025 (4,837)

City of Austin, Minnesota
Notes to the Financial Statements
December 31, 2018
(88)
NOTE 3 OTHER INFORMATION (CONTINUED)
C. Other Employee Benefits (continued)
Other Postemployment Benefit Plan (continued)
Plan Description The Utilities defined benefit OPEB plan, Austin Utilities Retiree Benefits Plan (AURBP), provides OPEB for eligible employees and their spouses. AURBP is a single-employer defined benefit OPEB plan administered by the Utilities. Benefit and eligibility provisions are established through negotiations between the Utilities’ and various unions representing the Utilities’ employees and are renegotiated each bargaining period. AURBP does not issue a publicly available financial report. Benefits Provided AURBP provides healthcare benefits for retirees and their spouses. Benefits are provided through a third-party insurer. Employees hired before January 1, 1998 receive a benefit equal to the same amount the Utilities contributes for active employees toward single or family medical premiums for the lifetime of the retiree. Employees hired on or after January 1, 1998 and before January 1, 2005 receive a benefit equal to the same amount the Utilities contributes for active employees toward single or family medical premiums until Medicare eligibility. Employees hired on or after January 1, 2005 receive no benefit. Employees Covered by Benefit Terms At December 31, 2018, the following employees were covered by the benefit terms:
Inactive Plan Members or Beneficiaries
Currently Receiving Benefit Payments 85
Inactive Plan Members Entitled to But Not
Yet Receiving Benefit Payments -
Active Plan Members 74
159

City of Austin, Minnesota
Notes to the Financial Statements
December 31, 2018
(89)
NOTE 3 OTHER INFORMATION (CONTINUED)
C. Other Employee Benefits (continued)
Other Postemployment Benefit Plan (continued)
Total OPEB Liability
The Utilities’ total OPEB liability was measured as of January 1, 2018, and the total OPEB liability used to calculate the net OPEB liability was determined by an actuarial valuation as of that date. Actuarial assumptions The total OPEB liability in the January 1, 2018 actuarial valuation was determined using the following actuarial assumptions, applied to all periods included in the measurement, unless otherwise specified: Inflation 2.5%
Salary Increases 3.0%
Investment Rate of Return 3.3%
Healthcare Cost 6.50% as of January 1, 2018 grading
Trend Rates to 5.00% over 6 years.
Mortality rates were based on the RPH-2014 White Collar Mortality Tables with MP-2017 Generational Improvement Scale. Discount Rate
The discount rate used to measure the total OPEB liability was 3.30%, which reflects the index rate for a 20-year tax-exempt general obligation municipal bond with a rating of AA as of the measurement date.
Changes in Total OPEB Liability
Total OPEB
Liability
Balance at December 31, 2017 16,280,310$
Changes for the year:
Service Cost 98,046
Interest 525,521
Benefit Payments (914,365)
Balance at December 31, 2018 15,989,512$

City of Austin, Minnesota
Notes to the Financial Statements
December 31, 2018
(90)
NOTE 3 OTHER INFORMATION (CONTINUED)
C. Other Employee Benefits (continued)
Other Postemployment Benefit Plan (continued)
Changes in Total OPEB Liability (continued)
Sensitivity of the net OPEB liability to changes in the discount rate. The following presents the total OPEB liability of the Utilities, as well as what the Utilities’ total OPEB liability would be if it were calculated using a discount rate that is 1-percentage-point lower (2.30 percent) or 1-percentage-point higher (4.30 percent) than the current discount rate:
1% Decrease Current 1% Increase
(2.30%) (3.30%) (4.30%)
Total OPEB Liability 17,909,957$ 15,989,512$ 14,379,419$
Sensitivity of the net OPEB liability to changes in the healthcare cost trend rates The following presents the total OPEB liability of the Utilities, as well as what the Utilities’ total OPEB liability would be if it were calculated using healthcare cost trend rates that are 1-percentage-point lower (5.50 percent decreasing to 4.00 percent) or 1-percentage-point higher (7.50 percent decreasing to 6.00 percent) than the current healthcare cost trend rates:
1% Decrease Current 1% Increase
(5.50% decreasing (6.50% decreasing (7.50% decreasing
to 4.00%) to 5.00%) to 6.00%)
Total OPEB Liability 15,675,243$ 15,989,512$ 16,252,160$
OPEB Expense and Deferred Outflows of Resources and Deferred Inflows of
Resources Related to OPEB
For the year ended December 31, 2018, the Utilities recognized OPEB expense of $623,567. At December 31, 2018, the Utilities reported deferred outflows of resources and deferred inflows of resources related to OPEB from the following sources:
Deferred Deferred
Outflows of Inflows of
Description Resources Resources
879,159$ -$ Contributions subsequent to the measurement date
$879,159 reported as deferred outflows of resources related to OPEB resulting from the Utilities contributions subsequent to the measurement date will be recognized as a reduction of the total pension liability in the year ended December 31, 2019.

City of Austin, Minnesota
Notes to the Financial Statements
December 31, 2018
(91)
NOTE 3 OTHER INFORMATION (CONTINUED)
C. Other Employee Benefits (continued)
Vacations Employees can earn annual vacation starting at 10 days after one year ranging to 30 days after 20 to 25 years of service. The department heads, the Supervisors Bargaining Unit, and Austin Employees Association Bargaining Unit employees of the City may carry over one week of vacation at year-end for use in the immediate calendar year. Management employees of the Utilities are allowed to carry over a maximum of eighty hours of vacation at year-end. All unused and accrued vacation is payable at termination of employment. The balances for vacation payable at December 31, 2018 for governmental and business-type activities are $520,679 and $73,101 respectively.
Compensatory Time Earned Hourly employees of the City earn and accrue compensatory time in lieu of payment for hours worked over the normal forty-hour week. These hours are accumulated at the rate of one and one-half hours per each hour worked over the normal forty hours for non-exempt employees. All accumulated unused compensatory time is payable at termination of employment for those hourly employees. Governmental activities balance of compensatory time earned was $69,620 and $18,305 for business-type activities.
Sick Leave Retirement Benefit Sick leave is provided for all City employees at the rate of one day per month. Sick leave not taken in the current year is accumulated. A retirement benefit is payable in the event of death or retirement equal to the sick leave accumulated, up to a maximum of one year's salary. The governmental activities balance of sick leave was $1,510,980. Austin Utilities employees earn sick leave at the rate of eight hours per month. Sick leave not taken in the current year is accumulated and is payable upon retirement or termination of employment. At December 31, 2018, the total accumulated sick pay of $1,804,814 is recorded in operating reserves. The Utilities is required to maintain investments or cash balances equal to at least 80% of the accumulated sick pay benefits. At December 31, 2018, the Utilities has specifically restricted investments equal to 97% of the accumulated sick pay benefits.
Austin Part-time Firefighters Relief Association A. Plan Description
The Austin Part-time Firefighters Relief Association administers a single-employer defined contribution pension plan available to part-time firefighters. The plan may be amended by first approval from the Austin Part-time Firefighters Relief Association and then by the Austin city council. The plan provides retirement, disability, and death benefits to plan members and beneficiaries. The Austin Part-time Firefighters Relief Association has an annual audit. The audit report may be obtained at 500 4th Avenue NE, Austin, Minnesota 55912.
B. Funding Policy
The funding policy provides for annual contributions ranging from $2,000 to $3,500 per part-time firefighter, depending on years of service within the organization. Total City contributions were $49,002 for the year ended December 31, 2018.

City of Austin, Minnesota
Notes to the Financial Statements
December 31, 2018
(92)
NOTE 3 OTHER INFORMATION (CONTINUED)
D. Risk management
The City and the Utilities are exposed to various risks of loss related to torts; theft of, damage to, and destruction of assets; errors and omissions; injuries to employees; and natural disasters. The City established a Risk Management Fund (an internal service fund) to account for and finance its uninsured risks of loss. Contributions in 2018 were based on maximum claims before reinsurance is effective. Under this program, the Risk Management Fund provides coverage for up to a lifetime maximum of $1,000,000 for each health insurance claim. The City has entered into an agreement with an insurance company to provide stop-loss insurance to limit the losses on individual claims and to provide claims processing and other administrative duties. Under a specific stop-loss, the plan’s liability is limited to $85,000 for each employee and dependents each calendar year. Under the aggregate stop loss, the total liability of the City will be limited to an amount determined from the insurance carrier’s records by the number of employees and dependents multiplied by the provisional rate of the plan. The actual annual aggregate stop-loss is approximately $1,720,100. The City maintains reinsurance coverage for individual claims above these limits. Claims that have been settled have not exceeded coverage in any of the past three years. During the year 2018, there was no significant reduction in insurance coverage from the prior year. The City has established an internal service fund to purchase property and liability insurance and to fund claims under the deductible amounts. Under this program, coverage is provided for up to a maximum of $1,000,000 for each property damage claim. The City has also established an internal service fund to purchase workers' compensation insurance. Under this program, coverage is provided for up to a maximum of $1,000,000 for each workers' compensation claim. Other funds and departments participate in the programs and make payments to the Risk Management Fund based on management's estimates of the amounts needed for claims. The liability for unpaid claims is included in the Risk Management Fund, an Internal Service Fund, as part of accrued expenses, a current liability. 2018 2017
Unpaid Claims, Beginning of Year $ 182,146 $ 182,595 Incurred Claims 2,164,587 1,581,973 Claim Payments (2,195,091) (1,582,422)
Unpaid Claims, End of Year $ 151,642 $ 182,146

City of Austin, Minnesota
Notes to the Financial Statements
December 31, 2018
(93)
NOTE 3 OTHER INFORMATION (CONTINUED)
D. Risk management (continued)
The Utilities has purchased commercial insurance for its personal property claims. Coverage is provided on building and contents up to $54,326,106.
The Utilities participates in the League of Minnesota Cities Insurance Trust (LMCIT) for its workers’ compensation insurance. This plan is administered by Berkley Administrators. Each member of the association is required to pay a premium for coverage of claims and administrative expenses. This is a retrospectively rated policy with the premium being based primarily on the Utilities’ loss experience. An aggregate excess reinsurance policy and per occurrence coverage for claims have been purchased. Each member of the trust is jointly and severally liable for additional assessments. As of the date of this report it is not possible to determine if any additional liability exists for the year ended December 31, 2018. The Utilities has joined together with other governmental entities in the National Joint Powers Alliance, a public entity risk pool currently operating as common risk management and insurance program for member entities. The Utilities pays an annual premium to this plan for its health insurance coverage. These premiums are used to purchase reinsurance through commercial companies. The administrators of the plan believe assessment to participating entities for future losses sustained is extremely remote. Insurance coverage decreased significantly from the previous year for the Utilities’ property insurance due to decommissioning of the northeast plant. Settled claims resulting from these risks have not exceeded insurance coverage in any of the past three fiscal years.
NOTE 4 RESTATEMENT
The City restated beginning net position when it adopted GASB Statement No. 75 Accounting and Financial Reporting for Postemployment Benefits Other Than Pensions for the year ended December 31, 2018. The restatement is as follows:
Governmental Business-Type
Activities Activities
Net position - Beginning as Previously Reported 147,345,757 107,374,294
Restatement - Adoption of GASB 75 (866,322) (12,887,761)
Net Position - Beginning as Restated 146,479,435 94,486,533
Sewer Storm Water
User Utilities Utility
Net position - Beginning as Previously Reported 41,023,729 60,109,683 5,367,202
Restatement - Adoption of GASB 75 (147,909) (12,724,693) (15,159)
Net Position - Beginning as Restated 40,875,820 47,384,990 5,352,043

(This page intentionally left blank.)

Required Supplementary Information

(This page intentionally left blank.)

2018
City:
Total OPEB Liability
Service Cost 81,174$
Interest 47,189
Changes in Assumptions (69,335)
Benefit Payments (68,989)
Net Change in Total OPEB Liability (9,961)$
Total OPEB Liability - Beginning 1,324,818
Total OPEB Liability - Ending 1,314,857
Covered Employee Payroll 9,100,343$
Citys' Net OPEB Liability as a Percentage of the
Covered Employee Payroll 14%
Utilities:
Total OPEB Liability
Service Cost 98,046$
Interest 525,521
Benefit Payments (914,365)
Net Change in Total OPEB Liability (290,798)$
Total OPEB Liability - Beginning 16,280,310
Total OPEB Liability - Ending 15,989,512
Covered Employee Payroll 5,611,150$
Utilities' Net OPEB Liability as a Percentage of the
Covered Employee Payroll 285%
Note 1: Information is required to be presented for 10 years. However, until a full 10-year trend is compiled,
the City and Utilities will present information for only those years for which information is available.
Note 2: No assets are accumulated in a trust to pay related benefits.
City of Austin, Minnesota
Schedule of Changes in Total OPEB Liability and Related Ratios
(97)

Fiscal Year 2018 2017 2016 2015
Measurement Date 6/30/2018 6/30/2017 6/30/2016 6/30/2015
GERF
Citys' Proportion of the Net Pension Liability 0.0853% 0.0874% 0.0860% 0.0876%
Citys' Proportionate Share of the Net Pension Liability 4,732,094$ 5,579,558$ 6,982,773$ 4,539,887$
State's Proportionate Share of the Net Pension Liability
Associated with the City 155,225 70,121 91,198 -
Total 4,887,319$ 5,649,679$ 7,073,971$ 4,539,887$
Citys' Covered Payroll 5,734,155$ 5,651,768$ 5,339,321$ 5,146,702$
Citys' Proportionate Share of the Net Pension Liability (Asset) as
a Percentage of its Covered Payroll 82.52% 98.72% 130.78% 88.21%
Plan Fiduciary Net Pension as a Percentage of the Total Pension Liability 79.50% 75.90% 68.90% 78.19%
Utilities' Proportion of the Net Pension Liability 0.0898% 0.0937% 0.0989% 0.0989%
Utilities' Proportionate Share of the Net Pension Liability 4,981,736$ 5,981,746$ 7,973,353$ 5,125,511$
State's Proportionate Share of the Net Pension Liability
Associated with the Utilities 163,329 75,183 104,049 -
Total 5,145,065$ 6,056,929$ 8,077,402$ 5,125,511$
Utilities' Covered Payroll 6,035,606$ 5,934,560$ 6,099,106$ 6,056,621$
Utilities' Proportionate Share of the Net Pension Liability (Asset) as
a Percentage of its Covered Payroll 82.54% 100.80% 130.73% 84.63%
Plan Fiduciary Net Pension as a Percentage of the Total Pension Liability 79.50% 75.90% 68.90% 78.20%
PEPFF
Citys' Proportion of the Net Pension Liability 0.3033% 0.3080% 0.3070% 0.3170%
Citys' Proportionate Share of the Net Pension Liability 3,232,866$ 4,158,367$ 12,320,444$ 3,601,862$
Citys' Covered Payroll 3,196,569$ 3,166,122$ 2,954,160$ 2,904,778$
Citys' Proportionate Share of the Net Pension Liability (Asset) as
a Percentage of its Covered Payroll 101.14% 131.34% 417.05% 124.00%
Plan Fiduciary Net Pension as a Percentage of the Total Pension Liability 88.80% 85.40% 63.90% 86.61%
Note: Information is required to be presented for ten years. However until a full ten-year trend is compiled, the City
will present information for only those years for which information is available.
City of Austin, Minnesota
Schedule of Citys' Proportionate Share of the Net Pension Liability
(98)

2018 2017 2016 2015
GERF
City
Contractually Required Contribution 436,324$ 425,940$ 413,244$ 397,511$
Contributions in Relation to the Contractually Required Contribution (436,324) (425,940) (413,244) (397,511)
Contribution Deficiency (Excess) -$ -$ -$ -$
Citys' Covered Payroll 5,817,608$ 5,678,596$ 5,509,921$ 5,304,463$
Contributions as a Percentage of Covered Payroll 7.50% 7.50% 7.50% 7.49%
Utilities
Contractually Required Contribution 448,995$ 456,619$ 456,720$ 442,817$
Contributions in Relation to the Contractually Required Contribution (448,995) (456,619) (456,720) (442,817)
Contribution Deficiency (Excess) -$ -$ -$ -$
Utilities' Covered Payroll 5,986,595$ 6,089,520$ 6,090,354$ 5,915,410$
Contributions as a Percentage of Covered Payroll 7.50% 7.50% 7.50% 7.49%
PEPFF
Contractually Required Contribution 527,013$ 513,690$ 498,050$ 471,481$
Contributions in Relation to the Contractually Required Contribution (527,013) (513,690) (498,050) (471,481)
Contribution Deficiency (Excess) -$ -$ -$ -$
Citys' Covered Payroll 3,253,165$ 3,170,925$ 3,074,385$ 2,910,376$
Contributions as a Percentage of Covered Payroll 16.20% 16.20% 16.20% 16.20%
Note: Information is required to be presented for ten years. However until a full ten-year trend is compiled, the City
will present information for only those years for which information is available.
City of Austin, Minnesota
Schedule of City Contributions
(99)

(This page intentionally left blank.)

Combining and Individual Fund Statements and Schedules

(This page intentionally left blank.)

Nonmajor Governmental Funds
Special Revenue Funds Special revenue funds are used to account for specific revenues that are legally restricted to expenditure for particular purposes.
Debt Service Funds
Debt service funds are used to account for financial resources accumulated to retire principal and interest on bond issues
Capital Projects Funds
Capital projects funds are used to account for the acquisition and construction of major capital facilities other than those financed by proprietary funds and trust funds.
Permanent Funds
Permanent funds are used to report resources that are legally restricted to the extent that only earnings, not principal, may be used for purposes that support the reporting government’s programs.

City of Austin, Minnesota
Combining Balance Sheet
Nonmajor Governmental Funds
December 31, 2018
Special Debt Capital
Revenue Service Projects
Assets
Cash and investments 2,051,383$ 779,768$ 5,813,940$
Taxes receivable 53,089 17,851 36,171
Accounts receivable 9,015 - 27,149
Notes receivable, net of allowance for uncollectibles 79,386 - -
Special assessments receivable - 284,095 2,562,192
Accrued interest receivable 6,086 - -
Due from other funds - - 34,638
Due from other governments 43,540 12,453 293,954
Total assets 2,242,499$ 1,094,167$ 8,768,044$
Liabilities
Vouchers payable 27,494$ 114,931$ 21,582$
Contractors' retained percentage - - 497,304
Accrued expenditures 42,600 - -
Due to other funds 3,951 - -
Due to other governments 79,674 - 621
Unearned revenues - - 374,684
Total liabilities 153,719$ 114,931$ 894,191$
Deferred inflows of resources
Unavailable revenue 53,089$ 301,946$ 2,825,902$
Total deferred inflows of resources 53,089$ 301,946$ 2,825,902$
Fund balance
Nonspendable:
Permanent fund principal -$ -$ -$
Restricted for:
Fire 285,265 - -
Parks and recreation 2,343 - -
Debt service reserve - 677,290 -
Library 1,014,288 - -
Committed to:
Other capital projects 23,350 - -
Library 554,471 - -
Parks and recreation 155,974 - -
Assigned to:
Police - - -
Streets and highways - - 2,493,065
Other capital projects - - 2,554,886
Library - - -
Total fund balance 2,035,691$ 677,290$ 5,047,951$
Total liabilities, deferred inflows of
resources, and fund balance 2,242,499$ 1,094,167$ 8,768,044$
(104)

Total
Nonmajor
Governmental
Permanent Funds
159,369$ 8,804,460$
- 107,111
- 36,164
- 79,386
- 2,846,287
- 6,086
- 34,638
- 349,947
159,369$ 12,264,079$
-$ 164,007$
- 497,304
- 42,600
- 3,951
- 80,295
- 374,684
-$ 1,162,841$
-$ 3,180,937$
-$ 3,180,937$
136,052$ 136,052$
- 285,265
- 2,343
- 677,290
- 1,014,288
- 23,350
- 554,471
- 155,974
746 746
- 2,493,065
- 2,554,886
22,571 22,571
159,369$ 7,920,301$
159,369$ 12,264,079$
(105)

City of Austin, Minnesota
Combining Statement of Revenues, Expenditures, and
Changes in Fund Balances - Nonmajor Governmental Funds
For the Year Ended December 31, 2018
Special Debt Capital
Revenue Service Projects
Revenues
Taxes 967,688$ 449,198$ 1,414,002$
Special assessments - 22,854 749,513
Intergovernmental 181,230 4 969,895
Charges for services 110,815 - -
Fines and forfeits 13,867 4,574 -
Miscellaneous 124,351 3,145 209,053
Total revenues 1,397,951$ 479,775$ 3,342,463$
Expenditures
Current
Public safety 17,966$ -$ -$
Culture and recreation 1,297,354 - -
Capital outlay - - 2,554,344
Debt service
Principal retirement - 285,000 -
Interest and fiscal charges - 256,463 -
Total expenditures 1,315,320$ 541,463$ 2,554,344$
Excess (deficiency) of revenues
over expenditures 82,631$ (61,688)$ 788,119$
Other financing uses
Transfers out (5,000)$ -$ -$
Total other financing uses (5,000)$ -$ -$
Net change in fund balance 77,631$ (61,688)$ 788,119$
Fund balance - beginning 1,958,060 738,978 4,259,832
Fund balance - ending 2,035,691$ 677,290$ 5,047,951$
(106)

Total
Nonmajor
Governmental
Permanent Funds
-$ 2,830,888$
- 772,367
- 1,151,129
- 110,815
- 18,441
914 337,463
914$ 5,221,103$
-$ 17,966$
- 1,297,354
- 2,554,344
- 285,000
- 256,463
-$ 4,411,127$
914$ 809,976$
-$ (5,000)$
-$ (5,000)$
914$ 804,976$
158,455 7,115,325
159,369$ 7,920,301$
(107)

(This page intentionally left blank.)

Nonmajor Governmental Funds
Nonmajor Special Revenue Funds Library To account for the operation and maintenance of the Public Library. The Library is financed primarily by general ad valorem property taxes, a county apportionment, and by library charges for services. The City charter provides for the Library Board. Recreation Programs To account for the operation of Park and Recreation Board self-supported recreation programs. Community Development Established to account for community development block grants. Fire PERA To account for funds received as a result of the termination of the PERA Police and Fire Consolidation Fund (PFCF). In accordance with Minnesota legislation passed in 1999, the PFCF was terminated, and all assets and liabilities were transferred to PERA’s Police and Fire Fund (PEPFF). Because the consolidation account was overfunded, the city is entitled to a refund of residual assets as calculated by an actuary. The city intends to use the interest earned on these funds for future capital purchases in the fire department. Expendable Floral Club Established to account for gifts and memorials received by the Library. Expendable Funds are used for specific purposes by the Library. Expendable Memorial and Gifts Established to account for gifts and memorials received by the Library. Expendable Funds are used for specific purposes by the Library. Shaw Gym This fund was established to account for contributions to be used for the replacement of Shaw Gym. Minnesota Foundation A fund established to account for interest earnings and expenditures made for specified library purposes. The fund received interest earnings from a $10,000 endowment within Minnesota Foundation. The endowment was established from $5,000 in local contributions and $5,000 from the Mardag Foundation.

Recreation Community
Library Programs Development Fire PERA
Assets
Cash and investments 547,845$ 157,642$ 23,350$ 284,535$
Taxes receivable 53,089 - - -
Accounts receivable - - - -
Notes receivable, net of allowance for uncollectibles - - 79,386 -
Accrued interest receivable - - - 730
Due from other governments 43,540 - - -
Total assets 644,474$ 157,642$ 102,736$ 285,265$
Liabilities
Vouchers payable 25,195$ 610$ -$ -$
Accrued expenditures 41,558 1,042 - -
Due to other funds 3,951 - - -
Due to other governments 272 16 79,386 -
Total liabilities 70,976$ 1,668$ 79,386$ -$
Deferred inflows of resources
Unavailable revenue 53,089$ -$ -$ -$
Total deferred inflows of resources 53,089$ -$ -$ -$
Fund balance
Restricted for:
Fire -$ -$ -$ 285,265$
Parks and recreation - - - -
Library - - - -
Committed to:
Other capital projects - - 23,350 -
Library 520,409 - - -
Parks and recreation - 155,974 - -
Total fund balance 520,409$ 155,974$ 23,350$ 285,265$
Total liabilities, deferred inflows of
resources, and fund balance 644,474$ 157,642$ 102,736$ 285,265$
City of Austin, Minnesota
Combining Balance Sheet
Nonmajor Special Revenue Funds
December 31, 2018
(110)

Total
Nonmajor
Expendable Expendable Special
Floral Memorial Shaw MN Revenue
Club & Gifts Gym Foundation Funds
2,249$ 1,016,623$ 2,343$ 16,796$ 2,051,383$
- - - - 53,089
- 9,015 - - 9,015
- - - - 79,386
- 5,356 - - 6,086
- - - - 43,540
2,249$ 1,030,994$ 2,343$ 16,796$ 2,242,499$
-$ 1,689$ -$ -$ 27,494$
- - - - 42,600
- - - - 3,951
- - - - 79,674
-$ 1,689$ -$ -$ 153,719$
-$ -$ -$ -$ 53,089$
-$ -$ -$ -$ 53,089$
-$ -$ -$ -$ 285,265$
- - 2,343 - 2,343
2,249 995,243 - 16,796 1,014,288
- - - - 23,350
- 34,062 - - 554,471
- - - - 155,974
2,249$ 1,029,305$ 2,343$ 16,796$ 2,035,691$
2,249$ 1,030,994$ 2,343$ 16,796$ 2,242,499$
(111)

Recreation Community
Library Programs Development Fire PERA
Revenues
Taxes 967,688$ -$ -$ -$
Intergovernmental 181,230 - - -
Charges for services 10,224 100,591 - -
Fines and forfeits 13,867 - - -
Miscellaneous 895 26,830 8,746 6,466
Total revenues 1,173,904$ 127,421$ 8,746$ 6,466$
Expenditures
Public safety -$ -$ -$ 17,966$
Culture and recreation 1,117,736 96,733 - -
Total expenditures 1,117,736$ 96,733$ -$ 17,966$
Excess (deficiency) of revenues
over expenditures 56,168$ 30,688$ 8,746$ (11,500)$
Other financing uses
Transfers out -$ (5,000)$ -$ -$
Total other financing uses -$ (5,000)$ -$ -$
Net change in fund balance 56,168$ 25,688$ 8,746$ (11,500)$
Fund balance - beginning 464,241 130,286 14,604 296,765
Fund balance - ending 520,409$ 155,974$ 23,350$ 285,265$
City of Austin, Minnesota
Combining Statement of Revenues, Expenditures, and
Changes in Fund Balances - Nonmajor Special Revenue Funds
For the Year Ended December 31, 2018
(112)

Total
Nonmajor
Expendable Expendable Special
Floral Memorial Shaw MN Revenue
Club & Gifts Gym Foundation Funds
-$ -$ -$ -$ 967,688$
- - - - 181,230
- - - - 110,815
- - - - 13,867
14 81,280 1 119 124,351
14$ 81,280$ 1$ 119$ 1,397,951$
-$ -$ -$ -$ 17,966$
- 82,885 - - 1,297,354
-$ 82,885$ -$ -$ 1,315,320$
14$ (1,605)$ 1$ 119$ 82,631$
-$ -$ -$ -$ (5,000)$
-$ -$ -$ -$ (5,000)$
14$ (1,605)$ 1$ 119$ 77,631$
2,235 1,030,910 2,342 16,677 1,958,060
2,249$ 1,029,305$ 2,343$ 16,796$ 2,035,691$
(113)

(This page intentionally left blank.)

Nonmajor Governmental Funds
Nonmajor Debt Service Funds
Tax Increment Revenue Pool Established to account for all tax increment revenues and for the retirement of tax increment bond issues.
Improvement Bonds Debt Service Established to account for financial resources accumulated to retire principal and interest on improvement bond issues.

City of Austin, Minnesota
Combining Balance Sheet
Nonmajor Debt Service Funds
December 31, 2018
Total
Improvement Nonmajor
Tax Increment Bonds Debt Service
Revenue Pool Debt Service Funds
Assets
Cash and investments 588,988$ 190,780$ 779,768$
Taxes receivable - 17,851 17,851
Special assessments receivable - 284,095 284,095
Due from other governments 216 12,237 12,453
Total assets 589,204$ 504,963$ 1,094,167$
Liabilities
Vouchers payable 114,931$ -$ 114,931$
Total liabilities 114,931$ -$ 114,931$
Deferred inflows of resources
Unavailable revenue -$ 301,946$ 301,946$
Total deferred inflows of resources -$ 301,946$ 301,946$
Fund balance
Restricted for:
Debt service reserve 474,273$ 203,017$ 677,290$
Total fund balance 474,273$ 203,017$ 677,290$
Total liabilities, deferred inflows of
resources, and fund balance 589,204$ 504,963$ 1,094,167$
(116)

City of Austin, Minnesota
Combining Statement of Revenues, Expenditures, and
Changes in Fund Balances - Nonmajor Debt Service Funds
For the Year Ended December 31, 2018
Total
Improvement Nonmajor
Tax Increment Bonds Debt Service
Revenue Pool Debt Service Funds
Revenues
Taxes 351,545$ 97,653$ 449,198$
Special assessments - 22,854 22,854
Intergovernmental - 4 4
Fines and forfeits - 4,574 4,574
Miscellaneous 1,471 1,674 3,145
Total revenues 353,016$ 126,759$ 479,775$
Expenditures
Debt service
Principal retirement 35,000$ 250,000$ 285,000$
Interest and fiscal charges 249,014 7,449 256,463
Total expenditures 284,014$ 257,449$ 541,463$
Net change in fund balance 69,002$ (130,690)$ (61,688)$
Fund balance - beginning 405,271 333,707 738,978
Fund balance - ending 474,273$ 203,017$ 677,290$
(117)

(This page intentionally left blank.)

Nonmajor Governmental Funds
Nonmajor Capital Projects Funds
Capital Improvements Revolving Established to account for an accumulation of resources to be used directly for construction of street and other community improvements that are not financed by general improvement bond issues. State Aid Street Established to account for improvements to streets financed with the Municipal State Aid Street Account. Airport Improvements This fund was established to account for various airport projects.

Total
Capital State Nonmajor
Improvements Aid Airport Capital
Revolving Street Improvements Project Funds
Assets
Cash and investments 2,598,491$ 3,034,051$ 181,398$ 5,813,940$
Taxes receivable 36,171 - - 36,171
Accounts receivable 27,149 - - 27,149
Special assessments receivable 2,049,729 512,463 - 2,562,192
Due from other funds 30,660 3,978 - 34,638
Due from other governments 64,760 229,194 - 293,954
Total assets 4,806,960$ 3,779,686$ 181,398$ 8,768,044$
Liabilities
Vouchers payable 21,582$ -$ -$ 21,582$
Contractors' retained percentage 300,705 196,599 - 497,304
Due to other governments 285 336 - 621
Unearned revenues 25,000 349,684 - 374,684
Total liabilities 347,572$ 546,619$ -$ 894,191$
Deferred inflows of resources
Unavailable revenue 2,085,900$ 740,002$ -$ 2,825,902$
Total deferred inflows of resources 2,085,900$ 740,002$ -$ 2,825,902$
Fund balance
Assigned to:
Streets and highways -$ 2,493,065$ -$ 2,493,065$
Other capital projects 2,373,488 - 181,398 2,554,886
Total fund balance 2,373,488$ 2,493,065$ 181,398$ 5,047,951$
Total liabilities, deferred inflows of
resources, and fund balance 4,806,960$ 3,779,686$ 181,398$ 8,768,044$
City of Austin, Minnesota
Combining Balance Sheet
Nonmajor Capital Projects Funds
December 31, 2018
(120)

Total
Capital State Nonmajor
Improvements Aid Airport Capital
Revolving Street Improvements Projects Funds
Revenues
Taxes 1,414,002$ -$ -$ 1,414,002$
Special assessments 561,334 188,179 - 749,513
Intergovernmental revenues 1,650 963,950 4,295 969,895
Miscellaneous revenues
Investment income 13,211$ 10,489$ -$ 23,700$
Miscellaneous 185,143 210 - 185,353
Total miscellaneous revenues 198,354$ 10,699$ -$ 209,053$
Total revenues 2,175,340$ 1,162,828$ 4,295$ 3,342,463$
Expenditures
Capital outlay 1,823,443$ 730,901$ -$ 2,554,344$
Total expenditures 1,823,443$ 730,901$ -$ 2,554,344$
Net change in fund balance 351,897$ 431,927$ 4,295$ 788,119$
Fund balance - beginning 2,021,591 2,061,138 177,103 4,259,832
Fund balance - ending 2,373,488$ 2,493,065$ 181,398$ 5,047,951$
City of Austin, Minnesota
Combining Statement of Revenues, Expenditures, and
Changes in Fund Balances - Nonmajor Capital Projects Funds
For the Year Ended December 31, 2018
(121)

(This page intentionally left blank.)

Nonmajor Governmental Funds
Nonmajor Permanent Funds
Non-Expendable Memorial and Gift Established to account for gifts and memorials received by the Library. Interest earnings are expendable while gifts of $122,750 are non-expendable. The original $22,750 of gifts were from the Rasmussen bequest ($2,000), Rupner children’s room ($10,000), Tanya B. Hines bequest ($10,000) and an anonymous gift ($750). During 2012, a gift of $100,000 was received from Ira James Holton. Non-Expendable Floral Club Established to account for gifts and memorials received by the Library. All bequests and gifts are non-expendable while interest earnings are expendable. The original $12,000 gift was from an anonymous source. Junior Police Program A non-expendable fund established to account for the contribution of $1,302 from the Exchange Club of Austin in 1993. The interest earnings are available for use in continuing the Junior Police program. If the Junior Police Program is discontinued, interest earnings are then available for a comparable youth oriented law enforcement education program.

City of Austin, Minnesota
Combining Balance Sheet
Nonmajor Permanent Funds
December 31, 2018
Non-Expendable Junior
Memorial Non-Expendable Police
and Gift Floral Club Program Total
Assets
Cash and investments 136,623$ 20,698$ 2,048$ 159,369$
Total assets 136,623$ 20,698$ 2,048$ 159,369$
Fund balance
Nonspendable:
Permanent fund principal 122,750$ 12,000$ 1,302$ 136,052$
Assigned to:
Police - - 746 746
Library 13,873 8,698 - 22,571
Total fund balance 136,623$ 20,698$ 2,048$ 159,369$
(124)

City of Austin, Minnesota
Combining Statement of Revenues, Expenditures, and
Changes in Fund Balances - Nonmajor Permanent Funds
For the Year Ended December 31, 2018
Non-Expendable Junior
Memorial Non-Expendable Police
and Gift Floral Club Program Total
Revenues
Investment income 753$ 146$ 15$ 914$
Total revenues 753$ 146$ 15$ 914$
Net change in fund balance 753$ 146$ 15$ 914$
Fund balance - beginning 135,870 20,552 2,033 158,455
Fund balance - ending 136,623$ 20,698$ 2,048$ 159,369$
(125)

(This page intentionally left blank.)

Governmental Funds
Budgetary Comparisons

City of Austin, Minnesota
General Fund
Schedule of Revenues - Budget and Actual
For the Year Ended December 31, 2018
Variance with
Final Budget -
Budgeted Amounts Actual Positive
Original Final Amounts (Negative)
Taxes
General property, current 3,415,325$ 3,415,325$ 3,351,812$ (63,513)$
General property, delinquent 120,000 120,000 52,974 (67,026)
Penalty and interest on delinquent 15,000 15,000 5,936 (9,064)
Mobile home 2,000 2,000 3,950 1,950
Hotel - Motel tax 140,000 140,000 192,549 52,549
Cablevision franchise fee 325,000 325,000 318,779 (6,221)
Lawful gaming tax 3,500 3,500 5,589 2,089
Total taxes 4,020,825$ 4,020,825$ 3,931,589$ (89,236)$
Special assessments 26,000$ 26,000$ 29,167$ 3,167$
Licenses and permits
Business licenses and permits 74,525$ 74,525$ 77,954$ 3,429$
Non-Business licenses and permits 391,250 391,250 388,701 (2,549)
Rental housing licenses and permits - - 10,157 10,157
Total licenses and permits 465,775$ 465,775$ 476,812$ 11,037$
Intergovernmental revenues
State
Local government aid 8,151,133$ 8,151,133$ 8,151,133$ -$
Fire relief association amortization aid 129,000 129,000 131,991 2,991
PERA Aid - - 27,297 27,297
Highway maintenance 52,000 52,000 54,671 2,671
Police training reimbursement 24,000 24,000 31,581 7,581
Airport maintenance 49,739 49,739 49,968 229
Mobile home homestead credit - - 151 151
State and federal grants 97,014 97,014 98,867 1,853
Police insurance premium aid 250,000 250,000 272,604 22,604
School district liaison aid 158,347 158,347 162,808 4,461
Total intergovernmental revenues 8,911,233$ 8,911,233$ 8,981,071$ 69,838$
Charges for services
License late fees 810$ 810$ 1,408$ 598$
Booklet and map sales 20 20 570 550
Plans and specifications 1,000 1,000 446 (554)
Photocopies and accident copies 10 10 64 54
Special services, police 4,500 4,500 193 (4,307)
Autopawn system revenues 4,000 4,000 1,947 (2,053)
Special services, fire 4,000 4,000 1,647 (2,353)
Rural fire fees 135,000 135,000 135,000 -
Impounding and adoption fee 1,500 1,500 959 (541)
Plat and changes of use fees 2,000 2,000 2,075 75
Zoning review and variance fees 1,250 1,250 2,065 815
Investigation fees 1,000 1,000 1,690 690
Interest earnings on loan 4,000 4,000 367,138 363,138
Satisfaction fees 4,800 4,800 4,416 (384)
School crossing guards 14,837 14,837 14,731 (106)
(128)

City of Austin, Minnesota
General Fund
Schedule of Revenues - Budget and Actual
For the Year Ended December 31, 2018
Variance with
Final Budget -
Budgeted Amounts Actual Positive
Original Final Amounts (Negative)
Charges for services (continued)
Assessment searches 8,500 8,500 13,380 4,880
Building investigation fees 1,000 1,000 346 (654)
Building seminar program fees 4,500 4,500 4,070 (430)
Parking lot lease revenues 5,000 5,000 6,343 1,343
Mill Pond Boat user fees 842 842 234 (608)
Airport hangar rental 14,000 14,000 14,026 26
Swimming pool 83,000 83,000 95,594 12,594
Park and recreation facilities 8,892 8,892 19,641 10,749
Nature center public school rentals 5,000 5,000 5,995 995
Ruby Rupner Auditorium rentals 7,596 7,596 12,417 4,821
Riverside and Packer Arena 210,023 210,023 226,780 16,757
Total charges for services 527,080$ 527,080$ 933,175$ 406,095$
Fines and forfeits
Court fines 140,000$ 140,000$ 105,507$ (34,493)$
Other fines 17,200 88,200 39,340 (48,860)
Parking violations 20,500 20,500 14,271 (6,229)
Total fines and forfeits 177,700$ 248,700$ 159,118$ (89,582)$
Miscellaneous revenues
Investment income 20,000$ 20,000$ 58,899$ 38,899$
Contributions, private sources 181,195 181,195 174,926 (6,269)
County Contribution, Senior Center 30,000 30,000 35,000 5,000
Other miscellaneous revenues 98,418 98,418 295,862 197,444
Administration fees 160,000 160,000 127,037 (32,963)
Accounting fees 55,000 55,000 54,962 (38)
Sale of fixed assets 25,000 25,000 - (25,000)
Total miscellaneous revenues 569,613$ 569,613$ 746,686$ 177,073$
Total revenues 14,698,226$ 14,769,226$ 15,257,618$ 488,392$
Other financing sources
Operating transfers in 1,705,000$ 1,705,000$ 1,696,915$ (8,085)$
Total other financing sources 1,705,000$ 1,705,000$ 1,696,915$ (8,085)$
Total revenues and other sources 16,403,226$ 16,474,226$ 16,954,533$ 480,307$
(129)

City of Austin, Minnesota
General Fund
Schedule of Expenditures - Budget and Actual
For the Year Ended December 31, 2018
Variance with
Final Budget -
Budgeted Amounts Actual Positive
Original Final Amounts (Negative)
General government
Council 239,795$ 239,795$ 204,788$ 35,007$
Mayor 16,733 16,733 12,634 4,099
Administrator 278,369 278,369 270,420 7,949
Clerk 205,607 205,607 202,089 3,518
Finance 463,485 463,485 449,001 14,484
Assessor - - 99 (99)
Attorney 154,852 154,852 164,350 (9,498)
Prosecuting attorney 188,468 188,468 187,458 1,010
Human resources 115,974 115,974 109,774 6,200
Planner 216,006 216,006 201,191 14,815
City hall 164,168 164,168 162,471 1,697
Cable TV access channel 11,500 11,500 9,424 2,076
Contingency 108,166 80,695 42,191 38,504
Capital outlay 41,650 61,808 23,387 38,421
Total general government 2,204,773$ 2,197,460$ 2,039,277$ 158,183$
Public safety
Police 3,734,675$ 3,734,675$ 3,732,234$ 2,441$
Law enforcement center 750,000 750,000 735,386 14,614
Canine program 3,400 3,400 4,422 (1,022) Crossing guards 14,837 14,837 14,731 106
Police explorer 1,200 1,200 1,016 184
Community service officers 175,533 175,533 163,735 11,798
Ellis School Liaison 87,920 87,920 90,298 (2,378)
Fire 1,652,563 1,652,563 1,276,730 375,833
Building inspection 291,998 291,998 275,359 16,639
Rental housing inspection - - 23,938 (23,938)
Civil defense 28,000 28,000 38,553 (10,553)
Capital outlay 137,036 203,362 76,948 126,414
Contingency 24,136 21,181 15,775 5,406
Total public safety 6,901,298$ 6,964,669$ 6,449,125$ 515,544$
Streets and highways
Engineering 673,936$ 673,936$ 696,222$ (22,286)$
Streets and highways 2,567,772 2,568,772 2,313,600 255,172
Sidewalk, curb and gutter 16,000 16,000 16,002 (2)
Highway lighting 202,000 202,000 248,187 (46,187)
Sign shop 131,845 131,845 129,851 1,994
Parking lots 21,500 21,500 20,469 1,031
Capital outlay 57,419 85,211 32,242 52,969
Total streets and highways 3,670,472$ 3,699,264$ 3,456,573$ 242,691$
(130)

City of Austin, Minnesota
General Fund
Schedule of Expenditures - Budget and Actual
For the Year Ended December 31, 2018
Variance with
Final Budget -
Budgeted Amounts Actual Positive
Original Final Amounts (Negative)
Culture and recreation
Park and recreation
Recreation and nature center 936,542$ 936,542$ 898,394$ 38,148$
Swimming pool 172,935 172,935 129,682 43,253
Recreation facilities 65,413 65,413 57,817 7,596
Park maintenance 1,098,916 1,098,916 1,086,949 11,967
Weed control 53,500 53,500 58,210 (4,710)
Contingency 88,198 65,799 32,639 33,160
Capital outlay 314,095 466,119 176,370 289,749
Downtown flowers 41,499 41,499 40,729 770
Total park and recreation 2,771,098$ 2,900,723$ 2,480,790$ 419,933$
Arenas
Riverside and Packer Arena 519,534$ 519,534$ 513,262$ 6,272$
Senior citizen's activities
Senior Citizen's Center 65,000$ 65,000$ 69,509$ (4,509)$
Total culture and recreation 3,355,632$ 3,485,257$ 3,063,561$ 421,696$
Public service
Airport maintenance 97,000$ 97,000$ 93,133$ 3,867$
Total public service 97,000$ 97,000$ 93,133$ 3,867$
Economic development 191,551$ 222,051$ 270,792$ (48,741)$
Total expenditures 16,420,726$ 16,665,701$ 15,372,461$ 1,293,240$
(131)

City of Austin, Minnesota
Library Fund
Schedule of Revenues, Expenditures, and
Changes in Fund Balances - Budget and Actual
For the Year Ended December 31, 2018
Variance with
Final Budget -
Budgeted Amounts Actual Positive
Original Final Amounts (Negative)
Revenues
Taxes
General property, current 968,916$ 968,916$ 950,897$ (18,019)$
Delinquent property taxes 40,000 40,000 15,670 (24,330)
Mobile home - - 1,121 1,121
Total taxes 1,008,916$ 1,008,916$ 967,688$ (41,228)$
Intergovernmental revenues
State
Mobile home homestead credit -$ -$ 43$ 43$
County
Apportionment 178,620$ 178,620$ 181,187$ 2,567$
Total intergovernmental revenues 178,620$ 178,620$ 181,230$ 2,610$
Charges for services
Room and picture rentals 520$ 520$ 475$ (45)$
Photocopies 6,000 6,000 6,009 9
Book sales 6,000 6,000 3,740 (2,260)
Total charges for services 12,520$ 12,520$ 10,224$ (2,296)$
Fines and forfeits
Book fines 17,000$ 17,000$ 13,867$ (3,133)$
Miscellaneous revenues
Investment income -$ -$ 262$ 262$
Revenue from other sources - - 633 633
Total miscellaneous revenues -$ -$ 895$ 895$
Total revenues 1,217,056$ 1,217,056$ 1,173,904$ (43,152)$
Expenditures
Culture and recreation
Library 1,217,056$ 1,217,056$ 1,117,736$ 99,320$
Total expenditures 1,217,056$ 1,217,056$ 1,117,736$ 99,320$
Net change in fund balance -$ -$ 56,168$ 56,168$
Fund balance - beginning 464,241 464,241 464,241 -
Fund balance - ending 464,241$ 464,241$ 520,409$ 56,168$
(132)

(This page intentionally left blank.)

City of Austin, Minnesota
Recreation Programs Fund
Schedule of Revenues, Expenditures, and
Changes in Fund Balances - Budget and Actual
For the Year Ended December 31, 2018
Variance with
Final Budget -
Budgeted Amounts Actual Positive
Original Final Amounts (Negative)
Revenues
Charges for services
Adult softball 12,000$ 12,000$ 20,823$ 8,823$
Adult volleyball 3,000 3,000 2,849 (151)
Community gardens 1,600 1,600 1,504 (96)
Disc golf - - 1,015 1,015
Horseshoe club - - 1,062 1,062
Player fees 5,000 5,000 4,424 (576)
Southern Minny fast pitch 5,000 5,000 - (5,000)
Youth basketball camp fees 7,000 7,000 10,872 3,872
Summer programs 12,000 12,000 14,927 2,927
Austin Area Volleyball Club 6,573 6,573 11,442 4,869
Youth wrestling 5,000 5,000 7,532 2,532
Bike club 1,000 1,000 6,562 5,562
Canoe rental 500 500 430 (70)
Crafts program 1,200 1,200 1,745 545
Cross country skiing 2,000 2,000 1,359 (641)
Special events 9,000 9,000 14,045 5,045
Total charges for services 70,873$ 70,873$ 100,591$ 29,718$
Miscellaneous Revenues
Investment income -$ -$ 867$ 867$
Concessions commissions 18,000 18,000 20,963 2,963
Nature Center donations 2,500 2,500 5,000 2,500
Total miscellaneous 20,500$ 20,500$ 26,830$ 6,330$
Total revenues 91,373$ 91,373$ 127,421$ 36,048$
(134)
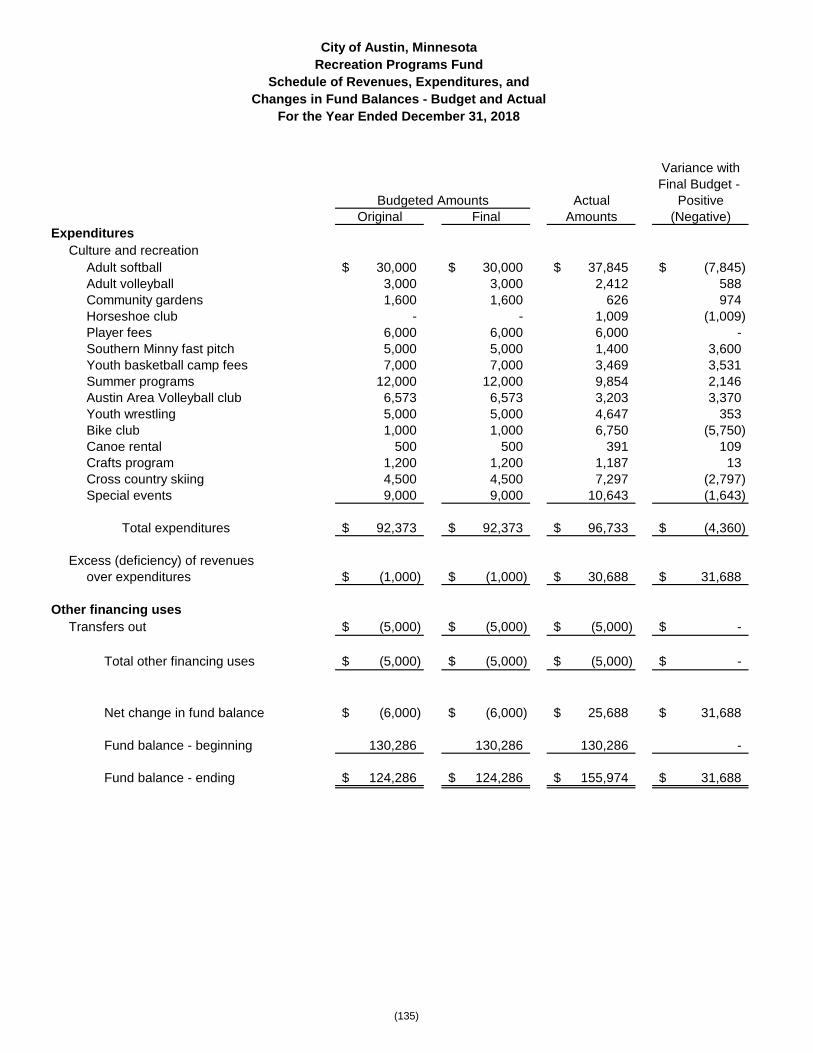
City of Austin, Minnesota
Recreation Programs Fund
Schedule of Revenues, Expenditures, and
Changes in Fund Balances - Budget and Actual
For the Year Ended December 31, 2018
Variance with
Final Budget -
Budgeted Amounts Actual Positive
Original Final Amounts (Negative)
Expenditures
Culture and recreation
Adult softball 30,000$ 30,000$ 37,845$ (7,845)$
Adult volleyball 3,000 3,000 2,412 588
Community gardens 1,600 1,600 626 974
Horseshoe club - - 1,009 (1,009)
Player fees 6,000 6,000 6,000 -
Southern Minny fast pitch 5,000 5,000 1,400 3,600
Youth basketball camp fees 7,000 7,000 3,469 3,531
Summer programs 12,000 12,000 9,854 2,146
Austin Area Volleyball club 6,573 6,573 3,203 3,370
Youth wrestling 5,000 5,000 4,647 353
Bike club 1,000 1,000 6,750 (5,750)
Canoe rental 500 500 391 109
Crafts program 1,200 1,200 1,187 13
Cross country skiing 4,500 4,500 7,297 (2,797)
Special events 9,000 9,000 10,643 (1,643)
Total expenditures 92,373$ 92,373$ 96,733$ (4,360)$
Excess (deficiency) of revenues
over expenditures (1,000)$ (1,000)$ 30,688$ 31,688$
Other financing uses
Transfers out (5,000)$ (5,000)$ (5,000)$ -$
Total other financing uses (5,000)$ (5,000)$ (5,000)$ -$
Net change in fund balance (6,000)$ (6,000)$ 25,688$ 31,688$
Fund balance - beginning 130,286 130,286 130,286 -
Fund balance - ending 124,286$ 124,286$ 155,974$ 31,688$
(135)

City of Austin, Minnesota
Fire PERA Fund
Schedule of Revenues, Expenditures, and
Changes in Fund Balances - Budget and Actual
For the Year Ended December 31, 2018
Variance with
Final Budget -
Budgeted Amounts Actual Positive
Original Final Amounts (Negative)
Revenues
Interest income 5,000$ 5,000$ 6,466$ 1,466$
Total revenues 5,000$ 5,000$ 6,466$ 1,466$
Expenditures
Public safety
Capital outlay 61,000$ 61,000$ 17,966$ 43,034$
Total expenditures 61,000$ 61,000$ 17,966$ 43,034$
Net change in fund balance (56,000)$ (56,000)$ (11,500)$ 44,500$
Fund balance - beginning 296,765 296,765 296,765 -
Fund balance - ending 240,765$ 240,765$ 285,265$ 44,500$
(136)

Nonmajor Enterprise Funds
Waste Transfer Station Fund To account for operation and maintenance of the City's waste transfer station. Storm Water Utility Fund To account for storm water utility maintenance.

City of Austin, Minnesota
Combining Statement of Net Position
Nonmajor Enterprise Funds
December 31, 2018
Waste Storm Total Nonmajor
Transfer Water Enterprise
Assets Station Utility Funds
Current assets
Cash and investments 399,642$ 577,664$ 977,306$
Accounts receivable 123 100,000 100,123
Due from other funds - 56,515 56,515
Total current assets 399,765$ 734,179$ 1,133,944$
Capital assets
Capital assets 505,964$ 4,954,467$ 5,460,431$
Accumulated depreciation (280,777) (682,165) (962,942)
Net 225,187$ 4,272,302$ 4,497,489$
Construction in progress - 920,417 920,417
Net capital assets 225,187$ 5,192,719$ 5,417,906$
Total assets 624,952$ 5,926,898$ 6,551,850$
Deferred outflows of resources
Pension related -$ 15,926$ 15,926$
Total deferred outflows of resources -$ 15,926$ 15,926$
Total assets and deferred outflows of resources 624,952$ 5,942,824$ 6,567,776$
Liabilities
Current liabilities
Vouchers payable -$ 12,431$ 12,431$
Accrued expenses - 4,300 4,300
Due to other funds - 7,681 7,681
Total current liabilities -$ 24,412$ 24,412$
Noncurrent liabilities
Net pension liability -$ 89,910$ 89,910$
Other postemployment benefits payable - 16,546 16,546
Total noncurrent liabilities -$ 106,456$ 106,456$
Total liabilities -$ 130,868$ 130,868$
Deferred inflows of resources
Pension related -$ 24,121$ 24,121$
OPEB related - 757 757
Total deferred inflows of resources -$ 24,878$ 24,878$
Net position
Net investment in capital assets 225,187$ 5,192,719$ 5,417,906$
Unrestricted 399,765 594,359 994,124
Total net position 624,952$ 5,787,078$ 6,412,030$
Total liabilities, deferred inflows of
resources, and net position 624,952$ 5,942,824$ 6,567,776$
(138)

City of Austin, Minnesota
Combining Statement of Revenues, Expenses,
and Changes in Net Position - Nonmajor Enterprise Funds
For the Year Ended December 31, 2018
Waste Storm Total Nonmajor
Transfer Water Enterprise
Station Utility FundsOperating revenues
Charges for services -$ 684,338$ 684,338$
Other operating revenues 42,672 - 42,672
Total operating revenues 42,672$ 684,338$ 727,010$
Operating expenses
Salaries and benefits -$ 127,650$ 127,650$
Supplies and maintenance 15,384 75,222 90,606
Administrative and general 11,674 72,028 83,702
Total operating expenses, excluding depreciation 27,058$ 274,900$ 301,958$
Depreciation 16,934 81,831 98,765
Total operating expenses 43,992$ 356,731$ 400,723$
Operating income (loss) (1,320)$ 327,607$ 326,287$
Non-operating revenues
Investment income 2,493$ 7,317$ 9,810$
Miscellaneous - 100,111 100,111
Total non-operating revenues 2,493$ 107,428$ 109,921$
Change in net position 1,173$ 435,035$ 436,208$
Total net position - beginning 623,779 5,367,202 5,990,981
Restatement - (15,159) (15,159)
Total net position - beginning, as restated 623,779 5,352,043 5,975,822
Total net position - ending 624,952$ 5,787,078$ 6,412,030$
(139)

City of Austin, Minnesota
Combining Statement of Cash Flows
Nonmajor Enterprise Funds
For the Year Ended December 31, 2018
Waste Storm Total Nonmajor
Transfer Water Enterprise
Station Utility Funds
Cash flows from operating activities
Receipts from customers and users 42,549$ 584,052$ 626,601$
Payments to suppliers (27,058) (146,010) (173,068)
Payments to employees - (149,029) (149,029)
Other receipts - 100,111 100,111
Net cash provided by operating activities 15,491$ 389,124$ 404,615$
Cash flows from capital and related financing activities
Capital assets acquisitions -$ (505,494)$ (505,494)$
Net cash used by capital and related financing activities -$ (505,494)$ (505,494)$
Cash flows from investing activities
Investment income 2,493$ 7,317$ 9,810$
Net cash flows provided by investing activities 2,493$ 7,317$ 9,810$
Net increase (decrease) in cash and cash equivalents 17,984$ (109,053)$ (91,069)$
Cash and cash equivalents - beginning 381,658 686,717 1,068,375
Cash and cash equivalents - ending 399,642$ 577,664$ 977,306$
Reconciliation of operating income (loss) to net cash
provided by operating activities:
Operating income (loss) (1,320)$ 327,607$ 326,287$
Adjustments to reconcile operating income (loss)
to net cash provided by operating activities:
Depreciation and amortization 16,934 81,831 98,765
Miscellaneous revenues - 100,111 100,111
Change in net pension liability - (32,840) (32,840)
Change in deferred inflows of resources - pension related - 1,652 1,652
Change in deferred inflows of resources - OPEB related - 757 757
Change in deferred outflows of resources - pension related - 14,698 14,698
Other postemployment benefits payable - (2,964) (2,964)
(Increase) decrease in assets:
Accounts receivable (123) (100,000) (100,123)
Due from other funds - (286) (286)
Increase (decrease) in liabilities:
Vouchers payable - 3,545 3,545
Contractors' retained percentage - (3,864) (3,864) Accrued expenses - (5,119) (5,119)
Due to other funds - 3,996 3,996
Net cash provided by operating activities 15,491$ 389,124$ 404,615$
(140)

Internal Service Funds
MIS Replacement Established to account for the operation, maintenance, and replacement of certain management information systems equipment. City departments are billed for equipment use. Central Garage Established to account for the operation and maintenance of a central garage service to all departments except for Police, Library, and Utilities. City departments are billed for equipment use based on a pre-determined rate per hour for each vehicle which includes depreciation, operating costs, and overhead. Risk Management Established to account for the following activities:
Health Insurance Established to account for health insurance administrative and claims costs financed by contributions from City departments and funds.
Property and Liability Established to account for insurance premiums and claims. City departments and funds are billed for these costs.
Workers' Compensation Insurance Established to account for insurance premiums and claims. City departments and funds are billed to cover these costs.
Sick Leave Program Established to account for retirement benefits paid as a result of accumulated sick leave. City departments and funds are billed to finance these benefits.

City of Austin, Minnesota
Combining Statement of Net Position - Internal Service Funds
December 31, 2018
Total Internal
MIS Central Risk Service
Replacement Garage Management Funds
Assets
Cash and investments 255,424$ 3,736,550$ 4,442,116$ 8,434,090$
Accounts receivable - - 259 259
Due from employees - - 4,110 4,110
Inventory - 76,800 - 76,800
Prepaid items - - 264,390 264,390
Total current assets 255,424$ 3,813,350$ 4,710,875$ 8,779,649$
Capital assets 126,065$ 16,461,090$ -$ 16,587,155$
Accumulated depreciation (93,887) (7,979,331) - (8,073,218)
Construction in progress - 47,480 - 47,480
Net capital assets 32,178$ 8,529,239$ -$ 8,561,417$
Total assets 287,602$ 12,342,589$ 4,710,875$ 17,341,066$
Deferred outflows of resources
Pension related 10,897$ 37,720$ 3,353$ 51,970$
Total deferred outflows of resources 10,897$ 37,720$ 3,353$ 51,970$
Total assets and deferred outflows
of resources 298,499$ 12,380,309$ 4,714,228$ 17,393,036$
Liabilities
Vouchers payable 151$ 101,028$ 852$ 102,031$
Accrued expenses 18,717 54,962 241,951 315,630
Due to other funds - 7,168 - 7,168
Net pension liability 61,517 212,944 18,929 293,390
Total liabilities 80,385$ 376,102$ 261,732$ 718,219$
Deferred inflows of resources
Pension related 16,504$ 57,128$ 5,078$ 78,710$
Total deferred inflows of resources 16,504$ 57,128$ 5,078$ 78,710$
Net position
Net investment in capital assets 32,178$ 8,529,239$ -$ 8,561,417$
Unrestricted 169,432 3,417,840 4,447,418 8,034,690
Total net position 201,610$ 11,947,079$ 4,447,418$ 16,596,107$
Total liabilities, deferred inflows of
resources, and net position 298,499$ 12,380,309$ 4,714,228$ 17,393,036$
(142)

City of Austin, Minnesota
Combining Statement of Revenues, Expenses, and
Changes in Net Position - Internal Service Funds
For the Year Ended December 31, 2018
Total Internal
MIS Central Risk Service
Replacement Garage Management Funds
Operating revenues
Charges for services 220,000$ 1,744,383$ 2,545,858$ 4,510,241$
Total operating revenues 220,000$ 1,744,383$ 2,545,858$ 4,510,241$
Operating expenses
Salaries and benefits 105,858$ 368,847$ 35,698$ 510,403$
Supplies and maintenance 2,178 488,219 - 490,397
Administrative and general 99,975 54,146 54,979 209,100
Claims - - 2,198,424 2,198,424
Retirement benefits - - 121,808 121,808
Insurance premiums - - 1,042,264 1,042,264
Total operating expenses,
excluding depreciation 208,011$ 911,212$ 3,453,173$ 4,572,396$
Depreciation 15,805 703,012 - 718,817
Total operating expenses 223,816$ 1,614,224$ 3,453,173$ 5,291,213$
Operating income (loss) (3,816)$ 130,159$ (907,315)$ (780,972)$
Non-operating revenues
Investment income 1,699$ 28,781$ 42,662$ 73,142$
Other revenues - 3,204 609,372 612,576
Total non-operating revenues 1,699$ 31,985$ 652,034$ 685,718$
Change in net position (2,117)$ 162,144$ (255,281)$ (95,254)$
Net position - beginning 203,727 11,784,935 4,702,699 16,691,361
Net position - ending 201,610$ 11,947,079$ 4,447,418$ 16,596,107$
(143)

City of Austin, Minnesota
Combining Statement of Cash Flows - Internal Service Funds
For the Year Ended December 31, 2018
Total Internal
MIS Central Risk Service
Replacement Garage Management Funds
Cash flows from operating activities
Receipts from customers and users 220,000$ 1,744,383$ 2,548,987$ 4,513,370$
Payments to suppliers (102,002) (448,075) (3,589,085) (4,139,162)
Payments to employees (106,779) (344,066) (30,673) (481,518)
Payments to retirees - - (121,808) (121,808)
Other receipts - 3,204 609,372 612,576
Net cash provided (used) by operating activities 11,219$ 955,446$ (583,207)$ 383,458$
Cash flows from capital
and related financing activities
Capital asset acquisitions (11,960)$ (1,122,155)$ -$ (1,134,115)$
Net cash used by capital and
related financing activities (11,960)$ (1,122,155)$ -$ (1,134,115)$
Cash flows from investing activities
Investment income 1,699$ 28,781$ 42,662$ 73,142$
Net cash flows provided by investing activities 1,699$ 28,781$ 42,662$ 73,142$
Net increase (decrease) in cash and
cash equivalents 958$ (137,928)$ (540,545)$ (677,515)$
Cash and cash equivalents - beginning 254,466 3,874,478 4,982,661 9,111,605
Cash and cash equivalents - ending 255,424$ 3,736,550$ 4,442,116$ 8,434,090$
Reconciliation of operating income (loss) to net
cash provided (used) by operating activities:
Operating income (loss) (3,816)$ 130,159$ (907,315)$ (780,972)$
Depreciation 15,805 703,012 - 718,817
Miscellaneous revenues - 3,204 609,372 612,576
Change in net pension liability (11,017) (21,397) 2,190 (30,224)
Change in deferred inflows of resources - pension related 3,227 14,232 2,011 19,470
Change in deferred outflows of resources - pension related 7,199 20,745 824 28,768
(Increase) Decrease in assets:
Accounts receivable - - 7,239 7,239
Due from employees/FSA - - (4,110) (4,110)
Inventory - 4,648 - 4,648
Prepaid items - - (264,390) (264,390)
Increase (Decrease) in liabilities:
Vouchers payable 151 82,474 (128) 82,497
Accrued expenses (330) 11,201 (28,900) (18,029)
Due to other funds - 7,168 - 7,168
Net cash provided (used) by operating activities 11,219$ 955,446$ (583,207)$ 383,458$
(144)

City of Austin, Minnesota
Combining Schedule of Net Position
Internal Service Funds - Central Garage Fund
December 31, 2018
Fire
Streets and Parks and Vehicles and
Highways Forestry Equipment Total
Assets
Cash and investments 1,676,388$ 1,734,821$ 325,341$ 3,736,550$
Inventory 76,800 - - 76,800
Total current assets 1,753,188$ 1,734,821$ 325,341$ 3,813,350$
Capital assets 12,204,182$ 1,807,903$ 2,449,005$ 16,461,090$
Accumulated depreciation (5,578,654) (1,247,572) (1,153,105) (7,979,331)
Construction in progress - 47,480 - 47,480
Net capital assets 6,625,528$ 607,811$ 1,295,900$ 8,529,239$
Total assets 8,378,716$ 2,342,632$ 1,621,241$ 12,342,589$
Deferred outflows of resources
Pension related 29,373$ 8,347$ -$ 37,720$
Total deferred outflows of resources 29,373$ 8,347$ -$ 37,720$
Total assets and deferred outflows
of resources 8,408,089$ 2,350,979$ 1,621,241$ 12,380,309$
Liabilities
Current liabilities
Vouchers payable 10,133$ 3,658$ 87,237$ 101,028$
Accrued expenses 45,050 9,721 191 54,962
Due to other funds 7,168 - - 7,168
Net pension liability 165,819 47,125 - 212,944
Total liabilities 228,170$ 60,504$ 87,428$ 376,102$
Deferred inflows of resources
Pension related 44,486$ 12,642$ -$ 57,128$
Total deferred inflows of resources 44,486$ 12,642$ -$ 57,128$
Net position
Net investment in capital assets 6,625,528$ 607,811$ 1,295,900$ 8,529,239$
Unrestricted 1,509,905 1,670,022 237,913 3,417,840
Total net position 8,135,433$ 2,277,833$ 1,533,813$ 11,947,079$
Total liabilities, deferred inflows of
resources, and net position 8,408,089$ 2,350,979$ 1,621,241$ 12,380,309$
(145)

City of Austin, Minnesota
Combining Schedule of Revenues, Expenses, and
Changes in Net Position
Internal Service Funds - Central Garage Fund
For the Year Ended December 31, 2018
Fire Total Central
Streets and Parks and Vehicles and Garage
Highways Forestry Equipment Fund
Operating revenues
Charges for services 1,247,132$ 327,251$ 170,000$ 1,744,383$
Total operating revenues 1,247,132$ 327,251$ 170,000$ 1,744,383$
Operating expenses
Salaries and benefits 291,022$ 77,825$ -$ 368,847$
Supplies and maintenance 346,146 115,525 26,548 488,219
Administrative and general 45,566 8,580 - 54,146
Total operating expenses,
excluding depreciation 682,734$ 201,930$ 26,548$ 911,212$
Depreciation 509,931 105,364 87,717 703,012
Total operating expenses 1,192,665$ 307,294$ 114,265$ 1,614,224$
Operating income 54,467$ 19,957$ 55,735$ 130,159$
Non-operating revenues
Investment income 12,329$ 12,831$ 3,621$ 28,781$
Other revenues 2,030 1,174 - 3,204
Total non-operating revenues 14,359$ 14,005$ 3,621$ 31,985$
Change in net position 68,826$ 33,962$ 59,356$ 162,144$
Net position - beginning 8,066,607 2,243,871 1,474,457 11,784,935
Net position - ending 8,135,433$ 2,277,833$ 1,533,813$ 11,947,079$
(146)

City of Austin, Minnesota
Combining Schedule of Net Position
Internal Service Funds - Risk Management Fund
December 31, 2018
Property Workers' Sick Total Risk
Health and Compensation Leave Management
Insurance Liability Insurance Program Fund
Assets
Cash and investments 588,148$ 1,113,787$ 362,632$ 2,377,549$ 4,442,116$
Accounts receivable 259 - - - 259
Due from employees 4,110 - - - 4,110
Prepaid items 264,390 - - - 264,390
Total assets 856,907$ 1,113,787$ 362,632$ 2,377,549$ 4,710,875$
Deferred outflows of resources
Pension related 2,515$ 298$ 413$ 127$ 3,353$
Total deferred outflows of resources 2,515$ 298$ 413$ 127$ 3,353$
Total assets and deferred outflows
of resources 859,422$ 1,114,085$ 363,045$ 2,377,676$ 4,714,228$
Liabilities
Vouchers payable 652$ -$ 200$ -$ 852$
Accrued expenses 238,435 2,697 819 - 241,951
Net pension liability 14,197 1,681 2,334 717 18,929
Total liabilities 253,284$ 4,378$ 3,353$ 717$ 261,732$
Deferred inflows of resources
Pension related 3,809$ 451$ 626$ 192$ 5,078$
Total deferred inflows of resources 3,809$ 451$ 626$ 192$ 5,078$
Net position
Unrestricted 602,329$ 1,109,256$ 359,066$ 2,376,767$ 4,447,418$
Total net position 602,329$ 1,109,256$ 359,066$ 2,376,767$ 4,447,418$
Total liabilities, deferred inflows of
resources, and net position 859,422$ 1,114,085$ 363,045$ 2,377,676$ 4,714,228$
(147)

City of Austin, Minnesota
Combining Schedule of Revenues, Expenses, and
Changes in Net Position
Internal Service Funds - Risk Management Fund
For the Year Ended December 31, 2018
Property Workers' Sick Total Risk
Health and Compensation Leave Management
Insurance Liability Insurance Program Fund
Operating revenues
Charges for services 1,523,287$ 288,036$ 548,994$ 185,541$ 2,545,858$
Total operating revenues 1,523,287$ 288,036$ 548,994$ 185,541$ 2,545,858$
Operating expenses
Salaries and benefits 26,770$ 3,170$ 4,406$ 1,352$ 35,698$
Administrative and general 9,000 - 45,979 - 54,979
Claims 2,164,587 12,114 14,126 7,597 2,198,424
Retirement benefits - - - 121,808 121,808
Insurance premiums 389,394 291,253 361,617 - 1,042,264
Total operating expenses 2,589,751$ 306,537$ 426,128$ 130,757$ 3,453,173$
Operating income (loss) (1,066,464)$ (18,501)$ 122,866$ 54,784$ (907,315)$
Non-operating revenues
Investment income 10,156$ 8,929$ 2,020$ 21,557$ 42,662$
Other revenues
Refunds 588,367$ 14,939$ -$ -$ 603,306$
Miscellaneous 523 844 4,699 - 6,066
Total other revenues 588,890$ 15,783$ 4,699$ -$ 609,372$
Total non-operating revenues 599,046$ 24,712$ 6,719$ 21,557$ 652,034$
Net income (loss) before transfers (467,418)$ 6,211$ 129,585$ 76,341$ (255,281)$
Other financing sources (uses)
Transfers in 500,000$ -$ -$ -$ 500,000$
Transfers out - - - (500,000) (500,000)
Total other financing sources (uses) 500,000$ -$ -$ (500,000)$ -$
Change in net position 32,582$ 6,211$ 129,585$ (423,659)$ (255,281)$
Net position - beginning 569,747 1,103,045 229,481 2,800,426 4,702,699
Net position - ending 602,329$ 1,109,256$ 359,066$ 2,376,767$ 4,447,418$
(148)

Supplementary Information

General Obligation
Refunding Bonds of 2009A
Year Principal Interest Total
2019 35,000$ 13,432$ 48,432$
2020 35,000 12,243 47,243
2021 40,000 10,967 50,967
2022 40,000 9,537 49,537
2023 45,000 7,944 52,944
2024 40,000 6,350 46,350
2025 45,000 4,700 49,700
2026 45,000 2,900 47,900
2027 50,000 1,000 51,000
375,000$ 69,073$ 444,073$
City of Austin, Minnesota
Tax Increment Bonds
Debt Service Requirements to Maturity
(150)

Series 2000B Series 2010A
Year Principal Interest Total Principal Interest Total
2019 270,000$ 14,715$ 284,715$ 185,000$ 53,307$ 238,307$
2020 - - - 180,000 47,150 227,150
2021 - - - 180,000 40,400 220,400
2022 - - - 175,000 33,300 208,300
2023 - - - 170,000 25,975 195,975
2024 - - - 165,000 18,437 183,437
2025 - - - 160,000 10,924 170,924
2026 - - - 150,000 3,563 153,563
270,000$ 14,715$ 284,715$ 1,365,000$ 233,056$ 1,598,056$
City of Austin, Minnesota
General Obligation Utility Revenue Bonds
Sewer User Fund
Debt Service Requirements to Maturity
(151)

Series 2012A
Year Principal Interest Total
2019 365,000$ 75,906$ 440,906$
2020 370,000 68,606 438,606
2021 375,000 61,206 436,206
2022 385,000 53,706 438,706
2023 390,000 46,006 436,006
2024 400,000 38,206 438,206
2025 410,000 29,706 439,706
2026 415,000 20,482 435,482
2027 425,000 10,625 435,625
3,535,000$ 404,449$ 3,939,449$
Debt Service Requirements to Maturity
General Obligation Utility Revenue Bonds
City of Austin, Minnesota
Water Utility Fund
(152)

Series 2015A
Year Principal Interest Total
2019 690,000$ 520,913$ 1,210,913$
2020 710,000 499,913 1,209,913
2021 735,000 481,913 1,216,913
2022 745,000 467,113 1,212,113
2023 760,000 448,263 1,208,263
2024 785,000 425,087 1,210,087
2025 810,000 393,062 1,203,062
2026 850,000 355,813 1,205,813
2027 885,000 325,538 1,210,538
2028 910,000 298,613 1,208,613
2029 935,000 270,352 1,205,352
2030 965,000 240,062 1,205,062
2031 1,000,000 208,131 1,208,131
2032 1,030,000 174,500 1,204,500
2033 1,065,000 139,147 1,204,147
2034 1,100,000 101,925 1,201,925
2035 1,140,000 62,725 1,202,725
2036 1,180,000 21,388 1,201,388
16,295,000$ 5,434,458$ 21,729,458$
City of Austin, Minnesota
General Obligation Capital Improvement Bonds
Austin Utilities
Debt Service Requirements to Maturity
(153)

(This page intentionally left blank.)

Statistical Section This part of the City of Austin’s comprehensive annual financial report presents detailed information as a context for understanding what the information in the financial statements, note disclosures, and required supplementary information says about the government’s overall financial health.
Page
Financial Trends 157 These schedules contain trend information to help the reader
understand how the government’s financial performance and well-being have changed over time.
Revenue Capacity 162 These schedules contain information to help the reader assess the
government’s most significant local revenue source, the property tax.
Debt Capacity 166 These schedules present information to help the reader assess the
affordability of the government’s current levels of outstanding debt and the government’s ability to issue additional debt in the future.
Demographic and Economic Information 171 These schedules offer demographic and economic indicators to help the
reader understand the environment within which the government’s financial activities take place.
Operating Information 173 These schedules contain service and infrastructure data to help the
reader understand how the government’s financial report relates to the services the government provides and the activities it performs.
Sources: Unless otherwise noted, the information in these schedules is derived from the comprehensive annual financial reports for the relevant year.

(This page intentionally left blank.)

2009 2010 2011 2012 2013 2014 2015 2016 2017 2018
Governmental activities
Net investment in capital assets 82,552,219$ 84,106,625$ 89,044,134$ 92,487,056$ 96,714,082$ 112,148,907$ 117,139,070$ 122,500,058$ 127,073,132$ 128,915,686$
Restricted 4,065,139 8,397,241 8,000,415 9,224,826 9,360,960 5,378,069 5,020,295 6,214,116 6,373,158 6,780,954
Unrestricted 23,077,129 21,315,989 23,076,259 22,296,834 22,120,566 22,954,462 16,144,791 13,869,081 13,899,467 15,635,079
Total governmental activities net position 109,694,487$ 113,819,855$ 120,120,808$ 124,008,716$ 128,195,608$ 140,481,438$ 138,304,156$ 142,583,255$ 147,345,757$ 151,331,719$
Business-type activities
Net investment in capital assets 64,992,776$ 67,867,321$ 65,822,382$ 66,893,928$ 73,028,400$ 76,766,362$ 81,663,459$ 80,356,144$ 82,148,457$ 84,112,732$
Restricted 135,000 135,000 - - - - 53,703 - - -
Unrestricted 27,342,731 28,549,189 32,757,581 33,596,846 27,616,551 28,628,642 22,398,144 25,793,299 25,225,837 14,580,443
Total business-type activities net position 92,470,507$ 96,551,510$ 98,579,963$ 100,490,774$ 100,644,951$ 105,395,004$ 104,115,306$ 106,149,443$ 107,374,294$ 98,693,175$
Primary government
Net investment in capital assets 147,544,995$ 151,973,946$ 154,866,516$ 159,380,984$ 169,742,482$ 188,915,269$ 198,802,529$ 202,856,202$ 209,221,589$ 213,028,418$
Restricted 4,200,139 8,532,241 8,000,415 9,224,826 9,360,960 5,378,069 5,073,998 6,214,116 6,373,158 6,780,954
Unrestricted 50,419,860 49,865,178 55,833,840 55,893,680 49,737,117 51,583,104 38,542,935 39,662,380 39,125,304 30,215,522
Total primary government net position 202,164,994$ 210,371,365$ 218,700,771$ 224,499,490$ 228,840,559$ 245,876,442$ 242,419,462$ 248,732,698$ 254,720,051$ 250,024,894$
City of Austin, Minnesota
Net Position by Component
Last Ten Years
(accrual basis of accounting)
(157)

2009 2010 2011 2012 2013 2014 2015 2016 2017 2018
Expenses
Governmental activities:
General government 1,283,171$ 1,810,185$ 1,247,615$ 1,994,989$ 1,775,118$ 1,431,184$ 2,080,195$ 2,644,256$ 2,655,024$ 2,887,408$
Public safety 6,904,187 5,732,405 5,670,662 5,640,813 5,963,143 6,388,332 6,609,642 8,560,538 7,304,029 6,561,588
Streets and highways 4,547,299 4,694,852 4,586,371 4,671,850 4,790,336 4,831,833 5,013,859 5,580,254 5,294,742 5,270,917
Culture and recreation 3,868,810 3,902,944 4,046,580 4,141,344 4,343,675 4,443,814 4,507,566 4,929,260 5,311,447 5,213,298
Public service 380,463 384,754 361,199 308,776 453,346 89,696 383,336 382,662 375,465 387,317
Economic development 342,641 516,236 282,574 259,540 436,675 310,287 653,608 833,150 608,226 505,254
Community development 590,456 539,353 769,866 307,105 479,747 859,301 1,134,686 889,103 773,616 539,363
Interest on long-term debt 260,877 200,946 160,572 113,090 74,900 52,949 35,220 29,971 25,729 14,973
Total governmental activities
expenses 18,177,904$ 17,781,675$ 17,125,439$ 17,437,507$ 18,316,940$ 18,407,396$ 20,418,112$ 23,849,194$ 22,348,278$ 21,380,118$
Business-type activities
Sewer user 4,563,848$ 5,064,895$ 5,117,547$ 4,905,159$ 4,767,774$ 5,064,346$ 5,183,222$ 4,939,927$ 5,315,668$ 5,157,970$
Waste transfer station 22,546 35,187 50,938 34,352 30,147 29,689 30,751 34,849 39,856 31,342
Storm water utility 191,762 230,654 220,472 202,481 208,963 263,999 313,016 322,100 372,669 315,603
Electric 30,620,973 31,654,684 32,079,694 31,778,362 31,713,856 31,704,826 32,273,865 34,450,475 35,196,329 37,584,354
Water 2,679,004 2,420,400 2,619,395 2,838,536 3,522,146 3,747,554 3,892,185 3,968,228 4,420,292 4,112,784
Gas 19,099,615 18,399,817 16,684,916 13,678,763 16,842,327 22,717,982 15,017,991 14,999,868 16,565,068 15,609,175
Total business-type
activities expenses 57,177,748$ 57,805,637$ 56,772,962$ 53,437,653$ 57,085,213$ 63,528,396$ 56,711,030$ 58,715,447$ 61,909,882$ 62,811,228$
Total primary government
expenses 75,355,652$ 75,587,312$ 73,898,401$ 70,875,160$ 75,402,153$ 81,935,792$ 77,129,142$ 82,564,641$ 84,258,160$ 84,191,346$
Program Revenues
Governmental activities:
Charges for services:
General government 439,746$ 467,554$ 489,002$ 536,742$ 430,416$ 482,969$ 517,579$ 565,466$ 685,001$ 1,120,057$
Public safety 759,579 663,572 784,519 776,389 612,524 793,585 864,408 753,980 646,527 741,367
Streets and highways 30,743 10,804 20,571 10,542 16,036 15,041 7,126 15,914 36,096 42,281
Culture and recreation 521,759 598,125 567,452 538,694 522,905 497,992 536,192 558,708 565,917 584,877
Public service 16,547 41,406 34,275 30,863 38,480 38,437 41,346 37,671 39,218 39,161
Economic development 18,646 16,485 17,077 49,833 51,106 49,177 34,585 33,754 25,924 25,900
Operating grants and contributions 930,537 1,074,609 880,834 984,457 925,583 1,187,211 1,041,820 1,722,121 984,257 1,091,641
Capital grants and contributions 3,803,071 3,350,811 4,391,707 2,771,366 4,583,896 9,952,310 4,096,969 6,503,556 6,601,283 3,566,943
Total governmental activities
program revenues 6,520,628$ 6,223,366$ 7,185,437$ 5,698,886$ 7,180,946$ 13,016,722$ 7,140,025$ 10,191,170$ 9,584,223$ 7,212,227$
City of Austin, Minnesota
Changes in Net Position
Last Ten Years
(accrual basis of accounting)
(158)

Business-type activities:
Charges for services:
Sewer user 4,214,658$ 4,861,380$ 5,183,433$ 4,553,218$ 4,679,517$ 5,023,390$ 4,589,825$ 4,942,300$ 5,157,056$ 5,768,857$
Waste transfer station 73,509 78,267 76,166 71,271 66,693 65,673 20,117 6,950 25,800 42,673
Storm water utility 422,041 422,330 422,491 546,600 702,999 676,744 670,786 663,433 680,968 684,087
Electric 32,123,619 33,086,821 32,843,809 33,679,982 32,742,707 34,469,396 35,290,519 36,624,967 36,724,198 37,326,080
Water 2,592,950 2,584,965 2,606,181 2,807,120 3,705,645 3,998,961 4,282,613 4,513,791 4,801,292 4,850,518
Gas 20,194,101 19,631,575 18,342,963 14,134,078 17,401,568 24,056,300 15,896,034 15,398,491 16,479,832 17,147,060
Operating grants and contributions - - - - - - - - - -
Capital grants and contributions 1,451,131 2,230,168 100,063 584,323 448,910 90,544 2,055,241 513,175 593,434 2,596,998
Total business-type activities
program revenues 61,072,009$ 62,895,506$ 59,575,106$ 56,376,592$ 59,748,039$ 68,381,008$ 62,805,135$ 62,663,107$ 64,462,580$ 68,416,273$
Total primary government
program revenues 67,592,637$ 69,118,872$ 66,760,543$ 62,075,478$ 66,928,985$ 81,397,730$ 69,945,160$ 72,854,277$ 74,046,803$ 75,628,500$
Net (expense)/revenue
Governmental activities (11,657,276)$ (11,558,309)$ (9,940,002)$ (11,738,621)$ (11,135,994)$ (5,390,674)$ (13,278,087)$ (13,658,024)$ (12,764,055)$ (14,167,891)$
Business-type activities 3,894,261 5,089,869 2,802,144 2,938,939 2,662,826 4,852,612 6,094,105 3,947,660 2,552,698 5,605,045
Total primary government
net expense (7,763,015)$ (6,468,440)$ (7,137,858)$ (8,799,682)$ (8,473,168)$ (538,062)$ (7,183,982)$ (9,710,364)$ (10,211,357)$ (8,562,846)$
General Revenues and Other
Changes in Net Position
Governmental activities:
Property taxes 3,935,304$ 4,059,447$ 4,262,432$ 4,784,024$ 5,124,431$ 5,006,324$ 5,237,753$ 5,419,016$ 5,779,620$ 6,461,424$
Other taxes 1,782,573 1,903,140 1,821,102 1,690,449 1,771,851 2,056,861 1,918,020 1,992,858 1,376,351 1,927,168
Unrestricted grants and contributions 7,976,890 7,336,020 7,339,401 7,146,012 7,151,606 7,911,483 7,991,475 8,016,728 8,030,033 8,185,269
Unrestricted investment earnings 488,090 607,424 993,905 542,379 (445,204) 956,496 468,370 225,519 498,333 518,772
Miscellaneous 175,901 68,347 120,896 66,201 10,410 14,469 56,783 60,063 130,989 82,927
Gain (loss) on sale of capital assets 5,295 49,218 11,470 28,729 14,465 12,265 540 540 900 -
Transfers 1,637,122 1,660,081 1,691,749 1,368,735 1,695,327 1,718,606 1,722,377 2,222,399 1,710,331 1,844,615
Total governmental activities 16,001,175$ 15,683,677$ 16,240,955$ 15,626,529$ 15,322,886$ 17,676,504$ 17,395,318$ 17,937,123$ 17,526,557$ 19,020,175$
Business-type activities:
Unrestricted investment earnings 300,995$ 645,866$ 743,270$ 339,842$ (935,219)$ 1,271,026$ 410,367$ 255,417$ 382,484$ 446,212$
Miscellaneous 50 - - - 2,113 327,421 - - - -
Gain on sale of capital assets 1,341 5,349 256,347 765 119,784 17,600 68,681 53,459 - -
Transfers (1,637,122) (1,660,081) (1,691,749) (1,368,735) (1,695,327) (1,718,606) (1,722,377) (2,222,399) (1,710,331) (1,844,615)
Total business-type activities (1,334,736)$ (1,008,866)$ (692,132)$ (1,028,128)$ (2,508,649)$ (102,559)$ (1,243,329)$ (1,913,523)$ (1,327,847)$ (1,398,403)$
Total primary government 14,666,439$ 14,674,811$ 15,548,823$ 14,598,401$ 12,814,237$ 17,573,945$ 16,151,989$ 16,023,600$ 16,198,710$ 17,621,772$
Change in Net Position
Governmental activities 4,343,899$ 4,125,368$ 6,300,953$ 3,887,908$ 4,186,892$ 12,285,830$ 4,117,231$ 4,279,099$ 4,762,502$ 4,852,284$
Business-type activities 2,559,525 4,081,003 2,110,012 1,910,811 154,177 4,750,053 4,850,776 2,034,137 1,224,851 4,206,642
Total primary government 6,903,424$ 8,206,371$ 8,410,965$ 5,798,719$ 4,341,069$ 17,035,883$ 8,968,007$ 6,313,236$ 5,987,353$ 9,058,926$
(159)

City of Austin, Minnesota
Fund Balances of Governmental Funds
Last Ten Years
(modified accrual basis of accounting)
2009 2010 2011 2012 2013 2014 2015 2016 2017 2018
General Fund
Reserved 167,711$ -$ -$ -$ -$ -$ -$ -$ -$ -$
Unreserved, designated 4,756,033 - - - - - - - - -
Unreserved, undesignated 998,956 - - - - - - - - -
Nonspendable - - - - - - - - - -
Restricted - 204,965 137,726 151,149 151,172 115,975 129,924 163,374 163,810 198,825
Committed - 56,607 58,713 62,260 59,267 57,122 46,815 47,122 38,221 38,167
Assigned - 85,672 65,670 44,433 - - - - - -
Unassigned - 5,926,864 6,557,097 6,332,000 6,582,477 6,869,995 7,579,428 6,397,461 6,724,890 8,272,001
Total general fund 5,922,700$ 6,274,108$ 6,819,206$ 6,589,842$ 6,792,916$ 7,043,092$ 7,756,167$ 6,607,957$ 6,926,921$ 8,508,993$
All other governmental funds
Reserved 12,375,070$ -$ -$ -$ -$ -$ -$ -$ -$ -$
Unreserved, reported in:
Special revenue funds 418,154 - - - - - - - - -
Capital project funds - - - - - - - - - -
Permanent funds 18,119 - - - - - - - - -
Nonspendable - 957,124 789,124 721,124 531,883 886,052 961,052 970,952 136,052 136,052
Restricted - 8,137,669 7,796,624 8,901,207 9,046,910 5,095,654 4,717,919 5,552,080 5,736,559 6,126,659
Committed - 397,125 975,217 1,012,850 1,033,695 626,252 613,224 595,776 650,786 733,795
Assigned - 4,360,327 4,343,785 4,267,315 4,278,476 5,403,076 5,163,858 5,754,710 5,903,651 7,122,659
Total all other governmental funds 12,811,343$ 13,852,245$ 13,904,750$ 14,902,496$ 14,890,964$ 12,011,034$ 11,456,053$ 12,873,518$ 12,427,048$ 14,119,165$
Note: The City of Austin implemented GASB Statement 54 in 2010; schedules presenting
government-wide information include information beginning in that year.
(160)

City of Austin, Minnesota
Changes in Fund Balances of Governmental Funds
Last Ten Years
(modified accrual basis of accounting)
2009 2010 2011 2012 2013 2014 2015 2016 2017 2018
Revenues
Taxes 5,459,032$ 5,732,878$ 5,869,701$ 6,257,536$ 6,723,378$ 6,825,763$ 7,014,083$ 7,196,533$ 6,976,901$ 8,172,728$
Special assessments 803,215 678,639 853,572 864,437 762,933 808,726 846,070 705,785 988,532 801,534
Licenses and permits 436,908 340,281 455,074 488,726 346,374 455,857 586,348 467,724 405,766 476,812
Intergovernmental 11,174,267 10,244,548 11,384,402 9,699,780 11,446,161 18,120,697 10,907,846 11,633,819 11,278,358 10,967,151
Charges for services 674,900 724,386 681,187 654,270 632,923 626,056 641,566 693,694 670,218 1,043,990
Fines and forfeits 244,251 263,588 261,535 223,930 206,199 257,104 210,935 197,504 180,474 177,559
Miscellaneous 1,868,775 1,628,558 1,983,625 1,694,838 738,282 1,805,765 2,409,248 4,673,724 3,271,165 2,201,404
Total revenues 20,661,348$ 19,612,878$ 21,489,096$ 19,883,517$ 20,856,250$ 28,899,968$ 22,616,096$ 25,568,783$ 23,771,414$ 23,841,178$
Expenditures
Current
General government 1,754,641$ 1,808,092$ 1,882,533$ 1,898,437$ 1,890,867$ 1,836,120$ 1,930,264$ 2,073,258$ 2,145,323$ 2,039,277$
Public safety 5,473,884 5,313,860 5,612,721 5,685,437 6,319,790 6,196,006 6,465,704 6,676,874 6,876,792 6,467,091
Streets and highways 3,248,596 3,366,429 3,319,146 3,290,445 3,303,846 3,325,106 3,212,373 3,316,358 3,428,750 3,456,573
Culture and recreation 3,480,167 3,732,854 3,822,520 3,850,381 3,735,839 4,158,995 4,071,540 4,326,011 4,404,245 4,360,915
Public service 102,688 100,435 79,406 73,829 85,602 110,600 97,975 89,505 80,136 93,133
Economic development 206,451 138,632 158,004 166,447 300,130 217,322 206,355 231,964 519,730 270,792
Community development 305,627 452,048 70,008 20,556 13,964 44,299 60,116 287,159 2,400 -
Capital outlay 8,214,223 3,530,938 6,688,077 3,836,072 5,850,828 16,548,448 7,153,565 8,275,972 7,374,723 5,029,660
Debt service
Principal retirement 909,203 505,890 654,206 940,000 600,000 590,000 420,000 115,000 115,000 285,000
Interest and fiscal charges 346,583 248,971 226,121 196,708 188,669 150,932 491,988 629,478 112,152 256,463
Debt issuance costs 33,652 - - - - - - - - -
Total expenditures 24,075,715$ 19,198,149$ 22,512,742$ 19,958,312$ 22,289,535$ 33,177,828$ 24,109,880$ 26,021,579$ 25,059,251$ 22,258,904$
Excess (deficiency) of revenues
over (under) expenditures (3,414,367)$ 414,729$ (1,023,646)$ (74,795)$ (1,433,285)$ (4,277,860)$ (1,493,784)$ (452,796)$ (1,287,837)$ 1,582,274$
Other financing sources (uses)
Proceeds of bonds and loans 1,250,000$ -$ -$ -$ -$ -$ -$ -$ -$ -$
Premiums on bonds 19,475 - - - - - - - - -
Proceeds from sale of assets - 8,000 - - - - - - - -
Payments from escrow agent (655,000) (620,000) - - - - - - - -
Transfers in 1,985,922 1,841,568 1,744,249 2,006,177 2,684,827 2,531,156 1,957,878 2,473,051 1,780,391 1,696,915
Transfers out (419,300) (251,987) (123,000) (1,163,000) (1,060,000) (883,050) (306,000) (1,751,000) (620,060) (5,000)
Total other financing sources (uses) 2,181,097$ 977,581$ 1,621,249$ 843,177$ 1,624,827$ 1,648,106$ 1,651,878$ 722,051$ 1,160,331$ 1,691,915$
Net change in fund balance (1,233,270)$ 1,392,310$ 597,603$ 768,382$ 191,542$ (2,629,754)$ 158,094$ 269,255$ (127,506)$ 3,274,189$
Debt service as a percentage of
non capital expenditures 6.90% 4.91% 5.66% 7.13% 4.91% 4.64% 5.49% 4.34% 1.32% 3.19%
(161)

City of Austin, Minnesota
Assessed Value and Estimated Actual Value of Taxable Property
Last Ten Years
Assessed Total
Total Taxable Estimated Value (2)
as a Direct
Residential Commercial Industrial Assessed Tax Exempt Actual Percentage of Tax
Year Property Property Property Value Property (1)
Value Actual Value Rate
2010 9,042,005$ 2,324,283$ 601,761$ 11,968,049$ 3,747,579$ 1,050,592,500$ 1.50 % 34.177$
2011 9,029,233 2,314,476 594,710 11,938,419 3,747,579 1,065,729,379 1.47 36.196
2012 7,296,500 2,333,554 718,097 10,348,151 3,747,579 1,049,276,700 1.34 40.475
2013 6,155,468 3,792,528 716,134 10,664,130 3,747,579 1,049,285,500 1.37 41.431
2014 6,401,016 3,659,422 679,912 10,740,350 3,747,579 1,052,658,900 1.38 40.797
2015 7,309,849 4,293,773 846,411 12,450,033 3,747,579 1,119,132,275 1.45 40.947
2016 7,268,830 2,954,898 849,473 11,073,201 3,747,579 930,510,879 1.59 45.016
2017 7,568,979 2,843,862 808,360 11,221,201 3,747,579 1,117,958,300 1.34 48.419
2018 7,970,394 2,890,404 970,889 11,831,687 3,747,579 1,171,110,900 1.33 51.577
2019 8,493,979 3,083,360 729,253 12,306,592 3,734,102 1,230,828,400 1.30 56.613
Source: Office of County Finance Director
Note: Property in the county is reassessed annually. The county assesses property at full market value, however,
taxable assessed value is limited based upon Minnesota State Statutes. Tax rates are per $1,000 of assessed value.
(1) Tax-exempt property is not included in any of the assessed property categories.
(2) Includes tax-exempt property for the years provided.
(162)

City of Austin, Minnesota
Property Tax Rates - Direct and Overlapping Governments
(Per $1,000 of Assessed Value)
Last Ten Years
Taxes
Payable Operating Debt Service Total School Mower
Year Rate Rate Rate District County Other Total
32.867$ 1.310$ 34.177$ 21.061$ 45.155$ 1.491$ 101.884$
34.922 1.274 36.196 22.115 45.788 2.820 106.919
39.050 1.425 40.475 18.184 50.286 3.160 112.105
39.742 1.689 41.431 28.436 47.178 3.127 120.172
39.283 1.514 40.797 26.298 38.546 2.930 108.571
39.578 1.369 40.947 28.374 41.992 3.262 114.575
44.137 0.879 45.016 26.773 44.242 2.574 118.605
47.566 0.853 48.419 25.898 46.289 2.944 123.550
50.760 0.817 51.577 26.077 49.616 2.926 130.196
56.613 - 56.613 26.639 50.116 2.872 136.240
Source: Office of County Finance Director
2014
2012
2017
2019
2016
City of Austin
2018
2013
2015
2010
2011
(163)

City of Austin, Minnesota
Principal Property Taxpayers
December 31, 2018
2017/2018 2008/2009
Percentage of Percentage of
Net Tax Total Net Tax Net Tax Total Net Tax
Capacity Capacity Capacity Capacity
Taxpayer Type of Business Value Rank Value Value Rank Value
Hormel Foods Food Processor 699,970$ 1 5.92 % 494,947$ 1 4.28 %
HyVee Foods Inc. Retail Complex 195,227 2 1.65 58,813 4 0.51
Walmart Stores, Inc. Retail Complex 173,440 3 1.47 103,998 2 0.90
Austin Medical Center Clinic 156,720 4 1.32 - -
ATI Hotel Inc. Hotel 98,606 5 0.83 49,250 10 0.43
Keystone Austin 15th Ave LLC Apartments 59,673 6 0.50 - -
Jr. & R II LLC Retail Complex 59,264 7 0.50 - -
BRE Retail Residual Owner 3 LLC Retail Complex 59,250 8 0.50 - -
SMMPA Utility 57,226 9 0.48 52,988 7 0.46
Shopko Properties SPE RE LLC Retail Complex 55,920 10 0.47 49,490 9 0.43
DCA Minnesota LLC Retail Complex - - 82,928 3 0.72
Dayton Hudson Associates Apartments - - 57,090 5 0.49
Centro Saturn Holding SPE LLC Retail Complex - - 55,136 6 0.48
Oak Park Mall Limited Partnership Retail Complex - - 50,205 8 0.43
Totals 1,615,296$ 13.7 % 1,054,845$ 9.1 %
Source: Office of County Finance Director
(164)

City of Austin, Minnesota
Property Tax Levies and Collections
Last Ten Years
Collected within the Total Collections
Year of the Levy to Date
Tax Levy, As Percentage Collections in Percentage
Year Adjusted Amount of Levy Subsequent Years Amount of Levy
3,164,329$ 3,085,647$ 97.51 % 78,332$ 3,163,979$ 99.99 %
3,355,174 3,255,620 97.03 99,210 3,354,830 99.99
3,527,296 3,431,238 97.28 95,790 3,527,028 99.99
3,972,572 3,868,655 97.38 103,714 3,972,369 99.99
4,193,983 4,088,701 97.49 59,155 4,147,856 98.90
4,169,870 4,052,843 97.19 58,797 4,111,640 98.60
4,350,453 4,244,363 97.56 57,611 4,301,974 98.89
4,944,597 4,823,818 97.56 92,148 4,915,966 99.42
5,418,461 5,296,733 97.75 78,043 5,374,776 99.19
5,966,633 5,830,519 97.72 - 5,830,519 97.722018
2012
2010
2009
2014
2013
2011
2017
2016
2015
(165)

City of Austin, Minnesota
Ratios of Outstanding Debt by Type
Last Ten Years
Governmental Activities Business-Type Activities
Tax Special Capital Sewer Electric Capital Water Total Percentage
Increment Assessment Improvement Leases Utility Revenue Improvement Revenue Primary of Personal Per
Year Bonds Bonds Bonds Payable Bonds Bonds Bonds Bonds Government Income (1) Capita (1)
2,930,000$ 2,190,000$ 985,000$ -$ 6,755,000$ 315,000$ -$ -$ 13,175,000$ 0.94% 555
2,020,000 2,040,000 900,000 - 9,000,000 160,000 - - 14,120,000 0.94% 571
1,710,000 1,730,000 815,000 - 8,355,000 - - - 12,610,000 0.80% 509
1,395,000 1,105,000 - - 7,430,000 - - 5,600,000 15,530,000 0.92% 626
1,100,000 800,000 - - 6,485,000 - - 5,295,000 13,680,000 0.85% 552
800,000 510,000 - - 5,525,000 - - 4,950,000 11,785,000 0.74% 475
480,000 410,000 - - 4,535,000 - 17,986,514 4,665,293 28,076,807 1.69% 1,132
445,000 330,000 - - 3,505,000 - 17,968,939 4,309,814 26,558,753 1.53% 1,071
410,000 250,000 - - 2,435,000 - 17,286,364 3,949,334 24,330,698 1.40% 981
375,000 - - - 1,635,000 - 16,593,789 3,583,854 22,187,643 1.26% 895
Note: Details regarding the city's outstanding debt can be found in the notes to the financial statements.
(1) See the Schedule of Demographic and Economic Statistics table for personal income and population data.
Personal income data is not yet available for 2018. For purposes of this schedule, the personal
income from 2017 was used in calculating these ratios until updated figures are available.
2018
2010
2015
2014
2009
2013
2012
2017
2016
2011
(166)

City of Austin, Minnesota
Ratios of General Bonded Debt Outstanding
Last Ten Years
Less: Amounts Percentage of
Gross General Available for Debt Net General Assessed Per
Year Bonded Debt (1) Service Bonded Debt Value (2) Capita (3)
985,000$ 85,000$ 900,000$ 7.78 % 38
900,000 85,000 815,000 6.81 33
815,000 90,000 725,000 6.07 29
- - - - -
- - - - -
- - - - -
17,635,000 - 17,635,000 141.65 711
17,635,000 - 17,635,000 159.26 711
16,970,000 - 16,970,000 151.23 684
16,295,000 - 16,295,000 137.72 657
(1) Gross General Bonded Debt represents bond issues that are applicable to
Legal Debt Limit.
(2) See the Schedule of Assessed Value and Estimated Actual Value of Taxable
Property for property value data.
(3) Population data can be found in the Schedule of Demographic and Economic Statistics table.
2018
2009
2012
2011
2010
2017
2016
2015
2013
2014
(167)

City of Austin, Minnesota
Direct and Overlapping Governmental Activities Debt
December 31, 2018
Estimated
Estimated Share of
Debt Percentage Overlapping
Jurisdiction Outstanding Applicable Debt
School District #492 37,850,444 (1) 68.2% (2) 25,814,003$
Mower County 14,809,271 (1) 29.2% (3) 4,324,307
Subtotal, overlapping debt 30,138,310$
City of Austin Direct Debt (375,000)
Total direct and overlapping debt 29,763,310$
Note: Overlapping governments are those that coincide, at least in part, with the geographic boundaries of the
city. This schedule estimates the portion of the outstanding debt of those overlapping governments that is
borne by the residents and businesses of the City of Austin. This process recognizes that, when considering
the government's ability to issue and repay long-term debt, the entire debt burden borne by the residents
and businesses should be taken into account. However, this does not imply that every taxpayer is a resident,
and therefore responsible for repaying the debt of each overlapping government.
(1) Excludes the amount available in the escrow funds to repay the outstanding debt.
(2) Represents the percent of the City of Austin Net Tax Capacity to
School District #492 Net Tax Capacity.
(3) Represents the percent of the City of Austin Net Tax Capacity to
Mower County Net Tax Capacity.
(168)

City of Austin, Minnesota
Legal Debt Margin Information
Last Ten Years
2009 2010 2011 2012 2013 2014 2015 2016 2017 2018
Debt limit 30,732,984$ 34,158,417$ 31,373,331$ 31,478,565$ 31,579,767$ 33,573,968$ 27,915,326$ 33,538,749$ 35,133,327$ 36,924,852$
Total net debt applicable to limit 985,000 900,000 815,000 - - - 17,635,000 17,635,000 16,970,000 16,295,000
Legal debt margin 29,747,984$ 33,258,417$ 30,558,331$ 31,478,565$ 31,579,767$ 33,573,968$ 10,280,326$ 15,903,749$ 18,163,327$ 20,629,852$
Total net debt applicable to the limit
as a percentage of debt limit 3.31% 2.71% 2.67% 0.00% 0.00% 0.00% 171.54% 110.89% 93.43% 78.99%
Legal Debt Margin Calculation for 2017
Estimated market value, 2017/2018 1,230,828,400$
Debt limit, 3.0% of market value 36,924,852$
Debt applicable to debt limit:
Total bonded debt 21,840,000$
Less:
Obligations issued for revenue producing facilities 5,170,000
Obligations issued with tax increments 375,000
Total deductions 5,545,000$
Total debt applicable to debt limit 16,295,000
Debt margin at December 31, 2018 20,629,852$
Note: Computed in accordance with Chapter 475, State of Minnesota Statutes.
(169)

City of Austin, Minnesota
Pledged Revenue Coverage
Last Ten Years
Electric Utility Revenue Bonds
Net
Gross Available Debt Service
Revenues Expenses Revenue Principal Interest Coverage
2009 32,250,662$ 30,616,749$ 1,633,913$ 150,000$ 19,075$ 9.66 %
2010 33,367,826 31,885,333 1,482,493 155,000 13,075 8.82
2011 33,336,037 32,315,636 1,020,401 160,000 6,720 6.12
2012 33,336,037 32,315,636 1,020,401 160,000 6,720 6.12
2013 - - - - - 0.00
2014 - - - - - 0.00
2015 - - - - - 0.00
2016 - - - - - 0.00
2017 - - - - - 0.00
2018 - - - - - 0.00
Water Utility Revenue Bonds
Net
Gross Available Debt Service
Revenues Expenses Revenue Principal Interest
2009 -$ -$ -$ -$ -$ 0.00 %
2010 - - - - - 0.00
2011 - - - - - 0.00
2012 2,862,934 2,483,631 379,303 - - 0.00
2013 3,603,042 3,148,998 454,044 305,000 166,042 0.00
2014 4,133,100 3,358,990 774,110 345,000 111,106 1.70
2015 4,353,913 3,325,781 1,028,132 350,000 104,208 2.26
2016 4,567,064 3,422,222 1,144,842 350,000 97,206 2.56
2017 4,855,225 3,593,869 1,261,356 355,000 90,206 2.83
2018 4,914,730 3,429,436 1,485,294 360,000 83,106 3.35
Note: Details regarding the government's outstanding debt can be found in the notes to the
financial statements. Total revenues include interest and miscellaneous. Expenses
are operating expenses exclusive of depreciation.
Coverage
(170)

City of Austin, Minnesota
Demographic and Economic Statistics
Last Ten Years
Personal
Income Per Capita Median School Unemployment
Population (amounts expressed Income Age Enrollment Rate %
(1) in thousands) (2) (3) (4) (5)
23,726 1,401,357 36,670 40.3 4,451 6.4
24,718 1,502,443 38,340 39.6 4,507 6.6
24,779 1,584,490 40,268 39.2 4,520 5.3
24,800 1,682,174 42,725 38.3 4,582 4.5
24,800 1,617,470 41,129 36.9 4,715 3.9
24,800 1,594,035 40,537 37.4 4,797 3.2
24,800 1,657,094 42,364 37.8 4,832 2.9
24,800 1,733,905 44,274 37.7 4,901 2.9
24,800 1,756,900 44,403 37.3 5,238 2.4
24,800 Not Available Now Not Available Now 37.9 5,293 3.1
Sources:
(1) United States Census Bureau.
(2) Office of the State Demographer; which uses U.S. Department
of Commerce, Bureau of Economic Analysis, Washington, D.C.
Represents per capita income for Mower County.
(3) Office of the State Demographer; which uses U.S. Department
of Commerce, Bureau of Economic Analysis, Washington, D.C.
Represents median age for Mower County.
(4) Austin Public School District #492.
(5) Minnesota Department of Employment and Economic Development.
2011
2010
2009
2013
2012
2015
2016
2014
2017
2018
(171)

City of Austin, Minnesota
Principal Employers
Current Year and Nine Years Ago
2018 2009
Percentage of Percentage of
Total City Total City
Taxpayer Type of Business Employees Rank Employment Employees Rank Employment
Hormel Foods Food processor 2,920 1 23.9 % 1,951 1 17.1 %
Quality Pork Processors Meat packing plant 1,250 2 10.2 1,100 2 9.6
Mayo Clinic Health System Health care 970 3 8.0 700 3 6.1
Independent School District 492 Public education 926 4 7.6 675 4 5.9
Hy Vee Inc. Retail 560 5 4.6 300 8 2.6
Riverland Community College Post-secondary education 275 6 2.3 - -
Mower County County government 267 7 2.2 227 10 2.0
Walmart Stores Retail 256 8 2.1 325 6 2.8
Cedar Valley Services Residential care 230 9 1.9 - -
City of Austin Municipal government 225 10 1.8 262 9 2.3
Austin Newspapers, Inc. Publishing/Printing - - 508 5 4.5
Austin Packaging Company Food processor - - 300 7 2.6
Totals 7,879 64.6 % 6,348 55.6 %
Source: As presented in the City's official statement for each year presented above or from Austin Area Chamber of Commerce.
(172)

City of Austin, Minnesota
Full-time Equivalent City Government Employees by Function
Last Ten Years
Full-time Equivalent Employees as of December 31
2009 2010 2011 2012 2013 2014 2015 2016 2017 2018
Function/Program
General government 11.10 11.10 11.10 11.10 11.50 12.00 12.00 12.00 12.00 12.00
Public safety 48.50 48.00 48.00 48.00 48.00 49.00 49.00 51.00 51.50 53.00
Streets and highways 27.00 27.00 27.00 26.00 26.00 26.00 26.00 26.00 26.00 27.00
Culture and recreation 26.55 25.55 25.55 25.80 26.80 27.80 27.80 28.75 28.75 28.75
Sewer user 26.50 25.50 25.50 25.50 24.50 23.50 23.50 23.50 23.50 23.50
Storm water utility district - - - - - - 1.00 1.00 1.00 1.00
Electric 57.00 51.00 35.00 32.00 31.00 32.00 31.00 30.00 22.00 21.00
Water 13.00 14.00 10.00 19.00 10.00 9.00 9.00 9.00 14.00 21.00
Gas 30.00 28.00 20.00 10.00 20.00 19.00 20.00 20.00 22.00 13.00
Utilities administration (1) - - 20.00 23.00 23.00 25.00 22.00 22.00 23.00 25.00
Total 239.65 230.15 222.15 220.40 220.80 223.30 221.30 223.25 223.75 225.25
Source: Finance Department, Truth in Taxation Reports and
Austin Utilities payroll department.
(1) - Beginning in 2011 the Austin Utilities started breaking out the administrative
employees in each department.
(173)

City of Austin, Minnesota
Operating Indicators by Function
Last Ten Years
2009 2010 2011 2012 2013 2014 2015 2016 2017 2018
Function/Program
Police
Adult arrests 1,118 1,243 1,232 1,125 1,159 1,144 1,227 1,286 1,230 1,238
Juvenile arrests 528 403 589 640 395 612 450 318 429 427
Citations 6,709 5,859 5,242 4,220 4,363 4,368 4,878 4,784 4,267 4,447
Fire
Number of calls answered 385 382 394 489 547 729 900 954 944 914
Streets and highways
Asphalt purchases for street repairs
(tons) 5,000 5,000 5,000 4,400 4,400 4,400 3,925 4,500 4,500 3,920
Culture and recreation
Municipal pool admissions 12,830 15,945 15,634 16,614 15,976 12,951 16,661 11,555 10,779 11,762
Fall/Winter programs participants 490 97 92 79 78 72 136 164 156 132
Self supporting programs participants 844 746 931 995 1,085 1,219 1,166 1,654 1,530 2,163
Library annual circulation 357,907 337,609 322,318 310,928 267,394 228,045 209,693 203,303 187,368 178,293
Library-number of items held 108,068 107,091 108,169 97,136 86,190 82,834 83,415 82,875 82,604 88,756
Sewer user
Average daily sewage treatment
(thousands of gallons) 5,171 5,368 5,614 4,376 5,480 5,210 6,050 7,000 6,450 6,080
Electric
Average daily consumption
(thousands of killowatt hours) 892 925 977 961 921 910 920 928 920 925
Water
Average daily consumption
(thousands of cubic feet) 334 312 320 386 680 724 723 700 700 650
Gas
Average daily consumption
(thousands of cubic feet) 6,604 6,345 6,682 6,074 6,720 7,238 6,411 6,155 6,364 6,675
Sources: Various government departments.
Note: Indicators are not available for the general government function.
(174)

City of Austin, Minnesota
Capital Asset Statistics by Function
Last Ten Years
2009 2010 2011 2012 2013 2014 2015 2016 2017 2018
Function/Program
Public Safety:
Police:
Stations 1 1 1 1 1 1 1 1 1 1
Patrol units 20 20 20 20 20 20 20 20 20 20
Fire:
Stations 1 1 1 1 1 1 1 1 1 1
Fire/Rescue Vehicles 10 10 10 10 10 10 10 10 10 10
Streets and highways
Streets - paved and asphalt (miles) 122 126 128 126 126 126 126 126 126 126
Streets - unpaved (miles) 3 4 4 4 4 4 4 4 4 4
Culture and recreation
Nature Center acreage 507 507 507 507 507 507 518 518 518 518
Park acreage 600 600 600 600 600 600 600 600 596 596
Parks 27 27 27 27 27 27 27 27 27 27
Swimming pools 1 1 1 1 1 1 1 1 1 1
Library 1 1 1 1 1 1 1 1 1 1
Sewer
Sanitary sewers (miles) 115 119 119 119 119 119 120 120 121 121
Storm sewers (miles) 53 53 54 54 54 54 55 55 55 55
Electric
Number of substations 6 6 6 7 7 7 7 7 7 7
Water
Water mains (miles) 133.80 134.30 134.53 135.08 135.59 135.64 137.33 138.33 138.26 138.64
Gas
Gas services 10,374 10,380 10,352 10,274 10,281 10,269 10,260 10,255 10,260 10,300
Sources: Various city departments.
Note: No capital asset indicators are available for the general government function.
(175)

(This page intentionally left blank.)