
Hips don't lie – the use of benchmarking and register data to ...
84
Thesis for doctoral degree (Ph.D.) 2021 Hips don’t lie – the use of benchmarking and register data to assess the performance of orthopaedic care Fanny Goude Thesis for doctoral degree (Ph.D.) 2021 Fanny Goude Hips don’t lie – the use of benchmarking and register data to assess the performance of orthopaedic care
-
Upload
khangminh22 -
Category
Documents
-
view
7 -
download
0
Transcript of Hips don't lie – the use of benchmarking and register data to ...

Thesis for doctoral degree (Ph.D.)2021
Hips don’t lie – the use of benchmarking and register data to assess the performance of orthopaedic care
Fanny Goude
Thesis fo
r do
ctoral d
egree (Ph.D
.) 2021Fan
ny G
oud
eH
ips don’t lie – the use of benchmarking and register data
to assess the performance of orthopaedic care

From DEPARTMENT OF LEARNING, INFORMATICS, MANAGEMENT AND ETHICS
Karolinska Institutet, Stockholm, Sweden
HIPS DON’T LIE –
THE USE OF BENCHMARKING AND REGISTER DATA TO ASSESS
THE PERFORMANCE OF ORTHOPAEDIC CARE
Fanny Goude
Stockholm 2021

All previously published papers were reproduced with permission from the publisher.
Published by Karolinska Institutet.
Printed by Universitetsservice US-AB, 2021
© Fanny Goude, 2021
ISBN 978-91-8016-236-4
Cover illustration: Pontus Andersson, Pontus Art Production

Hips don’t lie – the use of benchmarking and register data to assess the performance of orthopaedic care
THESIS FOR DOCTORAL DEGREE (Ph.D.)
By
Fanny Goude
The thesis will be defended in public at Karolinska Institutet, Samuelssonsalen, Tomtebodavägen 6, Stockholm, May 28th, 2021 at 9:30 AM.
Principal Supervisor: Professor Clas Rehnberg Karolinska Institutet Department of Learning, Informatics, Management and Ethics Medical Management Centre Co-supervisor: Professor, Director Sverre A.C. Kittelsen University of Oslo Department of Health Management and Health Economics
Ragnar Frisch Centre for Economic Research
Opponent: Research Professor Kamrul Islam NORCE Norwegian Research Centre Department of Social Sciences Health Services and Health Economics
University of Bergen Department of Economics Examination Board: Professor Emeritus Gunnar Németh Karolinska Institutet Department of Molecular Medicine and Surgery Unit of Orthopaedics Associate Professor Anna Häger Glenngård Lund University School of Economics and Management Department of Business Administration Associate Professor Carl Bonander University of Gothenburg Sahlgrenska Academy School of Public Health and Community Medicine


Till min familj


POPULÄRVETENSKAPLIG SAMMANFATTNING Dagens hälso- och sjukvårdssystem står inför stora utmaningar. Dessa inkluderar ett ökat behov
av sjukvård från en åldrande och växande befolkning, variationer i vårdkvalitet mellan olika
vårdgivare, överdriven eller onödig användning av sjukvård samt ökade sjukvårdskostnader.
Det är därför viktigt att åstadkomma förbättringar inom vården och se till att de begränsade
resurserna som finns tillgängliga används på bästa möjliga sätt.
För att stödja organisationer och vårdgivare i deras förbättringsarbete kommer benchmarking,
det vill säga systematiska jämförelser, väl till användning. Benchmarking är en process där
verksamheter utvärderas i förhållande till varandra med avseende på olika resultatmått och ger
insikt i bästa praxis. På så sätt kan verksamheterna identifiera eventuella förbättringsområden.
I ett annat avseende är benchmarking också användbart för att utvärdera effekterna av hälso-
och sjukvårdsreformer.
Syftet med den här avhandlingen var att visa hur benchmarking tillsammans med ”big data”
från patient- och befolkningsregister kan tillämpas för att mäta resultat utifrån olika perspektiv
och nivåer inom hälso- och sjukvården. Bland annat ges inblick i hur benchmarking kan
användas för att identifiera och analysera variationer i resultat inom ortopedisk vård. Här
jämförs dels vårdtid och dödlighet för patienter med höftfrakturer mellan och inom sju
europeiska länder, dels produktivitetsutvecklingen för höftprotesoperationer hos
ortopedavdelningar inom Sverige. I båda jämförelserna påvisas betydande variationer i vården,
vilket indikerar att det finns utrymme för förbättringar och att beslutsfattare bör ta lärdom av
bästa praxis.
Vidare ges insyn i hur benchmarking kan användas i syfte att utvärdera sjukvårdsreformer. Här
studeras en uppmärksammad vårdvalsreform för höftprotesoperationer där konkurrens och
ekonomiska incitament introducerades i Region Stockholm. Resultaten tyder på att reformen
har medfört en kvalitetsförbättring vad gäller komplikationer efter operation. Däremot
minskade inte vårdtiden i samband med operation i samma takt som tidigare och
patientrapporterade kvalitetsmått lämnades oförändrade. Dessa resultat bidrar till den allmänna
kunskapen om effekterna av konkurrens och ekonomiska incitament och kan användas för att
informera framtida beslutsfattande.
Framtida perspektiv bör fokusera på hur informationen som erhålls med hjälp av benchmarking
kan och bör användas i praktiken för att förändra organisationers och vårdgivares beteenden i
syfte att förbättra vården.


ABSTRACT Background: Today’s healthcare systems face challenges involving rising need and demand
for healthcare as well as concerns about cost containment, misuse of medical services and
unwarranted variations in medical practices. Given the stretched budgets for healthcare, there
is a need to improve healthcare performance and to make competent use of limited resources.
To support organisations in improving performance, benchmarking is a valuable tool for
several reasons. First, it is an effective substitute for competition in the public sector. Second,
through benchmarking, performance differences between organisations in various measures
are revealed, and for those performing less optimally, possible improvement areas may be
discovered. Third, benchmarking is useful for evaluating the impact of healthcare reforms on
performance. Coupled with big data from patient registers and other administrative registers,
benchmarking thus can offer opportunities for finding ideal structures in the provision and
financing of healthcare.
Aim: The overall aim of this thesis was to show how benchmarking can be applied to assess
healthcare performance with the use of register data.
Methods: The four studies included in the thesis were based on two comprehensive patient-
level datasets, with data obtained from multiple registers. Study I applied international
benchmarking, with the performance for the surgical treatment of hip fractures being assessed
between and within seven European countries. Regression analyses were used to explore
associations between age- and sex-adjusted mortality rates and length of stay (LOS) and
selected country- and region-level variables.
In Studies II–IV, a national perspective was considered in the assessment of the performance
of elective hip replacement surgery in Sweden. In Study II, the orthopaedic departments’
productivity development between 2005 and 2012 was measured by the Malmquist
Productivity Indices. The indices were further decomposed into changes in efficiency and
technology. In Studies III and IV, a quasi-experimental research design was applied to assess
the effects of a healthcare reform involving competition and financial incentives introduced in
the capital region in 2009. In both studies, difference-in-difference analysis was used to
estimate the causal effects on LOS and various measures of subjective and objective quality.
In Study III, the difference-in-difference analyses were also stratified by hospital type to
examine whether the reform had heterogenous effects across hospital types. In Study IV, an
entropy balancing algorithm was further applied to make the intervention and control groups
comparable.
Findings: Study I revealed marked differences in age- and sex-adjusted LOS and mortality
rates for hip fracture patients, across and within included countries. Variations were found to
be associated with the availability of national clinical guidelines, the share of males in the
region and country-specific effects.
In Study II, differences in the development of productivity, efficiency and technology in the
provision of hip replacement surgery across and within the orthopaedic departments were
revealed. The overall results indicated a slight positive productivity development over the study
period, which was primarily due to catch-up effects (improvements in efficiency), rather than
changes in technology.
The findings from Study III indicated that the reform led to the LOS of the surgical admission
not decreasing at the same rate as before, and to reduction of the adverse event rate within 90
days following surgery. These effects were driven mainly by university and central hospitals.
Furthermore, the reform brought no changes in patient satisfaction with the outcome of the
surgery (Study III and Study IV) or gains in various patient-reported outcome measures at one-
and six-year follow-ups (Study IV).
Conclusions: The thesis has demonstrated how benchmarking can be applied to assess
healthcare performance with the use of register data, with the four studies contributing with
various perspectives and measurements at different levels of healthcare systems. First, the
thesis has exemplified how performance measurement can be applied to identify and analyse
performance gaps. Considerable variations in the performance of orthopaedic care between and
within units of analysis were revealed at the departmental and international levels. This implies
that there is room for improvement and that stakeholders should learn from best practices.
Second, the thesis has demonstrated how benchmarking can be useful in the assessment of
healthcare reforms. The findings indicated that the studied reform reduced the adverse event
rate, led to LOS not decreasing at the same rate as before and had no effect on patient-reported
outcome measures. These findings contribute to the general knowledge about the effects of
market elements and financial incentives and can be used to inform decisionmaking.
Future perspectives should focus on how this information can and should be used in practice
to change organisations’ behaviour and to improve healthcare performance.
Key words: performance, benchmarking, register data, quality, length of stay, mortality,
patient-reported outcome measure, productivity development, hip fracture, total hip
replacement, Europe, Sweden, competition, bundled payment, quasi-experiment

LIST OF SCIENTIFIC PAPERS I. Medin, E., Goude, F., Melberg, H.O., Tediosi, F., Belicza, E., Peltola, M.,
EuroHOPE Study Group. European regional differences in all-cause mortality and length of stay for patients with hip fracture. Health Economics, 2015;24(Suppl 2):53-64.
II. Goude, F., Garellick, G., Kittelsen, S.A.C., Nemes, S., Rehnberg, C. The productivity development of total hip arthroplasty in Sweden: a multiple registry-based longitudinal study using the Malmquist Productivity Index. BMJ Open, 2019;9(9):e028722.
III. Goude, F., Garellick, G., Kittelsen, S.A.C., Malchau, H., Peltola, M., Rehnberg, C. The effects of patient choice and bundled payment on the performance of hip replacement surgery in Stockholm, Sweden – results from a quasi-experimental study. Manuscript submitted.
IV. Goude, F., Kittelsen, S.A.C., Malchau, H., Mohaddes, M., Rehnberg, C. The effects of competition and bundled payment on patient reported outcome measures after hip replacement surgery. BMC Health Services Research, 2021;21:387.


CONTENTS Preface ..................................................................................................................................... 1
1 Introduction ..................................................................................................................... 3
1.1 Rationale for the thesis .......................................................................................... 3
1.2 Setting the scene .................................................................................................... 4
1.3 Definitions of central concepts .............................................................................. 5
2 Aim .................................................................................................................................. 9
3 Background .................................................................................................................... 11
3.1 Theoretical aspects .............................................................................................. 12
3.1.1 The market for healthcare ....................................................................... 12
3.1.2 Benchmarking ......................................................................................... 12
3.1.3 Competition and financial incentives ..................................................... 12
3.1.4 The link between measurement and improvement ................................ 13
3.2 Performance measurement in healthcare ............................................................ 14
3.2.1 A model of performance measurement .................................................. 15
3.2.2 A journey into history ............................................................................. 15
3.2.3 Methodological aspects ........................................................................... 17
3.3 Thesis building blocks ......................................................................................... 17
3.3.1 The EuroHOPE project ........................................................................... 18
3.3.2 A coordination project initiated by SHAR ............................................. 19
4 Material and methods .................................................................................................... 21
4.1 Study I .................................................................................................................. 22
4.1.1 Setting ...................................................................................................... 22
4.1.2 Data and study population ...................................................................... 23
4.1.3 Performance indicators ........................................................................... 24
4.1.4 Statistical analyses................................................................................... 24
4.2 Studies II–IV ........................................................................................................ 25
4.2.1 Setting ...................................................................................................... 25
4.2.2 Data and study population ...................................................................... 25
4.2.3 Performance indicators ........................................................................... 26
4.2.4 Statistical analyses................................................................................... 27
4.3 Ethical considerations .......................................................................................... 29
5 Findings ......................................................................................................................... 31
5.1 Performance of surgical treatment of hip fracture (Study I) .............................. 31
5.1.1 National and regional differences ........................................................... 31
5.1.2 Associations with selected country- and region-level variables ............ 31
5.2 Performance of elective hip replacement surgery (Studies II–IV) .................... 33
5.2.1 Development in productivity, efficiency and technology ...................... 33
5.2.2 Effects of competition and bundled payment ......................................... 36
6 Discussion ...................................................................................................................... 39
6.1 Key findings and interpretations ......................................................................... 39
6.1.1 International comparisons ....................................................................... 39

6.1.2 Regional comparisons ............................................................................. 39
6.1.3 Departmental comparisons ..................................................................... 41
6.2 The use of benchmarking and register data ........................................................ 41
6.3 Strengths and limitations ..................................................................................... 43
6.4 Future perspectives .............................................................................................. 44
7 Conclusions ................................................................................................................... 47
8 Acknowledgements ....................................................................................................... 49
9 References ..................................................................................................................... 55
10 Appendix ....................................................................................................................... 63
10.1 Appendix A – Questionnaire on reimbursement scheme ................................... 63
10.2 Appendix B – Changes in efficiency .................................................................. 64
10.3 Appendix C – Changes in technology ................................................................ 66

LIST OF ABBREVIATIONS
DiD Difference-in-difference
DRG Diagnosis-related group
EuroHOPE European Health Care Outcomes, Performance and Efficiency
GDP Gross domestic product
LOS Length of stay
PROM Patient-reported outcome measure
SHAR Swedish Hip Arthroplasty Register
VAS Visual analogue scale


1
PREFACE I thought I would take the opportunity to briefly describe my academic background to give the
reader a hint as to what perspective I have had in the pursuit of completing this PhD project.
As a great fan of numbers, I started with mathematics, statistics and computer science which
eventually led to a master’s in economics. After that, I became a research assistant in the Health
Economics and Policy research group at Karolinska Institutet and was immediately thrown into
the EuroHOPE project (which the reader will learn more about later). Little did I know that this
was the start of my research career. To complement my background in economics, I also took
the opportunity to pursue a master’s of medical science in health economics, policy and
management at Karolinska Institutet. A while later, I took what felt like the natural step – and
there I was, a PhD candidate.
If I benchmark my research performance today against what it was when I first started as a
research assistant, I see how it has improved and what my achievements are. I have been guided
by previous research and best practice, and learned about strengths and weaknesses, both my
own and those of research. Looking back, I see that in a way, one could say that benchmarking
has allowed me to adapt, grow and thrive through change in my research learning process. Of
course, I have no register data to back me up, so you just have to take my word for it.
Enjoy the reading!
Fanny Goude
Stockholm, April 2021

2

3
1 INTRODUCTION
‘By the adoption of the register, physicians and surgeons would obtain clearer insight
into the comparative success of their hospital and private practice; and would be incited
to a diligent investigation of the causes of such difference.’ – Sir Thomas Percival, 1803
The improvements in health within the past century has been nothing short of remarkable. The
incidence of illness and death has decreased significantly, in part because of medical
advancements towards more efficient treatment and care. Populations are thus growing and
getting older, which in turn results in increased need and demand for healthcare. The downside
of this fundamentally positive development is increased healthcare costs (1-4).
Moreover, in addition to concerns about cost containment, there are indications of over- and
undertreatment, as well as unwarranted variations in medical practices, suggesting that there is
room for improvements (4). Given the stretched budgets for healthcare, there is thus an intense
pressure on health systems to improve healthcare performance and to make competent use of
limited resources (2, 3).
To support health systems in improving performance, benchmarking, i.e., systematic
comparisons, is a valuable tool for several reasons. First, benchmarking is an effective
substitute for competition in the public sector, which is a particularly attractive feature in
healthcare markets, where market forces are largely absent due to uncertainty and information
asymmetry (5). Second, through benchmarking, performance differences between healthcare
organisations in various measures (e.g., quality and cost containment) are revealed, and for
those performing less optimally, possible improvement areas may be discovered (6). Third,
healthcare reforms are continuously being implemented, with the ultimate purpose of
improving performance. Here, too, benchmarking can be useful to evaluate their effects on
performance (7). In many ways, benchmarking thus offers opportunities to find ideal structures
in the provision and financing of healthcare.
1.1 RATIONALE FOR THE THESIS
Performance benchmarking in healthcare has been applied since the 17th century; thus, this
thesis is not the beginning. It is not an era of something new, of something unseen. However,
given the challenges that health systems face today – increasing costs, misuse of medical
services and wide variations in performance – the need for performance measurement and
transparency is perhaps greater than ever.
Benchmarking is a continuous process, constantly in search of areas that can be improved.
When combined with big data from patient registers and other administrative registers, it
provides information and knowledge that can lead to scientific findings and sustained
healthcare improvements.

4
This thesis has made use of such ‘real world evidence’ and gives insights into how
benchmarking can be applied within various contexts. First, it provides comparisons at three
levels: between countries, between regions and between departments. Second, it demonstrates
how performance measurement can be applied to both identify and analyse performance gaps,
as well as to evaluate healthcare reforms. Underlying all of these efforts was the goal to inform
decisionmaking on the part of various stakeholders (e.g., clinicians, managers and
governments), to ultimately achieve improved healthcare performance.
1.2 SETTING THE SCENE
The studies in this thesis assessed healthcare performance in two settings (illustrated in Figure
1), with different aspects and applications of performance benchmarking being demonstrated.
In both settings, a disease-based approach was adopted in the field of orthopaedic care. While
the first setting, Setting 1, focused on hip fractures, which are a major cause of morbidity and
mortality and are associated with high healthcare costs worldwide, the second setting, Setting
2, focused on elective hip replacement surgery due to osteoarthritis, another common condition.
Both conditions have been subject to policy interventions aiming to improve healthcare
performance, such as fast-track for hip fractures and patient choice for elective hip replacement
surgery in Sweden. Given this, and the increasing incidence of hip fractures and elective hip
replacement surgeries, both conditions are relevant for performance measurement.
Figure 1. Illustrative overview of the studies in the thesis.

5
Setting 1, represented in Study I, contributed with insights into international benchmarking,
where the performance for the surgical treatment of hip fractures was assessed between and
within seven European countries. The selection of relevant performance indicators was based
mainly on data availability across participating countries. The empirical data for this setting
was provided by the project entitled European Health Care Outcomes, Performance and
Efficiency (EuroHOPE), which was funded by the European Union’s Seventh Framework
Programme.
In Setting 2 (represented in Studies II–IV), the performance of elective hip replacement surgery
in Sweden was considered. Thus, a national perspective was applied. In Study II, the units of
comparison were orthopaedic departments, whereas in Study III and Study IV, the
measurement focus was shifted to the regions, to evaluate the effects of a healthcare reform
implemented in the capital region. In this setting, rich empirical data were provided by the
Swedish Hip Arthroplasty Register (SHAR) and other administrative registers, which enabled
a multidimensional assessment of performance.
1.3 DEFINITIONS OF CENTRAL CONCEPTS
A number of concepts are central to this thesis; their definitions and meanings are elucidated
below.
Benchmarking
The concept of benchmarking has been defined by several authors and organisations, with a
common theme of identifying and implementing best practices. Basically, benchmarking is a
process where the performance of various organisations is compared and differences are
revealed, with the intention of enabling organisations to improve their own performance on the
market (6). Throughout the thesis, benchmarking is used synonymously with the terms
performance measurement and (systematic) comparisons.
Performance
The concept of healthcare performance is complex and multidimensional, and incorporates
cornerstones such as equity, efficiency and several dimensions of quality of care (8).
‘Performance’ is the degree to which health systems or organisations are fulfilling these
dimensions (3).
In this thesis, performance has been assessed through various measures of quality (Studies I,
III and IV), resource use (Studies I and III) and productivity (Study II), the definitions of which
follow below.
Quality
Quality is also a complex concept with multiple dimensions. A broadly used definition of
quality in healthcare is that from the Institute of Medicine committee: ‘quality of care is the

6
degree to which health services for individuals and populations increase the likelihood of
desired health outcomes and are consistent with current professional knowledge’ (9). Although
outcome measures are highlighted in the definition, it also considers the connection between
processes of healthcare and outcomes (9).
Health outcomes refer to changes in a patient’s health condition as a result of received
healthcare. However, due to difficulties in measuring such changes, proxy indicators are often
used instead. These include measures of health status (e.g., indicators on avoidable
hospitalisations and mortality) and process of care measures (for example, indicators reflecting
utilisation, which are assumed to be related to outcomes, such as screening rates) (3).
In the thesis, a number of indicators were measured to capture various aspects of both
subjective and objective quality, including measures directly capturing outcomes (patient-
reported outcome measures (PROMs) of gains in health status and pain level in Study IV) and
proxies of outcomes (mortality in Study I, adverse events in Study III and patient satisfaction
in Study III and Study IV).
Resource use
A frequently used indicator of resource use is length of stay (LOS), which may be viewed as
an indicator of efficiency and a surrogate measure for costs. In that regard, providers with
shorter LOS are considered to be efficient in resource use, while providers with longer LOS
are inefficient (10).
In both Study I and Study III, resource use was analysed in terms of LOS.
Productivity
Although the terms productivity and efficiency – both widely used concepts in economics – are
closely related, they do differ. They are sometimes used interchangeably, but in this thesis, they
are differentiated when necessary. While productivity is a ratio that can be written in real units,
such as patients per nurse, efficiency is always defined relative to the best possible, e.g., as
95% or 100% efficient.
In Study II, performance was evaluated in terms of productivity change, which was further
decomposed into changes in efficiency and changes in technology (these concepts are defined
in the study).
Register data
Register data refer to routinely collected information on patients or population groups, that is
stored and administered in a register format (11). For example, there are patient registers which
contain data on patients and their healthcare events, and population registers which include
detailed information on, e.g., demographics. In Sweden, there are also several national quality
registers which contain data on medical interventions and outcomes following treatment for
specific patient groups (12). Furthermore, in Sweden (and many other countries), individuals

7
are identifiable in the registers, which makes it possible to track them at the individual level
through many different data sources.
We find many names for the things we love; hence, I have used many different terms for
register data in this thesis, including – but not limited to – big data, real world data and
administrative data.

8

9
2 AIM The overall research aim of the thesis was to show how benchmarking can be applied to assess
healthcare performance through the use of register data. The applications were demonstrated
in the orthopaedic care of patients with hip osteoarthritis and hip fracture. The thesis includes
four empirical studies with the following specific aims:
o Study I: To assess associations between selected country- and region-level factors and
age- and sex-adjusted mortality rates and LOS following surgical treatment of hip
fractures in seven European countries.
o Study II: To analyse the productivity development, including changes in efficiency and
technology, in the provision of hip replacement surgery in Sweden between 2005 and
2012.
o Study III: To assess the effects of a policy reform involving competition and bundled
payment on the performance of hip replacement surgery measured as LOS of surgical
admission, adverse event rate and patient satisfaction with the outcome of the surgery.
o Study IV: To examine the effects of competition and bundled payment on the perceived
quality of elective hip replacement surgery as captured by PROMs of health gain, pain
reduction and patient satisfaction with the outcome of the surgery.

10
11
3 BACKGROUND The improvements in population health during the past century have been remarkable. Many
of the main reasons for these improvements lie outside the field of healthcare, such as
improvements in water and food supply, sanitation and control of disease vectors. Economic
growth has also contributed through better nutrition and education. The health status
improvements are most apparent in declines in mortality and steady increases in life
expectancy (1). Nowadays, there are several countries with populations with an expected
lifespan of 80 years, in contrast to the situation a hundred years ago, when almost no
populations had a life expectancy of more than 50 years (13). Moreover, pharmaceutical
developments such as vaccines and antibiotics have contributed to the significant decreases in
the incidence of illness and death (1). While populations are growing and aging thanks to these
improvements, and some disease progressions are being decelerated because of medical
advancements towards more efficient treatment and care, disease profiles are changing (such
as the rise in non-communicable diseases), which in turn increases healthcare utilisation (2-4).
The downside of this fundamentally positive development is greater healthcare costs due to
increased and changed need and demand for healthcare (2-4). Adding to that are the
technological advances (e.g., diagnostic, surgical, therapeutic and imaging) in combination
with new drugs, tests and devices in standard medical practice, which further drive
expenditures (4). Furthermore, there is evidence that medicines, tests and healthcare services
are misused (provision of appropriate care, but in a way that can lead to avoidable
complications), overused (unnecessary provision of health services) and underused (absence
of necessary provision of health services) (4, 14). Additionally, there are wide variations in
medical practices which cannot be explained by the characteristics of individuals or health
status of patients, i.e., unwarranted variations. These factors also drive growing healthcare costs
(4). For instance, according to Hicks and Makary (15), a report from the Institute of Medicine
in 2012 concluded that up to a third of all US healthcare costs might be redundant and might
not improve health outcomes.
Consequently, there is an intense pressure on health systems to improve healthcare
performance and to make competent use of limited resources (2, 3). To support organisations
and systems in improving performance, benchmarking of relevant performance measures is
valuable (3, 16-18). Benchmarking can be summarised as a tool to offer organisations guidance
in feasible performance levels and an understanding of strengths and weaknesses on the market,
to promote changes and innovations as well as to deliver improvements in performance.
Additional benefits of benchmarking are its cost-effectiveness and time efficiency (6).
Moreover, benchmarking may be beneficial in the evaluation of effects of healthcare reforms
(7). In the public sector, benchmarking is further an effective substitute for competition, which
is a particularly attractive feature in healthcare markets where market forces are largely absent
due to uncertainty and information asymmetry (5).

12
3.1 THEORETICAL ASPECTS
The theory underpinning benchmarking hinges upon comparison of performance,
identification of performance gaps and changes in the management process (6). In their pursuit
of a benchmarking theory for the public sector, van Helden and Tillema (5) used elements from
both economic and institutional reasoning. The latter derives from neo-institutional and
resource dependence theories, and provides insight into motivations and processes that trigger
organisations’ responses to institutional pressures in the public sector (5). Nevertheless, as this
thesis is placed in the field of health economics, the following discussion on theoretical aspects
will be delimited to economic reasoning, with the healthcare market as point of departure.
Related empirical literature will also be highlighted.
3.1.1 The market for healthcare
Healthcare markets are characterised by several features distinguishing them from ‘perfect
markets’, including extensive government regulations, imperfect information, differentiated
products and lack of price transparency (19-21). These imperfections are mainly derived from
the high level of uncertainty and the asymmetry of information that are intrinsic to healthcare
(19, 21), as recognised by Arrow in the early 1960s (22). The institutional response to
uncertainty has been various types of third-party payer arrangements, such as national health
service (tax-funded healthcare), social insurance and voluntary insurance (23).
To alleviate market failures caused by these imperfections, market-oriented elements such as
regulated competition, financial incentives and performance measurements are being
introduced to the healthcare sector, with the ultimate goal to improve performance.
3.1.2 Benchmarking
Based on economic reasoning, in the presence of market forces, consumers can choose a
supplier in accordance with their own preferences. As the survival of poor performing suppliers
who face low demand is thus threatened, they are motivated to improve their performance (5).
However, in the absence of such forces, benchmarking has been advocated as a substitute for
the competitive mechanism in the public sector. It is argued that since benchmarking enables
consumers (patients, third-party payers, et cetera) to compare healthcare providers’ relative
performance, the providers are incentivised to improve. In the case of unwarranted
performance gaps, poorly performing providers feel pressured to improve (5, 24-26).
3.1.3 Competition and financial incentives
With inspiration from economic theory, competition and financial incentives are being
introduced to the market with the aim of correcting for market imperfections and improving
performance. However, when third-party payers are involved, such elements may themselves
introduce new problems, including risk selection and moral hazard, which need to be
considered when designing market-based reforms (19, 21, 23, 27, 28).

13
Previously, competition in healthcare was confined to the US, but in the last few decades,
competition has increasingly been introduced into European healthcare systems on either the
provider or the insurer side of the market (27, 29). In the Northern European countries, provider
competition is driven by patient choice in both hospital care and primary care. As the price for
treatment is usually fixed for all providers, there is no price competition. Instead, providers
compete in terms of quality in systems where the money follows the patient. In theory, by
offering patients a choice, providers are incentivised to improve their quality of care and
efficiency. In addition, patient choice is advocated as a means of improving responsiveness and
empowering patients (28-32). Moreover, private providers may enter the market to some
extent; however, they typically need authorisation from a public authority or insurer (30).
Various prospective payment and reimbursement schemes with different mechanisms of
financial incentives have furthermore been developed to improve provider performance. If
these are optimally designed and used under appropriate conditions, problems of risk selection
may be avoided. Examples of payment models include pay-for-performance schemes, in which
provider payments are linked to specific performance targets, and bundled payments, where
providers are given a lump sum for a defined episode of care (33-36).
The body of empirical work on the effects of market-oriented reforms in healthcare markets is
growing, but the evidence is mixed and unpredictable. Because of the complexity of reforms,
it is challenging to disentangle the effects of competition from accompanying changes in
payment mechanisms in some studies (37). Furthermore, the impact of competition is subject
to contextual settings and important market characteristics, including policy design, whether
pricing is centralised, availability of information and who makes the choice (37, 38). While
there is limited evidence from the Swedish health system (39), studies from the health systems
in the US and UK have found that competition, as theory would predict, improves quality of
care (29, 40). Nevertheless, the overall evidence suggests that choice and competition have
limited desired effects on efficiency and quality (37, 41, 42).
The evidence-based effects of financial incentives are more difficult to recapitulate due to the
large variety of payment models with different mechanisms of financial incentives, in addition
to contextual settings. Reviews within the field summarise the literature as limited (but
growing) and fragmented, with results ranging from negative (unintended) to positive effects.
This further limits generalisability and the results may be subject to methodological
weaknesses. It is therefore difficult to draw any general conclusions on the effects of financial
incentives (43-46).
3.1.4 The link between measurement and improvement
The measurement of performance is necessary, but not sufficient, for improvement.
Nevertheless, there are many possible mechanisms connecting the process of measurement to
the process of improvement. Traditional mechanisms include regulation, feedback based on
performance measurement, targets and marketplace competition. Two of the most widely

14
advocated strategies to promote improvement are public reporting of performance and pay-for-
performance programmes (47).
In their paper, Berwick et al. (48) discuss two pathways serving as stimulus for performance
improvement through the public disclosure of data. The first pathway relies on the actions of
consumers to become better informed and choose providers of higher quality. Examples of this
pathway include selection on the part of the individual patient, selective referral by practitioners
and selective contracting by third-party payers. The second pathway is about change, where
the information is used to identify areas of poor performance to help providers focus on what
can be improved (48). While public reporting has been found to have little effect on the
selection pathway, there is increasing evidence that the change pathway does stimulate
improvement activities in hospitals. Public reporting also enhances general accountability to
funders and other stakeholders, thereby stimulating improved performance (18). On the other
hand, public reporting may result in adverse unintended consequences, such as avoidance of
high-risk patients (49).
Financial incentives linked to performance are increasingly being employed to improve
performance by rewarding excellence. The effects of such pay-for-performance programmes
vary depending on their design, including which aspects of performance are targeted, how the
targets are set, how strong the connection between achievement and reward (versus penalty) is,
the extent of the incentives and whether incentives are offered at the individual or group level.
The predicted impact of these dimensions on performance, based on theory, has been further
discussed by Conrad elsewhere (50). As described above (albeit there focused on financial
incentives in general, not on pay-for-performance programmes), it is difficult to summarise the
effects of different performance incentive schemes, given their wide range. As in the case of
public reporting of data, performance incentives may potentially lead to unintended responses,
such as cream skimming and miscoding of diagnoses (50).
3.2 PERFORMANCE MEASUREMENT IN HEALTHCARE
The most important objective of health systems is to improve the health of the patients and
populations they serve. Here, ‘health’ relates to both health outcomes following treatment and
broader public health. Other key objectives of health systems are responsiveness to the
population’s expectations and preferences, provision of financial protection against cost of ill
health and efficient utilisation of resources. Moreover, health systems are complex and involve
many stakeholders (including patients, healthcare providers, managers, governments, and
citizens). The measurement of performance in healthcare seeks to monitor, assess and
communicate the degree to which the objectives are met, in order to inform the decisionmaking
of the various stakeholders (18, 51).
15
3.2.1 A model of performance measurement
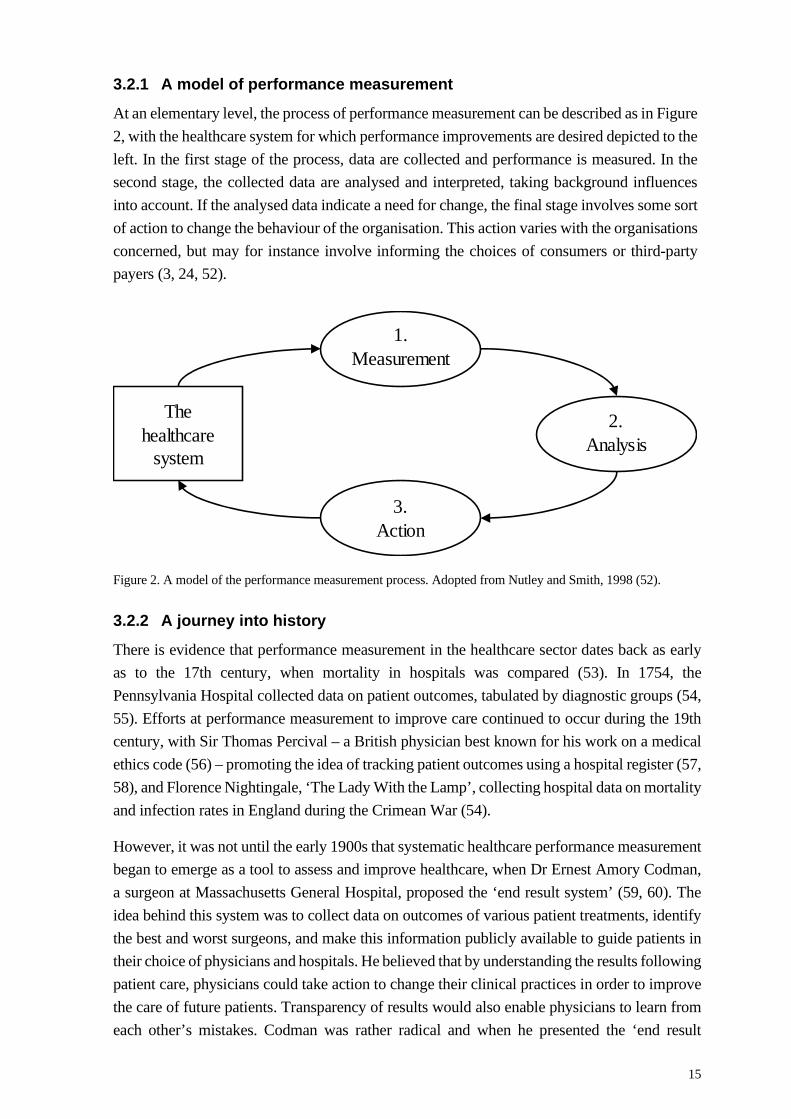
At an elementary level, the process of performance measurement can be described as in Figure
2, with the healthcare system for which performance improvements are desired depicted to the
left. In the first stage of the process, data are collected and performance is measured. In the
second stage, the collected data are analysed and interpreted, taking background influences
into account. If the analysed data indicate a need for change, the final stage involves some sort
of action to change the behaviour of the organisation. This action varies with the organisations
concerned, but may for instance involve informing the choices of consumers or third-party
payers (3, 24, 52).
Figure 2. A model of the performance measurement process. Adopted from Nutley and Smith, 1998 (52).
3.2.2 A journey into history
There is evidence that performance measurement in the healthcare sector dates back as early
as to the 17th century, when mortality in hospitals was compared (53). In 1754, the
Pennsylvania Hospital collected data on patient outcomes, tabulated by diagnostic groups (54,
55). Efforts at performance measurement to improve care continued to occur during the 19th
century, with Sir Thomas Percival – a British physician best known for his work on a medical
ethics code (56) – promoting the idea of tracking patient outcomes using a hospital register (57,
58), and Florence Nightingale, ‘The Lady With the Lamp’, collecting hospital data on mortality
and infection rates in England during the Crimean War (54).
However, it was not until the early 1900s that systematic healthcare performance measurement
began to emerge as a tool to assess and improve healthcare, when Dr Ernest Amory Codman,
a surgeon at Massachusetts General Hospital, proposed the ‘end result system’ (59, 60). The
idea behind this system was to collect data on outcomes of various patient treatments, identify
the best and worst surgeons, and make this information publicly available to guide patients in
their choice of physicians and hospitals. He believed that by understanding the results following
patient care, physicians could take action to change their clinical practices in order to improve
the care of future patients. Transparency of results would also enable physicians to learn from
each other’s mistakes. Codman was rather radical and when he presented the ‘end result
The healthcare
system
1. Measurement
2. Analysis
3. Action

16
system’ during a meeting of the local medical society, he unveiled a cartoon depicting greedy
surgeons concerned only with reimbursements associated with surgery, not with the outcomes
following the surgery (Figure 3). Needless to say, this was not well-received and Codman
resigned and opened his own hospital, which however was closed shortly thereafter. Still, the
‘end result system’ was soon incorporated by the American College of Surgeons, an association
established to improve the quality of care for patients (15, 54, 55, 61).
Figure 3. Codman’s famous cartoon – ‘The Back Bay golden goose ostrich’. The cartoon depicts an ostrich (representing the patients/public, labelled with reference to an area in Boston known as the Back Bay) with its head buried in the sand and laying golden eggs, and highlights how the fee-for-services system encouraged overtreatment and made physicians rich through poor quality care (15, 61). Held by Boston Medical Library in the Francis A. Countway Library of Medicine. Public Domain.
A century later, performance measurements are still supported by the ideas and principles of
Codman (54). In more recent history, there are several examples of international performance
benchmarking projects (53, 62, 63). For instance, the Organisation for Economic Co-operation
and Development has performed benchmarking of healthcare systems since the 1980s (63).
This work has been developed into a comprehensive database containing more than 1,200
indicators on different aspects of health systems in the member states (64). A similar example
is the work carried out by the World Health Organization, in which the overall performance of
health systems was assessed and compared between member states. The results were published
in the widely known World Health Report 2000 (51).
Furthermore, national performance measurement frameworks have been developed in many
countries. In Sweden, examples of such frameworks are the national quality registers which
systematically collect data on various patient groups. Initiated by the medical profession, the
first quality register was established in the 1970s. Nowadays, there are over a hundred quality
registers in Sweden, with the ultimate purpose to be used for continuous improvement work in
healthcare by comparing the performance of healthcare providers (65). The quality registers
have also been crucial in making ‘Regional Comparisons’ possible, another example of a
performance measurement framework in Sweden. The ‘Regional Comparisons’ concept was
developed by the National Board of Health and Welfare together with the Swedish Association

17
of Local Authorities and Regions and has been used since 2006 to compare the quality of
healthcare and social services in Sweden (66, 67).
3.2.3 Methodological aspects
Benchmarking is a continuous process and a seemingly simple endeavour with many benefits.
However, there are some challenges and potential risks involved with the benchmarking
process in the healthcare environment. One of the main issues concerns the comparison of non-
comparable units. As each healthcare provider or organisation differs, for example in terms of
mission, environment and available technology, benchmarking could be misleading if units are
benchmarked against others outside the specific area of comparison. For instance, in the
absence of proper risk adjustments which take account of healthcare providers’ different
compositions of patients, adopting what seem to be the best practice standards into one’s own
organisation might result in adopting standards from an inferior organisation (6, 54, 63).
Another challenge relates to the measurement focus and the selection of performance
indicators. There are several dimensions and subcategories of health system performance, and
depending on the specific objective of a comparison, the selected indicators may focus on the
measurement of, for example, health outcomes, responsiveness or efficiency. This is also
connected to the availability and quality of the data, which often vary across different settings,
and may thus be an issue (54, 63). Campbell and colleagues (68) raise a few important points
related to developing or applying indicators, including which stakeholder perspective(s) the
indicators are intended to reflect and what aspects of healthcare should be measured. Further,
although it may never be possible to develop an error-free indicator, indicators should in so far
as possible exhibit the features of acceptability, feasibility, reliability, sensitivity to change and
validity (68).
Other methodological aspects relate to the levels of comparison and assessment. In the field of
benchmarking in healthcare, comparisons can be made at either an international level, i.e.,
between healthcare systems, or at the country level, i.e., within a given system. Furthermore,
the comparisons can be based on data derived from different levels or strata within the
healthcare system, such as individual practitioners, primary care centres, pharmacies, hospitals,
districts and regions, the disease or condition level, or the country level. Also, comparisons can
be made at one time point or over time and within or between units (63).
3.3 THESIS BUILDING BLOCKS
The thesis was based on two large-scale projects: the EuroHOPE project and a coordination
project initiated by SHAR, which were previously referred to as Settings 1 and 2, respectively
(Figure 1). These projects are briefly described below.

18
3.3.1 The EuroHOPE project
The EuroHOPE research project was launched in 2010. The project was a collaboration
between seven European countries (Finland, Hungary, Italy, the Netherlands, Norway,
Scotland and Sweden) and was financed by the European Union’s Seventh Framework
Programme during 2010–2014. The overall aim of EuroHOPE was to evaluate the performance
of healthcare systems in terms of quality and use of resources. Based on linkable patient-level
data gathered from multiple national registers and other data sources, the project took on a
disease-based approach by considering five disease groups: ischemic stroke, hip fracture, acute
myocardial infarction, breast cancer, and very low birth weight and preterm infants. A sub-
sector level approach was also applied by using patient-level register data from the Nordic
countries, with the specific objective to examine healthcare productivity (69).
In a first step, performance indicators and methods, such as standardised risk adjustment
procedures, suitable for intra- and international register-based healthcare benchmarking, were
developed. National disease-specific databases appropriate for this type of performance
measurement and comparison were further created (Figure 4). Detailed descriptions of the data,
indicators and methods are available on the project’s web page (www.eurohope.info). In a
second step, Europe-wide benchmarking of various performance indicators was performed.
Variations in the performance between and within participating countries were described and
reasons behind the variations were explored. Further, the relationship between costs and
outcomes was investigated (69).
Figure 4. The creation of the EuroHOPE databases. Adopted from Häkkinen et al., 2013 (69).
An important general finding from the project was that the observed differences in performance
at the country, region and hospital levels could not be explained by the demand and supply
variables included (such as age structure, gross domestic product (GDP) per capita, education,

19
unemployment, density of population and concentration of hospital care). This indicated that
there was room for performance improvement, which underlines the significance of
benchmarking. The project concluded that this type of standardised data collection and
comparisons was highly feasible. However, to have an impact on healthcare performance, the
process would need to be carried out routinely (70, 71). After the end of the EuroHOPE project,
the work continued as part of the BRIDGE Health project (BRidging Information and Data
Generation for Evidence-based Health policy and research), supported by the European
Union’s Health Programme (www.bridge-health.eu).
3.3.2 A coordination project initiated by SHAR
In 1979, SHAR (which has recently decided to merge with the Swedish Knee Arthroplasty
Register and form the Swedish Arthroplasty Register) started their data collection, making it
one of the oldest national quality registers for healthcare in Sweden. The data are collected at
the patient level from all orthopaedic departments in the country, both public and private
providers, and used for performance measurements and comparisons. Each year, the results are
presented in publicly available reports with the objective to map surgical techniques,
complications and patient-experienced results in order to improve the care of patients
undergoing hip replacement surgery (72).
Central to this thesis was a research database created in a coordination project initiated by
SHAR in 2014. Within this project, data were collected from multiple national registers
provided by SHAR, the National Board of Health and Welfare and Statistics Sweden. The data
were linked at the patient level and encompassed information on around 300,000 operations
between 1992 and 2013, with long-term follow-up. The database has since been extended to
include patients who have undergone surgery in more recent years.
The research database was created to foster analyses of the departments and their activities as
well as clinical research. It has served as a starting point for clinical improvement work and
several research projects, including a major part of this thesis. The cooperation process as well
as the details of the database (hereafter referred to as the SHAR coordination research database)
are described more fully in Cnudde et al. (7).

20

21
4 MATERIAL AND METHODS The thesis includes four studies, all of which were observational and retrospective. Some
aspects of the research design were similar between the studies, such as the use of register data
and quantitative analysis, while other aspects differed, such as the empirical setting and level
of analysis. Study I was conducted in an international context and was based on the EuroHOPE
research database (Setting 1). The study aimed at comparing the performance for the surgical
treatment of hip fractures. Studies II–IV were conducted in the Swedish context and were all
based on the SHAR coordination research database (Setting 2). While Study II was focused on
the productivity development of hip replacement surgery at orthopaedic departments in
Sweden, Studies III and IV aimed at investigating the effects on various performance indicators
of a regional reform involving competition and bundled payment for hip replacement surgery.
In these different research approaches, various statistical methods were applied. An overview
of the characteristics of Studies I–IV is presented in Table 1.

22
Table 1. Overview of study characteristics.
Study I Study II Study III Study IV
Study focus Associations between selected country- and region-level factors and mortality rates and LOS
Productivity development, including changes in efficiency and technology
Effects of competition and bundled payment on LOS, adverse event rate and patient satisfaction
Effects of competition and bundled payment on PROMs
Study setting Hospital inpatient care in seven European countries
Orthopaedic care at 65 departments in Sweden
Orthopaedic care in Sweden, reform involving competition and bundled payment in Region Stockholm
Orthopaedic care in Sweden, reform involving competition and bundled payment in Region Stockholm
Study design Register-based, cross-sectional
Register-based, longitudinal
Register-based, repeated cross-sections, quasi-experimental
Register-based, repeated cross-sections, quasi-experimental
Study population Surgically treated hip fracture patients
Patients who underwent elective hip replacement surgery due to osteoarthritis
Patients who underwent elective hip replacement surgery due to osteoarthritis
Low-risk patients who underwent elective hip replacement surgery due to osteoarthritis
Data collection Register data (national patient and mortality registers), 2007 (2009 in Norway)
Register data (SHAR, national patient register), 2005–2012
Register data (SHAR, LISA, national patient and mortality register), 2005–2012
Register data (SHAR, LISA, national patient and mortality register), 2008–2012
Data analysis Regression analysis Malmquist Productivity Index
DiD analysis Entropy balancing, DiD analysis
Notes: LISA, Longitudinal Integrated Database for Health Insurance and Labour Market Studies.
4.1 STUDY I
4.1.1 Setting
Hip fracture is a serious injury that is common worldwide. It was estimated that 1.6 million hip
fractures occurred globally in 2000 (73) and the number is expected to reach 6.3 million by
2050 (74). Hip fractures are an important cause of morbidity and mortality, especially in the
elderly population. Furthermore, hip fractures are associated with high medical care costs.
In Study I, the performance for the surgical treatment of hip fractures was studied in the
following seven European countries: Finland, Hungary, Italy (one region and one town), the
23
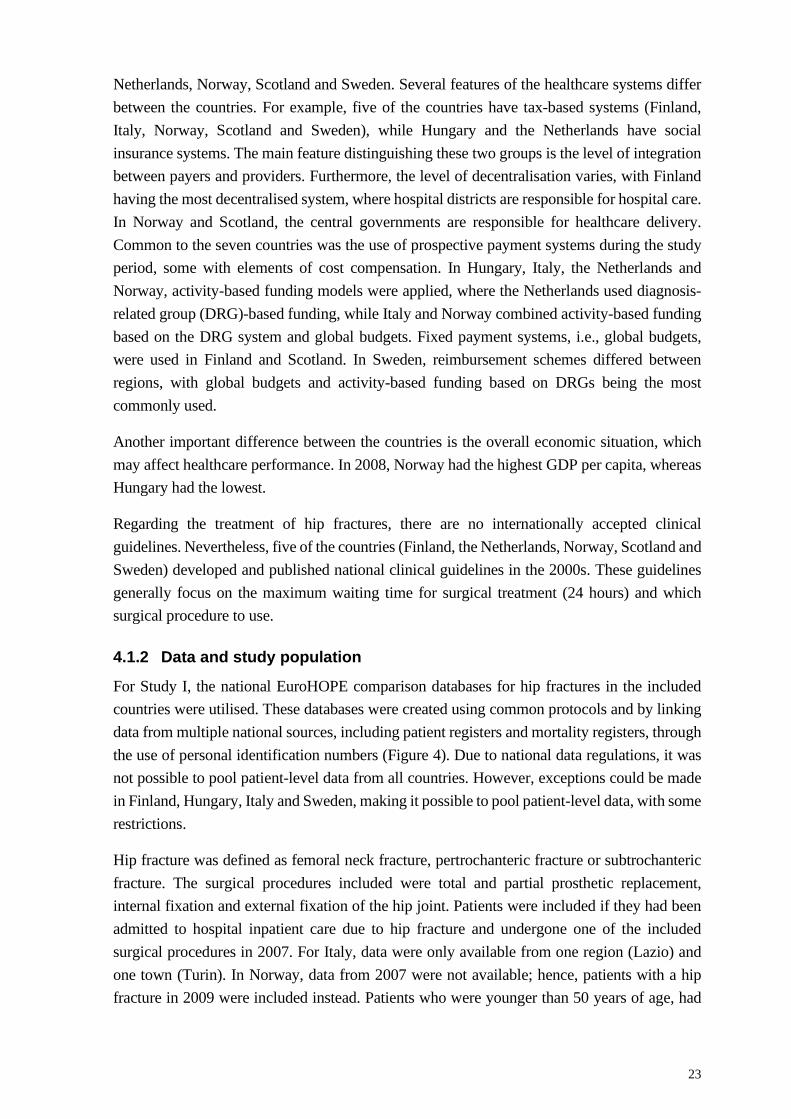
Netherlands, Norway, Scotland and Sweden. Several features of the healthcare systems differ
between the countries. For example, five of the countries have tax-based systems (Finland,
Italy, Norway, Scotland and Sweden), while Hungary and the Netherlands have social
insurance systems. The main feature distinguishing these two groups is the level of integration
between payers and providers. Furthermore, the level of decentralisation varies, with Finland
having the most decentralised system, where hospital districts are responsible for hospital care.
In Norway and Scotland, the central governments are responsible for healthcare delivery.
Common to the seven countries was the use of prospective payment systems during the study
period, some with elements of cost compensation. In Hungary, Italy, the Netherlands and
Norway, activity-based funding models were applied, where the Netherlands used diagnosis-
related group (DRG)-based funding, while Italy and Norway combined activity-based funding
based on the DRG system and global budgets. Fixed payment systems, i.e., global budgets,
were used in Finland and Scotland. In Sweden, reimbursement schemes differed between
regions, with global budgets and activity-based funding based on DRGs being the most
commonly used.
Another important difference between the countries is the overall economic situation, which
may affect healthcare performance. In 2008, Norway had the highest GDP per capita, whereas
Hungary had the lowest.
Regarding the treatment of hip fractures, there are no internationally accepted clinical
guidelines. Nevertheless, five of the countries (Finland, the Netherlands, Norway, Scotland and
Sweden) developed and published national clinical guidelines in the 2000s. These guidelines
generally focus on the maximum waiting time for surgical treatment (24 hours) and which
surgical procedure to use.
4.1.2 Data and study population
For Study I, the national EuroHOPE comparison databases for hip fractures in the included
countries were utilised. These databases were created using common protocols and by linking
data from multiple national sources, including patient registers and mortality registers, through
the use of personal identification numbers (Figure 4). Due to national data regulations, it was
not possible to pool patient-level data from all countries. However, exceptions could be made
in Finland, Hungary, Italy and Sweden, making it possible to pool patient-level data, with some
restrictions.
Hip fracture was defined as femoral neck fracture, pertrochanteric fracture or subtrochanteric
fracture. The surgical procedures included were total and partial prosthetic replacement,
internal fixation and external fixation of the hip joint. Patients were included if they had been
admitted to hospital inpatient care due to hip fracture and undergone one of the included
surgical procedures in 2007. For Italy, data were only available from one region (Lazio) and
one town (Turin). In Norway, data from 2007 were not available; hence, patients with a hip
fracture in 2009 were included instead. Patients who were younger than 50 years of age, had

24
an extremely long LOS or had incomplete personal identification numbers, as well as tourists,
were excluded from the study.
In addition, variables at the country (funding type and availability of national clinical
guidelines) and region level (GDP per capita, population density, Herfindahl-Hirschman index
(a common measure of market concentration), the number of hip fracture cases among those
above 50 years per 100,000 inhabitants, and share of males) were collected from the statistical
database of the Organisation for Economic Co-operation and Development and from national
statistics bureaus. Regions in Finland, Italy, the Netherlands, Norway, Scotland and Sweden
refer to local authorities responsible for healthcare, while regions in Hungary are based on a
regional governmental division. Regions with incomplete data or fewer than 100 hip fractures
were excluded.
4.1.3 Performance indicators
The performance for the surgical treatment of hip fractures was compared across and within
the seven countries in Study I. Performance was measured as 30-day and one-year all-cause
mortality rates and LOS of the first hospital episode in acute care (including hospital transfers)
and during a follow-up period of 365 days following hip fracture.
4.1.4 Statistical analyses
The national comparison databases were used to calculate aggregate region-level risk-adjusted
performance indicators. For each region, age- and sex-adjusted mortality rates and LOS were
calculated based on the ratio between observed and predicted values. The pooled patient-level
data from Finland, Hungary, Italy and Sweden were used in negative binomial regression
models (logistic regression) to calculate coefficients in order to predict mortality rates and LOS.
To determine how much of the variance of the indicators was attributable to cross-country
differences and regional differences, respectively, one-way random effects analysis of variance
models were applied.
Region-level analyses were performed to assess associations between the risk-adjusted
indicators and the aforementioned country- and region-level variables. To assess the
associations between indicators and explanatory variables, fixed (M1) and random effects
models (M2) were applied. The Hausman test was used to select the most appropriate model
of these two. A third model (M3) was further applied where the country-level fixed effects
(country indicators) were replaced with fixed-effects variables for funding type and availability
of clinical guidelines.

25
4.2 STUDIES II–IV
4.2.1 Setting
Total hip replacement surgery is a common procedure worldwide. In Sweden, more than
18,000 hip replacements surgeries are performed every year, with the majority of the patients
suffering from osteoarthritis (72). With an increasing incidence, and an aging and growing
population, the number of surgeries is expected to rise (75).
The 21 regions in Sweden are responsible for the funding and delivery of healthcare, through
a decentralised tax-based healthcare system. Specialised somatic care, such as hip replacement
surgery, is usually provided by region-owned hospitals, but also by privately owned, often
specialised, hospitals which are publicly regulated and financed. There are roughly 75
orthopaedic providers performing hip replacement surgery, and these can be grouped as
university, central or local hospitals and private specialised centres. They are in general
reimbursed through the DRG model, either as a basis for a budget or as activity-based funding.
In Study II, the productivity development of the orthopaedic departments providing total hip
replacement surgery in Sweden was analysed. In Studies III and IV, the focus shifted from the
level of departments to Region Stockholm, where a competition-promoting reform changed the
market for hip and knee replacement surgery in 2009. Prior to the reform, patients were
traditionally referred to and treated by the region-owned hospitals. However, with the reform,
private providers were invited to the market through accreditation and low-risk profile patients
were allowed to choose provider, thus creating competition for patients. In addition, the reform
also introduced a bundled payment model for the reimbursement of providers. In this model,
providers are given a single payment to cover costs for a defined episode of care, including
surgery, pre- and post-operative care, and adverse events. Previously, a DRG-based
arrangement was used (76). Apart from empowering the patient to make a choice, the reform
sought to improve quality and efficiency by means of competition and economic incentives, as
well as to increase access in order to shorten waiting times.
4.2.2 Data and study population
Studies II–IV were all based on the SHAR coordination research database. Common for the
studies was the inclusion of patients who underwent elective total hip replacement due to
osteoarthritis. Patients younger than 18 years, who underwent bilateral hip replacement or who
had a prior hip replacement within 90 days of the surgery were excluded. Patients with missing
information essential for the analyses (for example, patients with a missing or incorrect DRG
code in Study II, and patients with missing information on any of the included confounders in
Studies III and IV) were also excluded.
In Study II, SHAR was used to identify and obtain data on patients who underwent surgery
between 2005 and 2012. For each patient, administrative data on their hospital inpatient stays
related to the surgery were retrieved from the national patient register. All orthopaedic
departments in Sweden were eligible for inclusion in the study. However, a few of them had to

26
be excluded due to inabilities to match their data between SHAR and the national patient
register, no or low completeness in the national patient register, or their entering (exiting) of
the market during the last (first) year of the study period. Moreover, departments that were
affected by reorganisations during the study period, such as mergers and splits, were considered
to be the same unit during the entire study period. A total of 65 departments were included in
the analysis after these exclusions. The departments’ production-related costs were provided
by the National Board of Health and Welfare and the Swedish Association of Local Authorities
and Regions through their cost per patient database (77).
In Studies III and IV, patients who underwent surgery in a region other than their registered
residential region and patients at a private specialised centre in Stockholm that mainly operates
on privately insured patients and therefore was not affected by the reform were further
excluded. In Study III, patients who underwent surgery in 2005–2012 were included and data
were retrieved from SHAR (information about the surgery and patient), the national patient
register (information on hospital inpatient stays related to the surgery and previous use of
inpatient care), the national mortality register (information on deaths) and the Swedish
Longitudinal Integrated Database for Health Insurance and Labour Market Studies
(information on patient demographics). Study IV included patients between 2008 and 2012.
Additional inclusion criteria in Study IV were that the patients were at low risk (American
Society of Anaesthesiologists grades 1 or 2) and thus covered by the reform, and had a body
mass index between 15 and 50. Data on the surgery and PROMs, previous use of inpatient care,
and patient demographics were collected from SHAR, the national patient register and the
Swedish Longitudinal Integrated Database for Health Insurance and Labour Market Studies,
respectively.
For Studies III and IV, a questionnaire (provided in Appendix A, in Swedish) was sent out to
all regions to gather information regarding how the providers were reimbursed for this type of
surgical procedure. Furthermore, I held an interview with one of the representatives from the
third-party payer that was involved in designing the reform, in order to gain a better
understanding of what prompted the reform and how it worked in practice. Moreover, to
understand the perspective of a hip replacement patient, I followed a patient during one day,
from hospital admission to surgery and recovery. The following day, I made another visit to
see how the patient was feeling and how the discharge was planned.
4.2.3 Performance indicators
In Study II, the departments’ development in productivity in the provision of total hip
replacement surgery was assessed by relating the number of surgeries to the costs associated
with the surgeries. The productivity development was also decomposed into changes in
efficiency and technology.
The performance indicators in Studies III and IV were selected to provide a multidimensional
assessment of the effects of the reform. While Study III captured aspects of resource use (LOS
of surgical admission) and quality, based on both medical outcomes (adverse events within 90

27
days following surgery) and PROMs (share of patients satisfied with the outcome of the
surgery), Study IV focused on hip replacement surgery quality as captured by PROMs of health
gain (indicated by the EQ-5D index and a visual analogue scale (VAS) for health status), pain
reduction (VAS) and level of satisfaction (VAS) one and six years post-surgery.
4.2.4 Statistical analyses
To measure the productivity development in Study II, the input and outputs in the orthopaedic
departments’ production function were first defined. The single input was defined as the
estimated departmental costs associated with hip replacement surgery. These costs consisted
of a fixed cost for the surgery, a variable cost corresponding to the LOS of the surgical
admission, and costs of any adverse events within 90 days following surgery. The fixed and
variable costs of the surgery were estimated using national averages for the DRGs which
include hip replacement surgery, whereas the costs for adverse events were calculated using
DRG weights corresponding to the specific diagnoses of the adverse events. The numbers of
non-cemented, hybrid and cemented hip replacements were defined as three different outputs.
The input and outputs were then summarised by department and year.
Second, following the approach developed by Färe et al. (78), input-oriented Malmquist
Productivity Indices to measure the productivity development were calculated. These indices
have a few attractive properties, including that information on input or output prices is not
required in their construction and there is no need for an assumption regarding the
organisations’ behaviour (e.g., profit maximisation or cost minimisation), which is useful in
situations where such information is missing. Another desirable feature is that the indices can
be decomposed into economically relevant components of productivity change: changes in
efficiency and technology, respectively (79).
Furthermore, as costs defined the input, cost-based Malmquist indices were constructed (80).
The indices were calculated by relating changes in each of the departments’ production from
one year to the next, and by comparing the production to the production frontier of the so-called
best practice. Because of innovation and technological change, this frontier shifts over time.
The indices of productivity change can accordingly be decomposed into efficiency change and
technological change, where the former is associated with changes in the departments’
observed production relative to the maximum potential production (‘the catch-up effect’) and
the latter is associated with shifts in the frontier (78, 80).
To test the null hypothesis of no change in productivity, efficiency and technology, a bootstrap
technique was applied (81, 82). In the sensitivity analyses, variations in the cost calculations,
different model specifications, and outlier removals were applied. The calculations of the
Malmquist indices were performed in the R software using the FEAR package (83).
Studies III and IV were quasi-experimental studies in which the commonly used difference-in-
difference (DiD) analytical framework was applied to estimate causal effects of the reform.
Within this framework, changes in an outcome before and after an intervention for a treatment
group are compared with changes of the same outcome for a control group. It is assumed that

28
unobservable confounders that vary across groups are fixed over time, and thus cancel each
other out, which allows for identification of treatment effects while controlling for these
unobservable confounders (although without explicitly measuring them). Moreover,
unobservable confounders that vary over time are assumed to be fixed between groups. Thus,
in the absence of the intervention, the groups would have experienced the same changes in
outcomes. This is referred to as the parallel trend assumption (84-87).
Since the reform was introduced only in Region Stockholm (at least during the study period),
patients in this area formed the intervention group, while patients in other regions formed the
control group. Repeated cross-sections were constructed and the data were collapsed into two
periods, pre-reform (2005–2008 in Study III and 2008 in Study IV) and post-reform (2009–
2012 in both studies), to avoid issues of serially correlated outcomes (88). In both studies, and
for all performance indicators, the DiD analyses were performed using regression modelling,
with and without controlling for confounders. Generalised estimating equations were used to
solve linear regression models, while accounting for clustering of patients within hospitals. All
statistical analyses were performed using the SAS software, version 9.4 (89).
In Study III, the mean outcomes per year and group were plotted to validate the assumption of
parallel trends. The assumption was also tested in simple linear trend models by assessing the
significance of the interaction between time and group in the pre-reform period (85). The
following confounders were included in Study III: sex, age group, educational level, civil
status, and level of comorbidity as indicated by Elixhauser Comorbidity Index. In Study III,
the DiD analyses were further stratified by hospital type (university, central and local hospitals
and private specialised centres) to examine whether the reform had heterogenous effects across
various hospital types with differences in patient case mix. To test the robustness of the results,
various sub-samples of low-risk patients and patients from regions with a similar hospital
structure as Stockholm were considered.
In Study IV, the assumption of parallel trends could not be investigated due to data being
available only from 2008. Instead, entropy balancing was used prior to the DiD analyses to
account for potential time-varying confounding (90). Entropy balancing is a data pre-
processing method which makes use of a reweighting scheme to create weights for all
observations so that the confounder distributions in the reweighted treatment and control
groups satisfy a set of prespecified balance constraints. In this process, differences in the
distributions with respect to the first, second or higher moments are precisely adjusted for (91,
92). The entropy balancing algorithm was applied to achieve balance in the mean and variance
of observable characteristics between the treatment and control groups. The algorithm was
applied three times to make the patients in Stockholm in the pre-period and the patients in the
control group in the pre- and post-periods comparable to the patients in Stockholm in the post-
period (90, 93). The following confounders were included: sex, age, body mass index,
American Society of Anaesthesiologists grade, Charnley classification (a patient self-reported
comorbidity grouping for walking ability), surgical approach, level of comorbidity as indicated
by Elixhauser Comorbidity Index, civil status, educational level, and pre-operative values of

29
each respective PROM (satisfaction excluded, as it was measured only post-operatively).
Moreover, the balancing was performed separately for each outcome and follow-up period.
The balance was assessed by comparing weighted means and variances of the confounders.
The DiD analyses in Study IV were thereafter performed using weighted regression modelling
with the weights produced by the entropy balancing, with and without controlling for the same
set of confounders used in the balancing algorithm (90, 94). In a first sensitivity analysis,
inverse probability of treatment weighing to create balance between the groups was applied
(95). In a second sensitivity analysis, the entropy balancing scheme was simplified and
estimated weights so that the treatment groups would be balanced, although without
considering the time dimension (i.e., the algorithm was applied twice: first, to make the patients
in the pre-period control group comparable to the patients in Stockholm in the pre-period;
second, to make the patients in the post-period control group comparable to the patients in
Stockholm in the post-period).
4.3 ETHICAL CONSIDERATIONS
For Study I, the Regional Ethics Review Board in Stockholm, Sweden, approved the part of
the research carried out in Sweden (reference number 2011/213-31). Similar ethical approvals
were applied for (and granted) in the other countries. Ethical approvals for Studies II–IV were
granted by the Regional Ethics Review Board in Gothenburg, Sweden (reference numbers 271-
14, T695-14 and 2020-00072).
The thesis, consisting of four register-based studies, was based on two comprehensive patient-
level datasets containing sensitive information on patients with hip osteoarthritis and hip
fracture. The data were collected from multiple national registers and were linked by the
responsible government agencies through use of personal identification numbers. Thereafter,
the data were pseudonymised before being distributed to the researchers involved in the two
projects that form the basis for this thesis.
In register-based research, ethical aspects concern the role of informed consent and the
protection of the integrity of study participants. Although the Declaration of Helsinki states that
informed consent from study participants is required to conduct research (96), it is generally
not a requirement for large-scale, register-based studies. As discussed by Ludvigsson et al. (97),
arguments for this include that the large number of study participants makes it difficult, if not
impossible, to obtain consent from all participants. The costs for this process would also be
unreasonable. Moreover, requirements of consent would likely result in significantly reduced
participation rates and lead to severe selection bias in specific groups (e.g., among immigrants
and children). Provided that the research is ethically sound, it is assumed that study participants
do not object to register-based research (97). For these reasons, the need for informed consent
in register-based research is generally waived by an ethics review committee, as was the case
for the studies included in this thesis.

30
The registration of patients in national quality registers, such as SHAR, can be related to what
is mentioned above. At registration, patients are informed that their data may be used for
research. Should a patient wish to opt out, the patient can do so at any time and have their
record deleted, in accordance with the Swedish Patient Data Act (98).
To protect the integrity of study participants, precautionary measures have been taken in the
performance of the studies included herein. First, the datasets were pseudonymised before
being transferred to the researchers. Thus, data containing personal information that would
have made it possible to identify individuals, such as name, personal identification number and
address, were at no stage processed by the researchers. Second, the data were stored on
password-protected servers and could only be accessed by the researchers involved in the
project. Third, the studies did not involve any contact between researchers and study
participants. Fourth, the datasets were relatively large and all results were presented at an
aggregated level, meaning that the risk of individual identification may be considered
negligible.
It should also be noted that during the work related to this thesis, I was employed by the Centre
for Health Economics, Informatics and Health Services Research in Region Stockholm. This
may constitute a potential risk of conflict of interest regarding Study III and Study IV, as these
studies analysed the impact of a political reform undertaken within and by the region. On the
other hand, the Centre for Health Economics, Informatics and Health Care Research operates
independently from the region and has strong connections to the academic world, and the
studies followed a strictly academic process in their design and execution.
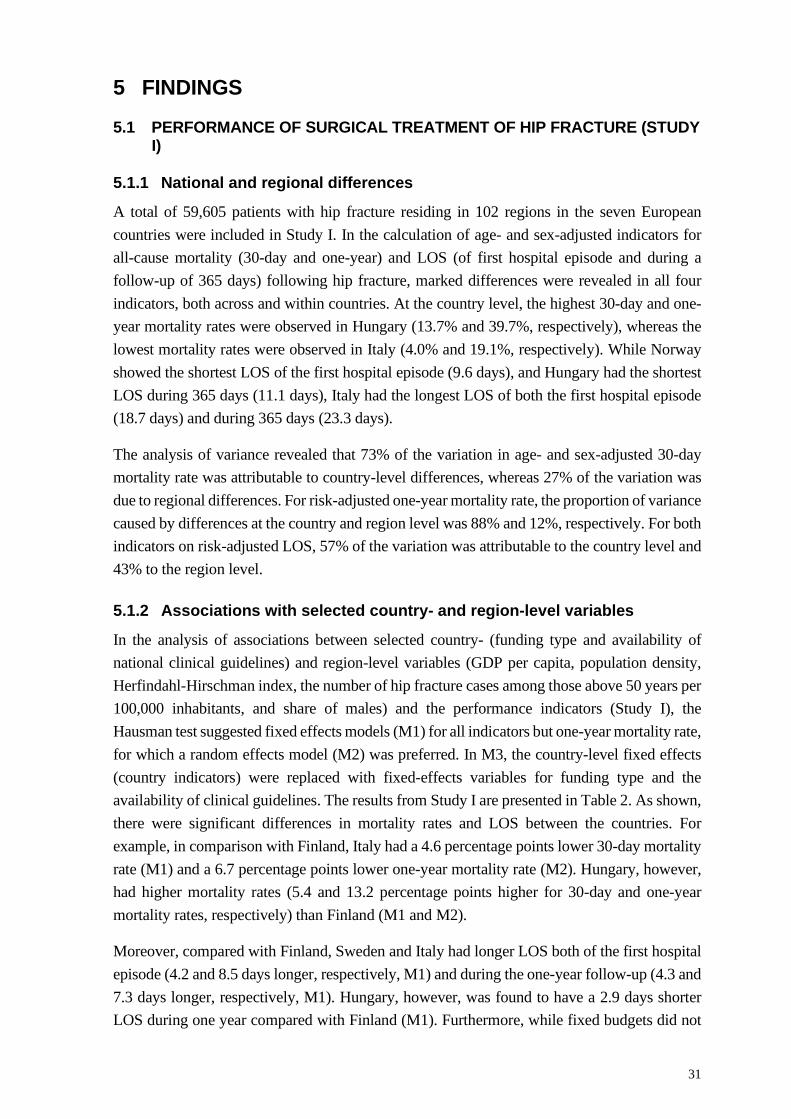
31
5 FINDINGS
5.1 PERFORMANCE OF SURGICAL TREATMENT OF HIP FRACTU RE (STUDY I)
5.1.1 National and regional differences
A total of 59,605 patients with hip fracture residing in 102 regions in the seven European
countries were included in Study I. In the calculation of age- and sex-adjusted indicators for
all-cause mortality (30-day and one-year) and LOS (of first hospital episode and during a
follow-up of 365 days) following hip fracture, marked differences were revealed in all four
indicators, both across and within countries. At the country level, the highest 30-day and one-
year mortality rates were observed in Hungary (13.7% and 39.7%, respectively), whereas the
lowest mortality rates were observed in Italy (4.0% and 19.1%, respectively). While Norway
showed the shortest LOS of the first hospital episode (9.6 days), and Hungary had the shortest
LOS during 365 days (11.1 days), Italy had the longest LOS of both the first hospital episode
(18.7 days) and during 365 days (23.3 days).
The analysis of variance revealed that 73% of the variation in age- and sex-adjusted 30-day
mortality rate was attributable to country-level differences, whereas 27% of the variation was
due to regional differences. For risk-adjusted one-year mortality rate, the proportion of variance
caused by differences at the country and region level was 88% and 12%, respectively. For both
indicators on risk-adjusted LOS, 57% of the variation was attributable to the country level and
43% to the region level.
5.1.2 Associations with selected country- and regio n-level variables
In the analysis of associations between selected country- (funding type and availability of
national clinical guidelines) and region-level variables (GDP per capita, population density,
Herfindahl-Hirschman index, the number of hip fracture cases among those above 50 years per
100,000 inhabitants, and share of males) and the performance indicators (Study I), the
Hausman test suggested fixed effects models (M1) for all indicators but one-year mortality rate,
for which a random effects model (M2) was preferred. In M3, the country-level fixed effects
(country indicators) were replaced with fixed-effects variables for funding type and the
availability of clinical guidelines. The results from Study I are presented in Table 2. As shown,
there were significant differences in mortality rates and LOS between the countries. For
example, in comparison with Finland, Italy had a 4.6 percentage points lower 30-day mortality
rate (M1) and a 6.7 percentage points lower one-year mortality rate (M2). Hungary, however,
had higher mortality rates (5.4 and 13.2 percentage points higher for 30-day and one-year
mortality rates, respectively) than Finland (M1 and M2).
Moreover, compared with Finland, Sweden and Italy had longer LOS both of the first hospital
episode (4.2 and 8.5 days longer, respectively, M1) and during the one-year follow-up (4.3 and
7.3 days longer, respectively, M1). Hungary, however, was found to have a 2.9 days shorter
LOS during one year compared with Finland (M1). Furthermore, while fixed budgets did not

32
have any significant effect on any of the indicators, the availability of clinical guidelines was
associated with decreased mortality rates (between 3.9 and 9.9 percentage points) and 4.2 days
longer LOS during one year (M3).
At the regional level, a higher share of males was found to be associated with a higher 30-day
mortality rate and shorter LOS (M3).
Table 2. Results from fixed and random effects models.
30-day
mortality rate One-year
mortality rate LOS
first episode LOS
during 365 days
M1 M3 M2 M3 M1 M3 M1 M3 Intercept 12.58*** 7.84** 26.04*** 30.80*** 10.23* 29.76*** 15.13** 23.99***
(3.11) (2.81) (4.46) (5.55) (4.22) (3.59) (4.83) (3.90) GDP/capita -0.00 -0.01 -0.01 -0.01 0.00 -0.01 0.01 0.00
(0.00) (0.00) (0.00) (0.01) (0.00) (0.01) (0.01) (0.01) Population density -0.00 -0.03 0.04 -0.05 -0.01 0.02 -0.02 0.02
(0.03) (0.04) (0.04) (0.08) (0.04) (0.05) (0.04) (0.06) HHI -1.16 -1.32 -1.18 -3.18 -0.61 -1.81 -0.43 0.21
(0.98) (1.29) (1.43) (2.54) (1.33) (1.64) (1.52) (1.78) Share hip fractures -0.04 -0.07 0.00 -0.06 -0.04 0.05 -0.02 0.08
(0.04) (0.05) (0.06) (0.10) (0.05) (0.06) (0.06) (0.07) Share males -0.10 0.20* 0.05 0.30 -0.02 -0.54*** 0.00 -0.34**
(0.09) (0.09) (0.13) (0.17) (0.12) (0.11) (0.13) (0.12) Fixed budget 0.61 2.68 -0.28 -1.90
(0.72) (1.43) (0.92) (1.00) Clinical guidelines -3.94*** -9.91*** 2.09 4.21**
(1.00) (1.98) (1.28) (1.39) Country indicators Sweden -1.31* -3.11 4.23*** 4.28*** (0.64) (2.46) (0.86) (0.99) Hungary 5.40*** 13.24*** 1.35 -2.92* (0.87) (1.06) (1.18) (1.35) Italy -4.57*** -6.74** 8.51*** 7.27*** (1.22) (2.37) (1.65) (1.89) Netherlands -1.09 -2.11 3.35** 1.60 (0.92) (11.63) (1.24) (1.42) Norway -0.43 -2.72 -1.14 0.09 (0.84) (3.49) (1.14) (1.30) Scotland -1.23 3.40*** 7.54*** 2.61 (0.94) (0.86) (1.28) (1.46) Finland -1.96 (1.06) Adj. R-squared 0.72 0.43 0.03 0.53 0.57 0.22 0.53 0.22 F statistics 23.53*** 11.13*** 0.24 16.32*** 12.68*** 4.86*** 10.79*** 4.95***
Notes: * p ≤ 0.05, ** p ≤ 0.01, *** p ≤ 0.001. M1 = fixed effects model, M2 = random effects model, M3 = fixed effects model. HHI, Herfindahl-Hirschman index.

33
5.2 PERFORMANCE OF ELECTIVE HIP REPLACEMENT SURGERY (STUDIES II–IV)
5.2.1 Development in productivity, efficiency and t echnology
The productivity development of the provision of total hip replacement surgery between 2005
and 2012 was evaluated in Study II. The productivity development, measured by Malmquist
Productivity Indices, was further decomposed into changes in efficiency and technology. A
total of 65 orthopaedic departments providing total hip replacement surgery was included in
the study. The average number of surgeries per department increased over time: from 157
surgeries on average in 2005 to 187 surgeries on average in 2012. Regarding the input variable
(costs of hip replacements), no clear trends were observable. While the highest total cost for
the average department was observed in 2009, the lowest total cost was observed in 2006.
However, the mean cost of a single hip replacement surgery decreased over time: from SEK
93,000 in 2005 to SEK 83,000 in 2012. Approximately 4–5% of the operations per year were
followed by an adverse event.
The overall results from the study are presented graphically in Figure 5, where averages of
changes in productivity (Malmquist Productivity Index), efficiency and technology are shown.
The averages were calculated as the geometric mean of the results from the 65 departments.
The error bars represent 95% confidence intervals. A value above one indicates progress
between two consecutive years, whereas a value below one indicates regress. A value of 1
means no change.
Figure 5. A graphical representation of the results of productivity change (Malmquist Productivity Index) and its components. A value = 1 indicates no change between two consecutive years, > 1 indicates progress and < 1 indicates regress. The error bars represent 95% confidence intervals.
1.41.10.2
-20.0
-15.0
-10.0
-5.0
0.0
5.0
10.0
15.0
20.0
25.0
30.0
2005/2006 2006/2007 2007/2008 2008/2009 2009/2010 2010/2011 2011/2012 Mean
Change, %
Productivity change (Malmquist Productivity Index) Efficiency change Technological change

34
As presented in Figure 5, an average productivity increase of 1.4% per year was noted over the
study period. This development was due mainly to changes in efficiency (1.1%), rather than
changes in technology (0.2%). The results broken down by year show that productivity
progress was found in three periods (ranging from 1.6% to 27.0%), whereas a regress was
found in four periods (ranging from 0.8% to 12.1%). These changes were statistically
significant. Furthermore, efficiency improved significantly in two periods (between 2.6% and
8.7%) and deteriorated significantly in one period (3.9%). Significant progress in technology
was achieved in three periods (ranging from 3.2% to 16.9%), whereas a significant regress was
experienced in two periods (between 10.2% and 12.6%).
The department-specific Malmquist indices are presented in Table 3, whereas changes in
efficiency and technology are presented in Appendix B and C, respectively. Inspection of the
results shows that none of the orthopaedic departments had continuous progress or regress in
productivity, efficiency or technology during the study period.
Table 3. Malmquist productivity indices; mean (geometric), 2005–2012, 65 departments.
Department 2005/2006 2006/2007 2007/2008 2008/2009 2009/2010 2010/2011 2011/2012
1 0.911 0.945* 0.924* 1.124* 1.120* 0.993 0.941*
2 1.231* 0.858* 0.851* 1.005 1.218* 0.925* 0.992*
3 1.300* 0.760* 0.914* 0.972 1.044* 0.974 0.989
4 1.308* 0.817* 0.848* 0.951* 1.108* 1.015 0.960*
5 1.323* 0.887* 0.981* 0.971* 1.041* 0.978 0.952*
6 1.206* 0.897* 0.936* 0.941* 1.060* 1.034* 0.967*
7 1.371* 0.868* 0.872* 1.034* 1.173* 1.037 0.934*
8 1.359* 0.874* 0.971* 0.969* 1.106* 0.971* 0.974*
9 1.352* 1.047 0.988* 0.965* 1.086* 0.929* 1.013*
10 1.259* 0.946* 0.817* 1.005 1.109* 0.997 0.937*
11 1.257* 0.796* 0.857* 1.008* 1.100* 1.089* 0.984*
12 1.358* 0.871* 0.902* 0.808* 1.228* 1.070* 0.967*
13 1.196* 0.882* 0.846* 1.021* 1.078* 1.122* 0.964*
14 1.214* 1.047 0.863 1.038 1.023* 0.979 1.002
15 1.317* 0.894* 0.873* 0.939* 1.131* 0.971* 1.016
16 1.338* 0.892* 0.905* 0.969* 1.209* 1.026 0.957*
17 1.375* 0.888* 0.929* 0.987* 1.193* 1.110* 0.896*
18 1.363* 0.861* 0.895* 1.038* 1.170* 1.033* 1.046*
19 1.064* 0.946* 0.920* 0.976* 1.052 1.002 0.994
20 1.254* 0.815* 0.911* 1.022* 1.105* 1.034* 1.074*
21 1.280* 0.906* 0.953* 0.994 1.060* 1.037* 0.956*
22 1.236* 0.897* 0.821* 1.006* 1.151* 1.179* 1.034*
23 1.275* 0.806* 0.966* 1.087* 1.091* 1.045* 0.932*
24 1.307* 0.867* 0.904* 1.008* 1.153* 0.939* 0.886*
25 1.190* 0.850* 0.925* 0.974 1.016* 1.011* 1.031*
26 1.303* 1.057 0.767* 1.051* 0.994 1.017 0.938*
27 1.154* 1.011 0.988 0.856* 0.999 0.988 0.987*
28 1.272* 0.907* 0.920* 0.878* 1.067* 0.959 1.013
29 1.202* 0.936* 0.889* 0.954* 1.070* 1.002 1.015

35
Department 2005/2006 2006/2007 2007/2008 2008/2009 2009/2010 2010/2011 2011/2012
30 1.313* 0.790* 0.882* 1.031* 1.253* 0.982 1.135*
31 1.319* 0.804* 0.923* 0.920* 1.150* 1.027* 0.952*
32 0.975 1.031 0.864* 1.032* 1.131* 0.913 1.039
33 1.232* 0.806* 0.927* 0.960* 1.289* 0.964* 1.090*
34 1.187* 0.924* 0.868* 0.981* 1.073* 1.066* 0.996
35 1.188* 0.881* 0.949* 1.058* 1.123* 1.024* 0.982
36 1.689* 0.682* 0.943* 1.028* 1.197* 1.062* 0.907*
37 1.217* 0.828* 0.952* 0.966* 1.085* 0.922* 0.946*
38 1.285* 0.926* 0.944* 0.993 1.035* 1.050* 0.871*
39 1.186* 0.859* 0.888* 1.026* 1.078* 1.021* 0.965*
40 1.417* 0.880* 0.861* 0.990* 1.154* 1.123* 0.993*
41 1.351* 0.831* 0.960* 1.022* 1.127* 1.026* 0.991
42 1.166* 1.013 0.852* 0.987 1.276* 0.932* 1.012
43 1.261* 1.221* 0.657* 1.045* 1.096* 1.138* 1.037*
44 1.105* 0.922* 0.900* 0.855* 1.298* 0.977* 1.029
45 1.325* 0.856* 0.912* 1.008* 1.071* 1.070* 1.087*
46 1.307* 0.820* 0.920* 0.924* 1.071* 1.007 1.015*
47 1.297* 0.894* 0.963* 1.010 0.967 1.048* 1.050*
48 1.331* 0.859* 0.794* 1.035* 1.106* 1.084* 0.979*
49 1.250* 0.878* 0.929* 1.015* 1.076* 1.006* 0.908*
50 1.581* 0.885* 0.803* 1.067* 1.076* 0.981* 0.962*
51 1.306* 0.882* 0.859* 1.053* 1.089* 0.988* 0.956*
52 1.331* 0.852* 0.901* 0.997 1.124* 0.984 0.999
53 1.235* 0.839* 0.912* 0.945* 1.118* 1.009 0.997
54 1.321* 0.866* 0.809* 0.914* 1.044* 1.058* 0.947*
55 1.270* 0.807* 0.871* 0.912* 1.133* 0.970* 1.005
56 1.400* 0.819* 1.009 0.964* 1.076* 1.053 1.009
57 1.412* 0.878* 1.011 1.045 1.211* 0.967* 0.993*
58 1.160* 0.873* 0.770* 1.204* 0.964 1.076* 0.894*
59 1.343* 0.845* 0.937* 0.946* 1.100* 1.020* 0.966*
60 1.344* 0.897* 0.818* 0.922* 1.230* 1.078* 1.043*
61 1.279* 0.827* 0.925* 1.169* 1.146* 1.054* 0.986*
62 1.245* 0.841* 0.898* 1.040* 1.085* 0.927* 1.028*
63 1.223* 0.838* 0.907* 0.971* 1.101* 1.051* 0.953*
64 1.236* 0.831* 0.927* 0.991 1.138* 0.969* 0.942*
65 1.229* 0.823* 0.934* 1.038* 1.069* 1.071* 0.966*
Geometric mean 1.270* 0.879* 0.895* 0.992* 1.110* 1.016* 0.983* Notes: The numbers show annual change between two consecutive years, = 1 indicates no change, > 1 indicates progress, < 1 indicates regress. * indicates statistically significantly different from 1.0 at 95% level.
The sensitivity analyses showed that the overall results were rather robust; productivity slightly
increased over the study period in all models, with efficiency changes being the main
contributor to this progress.

36
5.2.2 Effects of competition and bundled payment
In Studies III and IV, the effects of competition and bundled payment on the performance of
hip replacement surgery were evaluated. Several performance indicators were investigated to
provide a multidimensional assessment of the reform. A total of 85,275 observations were
included in the main analysis of Study III, whereas 36,627 observations were included in the
analysis of PROMs with a one-year follow-up (Study IV) and 18,145 observations were
included for the six-year follow-up PROMs (Study IV). Table 4 presents how the observations
were divided by group and period.
Table 4. Number of observations included in Study III and Study IV.
Stockholm
(treatment group) Other regions
(control group)
Pre-reform Post-reform Pre-reform Post-reform
Study III
LOS of surgical admission 6,380 8,190 32,799 37,906 Adverse events within 90 days 6,380 8,190 32,799 37,906 Share of satisfied patients 2,581 7,512 14,235 34,686
Study IV
One-year follow-up PROMs 1,143 5,420 4,785 25,279
Six-year follow-up PROMs 1,004 2,259 4,205 10,677 Notes: In Study III, pre-reform = 2005–2008 (2007–2008 for share of satisfied patients). In Study IV, pre-reform = 2008. In both Study III and Study IV, post-reform = 2009–2012.
Descriptive statistics showed that the resource use, measured as LOS of surgical admission,
declined over time (Study III) in both Stockholm (treatment group) and the other regions
(control group). This can also be seen in Figure 6a. Patients in the control group had a longer
LOS than patients in Stockholm, both before and after the reform. However, they approached
Stockholm’s level over time. Moreover, visual inspection of the trend of LOS (Figure 6a) and
a statistical test validated the assumption of common trends prior to the reform. In the analysis
of the effects of the introduction of competition and bundled payment in Stockholm, the results
revealed that LOS increased in relation to the control group (Study III). However, as Figure 6a
shows, LOS has still slightly decreased after the reform in Stockholm. As indicated in Table 5,
the risk-adjusted decrease in LOS was 0.7 days lower (baseline LOS of 5.8 days) in Stockholm
in comparison with the control group. In the analysis stratified by hospital type, it was revealed
that this effect was driven mainly by university and central hospitals.

37
Figure 6a-c. Performance indicators per group over time and corresponding counterfactuals. The vertical reference line indicates the introduction of the reform.
The assumption of common trends for adverse event rates before the reform was also confirmed
by visual inspection (Figure 6b) and a statistical test (Study III). Prior to the reform, the control
group clearly had a lower rate of adverse events according to descriptive statistics and Figure
6b. However, while the control group experienced only a marginal decrease in their rate over
time, Stockholm experienced a rather sharp reduction in the adverse event rate post-reform.
The DiD analysis confirmed this, and indicated that the reform led to a significant decrease of
1.6–1.8 percentage points (Table 5) in the adverse event rate (baseline rate of 6.3 percent).
Again, this effect was driven mainly by university and central hospitals according to the
analysis stratified by hospital type.
Regarding the indicators on patient satisfaction with the outcome of the surgery, both the share
of patients who were satisfied (Study III) and the level of satisfaction (Study IV) were similar
across treatment groups and remained quite stable over time. As information regarding patient
satisfaction was available only from 2007 (i.e., two years before the reform) in Study III, it was
difficult to shed light on the validity of common trends (Figure 6c). Therefore, the results
should be interpreted with caution. Nevertheless, in Study IV, balance in the included
confounders was successfully achieved through the entropy balancing. This means that the
results are more reliable, since time-varying confounding, which could affect the groups’ trends
differently, is accounted for. According to the DiD analyses in Studies III and IV, patient
satisfaction was not affected by the introduction of competition and bundled payment (Table
5).
01
23
45
67
8D
ays
2005 2006 2007 2008 2009 2010 2011 2012
a. LOS of surgical admission
01
23
45
67
%
2005 2006 2007 2008 2009 2010 2011 2012
b. Adverse events within 90 days
8085
9095
100
%
2007 2008 2009 2010 2011 2012
c. Share of satisfied patients
Stockholm Other regions Counterfactual

38
Similarly, Study IV showed that gains in EQ-5D index and health status as indicated on a VAS
as well as pain reduction as indicated on a VAS after hip replacement surgery in Stockholm
were comparable to those in the control group, at both one- and six-year follow-up. These
indicators did not change over time. Again, the entropy balancing was successful in creating
balance between the groups. Results from the DiD analyses indicated that the reform did not
have any effect on these indicators.
The sensitivity analyses showed that the results in both studies were robust.
Table 5. Results from DiD analyses. Unadjusted Adjusted Performance indicators DiD estimate Std. err. DiD estimate Std. err.
Resource use
LOS of surgical admission 0.594** 0.271 0.669*** 0.258 Quality
Medical outcomes, 90-day follow-up
Adverse event rate -0.018*** 0.006 -0.016** 0.007 PROMs, one-year follow-up
Gain EQ-5D index -0.004 0.017 -0.003 0.011
Gain health status VAS -0.202 1.129 -0.203 0.688
Reduction pain VAS 0.195 1.751 0.073 0.991
Share of satisfied patients (Study III) 0.320 1.296 0.310 1.366
Level of satisfaction VAS (Study IV) -0.008 0.016 -0.010 0.017
PROMs, six-year follow-up
Gain EQ-5D index 0.011 0.015 0.012 0.010
Gain health status VAS 1.317 1.575 1.238 1.455
Reduction pain VAS 0.715 1.747 0.650 0.974
Level of satisfaction VAS (Study IV) 0.437 1.150 0.431 1.159 Notes: * p ≤ 0.1, ** p ≤ 0.05, *** p ≤ 0.01. Std. err., standard error.

39
6 DISCUSSION This thesis has shown how benchmarking can be applied to assess healthcare performance with
the use of register data, and contributes with different aspects and applications of performance
benchmarking. First, it has provided comparisons at three levels: between countries, between
regions and between departments. Second, it has demonstrated how performance measurement
can be applied to both identify and analyse performance gaps, as well as to assess healthcare
reforms.
In the following sections, the key findings of the empirical studies are presented and
interpreted. This is followed by a discussion on the use of benchmarking and register data to
assess healthcare performance. Next, strengths and limitations are highlighted. Lastly, future
perspectives are reflected upon.
6.1 KEY FINDINGS AND INTERPRETATIONS
6.1.1 International comparisons
At the international level, the systematic comparisons revealed marked differences in LOS and
mortality rates for hip fracture patients, both across and within included countries, after
adjustment for patients' age and sex (Study I). Variations in the performance were found to be
associated with the availability of national clinical guidelines, share of males in the region and
country-specific effects. As expected, countries with developed and available clinical
guidelines as well as regions with larger share of males performed better in terms of lower
mortality rates. This indicates that there is room for improvement, and that policymakers,
managers and clinicians should learn from best practices. For example, countries that have not
yet introduced national clinical guidelines should perhaps do so.
There are several important factors that may further explain these differences. However, these
were not possible to examine in the study. For example, different surgical methods and
rehabilitation practices for various types of fractures may contribute to variations in LOS (99).
Moreover, there has been efforts in the surgical and medical management of hip fracture
patients which are believed to reduce mortality. These include a focus on timely surgical
intervention, weight-bearing exercises earlier in the care trajectory, improved surgical devices
and increased rates of discharge to non-acute healthcare facilities rather than discharge to home
(100), and may further explain differences in mortality rates. In addition, pre-operative waiting
time is an important factor which could affect both mortality and LOS (101, 102).
6.1.2 Regional comparisons
In Study III and Study IV, regional differences in the adoption of a reform were exploited to
assess its effects on the performance of hip replacement surgery. The reform was implemented
in the capital region, but not in the other Swedish regions (at least not during the study period),
and involved competition and bundled payment. Together, the two studies provided a
40
multidimensional assessment of the reform, as several performance indicators were measured
and investigated.
The main findings from these studies indicated that the reform led to the LOS of the surgical
admission not decreasing at the same rate as before, and to successful reduction of the adverse
event rate within 90 days following surgery (Study III). The analyses stratified by hospital type
in Study III indicated that the effect on LOS was driven by lower decreases in LOS at university
and central hospitals. This may be an effect of what qualitative studies have shown: a separation
of low- and high-risk patients, where acute hospitals treat high-risk patients and private
specialised centres treat low-risk patients (103). The decrease in the adverse event rate was also
found to be specifically derived from improved rates at university and central hospitals.
Furthermore, the reform brought no changes in patient satisfaction with the outcome of the
surgery (Study III and Study IV) or gains in PROMs at one- and six-year follow-ups (Study
IV).
Taken together, the findings from Study III and Study IV have several important implications.
First, the results can be interpreted on the basis of the incentives that are embedded in the
bundled payment model. Within the new model, providers are reimbursed a fixed price per
patient to cover costs for all services included in the bundle, including pre-operative
diagnostics, implant costs, surgery and post-operative care. Furthermore, providers are
financially accountable for any complications (adverse events) within two years (up to five
years in case of infections), through a complication guarantee. As part of the bundled payment,
providers may also be remunerated through a performance payment of a few percentage points,
if they achieve certain performance targets, such as a minimum share of patients who
experience improved quality of life and pain relief one year after surgery. Compared with other
payment models where providers are reimbursed for each service and thus not financially
accountable for post-operative activities, providers have stronger incentives to focus on quality
with the bundled payment, perhaps at the disbursement of higher resource use, such as LOS.
This might explain the Study III findings of a lower decrease in LOS and reduced adverse event
rate in Stockholm after the reform. Further, due to how the bundled payment was structured,
the incentive for avoiding negative outcomes, such as adverse events, was stronger than that
for improving PROMs, which may explain the findings of the lack of effects on PROMs in
Study IV.
Second, ‘having a new hip’ is presumably the driver behind the majority of potential gains in
PROMs (especially after a year, when a patient is likely to have forgotten how bad they felt at
the time of surgery) and due to the bounded nature of these gains, the PROMs can only improve
up to a certain limit. As the PROMs were at a relatively satisfactory level prior to the reform,
it was thus perhaps not expected to see improvements in these measures. Further, had there
been any minor gains, they would probably have appeared shortly after surgery.
Third, it is expected that adverse events will have a direct effect on PROMs, at least in their
immediate aftermath. The seemingly contradictory finding of reduced adverse event rate, but
no gains in PROMs, may also be explained by the timing discrepancy.

41
6.1.3 Departmental comparisons
In the productivity analysis of hip replacement surgery, differences in the development of
productivity, efficiency and technology across and within orthopaedic departments were
revealed (Study II). There were, however, no distinct departments that were continuously
efficient and simultaneously pushing the production frontier outwards. In other words, none of
the departments were identified as ‘technical’ leaders.
Furthermore, the overall results indicated a slight positive productivity development between
2005 and 2012. When this was decomposed, the progress was seen to primarily be due to catch-
up effects, i.e., improvements in efficiency, rather than changes in technology. As previously
mentioned, SHAR believes in transparency and publishes yearly reports containing
performance measures from all orthopaedic departments in Sweden, with the ultimate goal to
improve performance. In addition, data are to some extent accessible online through SHAR’s
website. With the help of these data and reports, individual departments can compare their
results with others. Should a department underperform, reasons for this may be investigated
and, based on that information, measures can be taken. Thus, the practice of public
benchmarking may have contributed to the observed catch-up effect.
In order to improve overall productivity, variations need to be addressed and reduced by
improving the performance of the least productive units.
6.2 THE USE OF BENCHMARKING AND REGISTER DATA
Benchmarking is recognised as an option in various parts of the healthcare system, including
for resource funding, public reporting, administrative control, and improvement of clinical
practice. Its versatility is one of the reasons why performance benchmarking is so popular
(104). It is a rather straightforward process with many benefits: in its simplest form, all that is
required is a means of collecting and analysing performance data, and what you get is
information that enlightens decisionmaking.
The potential of healthcare registers, medical transparency and benchmarking was recognised
by Codman already in the early 1900s (59, 60). Since then, Codman’s ‘end result system’ has
served as a basis for many quality improvement initiatives. What facilitates today’s
performance measurement is the changing attitudes in general, growing demand for health
system accountability, and rapid advances in technology and analytical methodology (105),
coupled with enormous amounts of routinely collected and accessible real world data. This can
be contrasted with the context of a hundred years ago, when the reality was as depicted in
Figure 7 (Codman’s national register of bone sarcoma patients). In addition, the possibility of
linking multiple registers at the level of the individual, which can be done in Sweden and many
other countries, provides opportunities for further risk adjustment and multi-level analyses,
where variations in performance can be disentangled at several levels (such as at the patient or
provider level), which is important for fair benchmarking (7). Furthermore, the present access

42
to internationally comparable data creates opportunities to increase the number of observations
included and thereby strengthen statistical analyses.
Figure 7. Codman’s national register of bone sarcoma patients. Picture taken by Roy Mabrey. Held by Boston Medical Library in the Francis A. Countway Library of Medicine. Public Domain.
This thesis has demonstrated how benchmarking can be used at several different levels of
healthcare systems to assess relative performance. In Studies I and II, performance gaps were
identified between and within units of analysis (countries, regions and departments), which
indicates that there is room for improvements. Further, the thesis has shown how performance
measurements can be used to investigate factors which explain differences between
organisations, as exemplified in Study I.
The information derived from these approaches may further be used by different stakeholders
in various ways. For example, comparisons carried out at the national and international levels
can provide valuable information for governments and regulators in terms of population health,
regulatory effectiveness and efficiency, et cetera. Such comparisons strongly contribute to
national accountability and provide important input for health policymaking (105).
International level comparisons can also provide information on which national data may not
be sufficient. For instance, they may lead to the discovery of more cost-effective approaches,
which in turn offer useful information to a range of stakeholders, including third-party payers,
regulators and providers. However, challenges connected to measurement at this level concern
the availability and comparability of data, which was experienced in Study I.

43
On the other hand, benchmarking carried out at the hospital or departmental level, where
similar services are compared, provides other relevant and useful information to care providers,
among others. This may include information on, for instance, their relative performance, scope
for improvement and own development. In another aspect, an advantage of assessing
performance by disease or specific procedure (i.e., a disease-based approach), such as hip
replacement surgery, is the possibility to relate inputs to outputs and outcomes (e.g., outcomes
can be measured and linked quite accurately to costs).
From the perspective of patients, public disclosure of information about available providers
and their performance enables them to make more rational choices based on personal
preferences (if they can make choices). Examples of relevant information include available
healthcare services, treatment options and health outcomes. In the case of elective hip
replacement surgery, studies have found that patients do incorporate quality information in
their choice of hospital (106, 107).
Furthermore, as demonstrated in Studies III–IV, performance measurement may also be used
to evaluate healthcare policies. Such assessments provide important input that can inform
policymaking. For example, the studies showed how the reform had affected various aspects
of the performance of hip replacement surgery differently, possibly because of how the
financial incentives were structured and linked to outcomes. From another perspective, an
advantage of international data is the possibility they create by providing an appropriate control
group to evaluate the effects of national healthcare policies.
In conclusion, the information derived from the different approaches and levels of
benchmarking thus satisfies diverse needs among the various stakeholders in healthcare
systems, which is important to consider in the design of performance measurements.
6.3 STRENGTHS AND LIMITATIONS
This thesis has contributed with a range of different aspects and applications of performance
measurement. One important strength thus relates to the variety of methods which were
employed to approach the study-specific objectives. In the assessment of the healthcare reform
for hip replacement surgery, a quasi-experimental design was applied to estimate its causal
impact on performance (Studies III–IV). The causal interpretation rests on the assumption that
there are no confounding variables which cannot be accounted for. In both studies, the widely
applied DiD analytical framework was employed to deal with potential time-invariant
confounding caused by selection bias. In Study III, the key underlying assumption of parallel
trends of the outcomes between treatment groups was considered to be fulfilled. In other words,
the control group was assumed to provide an appropriate counterfactual of the trend that
Stockholm would have followed in the absence of the reform, which enabled identification of
treatment effects. In Study IV, data were not available to investigate this assumption.
Nevertheless, to account for the differing compositions of patients between the treatment

44
groups, which may vary over time, weighing techniques were used in combination with DiD
to reduce selection bias caused by this type of confounding.
Moreover, in Study II, where the productivity of hip replacement surgery was analysed,
Malmquist productivity indices were computed, making it possible to decompose productivity
changes into changes in efficiency and changes in technology. This distinction should prove
useful for policy purposes, as it provides detailed information which may support managers
and policymakers in undertaking actions for productivity improvement.
Another major strength of the thesis relates to the comprehensive patient level datasets that the
studies were based on. The data included information on patients, procedures, resource use and
quality outcomes, with the linkage between multiple registers being crucial. The data created
opportunities for fair benchmarking through proper risk adjustments and provided possibilities
to benchmark performance in many aspects.
Moreover, through the rich dataset on hip replacement surgeries, it was possible to evaluate the
reform based on multiple performance dimensions, including aspects of resource use and both
objective and subjective quality (Studies III–IV).
The studies included in the thesis are subject to a number of limitations which should be noted.
First, despite the emphasis on the importance of risk adjustment for fair benchmarking,
differences in patient case mix were not accounted for in the productivity analysis for hip
replacement surgery in Study II, which was clearly a major limitation. In addition, Study I
lacked information on aspects known to affect LOS and mortality after hip fracture, such as
additional case-mix variables and pre-operative waiting time. This was largely due to
differences in the availability of such information.
Second, in the assessment of the reform for hip replacement surgery (Study III and Study IV),
it was not possible to separate whether the effects were driven by the introduction of patient
choice, free entry of new providers through accreditation, a changed reimbursement scheme,
or a combination of all of these factors. Furthermore, it is possible that the effects of the reform
varied over time, however, this was not examined.
Lastly, an overall limitation of the thesis concerns costs and resource use. While Study II
attempted to estimate costs, Studies I and III used LOS as means of describing resource use.
However, since information on healthcare costs are not (easily) obtainable at the patient level
in Sweden, and thus not linkable to patient registers, it may not be a limitation of the thesis per
se. Nevertheless, from a health economic perspective, the inclusion of more accurate costs and
resource use would surely have strengthened the thesis.
6.4 FUTURE PERSPECTIVES
Returning to Nutley’s and Smith’s (52) model of performance measurement (Figure 2), this
thesis has exemplified the first two stages in the process of benchmarking: the measurement

45
and analysis of performance data. Differences in the performance of orthopaedic care of
patients with hip fracture and osteoarthritis have been identified and disentangled at various
levels of healthcare systems, indicating that there is room for improvement. Still, these
performance measurements are not enough in themselves; some sort of action needs to take
place for improvement to occur, as represented in the final stage of the process in Figure 2.
Future perspectives should therefore focus on how this information can and should be used in
practice to change organisations’ behaviors in order to improve performance.
This does not apply only to the benchmarking demonstrated in the field of orthopaedic care.
Although benchmarking has gained a fundamental role in many parts of healthcare systems,
where management through measures is emphasised by healthcare managers and
policymakers, there is limited evidence on the use of performance measures and the effects of
benchmarking initiatives (6, 24, 104).
Furthermore, in its evaluation of the healthcare reform for hip replacement surgery, the thesis
has contributed with important input for policymakers to consider when designing financial
incentives linked to outcomes. To address relevant concerns regarding quality, policies should
be preceded by a review of quality indicators in terms of the degree of poor performance and
the potential for improvement. Outcomes that are at a satisfactory level should perhaps not be
subject to rewards (such as the PROMs, in this case, which were unaffected by the reform).
Rather, the focus should be on inferior outcomes (in this case, adverse events, which
significantly decreased as an effect of the reform and led to Stockholm becoming on par with
the rest of Sweden). A suggestion for future studies is to address the reform’s impact on
healthcare costs.
On a final note, from a health economic perspective, a register of healthcare costs, with
possibilities to link to other healthcare registers at the patient level, would enable important
economic analyses that could inform decisionmaking. However, this needs to be done at a
national level, with costs uniformly defined and calculated in the same way across different
regions.

46

47
7 CONCLUSIONS The overall aim of this thesis was to show how benchmarking can be applied to assess
healthcare performance with the use of register data. The four studies in the thesis contributed
with various perspectives and measurements at different levels of healthcare systems. The
information derived can satisfy diverse needs among the various stakeholders in healthcare
systems, which is important to consider in the design of performance measurements.
First, the thesis has demonstrated how performance benchmarking can be applied to both
identify and analyse performance gaps. At the international level, considerable variations in
mortality rates and LOS in the surgical treatment of hip fractures between and within included
countries were revealed. These variations were found to be associated with the availability of
national clinical guidelines, the share of males in the region and country-specific effects. The
findings imply that there is room for improvement, and that policymakers, healthcare managers
and clinicians should learn from best practices. Study I showed that international standardised
analysis of patient-level data is feasible and can be considered a step towards routine register-
based international benchmarking of healthcare systems in the treatment of hip fractures.
Similarly, the departmental comparisons revealed differences in the development of
productivity, efficiency and technology for hip replacement surgery across and within
orthopaedic departments. The findings of a slight positive overall productivity development,
due mainly to catch-up effects, may show some support for the usefulness of public reporting.
To improve overall productivity, variations need to be addressed and reduced by improving the
performance of the least productive units.
Second, the thesis has demonstrated how benchmarking can be beneficial in the evaluation of
healthcare reforms. The effects of a regional reform involving competition and financial
incentives to encourage improved performance of hip replacement surgery were analysed,
where the main findings indicated that the reform led to the LOS not decreasing at the same
rate as before, and to successful reduction of the adverse event rate. Moreover, the reform
brought no changes in patient satisfaction or gains in PROMs at one- and six-year follow-ups.
These findings contribute to the general knowledge about the effects of market elements and
financial incentives and offer valuable information to various stakeholders.
Future perspectives should focus on how this information can and should be used in practice
to change organisations’ behavior and improve healthcare performance.

48

49
8 ACKNOWLEDGEMENTS Becoming a PhD has been a long and challenging journey, and I would not have come this far
without all the wonderful people who have been by my side during these years. For that, I am
truly grateful.
My main supervisor, Clas Rehnberg, who is also my boss and friend (and foe, when it comes
to ice hockey). And a role model within health economics. I am grateful for your trust and
belief in me, and for the support along the way, especially at the end when I was having the
hardest time and needed it most. Without your guidance, push forward and high thoughts about
me, I doubt this thesis would have been completed. But now that it has, I can finally ask the
question: what is the difference between my thesis and Linköping Hockey Club? My thesis has
a title!
My co-supervisor, Sverre A.C. Kittelsen, for your strong support from the beginning to the
end. If there is anything I need to know, I turn to you. You are my idol! Please never stop using
smileys in emails, I absolutely love them!
Mikko Peltola, my former co-supervisor, for your valuable thoughts and feedback, which have
always been delivered in a much-needed instructive manner.
Szilárd Nemes, my former co-supervisor, for your helpful lessons about the Swedish Hip
Arthroplasty Register.
My orthopaedic friends, as I call you, and co-authors, for your highly appreciated teamwork.
Göran Garellick, my informal co-supervisor, for great support, challenges and humour along
the way. Henrik Malchau , for showing interest in my studies when I needed it most. Maziar Mohaddes, for helpful, quick and effective feedback.
Many warm thanks to the EuroHOPE study group for all you have taught me about research
and for the valuable international cooperation. A special thanks to the co-authors of Study I.
My sincere gratitude to my mentor Mesfin Tessma, for the endless encouragement and
support. You are a star!
To my fellow health economists at the Centre for Health Economics, Informatics and Health
Services Research, from whom I have learned so much. I am truly blessed to have such amazing
colleagues and friends. The support you have given me during all these years is priceless.
Mimmi Åström , you have been a rock to me. You are such a caring person and I appreciate
our conversations about life’s ups and downs. I am deeply grateful for our friendship, and of
course for our morning runs. Cecilia Dahlgren, I do not even know where to begin to thank
you. But to mention a few things I am grateful for: your never-ending positive spirit, being my
training buddy (and making me run 10K and do handstands!), our invaluable feedback sessions
and our great adventures in Iceland. I look forward to the day when I get my revenge in
balancing-along-the-edge-the-longest-while-river-rafting. TYVM 4 ETH, IOU! Matilda Hagman, in the most uncomfortable situations it is you and me together. I can always count

50
on you, which I greatly appreciate. Many thanks for our hangouts, talks and laughs. Sofi Varg,
thank you for being you. I love how we share the same passion for dance, knitting and Pinchos.
Well, almost the same at least. Sofia Sveréus, you are such an incredibly smart and funny
person. Your ability to understand me when not even I can is outstanding. I cherish the
memories we have from traveling around the world. And to the group’s latest additions: Niklas Zethraeus – for always being friendly, Karoline Magnusdottir – for your positive thoughts,
and Emelie Heintz – you are a true inspiration. Go team Siffergasellerna!
Kristina Burström , for your valuable feedback and advice over the years, and as my mock
opponent, for taking the time to prepare me for what is to come. I deeply appreciate it.
A big shout-out to the man behind the brilliant title of my thesis – Filip Gedin. On a more
serious note, life at LIME is not the same without you. I really do appreciate our conversations
about everything. Many thanks also for all the help on the home stretch!
Olivia Erntsson and Max Kleijberg , you rock. Hang in there – I am rooting for you!
Hilja Brorsson, for all the lessons in statistics, SAS programming and fly fishing.
Hanna Rättö, what started as an international collaboration developed into a friendship. I
cannot wait for us to have a beer and catch up again!
To current and former doctoral students: Anne Leppänen, Emma Granström, Agnes Elmberger, Linda Sturesson Stabel, Marie Dahlberg, Mairi Savage, Shaofan Chen, Fitsum Sebsibe Teni, Sara Korlén, Rebecca Mosson, Sara Ingvarsson, Charlotte Klinga ,
Annika Bäck, Shuang Hao, Chantelle Murley, Emma Spånberg and many others. Thank
you for all the fun moments we have shared.
To all my current and former colleagues at LIME, for creating a friendly work environment
through support and kindness. A particular thanks to Ebba Pettersson, Eva Hagel, Liisa Olsson, Vibeke Sparring, Marie Lind , Ronny Sejersen, Henna Hasson and Ulrika Schüldt Håård.
Carl Johan Sundberg, head of LIME, your commitment to wellness is highly appreciated.
Therese Wahlström, for the kindness and for always giving me a helping hand when needed.
Tomas Månsson, Gert Helgesson and Ingrid Smedberg for support in the doctoral
education.
For great IT support: Erik Attoff (and for our random conversations!), Ludvig Andersson and
Ludwig Berglund.
The Swedish Hip Arthroplasty Register, for the collaboration and for providing access to the
data. In particular, I want to thank Johanna Vinblad, Emma Nauclér, Erik Bülow and Ola Rolfson for their support with everything from administration to statistics.
Many warm thanks to the staff at Capio Ortopediska Huset and the patient I followed. It was a
day unlike any other.

51
I would also like to gratefully acknowledge the financial support from the Centre for Health
Economics, Informatics and Health Services Research in Region Stockholm and the European
Union Seventh Framework Programme regarding the EuroHOPE project (contract no.
241721).
Many thanks to the various constellations at LIME of which I am part: LIME running club –
because you make me move, Creative lunches – for very nice company and knitting lessons,
and Kappa-gruppen – for incredible support during the coronavirus pandemic and the final
year of my PhD studies.
A special thanks also to Shakira and Wyclef Jean for the catchy song! Who could have
guessed that a PhD thesis would be named after it?!
Mina närmaste vänner: Maria Nymark , Sara Henning, Maria Wallard och Jennifer Brännerud. Jag saknar er och längtar tills vi kan umgås normalt igen.
Min älskade familj, som är den absolut bästa man kan ha. Tack för att ni alltid finns där.
Mamma och pappa, för allt ni har lärt mig om livet och för att ni alltid tror på mig. Det är er
omtanke och kärlek som har format mig. Eva, jag är så glad att just du kom in i pappas och
våra liv.
Mina systrar, Anna och Malin , som också är mina bästa vänner. Jag får ofta höra från andra
om hur speciellt vårt band är och att vi delar så mycket i livet med varandra. Och just det är jag
så tacksam för – för allt vi delar. Tänk vad lyckligt lottad jag är som inte bara fick en, utan två
helt fantastiska systrar.
Världens finaste påg, min systerson Oliver . Det är en fröjd att se dig växa upp.
Familjen Blad, min skånska familj. Tack för alla fantastiska äventyr ni tar med mig på. Lotten,
det är lite tveksamt om detta räcker till en Nobelfest, men som tur är har vi ju andra trevligheter
att se fram emot!
Anders, min hjärtevän och alldeles egna stöttepelare i livet. Vad skulle jag göra utan dig? Med
dig har jag aldrig tråkigt och tillsammans kan vi vara konstiga. Jag ser fram emot våra framtida
äventyr. Ik hou van jou. ♥ ♥ ♥

52

53

54

55
9 REFERENCES 1. Jack W, Lewis M. Health Investments And Economic Growth: Macroeconomic Evidence And Microeconomic Foundations. Policy Research Working Papers. 2009.
2. Hollingsworth B. Cost, production, efficiency, or effectiveness: where should we focus? The Lancet Global Health. 2013;1(5):e249-e250.
3. Hurst J, Jee-Hughes M. Performance Measurement and Performance Management in OECD Health Systems. OECD Labour Market and Social Policy Occasional Papers. 2001.
4. Peiró S, Maynard A. Variations in health care delivery within the European Union. European Journal of Public Health. 2015;25 Suppl 1:1-2.
5. Van Helden GJ, Tillema S. In search of a benchmarking theory for the public sector. Financial Accountability and Management. 2005;21(3):337-361.
6. Kay JFL. Health care benchmarking. Hong Kong Medical Diary. 2007;12(2):22-27.
7. Cnudde P, Rolfson O, Nemes S, Kärrholm J, Rehnberg C, Rogmark C, et al. Linking Swedish health data registers to establish a research database and a shared decision-making tool in hip replacement. BMC Musculoskeletal Disorders. 2016;17(1):414.
8. OECD. Measuring up: Lessons and Potential. 2003. In: Measuring Up: Improving Health System Performance in OECD Countries [Internet]. OECD Publishing. Available from: https://www.oecd-ilibrary.org/content/component/9789264195950-18-en.
9. Institute of Medicine (US) Committee to Design a Strategy for Quality Review and Assurance in Medicare. 1, Health, Health Care, and Quality of Care. 1990. In: Medicare: A Strategy for Quality Assurance [Internet]. Lohr KN, editor. Washington (DC): National Academies Press (US). Available from: https://www.ncbi.nlm.nih.gov/books/NBK235460/.
10. Thomas JW, Guire KE, Horvat GG. Is patient length of stay related to quality of care? Journal of Healthcare Management. 1997;42(4):489.
11. Sund R, Gissler M, Hakulinen T, Rosén M. Use of Health Registers. In: Handbook of Epidemiology. Ahrens W, Pigeot I, editors. New York, NY: Springer New York; 2014. p. 707-730.
12. National Quality Registries. About the National Quality Registries [Internet]. [2021-03-15]. Available from: https://kvalitetsregister.se/englishpages/aboutqualityregistries.2422.html.
13. Crimmins EM. Lifespan and Healthspan: Past, Present, and Promise. The Gerontologist. 2015;55(6):901-911.
14. Institute of Medicine (US) Committee on Quality of Health Care in America. Appendix A, Report of the Technical Panel on the State of Quality to the Quality of Health Care in America Committee. 2001. In: Crossing the Quality Chasm: A New Health System for the 21st Century [Internet]. Washington (DC): National Academies Press (US). Available from: https://www.ncbi.nlm.nih.gov/books/NBK222263/.
15. Hicks CW, Makary MA. A prophet to modern medicine: Ernest Amory Codman. BMJ. 2013;347.
16. Linna M, Häkkinen U, Magnussen J. Comparing hospital cost efficiency between Norway and Finland. Health Policy. 2006;77(3):268-278.

56
17. Smith PC. Measuring health system performance. The European Journal of Health Economics. 2002;3(3):145-148.
18. Smith P, Mossialos E, Papanicolas I, Leatherman S. Principles of performance measurement. In: Performance Measurement for Health System Improvement: Experiences, Challenges and Prospects. Smith P, Mossialos E, Papanicolas I, Leatherman S, editors. Cambridge: Cambridge University Press; 2009.
19. Gaynor M, Vogt WB. Antitrust and competition in health care markets. In: Handbook of Health Economics. Elsevier; 2000. p. 1405-1487.
20. Song PH, Barlow JD, Seiber EE, McAlearney AS. Competition in Health Care. In: International Encyclopedia of Public Health. Quah SR, editor. Second ed. Oxford: Academic Press; 2017. p. 129-133.
21. Gaynor M, Haas-Wilson D. Change, Consolidation, and Competition in Health Care Markets. Journal of Economic Perspectives. 1999;13(1):141-164.
22. Arrow KJ. Uncertainty and the Welfare Economics of Medical Care. The American Economic Review. 1963;53(5):941-973.
23. Van de Ven WP, Schut FT, Rutten FF. Forming and reforming the market for third-party purchasing of health care. Social Science and Medicine. 1994;39(10):1405-1412.
24. Mannion R, Goddard M. Performance measurement and improvement in health care. Applied health economics and health policy. 2002;1(1):13-23.
25. Ochrana F, Plaček M, Půček M. Benchmarking as a substitute for the market mechanism: Empirical evidence for the Czech Republic. Procedia Economics and Finance. 2015;30:606-612.
26. Moriarty JP, Smallman C. En route to a theory of benchmarking. Benchmarking: An International Journal. 2009;16(4):484-503.
27. Van de Ven WP. Market-oriented health care reforms: Trends and future options. Social Science and Medicine. 1996;43(5):655-666.
28. Le Grand J. Choice and competition in publicly funded health care. Health Economics, Policy and Law. 2009;4(4):479-488.
29. Propper C. Competition, incentives and the English NHS. Health Economics. 2012;21(1):33-40.
30. Vrangbaek K, Robertson R, Winblad U, Van de Bovenkamp H, Dixon A. Choice policies in Northern European health systems. Health Economics, Policy, and Law. 2012;7(1):47-71.
31. Dahlgren G. Why public health services? Experiences from profit-driven health care reforms in Sweden. International journal of health services: planning, administration, evaluation. 2014;44(3):507-524.
32. Anell A. The Public–Private Pendulum — Patient Choice and Equity in Sweden. The New England journal of medicine. 2015;372(1):1-4.
33. Eijkenaar F. Pay for Performance in Health Care: An International Overview of Initiatives. Medical Care Research and Review. 2012;69(3):251-276.
34. Saltman RB. Regulating incentives: the past and present role of the state in health care systems. Social Science and Medicine. 2002;54(11):1677-1684.

57
35. Ma C-tA. Health Care Payment Systems: Cost and Quality Incentives. Journal of Economics & Management Strategy. 1994;3(1):93-112.
36. Barnum H, Kutzin J, Saxenian H. Incentives and provider payment methods. The International journal of health planning and management. 1995;10(1):23-45.
37. Propper C, Wilson D, Burgess S. Extending Choice in English Health Care: The Implications of the Economic Evidence. Journal of Social Policy. 2006;35(4):537-557.
38. Barros PP, Brouwer WBF, Thomson S, Varkevisser M. Competition among health care providers: helpful or harmful? The European journal of health economics. 2016;17(3):229-233.
39. Anell A. Hälso- och sjukvårdstjänster i privat regi [Privately provided healthcare services]. In: Konkurrensens konsekvenser - Vad händer med svensk välfärd? Hartman L, editor. Studieförbundet Näringsliv och samhälle; 2011.
40. Gaynor M, Town RJ. Competition in health care markets. In: Handbook of health economics. Elsevier; 2011. p. 499-637.
41. Fotaki M. Is Patient Choice the Future of Health Care Systems? International Journal of Health Policy and Management. 2013;1(2):121-123.
42. Fotaki M, Roland M, Boyd A, McDonald R, Scheaff R, Smith L. What benefits will choice bring to patients? Literature review and assessment of implications. Journal of health services research & policy. 2008;13(3):178-184.
43. Chaix-Couturier C, Durand-Zaleski I, Jolly D, Durieux P. Effects of financial incentives on medical practice: results from a systematic review of the literature and methodological issues. International journal for quality in health care. 2000;12(2):133-142.
44. Eijkenaar F, Emmert M, Scheppach M, Schöffski O. Effects of pay for performance in health care: a systematic review of systematic reviews. Health Policy. 2013;110(2-3):115-130.
45. Flodgren G, Eccles MP, Shepperd S, Scott A, Parmelli E, Beyer FR. An overview of reviews evaluating the effectiveness of financial incentives in changing healthcare professional behaviours and patient outcomes. The Cochrane database of systematic reviews. 2011(7):Cd009255.
46. Scott A, Sivey P, Ait Ouakrim D, Willenberg L, Naccarella L, Furler J, et al. The effect of financial incentives on the quality of health care provided by primary care physicians. The Cochrane database of systematic reviews. 2011(9):Cd008451.
47. Lindenauer PK, Remus D, Roman S, Rothberg MB, Benjamin EM, Ma A, et al. Public reporting and pay for performance in hospital quality improvement. The New England journal of medicine. 2007;356(5):486-496.
48. Berwick DM, James B, Coye MJ. Connections between quality measurement and improvement. Medical care. 2003:I30-I38.
49. Shekelle PG. Public performance reporting on quality information. In: Performance Measurement for Health System Improvement: Experiences, Challenges and Prospects. Smith P, Mossialos E, Papanicolas I, Leatherman S, editors. Cambridge: Cambridge University Press; 2009.
50. Conrad DA. Incentives for health-care performance improvement. In: Performance Measurement for Health System Improvement: Experiences, Challenges and Prospects.

58
Smith P, Mossialos E, Papanicolas I, Leatherman S, editors. Cambridge: Cambridge University Press; 2009.
51. World Health Organization. The world health report 2000: health systems: improving performance. World Health Organization; 2000.
52. Nutley S, Smith PC. League tables for performance improvement in health care. Journal of health services research & policy. 1998;3(1):50-57.
53. Ettorchi-Tardy A, Levif M, Michel P. Benchmarking: a method for continuous quality improvement in health. Healthcare policy. 2012;7(4):e101-e119.
54. Loeb JM. The current state of performance measurement in health care. International journal for quality in health care. 2004;16 Suppl 1:i5-9.
55. McIntyre D, Rogers L, Heier EJ. Overview, History, and Objectives of Performance Measurement. Health care financing review. 2001;22(3):7-21.
56. Percival T. Medical Ethics: or, a code of institutes and precepts adapted to the professional conduct of physicians and surgeons. To which is added an appendix containing a discourse on hospital duties [by TB Percival]; also notes and illustrations: S. Russell; 1803.
57. Varghese TK. A Legacy of Surgical Outcomes [Internet]. [2021-02-17]. Available from: https://hcldr.wordpress.com/2014/04/20/a-legacy-of-surgical-outcomes/.
58. Pellegrino ED. Percival's Medical Ethics: The Moral Philosophy of an 18th-Century English Gentleman. Archives of Internal Medicine. 1986;146(11):2265-2269.
59. Codman EA. A study in hospital efficiency: as demonstrated by the case report of the first five years of a private hospital. 1917.
60. Brand RA. Ernest Amory Codman, MD, 1869-1940. Clinical orthopaedics and related research. 2009;467(11):2763-2765.
61. Mueller K. Commentary: Ernest Codman and the Impact of Quality Improvement in Neurosurgery: A Century Since the Idea of the “End Result”. Neurosurgery. 2018;84(2):E116-E119.
62. Thonon F, Watson J, Saghatchian M. Benchmarking facilities providing care: An international overview of initiatives. SAGE open medicine. 2015;3.
63. Wait S, Nolte E. Benchmarking health systems: trends, conceptual issues and future perspectives. Benchmarking: an international journal. 2005;12(5):436-448.
64. OECD. Health Statistics [Internet]. [2021-03-15]. Available from: https://www.oecd.org/health/health-statistics.htm.
65. Registercentrum Västra Götaland. About National Quality Registers [Om nationella kvalitetsregister] [Internet]. [2021-03-15]. Available from: https://registercentrum.se/om-oss/om-nationella-kvalitetsregister/p/rk21maUUf.
66. Swedish Association of Local Authorities and Regions. Regional Comparisons: healthcare [Öppna jämförelser: hälso- och sjukvård] [Internet]. [2021-03-15]. Available from: https://skr.se/tjanster/merfranskl/oppnajamforelser/halsoochsjukvard.1563.html.
67. National Board of Health and Welfare. Regional Comparisons [Öppna Jämförelser] [Internet]. [2021-03-15]. Available from: https://www.socialstyrelsen.se/statistik-och-data/oppna-jamforelser/.

59
68. Campbell SM, Braspenning J, Hutchinson A, Marshall M. Research methods used in developing and applying quality indicators in primary care. Quality & safety in health care. 2002;11(4):358-364.
69. Häkkinen U, Iversen T, Peltola M, Seppälä TT, Malmivaara A, Belicza É, et al. Health care performance comparison using a disease-based approach: The EuroHOPE project. Health Policy. 2013;112(1):100-109.
70. Heijink R, Engelfriet P, Rehnberg C, Kittelsen SAC, Häkkinen U. A Window on Geographic Variation in Health Care: Insights from EuroHOPE. Health Economics. 2015;24(S2):164-177.
71. Häkkinen U, Iversen T, Peltola M, Rehnberg C, Seppälä TT, group obotEs. Towards Explaining International Differences in Health Care Performance: Results of the EuroHOPE Project. Health Economics. 2015;24(S2):1-4.
72. Swedish Hip Arthroplasty Register. Annual Report 2019. Swedish Hip Arthroplasty Register; 2020.
73. Cooper C, Cole ZA, Holroyd CR, Earl SC, Harvey NC, Dennison EM, et al. Secular trends in the incidence of hip and other osteoporotic fractures. Osteoporosis international. 2011;22(5):1277-1288.
74. Cooper C, Campion G, Melton LJ. Hip fractures in the elderly: a world-wide projection. Osteoporosis international 1992;2(6):285-289.
75. Nemes S, Gordon M, Rogmark C, Rolfson O. Projections of total hip replacement in Sweden from 2013 to 2030. Acta Orthopaedica. 2014;85(3):238-243.
76. Hälso- och sjukvårdsnämndens förvaltning - Stockholms Läns Landsting. Regelbok för höft- och knäprotesoperationer, 2011 [Rulebook for hip and knee replacement operations, 2011]. Region Stockholm; 2011.
77. Swedish Association of Local Authorities and Regions. KPP Databas [Cost per patient database] [Internet]. [2021-03-15]. Available from: https://skr.se/skr/halsasjukvard/kunskapsstodvardochbehandling/kostnadperpatientkpp/kppdatabas.46722.html.
78. Färe R, Grosskopf S, Lindgren B, Roos P. Productivity changes in Swedish pharamacies 1980–1989: A non-parametric Malmquist approach. Journal of Productivity Analysis. 1992;3(1):85-101.
79. Färe R, Grifell-Tatjé E, Grosskopf S, Knox Lovell CA. Biased Technical Change and the Malmquist Productivity Index. Scandinavian journal of Economics. 1997;99(1):119-127.
80. Färe R, Grosskopf S, Roos P. Produktivitetsutvecklingen inom sjukhussektorn 1970-1992 [Productivity growth in the hospital sector 1970-1992]. Finansdepartementet (Ministry of Finance); 1994.
81. Simar L, Wilson P. Estimating and bootstrapping Malmquist indices. European journal of operational research. 1999;115(3):459-471.
82. Simar L, Wilson P. A general methodology for bootstrapping in non-parametric frontier models. Journal of applied statistics. 2000;27(6):779-802.
83. Wilson P. FEAR: A software package for frontier efficiency analysis with R. Socio-economic planning sciences. 2008;42(4):247-254.

60
84. Angrist JD, Pischke J-S. Mostly Harmless Econometrics: An Empiricist's Companion. Princeton: Princeton University Press; 2008.
85. Dimick JB, Ryan AM. Methods for Evaluating Changes in Health Care Policy: The Difference-in-Differences Approach. JAMA. 2014;312(22):2401-2402.
86. Lechner M. The Estimation of Causal Effects by Difference-in-Difference Methods. Foundations and Trends in Econometrics. 2011;4(3):165-224.
87. Wing C, Simon K, Bello-Gomez RA. Designing Difference in Difference Studies: Best Practices for Public Health Policy Research. Annual review of public health. 2018;39(1):453-469.
88. Bertrand M, Duflo E, Mullainathan S. How Much Should We Trust Differences-In-Differences Estimates? The Quarterly Journal of Economics. 2004;119(1):249-275.
89. SAS. Version 9.4. 2003.
90. Stuart EA, Huskamp HA, Duckworth K, Simmons J, Song Z, Chernew M, et al. Using propensity scores in difference-in-differences models to estimate the effects of a policy change. Health Services and Outcomes Research Methodology. 2014;14(4):166-182.
91. Hainmueller J. Entropy Balancing for Causal Effects: A Multivariate Reweighting Method to Produce Balanced Samples in Observational Studies. Political Analysis. 2012;20(1):25-46.
92. Faries D, Zhang X, Kadziola Z, Siebert U, Kuehne F, Obenchain RL, et al. Real World Health Care Data Analysis: Causal Methods and Implementation Using SAS. SAS Institute; 2020.
93. Blundell R, Dias MC. Alternative Approaches to Evaluation in Empirical Microeconomics. Journal of Human Resources. 2009;44(3):565-640.
94. Achelrod D, Welte T, Schreyögg J, Stargardt T. Costs and outcomes of the German disease management programme (DMP) for chronic obstructive pulmonary disease (COPD)-A large population-based cohort study. Health Policy. 2016;120(9):1029-1039.
95. Austin PC. An Introduction to Propensity Score Methods for Reducing the Effects of Confounding in Observational Studies. Multivariate behavioral research. 2011;46(3):399-424.
96. World Medical Association. World Medical Association Declaration of Helsinki: ethical principles for medical research involving human subjects. JAMA. 2013;310(20):2191-2194.
97. Ludvigsson JF, Håberg SE, Knudsen GP, Lafolie P, Zoega H, Sarkkola C, et al. Ethical aspects of registry-based research in the Nordic countries. Clinical epidemiology. 2015;7:491-508.
98. Patientdatalag (2008:355) [Patient Data Act], 2008.
99. Sund R, Riihimäki J, Mäkelä M, Vehtari A, Lüthje P, Huusko T, et al. Modeling the length of the care episode after hip fracture: does the type of fracture matter? Scandinavian Journal of Surgery. 2009;98(3):169-174.
100. Brauer CA, Coca-Perraillon M, Cutler DM, Rosen AB. Incidence and Mortality of Hip Fractures in the United States. JAMA. 2009;302(14):1573-1579.
101. Sund R, Liski A. Quality effects of operative delay on mortality in hip fracture treatment. BMJ Quality & Safety. 2005;14(5):371-377.

61
102. Siegmeth AW, Gurusamy K, Parker MJ. Delay to surgery prolongs hospital stay in patients with fractures of the proximal femur. The Journal of bone and joint surgery - British volume. 2005;87(8):1123-1126.
103. Korlén S, Amer-Wåhlin I, Lindgren P, von Thiele Schwarz U. Professionals’ perspectives on a market-inspired policy reform: A guiding light to the blind spots of measurement. Health Services Management Research. 2017;30(3):148-155.
104. Elg M, Broryd KP, Kollberg B. Performance measurement to drive improvements in healthcare practice. International Journal of Operations & Production Management. 2013.
105. Smith P, Mossialos E, Papanicolas I, Leatherman S. Conclusions. In: Performance Measurement for Health System Improvement: Experiences, Challenges and Prospects. Smith P, Mossialos E, Papanicolas I, Leatherman S, editors. Cambridge: Cambridge University Press; 2009.
106. Beukers PD, Kemp RG, Varkevisser M. Patient hospital choice for hip replacement: empirical evidence from the Netherlands. The European Journal of Health Economics. 2014;15(9):927-936.
107. Gutacker N, Siciliani L, Moscelli G, Gravelle H. Choice of hospital: Which type of quality matters? Journal of Health Economics. 2016;50:230-246.

62

63
10 APPENDIX
10.1 APPENDIX A – QUESTIONNAIRE ON REIMBURSEMENT SC HEME
Enkät: Ersättning höftprotesoperationer Vänligen fyll i blåmarkerade rutor enligt anvisning. Region:
Vänligen fyll i uppgifterna nedan med hjälp av förkortningarna för respektive
år.
Hur sker ersättningen av höftprotesoperationer, uppdelat på akutsjukhus och övriga vårdgivare (privata), i er region?
Akutsjukhus Övriga vårdgivare
(privata) Ev. kommentar
1999 2000 2001 2002 2003 2004 2005 2006 2007 2008 2009 2010 2011 2012 2013 2014 2015 2016 2017 2018 2019
Olika typer av ersättningar och deras förkortningar:
B = Budget/anslag
DRG = Ersättning per produktgrupp baserad på DRG
V = Vårdepisodersättning (bundled payment) inkl. vård för komplikationer efter utskrivning
Å = Åtgärdsbaserad ersättning
Ö = Övrigt, specificera i kommentar

64
10.2 APPENDIX B – CHANGES IN EFFICIENCY
Department 2005/2006 2006/2007 2007/2008 2008/2009 2009/2010 2010/2011 2011/2012
1 0.816 1.120* 1.045 1.048 1.000 1.000 0.963
2 1.095* 1.022 0.978 0.910* 1.091* 0.926* 0.998
3 1.191* 0.883* 1.028 0.937* 0.927* 0.981 0.996
4 1.174* 0.958* 0.966* 0.943 1.034 1.045* 0.944*
5 1.086* 0.987 1.060 0.979 0.990 0.988 0.950*
6 1.034* 1.026 1.031 0.933* 0.980 1.052* 0.953*
7 1.157* 1.046* 0.991 1.005 1.071 1.033 0.960
8 1.116* 1.000 1.000 1.000 1.000 1.000 0.989
9 1.135 1.000 1.000 1.000 1.000 1.000 1.000
10 1.034 1.168* 0.929* 0.980 1.007 0.997 0.948*
11 1.124* 0.916* 0.886* 1.030 1.002 1.115* 1.005
12 1.132* 0.987 0.988 0.763* 1.116* 1.083* 0.966
13 1.007 1.080* 0.959* 0.969 0.957 1.130* 0.974
14 1.035 1.001 0.993 1.007 1.000 1.000 0.988
15 1.181* 1.033 0.978 0.893* 0.996 0.961 1.042
16 1.080* 0.953 0.983 0.998 1.143* 1.065* 0.945*
17 1.112* 0.989 0.990 0.999 1.136* 1.148* 0.883*
18 1.242* 0.995 1.012 0.961* 1.022 1.002 1.064*
19 0.935* 1.091 1.018 0.995 0.995 1.058* 0.997
20 1.143* 0.950* 1.017 0.963* 1.012 1.043* 1.064*
21 1.057 1.111* 1.096* 0.923* 0.935* 1.056* 0.976
22 1.082* 1.048* 0.911* 0.956* 1.031 1.183* 1.043
23 1.107* 0.928* 1.070* 1.042 0.996 1.060* 0.935*
24 1.197* 1.002 1.022 0.933* 1.008 0.911* 0.922
25 1.000 1.000 1.000 1.000 0.962 1.027 1.012
26 1.072 1.000 1.000 1.000 1.000 1.000 0.966
27 0.950 1.140* 1.099* 0.864* 0.962 1.029* 0.972*
28 1.053 1.011 1.028 0.891 0.995 0.985 1.030
29 1.092* 1.087* 1.005 0.866* 0.953 0.984 1.034
30 1.193* 0.921* 1.001 0.943* 1.106* 0.963 1.125*
31 1.195* 0.940* 1.046* 0.853* 1.043* 1.033* 0.945*
32 0.843 1.138* 0.945* 1.014 1.086 0.949 1.042
33 1.043 0.944* 1.058* 0.927* 1.179* 0.965 1.100*
34 1.088* 1.068* 0.980 0.891* 0.968 1.061* 0.996
35 1.010 0.990 1.020 1.025 1.000 1.000 1.000
36 1.190 0.789 1.057* 0.982 1.082* 1.070* 0.913*
37 1.114* 0.961* 1.085* 0.914* 0.985 0.928 0.952
38 1.055* 1.051* 0.976 1.027 0.939* 1.078* 0.893*
39 1.000 1.000 1.000 1.000 0.989 1.012 1.000
40 1.222* 1.033 0.961 0.935* 1.032 1.121* 1.000
41 1.110* 0.948* 1.098* 0.951* 1.012 1.027 1.004
42 0.982 1.105* 0.919* 0.952 1.216* 0.984 0.997
43 0.992 1.226* 0.711* 1.065* 1.028 1.170* 1.039*
44 0.915* 1.034 0.953 0.868* 1.228* 1.013 1.026
45 1.047 0.962 0.970 1.051* 1.010 1.089* 1.079*

65
Department 2005/2006 2006/2007 2007/2008 2008/2009 2009/2010 2010/2011 2011/2012
46 1.172* 0.965* 1.051* 0.879* 0.976 1.013 1.017
47 1.093* 1.011 1.035 1.022 0.920 1.091* 1.035
48 1.094* 1.049* 0.908* 0.977 0.983 1.099* 0.994
49 1.144* 1.014 1.050* 0.940* 0.940 0.976 0.928
50 1.287* 0.998 0.877* 1.050 0.996 1.004 0.971
51 1.045 1.047* 0.970 1.071* 1.017 0.991 0.964
52 1.142* 0.997 1.016 0.928* 1.000 0.974 1.016
53 1.107* 1.013 1.040 0.912* 1.010 1.015 1.012
54 1.092* 1.060* 0.923* 0.911* 0.984 1.086* 0.929*
55 1.152* 0.941* 0.962 0.879* 1.046* 0.987 1.007
56 1.200* 0.875 1.135 0.952 1.045* 1.046 1.000
57 1.176* 0.967 1.091* 1.039 1.163* 0.995 0.995
58 1.045* 1.044 0.876* 1.195* 0.896* 1.075* 0.903*
59 1.111* 0.936 0.972 0.974 1.053* 1.057* 0.943*
60 1.145* 1.052* 0.927* 0.848* 1.113* 1.075* 1.053*
61 1.029 0.974 1.053 1.164 1.000 1.000 1.000
62 1.137* 0.981* 1.005 0.971* 0.972 0.920* 1.037*
63 1.068* 1.006 1.042* 0.906* 0.990 1.056* 0.956
64 1.132* 0.967* 1.048* 0.907* 1.020 0.957* 0.942
65 1.080* 0.998 1.071* 0.941* 0.954 1.074* 0.973
Geometric mean 1.087* 1.006* 0.996* 0.961* 1.018* 1.026* 0.988* Notes: The numbers show annual change in efficiency between two consecutive years, = 1 indicates no change, > 1 indicates progress, < 1 indicates regress. * indicates statistically significantly different from 1.0 at 95% level.
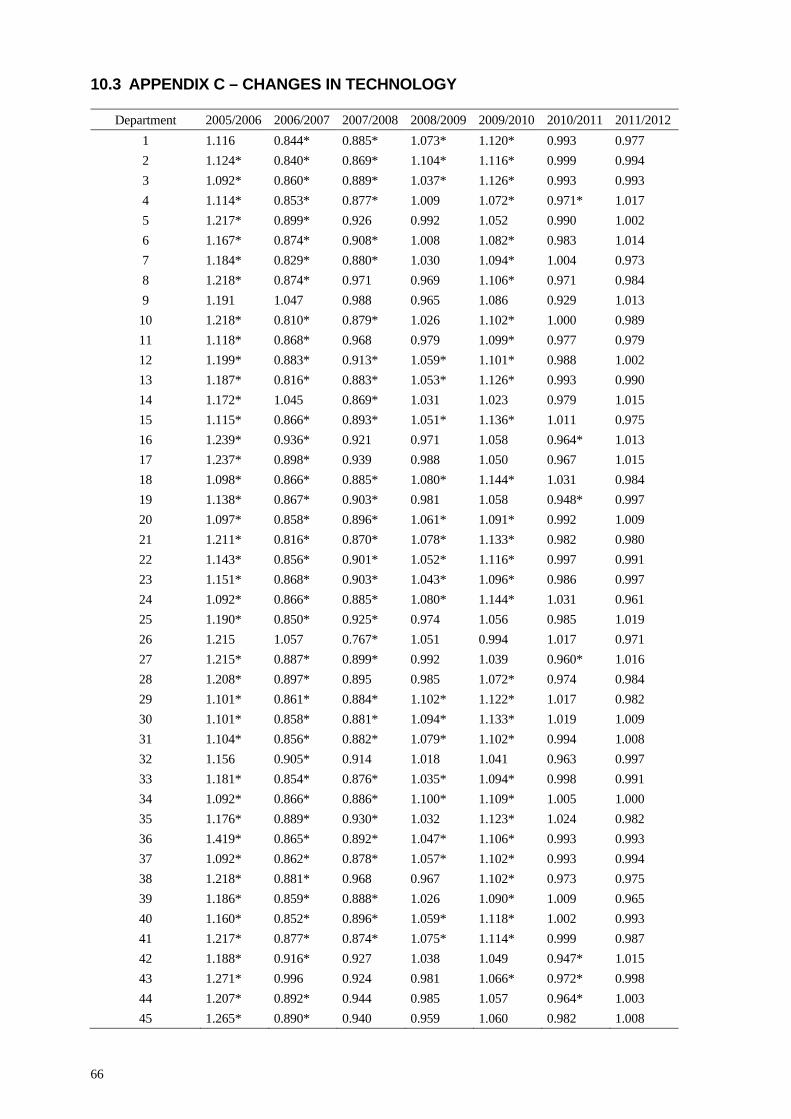
66
10.3 APPENDIX C – CHANGES IN TECHNOLOGY
Department 2005/2006 2006/2007 2007/2008 2008/2009 2009/2010 2010/2011 2011/2012
1 1.116 0.844* 0.885* 1.073* 1.120* 0.993 0.977
2 1.124* 0.840* 0.869* 1.104* 1.116* 0.999 0.994
3 1.092* 0.860* 0.889* 1.037* 1.126* 0.993 0.993
4 1.114* 0.853* 0.877* 1.009 1.072* 0.971* 1.017
5 1.217* 0.899* 0.926 0.992 1.052 0.990 1.002
6 1.167* 0.874* 0.908* 1.008 1.082* 0.983 1.014
7 1.184* 0.829* 0.880* 1.030 1.094* 1.004 0.973
8 1.218* 0.874* 0.971 0.969 1.106* 0.971 0.984
9 1.191 1.047 0.988 0.965 1.086 0.929 1.013
10 1.218* 0.810* 0.879* 1.026 1.102* 1.000 0.989
11 1.118* 0.868* 0.968 0.979 1.099* 0.977 0.979
12 1.199* 0.883* 0.913* 1.059* 1.101* 0.988 1.002
13 1.187* 0.816* 0.883* 1.053* 1.126* 0.993 0.990
14 1.172* 1.045 0.869* 1.031 1.023 0.979 1.015
15 1.115* 0.866* 0.893* 1.051* 1.136* 1.011 0.975
16 1.239* 0.936* 0.921 0.971 1.058 0.964* 1.013
17 1.237* 0.898* 0.939 0.988 1.050 0.967 1.015
18 1.098* 0.866* 0.885* 1.080* 1.144* 1.031 0.984
19 1.138* 0.867* 0.903* 0.981 1.058 0.948* 0.997
20 1.097* 0.858* 0.896* 1.061* 1.091* 0.992 1.009
21 1.211* 0.816* 0.870* 1.078* 1.133* 0.982 0.980
22 1.143* 0.856* 0.901* 1.052* 1.116* 0.997 0.991
23 1.151* 0.868* 0.903* 1.043* 1.096* 0.986 0.997
24 1.092* 0.866* 0.885* 1.080* 1.144* 1.031 0.961
25 1.190* 0.850* 0.925* 0.974 1.056 0.985 1.019
26 1.215 1.057 0.767* 1.051 0.994 1.017 0.971
27 1.215* 0.887* 0.899* 0.992 1.039 0.960* 1.016
28 1.208* 0.897* 0.895 0.985 1.072* 0.974 0.984
29 1.101* 0.861* 0.884* 1.102* 1.122* 1.017 0.982
30 1.101* 0.858* 0.881* 1.094* 1.133* 1.019 1.009
31 1.104* 0.856* 0.882* 1.079* 1.102* 0.994 1.008
32 1.156 0.905* 0.914 1.018 1.041 0.963 0.997
33 1.181* 0.854* 0.876* 1.035* 1.094* 0.998 0.991
34 1.092* 0.866* 0.886* 1.100* 1.109* 1.005 1.000
35 1.176* 0.889* 0.930* 1.032 1.123* 1.024 0.982
36 1.419* 0.865* 0.892* 1.047* 1.106* 0.993 0.993
37 1.092* 0.862* 0.878* 1.057* 1.102* 0.993 0.994
38 1.218* 0.881* 0.968 0.967 1.102* 0.973 0.975
39 1.186* 0.859* 0.888* 1.026 1.090* 1.009 0.965
40 1.160* 0.852* 0.896* 1.059* 1.118* 1.002 0.993
41 1.217* 0.877* 0.874* 1.075* 1.114* 0.999 0.987
42 1.188* 0.916* 0.927 1.038 1.049 0.947* 1.015
43 1.271* 0.996 0.924 0.981 1.066* 0.972* 0.998
44 1.207* 0.892* 0.944 0.985 1.057 0.964* 1.003
45 1.265* 0.890* 0.940 0.959 1.060 0.982 1.008

67
Department 2005/2006 2006/2007 2007/2008 2008/2009 2009/2010 2010/2011 2011/2012
46 1.115* 0.849* 0.875* 1.052* 1.097* 0.994 0.998
47 1.186* 0.884* 0.930 0.988 1.051 0.961* 1.014
48 1.216* 0.820* 0.874* 1.060* 1.124* 0.986 0.986
49 1.092* 0.866* 0.885* 1.080* 1.144* 1.031 0.979
50 1.229* 0.887* 0.916* 1.016 1.081* 0.976 0.991
51 1.249* 0.843* 0.886* 0.983 1.071* 0.996 0.991
52 1.165* 0.854* 0.887* 1.074* 1.124* 1.010 0.983
53 1.116* 0.828* 0.876* 1.037 1.107* 0.995 0.986
54 1.210* 0.817* 0.877* 1.003 1.061 0.974 1.020
55 1.103* 0.858* 0.905* 1.038* 1.082* 0.983 0.998
56 1.167 0.936 0.889 1.012 1.030 1.007 1.009
57 1.200* 0.908* 0.926 1.006 1.041 0.972 0.997
58 1.111* 0.836* 0.878* 1.008 1.076* 1.000 0.990
59 1.209* 0.902* 0.964 0.971 1.044 0.965 1.024
60 1.173* 0.852* 0.883* 1.087* 1.105* 1.002 0.990
61 1.243* 0.849* 0.878* 1.004 1.146 1.054 0.986
62 1.095* 0.858* 0.893* 1.072* 1.116* 1.008 0.992
63 1.145* 0.833* 0.870* 1.073* 1.112* 0.995 0.997
64 1.092* 0.859* 0.885* 1.093* 1.115* 1.012 1.000
65 1.138* 0.825* 0.871* 1.103* 1.121* 0.997 0.993
Geometric mean 1.169* 0.874* 0.898* 1.032* 1.091* 0.990* 0.995* Notes: The numbers show annual change in technology between two consecutive years, = 1 indicates no change, > 1 indicates progress, < 1 indicates regress. * indicates statistically significantly different from 1.0 at 95% level.