Why do lie-catchers fail? A lens model meta-analysis of human lie judgments
17
Why Do Lie-Catchers Fail? A Lens Model Meta-Analysis of Human Lie Judgments Maria Hartwig John Jay College of Criminal Justice, City University of New York Charles F. Bond Jr. Texas Christian University Decades of research has shown that people are poor at detecting lies. Two explanations for this finding have been proposed. First, it has been suggested that lie detection is inaccurate because people rely on invalid cues when judging deception. Second, it has been suggested that lack of valid cues to deception limits accuracy. A series of 4 meta-analyses tested these hypotheses with the framework of Brunswik’s (1952) lens model. Meta-Analysis 1 investigated perceived cues to deception by correlating 66 behavioral cues in 153 samples with deception judgments. People strongly associate deception with impressions of incompetence (r .59) and ambivalence (r .49). Contrary to self-reports, eye contact is only weakly correlated with deception judgments (r .15). Cues to perceived deception were then compared with cues to actual deception. The results show a substantial covariation between the 2 sets of cues (r .59 in Meta-Analysis 2, r .72 in Meta-Analysis 3). Finally, in Meta-Analysis 4, a lens model analysis revealed a very strong matching between behaviorally based predictions of deception and behaviorally based predictions of perceived deception. In conclusion, contrary to previous assumptions, people rarely rely on the wrong cues. Instead, limitations in lie detection accuracy are mainly attributable to weaknesses in behavioral cues to deception. The results suggest that intuitive notions about deception are more accurate than explicit knowledge and that lie detection is more readily improved by increasing behavioral differences between liars and truth tellers than by informing lie-catchers of valid cues to deception. Keywords: deception judgments, subjective cues to deception, Brunswik’s lens model Supplemental materials: http://dx.doi.org/10.1037/a0023589.supp Human deception and its detection have long been of interest to psychologists. Social psychological research has established that lying is a common feature of everyday social interactions (Cole, 2001; Jensen, Arnett, Feldman, & Cauffman, 2004; see Serota, Levine, & Boster, 2010, for a qualification of this finding): People tell both self-oriented lies (e.g., to enhance socially desirable traits and to escape punishment for transgressions) and other-oriented lies (e.g., to protect others’ feelings from being hurt and to protect social relationships; DePaulo & Kashy, 1998; DePaulo, Kashy, Kirkendol, Wyer, & Epstein, 1996). Lying is thus an important interpersonal phenomenon that serves the purpose of regulating social life (Vrij, 2008). Deception has also attracted the attention of applied psychologists because interpersonal judgments of cred- ibility play an important role in several domains, including the legal system (Granhag & Strömwall, 2004; Vrij, 2008). One of the major findings from this research is that people are poor at detecting lies: A meta-analysis of 206 studies showed an average hit rate of 54%, which is hardly impressive given that chance performance is 50% (Bond & DePaulo, 2006). Why is lie detection prone to error? In the literature, two explanations have been proposed (e.g., Vrij, 2008). First, it has been suggested that naı ¨ve lie detection is inaccurate because people have a false stereotype about the characteristics of deceptive behavior and therefore base their judgments on cues that are invalid. This hypothesis (which we may call the wrong subjective cue hypoth- esis) implies that errors in lie judgments are attributable to limi- tations in social perception and impression formation and that lie detection would be improved if perceivers relied on a different set of cues. Second, meta-analyses of cues to deception show that behavioral differences between truth tellers and liars are minute at best (DePaulo et al., 2003; see also Sporer & Schwandt, 2006, 2007). In other words, there is no Pinocchio’s nose—no behavioral sign that always accompanies deception (Vrij, 2008). Because the behavioral differences between liars and truth tellers are small, perceivers have little diagnostic material to rely on when attempt- ing to establish veracity. This view (which we may call the weak objective cue hypothesis) suggests that the limitations of lie detec- tion reside in the judgment task itself. In this article, we employ Brunswik’s lens model to understand judgments of veracity (Brunswik, 1952; Hursch, Hammond, & Hursch, 1964). Brunswik’s (1952) lens model is a conceptual framework for studying human predictions of criteria that are probabilistically Maria Hartwig, Department of Psychology, John Jay College of Crim- inal Justice, City University of New York; Charles F. Bond Jr., Department of Psychology, Texas Christian University. Thanks are due to Bella DePaulo, Joshua Freilich, Larry Heuer, Timothy Luke, Jaume Masip, Steve Penrod, Sigi Sporer, Annelies Vredeveldt, and Brian Wallace for comments on a draft of this article. Correspondence concerning this article should be addressed to Maria Hartwig, Department of Psychology, John Jay College of Criminal Justice, 445 West 59th Street, New York, NY 10019. E-mail: mhartwig@ jjay.cuny.edu Psychological Bulletin © 2011 American Psychological Association 2011, Vol. 137, No. 4, 643– 659 0033-2909/11/$12.00 DOI: 10.1037/a0023589 643
Transcript of Why do lie-catchers fail? A lens model meta-analysis of human lie judgments

Why Do Lie-Catchers Fail?A Lens Model Meta-Analysis of Human Lie Judgments
Maria HartwigJohn Jay College of Criminal Justice, City University of
New York
Charles F. Bond Jr.Texas Christian University
Decades of research has shown that people are poor at detecting lies. Two explanations for this findinghave been proposed. First, it has been suggested that lie detection is inaccurate because people rely oninvalid cues when judging deception. Second, it has been suggested that lack of valid cues to deceptionlimits accuracy. A series of 4 meta-analyses tested these hypotheses with the framework of Brunswik’s(1952) lens model. Meta-Analysis 1 investigated perceived cues to deception by correlating 66 behavioralcues in 153 samples with deception judgments. People strongly associate deception with impressions ofincompetence (r � .59) and ambivalence (r � .49). Contrary to self-reports, eye contact is only weaklycorrelated with deception judgments (r � �.15). Cues to perceived deception were then compared withcues to actual deception. The results show a substantial covariation between the 2 sets of cues (r � .59in Meta-Analysis 2, r � .72 in Meta-Analysis 3). Finally, in Meta-Analysis 4, a lens model analysisrevealed a very strong matching between behaviorally based predictions of deception and behaviorallybased predictions of perceived deception. In conclusion, contrary to previous assumptions, people rarelyrely on the wrong cues. Instead, limitations in lie detection accuracy are mainly attributable toweaknesses in behavioral cues to deception. The results suggest that intuitive notions about deception aremore accurate than explicit knowledge and that lie detection is more readily improved by increasingbehavioral differences between liars and truth tellers than by informing lie-catchers of valid cues todeception.
Keywords: deception judgments, subjective cues to deception, Brunswik’s lens model
Supplemental materials: http://dx.doi.org/10.1037/a0023589.supp
Human deception and its detection have long been of interest topsychologists. Social psychological research has established thatlying is a common feature of everyday social interactions (Cole,2001; Jensen, Arnett, Feldman, & Cauffman, 2004; see Serota,Levine, & Boster, 2010, for a qualification of this finding): Peopletell both self-oriented lies (e.g., to enhance socially desirable traitsand to escape punishment for transgressions) and other-orientedlies (e.g., to protect others’ feelings from being hurt and to protectsocial relationships; DePaulo & Kashy, 1998; DePaulo, Kashy,Kirkendol, Wyer, & Epstein, 1996). Lying is thus an importantinterpersonal phenomenon that serves the purpose of regulatingsocial life (Vrij, 2008). Deception has also attracted the attentionof applied psychologists because interpersonal judgments of cred-ibility play an important role in several domains, including thelegal system (Granhag & Strömwall, 2004; Vrij, 2008).
One of the major findings from this research is that people arepoor at detecting lies: A meta-analysis of 206 studies showed anaverage hit rate of 54%, which is hardly impressive given thatchance performance is 50% (Bond & DePaulo, 2006). Why is liedetection prone to error? In the literature, two explanations havebeen proposed (e.g., Vrij, 2008). First, it has been suggested thatnaıve lie detection is inaccurate because people have a falsestereotype about the characteristics of deceptive behavior andtherefore base their judgments on cues that are invalid. Thishypothesis (which we may call the wrong subjective cue hypoth-esis) implies that errors in lie judgments are attributable to limi-tations in social perception and impression formation and that liedetection would be improved if perceivers relied on a different setof cues. Second, meta-analyses of cues to deception show thatbehavioral differences between truth tellers and liars are minute atbest (DePaulo et al., 2003; see also Sporer & Schwandt, 2006,2007). In other words, there is no Pinocchio’s nose—no behavioralsign that always accompanies deception (Vrij, 2008). Because thebehavioral differences between liars and truth tellers are small,perceivers have little diagnostic material to rely on when attempt-ing to establish veracity. This view (which we may call the weakobjective cue hypothesis) suggests that the limitations of lie detec-tion reside in the judgment task itself. In this article, we employBrunswik’s lens model to understand judgments of veracity(Brunswik, 1952; Hursch, Hammond, & Hursch, 1964).Brunswik’s (1952) lens model is a conceptual framework forstudying human predictions of criteria that are probabilistically
Maria Hartwig, Department of Psychology, John Jay College of Crim-inal Justice, City University of New York; Charles F. Bond Jr., Departmentof Psychology, Texas Christian University.
Thanks are due to Bella DePaulo, Joshua Freilich, Larry Heuer, TimothyLuke, Jaume Masip, Steve Penrod, Sigi Sporer, Annelies Vredeveldt, andBrian Wallace for comments on a draft of this article.
Correspondence concerning this article should be addressed to MariaHartwig, Department of Psychology, John Jay College of Criminal Justice,445 West 59th Street, New York, NY 10019. E-mail: [email protected]
Psychological Bulletin © 2011 American Psychological Association2011, Vol. 137, No. 4, 643–659 0033-2909/11/$12.00 DOI: 10.1037/a0023589
643

related to cues (e.g., a physician making an assessment of thelikelihood that a patient has cancer on the basis of the patient’ssymptoms, a teacher’s assessment of a student’s scholastic abilitiesbased on the student’s performances in class, or a manager’sjudgment of job candidates on the basis of their behavior; Karelaia& Hogarth, 2008). We draw on the available empirical data toconduct a series of meta-analyses of judgment achievement asdefined by the lens model equation (Kaufmann & Athanasou,2009). As we shall see, the lens model offers an analytic frame-work that lets us put the two hypothesized explanations to aquantitative test, by allowing for a statistical decomposition ofinaccuracy in lie detection in two components reflecting (a) limi-tations in the naıve use of cues to deception and (b) lack of validityof objective cues to deception. In order to fully develop therationale for the current study, we provide an overview of the mainfeatures of research on deception, after which we turn to theapplication of the lens model to deception judgments.
Major Findings in Deception Research
Most research on deception is laboratory-based. In this research,participants, typically college students, provide truthful or delib-erately false statements (e.g., by purposefully distorting their atti-tudes or events that they have witnessed or participated in). Thestatements are subjected to various analyses including coding ofverbal and nonverbal characteristics. This allows for the mappingof objective cues to deception—behavioral characteristics thatdiffer as a function of veracity. Also, the videotaped statements aretypically shown to other participants serving as lie-catchers whoare asked to make judgments about the veracity of the statementsthey have seen. Across hundreds of such studies, people average54% correct judgments, when guessing would yield 50% correct.Meta-analyses show that accuracy rates do not vary greatly fromone setting to another (Bond & DePaulo, 2006) and that individ-uals barely differ from one another in the ability to detect deceit(Bond & DePaulo, 2008). Contrary to common expectations (Gar-rido, Masip, & Herrero, 2004), presumed lie experts who routinelyassess credibility in their professional life do not perform betterthan lay judges do (Bond & DePaulo, 2006). In sum, that liedetection is a near-chance enterprise is a robust finding emergingfrom decades of systematic research.
Subjective Versus Objective Cues to Deception
What is the reason for the near-chance performance of humanlie detection? To explain lack of accuracy, researchers have at-tempted to map the decision making of lie-catchers by studyingsubjective cues to deception (Strömwall, Granhag, & Hartwig,2004). These are behaviors that are perceived by observers as signsof deception. The most commonly employed method to studysubjective cues to deception is the survey approach, in whichpeople are asked to self-report on their beliefs about deceptivebehavior (Akehurst, Köhnken, Vrij, & Bull, 1996; Strömwall &Granhag, 2003; Vrij & Semin, 1996; for a different approach, seeZuckerman, Koestner, & Driver, 1981). In most of these studies,respondents were provided with a list of verbal and nonverbalbehaviors and asked how, if at all, these behaviors are related todeception (e.g., L. H. Colwell, Miller, Miller, & Lyons, 2006;Lakhani & Taylor, 2003; Taylor & Hick, 2007). In most studies,
people are provided with a list of common subjective and objectivecues to deception, to investigate whether people express supportfor subjective cues and whether they reject objective cues. Inaddition to this closed-ended approach, some studies have em-ployed an open-ended approach in which respondents are askedwhat behavioral cues they associate with deception. Another wayof mapping subjective cues to deception is to ask lie-catchers inlaboratory studies to self-report the basis for their veracity judg-ment (e.g., “I thought the person was lying because she wasstuttering”; see Strömwall et al., 2004).
The results from self-report studies on subjective cues to decep-tion are remarkably consistent. Most commonly, people report thebelief that gaze aversion is indicative of deception. A worldwidestudy surveyed beliefs about cues to deception in 58 countries andfound that in 51 of these, the belief in a link between gaze behaviorand deception was the most frequently reported (Global DeceptionResearch Team, 2006). People also report that increased bodymovements, fidgeting, and posture changes are associated withdeceit, as well as a higher pitched voice and speech errors. Thispattern suggests that people expect liars to experience nervousnessand discomfort and that this nervousness is evident in behavior(Vrij & Semin, 1996). However, there is a methodological limita-tion to these studies that prevents us from concluding that peoplemake lie judgments based on these criteria: We cannot be certainthat the behaviors people report explicitly are those that bestcapture their actual decision-making strategies (Nisbett & Wilson,1977). As impression formation is partly automatic and implicit(Bargh & Chartrand, 1999; Fiske & Taylor, 2008), it is quitepossible that people are unaware of the basis for their veracityassessments and that self-reports reflect an explicit, consciousstereotype of deceptive behavior that has little impact on actualdecision making. As we shall see, applying the lens model todeception judgments allows us to go beyond self-reports to assessthe actual behavioral criteria that predict judgments of deception.
Do liars behave consistently with people’s notions of deceptivebehavior? Expressed differently, is there an overlap between sub-jective beliefs about deceptive behavior and actual objective cuesto deception? Analyses of verbal and nonverbal behavior of liarsand truth tellers show that cues to deception are scarce and thatmany subjective cues are unrelated to deception. A meta-analysiscovering 120 studies and 158 cues to deception showed that mostbehaviors are only weakly related to deception, if at all (DePauloet al., 2003; see also DePaulo & Morris, 2004). Gaze aversion isnot a valid indicator of deception. The simple heuristic that liarsare more nervous is not supported by the meta-analysis becausemany indicators of nervousness, such as fidgeting, blushing orspeech disturbances, are not systematically linked to deception.The meta-analysis does suggest that liars might be more tense,possibly as a function of operating under a heavier self-regulatoryburden: Their pupils are more dilated and their pitch of voice ishigher (DePaulo et al., 2003). The results also suggest that theremight be some verbal differences between liars and truth tellers:Liars talk for a shorter time and include fewer details, comparedwith truth tellers. Also, liars’ stories make less sense in that theirstories are somewhat less plausible and less logically structured.
It is not our intention to provide a comprehensive overview ofthe available research on deception and its detection. For suchoverviews, we direct the reader to recent meta-analyses byDePaulo et al. (2003) and Bond and DePaulo (2006) and the
644 HARTWIG AND BOND

comprehensive review by Vrij (2008). The important point is thatresearch suggests two plausible explanations for why lie-catchingoften fails. First, self-reports suggest a mismatch between subjec-tive and objective cues to deception, meaning that people consis-tently report relying on behaviors that are unrelated to deception.Second, behavioral coding of lies and truths in laboratory researchsuggests that there is a scarcity of objective cues to deception,making the judgment task intrinsically error prone. How do weknow which of these explanations fits the data best? The fact thatthere is no answer to this question in the available literaturesuggests that despite the vast body of empirical research, judg-ments of deception are poorly understood. We aim to enhanceunderstanding by employing the lens model originally outlined byBrunswik (1952), a method of analysis that has proven fruitful forunderstanding human judgments in a wide range of areas (Hogarth& Karelaia, 2007; Juslin, 2000; Karelaia & Hogarth, 2008; Kauf-mann & Athanasou, 2009). In contrast to previous research inwhich researchers have studied either the characteristics of decep-tive and truthful behavior or the characteristics of judgments ofdeception, employing the lens model allows us to study the inter-play between the characteristics of the judgment task and perceiverperformance (e.g., Juslin, 2000). A few previous studies haveemployed the lens model to study judgments of deception (Fiedler& Walka, 1993; Sporer, 2007; Sporer & Kupper, 1995). We buildon and extend this work by offering a synthesis of the availableliterature on deception judgments using the framework of the lensmodel. We aim to address three main questions. First, what cues dopeople use when judging deception (Meta-Analysis 1)? Second, isthere a lack of overlap between subjective and objective cues todeception (Meta-analyses 2 and 3)? Third, is inaccuracy mainlydue to incorrect decision-making strategies or lack of valid cues todeception (Meta-Analysis 4)?
Brunswik’s Lens Model
Within the theoretical framework of probabilistic functionalism,Egon Brunswik (Brunswik, 1952; Petrinovich, 1979) proposed amodel to understand processes of human perception. The basicassumption of probabilistic functionalism is that people exist in anuncertain environment and that judgments and inferences about theenvironment are therefore made on the basis of probabilistic data(Brunswik, 1943, 1952; Hammond, 1996). Judgments of a crite-rion are made on the basis of cues with different ecologicalvalidities, where ecological validity is the correlation between thecue and the distal variable to be predicted (Hursch, Hammond, &Hursch, 1964). Also, cues differ in their use by a perceiver, wherecue utilization can be represented by the correlation between thecue and the inference drawn by the perceiver. A person’s achieve-ment or accuracy can be captured by the correlation between theinference drawn and the distal variable. Since the lens model wasproposed, it has been expanded to capture not only perceptualjudgments but also a variety of cognitive processes includinglearning (Summers & Hammond, 1966), clinical inference (Ham-mond, Hursch, & Todd, 1964), interpersonal perception (Ham-mond, Wilkins, & Todd, 1966), and personality attributions(DeGroot & Gooty, 2009).
A main advantage of the lens model is its ability to modeljudgment accuracy by taking into account both the decision makerand the decision-making task. In the words of Karelaia and Hog-
arth (2008, p. 404), “The simple beauty of Brunswik’s lens modellies in recognizing that the person’s judgment and the criterionbeing predicted can be thought of as two separate functions of cuesavailable in the environment of the decision.” From this, it followsthat the accuracy of a person’s judgment will be a function of theextent to which the criterion can be predicted from a set of cues,as well as to what extent the cues used by a perceiver overlap withthe cues that predict the criterion. To illustrate this, consider amusician who plays the same tune repeatedly but attempts toconvey different emotions (e.g., anger, sadness, happiness) eachtime the song is played (see Juslin, 2000). How well can a listenerjudge what emotion the musician is attempting to convey? Thejudgment achievement of the listener (i.e., the correlation betweenthe performer’s intention and the listener’s judgment) will, accord-ing to the lens model, be a function of the following: First, to whatextent are there valid cues to the performer’s intended emotion inthe tune being played? Second, to what extent can the perceiver’sjudgment be reliably predicted from cues? Third, to what extentdoes the set of cues utilized by a perceiver to judge emotionalexpression match those actually indicative of the performer’s emo-tion? The lens model thus decomposes judgment inaccuracy incomponents reflecting (a) lack of validity in objective cues toemotions in the tune being played and (b) lack of overlap betweenobjective cues to emotion and subjective use of cues to predictemotion on the basis of the tune being played. The lens model cantherefore provide both descriptive information to understand judg-ment accuracy, and prescriptive information about how judgmentaccuracy can be improved (Hogarth & Karelaia, 2007). For athorough discussion of the lens model, see Cooksey (1996).
A Lens Model of Deception Judgments
Let us now employ the reasoning outlined above to understandaccuracy in judgments of deception. In the current article, we donot measure lie detection accuracy as percentage correct. Instead,we measure accuracy in terms of a Pearson product–momentcorrelation coefficient—the correlation between actual deceptionand judgments of deception. For present purposes, this correla-tional metric is superior to percentage correct. Unlike percentagecorrect, it can accommodate results from the many studies ofdeception in which participants render their judgments of truthfuland deceptive messages on Likert scales. The correlational metricis also necessary for the implementation of a lens model ofdeception judgments, as is now explained.
A lens model of judgments of deception incorporates a commu-nicator, behavioral cues, and a judge (see Figure 1). The commu-nicator appears at the left of the figure, and cues appear in themiddle. The communicator will either lie or tell the truth, and thecommunicator’s behaviors may function as cues indicating his orher deceptiveness. Atop the line going from the communicator toeach cue, we would hope to place a validity coefficient—a statis-tical measure of the extent (and direction) of the relation betweenthe communicator’s deceptiveness and that cue. Suppose, for ex-ample, that the cue at the top of the figure is the amount of detailin the communicator’s message. We have some idea of the validityof that measure as a cue to deceptiveness. An earlier meta-analysisby DePaulo et al. (2003) reveals a correlation between deceptive-ness and number of details of �.20, with truthful messages beingmore detailed than deceptive ones. The DePaulo et al. (2003)
645A LENS MODEL META-ANALYSIS OF HUMAN LIE JUDGMENTS

meta-analysis provides correlation coefficients for 158 potentialcues to deception. We draw on these earlier meta-analytic data toimplement the left-hand side of our lens model.
The naıve detection of deception involves not just the commu-nicator, it also involves a judge. In attempting to uncover deceit,judges attend to cues. From certain of those cues, they inferdeception; from others, veracity. This process of decoding com-municator behavior appears on the right-hand side of Figure 1.There we have a judge, as well as lines emanating from cuestoward that judge. Our goal is to place atop each line a utilizationcoefficient—that is, a measure of the extent and direction of therelation between a cue and a judges’ tendency to infer that thecommunicator is being deceptive. Again, suppose that the cue atthe top of the figure is the number of details in a communicator’smessage. As reported below, perceivers tend to infer truthfulnessfrom detailed communications; in fact, the relevant r with per-ceived deceptiveness is �.37. The similarity between this decod-ing coefficient (of �.37) and the corresponding encoding coeffi-cient (of �.20) would suggest that perceivers enhance theiraccuracy in detecting deception insofar as they rely on messagedetails as a judgment cue. More generally, accuracies (and inac-
curacies) in naıve lie detection reflect the correspondence (andnoncorrespondence) between the validity of particular deceptioncues and their utilization by judges.
Within this lens model framework, accuracies in human liedetection can be statistically decomposed. To explain the decom-position, we must introduce some notation. Suppose that we havedata on a number of potential deception cues. Suppose we enterthose cue variables into a multiple regression equation and usethem to predict communicator deceptiveness. Call our measure ofdeceptiveness D. The resulting regression equation would yield astatistical prediction of deceptiveness for each communicator (callthe predictions D�), and these predictions would be more (or less)accurate. One measure of their accuracy is the Pearson product–moment correlation between actual deceptiveness and statisticalpredictions of deceptiveness (that is, between D and D�). Call thiscorrelation coefficient RDec. It indicates the overall predictabilityof deception from our set of behavioral cues.
Given appropriate data, we could set up a multiple regressionequation for predicting judgments of communicator deceptivenessfrom the same behavioral cues. Let us call our measure of per-ceived deceptiveness P. Our regression equation would yield a
Figure 1. The communicator (C) is displayed to the left, and the judge (J) is displayed to the right. Behavioralcues (X) appear in the middle of the figure. Each cue is related to deception by a validity coefficient (rv) and todeception judgments by a utilization coefficient (ru), each represented by a Pearson’s r. For example, assume thatthe cue at the top of the figure, X1 is the number of details in a communicator’s message. A previousmeta-analysis by B. M. DePaulo et al. (2003) revealed a correlation between deceptiveness and number of details(rv) of �.20, with truthful messages being more detailed than deceptive ones. In Meta-Analysis 1, we find thatthe number of details is associated with deception judgments with ru � �.37, suggesting that judges (correctly)infer deception from a lack of details. Generally, the accuracy of the judge (i.e., the correlation between thejudgment of deception and actual deception, represented in the figure by racc) will, according to the lens model,be a function of the following: First, to what extent are there valid cues to deception (the left side of the figure)?Second, to what extent can the perceiver’s judgment be reliably predicted from cues (the right side of the figure)?Third, to what extent does the set of cues utilized by a perceiver to judge deception match those actuallyindicative of deception (the matching between the left and right side of the figure)?
646 HARTWIG AND BOND

prediction of deception judgment for each communicator. Let uscall these predictions P� and measure their accuracy by theircorrelation with actual judgments. The resulting correlation, whichwe denote RPer, reflects the predictability of deception judgmentsfrom a set of behavioral cues. Finally, it is of interest to comparestatistical predictions of deception with the corresponding predic-tions of perceived deception. If behaviorally based predictions ofdeception perfectly matched behaviorally based predictions ofdeception judgment, the two sets of predictions would correlate�1. If there was a perfect mismatch between the two sets ofpredictions, they would correlate –1. More generally, a quantifi-cation of accuracy in the lens model depends on the so-calledmatching index—the correlation coefficient between cue-basedpredictions of deception and cue-based predictions of deceptionjudgment. Call this matching index G.
For purposes of the lens model, we measure the accuracy ofdeception judgments by a Pearson product–moment correlationcoefficient—the r between judgments of deception and actualdeception. Call this accuracy correlation racc. If we can assume thaterrors in predicting deception are uncorrelated with errors inpredicting deception judgment, lie detection accuracy can be ex-pressed as the product of three factors (Tucker, 1964):
racc � RDec � RPer � G. (1)
Thus, the accuracy of lie detection is the product of (a) thepredictability of a communicator’s deceptiveness from behavioralcues, (b) the predictability of a communicator’s perceived decep-tiveness from behavior cues, and (c) the matching of cue-basedpredictions of deception with cue-based predictions of apparentdeception. To implement this lens model, we began by collectingmeta-analytic data on cues to deception judgment. These data areof interest in their own right because there is no comprehensiveup-to-date synthesis of behavioral correlates of lie judgments inthe accumulated literature.
Meta-Analysis 1: Cues to Perceived Deception
The purpose of Meta-Analysis 1 is to identify behaviors thatcovary with the degree to which a communicator is perceived asdeceptive. We do not assume that participants can accuratelyreport on the bases of their deception judgments—rather, theaccuracy of this reporting is a question to be empirically addressed.For the identification of objective correlates of perceived decep-tiveness, we consider studies in which people make judgments ofthe veracity of a set of communicators and correlate a communi-cator’s perceived deceptiveness with various aspects of the com-municator’s demeanor, speech, or behavior. To this date, a numberof such reviews have been conducted. Here we consider several ofthose reviews.
Zuckerman, DePaulo, and Rosenthal (1981) examined 13 stud-ies on behaviors associated with perceived deception. These stud-ies yielded data on the relation between deception judgments and10 distinct behaviors that might be used to form those judgments.Eight of the 10 behaviors in the studies were significantly relatedto deception judgments. Deception was most strongly inferredfrom high vocal pitch and from slow speech, each relation yieldingr � .32. Along with a companion meta-analysis, this reviewindicated that behaviors are more strongly associated with per-ceived deception than actual deception.
In an unpublished master’s thesis, Malone (2001) assessed re-sults on cues to perceived deception from 69 independent samples.These yielded data on the relation between deception judgmentsand 136 potential judgment cues. Meta-analysis revealed thatmany of the cues were in fact significantly related to deceptionjudgments. The strongest results indicated that judges attributedeception to communicators who appear indifferent and unintelli-gent, each relation yielding r � .56. More generally, hesitant,fidgety communicators are judged to be deceptive; positive, con-sistent, forthcoming communicators are judged to be truthful (Mal-one, 2001). From a nonquantitative analysis, Malone concludedthat there is some overlap and some divergence between these cuesto deception judgment and cues to actual deception.
From a tabulation of significant and nonsignificant correlationsin 48 studies, Vrij (2008) drew conclusions about 26 behavioralcues to perceived deception. Vrij (2008) concluded that peopleinfer deception from signs of nervousness, like speech errors,pauses, and gaze aversion. They also infer deception from oddbehaviors, like excessive eye contact and abnormal response la-tencies.
Although these earlier reviews have been informative, they donot reflect all of the evidence on cues to perceived deception.Malone’s (2001) thesis offers the most comprehensive literaturereview to date. Unfortunately, his effort is unpublished, and itdraws conclusions from only 69 samples of senders. Here, weidentify cues to perceived deception from a larger database.
Method
Literature search procedures. To locate relevant studies,we conducted computer-based searches of Psychological Ab-stracts, PsycInfo, PsycLit, Communication Abstracts, DissertationAbstracts International, WorldCat, and Google using the key-words deception, deceit, and lie detection. We searched the SocialSciences Citation Index for articles that cited key references (e.g.,B. M. DePaulo & Rosenthal, 1979), examined reference lists fromprevious reviews (Bond & DePaulo, 2006; DePaulo et al., 2003;Malone, 2001; Vrij, 2008), and reviewed the references cited inevery article we found.
Criteria for inclusion of studies. Our goal was to summarizeall English-language reports of original research on cues to judg-ment of deception available prior to January 2011. To be includedin this review, a document had to report the relation betweenjudgments of deception and at least one cue. For purposes ofimplementing this criterion, we construed judgments of deceptionbroadly, to include the percentage of receivers who inferred that asender was lying (rather than telling the truth), the rating of asender on a multipoint scale of deceptiveness, and the ratings ofthe sender’s honesty, trustworthiness, and believability. However,we did not include in this review judgments of affect, even if theaffect being judged had been falsified. Although we includedstudies in which children served as senders of truthful and decep-tive messages, we did not include studies in which people under 16years old served as receivers—leaving to developmental psychol-ogists the task of understanding children’s deception judgments.
As possible cues to deception judgment, we included any be-havior of the person being judged, any impression of the personconveyed, and any aspect of the person’s demeanor or physicalappearance. We did not consider situational factors as cues to
647A LENS MODEL META-ANALYSIS OF HUMAN LIE JUDGMENTS

deception judgment—the impact of situational factors on decep-tion judgments having recently been summarized by Bond andDePaulo (2006). We uncovered 128 documents that satisfied ourinclusion criteria.
Several features of this literature deserve comment. First, anumber of these documents reported more than one study of cuesto deception judgment. Second, there were a number of cases inwhich a given sample of senders was judged by more than onesample of receivers. For purposes of the current meta-analysis, theunit of aggregation is the sender sample. Our analyses extract oneset of cue–judgment correlations from each independent sample ofsenders—aggregating across multiple groups of receivers, whennecessary. From this literature, we extracted 153 independentsender samples.
In these studies, researchers reported results on the relation ofdeception judgments to 81 different cues. Fifteen of the cues wereexamined in only one sample of senders (information about theseare available from the first author). These were excluded from thepresent study. The remaining 66 cues appear at the left of Table 1.Seventy-five of the 81 cues appeared in an earlier meta-analysis ofcues to deception by DePaulo et al. (2003) and are more fullydescribed there. The six additional cues appear at the bottom ofTable 1.
Variables coded from each report. From each report, wecoded as many of the following variables as possible: (a) numberof senders, (b) number of receivers, (c) an accuracy correlation, (d)at least one cue–judgment correlation, (e) an N for the cue–judgment correlation, (f) the number of cue–judgment correlations,and (g) a multiple-cue correlation for judgments. We coded thenumber of senders and number of receivers from each document.From each document that allowed it, we computed an accuracycorrelation—that is, a Pearson product–moment correlation coef-ficient between deception and judgments of deception. We alsocomputed at least one cue–judgment correlation—that is, a Pear-son product–moment correlation between deception judgmentsand scores on a potential cue to deception judgment. Often, theunit for the cue–judgment correlation was a statement. In this case,a positive correlation implies that the more of the cue that wasexhibited during a statement, the more likely the statement was tobe judged deceptive. In other cases, each sender made multiplestatements, and sender was the unit of analysis for the cue–judgment correlation. In this case, a positive correlation wouldimply that the more of a cue the sender exhibited, the moredeceptive she or he was judged to be. We noted the number ofcases on which the judgment–cue correlation was based. This waseither the number of statements or the number of senders.
Results
Characteristics of the literature. We found 128 documentsthat satisfied our criteria. Of these documents, 107 were publishedand 21 were unpublished. The earliest document was dated 1964,and the latest was dated 2010. Searching through these documents,we found 153 independent sender samples. These documents in-cluded a total of 4,638 senders and 18,837 receivers. In the medianstudy, 88 receivers judged the veracity of 16 senders. Researchersreported 531 cue–judgment correlations—that is, Pearson product–moment correlations between deception judgments and a cue tothose judgments. In 43 cases (that is, 8.1% of the 531), a researcher
stated that the relation between perceived deception and a cue wasnot significant, without reporting anything more. We treated theseas r � 0. In all other cases, we analyzed the reported correlationcoefficients.
In 57 of the 153 sender samples, receivers classified partici-pants’ statements as either lies or truths; in 36 samples, receiversrated veracity on multipoint scales; in 35 samples, participantsrated senders’ honesty; and in 25 samples, they rated senders on anhonesty-related attribute (e.g., trustworthiness). Senders weretreated in one of three ways. In deception experiments, senderswere required to lie or tell the truth on an experimenter-specifiedtopic. In cue experiments, senders were required to exhibit (or notexhibit) a particular behavior. In observational studies, sendersreceived no experimental instructions before having their veracityjudged. Deception experiments, cue experiments, and observa-tional studies contributed 72, 56, and 25 sender samples to thecurrent database, respectively.
Judgment cues. From these data, we abstracted 81 distinctjudgment cues, aggregated data for each cue within sender sample,converted the 531 Pearson product–moment correlations to Fish-er’s Z transforms, and cumulated the Fisher’s Zs for each cue withrandom-effects techniques1 (Lipsey & Wilson, 2001). We codedeach judgment–cue correlation as positive if perceivers inferreddeception from more of the cue and coded it as negative ifperceivers inferred deception from less of the cue. Table 1 displaysrelevant results for the 66 cues that had been studied in more thanone sample. Appearing on each line of the table are an identifica-tion number for the cue from Appendix A in an earlier review byDePaulo and colleagues (2003), the name of the cue, the numberof samples in which that cue was studied, a Pearson r correspond-ing to the mean weighted Fisher’s Z for the relation of that cue toperceived deception, a 95% confidence interval (CI) for that meanrelation (expressed in terms of r), and a between-samples truestandard deviation in the population correlation coefficient for therelation between the cue and perceived deception.
As is indicated in the table, 41 of 66 cues (that is, 62.12%) havea statistically significant relation to perceived deception, at aper-cue alpha-level of .05. In light of the large number of cuesbeing assessed, it should also be mentioned that 27 of 66 cues havea statistically significant relation to perceived deception at a morestringent per-cue alpha level of .001. Of the 66 cues, 21 haverelations with perceived deception that vary significantly acrosssamples at p � .001.
Deception judgments are more strongly related to some cuesthan to others. Of the 66 cues in Table 1, two have a Pearsonproduct–moment correlation with a perceived deception thatequals or exceeds .50, in absolute value. As these strongest cor-relations indicate, people who appear incompetent are judged to bedeceptive, as are people whose statements do not place eventswithin their context. Eleven other cues have relations with per-ceived deception that yield absolute rs between .40 and .50. Theseindicate that people are judged to be deceptive if they fidget withobjects, sound uncertain, and appear ambivalent or indifferent.They are judged to be truthful if they sound immediate, if their face
1 We also conducted a fixed-effects meta-analysis on these data andobtained similar results.
648 HARTWIG AND BOND
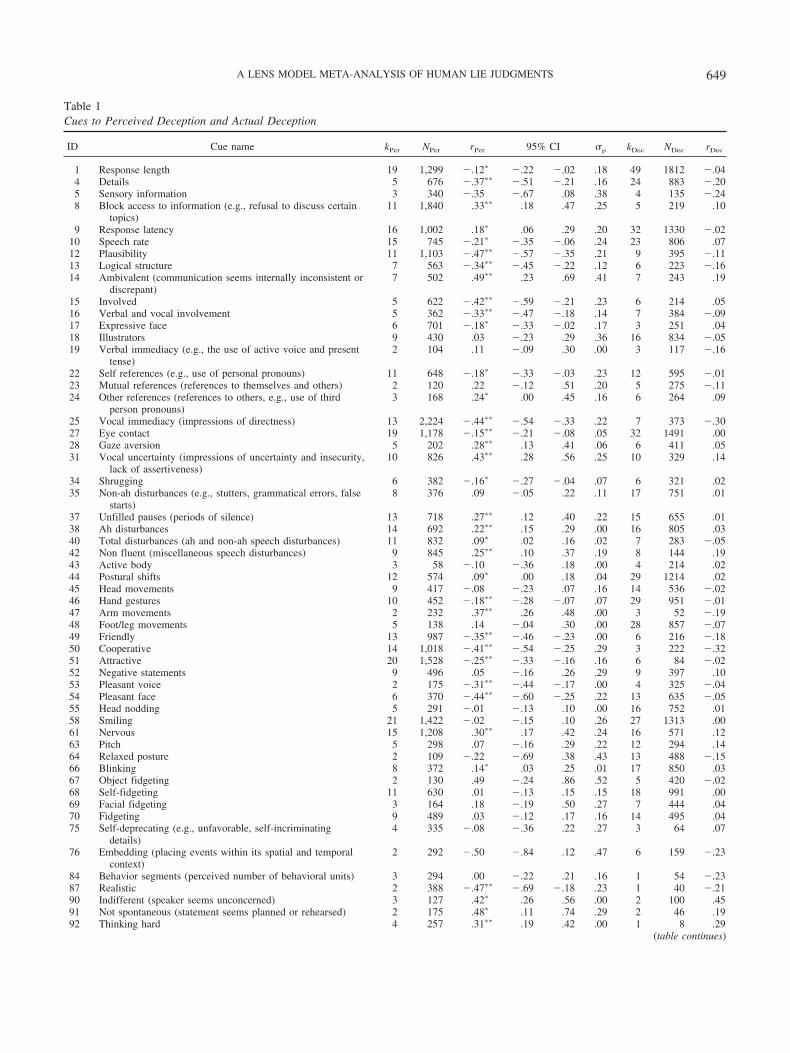
Table 1Cues to Perceived Deception and Actual Deception
ID Cue name kPer NPer rPer 95% CI �� kDec NDec rDec
1 Response length 19 1,299 �.12� �.22 �.02 .18 49 1812 �.044 Details 5 676 �.37�� �.51 �.21 .16 24 883 �.205 Sensory information 3 340 �.35 �.67 .08 .38 4 135 �.248 Block access to information (e.g., refusal to discuss certain
topics)11 1,840 .33�� .18 .47 .25 5 219 .10
9 Response latency 16 1,002 .18� .06 .29 .20 32 1330 �.0210 Speech rate 15 745 �.21� �.35 �.06 .24 23 806 .0712 Plausibility 11 1,103 �.47�� �.57 �.35 .21 9 395 �.1113 Logical structure 7 563 �.34�� �.45 �.22 .12 6 223 �.1614 Ambivalent (communication seems internally inconsistent or
discrepant)7 502 .49�� .23 .69 .41 7 243 .19
15 Involved 5 622 �.42�� �.59 �.21 .23 6 214 .0516 Verbal and vocal involvement 5 362 �.33�� �.47 �.18 .14 7 384 �.0917 Expressive face 6 701 �.18� �.33 �.02 .17 3 251 .0418 Illustrators 9 430 .03 �.23 .29 .36 16 834 �.0519 Verbal immediacy (e.g., the use of active voice and present
tense)2 104 .11 �.09 .30 .00 3 117 �.16
22 Self references (e.g., use of personal pronouns) 11 648 �.18� �.33 �.03 .23 12 595 �.0123 Mutual references (references to themselves and others) 2 120 .22 �.12 .51 .20 5 275 �.1124 Other references (references to others, e.g., use of third
person pronouns)3 168 .24� .00 .45 .16 6 264 .09
25 Vocal immediacy (impressions of directness) 13 2,224 �.44�� �.54 �.33 .22 7 373 �.3027 Eye contact 19 1,178 �.15�� �.21 �.08 .05 32 1491 .0028 Gaze aversion 5 202 .28�� .13 .41 .06 6 411 .0531 Vocal uncertainty (impressions of uncertainty and insecurity,
lack of assertiveness)10 826 .43�� .28 .56 .25 10 329 .14
34 Shrugging 6 382 �.16� �.27 �.04 .07 6 321 .0235 Non-ah disturbances (e.g., stutters, grammatical errors, false
starts)8 376 .09 �.05 .22 .11 17 751 .01
37 Unfilled pauses (periods of silence) 13 718 .27�� .12 .40 .22 15 655 .0138 Ah disturbances 14 692 .22�� .15 .29 .00 16 805 .0340 Total disturbances (ah and non-ah speech disturbances) 11 832 .09� .02 .16 .02 7 283 �.0542 Non fluent (miscellaneous speech disturbances) 9 845 .25�� .10 .37 .19 8 144 .1943 Active body 3 58 �.10 �.36 .18 .00 4 214 .0244 Postural shifts 12 574 .09� .00 .18 .04 29 1214 .0245 Head movements 9 417 �.08 �.23 .07 .16 14 536 �.0246 Hand gestures 10 452 �.18�� �.28 �.07 .07 29 951 �.0147 Arm movements 2 232 .37�� .26 .48 .00 3 52 �.1948 Foot/leg movements 5 138 .14 �.04 .30 .00 28 857 �.0749 Friendly 13 987 �.35�� �.46 �.23 .00 6 216 �.1850 Cooperative 14 1,018 �.41�� �.54 �.25 .29 3 222 �.3251 Attractive 20 1,528 �.25�� �.33 �.16 .16 6 84 �.0252 Negative statements 9 496 .05 �.16 .26 .29 9 397 .1053 Pleasant voice 2 175 �.31�� �.44 �.17 .00 4 325 �.0454 Pleasant face 6 370 �.44�� �.60 �.25 .22 13 635 �.0555 Head nodding 5 291 �.01 �.13 .10 .00 16 752 .0158 Smiling 21 1,422 �.02 �.15 .10 .26 27 1313 .0061 Nervous 15 1,208 .30�� .17 .42 .24 16 571 .1263 Pitch 5 298 .07 �.16 .29 .22 12 294 .1464 Relaxed posture 2 109 �.22 �.69 .38 .43 13 488 �.1566 Blinking 8 372 .14� .03 .25 .01 17 850 .0367 Object fidgeting 2 130 .49 �.24 .86 .52 5 420 �.0268 Self-fidgeting 11 630 .01 �.13 .15 .15 18 991 .0069 Facial fidgeting 3 164 .18 �.19 .50 .27 7 444 .0470 Fidgeting 9 489 .03 �.12 .17 .16 14 495 .0475 Self-deprecating (e.g., unfavorable, self-incriminating
details)4 335 �.08 �.36 .22 .27 3 64 .07
76 Embedding (placing events within its spatial and temporalcontext)
2 292 �.50 �.84 .12 .47 6 159 �.23
84 Behavior segments (perceived number of behavioral units) 3 294 .00 �.22 .21 .16 1 54 �.2387 Realistic 2 388 �.47�� �.69 �.18 .23 1 40 �.2190 Indifferent (speaker seems unconcerned) 3 127 .42� .26 .56 .00 2 100 .4591 Not spontaneous (statement seems planned or rehearsed) 2 175 .48� .11 .74 .29 2 46 .1992 Thinking hard 4 257 .31�� .19 .42 .00 1 8 .29
(table continues)
649A LENS MODEL META-ANALYSIS OF HUMAN LIE JUDGMENTS

appears pleasant, if they are cooperative and involved, and if theirstatements seem plausible, realistic, and spontaneous.
For purposes of establishing benchmarks for stronger andweaker cues to deception judgment, we noted the absolute value ofthe r corresponding to each judgment–cue mean weighted Fisher’sZ. Across all the cues in Table 1, the median absolute r is .25; theabsolute rs at the first and third quartile are .11 and 39.
Let us compare certain cues to deception judgment with peo-ple’s self-reported beliefs about deception. As mentioned earlier,the most commonly self-reported cue is gaze aversion.
Table 1 displays cue–judgment correlations for two variablesrelated to this belief. Consistent with the belief that liars “can’tlook you in the eye,” people are likely to be judged deceptive ifthey avoid eye contact and avert gaze (for the relation of these twovariables to perceived deception, rs � �.15 and .28, respectively).The modest size of these correlations is, however, noteworthy. Eyecontact has a weaker relation to deception judgments than mostof the cues in Table 1—the median cue yielding an absolute r �.25. Although gaze aversion is a somewhat stronger cue todeception judgments, it is still weaker than 30 of the judgmentcues in Table 1.
Meta-Analysis 2: Cues to Perceived and ActualDeception
In Meta-Analysis 2, we sought to test the wrong subjective cuehypothesis. From Meta-Analysis 1, we had data on a large numberof cues to perceived deception; in a second meta-analysis, wesought to compare them with cues to actual deception. For data onthe latter, we turned to work by DePaulo et al. (2003). The wrongsubjective cue hypothesis would be discredited if we obtain astrong positive correlation between the two sets of cues.
Method
For comparison with cues to perceived deception, we soughtactual cues to deception. Hereafter, we call the former judgment
cues and the latter deception cues. We were interested in anyvariable that had been studied as a judgment cue in more than onesample and that had also been studied as an actual deception cuein more than one sample. We found 57 such cues. For purposes ofcomparing judgment cues with deception cues, it was necessarythat the strength of the two types of cues be expressed in the samestatistical metric. In Meta-Analysis 1, we expressed the strength ofjudgment cues in terms of Pearson product–moment correlations,whereas in their earlier meta-analysis DePaulo et al. (2003) ex-pressed the strength of deception cues in terms of a standardizedmean difference. DePaulo et al. (2003) graciously supplied us withtheir study-by-study data. For the present work, we transformedeach standardized mean difference in the DePaulo et al. (2003)database to a Pearson product–moment correlation coefficient. Wethen transformed each r to a Fisher’s Z, cumulated the Zs withstandard methods, then back-transformed the weighted mean Fish-er’s Z to an r—precisely as we had for judgment cues in Meta-Analysis 1. For the resulting actual deception cue correlations, seethe rightmost column of Table 1. Again, these data were collectedby DePaulo et al. (2003). Positive correlations imply that peopledisplay more of the cue when lying than when telling the truth.2
2 The entries in Table 1 are simple correlation coefficients, not standard-ized multiple regression coefficients. In examining the table, readers mayproperly regard each rPer and each rDec as utilization and validity coeffi-cients for a lens model that predicts deception from a single cue. Thus, forjudging deception from response length (rPer � �.12 and rDec � �.04).These do not represent utilization and validity coefficients for responselength, in a lens model that predicts deception from all 66 cues in Table 1.As meta-analysts, we cannot determine the latter multicue utilization andvalidity coefficients because the required multiple regression results are notreported in this literature. For some results on multicue lens models ofdeception, see Meta-Analysis 4.
Table 1 (continued)
ID Cue name kPer NPer rPer 95% CI �� kDec NDec rDec
93 Serious (speaker seems formal) 4 175 �.30 �.55 .01 .27 4 23 .00115 Competent 6 536 �.59�� �.75 �.36 .32 3 90 �.02116 Ingratiating 2 133 �.26� �.41 �.09 .00 4 64 .00134 Admit responsibility 2 96 .09 �.21 .37 .15 2 123 .16
Nonverbal deception pose (communicator enacts typicalnonverbal deception cues)
12 2,139 .38�� .34 .42 .04
Verb deception pose (communicator enacts typical verbaldeception cues)
10 1,885 .35�� .22 .46 .21
Messy clothes 2 102 .37 �.11 .71 .32Weird behaviors 7 293 .29� .05 .50 .25Foreign language 5 184 �.19 �.57 .26 .45Baby face 14 1,441 �.37� �.49 �.24 .23
Note. ID refers to the identification number in Appendix A of B. M. DePaulo et al. (2003). For a further description of the cues, see that appendix. Positiveentries imply that more of the cue is associated with deception or perceived deception. The six last cues in the Table were not included in the meta-analysisby B. M. DePaulo et al. (2003), hence the missing data on ID number, kDec, NDec and rDec. kPer � Number of studies that examined the association betweenperceived deception and the cue; NPer � Number of lie-/truth-tellers in those studies; rPer � r corresponding to the mean Fisher’s Zr for the associationbetween perceived deception and the cue; 95% CI � a 95% confidence interval for the population correlation coefficient between perceived deception andthe cue; �� � the square root of the true variance of the population correlation coefficient between perceived deception and the cue; kDec � Number ofstudies that examined the association between actual deception and the cue; NDec � Number of lie-/truth-tellers in those studies; rDec � r correspondingto the mean Fisher’s Zr for the association between actual deception and the cue.� p � .05 (at which relation differs significantly from 0). �� p � .001 (at which relation differs from 0).
650 HARTWIG AND BOND

Results
We were especially interested in those attributes that had beenexamined in more than one sample as a cue to perceived deceptionand in more than one sample as a cue to actual deception. For eachof those 57 cues, we compared a mean weighted Fisher’s Z for therelation of the cue to perceived deception with a mean weightedFisher’s Z for the relation of that cue to deception. Correlatingthese Fisher’s Zs across cues, it is evident that the relation of a cueto deception is positively associated with its relation to perceiveddeception (r � .59). Although the correlation between deceptioncues and judgment cues is not perfect, it is positive and substantialin size. The correlation between actual deception cues and judg-ment cues is much larger, for example, than the correlation be-tween deception judgments and deception itself. Again, the lattertypically yields r � .21. The wrong subjective cue hypothesiswould not have predicted such a close correspondence betweendeception cues and judgment cues.
Kraut (1980) was the first to suggest that behaviors are morestrongly related to perceived deception than actual deception. Toassess this claim, we compared two absolute values for each of 57cues—the absolute mean weighted Fisher’s Zr for the associationof that cue to deception and the absolute mean weighted Fisher’sZr for the cue’s association to perceived deception. Averagingacross the cues, the mean absolute Fisher’s Zr for the associationof cues to deception is .09, and the mean absolute Fisher’s Zr forthe association of cues to judgments of deception is .25. By anunweighted test with cue as the unit of the analysis, these meansdiffer significantly, t(56) � 8.22, p � .001. Thus, it is true thatbehaviors are more strongly related to judgments of deception thanto actual deception.
We compared the relation of each cue to deception with itsrelation to perceived deception—comparing, in particular, the tworelevant weighted mean Fisher’s Zrs. We set a per-cue two-tailedalpha-level of .05. Results show that for 22 of the 57 cues (that is,38.59%), the two relations are significantly different. Inspectingmeans that it is apparent that all 22 significant differences are onesin which the judgment cue is stronger than the deception cue.
We examined data from the 22 cues that have a significantlydifferent relation to actual deception than to perceived deception.Examination showed that 14 of those cues had the same directionalrelation to actual deception and perceived deception. None of theremaining eight cues had a statistically significant relation todeception at p � .05. There is no evidence here that perceiversinfer deception from truth cues or infer truthfulness from deceptioncues.
As noted above, there is a general tendency for cues to be morestrongly related to perceived deception than actual deception. Infact, the results above indicate that the mean absolute Zr forperceived deception is 2.77 times as large as the mean absolute Zrfor actual deception (those values being .25 and .09). We won-dered whether this general size difference could explain the 22statistically significant differences between cues to actual decep-tion and to perceived deception. To assess this possibility, wenoted the mean weighted Fisher’s Zrs for the relevant 22judgment–cue correlations and divided each of these values by2.77 (the ratio of the mean absolute relation between cues toperceived deception and cues to actual deception). We then testedfor the differences between the relation between a cue and decep-
tion with this deflated measure of the relation between that cue andperceived deception—the deflation offsetting a general tendencyfor judges’ cue utilization coefficients to exceed validity coeffi-cients. Although we found 22 significant differences between cuesto actual deception and cues to perceived deception in the rawanalyses above, this second analysis revealed only one significantdifference at p � .05, for the cue arm movements. With this oneexception, differences between cues to deception and to perceiveddeception are not cue-specific. Rather, they reflect a general ten-dency for judges’ utilization coefficients to be larger than validitycoefficients.
Meta-Analysis 3: Within-Study Evidence
Meta-Analysis 2 revealed a strong positive correlation betweencues to actual deception and cues to perceived deception. Thiscorrelation seems to discredit the wrong subjective cue hypothesis.Before rejecting that hypothesis, however, we must acknowledgeone of the features of Meta-Analysis 2. It incorporated data fromall studies of actual deception cues and judgment cues. Many ofthe studies of deception cues did not provide data on deceptionjudgments. Thus, our data on judgment cues came from one set ofstudies, and our data on deception cues came from another set ofstudies. The two sets of studies differ in unknown ways, and thesedifferences complicate any interpretation of the meta-analytic re-sults we have reported. For a controlled comparison of actualdeception cues and judgment cues, we sought within-study evi-dence—hoping to review all results to date from researchers whohad assessed both actual deception cues and judgment cues in thevery same study.
Method
We sought studies in which researchers had measured both cuesto actual deception and cues to deception judgment. Planning tocorrelate the two sets of cues within each study, we restrictedattention to instances in which a researcher had reported correla-tions among deception and three or more cues, as well as corre-lations among perceived deception and those same cues on thesame set of senders. From the studies uncovered for Meta-Analysis1, we found 25 such sender samples. They included a total of 1,422senders and judgments of those senders made by a total of 2,250individuals. From each of these samples, we converted each Pear-son’s r for a deception cue or judgment cue to a Fisher’s Zr. Thenwe correlated the Zrs for actual deception cues with the Zrs forjudgment cues. This resulted in a cross-cue Pearson’s r. It assessesthe relation between actual deception cues and judgment cueswithin a particular sample.
Results
Over the 25 sender samples, correlations for the relation be-tween actual deception cues and judgment cues varied widely. Themaximum cross-cue r was .97, and the minimum was �.68.Twenty-two of the 25 cross-cue correlations were positive. Themedian correlation was .54. To combine these cross-cue correla-tions, we began by converting each r to a Fisher’s Zr, then appliedstandard random-effects meta-analytic methods. In these aggre-gated within-study results, the more strongly a cue is associated
651A LENS MODEL META-ANALYSIS OF HUMAN LIE JUDGMENTS

with deception, the more strongly it is associated with perceiveddeception (mean weighted Zr � .90). The corresponding Pearson’sr is .72, 95% CI [.70, .74].
For 22 of these samples, we also had a measure of judges’accuracy in discriminating lies from truths. We expressed judgeaccuracy as a correlation coefficient then converted this r to aFisher’s Zr. The stronger the positive relation between deceptioncues and judgment cues in a study, the greater is judges’ accuracyin that study (for the correlation between the two sets of Zrs, r �.60). As the lens model shows, the accuracy of a deception judg-ment will increase if perceivers use cues that in fact reflect deceit.
Within each of 25 sender samples, we also noted the means oftwo sets of absolute Fisher’s Zrs—one set indexing the relations ofvarious cues to actual deception and the other set indexing therelations of those cues to perceived deception. Averaging acrossthe 25 sender samples, we find that the mean absolute Fisher’s Zrfor the relation of a behavior to deception is .17, and the meanabsolute Fisher’s Zr for the relation of a behavior to perceiveddeception is .27. As was evident in the cross-study comparison,these within-study means indicate that perceivers’ coefficients forutilizing cues to deception are larger than the validity coefficientsfor the cues, t(24) � 3.89, p � .005.
Perhaps our averaging of all cues to deception is misguided.Perhaps perceivers intuit the behavior that is most strongly relatedto deception in a particular situation and base their judgments inthat situation on this optimal cue. Averaging across 25 sendersamples, the mean of the maximum absolute Fisher’s Zr betweenany cue and deception is .39, whereas the corresponding mean ofthe maximum absolute Fisher’s Zr between any cue and perceiveddeception is .61. By standard unweighted methods, this is a sig-nificant difference, t(24) � 3.72, p � .005. Thus, the validity ofthe optimal cue is lower than the largest utilization coefficientof any cue. As usual, cues are more strongly related to judg-ments of deception than to deception itself.
Meta-Analysis 4: Multiple Cues
The purpose of Meta-Analysis 4 is to investigate whether inac-curacy in lie judgments is mainly due to incorrect decision-makingstrategies or due to a lack of valid cues to deception and toestablish the matching of cue-based predictions of deception withpredictions of deception judgments. In the analyses discussed sofar, it is assumed that perceivers judge deception from a single cue.Single-cue lens analyses are implicit in the correlation coefficientsof Table 1. Perhaps perceivers do not judge deception from asingle cue. Perhaps they judge it from multiple cues, and deceptiongives rise to multiple cues. In that case, the correlation coefficientsof Table 1 would not be appropriate validity and utilization coef-ficients.
As mentioned above, lens model analysis reveals that the cor-relation coefficient between actual deception and perceived decep-tion is the sum of two terms, one of which involves the correlationbetween errors in predicting a sender’s deceptiveness and thatsame sender’s perceived deceptiveness. Assuming that these errorterms are uncorrelated, the correlation between actual deceptionand perceived deception is the product of three factors: RDec, RPer,and G, where RDec is the multiple R for predicting deception fromcues, RPer is the multiple R for predicting perceived deception fromthose same cues, and G is the correlation between predictions of
senders’ deception from cues and predictions of their perceiveddeception from those same cues. In order to use the multiple-cuelens model for deception, it is necessary to estimate these threefactors: RDec, RPer, and G. Let us do so.
Method
We sought studies in which deception had been predicted fromtwo or more cues. We searched for statistical analyses that madethese predictions and reported a statistic correlating predicteddeception with actual deception. Some authors reported discrimi-nant analyses; others reported logistic regressions, and still othersreported ordinary multiple regressions. We sought results from allthree kinds of analyses, as long as two conditions were met. First,we required that the variables used to predict deception be chosenon a priori nonstatistical grounds. We did not use results fromstepwise analyses or analyses that chose as predictors of deceptiononly those variables that had shown a significant univariate rela-tion to deception. Such analyses would overstate the relationbetween deception and deception cues, as Thompson (1995) ex-plains. Second, we required that the researcher report (or that wecould determine) an adjusted (or shrunken) multiple correlationcoefficient for the predictability of deception from cues. We usedthese same criteria in searching for analyses that predicted per-ceived deception from two or more cues.
We found 59 multiple-cue predictions of deception that satisfiedour criteria. These represented predictions of deception by 3,428senders. From each of the 59 sender samples, we coded a multiplecorrelation coefficient (an R) for predicting deception from two ormore cues—defining each RDec as the square root of an adjusted(or shrunken) R2.
We found 30 multiple-cue predictions of perceived deceptionthat satisfied the criteria. These represented data from 1,178 send-ers and 3,497 judges. From each of the 30 sender samples, weagain coded RPer as the square root of an adjusted (or shrunken) R2.
Results and Discussion
For predicting actual deception from multiple cues, the medianRDec is .46. The interquartile range is .24 to .65. The number ofcues entering into these Rs ranges from 2 to 38. Across the 59multiple correlation coefficients, there is no relation between themagnitude of an RDec and the number of cues entering into it (r �.03, ns).
For a meta-analytic approach to combining multiple correlationcoefficients, we used methods suggested by Konishi (1981). Webegan by applying a Fisher’s Zr transformation to each RDec andweighting it by N-p-1, where N is the number of senders and p isthe number of cues from which deception was predicted. We thencomputed a mean inverse-variance weighted Fisher’s Zr and back-transformed it to an R. For predicting deception from two or morecues, the R corresponding to the mean of 59 weighted Fisher’s Zrsis .36, 95% CI [.33, .38].
We were also interested in the prediction of perceived deceptionfrom multiple cues. The median RPer is .61. The interquartile rangeis .46 to .67. The number of cues entering into these multiple Rsranges from 2 to 16 and is uncorrelated with the magnitude of theRs (r � �.03, ns).
652 HARTWIG AND BOND

As in the analysis above, we converted each RPer to a Fisher’s Zrand weighted it by N-p-1. For predicting perceived deception fromtwo or more cues, the R corresponding to the mean of 30 weightedFisher’s Zrs is .63, 95% CI [.60, .65]. From multiple cues, it iseasier to predict perceived deception than deception. This is ap-parent in the multiple correlation coefficients we have reported.Moreover, this difference in multiple correlation coefficients isconsistent with some results reported above, in which individualbehaviors correlate more strongly with perceived deception thanactual deception.
The typical relation between actual deception and perceiveddeception yields an accuracy of r � .21 (Bond & DePaulo, 2006).As shown by the meta-analytic estimates above, deception can bepredicted from two or more cues to a degree that typically yieldsRDec � .34. Multiple-cue predictions of deception judgment typ-ically yield RPer � .61. We cannot calculate G from individualstudies. However, by manipulating Equation 1, above, in themanner suggested by Stenson (1974), we infer that
G � racc/�RDecRPer� � .21/�.36.63� � .93. (2)
Thus, behaviorally based predictions of deception are verystrongly correlated with behaviorally based predictions of per-ceived deception (r � .93),3 and the accuracy of deception judg-ments can be quantitatively decomposed as
racc � RDec � RPer � G from above. (3)
.21 � .36 � .63 � .93.
As we can see in this equation, the accuracy of deception judg-ments is most constrained by the lack of valid behavioral cues todeception, less constrained by judges’ unreliability in using thosecues, and unconstrained by the matching of behaviorally basedpredictions of deception with predictions of deception judgment.
For purposes of comparison, it may be useful to describe theresults of lens model analyses in other domains. Karelaia andHogarth (2008) summarized lens model analyses of human judg-ments of many attributes other than deception. Across 249 studies,they found an average accuracy coefficient of .56, much higherthan the .21 accuracy correlation in judgments of deception. Theyfound that environmental criteria could be predicted by cues withan average multiple of R � .80 and that human judgments of thecriterion could be predicted by those cues with an average multipleof R � .81. The first is much higher than the .36 predictability ofdeception, and the second is somewhat higher than the .63 pre-dictability of perceived deception. Finally, Karelaia and Hogarth(2008) found that statistical predictions of environmental criteriacorrelated .80 with statistical predictions of judgments of thosecriteria. Thus, the matching of deception with deception judgments(r � .93) is higher than the matching of other criteria with humanjudgments of those criteria.
General Discussion
The purpose of this work was to shed new light on deceptionand its detection by analyzing judgments of veracity usingBrunswik’s (1952) lens model. In particular, we test the validity ofthe hypotheses that (a) lie judgments are often inaccurate due toincorrect cue reliance of lie-catchers and (b) lie judgments areoften inaccurate due to lack of valid cues to deception. Our goal
was to generate new knowledge about naıve lie detection in twoways. First, by analyzing judgments of deception using the lensmodel, we offer new descriptive information about the character-istics of lie judgments and why they often fail. This is a questionof basic importance for the theoretical understanding of interper-sonal perception in general and deception judgments in particular.Second, by quantifying the constraints on accuracy imposed by thestrategies of the perceiver and by the difficulty of the judgmenttask, we can offer some prescriptive information about how accu-racy in deception detection can be increased. This is a question ofimportance for applied psychology because veracity assessmentsare critical in a number of settings.
Cues to Deception Judgments
As discussed earlier, the available research typically employsself-reports to tap the decision-making strategies people employwhen attempting to establish veracity (Global Deception ResearchTeam, 2006). Deception scholars have noted that self-reportsmight not offer entirely valid information about actual decisionmaking because people may have limited insight into their owncognitive processes (e.g., Strömwall, Granhag, & Hartwig, 2004).Still, only a few studies have attempted to go beyond self-reportsto establish the actual correlates of deception judgments (Bond etal., 1992; Desforges & Lee, 1995; Ruback & Hopper, 1986; Vrij,1993), and to this date, there is no quantitative overview of thesestudies. The prevailing notion in the literature is that false stereo-types about deceptive behavior are main contributors to the failureof lie judgments to reach hit rates substantially above chance levels(Park, Levine, McCornack, Morrison, & Ferrara, 2002).
The results of this meta-analysis contrast with past research inimportant ways. In general, the analysis shows that actual corre-lates of deception judgments differ from those that people report.In particular, the robust finding from surveys that people associatedeception with lack of eye contact receives little support. Eyecontact is a weaker judgment cue than most of the 66 cues inMeta-Analysis 1, and gaze aversion is weaker than 30 cues in thesame meta-analysis. Other common self-reported cues to deceptionare body movements and fidgeting (Akehurst et al., 1996; Ström-wall & Granhag, 2003). Similar to the findings on eye behavior, itseems that the link between these behaviors and deception judg-ments is weaker than previously thought. Although the relation
3 With this estimate, it is assumed that there is no correlation betweentwo error terms—the error from a model predicting deception from cuesand the error from a model predicting deception judgments from thosesame cues. It is possible that these errors are correlated. To our knowledge,no correlation between these error terms has ever been reported in theliterature on deception judgment. In the absence of any information aboutthe correlation between error terms in judgments of deception, let us drawon a meta-analysis of 204 lens model studies by Karelaia and Hogarth(2008). There, a 95% CI for the mean estimate of the correlation amonglens-model error terms was .02–.06. Plugging these values into the relevantlens model equation (along with values we computed from the deceptiondetection literature), one would infer that cue-based predictions of decep-tion correlate positively with cue-based predictions of deception judgment,with a value of the correlation coefficient between .73 and .86. We urgefuture researchers to fit lens models to their data on deception judgmentsand to report correlations between cue-based predictions of deception andcue-based predictions of deception judgment.
653A LENS MODEL META-ANALYSIS OF HUMAN LIE JUDGMENTS

between arm movements and deception judgments is moderate, therelation to postural shifts is weak, as is the link to head, hand, andfoot/leg movements and fidgeting. Among the strongest correlatesof deception judgments emerging from this meta-analysis are thatpeople are judged as deceptive when they appear incompetent andambivalent, and when the statement is implausible and lacksspontaneity. These cues are not commonly reported in studiesemploying the self-report method (Strömwall, Granhag, &Hartwig, 2004). These results suggest that the behaviors peopleactually rely on when judging veracity differ markedly from thestereotype previously thought to influence much of lie-catchers’decision making.
Even though these results might be surprising, they are consis-tent with research on cognitive processes demonstrating that self-knowledge about beliefs, motives, and judgments is often inaccu-rate (Fiske & Taylor, 2008; G. A. Miller, 1962; Neisser, 1967;Nisbett & Ross, 1980). This research suggests that when asked toaccount for their attributions and judgments, people may rely on apriori theories rather than actual insight into their thought pro-cesses simply because these processes might be inaccessible (Nis-bett & Wilson, 1977). Such an a priori theory could be thecommon sense notion that liars experience guilt, shame, and ner-vousness and that these emotions are evident in nonverbal behav-iors such as gaze aversion and fidgeting (Bond & DePaulo, 2006).It is plausible that this naıve theory is a product of deliberatereasoning produced in response to a question about one’s beliefsbut that actual decision making is driven by intuitive, implicitcognitive processes that lie partly outside the realm of consciousawareness (Gigerenzer, 2007).
If people do not base their judgments on the explicit stereotypeof liars as nervous and guilt-stricken, what are the implicit theoriesthat actually lie behind judgments of deception? Inspecting themeta-analytic pattern on cues to deception judgments, it seems thatpeople are likely to judge communicators as deceptive if theyprovide implausible, illogical accounts with few details, particu-larly few sensory details. This is similar to predictions fromtheoretical frameworks on self-experienced versus imaginedevents that have been employed to study verbal differences be-tween fabricated and truthful accounts (Johnson & Raye, 1981;Sporer, 2004). One way to interpret our finding is that peoplemight be intuitively in tune with what these frameworks call“reality criteria.” Speculatively, a lifetime of exposure to state-ments (most of them likely to be truthful) might serve to create anintuitive feeling for the characteristics of self-experienced events.
The results suggest that people seem deceptive if they sounduncertain and appear indifferent and ambivalent. This fits with oneof the main predictions from the self-presentational perspective (De-Paulo, 1992; DePaulo et al., 2003), which states that deceptive ac-counts might be less embraced by communicators than are truthfulones for several reasons: Liars might lack familiarity with the domainthey are describing, and they might have less emotional investment inthe claims they are making. Also, awareness of the risk of beingdisproven might give rise to ambiguous and vague statements(Vrij, 2008). In sum, with regard to both verbal content andnonverbal behavior, people’s cue reliance seems reasonably in linewith what actually characterizes deception.
The overall pattern, that implicit notions about deceptive behav-ior are more accurate than explicit ones, is supported by researchon what is referred to as indirect deception detection (Vrij, Edw-
ard, & Bull, 2001). This research shows that people might perceiveand process deceptive and truthful statements differently in waysthat explicit measurements may not pick up on (Anderson, 1999;DePaulo & Morris, 2004; Anderson, DePaulo, Ansfield, Tickle, &Green, 1999; DePaulo, Jordan, Irvine, & Laser, 1982; DePaulo,Rosenthal, Green, & Rosenkrantz, 1982; Hurd & Noller, 1988).For example, a meta-analysis on the relation between accuracy andconfidence in deception judgments showed that people were moreconfident when they saw a truthful statement than when they sawa deceptive one, regardless of what explicit veracity judgment theymade (DePaulo et al., 1997). A study on deception detection inclose relations showed that even though explicit veracity judg-ments were not accurate, judges reported feeling more suspiciouswhen watching a deceptive statement than when watching a truth-ful statement (Anderson, DePaulo, & Ansfield, 2002). It might befruitful in the future for researchers to further explore the relationbetween explicit and implicit processes in deception judgments.For example, research could investigate the effects of increasingperceivers’ reliance on intuitive impressions of veracity (e.g., byasking judges to make decisions under cognitive load), with theexpectation that this might increase judgment accuracy (see Al-brechtsen, Meissner, & Susa, 2009). However, it is not likely thatthe improvement would be substantial, given our finding thatweaknesses in the validity of cues to deception constrain accuracy.
It is worth noting that the strongest cues to deception judgmentsare not single behaviors but global impressions, such as ambiva-lence. It is plausible that such impressions consist of a variety ofmore minute behavioral changes, possibly on both verbal andnonverbal levels. However, to our knowledge, no study has at-tempted to examine the components of these impressions. Giventhe finding from DePaulo et al. (2003) that global impressions arestronger cues to deception than individual cues, and our findingthat such impressions are the best predictors of deception judg-ment, we encourage future research to explore the behavioralcomponents of these impressions further.
It is possible that cue reliance is not uniform across all groupsand settings. For example, legal professionals (e.g., customs andpolice officers) and lay people might differ in the cues on whichthey base their judgments. On the basis of previous research (e.g.,Bond & DePaulo, 2006), we do not expect that legal professionalswill outperform lay judges. Speculatively, due to the salience ofdeception judgments in the life of legal professionals, the con-scious stereotype of liars as fidgety and gaze aversive may becomechronically accessible (Fiske & Taylor, 2008). If this is true, legalprofessionals’ cue reliance should be more similar to the patternobtained using the self-report method (and less accurate). As wedid not investigate moderator variables in the current study, weencourage future research to explore this and other variablespossibly moderating cue reliance.
Judgment Cues Versus Deception Cues: Testing theWrong Subjective Cue Hypothesis
The first meta-analysis does not provide support for the wrongsubjective cue hypothesis. To subject the wrong subjective cuehypothesis to a quantitative test, we conducted a second meta-analysis in which we compared cues to deception judgments(judgment cues) with behavioral cues to deception (deceptioncues). The wrong subjective cue hypothesis predicts a discrepancy
654 HARTWIG AND BOND

between judgment cues and deception cues, implying that peoplerely on cues that are either unrelated to deception or related todeception in the opposite direction of their expectations. Meta-Analysis 2 does not provide support for this prediction. In fact, atleast four interrelated pieces of evidence counter to the wrongsubjective cue hypothesis emerged from our analyses. First, wefound a strong positive correlation between judgment cues anddeception cues. The more strongly a cue is related to deception, themore likely people are to rely on that cue when judging veracity.The relation is not perfect but is much stronger than would bepredicted from the premise of the wrong subjective cue hypothesis.Second, of the more than 50 cues investigated, only slightly morethan a third showed significant discrepancies between judgmentcues and deception cues. Third, when judgment cues did differfrom deception cues, it was typically the case that the judgmentcue matched the deception cue in its directional relation to decep-tion but that the magnitude of the judgment cue was larger thanthat of the deception cue. For only eight out of 57 cues did peoplerely on a behavior that was unrelated to deception, and for nobehavior did we observe a directional error (i.e., that judgesassociated more of a particular behavior with deception when thecase was that communicators displayed less of it when lying, or theother way around). This suggests that people are rarely inaccurateabout the relation between a given behavior and veracity—in casesin which judgment cues differed from deception cues, the errorwas most frequently due to judges’ overestimation of the magni-tude of the relation rather than outright misconceptions about therelation between a behavior and deception. Fourth, a lens modelanalysis revealed a very strong matching (r � .93) between be-haviorally based predictions of deception and behaviorally basedpredictions of perceived deception.
In light of these findings, we believe the argument that peopleare misinformed about cues to deception ought to be revised. Theclaim is true in the sense that people’s explicit notions aboutdeception are largely inaccurate and reflects a stereotype notsupported by research on objective behavioral differences. How-ever, when mapping the behaviors that actually covary with judg-ments of deception, a different picture is revealed. People seemintuitively in tune with the characteristics of deceptive behavior.Rarely do people overestimate the extent of an individual behav-ioral link to deception and even more rarely do people rely on cuesthat are unrelated to veracity. In conclusion, it seems people’sintuitive notions about cues to deception are far less flawed thanpreviously thought.
Implications
Our analysis provides new information about why lie-catchersoften fail. In explaining the lack of accuracy, deception scholarshave operated on the assumption that reliance on incorrect heuris-tics about deceptive processes limits judgment accuracy. In linewith this assumption, a common recommendation on how toimprove judgment accuracy has been that observers ought to shifttheir reliance on invalid cues such as gaze aversion, fidgeting andposture shifts to cues that have been found to be more valid basedon the scientific literature (Vrij, 2008). Our results suggest thatboth the descriptive and prescriptive conclusions about judgmentperformance ought to be qualified. Starting with the descriptiveaspect, the analyses of cues to deception judgments in Meta-
Analyses 1–3 show that observers do not in general rely on thewrong cues to deception. The discrepancy between our results onsubjective cues to deception is interesting for two reasons. First,the results indicate that self-reports do not offer valid informationabout the true nature of lie-catchers’ decision making. This impliesthat if researchers wish to map lie-catchers’ judgments, they oughtto study actual performance, not self-reports about performance.Second, the discrepancy between self-reported judgment cues andactual judgment cues informs our basic understanding of processesof deception detection by suggesting that deception judgments arelargely driven by intuitions that may be inaccessible to the con-scious mind. People do not seem to know what behaviors they usewhen judging veracity. The behaviors they claim to use are largelyinaccurate, but the behaviors they actually rely on show a substan-tial overlap with objective cues to deception. Simply put, intuitionoutperforms explicit notions about deception.
With regard to prescriptive implications, the results provide newinformation about how judgment achievement can be improved.The results from Meta-Analysis 4 suggest that lack of validity incues to deception degrade judgment performance more stronglythan improper cue reliance. This suggests that the best way toimprove judgment achievement is to increase behavioral differ-ences between liars and truth tellers rather than to educate per-ceivers about actual objective cues to deception. To be fair, inexplaining deception detection inaccuracy, scholars have consis-tently highlighted the stable finding that cues to deception arescarce and weak. Nevertheless, attempts to improve deceptiondetection performance have until recently almost exclusively fo-cused on altering the strategies used by perceivers to detect de-ception. A number of studies have been conducted with the pur-pose of training observers to make more accurate judgments byeither informing them of actual cues to deception, by providingoutcome feedback about their performance, or both (Frank &Feeley, 2003). Such attempts to improve judgment accuracy haveshown either no effects of training or only minor improvement.Our results provide a new explanation for why such trainingprograms have largely failed: Informing lie-catchers of objectivecues to deception might be ineffective not because judges areimmune to education but also because their use of cues to decep-tion already largely overlaps with actual cues to deception. Feed-back could be a way to improve intuitive cue reliance further, butour results indicate that in order to substantially improve perfor-mance, it might be more fruitful to manipulate the decision-makingtask than to manipulate the decision-making strategies of lie-catchers. In line with our claim that training observers to rely ondifferent cues might not be the optimal way to increase perfor-mance, one study showed that perceivers’ performance wasslightly enhanced by both bogus training (in cues that are notactually related to deception) and training in actual cues to decep-tion (Levine, Feeley, McCornack, Hughes, & Harms, 2005). Thissuggests that to the extent that training in valid cues to deceptionis effective at all, it might be the act of training itself rather thanits content that is responsible for improvements in performance,possibly by creating more motivated lie-catchers. Future researchaiming to improve judgments through cue information should firstestablish empirically that judges indeed rely on the wrong cues. Onthe basis of our results, such incorrect cue reliance seems quiteunlikely.
655A LENS MODEL META-ANALYSIS OF HUMAN LIE JUDGMENTS

Eliciting Valid Cues to Deception
If lie detection accuracy is more strongly degraded by limita-tions in behavioral indicators of deception, it makes sense toattempt to increase behavioral differences between liars and truthtellers in order to improve the chances of accurate deceptionjudgments. Recently, several lines of research have taken on thistask with promising results. This research has largely focused onhow to elicit valid cues to deception in interactional settings, mosttypically interviews (Levine, Shaw, & Shulman, 2010; Vrij et al.,2009). First, researchers drawing on the theoretical notion thatlying might be more cognitively demanding than truth telling haveattempted to increase cues to deception by imposing further cog-nitive load on targets. The idea is that liars would be morehampered by such cognitively demanding tasks because theirresources are already preoccupied with the cognitive challenge oflying. In one study, liars and truth tellers were asked to tell thestory in reverse order. Cues to deception were more pronouncedwhen the story was told in reverse order, and lie-catchers weremore accurate when judging these statements, compared with thecontrol condition (in which the statement was told in chronologicalorder, Vrij et al., 2008).
Based on similar premises postulating cognitive differencesbetween liars and truth tellers, a second line of research hasfocused on the possibility of eliciting cues to deception by usingthe available case information strategically. This research capital-izes on the fact that liars and truth tellers have different verbalstrategies, in particular when they are unaware of the informationheld by the lie-catcher (Hartwig, Granhag, & Strömwall, 2007).Using a mock theft paradigm in which both liars and truth tellerstouched a briefcase (from which liars then stole a wallet), Hartwig,Granhag, Strömwall, and Vrij (2005) found that when the infor-mation that their fingerprints had been found on the briefcase wasdisclosed in the beginning of the interview, liars and truth tellersboth gave plausible explanations for being in contact with thebriefcase (e.g., that they just moved it while looking for some-thing). Lie-catchers could not distinguish between these true andfalse denials. In contrast, when the information was strategicallywithheld and the interviewer posed questions about it (e.g., ‘Didyou see or touch a briefcase?’), verbal cues such as implausibilityappeared as liars often proposed denials that violated the knowninformation (e.g., by saying they were not close to the briefcase).
A third approach drawing on cognitive differences between liarsand truth tellers is the ACID approach, outlined and studied by K.Colwell, Hiscock-Anisman, Memon, Taylor, and Prewett (2007).In this approach, targets are questioned using an interview styleinspired by the Cognitive Interview (CI). CI was developed toimprove the accuracy and completeness of memory reports anduses mnemonic techniques based on cognitive psychology. TheACID approach uses such mnemonics with the assumption thatthey will enhance verbal differences between liars and truth tellers.Mnemonics may provide richer details from truth tellers (forwhom they serve as cues to recall) by probing for specific detailswhile increasing the challenges for liars who might have difficul-ties fabricating (or lack the willingness to fabricate) information inresponse to these probes. In line with expectations, research hasshown that cues to deception become more pronounced when liarsand truth tellers are questioned with this approach.
Our results have implications for lie detection in the real world.The findings suggest that people who wish to make accuratejudgments of credibility in everyday life or as part of their pro-fessions (e.g., customs officers, police officers and other legalprofessionals) may benefit from learning about methods to in-crease cues to deception through interviewing methods such asthose outlined above. That is, rather than learning about the char-acteristics of deceptive behavior, real world lie-catchers may wantto educate themselves about methods to actively elicit cues todeception.
Concluding Remarks
We believe this study offers new and intriguing informationabout deception of both theoretical and practical importance. First,our results suggest the novel conclusion that lie-catchers’ intuitivenotions about cues to deception are reasonably accurate. People’sexplicit theories about deceptive behavior seem to exert littleinfluence over actual decision making, suggesting that implicitprocesses not only play a role but might even be dominant informing impressions about veracity. This finding fits with a waveof social cognition research showing that processing of socialinformation is often driven by automatic rather than controlledprocesses (Bargh, 1997; Bargh & Chartrand, 1999). Such researchshows that automaticity in processing might emerge as a functionof practice, also referred to as proceduralization (Fiske & Taylor,2008). Given the frequency of honesty judgments in everyday life(DePaulo & Kashy, 1998), automaticity in veracity assessmentsmakes theoretical sense.
How is it possible that intuitive notions about cues to deceptionoverlap to such a large extent with actual behavioral cues todeception? Previous research has suggested that lack of feedbackabout the actual veracity of communicators might prevent learningproper rules from experience (Granhag, Andersson, Strömwall, &Hartwig, 2004; Hartwig, Granhag, Strömwall, & Andersson, 2004;Hogarth, 2001; Vrij & Semin, 1996). Given that the current studyshows that actual decision making is less flawed than previouslythought, we might have to reinterpret the role of feedback indeception judgments. Speculatively, people might receive feed-back about veracity often enough (perhaps through sources ofinformation not often captured by the typical laboratory paradigm,see Park et al., 2002) to shape proper intuitions about deceptivedemeanor. Whether such feedback is indeed the explanation forjudges’ cue reliance is a question for future research.
We do not challenge the robust conclusion that deception de-tection is often inaccurate. However, we challenge the explanationproposed in previous research by demonstrating that the case forthe wrong subjective cue hypothesis in the accumulated literatureis quite weak. Lens model analyses show that the strongest con-straint on performance is the lack of valid behavioral indicators ofdeception rather than incorrect cue reliance. That behavioral dif-ferences between liars and truth tellers are minute is not surprisinggiven two factors: First, people lie frequently in everyday life andare therefore likely to be skilled as a function of practice (Vrij,2008). Second, as emphasized by the self-presentational perspec-tive on deception, convincing another that one is telling the truthentails similar tasks for deceptive and truthful communicators.Both share the motivation to create a credible impression and bothwill engage in deliberate efforts to create such an impression
656 HARTWIG AND BOND

(DePaulo et al., 2003). However, that cues to deception are scarceis not necessarily a universal fact. Perhaps liars in the majority ofthe laboratory research conducted so far are not facing enoughof a challenge to give rise to valid behavioral differences. In mostof these studies, people are asked to provide a statement with norisk of being challenged about particular details and no risk ofbeing disproven by external information. New research has shownthat it is possible to increase cues to deception by interventionsbased on the theoretical assumption that under certain circum-stances, deceptive statements might be more cognitively demand-ing to produce. Our results support these efforts by suggesting thatcreating stronger behavioral cues to deception is the key to im-prove the accuracy of lie judgments.
References
References marked with an asterisk indicate studies included in themeta-analyses that are discussed in the text. For a complete list, go tohttp://dx.doi.org/10.1037/a0023589.supp
Akehurst, L., Köhnken, G., Vrij, A., & Bull, R. (1996). Lay persons’ andpolice officers’ beliefs regarding deceptive behavior. Applied CognitivePsychology, 10, 461– 471. doi:10.1002/(SICI)1099-0720(199612)10:6�461::AID-ACP413�3.0.CO;2-2
Albrechtsen, J. S., Meissner, C. A., & Susa, K. J. (2009). Can intuitionimprove deception detection performance? Journal of ExperimentalSocial Psychology, 45, 1052–1055. doi:10.1016/j.jesp.2009.05.017
Anderson, D. E. (1999). Cognitive and motivational processes underlyingtruth bias (Doctoral dissertation). Available from ProQuest Dissertationsand Theses database. (UMI No. 9935030)
Anderson, D. E., DePaulo, B. M., & Ansfield, M. E. (2002). The devel-opment of deception detection skill: A longitudinal study of same-sexfriends. Personality and Social Psychology Bulletin, 28, 536–545. doi:10.1177/0146167202287010
Anderson, D. E., DePaulo, B. M., Ansfield, M. E., Tickle, J. J., & Green,E. (1999). Beliefs about cues to deception: Mindless stereotypes oruntapped wisdom? Journal of Nonverbal Behavior, 23, 67–89. doi:10.1023/A:1021387326192
Bargh, J. A. (1997). The automaticity of everyday life. In R. S. Wyer Jr.(Ed.), The automaticity of everyday life: Advances in social cognition(pp. 1–61). Mahwah, NJ: Erlbaum.
Bargh, J. A., & Chartrand, T. L. (1999). The unbearable automaticity ofbeing. American Psychologist, 54, 462– 479. doi:10.1037/0003-066X.54.7.462
Bond, C. F., Jr., & DePaulo, B. M. (2006). Accuracy of deception judg-ments. Personality and Social Psychology Review, 10, 214–234. doi:10.1207/s15327957pspr1003_2
Bond, C. F., Jr., & DePaulo, B. M. (2008). Individual differences injudging deception: Accuracy and bias. Psychological Bulletin, 134,477–492. doi:10.1037/0033-2909.134.4.477
�Bond, C. F., Jr., Omar, A., Pitre, U., Lashley, B. R., Skaggs, L. M., &Kirk, C. T. (1992). Fishy-looking liars: Deception judgment from ex-pectancy violation. Journal of Personality and Social Psychology, 63,969–977. doi:10.1037/0022-3514.63.6.969
Brunswik, E. (1943). Organismic achievement and environmental proba-bility. Psychological Review, 50, 255–272. doi:10.1037/h0060889
Brunswik, E. (1952). The conceptual framework of psychology. Chicago,IL: University of Chicago Press.
Cole, T. (2001). Lying to the one you love: The use of deception inromantic relationships. Journal of Social and Personal Relationships,18, 107–129. doi:10.1177/0265407501181005
Colwell, K., Hiscock-Anisman, C., Memon, A., Taylor, L., & Prewett, J.(2007). Assessment Criteria Indicative of Deception (ACID): An inte-grated system of investigative interviewing and detecting deception.
Journal of Investigative Psychology and Offender Profiling, 4, 167–180.doi:10.1002/jip.73
Colwell, L. H., Miller, H. A., Miller, R. S., & Lyons, P. M., Jr. (2006). U.S.police officers’ knowledge regarding behaviors indicative of deception:Implications for eradicating erroneous beliefs through training. Psychol-ogy, Crime & Law, 12, 489–503. doi:10.1080/10683160500254839
Cooksey, R. W. (1996). Judgment analysis: Theory, methods, and appli-cations. New York, NY: Academic Press.
DeGroot, T., & Gooty, J. (2009). Can nonverbal cues be used to makemeaningful personality attributions in employment interviews? Journalof Business and Psychology, 24, 179–192. doi:10.1007/s10869-009-9098-0
DePaulo, B. M. (1992). Nonverbal behavior and self-presentation. Psycho-logical Bulletin, 111, 203–243. doi:10.1037/0033-2909.111.2.203
DePaulo, B. M., Charlton, K., Cooper, H., Lindsay, J. J., & Muhlenbruck,L. (1997). The accuracy-confidence correlation in the detection of de-ception. Personality and Social Psychology Review, 1, 346–357. doi:10.1207/s15327957pspr0104_5
DePaulo, B. M., Jordan, A., Irvine, A., & Laser, P. S. (1982). Age changesin the detection of deception. Child Development, 53, 701–709. doi:10.2307/1129383
DePaulo, B. M., & Kashy, D. A. (1998). Everyday lies in close and casualrelationships. Journal of Personality and Social Psychology, 74, 63–79.doi:10.1037/0022-3514.74.1.63
DePaulo, B. M., Kashy, D. A., Kirkendol, S. E., Wyer, M. M., & Epstein,J. A. (1996). Lying in everyday life. Journal of Personality and SocialPsychology, 70, 979–995. doi:10.1037/0022-3514.70.5.979
DePaulo, B. M., Lindsay, J. J., Malone, B. E., Muhlenbruck, L., Charlton,K., & Cooper, H. (2003). Cues to deception. Psychological Bulletin,129, 74–118. doi:10.1037/0033-2909.129.1.74
DePaulo, B. M., & Morris, W. L. (2004). Discerning lies from truths:Behavioral cues to deception and the indirect pathway of intuition. InP. A. Granhag & L. A. Strömwall (Eds.), The detection of deception inforensic contexts (pp. 15–40). New York, NY: Cambridge UniversityPress. doi:10.1017/CBO9780511490071.002
DePaulo, B. M., & Rosenthal, R. (1979). Telling lies. Journal of Person-ality and Social Psychology, 37, 1713–1722. doi:10.1037/0022-3514.37.10.1713
DePaulo, B. M., Rosenthal, R., Green, C. R., & Rosenkrantz, J. (1982).Diagnosing deceptive and mixed messages from verbal and nonverbalcues. Journal of Experimental Social Psychology, 18, 433–446. doi:10.1016/0022-1031(82)90064-6
*Desforges, D. M., & Lee, T. C. (1995). Detecting deception is not as easyas it looks. Teaching of Psychology, 22, 128 –130. doi:10.1207/s15328023top2202_10
*Fiedler, K., & Walka, I. (1993). Training lie detectors to use nonverbalcues instead of global heuristics. Human Communication Research, 20,199–223. doi:10.1111/j.1468-2958.1993.tb00321.x
Fiske, S. T., & Taylor, S. E. (2008). Social cognition: From brains toculture. Boston, MA: McGraw-Hill.
Frank, M. G., & Feeley, T. H. (2003). To catch a liar: Challenges forresearch in lie detection training. Journal of Applied CommunicationResearch, 31, 58–75. doi:10.1080/00909880305377
Garrido, E., Masip, J., & Herrero, C. (2004). Police officers’ credibilityjudgments: Accuracy and estimated ability. International Journal ofPsychology, 39, 254–275. doi:10.1080/00207590344000411
Gigerenzer, G. (2007). Gut feelings: The intelligence of the unconscious.New York, NY: Viking.
Global Deception Research Team. (2006). A world of lies. Journal ofCross-Cultural Psychology, 37, 60–74. doi:10.1177/0022022105282295
Granhag, P. A., Andersson, L. O., Strömwall, L. A., & Hartwig, M. (2004).Imprisoned knowledge: Criminals’ beliefs about deception. Legaland Criminological Psychology, 9, 103–119. doi:10.1348/135532504322776889
657A LENS MODEL META-ANALYSIS OF HUMAN LIE JUDGMENTS

Granhag, P. A., & Strömwall, L. A. (Eds.). (2004). The detection ofdeception in forensic contexts. New York, NY: Cambridge UniversityPress. doi:10.1017/CBO9780511490071
Hammond, K. R. (1996). Upon reflection. Thinking & Reasoning, 2,239–248. doi:10.1080/135467896394537
Hammond, K. R., Hursch, C. J., & Todd, F. J. (1964). Analyzing thecomponents of clinical inference. Psychological Review, 71, 438–456.doi:10.1037/h0040736
Hammond, K. R., Wilkins, M. M., & Todd, F. J. (1966). A researchparadigm for the study of interpersonal learning. Psychological Bulletin,65, 221–232. doi:10.1037/h0023103
Hartwig, M., Granhag, P. A., & Strömwall, L. A. (2007). Guilty andinnocent suspects’ strategies during interrogations. Psychology, Crime &Law, 13, 213–227. doi:10.1080/10683160600750264
Hartwig, M., Granhag, P. A., Strömwall, L. A., & Andersson, L. O. (2004).Suspicious minds: Criminals’ ability to detect deception. Psychology,Crime & Law, 10, 83–95. doi:10.1080/1068316031000095485
�Hartwig, M., Granhag, P. A., Strömwall, L. A., & Vrij, A. (2005).Detecting deception via strategic disclosure of evidence. Law and Hu-man Behavior, 29, 469–484. doi:10.1007/s10979-005-5521-x
Hogarth, R. M. (2001). Educating intuition. Chicago, IL: The University ofChicago Press.
Hogarth, R. M., & Karelaia, N. (2007). Heuristic and linear models ofjudgment: Matching rules and environments. Psychological Review,114, 733–758. doi:10.1037/0033-295X.114.3.733
Hurd, K., & Noller, P. (1988). Decoding deception: A look at the process.Journal of Nonverbal Behavior, 12, 217–233. doi:10.1007/BF00987489
Hursch, C. J., Hammond, K. R., & Hursch, J. L. (1964). Some method-ological considerations in multiple-cue probability studies. Psychologi-cal Review, 71, 42–60. doi:10.1037/h0041729
Jensen, L. A., Arnett, J. J., Feldman, S. S., & Cauffman, E. (2004). Theright to do wrong: Lying to parents among adolescents and emergingadults. Journal of Youth and Adolescence, 33, 101–112. doi:10.1023/B:JOYO.0000013422.48100.5a
Johnson, M. K., & Raye, C. L. (1981). Reality monitoring. PsychologicalReview, 88, 67–85. doi:10.1037/0033-295X.88.1.67
Juslin, P. N. (2000). Cue utilization in communication of emotion in musicperformance: Relating performance to perception. Journal of Experi-mental Psychology: Human Perception and Performance, 26, 1797–1812. doi:10.1037/0096-1523.26.6.1797
Karelaia, N., & Hogarth, R. M. (2008). Determinants of linear judgment:A meta-analysis of lens model studies. Psychological Bulletin, 134,404–426. doi:10.1037/0033-2909.134.3.404
Kaufmann, E., & Athanasou, J. A. (2009). A meta-analysis of judgmentachievement as defined by the lens model equation. Swiss Journal ofPsychology, 68, 99–112. doi:10.1024/1421-0185.68.2.99
Konishi, S. (1981). Normalizing transformations of some statistics inmultivariate analysis. Biometrika, 68, 647–651. doi:10.1093/biomet/68.3.647
Kraut, R. E. (1980). Humans as lie detectors: Some second thoughts.Journal of Communication, 30, 209–216.
Lakhani, M., & Taylor, R. (2003). Beliefs about the cues to deception inhigh-and low-stake situations. Psychology, Crime & Law, 9, 357–368.doi:10.1080/1068316031000093441
Levine, T. R., Feeley, T. H., McCornack, S. A., Hughes, M., & Harms,C. H. (2005). Testing the effects of nonverbal behavior training onaccuracy in deception detection with the inclusion of a bogus trainingcontrol group. Western Journal of Communication, 69, 203–217. doi:10.1080/10570310500202355
Levine, T. R., Shaw, A., & Shulman, H. C. (2010). Increasing deceptiondetection accuracy with strategic questioning. Human CommunicationResearch, 36, 216–231. doi:10.1111/j.1468-2958.2010.01374.x
Lipsey, M. W., & Wilson, D. B. (2001). Practical meta-analysis. ThousandOaks, CA: Sage.
Malone, B. E. (2001). Perceived cues to deception: A meta-analytic review(Unpublished master’s thesis). University of Virginia, Charlottesville,VA.
Miller, G. A. (1962). Psychology: The science of mental life. New York,NY: Harper & Row.
Neisser, U. (1967). Cognitive psychology. New York, NY: Appleton-Century-Crofts.
Nisbett, R. E., & Ross, L. (1980). Human inference: Strategies andshortcomings of social judgment. Englewood Cliffs, NJ: Prentice Hall.
Nisbett, R. E., & Wilson, T. D. (1977). Telling more than we can know:Verbal reports on mental processes. Psychological Review, 84, 231–259.doi:10.1037/0033-295X.84.3.231
Park, H. S., Levine, T. R., McCornack, S. A., Morrison, K., & Ferrara, M.(2002). How people really detect lies. Communication Monographs, 69,144–157. doi:10.1080/714041710
Petrinovich, L. (1979). Probabilistic functionalism: A conception of re-search method. American Psychologist, 34, 373–390. doi:10.1037/0003-066X.34.5.373
�Ruback, R. B., & Hopper, C. H. (1986). Decision making by paroleinterviewers: The effect of case and interview factors. Law and HumanBehavior, 10, 203–214. doi:10.1007/BF01046210
Serota, K. B., Levine, T. R., & Boster, F. J. (2010). The prevalence of lyingin America: Three studies of self-reported lies. Human CommunicationResearch, 36, 2–25. doi:10.1111/j.1468-2958.2009.01366.x
Sporer, S. L. (2004). Reality monitoring and the detection of deception. InP. A. Granhag & L. A. Strömwall (Eds.), The detection of deception inforensic contexts (pp. 64–102). New York, NY: Cambridge UniversityPress. doi:10.1017/CBO9780511490071.004
Sporer, S. L. (2007). Evaluating witness evidence: The fallacies of intu-ition. In C. Engel & F. Strack (Eds.), The impact of court procedure onthe psychology of judicial decision making (pp. 111–150). Baden-Baden,Germany: Nomos Verlag.
Sporer, S. L., & Kupper, B. (1995). Realitatsueberwachung und dieBeurteilung des Wahrheitsgeshaltes von Erzaehlungen: Eine experimen-telle Studie [Reality monitoring and the judgment of the truthfulness ofaccounts: An experimental study]. Zeitschrift fuer Sozialpsychologie, 26,173–193.
Sporer, S. L., & Schwandt, B. (2006). Paraverbal indicators of deception:A meta-analytic synthesis. Applied Cognitive Psychology, 20, 421–446.doi:10.1002/acp.1190
Sporer, S. L., & Schwandt, B. (2007). Moderators of nonverbal indicatorsof deception: A meta-analytic synthesis. Psychology, Public Policy, andLaw, 13, 1–34. doi:10.1037/1076-8971.13.1.1
Stenson, H. H. (1974). The lens model with unknown cue structure.Psychological Review, 81, 257–264. doi:10.1037/h0036334
Strömwall, L. A., & Granhag, P. A. (2003). How to detect deception?Arresting the beliefs of police officers, prosecutors, and judges. Psy-chology, Crime & Law, 9, 19–36. doi:10.1080/10683160308138
Strömwall, L. A., Granhag, P. A., & Hartwig, M. (2004). Practitioners’beliefs about deception. In P. A. Granhag & L. A. Strömwall (Eds.),The detection of deception in forensic contexts (pp. 229 –250).New York, NY: Cambridge University Press. doi:10.1017/CBO9780511490071.010
Summers, D. A., & Hammond, K. R. (1966). Inference behavior inmultiple-cue tasks involving both linear and nonlinear relations. Journalof Experimental Psychology, 71, 751–757. doi:10.1037/h0023122
Taylor, R., & Hick, R. F. (2007). Believed cues to deception: Judgments inself-generated trivial and serious situations. Legal and CriminologicalPsychology, 12, 321–331. doi:10.1348/135532506X116101
Thompson, B. (1995). Stepwise regression and stepwise discriminantanalysis need not apply here: A guidelines editorial. Educational andPsychological Measurement, 55, 525–534. doi:10.1177/0013164495055004001
Tucker, L. R. (1964). A suggested alternative formulation in the develop-
658 HARTWIG AND BOND

ments of Hursch, Hammond, and Hursch and by Hammond, Hursch, andTodd. Psychological Review, 71, 528–530. doi:10.1037/h0047061
*Vrij, A. (1993). Credibility judgments of detectives: The impact ofnonverbal behavior, social skills and physical characteristics on impres-sion formation. The Journal of Social Psychology, 133, 601–610. doi:10.1080/00224545.1993.9713915
Vrij, A. (2008). Detecting lies and deceit: Pitfalls and opportunities (2nded.). New York, NY: Wiley.
Vrij, A., Edward, K., & Bull, R. (2001). Police officers’ ability to detectdeceit: The benefit of indirect deception detection measures. Legal andCriminological Psychology, 6, 185–196. doi:10.1348/135532501168271
Vrij, A., Leal, S., Granhag, P. A., Fisher, R. P., Sperry, K., Hillman, J., &Mann, S. (2009). Outsmarting the liars: The benefit of asking unantic-ipated questions. Law and Human Behavior, 33, 159–166. doi:10.1007/s10979-008-9143-y
Vrij, A., Mann, S., Fisher, R. P., Leal, S., Milne, R., & Bull, R. (2008).Increasing cognitive load to facilitate lie detection: The benefit of
recalling an event in reverse order. Law and Human Behavior, 32,253–265. doi:10.1007/s10979-007-9103-y
Vrij, A., & Semin, G. R. (1996). Lie experts’ beliefs about nonverbalindicators of deception. Journal of Nonverbal Behavior, 20, 65–80.doi:10.1007/BF02248715
Zuckerman, M., DePaulo, B. M., & Rosenthal, R. (1981). Verbal andnonverbal communication of deception. In L. Berkowitz (Ed.), Advancesin experimental social psychology, Vol. 14 (pp. 1–57). New York, NY:Academic Press.
Zuckerman, M., Koestner, R., & Driver, R. (1981). Beliefs about cuesassociated with deception. Journal of Nonverbal Behavior, 6, 105–114.doi:10.1007/BF00987286
Received February 18, 2010Revision received February 3, 2011
Accepted February 24, 2011 �
659A LENS MODEL META-ANALYSIS OF HUMAN LIE JUDGMENTS