HighTech and Innovation Journal
13
Available online at www.HighTechJournal.org HighTech and Innovation Journal Vol. 1, No. 1, March, 2020 8 Comparative Analysis of Implementation of Solar PV Systems Using the Advanced SPECA Modelling Tool and HOMER Software: Kenyan Scenario S. Kibaara a* , D. K. Murage b , P. Musau c , M. J. Saulo a a Technical University of Mombasa, Mombasa, Kenya. b Jomo Kenyatta University, Juja, Kenya. c University of Nairobi, Nairobi, Kenya. Received 25 January 2020; Revised 23 February 2020; Accepted 28 February 2020; Published 01 March 2020 Abstract Globally, attention has been focused on the pollution and exhaustion of fossil fuels allied to conventional energy sources, while non-conventional energy/renewable energy sources have always been considered clean and environmentally friendly. Of the two, the non-conventional (renewable) is being preferred because it is believed to be more environmentally friendly. Renewable Energy Technologies (RETs), especially Solar Photovoltaics, have seen many plants being constructed to either supplement the grid or as alternatives for those far from the grid. Solar Photovoltaics plants occupy large tracts of land that would have been used for other economic activities for revenue generation, such as agriculture, forestry, or tourism at archaeological sites. The negative impacts slow down the application of Solar PV, but a modelling tool that can easily and quantitively assess the impacts in monetary form would accelerate the Solar PV application. The work presents a developed modelling tool that is able to assess not only the techno-economic impacts but also the environmental impacts in monetary form, allowing one to be able to determine the viability of a plant in a given region. The results are compared with those of the HOMER software. Keywords: SPECA Tool; HOMER; Environment; Solar PV. 1. Introduction Due to the depletion of fossil fuels and their GHG emissions, global attention has shifted largely to the generation of electricity using hybrid renewable energy systems [1]. The governments of many nations across the world have also given direct nomination to these renewable energy systems through tradable green certificates. This has spurred tremendous efforts in the exploration of renewable energy options, particularly in rural areas where grid connection is impractical due to rugged terrain and a small population [1, 2]. In this regard, a number of software tools have been suggested for the simulation and optimization of HRES. HOMER, SAM, HOGA, and RETScreen are some of the most popular Techno-Economic tools [3]. HOMER has been regarded as the global standard for optimization of HRES and is one of the most widely used tools for optimization and sensitivity analysis [4, 5]. According to Acakpovi et al. (2015) [4], it is a computer tool that is able to simplify and design a standalone or grid-tied micro-grid. On the other hand, HOMER has demerits such as the inability to show the optimization techniques adopted in the simulation * Corresponding author: [email protected] http://dx.doi.org/10.28991/HIJ-2020-01-01-02 This is an open access article under the CC-BY license (https://creativecommons.org/licenses/by/4.0/). © Authors retain all copyrights.
-
Upload
khangminh22 -
Category
Documents
-
view
4 -
download
0
Transcript of HighTech and Innovation Journal
Available online at www.HighTechJournal.org
HighTech and Innovation Journal
Vol. 1, No. 1, March, 2020
8
Comparative Analysis of Implementation of Solar PV Systems
Using the Advanced SPECA Modelling Tool and HOMER
Software: Kenyan Scenario
S. Kibaara a*, D. K. Murage b, P. Musau c, M. J. Saulo a a Technical University of Mombasa, Mombasa, Kenya.
b Jomo Kenyatta University, Juja, Kenya.
c University of Nairobi, Nairobi, Kenya.
Received 25 January 2020; Revised 23 February 2020; Accepted 28 February 2020; Published 01 March 2020
Abstract
Globally, attention has been focused on the pollution and exhaustion of fossil fuels allied to conventional energy sources,
while non-conventional energy/renewable energy sources have always been considered clean and environmentally
friendly. Of the two, the non-conventional (renewable) is being preferred because it is believed to be more
environmentally friendly. Renewable Energy Technologies (RETs), especially Solar Photovoltaics, have seen many
plants being constructed to either supplement the grid or as alternatives for those far from the grid. Solar Photovoltaics
plants occupy large tracts of land that would have been used for other economic activities for revenue generation, such as
agriculture, forestry, or tourism at archaeological sites. The negative impacts slow down the application of Solar PV, but
a modelling tool that can easily and quantitively assess the impacts in monetary form would accelerate the Solar PV
application. The work presents a developed modelling tool that is able to assess not only the techno-economic impacts
but also the environmental impacts in monetary form, allowing one to be able to determine the viability of a plant in a
given region. The results are compared with those of the HOMER software.
Keywords: SPECA Tool; HOMER; Environment; Solar PV.
1. Introduction
Due to the depletion of fossil fuels and their GHG emissions, global attention has shifted largely to the generation
of electricity using hybrid renewable energy systems [1]. The governments of many nations across the world have also
given direct nomination to these renewable energy systems through tradable green certificates. This has spurred
tremendous efforts in the exploration of renewable energy options, particularly in rural areas where grid connection is
impractical due to rugged terrain and a small population [1, 2]. In this regard, a number of software tools have been
suggested for the simulation and optimization of HRES. HOMER, SAM, HOGA, and RETScreen are some of the
most popular Techno-Economic tools [3]. HOMER has been regarded as the global standard for optimization of
HRES and is one of the most widely used tools for optimization and sensitivity analysis [4, 5]. According to Acakpovi
et al. (2015) [4], it is a computer tool that is able to simplify and design a standalone or grid-tied micro-grid. On the
other hand, HOMER has demerits such as the inability to show the optimization techniques adopted in the simulation
* Corresponding author: [email protected]
http://dx.doi.org/10.28991/HIJ-2020-01-01-02
This is an open access article under the CC-BY license (https://creativecommons.org/licenses/by/4.0/).
© Authors retain all copyrights.

HighTech and Innovation Journal Vol. 1, No. 1, March, 2020
9
process. Furthermore, HOMER does not provide flexibility to the user to set the optimization constraints, especially in
cases where the prices of electricity generation fuels are already fixed by the markets. In a nutshell, despite its big
name and global attention, HOMER does not meet all the needs of HRES optimization problems. Therefore, scientists
have resulted in searching for other HRES optimization and sizing options based on rigorous mathematical modelling
[4].
2. Previous Work on Optimization and Sizing of HRES
A variety of studies have applied different optimization techniques to the sizing of HRES. For instance, Amer et al.
(2013) [6] proposed the cost reduction of HRES using particle swarm optimization (PSO). Bansal et al. (2011) [7] in
their simulations of a hybrid wind solar and battery used a meta-heuristic particle swarm optimization for cost
reduction. Ram et al. (2013) [8] in their design of a standalone solar –wind hybrid with a diesel generator used PSO to
find the optimal sizes of each to meet the existing load. In addition, Lotfi et al. (2013) [9] proposed the use of the
imperial competitive algorithm, PSO, to establish the optimal configuration of a hybrid wind-solar and batteries. Other
superior cost reduction optimization techniques, such as Hybrid Genetic algorithms (GA) with PSO (HGAPSO) [10],
were used for the optimization of HRES. This algorithm overcomes the low speed convergence attributed to GA and
the premature convergence of PSO, which means tremendous speed of convergence and hence global convergence.
The combination of PSO and simulated annealing (SA) developed by Idoumghar et al. (2011) [11] overcame the
premature convergence of PSO.
ARENA 12 which is a commercial software was used by Ekren and Ekren (2009) [12] for the simulation and
optimization of various HRES at various loads. The optimal size of PV- biomass hybrid system was configured by
HOMER in Egypt [13]. Ashok (2007) [14] configured the sizes of wind solar and batteries using analytical models.
The speed of the wind, direct normal irradiation (DNI) and the load requirement were the main factors used to control
the micro grid. The results obtained were used for calibration of the optimal power required for the load.
Important to note is all these modern tools for optimization and simulation of HRES have a clear focus on cost
reduction and size configuration. The cost reduction in this case refers to the capital cost. These techniques and tools
fail to address the overall reduction of LCOE which is a quotient of the life cycle costs (capital costs, operation and
maintenance costs, replacement costs, salvage cost) and the life time energy generated. Also missing in all these
optimization techniques and simulation tools are the levelized cost of externalities (LECOE), that is, the
environmental impacts of these energy sources. This paper therefore seeks to bridge the existing knowledge gap by
showing the mathematical development of the SPECA model which fills the gap as it is able to determine the
configuration of solar PV and clearly demonstrates the indirect costs (externalities) incurred when generating
electricity from PV. In this paper the SPECA model and HOMER software will be used to simulate PV for Turkana
District in Kenya and results obtained shall be compared based on the energy generated, cash flows, environmental
impacts and LCOE.
The first part of this paper presents the detailed SPECA model development followed by the available resources
and load requirements for testing. Simulations are finally carried out using the SPECA model and the HOMER
software and the results tabulated for comparison.
3. Methodology
The core objective of this paper is the acknowledgement that nature has value in it, and therefore in the decisions to
install and test the techno economic viability of solar PV the environmental impacts should be taken into
consideration. Therefore, in the development of the SPECA model environmental impacts of solar PV have been
identified quantified according to their believed monetary value. The SPECA model developed is based on the LCOE
equation described by Equation 1 which is further broken down as shown by Equation 2.
cos
Total life cycle tsLCOE
Total life time energy production
(1)
0
1
(1 )
(1 )
Tt
tt
Tt
tt
C
rLCOE
E
r
(2)
LCOE represents the cost of electricity that would match the cash inflows and the cash outflows normalized over
the lifespan of the plant. This important metric allows the independent power producers (IPPs) to fully recover all the
costs of the plant over a predetermined period of time [15, 16]. The LCOE of an energy generating unit is usually
determined at the point where the sum of all the discounted revenues equalizes with the sum of all the discounted cost
as described by Equation 3.

HighTech and Innovation Journal Vol. 1, No. 1, March, 2020
10
1 0(1 ) (1 )
T Tt t
t tt t
R C
r r
(3)
Unlike the modelling done in HOMER, the LCOE Equation 4 adopted by the SPECA model has included the
externalities ∑ 𝐸𝐶𝑘𝑖=𝑘 (social, environmental and economic) of solar PV in the computation of 𝐿𝐶𝑂𝐸 and other metrics
such as energy generated, cash flows among others. k
i k
1 1 1
1
EC&
(1 )(1 ) (1 ) (1 ) (1 ) (1 )
*
(1 )
(1 )
T T T
n t t t tt t t
Nt
t
n
t
DEP INT LP O M RVIC TR ROI RC
DR DR DR DR DRLCOE
S
DR
SDR
(4)
3.1. SPECA Model Architecture
The SPECA model provides an interactive GUI platform developed using visual basic programming while SQL
has been used for database development. The system has the user interface and the database. The GUI is window
based that provides functions to manipulate the data according to the requirements. The interface calls stored
procedures and views heavily for data processing and data retrieval. Finally, the database stores all system data and
none is held outside the database enhancing data integrity. The process flow diagram of the SPECA model is
described by Figure 1.
Figure 1. SPECA Model system Architecture
The database used is a relational database management system which is a Microsoft SQL server. The database
stores the tabular files of DNI, cost of equipment’s used for solar photovoltaic and their types, different environmental
aspects of the different regions in Kenya, batteries, inverters etc. Figure 2 shows main features of the SPECA model
derived from Equation 4.
Table 1. SPECA and HOMER Economic Inputs
Component Amount
Discount rate 7.5%
Expected inflation rate 7%
Project lifespan 25 years
land cost/acre (for SPECA model) Area dependent variable
Residual value (SPECA model) 4.5% of CAPEX
User inputs
Data stored in the Database
Data processing
Simulation Output

HighTech and Innovation Journal Vol. 1, No. 1, March, 2020
11
Total Investment costAnnual O&MCapacity factor Degradation of componentsEnvironmental impacts costsOthers
Weather dataArea occupied
Energy Model
EDMTRE
Discount rate, equity/debit ratio..
FIXED PARAMETERS
Total system output
LCOE,NPC,IRR,Cash flow
Annual/daily/monthly energy
output,
N years
Figure 2. SPECA Model Block Diagram
4. Criterion of Sizing Solar PV using SPECA Model
The economic criteria used in the sizing of the solar PV depend on the load demand. In this paper the load demand
of a typical village in Turkana district was estimated as shown in Table 5 which was used as an input to the SPECA
model to determine the number of solar panels required and the batteries. Solar PV system includes different
components that should be selected according to the system type, site location and applications. The major
components for solar PV system are the PV module, inverter and the battery bank.
The sizing procedure described herein mostly applies for the SPECA model. The mathematical sizing procedure
used in HOMER is hardly discussed in literature and hence sizing is done by the software itself. The user chooses the
location, load requirements, components, and type of fuel, and once the system is run, HOMER calculates the LCOE,
NPV, and the energy produced.The procedure followed by the SPECA model for sizing the PV and batteries is
described in the flowing section.
4.1. Sizing of a Standalone PV System
For convenience and accurate sizing of a PV system, the specific area, Direct Normal Irradiance (DNI) data and
the anticipated load are defined. The size of the PV system, total number of PV panels and the number of batteries are
then calculated. As such several factors considered are the amount of energy (kWh) that can be generated by the solar
PV to meet the load demand, the Ah of the batteries required and the area occupied. There are several sizing
techniques used previously in literature such as intuitive, numerical, analytical, commercial computer tools, artificial
intelligence and the hybrid methods [17]. The numerical technique has been used in this paper for sizing the PV
system because of its known accuracy and ability to easily use the linear functions unlike other tools [17].
The energy delivered by a solar PV array is given by:
*,STCdcac PP (5)
Where
acP = Actual ac power delivered;
STCdcP , = Rated dc power output under standard test conditions;
= Conversion efficiency which accounts for inverter efficiency, dirt, PV collectors efficiency and mismatch factor.
4.2. Steps Followed in Sizing the PV Array
The insolation data (kWh/m2) for the different sites used in the SPECA model are obtained from the NASA
websites. The worst month (month with the lowest solar irradiance) of the year is used for design. As shown by
Equation 6 identification of a PV module and using its rated current IR together with its coulomb efficiency of about
0.9 and a derating factor (DR) of 0.9 and the Direct Normal Irradiance (DNI) of the design month, the Ah/day
produced by each solar PV string is determined.

HighTech and Innovation Journal Vol. 1, No. 1, March, 2020
12
DRImkWhDNIstringdayAh R **)/(/ 2 0 (6)
The number of parallel strings is given by Equation 7.
monthdesigninuleperdayAh
dayAhloadmonthdesignparallelinStrings
mod/
)/(
(7)
The number of PV modules in series is determined by Equation 8.
)(modmin
)(mod
VvoltageulealNo
Vvoltagesystemseriesinules (8)
4.3. Determination of Collector Area
The size of area occupied and the number of PV cells varies according to type, as each has different parameters.
Amount of energy delivered by a cell PV is described by Equations 9 and 10.
STCav
ambientcell DNITNOCT
TT *)..8.0
(
(9)
Where
STCDNI = Insolation under standard test conditions (kWh/m2);
NOCT = Nominal Operating Cell Temperature;
avT = Average maximum daily temperature.
)](1[ ovcelllratingdc TTPPVP (10)
Where
dcP = Solar PV DC output power;
ratingPV = Rating of the solar PV;
lP = Power loss per degree above ovT .
Including the dirt, mismatch and inverter efficiencies will result in an estimated ac rated power of the solar photo
voltaic (acP ) shown by Equation 11.
inverterdirtmismatchPP dcac *** (11)
The collector area is governed by the yearly energy yield and the yearly energy demand as described by Equations
12 to 15.
daysCFdayDNIPyrED siteac 365**/*/ (12)
(13)
efficiencyinverterdirtMismatch
PP ac
dc**
(14)
efficiencycollectoryearDNI
PoccupiedArea
site
dc
*/
(15)
The different types of solar photovoltaic panels used in the development of the SPECA model are as shown in
Table 2.
daysCFdayDNI
yrEDP
site
ac365**/
/

HighTech and Innovation Journal Vol. 1, No. 1, March, 2020
13
Table 2. Types of Solar PV and their Characteristics
Module type Sharp NE
K125U2
Kyocera
KC158G
Shell
SP150
Unisolar
SSR256
Material Poly crystal Multicrysta Mono crystal Triple junc
)dcP( Rated power 125W 158W 150W 256W
Voltage max 26V 23.5V 34V 66V
Max Current 4.8A 6.82A 4.4A 3.9A
O/C voltage 32.3V 28.9V 43.4V 95.2V
S/C voltage 5.46A 7.58A 4.8A 4.8A
Length (m) 1.19 1.29 1.619 11.124
Width (m) 0.792 0.99 0.814 0.42
Efficiency 13.3% 12.4% 11.4% 5.5%
Capital cost ($ 525 663.6 630 1075
Deratiing % 90% 90% 90% 90%
Replacement $ 525 663.6 630 1075
Lifespan (yrs 25 25 25 25
O&M cost($) 121.25 153.26 145.5 248.32
4.4. Battery Storage
The different types of batteries are as shown Table 3.
Table 3. Types of Batteries and their Characteristics
Battery MDOD (%) Cycle life (cycles) Lifespan (Years) Eff. % Cost ($/kwh)
Lead acid 20% 500 1-2 90 50
Golf cart Lead 80% 1000 3-5 90 60
Deep cycle 80% 2000 7-10 90 100
Nickel-cadmiu 100% 1000-2000 10-15 70 1000
Nickel-hydride 100% 1000-2000 8-10 70 1200
The battery storage capacity is determined by Equation 16.
DRMDOM
autonomyofdaysdayAhcapacitystoragebattery
*
*/
(16)
Where
MDOM = maximum depth of discharge;
DR= % discharge rate.
5. Quantification of Land Use Impacts
Land Use Changes (LUC) all over the world remains to be one of the greatest contributing factor to the drastic
biodiversity loss and extinction [18, 19]. The SPECA model has adopted countryside Species Area Relationship
(SAR) for quantification of the number of species in the areas occupied by the USSE. The SAR model has been
extensively used for describing the species richness existing in different localities across the world [18]. The SAR
model is described by Equation 17.
z
orgorg cAS (17)
Where
orgS = Total number of species in a given area;
c = Constant that depends on the taxonomic group and region being studied;
rgoA = Area occupied by the USSE (transformed land);
z = A constant that depends on the sampling regime and scale.

HighTech and Innovation Journal Vol. 1, No. 1, March, 2020
14
The species that remain after land is converted from one form to another is estimated using Equation 18.
znewnew CAS (18)
The quotient of Equations 17 and 1) yields Equation 19.
z
org
new
org
new
A
A
S
S
(19)
The multiplication of Equation 19 by orgS yields Equation 20.
z
org
new
orgnewA
ASS
(20)
Subtracting Equation 20 from the original number of species that existed before the land use change yields the
prediction of the extinctions as indicated by Equation 21.
Table 4. Valuation of Ecosystem Goods and Services [20]
z
org
new
orgorgneworgA
ASSSS
(21)
In this paper the z takes the values of 0.25-0.35 while c .
After the conceivable damages have been identified the, restoration cost approach will be used to perform damage
evaluation as shown in Equation 22.
XVCi
i * (22)
Where C is the total external cost, V is the value of each external cost and X represents the number of impacts of USSE
Ecosystem Goods and services Valuation ($)/ha
Regulating functions of ecosystems
1 Regulating air 7-265
2 Climate change 88-268
3Disturbing ecosystems goods and services 2-7240
4 Water uptake and usage 2-5445
5 water supply 3-7600
6 Soil erosion 29-245
7Soil maturity and formation 1-10
8 soil nutrients recycling 87-21,100
9 plants pollination 14-25
10. Biological control 2-78
Habitat provision
11 habitation services 3-1523
12 Nursery function 142-195
Bleeding and production services 6-2761
13 food 6-1014
14Raw materials such as wood, charcoal 6-1014
15Genetics 6-112
16medicinal value 6-112
HighTech and Innovation Journal Vol. 1, No. 1, March, 2020
15
considered in a certain region. The international standards of ecosystem goods and services are expressed in $/ha/year
and were estimated according to Groot et al. [17] as shown in Table 4.
5.1. Accounting for Human Health Damages
The SPECA model developed in this paper accounts for morbidity and mortalities resulting from the installation of
Solar PV. The work-related and non-work related accidents considered in this paper are for the non-organization for
Economic Cooperation and Development countries where Kenya is classified into Nkambule and Blignaut (2017)
study [21]. The per unit prices for treating persons suffering injuries or mortalities while working with USSE are
based on the studies done by Friedrich et al. (2004) and Preiss and Klotz (2008) [22, 23]. Morbidity and mortality
consists of two variables viz. unit morbidity value and the unit mortality value. The per unit morbidity value ( modUV$/person) is estimated using Equation 23.
)()1804()( modmodmod tUVUVtUV (23)
Where )(mod tUV is the change in morbidity value. The unit mortality values ( motUV ,$/person) were obtained by
Nkambule and Blignaut (2017) [21] and are described by Equation 24.
)()17413()( tUVUVtUV motmotmot (24)
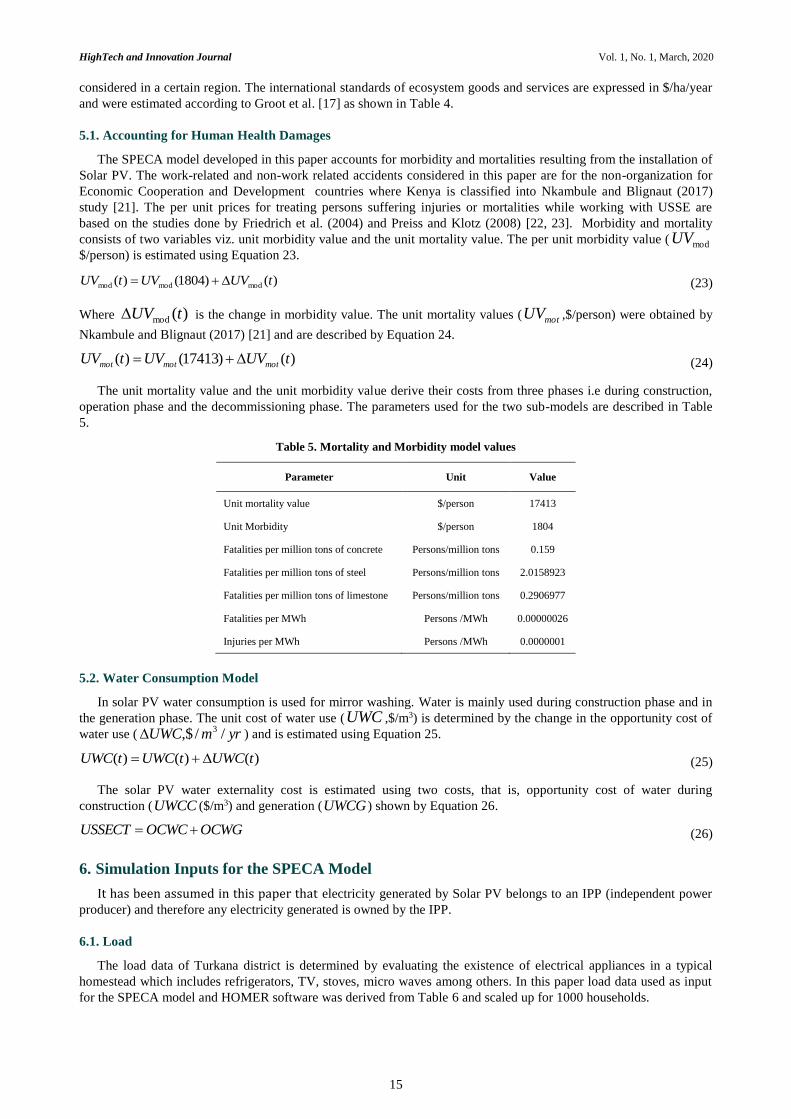
The unit mortality value and the unit morbidity value derive their costs from three phases i.e during construction,
operation phase and the decommissioning phase. The parameters used for the two sub-models are described in Table
5.
Table 5. Mortality and Morbidity model values
Parameter Unit Value
Unit mortality value $/person 17413
Unit Morbidity $/person 1804
Fatalities per million tons of concrete Persons/million tons 0.159
Fatalities per million tons of steel Persons/million tons 2.0158923
Fatalities per million tons of limestone Persons/million tons 0.2906977
Fatalities per MWh Persons /MWh 0.00000026
Injuries per MWh Persons /MWh 0.0000001
5.2. Water Consumption Model
In solar PV water consumption is used for mirror washing. Water is mainly used during construction phase and in
the generation phase. The unit cost of water use (UWC ,$/m3) is determined by the change in the opportunity cost of
water use ( yrmUWC //,$ 3 ) and is estimated using Equation 25.
)()()( tUWCtUWCtUWC (25)
The solar PV water externality cost is estimated using two costs, that is, opportunity cost of water during
construction (UWCC ($/m3) and generation (UWCG ) shown by Equation 26.
OCWGOCWCUSSECT (26)
6. Simulation Inputs for the SPECA Model
It has been assumed in this paper that electricity generated by Solar PV belongs to an IPP (independent power
producer) and therefore any electricity generated is owned by the IPP.
6.1. Load
The load data of Turkana district is determined by evaluating the existence of electrical appliances in a typical
homestead which includes refrigerators, TV, stoves, micro waves among others. In this paper load data used as input
for the SPECA model and HOMER software was derived from Table 6 and scaled up for 1000 households.

HighTech and Innovation Journal Vol. 1, No. 1, March, 2020
16
Table 6. Typical Load of Turkana District
Appliance Quantity Rating (kW) (hrs/day) Daily consumption (kWh)
Fridge (14.cu ft) 1 0.3 24 7.2
Television (19-in) 2 0.068 8 1.088
Electric Kettle 1 1 0.5 0.5
Desktop computer 1 0.3 6 1.8
Laptop 2 0.036 6 0.432
Lights 10 0.03 5 1.5
Security Lights 2 0.045 8 0.72
Geyser 1 3 1 3
Heater 2 2 3 12
Microwave 1 1 0.33 0.33
Total 28.57*100=2857
The resulting load profile is described by Figure 3 with an average hourly load of 119.04 kW/hr.
Figure 3. Load Profile of Turkana District
6.2. Resources
The site selected for the simulation is Turkana District which is 3018.7’N, 35033.9’E. HOMER and SPECA model
requires the solar insolation data as an input for electricity for electricity generation from PV. The weather patterns of
the different regions across the globe are inbuilt in HOMER and therefore once a site is selected, its weather data is
loaded as well. The solar insolation Data is shown by Figure 4.
Figure 4. Temperature and DNI of Turkana using SPECA modelling tool
7. Costs Considered
The basic criterion related to the selection of the power system components in this paper is the cost of components,
because the main purpose of the work is searching the optimum power system configuration that would meet the
demand with minimum NPC and COE. The estimation of the components cost was made based on the current cost
available in the market. In this paper the all component costs and specifications were adopted from [24]. In the

HighTech and Innovation Journal Vol. 1, No. 1, March, 2020
17
HOMER and SPECA model the user can change the component cost based on the market trend. The different types of
component cost are:
Initial capital cost of components: It is the total installed cost deployed to purchase and install the component
at the commencement of the project.
O&M cost: It is the cost accounted for maintenance and operation of the system. The entire scheme components
considered in this paper has different operation and maintenance costs. Miscellaneous O&M costs considered by
HOMER are like emission penalties, capacity shortage penalty and fixed operation and maintenance costs. The
determination of the emission penalties and capacity shortage penalty used by HOMER is mathematically inbuilt
in the software and hence no mathematical models available as the software does not provide them to the public.
For the SPECA model, the emissions are accounted for as described in sections above which includes water
consumption, land usage, impacts on health and ecosystems.
Replacement cost: This is the cost required to replace wear out components at the end of its life cycle. This cost
is different from initial cost of the component, due to the fact that different components have different life times.
There are some components that will run in the entire lifespan of the plant whereas some will be replaced
midway.
8. Results and Analysis
In this section the simulation results obtained from SPECA model and HOMER software for Turkana District are
discussed and compared. The two software calculates the output based on the procedure mentioned in the
methodology and the results of each software are described in the following sections.
8.1. SPECA Modelling Tool Results
The SPECA modelling displayed results of yearly energy generated from 1992-2016 as shown in the diagram. The
energy delivered varies according to the DNI estimated at 1800 kWh/m2/yr. Figure 5 shows the yearly energy
generated during the lifespan of the plant. The random variability of the solar resource leads to the uneven energy
production in the different years.
The area required for installation to meet the electricity demand was estimated to be 5130 acres of land that
required about 4008 solar photovoltaic panels and 394 batteries. The cascaded impacts on land as a result of this land
occupation includes diseases like Cancer which results from emission of some hazardous gases such as particulate
matter, lead, VOC among others. The SPECA modelling tool estimated the NPC including the externalities
(environmental and health costs) to a tune of $2.07 billion for a period of 25 years The environmental cost included
were the cost of land and the various function of land in this particular region as was described in Table 3. The
SPECA tool determines the cost of a disease using two functions described above, that is, unit morbidity value and
unit mortality values.
Figure 5. Yearly Energy Generated
SPECA model further determines the LCOE to be about $3.81. As discussed earlier LCOE is a function of the Life
cycle costs (LCC) and the energy generated. The SPECA model is among the first tools to accommodate the external
costs of energy generation which in this case are the environmental costs and the health costs. The cash inflow and
cash outflow for the whole period is shown in Figures 6 and 7. The cash flow is highest at the beginning of the project
and minimum near the end of the lifespan.

HighTech and Innovation Journal Vol. 1, No. 1, March, 2020
18
Figure 6. SPECA Model Cash Inflow
Figure 7. SPECA Model Cash outflow
8.2. HOMER Results
HOMER simulation estimated the total NPC to $1.7 billion while the optimal LCOE was $1.07. HOMER found
the optimal LCOE by considering 138 combinations in which only 66 cases were feasible. The resultant of the input
output cash-flow is as shown in Figure 8. In the cash-flow the plant breaks-even on the final year of production where
the cash-flow is positive.
Figure 8. HOMER Cash flow

HighTech and Innovation Journal Vol. 1, No. 1, March, 2020
19
8.3. Results Comparison
The results are compared in terms of environmental impact analysis, health impact analysis and the general
economics. A variety of greenhouse gases are also emitted from solar during generation as reported in literature [25].
The SPECA model considers a variety of them including PM, ammonia, CO2, nickel, mercury, methane, and lead
among others. Also, in the SPECA modelling tool the land occupied is quantified according size, type vegetation,
economic worth measured in terms of $/Hectare/ year. The different monetary value of land use types were obtained
from the Ecosystem service value database (EVSD). The EVSD allocates monetary value to the different types of land
occupation per Hectare per year. The SPECA model is equipped with SQL database that contains this data and is
always recalled during calculation. On the other hand HOMER considers only the carbon Dioxide [4], which in not
monetized. LCOE for the SPECA model is 70% more than that of HOMER which has been attributed to lack of
monetization of the land costs, environmental cost and the social costs.
9. Conclusion and Recommendations
In this paper, HOMER and the SPECA modelling tool have been used to size solar photovoltaic systems for
Turkana District. The result analysis provides a base for comparison of the two packages. The SPECA model is a new
tool and has not been explored as much as the HOMER software. HOMER is user-friendly, flexible, and good at
sizing HRES according to resource availability. The LCOE yield in HOMER is slightly low. However, during the
sizing of the most optimal combination of HRES, HOMER does not consider basic things like land cost and size,
environmental impacts costs, and social impacts costs. It is the opinion of the authors of this paper that if these key
costs were considered in HOMER, the LCOE and NPC of the two packages would match. The other possible
discrepancy with the results is that HOMER determines the NPC of a component as the present value of all the costs
incurred during purchasing, installing, and operating the component minus all the revenues generated by the product.
On the other hand, the SPECA modelling tool does not consider the revenue from solar PV.
Research and development should be geared towards improving the SPECA model software to accommodate more
than one energy resource type to enhance hybridization of renewable energy systems. In general, SPECA will be of
great use to investors and policy makers of Solar PV systems for drawing alternatives and conclusions based on the
best compromise. The model developed will be useful especially in addressing the trade-offs between environmental
impacts, financial impacts which are all aimed in the improvement of the quality and transparency in the decision-
making during deployment of Solar PV. The quantification of the social-environmental impacts of Solar PV will
permit for a cost accounting assessment of the unforeseen costs incurred when using them for electricity generation.
10. Acknowledgement
The authors would like to thank the Technical University of Mombasa for providing infrastructure to carry out this
study.
11. Declaration of Competing Interest
The authors declare that they have no known competing financial interests or personal relationships that could have
appeared to influence the work reported in this paper.
12. References
[1] Painuly, J. P. (2001). Barriers to renewable energy penetration; a framework for analysis. Renewable Energy, 24(1), 73–89.
doi:10.1016/s0960-1481(00)00186-5.
[2] Burtraw, D., Krupnick, A., Sampson, G., & Beasley, B. (2012). The True Cost of Electric Power. RFF Report, Resources for
the Future, Washington, DC, United States.
[3] Connolly, D., Lund, H., Mathiesen, B. V., & Leahy, M. (2010). A review of computer tools for analysing the integration of
renewable energy into various energy systems. Applied Energy, 87(4), 1059–1082. doi:10.1016/j.apenergy.2009.09.026.
[4] Acakpovi, A., Hagan, E. B., & Michael, M. B. (2015). Cost benefit analysis of self-optimized hybrid solar-wind-hydro
electrical energy supply as compared to HOMER optimization. International Journal of Computer Applications, 114(18), 32-38.
[5] Rawat, R., & Chandel, S. S. (2013). Simulation and optimization of solar photovoltaic-wind stand-alone hybrid system in hilly
terrain of India. International Journal of Renewable Energy Research (IJRER), 3(3), 595-604.
[6] Amer, M., Namaane, A., & M’Sirdi, N. K. (2013). Optimization of Hybrid Renewable Energy Systems (HRES) Using PSO for
Cost Reduction. Energy Procedia, 42, 318–327. doi:10.1016/j.egypro.2013.11.032.
[7] Bansal, A. K., Gupta, R. A., & Kumar, R. (2011). Optimization of hybrid PV/wind energy system using Meta Particle Swarm
Optimization (MPSO). India International Conference on Power Electronics 2010 (IICPE2010), New Delhi, India.
doi:10.1109/iicpe.2011.5728079.

HighTech and Innovation Journal Vol. 1, No. 1, March, 2020
20
[8] Ram, G. N., Shree, J. D., and Kiruthiga, A. (2013). Cost Optimization of Standalone Hybrid Power Generation System,
International Journal of Advanced Research in Electrical, Electronics and Instrumentation Engineering, 2(8), 4048–4057.
[9] Lotfi, S., Tarazouei, F. L., & Ghiamy, M. (2013). Optimal design of a hybrid solar-wind-diesel power system for rural
electrification using imperialist competitive algorithm. International Journal of Renewable Energy Research (IJRER), 3(2), 403-
411.
[10] Sharma, D., Gaur, P., & Mittal, A. P. (2014). Comparative Analysis of Hybrid GAPSO Optimization Technique with GA and
PSO Methods for Cost Optimization of an Off-Grid Hybrid Energy System. Energy Technology & Policy, 1(1), 106–114.
doi:10.1080/23317000.2014.969450.
[11] Idoumghar, L., Melkemi, M., Schott, R., & Aouad, M. I. (2011). Hybrid PSO-SA Type Algorithms for Multimodal Function
Optimization and Reducing Energy Consumption in Embedded Systems. Applied Computational Intelligence and Soft
Computing, 2011, 1–12. doi:10.1155/2011/138078.
[12] Ekren, B. Y., & Ekren, O. (2009). Simulation based size optimization of a PV/wind hybrid energy conversion system with
battery storage under various load and auxiliary energy conditions. Applied Energy, 86(9), 1387–1394.
doi:10.1016/j.apenergy.2008.12.015.
[13] Barakat, S., Samy, M. M., Eteiba, M. B., & Wahba, W. I. (2016). Feasibility Study of Grid Connected PV-Biomass Integrated
Energy System in Egypt. International Journal of Emerging Electric Power Systems, 17(5), 519–528. doi:10.1515/ijeeps-2016-
0056.
[14] Ashok, S. (2007). Optimised model for community-based hybrid energy system. Renewable Energy, 32(7), 1155–1164.
doi:10.1016/j.renene.2006.04.008.
[15] Mohamed, E. S. (2017). Economics of variable renewable sources for electric power production. Lap Lambert Academic
Publishing, Sunnyvale, CA, USA.
[16] Namovicz, C. (2013). Assessing the economic value of new utility-scale renewable generation projects. In EIA Energy
Conference, 1-20. U.S. Energy Information Administration, Washington, DC, USA.
[17] Khatib, T., Ibrahim, I. A., & Mohamed, A. (2016). A review on sizing methodologies of photovoltaic array and storage battery
in a standalone photovoltaic system. Energy Conversion and Management, 120, 430–448.
doi:10.1016/j.enconman.2016.05.011.
[18] Chaudhary, A., Verones, F., De Baan, L., & Hellweg, S. (2015). Quantifying land use impacts on biodiversity: combining
species–area models and vulnerability indicators. Environmental Science & Technology, 49(16), 9987-9995.
doi:10.1021/acs.est.5b02507.
[19] Pereira, H. M., Ziv, G. U. Y., & Miranda, M. (2014). Countryside species–area relationship as a valid alternative to the matrix-
calibrated species–area model. Conservation Biology, 28(3), 874. doi:10.1111/cobi.12289.
[20] Wilson, M. A., Costanza, R., Boumans, R., & Liu, S. (2005). Integrated assessment and valuation of ecosystem goods and
services provided by coastal systems. The intertidal ecosystem: the value of Ireland’s shores. Royal Irish Academy, 1-24.
[21] Nkambule, N. P., & Blignaut, J. N. (2017). Externality costs of the coal-fuel cycle: The case of Kusile Power Station. South
African Journal of Science, 113(9-10), 1-9. doi:10.17159/sajs.2017/20160314.
[22] Friedrich, R.; Rabl, A., Hirschberg, S., Desaigues, B., Markandya, A., de Nocker, L. (2004). New elements for the assessment
of external costs from energy technologies. In EU 5th Framework Programme; Institute for Energy Economics and the
Rational Use of Energy: Stuttgart, Germany.
[23] Preiss, P., & Klotz, V. (2008). NEEDS New Energy Externalities Developments for Sustainability. Technical Paper no. 7.4–
RS 1b.“Description of updated and extended draft tools for the detailed site-dependent assessment of external costs”.
Universität Stuttgart, Germany.
[24] Masters, G. M. (2013). Renewable and Efficient Electric Power Systems. John Wiley & Sons, New York, United States.
[25] Moss, J., Coram, A., & Blashki, G. (2014). Solar Energy in Australia: Health and environmental Costs and Benefits of Solar
energy in Australia. The Australia Institute, Canberra, Australia.