INTERNATIONAL JOURNAL OF INNOVATION AND ...
81
ISSN: 2351-8014 INTERNATIONAL JOURNAL OF INNOVATION AND SCIENTIFIC RESEARCH Vol. 7 N. 1 August 2014 International Peer Reviewed Monthly Journal Innovative Space of Scientific Research Journals http://www.issr-journals.org/ Impact Factor: 2.095
-
Upload
khangminh22 -
Category
Documents
-
view
4 -
download
0
Transcript of INTERNATIONAL JOURNAL OF INNOVATION AND ...

ISSN: 2351-8014
INTERNATIONAL JOURNAL
OF
INNOVATION AND SCIENTIFIC
RESEARCH
Vol. 7 N. 1 August 2014
International Peer Reviewed Monthly Journal
Innovative Space of Scientific Research Journals
http://www.issr-journals.org/
Impact Factor: 2.095

International Journal of Innovation and Scientific Reseach
International Journal of Innovation and Scientific Research (ISSN: 2351-8014) is an open access, specialized,
peer-reviewed, and interdisciplinary journal that focuses on research, development and application within
the fields of innovation, engineering, science and technology. Published four times per year in English,
French, Spanish and Arabic, it tries to give its contribution for enhancement of research studies.
All research articles, review articles, short communications and technical notes are sent for blind peer
review, with a very fast and without delay review procedure (within approximately two weeks of
submission) thanks to the joint efforts of Editorial Board and Advisory Board. The acceptance rate of the
journal is 75%.
Contributions must be original, not previously or simultaneously published elsewhere. Accepted papers are
available freely with online full-text content upon receiving the final versions, and will be indexed at major
academic databases.
i

Table of Contents
Design of Square Microstrip Antenna Using T-Shaped Notch in the Ground Plane for Ultra Wideband
Applications
1-4
MAPPING OF IRON MININGS OF NOAMUNDI AREAS, JHARKHAND BY USING THE IMAGE BASED NDII AND
GEOSPATIAL TECHNOLOGY
5-10
Comparison of Aster Thermal Bands and feature Identification Using Advance Spectroscopic Techniques 11-18
IMPROVE THE PERFORMANCE OF USER SEARCH GOALS USING FEEDBACK SESSION 19-27
TERRORISM AND SUSTAINABLE DEVELOPMENT IN NORTHERN NIGERIA 28-37
The financial markets efficiency and Random walk of prices 38-49
A Comparison between the Self-Organizing Maps and the Support Vector Machines for Handwritten Latin
Numerals Recognition
50-56
Placental tissues: fixing smiles 57-62
L'importance des clusters dans l'attractivité territoriale 63-68
Effect of Anthropogenic Activities in Dry Miombo Woodlands on Wood Stock and Tree Diversity: A Case of
Chenene Forest Reserve, Bahi, Tanzania
69-77
Powered by TCPDF (www.tcpdf.org)
ii
International Journal of Innovation and Scientific Research ISSN 2351-8014 Vol. 7 No. 1 Aug. 2014, pp. 1-4 © 2014 Innovative Space of Scientific Research Journals http://www.ijisr.issr-journals.org/
Corresponding Author: Soufian Lakrit 1
Design of Square Microstrip Antenna Using T-Shaped Notch in the Ground Plane for Ultra Wideband Applications
Soufian Lakrit and Hassan Ammor
Electronic and Communication Laboratory EMI, Mohammed V University Agdal (UM5A), Rabat, Morocco
ABSTRACT: This paper presents the design of an ultra wideband microstrip patch antenna for (UWB) communications. In this
structure there is a square patch consists of a partial ground plane and fed by a 50 Ω microstrip line. The proposed antenna can achieves a wide bandwidth from 1.52 GHz to 11.19 GHz with VSWR<2 with stable and bi-directional radiation pattern. The simulation of this antenna has been performed by using Ansoft High Frequency Structure Simulator (HFSS) and Computer Simulation Technology-Microwave Studio (CST).
KEYWORDS: microstrip, Ultra-wideband (UWB), VSWR, HFSS, CST.
1 INTRODUCTION
Ultra-wideband (UWB) communication systems draw great attention in the wireless world because of their advantages, like high speed data rate, extremely low spectral power density, precision, high precision ranging, low complexity and low cost since the Federal Communications Commission(FCC) allowed 3.1 to 10.6 GHz unlicensed band for UWB communication [1]. UWB also have wide applications in short range and high speed wireless systems, such as ground penetrating radars, medical imaging system, high data rate wireless local area networks WLAN (5.15–5.35 and 5.725–5.825 GHz), downlink of X-band satellite communication systems (7.25–7.75 GHz) and ITU (8.025–8.4 GHz), Various UWB microstrip antennas with single or double layer have been discussed in the literature to achieve the requirement for different applications, one of which is to increase the bandwidth [5-7],[15],[16]. Many techniques have already been applied to design wideband antennas. For example an isolated slit inside a patch, two opened slits at the top edge of a T-shaped stub, two parasitic strips and a square ring resonator embedded in a tuning stub have been reported to design band notched antenna. Embedding of various thin slots on the antenna surface, such as L-shaped slot, T-shaped slot , fractal slot and H-slot have also been reported for achieving wide-bands [8-13],[16].
In this paper, a novel square patch antenna is proposed, This structure present a wide bandwidth and miniaturized dimensions, sufficient impedance bandwidth and highly stable bi-directional radiation pattern is obtained. The planar antenna consists of a square shaped radiating patch and partial ground plane with a T-shaped slot on the upper edge to cause a broad bandwidth from 1.52GHz to 11.19GHz frequency. The antenna structure is flat, and its design is simple and straightforward. Details of the proposed design are presented and discussed in this paper. The proposed antenna design and performances are analyzed by using Ansoft High Frequency Structure Simulator (HFSS) and Computer Simulation Technology- Microwave Studio (CST).
2 ANTENNA GEOMETRY AND DESIGN
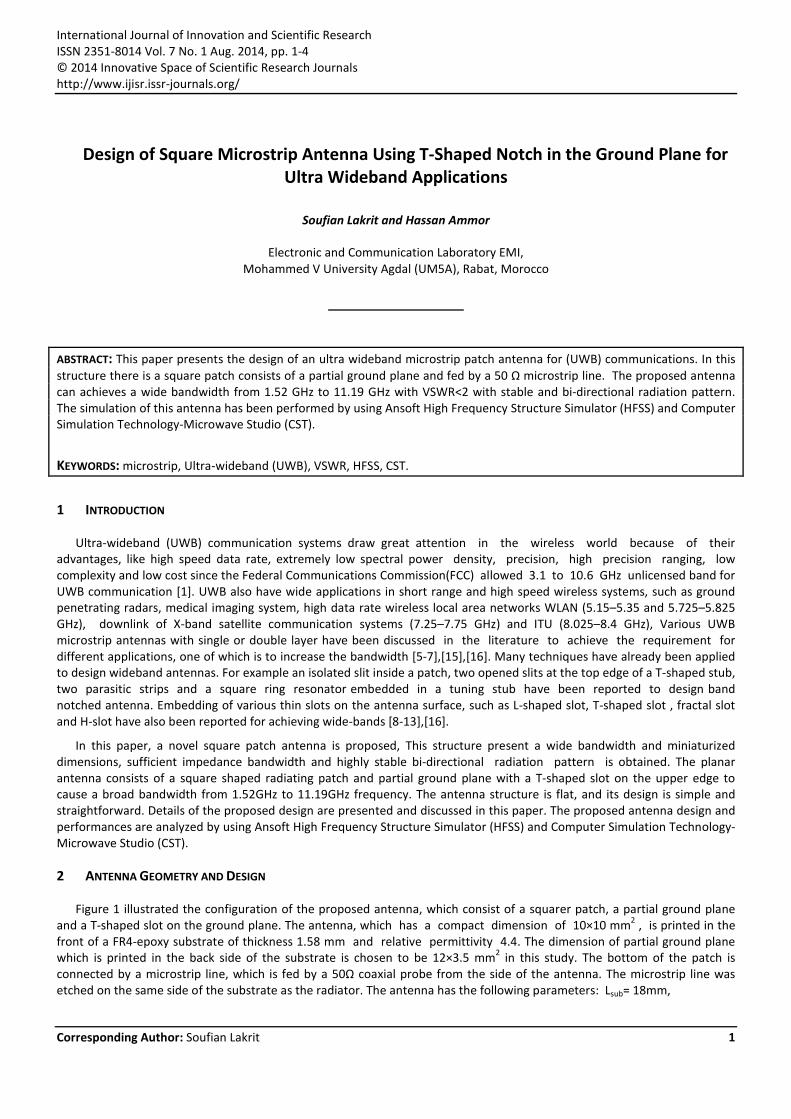
Figure 1 illustrated the configuration of the proposed antenna, which consist of a squarer patch, a partial ground plane and a T-shaped slot on the ground plane. The antenna, which has a compact dimension of 10×10 mm
2 , is printed in the
front of a FR4-epoxy substrate of thickness 1.58 mm and relative permittivity 4.4. The dimension of partial ground plane which is printed in the back side of the substrate is chosen to be 12×3.5 mm
2 in this study. The bottom of the patch is
connected by a microstrip line, which is fed by a 50Ω coaxial probe from the side of the antenna. The microstrip line was etched on the same side of the substrate as the radiator. The antenna has the following parameters: Lsub= 18mm,
Design of Square Microstrip Antenna Using T-Shaped Notch in the Ground Plane for Ultra Wideband Applications
ISSN : 2351-8014 Vol. 7 No. 1, Aug. 2014 2
Wsub = 12mm, WP = 10mm, Wf = 2mm, lf = 7mm, Lg = 3.5mm, wS1 = lS1 = wS2 = 1mm, lS2 = 6mm and h = 1.58mm.
Top view Bottom view side view
Fig. 1. Geometry of proposed antenna with inverted T-shaped notch
3 RESULTS AND DISCUSSION
In this section, the square patch antenna with various design parameters is constructed, and the numerical results of the input impedance and radiation characteristics are presented and discussed. The simulated results are obtained using the Ansoft simulation software high frequency structure simulator (HFSS) and Computer Simulation Technology- Microwave Studio (CST).
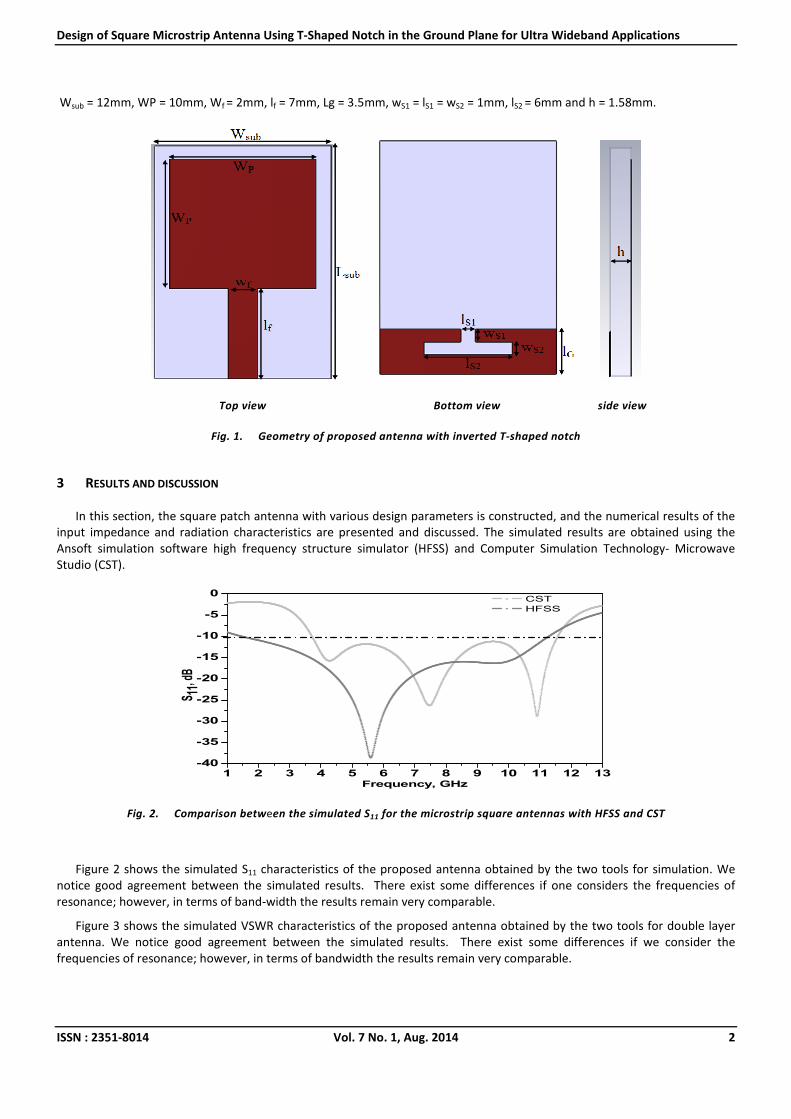
Fig. 2. Comparison between the simulated S11 for the microstrip square antennas with HFSS and CST
Figure 2 shows the simulated S11 characteristics of the proposed antenna obtained by the two tools for simulation. We notice good agreement between the simulated results. There exist some differences if one considers the frequencies of resonance; however, in terms of band-width the results remain very comparable.
Figure 3 shows the simulated VSWR characteristics of the proposed antenna obtained by the two tools for double layer antenna. We notice good agreement between the simulated results. There exist some differences if we consider the frequencies of resonance; however, in terms of bandwidth the results remain very comparable.
1 2 3 4 5 6 7 8 9 10 11 12 13-40
-35
-30
-25
-20
-15
-10
-5
0 CST HFSS
S 11, d
B
Frequency, GHz

Soufian Lakrit and Hassan Ammor
ISSN : 2351-8014 Vol. 7 No. 1, Aug. 2014 3
Fig. 3. Comparison between the simulated VSWR for the microstrip square antennas with HFSS and CST
(a) (b) (c)
Fig. 4. E- and H-field patterns at different frequencies a-6GHz, b-7.38GHz and c-10.52GHz
Figure 4 shows the radiation patterns of the proposed antenna at three frequencies of 6 GHz, 7.38 GHz and 10.52GHz. It is observed that at lower frequencies both the E-plane and H-plane field patterns are approximately bidirectional and the antenna has a main beam in the broadside direction. As the frequency increases, higher order current modes are excited and the radiation patterns becomes slightly directional. However a stable and symmetric the radiation patterns are observed over the entire operating band of the proposed antenna which is similar to a typical monopole antenna [13].
Fig. 5. Gain in dBi of square patch antennas against frequency
1 2 3 4 5 6 7 8 9 10 11 12 131
2
3
4 CST HFSS
V S
W R
Frequency, GHz

Design of Square Microstrip Antenna Using T-Shaped Notch in the Ground Plane for Ultra Wideband Applications
ISSN : 2351-8014 Vol. 7 No. 1, Aug. 2014 4
Figure 5 shows the antenna gain in a frequency range from 1 GHz to 12 GHz. The maximum gain is 4.55 dBi with an average of 3.7dBi.
4 CONCLUSION
A novel compact microstrip-fed printed patch antenna has been proposed for UWB applications. We showed that by embedding a pair of T-shaped slots with a proper dimension and position in the partial ground plane, a wide impedance bandwidth from 1.52 GHz to 11.19 GHz (9.67 GHz) with VSWR ≤ 2 is achieved. Also the antenna is compact and can cover the whole frequency band of 5.8 GHz-band RFID systems, WLAN, ITU, X-band satellite communication systems and European-standard UWB systems, it should be a promising candidate for such applications.
REFERENCES
[1] “Federal Communications Commission Revision of Part 15 of the Commission’s Rules Regarding Ultra-Wideband Transmission System from 3.1 to 10.6 GHz,” in FEDERAL Communications Commission. Washington, DC: ET-Docket, pp. 98–153, FCC, 2002.
[2] Cai, L.Y., Li, Y., Zeng, G., and Yang, H.C.: “Compact wideband antenna with double-fed structure having band-notched characteristics”, Electron.Lett., vol 46, (23), pp. 1534–1536, 2010.
[3] D. C. Chang, J. C. Liu, and M. Y. Liu, “A novel tulip-shaped monopole antenna for UWB applications,” Microw. Opt. Technol. Lett., vol. 48, pp. 307–312, 2006.
[4] X. H. Wu and Z. N. Chen, “Comparison of planar dipoles in UWB applications,”IEEE Trans. Antennas Propag., vol. 53, pp. 1973–1983, 2005.
[5] X. H.Wu and A. A. Kishk, “Study of an ultrawideband omnidirectional rolled monopole antenna with trapezoidal cuts,”IEEE Trans. Antennas Propag., vol. 56, pp. 259–263, 2008.
[6] X. H. Wu, Z. N. Chen, and N. Yang, “Optimization of planar diamond antenna for single-based and multiband UWB wireless communications,”Microw. Opt. Technol. Lett., vol. 42, pp. 451–455, 2004.
[7] Azim R., Islam M. T., Misran N., Mobashsher A. T., “Compact UWB planar antenna for broadband applications”, Informacije MIDEM, vol 41, No.1, pp. 37-40,2011.
[8] Lui W., Cheng C., Zhu H., Improved frequency notched ultra wideband slot antenna using square ring resonator, IEEE Trans. Antennas Propag., vol 55, No. 9, pp. 2445–2450, 2007.
[9] H.AMMOR, R.KARLI, "Conception d’une nouvelle antenne en technologie micro-ruban pour usage spatiale et pour l’évaluation des changements climatiques", CITS, IAV-Rabat, 30-31octobre, 2013.
[10] Zaker R., Ghobadi C., Nourinia J., “Bandwidth enhancement of novel compact single and dual band-notched printed monopole antenna with a pair of L-shaped slots”, IEEE Trans. Antennas Propag., vol 57, No. 12, pp. 3978–3983, 2009.
[11] Ojaroudi M., Ghobadi C., Nourinia J., “Small square monopole antenna with inverted T-shaped notch in the ground plane for UWB application”, IEEE Antennas Wireless Propag. Lett., vol 8, pp. 728–731,2009.
[12] Zhao Y. L., Jiao Y. C., Zhao G., Zhang L., Song Y., Wong Z. B., “Compact planar monopole UWB antenna with band-notched charac-teristic”, Microw. Opt. Technol. Lett., vol 50, No. 10, pp. 2656-2658, 2008.
[13] Lui W. J., Cheng C. H., Zhu H. B., “Compact frequency notched Ultra-wideband fractal printed slot antenna”, IEEE Microw. Wireless Compon. Lett., vol 16, No. 4,pp. 224-226, 2006.
[14] Azim R., Islam M. T., Misran N., “ Ground modified doublesided printed compact UWB antenna ” , Electron. Lett., vol 47, No. 1, pp .9-11 , 2011.
[15] Weerathep K., Noppin A., Chawalit B., Jintana N., and Toshio W., “ Controllable Band- Notched Slot Antenna for UWB Communication Systems ”, ETRI Journal, Vol 34, No. 5, pp.674-683, 2012.
[16] Soufian, Lakrit., Hassan, Ammor., Jaouad, Terhzaz., “Design of H-slot Patch Antenna for Ultra Wideband ”, European Journal of Scientific Research, Vol 106, No. 2,pp.224-228, 2013.

International Journal of Innovation and Scientific Research ISSN 2351-8014 Vol. 7 No. 1 Aug. 2014, pp. 5-10 © 2014 Innovative Space of Scientific Research Journals http://www.ijisr.issr-journals.org/
Corresponding Author: Surajit Panda 5
MAPPING OF IRON MININGS OF NOAMUNDI AREAS, JHARKHAND BY USING THE IMAGE BASED NDII AND GEOSPATIAL TECHNOLOGY
Surajit Panda1, Krishnendu Banerjee
1, Dr. Manish Kumar Jain
2, Dr. A.T Jeyaseelan
3, and Ratnesh Kr. Sharma
1
1Jharkhand Space Applications Center,
Dept. of Information Technology, Govt. of Jharkhand, Ranchi- 834004, Jharkhand, India
2Dept. of Environmental Science & Engineering,
Indian School of Mines (ISM), Dhanbad-826004, Jharkhand, India
3Regional Remote Sensing Centre West,
NRSC, ISRO, Jodhpur - 342003 Rajasthan, India
Copyright © 2014 ISSR Journals. This is an open access article distributed under the Creative Commons Attribution License, which permits unrestricted use, distribution, and reproduction in any medium, provided the original work is properly cited.
ABSTRACT: This paper present the mapping of active Iron ore mines of Noamundi areas of Jharkhand.It was observed that the
spectral characteristic of iron ore lie in the NIR and SWIR region. The Iron ore absorbs the0.85-0.9µm, and shows strong reflectance at 0.7-0.75µm region of Electromagnetic Radiation (EMR).The study involves hyperspectral image data, preprocessing like Noises are fixing bad and outlier pixels, local de-striping, atmospheric correction etc. and mines map generation by using NDII (Normalized Difference Iron ore Index) from the image. Atmospheric correction was carried out by using FLAASH algorithms applied on Hyperion image using the Hyperion tools available from ENVI 4.7 [2]. The Iron ore mines are full of Iron ore or Fe dust material. So Iron ore has spectral signature due to own chemical component. In the case of Iron ores, the maximum reflectance Hematite shows near 0.7µm and maximum absorption shows near 0.85µm range of EMR [7]. By using this importance character of Iron ore, Iron ore mines are mapped with the help of NDI Index which shows a reasonable match with known mining locations.
KEYWORDS: Atmospheric Correction, FLAASH, NDII, EMR, EO-1Hyperionetc.
1 INTRODUCTION
Land and water are the two basic natural resources which are being exploited for various developmental activities. For example mineral resources play very important role to back up or support the economy of country. Now a day the Iron ore resource takes very important role to support the economy of under developing country like India. But sometimes mining activities are cross the lease areas know as Illegal mining. So the active mining areas mapping are very important. The field survey technique, which is the more costly and time consuming technique to mapping the mining areas. The recent advancement technology of remote sensing is provide a powerful tool to mapping the mineral distribution, different activities, different features and natural resources mapping on earth surface etc. Hyperspectral images can provide valuable information of mining areas of earth surface as a form of aerial mapping.
Noamundi of Jharkhand is an active Iron ore mining areas according to Geological survey of India (GSI 2006). So by using this geospatial technique we can show, this technique can provide the information and mapped the mining areas of earth surface.

MAPPING OF IRON MININGS OF NOAMUNDI AREAS, JHARKHAND BY USING THE IMAGE BASED NDII AND GEOSPATIAL TECHNOLOGY
ISSN : 2351-8014 Vol. 7 No. 1, Aug. 2014 6
2 OBJECTIVES
The main objectives of the present study is mapping and locating the iron mines of Noamundi areas, Jharkhand through a simple ratio technique of multispectral imagery.
3 ABOUT STUDY AREAS
This Iron ore mining are situated at Noamundi of Jharkhand state in India. The geographical location of theses mining fall between 22°04'14”N to 22°10'41”N latitude, and 85°27'09E to 85°30'06E longitude which is shows in Fig 1. The deposit is now being mined by TATA Steel. As the mining progresses, the benches are exposed and samples location collected from these exposed mining areas and faces.
Fig. 1. Location map of the study area.
4 DATA USED AND METHODOLIGY
The EO-1Hyperion sensor data on 16th April 2011 has been used for this present study (Noamundi mining areas of Jharkhand state, India) which acquired from USGS glovis data center. The image has 242 unique spectral channels range of 400-2500 nm with 10 nm band width. But only 196 of 242 bands are calibrated. The bands 8 to 57 for visible-to-near-infrared (VNIR) and bands 77 to 224 in the shortwave-infrared (SWIR) regions are used. The details of data specification of Hyperion image are given bellow:

Surajit Panda, Krishnendu Banerjee, Dr. Manish Kumar Jain, Dr. A.T Jeyaseelan, and Ratnesh Kr. Sharma
ISSN : 2351-8014 Vol. 7 No. 1, Aug. 2014 7
Table 1. Details of EO-1 Hyperiondata specification
Sensor Hyperion
Type Pushbroom grating spectrometer (VNIR-SWIR)
Path, Row P-140, R-45
Date of acquisition 16/04/2011
Spectral range 400-2500 nm
Spectral coverage Contiguous
Spectral resolution 10nm
Spatial resolution 30m
Radiometric resolution 16 bit
Temporal resolution 200 days
Number of bands 242 but Calibrated: 196 of 242
Swath width 70km
Sensor altitude 705km
Before using this imagery, some pre-processing operation needs to be done in this image to reduce the image Noise like fixing the bad and outlier pixels, local de-striping it is necessary to correct the atmospheric noise [4] etc. by using the Hyperion tools available from ENVI 4.7 [2].
The Hyperion image is acquired as level 1B data in scaled radiance units to fulfill the requirement of different indices and measurements. These values are to be digitally converted from raw radiance into apparent reflectance using Fast Line-of-sight Atmospheric Analysis of Spectral Hyper cubes (FLAASH) atmospheric correction model [3]. Hyperion raw data is corrected using FLAASH from ENVI includes atmospheric rectification, geometric correction of the image. The FLAASH algorithm along with the field data calibration can thus be used for conversion of Hyperion data from radiance to reflectance values [6].The used FLAASH parameter of the atmospheric correction is presented in bellow table 2.
Table 2. Details of FLAASH parameter using for atmospheric correction
Scene canter location 22 13 50.653 Initial visibility 40km
85 30 09.312
Sensor Altitude 705km Spectral Polishing Yes
Ground elevation 0.75 Width of bands 9
Pixel size9(m) 30 Wave length calibration No
Flight date April 16 2011 Aerosol scale height(km) 2
Flight ime(HH:MM:SS) 4:33:00 Co2 mixing ratio(ppm) 390
Atmospheric Model Tropical Use adjacency correction No
Water retrieval No Modtran Resolution 15 cm-1
Water absorption features 1 Modtran multi scatter Model Scaled DISORT
Aerosol model Rural No of Disort streams 8
Aerosol Retrieval 2-Band(K-T) Output reflectance scale factor 10000
Azimuth Angle 111.872439 Title Size 600
The overview methodology of the study is presented through a schematic diagram or flow chart shown in below Fig 2.

MAPPING OF IRON MININGS OF NOAMUNDI AREAS, JHARKHAND BY USING THE IMAGE BASED NDII AND GEOSPATIAL TECHNOLOGY
ISSN : 2351-8014 Vol. 7 No. 1, Aug. 2014 8
Fig. 2. Flow Diagram showing the methodology adopted in the study
5 RESULT AND DISCUSSION
In this present study, atmospheric correction was carried out and result is shown in Fig 2, the raw Hyperion image (Fig 3a) and the respective spectral plots for Iron ore of known mines [1]. From these spectral plots, it is observed that the reflectance of iron ore is obtained from the radiance image on the Hyperion image (Fig 3b). It is observed that very strong
absorption of iron ore at 840-890nm and strong reflectance at 720-755nm region.
Fig. 3. Showing the spectral profile of Iron ore mining areas of before and after atmospheric correction. 3a: Before atmospheric Correction and 3b: after atmospheric Correction
Iron Ore image spectra
3a 3b

Surajit Panda, Krishnendu Banerjee, Dr. Manish Kumar Jain, Dr. A.T Jeyaseelan, and Ratnesh Kr. Sharma
ISSN : 2351-8014 Vol. 7 No. 1, Aug. 2014 9
The 840nm to 890nm region of EMR of atmospheric corrected image indicate the band no. 51, 52, and 53. On the other hand 720nm to 755nm region of EMR of atmospheric corrected image indicate the band no. 37, 38, 39 and 40. The group of high reflectance and group of strong absorption bands are average individually. After that NDI Index calculated using the eq. No 1. This index is the modified form of Normalized Diffrence Vegetation Index (Edward P.et.al 2008).The NDII algorithm subtracts the absorption bands from the reflectance bands and divides it by the sum of absorption and reflectance bands. The result of this NDII is varies between -1 to 1. The positive values near 0 indicate the Iron ore mine areas which are middle of this range. So the -1 is multiply with that index to sifting that range towards a side of range. Now the all positive values are converted into negative values and vice versa. Finally the negative values are indicate the Iron ore mining areas which is shows in Fig 4 with two test site (Red 1 and Yellow 2) in a certain zoom label to see better.
Fig. 4. Fig 4: Showing the final result of Iron ore mines of Noamundi areas. Hyperion Image (Left) and comparative mine areas (Right)
6 CONCLUSION
Integrated Remote sensing and GIS is a powerful tool to mapping the land surface feature and activities. In the present study it is possible to identify the Iron ore mining areas by visual interpretation and digital mapping. For digital mapping some noise and error corrections are required. It true’s that the standard and advanced atmospheric correction method of FLAASH is very useful to normalizations the atmospheric noise of the satellite data. From this work reported it is clear that to using the band selection and band ratio technique the Iron ore mines of Noamundi areas it is possible to demarcate the mining distribution mapping. The Fig 4 (Right) shows the Iron ore mining’s of Noamundi Iron ore belt. The red patches of the image (Fig 4 Right) represent the Iron ore mines and green are represent vegetation and other features. The result of Iron ore mines of noamundi is verified with the GSI located mines and field survey data of T. Magendran and S. Sanjeevi [8].
ACKNOWLEDGMENT
The authors are grateful to Dr. Jatisankar Bandyopadhyay, Lecturer, Department of Remote Sensing & GIS, Vidyasagar University, West Bengal, India, for giving valuable suggestions during this study. Our thanks are also due to colleagues of Jharkhand Space Applications Center, Ranchi of Jharkhand who have helped at various stages and provide their laboratory to process the satellite image of this study. As well as our thanks to USGS data center to free available the data of this areas.
1
2
1 2

MAPPING OF IRON MININGS OF NOAMUNDI AREAS, JHARKHAND BY USING THE IMAGE BASED NDII AND GEOSPATIAL TECHNOLOGY
ISSN : 2351-8014 Vol. 7 No. 1, Aug. 2014 10
REFERENCES
[1] Babu K. Raghu, 2012: Spectral analysis of IRS P6 LISS III image for gold associated minerals in Veligallu Schist Belt, Kadapa district, A.P, Int. Journal of Advances in Remote Sensing and GIS, Vol. 1, No. 1, 2012
[2] Brando, V.E., and Dekker, A. 2003. Site Report for Moreton Bay in the evaluation of Hyperion performance at Australian hyperspectral calibration and validation sites (NRA-99-OES-01). (D. Jupp), Canberra, ACT, Australia: CSIRO Earth Observation Centre.
[3] Cooley, T.; Anderson, G.P.; Felde, G.W.; Hoke, M.L.; Ratkowski, A.J.; Chetwynd, J.H.; Gardner, J.A.; Adler-Golden, S.M.; Matthew, M.W.; Berk, A.; Bernstein, L.S.; Acharya, P.K.; Miller, D.; Lewis, P.( 2002). FLAASH, a MODTRAN4-based atmospheric correction algorithm, its application and validation Geoscience and Remote Sensing Symposium, IGARSS 02. 2002 vol.3 IEEE International, November 2002 pp 1414-1418.
[4] Dobhal Shashi, 2008 : Performance analysis of high-resolution and hyperspectral data fusion for classification and linear feature extraction, January, 2008, pp. 07-10.
[5] Edward P. Glenn, Alfredo R. Huete, Pamela L. Nagler and Stephen G. Nelson, 2008: Relationship Between Remotely-sensed Vegetation Indices, Canopy Attributes and Plant Physiological Processes: What Vegetation Indices Can and Cannot Tell Us about the Landscape, Sensors 2008, 8, 2136-2160.
[6] Kawishwar Prashant, 2007 : Atmospheric Correction Models for Retrievals of Calibrated Spectral Profiles from Hyperion EO-1 Data, January, 2007, pp. 17-19
[7] T. Magendran and S. Sanjeevi, 2011: Assessing the Grades of Iron Ores of Noamundi, India by Ground Based Hyperspectral Remote Sensing, International Journal of Earth Sciences and Engineering ISSN 0974-5904, Vol. 04, No 08 - Spl issue, December 2011, pp. 07-16
[8] T. Magendran and S. Sanjeevi, 2013: A Study on the Potential of Satellite Image-derived Hyperspectral Signatures to Assess the Grades of Iron ore Deposits, JOURNAL GEOLOGICAL SOCIETY OF INDIA Vol.82, September 2013, pp.227-235.

International Journal of Innovation and Scientific Research ISSN 2351-8014 Vol. 7 No. 1 Aug. 2014, pp. 11-18 © 2014 Innovative Space of Scientific Research Journals http://www.ijisr.issr-journals.org/
Corresponding Author: Krishnendu Banerjee 11
Comparison of Aster Thermal Bands and feature Identification Using Advance Spectroscopic Techniques
Krishnendu Banerjee1, Surajit Panda
1, Dr. Manish Kumar Jain
2, Dr. A.T Jeyaseelan
3, and Ratnesh Kr. Sharma
1
1Jharkhand Space Applications Center,
Dept. of Information Technology, Govt. of Jharkhand, Ranchi- 834004, Jharkhand, India
2Dept. of Environmental Science & Engineering,
Indian School of Mines (ISM), Dhanbad-826004, Jharkhand, India
3Regional Remote Sensing Centre West ,
NRSC, ISRO, Jodhpur - 342003 Rajasthan, India
Copyright © 2014 ISSR Journals. This is an open access article distributed under the Creative Commons Attribution License, which permits unrestricted use, distribution, and reproduction in any medium, provided the original work is properly cited.
ABSTRACT: Land surface temperature (LST) is important factor in surface feature mapping, analysis, and estimation of
emissivity and heat balance studies. The knowledge of surface temperature is important for various applications in Remote sensing field. Feature mapping and analysis can be done according to their emissivity and brightness temperature. In this investigation an attempt has been made to estimate surface temperature from ASTER and to use the relationship between aster thermal bands for feature mapping. ASTER has 5 thermal bands (wave length ranging from 8.125µm to 11.65µm) and these are used in comparison. ASTER thermal bands have been used to convert digital numbers to exoatmospheric radiance using published ASTER user manual gains and offsets. The exoatmospheric radiance is then converted to surface radiance by applying the Emissivity Normalization method, assuming the emissivity of the Investigation area is constant (0.96, the emissivity of urban areas).The surface temperature is then extracted from the surface radiance, based on ASTER images ofMay2007.The extracted temperature data were compared to individual ASTER temperature bands. A positive correlation has been found from this comparison.
KEYWORDS: LST (Land surface temperature), TOA (Top of the atmosphere)
1 INTRODUCTION
The measured radiance from the earth surface in the thermal infrared region is a function of both emissivity and temperature information. Emissivity calculations and subsequent estimation of land surface temperature (LST) using ASTER (TIR) bands have opened up new possibilities for satellite based lithological mapping. Emissivity is controlled by the composition of the surface rock and is often used for constituent/lithological mapping. In this context, silicate minerals play important roles, as emissivity characteristics of silicate minerals are found to be useful indicators of lithology. In the present study, the term ‘relative emissivity / emittance’ is more relevant than ‘absolute emissivity’, as it is related to measurement of natural surface rather than ideal specimen. LST is known to be one of the key diagnostic parameters of the physical processes of land surface, involving both surface and subsurface geology (Becker and Li, 1990). LST is controlled by surface energy balance, atmospheric condition, and thermal properties of surface and subsurface formation. Land surface temperature can provide important information about the surface physical properties and climate which plays a role in many environmental processes (Dousset & Gourmelon 2003; Weng, Lu & Schubring 2004). The surface temperature is a main indicator of the

Comparison of Aster Thermal Bands and feature Identification Using Advance Spectroscopic Techniques
ISSN : 2351-8014 Vol. 7 No. 1, Aug. 2014 12
surface energy balance of the Earth and it is used as input data in climate change models, agro-meteorological or hydrological models. Surface temperature can also be used to forecast the soil freezing, to analyse heat islands in urban areas, to decide the optimal timing of agricultural activities, to study volcanoes and geothermal activities, to detect fires, and the exploration of natural resources.
2 AIM AND OBJECTIVE OF THE STUDY
Calculate Emissivity ASTER thermal bands.
Calculate surface temperature of ASTER thermal bands.
Generate Band statistics of ASTER thermal bands.
Feature identification by using ASTER thermal bands.
3 INVESTIGATION AREA
In the present Investigation, the main Investigation area is in East Singhbhum district and some part of Investigation area covers West Bengal and Odisha State. The complete Aster scene covers or 3600 square kilometre. The Investigation area, lies between 86°41’52.22”E to 86°13’39.43”E and 22°13’58.27”N to 22°52’28.52”N. It has varying elevation of 10.425–644.370 meters above sea level (ASTER DEM 2007). ASTERL1b data was used in this Investigation. The multi data sets were acquired on Jan152007. They consist of Band 5, Thermal Infrared data, and were obtained from the Jharkhand Space Application Centre in HDF format.
Fig: 1 Location map of the study area
4 METHODOLOGY
The relationship of Bands in infrared region allows the calculation of the surface temperature of the scene thermal channels. The infrared radiance measured from a satellite can be converted to surface radiance by applying the reference channel method. The surface radiance is then converted to surface temperature. The methodology followed is schematically shown in Figure 3. Thermal bands ware processed using ENVI 4.7 (Fig: 2)

Krishnendu Banerjee, Surajit Panda, Dr. Manish Kumar Jain, Dr. A.T Jeyaseelan, and Ratnesh Kr. Sharma
ISSN : 2351-8014 Vol. 7 No. 1, Aug. 2014 13
Fig: 2 Detail flow Diagram of Methodology
5 DETAIL PROCEDURE OF FUNCTIONS USED
5.1 DN TO SPECTRAL RADIANCE
Data used here, as an example, is ASTER L1B data (version 3.0), radiometrically Re-calibrated digital numbers, 8bit (1-255) for visible and near-infrared bands and 12 bit (1-4095) for thermal infrared (TIR) bands (table: 1). Dn to spectral radiance is converted by using eq 1.
(eq. 1)
Where, Lrad, j is ASTER spectral radiance at the sensor’s aperture measured in a wavelength j; j is the ASTER band number; DNj is the unitless DN values for an individual band j; UCCj is the Unit Conversion Coefficient (W m
-2sr
-1 µm
-1) from ASTER
Users Handbook.

Comparison of Aster Thermal Bands and feature Identification Using Advance Spectroscopic Techniques
ISSN : 2351-8014 Vol. 7 No. 1, Aug. 2014 14
Table 1: Calculated Unit Conversion Coefficients
BAND# Maximum Radiance (W m-2
sr-1
µm-1
)
High gain Normal Gain Low Gain 1 Low gain 2
1 0.676 1.688 2.25 N/A
2 0.708 1.415 1.89
3N 0.423 0.862 1.15
3B 0.423 0.862 1.15
4 0.1087 0.2174 0.29 0.29
5 0.0348 0.0696 0.0925 0.409
6 0.0313 0.0625 0.083 0.39
7 0.0299 0.0597 0.0795 0.332
8 0.0209 0.0417 0.0556 0.245
9 0.0159 0.0318 0.0424 0.265
10 N/A 0.006822 N/A N/A
11 0.00678
12 0.00659
13 0.005693
14 0.005225
5.2 SPECTRAL RADIANCE TO TOA (TOP OF THE ATMOSPHERE) REFLECTANCE
ASTER at-sensor reflectance (ρTOA also called as planetary reflectance or apparent reflectance or TOA reflectance) for a specific band j is calculated using the standard Landsat equation (eq 2) as:
(eq. 2)
Where, ρTOA is Unit less planetary reflectance, Lrad is Spectral radiance at the sensor's aperture, D is Earth% Sun distance
in astronomical units from an Excel file which is calculated using the below EXCEL equation (Achard and D’Souza 1994; Eva and Lambin, 1998) or interpolated from values listed in (Table 2), Esun is mean solar exoatmospheric irradiances, Λ is wavelength, corresponds to the band number j, Θs is solar zenith angle in degrees (zenith angle = 90– solar elevation angle), which is found in the ASTER header file.
5.3 TOA REFLECTANCE TO SURFACE REFLECTANCE
Table 2: Earth-Sun Distance in Astronomical Units
Days of Year Distance
Days of Year Distance
Days of Year Distance
Days of Year Distance
Days of Year Distance
1 0.98331 74 0.99446 152 1.01403 227 1.01281 305 0.99253
15 0.98365 91 0.99926 166 1.01577 242 1.00969 319 0.98916
32 0.98536 106 1.00353 182 1.01667 258 1.00566 335 0.98608
46 0.98774 121 1.00756 196 1.01646 274 1.00119 349 0.98426
60 0.99084 135 1.01087 213 1.01497 288 0.99718 365 0.98333
Surface reflectance is calculated using empirical methods when ground truth is available by correlating the field measured surface reflectance with synchronous pixel value, or radiative transfer models such as MODTRAN , 6S (Second Simulation of the Satellite Signal in the Solar Spectrum, Vermote, et al., 1997), etc.

Krishnendu Banerjee, Surajit Panda, Dr. Manish Kumar Jain, Dr. A.T Jeyaseelan, and Ratnesh Kr. Sharma
ISSN : 2351-8014 Vol. 7 No. 1, Aug. 2014 15
It is recommended to use surface reflectance products for quantitative remote sensing analysis, however, TOA reflectance based outcome is also acceptable due to the fact that land surface reflectance retrieval is complicated.
5.4 TEMPERATURE CALCULATION
5.4.1 DNS TO RADIANCE
Refer to Part1 Step1 to convert DNs to radiance for thermal bands. There is no difference between converting DNs to radiance of thermal or optical data.
5.4.2 SPECTRAL RADIANCE TO TOA BRIGHTNESS TEMPERATURE
Planck’s Radiance Function (eq 3)
(eq. 3)
Where, C1 is 1.19104356×10⁻¹⁶
W m2; C2 is 1.43876869×10
-2m K
In the absence of atmospheric effects, T of a ground object can be theoretically determined by inverting the Planck’s function as follows (eq 4):
(eq. 4)
This equation can be reformed (eq 5) as
(eq. 5)
Let K1 is C1/λ5, and K2 is C2/λ, and satellite measured radiant intensity B λ (T) is L λ, then above mentioned equation is
collapsed into an equation similar to the one used to calculate brightness temperature from Landsat TM image. The equation (eq 6) is.
(eq. 6)
Therefore, K1 and K2 become a coefficient determined by effective wavelength of a satellite sensor. For example, effective wavelength of ASTER band 10, λ=8.291µm = 8.291×10
-16 m, we can have K1 = C1/λ
5 = 1.19104356×10
-16 W m
-2 / (8.291×10
-6
m) 5= 3040136402 W m
-2µm
-1 = 3040.136402 W m
-2 µm
-1 K2 = C2/λ = 1.43876869×10
-2 m K / 8.291×10
-6m = 1735.337945K
.The values of other bands are given in (Table 3).
Table 3: ASTER thermal bands (referenced ASTER L1B Manual Ver.3.0)
Bands
Bandpass Effective UCC K1(W m-2µm -1) K (K)
10 (µm) Wavelength (µm) 0.006882 3040.136402 1735.33795
11 8.475-8.825 8.634 0.00678 2482.375199 1666.39876
12 8.925-9.275 9.075 0.00659 1935.060183 1585.42004
13 10.25-10.95 10.657 0.005693 866.468575 1350.06915
14 10.95-11.65 11.318 0.005225 641.326517 1271.22167

Comparison of Aster Thermal Bands and feature Identification Using Advance Spectroscopic Techniques
ISSN : 2351-8014 Vol. 7 No. 1, Aug. 2014 16
6 RESULT AND DISCUSSION
The temperature of successive band has been calculated from the reference channel method. The highest temperature of successive thermal bands is found316.75°K and lowest is 288.36°K. The mean value is 302.66°K.All the bands has the same range of temperature but the power of discrimination of objects is varies as their wave length changes in different bands. The spectral wavelength of band 10 is (8.12-8.47μm). The wavelengths increase in the successive bands and range to (10.95-11.65μm) at band 14.The temperature map and the band statistics has been calculated every individual band of ASTER. (Fig: 3)
Fig: 3 Temperature maps of different thermal bands (ASTER)
The temperature variation of different channels varies between 284°K to 316°K. Pixel count has been taken in each temperature range. The concentration of pixel count is maximum 287-302°K in the study area. The image has been taken in day time and the study area is belongs to chhotanagpur platue region so the temperature variation is very high.
While comparing the pixel count at same temperature range of different thermal channels, it is found that the maximum pixel count or pick temperature is found in band 10 at 292°K (129185 pixels). A positive relation is found in wavelength and temperature. Band 10 and Band 11 is found mostly co-related bands in temperature estimation. The discrimination power of different surface features is found best in Band 10 and Band 11.

Krishnendu Banerjee, Surajit Panda, Dr. Manish Kumar Jain, Dr. A.T Jeyaseelan, and Ratnesh Kr. Sharma
ISSN : 2351-8014 Vol. 7 No. 1, Aug. 2014 17
Fig: 4 Statistical comparisons of different temperature channel (ASTER)
While comparing the mostly co-related bands (10, 11) it shows the positive co relation. A different physical characteristic is found in different physical objects. Like water bodies heats quickly and release heat slowly in daytime and absorbs the most part of inferred region. Green vegetation reflects the most part of inferred region. So a lowest co-relation is found in the case of wet lands (red colour shows wet lands). A moderate co-relation is found in the case of vegetation (green coloured shows vegetation).The fellow land shows strong co-relation in the scatter plot (brown colour shows bare land) in Fig: 5.
Fig: 5 Feature identification using temperature channel combination

Comparison of Aster Thermal Bands and feature Identification Using Advance Spectroscopic Techniques
ISSN : 2351-8014 Vol. 7 No. 1, Aug. 2014 18
7 CONCLUSION
The Present study shows the effective utilization of thermal remote sensing data for thermal mapping and detection of thermal anomalies. This study was carried out with the primary objective of finding the suitability of ASTER thermal bands data in providing land surface temperatures as well as the new dimension in feature identification. The primary goal is to find co-relation of ASTER thermal bands in LST (Land Surface Temperature) calculation. The effective wavelength of TIR bands are used for analysis. There are many other methods available for LST calculation like emissivity normalization but reference channel method is found the most effective method as it calculates the LST of individual bands assuming the constant emissivity value of .96.Feature identification should be applied in large areas or in large scale. The comparison of LST of different bands is found most helpful method in feature identification then visual image interpretation technique. But it limits the feature identification in small scale. Overall result of feature identification is found helpful for geological or geomorphological studies.
REFERENCES
[1] Abduwasit Ghulam (2009). How to calculate reflectance and temperature using ASTER data. Center for Environmental Sciences at Saint Louis University.
[2] BECKER, F. (1987) Impact of spectral emissivity on the measurement of land surface temperatures from a satellite, Received: 3 Mar 1987, Accepted: 23 May 1987, Published online: 07 May 2007.
[3] D.W.J. Stein, S.G. Beaven et al. “Anomaly Detection from Hyperspectral Imagery”, and Date of Publication: Jan 2002, ISSN: 1053-5888.
[4] GILLESPIE, KAHLE A.B.et.al (1998) A temperature and emissivity separation algorithm for Advanced Space borne Thermal Emission and Reflection Radiometer (ASTER) images. Date of Publication: Jul 1998, ISSN: 0196-2892.
[5] Hook S J, Vaughan R G et al. (2007) Absolute radiometric in-flight validation of Midand Thermal Infrared data from ASTER and MODIS using the Lake Tahoe CA/NV, USA automated validation site. Date of Publication: June 2007,ISSN: 0196-2892.
[6] Jacob F, Petitcolin F et al.(2004) Comparison of land surface emissivity and radiometric temperature derived from MODIS and ASTER sensors.Received 12 August 2003; received in revised form 24 November 2003; accepted 28 November 2003.
[7] Jensen J.R, 2000,”Remote sensing of Environment-an Earth Resource Perspective” Published by Pearson Education. [8] R.J. Muirhead, (1982): “Aspects of Multivariate Statistical Theory”. Copyright 1987. Online ISBN : 9 8-94-017-0653-7,pp
277-288 [9] S. Rajendran, S. Aravindan et al. (2009),”Hyperspectral Remote sensing and Spectral Signature Application”.pp 200-203 [10] Sobrino J A, El Kharraz J and Li Z-L 2003 Surface temperature and water vapour retrieval from MODIS data. Received 14
May 2002; in final form 10 February 2003.
International Journal of Innovation and Scientific Research ISSN 2351-8014 Vol. 7 No. 1 Aug. 2014, pp. 19-27 © 2014 Innovative Space of Scientific Research Journals http://www.ijisr.issr-journals.org/
Corresponding Author: D.Kavitha 19
IMPROVE THE PERFORMANCE OF USER SEARCH GOALS USING FEEDBACK SESSION
D.Kavitha1, K.M.Subramanian
1, and Dr.K.Venkatachalam
2
1Computer Science and Engineering, Erode Sengunthar Engineering College,
Anna University Chennai, Tamilnadu, India
2Electrical Communication and Engineering, Vellalar College of Engineering and Technology,
Anna University Chennai, Tamilnadu, India
Copyright © 2014 ISSR Journals. This is an open access article distributed under the Creative Commons Attribution License, which permits unrestricted use, distribution, and reproduction in any medium, provided the original work is properly cited.
ABSTRACT: Search engine is one of the most important applications in today’s internet. Users collect required information
through the search engine in the internet. Analyzing user search goals are essential to provide best result for which the user looks for in the internet. In existing system, various techniques such as Feedback session, goal text, Pseudo-documents restructuring search result based on term frequency are used to infer user search goals. Existing search results based on term frequency (keywords) which may display unwanted results. In proposed system “Classified Average Precision (CAP)” algorithm is used to understand user search goals efficiently and evaluate the performance of inferring user search goals. Phrase search is performed in proposed system instead of keyword search. Initially Noun Phrase of user query is framed using natural language processing. Framed noun phrases are searched in webpages available in Internet. Term frequency of each noun phrase is found in Pseudo document i.e., finding number of webpages a particular noun phrase is occurred. Based on term frequency, place the webpage/document which contain only the above noun phrases at top link. Here user needs is highlighted and provides a user friendly search engine. Performance of inferring user search goal is evaluated using a new CAP algorithm.
KEYWORDS: Classified Average Precision (Cap), User Search, Feedback Session.
1 INTRODUCTION
In web search applications, queries are submitted to search engines to represent the information needs of users mostly queries may not represent user’s specific information exactly. User desire to obtain information to satisfy the need exactly. In order to achieve the user’s desire web search result can be restructured to provide user search information at top among result patterns displayed various steps involved in acquiring user’s goal are first restructure web search results based on grouping the results of some goal together. Second representing some phrases frequently used in grouped search result. Last step reranking search results that containing different user search goal. Various people attempts to infer user goals using various techniques like predefining the queries into two classes (i.e.) product intent and job indent, analyzing the clicked URL’s directly from user click through logs to organize search results.
User search goal represent for what user looks for in the internet. The feedback session is defined as the series of both clicked and unclicked URLs and ends with the last URL that was clicked in a session from user click through logs. Since feedback session represent both clicked and unclicked URLs. Feedback session provides idea to cluster user care about and does not care about. Instead of goal text the phrase search is performed. Based on the feedback session construct the pseudo document for analyzing the accurate result. This pseudo document consist of phrases for each URLs present in the feedback session. This is called as enriched URLs. The enriched URLs are clustered and form a pseudo document. Clustering is the process of grouping the data into classes or clusters. So that objects within a cluster have a high similarity in comparison to one another but are very dissimilar to object in other clusters. After constructing the pseudo document the web search results are restructured and CAP algorithm is used to evaluate the performance of restructured search results.

IMPROVE THE PERFORMANCE OF USER SEARCH GOALS USING FEEDBACK SESSION
ISSN : 2351-8014 Vol. 7 No. 1, Aug. 2014 20
The main contribution of this paper as follows:
Clustering feedback sessions is more efficient than clustering search results or clicked URLs directly.
Combination of enriched URLs in the feedback session to form a pseudo document which reflect information needs of users.
To achieving the user search goal efficiently and provide user friendly environment in web search application.
Search engine displays only user wanted information. Unwanted or related search results are placed at last. User search goal is achieved from top search results of the proposed system. Noisy data is completed eliminated by the proposed policies. Main objective is to provide user searching information in first fewer links of the search result. In existing system, keyword search was performed. In proposed, phrase search is performed. Phrase search provides efficiency and better search result.
The rest of the paper is organized as follows: The related work can be presented in section2. The system architecture is presented in section3. The proposed system and the evaluation is based on restructuring web search results is presented in section4. Implementation of proposed system is depicted in section5 and concludes the paper in section6.
2 RELATED WORK
Efficient algorithm is used for finding user friendly environment in web search application using data mining concepts. In order to finding the automatic goal identification based on human subject study by using user-click behavior and anchor link distribution, Zheng Lu et al. [2]. In [3] Barbara Poblete et al. to achieve better results using non-supervised tasks such as clustering and labeling.
In [4] clustering search results is an efficient way to organize search results using commercial search engine log data. In [5] Rosie Jones et al. generating a new query to replace a users original search query using query pair algorithm. In [6] Xiao Li et al. increasing the amount of training data based on click graph using semi-supervised click graphs.
In [7] Steven M.Beitzed et al. web query classification is used to improving retrival effectiveness and efficiency. In [8] Daxin Jiang et al. query suggestion by mining query patterns from search logs using query suggestion step and concept sequence suffix. In [9] Dou Shen et al. web query classification aims to classify web users queries, which are often short and ambiguous, into a set of target categories. In [10] Rosie Jones et al. analysis of typical timeouts used to divide query streams into sessions, and demonstration that they are less than optimal for this task
3 SYSTEM ARCHITECTURE
In this section, we represent the system architecture for user search goal evaluation. Initially we enter the user query. System architecture of the proposed system is depicted using the above figure Fig.1. Initially user enter query for which he/she search for in the Internet. Original search results will be displayed. Feedback session is formed from the original search results to monitor user logs. Next, noun phrase is generated using natural language processing. Pseudo documents contain noun phrase along with its term frequency. Based on term frequency, original search results is re-structured which provides user search goal on top links. Finally performance of original and re-structured search results is analyzed.

D.Kavitha, K.M.Subramanian, and Dr.K.Venkatachalam
ISSN : 2351-8014 Vol. 7 No. 1, Aug. 2014 21
Fig. 1. Architecture for User Search Goal Evaluation
4 PROPOSED SYSTEM
User’s search goal is inferred efficiently by displaying his/her required information at top links among search results. Phrase search is performed instead of keyword search. Noun phrase for user query is framed using natural language processing. Newly framed nun phrases are searched in webpages available in Internet and web page containing exact phrase is placed at top link. Proposed system consists of variety of modules. First module is Construction of Feedback Session in which session is formed to indentify user search goal. Second module is Noun Phrase generation in which noun phrase of user entered query is generated. Third module is Clustering the Pseudo Documents which consists of noun phrase with its term frequency stating a particular phrase present in how many documents. Fourth module is Re-ranking the web search results in which search result containing user goal is placed in top links. Last module is Performance Analysis, in this module performance of existing system search results and proposed system search results is observed.
Feed Back Session
Noun Phrases Generation
Pseudo Document
Based on ranking
Restructure search results
User search goals
CAP Evaluation
Query Original Search results

IMPROVE THE PERFORMANCE OF USER SEARCH GOALS USING FEEDBACK SESSION
ISSN : 2351-8014 Vol. 7 No. 1, Aug. 2014 22
4.1 CONSTRUCTION OF FEEDBACK SESSION
Feedback session is considered by grouping set of URL’s based on user click through logs. Feedback session consists of both clicked and unclicked URL’s. In which clicked URL’s tells about “what user care for”. Unclicked URL’s tells about “what user does not care about”. Feedback session is used to focus on user’s search goal. Feedback session provides user logs, using which usage of a particular document is determined.
Each feedback session can tell what a user requires and what he/she does not care about. Moreover, there are plenty of diverse feedback sessions in user click-through logs. Therefore, for inferring user search goals, it is more efficient to analyze the feedback sessions than to analyze the search results or clicked URLs directly. Multiple feedback sessions are considered to provide efficient information regarding user search goals.
Fig. 2. Feedback Sessions
Fig. 2. A feedback session in a single session. “0” in click sequence means “unclicked.” All the 10 URLs construct a single session. The URLs in the rectangular box construct a feedback session.
4.2 NOUN PHRASE GENERATION
Noun phrase for user enter query is framed using natural language processing. Natural language processing is a technique used to indentify noun, verb, object etc in a sentence. Here user query is considered as sentence and it is analyzed to indentify the meaning of user query. Natural language separate noun, verb etc in a query and analyze the meaning of the user query. After analyzing the query, phrases are framed as following example. Phrases is an incomplete sentence which contain noun and verb. Synonyms for keywords in user entered query is also found and phrases are framed using those synonyms. Main purpose of finding synonyms is to cover user search goals efficiently. An example for noun phrase generation for a sample query is given below
Query: What is use of Internet?
Phrases:
i. Internet is used for ii. Uses of Internet iii. Benefits of Internet iv. Advantages of Internet v. Functions of Internet
vi. Purpose of Internet etc.,

D.Kavitha, K.M.Subramanian, and Dr.K.Venkatachalam
ISSN : 2351-8014 Vol. 7 No. 1, Aug. 2014 23
4.3 CLUSTERING THE PSEUDO DOCUMENTS
Clustering groups user search content. K-mean algorithm is used to cluster the Pseudo documents. Since feedback sessions vary a lot for different click-throughs and queries, it is unsuitable to directly use feedback sessions for inferring user search goals. Some representation method is needed to describe feedback sessions in a more efficient and coherent way. There can be many kinds of feature representations of feedback sessions.
In proposed system the Pseudo document contains phrases framed along with its respective term frequency. Term frequency states, how many documents contain a specific phrase. Each and every noun phrase generated is searched thoroughly in web document available in World Wide Web. By searching, pick the web documents which contain above stated phrases exactly.
Term Frequency represents number of document a particular phrases occurs in various document is calculated
Fig. 3. Pseudo document
Figure 3, depicts the Pseudo document which consists of noun phrases and number of documents in which a particular noun phrases occurs exactly.
4.4 RE-RANKING THE WEB SEARCH RESULTS
Since search engines always return millions of search results, it is necessary to organize them to make it easier for users to find out what they want. In existing system mostly clicked URL is placed at top links, Restructuring web search results is an application of inferring user search goals. This paper introduce how to restructure web search results by inferred user search goals at first.
Based on Term frequency of the phrase in pseudo document re-structuring is performed. Phrase which occurs in maximum number of document is considered first. In that, Document containing exact phrase is displayed first. Likewise all the documents are re-structured accordingly. Related links are displayed at last.

IMPROVE THE PERFORMANCE OF USER SEARCH GOALS USING FEEDBACK SESSION
ISSN : 2351-8014 Vol. 7 No. 1, Aug. 2014 24
4.5 PERFORMANCE ANALYSIS
In this module, performance of existing system and proposed system in measured. In existing system user search goal is inferred. It just states what user search for and what user does not search for. Hence existing system may display unwanted or noisy search results. In proposed system, user search goal is provided exactly at first link among the search results. Based on availability of user search goal at top link, efficiency is stated. User required information can be gathered with in some top search results.
Fig. 4. Performance Analysis
5 IMPLEMENTATION
Proposed system has been implemented using PHP & MySQL. PHP is used at front end and MySQL is used at back end to store various webpages from the Internet. Google Search Engine is considered as existing system, which displays users search goal in elegant manner. Usually Google search engine displays often clicked webpages at top link which consists of keywords in user query. Wikipedia content links mostly displayed at top links in Google search engine. Users goal may be obtained from forth coming links. User search goal at top links cannot be assured and noisy data may be displayed.
Search results of Google search engine is depicted below.

D.Kavitha, K.M.Subramanian, and Dr.K.Venkatachalam
ISSN : 2351-8014 Vol. 7 No. 1, Aug. 2014 25
Fig. 5. Existing Search results
Proposed search engine provides user search goal at top links. This can be achieved by techniques like Feedback session, Noun Phrase, Pseudo documents and Restructuring search results based on phrase frequency. As stated about modules in Section 4, proposed has been designed. Feedback session provides user click logs. Noun phrase generation provides noun phrase of user entered query. Pseudo document provides frequency of noun phrases. Number of documents a particular noun phrase is occurred.
Search results of Proposed search engine is depicted below.

IMPROVE THE PERFORMANCE OF USER SEARCH GOALS USING FEEDBACK SESSION
ISSN : 2351-8014 Vol. 7 No. 1, Aug. 2014 26
Fig. 6. Restructured Results
Figure 6, depicts the search result of the proposed system. In this, uses of computer in schools was placed in first link. All the displaying links contain only the uses of computer, not the general information about the computer. Hence users search goal is achieved efficiently. Proposed search engine lists only information needed by the user.
6 CONCLUSION
In this paper, a novel approach has been proposed to infer user search goals for a query by clustering its feedback sessions represented by pseudo-documents. First, we introduce feedback sessions to be analyzed to infer user search goals rather than search results or clicked URLs. Both the clicked URLs and the unclicked ones before the last click are considered as user implicit feedbacks and taken into account to construct feedback sessions.
Therefore, feedback sessions can reflect user information needs more efficiently. Second, we map feedback sessions to pseudo documents to approximate goal texts in user minds. The pseudo-documents can enrich the URLs with additional textual contents including the titles and snippets. Based on these pseudo-documents, user search goals can then be discovered and depicted with some keywords. Finally, a new criterion CAP is formulated to evaluate the performance of user search goal inference. Proposed system is used to infer user search goal efficiently. Existing system is used to categorize about what user care and does not care about. Re-structuring is performed in such a way. In proposed system, phrase search is performed for user query. Searching for phrase provides user requirement exactly. During Re-structuring Webpage containing exact phrase can be placed at top link. Unwanted or noisy search results will not be displayed in the proposed system. Thus user goal is inferred efficiently and exactly.
REFERENCES
[1] Beitzel. S, Jensen. E, Chowdhury. A, and Frieder. O, (2007), “Varying Approaches to Topical Web Query Classification,” Proc. 30th Ann.Int’l ACM SIGIR Conf. Research and Development (SIGIR ’07), pp. 783-784.
[2] Baeza-Yates. R, Hurtado. C, and Mendoza. M, (2004), “Query Recommendation Using Query Logs in Search Engines,” Proc. Int’l Conf. Current Trends in Database Technology (EDBT’04), pp. 588-596.
[3] Beeferman. D and Berger. A, (2000), “Agglomerative Clustering of a Search Engine Query Log,” Proc. Sixth ACM SIGKDD Int’l Conf. Knowledge Discovery and Data Mining (SIGKDD’00), pp. 407-416.

D.Kavitha, K.M.Subramanian, and Dr.K.Venkatachalam
ISSN : 2351-8014 Vol. 7 No. 1, Aug. 2014 27
[4] Cao. H, Jiang. D, Pei. J, He. Q, Liao. Z, Chen. E, and Li. H, (2008), “Context-Aware Query Suggestion by Mining Click-Through,” Proc. 14th ACM SIGKDD Int’l Conf. Knowledge Discovery and Data Mining (SIGKDD ’08), pp. 875-883.
[5] Chen. H and Dumais. S, (2000), “Bringing Order to the Web: Automatically Categorizing Search Results,” Proc. SIGCHI Conf. Human Factors in Computing Systems (SIGCHI ’00), pp. 145-152.
[6] Huang C.K, Chien. L.-F, and Oyang. Y.-J, (2003), “Relevant Term Suggestion in Interactive Web Search Based on Contextual Information in Query Session Logs,” J. Am. Soc. for Information Science and Technology, vol. 54, issue no. 7, pp. 638-649.
[7] Jones. R, Rey. B, Madani. O, and Greiner.W, (2006), “Generating Query Substitutions,” Proc. 15th Int’l Conf. World Wide Web (WWW ’06), pp. 387-396.
[8] Joachims. T, Granka. L, Pang. B, Hembrooke. H, and Gay. G, (2005), “Accurately Interpreting Clickthrough Data as Implicit Feedback,” Proc. 28th Ann. Int’l ACM SIGIR Conf. Research and Development in Information Retrieval (SIGIR ’05), pp. 154-161.
[9] Joachims. T, (2003), “Evaluating Retrieval Performance Using Clickthrough Data,” Text Mining, J. Franke, G. Nakhaeizadeh, and I. Renz, eds., Physica/Springer Verlag, pp. 79-96.
[10] Jones. R and Klinkner .K.L, (2008), “Beyond the Session Timeout: Automatic Hierarchical Segmentation of Search Topics in Query Logs,” Proc. 17th ACM Conf. Information and Knowledge Management (CIKM ’08), pp. 699-708.
[11] Lee. U, Liu. Z, and Cho.J, (2005), “Automatic Identification of User Goals in Web Search,” Proc. 14th Int’l Conf. World Wide Web (WWW ’05), pp. 391-400.
[12] Li. X, Wang. Y.-Y, and Acero. A, (2008), “Learning Query Intent from Regularized Click Graphs,” Proc. 31st Ann. Int’l ACM SIGIR Conf. Research and Development in Information Retrieval (SIGIR ’08), pp. 339-346.
[13] Poblete. B and Ricardo. B.-Y, (2008), “Query-Sets: Using Implicit Feedback and Query Patterns to Organize Web Documents,” Proc. 17th Int’l Conf. World Wide Web (WWW ’08), pp. 41-50.
[14] Shen. D, Sun. J, Yang. Q, and Chen. Z, (2006), “Building Bridges for Web Query Classification,” Proc. 29th Ann. Int’l ACM SIGIR Conf. Research and Development in Information Retrieval (SIGIR ’06), pp. 131-138.
[15] Wang. X and Zhai. C.-X, (2007), “Learn from Web Search Logs to Organize Search Results,” Proc. 30th Ann. Int’l ACM SIGIR Conf. Research and Development in Information Retrieval (SIGIR ’07), pp. 87-94.
[16] Zheng. Lu, Hongyuan Zha, Xiaokang Yang, (2006), “Automatic Query Log Identification of User Goals in Web Search” Proc. 29
th Ann. Int’l ACM SIGIR Conf. Research and Development in Information Retrieval (SIGIR’ 06), pp. 135-148.

International Journal of Innovation and Scientific Research ISSN 2351-8014 Vol. 7 No. 1 Aug. 2014, pp. 28-37 © 2014 Innovative Space of Scientific Research Journals http://www.ijisr.issr-journals.org/
Corresponding Author: ANANWA JOSEPH CHIKA 28
TERRORISM AND SUSTAINABLE DEVELOPMENT IN NORTHERN NIGERIA
ANANWA JOSEPH CHIKA
National Open University of Nigeria, Lagos, Nigeria
Copyright © 2014 ISSR Journals. This is an open access article distributed under the Creative Commons Attribution License, which permits unrestricted use, distribution, and reproduction in any medium, provided the original work is properly cited.
ABSTRACT: Terrorism is an act of political violence which cause fear and inflict pains; destructions and loss of lives which are
mostly carried out by Nation-States, criminal gangs and sometimes unorganized individuals. But development can only be carried out and sustained by human and it can not occur without peace and not just peace but people living without fear totally committed to congenial existence within the society. That is why the state of destructive insecurity being experienced presently in the northern Nigeria is unfortunate and regrettable. Terrorist groups exist all over world mostly in third-world countries while their activities are mainly political in nature it has direct effect on the economic development of the area where they operate. So many lives and property had been destroyed within the last five (5) years in the Northern Nigeria; effort made by the federal and state governments in the region to curb the man made disaster was all in vain. This study therefore examined the causes, what, why and how terrorism and terror groups in the northern Nigeria can be curtailed so that development can be sustained in that geo-political region. The study also concluded that concerted efforts must be made by both government and private sector to wage an all frontier war on armed criminal gangs by whatever name they call themselves.
KEYWORDS: Terrorist Group, Sustainable Development, Northern Nigeria, Boko Haram, Armed gangs.
1 INTRODUCTION
Terrorism is a recent phenomenon when compared to other anomalous happenings like war, crime and poverty, terrorism occurs not only in Nigeria but all over the globe. According to United States Department of Defence terrorism is a calculated use of unlawful violence or threat of unlawful violence to inculcate fear; intended to coerce or to intimidate Governments or Societies in the pursuit of goals that are generally political, religious, or ideological. Terrorism and terrorist acts date back to the eighteenth century according to Lacquer [1]. Nigeria in recent time had experienced quite a number of terrorist acts especially in the Northern part of the country. Sustainable development can be defined as the formulation and implementation of a development option for the achievement of appropriate and justifiable social, economic and political goals that meet basic needs and equity without compromising the natural system for the future generations [2].
It is important to note that an attempt to forcefully impose religious ideology or belief on the Nigerian society since her independence in 1960 especially in the Northern part is not new. The first major attempt in the post colonial period was led by the leader of the Maitatsine sectarian group in 1980s and eventually led to large scale uprisings. Thus, it can therefore be said that the emergence of this dreaded Islamic sect Jama’atu Ahlis Sunnah Lidda’awati wal-Jihad popularly known as the Boko Haram or Yobe Taliban had its root and inspiration from the post colonial period as well as from the “Maitatsine” uprisings of the early 1980s in particular.
Terrorism and terrorist acts does not go hand in hand with sustainable development since the major agents of development remain human beings, natural resources, and infrastructures. This study therefore did not only educe the causes and impact of terror acts in the Northern part of Nigeria but also gave several recommendations which if applied can help to curb the activities of the terrorist groups in the country.

ANANWA JOSEPH CHIKA
ISSN : 2351-8014 Vol. 7 No. 1, Aug. 2014 29
2 CONCEPTUAL CLARIFICATIONS
2.1 TERRORISM
Terrorism is a criminal act. Whether the terrorist chooses to identify himself with military terminology e.g. Liberation Front, Freedom Fighter or with civilian descriptions brotherhood, committee etc., he is a criminal in both spheres.
Terrorism was defined by Sampson and Onuoha [3], as “the premeditated use or threat of use of violence by an individual or group to cause fear, destruction or death, especially against unarmed targets, property or infrastructure in a state, intended to compel those in authority to respond to the demands and expectations of the individual or group behind such violent acts. According to Alex [4]. Terrorism is a method of combat in which random or symbolic victims serve as an instrumental target of violence. These instrumental victims share group or class characteristics that form the basis for their selection for victimization. Through the previous use of violence or the credible threat of violence other members of the group or class are put in a state of chronic fear. The purpose of this indirect method of combat is either to immobilize the target in order to produce disorientation and/or compliance or mobilize secondary targets of demands (e. g., a government) or targets of attention (e. g., public opinion) to change their attitude or behaviour favouring the short and long term interests of the users of this method of combat [5].
But to US department of Justice, Terrorism involves violent acts or acts dangerous to human life that are violation of the criminal laws of the United States, or that would be a criminal violation if committed within the jurisdiction of the United States or any state. These acts appear to be intended to intimidate or coerce a civilian population, influence the policy of a government by intimidation or coercion, or affect the conduct of a government by assassination or kidnapping. International terrorist acts occurs outside the United States, or transcend national boundaries in terms of the means by which they are accomplished, the persons they intended to coerce or intimidate, or the locale in which their perpetrators operate or seek asylum [6].
Canada’s Anti-terrorism Act (Bill C-36) designates “terrorist activity” as “an act or omission that is committed in whole or in part for a political, religious or ideological purpose, objective or cause and in whole or in part with the intention of intimidating the public, or a segment of the public, with regard to its security, including its economic security, or compelling a person, a government or a domestic or an international organization to do or to refrain from doing any act, whether the person, government or organization is inside or outside Canada.
United Nations in 1992; Opined that terrorism is an anxiety-inspiring method of repeated violent action, employed by (semi-) clandestine individual, group or state actors, for idiosyncratic, criminal or political reasons, whereby - in contrast to assassination - the direct targets of violence are not the main targets.
Nigeria witness the rise of Jama’atu Ahlis Sunnah Lidda’awati wal-Jihad (popularly called Yobe Taliban) and later known as Boko Haram, they have a strong desire for an Islamic state/government and they have attacked severally and severely in the North Eastern region of the country.
I wish to mention and condemn the gruesome terrorist attack carried out at Nyanya Motor Park in Abuja on Monday 14th
April 2014 by Boko Haram where over 100 persons were killed and scores injured. This heinous crime was carried out at the time of researching this paper.
Boko Haram the terrorist group believed to have lunched the attack is an armed terrorist group blamed for killing hundreds of other people in northern and central Nigeria. Many of their attacks have targeted places of worship, often churches, but some Muslims have also been killed [7].
The group was supposedly founded in 2002 in Maiduguri, the capital of
Borno state, allegedly by Mohammed Yusuf, a religious teacher. Yusuf is hostile to democracy and the secular educational system, vowing that "this war that is yet to start would continue for long" if the political and educational system was not changed.
In 2004, it moved to Kanamma in Yobe state, close to the border with Niger, where it set up a base known as "Afghanistan", from which it attacked nearby police outposts. Boko Haram means "Western education is sin" in the Hausa language spoken in Northern Nigeria. It is believed to have a number of factions with differing aims, including some with political links.
The group initially claimed to be fighting for the creation of an Islamic state in the north; but a range of demands by different Set of splinter Terror groups have since been issued. Nigeria has been in the forefront in the efforts to fight the spread of terrorism, this was shown in the finding of Martins et al [8].

TERRORISM AND SUSTAINABLE DEVELOPMENT IN NORTHERN NIGERIA
ISSN : 2351-8014 Vol. 7 No. 1, Aug. 2014 30
Partly in expectation of the occupation by Nigeria of a non Permanent Seat on the United Nations Security Council as from January 1, 2010, the United Nations Analytical Support and Sanctions Monitoring Team visited Nigeria in November 2009 in order to assess the extent of compliance by Nigeria with the UN Security Council resolutions. The findings of the Monitoring Team were satisfactory. For instance, of the sixteen United Nations Universal Instruments against Terrorism, Nigeria has already ratified nine. These includes the Convention on Offences and Certain Other Acts Committed on Board Aircraft (1963); Convention for the Suppression of Unlawful Seizure of Aircraft (1970); Convention for the Suppression of Unlawful Acts against the Safety of Civil Aviation (1971) and that against the Safety of Maritime Navigation (1988); and Convention on the Prevention and Combating of Terrorism (1999). Nigeria ratified the United Nations Conventions against Trans-national Organized Crime (2001). At the level of the OAU/African Union, Nigeria has adopted the OAU Convention on the Prevention and Combating of Terrorism, which was done in July 1999 in Algiers. Nigeria has also adopted the Declaration on Terrorism made in 2001 in Senegal, as well as The Plan of Action for the Prevention and Combating of Terrorism by the Intergovernmental High Level Meeting of African Union in September 2002 in Algiers, Algeria in Akanji [9].
According to former Minister of Information, Chief Nweke Terrorism can no longer be treated as the problem of one particular country, because incidences of terrorism have been recorded all over the World, including the United States, Middle East, Europe and some part of Africa. He said even before the 9/11 incident in the U S, there was the bombing of U S embassy in Nairobi-Kenya, Tanzania, and Uganda.
Terrorist group commits acts of violence in order to produce widespread fear, obtain worldwide, national, or local recognition for their cause by attracting the attention of the media. Harass, weaken, or embarrass government security forces so that the government overreacts and appears repressive. Steal or extort money and equipment, especially weapons and ammunition vital to the operation of their group.
Destroy facilities or disrupt lines of communication in order to create doubt that the government can provide for and protect its citizens. Discourage foreign investments, tourism, or assistance programs that can affect the target area’s economy and support of the government in power. Influence government decisions, legislation, or other critical decisions, free prisoners and carried out vengeance.
Turn the tide in a guerrilla war by forcing government security forces to concentrate their efforts in urban areas. This would allow the terrorist group to establish itself among the local populace in rural areas.
2.2 SUSTAINABLE DEVELOPMENT
World Commission on Environment and Development, also known as the Brundtland Commission, defined sustainable development in its 1987 report “Our Common Future” as a process of development that “meets the needs of the present without compromising the ability of future generations to meet their own needs”[10].
The watershed for sustainable development as a concept and priority was the UN Conference on Environment and Development, the Earth Summit, which was held in Rio de Janeiro in 1992 [11].
The summit issued two important declarations one, the inseparability of the fate of humankind from that of the Earth and conventional sustainable development in an international framework. Two, on the program of action that includes detailed goals, responsibilities, work plans, and funding estimates to implement sustainable development at the local, national and global levels.
As a result of globalization, external factors have become critical in determining the success or failure of developing countries in their national efforts towards sustainable development. If the momentum for global progress towards sustainable development is to be maintained and increased particularly in the areas of finance, technology transfer and debt/trade, full and effective participation of developing countries in global decision-making must be encouraged [12].
The trend should be to promote an integrated approach to policy-making at the national, regional and local levels for transport services and systems to promote sustainable development, including policies and planning for land use, infrastructure, public transport systems and goods delivery networks, with a view to providing safe, affordable and efficient transportation, increasing energy efficiency, reducing pollution, congestion and adverse health effects and limiting urban sprawl, taking into account national priorities and circumstances. Throughout the ages, mankind has, for economic and other reasons, constantly interfered with nature. In the past, this was often done without consideration of the effects upon the environment. Owing to new scientific insights and to a growing awareness of the risks for mankind (present and future generations) of pursuit of such interventions at an unconsidered and unabated pace, new norms and standards have been developed, set forth in a great number of instruments during the last two decades.

ANANWA JOSEPH CHIKA
ISSN : 2351-8014 Vol. 7 No. 1, Aug. 2014 31
The most potentially far-reaching aspect of sustainable development is that for the first time it makes a state's management of its own domestic environment a matter of international concern in a systematic way [13].
Sustainable development has also become a yardstick to evaluate development activities in a continuous manner that influence the decision making process.
The achievement of growth and development therefore has been challenged by the astronomical incidence of terrorist activities in Nigeria in recent times. The pattern and trend of terrorism, revolution, different forms of strike actions, premeditated application or threats of violence against religious groups and politically motivated expressions of violence in the present democratic era have threatened development, democratic governance and economic activities in the Nigeria. According to Czinkota and Ronkainen [14],
the impact of terrorist activities on economic development, management and
international business has increased tremendously in Nigeria.
Nigeria is significantly in dire need of uninterrupted development, sustained democratic governance, investment-friendly environment as well as ultimate macroeconomic stability. Development is multifaceted and multidimensional in nature with structural, institutional, political, social and all round transformation process. There is no doubt that self-sustained rural community development is vital to the economic and social progress of any developing nation like Nigeria. This desirable economic scenario is currently being threatened by the activities of terror groups in Nigeria, Northern Nigeria in particular.
2.3 NORTHERN NIGERIA
Northern Nigeria was originally a creation of British government and a Protectorate which was established in 1900 and lasted up to 1914, now located in the present country of Nigeria. The protectorate spanned 255,000 miles (410,000 km) including the pre-colonial states of the Sokoto Caliphate, the Bornu Empire, and the Kano Emirate. The first High Commissioner of the protectorate was Frederick Lugard who actively suppressed revolutions and created a system of administration built around native authorities or indirect rule. The Protectorate ended in 1914 when it was amalgamated with the Southern Protectorate and the Lagos Colony which was named Northern Province Colony and Protectorate of Nigeria wikiped.com [15].
The Berlin conference of 1884/1885 which some writers tagged the scramble and partition of Africa ceded the Northern, Southern protectorate and Lagos colony to Britain. The present Northern Region was one of Nigeria’s federal divisions. It was created before independence in 1960, with its capital at Kaduna. Major general Gowon later divided the country into twelve states with the North having the lion share in 1967 in an attempt to obviate the Nigerian civil war. Namely - Benue-Plateau State, Kano State, Kwara State, north-central State, North-Eastern State and North-Western State.
Following subsequent division the region had nineteen states currently. Northern Nigeria in the contemporary is further divided into three geo-political zones (without constitutional powers) which comprised North West, North East and North Central during Abacha’s regime. Northern Nigerians is seen by the their Southern counter part as being lop-sided in seize when compared to the South; that is why even in the current political dispensation Peoples Democratic Party (PDP) insists that the president must rotate only between the two political region of North and South. The Northern region is mostly Moslem with some Christian minority located mainly in the North Central States of Benue, plateau, Adamawa, Taraba, Kogi and Southern Kaduna. The economic main stay of the people in the region is mostly agriculture, with the region producing farm goods like maize, yam tubers, beans and large quantities of vegetables mostly for direct and subsistence consumption.
Most State governments in the present Northern Region of the country adopted what was termed political Sharia Law during the former president Olusegun Obasanjo’s regime 1999 to 2003. (Perhaps that single incident was the immediate cause and take off of terrorism and terrorist organization in Nigeria). The region lack basic educational facilities while family planning is not in their lexicon. Many children are un-catered for, and they are ready tools in the hands of the fanatics like Boko harem and kala Kato; another religious terrorist group in northern Nigeria formed by Malam Isiyaka.
3 CAUSES OF TERRORISM
The search for causes and causality is a central theme in all social sciences, deriving from the inherent need to understand the occurrence of particular phenomena. Moreover, in dealing with undesirable occurrences, we seek to understand the ‘why’ and ‘how’ in order to develop appropriate counter measures [16].
According to Martha Crenshaw [17], the causes of terrorism can be grouped into two viz.
Root causes (or remote) are those factors that set the stage for terrorism over the long period.

TERRORISM AND SUSTAINABLE DEVELOPMENT IN NORTHERN NIGERIA
ISSN : 2351-8014 Vol. 7 No. 1, Aug. 2014 32
Trigger causes (or immediate) are specific events that immediately precede the occurrence of terrorism.
The factors that create and nurture terrorism or motivate terrorist group varied, more often than not they exist to bring disorder that cannot be easily be separated into distinct groups. But according to Kegley [18], the following are the major factors.
3.1 RELIGIOUS EXTREMISM
Every faith has its own fundamentalists and extremists; terrorism was perceived to be closely linked to Islamic fundamentalism. The political desire by fundamentalist group in Islamic world to overthrow their secular governments and replace them with theocratic ones is responsible for the violence in countries such as Algeria, Egypt, Indonesia, Philippines; e t c. Such group emerged in Nigeria and called themselves Jama’atu Ahlis Sunnah Lidda’awati wal-Jihad (popularly called Yobe Taliban) and later known as Boko Haram supposedly in 2009. A similar group with Christian background is The Lord Resistance Army in Uganda, which uses kidnapping and violence as a means of replacing the Ugandan government with one that is based on the Ten Commandments.
3.2 PERCEIVED OPPRESSION
According to Wardlaw [19], groups which use oppression as excuse for terrorism believe they are not getting a fair share of the resources available to the state or consider themselves as being inadequately represented in the executive arm of the government. Example of these abound for instances the Israel/Palestine crisis over land use, agitation for resource control in Nigeria’s Niger Delta and the clamouring for freedom of religious expression in China.
3.3 NATIONALIST OR RACIAL CONSIDERATIONS
These are people of common origin having same culture, language and fighting to form a nation state of their own. They usually have some clearly defined political objectives on issue like self – determination and independence for their people/territory. Mostly they claim to be marginalised, oppressed and being cheated out of their share of public revenue. Examples of this are (E T A) in Spain, the Irish Republican Army (I RA) of Britain, the Tamil Tiger of Sri Lanka, etc.
3.4 ABSENCE OF CENTRAL AUTHORITY
The total breakdown of law and order in failed states especially Somali and during the ethnic strife in Liberia and Sierra Leone, and recently Sudan. Others include Iraq and Libya. These usually give rise to the emergence of war lords who engage in hostage taking, extortion and attacks on civilian targets.
3.5 POVERTY AND IGNORANCE
These factors equally precipitate terrorism; the perpetrators easily capitalize on the deprived economic condition of the masses to manipulate and instigate them against the state. Monetary incentives and religious indoctrination are used by terrorists as veritable tools where poverty and ignorance pervaded. Studies have shown that some of the factors responsible for violent conflicts in Nigeria include poverty, unemployment, and religious intolerance, ethnic rivalry and growing acculturation. Others are resource control agitations and ignorance. Most critical of these factors however is ignorance, which leads to suspicion and mistrust.
State sponsored; in this category are activities of state cum terrorist operators, which in the past included terrorist acts allegedly perpetrated by Libya and Iraq. Here Nation States hire, train and sponsor terrorist organization to carry criminal acts for example Iran and Syria. Such activities have been directed against dissidents at home and abroad and foreign nations whose political opposition has cause substantial irritation to a dictatorial regime.
3.6 POLITICAL IDEOLOGICAL
These could be right or left or anarchist. A Large group of terrorist organizations emerged during the cold war era; they were motivated by ideological beliefs to purse unlawful aims and objectives. Such groups include the Baader -Meinhof Gang of Germany, Encarta [20], the above represents the major causes of terrorism ideologically, however, government policies and leadership style may also contribute to raising and nurturing of terrorism. The case of militants in the Niger Delta arises from a defective and malfunctioning revenue allocation formula.

ANANWA JOSEPH CHIKA
ISSN : 2351-8014 Vol. 7 No. 1, Aug. 2014 33
3.7 POLITICAL GRIEVANCES
A lack of political inclusiveness in states or grievances against a certain political order may cause individuals to join or create terrorist groups. Left and right wing terrorists groups often seek to participate in the political system of their country as well as many other nations with authoritarian regimes that do not provide avenue for comprehensive political participation. Frustrated expressions of those denied political power can turn to violence as an alternative to exclusive political systems. While somewhat similar to ethno-nationalist/separatist causes, these political grievances are not born from the desire to create a new state but to change the order within the contemporary one.
3.8 ALIENATION /DISCRIMINATION
Several authors on terrorism have pointed to a sense of alienation felt by those who live in a country other than their own, particularly those living in Europe as a driver of terrorism. Many times these groups face discrimination in the countries they reside, leading to further feelings of isolation. They commonly move from poorer countries, particularly Muslim states in the case of Europe, to wealthier ones to go to school or find work once in these countries they begin to feel alienated. The new host nation is substantially different from their country of origin, and is usually much less community oriented. This causes alienated individuals to search for communities with cultures like that of their home countries or others that are close. These groups may become infuriated to the society around them as they don’t fit in and feel excluded. Growing sentiments of discrimination can lead groups to look to more conservative, and eventually, extremist ideologies.
3.9 CORRUPTION
Greater percentage of the populace believed that Nigeria government is corrupt, according to a Gallup survey released in January, 2010.
One of the reasons given by Boko Haram in Nigeria was that the government at all levels are corrupt and therefore must be sacked. The most frightening and damaging aspect of corrupt government is that large number of the populace is accommodating and sympathetic to the cause of the terrorist groups in a protest.
Terrorism is an attractive strategy to groups of different ideological affiliation who challenge the state's authority. Groups who want to stage a cause, to destabilise the government, to achieve popular support, to incite regime to violence, to motivate followers, or to take over a wider opposition movement, who are weak vis-à-vis the regime, and who are impatient to act.
Other causes includes the problem highlighted by Jonathan in a January 9 address where he noted that part of the difficulty in defeating Boko Haram is that the group has infiltrated both the government and the military.
4 EFFECT OF TERRORISM IN NORTHERN NIGERIA
The challenge of terrorism has the potential to threaten Nigeria’s sustainable development, but political stability is however one of the preconditions for prosperity. What is needed is multi-polar counter-terrorism in which both Africa and Nigeria have a vital role to play. The challenge of terror in the seas and terrorism on land pose a threat to Nigeria’s economy and have the potential to threaten its growth in the future. No large emerging economy has created prosperity without stability.
About $600 million was given to Nigeria government by Obama administration through U.S foreign aids to counter and fight terrorism in the country. And since 2010 United State of America bi-lateral dialogue with Nigeria had established strategies to promote and develop peace in the country.
Terrorism has shifted the threat of violence from the Middle East and South Asia to Africa and Nigeria. The members of some of these terrorist groups have expanded ties with other violent Islamist groups, such as those in Mali and the Sahel, including Al Qaeda in the Islamic Maghreb.
Since 2009 terrorist groups especially Boko Haram has randomly targeted churches, motor parks and market places triggering some retaliatory violence and threatening to inflame religious tensions.
Since the end of the civil war no calamity of enormous proportion has befallen this fledging nation-state more than the terror unleashed by the dreadful terrorist group called Boko Haram. Many lives have been lost; properties worth billions of naira have been destroyed. Nobody is insulated from the attack. Government officials and buildings, traditional rulers, police

TERRORISM AND SUSTAINABLE DEVELOPMENT IN NORTHERN NIGERIA
ISSN : 2351-8014 Vol. 7 No. 1, Aug. 2014 34
and military formations and church worshippers are targets. On daily basis, there is panic and the fear of the invincible agitators has become the order of the day and the beginning of wisdom.
Worthy of special attention is the killing by shooting and or kidnapping of school children, terrorist organizations in the north are no longer content with bomb but are now using machine gun to kill their victims.
Below are the topical presentations of the impact of terrorism in the region: -
4.1 SECURITY
Security is the state or feeling of being safe and protected: the assurance that something of value will not be taken away e.g. security of life and property. Security can also be seen as a situation where a person or thing is not exposed to any form of danger or risk of physical or moral aggression, accident, theft or deterioration. But the above definitions are centred on personal and individual wellbeing; but security from other perspectives also includes that of a nation-state, organizations and other entities e.g. security in the Northern Region, Catholic Church, jobs, human rights etc.
The insurgency of terror groups in Northern Nigeria have posed serious security challenges to Nigeria in the sense that people were denied the choice of exercising their natural freedom of movement due to fear of attack from members of Boko Haram and other terror groups. Particularly in some parts of Northern Nigeria where Boko Haram have taken over through planting of bombs as well as brutalized attack on innocent souls.
According to Dyke [21], national security embodies the sovereignty of the state, the inviolability of its territorial boundaries, and the right to individual and collective self-defence against internal and external threats.
But to Freedman [22], national security problems are anything that generates anxiety or threatens the quality of life in some respect.
There is no doubt that Northern Nigeria and indeed the whole country is having serious security problems at present and there is imperative reasons to address the security lapses before it escalate to an unmanageable proportion.
4.2 LOSS OF REVENUE
During the Obasanjo’s regime Nigeria had lost billions of petrol dollars in the South-South region alone. The situation was however revised under the present regime through dialog that led to amnesty and resettlement that cost billions of Naira. In the Northern region Nigeria government is currently losing huge amount of income due to the Boko Haram insurgency especially in Kano, Bornu, Bauchi and Yobe states.
About 97 per cent of businesses in the northern Nigeria were negatively affected by the security problem. Some of them had to close down, while some had to retrench their workers, and others had cut down the number of hours of operation.
4.3 REDUCED FOREIGN DIRECT INVESTMENT
Political stability and peace has always been a panacea for economic and sustainable development anywhere in the world. Investors from within and outside the country steer clear of areas susceptible for trouble and economic disruption of any kind. All business needs the continuous presence of human beings to thrive in addition to the safety of material inputs which must be guaranteed. There is no doubt that Northern of Nigeria and indeed Nigeria had substantial number of investments from within and outside the country.
4.4 IMPEDE PEACE
Peace has been variously defined as freedom from conflict or agreement among people or groups of people, the absence of violence and other disturbances within a state. But peace cannot thrive in an area of insecurity; currently peaceful co-existence in the Northern Region of the country is under severe threat where there is a deep tribal/religious rift between and among various ethnic and religious groups. The precarious security situation across the country that entails kidnapping, terrorism, ritual killings and other criminal activities is lamentable and an urgent solution is needed.

ANANWA JOSEPH CHIKA
ISSN : 2351-8014 Vol. 7 No. 1, Aug. 2014 35
4.5 TERRORIST ACTIVITIES HIDER SUSTAINABLE DEVELOPMENT
Sustainable development is the application of natural resources and human inputs to produce a save and balanced environment that does not impede the well being of the future generations. For development to be sustainable it has to preserved and renewed in peaceful surroundings devoid of terrorist and organized criminal activities. The existing situation in the north as at now is far from being peaceful; with properties worth billions of naira and thousands of lives being destroyed on weekly bases.
4.6 DISTORTION OF CULTURAL EQUILIBRIUM
The social fabric in the Northern Region of Nigeria has been shattered due to the devilish acts of Boko Haram and other terror groups operating in the area. Before now there were some elements of cultural exchange between the people of the north and their southern counter-part especially within the Christians community. The situation has since changed as a result of the call by Boko Haram to non-Muslims to relocate to their various places of origins.
4.7 INCREASES PUBLIC EXPENDITURE
Terrorist activities can and do increase public expenditures, currently federal government of Nigeria is spending huge amount of money in an attempt to check the nefarious activities of Boko Haram. Government as at present is spending about N500:00 per day as an allowance paid to each soldier in the team created to fight terrorist in the north. This is in addition to the money that was used to procure vehicles, surveillance equipments, arms and ammunitions and the one spend in keeping the vehicles on the road. Security related expenditures or security vote (money given to state governors for security within their domain) is on the increase since the menace of the terrorist acts escalated.
4.8 INDUCE FEAR AND UNREST
One of the key instruments of terror groups is fear: fear is defined as unpleasant feeling of anxiety or apprehension caused by the presence or anticipation of danger, concern for something that threatens to bring bad news or results and the likelihood of an undesirable thing happening. Northern Nigeria is at present a place to dread thousands of people had already left; others are contemplating whether to stay or leave. There are calls from some quarters in the south to their kin and kindred to come back home to their place of origin permanently.
5 RECOMMENDATIONS
The ruling elites and the entire government of Nigeria are responsible to a large extent for the terror acts committed across the country especially in the north. It is the mismanagement of the public wealth of the society that created the precondition for ethno-religious rivalries in the country. It was also the same factor that is the root cause of militant activities in the Niger Delta of Nigeria. Nigeria has made billion of dollar from the sales of the crude oil, particularly in the last decade, yet there has been nothing fundamental to show in terms of improved living conditions, social services, job creation and infrastructural development.
Civilian populace equally have to be blamed, if what had happened in Nigeria occur elsewhere their citizens would have since taken to the street in vociferous protest. The government, civilians and some other organizations like religious bodies, organized labour, print and electronic media had equally failed to mount strong oppositions against government in an attempt to force them to perform.
The Nigeria constitution provided an enabling proviso for peaceful co-existence and a secular clause that permits all shade of religious views and practices. It is on that note that this paper put forward the following recommendations: -
The whole of Nigeria must revert back to secularism in sincere practise and there must be one law, one constitution and just application of the said law. The practises of Sharia law in the North must give way in order to eradicate extremism and double standards currently existing in the country.
The incompetence of Nigerian politicians in power is another colossal cankerworm that may lead to disintegration of the country. Therefore concerted effort must be made by all to correct the anomalies presently being experience in Nigeria leadership there cannot be good governance without the input of people.

TERRORISM AND SUSTAINABLE DEVELOPMENT IN NORTHERN NIGERIA
ISSN : 2351-8014 Vol. 7 No. 1, Aug. 2014 36
Government have to amend police act and other enabling laws to give governors command of police in their domain: technical gadgetry and sophisticated devices and international liaison type of collaboration and intelligence support. The legislature should enact fresh and stiffer laws to strengthen the anti terrorist laws with stiff penalties to terrorist when convicted.
The government must expose, denounce and where appropriate prosecute politicians in and out of power involved or connected with violent extremist groups.
The government should provide good, open and responsive governance to deal with subversion and terrorism any where it rear it ugly head.
Stringent border Control and Security measures had to be instituted and made to function maximally to check the influx of those that enter the country without proper documents.
Nigeria as a matter of exigency should embark on massive re-orientation and re-education of the entire populace to equip the citizens with the prerequisite approach to co-habitation and peaceable existence.
6 CONCLUSIONS
The purpose of this paper is to show the effect of terrorism on the sustainable development in the northern part of Nigeria and having reviewed and apprised the various literatures consulted I present the following conclusions.
Terrorism and other related organized crimes had indeed provoked a serious actions and reactions that would continue to impede sustainable development in the Northern part of Nigeria. That concerted effort must commence immediately to find and apply solutions to terrorist insurgencies in the country before it completely gets out of hand. Nigeria should employ both diplomacy and constructive dialog with foreign partners in order to inject more modern strategies towards waging a total war against terror groups in the country.
REFERENCES
[1] Lacquer W. The Age of terrorism, Boston, MA: Little Brown and Co. 1987. [2] United Nations (UN), Report of the World Commission on Environment and Development: Our Common Future, New
York. 1987. [3] Sampson, I.T. and Onuoha, F.C. ‘Forcing the Horse to Drink or Making it Realise its Thirst’? Understanding the
Enactment of Anti-Terrorism Legislation (ATL) in Nigeria, Perspective on Terrorism, Vol. 5, No. 3-4. 2011. [4] Alex, P. S. Political Terrorism: A Research Guide, Theories, Data Bases and Literature. New Brunswick, NJ, Transaction
Books. 1983. [5] Alex, P. S. Political Terrorism: A Research Guide, Theories, Data Bases and Literature. New Brunswick, NJ, Transaction
Books. 1983. [6] United States Code, Title 18, Section 2331 (18 USC 2331). (Encarta, 2009). [7] Chat212.blogspot.com assessed on 22
nd April, 2014.
[8] Martin O. et al, Is Nigeria Really a Security Risk State? The Fronteira Post: 2010 accessed from www.valuefronteira.com on July 4 2011.
[9] Akanji, O.O. The Politics of Combating Domestic Terrorism in Nigeria; in Okumu. W and Botha. A (Ed) Domestic Terrorism in Africa: Defining, Addressing and Understanding its Impact on Human Security. Pretoria: Institute of Security Studies. 2009.
[10] World Commission on Environment and Development. Our Common Future. 1987. [11] Agenda 21: Programme of Action for Sustainable Development, adopted at the United Nations Conference on
Environment and Development, Rio de Janeiro, June. 1992. [12] Johannesburg Declaration on Sustainable Development, 2002 http://www.un-documents.net/jburgdec.htm. on 20th
April, 2014. [13] Patricia Birnie & Alan Boyle, International Law and the Environment 2nd edition. 2002. [14] Czinkota M.R and Ronkainer, I. A. Trends and indications in international business: topic for future Management
International Review, 49:249 – 266. 2009. [15] http://en.wikipedia.org/wiki/sokoto_caliphate assessed on 25th April, 2014 [16] Transnational Terrorism, Security and the Rule of Law in www.transnationalterrorism.eu. [17] Crenshaw M. “The Causes of Terrorism.” Comparative Politics, vol. 13, no. 4, pp. 379-399. 1981.

ANANWA JOSEPH CHIKA
ISSN : 2351-8014 Vol. 7 No. 1, Aug. 2014 37
[18] Kegley C. W Jr. the Characteristics, Causes and Controls of the New Global Terrorism: an Introduction, in Charles W Kegley Jr (ed.), the New Global Terrorism: Characteristics, Causes and Controls, New Jersey: Prentice Hall. 2003.
[19] Wardlaw G. Political Terrorism. Theory, tactics, and counter-measures, Cambridge: Cambridge University Press. 1982. [20] Encarta Dictionary in Microsoft DVD. 2008. [21] Dyke V.V. Security and Sovereignty in International Politics. New York: 1966. [22] Freedman L. “International Security: Changing Targets; Foreign Policy, 110:48-63. 1998.
CHIKA JOSEPH ANANWA
Academic Qualification: -
Bachelor’s Degree in International Studies and Diplomacy
Master’s Degree in Public Administration
PhD Public Administration [in view] National Open University of Nigeria, Lagos
Telephone Number: - +2348038749494
Postal Address: - 4 Ilorin Street, Fegge
Onitsha
Anambra State
Nigeria.

International Journal of Innovation and Scientific Research ISSN 2351-8014 Vol. 7 No. 1 Aug. 2014, pp. 38-49 © 2014 Innovative Space of Scientific Research Journals http://www.ijisr.issr-journals.org/
Corresponding Author: Khayreddine BELAAZE 38
لألسعــار العشوائیــة والحركــة المـال رأس أسـواق كفـاءة
[ The financial markets efficiency and Random walk of prices ]
Rami HARID1, Khayreddine BELAAZE
1, and Rabah KHOUNI
2
1Laboratory of finance, banking and management,
University of Mohamed Khider, BP 145 RP, 07000,
Biskra, Algeria
2Department of commercial sciences,
University of Mohamed Khider, BP 145 RP, 07000,
Biskra, Algeria
Copyright © 2014 ISSR Journals. This is an open access article distributed under the Creative Commons Attribution License, which permits unrestricted use, distribution, and reproduction in any medium, provided the original work is properly cited.
ABSTRACT: This sheet discusses a subject very important it’s the relationship between the efficiency of capital markets and
the random walk of prices, where they appear this relationship through stock prices, which is expected be responsive to all information reach to investors , and movements of prices become random so long as the information contained independent of one another, which increases the efficiency of capital markets, However, some investors access to private information will leading to a non-random changes in prices as a result of information asymmetry and therefore weaken the efficiency of capital markets, Accordingly came the signal theory to help least partially in the provision and correct the information available to investors and raise the efficiency of capital markets.
KEYWORDS: efficiency of financial markets, Random walk of prices, signal theory, information asymmetry.
وضوعا على درجة كبیرة من األھمیة وھو العالقة بین كفاءة أسواق رأس المال والحركة العشوائیة لألسعار، حیث تظھر ھذه العالقة من تتناول ھذه الورقة م ملخص:عن بعضھا وبذلك تصبح حركة األسعار عشوائیة طالما أن المعلومات الواردة مستقلة ،خالل أسعار األسھم التي یتوقع أن تستجیب لكل معلومة تصل الى المستثمرین
ار نتیجة عدم البعض مما یزید من كفاءة أسواق رأس المال، غیر أن حصول بعض المستثمرین على معلومات خاصة سوف یؤدي الى تغیرات غیر عشوائیة في األسعتوفیر وتصحیح المعلومات المتوفرة لدى ، وعلیھ فقد جاءت نظریة االشارة للمساھمة ولو بشكل جزئي فيوبالتالي إضعاف كفاءة أسواق رأس المال تماثل المعلومات
المستثمرین ورفع كفاءة أسواق رأس المال.
.نظریة اإلشارة عدم تماثل المعلومات، أسواق رأس المال، الحركة العشوائیة لألسعار، كلمات داللیة:
تقدیم 1
أسواق رأس المال وبورصات األوراق المالیة ذات كفاءة عالیة تلعب أسواق رأس المال دورا مھما في تحقیق النمو اإلقتصادي، حیث من المعروف أن وجود تمنح مزایا عدیدة لالقتصاد والنظام المالي.
التعامل بأوراقھا ویعتمد االستثمار في األوراق المالیة وتداولھا بالدرجة األساس على االفصاح عن البیانات والمعلومات عن جمیع أنشطة الشركات التي یتم تثمرین، وأن أي السوق المالي، والعنصر الرئیسي في تحدید أسعار األوراق المالیة دقة البیانات والمعلومات المنشورة التي تؤثر كثیرا على قرارات المسالمالیة في
خلل في ھذه البیانات والمعلومات یؤدي الى انخفاض كفاءة أسواق رأس المال.

Rami HARID, Khayreddine BELAAZE, and Rabah KHOUNI
ISSN : 2351-8014 Vol. 7 No. 1, Aug. 2014 39
ات المتاحة حول أصل مالي معین وفي أي لحظة من الزمن منعكسة في سعره في اللحظة ذاتھا، حیث تستمد إذا كانت جمیع المعلوم ءویكون السوق المالي كف بالنسبة لما ھو معلوم ھذه الفرضیة أصولھا من فرضیة السلوك العشوائي التي تنص على أنھ في نقطة زمنیة معینة یكون حجم واتجاه التغیر السعري التالي عشوائیا
منیة إذا كان جمیع المستثمرین لدیھم نفس المعلومة.في تلك النقطة الز
ثمرین آخرین ال وطالما أن ھناك فئة من المستثمرین تتفوق على غیرھا في الحصول على المعلومات وتحلیلھا وبالتالي تحقیق أرباح غیر عادیة على حساب مست ذه الحالة باعتبار أن فئة من المستثمرین یمكن لھم التنبؤ باألسعار في الفترة القریبة المستقبلیة.تتاح لھم ھذه المعلومات، فإن حركة األسعار ال تكون عشوائیة في مثل ھ
وعلیھ فإن ھاتھ الورقة البحثیة تأتي لإلجابة على اإلشكال التالي :
ساھم نظریة اإلشارة في رفع كفاءة أسوق رأس إلى أي مدى یمكن الحكم على كفاءة أسوق رأس المال من خالل الحركة العشوائیة لألسعار ؟ وكیف یمكن أن ت المال خاصة في شكلھا القوي؟
ولإلجابة على ھذا التساؤل قمنا بصیاغة الفرضیات التالیة:
عندما تكون أسواق رأس المال كفئة فإن المعلومات الواردة للمستثمرین تصل بسرعة وبشكل عشوائي. -
ل تكون األسعار غیر عشوائیة.في الشكل القوي من كفاءة أسواق رأس الما -
تساھم نظریة اإلشارة في رفع كفاءة أسوق رأس المال خاصة في شكلھا القوي. -
المحاور التالیة: أجل اإلحاطة قدر اإلمكان بمختلف جوانب البحث ارتأینا أن نتناول الموضوع من خالل ومن
كفاءة أسواق رأس المال. -
الحركة العشوائیة لألسعار.و لالعالقة بین كفاءة أسواق رأس الما -
نظریة اإلشارة كآلیة للمساھمة في رفع كفاءة أسواق رأس المال. -
المال رأس أسواق كفاءة 2
سعر فیتقرر وعشوائیة مستقلة وقت أي في السوق الى تأتي المعلومات أن حیث األسواق، بتلك المھتمین بین كبیرا حالفا المال رأس سوق كفاءة فكرة أثارت لقد
على أساسي بشكل تعتمد األسواق كفاءة أن حیث المال، رأس سوق ونضج لتطور المساندة الرئیسیة المقومات أھم أحد تعد التي الواردة المعلومات على بناءا المالیة لورقةا
المتاحة. ماتالمعلو تلك في المستثمرین یضعھا التي الثقة مقدار وعلى للمتعاملین، معلومات من األخیرة ھذه توفره ما مقدار
المال رأس أسوق كفاءة مفھوم 2.1
السوق الذي یعكس سعر السھم الذي تصدره منشأة ما كافة المعلومات "، على أنھ (Efficient market)الكفء رأس المال یعرف منیر إبراھیم ھندي سوق ل اإلعالم، أو تمثلت في السجل التاریخي لسعر السھم في األیام واألسابیع المتاحة عنھا، سواء تمثلت تلك المعلومات في القوائم المالیة أو في معلومات تبثھا وسائ
ؤثر على القیمة السوقیة للسھم، والسنوات الماضیة، أو في تحلیالت أو التقاریر عن أثار الحالة االقتصادیة العامة على أداء المنشأة، أو غیر ذلك من المعلومات التي تتعكس تماما قیمتھ الحقیقیة التي یتولد عنھا (fair value)دعاء بأنھ في ظل السوق الكفء تكون القیمة السوقیة للسھم ھي قیمة عادلة وإذا كان األمر كذلك فإنھ یمكن اال
تجة عن امتالكھ، یة الناعائد یكفي لتعویض المستثمر عما ینطوي علیھ االستثمار في ذلك السھم من مخاطر، أو بعبارة أخرى تكون القیمة الحالیة للمكاسب المستقبل [1]."والمخصومة بمعدل عائد على االستثمار یكفي لتعویض المستثمر عن المخاطر تساوي تماما القیمة السوقیة للسھم یوم شرائھ
………….[2] K= ∑
()∞
القیمة السوقیة للسھم وھي تعادل القیمة الحقیقیة. :K حیث:
T : .التوزیعات السنویة
N: سنوات.عدد ال
M: .معدل العائد المطلوب على االستثمار الذي یكفي للتعویض عن المخاطر التي ینطوي علیھا االستثمار في السھم
أنھ في ظل السوق الكفء یعكس سعر السھم في السوق توقعات المستثمرین بشأن المكاسب المستقبلیة، وبشأن المخاطر التي تتعرض لھا ھذه تشیر المعادلة في ذلك ھو اختالف لمكاسب، وعلى الرغم من أن المعلومات متاحة للجمیع فإنھم لن یصلوا الى نفس التقدیرات بشأن المكاسب والمخاطر التي تحیط بھا، والسبب ا
بھا المعامالت والناتجة عن التحلیل أسالیب التحلیل من مستثمر آلخر، إضافة الى تباین مستوى الخبرة والكفاءة بین المتعاملین، ومع ذلك فإن األسعار التي تتم وتوقعات المستثمرین تقترب من القیمة الحقیقیة للسھم.
السوق الذي یعكس سعر السھم فیھ توقعات المستثمرین بشأن المكاسب المستقبلیة وبشأن "ویعرف مثنى عبد اإللھ ناصر سوق رأس المال الكفء على أنھ وتجدر اإلشارة ھنا الى أن إتاحة المعلومات للجمیع ال یعني بأن تقدیراتھم بشأن المكاسب المستقبلیة والمخاطر المحیطة بھا المخاطر التي تتعرض لھا ھذه المكاسب،
متعین بالفطنة أو اآلخرین المتمتطابقة تماما، فقرارات المستثمرین قلیلي الخبرة قد تأخذ باألسعار بعیدا عن قیمتھا الحقیقیة، غیر أن قرارات المستثمرین المحترفین "دیراتھ سلیمة وال مبالغة فیھاستدفع باألسعار نحو القیمة الحقیقیة ولكن لیس ھذا ھو المھم بالنسبة لمفھوم كفاءة السوق، فالمھم ھو أن یكون كل مستثمر مقتنع بأن تق
[3].
راق المالیة للتغیرات في نتائج تحلیل البیانات والمعلومات المتدفقة إلیھ، وعلیھ یمكن القول أن سوق رأس المال الكفء ھو السوق الذي تستجیب فیھ أسعار األو مكاسب غیر عادیة على وتحدث ھذه االستجابة بسرعة تؤدي الى تساوي القیمة السوقیة للسھم مع قیمتھ الحقیقیة، بحیث ال تستطیع أي فئة من المستثمرین أن تحقق
تزید أسعارھا عن قیمتھا الحقیقیة. حساب فئة أخرى كنتیجة الكتشاف أسھم تقل أو

لألسعــار العشوائیــة والحركــة المـال رأس أسـواق كفـاءة
ISSN : 2351-8014 Vol. 7 No. 1, Aug. 2014 40
الكفء المال رأس سوق خصائص 2.2
[4]وفقا لمفھوم كفاءة سوق رأس المال یمكن استخالص مجموعة من الخصائص التي یتمیز بھا السوق الكفء:
:وق والخروج منھ في العملیات وھذا الشرط مرھون بتوافر عدد كبیر من البائعین والمشترین تتوفر لھم حریة الدخول الى السالمنافسة الكاملة السوقیة وذلك حتى تقل فرص نشوء االحتكار.
:ت أي یجب أن تتوفر الحمایة الالزمة ضد المخاطر التي یمكن أن یتعرض لھا المستثمر، وبالتالي یجب على إدارة السوق المالي متابعة الصفقا األمن ادعة لھا، مع وجود مؤسسات للتأمین ضد المخاطر.غیر األخالقیة أو الوھمیة ویكون لدیھا اإلجراءات الر
:ء وھو أن یكون ھدف المتعاملین تحقیق األرباح من خالل معالجة المعلومات واختیار البدیل االستثماري األفضل، حیث یتم االستعانة بالخبرا العقالنیة والمحللین والمكاتب االستشاریة في ھذا المجال.
:ى السوق المالي تزوید المتعاملین بالمعلومات الدقیقة في الوقت المناسب عن كافة الصفقات التي أبرمت من حیث عل دقة وسرعة وصول المعلومات الحجم والسعر، وأن یزودھم بالظروف السائدة في السوق بالنسبة ألسعار األوراق المالیة المتداولة، والتي تعكس مستوى الطلب والعرض لكل
األوراق المالیة. :توفر السوق المالیة خاصیة السیولة لألوراق المالیة المتداولة فیھا، وبتوفیر خاصیة السیولة تتحقق الفرص أمام المستثمر لبیع وشراء أن السیولة
األوراق المالیة بالكلفة المناسبة، وبالوقت المناسب وبالسرعة المناسبة. :ن فیھ فرصة متساویة للتعامل، وذلك من حیث الوقت، أو المعلومات المتاحة ویقصد بالعدالة ھو أن تتیح السوق لجمیع المتعاملی عدالة التسویق
والتحقق من سیادة القانون.
المال رأس سوق في الكفاءة أنواع 2.3
دیة.تتأثر كفاءة سوق رأس المال بسرعة وصول المعلومات الى المستثمرین وفي ھذا الصدد یمكن التمییز بین الكفاءة الكاملة والكفاءة االقتصا
یقصد بھا عدم وجود فاصل زمني بین تحلیل المعلومات الجدیدة الواردة الى السوق وبین الوصول الى : (Perfectly efficient market)الكفاءة الكاملة -أ . [5] لومات متاحة للجمیعنتائج محددة بشأن سعر السھم، وھو ما یضمن حدوث تغییر فوري في السعر عاكسا بذلك ما تحملھ المعلومات، على أن تكون تلك المع
وعلیھ تتحقق الكفاءة الكاملة في ظل توافر الشروط التالیة:
توفر معلومات كاملة لجمیع المتعاملین في السوق وبدون تكالیف إضافیة، وھذا یعني أن جمیع توقعات المستثمرین تكون متماثلة؛ -
؛[6] حیث یفسح المجال للمستثمر ببیع أو شراء أي كمیة من األسھم بسھولة ومھما صغر حجمھاعدم وجود قیود على التعامل باألوراق المالیة في السوق ب -
وجود عدد كبیر من المستثمرین في السوق بحیث ال توجد فرصة احتكار السوق أو تأثیر أي واحد منھم على حركة األسعار؛ -
.[7]نفعة الخاصة لكل واحد منھمیتمتع المستثمرین بالرشد االقتصادي وھدفھم السعي الى تعظیم الم -
ستحیلة وھذا راجع وعند مناقشة مدى واقعیة الشروط السابقة التي تؤدي لوجود الكفاءة الكاملة نرى أن الشروط الثالث األولى صعبة التحقیق بل تكاد تكون م الى:
ي ممكن ألن غالبیة المستثمرین یحصلون على المعلومات وتحلیالتھا من أن الشرط األول الذي یقضي بتوفر المعلومات للجمیع في نفس الوقت وبدون تكالیف غ - مصادر مختلفة ولھذه المصادر تكلفة في الغالب، وصدور المعلومات عن مصادرھا یحدث بتفاوت زمني قصیر؛
ا ألن غالب المعامالت تتعرض لمثل ھذه القیود؛أن الشرط الثاني والذي یقول بأنھ ال توجد على المعامالت أي قیود أو ضرائب أو تكالیف غیر موجود نھائی -
ود أیضا ألنھ أن الشرط الثالث والذي یقضي بأن التعامالت تتم عن طریق عدد كبیر من المستثمرین وأن تصرف أي منھم ال یؤثر على الجمھور فھذا غیر موج - بأحجام كبیرة وھذه التعامالت تؤثر على بعضھا البعض.في الواقع أغلب المعامالت في سوق رأس المال تتم لحساب مؤسسات مالیة كبیرة و
آلخرین للحصول یبقى شرط واحد قابل للتحقیق وھو الشرط األخیر الذي یقضي بأن المستثمر رشید یسعى الى تعظیم المنفعة والثروة وأنھ في سباق دائم مع ا لتالي ننتقل من الكفاءة الكاملة والتي تتطلب الشروط األربعة والتي من المستحیل تحققھا الى على المعلومات التي تساعده في بلوغ ھدفھ فھذا الشرط یمكن تحققھ، وبا
مفھوم الكفاءة االقتصادیة والتي یمكن أن تتحقق بتحقق الشرط األخیر.
بعض الوقت منذ وصول المعلومات في ظل الكفاءة االقتصادیة للسوق فإنھ یتوقع أن یمضي: (Economically efficient market)الكفاءة االقتصادیة -بالوقت على األقل، ولكن بسبب الى السوق حتى تظھر أثارھا على أسعار األسھم، وھذا یعني أن القیمة السوقیة للسھم قد تبقى أعلى أو أقل من قیمتھا الحقیقیة لفترة من
قیمتین كبیر الى درجة أن یحقق المستثمر من ورائھا أرباحا غیر عادیة على المدى تكلفة المعلومات والضرائب وغیرھا من تكالیف االستثمار لن یكون الفارق بین ال .[8]القصیر
المال رأس أسواق في الكفاءة متطلبات 2.4
[9]:حتى یكون سوق رأس المال على أعلى درجة ممكنة من الكفاءة یجب أن تتوفر فیھ خاصیتین أساسیتین ھما
صد بكفاءة التسعیر أو الكفاءة الخارجیة، سرعة وصول المعلومات الجدیدة الى جمیع المتعاملین في السوق وأن ال یق: (Price efficiency)كفاءة التسعیر -أ، فالجمیع لدیھم نفس الفرصة یتكبدوا في سبیلھا تكالیف باھضة، بما یجعل أسعار األسھم مرآة تعكس كافة المعلومات المتاحة، بذلك یصبح التعامل في السوق لعبة عادلة
تحقیق األرباح، إال أنھ یصعب على أحدھم تحقیق أرباح غیر عادلة على حساب األخرین.ل
یقصد بكفاءة التشغیل أو الكفاءة الداخلیة قدرة السوق على خلق توازن بین العرض والطلب، دون أن یتكبد :(Operational efficiency)كفاءة التشغیل -بأن یتاح للتجار والمتخصصین أي صناع السوق، فرصة لتحقیق ھامش ربح كبیر، وبذلك فإن كفاءة التسعیر تعتمد الى حد المتعاملین فیھ تكلفة عالیة للسمسرة ودون
كبیر على كفاءة التشغیل.

Rami HARID, Khayreddine BELAAZE, and Rabah KHOUNI
ISSN : 2351-8014 Vol. 7 No. 1, Aug. 2014 41
المال رأس سوق كفاءة في المالیة المعلومات دور 2.5
لمالیة، بل إن كفاءة أسواق رأس المال تعتمد بشكل أساسي على مقدار تعد المعلومات وأنظمة االفصاح المالي أحد أھم المحددات الرئیسیة لتطور ونضوج السوق ا ا.الثقة التي یضعھا المستثمر بالمعلومات المتاحة والمنشورة، وتلك التي تتدفق من قنوات متعددة عامة وخاصة من حیث مصداقیتھا وموضوعیتھ
والدالالت والمعارف والمضامین التي تتصل بالشيء أو الموضوع، وتساعد المھتمین المعلومة ھي جملة من البیاناتمفھوم المعلومة والمعلومة المالیة: -أ . [10] بالتعرف علیھ والعلم بھ، فالمعلومات إذا توضح مفھوم الشيء وتعطیھ قدره وتوضح سماتھ وخصائصھ وتبین استخداماتھ ووظائفھ
یعطي لھا معنى وقیمة للمستفید والمتمثل عادة في المتعاملون في السوق المالیة، حیث یقومون والمعلومة المالیة ھي عبارة عن بیانات ذات أثر مالي تنظم بشكل .[11]بتحلیل وتفسیر ھذه المعلومات من أجل تحدید مضامینھا ومن ثم استخدامھا في صیاغة قراراتھم المتعلقة باالستثمار في األوراق المالیة
ید من المصادر التي یمكن للمستثمر اللجوء إلیھا للحصول على المعلومات المالیة، ومن أبرز ھذه المصادر ھناك العدمصادر الحصول على المعلومات: -ب، (wsj) صحیفة وول ستریت، (nyt) من أبرز الصحف التي تھم المستثمرین ھي الصحف األمریكیة خاصة منھا صحیفة نیویورك تایمز الصحف: - [12]:نجد
.(id)وصحیفة یومیات المستثمر
ھناك العشرات من المجالت المتخصصة في مجال المال واألعمال التي تھم جمھور المستثمرین أھمھا: مجلة فورشن ومجلة المجالت المالیة المتخصصة: - بارون.
حدة األمریكیة نجد: یقصد بھا مطبوعات المؤسسات المتخصصة في مجال المال واألعمال ومن أشھرھا في الوالیات المت مطبوعات استشاري االستثمار: - ومودي لخدمات المستثمرین. (Corporation standard & poor)مؤسسة ستاندرد أند بور
لجنة من أبرز التقاریر المنشورة التي تھم المتعاملین في سوق رأس المال تلك التي توجھ الى حملة األسھم العادیة والتقاریر التي ترسل الى تقاریر المنشأت: - .(Securities and exchange commission)لیة والبورصة األوراق الما
عادة ما یوجد في بیوت السمسرة الكبیرة أقسام متخصصة للبحوث والدراسات، ویتیح قسم البحوث والدراسات للعمالء الحالیین مطبوعات بیوت السمسرة: - ة.والمحتملین معلومات مجانیة مفیدة عن أحول سوق رأس المال واألوراق المالی
تعتبر المطبوعات الحكومیة من أھم مصادر المعلومات عن األحول االقتصادیة بصفة عامة والجوانب المالیة لھا بصفة خاصة، وذلك المطبوعات الحكومیة: - االقتصادیة، وظروف أسواق إضافة الى كونھا مصدرا للمعلومات عن العدید من الصناعات، وتتضمن بیانات إحصائیة عن األسعار واألجور واإلنتاج، والدورات
سنوات المقبلة، وتقاریر ربع سنویة تتضمن قوائم الدخل 10صناعة في خالل 200رأس المال، كما تصدر الحكومة كدلك تقریر سنوي عن مستقبل ما یزید عن والمیزانیات العمومیة للمنشآت الصناعیة مصنفة على أساس نوع الصناعة وكذا على أساس حجم المنشأة.
توفر للمستثمرین بیانات تفصیلیة عن األوراق المالیة المتداولة وعن (Data Banks)یوجد في الوالیات المتحدة األمریكیة بنوك للبیانات نوك المعلومات:ب - زھیدة، وتتیح تلك الملفات التي یمكن شراءھا من مؤسسات متخصصة بتكلفة (Computer files)المنشآت التي أصدرتھا، وتعبأ تلك البیانات في ملفات الحاسوب
للمستثمر الذي یقتنیھا الحصول على أیة معلومة یبحث عنھا.
تتوقف كفاءة سوق رأس المال على مدى توافر المعلومات والبیانات للمستثمرین من حیث سرعة توافرھا أثر المعلومات على كفاءة سوق رأس المال: -ج .[13] منھا، وأیضا على قدرة المستثمرین على فھم وتفسیر وتحلیل ھذه المعلوماتوتكالیف الحصول علیھا وعدالة فرص االستفادة
وب على االستثمارات وعلیھ یمكن القول بأن المعلومات المتاحة (خاصة المعلومات المالیة) تساعد المتعاملین في سوق رأس المال على تحدید معدل العائد المطل .[14] ھا، ألن قرارات االستثمار في األوراق المالیة من القرارات االقتصادیة التي تتخذ على ضوء المعلومات المالیة المنشورةالمختلفة وفقا لدرجة الخطر المرتبطة ب
على لومات تبنى مما سبق یمكن القول أن الكفاءة في سوق رأس المال تتوقف على كفاءة نظام المعلومات المالیة، حیث أن نجاح سوق رأس المال یحتاج الى مع [15]:أساس مجموعة من العناصر تتمثل في
لومات المالئمة أھمیة االعالن المالي ودوره في ضبط حركة سوق رأس المال وھو ما یعرف ( بمعیار االفصاح العام)، الذي یؤدي الى توفیر قدر كاف من المع - تثمار المختلفة؛التي تتصف بالدقة والموضوعیة والتي یمكن استخدامھا في المفاضلة بین فرص االس
توفر المعلومات المالیة التي تعكس المركز المالي للمؤسسة المعنیة لحساب القیمة الحقیقیة لھا؛ -
مستثمرین.توفر نوعیات مختلفة من األوراق المالیة القابلة للتداول، بحیث یكون لكل منھا خصائصھ ودرجة الخطر المرتبطة بھ بما یلبي احتیاجات ال -
ق كره تتضح أھمیة المعلومات ومدى توفرھا في سوق رأس المال وعدم تكافؤ المستثمرین في الحصول علیھا من شأنھ أن یؤثر على سیر أداء السومما سبق ذ ات، أي امتالك بعض علومالمالي الفعال، وفي حالة عدم تكافؤ فرص الحصول على المعلومات بین المتعاملین في سوق رأس المال فإن ھذه الحالة تسمى بعدم تماثل الم
المتعاملین لمعلومات ال یمتلكھا اآلخرون.
المال رأس سوق لكفاءة المختلفة الصیغ 2.6
ق الى المستویات الما أن كفاءة سوق رأس المال ترتبط أساسا بالمعلومات فإن نوعیة الكفاءة تتحدد حسب المعلومات المتاحة فیھا، ویمكن تصنیف كفاءة السوظ [16]التالیة:
یقتضي ھذا الفرض أن تكون المعلومات التاریخیة حول األسعار : (The weak form efficient market)غة الضعیفة لكفاءة سوق رأس المال الصی -أ منعكسة في األسعار الحالیة، وبالتالي ال یمكن االستفادة منھا للتنبؤ بالتغیرات المستقبلیة في األسعار.
یقتضي ھذا الفرض أن تعكس األسعار الحالیة إضافة : (The semi-strong form efficient market)المال الصیغة المتوسطة لكفاءة سوق رأس -ب رات في أنظمة المحاسبة.الى المعلومات التاریخیة حول األسعار كل المعلومات المعروفة والمتاحة حول الشركات مثل األرباح، وتوزیعات األرباح، المنتجات والتغی

لألسعــار العشوائیــة والحركــة المـال رأس أسـواق كفـاءة
ISSN : 2351-8014 Vol. 7 No. 1, Aug. 2014 42
یقتضي ھذا الفرض أن تعكس األسعار الحالیة بصفة كاملة كل : (The strong form efficient market)یة لكفاءة سوق رأس المال الصیغة القو -ج قیق أرباح غیر عادیة بصفة نظامیةالمعلومات العامة والخاصة، بحیث ال یمكن ألي مجموعة من المستثمرین استخدام معلومات غیر متاحة لغیرھم لتح
: المستویات الثالثة للمعلومات التي تعكس أسعار األسھم1 الشكل رقم
مستوي الصیغة الضعیفة لكفاءة سوق رأس المال : یفترض أن تكون المعلومات
التاریخیة حول األسعار منعكسة في األسعار الحالیة.
مستوى الصیغة المتوسطة لكفاءة سوق رأس المال : یفترض أن تعكس األسعار
ضافة الى المعلومات التاریخیة كل المعلومات المتاحة والمعروفة حول الشركات.الحالیة إ
مستوى الصیغة القویة لكفاءة سوق رأس المال : یفترض أن تعكس األسعار
الحالیة بصفة كاملة كل المعلومات العامة والخاصة.
المصدر: من إعداد الباحثان باالعتماد على التحلیل السابق
لألسعار العشوائیة والحركة المال رأس أسواق كفاءة بین العالقة 3
ة بین المفھومین تعتبر ظاھرة الحركة العشوائیة لألسعار األساس الذي یمكن من خاللھ الحكم على كفاءة سوق رأس المال، لكن قبل أن نكشف عن أبعاد العالق سوف نعرض لسرد تاریخي مختصر الكتشاف تلك الظاھرة.
(RANDOM WALK) لألسعار ئیةالعشوا الحركة ظاھرة 3.1
في لألسعار المتتالیة للتغیرات متابعتھ أسفرت فلقد ،LOUIS BACHELIER یدعى فرنسي باحث الى 1900 عام في لألسعار العشوائیة الحركة ظاھرة اكتشاف یرجع
لعبة ھي السوق تلك في المضاربة بأن بالقول ذلك على علق وقد سعاراأل تلك لحركة محدد نمط وجود عدم على یؤكد بما بینھا، ترابط أي وجود تفتقد أنھا عن السلع سوق
.[17]غیره حساب على األرباح تحقیق یضمن أن المشتري أو للبائع یمكن ال حیث ،(FAIR GAME) عادلة
ففي 1905االحصاء، نشرت في عام عن الحركة العشوائیة في مجال Karl Pearsonمع نتائج دراسة كارل بیرسون Bachelierوقد تطابقت نتائج مالحظة قعة التي تركتھ فیھا، تلك الدراسة وصف بیرسون الحركة العشوائیة بالشخص المخمور اذا تركتھ في مكان ما ثم رغبت في العثور علیھ، فعلیك أن تذھب إلیھ في الب
لمستقبل، ذلك أن المخمور عادة ما یسیر على غیر ھدى مرة ھنا ومرة ھناك، فھو فتلك البقعة ھي التقدیر الغیر متحیز للمكان الذي یمكن أن تجده فیھ في أي لحظة في ا .[18] یدور حول نفسھ في حركة عشوائیة
ر األوراق وعند تطبیق نتائج الدراسة التي توصل إلیھا بیرسون بخصوص الحركة العشوائیة لألسعار في مجال اإلحصاء على سوق رأس المال، نجد أن أسعا باح على تتبع حركة عشوائیة باعتبار أن جمیع المعلومات المتحصل علیھا معكوسة في سعر الورقة المالیة وبالتالي ال یمكن ألي مستثمر أن یحقق أر المالیة سوف
كون معكوسة في أسعار حساب اآلخرین، وأي معلومة تصل السوق تعدل توقعات المستثمرین فیتغیر السعر، كما أن توقعات المستثمرین بشأن نتائج بعض المؤسسات ت أوراقھا المالیة المصدرة.
في سعر وعلیھ فإن التغیرات في األسعار تكون مستقلة عن بعضھا البعض، وتبقى مرتبطة بالمعلومات التي تصل الى السوق في شكل عشوائي والتي تعكس الورقة المالیة، ومنھ یمكن القول أن السوق یتبع حركة عشوائیة إذا كان:
− = …………….[19]
:حیث: .سعر الورقة المالیة في الزمن
)سعر الورقة المالیة في الزمن : + 1).
: ة ورود معلومات حقیقیة (تمس فعال وھي ناتجة عن التغیر في السعر والعوائد المرتبطة بھ نتیج (Bruit blanc) عبارة عن ضوضاء بیضاء سعر الورقة المالیة وعوائدھا) الى سوق رأس المال.
أسبوع، والتي تظھر أن ھناك حركة عشوائیة في قیمة المؤشر طیلة ھذه الفترة. 52وفیما یلي خریطة فعلیة لقیمة مؤشر دو جونز لمتوسط الصناعة في

Rami HARID, Khayreddine BELAAZE, and Rabah KHOUNI
ISSN : 2351-8014 Vol. 7 No. 1, Aug. 2014 43
أسبوع 52جونز لمتوسط الصناعة في خریطة فعلیة لقیمة مؤشر دو : 2الشكل رقم
.516، ص 2007المصدر: منیر إبراھیم ھندي، األوراق المالیة وأسواق المال، منشأة المعارف، االسكندریة، مصر،
المال رأس سوق لكفاءة المختلفة واألشكال لألسعار العشوائیة الحركة 3.2
لألسعار، سوف ننتقل اآلن لدراسة العالقة بینھا وبین المستویات الثالثة لكفاءة سوق رأس المال. بعد أن قمنا بإعطاء نظرة شاملة عن ظاھرة الحركة العشوائیة
كما سبق وأن أشرنا الى أن فرضیة الصیغة الضعیفة لكفاءة سوق رأس المال تقضي بأن الحركة العشوائیة لألسعار والشكل الضعیف لكفاءة سوق رأس المال: -أار األسھم في السوق ھي معلومات تاریخیة بشأن ما طرأ من تغیرات على سعر السھم وعلى حجم التعامالت التي جرت فیھ في المعلومات التي تعكسھا أسع
و الشھور أو . وھو ما یعني أن أي محاولة للتنبؤ بما سیكون علیھ سعر السھم في المستقبل، من خالل دراسة التغیرات التي طرأت على سعره في األیام أ[20]الماضيقییم األسھم یقوم على السنوات الماضیة ھي مسألة عدیمة الجدوى فھذه الصیغة ترفض رفضا تاما البناء النظري الذي یقوم علیھ التحلیل الفني (وھو أحد أسالیب ت
أساس التوقع بمستقبل حركة األسعار بناءا على المعطیات التاریخیة لھا عن طریق استنتاج نمط أو اتجاه لھذه الحركة).
ألن التغیرات التي تطرأ على سعر السھم في (Random walk theory)ویعرف الشكل الضعیف لكفاءة سوق رأس المال بنظریة الحركة العشوائیة لألسعار ة المتتالیة مستقلة عن بعضھا المستقبل ال بد وأن تكون مستقلة تمام االستقالل عن التغیرات التي طرأت على سعره في الماضي، أو بعبارة أخرى أن التغیرات السعری
.[21] البعض وال یوجد بینھا أي ترابط، أو ما یمكن أن یعبر عنھ بالحركة العشوائیة لألسعار
ویخضع ھذا الفرض لكفاءة سوق رأس المال لثالث اختبارات ھي:
ھذه تكون أن على معینة زمنیة فترة خالل معین سھم سعر في التغیر بین االرتباط معامل قیاس یتم حیث : (SERIAL CORRELATIONS) االرتباطات سلسلة -
الرئیسي السبب أن غیر األسعار، التجاه معین نمط وجود احتمال الستبعاد الطویل المدى استبعاد ویتم للسوق العشوائیة الحركة نظریة إلثبات وذلك قصیرة، الفترة
للمالحظات نتیجة البورصات في الماضیة المعلومات على بناءا المستقبلیة باألسعار التنبؤ المستثمرین فیھا یحاول التي المدة مع ذلك تناسب ھو القصیر المدى لالعتماد
في المسعرة األسھم لمؤشر المتتالیة التغیرات أن أظھرت والتي )،KENDALL )1953 بھا قام التي أبرزھا دراسات عدة توجد الصدد ھذا وفي بھا، یقومونا التي التجریبیة
الذاتي االرتباط اختبارات الى إضافة األمریكي السوق في النتیجة ھذه التجارب من مجموعة أكدت وقد تماما، مستقلة كانت )1938- 1928( الفترة خالل لندن بورصة
المعامل ھذا بأن العلم مع جدا ضعیفة لألسعار المتعاقبة التغیرات بین الذاتي االرتباط معامالت أن الى كلھا خلصت حیث )،COOTNER )1964 بھا قام التي االحصائیة
(T) متتالیتین فترتین خالل مالیة ورقة سعر لتغیرات الممثل 3 الشكل خالل من ذلك توضیح كنویم ، [22]عشوائیة المتتالیة التغیرات كانت إذا للصفر مساویا یكون
(T+1). و

لألسعــار العشوائیــة والحركــة المـال رأس أسـواق كفـاءة
ISSN : 2351-8014 Vol. 7 No. 1, Aug. 2014 44
المالیة. الورقة لسعر المتتالیة التغیرات انتشار : 3 رقم الشكل
.38بلجبلیة سمیة، مرجع سبق ذكره، ص المصدر:
وتجدر االشارة یظھر ارتباط قوي موجب ب - 3رقة المالیة في حین أن الشكل رقمال یظھر أي ارتباط في تغیرات سعر الو أ -3رقم مما سبق نالحظ أن الشكل لم تظھر أي ارتباط، 1962 الى 1957في مؤشر داو جونز في الفترة الممتدة من ، حول التغیرات الیومیة لألسعار)Fama )1965الى أن الدراسات التي قام بھا
. [23]وحتى عند تغیر الفترة الى أسبوعیة أو نصف شھریة كان معامل االرتباط ضعیف جدا
عتمد على المعلومات التاریخیة لألسعار وتسمى أیضا باختبارات التحلیل الفني، حیث من المعروف أن المحلل الفني ی: (Filtering rules)قواعد التصفیة - واعد التصفیة یقترحون قواعد بھدف إیجاد اتجاه للحركة المستقبلیة لھا، غیر أن ھذا یعترض مع االعتقاد بالحركة العشوائیة لألسعار، ومع ذلك فاللذین یعتمدون على ق
بعد خصم تكلفة –لھا للمستثمر أن یحدد توقیت أوامر الشراء والبیع بالشكل الذي یحقق لھ المتاجرة أو التعامل بناءا على الحركة التاریخیة لألسعار، ویمكن من خال [24]:عائدا متمیزا عن أقرانھ الذین ال یتبعون ھذه القاعدة، وفي ھذا الصدد توجد أربعة مجموعات من قواعد التصفیة التي اقترحھا الفنیین ھي –المعامالت
في السعر بنسبة معینة (یتم حسابھا) یعد مؤشرا یعتمد علیھ في قرار الشراء، وأن انخفاضا في السعر بنسبة معینة یعد مؤشرا مجموعة تقوم على أن ارتفاعا - والشكل التالي یوضح ذلك: سلیما لقرار البیع،
: توقیت الدورات4الشكل رقم
39 ص ذكره، سبق مرجع سمیة، بلجبلیة المصدر:
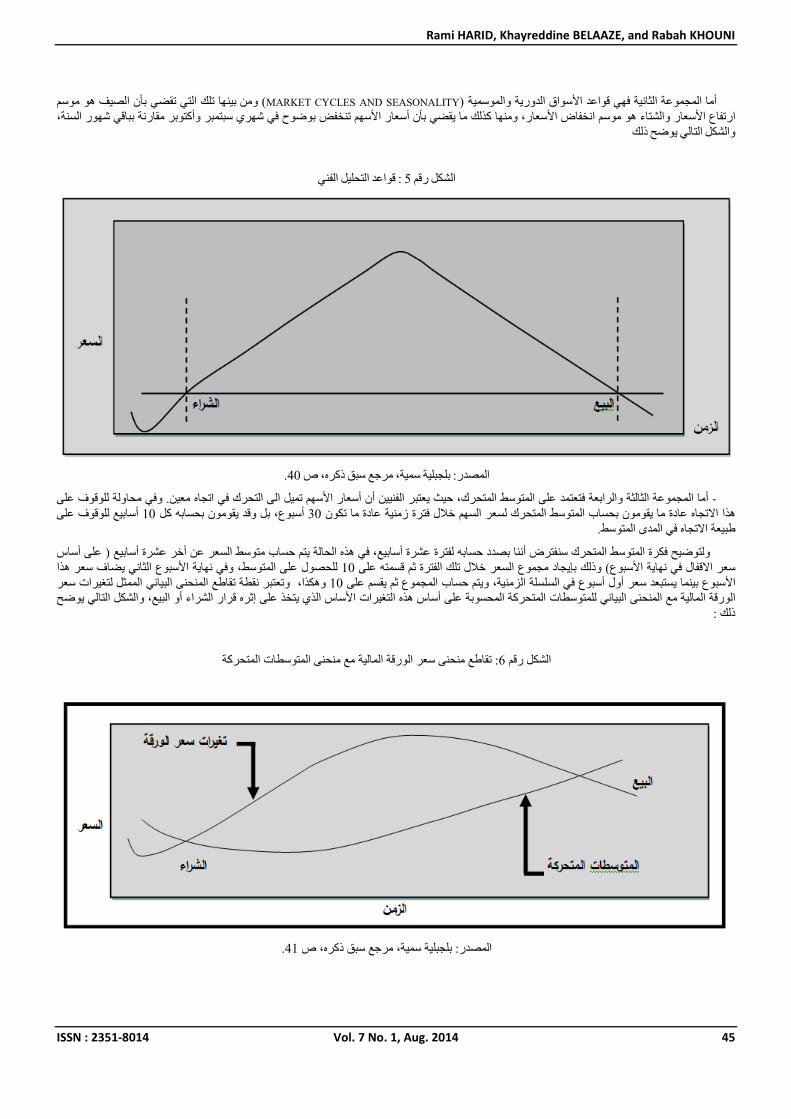
Rami HARID, Khayreddine BELAAZE, and Rabah KHOUNI
ISSN : 2351-8014 Vol. 7 No. 1, Aug. 2014 45
موسم ھو الصیف بأن تقضي التي تلك بینھا ومن (MARKET CYCLES AND SEASONALITY) والموسمیة الدوریة األسواق اعدقو فھي الثانیة المجموعة أما
السنة، شھور بباقي مقارنة وأكتوبر سبتمبر شھري في بوضوح تنخفض األسھم أسعار بأن یقضي ما كذلك ومنھا األسعار، انخفاض موسم ھو والشتاء األسعار ارتفاع
ذلك یوضح تاليال والشكل
الفني التحلیل قواعد : 5 رقم الشكل
.40 ص ذكره، سبق مرجع سمیة، بلجبلیة المصدر:
ي محاولة للوقوف على أما المجموعة الثالثة والرابعة فتعتمد على المتوسط المتحرك، حیث یعتبر الفنیین أن أسعار األسھم تمیل الى التحرك في اتجاه معین. وف - أسابیع للوقوف على 10أسبوع، بل وقد یقومون بحسابھ كل 30دة ما یقومون بحساب المتوسط المتحرك لسعر السھم خالل فترة زمنیة عادة ما تكون ھذا االتجاه عا
طبیعة االتجاه في المدى المتوسط.
ب متوسط السعر عن أخر عشرة أسابیع ( على أساس ولتوضیح فكرة المتوسط المتحرك سنفترض أننا بصدد حسابھ لفترة عشرة أسابیع، في ھذه الحالة یتم حسا للحصول على المتوسط، وفي نھایة األسبوع الثاني یضاف سعر ھذا 10سعر االقفال في نھایة األسبوع) وذلك بإیجاد مجموع السعر خالل تلك الفترة ثم قسمتھ على
وتعتبر نقطة تقاطع المنحنى البیاني الممثل لتغیرات سعر ،وھكذا 10جموع ثم یقسم على األسبوع بینما یستبعد سعر أول أسبوع في السلسلة الزمنیة، ویتم حساب المالبیع، والشكل التالي یوضح الورقة المالیة مع المنحنى البیاني للمتوسطات المتحركة المحسوبة على أساس ھذه التغیرات األساس الذي یتخذ على إثره قرار الشراء أو
ذلك :
ع منحنى سعر الورقة المالیة مع منحنى المتوسطات المتحركة: تقاط6الشكل رقم
.41المصدر: بلجبلیة سمیة، مرجع سبق ذكره، ص

لألسعــار العشوائیــة والحركــة المـال رأس أسـواق كفـاءة
ISSN : 2351-8014 Vol. 7 No. 1, Aug. 2014 46
لممثل للمتوسطات من الشكل نالحظ أن نقطة الشراء یتم تحدیدھا بتقاطع المنحنى البیاني الممثل لتغیرات الورقة المالیة المتجھ نحو الصعود مع المنحنى ا ثل لتغیرات سعر التالي فھي نقطة الشراء واألسعار بعد ھذه النقطة ستتجھ الى االرتفاع، أما نقطة البیع فیمكن تحدیدھا حین یتجھ المنحنى البیاني الممالمتحركة وب
الورقة المالیة الى االنخفاض ثم یلتقي مع المنحنى البیاني للمتوسطات المتحركة.
ھذا المدخل بأن التغیرات السعریة قد تكون عشوائیة معظم الوقت، إال أنھا قد تأخذ من أن الى أخر نمطا معینا یمكن یعترف أنصار اختیار األنماط الطارئة: - اه ي حدث فیھا التغیر في اتجاقتفاء أثره، وللتأكد من مدى إمكانیة حدوث ذلك یمكن استخدام اختبارات التغیر في اتجاه األسعار التي تھدف الى معرفة عدد المرات الت
.[25] األسعار، وطول الفترة في كل مرة
بعد مراجعة شاملة لدراسات سابقة الختبار صیغة الفرض الضعیف، فلقد أشار الى أن )،Fama )1970ھذا وقد یكون من المناسب االشارة الى ما خلص إلیھ بناء علیھ ال یمكن للمضاربین أن یحققوا أرباحا غیر عادیة، من جراء قیامھم التغیرات السعریة في المستقبل ال ترتبط بالتغیرات السعریة في الماضي أو الحاضر، و
.[26] بتحلیل الحركة التاریخیة لألسعار، ھذا یعني بالقطع تأیید لصیغة الفرض الضعیف
المتوسطة لكفاءة سوق رأس المال تقضي لقد سبق وأن أشرنا الى أن فرضیة الصیغة الحركة العشوائیة لألسعار والشكل المتوسط لكفاءة سوق رأس المال: -بعامة ) أو التنبؤات التي تقوم بأن أسعار األسھم ال تعكس فقط التغیرات السابقة في أسعار تلك األسھم، بل تعكس كذلك كافة المعلومات المتاحة للجمھور ( المعلومات ال
في الدولة أو ظروف الشركة (التقاریر المالیة وغیرھا من التقاریر والتحلیالت التي تتاح على تلك المعلومات، سواء كانت عن الشؤون الدولیة أو الظروف االقتصادیة للجمھور).
سوق رأس وتعتبر سرعة انعكاس المعلومات على األسعار ھي أساس معرفة مدى كفاءة سوق رأس المال عند ھذا الشكل، فإذا كان تعدل األسعار فوري فإن المتوسط. المال كامل الكفاءة في شكلھ
رصة ألي مستثمر وقد اختلفت الدراسات في اختبارھا صیغة الفرض المتوسط حیث أثبت بعضھا سرعة استجابة أسعار األسھم للمعلومات المالیة بما ال یتیح الف عطي فرصة لتحلیل المعلومات كشفت دراسات أخرى أن ھناك فاصل زمني ی في حین، (Pearce & roley 1988) ألن یحقق عائد متمیز على حساب اآلخرین
[27]الواردة للسوق وتحقیق أرباح غیر عادیة
ار ستكون لكن یبقى أنھ كلما زادت سرعة إنعكاس المعلومات على أسعار األوراق المالیة كلما زادة درجة كفاءة سوق رأس المال ( أي أن حركة األسع عشوائیة) عند ھذا الشكل والعكس صحیح.
كما سبق وأن أشرنا الى أن فرضیة الصیغة القویة لكفاءة سوق رأس المال تقضي بأن ئیة لألسعار والشكل القوي لكفاءة سوق رأس المال: الحركة العشوا -ج (Public information)المعلومات التي یعكسھا سعر السھم في السوق ھي جمیع المعلومات المتاحة للعامة والخاصة، أي المعلومات المنشورة والمتاحة للجمھور
. [28] (Insiders)إضافة الى تلك المعلومات التي قد تكون متاحة لفئة معینة منھ مثل ادارة الشركة المصدرة للسھم وكبار المتعاملین فیھا
ا وسائلھا الخاصة في ولقد اختبرت صیغة الفرض القوي بطریقة غیر مباشرة، من خالل قیاس العائد الذي تحققھ فئات معینة من المستثمرین، یفترض أن لھ ة، إضافة الى الحصول على معلومات ال تتاح للجمھور بذات السرعة وھم المؤسسات المالیة المتخصصة في االستثمار، والمتخصصین في تحلیل األوراق المالی
[29]:أظھرت ھذه االختبارات ما یلي المدیرین وكبار العاملین الذین یستثمرون جزء من مواردھم المالیة في أسھم الشركة التي یعملون فیھا، وقد
عن عدم وجود دلیل یؤكد قدرة تلك المؤسسات على تحقیق عائد ، )Cumby & Glen )1990 بالنسبة للمؤسسات المتخصصة في االستثمار كشفت دراسة - رة تلك المؤسسات حتى على التنبؤ باتجاه أسعار ، قد أوضحت عدم قد)Viet & Cheney )1982یفوق ذلك الذي یمكن أن یحققھ مستثمر بسیط، في حین أن دراسة
األسھم في المستقبل، وھو ما یحمل في طیاتھ عدم توفر میزة خاصة لتلك المؤسسات یمكن من خاللھا تحقیق أرباح غیر عادیة.
حقیق السبق في امتالك معلومات ذات قیمة قبل غیرھا، أما بالنسبة للمؤسسات المتخصصة في التحلیل والتي یعتقد أنھ من خالل اتصاالتھا وقدرتھا الفنیة یمكنھا ت - ، بل وأن قدرتھم على تقدیر القیمة الحقیقیة للسھم ال تتسم )Dimson & March )1984فإن الدراسات قد كشفت أیضا عن عدم قدرتھا على تحقیق أرباح غیر عادیة
بالدقة في كثیر من األحیان.
بالعائد الذي یحققھ كبار العاملین من وراء االتجار في األوراق المالیة التي تصدرھا الشركة التي یعملون فیھا، فتكاد تجمع وأخیرا فإنھ بالنسبة للدراسات الخاصة - .(E.G.Seyun 1988, Rozeff & Zaman 1988, Born 1988)على أن ھؤالء العاملین یحققوا بالفعل أرباحا غیر عادیة
أعلى درجات كفاءة أسوق رأس المال، ویمكن أن نؤكد أنھ غیر محقق في الواقع العملي، طالما أن ھناك فئة من وعلیھ یمكن القول أن الشكل القوي ھو ه المعلومات، وبالتالي المستثمرین تتفوق على غیرھا في الحصول على المعلومات وتحلیلھا ومنھ تحقیق أرباح غیر عادیة على حساب مستثمرین آخرین ال تتاح لھم ھذ
ترة القریبة األسعار في ھذا الشكل من كفاءة أسواق المال ستكون غیر عشوائیة باعتبار أن ھناك فئة من المستثمرین یمكن لھم التنبؤ باألسعار في الففإن حركة المستقبلیة.
المال رأس أسواق كفاءة رفع في للمساھمة كآلیة اإلشارة نظریة 4
فئة من المستثمرین یمكن لھم التنبؤ باألسعار من كفاءة سوق رأس المال تكون غیر عشوائیة بسبب وجود سبق وأن أشرنا الى أن حركة األسعار في الشكل القوي لكي تساھم ولو نسبیا في معالجة ھذه الفجوة لعدم كفاءة سوق رأس المال. في الفترة القریبة المستقبلیة، وعلى ھذا األساس جاءت نظریة االشارة
:(SIGNAL THEORY) االشارة نظریة مفھوم 4.1
INFORMATION) المعلومات تماثل عدم مشكل لتخفیض أساسا جاءت وقد ،ROSS )1977( [30] الكاتب الى النظریة ھذه ظھور في الفضل یعود
ASYMMETRY) ل الشھیر بالمثال نستعین سوف ذلك ولتوضیح والمستثمرین، المسیرین بین GEORGE AKERLOF، األساسیة مقالتھ خالل من (L’ARTICLE
FONDATEUR 1970)، المستعملة السیارات سوق حول )LE MARCHE DE LEMONS(، سیبیع لماذا المطروح السؤال یكون سیارتھ بیع ما شخص قرر إذا حیث
إقناع على البائع سیعمل يوبالتال أموال...إلخ، الى بحاجة السیارة صاحب جید، بشكل تعمل تعد لم السیارة أن بینھا من إجابات عدة لدینا وستكون ؟ سیارتھ الشخص ھذا
.[31]للمشتري إشارة بإرسال یقوم أي لسیارتھ، بیعھ سبب عن المشتري

Rami HARID, Khayreddine BELAAZE, and Rabah KHOUNI
ISSN : 2351-8014 Vol. 7 No. 1, Aug. 2014 47
ءت لكي تعالج وبإسقاطنا لھذا المثال على سوق رأس المال وذلك بافتراض المسیر ھو البائع والمستثمر ھو المشتري، سوف نفھم جیدا أن نظریة االشارة جا / ن كل األطراف المھتمة بالمؤسسة (المسیرین، المساھمین والمقرضین)، أي بعبارة أخرى أن المعلومات لیست مقسمة بشكل متماثلمشكل عدم تماثل المعلومات بی
متناظر، ذلك أن المسیرین یحوزون على معلومات تفوق تلك التي بحوزة باقي األطراف.
المعلومات: تماثل وعدم االشارة نظریة 4.2
األداء، من أقل مستوى ذات أخرى مؤسسات عن تمیزھا وفعالة، خاصة إشارات إصدار أداء األحسن المؤسسات في المدیرین بإمكان أنھ من اإلشارة نظریة تنطلق
[32]:ھما فكرتین إلى اإلشارة نظریة تستند إذن، ضعیفة. مؤسسات طرف من تقلیدھا الصعب من سیكون أنھ اإلشارات ھذه وخاصیة
المستثمرین؛ متوفرة لدى تكون ال معلومات یئةتھ ما مؤسسة في المدیرین بإمكان أنھ حیث :االتجاھات جمیع في موزعة غیر المعلومة، نفس - أ
.والطریقة األسلوب وال تفھم بنفس تدرك ال سوف فإنھا الجمیع، لدى ومتوفرة منشورة المعلومات تلك كانت إذا وحتى - ب
ین ال تتوقف في حد أنھا قرارات صحیحة فقط بل ال بد أن یعمل ھؤالء المسیرین على إقناع السوق بأنھا وبالتالي فإن القرارات المالیة التي یتخذھا المسیر ة لسیاسة االتصال المالیة، قرارات جیدة وفي فائدة المؤسسة ومن ثم في فائدة المستثمرین، كما تعتبر االشارة المرسلة من طرف المسیرین للمستثمرین الوحدة األساسی
في ساذجا أیكون من أبعد بطبیعتھ المستثمر فأن ، ولذا[33] االشارات لیست بسر أو بتصریح یتحمل نتائجھ المتدخلون األوائل في سوق رأس المالحیث أن ھذه [34]أنھ: إلى اإلشارة من البد وعلیھ، الشك من معینة بدرجة إشارة كل یستقبل فھو إشارة، أو معلومة ألي تصدیقھ
؛ اإلشارة جھة إلیھا تھدف التي الفائدة عن أوال المستثمر یتساءل -
؛ االتصال في وسیاستھ للمؤسسة المدیر الفریق صورة فھم یحاول -
.صحیحة غیر معلومات نشر حالة في البورصیة السلطات وحكم مراقبة یراعي -
اإلشارة نظریة أدوات أھم 4.3
لمعاني حاملة إشارات وھي ،[35] األرباح توزیع سیاسة عن أو المال، رأس لتكلفة وصفا أو صورة تكون أن یمكن إذ عدیدة، بأشكال المستعملة اإلشارة تكون
األعوان. لمختلف القرارات واتخاذ توجیھ في تفید ومعلومات
لي تكون لدینا إشارة مرسلة أن أي تغییر في السیاسة المالیة یؤدي الى تغییر نظرة المستثمرین للمؤسسة وبالتا Ross یعتبرھیكل رأس المال كأداة لإلشارة : -أ ، ویمكن التطرق لھیكل رأس المال كأداة لإلشارة من خالل العوامل الثالثة التي تؤثر فیھ:[36]لسوق رأس المال
ة المؤسسة على باعتبارھا مؤشر على قدر إن لجوء المؤسسة الى االستدانة سوف یرسل إشارة إیجابیة لمختلف المستثمرین،نظریة اإلشارة وسیاسة االستدانة: -وفي حالة ما إذا كانت ھذه اإلشارة خاطئة أي أن المؤسسة لیست لدیھا القدرة على تسدید دیونھا فإنھا ستتعرض لعقوبات ،[37]تحمل أعباء ثابتة ذات طبیعة خطرة
. [38] مالیة من طرف سلطات البورصة
المعلومات فإن الزیادة في رأس المال یعد مؤشرا مالیا على أن القیمة السوقیة لتلك األسھم إذا نظرنا من وجھة عدم تماثلنظریة اإلشارة وزیادة رأس المال: -ستقبلة من طرف المستثمرین. مغال فیھا، وفي ظل ھذا االعتقاد فإن المستثمرین لن یقدموا على شراء تلك األسھم إال بسعر أقل مما ھي علیھ بسبب اإلشارة السلبیة الم
أن مستقبل الشركة غیر مبشر، ھنا یتوقع أن تسعى إلصدار أسھم عادیة لجلب -دون أن یدرك المتعاملین في السوق –یحدث لو أن اإلدارة تدرك نفس الشيء، یمكن أن تبط في أذھان ة یرالمزید من المستمرین لیتحملوا جزء من اآلثار السیئة المحتملة، مما یخفف العبء على المالك الحالیین، وھكذا یبدو أن إصدار أسھم جدید
. [39]المستثمرین المحتملین بأنھ فأل غیر حسن بسبب اإلشارة السلبیة التي استقبلوھا
مبدئیا وفي ظل عدم تماثل جیدة ؟ بنتائج یبشر مستقبلھا بأن ثقة المال المؤسسة إذا كانوا على رأس زیادة للمسیرین من یمكن ولكن السؤال الذي یطرح ھنا كیف حیث سیظل المستثمرون یفسرون قرار اإلصدار على أنھ نتیجة لكون القیمة غیر سارة، (Signals)دار أسھم جدیدة سوف یحمل في طیاتھ إشارات المعلومات فإن إص
شراء السھم بالسعر بلوا السوقیة للسھم مغال فیھا، وأن اإلدارة تسعى الستغالل المستثمرین المحتملین لصالح المستثمرین القدامى، وعلى ضوء ھذا التفسیر فلن یقوقت إرسال إشارات المعروض رغم أنھ سعر عادل، ولتصحیح ھذا الوضع فإنھ من األفضل للمسیرین اللجوء الى االقتراض لتمویل االستثمارات الجدیدة وفي نفس ال
سارة لسوق رأس المال.
لومات داخلیة تدل على أن قیمة التدفقات المستقبلیة في ظل مخاطرة معینة كما أن بیع المسیرین لمساھمتھم في المؤسسة ھو إشارة سلبیة بسبب توفرھم على مع ما یعد إشارة جد إیجابیة ستكون أقل مما ھو متوقع، والعكس في حالة ما إذا قام المسیرین بزیادة مساھمتھم وخاصة إذا ما تم ذلك عن طریق االستدانة الخاصة، وھو
.[40] بالنسبة لسوق رأس المال
[41]إن عملیة إعادة شراء األسھم تتضمن تفاسیر متعددة نذكر منھا:إلشارة وتخفیض رأس المال ( إعادة شراء األسھم): نظریة ا -
أكبر؛ غیاب فرص االستثمار بنسبة المردودیة المطلوبة، فالمسیرین یقومون بإرجاع األموال للمساھمین الستثمارھا في مشاریع تعود علیھم بفائدة -
ر الجید بحیث یعتبر المسیرین أن سعر السھم مقیم بأقل من قیمتھ الحقیقیة؛إشارة الخب -
األموال الخاصة، وعلیھ فإن تخفیض رأس المال ال یؤدي الى زیادة قیمة السھم ولكن یسمح بتجنب استثمار األموال في مشاریع تكون مردودیتھا أقل من تكلفة اء أسھمھا بسعر أقل من القیمة المتوقعة، وبالتالي فإن تخفیض رأس المال یعتبر بمثابة مؤشر إیجابي على أن وأن ھذا ال یتحقق إال إذا نجحت المؤسسة في شر
المؤسسة تعمل لفائدة ولصالح المساھمین.
المؤسسات ذات المردودیة تعتبر سیاسة توزیع األرباح وسیلة من وسائل االتصال بین المؤسسة وسوق رأس المال، فسیاسة توزیع األرباح كأداة لإلشارة: -بسائل نجد سیاسة توزیع العالیة تبحث عن كل الوسائل والسیاسات التي تحسن من صورتھا مقارنة بتلك المؤسسات التي تفتقد الى تلك الوسائل، ومن بین أھم ھذه الو
كس صحیح، وإذا حدث انخفاض في نسبة األرباح الموزعة فعلى األرباح، حیث كلما زادت نسبة األرباح الموزعة فھو إشارة على مردودیة المؤسسة المرتفعة والع

لألسعــار العشوائیــة والحركــة المـال رأس أسـواق كفـاءة
ISSN : 2351-8014 Vol. 7 No. 1, Aug. 2014 48
ح تشكل عامل معلوماتي ممیز المسیرین أن یقوموا بإقناع المستثمرین بأنھا مرحلة عابرة ألسباب ما وأنھا ستزول في األجل القریب، وبالتالي فإن سیاسة توزیع األربا تظھر بھا المؤسسة تعبر عن الحقیقة. یستعملھ المسیرین إلقناع المستثمرین بأن الصورة التي
خالصة 5
تقتضي فرضا منطقیا وھو إن لكفاءة سوق رأس المال مفھومین أساسین ھما الكفاءة الكاملة التي یصعب تحقیقھا، والكفاءة االقتصادیة التي یمكن تحقیقھا باعتبارھال الكفء یتوقع أن یتحقق التخصیص الفعال للموارد المتاحة، غیر أن ھذا یقتضي توفر أن جمیع المستثمرین یسعون الى تعظیم ثروتھم، ھذا وفي ظل سوق رأس الما
مطلبین أساسیین ھما كفاءة التشغیل وكفاءة التسعیر.
التنبؤ یمكن ا) المستویاتھ (ولیس األسعار وتقلبات تغیرات أن یعني وھذا عشوائیة تكون أن یجب األسھم أسعار فإن أسواق رأس المال كفاءة فرضیة تحققت إذا باعتبار أن جمیع المعلومات المتحصل علیھا معكوسة في سعر الورقة المالیة، وبالتالي ال یمكن ألي مستثمر أن یحقق أرباح غیر عادیة على األحوال حال من بأي بھا
ر السعر، وطالما أن ھناك فئة من المستثمرین یمكن لھم حساب المستثمرین اآلخرین، وأن أي معلومة تصل الى سوق رأس المال تعدل توقعات المستثمرین فیتغیاألسعار ستكون غیر عشوائیة الحصول على معلومات خاصة وتحلیلھا وبالتالي تحقیق أرباح غیر عادیة نتیجة التنبؤ باألسعار في الفترة القریبة المستقبلیة فإن حركة
بسبب عدم التماثل أو التناظر في المعلومات.
مرین یة اإلشارة أداة مھمة للرفع من كفاءة سوق رأس المال، حیث تساھم في التخفیف من مشكل عدم التماثل في المعلومات بین المسیرین والمستثوتعتبر نظر مة األسھم.یوذلك من خالل توفیر معلومات ال تتوفر لدى المستثمرین أو تصحیح بعض التفسیرات السلبیة من خالل إرسال إشارات تؤدي الى تقییم عادل لق
مراجعال
.490- 489، ص ص 2007منیر ابراھیم ھندي، األوراق المالیة وأسواق المال، منشأة المعارف، االسكندریة، مصر، [1] .490نفس المرجع، ص [2]وسبل رفع كفاءتھا، مجلة الباحث، جامعة ورقلة، دراسة لواقع أسوق الوراق المالیة العربیة - مفتاح صالح، معارفي فریدة، متطلبات كفاءة سوق األوراق المالیة [3]
.182، ص 2010، 07العدد رقم یل درجة محمود محمد سمیر، تحلیل سلوك أسعار األسھم وأثره على كفاءة بورصة فلسطین لألوراق المالیة (دراسة حالة)، مذكرة مقدمة ضمن متطلبات ن [4]
.26، ص 2011ة، غزة، فلسطین، الماجستیر في المحاسبة والتمویل، الجامعة االسالمی .09، ص 2004عیسى محمد الغزالي، تحلیل األسواق المالیة، سلسلة دوریة تعنى بقضایا التنمیة في االقطار العربیة، العدد السابع والعشرون، [5]
[6] Philippe gillet, L’effecience des marchès financiers, Economica, paris, 2eme
édition, 2006, pp, 19-26. حول الریادة واإلبداع : درید أل شبیب، عبد الرحمن الجبوري، أھمیة تطویر ھیئة الرقابة على األوراق المالیة لرفع كفاءة السوق المالي، المؤتمر العلمي الرابع [7]
.04، ص 2005إستراتیجیات األعمال في مواجھة تحدیات العولمة، جامعة فیالدلفیا، االردن، .09محمد الغزالي، مرجع سبق ذكره، ص عیسى [8] .10نفس المرجع، ص [9]
http://www.ahmadfarag.bbflash.net/t49-topic، من الموقع:26/01/2013أحمد فرج، مفھوم المعلومات، تاریخ االطالع: [10] .132، ص 2004فؤاد التمیمي، أسامة عزمي سالم، االستثمار باألوراق المالیة، دار المسیرة للنشر والتوزیع والطباعة، األردن، الطبعة األولى، أرشد [11] .238- 219منیر ابراھیم ھندي، مرجع سبق ذكره، ص ص [12] .130، ص 1997الجامعیة، مصر، الطبعة الثانیة، محمد صالح الحناوي، أساسیات االستثمار في بورصة األوراق المالیة، دار [13] .132أرشد فؤاد التمیمي، أسامة عزمي سالم، مرجع سبق ذكره، ص [14] .132محمد صالح الحناوي، مرجع سبق ذكره، ص [15] .10عیسى محمد الغزالي، مرجع سبق ذكره، ص [16] .516- 515منیر ابراھیم ھندي، مرجع سبق ذكره، ص ص [17] .516نفس المرجع، ص [18]
[19] Phillipe Spieser, Information économique et marchés financiers, Economica, Paris, France, 2000, p : 244. .503منیر ابراھیم ھندي، مرجع سبق ذكره، ص ص [20] .503نفس المرجع، ص [21])، مذكرة مقدمة 2006- 1996تطبیقیة ألسھم مجموعة من الشركات المسعرة في بورصة عمان للفترة (دراسة - بلجبلیة سمیة، أثر التضخم على عوائد األسھم [22]
.38-37، ص 2010ضمن متطلبات نیل شھادة الماجستیر في علوم التسییر، تخصص: تسییر المؤسسات، جامعة منتوري، قسنطینة، .38نفس المرجع، ص [23] .505- 504ص ص منیر ابراھیم ھندي، مرجع سبق ذكره، [24] .505نفس المرجع، ص [25] .506نفس المرجع، ص [26] .129محمد صالح الحناوي، مرجع سبق ذكره، ص [27] .510منیر ابراھیم ھندي، مرجع سبق ذكره، ص [28] .512-511نفس المرجع، ص ص [29]، ص 2009، جامعة قاصدي مرباح، ورقلة، 07توسطة، مجلة الباحث، العدد رقم عبد الوھاب دادن، الجدل القائم حول ھیاكل تمویل المؤسسات الصغیرة والم [30]319.
[31] Pierre Vernimmen, Finance d’entreprise, 5éme, édition , Dalloz, Paris, France, 2002, p. 628. .319بق ذكره، ص عبد الوھاب دادن، الجدل القائم حول ھیاكل تمویل المؤسسات الصغیرة والمتوسطة، مرجع س [32]

Rami HARID, Khayreddine BELAAZE, and Rabah KHOUNI
ISSN : 2351-8014 Vol. 7 No. 1, Aug. 2014 49
، جامعة فرحات عباس سطیف، 10شوقي بورقبة، دور نظریة اإلشارة في الرفع من كفاءة األسواق المالیة، مجلة العلوم االقتصادیة وعلوم التسییر، العدد رقم [33] .145- 144، ص ص 2010، جامعة قاصدي مرباح، 04ھامات النظریة األساسیة، مجلة الباحث، العدد رقم االس - عبد الوھاب دادن، تحلیل المقاربات النظریة حول أمثلیة الھیكل المال [34]
.112، ص ص 2006ورقلة، .319عبد الوھاب دادن، الجدل القائم حول ھیاكل تمویل المؤسسات الصغیرة والمتوسطة ، ص [35] .145شوقي بورقبة، مرجع سبق ذكره، ص [36]
[37] Josée st pierre, la gestion financière des pme : théories et pratiques, presses de l’université du Québec, canada, 1999, p : 90.
.146شوقي بورقبة، مرجع سبق ذكره، ص [38] .304، ص 1998منیر إبراھیم ھندي، الفكر الحدیث في مجال مصادر التمویل، الجزء الثاني، منشأة المعارف، االسكندریة، مصر، [39] .146شوقي بورقبة، مرجع سبق ذكره، ص [40] .147 ص المرجع، نفس [41]
International Journal of Innovation and Scientific Research ISSN 2351-8014 Vol. 7 No. 1 Aug. 2014, pp. 50-56 © 2014 Innovative Space of Scientific Research Journals http://www.ijisr.issr-journals.org/
Corresponding Author: R. SALOUAN 50
A Comparison between the Self-Organizing Maps and the Support Vector Machines for Handwritten Latin Numerals Recognition
R. SALOUAN, S. SAFI, and B. BOUIKHALENE
Department of Mathematic and Informatic, Polydisciplinary Faculty, Sultan Moulay Slimane University, Beni Mellal, Morocco
ABSTRACT: In this paper, we present a comparison between two methods for learning-classification; the first one is called
Kohonen network or Self-Organizing Maps (SOM) which is characterized by an unsupervised learning. The second one is called Support Vector Machine (SVM) which is based on a supervised learning. These techniques are used for recognition of handwritten Latin numerals that’s extracted from MNIST database. In the pre-processing phase we use the thresholding, centering and skeletization techniques in the features extraction we use the zoning method. The simulation result demonstrates that the SVM is more robust than the SOM method in the recognition of handwritten numerals Latin.
KEYWORDS: Handwritten Latin numerals, Thresholding, Centering, Skeletization techniques, Self-Organizing Maps (SOM),
Support Vectors Machines (SVM).
1 INTRODUCTION
Handwritten Latin numeral recognition is considered as a one of the most active field in pattern recognition in reason of its usage uses in many applications including those in postal sorting, bank cheque processing and automatic data entry.
Many approaches have been proposed by the researchers towards recognition of handwritten characters or Latin numerals by using the zoning [1-5] method in the features extraction or the SOM [6-10] or the SVM [11-14] in the learning-classification phase.
In fact, a recognition system can be divided into three principal steps. The first one is a pre-processing which is used for
enhancing the image quality. The second step is the features extraction from each numeral pattern for to extract a quantity of informations from each numeral. The third step is the learning-classification which is used to recognize the Latin numerals.
In this work, all numeral images are pre-processed by the thresholding and the centering techniques then a skeletization of them is carried. The features extraction is used by the zoning method which is used to convert each image of numeral to a vector that will used as an input vector of SOM then of SVM that are used to train the numeral images of the training database and to classify them in the test database. The last steps contain two methods which are described as follow:
1.1 DESCRIPTION OF THE SOM METHOD
In learning phase, each input vector that models a numeral should beards the label of a neuron called the winner neuron, it’s that has a vector weights is very nearest to this vector after calculation of the Euclidean distance between this input vector and all vectors weights that binds each vector of the input layer of the SOM and each neuron of the output layer of the SOM. The vector weight that’s closest must be learned be more near to the input vector that’s nearest to it. After learning we will get for each numeral the very nearest vector, all these vectors weight learned should be stocked just for forming a learning base.
In the classification phases we calculate the Euclidean distance between a test vector (unknown numeral) and each of vectors weights that was saved in the learning base. The recognition will assigned to label of the neuron that its vector weight is nearest to test vector.

R. SALOUAN, S. SAFI, and B. BOUIKHALENE
ISSN : 2351-8014 Vol. 7 No. 1, Aug. 2014 51
1.2 DESCRIPTION OF THE SVM METHOD
In the learning phase, we use the SVM method which is based on the strategy: one against all. A separation must be making for each numeral image that belongs in a class has a label equal to value 1 of the learning base to all other numeral images that are regrouped in another class labeled by -1. This separation (maximizing the margin between both classes) is therefore creating a decision function separating these both classes. We have ten numerals. So we will have ten decision functions each of them will separate a pair of classes (1 and -1) among the ten pairs.
In the classification phase, we calculate the image of an unknown vector by all ten decision functions. The recognition will be attributed to the numeral whose decision function separates its class to another class containing the rest of numerals which gives the biggest value.
2 THE RECOGNITION SYSTEM
Fig. 1. System for handwritten Latin numerals recognition.
3 PREPROCESSING
Pre-processing is the first part of Latin numerals recognition system that’s used for producing a cleaned up version of the original image so that it can be used efficiently in the feature extraction step. In our study, we preprocess the images by these techniques; the first is the thresholding that’s used to make each numeral image contains only the black and white colors according to preset threshold. The second steps is the centering, used for numeral which is in center of image, the skeletonization is used for detecting the skeleton of each numeral image.
4 FEATURES EXTRACTION
It is very important to extract the features in such a way that the recognition of numerals becomes easier on the basis of individual features of the numerals. In this work we have used the Zoning method that can be explained as follow: Given a black image that contains an numeral written in white, the zoning method consists to divide this image to a several zones then calculating in each of them the number of white pixels, all these numbers are stocked in a vector, that is to say: the image is converted to a vector has a number of components equal to that of zones.
Fig. 2. Example of zoning method of handwritten Latin numeral 2
5 LEARNING PHASE

A Comparison between the Self-Organizing Maps and the Support Vector Machines for Handwritten Latin Numerals Recognition
ISSN : 2351-8014 Vol. 7 No. 1, Aug. 2014 52
5.1 THE KOHONEN NETWORK
The Kohonen network [15] is composed of two layers one has I nodes that’s the input of network, other has a J nodes
that’s its output. These layers are connected via IxJ coefficients called weightsW .
Fig. 3. The Kohonen network
The topological maps of Kohonen (Self-Organizing Maps)weighed a special structuring to its neurons (nodes).This structure binds the neurons and have forced them to respect a certain topology during the learning phase .Thus the near data in the input space have an very closest representations in topological Kohonen map.
5.1.1 LEARNING ALGORITHM OF TOPOLOGICAL KOHONEN MAPS:
It contains the following phases:
• Initialize the weights randomly 0jW : ],1[ Jj
• Presentation of datat
IxxxX ),.....,,( 21 in input to the current iteration n and calculating its distance from each of the
vectorsnjW ],1[ Jj
• Selection of winner neuron*j that is nearest to the input X by computing the distances:
2
1
2 )))()(( tWtxd ij
I
iij
• Update he weightsnjW
The result obtained *W after the training (learning) phase is a memory containing a set of an optimal weight vectors that are
very nearest to each input vector t
IxxxX ),.....,,( 21
5.2 THE SUPPORTS VECTORS MACHINES
An SVM [16] is basically defined for two-class problem separation, and it finds an optimal hyperplane which can maximize the distance, the margin, between the nearest examples of both classes, named support vectors (SVs). Given a training database of M data: ).....2,1,( MiX i
.
(1)

R. SALOUAN, S. SAFI, and B. BOUIKHALENE
ISSN : 2351-8014 Vol. 7 No. 1, Aug. 2014 53
Fig. 4. The determination of optimal hyperplane, vectors supports, maximum Marge and valid hyperplanes.
The linear SVM classifier is then defined as:
bxxf )(
Where w and b are the parameters of the classifier y is the label.
The linear SVM can be extended to a non-linear classifier by replacing the inner product between the input vectors x and the SVs, through a kernel function K defined as:
Kernel linear: xy
Kernel polynomial of degree n: nxy )1(
Gaussian Radial Basis Function (GRBF): 2
2
2
yx
e
The method described above is designed for a problem of two classes only, many studies treat a generalization of the SVM to a multi-classification [17] among these studies we cite the two strategies frequently used: the first approach is based to use N decision functions (one against all) allowing to make a discrimination of a class contains a one vector against all other vectors existed in a other class opposite. The decision rule used in this case is usually the maximum such that we will assign an unknown vector X into a class associated with an output of SVM is the largest.
The second method is called the one against one instead of learning N decision functions; each class is opposed against another. So
2
)1( NN decision functions are learned and each of them performs a voting for the assignment of a new test
(unknown) vector X. its class then becomes the majority class after the vote.
6 THE CLASSIFICATION PHASE
By using the SOM :
During the classification phase, an unknown vector should be presented t
IxxxX ),.....,,( 21 and determining the
very nearest node in terms of Euclidean distance between X and each optimal vector *W the unknown vector X will bear the
label of the class of the winner neuron.
By using the SVM :
After having built the ten decision functions between the ten pairs of classes in the learning phase by the strategy of (one against all) we calculate all the values of the images of the vector that models the numeral test by the all the ten decision functions, the recognition will be assigned to the numeral whose an decision function separating its class to another class contains the rest of the other numerals that gives the largest value among all values calculated of the ten images of the numeral test.
7 EXPERIMENTS AND RESULTS
(2)
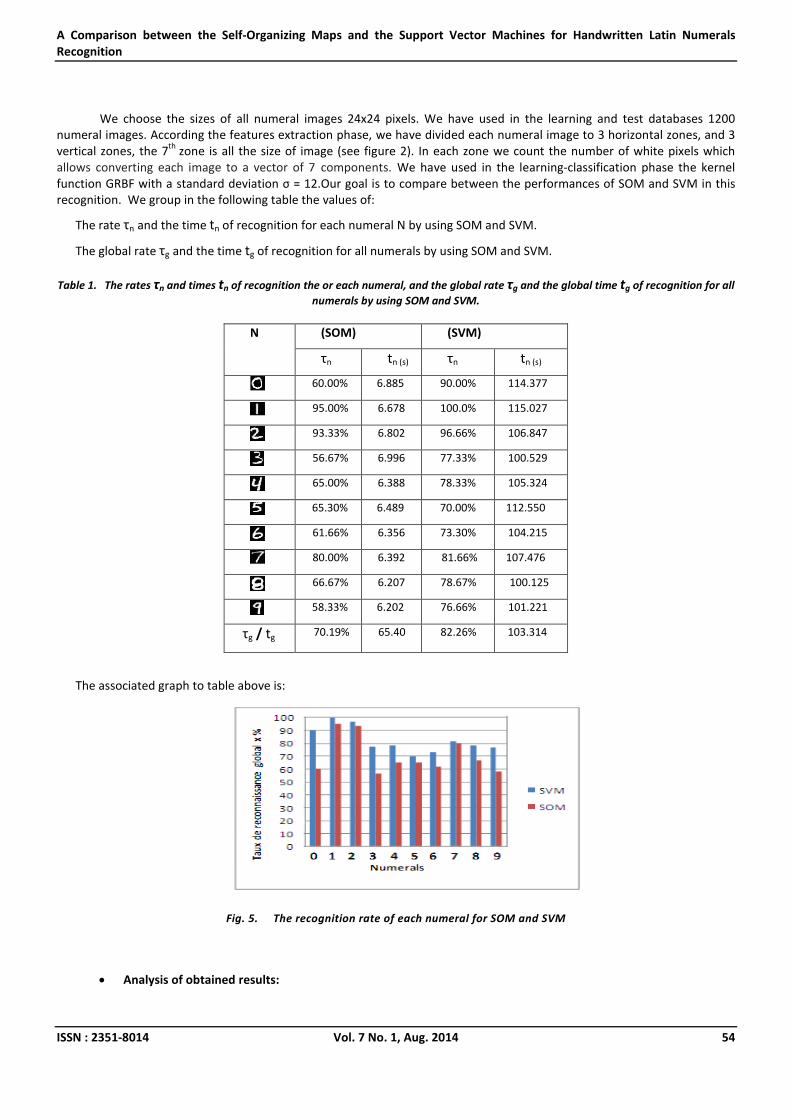
A Comparison between the Self-Organizing Maps and the Support Vector Machines for Handwritten Latin Numerals Recognition
ISSN : 2351-8014 Vol. 7 No. 1, Aug. 2014 54
We choose the sizes of all numeral images 24x24 pixels. We have used in the learning and test databases 1200 numeral images. According the features extraction phase, we have divided each numeral image to 3 horizontal zones, and 3 vertical zones, the 7
th zone is all the size of image (see figure 2). In each zone we count the number of white pixels which
allows converting each image to a vector of 7 components. We have used in the learning-classification phase the kernel function GRBF with a standard deviation σ = 12.Our goal is to compare between the performances of SOM and SVM in this recognition. We group in the following table the values of:
The rate τn and the time tn of recognition for each numeral N by using SOM and SVM.
The global rate τg and the time tg of recognition for all numerals by using SOM and SVM.
Table 1. The rates τn and times tn of recognition the or each numeral, and the global rate τg and the global time tg of recognition for all
numerals by using SOM and SVM.
N (SOM) (SVM)
τn tn (s)
τn tn (s)
60.00% 6.885 90.00% 114.377
95.00% 6.678 100.0% 115.027
93.33% 6.802 96.66% 106.847
56.67% 6.996 77.33% 100.529
65.00% 6.388 78.33% 105.324
65.30% 6.489 70.00% 112.550
61.66% 6.356 73.30% 104.215
80.00% 6.392 81.66% 107.476
66.67% 6.207 78.67% 100.125
58.33% 6.202 76.66% 101.221
τg / tg 70.19% 65.40 82.26% 103.314
The associated graph to table above is:
Fig. 5. The recognition rate of each numeral for SOM and SVM
Analysis of obtained results:

R. SALOUAN, S. SAFI, and B. BOUIKHALENE
ISSN : 2351-8014 Vol. 7 No. 1, Aug. 2014 55
These results show that generally, for each numeral, the recognition rate for each numeral also the global rate by using SVM is more than those that when using SOM in one hand, about time recognition the SOM is more fast than SVM in other hand. Now, we present firstly the matrix of confusion that is associated to SOM:
Table 2. The matrix of confusion of SOM
SOM
60.00 % 00.00% 00.00% 03.66% 00.00% 28.00% 00.00% 00.00% 08.34% 00.00%
00.00% 95.00% 00.00% 05.00% 00.00% 00.00% 00.00% 00.00% 00.00% 00.00%
04.00% 00.00% 93.33% 00.00% 00.00% 02.67% 00.00% 00.00% 00.00% 00.00%
15.33% 04.00% 00.00% 56.67% 00.00% 14.50% 00.00% 06.50% 03.00% 00.00%
03.50% 04.25% 00.00% 00.00% 65.00% 15.00% 00.00% 06.75% 05.50% 00.00%
11.00% 04.00% 05.00% 02.00% 00.00% 65.30% 00.00% 00.00% 12.70% 00.00%
12.00% 03.00% 05.50% 02.00% 03.50% 07.00% 61.66% 00.00% 05.34% 00.00%
00.00% 05.50% 00.00% 06.00% 00.00% 03.50% 00.00% 80.00% 00.00% 05.00%
06.00% 00.00% 04.00% 07.00% 06.00% 03.00% 03.00% 00.00% 66.67% 04.33%
00.00% 03.50% 00.00% 00.00% 02.00% 15.00% 00.00% 06.67% 14.50% 58.33%
Then, the matrix of confusion that is associated to SVM is presented in following table:
Table 3. The matrix of confusion of SVM
SVM
90.00 % 00.00% 00.00% 02.50% 04.50% 03.00% 00.00% 00.00% 00.00% 00.00%
00.00% 100.0% 00.00% 00.00% 00.00% 00.00% 00.00% 00.00% 00.00% 00.00%
00.00% 00.00% 96.66% 00.00% 00.00% 02.34% 00.00% 00.00% 00.00% 00.00%
11.67% 00.00% 04.00% 77.33% 00.00% 06.00% 00.00% 01.50% 03.50% 00.00%
00.00% 02.67% 00.00% 04.00% 78.33% 05.00% 00.00% 0.00% 05.50% 04.50%
05.50% 00.00% 07.50% 10.00% 00.00% 70.00% 00.00% 03.00% 00.00% 04.00%
14.00% 00.00% 00.00% 02.70% 05.00% 00.00% 73.30% 00.00% 05.00% 00.00%
00.00% 02.50% 04.50% 00.00% 00.00% 00.00% 00.00% 81.66% 00.00% 11.34%
00.00% 00.00% 02.00% 00.00% 05.33% 00.00% 08.00% 00.00% 78.67% 06.00%
00.00% 00.00% 05.34% 00.00% 00.00% 08.50% 00.00% 09.50% 00.00% 76.66%
8 CONCLUSION
In this paper, we have presented two methods for recognition of isolated Latin handwritten numerals. Those methods are Pre-processed by a thresholding, centring and then a skeletisation operation is carried. The features extraction is used by the zoning method, the learning-classification was done using the self-organization maps and the support vectors machines.
The simulation results demonstrate that the SVM is more performing but more slow than the SOM in the recognition of handwritten Latin numeral.
REFERENCES

A Comparison between the Self-Organizing Maps and the Support Vector Machines for Handwritten Latin Numerals Recognition
ISSN : 2351-8014 Vol. 7 No. 1, Aug. 2014 56
[1] Ravindra S. Hegadi, Recognition of Printed Kannada Numerals based on Zoning Method, International Journal of Computer Applications (0975 – 8878) on National Conference on Advanced Computing and Communications - NCACC, April 2012
[2] Basappa B. Kodada and Shivakumar K. M. Unconstrained Handwritten Kannada Numeral Recognition , International Journal of Information and Electronics Engineering, Vol. 3, No. 2, March 2013
[3] Efficient zone based feature extraction algorithm handwritten numeral recognition of four popular south Indian scripts, Journal of Theoretical and Applied Information Technology
[4] Rajashekararadhya S.V. and Vanaja Ranjan P., “Efficient zone based feature extraction algorithm for handwritten numeral recognition of four popular south Indian scripts”, Journal of Theoretical and Applied Information Technology, 2005, pp 1171- 1181.
[5] Sikkim Manipal ,Manjaiah D.H, Rabindranath Bera, Ashoka H.N. et al , Zone Based Feature Extraction and Statistical Classification Technique for Kannada Handwritten Numeral Recognition , International Journal of Computer Science & Engineering Technology (IJCSET).
[6] Neila Mezghani1 and Amar Mitiche2, A Gibbsian Kohonen Network for Online Arabic Character Recognition, G. Bebis et al. (Eds.): ISVC 2008, Part II, LNCS 5359, pp. 493–500, 2008.c Springer-Verlag Berlin Heidelberg 2008
[7] Dr. Pankaj Agarwal, hand-written character recognition using Kohonen Network, IJCSt Vol. 2, ISSue 3, September 2011 [8] R.Indra Gandhi, ADr.K.Iyakutti, n Attempt to Recognize Handwritten Tamil Character Using Kohonen SOM , Int. J. of
Advance d Networking and Applications Volume: 01 Issue: 03 Pages: 188-192 (2009) [9] Prof. Sheetal A. Nirve , Dr. U. B. Shinde, HINDI CHARECTER RECOGNITION USING KOHONEN NETWORK, International
Journal of Scientific & Engineering Research, Volume 4, Issue 5, May-2013, ISSN 2229-5518 [10] S. Peyarajan R. Indra Gandhi, ON-LINE TAMIL HAND WRITTEN CHARACTER RECOGNITION USING KOHONEN NEURAL
NETWORK, Research Journal of Computer Systems Engineering- An International Journal, Vol 02, Issue 02, July, 2011 [11] Arora, S., Bhattacharjee, D., Nasipuri, M., Malik, L., Kundu, M. and Basu, D. K., Performance Comparison of SVM and ANN
for Handwritten Devnagari Character Recognition, IJCSI International Journal of Computer Science Issues, Vol. 7, Issue 3, No 6, May 2010.
[12] H Byun and S. Lee. “Applications of Support Vector Machines for Pattern Recognition: A Survey”, In the Proceedings of the First International Workshop: Pattern Recognition with Support Vector Machines, pps 213-236, Niagara Falls, Canada 2002.
[13] K. Vijay Kumar, R.Rajeshwara Rao, Online Handwritten Character Recognition for Telugu Language Using Support Vector Machines, International Journal of Engineering and Advanced Technology (IJEAT), ISSN: 2249 – 8958, Volume-3, Issue-2, December 2013
[14] Luiz S. Oliveira and Robert Sabourin, Support Vector Machines for Handwritten Numerical StringRecognition, Proceedings of the 9th Int’l Workshop on Frontiers in Handwriting Recognition (IWFHR-9 2004) 0-7695-2187-8/04 $20.00 © 2004 IEEE
[16] Kohonen T," Self-Organizing Maps " 3rd edition, Springer, Berlin, 2001. [17] V.N.Vapnik, "An overview of statistical learning theory", IEEE Trans. Neural Networks., vol. 10, pp. 988– 999, Sep. 1999. [18] C. Cortes and V.Vapnik. Support vector networks. Machine Learning, 20: pp 1–25, 1995.

International Journal of Innovation and Scientific Research ISSN 2351-8014 Vol. 7 No. 1 Aug. 2014, pp. 57-62 © 2014 Innovative Space of Scientific Research Journals http://www.ijisr.issr-journals.org/
Corresponding Author: Dr. Ira Gupta 57
Placental tissues: fixing smiles
Dr. Ira Gupta1, Dr. Rohit Gupta
1, Dr. Shankar T Gokhale
2, and Dr. Anjali Sharma
1
1Rama Dental college hospital and research centre, Kanpur,
Department of periodontics, India
2Institute of dental sciences, Barielly, Department of periodontics, India
Copyright © 2014 ISSR Journals. This is an open access article distributed under the Creative Commons Attribution License, which permits unrestricted use, distribution, and reproduction in any medium, provided the original work is properly cited.
ABSTRACT: Autograft tissue currently remains the gold standard of periodontal plastic surgery. It provides excellent
predictability, improved long-term outcomes, and superior aesthetics over other treatment options. The amniotic sac encloses the developing foetus through gestation and is composed of amnion and chorion tissues. Amnion basement membrane closely mimics the basement membrane of human oral mucosa. Use of placental allografts in dentistry is a more recent development. The currently available dental form of placental allograft is composed of cryopreserved, dehydrated amnion chorion laminate. Fresh amnion has generally been used .When compared to traditional guided tissue regeneration membranes, placental barriers, such as amnion chroion membranes demonstrate many unique properties including anti-adhesive effects, bacteriostatic properties, wound protection, pain reduction, and epithelialization effects.
KEYWORDS: Amniotic membrane, Allograft, Placental membrane.
INTRODUCTION
The human placenta is a complex organ which starts developing within few days after fertilization and is very Important for development and survival of the fetus throughout the gestation. It is about 10-15 micrometer thick which constitutes of two fetal membranes, the inner amniotic membrane and the outer chorion.
1
The amnion membrane encases the amniotic fluid and fetus, and is highly flexible because of which it is easily separated from the chorion.
2
Amniotic membrane is the innermost lining of fetal membrane that is in contact with the developing fetus. The lining serves as a natural barrier to protect the fetus from infections and trauma because of lack of immune system.
3
Amnion is thin, tough, transparent membrane. Chorion side of the membrane is rougher and porous. Amnion can easily be separated from chorion leave and placenta as far as the umbilical cord. Once separated, the amnion is found to be smooth and shining and much tougher and more elastic and easier to clean than the thicker chorion, which does not strip from the placenta. The chorion, although thicker, is more easily torn because it is much less elastic.
4
HISTORY
Davis introduced the use of human fetal membranes for skin transplantation in 1910 and 3 years later Sabella described its use for burnt and ulcerated skin surfaces. The use of amniotic membranes offers the advantage that the thicker intact membrane can be handled easily and remains on the wound longer than amnion by itself. In 1952, Douglas reported the use of amniotic membrane to temporarily cover burn wounds. Since then this material has shown good results as a temporary wound dressing and is mostly used to treat burns.
5

Placental tissues: fixing smiles
ISSN : 2351-8014 Vol. 7 No. 1, Aug. 2014 58
Interest in utilization of amniotic membrane waned in the early 1980’s as a result of communicable diseases such as H.I.V./A.I.D.S., Hepatitis, etc. In the late 1990’s and early 2000’s amnion re-appeared in cryopreserved form for the treatment of ophthalmic wounds.
6
There were only few reports in the literature on reconstruction of oral tissues using amnion. Lawson in 1985 studied the use of amniotic membrane along with pectoralis major muscle for oral cavity reconstruction. He concluded that placement of amnion over the deep aspect of the muscle that is exposed to the oral cavity resulted in a more rapid development of mucosa. When muscle was used without amniotic membrane, the healing process usually took twice as long. Also, when amnion was not used, it showed a significant amount of wound contracture.
5
PROPERTIES OF AMNIOTIC MEMBRANE
The human amnion membrane is a biological graft which has unique properties like anti-adhesive effects, bacteriostatic properties, wound protection, pain reduction and epithelialisation effects.
4
IMMUNOMODULATIVE AND IMMUNE PRIVILEGE
Amniotic membrane has a unique molecular surface architecture and biochemical properties that is derived from the layer of trophoblast cells which renders it unsusceptible to maternal immune attack. The native amniotic epithelial cells express the non-polymorphic, non-classical human leukocyte antigen (HLA-G) but lack the polymorphic antigens HLA-A, B (Class IA) and HLA-DR (Class II) on their surfaces. 'Ihe class I antigen is seen in almost all cells of the amniotic membrane unlike the class II antigen which is only present in some fibroblasts. These mesenchymal stem cells are different from other nucleated mammalian cells as stimulate they show little allogeneic reactivity when administered to MHC unmatched adult immune competent recipients. This immune barrier is due to lack of expression of co-stimulatory cell surface molecules such as CD80 and CD8 mostly in the human. Furthermore, they are actively suppressive of T cell, dendritic cell and B cell function that down-modulate exuberant inflammation.
1
ANTI-MICROBIAL PROPERTY
It forms an early physiologic “seal” with the host tissue precluding bacterial contamination. It forms a firm adherence barrier with the wound via fibrin and elastin linkages that seals the wound and prevent contamination. This tight adherence helps in restoring lymphatic integrity, protects circulating phagocytes from exposure and allows faster removal of surface debris and bacteria from the wound.
1
This antimicrobial activity of mesenchymal stem cells is mediated by two mechanisms: direct; via secretion of antimicrobial factors such as LL-37
6 and indirectly, via secretion of immunomodulative factors which will upregulates
bacterial killing and phagocytosis by immune cells7. These mechanisms will reduce the bacterial counts in the wound and
promotes healing. Many bactericidal products of purine metabolism and lysozyme are also found in the amnion membrane. Defensins, mostly β-3 defensins that helps the epithelial surfaces to resist microbial colonization form a major group of anti-microbial peptides found in the amniotic membranes.
1
REDUCTION OF PAIN
Amnion membrane has the unique ability to reduce the pain during the surgical procedure as it diminishes inflammation and provides a better state of hydration that soothes the wound bed to promote faster healing. The soft mucoid lining of amniotic membrane also protects the exposed nerve endings from external irritant that help to decrease pain sensation by preventing nerve stimuli. It also supportes the growth of the epithelium and facilitates migration and reinforced adhesion.
1
ANTI SCARRING AND ANTI INFLAMMATORY PROPERTIES
Wound healing stimulates recruitment of various cells like neutrophils, macrophages and giant cells to the surgical site to combat the invading microorganisms and to control the ongoing inflammatory process. Macrophages and giant cells at the surgical site produce cytokines that attract fibroblasts leading to development of fibrosis at the surgical site. Fibroblasts are activated by the transforming growth factor (T.G.F.) beta that is secreted by macrophages and fibroblast in the wound area. Amniotic membrane secretes vascular endothelial

Dr. Ira Gupta, Dr. Rohit Gupta, Dr. Shankar T Gokhale, and Dr. Anjali Sharma
ISSN : 2351-8014 Vol. 7 No. 1, Aug. 2014 59
growth factor (V.E.G.F.), hepatocytes growth factor (H.G.F.) that maintain a proper balance between TGF-1 and TGF-3 that prevents scarring.
The mesenchymal cells in amniotic membrane decreases the secretion of the proinflammatory cytokines like TNF-α and interferon while simultaneously increasing the production of anti-inflammatory cytokines IL-10, IL-4, IL-1α, IL-1β.
1
INCREASED VASCULARIZATION AND REVASCULARIZATION
There is an enhanced induction of Vascular Endothelial Growth Factor (V.E.G.F.) both for V.E.G.F. receptors 1 and 2 by the cells of the amniotic membrane. Extensive neovascularization observed immediately after its application is attributed to the release of angiogenic factor like insulin derived growth factor (I.G.F.) that promote granulation tissue formation and epithelialization.
1
INCREASED EXTRACELLULAR MATRIX DEPOSITION
Mesenchymal cells differentiation helps in regenerating the damaged tissue, whereas mesenchymal cells paracrine signaling regulates the local cellular responses to injury. The paracrine signaling by the mesenchymal cells help in cell survival, proliferation, migration and gene expression of epithelial cells, endothelial cells, keratinocytes and fibroblasts.
8
ANTI –ADHESIVE
Human amniotic membranes preserved at -800C for one month revealed the presence of E.C.F., T.G.F.-α, K.G.F.,
H.G.F., b-F.G.F., T.G.F.-β1, T.G.F.-β2. The basement membrane facilitates migration of epithelial cells, reinforces adhesion of basal epithelial cells and may promote epithelial differentiation.
9
SOURCE OF AMNIOTIC TISSUE
Eligible amnion donors are living mothers that have delivered a live baby through cessarean section or vaginal section.
4
An elective caesarean delivery helps in the right choice of a consenting donor and planned collection of amniotic membrane because placenta collected after natural vaginal delivery may have structural defects linked with stretching of the membrane during labour and delivery and may be infected by normal vaginal flora, herpes, chlamydia or other contaminant bacteria. Due the risk of infection with H.I.V. and hepatitis C, tissue transplantation laws in different countries require different protocols for preservation, testing and storage.
10
Protection against transmission of viruses is effected by donor selection and testing for serological markers of presently known transmissible viruses at the time of donation and again 3-4 months later. This time window omits any chances of infection transfer that may be diagnosed later on.
4
PROCESSING OF AMNIOTIC MEMBRANE
For clinical use of the membrane, it can be prepared in the following forms:
Fresh membrane
Dried membrane
Frozen membrane
Freeze derived irradiated
Stabilized amniotic membrane
Cryopreserved membrane
FRESH MEMBRANE
Studies have shown that amnion can be maintained in viable condition for up to 6 weeks if stored aseptically at -48 0C in
0.5% silver nitrate solution or in 20% glycerine solution or in sterile saline after passage through one rinse of 0.025% sodium hypochlorite solution.
11

Placental tissues: fixing smiles
ISSN : 2351-8014 Vol. 7 No. 1, Aug. 2014 60
Preservation in 85% glycerol is not only very simple, it is also suitable for preservation over longer periods (up to 5 years). Glycerol dehydrates tissue by physically replacing most of the intracellular water but does not change the cell’s ionic concentration, thus it is an efficient agent that preserves tissue by protecting cell integrity.
12
Immediately prior to their use, small clean sections (6 x 10 cm2) of membrane were cut and kept in 400 ml of saline
containing 10,00,000 IU penicillin at 480C up to 24 hours.
11
DRIED MEMBRANE
After cleaning and rinsing the membranes are sepreaded on plastic sheet and allowed to dry in open air. These are found to be equally effective when compared with fresh.
4
FROZEN MEMBRANE
Hypothermic storage at 40C, freeze drying through liquid nitrogen at -196
0F, cooling preserve the membrane for an
indefinite time, produces bacteriologically pure and immunologically inert material.4
FREEZE DRIED IRRADIATED
Membrane after obtaining from placenta dried at -600C under vacuum for 48 hrs. It is then irradiated with 2.5 mega
rads in a batch type cobalt -60 irradiator. By the method of freeze drying there is sublimation of liquid moisture to gaseous state without having undergone the intermediate solid state. This method helps the membrane to maintain its original size and shape with minimum cell rupture. The freeze dried membrane can be made ready for use by soaking it in normal saline for 1 minute.
4
CRYOPRESERVED
Cryopreservation with dimethylsulphoxide at -800C is an important modality for preservation of these as it keeps the
membrane viable for a longer period of time but causes loss of some angiogenic factors and cell rupture.13
STABILIZED AMNIOTIC MEMBRANE
Successful use of gluteraldehyde treated amnion is employed as a microvascular interpositional graft in experiment animals.
4
HYPER-DRIED AMNIOTIC MEMBRANE
The far Infrared and microwaves are used for sterilization of amniotic membrane which is known as hyper-dry-amnion. The temperature during drying should not exceed 35
0C. Hyper-dried amnion can be preserved at room temperature until
packet is cut open.1
MEMBRANE PLACEMENT
Membrane is applied with rough (chorionic) surface next to the wound. Cryopreserved amniotic membrane is manufactured with the stromal side of the graft attached to the nitrocellulose filter paper that is sticky unlike the epithelial side which is non-sticky and shiny. Fibrin glue sticks to the stromal side and permits adherence of the membrane to the wound even without suturing.
1,4
USE OF AMNIOTIC MEMBRANE
Periodontal diseases leading to deterioration of tooth supporting structure are a serious concern for clinicians. The clinical application of amniotic membrane for guided tissue regeneration while fulfilling the current mechanical concept of guided tissue regeneration, amends it with the modern concept of biological guided tissue regeneration. Biomechanical guided tissue regeneration proposed here in using amnion membrane, not only maintains the structural and anatomical configuration of regenerated tissues, but also contribute to the enhancement of healing.
14

Dr. Ira Gupta, Dr. Rohit Gupta, Dr. Shankar T Gokhale, and Dr. Anjali Sharma
ISSN : 2351-8014 Vol. 7 No. 1, Aug. 2014 61
When compared to traditional guided tissue regeneration membrane, placental barriers demonstrate many unique properties that have been described earlier.
15
Human amniotic membrane has been tried in temporo mandibular joint ankylosis as it prevents fibrosis and reankylosis when used as an interpositional material.
1
Amnion has been used as a graft material after vestibuloplasty where it prevents secondary contraction after the surgery and maintains the post-operative vestibular depth.
16
Hyper dried amnion or cryopreserved amniotic membrane tissue is used as a barrier membrane in the treatment of periodontal osseous defect with or without bone graft
15 and even tried in the management of gingival recession with guided
tissue regeneration.17
LIMITATIONS
Operator’s inexperience is a limitation.15
The amniotic membrane is a biological-derived material and concomitant are the same problems of other biological material applications. For instance, transmission of infectious diseases is always a risk associated with human organ and tissue transplantation. Thus, the same precautions and safety criteria applied to organ transplantation have to be adhered in the application of amniotic membrane. Potential donors need to be screened effectively for any risk factors that might render them unsuitable for donation. A review of relevant medical records to ensure freedom from risk factors for and clinical evidence of H.I.V., hepatitis B, hepatitis C, C.M.V., syphilis, and other possible infections, should be carried out. There is a slight possibility that the donor may be in the “window period” of infection. Hence, even if serological tests are negative, it is advisable to repeat the investigations after 6 months. The amniotic membrane can be preserved at -80°C until samples found negative of any infectious diseases.
18
Cryopreserved / Hyper-dried membranes are costlier.3
Membrane is highly fragile.4
CONCLUSION
The use of amniotic membrane over the past 100 years has produced a significant amount of use and success in multiple areas of medicine and now-a-days its use has increased in dentistry too due to its unique properties. Human amniotic membrane is a uniquely suited material for use as an allograft. Used in its natural form, then later in preserved preparations, the material assists in the healing process through a number of physical, biochemical and molecular biological pathways to promote regenerative healing while simultaneously reducing scar formation. Additional research and characterization of this process will more completely define the dramatic results seen in the application of this material.
REFERENCES
[1] Parolini O et al. Concise review: isolation and characterization of cells from human term placenta: outcome of the first international workshop on placenta derived stem cells. Stem Cells. 2002;26:300-11.
[2] Aditi Chopra, Betsy S Thomas. Amniotic Membrane: A Novel Material for Regeneration and Repair. J Biomim Biomater Tissue Eng. 2013; 18(1):1-8.
[3] Ines Velez, William B. Parker, Michael A. Siegel,Maria Hernandez. Cryopreserved Amniotic Membrane for Modulation of Periodontal Soft Tissue Healing: A Pilot Study. J Periodontol 2010; 81:1797-1804.
[4] M.A. Ganatra. Amniotic Membrane in Surgery. J Pak Med Assoc. 2003;53(1):1-7. [5] Yogesh Sharma , Anisha Maria, Preeti Kaur. Effectiveness of Human Amnion as a Graft Material in Lower Anterior Ridge
Vestibuloplasty: A Clinical Study. J. Maxillofac. Oral Surg. 2011;10(4):283–7. [6] Krasnodembskaya. Antibacterial effect of human mesenchymal stem cells is mediated in part from secretion of the
antimicrobial peptide LL-37. Stem cells. 2010; 28: 2229-38. [7] Talmi YP, Sigler L, Inge E, Finkelstein Y, Zohar Y. Antibacterial properties of human amniotic membranes.
Placenta.1991;12:285-8. [8] Hocking AM, Gibran NS. Mesenchymal stem cells: Paracrine signaling and differentiation during cutaneous wound
repair. Exp Cell Res. 2010;316:2213-19.

Placental tissues: fixing smiles
ISSN : 2351-8014 Vol. 7 No. 1, Aug. 2014 62
[9] Irfan Z. Qureshi, Fareeha A. and Wajid A. Khan.Technique for Processing and Preservation of Human Amniotic Membrane for Ocular Surface Reconstruction. World Academy of Science, Engineering and Technology.2010;45:757-60.
[10] M. A. Ganatra, S Bhura. “Management of skin graft donor site by irradiated amniotic membrane.” Pakistan J Surg. vol. 2003;19: 82-85.
[11] Mohammad Hassan Samandari, Masoud Yaghmaei, Masoud Ejlalic Mohammad Moshref, Arash Shoja Saffar. Use of amnion as a graft material in vestibuloplasty: A preliminary report. Oral Surg Oral Med Oral Pathol Oral Radiol Endod 2004;97:574-8.
[12] Ravishanker R, Bath AS, Roy R.‘‘Amnion bank’’—the use of long term glycerol preserved amniotic membranes in the management of superficial & partial thickness burns. Burns. 2003; 29:369–74.
[13] Hennerbichler S, Reichl B, Wolbank S, Eibl J, Gabriel C, et al. (2007) Cryopreserved amniotic membrane releases angiogenic factors. Wound Rep Reg 15: A51.
[14] Amniotic membrane: A potential candidate for periodontal guided tissue regeneration? Medical Hypotheses. 2007; 69:454–73.
[15] Dan J. Holtzclaw, Nicholas J. Toscano. Amnion–Chorion Allograft Barrier Used for Guided Tissue Regeneration Treatment of Periodontal Intrabony Defects:A Retrospective Observational Report. Clinical Advances in Periodontics. 2013;3(3):131-37.
[16] Basavaraj C. Sikkerimath, Satyajit Dandagi, Santosh. S. Gudi, Deeptha Jayapalan. Comparison of vestibular sulcus depth in vestibuloplasty using standard Clark’s technique with and without amnion as graft material. Annals of Maxillofacial Surgery. 2012; 2(1):30-5.
[17] Harveen singh, Harshneet Singh. Bioactive amnion as a guided tissue regeneration(GTR) membrane for treatment of isolated gingival recession. A Case Report.Indian Journal of Dentistry.2013; 4:110-3.
[18] Hassan Niknejad1, Habibollah Peirovi1, Masoumeh Jorjani1, Abolhassan Ahmadiani, Jalal Ghanavi, Alexander M. Seifalian. Properties of the amniotic membrane for potential use in tissue engineering. European Cells and Materials. 2008; 15:88 - 99.

International Journal of Innovation and Scientific Research ISSN 2351-8014 Vol. 7 No. 1 Aug. 2014, pp. 63-68 © 2014 Innovative Space of Scientific Research Journals http://www.ijisr.issr-journals.org/
Corresponding Author: Soumaya Mejbri 63
L’importance des clusters dans l’attractivité territoriale
[ The importance of clusters in the territorial attractiveness ]
Soumaya Mejbri and Ahlem Soualhia
Faculté de sciences économiques et de gestion Sfax, Tunisia
Copyright © 2014 ISSR Journals. This is an open access article distributed under the Creative Commons Attribution License, which permits unrestricted use, distribution, and reproduction in any medium, provided the original work is properly cited.
ABSTRACT: The cluster can take a variety of forms and unique dimensions: geographic scope, social distance, nature of relationships, types of actors, sense of belonging to the cluster, level of technology, life cycle ... Based on the diamond of Porter, we tried to place the clusters in relation to industrial districts and clusters.
KEYWORDS: Cluster, industrial district, Technopark.
RESUME: Le cluster peut prendre une grande variété de formes et des dimensions singulières : étendue géographique,
distance sociale, nature des relations, types d’acteurs, conscience d’appartenance au cluster, niveau de technologie, cycle de vie…En se basant sur le diamant du Porter, nous avons essayé de positionner les clusters par rapport aux districts industriels et pôles de compétitivité.
MOTS-CLEFS: Cluster, district industriel, technopôle, pôle de compétitivité.
1 INTRODUCTION
Depuis quelques années, les démarches de clusters font l’objet d’un fort engouement académique et politique. Le terme « cluster » est à la mode et le concept séduisant. En effet, dans un contexte de compétition intense entre pays et régions, on assiste à une remise en cause du positionnement concurrentiel des territoires qui doivent s’adapter à une mondialisation porteuse d’opportunités et d’incertitudes. Dans ce cadre, nous intéressant à apporter des réponses à ces questions :
C’est quoi un Cluster? En quoi un cluster se différencie-t-il d'un district industriel ? En vertu de quoi un technopôle garde-t-il son statut ou se transforme-t-il en pôle de compétitivité ? Existe-t-il une hiérarchie entre ces formes de territoire?
2 DEFINITIONS
La concentration géographique d'entreprises dans des clusters s'explique avant tout par les économies externes d'agglomération dont elles bénéficient. L’explication de ces phénomènes est ancienne puisque l’économiste anglais Alfred Marshall en 1890 stipule que: « Généralement l'agrégation d'un grand nombre de petits ateliers, comme la création de quelques grandes usines, permet d'atteindre les avantages de production à grande échelle (...) Il est possible de couper le processus de production en plusieurs segments, chacun pouvant être réalisé avec le maximum d'économies dans un petit établissement formant ainsi un district composé d'un nombre important de petits établissements semblables spécialisés pour réaliser une étape particulière du processus de production ».

L’importance des clusters dans l’attractivité territoriale
ISSN : 2351-8014 Vol. 7 No. 1, Aug. 2014 64
La notion de « district industriel » a été reprise un siècle plus tard, en 1979, par Becattini qui a définit le district industriel comme une « entité socio-territoriale caractérisée par la présence active d’une communauté de personnes et d’une population d’entreprises dans un espace géographique et historique donné ».
Réactualisés par Michael Porter professeur à la Harvard Business School, en 1990 qui a popularisé la description des phénomènes d’agglomération d’entreprises, et le concept de cluster en particulier, en le définissant comme: « une concentration géographique d'entreprises liées entre elles, de fournisseurs spécialisés, de prestataires de services, de firmes d'industries connexes et d'institutions associées (universités, agences de normalisation ou organisations professionnelles, par exemple) dans un domaine particulier, qui s'affrontent et coopèrent ».
Un cluster désigne une Concentration géographique de firmes en compétition, complémentaires ou interdépendantes présentant un besoin commun de talent, de technologie, et d’infrastructure ainsi que des capacités d’évolution en réponse à l’évolution des industries elles-mêmes ou des conditions externes. C’est un système centré sur les firmes qui commercialisent en dehors du territoire (local, régional, voire national). Aussi c’est un système moteur de l’économie locale, régionale ou nationale. Les clusters ont pour objectifs d’améliorer la compétitivité des entreprises grâce à la coopération, se concentrer sur les défis stratégiques compétitifs qui ne peuvent être abordés par des actions individuelles menées par les entreprises, les clusters, serveurs du réseau fonctionnent comme catalyseur qui tente d’intensifier la quantité et la vitesse de la communication et de l’interaction entre les membres. Ainsi, pour mieux comprendre le concept du cluster, nous allons nous appuyer sur le Diamant de Porter :
Figure1 : Diamant de Porter 2004
Le Diamant de Porter comporte :
• Les conditions relatives aux facteurs qui incluent les facteurs de production utilisés par les entreprises du cluster: la main d'œuvre, notamment scientifique et technique (dans les disciplines du cluster); le capital (pour les différentes étapes de financement des entreprises); les infrastructures (équipement, administration, information, centres de recherche); les ressources naturelles ;
• Les stratégies de firmes et concurrence qui doit être sain et stable, encourager l’investissement, l’innovation et la concurrence
• Les conditions relatives à la demande désigne un marché local de qualité, et en quantité suffisante (« demand conditions ») : des consommateurs connaisseurs, exigeants pour les produits du cluster, permettant d’anticiper les demandes extérieures, et poussant les entreprises à avoir toujours plus d’innovation et de qualité ;
• Les industries complémentaires favorables : Un tissu local riche de fournisseurs et d'industries connexes ou d’assistance (« related and supporting industries »).
La proximité et les liens, qu’ils soient verticaux (liens clients-fournisseurs par exemple) ou horizontaux (produits et services complémentaires, utilisations de ressources, de technologies semblables) impliquent des relations sociales qui bénéficient aux entreprises concernées. Aussi le cluster peut-il se comprendre comme « une forme de réseau qui se produit dans une localisation donnée, où la proximité d’entreprises et d’institutions assure certains éléments communs et améliore
Stratégies de firmes et concurrence
Conditions relatives à la demande
Industries Complémentaires
favorables
Conditions relatives aux facteurs
Hasard
Gouvernance

Soumaya Mejbri and Ahlem Soualhia
ISSN : 2351-8014 Vol. 7 No. 1, Aug. 2014 65
la fréquence et l’impact des interactions »; autrement dit, comme une forme d’organisation en réseau du territoire, mettant l’accent sur des liens dans un lieu.
Les interactions entre les quatre éléments du « diamant » sont plus intenses quand les entreprises d’un même secteur sont concentrées géographiquement: ainsi la nature systémique du diamant compétitif et la nécessaire intensification des interactions entre ces quatre facteurs interdépendants conduisent à la concentration de firmes concurrentes et au développement d’un cluster. Le cluster peut alors être considéré comme la manifestation spatiale du diamant compétitif, voir son produit. M. Porter décrit les liens étroits entre la compétitivité des entreprises et leur appartenance à un cluster: les entreprises du cluster bénéficient d’un environnement local de firmes concurrentes, de ressources spécialisées et d’institutions qui encouragent les transferts de connaissance, stimulent leur compétitivité. Le cluster est ainsi considéré comme un système qui se « renforce de l’intérieur », qui produit de la richesse de manière endogène. Les quatre éléments du diamant compétitif, réunis dans un même cluster, auraient un triple effet bénéfique en accroissant à la fois la productivité, l'innovation et l'entrepreneuriat. Le cluster est souvent investi comme une solution aux problèmes d’innovation, de compétitivité et d’attractivité du territoire. Les acteurs locaux peuvent contribuer à améliorer l’environnement du cluster en facilitant par exemple la présence d'institutions (centres de recherche, de formation, universités, incubateurs, chambres de commerce...), d’associations (groupements locaux d’employeurs, agences de développement économique, fédérations professionnelles...), ou en renforçant la dotation en infrastructures matérielles (pépinières, hôtels d’entreprises) ou financières (capital-risque).
3 PÔLE DE COMPETITIVITE/ COMPETENCE
À ce niveau plusieurs questions se posent. Ainsi pour mieux cerner le concept du cluster, on doit savoir qu’appelle t-on par pôle de compétitivité? Quels sont ses types? Quelle différence existe t-il entre un cluster et un pôle de compétitivité? Quelle relation? Comment les centres de recherche, les pépinières, les incubateurs améliorent ils l’environnement du cluster??
3.1 PÔLES DE COMPÉTENCE
Ils sont concentrés dans un cluster « industriel », appuyés sur des plates-formes technologiques associant des établissements d’enseignement, et reconnus comme attractifs grâce au savoir-faire agrégé.
3.2 PÔLES DE COMPÉTITIVITÉ ET CLUSTERS (DANS LEUR ACCEPTION INTERNATIONALE)
Figure2 : Pôle de compétitivité
Source: THEMA - UMR 6049. Sophie Carel-Bergeon. 2005
Unis autour de 3 priorités: • Projets communs innovants • Démarche partenariale • Visibilité internationale
Entreprises
Unités de recherche publiques ou privées Centre de
formation

L’importance des clusters dans l’attractivité territoriale
ISSN : 2351-8014 Vol. 7 No. 1, Aug. 2014 66
Ils associent non seulement les entreprises entre elles, mais relient celles-ci à la formation, à l’enseignement supérieur et à la recherche dans une logique d’innovation. L’association sur un territoire donné d’entreprises, de centre de recherche et d’organismes de formation, engagés dans une stratégie commune de développement, destinée à dégager des synergies sur des projets innovants conduits en direction d’un (ou de) marché (s) donné(s).
Tableau1: Comparaison entre la politique des Clusters et des Pôles de Compétivité
Clusters Pôles
Réseautage d’entreprises et actions liées: mise en commun de ressources….
Coordination des acteurs et des politiques: R&D, investissements, formation.
Génération spontanée Appels à projets dans 5 domaines prédéfinis
Pilotage= Entreprises, surtout PME Pilotage= Entreprise+ Universités
Financement public= Animation Financement public= Projets collaboratifs Source: V.Lepage, 18-05-06
3.3 PÔLE DE COMPETITIVITE
Les pôles de compétences de l’axe management des technologies et dynamiques des organisations ont été crées pour tisser des liens étroits entre les chercheurs et les professionnels dans le domaine de gestion. Ces pôles de compétences poursuivent trois objectifs de valoriser la recherche scientifique, mutualiser les connaissances et favoriser le transfert des compétences
3.4 TYPES DE PÔLES
Les pôles reposant sur des savoir-faire traditionnels: Certains pôles de compétence n'ont pas de rapport direct avec la recherche scientifique mais ont maintenu leur avance en savoir-faire au cours des âges : par exemple la Suisse pour l‘horlogerie, Paris pour la haute couture et plus largement pour l'industrie du luxe en général ou Londres pour la finance.
Les pôles reposant sur la recherche scientifique de haut niveau (technopôles): Selon la loi tunisienne n°2001-50 du 3 mai 2001 relative aux entreprises des pôles technologiques telle que modifiée et complétée par la loi n°2006-37 du 12 juin 2006: « L’espace ou l’ensemble des espaces intégrés et aménagés pour accueillir des activités dans le domaine de la formation et la recherche scientifique et technologique, d’une part, et les domaines de la production et du développement technologique d’autre part, dans une spécialité déterminée ou un ensemble de spécialités, en vue de promouvoir la capacité concurrentielle de l’économie et de développer ses composantes technologiques, et ce, par l’encouragement des innovations technologiques et le soutien de la complémentarité et l’intégration entre ces activités dans le cadre des priorités nationales ». Ils sont capables de gérer les projets innovants, dans les domaines liés aux priorités nationales et aux besoins du monde économique. Ils sont innovants par la valorisation des résultats de la recherche dont les activités sont basées sur la Recherche-Développement et l’Innovation Technologique en particulier pour les diplômés de l’enseignement supérieur. Les objectifs de ce pôle sont de développer des compétences de haut niveau, favoriser la recherche scientifique, promouvoir l’innovation technologique, favoriser l'incubation et la création d'entreprises, promouvoir les projets innovants à haute valeur ajoutée, polariser les entreprises économiques, stimuler la création d'emplois, améliorer la capacité compétitive de l’entreprise tunisienne, promouvoir le partenariat public – privé, favoriser l’investissement direct étranger.
Donc un technopôle nécessite l’union des plusieurs facteurs: Ainsi on doit définir qu’est ce qu’un centre de recherche? Qu’est qu’on veut dire par valorisation des résultats? Et qu’est ce qu’on entend par pépinière?

Soumaya Mejbri and Ahlem Soualhia
ISSN : 2351-8014 Vol. 7 No. 1, Aug. 2014 67
CENTRE DE RECHERCHE: Le centre de recherche regroupe diverses catégories de chercheurs qui, dans une perspective de formation d’étudiants, travaillent de façon concertée à la réalisation d’un programme de recherche. Un centre de recherche comme son nom l'indique est «un lieu où, une entreprise, une société ou même l'Etat, regroupe et mobilise les forces dont il (elle) dispose en vue de mieux les exploiter».
CENTRE DE RECHERCHE EN TUNISIE: Sous la tutelle du Ministère de la Culture et de la Sauvegarde du Patrimoine ; étude et préservation du patrimoine archéologique ; bibliothèque et archives archéologiques et photographiques ; Organise des séminaires, dont certains peuvent toucher à la période médiévale. Publication d’une série histoire et la Revue Tunisienne de Sciences Sociales. La fondation privée basée à Tunis, elle développe des recherches principalement sur l’époque ottomane et les morisques, organise des séminaires et colloques, et publie la Revue d’Histoire Maghrebine et l’Arab Historical Review For Ottoman Studies.
VALORISATION DES RESULTATS de la recherche: « La valorisation de la recherche universitaire peut être définie comme l’ensemble des activités ayant pour but d’augmenter la valeur des résultats de la recherche et, plus généralement, de mettre en valeur les connaissances. La valorisation ne se résume pas uniquement à l’exploitation commerciale des résultats de la recherche : elle s’appuie également sur le déploiement et l’échange des connaissances dans tous les domaines du savoir.» ou « La valorisation des résultats de la recherche est le processus mis en œuvre pour que la recherche universitaire ait un réel impact économique et débouche, directement ou indirectement, sur des produits ou des procédés nouveaux ou améliorés exploités par des entreprises existantes ou créées à cet effet.» Bien que ces définitions décrivent la même activité, il faut remarquer une différence importante les séparant ; alors que la première met l’emphase sur la valorisation en tant qu’activité, la deuxième souligne l’importance des résultats qu’elle peut engendrer. La complémentarité est assez éclairante pour la compréhension du sujet .On peut effectivement distinguer deux types de valorisation :
• La valorisation financière, de type commercial qui correspond uniquement aux activités de commercialisation et de transfert.
• La valorisation sociale, de type non marchande qui concerne le développement de solutions ou d’applications, émanant de la recherche, dans le but de résoudre un problème social défini.
LES PEPINIERE D’ENTREPRISE: Chaque pépinière a ses propres critères pour sélectionner les entreprises hébergées. Généralement ce sont les activités intellectuelles de conception, les fabrications high-tech sans nuisances, les activités dans les nouvelles techniques d'information et de communication, etc. C’est une structure d'accueil, d'hébergement, d'accompagnement et d'appui aux porteurs de projets et créateurs d'entreprises offrant pour une période limitée à 48 mois un suivi de la création jusqu'au développement de l'entreprise et à son insertion dans le tissu économique. Elle se différencie des couveuses ou incubateurs d'entreprises qui apportent un support principalement avant la naissance de l'entreprise. Le directeur de la pépinière constitue un véritable homme-ressources à la disposition des locataires pour

L’importance des clusters dans l’attractivité territoriale
ISSN : 2351-8014 Vol. 7 No. 1, Aug. 2014 68
les aider à résoudre leurs problèmes de nouvelles entreprises. Les pépinières peuvent être de différents types: Pépinières de type généraliste, Pépinières de haute technologie ou innovantes, Pépinières artisanales, Pépinières thématiques
LES BONNES PRATIQUES: Ainsi, pour réussir un cluster on doit recourir au bonne pratique qui désigne que dans un milieu professionnel donné, un ensemble de comportements qui font consensus et qui sont considérés comme indispensables, qu'on peut trouver sous forme de guides de bonnes pratiques (GBP). Ces guides sont conçus par les filières ou par les autorités. Ils peuvent se limiter aux obligations légales, ou les dépasser. Comme les chartes, ils ne sont généralement pas opposables. Ils ne sont pas toujours publics, ni toujours gratuits ou accessibles en ligne pour le consommateur. Ils sont souvent établis dans le cadre d'une démarche qualité par les filières.
4 CONCLUSION
Le cluster peut prendre une grande variété de formes et des dimensions singulières : étendue géographique, distance sociale, nature des relations, types d’acteurs, conscience d’appartenance au cluster, niveau de technologie, cycle de vie… Il est utilisé aussi bien pour organiser le développement économique local, analyser empiriquement des régions que pour permettre des développements théoriques sur l’emploi, la croissance et la productivité. Le mot a été utilisé à des fins différentes par de nombreux auteurs (des économistes géographes aux hommes politiques) s’adressant à des publics différents.
Ainsi, le fait de s’entendre théoriquement sur une seule définition du terme cluster est donc presque impossible.
Les exemples de clusters sont multiples à travers le monde. La Norvège dispose, à titre d’exemple, du cluster le plus performant du monde à Oslo, spécialisé dans le domaine maritime et qui emploie 80.000 personnes.
Aujourd’hui, le défi principal pour un pays tel la Tunisie est de redoubler d’efforts pour rester dans la course vers la compétitivité tant requise par ce processus d’ouverture. Il s’agit de consolider les acquis mais également de poursuivre sur la voie de l’efficience. « Pour la Tunisie, la mise en place de clusters servira indubitablement à renforcer la compétitivité des sociétés et lui offrira des avantages distinctifs importants »
Les pôles “Solutions Communicantes Sécurisées” (SCS) et “Mer PACA signaient en 2006 un protocole d’accord de coopération avec les technopôles tunisiens d’El ghazala, de Sfax et de Sousse, regroupés au sein d'un consortium tunisien des TIC. Il encourage la conquête de marchés tunisiens et périphériques. C’est un accord gagnant-gagnant.
REMERCIEMENTS
Au Seigneur, qui nous accorde santé et protection, et nous comble de ses bénédictions tous les jours de notre vie. A feu mon père, ma mère et mes sœurs qui ont toujours été présent pour moi, qui ont su m’offrir le support moral indispensable à la réalisation de ce travail et à qui je dédie ce travail. A monsieur Lassâad Mezghani, pour leurs conseils avisés.
REFERENCES
[1] B. Mérenne-Schoumaker. (2007). De la compétitivité à la compétence des territoires. Comment promouvoir le développement économique ?, Exposé de synthès, Rennes.
[2] PORTER M. (1990). The competitive Advantage of Nations. Harvard Business Review. March-April. [3] ROUSSEAU C., MULKAY B. (2006). Attractivité économique et compétitivité des territoires, Insee, Paris. [4] SCHMIDT E., JUNGERS C. (2004). Territoires, pôles de compétitivité et intelligence économique. Aide-mémoire,
Compagnie Européenne d’Intelligence Stratégique (CEIS), Paris. [5] http://www.auto-entrepreneur.fr/pepinieres-entreprises.php http://www.casorsay.canalblog.com [6] http://www.clustertweed.be [7] http://www.elgazalacom.nat.tn [8] http://www.google.com [9] http://www.mes.tn/technopole/definition.htm [10] http://www.vedalis.com

International Journal of Innovation and Scientific Research ISSN 2351-8014 Vol. 7 No. 1 Aug. 2014, pp. 69-77 © 2014 Innovative Space of Scientific Research Journals http://www.ijisr.issr-journals.org/
Corresponding Author: S.M. Msuya 69
Effect of Anthropogenic Activities in Dry Miombo Woodlands on Wood Stock and Tree Diversity: A Case of Chenene Forest Reserve, Bahi, Tanzania
J.B. Nkonoki and S.M. Msuya
Institute of Rural Development Planning, Dodoma, Tanzania
Copyright © 2014 ISSR Journals. This is an open access article distributed under the Creative Commons Attribution License, which permits unrestricted use, distribution, and reproduction in any medium, provided the original work is properly cited.
ABSTRACT: This study assessed Woodstock, species richness, tree diversity and Importance Value Index (IVI) of Chenene
Forest Reserve (CFR). Forest inventory carried out in 120 systematically selected sample plots. The forest was post stratified into disturbed and undisturbed strata. The information recorded includes: diameter at breast height, species name, Geographical Positioning System (GPS) readings, and frequency of the species. Indicators of human activities such as charcoal kilns, pitsawing, burnt area and grazing signs. Analysis of the inventory data was done using Microsoft Excel. The inventory carried out in 2011 revealed that average number of stems per hectare (N), basal areas per hectare G (m
2ha
-1), and volume
per hectare V (m3ha
-1) as 352 35.20 (SE), 6.84 0.68 (SE) and 44.68 4.47 (SE) respectively. The parameters between
disturbed and undisturbed strata in this study revealed low parameters in disturbed stratum as compared to undisturbed strata were 567± 87.37 stems ha
-1, Basal area 11.21± 1.10m
2ha
-1 and volume 71.21± 7.00 m
3ha
-1 in undisturbed forest
stratum and 246± 15.00 stems ha-1
, Basal area 3.25±0.20 m2ha
-1 and volume 17.92 ± 1.00 m
3ha
-1. The study identified 95
species and the Shannon- Index of 4.17. The study concludes that CFR is potential for having high tree diversity and is fairly stocked to provide products and services to the surrounding communities. The study recommends starting Joint Forest Management (JFM), Preparation of management plans and good governance in the management of CFR.
KEYWORDS: Anthropogenic; Woodstock; Tree Diversity; Miombo Woodland.
1 INTRODUCTION
Tanzania’s forests and woodlands cover about 33.4 million hectares (ha) of the total land area which is about 38% of the total land area of 88.6 million ha (FAO, 2010). These forests and woodlands support the livelihoods of 87% of the poor populations who live in rural areas (CIFOR, 2004). Of the total forest area, about 13 million hectares cover reserved land in which there are 621 forest reserves and village land forest reserves of varying size from 3.0 to 580,000 ha (MNRT, 2005). Forest reserves are managed for protection, production or both and they may be under the jurisdiction of central government, local government, community and individual (URT, 1998).
Miombo Woodland is the most extensive vegetation type in Africa, covering an estimated 2.7 million km2 in regions
receiving greater than 700 mm mean annual rainfall on nutrient poor soils (Campbell, 1996). Miombo Woodlands is distinguished from other African savanna, woodland and forest formation by the dominance of tree species in the family Fabaceae sub-family Caesalpinioideae, particularly in the genera Brachystegia, Julbernadia and Isorbelinia (Frost, 1996). These genera are seldom found outside Miombo. Although this dominance by Caesalpinionideae is characteristic their contribution to numbers and Woodstock varies extensively within and between communities (Frost, 1996). What factors favour this dominance is an interesting but as yet largely unanswered question, though the wide spread occurrence of ectomycorrhizae in their root may enable them to exploit porous, infertile soils more efficiently than groups lacking ectomycorrhizae (Högberg and Nylund, 1981). The Woodstock and species composition structure of Miombo Woodlands appear superficially to be relatively uniform over large regions, suggesting a broad similarity in key environmental conditions. Woody plants comprise 95 – 98% of above ground biomass of undisturbed stands; grasses and herbs make up the remainder (Chidumayo, 1993). The woodlands typically comprise an upper canopy of umbrella shaped trees; a scattered layer, often

Effect of Anthropogenic Activities in Dry Miombo Woodlands on Wood Stock and Tree Diversity: A Case of Chenene Forest Reserve, Bahi, Tanzania
ISSN : 2351-8014 Vol. 7 No. 1, Aug. 2014 70
absent, of sub-canopy tree; a discontinuous understorey of shrubs and saplings; and a patchy layer of grasses (Campbell, 1966). The uniformity in appearance is due in part to the remarkably similar physiognomy of the dominant canopy trees, no doubt a reflection of their origins in the Caesalpinioideae. Differences in Woodstock and species composition and diversity are more apparent at lock scale. The origin of these differences is under: geomorphic evolution of the landscape (Cole, 1986); edaphic factors, principally soil moisture and soil nutrients (Campbell et al. (1988) and past and present land use and other anthropogenic disturbances (Chidumayo, 1987), have all been implicated. According to Chidumayo (1989) anthropogenic activities play a big role in the dynamics of Miombo Woodlands. The Woodstock and species composition and diversity have been affected in many ways by human beings, and it is believed no part of it remains absent of human influence (WWF – SARPO, 2001). Knowledge of the extent to which Woodstock and tree diversity have been affected is inadequate. This study assessed the Woodstock and tree diversity in Chenene Forest Reserve (CFR). CFR is a central Government owned forest located in Dodoma region Tanzania. Its management was devolved to Bahi District Council in 1992. It is against this background that the area is selected for this study since it is a good representative of forest which its management was devolved to local government in central part of Tanzania and as such it is worth assessing Woodstock and tree diversity under this management regime.
2 MATERIAL AND METHOD
2.1 THE STUDY AREA
Chenene Forest Reserve (CFR) is located in Bahi District, Dodoma Region at latitude 4o to 8
oS and longitude 35
o to 37
oE.
Bahi District is one of the six districts of Dodoma Region. Other districts are Kondoa, Chamwino, Dodoma Municipality, Mpwapwa and Kongwa. The headquarters of the district is located in Bahi ward which is 50 km away from Dodoma Mucipality and located close to the highway linking Singida and Dodoma regions. Bahi district extends between latitude 4
0
and 80 South and between longitude 35
0 and 37
0 East. On the east, the district shares its boarder with Chamwino and
Dodoma Municipal; Kondoa district on the north, Iringa region on the Southwest, and Manyoni District on the West. Their populations and households are in Table 1. The location of CFR is indicated in (Fig. 3).
Table 1: Population and households’ distribution of villages adjacent to CFR, Bahi, Tanzania
Village Population (2002) Population (2008) No. of households (2011)
Mayamaya 3 203 8 812 1 159 Chenene 2 342 6 362 720 Mkondai 1 310 5 240 1 529 Babayu 3 520 8 750 1 580
Source: URT, (2009); Village registers, (2011).

J.B. Nkonoki and S.M. Msuya
ISSN : 2351-8014 Vol. 7 No. 1, Aug. 2014 71
Fig. 1: Location of Chenene Forest Resrve
2.2 DATA COLLECTION
Forest inventory was conducted to determine Woodstock and tree diversity, their distribution and estimate the available stock in the forest reserve. Forest inventory is defined as the procedure for obtaining information on quantity and quality of forest resources and other characteristics of the land on which trees are growing (Malimbwi, 1997). The actual inventory was preceded by a reconnaissance survey which involved layout of transects and plots on the map of forest reserve.
To cover the whole forest reserve area and variations between vegetation cover, systematic sampling design was adopted in this study. Systematic sampling enabled an even distribution of the samples throughout the forest reserve and hence increases the chance of including all vegetation types in the area (Phillip, 1994).
The study adopted sampling intensity of 0.1% which is equivalent to 120 plots. The sample plots were stratified into disturbed and undisturbed strata as shown in Table 2.
Table 2: Distribution of sample plots in the study area
Forest strata No. of plots Plot size (ha) Plot area (ha)
Disturbed forest stratum 60 0.07 4.2
Undisturbed forest stratum 60 0.07 4.2
Total 120 0.07 8.4
Circular shaped plots were adopted because they are easy to use, they reduce edge effects in samples and counting errors during inventory of border trees are minimized. The effects are less on the circle plots than in square and rectangular plots (Krebs, 1989). The sample plot was divided into three areas of 5m, 10m and 15m radius.
The information that was recorded from each sample plot include: diameter at breast height (dbh), tree species name, Geographical System Positioning (GPS) readings, indicators of human activities such as pitsawing, fire signs, charcoal kilns and grazing signs.
2.3 DATA ANALYSIS
For the miombo woodland forest, the total tree volume was calculated using allometric equation developed by Malimbwi et al., (2005). The equation was:

Effect of Anthropogenic Activities in Dry Miombo Woodlands on Wood Stock and Tree Diversity: A Case of Chenene Forest Reserve, Bahi, Tanzania
ISSN : 2351-8014 Vol. 7 No. 1, Aug. 2014 72
V= 0.000011972D3.191672
From the collected data, it was possible to compute other forest stand parameters such as: density, i.e. the number of stems per hectare (N) and Basal area per hectare (G). These parameters are very important in forest management as they provide useful information on forest stocking levels. Tree diversity was determined using the Shannon Wiener index. The knowledge of tree diversity is useful for establishing the influence of human activities and the state of succession and stability in the environment (Misra, 1989). The species diversity increases with the number of species in the community (Krebs, 1989).
s
iii InppH
1
'
Where:
H’=Shannon-Wiener Index
Pi =is the proportion of total sample belonging to the ith species (Nnp ii /
)
ni = the number of individuals of each species.
Forest stock and tree diversity were compared using undisturbed and disturbed strata to reflect the past tree stocking and tree diversity.
Importance Value Index (IVI) was computed as the average of relative basal area, density and frequency. The IVI for a species is a composite of the three ecological parameters i.e. density, frequency and basal area which measure different features and characteristics of a species in its habitat. Ecologically, density, basal area and frequency of a species measure the distribution of a species within the population while basal areas measure the area occupied by the stems of the trees.
3 RESULTS AND DISCUSSION
3.1 FOREST INVENTORY
The inventory carried out in 2011 revealed that average number of stems per hectare (N), basal areas per hectare G
(m2ha
-1), and volume per hectare V (m
3ha
-1) as 352 35.20 (SE), 6.84 0.68 (SE) and 44.68 4.47 (SE) respectively. The
parameters between disturbed and undisturbed strata in this study revealed low parameters in disturbed stratum as compared to undisturbed stratum (Table 3).
Table 3: Parameters between disturbed and undisturbed forest strata in CFR, Bahi, Tanzania
Stand Forest strata t- stat P- value Parameters
Undisturbed Disturbed
N (stems/ha) 567 87.37 246 15.60 4.099 < 0.0001***
G (Basal area/ha) 11.21 1.10 3.25 0.20 5.949 < 0.0001***
V (Volume/ha) 71.21 7.00 17.92 1.00 4.187 0.006*** Shannon’s Index 4.17± 0.41 4.00 ± 0.40 4.136 < 0.0001***
The variation might be attributed by excessive human activities in CFR since the forest was not managed under Joint Forest Management (JFM). The forest management was devolved to local government authority but the type of devolution did not involve the local people in the management of forest. Iddi (2002) highlighted a gap between policy and practice as a result of poor understanding of the responsibilities and benefits of the communities. The author pointed out that this is exacerbated by the dilemma of finding suitable focus for decision making, therefore, if societal needs, resource potential and institutions guiding resource use are not harmonized, the potential exists for negative outcomes on both ecological (resources) and societal aspects emanating from unresolved conflicts.

J.B. Nkonoki and S.M. Msuya
ISSN : 2351-8014 Vol. 7 No. 1, Aug. 2014 73
3.1.1 SPATIAL COMPARISON ON STOCKING, BASAL AREA AND VOLUME IN CFR
STOCKING DISTRIBUTION
The distribution by diameter classes for the disturbed and undisturbed forest strata generally indicated ‘J’ shape DBH distribution (Fig. 2). This was an indication of active regeneration as it is expected for natural forest (Phillip, 1994).
Figure 2: Number of stems ha-1 distribution by diameter classes for disturbed and undisturbed strata for CFR 2011, Bahi, Tanzania.
The average number of stems per hectare for all diameter classes was 567 for undisturbed forest strata and for disturbed forest strata were 246. There was significant difference (p<0.0001) in number of stems per hectare between undisturbed and disturbed forest strata (Table 3). However, the disturbed forest strata had more number of stems per hectare for DBH classes I and II as compared to undisturbed forest strata (Figure 2). This indicates that human activities have negative impact on large diameter classes leaving large number of small diameters in disturbed strata.
Generally, in both undisturbed and disturbed forest strata, more number of trees was found in small diameter classes I and II indicating abundance of young trees which is a characteristic of natural forests (Phillip, 1994). It is also a manifestation of the ecosystem resilience. Such distribution is a common characteristic of natural forest with intimate mixture of trees of all age classes. This provide an indication that the stands were developing and regeneration in the forest reserve was taking place as well as the population structure was stable (Isango, 2007; Chingonikaya, 2010). The tree density reported in this study is within the range as reported by different authors studied in miombo woodlands (Isango, 2007; Chingonikaya, 2010).
BASAL AREA DISTRIBUTION
The average basal area per hectare for all diameter classes was 11.21 m2ha
-1 for undisturbed forest strata, where as for
disturbed strata was 3.25 m2ha
-1. This difference was significant (p<0.0001) (Table 3).
Num
ber
of
stem
s p
er h
ecta
re
0
100
200
300
400
500
600
DBH
CLASS I (0 -5) cm DBH
CLASS II (10 -19) cm DBH
CLASS III ( > 20) cm 0verall
DBH CLASSES
Disturbed strata Undisturbed strata

Effect of Anthropogenic Activities in Dry Miombo Woodlands on Wood Stock and Tree Diversity: A Case of Chenene Forest Reserve, Bahi, Tanzania
ISSN : 2351-8014 Vol. 7 No. 1, Aug. 2014 74
Figure 3: Distribution of basal area per hectare (G) by diameter classes for undisturbed and disturbed strata of year 2011 in CFR, Bahi, Tanzania.
Comparatively undisturbed forest had more average basal area than disturbed forest (Table 3) The reason might be that human activities had caused more removal of some diameter classes especially classes III (>20 cm) in disturbed forest stratum (Figure 3) this might be attributed by chopping down trees during pit sawing, charcoal making, poles for construction and fuelwood.
The basal area reported in this study is within the range as reported by different authors studied in other miombo woodlands. For example Chingonikaya (2010) studied in Mgori Forest Reserve observed that the basal area had a mean of 9.65 to 18.50 m
2ha
-1 while Isango (2004) reports a range of 10 to 14 m
2ha
-1.
3.1.2 VOLUME DISTRIBUTION
The average volume distribution for all diameter classes in the undisturbed forest strata were 71.21 m3ha
-1 while the
distribution for disturbed forest strata were 17.72 m3ha-1
. This difference was significant (p<0.0001). Furthermore, the undisturbed forest strata had more volume per hectare than disturbed forest strata (Table 3) However, the difference of more than 53.29 m
3ha
-1 between means of (undisturbed) and disturbed forest was considerable large and cannot simply be
ignored. The reason might be that human activities had caused more removal of some diameter classes especially classes II and III in disturbed forest stratum (10 – 20cm and > 20 cm) DBH (Figure 4). This may be due to pit sawing, charcoal burning, and poles for construction and fuelwood.
B
asal
are
a p
er h
ecta
re
0
2
4
6
8
10
12
DBH I (5 – 9) cm DBH II (10 -19) cm DBH III (> 20) cm OVERALL
DBH CLASSES
Disturbed strata
Undisturbed strata

J.B. Nkonoki and S.M. Msuya
ISSN : 2351-8014 Vol. 7 No. 1, Aug. 2014 75
Figure 4: Volume per hectare (V) distribution by diameter classes for undisturbed and disturbed strata of year 2011 in CFR, Bahi, Tanzania
Large volume was recorded in large diameter classes for undisturbed forest strata (Figure 4) as had been with basal area. Generally, volume trend was similar to that of basal area whereby small and medium diameter classes had small volume in both strata while large diameter class in undisturbed forest strata had large volume due to their fewer numbers (Figure 4).
3.1.3 SPECIES COMPOSITION AND RICHNESS
Table 4 shows the general characteristics of CFR tree resources. A total of 95 tree species were identified. The species richness (95) of trees observed in this study compares well with miombo woodland forests occurring in other areas. Luoga (2000) enumerated 79 species in Ktulangalo Forest Reserve while Backeus (2006) found 86 species around Ihombwa village. Njana (2008) and Mafupa (2006) found 82 and 46 species in Urumwa Forest Reserve and Igombe River Forest Reserve respectively. The higher the number of species richness in the study area was contributed to the presence of Bubu riverine forest that contributes to growth of many species.
Table 4: Characteristics of tree resources in CFR
Parameters Value
1. Richness (number of species) 95
2. Shannon’s Index 4.17
Krebs (1989) suggests that value of the index usually lies between 1.5 to 3.5, Shannon diversity increases with increase in number of species, in this study, the index is high (4.17) as compared to those found in Kitulangalo miombo forest, Tanzania by Nduwamungu (1996) which were 3.79, 3.56 and 3.26 for all diameter classes respectively. Zahabu (2001) reported Shannon – Index of 3.79 and 3.13 respectively in miombo woodland of Kitulangalo Forest Reserve, Morogoro, Tanzania.
3.1.4 IMPORTANCE VALUE INDEX (IVI)
The Importance Value Index (IVI) provides knowledge on important species of a plant community. Based on IVI Brachystegia boemii was the most dominant species. Followed by Brachystegia speciformis, Vitex doniana, Albizia versicolor, Brachystegia globiflora and Acacia tortilis. Others were Combretum molle; Pterocarpus angolensis, Acacia nilotica and Xeroderris stulmanii (Figure 5) show the distribution of important tree species in the woodland.
0
10
20
30
40
50
60
70
80
DBH CLASS I (5 -9) cm DBH CLASS II (10 – 19) cm DBH CLASS III ( > 20) cm OVERALL
DBH CLASSES
Disturbed strata Undisturbed strata

Effect of Anthropogenic Activities in Dry Miombo Woodlands on Wood Stock and Tree Diversity: A Case of Chenene Forest Reserve, Bahi, Tanzania
ISSN : 2351-8014 Vol. 7 No. 1, Aug. 2014 76
Figure 5: Species richness according to IVI in CFR, Bahi, Tanzania.
The results disclose that, the most important species in the scale of Shannon Wierner Index of Diversity. The IVI rank species in a way to give an indication on which species come out as important element of the miombo trees (Munishi et al., 2008).
4 CONCLUSION
The study revealed that CFR has a reasonably good woodstock and tree species composition and richness. The Woodstock in undisturbed (intact) strata forest were high (71.21 m
3/ha) as compared to disturbed forest strata (17.92 m
3/ha). Species
noted to be dominant include: Brachystegia boemii, Brachystegia speciformis, Vitex doniana, Brachystegia longifolia, Combretum molle, Pterocarpus angolensis, Acacia nilotic and Xeroderris stulmanii.
However, species richness for some timber tree species such as Pterocarpus angolensis, Dalbegia melanoxylon, Albizia versicolor and Brachystegia boemii were found in undisturbed forest strata due to over exploitation. The harvesting involves charcoal making, poles cutting (milunda), pitsawing and fuelwood. This indicates a sign of human activities which can lead to unsustainable supply of forest products and services and hence poor provision of livelihoods to the surrounding communities.
5 RECOMMENDATIONS
The study recommends preparation of management plans and promotion of good governance in management of CFR. Fuelwood, poles harvesting (milunda), charcoal making and pit sawing could have a contribution to deforestation in disturbed forest stratum. Similarly, state forests that cover large area of forests have experienced significant deforestation due to human pressure, lack of enforcement and weakness of institutions to tackle the deforestation problem.
Policy implications entail forest management and institutional interventions against inappropriate use: illegal logging, charcoal making, forest fires and overgrazing human activities. Simultaneously, poverty issues need to be tackled by providing more suitable ways of living to rural people that currently rely heavily on forests. Forest reserve areas should be associated with in depth analysis of socio-economic situation of villages that are close to them and potentially rely heavily on forests for grazing and other forest resources.
Finally, the study demonstrates the importance of CFR as dry miombo woodland which could be otherwise neglected.
REFERENCES
[1] Campbell, B.M. (1996). The Miombo in Transition: Woodlands and Welfare in Africa. Bogar. Indonesia: Centre for Forestry International Research (CIFOR).
[2] Campbell, B.M., Swift, M.J., Hatton, J., Frost, P.G.H. (1988). Small scale vegetation pattern and nutrient recycling in Miombo Woodland. In: J.T.A, Verhoeven., G.W, Heil., M.J.A, Wenger (Eds.): Vegetation Structure in Relation to Carbon and Nutrient Economy
[3] CIFOR, (2004). Making dry forests work for the poor in Africa-Bulding on success. CIFOR Livelihoods Brief No. 3. 15pp.
0
5
10
15
20
25
30
35
40
Brach
ystegia
boe
mii
Brach
ystegi
spec
iform
is
Vitex do
niana
Albizia
versico
lor
Brach
ystegia
glob
iflora
Acaia to
rtilis
Brach
ystegia
long
ifolia
Combr
etum
molle
Pteroca
rpus
ang
olens
is
Xerod
erris
stulm
annii
Species
% Im
porta
nt V
alue
Inde
x

J.B. Nkonoki and S.M. Msuya
ISSN : 2351-8014 Vol. 7 No. 1, Aug. 2014 77
[4] Chidumayo, E.N. (1989). Land use, deforestation and reforestation in the Zambian Cpperbelt. Land Use Degradation and Rehabilitation, 1: 209 – 216
[5] Chidumayo, E.N. (1993). Silvicultural characteristics and management of Miombo Woodland. Paper Presented in the Conference on International Symposium on Ecology and Management of Indigeneous Forest in Southern Africa, Victoria Fall Zimbabwe, July 27 – 29, 1992
[6] Cole, M. (1986). The Savanna: Biogeography and Geobotany. London Academics Press. [7] FAO, (2010). Global Forest Resource Assessment (FRA 2010), Country Report, Forestry Department, Food and
Agricultural Organization of the United Nations, Rome. 56pp. [8] Frost, P. (1996). The Ecology of Miombo Woodlands. In: B. Campbell (ed.): The Miombo in Transition: Woodland and
Welfare in Africa. Bogar, Indonesia: Centre for International Forestry Research (CIFOR). [9] Högberg, P. and Nylund, J.E. (1981). Ectomycorrhizae in Coastal miombo woodland of Tanzania. Plant and Soil, 63: 283 -
289 [10] Iddi, S. (2002). Community Participation in Forest Managemant in the Republic of Tanzania. Procceedings of Second
International Workshop on Participatory Forestry in Africa, defining the way forward: Sustainable Livelihoods and Sustainable Forest Managementthrough Participatory Forestry, 18 – 22 February 2002, Arusha, Tanzania. 59 – 67pp.
[11] Krebs, C.J. (1989). Ecological Methodology. Harper Collins publishers, New York, 654pp. [12] Luoga, E.J. (2000). The Effect of Human Disturbances on Diversity and Dynamics of Eastern Tanzania Miombo
Arborescent Species. PhD. Thesis, Johannesburg: University of Witwaterrand. [13] Mafupa, C.J (2006). Impact of Human Disturbances in Miombo woodlands of Igombe River Forest Reserve, Nzega
District, Tanzania. Dissertation for Award of Msc. Degree at Sokoine University of Agriculture, Tanzania, 84pp. [14] Malimbwi, R.E. (1997). Fundamentals of forest mensuration. Faculty of Forestry and Nature Conservation. Sokoine
University of Agriculture, Morogoro, Tanzania. 85pp. [15] Malimbwi, R.E, and Mugasha, A.G. (2002). Reconnaissance Timber Inventory for Handeni Hill Forest Reserve in Handeni
District, Tanzania. Morogoro Foconsult. [16] Munishi, P.K.T., Phillipina, F, Temu, R.P.C, Pima, N.E. (2008). Tree Species Composition and Local Use in Agricultural
Landscapes of West Usambaras Tanzania. African Journal of Ecology. 46: 66-73. [17] MNRT, (2005). Mpanda district inventory report, executive summary, compiled by. R.E. Malimbwi, D. T. K. Shemwetta,
E. Zahabu, S. P. Kingazi, J. Z. Katani and D. A. Silayo. Forconsult Report, Forestry and Beekeeping Division, Dar es Salaam, Tanzania. 75pp.
[18] Nduwamungu, J. (1996). Tree and Shrub Diversity in miombo woodlands: A Case Study at SUA- Kitulangalo Forest Reserve, Morogoro, Tanzania. Unpublished Msc. Dissertation, SUA, Morogoro, Tanzania. 135pp.
[19] Njana, M.A. (2008). Arborescent Species Diversity and Stocking in Miombo Woodland of Urumwa Forest Reserve and their Contributions to Livelihoods. Tabora, Tanzania. Msc. Dissertation, SUA, Morogoro, Tanzania.
[20] Phillip, M. S. (1994). Measuring Trees and Forests. Second Edition. Cab International University Press Cambridge. 310pp. [21] URT, (1998). The National Forest Policy. United Republic of Tanzania. Ministry of Natural Resources and Tourism, Dar es
Salaam. 59pp. [22] URT, (2009). Bahi District Economic Profile. IRDP/ Bahi District Council. 255pp. [23] Zahabu, E. (2001). Impact of Charcoal Extraction to the Miombo Woodlands: The Case of Kitulangalo area, Tanzania.
Msc. Dissertation, Sokoike University of Agriculture, Morogoro, Tanzania.