International Journal of Management Cases
386
Volume 9 Issue 3/4 International Journal of Management Cases C C C C C C CI I I I I IR R R R R R R R RC C C C C C C C C C C CL L L L L LE E E E E C C C C C Co o o o o on n n n n nf f f f fe e e e e e e er r r r r re e e e en nc c c ce e e e e e e e e C C C C C C C C C Ca a a al l l la a ab b b b r r r r r ri i i i i ia a a a, I It t t t ta a a a a al l ly y y y , A A Ap r r r r ril 2 2 20 00 0 0 0 07 7 7 7 7 7
-
Upload
khangminh22 -
Category
Documents
-
view
2 -
download
0
Transcript of International Journal of Management Cases
Volume 9 Issue 3/4
International Journal of Management Cases
CCCCCCCIIIIIIRRRRRRRRRCCCCCCCCCCCCLLLLLLEEEEE CCCCCCoooooonnnnnnfffffeeeeeeeerrrrrreeeeenncccceeeeeeeeeCCCCCCCCCCaaaallllaaabbbbbrrrrrriiiiiiaaaa, IItttttaaaaaalllyyyyyy, AAAppprrrrril 2220000000777777
EDITORSWestern EuropeProfessor Barry J. DaviesProfessor of Marketing, University of Gloucestershire, [email protected].
The Rest of the WorldProfessor Claudio VignaliArnold Ziff Chair in Retailing, Leeds Metropolitan University, [email protected]
Central EuropeProfessor Tihomir VranesevicThe Graduate School of Economics, The University of [email protected]
EDITORIAL BOARD Dr. David J. Bennett Head of Department, Operations & Information Management Division, Aston Business School, Birmingham, [email protected] Dr. Leo Dana University of Canterbury, New [email protected] Alberto MattiacciProfessor of Retailing and Marketing,The University of Sienna, Italymattiaccialbunisi.itProfessor Mark Dupuis Professor of Marketing, Ecole Superiore de Commerce de Paris, France. Dr. Labros VasiliadisBusiness Academy, Chalkida, [email protected]. Henk J. Gianotten Director, Centre for Retailing Research, Economish Institut voor het Midden en Kleinbedrijf, Netherlands. Dr. Hans-Rüdiger Kaufmann University of Applied Science, [email protected] Dr. Jürgen Polke Associate Dean, University of Applied Science, Vorarlberg, [email protected] Professor Carlo A. Pratesi Professor of Retailing Marketing, University of Urbino, [email protected] Jurica PavicicProfessor of Marketing, University of Zagreb, [email protected] Antonella ReitanoProfessor di Economica & Gestione, Universita di Calabria, [email protected] Brenda Sternquist Professor, International Retail Management, Michigan State University, [email protected] Dr. Tomasz Wisniewski The University of Szczecin [email protected]. Demetris VrontisDean, School of Business Administration, Intercollege, [email protected]
PRODUCTION EDITORGianpaolo [email protected]
www.ijmc.org.uk
ISSN 1741-6264
International Journal of Management Cases is published by:Access Press UK, 1 Hillside Gardens , Darwen, Lancashire, BB3 2NJ Copyright � Access Press UK
Centre for International Research in Consumers Location and their Environments (CIRCLE)
1
I n t e r n a t i o n a l J o u r n a l o f M a n a g e m e n t C a s e s
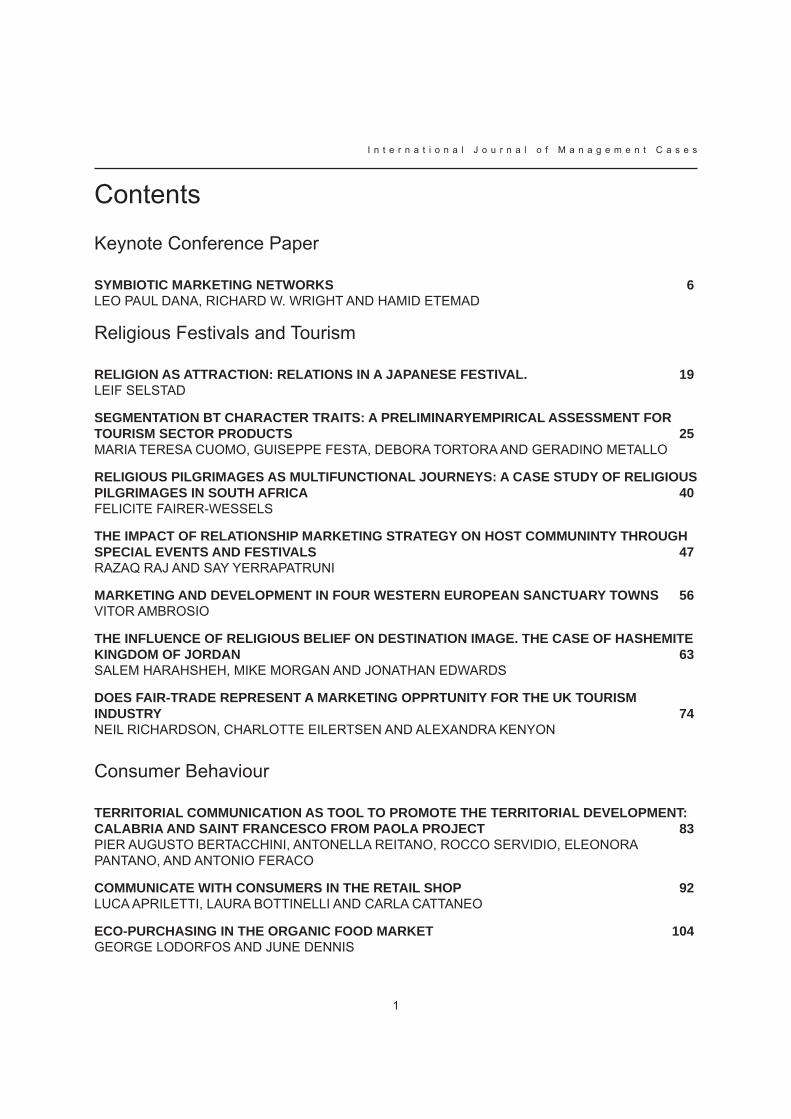
Contents
Keynote Conference Paper
SYMBIOTIC MARKETING NETWORKS 6LEO PAUL DANA, RICHARD W. WRIGHT AND HAMID ETEMAD
Religious Festivals and Tourism
RELIGION AS ATTRACTION: RELATIONS IN A JAPANESE FESTIVAL. 19LEIF SELSTAD
SEGMENTATION BT CHARACTER TRAITS: A PRELIMINARYEMPIRICAL ASSESSMENT FOR TOURISM SECTOR PRODUCTS 25MARIA TERESA CUOMO, GUISEPPE FESTA, DEBORA TORTORA AND GERADINO METALLO
RELIGIOUS PILGRIMAGES AS MULTIFUNCTIONAL JOURNEYS: A CASE STUDY OF RELIGIOUS PILGRIMAGES IN SOUTH AFRICA 40FELICITE FAIRER-WESSELS
THE IMPACT OF RELATIONSHIP MARKETING STRATEGY ON HOST COMMUNINTY THROUGH SPECIAL EVENTS AND FESTIVALS 47RAZAQ RAJ AND SAY YERRAPATRUNI
MARKETING AND DEVELOPMENT IN FOUR WESTERN EUROPEAN SANCTUARY TOWNS 56VITOR AMBROSIO
THE INFLUENCE OF RELIGIOUS BELIEF ON DESTINATION IMAGE. THE CASE OF HASHEMITE KINGDOM OF JORDAN 63SALEM HARAHSHEH, MIKE MORGAN AND JONATHAN EDWARDS
DOES FAIR-TRADE REPRESENT A MARKETING OPPRTUNITY FOR THE UK TOURISM INDUSTRY 74NEIL RICHARDSON, CHARLOTTE EILERTSEN AND ALEXANDRA KENYON
Consumer Behaviour
TERRITORIAL COMMUNICATION AS TOOL TO PROMOTE THE TERRITORIAL DEVELOPMENT: CALABRIA AND SAINT FRANCESCO FROM PAOLA PROJECT 83PIER AUGUSTO BERTACCHINI, ANTONELLA REITANO, ROCCO SERVIDIO, ELEONORA PANTANO, AND ANTONIO FERACO
COMMUNICATE WITH CONSUMERS IN THE RETAIL SHOP 92LUCA APRILETTI, LAURA BOTTINELLI AND CARLA CATTANEO
ECO-PURCHASING IN THE ORGANIC FOOD MARKET 104GEORGE LODORFOS AND JUNE DENNIS
I n t e r n a t i o n a l J o u r n a l o f M a n a g e m e n t C a s e s
2
INFLUENCING FACTORS OF CONSUMERS’ PERCEPTION TOWARDS DELICATESSEN DIFFERENTIATED BY CONSUMERS’ FAVOURITE SHOPPING LOCATIONS 121HANNES WECHNER, HANS RÜDIGER KAUFMANN AND CLAUDIO VIGNALI
BEHAVIOURAL AND NON-BEHAVIOURAL MODELS FORCUSTOMER SATISFACTIONMEASURE 129GABRIELLA MAZZULLA AND LAURA EBOLI
PUBLIC SERVICE CUSTOMER BEHAVIOURCOMPARISON BETWEEN TWO REGIONS: CALABRIA (I) AND SATAKUNTA (FIN) 140ANTONELLA REITANO, ANGELO BRUTTO, ALESSANDRO CALDERONE AND ANTONINO MORANO
NUTRITIONAL TRADE-OFFS – A COMPARATIVE STUDY OF TWO FOODS 156N WINDRUM AND R NELSON
Quality Assurance and Management
QUALITY ASSURANCE FOR THE HOTELS IN TURIN, ITALY 146ANTONELLA CAPRIELLO AND IAN D. ROTHERHAM
SERVICE QUALITY AND TRAINING: A PARADOX 172DR DES MONK AND DANIELLA RYDING
CREATING A CROSS-CULTURAL KNOWLEDGE PUMP 179DOLORES SANCHEZ BENGOA AND HANS RÜDIGER KAUFMANN
STRATEGIC COMMUNICATION RELATED TO ENVIRONMENTAL AND PACKAGING CHALLENGES: CASE OF BEVERAGE AND DAIRY INDUSTRY IN CROATIA 188NIKOLA DRASKOVIC, JURICA PAVICIC AND GORAN VLASIC
QUALITY MANAGEMENT OF FOOD PRODUCTS’ PRIVATE LABELS IN CROATIA 196MAJA MARTINOVIĆ, TIHOMIR VRANEŠEVIĆ AND MIROSLAV MANDIĆ
INTANGIBLES ASSETS IN COMPANY SUCCESSION IN GERMAN SMES 201SUSANNE DURST AND HANS RÜDIGER KAUFMANN
THE RELATIONSHIP BETWEEN THE DESIRED SELF-IMAGES AND THE SELF-MONITORING 212IHN HEE CHUNG, HYE JIN BAE AND HO JUNG CHOO
Marketing and Branding
THE CHANGING MARKETING COMMUNICATIONS MIX – A MEDIA AND MESSAGE FRAMEWORK 225GRAHAM HUGHES AND CHRIS FILL
CAUSE RELATED MARKETING: A RESEARCH PAPER ON ITS VALUE AND EFFECTS FROM THE STAKEHOLDERS’ PERSPECTIVE 233MARLEN MARTOUDI DEMETRIOU
MARKETING ETHICS : AN ISLAMIC AND CHRISTIAN COMPARISON IN CYPRUS 241RIA NICOLETTI MORPHITOU AND PAUL GIBBS

3
I n t e r n a t i o n a l J o u r n a l o f M a n a g e m e n t C a s e s
Innovation and Technology
ON-LINE CHANNELS AND DIRECT MARKETING MEDIA 249STJEPAN DVORSKI, DAMIR DOBRINIĆ AND VLADIMIR KOVŠCA
TECHNOLOGY BROADENS THE GAP BETWEEN PREMIERSHIP FOOTBALL CLUBS 254STEPHEN HENDERSON
RELATIONSHIP MARKETING ON A UNIVERSITY WEBSITES: AN ANALYSIS OF LEEDS METROPOLITAN UNIVERSITY WEBSITE 261TAHIR RASHID
EUROPEAN AIR NAVIGATION SERVICE PROVIDERS AT THE CROSSROADS 270THORSTEN QUENDT, CLAUDIO VIGNALI AND HANS-RÜDIGER KAUFMAN
BRAND EXTENSION STRATEGY 283TIHOMIR VRANEŠEVIĆ, MIROSLAV MANDIĆ AND IRENA PANDŽA
Retailing and Education
EXPLORING SHOPPERTAINMENT: LEEDS CITY CENTRE AND DEVELOPMENTS FOR CONSUMPTION SPACES 297ALEXANDRA KENYON
TITLE: RETAIL BRANDING MODELS IN TAIWANESE RETAIL GROCERY MARKET 305CHING-WEI HO, JOHN TEMPERLEY AND CLAUDIO VIGNALI
THE MARKETING ROLE OF PACKAGING: A REVIEW 315NIKOLA DRASKOVIC
SHOPPING CENTRES IN TOWN VERSUS OUT OF TOWN 324JOHN TEMPERLEY
BEHAVIOURAL BRANDING - THE INTERDISCIPLINARY HILTI CASE 329HANS RUEDIGER KAUFMANN, MARTIN CAJTHAML AND MICHAEL M. MEIER
FOOD CONSUMERS: STIGMATISATION AND THE MANAGEMENT OF COMMUNICATION 335POTTS, M, AND NELSON, R.
CO-BRANDING OR ALLIANCE OF BRANDS 342TIHOMIR VRANEŠEVIĆ, MIROSLAV MANDIĆ AND SANDRA HORVAT
RETAIL SECTOR IN CROATIA: GROWTH FUELED BY MARKETING INNOVATIONS 348MARIJA TOMASEVIC LISANIN AND MIRKO PALIC
THE ROLE OF NONSTORE RETAILING FROM CROATIAN CONSUMERS PERSPECTIVE 360SANDA RENKO AND VESNA BRČIĆ-STIPČEVIĆ,
ENTERING A FOREIGN MARKET WITH A NEW PRODUCT – THE CASE OF A NEW SAKE PRODUCT LAUNCHED IN AUSTRIA BY A SMALL/MEDIUM SIZED COMPANY.THE THEORETICAL APPROACH 369CLAUDIO VIGNALI, GIANPAOLO VIGNALI AND ALBERTO MATTIACCI

I n t e r n a t i o n a l J o u r n a l o f M a n a g e m e n t C a s e s
4
5
I n t e r n a t i o n a l J o u r n a l o f M a n a g e m e n t C a s e s
Subscription Fees2007 subscriptions are available in a number of major currencies. Exchange rates and prices will be held throughout 2007.
Subscription fees per volume are:
$US 280 £Stg 150 $Aus 370
€ 220 SFr 345 ¥ 32,340
Individual journal editions can be purchased at the following prices:
10 Journals @ £15 per journal 20 Journals @ £10 per journal 50 Journals @ £7 per journal
Subscription information is available from the Publishers at:
G Vignali Leeds Metroploitan University School of Tourism, Hospitality and Events Calverly St Civic Quarter Leeds LS1 3HE
Reproduction RightsThe publishers of the International Journal of Management Cases have granted, free of charge, unlimited photocopying and other reproduction rights to subscribers, for teaching and study use within the subscribing organization. Authors may also photocopy or otherwise reproduce their particular case from International Journal of Management Cases, subject to an acknowledgement of publication and copyright details.

6
I n t e r n a t i o n a l J o u r n a l o f M a n a g e m e n t C a s e s
SYMBIOTIC MARKETING NETWORKS
LEO PAUL DANAUNIVERSITY OF CANTERBURY, NEW ZEALAND
RICHARD W. WRIGHTUNIVERSITY OF CANTERBURY, NEW ZEALAND
HAMID ETEMADUNIVERSITY OF CANTERBURY, NEW ZEALAND
Abstract
As the drivers of globalization remove barriers which traditionally segmented the competitive environments of small and large firms, firms of all sizes are beginning to share the same competitive space. Symbiotic arrangements are evolving through which smaller firms enter the value chains of larger firms, to the benefit of both sides. Using a conceptual framework with illustrative examples, this paper explains how smaller firms can use symbiotic, collaborative arrangements with larger firms to overcome inherent constraints of size, and to achieve the efficiencies required for world-class competitiveness.
IntroductionThe global competitive environment is changing dramatically. Competition in international markets was traditionally the realm of large companies, with smaller businesses remaining local or regional. Now, however, drivers of globalization are removing the barriers which segmented the competitive environments of small and large firms. Firms of all sizes are beginning to share the same competitive space (Dana, Etemad & Wright, 1999a, 1999b). As a consequence, it is increasingly difficult for independent, small firms to thrive on their own unless they are globally competitive – whether they enter the global arena or not.
A promising way for small- and medium-sized enterprises (SMEs)[1] to increase their global competitiveness is to form co-operative market relationships with larger, multinational enterprises (MNEs). Such arrangements allow small firms to reach global markets and to achieve economies of scale, by integrating into the supply chains of the larger firms. At the same time, competitive pressures in the global environment are forcing
large firms to reduce costs through greater specialization, which they often achieve by out-sourcing value-added functions to smaller firms. New symbiotic relationships are thus created which allow smaller firms to achieve the expanded reach and efficiencies associated with internationalization more rapidly and effectively than they could on their own. In Western business systems, collaborative arrangements between small firms and large firms have traditionally been transaction-based; in other words, they can be terminated at the will of either (usually the larger) party. The newer arrangements, illustrated in this paper, are characterized instead by interdependence, with each party relying on the other in a sustained, ongoing manner. In a truly symbiotic relationship, neither party can compete effectively without the continued contribution of the other.[2]
This paper examines the growing use of collaborative arrangements by internationalizing small businesses, with an emphasis on networks of small and large firms. It first reviews the literature on small-business networks, and examines the traditional processes of SME internationalization. A conceptual framework is then developed for a better understanding of how inter-firm collaboration can allow SMEs to achieve global market position, and larger firms to gain cost reduction and greater flexibility, through symbiotic relations between the large and the small firms. Illustrative case examples are provided. A concluding section discusses the relevance of such collaboration for marketing managers.
Small-Firm NetworksThere exists a rich literature on networks of small firms. Aldrich and Zimmer (1986) investigated social networks and their impact on self-employment, concluding that networking may

7
I n t e r n a t i o n a l J o u r n a l o f M a n a g e m e n t C a s e s
be an essential requirement for entrepreneurial success. Aldrich, Rosen and Woodward (1987) also found network accessibility to be significant in predicting the success of business start-ups. Other researchers who have found networks to be central to entrepreneurial activity include: Aldrich (1989); Birley (1985); Carsrud, Gaglio and Olm (1986); Dubini and Aldrich (1991); Johannisson (1987); Olm, Carsrud and Alvey (1988); and Shaver and Scott (1991). Evidence of the growing importance of networking in a specifically international context is provided by Dunning (1995) and by Holm, Eriksson and Johanson (1997).
Some researchers have attributed importance to networking among entrepreneurs of similar cultural or ethnic affinities. Aldrich, Jones and McEvoy (1984), for example, focused on networks between immigrant entrepreneurs and their country of origin; while Werbner (1984) examined networking among Pakistani entrepreneurs in the United Kingdom. Aldrich and Zimmer (1986) found ethnic networks in England to be effective, and Boissevain and Grotenbreg (1987) showed that small firms in Amsterdam succeed within a social support network. Finally, Iyer and Shapiro (1999) demonstrated how expatriate ethnic entrepreneurs leverage their membership in local ethnic networks, in the countries to which they had emigrated, to import from their country of ethnic origin. These business people thus infused international activity into the supply and value chains of the social/ethnic networks in both countries.
Here are a few examples of marketing networks among small businesses, from around the world:
Of two million enterprises in Japan, only 1 • per cent are large firms. About 80 per cent of the workforce is employed by chusho kigyo: retail firms with up to 30 employees, wholesalers with up to 100, or others with up to 300 employees or with share capital not exceeding 100 million yen. Yet, Japan is a country in which large size is usually desirable in industrial activity: an old proverb teaches, “When seeking a shelter, look for a big tree.” Applied to entrepreneurs, this philosophy means, “Join a network!” Indeed, rather than competing with large firms, entrepreneurs in Japan cooperate with them, serving as suppliers, assemblers, distributors and service providers in intricate keiretsu network relationships based on shared cultural beliefs of obligation, indebtedness and loyalty.
Similarly, the development of one million small • firms in South Korea – in manufacturing, trading, transportation, construction and services − allows small firms to specialize, and to achieve efficiencies due to scale economies in producing the components which they provide to the huge companies at the center of each chaebol group. This phenomenon has led to an elaborate, mutually-beneficial system of collaboration with a large number of very small firms supplying a small number of very large chaebol firms, which in turn compete globally.
Along similar lines, several large corporations • in France have encouraged qualified employees to quit their jobs in order to establish their own independent firms, which then receive supply contracts from their former employers. Major corporations involved in such schemes include: Alcatel Alsthom, Banque Nationale de Paris, Electricité de France-Gas de France, Hewlett-Packard, the French Post Office, Renault, and Sanofi. This process of rationalization helps the large firms become more efficient, while the newly created ventures gain a platform for growth and indirect internationalization through the large firms. The new ventures remain free to provide services to other large companies, even competitors.
In the Philippines, small-scale entrepreneurs • in the agrifood sector have been linking up into networks with larger firms, and those networks of firms are supplemented in turn by networks of networks. For instance, the Villasis Mango Growers Association is a network of large and small firms. The Federation of Cooperatives for Pangasinan brings together several such networks of mango-growers. In the same region, Ilocos Norte Federation of Agribusiness Cooperatives does the same for vegetables. A similar network is the Christian Farmers Kilusang Bayan for Credit and Allied Services. The networks attain sufficient size and capability to enter international markets and to compete globally, which the small firms alone could not.
Much of the academic literature about small • firm networks has focused on the interaction of small firms with other small firms. The focus of this paper is collaborative networks between small and large firms, which can bring potential competitive benefits to both sides.

8
I n t e r n a t i o n a l J o u r n a l o f M a n a g e m e n t C a s e s
Internationalization of Small Enterprises The classic economic view of internationalization is based on the theory of competitive advantage. Over the years, internationalization has been viewed in various lights; yet it was seldom seen in western countries as a competitive necessity, only as an expansion option. Furthermore, traditional internationalization theories focused mainly on large multinational corporations, and were less pertinent to smaller firms (Dana, Etemad and Wright, 1999a; 199b). Even today, many small firms concentrate on their domestic market, neglecting international opportunities.
Until recently, those who wished to avoid uncertainties and the inherent unknowns of competing in foreign markets, could simply keep their firms small and local, thus refraining from expanding internationally. With the liberalization of trade, however, protective walls have come down. Even small local businesses are threatened by international competitors penetrating formerly protected domestic markets (Etemad, 1999a:91). Their success will rest largely on their ability to become internationally competitive, even if they refrain from competing globally.
In the past, internationalization was usually depicted as a gradual, incremental process. The Uppsala Model (Johanson and Wiedersheim-Paul, 1975) identified four stages of progressive entry into international markets. Similar stage models of internationalization were developed by: Johanson and Vahlne (1977); Bilkey and Tesar (1977); Newbould, Buckley and Thurwell (1978); Cavusgil (1980, 1984); and Bartlett and Ghoshal (1989).
A major problem of the “stages” model is that it assumes a considerable span of time through which a firm can gain experience, accumulate resources, and develop the managerial capabilities required for international operations. Through successively more-involved modes of involvement, small firms internationalize gradually, in a controlled fashion. However, the rapid globalization of markets (Levitt, 1983) and of competition (Ohmae, 1989; 1990) is dramatically reducing that time span, and constraining the ability of small firms to control their own development paths. A variety of circumstances may force small firms to deviate from the stage model. For example, a firm in a vertically integrated industry may have to internationalize immediately in order to reach the scale necessary to survive. When the economics of high startup costs, small
domestic market size, and shortened product life-cycle combine, firms may have no choice but to become “instant internationals” in order to survive (Oviatt and McDougall, 1999; Knight and Cavusgil, 1996). In the contemporary global business environment, time has become a critical strategic weapon (Stalk, 1988; Stalk and Hout, 1990). In such an environment, time-delayed models such as the stages theory do not provide an appropriate scenario for either survival or growth. Smaller firms may have neither the prerequisite resources to internationalize, nor the luxury of unlimited time in which to acquire them. Entrepreneurial behavior cannot follow the gradual and controlled process of conventional stage theories. [3] Coviello and Martin (1999) concluded that small, high-tech firms rarely follow a stepwise approach to internationalization. Jones (1999) showed that the initial cross-border activity of small firms is often importing, rather than exporting, in contrast to the prescription of stage theories.
Small-Large CollaborationsCollaboration between small and large firms is a significant means by which the product of smaller firms can reach global markets more quickly or at lower cost than through independent expansion (Harrison, 1997). Symbiotic collaboration between two or more firms aims to improve the quality of the output by lowering cost, reducing time to market, or improving customer service, to the benefit of all the parties involved. Symbiotic collaboration may occur anywhere in the value chain (e.g., R&D, production, marketing), and it can be housed in a variety of forms.[4] The anchor is the will to work together on an ongoing basis for mutual gain. As a consequence of small firm/large firm collaboration, smaller firms are partially sheltered within their symbiotic networks from the harsh competition ongoing between the larger and more efficient networks.
Bonaccorsi (1992) and Dana and Etemad (1994; 1995), explained how small businesses can rely on large firms for parts of their internationalization activities, fusing elements of international business with small business/entrepreneurship. Through this “scaling up” process, smaller firms can leverage their network resources to shorten the time span and reduce the cost and risk of their internationalization. Similarly, performing specialized functions for large firms allows small firms to hasten their own learning curve, and

9
I n t e r n a t i o n a l J o u r n a l o f M a n a g e m e n t C a s e s
to internalize sufficient expertise to become competitive at the global level.
International marketing, today, increasingly involves symbiotic relationships among large and small firms. Reynolds (1997) noted that the recent expansion of markets has not been associated with an expanded role for larger firms. Instead, smaller firms are filling niche roles (Buckley, 1997). Oviatt and McDougall concluded “the facile use of low-cost communication technology and transportation means that the ability to discover and take advantage of business opportunities in multiple countries is not the preserve of large, mature corporations” (1994, p.46).
Networks of small and large firms can enhance the competitiveness of both types of organizations. By supplying a portion of the high-volume needs of bigger firms, small firms can specialize more, achieving their own production scale economies. As these smaller firms become more competitive, by capturing scale economies not possible without large-firm linkups, the large firms in turn gain competitiveness by integrating those economies into their own value chains. The large firms also gain flexibility and economies of scope by accessing a number of highly specialized small firms, each producing a small range of components at very substantial scale economies. A further benefit to large firms is their enhanced ability to tailor products or processes to fit local demand or content requirements.
In summary, large, established firms increasingly achieve flexibility and efficiency by incorporating smaller businesses, often owned and managed by entrepreneurs, into their supply chains. There is a new symbiosis between large and small business, with the larger firms providing niche opportunities for the smaller firms within their networks. Complementarity may be so great in these new arrangements that neither party can survive without the other. Such interdependent and communitarian relationships (Lodge and Vogel, 1987: 14-18) have long characterized some non-western business systems such as Japan (Wright, 1989), Korea (Dana, 1999) and China (Etemad, 1996), and they may provide a model for North American and European firms today.
Toward an Interdependence ParadigmTraditionally, large firms expanding abroad have preferred wholly owned or majority-owned subsidiaries, mainly because of their desire to retain their independence and to maximize control of their own management policies (Yoshino and Rangan, 1995:9; Gomes-Casseres, 1996:2). Emulating that model, many smaller firms also attempt to expand internationally, using their own brand names and relying on their own resources. Often, however, they find independent international expansion to be costly, risky and, above all, requiring a time span longer than the useful product life cycle of the products or services for which the internationalization is intended. They may opt, as an alternative, to become suppliers to larger, established firms.
The internationalization of Southeast Asian firms is a case in point. Many South Korean firms, for example, first attempted to access international markets independently, using their own resources and brand names. However, they quickly discovered that they lacked the brand recognition and other internal resources required for rapid internationalization. Thus many of them successfully repositioned themselves as original-equipment manufacturer (OEM) suppliers to one or a small number of large, well-established U.S.- and European-based MNEs. The final products were then marketed globally under the brand names of the larger firms. While these relationships enabled the smaller firms to increase their revenues and decrease their costs, these gains were achieved at a cost: excessive dependence on what was often a single, domineering customer. While both the smaller and larger firms became partially dependent on each other, the larger firms could often diversify their supply sources, thus reducing their dependence on the smaller firms. For example, the larger firm could use its stronger bargaining power to preclude the smaller firm from supplying other potential customers. The crucial point here is that both the smaller firms and the larger firms were pursuing separate growth strategies, predicated on their own independence, which were often in conflict with each other. Dependence was not really desired by either side, as it implied loss of control, which was in conflict with their objectives of independent growth.
However, the recent evolution of networking suggests that a relationship of unbalanced dependence may evolve toward a more balanced,

10
I n t e r n a t i o n a l J o u r n a l o f M a n a g e m e n t C a s e s
mutual dependence of the two firms, leading to a relationship of true interdependence, to the mutual advantage of both (Etemad, 1999a:94). Acs and Yeung (1999:63) refer to such relationships “co-dependence.” As an integral part of a network, the smaller firm may be able to specialize further, achieving even greater cost reduction and quality control, with their large customers becoming reciprocally dependent on them. A healthy, mutually beneficial interdependence is then achieved.
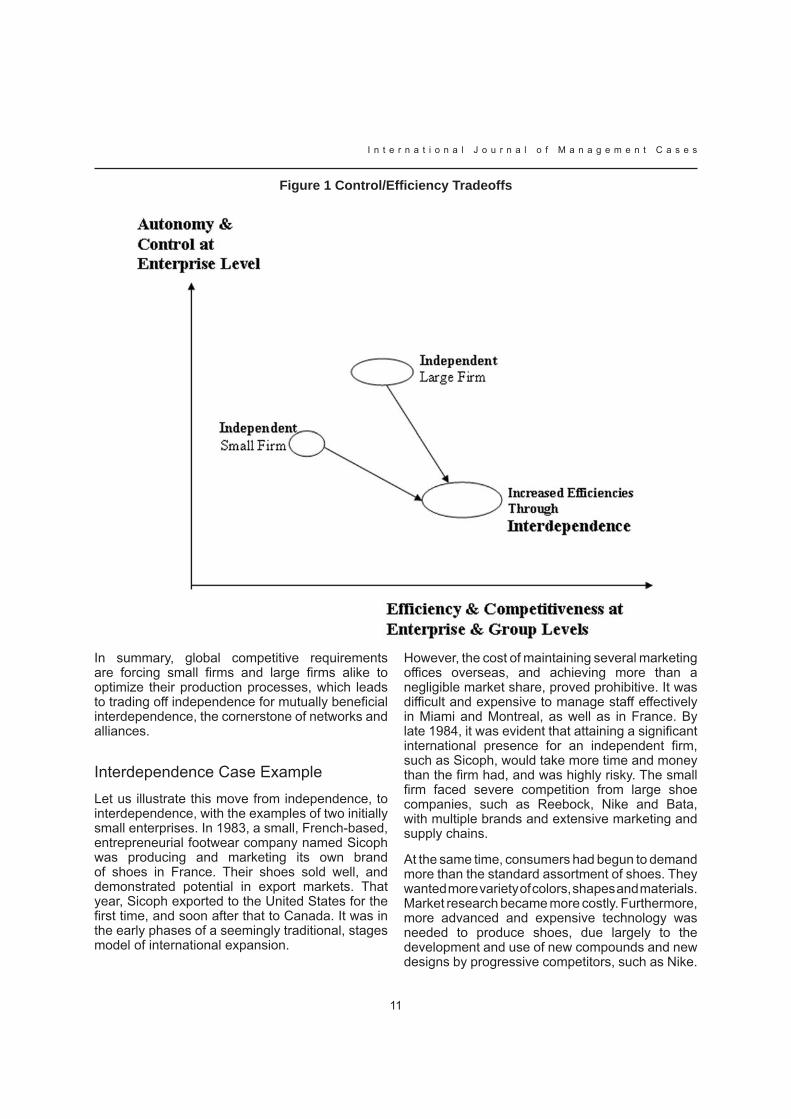
Figure 1 depicts this movement toward the new, interdependence paradigm. The figure shows, for example, that a larger firm may trade off a part of the independent management control associated with its large size, in order to gain flexibility and scale
economies which will enable it to become more efficient, and hence more competitive. Similarly, smaller firms may elect to sacrifice some of their autonomy by integrating into the larger firm’s supply or value chain, in order to achieve the efficiencies needed to achieve world-scale efficiencies. By each trading off some of their independence, both types of firms can optimize their competitiveness and joint, mutually dependent efficiencies.
Table 1 further expands into other potential dimensions of that conceptual framework. It compares the traditional modes of international involvement with the emerging interdependence paradigm on several key dimensions.
TABLE 1: COMPARATIVE CHARACTERISTICS OF OPERATING SYSTEMS PARADIGMS
11
I n t e r n a t i o n a l J o u r n a l o f M a n a g e m e n t C a s e s
Figure 1 Control/Efficiency Tradeoffs
In summary, global competitive requirements are forcing small firms and large firms alike to optimize their production processes, which leads to trading off independence for mutually beneficial interdependence, the cornerstone of networks and alliances.
Interdependence Case Example Let us illustrate this move from independence, to interdependence, with the examples of two initially small enterprises. In 1983, a small, French-based, entrepreneurial footwear company named Sicoph was producing and marketing its own brand of shoes in France. Their shoes sold well, and demonstrated potential in export markets. That year, Sicoph exported to the United States for the first time, and soon after that to Canada. It was in the early phases of a seemingly traditional, stages model of international expansion.
However, the cost of maintaining several marketing offices overseas, and achieving more than a negligible market share, proved prohibitive. It was difficult and expensive to manage staff effectively in Miami and Montreal, as well as in France. By late 1984, it was evident that attaining a significant international presence for an independent firm, such as Sicoph, would take more time and money than the firm had, and was highly risky. The small firm faced severe competition from large shoe companies, such as Reebock, Nike and Bata, with multiple brands and extensive marketing and supply chains.
At the same time, consumers had begun to demand more than the standard assortment of shoes. They wanted more variety of colors, shapes and materials. Market research became more costly. Furthermore, more advanced and expensive technology was needed to produce shoes, due largely to the development and use of new compounds and new designs by progressive competitors, such as Nike.

12
I n t e r n a t i o n a l J o u r n a l o f M a n a g e m e n t C a s e s
Consumers also wanted more models, which meant higher production costs and more inventory and warehousing expenses. It was devastating for a small, independent manufacturer, which did not have a sufficiently large market share to achieve optimal scale operations.
It became obvious that increased specialization would be beneficial, if not necessary, for the survival of the firm. Producing a single model, for a single buyer, would be a more profitable venture. However, this route would lead almost inevitably to dependence on that buyer. In time, it became evident that although independence was no longer sustainable, dependence introduced its own risks, namely loss of control because of the reliance on a single buyer who would likely have access to a number of alternative supply sources. The large buyer could select suppliers through a bidding process, which implied an adversarial, zero-sum competitive system. Each independent firm had to fend for itself, with only the most efficient surviving.
A third alternative for the small firm was to seek interdependence, by becoming even more specialized. Rather than producing only one style of shoe for a single large buyer, it was more attractive to produce only one component of the shoe, for multiple buyers. This approach eliminated the costs to Sicoph of acquiring and maintaining the diverse technologies needed to make all the parts of a shoe. It also allowed the small manufacturer to achieve significant production economies of scale (provided by the large buyers) and it facilitated improvements in quality control by allowing the small firm to focus its efforts on producing one component very well. This change in focus was accomplished at a price attractive to several large potential buyers, none of which could make or purchase the component with such high quality standards at such a low price. The result: a symbiotic relationship resulting from increased specialization for Sicoph, built on interdependence between the small firm and its large customers. Not only did Sicoph benefit, so did the network of similar producers constituting the supply chain of several (now interdependent) brands. Retrospectively, the formation of an interdependent network of small and large firms initiated a new supply structure, and the shift toward a new production paradigm was underway.
Meteoric GrowthAnother example of growth through interdependence is Magna International Inc. Twenty years ago, Magna was a small auto parts manufacturing company in southern Ontario, supplying a local auto assembly plant. Starting from a one-man tool shop in 1957, with sales of only $13,000, Magna signed its first contract with General Motors (GM) to supply auto parts to GM Canada in 1969. The value of that contract was only $10 million. With it came, however, the first part of a strategic shift, from independence to dependence. Magna’s chairman perceived the advantages of switching from an independent operation to relying exclusively on at least one of the big three auto makers, and growing with and through them. In so doing, the management of Magna surrendered a portion of its own managerial prerogatives in order to gain from the discipline and efficiencies that GM demanded. For Magna, those efficiencies materialized through production economies of scale, enabled initially by supplying GM’s Canadian plants, and subsequently its entire North American operations. As Magna gained further efficiencies through ever-larger scale economies, GM became increasingly reliant on Magna for its supply of quality, low-cost parts in what was becoming an increasingly symbiotic relationship. As a supplier of GM, Magna had become highly dependent on GM’s contracts for parts. At the same time, it had also become an integral part of GM’s international production process. While Magna had sacrificed a substantial degree of its independence, it had also gone international without leaving home!
A further shift in Magna’s strategy began to develop in the early 1970s. By formally changing its corporate name to Magna International, the company signaled the world that it had adopted a global perspective and would follow a corresponding strategy. The company began to diversify, first across product lines and then geographically. It began to supply other North American auto makers, and then auto makers outside of North America. By 1982 Magna had restructured into several product groups, further enhancing its productivity and efficiency. Its dependence within each product category was mitigated by supplying a diversity of European and North American auto makers (1982 sales = $240 million).
By 1987 (sales = $ 1 billion) Magna had transformed itself into a “full service supplier for virtually every system of automobile,” regardless
13
I n t e r n a t i o n a l J o u r n a l o f M a n a g e m e n t C a s e s
of the nationality and the location of the buyer. As Magna specialized and gained still greater scale efficiencies, it became an integral part of each of the auto makers’ global value chains. Its impressive growth was built on two related foundations: a global growth perspective predicated on world-scale production efficiencies; and a strategy of mutual interdependence with the major auto makers. This interdependence has become such a vivid strategic feature of this company, that many Magna parts plants today are located physically adjacent to the auto assembly plants. Diamler-Chrysler’s assembly plant near Stuttgart, for example, relies so completely on its adjoining Magna parts plant that sub- assemblies and parts flow directly from Magna’s plant, on suspended conveyor belts, into Diamler’s assembly line, with no intervening inventory stockpile. Conversely, Magna’s symbiotic relation with the auto maker is sufficiently strong that its entire parts plant is dedicated exclusively to the needs of the Daimler-Chrysler plant. Through this process of growth by relying on individual national auto makers, Magna avoided the time consuming and resource intensive process of classical internationalization. Instead, it leveraged its resources, including time, to climb onto a much higher efficiency path, making itself indispensable to its auto-industry customers. Magna International Inc. is today the largest auto parts supplier in world, well capable of becoming itself an auto maker should it wish to do so.
World-Scale NetworksThe mutual benefits of collaboration between small and large firms in larger networks may be further illustrated in the airline industry, where it has become common for smaller, entrepreneurially-oriented airlines to provide elements of the value chain to larger firms, via sub-contracting or franchising. Sub-contracting involves an agreement in which one company contracts a specific segment of its business operations to another firm, allowing each firm to focus on its competitive advantage, and to leverage the core competency of the other. Specifically, larger international carriers, more efficient at long-haul flights, rely on the services of small-scale carriers, with smaller aircraft, to access and service small niche markets in which the smaller carriers are more efficient. Significant cost reductions are achieved through the use of more specialized aircraft, while seamless service is offered to the customer. The small carrier may have added cost advantages of not being
unionized, and of having a more community-focused corporate culture. As an integral part of a larger network, smaller carriers can focus on specialized services and avoid scale-dependent operations, to the mutual advantage of both.
Allegheny Airlines pioneered the concept of sub-contracting flights to independent firms, to which it assigned its own two-letter designator. The airline developed a hub in Pittsburgh and introduced new routes. Deregulation allowed Allegheny Airlines to concentrate on its most profitable routes, mainly between hubs, using jet aircraft. Yet many other routes were still important as they provided feeder traffic and thus enlarged the customer base. Rather than discontinue service to minor airports, Allegheny maintained under contract a network of small, independent carriers that provided flights, under the brand name Allegheny Commuter, on behalf of Allegheny Airlines. Independent contractors included: Chatauqua Airlines, Fischer Brothers Aviation, Henson, Ransome Airlines, South Jersey Airlines and Suburban Airlines. This collaborative network enabled Allegheny Airlines (later USAir and more recently, U S Airways) to focus on expanding its presence, without abandoning low-density routes to smaller communities. This concept also proved beneficial to Allegheny’s associated entrepreneurs (such as Mr. and Mrs. Ransome, the owner-managers of Ransome Airlines), as it provided them access to long-haul travelers and scale-dependent operations (e.g., reservation and information systems), which Allegheny provided efficiently. The members of the Allegheny network saved costs and improved their competitiveness, in terms of expanded network reach, lower ticket prices, and higher satisfaction among customers who benefited from the seamless services provided by the network. When Allegheny changed its name to USAir, it kept the Allegheny Commuter network, which eventually became USAir Express. The benefits associated with such cooperative networking would soon impact the dynamics of airline competition, forcing others to emulate it:
American Airlines, originally opposed to code sharing, launched its American Eagle program in November 1984. Members have included numerous small firms, such as: AVAir, Air Midwest, Chaparral Airlines, Command Airways, Executive Air Charter, Metro Express II, Metroflight, Simmons Airlines and Wings West Airlines.

14
I n t e r n a t i o n a l J o u r n a l o f M a n a g e m e n t C a s e s
Delta Air Lines set up the Delta Connection in 1985, operated by Atlantic Southeast Airlines, Comair, Ransome Airlines (formerly an independent contractor for the Allegheny Commuter network) and Rio Airways. Meanwhile, Skywest Airlines and South Central Air operated Western Express for Western Airlines. Both networks were combined when Delta absorbed Western on April 1, 1987. Delta also set up a network operated by Business Express, using Delta’s (DL) designator.
United Airlines started sharing its (UA) designator in 1985 with Appleton-based Air Wisconsin, Seattle-based Horizon Air and Fresno-based WestAir. In 1986 Aspen Airways (operating Convair 580 turbo-props between Denver and Aspen) also became a United Airlines code-sharer. United lost Horizon when this contractor was acquired by Alaska Airlines.
As deregulation spread from the U.S. to Canada and Europe, so did the principle of creating alliances and networks between large, international airlines and small, local sub-contractors. In Canada, Air Canada set up a family of Air Canada Connectors, including Air Alliance, Air BC, Air Nova and Air Ontario, as well as Austin Airways (Canada’s oldest airline, established as a family business in 1934). Eventually, several other small firms, including Alberta Citylink, British Midland, and Central Mountain Air, also became code-share partners.
International franchising is a more recent innovation in the quest to market airline services internationally. As is the case with sub-contracting, franchising is an effective way by which one airline can cooperate with another to expand beyond its own resource base. A franchise agreement expands on subcontracting, often allowing the franchisee to use the franchiser’s name and airline code, and to operate airplanes painted in the livery of the franchiser. Unlike sub-contracting, franchising may allow an airline to effectively enter the restrictive domestic markets of foreign countries, through its local franchisees.
In May 1996, British Airways (BA) signed its first franchise agreement with a small, regional carrier outside the United Kingdom. It allowed Sun-Air, a Danish airline, to paint its fleet in the livery of BA, and its cabin crew to wear BA uniforms. Two months later, BA signed a similar franchise agreement with Comair, a small firm in the Republic of South Africa. In the case of airline franchising, the
franchiser benefits from rapid expansion into local markets without heavy capital investment. It also bypasses barriers against foreign ownership. The franchisee benefits from the brand name, technical expertise and scale-dependent benefits, including the expanded passenger base of the franchiser. For the entrepreneur who operates a small airline, such a cooperative relation provides access to international passengers, which would require much greater resources to attain independently.
Networking has proven highly effective in providing niche services, and generally enhancing competitiveness, in the airline industry. The large, flagship carriers at the apex of these networks are in turn forming networks of networks: the One World Alliance of American Airlines, British Airways, Canadian Airlines International, Cathay Pacific and Qantas is an oligopolistic reaction to the Star Alliance of United Airlines, Lufthansa, Air Canada, Scandinavian Airlines System, Thai International, and Varig. The noteworthy point is that all the small suppliers and commuter carriers attached to the major airlines are gaining access to ever-expanding international markets through their interdependent network relationships with larger firms.
Management Implications Globalization is transforming the competitive environment of small and large firms alike. In the more segregated competitive arenas of the past, managers of smaller firms could remain local if they wished, reasonably insulated from the forces of international competition. And if they chose to expand into markets abroad, they could acquire and internalize the resources needed to do so, incrementally over time.
In the new, intensified competitive environment, SMEs must achieve world-class efficiencies in order to survive, whether or not they actually compete globally. They can no longer afford the luxury of achieving these efficiencies gradually, through a sequential evolution, using their own resources. Instead, many small firms are achieving cost reduction and expanding their market reach indirectly, by linking their operations into the value chains of large firms, to the mutual benefit of both parties.
The traditional option of smaller firms “piggy-backing” on larger firms, at the larger firms’
15
I n t e r n a t i o n a l J o u r n a l o f M a n a g e m e n t C a s e s
discretion, typically entailed the small supplier subordinating the independence of its management decisions, through a one-way reliance on one or a few very large firms. The examples in this paper illustrate that by becoming highly specialized and efficient, small firms may be able to achieve symbiotic relationships in which small firms and large firms rely on each other to attain world-class competitiveness for their entire network. The resulting increase in efficiency enables the network as a whole to compete more effectively and to gain market share globally.
The accelerating trend toward small firm-large firm collaboration presents unprecedented opportunities, as well as challenges, for entrepreneurs and their firms. The days when small firms could operate independently, in relatively protected environments, are waning. Networks – and even coalitions of networks – now compete for global market share. The implications largely contradict conventional thinking about the independent growth and management of SMEs. The global environment calls for new strategies, often involving a tradeoff between independence and efficiency. Smaller firms may still depend heavily on the scale of large firms to achieve their initial efficiency gains. However, the examples in this paper illustrate that once small firms have begun to attain the prerequisite efficiencies, even world class players may find it necessary to incorporate them into their own supply chains, in order for their coalitions to achieve further global competitiveness.
Today’s emerging, highly-specialized and competitive SMEs are qualitatively different from those of the past. Their competencies are acquired and sustained differently as well. For example, networked SMEs need not be as self-sufficient or self-reliant as were the more independent firms of the past. Entrepreneurs of the future will be able to draw upon the pooled capabilities and knowledge stock of their entire network, instead of developing the required knowledge themselves (Etemad, 1999b). Building upon such enabling knowledge networks – mirroring the physical networks of the firms – is a new strategic competence which is bound to challenge SME managers, especially those still orientated toward fully independent operations. The consequences of this paradigm shift from independence toward interdependence are far-reaching. Managers will have to devise new strategies to help develop and maintain network
capabilities, in addition to their own internal competencies.
End NotesThere is no universally accepted definition 1. of what constitutes a “small” firm or a “small-and -medium-sized enterprise” (SME). The U.S. Department of Commerce defines an SME as one with 500 employees or fewer, while Canada sets the threshold at 300. The European Union Commission adopted “composite” (number of employees AND annual sales AND total capital investment) definitions of micro, small, and medium-sized enterprises, in which a firm is a micro-enterprise if it has fewer than ten employees; a small enterprise if it has fewer than fifty employees; and a medium-sized enterprise if it has fewer than 250 employees. In some countries, the definition even varies by industry: see the reference to Japan, later in this paper. Our discussion deals with the concept of smallness, rather than with any precise (and thereby limiting) definition.
Webster’s New Collegiate Dictionary defines 2. symbiosis as “the living together in intimate association or even close union of two dissimilar organisms...ordinarily it is used of cases where the association is advantageous, or often necessary, to one or both, and not harmful to either” (emphasis added). The focus of this paper is on the co-dependence of evolving symbiotic relationships, which goes well beyond the convenience or short-term benefit of transaction-based relationships.
Even the dynamic, new “.com” firms illustrate 3. the increasing interdependence of global competition. While they may seem to reach global markets with their own resources, even apparently successful .com firms rely heavily on others to provide missing portions of their value chains. Amazon.com, for example, is linked with Fedex and other couriers for physical logistics, as it is with various financial institutions for collecting payments, etc. The point is that one does not necessarily have to have international presence to sell globally, but one does have to have collaboration with other elements of the value chain in order to do so.

16
I n t e r n a t i o n a l J o u r n a l o f M a n a g e m e n t C a s e s
Etemad (1999a) provides a detailed 4. comparison of these forms (e.g., joint venture, contractual agreements, strategic alliances, etc.) in the emerging competitive environment. See, especially, Table II on pages 98-99.
ReferencesAcs, Zoltan J. and Bernard Yeung (1999), “Entrepreneurial Discovery and the Global Economy,” Global Focus, 11 (3), 63-71.
Aldrich, Howard E. (1989), “Networking among Women Entrepreneurs,” in Women-Owned Businesses, O. Hagen, C. Rivehum and Donald L. Sexton, eds. New York: Praeger, 103-132.
---------, Trevor P. Jones, and David McEvoy (1984), “Ethnic Advantage and Minority Business Development,” in Ethnic Communities in Business: Strategies for Economic Survival, R. Ward and R. Jenkins, eds. Cambridge: Cambridge university Press.
---------, Ben Rosen and William Woodward (1987), “The Impact of Social Networks on Business Foundings and Profit in a Longitudinal Study,” in Frontiers of Entrepreneurship Research, Babson College, eds. Wellesley, MA: Babson College, 154-168.
---------, and Catherine Zimmer (1986), “Entrepreneurship through Social Networks,” in The Art and Science of Entrepreneurship, D.L. Sexton and R. W. Smilor, eds. Cambridge, MA: Ballinger, 3-24.
Bartlett, Christopher A. and Sumatra Ghoshal (1989), Managing Across Borders: The Transnational Solution. Boston: Harvard Business School Press.
Bilkey, Warren J. and George Tesar (1977), “The Export Behavior of Smaller Sized Wisconsin Manufacturing Firms,” Journal of International Business Studies, 8 (1), 93-98.
Birley, Sue (1985), “The Role of Networks in the Entrepreneurial Process,” in Frontiers of Entrepreneurship Research, Babson College, eds. Wellesley, MA: Babson College, 325-337.
Boissevain, Jeremy and Hanneke Grotenbreg (1987), “Ethnic Enterprise in the Netherlands: The Surinamese of Amsterdam,” in Entrepreneurship in Europe: The Social Process, Robert Goffee and
Robert Scase, eds. London: Croom Helm, 105-130.
Bonaccorsi, A. (1992), “On the Relationship between Firm Size and Export Intensity,” Journal of International Business Studies, 4 (4), 605-635.
Buckley, Peter J. (1997), “International Technology Transfer by Small and Medium-Sized Enterprises,” Small Business Economics, 9, 67-78.
Carsrud, Alan L., Connie Marie Gaglio and Kenneth W. Olm (1986), “Entrepreneurs – Mentors, Networks and Successful New Venture Development: An Exploratory Study,” in Frontiers of Entrepreneurship Research, Babson College, eds. Wellesley, MA: Babson College, 229-243.
Cavusgil, S. Tamer (1980), “On the Internationalisation Process of Firms,” European Research, 8, 273-281.
--------- (1984), “Differences Among Exporting Firms Based on Their Degree of Internationalization,” Journal of Business Research, 12 (2), 195-208.
Coviello, Nicole E. and Kristina A-M Martin (1999), “Internationalization of Service SMEs: An Integrated Perspective from the Engineering Consulting Sector,” Journal of International Marketing, 7 (4), 42-66.
Dana, Leo-Paul (1999), Entrepreneurship in Pacific Asia: Past, Present & Future. Singapore: World Scientific.
--------- and Hamid Etemad (1994), “A Strategic Response Model for the Internationalization of Small or Medium-Sized Australian Enterprises,” Bond Management Review, 4 (1), 31-42.
--------- and --------- (1995), “SMEs - Adapting Strategy for NAFTA: A Model for Small and Medium-Sized Enterprises,” Journal of Small Business & Entrepreneurship, 12 (3), 4-17.
---------, --------- and Richard W. Wright (1999a), “The Impact of Globalization on SMEs,” Global Focus, 11 (4), 93-105.
---------, ---------, and --------- (1999b), “The Theoretical Foundations of International Entrepreneurship,” in International Entrepreneurship: Globalization of Emerging Businesses, Richard W. Wright, ed. Stamford, CN: JAI Press, 3-22.
17
I n t e r n a t i o n a l J o u r n a l o f M a n a g e m e n t C a s e s
Dubini, Paola and Howard E. Aldrich (1991), “Personal and Extended Networks are Central to the Entrepreneurship Process,” Journal of Business Venturing, 6 (5), 305-313.
Dunning, John H. (1995), “Reappraising the Eclectic Paradigm in an Age of Alliance Capitalism,” Journal of International Business Studies, 26 (3), 461-491.
Etemad, Hamid (1996), “From Obscurity to Powerhouse: The Process of China’s Two Decades of Development,” Business and the Contemporary World, 8 (3/4), 171-222.
--------- (1999a), “Globalization and Small-to-Medium-Sized Enterprises: Search for Potent Strategies,” Global Focus, 11 (3), 85-104.
--------- (1999b), “The Emerging Knowledge Network of International Entrepreneurship,” Global Focus, 11 (3), 55-62.
Gomes-Casseres, Benjamin (1996), The Alliance Revolution. Cambridge, MA: Harvard University Press.
Harrison, Bennett (1997), Lean and Mean. New York: Gilford.
Holm, Desiree B., Kent Eriksson and Jan Johanson (1997), “Business Networks and Cooperation in International Business Relationships,” in Cooperative Strategies: European Perspectives, Paul W. Beamish and J. Peter Killing, eds. San Francisco: The New Lexington Press, 242-266.
Iyer, Gopalkrishnan and Jon M. Shapiro (1999), “Ethnic Entrepreneurship and Marketing Systems: Implications for the Global Economy,” Journal of International Marketing, 7 (4), 83-110.
Johannison, Bengt (1987), “Towards a Theory of Local Entrepreneurship,” in The Spirit of Entrepreneurship, Robert G. Wyckham, Lindsay N. Meredith and Gervase R. Bushe, eds. Vancouver, BC: Faculty of Business Administration, Simon Fraser University, 1-14.
Johanson, Jan and Jan-Erik Vahlne (1977), “The Internationalization Process of the Firm – A Model of Knowledge Development and Increasing Foreign Market Commitments,” Journal of International Business Studies, 8 (1), 23-32.
--------- and Finn Wiedersheim-Paul (1975), “The Internationalization of the Firm: Four Swedish
Cases,” Journal of International Management Studies 12 (3), 36-64.
Jones, Marian V. (1999), “Patterns, Processes, Decisions: The Internationalisation of Small U.K. High Technology Firms,” Journal of International Marketing, 7 (4), 15-41.
Knight, Gary and S. Tamer Cavusgil (1996), “The Born Global Firm,” in Advances in International Marketing (8), S.T. Cavusgil and T.D. Masden, eds. Greenwich, CT: JAI.
Levitt, Theodore (1983), “The Globalization of Markets,” Harvard Business Review, May-June, 92-102.
Lodge, George C. And Ezra F. Vogel (1987), Ideology and National Competitiveness: An Analysis of Nine Countries. Boston, MA: Harvard Business School Press.
Newbould, G.D., Peter J. Buckley and J.C. Thurwell (1978), Going International - The Experience of Smaller Companies Overseas. New York: John Wiley & Sons.
Ohmae, Kenichi (1989), “The Global Logic of Strategic Alliances,” Harvard Business Review, March-April, 143-154.
--------- (1990), The Borderless World. New York: Harper Collins Books.
Olm, K., Alan L. Carsrud and L. Alvey (1988), “The Role of Networks in New Venture Funding of Female Entrepreneurs: A Continuing Analysis,” in Frontiers of Entrepreneurial Research, Babson College, eds.Wellesley, MA: Babson College, 658-659.
Oviatt, Benjamin M. and Patricia P. McDougall (1994), “Toward A Theory of International New Ventures,” Journal of International Business Studies, 25(1), 45-64.
--------- and --------- (1999), “A Framework for Understanding Accelerated International Entrepreneurship,” in International Entrepreneurship: Globalization of Emerging Businesses, Richard W. Wright, ed. Stamford, CN: JAI Press, 23-40.
Reynolds, Paul D. (1997), “New and Small Firms in Expanding Markets,” Small Business Economics, 9 (1), 79-84.
18
I n t e r n a t i o n a l J o u r n a l o f M a n a g e m e n t C a s e s
Shaver, Kelly G. and Linda R. Scott (1991), “Person, Process, Choice: The Psychology of New Venture Creation,” Entrepreneurship, Theory and Practice, 16 (2), 23-64.
Stalk, G. (1988), “Time – The Next Source of Competitive Advantage,” Harvard Business Review, July-August, 41-51.
--------- and T.M. Hout (1990), Competing Against Time. New York: Free Press.
Werbner, Phina (1984), “Business Trust: Pakistani Entrepreneurship in the Manchester Garment Trade,” in Ethnic Communities: Strategies for Economic Survival.Cambridge, Robin Ward and Richard Jenkins, eds. Cambridge University Press, 166-188.
Wright, Richard W. (1989), “Networking, Japanese Style,” Business Quarterly, 54(2), 20-24.
Yoshino, Michael Y. and U. Srinivasa Rangan (1995), Strategic Alliances. Boston. MA: Harvard Business School Press.

19
I n t e r n a t i o n a l J o u r n a l o f M a n a g e m e n t C a s e s
RELIGION AS ATTRACTION: RELATIONS IN A JAPANESE FESTIVAL.
LEIF SELSTADUNIVERSITY OF STAVANGER, NORWAY
Abstract
The paper investigates the shifts in the tourist orientation of a village festival in Tokyo, Japan. The place in question, Tsukuda, has been a tourist destination in Tokyo for more than two hundred years because of its village atmosphere. The local festival celebrating the Sea God has become a tourist attraction. The festival is held once every three years and is experienced by thousands of tourists. The study is based on long-term fieldwork from 1984 to the present.
The exposure of the festival to tourism has shifted over the years. In times of duress, such as during urbanisation drives in the 1960s and a threatened urban razing in the 1980s, tourism was fostered as a means to rally support for local preservation. This culminated in tentative commercial tourism in the 1990s, when festival clothing was sold as souvenirs and spectator stands were opened. Recently this trend has changed to one of de-emphasising tourism and accentuating the traditional attributes of the festival. It might be argued that this would destroy tourist interest in the festival, but such is not the case. While there has been some decline in the number of tourists present, both Japanese and international tourists came to see the recent festival in 2005. Spectators expressed satisfaction in the authentic appearance of festival performances, a lack of tourist staging and their physical proximity to the performers. Religious tourism opens a number of options for the persons in charge. In some cases a chosen lack of tourist orientation can strengthen the experience of authenticity for tourists. What strategy to adopt in relation to tourism, will depend on the context of political and religious conditions in the setting where religious tourism is performed.
This context includes changes in leadership for the festival and the local community, local drives to preserve residential areas and livelihood, and the macro political processes of urbanisation and tourism in Tokyo. The perceptions of tourists
will also have an impact, since the presence of tourists is taken to credit by festival performers. Theoretical contributions such as discursivity and constructivism are employed to explore how tourist interests interact with local perceptions of the festival. This leads up to a short discussion of how decisions by leaders and performers at the festival affect tourist attendance. Changes in the tourist adaptation of the festival provides an example of how different interests interact in religious tourism today.
Keywords: Religious tourism, festivals, tourist adaptation.
IntroductionThis paper explores the relations between tourists and local residents in a Japanese festival. The festival locality, Tsukuda, is a residential area near downtown Tokyo (Selstad, 1998a). Long-term research has provided an opportunity to follow social developments in this locality. One such development has been the rise and decline of tourist spectators at a local, religious festival. In the 1990s there were plans to turn this festival into a tourist event, plans that eventually were scrapped in favor of a return to a traditional, locally run event. Yet tourists continue to attend the festival, and local people continue to adapt to the presence of tourists. This means that local leaders and residents constantly make choices about how to relate to the interests of tourists at the festival. Such adaptation is one of the issues of religious tourism in the world today (Olsen & Timothy, 2006, p.11).
The method used in this research is long-term fieldwork in Tsukuda starting with several years residence from 1984 to 1988, and continuing as intermittent field-trips until today. The fieldwork methods include participant observation, interviews, questionnaire, and daily notes (Pelto & Pelto, 1978). After completing the Ph.D., the
20
I n t e r n a t i o n a l J o u r n a l o f M a n a g e m e n t C a s e s
author has continued to visit the community, in particular trying to visit the local festival when it takes place. This has offered an opportunity to renew acquaintances in the village, and to focus on particular relationships, such as those between residents and tourists.
When referring to a religious festival as an attraction, this touches on the dilemma of reconciling piety and entertainment in religious tourism (Vukonić, 1996, p.59). Tourism has been represented as a modern ritual (MacCannell, 1999, p.42). This has been due to tourists being placed outside their ordinary world, hence creating a liminal or ritual state (Turner, 1970). At the same time, modern tourism is too complex to be summed up as religion. What distinguishes tourism from religion is the social and economic repercussions of tourist activities, that only to some degree can be described as religious (Franklin, 2003, p.50). The challenge is to integrate tourists when they arrive as visitors at ritual events (Selstad, 2007).
Leaders of religious events adopt strategies that involve long-term planning and actions to achieve goals, such as promoting a festival for tourism purposes (Allen, 2002). In many cases there will be different options available to social actors. One approach in culture studies is called constructivism, which claims that cultural events are constructed to serve the interests of individuals (Hall, 1997; Selstad, 1998b). What is often neglected when discussing the construction of traditions, are the dilemmas that individuals face when trying to formulate their interests. The concept of construction can lead to a preconceived view of why people handle traditions the way they do. The concept of social discourse will be introduced to avoid an oversimplified view of individual choices. Discourse can be defined as a series of negotiations and exchanges between social actors in handling their interests within a social setting (Foucault, 1972). Discourse has relevance for religious tourism, where different interests about beliefs and commercial adaptation cannot be easily reconciled (Vukonić, 1996). Adaptation to tourism has become an issue at Tsukuda’s festival.
The Festival as a Tourist Attraction.Tsukuda is a local community near downtown Tokyo with about 900 residents. The community is clearly bounded, and is characterised by most of the local people being local born and working
in the fish industry (Selstad, 1998a). The place has been a tourist spot for more than two hundred years, starting with city dwellers renting boats to see the sights along Tokyo Bay. Tourism has continued to the present day, but today bridges span the islands of Tokyo Bay, and guided bus tours stop outside Tsukuda every few hours during the day. The community itself is generally intact, with no through traffic and a canal for fishing boats. Sightseers and tourists come to see the village, buy the local seafood specialty, and look at the local scenery.
The small buildings, secluded setting and local atmosphere sets the local area apart from the Tokyo metropolis (Tokyo-to, 1984, p. 84). This image is strengthened by the ritual life in the village. The most conspicuous celebration is called the Great Festival, a Shinto festival which is held in honor of the Sea God. The festival is held once every three years, and lasts for four days on the weekend nearest to August 6 (Sawara, 1972, p.87f). During these four days the village is physically and socially transformed by the Great Festival. Festival banners, stands and lanterns mark the place as a festival location.
The festival centers on the carrying of sacred paraphernalia around the village. These paraphernalia consist of heavy wooden objects called ‘lion heads’ and ‘godcarts’ (Selstad, 1998b). Lion heads are carved wooden heads of mythical animals resembling lions. These are carried around the village on the second day of the festival. On the third and fourth days, two godcarts, one more sacred than the other, are carried around. The Great Festival attracts crowds of thousands of onlookers, ranging from scholars and visiting relatives to tourists and sightseers (Selstad, 2007). Modern guidebooks permit tourists from all over the world to pay attention to when the next festival will be (Enbutsu, 1984, p.143).
The relationship between religious celebrations and tourism can be described as anything but straightforward (Vukonić, 1986, p.64). A constructivist view might claim that local traditions are constructed to attract tourists and to obtain public recognition. People involved in religious celebrations would dispute such a view, and might even claim that it is inappropriate to view religion as a tourist attraction. At the same time adaptation has been made to facilitate the presence of tourists.

21
I n t e r n a t i o n a l J o u r n a l o f M a n a g e m e n t C a s e s
The relationship between local residents and tourists has changed over the years, along with external factors. Throughout the twentieth century Tsukuda was threatened by urban development. The first threat was land reclamation in Tokyo Bay, that led to fishing grounds being destroyed by the 1950s. In stead local people found work at the Tokyo Fish Market. In connection with the Tokyo Olympics in 1964 there was a ‘clean up’ of the urban landscape that threatened traditional places such as Tsukuda. In the ensuing struggle Tsukuda found support among sightseers, scholars and artists (Sawara, 1972, p.284). In the 1980s the city government planned to build a number of high rise buildings around Tsukuda, and local people had to save the village from urban razing. The attractivity of Tsukuda as a tourist location became an argument for its preservation (Selstad, 1998a, p.283).
One outcome of this development was the gradual adaptation of the local festival to tourism. The former leader saw possibilities for increasing revenue at the festival from tourists. Together with the shrine priest he streamlined the festival program, selling posters and souvenirs to tourists, and opened spaces where tourists could take refreshments during the festival. He changed the rules of the festival, such as allowing women to take part in the carrying of sacred paraphernalia, a task that had formerly been restricted to men, in order to make the festival more palatable to the media and modern travelers. He set a fixed schedule for the performances in the festival (Selstad, 2002, p.157). This may be termed a process of touristification.
Tourist adaptation need not be progressive. When the local leader became sick and passed away, festival participants reverted to former practices of carrying out the festival by ignoring the leader’s plan. The old rules were reinstated. Participation in the Great Festival again is limited to local men in Tsukuda or to men with links to the community. Only these men are permitted to wear the festival kimono made specially for each festival, and to take part in carrying the sacred paraphernalia.
Most tourists are unaware that the performance is more strict than it seems at first sight. Local men are organized in age-grades, an ancient form of social organization where members rise in the age hierarchy by taking part in each festival. The men are also divided into three sections based on local residential divisions. Different age-grades and sections compete against each other, notably
in so-called fights between men carrying the lion heads, but also when taking turns in carrying the godcart. The carrying of sacred paraphernalia institutes a process of symbolic exclusion and inclusion, starting with each age-grade and each section carrying separately, and gradually joining local people in a common procession through the streets. To tourists the festival performance forms a spectacle to be photographed and remembered, which to local residents serves to confirm the distinctiveness of their community (Selstad, 2007, p.11).
Tourists have difficulties trying to interpret the festival. Local people are of little help, giving only simple answers to their inquiries. In spite of this tourists are attracted to the festival as a social undertaking. There is a display of hospitality during the festival. People are continuously on the street, and passers-by will be offered refreshments if they care to stop. Hospitality is a feature of host communities that attracts tourists in the first place, and tourist adaptation can be seen as a further development of local hospitality (Pi-Sunyer, 1989, p.196). What MacCannell refers to as the staging of attractions, becomes an added attribute to the hospitality of local hosts (MacCannell, 1999). When the crowds during the festival in 1987 reached 3,000 people during peak hours, local elders grew weary trying to make room for the festival paraphernalia. Yet no effort was made to remove tourists from the scene. The festival resembles street theatre, where performances attract spectators through their visuality (Pine & Gilmore, 1999, p.132).
The Contest between Traditionalism and Tourist Adaptation.The festival went through a period of tourist adaptation in the 1990s. This culminated at the Great Festival in 1993, when the leader instituted measures to make the festival more amenable to tourist spectators. The leader wanted to sell old festival uniforms as souvenirs. He made an effort to accommodate visitors at the festival. The leader made TV interviews, even acting as an expert commentator on TV while officially heading the festival (Selstad, 2002, p.157). He managed to sell the same type of festival wear used in Tsukuda to residents in nearby reclaimed areas, who formerly had used a different style of wear. Thereby the distinction between local festival paraphernalia and external interests were blurred.

22
I n t e r n a t i o n a l J o u r n a l o f M a n a g e m e n t C a s e s
This touches on the distinction between tourists and believers (Vukonić, 1996; Timothy & Olsen, 2006). C. M. Hall (2006, p. 180) notes that some religions are more tolerant than others in allowing non-believers to join believers in a crowd. This reflects on the question of why people travel. In relation to religion the question of why people visit a site takes on a special significance (Vukonić, 1996, p.59, 100). Religious scholars would like to separate believers from non-believers. Such distinctions are not easy to make in today’s world when people travel for all kinds of reasons and often have different motives for visiting a place, be they work, devotion or recreation.
Commodification threatens to destroy the distinction between devotees and visitors (Timothy & Conover, 2006, p. 150). There continues to be a strong local resistance to selling festival clothing or objects as souvenirs to tourists. The main reason for this is that tourists do not understand the social and religious connotations of ritual objects. Local people are also worried that they will lose control of the festival. This is similar to the fears of Native Americans about losing control of spiritual sites to tourism (Timothy & Conover, 2006, p.150). It is tempting to represent tourist adaptation as a one-way process, whereby events must be staged in order to attract tourists.
That this process is not one-sided, can be demonstrated in several ways. In 1987 the leader permitted a female TV personality to enter the festival briefly in front of cameras, to the dismay of local women who felt ignored. This TV personality gauded the leader about women not being permitted to carry the paraphernalia. In 1993, he instituted a new rule to the effect that, ‘this time … there will be a carrying of the … godcart by women only in the Great Festival’ (Selstad, 1998b, p.211). At the time the author interpreted this as an effort to include women as a segment in relation to men, since groups of men based on age and sections are gradually united in a symbolism of exclusion and inclusion in the festival. Women were even spoken of as a ‘fourth section’ in relation to men.
This view on symbolism was too simple. After 1993 women were no longer allowed to carry the sacred paraphernalia. When the old leader passed away, the new leadership reinstated the old rules about exclusive male participation. This could be referred to as a strategy of traditionalism (Selstad, 1998a). Traditionalism refers to the veneration of tradition, or people’s support of and involvement
in events that are held to be traditional (Shils, 1981, p.9). This has led some authors to claim that Tsukuda is a conservative place, a ‘living museum’ (Nishikawa, 1980, p.29; Kyôbashi Library, 1982). Local people contest this view, claiming that they are both traditional and modern. My survey showed that local women supported the festival as much as men (Selstad, 1998a, p.242). Women stated that if their husband refused to take part in the festival, this would give the wife grounds for divorce. At the same time that women were no longer allowed to take part in the festival, a woman was for the first time elected as the local leader in Tsukuda.
In 1999 there was still considerable adaptation to tourism at the festival. The local canal had been turned into a sightseeing and recreational area, with sidewalks and benches. Outdoor places serving refreshments had been prepared for tourists and visitors. The number of tourists was high, as was the number of photographers and TV crews. In 2005 this image had changed. There was less accomodation of tourists at the festival. The outdoor serving areas had been reserved for festival participants. The number of tourists and other spectators had been reduced, lessening the crowds when ritual objects were carried. Interestingly the first coffee shop had opened in the community at the same time, catering to tourists and residents.
Is this the end of tourism at the Great Festival in Tsukuda? Such an interpretation would be rash, since spectators at the event expressed considerable satisfaction at being able to get close to the carrying of the lion heads and godcarts. The smaller crowds allowed a closer look at the fight over the lion heads. A young novice was lifted on to to the backs of the other carriers to be allowed to touch the lion head, which is the goal of all young men. This drew spontaneous applause from the spectators. Such close encounters with local practitioners of a ritual event can be referred to as ‘existential authenticity’ (Wang, 2000, p.49). This is a concept that transcends the discussion of authenticity as either original objects or symbolic constructions (MacCannell, 1999, p.96). In the streets the sightseers received hospitality from local residents as always, several foreign tourists enjoying refreshments on local porches. The effect was one of de-marketing, giving spectators a more personal experience at the festival (Cooper et al., 2005, p.370). It could be claimed that both locals and tourists gained from the recent de-emphasis of the festival as a tourist event.
23
I n t e r n a t i o n a l J o u r n a l o f M a n a g e m e n t C a s e s
What on the surface seems like a straightforward process of adapting a religious celebration to tourism, turns out to be much more complex and ambiguous. Local leaders and stakeholders show considerable leeway in how they adapt events to tourism. This entails that a simplistic application of theories such as constructivism may lead to premature conclusions. Viewing the series of exchanges and decisions about tourist adaptation as a social discourse helps broaden the view of festival developments (Foucault, 1972). There is not a single strategy involved in adapting religious events to tourism, but rather a range of views and interests that impact religious tourism (Vukonić, 1996, p.151). The views of participants and stakeholders have to be examined in order to work out the staging of religious events.
Conclusion.Religious tourism opens up a number of options and strategic choices for people involved in events. In some cases a chosen lack of tourist orientation may strengthen the experience of authenticity, proximity and spontaneity for tourists. What strategy to adopt in relation to tourism is not a set question, not even for local leaders, but is embedded in a wide variety of considerations and involvements that tie different people to the festival. The claim is that we need a discursive view on the implementation of religious tourism, its limitations and possibilities.
D. Getz envisions that entire genres of festivals and events may disappear as a result of product life courses in tourism (Getz, 2000, p.176). Globalization may also threaten the ways in which tourists are incorporated into local events (Cohen, 2006, p.88). The ups and downs of the Tsukuda festival indicates that the image of a life course is too simple for this event. Devotees, members of the host community, and tourists, will have different views on the festival. A decline in the number of tourists need not foresee the disappearance of events, but has to be viewed in relation to the different interests and strategies of actors involved in the festival. From the literature cases are known where a temporary decline in visitors is followed by renewed interest in tourist attractions (Viken, 2002, p.168; Leiper, 1998). This may also be the case in Tsukuda, where a more general reliance on tourist facilities, such as the new coffee shop, can result in a stable influx of tourists. The village of Tsukuda has been threatened by destruction time
and again, but people there have always been able to devise strategies that permit the community to rebound and even to revitalize itself.
ReferencesAllen, J. et al. (2002) Festival and Special Event Management Milton, Qld.: John Wiley & Sons, Australia
Cohen, E. H. (2006) Religious Tourism as an Educational Experience In Timothy, D. J. & Olsen, D. H. (Eds.), Tourism, Religion and Spiritual Journeys London: Routledge pp. 78-93
Cooper, C. et al. (2005) Tourism: Principles and Practice 3rd. ed. Harlow: Pearson Education
Enbutsu, E. (1984) Discover Shitamachi Tokyo: Shitamachi Times
Foucault, M. (1972) The Archaeology of Knowledge London: Tavistock Publications
Franklin, A. (2003) Tourism: An Introduction London: SAGE Publications
Getz, D. (2000) Festivals and Special Events: Life Cycle and Saturation Issues In Gartner, W. C. & Lime, D. W. (Eds.), Trends in Outdoor Recreation, Leisure and Tourism Wallingford: CABI Publishing pp. 175-185
Hall, C. M. (2006) Buddhism, Tourism and the Middle Way In Timothy, D. J. & Olsen, D. H. (Eds.), Tourism, Religion and Spiritual Journeys. London: Routledge pp. 172-185
Hall, S. (Ed.) (1997) Representation: Cultural Representation and Signifying Practice London: SAGE Punlications
Kyoobashi Library. (1982) Tsukudajima ni tsuite (Concerning Tsukuda Island; in Japanese) Tokyo: Kyoobashi Library
Leiper, N. (1998) Big Success, Big Failure, at Big Banana Journal of Travel and Tourism Marketing Vol. 6 No. 3/4 pp. 103-121
MacCannell, D. (1999) The Tourist: A New Theory of the Leisure Class Berkeley: University of California Press
Nishikawa, K. et al. (1980) Rekishi no machinami (Historical Townscapes; in Japanese) Tokyo: NHK bukkusu

24
I n t e r n a t i o n a l J o u r n a l o f M a n a g e m e n t C a s e s
Olsen, D. H. & Timothy, D. J. (2006) Tourism and Religious Journeys In Timothy, D. J. & Olsen, D. H. (Eds.), Tourism, Religion and Spiritual Journeys. London: Routledge pp. 1-21
Pelto, P. J. & Pelto, G. H. (1978) Anthropological Research 2nd. ed. Cambridge: Cambridge University Press
Pine, B. J. II, & Gilmore, J. H. (1999) The Experience Economy Boston: Harvard Business School Press
Pi-Sunyer, O. (1989) Changing Perceptions of Tourism and Tourists in a Catalan Resort Town In V. L. Smith (Ed.), Hosts and Guests. Philadelphia: University of Pennsylvania Press, pp. 187-199
Sawara, R. (1972) Tsukudajima no konjaku (The Past and Present of Tsukuda Island; in Japanese). Tokyo: Sekkasha
Selstad, L. (1998a) An Island of Tradition Bergen: Ph.D. Dissertation, University of Bergen
Selstad, L. (1998b) Konstruksjon og diskurs: Nyere antropologiske bidrag til studiet av tradisjon (Construction and Discourse: Recent Anthropological Contributions to the Study of Tradition; in Norwegian) Norsk Antropologisk Tidsskrift Vol. 9 No. 4 pp. 202-214.
Selstad, L. (2002) The Attraction of Power: Honor and Politics in a Japanese Village In T. H. Aaase (Ed.), Tournaments of Power. Aldershot: Ashgate pp. 151-163
Selstad, L. (2007) The Social Anthropology of the Tourist Experience Scandinavian Journal of Hospitality and Tourism Vol. 7 No. 1 pp. 1-15
Smith, V. L. (1989) Hosts and Guests Philadelphia: University of Pennsylvania Press
Timothy, D. J., & Olsen, D. H. (Eds.) (2006) Tourism, Religion and Spiritual Journeys London: Routledge
Timothy, D. J., & Conover, P. J. (2006) Nature Religion, Self-Spirituality and New Age Tourism In Timothy, D. J. & Olsen, D. H. (Eds.), Tourism, Religion and Spiritual Journeys. London: Routledge pp. 139-155
Tokyo-to kyooiku iinkai. (1984) Chuo-ku Tsukudajima-chiku bunka-zai choosa hookoku (Cultural Assets of Tsukuda Island; in Japanese) Tokyo: Tokyo-to
Turner, V. W. (1970) Betwixt and Between: The Liminal Period in Rites de Passage In Hammel, E. A. & Simmons, W. S. (Eds.), Man Makes Sense. Boston: Little, Brown and Company pp. 354-369
Viken, A. (2002). Turismeproduktet (The Tourism Product; in Norwegian). In J. K. S. Jacobsen, J. K. S. & Viken, A. (Eds.), Turisme: Fenomen og produkt. Oslo: Gyldendal
Vukonić, B. (1996) Tourism and Religion Amsterdam: Pergamon
Wang, N. (2000) Tourism and Modernity: A Sociological Analysis Amsterdam: Pergamon
Autobiographical Note:Leif Selstad is Associate Professor at the Norwegian School of Hotel Management, University of Stavanger, Norway. He holds a Ph.D. in social anthropology from the University of Bergen, Norway. His research topics include ethnic tourism, festivals, and cultural tourism. Recent publications include: Leif Selstad (2007) The Social Anthropology of the Tourist Experience. Exploring the ’Middle Role’ Scandinavian Journal of Hospitality and Tourism Vol. 7 No. 1 pp.1-15. Leif Selstad (2002) The Attraction of Power: Honor and Politics in a Japanese Village In Aase, T. H. (Ed.), Tournaments of Power: Honor and Revenge in the Contemporary World. London: Ashgate pp.151-164.
25
I n t e r n a t i o n a l J o u r n a l o f M a n a g e m e n t C a s e s
SEGMENTATION BY CHARACTER TRAITS: A PRELIMINARY EMPIRICAL ASSESSMENT
FOR TOURISM SECTOR PRODUCTS
MARIA TERESA CUOMOFACULTY OF ECONOMICS, UNIVERSITY OF SALERNO, ITALY
GIUSEPPE FESTAFACULTY OF ECONOMICS, UNIVERSITY OF SALERNO, ITALY
DEBORA TORTORAFACULTY OF ECONOMICS, UNIVERSITY OF SALERNO, ITALY
GERARDINO METALLOFACULTY OF ECONOMICS, UNIVERSITY OF SALERNO, ITALY
Abstract
When we speak of mass consumption nowadays, in actual fact, we mean a cultural sphere capable of generating a specific perspective of the world, a system of values and a framework of personalities, peculiar to the functions of the system of demand; this implies going beyond the idea of the consumer “as a product of and from the organisation”, so as to reflect on the concept of individual identity, in that it is a relevant component in interpreting consumer behaviour, within an interacting circuit. Of course, as has been widely demonstrated, research of consumer behaviour, i.e. the personality, appears to guide what he consumes. However, this variable as far as the context of behaviour is concerned, cannot be separated from the degree of choice exerted that derives from individual necessity to survive in a specific context-environment, and the part, on the contrary, connected to characteristics which are more intrinsic and personal, but also more stable over time.
In actual fact, distinctive traits organically structured, or, in other words, natural distinctive features that cannot be easily modified for example in a person’s character. In particular, character traits specify and distinguish people, constituting a “basic item”, an original and congenital structure or framework that cannot be altered by individual choice. Therefore, consumer behaviour can be considered the essence of three interacting spheres: 1) natural distinctive features of the individual, which are
not easily altered; 2) personality, the complex of mental, moral and intellectual qualities that distinguish the actor; 3) the social environment, in which a person lives.
Amongst these, distinctive traits elements capable of inspiring more stable consumer behaviour emerge. Accordingly, the results of our research establish that since characteristic traits represent an objective limit, intrinsic to the actor’s personality as regards choice, they constitute a fixed sphere, and, as such can more or less guarantee a sort of continuity in consumer behaviour. Consequently, by identifying distinctive characteristic traits, peculiar to the consumer, (e.g. Jung Test about personality) permanent features of mass consumption can be defined, or, in other words, consumer behaviour that is less discontinuous over time and therefore able to generate a lasting and defendable competitive advantage for the organisations.
During the field research phase we have assessed the conceptual validity of our model identifying tourist behaviour as an observed variable and its characteristic traits, duly classified, as a latent variable. Applied research will be developed with specific reference to tourism service products since they are the ultimate expression of life style, in the face of which, it is possible to identify an individual generating characteristic trait.
Key words: segmentation, distinctive characters, character traits

I n t e r n a t i o n a l J o u r n a l o f M a n a g e m e n t C a s e s
26
1. Foreword and purposesBusiness management research has examined with great interest, and from many points of observation, the function of potential or expressed demand on the part of the market, in order to identify segments which are accessible and profitable for firms, above all in the long term(Yeung, Wyer, 2004). The process of segmentation, consequently, acquires a strategic value, imperative for any organisation, leaving wide opportunities for choice in terms of methods of application, based on specific company aims (Busacca., 2004). In literature, different perspectives of analysis with reference to the concept of market segmentation can be identified. They all, however, have the common aim of tracing substantial functional differences in terms of client response to marketing stimulus. From a brief overview of scientific research a fundamental principle emerges (Mazzoni, 2006.), confirming how the segmentation process does not correspond to an objective reconstruction of existing demand subdivision, but rather, constitutes an interpretation based on the variables involved (Wedel., Kamakura, 2002.).
For our purposes a reflection on the logics underpinning the process, focusing on the basic constructs/principles from which to proceed to market segmentation, would be more fruitful, projected as they are, towards identifying the variables against which the degree of heterogeneity of the functions of consumer demand can be measured (Heilman, Bowman, 2002) . This perspective bases assessment on both the modality of data processing on which the analysis stands (Otter et al., 2004.) as well as the object under observation, which could be the individual himself or his consumer status, by resorting respectively, to methods which are more or less intrusive, or by means of product specific methodology (Andrews, Currim, 2003,; Allenby G., et Al., 2002). However, if consumption can no longer be considered uniquely as a sphere of activity on a par with other functions carried out by the individual, but qualified, on the contrary, more and more frequently as a “cultural sphere capable of creating a personal vision of the world, a system of values and a structure of specific personality” (Siri, 2001), then a reflection on the concept of individual identity rather than a consumer analysis should be the focus
(Brangule-Vlagsma K., Pieters R. G.M., Wedel M., 2002). Consequently there is a shift from the idea of a concept of identity of an integral and stable subject to an image of active negotiation of identity on the part of an individual (symbolic interaction) and a more fragmented image giving origin to a dramatization of life (Goffman E, 1974.). A natural consequence is the adhesion to a new paradigm of consumption that prospects a holistic portrait of a consumer, first and above all, individual and then social actor and subsequently, protagonist of the ritual of consumption on an interactive circuit (Jonker J-J., Piersma N., Van den Poel D., 2004).
Furthermore, the consumer is considered strongly guided in his choices by stimulus that is difficult to observe, but for this very reason of greater value for firms that succeed first in defining the same.
In actual fact, distinctive individual traits exist, composed in a kind of organic structure, that seem to ensure behaviour with a dimension of permanence and invariance in space and time (Abbagnano A., 2001). Character traits, accordingly, specify and distinguish a person, and constitute a “consolidated fact”, a unique and congenital structure, that cannot be modified on the basis of an individual’s will. Character, accordingly, refers to how an individual acts in a given situation in life and determines how personality is manifested, conferring continuity to an individual’s experience. On the whole, the behaviour of a consumer can be considered a synthesis of the actions of the three interacting spheres, i.e. the natural distinctive marks of an individual, not easily modified, personality, as a compound of psychic, moral and intellectual qualities that distinguish the subject, and the social environment in which a person interacts with others (fig. 2).
Amongst the three, the distinctive markers seem like elements capable of influencing consumer behaviour that is more stable in the long term, on account of their rigid structure, deeply rooted in the individual, congenital, unalterable (Williams, 1988). The sphere that seems to remain more stable and as such, able to guarantee continuity in a certain sense to consumer behaviour, is that attributed to the distinctive character traits of the consumer (fig. 3)
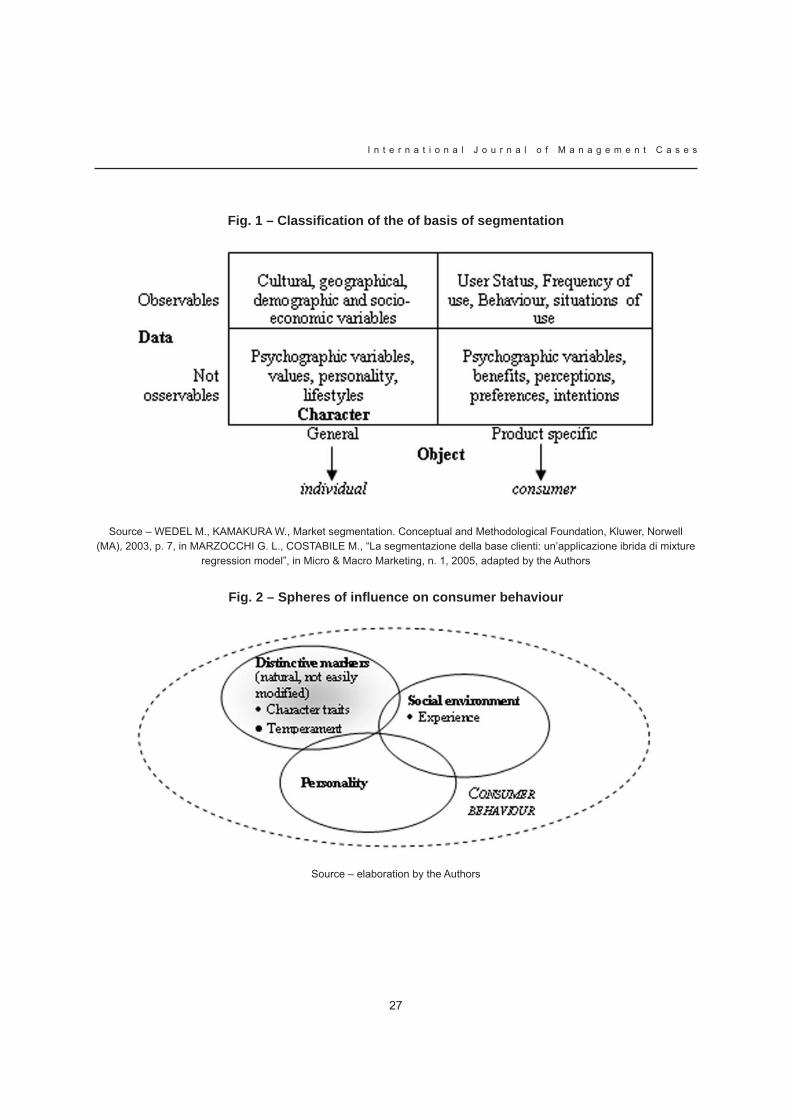
27
I n t e r n a t i o n a l J o u r n a l o f M a n a g e m e n t C a s e s
Fig. 1 – Classification of the of basis of segmentation
Source – WEDEL M., KAMAKURA W., Market segmentation. Conceptual and Methodological Foundation, Kluwer, Norwell (MA), 2003, p. 7, in MARZOCCHI G. L., COSTABILE M., “La segmentazione della base clienti: un’applicazione ibrida di mixture
regression model”, in Micro & Macro Marketing, n. 1, 2005, adapted by the Authors
Fig. 2 – Spheres of influence on consumer behaviour
Source – elaboration by the Authors

I n t e r n a t i o n a l J o u r n a l o f M a n a g e m e n t C a s e s
28
Fig. 3 – Traits, tendencies, behaviours
Source – elaboration by the Authors
It follows that by identifying such traits, contexts of permanence of the consumer system or, in other words, consumer behaviour which is more constant over time can be classified (Cattell, 1966). The ability to identify character traits, or in other words, to study their expression over time, offers a key for acquiring knowledge relevant for the market, taking into account the type of resource being dealt with, i.e. the consumer – a rare resource and for this reason, highly desirable in the eyes of enterprises.
Deciphering character orientations can enable the mapping of the market consolidated over time, from which to subsequently draw strategic indications in terms of segmentation to the advantage of organisations that operate there.
2. A theory of segmentation by character traitsOur research aims to define the degree of heterogeneity manifested by the functions of demand in relation to the variable “character” (Rapagli A., 2005; Thomson L., 1999). To this aim, in-depth discussions and assessments with regard to the appropriateness of the tools to use (Dalli D., Romani S., 2003) and, above all, to the theoretical matrix to refer to, all converge convincingly, in the direction of Jung’s theory (Jung C.G., 1977)
regarding the possibility of identifying specific fundamental ways with which we face reality. Jung proposes in particular, two variables that determine the individual, or, in other words, typical way a subject has, of interacting with others, i.e. introversion and extroversion.
Hence, in general terms, the consumer whose personality is classified as extrovert is characterised by greater objectivity in terms of decision making relative to purchases and by a marked commonsense, matter-of-factness in his/her consumer behaviour in core offer terms. On the contrary, a consumer classified as introvert may move in the direction of a commercial offer on the basis of the image held of that product rather than for its technical-functional attributes or for the performance it can guarantee. To complete the picture, an individual presents four distinct ways – or functions – awareness of and interaction with, the environment, determining the emerging of a specific psychological category; of the four functions of the conscious psyche, in the sense of cardinal personality traits , two are defined rational (thinking and feeling) and two irrational (sensation and intuition); the combined presence of all four functions in the same individual is a recognised/accepted fact, however, in each individual there is a predominating function by which he/she is guided in contingent situations (fig. 4).

29
I n t e r n a t i o n a l J o u r n a l o f M a n a g e m e n t C a s e s
Fig. 4 – Psychological categories
Accordingly, rational consumer behaviour can respond in an adequate manner to characteristics of the reflexive type (the thinking function), of which the affective component constitutes an integral part of emotive behaviour; furthermore, a sensorial consumer tends towards creating marketplace relations of a hedonistic kind; in conclusion, the intuitive consumer is particularly attracted towards innovative offers, and totally relaxed with imagining future outcomes.
To sum up: each to their own choice!
2.1 Empirical assessment and methodology: segmentation by character traits in the tourist sectorThese postulates have to be verified by field research. It is our intention in this study to segment customers on the basis of the character traits described above and in this respect, having once established which segmentation variables to use, the efficacy of our approach can be tested by its application to the tourist sector (Ortolani G., 2005; Simonicca A., 2004).
The advantage of using customer segmentation by character traits, as long as it fully satisfies
the requisites that segments need to have to be identified as profitable for an enterprise (Lambin J.J., 2004) lies in its long term stability status as well as in the relevant exhaustiveness of the client-profile, which component is not always easily achieved with criteria in use at the present time, tending as they do, to extrapolate segments that are changeable “over time” and “at the same time” due to consumer choice (Ciani S., 2006) or for reasons of opportunity (Franch M., et al., 2006) (tab. 1).
On the contrary, by means of Jung type categories, in this research we aim to pursue the construct of a proposal of segmentation based on non-observable variables, articulated in eight clusters, considered particularly attractive, not least, by virtue of the growth potential expressed by the tourism formulas they refer to (Tirelli T., 2005).
The segments highlighted have been extrapolated by taking into consideration the trends, or in other words, the principal attitudes – extroverts vs. introverts – the predominant function – thinking, feeling, sensation, intuition – and the tendency on which an individual relies to deal with reality outside – judgemental vs. perceptive – (tab. 2).
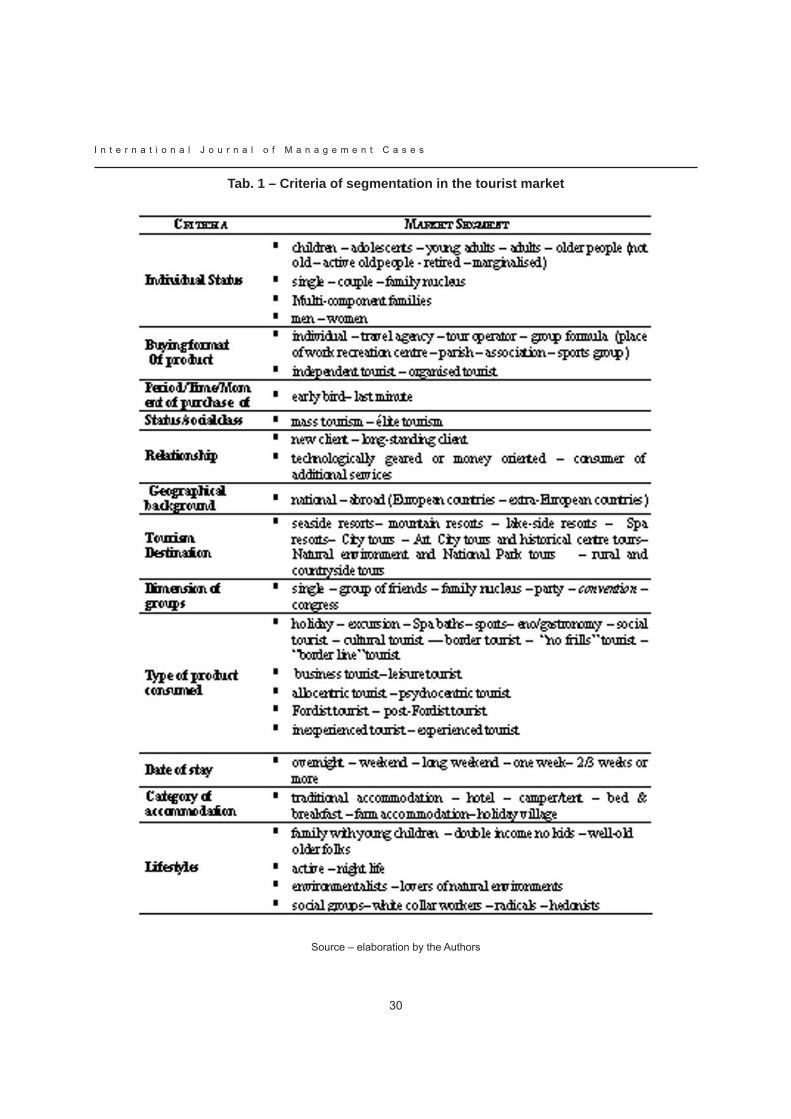
I n t e r n a t i o n a l J o u r n a l o f M a n a g e m e n t C a s e s
30
Tab. 1 – Criteria of segmentation in the tourist market
Source – elaboration by the Authors
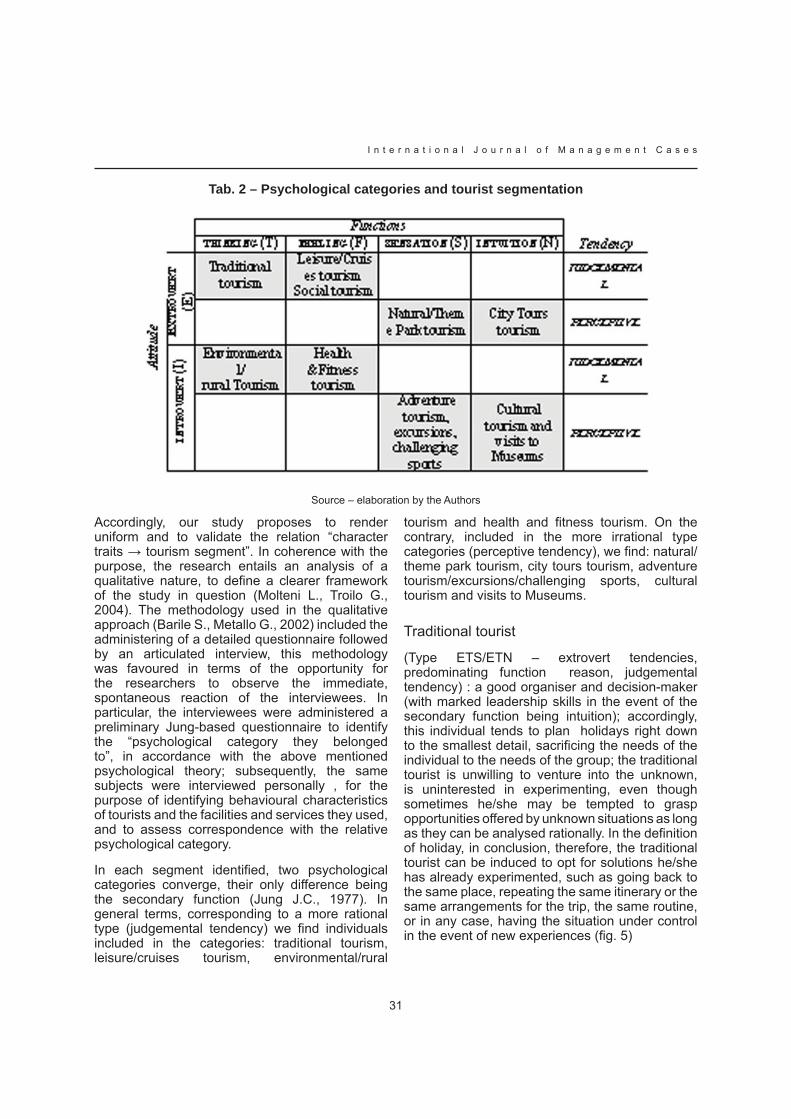
31
I n t e r n a t i o n a l J o u r n a l o f M a n a g e m e n t C a s e s
Tab. 2 – Psychological categories and tourist segmentation
Source – elaboration by the Authors
Accordingly, our study proposes to render uniform and to validate the relation “character traits → tourism segment”. In coherence with the purpose, the research entails an analysis of a qualitative nature, to define a clearer framework of the study in question (Molteni L., Troilo G., 2004). The methodology used in the qualitative approach (Barile S., Metallo G., 2002) included the administering of a detailed questionnaire followed by an articulated interview, this methodology was favoured in terms of the opportunity for the researchers to observe the immediate, spontaneous reaction of the interviewees. In particular, the interviewees were administered a preliminary Jung-based questionnaire to identify the “psychological category they belonged to”, in accordance with the above mentioned psychological theory; subsequently, the same subjects were interviewed personally , for the purpose of identifying behavioural characteristics of tourists and the facilities and services they used, and to assess correspondence with the relative psychological category.
In each segment identified, two psychological categories converge, their only difference being the secondary function (Jung J.C., 1977). In general terms, corresponding to a more rational type (judgemental tendency) we find individuals included in the categories: traditional tourism, leisure/cruises tourism, environmental/rural
tourism and health and fitness tourism. On the contrary, included in the more irrational type categories (perceptive tendency), we find: natural/theme park tourism, city tours tourism, adventure tourism/excursions/challenging sports, cultural tourism and visits to Museums.
Traditional tourist
(Type ETS/ETN – extrovert tendencies, predominating function reason, judgemental tendency) : a good organiser and decision-maker (with marked leadership skills in the event of the secondary function being intuition); accordingly, this individual tends to plan holidays right down to the smallest detail, sacrificing the needs of the individual to the needs of the group; the traditional tourist is unwilling to venture into the unknown, is uninterested in experimenting, even though sometimes he/she may be tempted to grasp opportunities offered by unknown situations as long as they can be analysed rationally. In the definition of holiday, in conclusion, therefore, the traditional tourist can be induced to opt for solutions he/she has already experimented, such as going back to the same place, repeating the same itinerary or the same arrangements for the trip, the same routine, or in any case, having the situation under control in the event of new experiences (fig. 5)
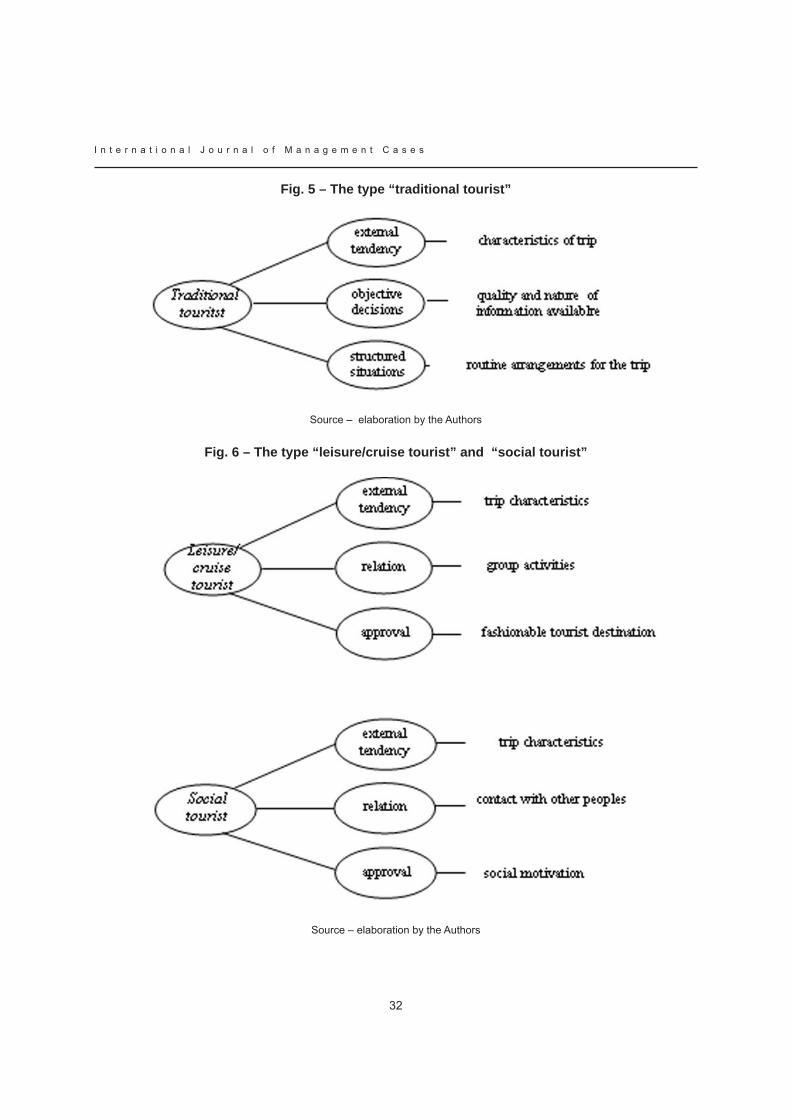
I n t e r n a t i o n a l J o u r n a l o f M a n a g e m e n t C a s e s
32
Fig. 5 – The type “traditional tourist”
Source – elaboration by the Authors
Fig. 6 – The type “leisure/cruise tourist” and “social tourist”
Source – elaboration by the Authors
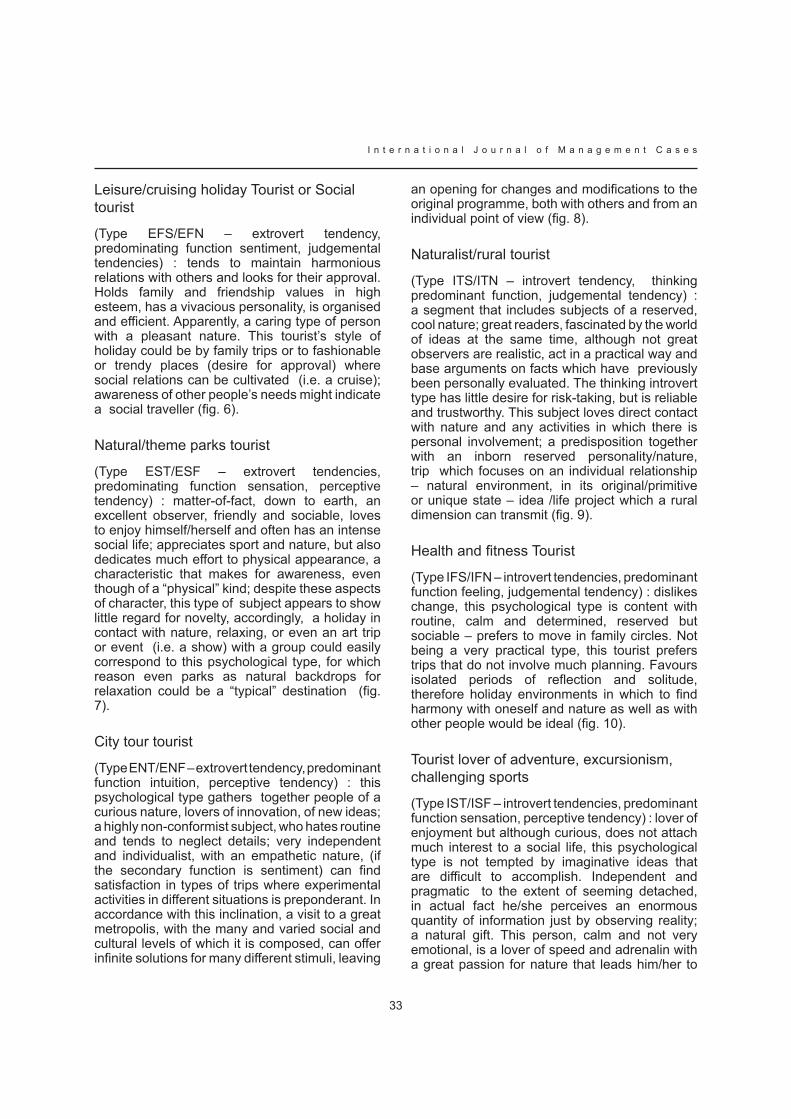
33
I n t e r n a t i o n a l J o u r n a l o f M a n a g e m e n t C a s e s
Leisure/cruising holiday Tourist or Social tourist
(Type EFS/EFN – extrovert tendency, predominating function sentiment, judgemental tendencies) : tends to maintain harmonious relations with others and looks for their approval. Holds family and friendship values in high esteem, has a vivacious personality, is organised and efficient. Apparently, a caring type of person with a pleasant nature. This tourist’s style of holiday could be by family trips or to fashionable or trendy places (desire for approval) where social relations can be cultivated (i.e. a cruise); awareness of other people’s needs might indicate a social traveller (fig. 6).
Natural/theme parks tourist
(Type EST/ESF – extrovert tendencies, predominating function sensation, perceptive tendency) : matter-of-fact, down to earth, an excellent observer, friendly and sociable, loves to enjoy himself/herself and often has an intense social life; appreciates sport and nature, but also dedicates much effort to physical appearance, a characteristic that makes for awareness, even though of a “physical” kind; despite these aspects of character, this type of subject appears to show little regard for novelty, accordingly, a holiday in contact with nature, relaxing, or even an art trip or event (i.e. a show) with a group could easily correspond to this psychological type, for which reason even parks as natural backdrops for relaxation could be a “typical” destination (fig. 7).
City tour tourist
(Type ENT/ENF – extrovert tendency, predominant function intuition, perceptive tendency) : this psychological type gathers together people of a curious nature, lovers of innovation, of new ideas; a highly non-conformist subject, who hates routine and tends to neglect details; very independent and individualist, with an empathetic nature, (if the secondary function is sentiment) can find satisfaction in types of trips where experimental activities in different situations is preponderant. In accordance with this inclination, a visit to a great metropolis, with the many and varied social and cultural levels of which it is composed, can offer infinite solutions for many different stimuli, leaving
an opening for changes and modifications to the original programme, both with others and from an individual point of view (fig. 8).
Naturalist/rural tourist
(Type ITS/ITN – introvert tendency, thinking predominant function, judgemental tendency) : a segment that includes subjects of a reserved, cool nature; great readers, fascinated by the world of ideas at the same time, although not great observers are realistic, act in a practical way and base arguments on facts which have previously been personally evaluated. The thinking introvert type has little desire for risk-taking, but is reliable and trustworthy. This subject loves direct contact with nature and any activities in which there is personal involvement; a predisposition together with an inborn reserved personality/nature, trip which focuses on an individual relationship – natural environment, in its original/primitive or unique state – idea /life project which a rural dimension can transmit (fig. 9).
Health and fi tness Tourist
(Type IFS/IFN – introvert tendencies, predominant function feeling, judgemental tendency) : dislikes change, this psychological type is content with routine, calm and determined, reserved but sociable – prefers to move in family circles. Not being a very practical type, this tourist prefers trips that do not involve much planning. Favours isolated periods of reflection and solitude, therefore holiday environments in which to find harmony with oneself and nature as well as with other people would be ideal (fig. 10).
Tourist lover of adventure, excursionism, challenging sports
(Type IST/ISF – introvert tendencies, predominant function sensation, perceptive tendency) : lover of enjoyment but although curious, does not attach much interest to a social life, this psychological type is not tempted by imaginative ideas that are difficult to accomplish. Independent and pragmatic to the extent of seeming detached, in actual fact he/she perceives an enormous quantity of information just by observing reality; a natural gift. This person, calm and not very emotional, is a lover of speed and adrenalin with a great passion for nature that leads him/her to
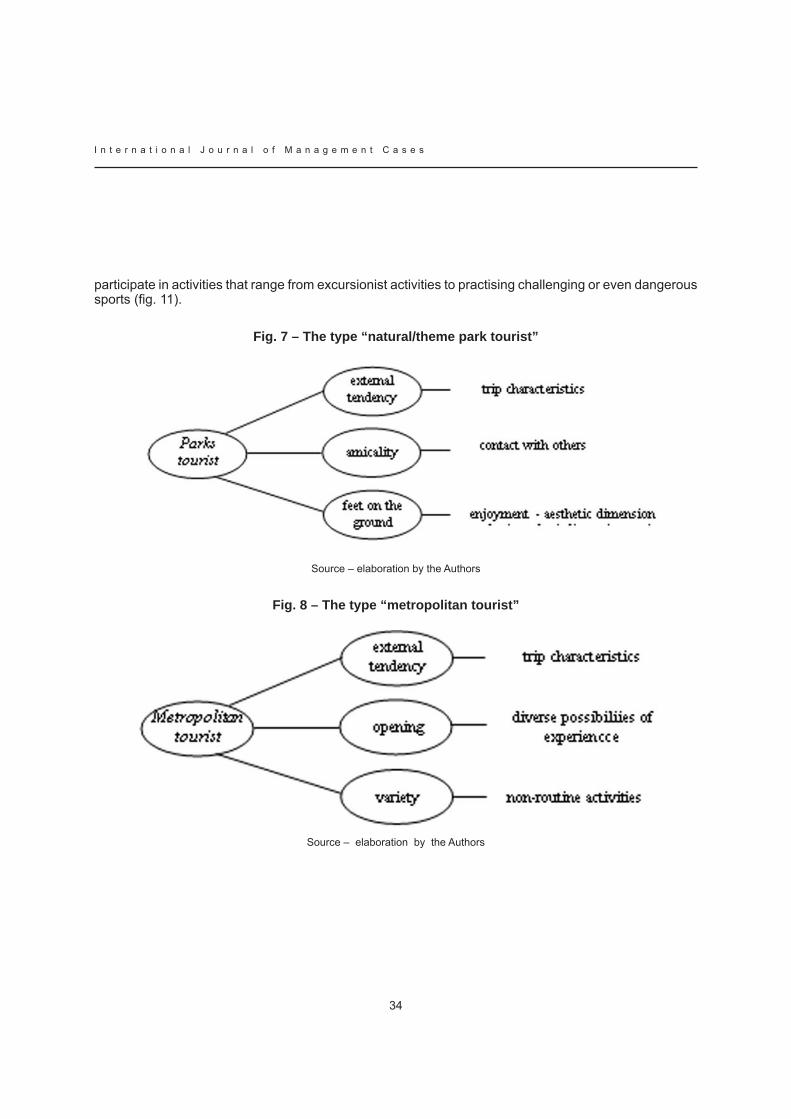
I n t e r n a t i o n a l J o u r n a l o f M a n a g e m e n t C a s e s
34
participate in activities that range from excursionist activities to practising challenging or even dangerous sports (fig. 11).
Fig. 7 – The type “natural/theme park tourist”
Source – elaboration by the Authors
Fig. 8 – The type “metropolitan tourist”
Source – elaboration by the Authors
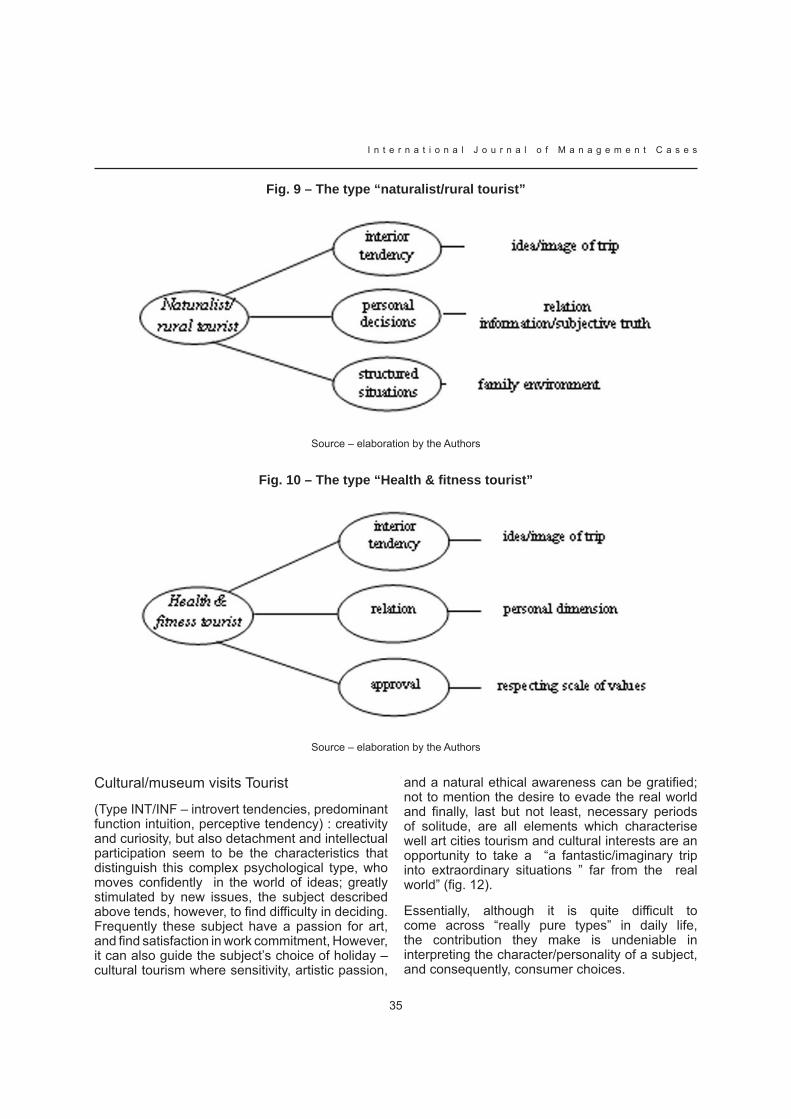
35
I n t e r n a t i o n a l J o u r n a l o f M a n a g e m e n t C a s e s
Fig. 9 – The type “naturalist/rural tourist”
Source – elaboration by the Authors
Fig. 10 – The type “Health & fitness tourist”
Source – elaboration by the Authors
Cultural/museum visits Tourist
(Type INT/INF – introvert tendencies, predominant function intuition, perceptive tendency) : creativity and curiosity, but also detachment and intellectual participation seem to be the characteristics that distinguish this complex psychological type, who moves confidently in the world of ideas; greatly stimulated by new issues, the subject described above tends, however, to find difficulty in deciding. Frequently these subject have a passion for art, and find satisfaction in work commitment, However, it can also guide the subject’s choice of holiday – cultural tourism where sensitivity, artistic passion,
and a natural ethical awareness can be gratified; not to mention the desire to evade the real world and finally, last but not least, necessary periods of solitude, are all elements which characterise well art cities tourism and cultural interests are an opportunity to take a “a fantastic/imaginary trip into extraordinary situations ” far from the real world” (fig. 12).
Essentially, although it is quite difficult to come across “really pure types” in daily life, the contribution they make is undeniable in interpreting the character/personality of a subject, and consequently, consumer choices.
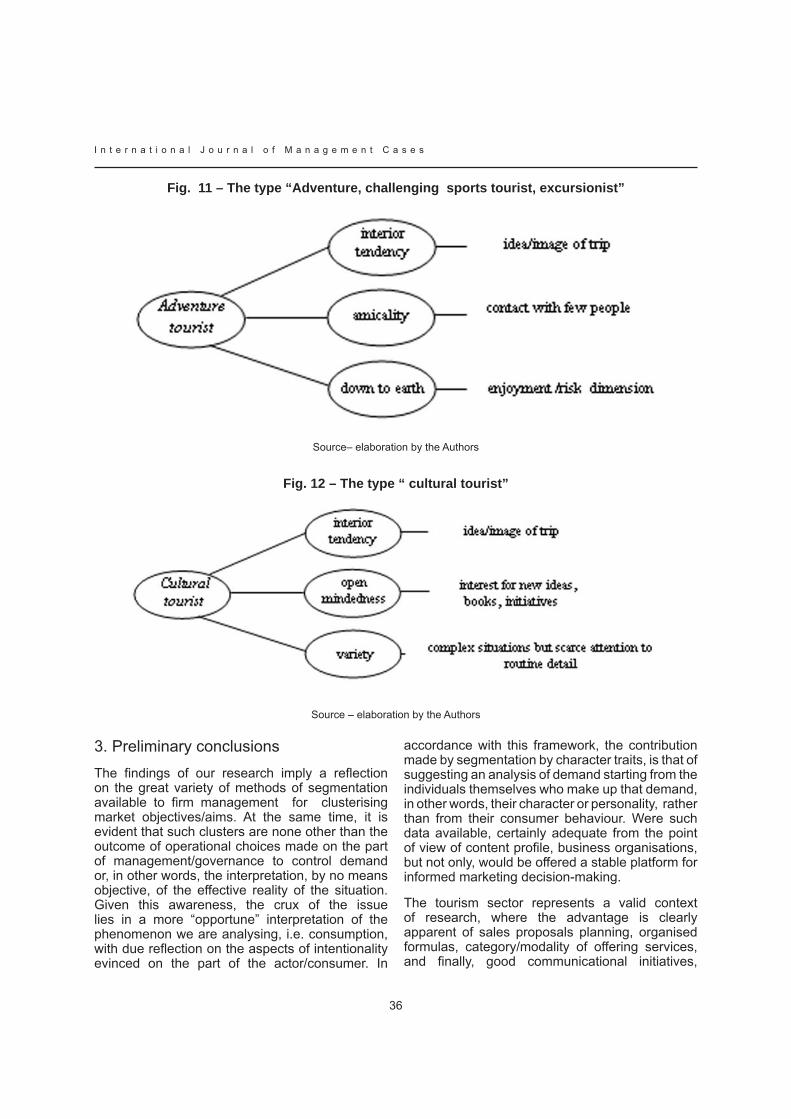
I n t e r n a t i o n a l J o u r n a l o f M a n a g e m e n t C a s e s
36
Fig. 11 – The type “Adventure, challenging sports tourist, excursionist”
Source– elaboration by the Authors
Fig. 12 – The type “ cultural tourist”
Source – elaboration by the Authors
3. Preliminary conclusionsThe findings of our research imply a reflection on the great variety of methods of segmentation available to firm management for clusterising market objectives/aims. At the same time, it is evident that such clusters are none other than the outcome of operational choices made on the part of management/governance to control demand or, in other words, the interpretation, by no means objective, of the effective reality of the situation. Given this awareness, the crux of the issue lies in a more “opportune” interpretation of the phenomenon we are analysing, i.e. consumption, with due reflection on the aspects of intentionality evinced on the part of the actor/consumer. In
accordance with this framework, the contribution made by segmentation by character traits, is that of suggesting an analysis of demand starting from the individuals themselves who make up that demand, in other words, their character or personality, rather than from their consumer behaviour. Were such data available, certainly adequate from the point of view of content profile, business organisations, but not only, would be offered a stable platform for informed marketing decision-making.
The tourism sector represents a valid context of research, where the advantage is clearly apparent of sales proposals planning, organised formulas, category/modality of offering services, and finally, good communicational initiatives,

37
I n t e r n a t i o n a l J o u r n a l o f M a n a g e m e n t C a s e s
taking into account the character traits of the targets/customers. To corroborate our theoretical approach nevertheless, the wider supply system of consumer goods has to be monitored. The findings of our present research clearly, constitute in this context, not a point of arrival but simply the starting point – a basis for a more structured kind of research, from which, we are confident, evidence, in statistic terms, will emerge, to demonstrate scientifically, the accuracy of what, at the present time, are pure assumptions.
EndnotesFour dimensions are identified, indicating 1. consumers as the subjects of the present analysis: they extract and use their own energy, collect and manage information, make decisions and organise their lives.
When the predominant function in the 2. consumer is identified as feeling, rationality is in a lower sphere and vice versa. Based on the theories of introversion and extroversion and of the four dimensions, a system of psychological categories is thus established
In this sense, consumption of solidarity 3. products could be privileged or consumer choices could be directed at firms that privilege ethical or eco-friendly conduct.
The questionnaire is purely a basis for the 4. interview itself; the questions are organised in two macro areas of interest: the first, to identify the socio-status details of the interviewees, to cross check with elaborated data on preferences and behaviour; the second, to identify behavioural characteristics of tourists, reasons for choice, activities carried out and services requested. 30 interviews were carried out using this methodology.
The extrovert thinking type, in conformity 5. with the definition, confers decisional power on objective reality and on objective data, directing choices towards conclusions of an intellectual nature or corresponding to universally valid ideas. Accordingly, consumer behaviour will reflect these tendencies and resolute-type predisposition.
In the extrovert feeling type the primary 6. function – feeling – is adapted to external reality and concords with objective values.
The extrovert, sensorial type has an 7. exceptionally well-developed objective sense of events; sensations are prevalently determined by an object and dependent on it. Information is acquired through sensations, but with difficulty transmuted into experience.
Intuition in the extrovert, intuitive type is 8. directed at the search for opportunities in objective data, from which is noted a marked dependence on external situations in terms of future projections.
The introvert thinking type is characterised 9. by the focus on ideas, that do not originate from objective reality, but rather, subjectively, showing with respect to the former, a certain sense of detachment or disinterest.
The feeling introvert type more or less, is 10. guided by his/her own feelings, being of a subjective nature, it is extremely difficult to grasp the motivation that inspires behaviour.
The introvert sensorial type relates with the 11. context on the basis of the intensity of the subjective sensorial component, as stimulated by objective data, to the point of behaving irrationally, in that he/she is guided on the basis of what happens and not with reference to rational judgement.
The introvert intuitional type is guided 12. essentially towards subjective images of events that do not occur in real life, consequently, they belong to a person’s subjective dimension. This is the reason why this psychological type has a dreamy and mystical nature, like an artist.
BibliographyABBAGNANO A. (2001), Dizionario di filosofia, Torino: Utet
ALLENBY G., ET AL. (2002), Market Segmentation Research: Beyond Within and Across Group Differences, Marketing Letters, issue 13/3
ALLPORT G. W., (1927),Concept of trait and personality, Psychological Bulletin, Vol. 24

I n t e r n a t i o n a l J o u r n a l o f M a n a g e m e n t C a s e s
38
ANDREWS R. L., CURRIM I. S., (2003), Retention of latent segments in regression-based marketing models, International Journal of Research in Marketing, Vol. 20
BARILE S., METALLO G., (2002), Le ricerche di mercato. Aspetti metodologici e applicativi, ed. 2, Torino: Giappichelli
BIJMOLT T. H.A, PAAS L. JU., VERMUT J. K., (2004), Country and consumer segmentation: Multi-level latent class analysis of financial product ownership, International Journal of Research in Marketing, Vol. 21
BRANGULE-VLAGSMA K., PIETERS R. G.M., WEDEL M., (2002), The dynamics of value segments: modeling framework and empirical illustration, International Journal of Research in Marketing, Vol. 19
BUSACCA B., (2004), Consumatore, concorrenza e valore. Una prospettiva di marketing, Milano: Egea
CATTELL R.B., (1966), The scientific analysis of personality, Chicago: Aldine
CECCARELLO L.(2004), Psicologia della scrittura e tratti del carattere, in www.aprespa.it, giugno 2004
CERVONE D., (2005), Personality Architecture: Within-Person Structures and Processes, Annual Review of Psychology, Vol. 56
CIANI S., (2006), L’elisir della montagna. Il wellbeing per evadere dallo stress quotidiano, PsicoLab, 3/05/2006, www. psicolab.net
DALLI D., ROMANI S., (2001), Acquirenti e processi d’acquisto dei prodotti di marca commerciale, LUGLI G. (edited by), Branding distributivo, Milano: Egea
DALLI D., ROMANI S.(2003), Il comportamento del consumatore, Milano: Franco Angeli, II° ed.
DI NALLO E. (1998), Quale marketing per la società complessa?, Milano: FrancoAngeli,
FRANCH M., MARTINI U., NOVI INVERARDI P. L., BUFFA F.(2006), Una metodologia per lo studio del comportamento del turista: dall’individuazione dei profili alla formulazione di strategie di
marketing per le destinazioni turistiche, Mercati & Competitività, n. 1
GOFFMAN E. (1974), Frame analysis, Cambridge: Harvard University Press
HEILMAN C. M., BOWMAN D. (2002), Segmenting consumers using multiple-category purchase data, International Journal of Research in Marketing, Vol. 19
ISNART – Istituto Nazionale Ricerche Turistiche, Osservatorio nazionale sul Turismo italiano. Estate 2006, il turismo in Italia ha più velocità: più prodotti per più turisti soprattutto stranieri, 3° Rapporto Indagine sulle prenotazioni/presenze nelle aree turistiche leader e sui segmenti di prodotto, Roma
JONKER J-J., PIERSMA N., VAN DEN POEL D. (2004), Joint optimization of customer segmentation and marketing policy to maximize long-term profitability, Expert Systems with Applications, Vol. 27
JUNG C. G. (1977), Psychologische Typen, ed. it. Tipi psicologici, Torino: Universale scientifica Boringhieri, Torino
KELMAN H. C. (2006), Interests, relationship, identities: Three Central Issues for Individuals and Groups in Negotiating Their Social Environment, Annual Review of Psychology, Vol. 57
LAMBIN J. J. (2004), Marketing strategico e operativo. Market-driven management, Milano: McGraw-hill
LEARY M. R. (2007), Motivational and emotional aspects of the self, Annual Review of Psychology, Vol. 58
MARZOCCHI G. L., COSTABILE M. (2005), La segmentazione della base clienti: un’applicazione ibrida di mixture regression model, Micro & Macro Marketing, n. 1
MAZZONI C. (2006), Scelte di consumo e reti del valore nella comunicazione mobile, Roma: Carocci editore
MOLTENI L., TROILO G (2003)., Ricerche di marketing, Milano: McGraw-Hill
NEISSER U., (edited by) (1999), La percezione del sé. Le fonti ecologiche e interpersonali della conoscenza di sé, Torino: Bollati Boringhieri

39
I n t e r n a t i o n a l J o u r n a l o f M a n a g e m e n t C a s e s
ORTOLANI G. (2006), Tendenze del turismo incoming in Italia e nel mondo, L’ITALIA E IL TURISMO INTERNAZIONALE NEL 2005, Ufficio Italiano dei Cambi, Venezia, 11 aprile 2006, www.uic.it
OTTER T., TÜCHLER R., FRQHWIRTH-SCHNATTER S. (2004), Capturing consumer heterogeneity in metric conjoint analysis using Bayesian mixture models, International Journal of Research in Marketing, Vol. 21
RAPAGLI A .(2005), La personalità di base anche per una scelta creativa del setting, intervento del 25/11/06, L’Io creativo e il Sé spontaneo, Conference Proceedings, Istituto Mosaico Psicologie, Bologna
SIMONICCA A. (2004), Turismo e società complesse. Saggi antropologici, Roma: Meltemi Editore
SIRI G. (2001), La psiche del consumo. Consumatori, desiderio e identità, Milano: Franco Angeli
STEENKAMP J-B. E.M., HOFSTEDE F. T. (2002), International market segmentation: issues and perspectives, International Journal of Research in Marketing, Vol. 19
THOMSON L. (1999), Il libro dei tipi psicologici, Roma: Casa editrice Astrolabio
TRIANDIS H. C., SUH E. M. (2002), Cultural influences on personality, Annual Review of Psychology, Vol. 53
WALKER B. M., WINTER D. A. (2007), The Elaboration of Personal Construct Psychology, Annual Review of Psychology, Vol. 58
WEDEL M., KAMAKURA W. (2002), Editorial. Introduction to the Special Issue on Market Segmentation, International Journal of Research in Marketing, Vol. 19
WILLIAMS K. C. (1988), Psicologia per il marketing, Bologna: Il Mulino
YEUNG C. W.M., WYER R. S. JR (2004), Affect, Appraisal, and Consumer Judgment, Journal of Consumer Research, Vol. 31

I n t e r n a t i o n a l J o u r n a l o f M a n a g e m e n t C a s e s
40
RELIGIOUS PILGRIMAGES AS MULTIFUNCTIONAL JOURNEYS: A CASE STUDY OF RELIGIOUS PILGRIMAGES IN
SOUTH AFRICA
FELICITE FAIRER-WESSELSDEPARTMENT OF TOURISM MANAGEMENT, UNIVERSITY OF PRETORIA, SOUTH AFRICA
Abstract
Pilgrimages are normally viewed from a religious or spiritual perspective. The connections between tourism and religion are many, and the question that arises is: what do pilgrimages and tourism have in common? Although theologians emphatically state that modern tourism is not a pilgrimage, pilgrimages can be viewed as the ancient forerunners of modern tourism. Since ancient times pilgrimages have been seen within a religious context, and are usually discussed in terms of religious tourism in the literature.
A pilgrimage is a phenomenon linked to all religions. It was a feature of primitive religions and was deeply rooted in small tribal communities and connected to the worship of so-called holy places and ancestor cult. The great epoch of pilgrimage in all world religions continues to this day. Some authors estimate that in the period between the 12th and 15th centuries over 30% of the world’s population was on a pilgrimage towards one of the 10,000 places of pilgrimage then shown and recognized. At the heart of religious teaching is humankind’s spiritual need to continually search for, and find true values, that is, “the truth”. Christian theology says that such a search in human history is called pilgrimage – man’s “religiously motivated journey to a sacred place” in search of the sacred.
For purposes of this paper two religious pilgrimage case studies within the South African context are elucidated: the Zion Christian Church that is the largest of the African Independent Churches in SA with more than several million members observing the tradition for more than 80 years, at the largest pilgrimage over Easter at Zion City, Moria, in Limpopo Province. The two smaller pilgrimages occur in September and over Christmas.
The second case study is the Nazareth Baptist Church, commonly referred to as the Shembe Church in Inanda, KwaZulu-Natal Province, also with more than between two and four million pilgrims embarking on three annual pilgrimages in January, July and October to pay homage to their ancestors and gods in the Nhlangakazi mountains near Ndwedwe, in Judia and Ematabetula near Inanda.
When we speak of pilgrimages and tourism simultaneously, we are referring to the interrelationship and interaction between tourism and religion, the broad relationship between religion and social phenomena. Religion and tourism, as phenomena undergo constant change. Tourism can be regarded as a kind of pilgrimage of modern civilization based on the motives of tourist movements on the one hand and the motives of pilgrimages on the other. Religious tourism is connected, more than one would expect, to other types of tourism, especially to holiday and cultural tourism, and social and group tourism. In history, religious journeys always were multifunctional journeys, even when the religious factors seemed to dominate. In the case of the above case studies, these factors still appear to dominate.
Keywords: religious pilgrimages, multifunctional journeys, South Africa
IntroductionIn this paper the phenomenon of pilgrimages will be discussed within a global context. Initially viewing them as religious journeys within a spiritual context, but also what pilgrimages have become, that is considering the wider sociological practise

41
I n t e r n a t i o n a l J o u r n a l o f M a n a g e m e n t C a s e s
of groups of people moving, but also as tourists on multifunctional journeys.
The focus of the article will be on what motivates people to undertake a religious pilgrimage and how this journey has become a multifaceted experience.
Research MethodThe paper is based largely on desk research and singular primary interviews with selected members from the Zionist and Nazareth Baptist Churches. Due to time constraints the author has not personally experienced any of the mentioned pilgrimages, but has visited the sites where some of the pilgrimages take place.
Although a purposive qualitative research method was employed, and information rich data obtained, the ideal would be a simultaneous quantitative survey reaching a large proportion of the target population in both cases, i.e. the Zionists and the Nazareth Baptists. The initial findings will briefly be discussed, although no generalisations can be made.
Pilgrimages within the tourism contextPilgrimages are normally viewed from a religious or spiritual perspective. The connections between tourism and religion are many, and the question to be asked is: what do pilgrimages and tourism have in common? Although theologians emphatically state that modern tourism is not a pilgrimage, pilgrimages can be viewed as the ancient forerunner of modern tourism (Vukonic, 1996: 135). Pilgrimage is a phenomenon linked to all religions. It was a feature of primitive religions and was deeply rooted in small tribal communities and connected to the worship of so-called holy places and ancestor cult (MacCannel, 2002: 269). Sometimes the development of pilgrimage was also linked to trade routes, such as the Silk Route in the Far East or the Incense Road in Arabia. The most regular travellers in ancient times were pilgrims who gathered in great numbers at well-known shrines on religious holidays. The greatest number of places of pilgrimage was in Greece, with the best-known and visited shrine being Apollo’s oracle at Delphi. Places of pilgrimage “to satisfy all tastes” developed, and such destinations such a as Rome, Fatima, Lourdes, Santiago de
Compostela, Mecca, Jerusalem and other places of pilgrimage still bear witness to their popularity and economic strength (Vukonic, 1996: 20).
The great epoch of pilgrimage in all world religions continues to this day. Some authors estimate that in the period between the 12th and 15th centuries, over 30% of the world’s population was on a pilgrimage toward one of the 10,000 places of pilgrimage then shown and recognized (Foster, 1982). At the heart of religious teaching is humankind’s spiritual need to continually search for and find true values, that is, “the truth” (Vukonic, 1992:79-91). Christian theology says that such a search in human history is called pilgrimage – man’s “religiously motivated journey to a sacred place” in search of the sacred (Hudson & Jackson, 1992: 1081; Jackowski & Smit, 1992: 93). In Biblical tradition, travel is the symbol of religious discovery. “To travel a new road always means to expose one’s life to the unexpected and the sacred” (O’Grady, 1982:74-75). Today cyberspace is also a form of travel through “virtual realities” where people electronically go to sacred sites, and “virtual pilgrimages” is an Internet neologism for destinations on the Www where pilgrims can travel for educational, economic and spiritual purposes (http://it.stlawu.edu/.., 2004). According to tradition pilgrimages are made to Jerusalem once in a lifetime by Jews of the Diaspora (Vukonic, 1996:123), and by Moslems to Mecca. In South Africa, two large religious groups of the Independent African Churches, the Zionists and the Nazareth Baptists that we will elaborate on later, have since the early twentieth century travelled on annual pilgrimages to their holy sites.
Who is a pilgrim?Theologians say: that the pilgrim steps gently onto holy soil; whereas the tourist overruns holy places and photographs their remains. The pilgrim travels with humility and patience, whereas the tourist travels arrogantly and in a hurry. The tourist is a semi-pilgrim, if the pilgrim is a semi-tourist. Even when people are burying themselves in the anonymity of a crowded beach they are searching for an almost sacred, frequently symbolic form of companionship that as a rule is out of their reach in the daily structure of their lives in the office and home (Turner & Turner, 1978: 20). According to Smith the pilgrim-tourist path should ultimately be redefined as two parallel, interchangeable lanes,
I n t e r n a t i o n a l J o u r n a l o f M a n a g e m e n t C a s e s
42
one of which is the secular knowledge based route of Western science, the other, the sacred road of faith and belief (Smith, 1992: 15). Every person worldwide could travel either lane, or switch between them as we will postulate in this paper as being multifunctional journeys although with a central religious focus.
Turner & Turner explicitly say “the tourist is half pilgrim, if the pilgrim is half tourist” (1978: 20). They advocated the thesis that pilgrimage entails the movement of people from their everyday world of structured roles and statuses to a sacred centre where they enter another world through the ritual celebration of their common and universal humanity. Therefore, the tourist in an ideal form, with a positive moral understanding of life, with a need for new knowledge, cultures and other values, with a positive attitude toward other tourist-receiving environments and toward the population in those environments, becomes a pilgrim of sorts (Vukonic, 1996:82). The terms pilgrimage and tourism both define cultural constructs, or concepts about specific categories of people who travel for different reasons” or “most travellers seem to share one common theme: a search for betterment of life”(Smith, 1992: 15).
Religious pilgrimages and tourism Despite the major religions in the world today, there are an enormous number of beliefs, cults, myths and sects, and it is easy to conclude that there does not exist in the world a religion that would be the same for all people, neither is there a single system of belief for all people. There are also many religions in the history of mankind that sociologists see as proof that religions are not eternal, but that they are transient like all other social phenomena. Religions disappear when new social needs arise that they no longer meet and it cannot be denied that religions have left behind impressive traces, in the forms of: temples, shrines, churches, and the great cultural and artistic heritage that has today, due to tourism become the property of a large part of humanity, allowing large sections of the population to add to their knowledge and insights into the history of the human race by visiting the
sites of ancient religions, cultures and civilizations (Vukonic, 1996: 25).
When we speak of pilgrimages and tourism in one breath, we are referring to the interrelationship and interaction between tourism and religion, the broad relationship between religion and social phenomena. Religion and tourism, as phenomena undergo constant change. Cohen however theorises from a sociological perspective that the phenomena of pilgrimage and that of tourism have similarities (Cohen, 1992: 35). Especially with regard to more serious forms of tourism where the motives of the tourist journey are more substantial than pure recreation and entertainment – these are analogous to the ecstatic forms of pilgrimage in their spiritual meaning for the traveller-tourist, but the symbolic language in which tourists are obliged to express their pilgrimage is different. For a radical phenomenological distinction – on his journey the tourist always moves towards a tourist destination as a kind of symbol of his wishes. This is a symbol of the civilization and social system to which he belongs, towards a this-worldly centre, as Cohen expressed it, just as the pilgrim does when he heads towards just such a centre personified in the shrine to which pilgrimages are made, seeking in it the fulfilment of his spiritual and religious needs and aspirations.
Religious tourism is tied, more than one would expect, to other types of tourism, especially to holiday and cultural tourism and social and group tourism as will become clear when the case studies are discussed. In history, religious journeys always were multifunctional journeys, even when the religious factors seemed to dominate. However, in modern societies, the religious motivation seems to be less important than in ancient societies. Therefore, those pilgrimage sites will flourish most that are located in the immediate area of large tourist attractions (Rinschede, 1992: 65).
Tourist journeys have always been motivated not only by objective, but by numerous subjective factors. Their source lies most often in the domain of the irrational and immeasurable. Hitrec (1990: 9-49) states that journeys and tourism are caused by gregarious instinct, the search for relationships and contacts, friendship, love, art and culture, the

43
I n t e r n a t i o n a l J o u r n a l o f M a n a g e m e n t C a s e s
desire to communicate, the wish to play, prestige and snobbishness, fashion and imitation, as well as belonging to a certain social – and thus a religious – group. It is important to see that these are all motives that are evident in the case studies discussed later.
Tourism and religionTourism is predominantly a phenomenon marked by movement, so it is understandable that the greatest amount of space is devoted to pilgrimages as a form of movement of tourists motivated by religious needs.
In demographic terms, tourism might be classified as a voluntary, temporary and seasonal migration. Voluntary, because people decide freely whether or not they will join in tourist movements. They decide freely whether or not they will seek a place to spend time outside their place of residence. Tourism can be called temporary migration because movement motivated by tourists takes place in only one part of the year that is, temporarily, and the tourist is obliged to return to his/her place of permanent residence. Tourism is also seasonal migration because tourist journeys are as a rule linked to a certain season in the year that depends on climatic conditions that are optimal for tourist movements and sojourns in a relatively short period of the year. Tourism may be classified under the general heading of migrations, with pilgrimages regarded as temporary migrations where believers undertake shorter or longer journeys to holy places (Vukonic, 1996: 27-28). This is clearly evident in the multi-annual migrations to Zion City Moria and Inanda.
Tourism is seen as a phenomenon that stimulates the development of many countries in the world, and as a typical phenomenon of the industrial period as is the concept of free time. It is the characteristics of free/leisure time that determine people’s relationship toward their spiritual needs - one would need free time to “go on a pilgrimage” and a new kind of consciousness seems to have arisen, where free time is increasingly seen as the content of life, and work, as a necessity. Free time has become an independent area of life that greatly affects many things in people’s lives: lifestyle, the way the natural environment is disposed of, the shaping of living conditions, the commercial supply on the leisure market. In summary, free times tend to enrich human life.
Pilgrimage, it has already been said, is a phenomenon that, due to its size, provides the most striking example of the interrelationship between tourism and religion as debated by sociologists. This debate can be reduced to the question of whether tourism has certain ritual qualities relating to free time that set it apart from everyday life, and whether these qualities make tourism a kind of a pilgrimage (MacCannel, 2002: 269; Vukonic, 1996: 83).
Research shows that due to the constant growth in the world population, and the growth of the world tourist demand, there has been a significant increase in the mass of religious tourists or pilgrims, resulting in an unexpected flourishing of certain places of pilgrimage, both traditional and recent. There are more and more journeys by believers who travel in a group, some under the patronage and with the participation of the church. In the case of ZCC, for example, more than 13,000 thousand busses transport the million pilgrims for the September celebration. What is important in this case is the companionship and social life of believers (Vukonic, 1996: 54-57).
The principles of tourism can be summed up in several requirements, namely: a peaceful encounter among people from different countries, cultures and professions; promoting cultural contacts, understanding, cooperation and friendship, as well as mutual respect; renewing and encouraging the development of personality; learning and satisfying intellectual curiosity; getting to know others through their customs and lifestyles. These principles can be applied directly to pilgrimages, religious or otherwise.
Religious pilgrimages as multifunctional journeys: a South African case studyThe two flagship religious pilgrimages in South Africa are undertaken by followers of the two largest African Independent Churches, the Zion Christian Church and the Nazareth Baptist Church both founded in 1910 and 1911 respectively and both with a following of between two and six million believers.
Pilgrimages of the ZCCThe Zion Christian Church was established in 1910 by Engenas Lekganyane, a farm worker

I n t e r n a t i o n a l J o u r n a l o f M a n a g e m e n t C a s e s
44
in a rural area in Limpopo Province, that later became known as Zion City Moria that became the headquarters of the church. After his death the church split into two congregations under the respective leadership of his two sons. The ZCC took its name from Biblical references to the Mount Zion in Jerusalem and is strongly influenced by the doctrines of the Christian Catholic Apostolic Church of John Dowie, based in Zion, Illinois in the United States, and by the teachings of the Pentecostal missionary John Lake who began work in Johannesburg in 1908.
The highlight of the ZCC religious calendar is the Easter pilgrimage which draws more than 5 million church members for several days of religious services at Zion City. Other smaller religious pilgrimages and celebrations take place in early September and over Christmas. These celebrations involve abstaining from sleep for several days, drinking blessed tea, singing and dancing the mkuku – to stomp the devil back into the ground. Zionist beliefs emphasise the healing power of religious faith, and for this reason ZCC leaders sometimes clash with the sangomas, or traditional healers, who are important in many African belief systems. Despite occasional conflicts the ZCC respects traditional African beliefs especially those concerning the power of the ancestors to intercede on behalf of humans.
The ZCC reflects some elements of that religion also incorporating eclectic African beliefs. The ZCC prohibits alcoholic beverages, smoking and eating pork. It condemns sexual promiscuity and violence, with members, always wearing a visible ZCC-badge pinned to the chest, having developed the reputation of being honest and dependable employees in the business community.
According to respondents belonging to the church interviewed, the Easter pilgrimage is viewed as the most important on the religious calendar, with largely males travelling by bus to the Zion City of Moria wearing their traditional garb of khaki uniforms with a peak cap. This celebration is to affirm their belief and bring monetary donations to the church. As the largest proportion of the church’s following reside in the Limpopo province, this pilgrimage as the others are partially seen as an opportunity to rekindle family ties with relatives living in the rural surrounds. The result is that many family-related celebrations are also planned during this period so as to optimally utilise the opportunity, such as family baptisms,
weddings, healing ceremonies and related social gatherings involving the extended family that can include up to one hundred ‘relatives’. This clearly shows that although the religious pilgrimage is the main focus of the journey, other secondary foci are evident that result in the journey being a multifaceted and multifunctional experience.
Pilgrimages of the Nazareth Baptist Church The Zulu visionary Isaiah Shembe founded the NBC in 1910/1911; a controversial religious movement rooted in Zulu tradition at his holy city of Ekuphakameni, just north of Durban, KwaZulu Natal Province. The Nazareth Baptist Church is an independent church with a very strong visible African identity portrayed in the church’s adoption of the ‘holy dance’ (a traditional sacred dance) as well as a temple service – respectively the ‘African’ and ‘biblical’ streams whose confluence makes this church so iconic of the enculturation of Christianity by charismatic African tricolours. The church boasts 4 million followers across SA who believes Shembe is Africa’s equivalent to Jesus with 7,000 temples in South Africa. Though the reputation for miraculous healing powers inherited by the founder’s three successors may account for much of this growth, it can also be ascribed to the appeal of the style of worship that is unique and markedly different from that of the Zion-Apostolics.
The Nazareth Baptist Church established three annual pilgrimages central to its religious calendar, namely: a pilgrimage to the sacred mountain of Nhlangakazi/ Inhlangakazi every January; one to Judia in October; and the pilgrimage to Ematabetula near Inanda in July.
According to respondents belonging to the church interviewed, the July pilgrimage is viewed as the most important on the religious calendar, with large numbers of especially Zulu people travelling to Ematabetula in KwaZulu Natal Province. This festival results in the temporary construction of 1,000plus temporary huts to accommodate the festival attendees. Abstinence from alcohol and tobacco is imperative and a good deal is spent on costumes and hairdressing to partake in the five main groups of dances: the first, or ‘Tuban’ group consists of girls under 15 and not of a marriageable age, with tuban referring to the
45
I n t e r n a t i o n a l J o u r n a l o f M a n a g e m e n t C a s e s
bright red pleated cotton skirt worn by the girls; secondly ‘the 25s’ and the ‘virgins’ group – young women of marriageable age; thirdly the ‘Ubuhalu’ group that consists of married women; fourthly the ‘Njobo’ group that consists of a group of older males, also the elders of the church wearing traditional costumes; and finally the ‘Iscotch’ group that consists of younger males, and also the more energetic dancers. This festival continues over three weeks – beginning on the 1 July and culminates in a day of sacred dance on the third Sunday of the month. During the festival the healing rituals make up for a large portion of the activities and time, that can be related to Maslow’s basic survival needs. The healing is exclusively the duty of the church leader, who cures believers through the ‘laying on of, or by blessing water or vaseline’.
As with the ZCC followers, the largest proportion of the church’s following reside in KZN province and the pilgrimage is also regarded as an opportunity to rekindle family ties with rural relatives also attending the celebrations. Similarly family-related celebrations are also planned during this period to optimally utilise the opportunity, such as family baptisms, weddings, healing ceremonies and related social gatherings. This pilgrimage as the ZCC pilgrimage thus also shows that although the religious pilgrimage is the primary motive of the journey, secondary motives are evident that result in the journey being a multifaceted and multifunctional experience and may as a total experience address Maslow’s (1970) needs from safety/security, relationship needs, self-esteem and development needs and self-actualisation/fulfilment needs.
ConclusionThe travel motivation of the ZCC and Nazareth Baptist pilgrims can be viewed as a multi-dimensional construct comprising numerous motives – ranging from physical safety to spiritual fulfilment – needs of the pilgrims that are satisfactorily addressed by partaking in the mentioned pilgrimages. The travel motives of religious pilgrimages can be internally oriented or
externally influenced and travel motivation occurs in a pattern of multiple motives rather than in a single dominant force as is evident in the case studies put forth. It can thus be concluded that the religious pilgrimages under discussion can be viewed as multifunctional journeys.
REFERENCES
Journal Articles
Cohen, E. (1992) Pilgrimage centers: concentric and excentric Annals of tourism research Vol. 19 Issue 1 pp. 35
Hitrec, T. (1990) Religious tourism: development-characteristics-perspectives Acta turistica Vol. 2 Issue 1 pp. 9-49
Hudson, L.E. and R.H. Jackson, (1992) Mormon pilgrimage and tourism Annals of tourism research Vol.19 Issue 1 pp 1081
Jackowski, A. and Smit, V.L. (1992) Polish pilgrim-tourists Annals of tourism research Vol.19 Issue1 pp 93
Nolan, M.L. and S. Nolan, S. (1992) Religious sites as tourism attractions in Europe Annals of tourism research Vol.19 Issue 1 pp. 77
Rinschede, G. (1992) Forms of religious tourism Annals of tourism research Vol.19 Issue 1 pp 65
Smith, V.(1992) Introduction: the quest in guest Annals of tourism research Vol. 19 Issue 1 pp 15
Vukonić, B.(1992) Medjugorge’s religion and tourism connection Annals of tourism research Vol.19 Issue 1 pp 79-91
Books
Foster, N. (1982) Die Pilger Frankfort: Wolfgang Kruger Verlag
Lickorish, L.J. and Kershaw, A.G. (1958) The travel trade London: Practical Press

I n t e r n a t i o n a l J o u r n a l o f M a n a g e m e n t C a s e s
46
MacCannel, D. (2002) Empty meeting grounds: the tourist papers London: Routledge
MacCannel, D. (1976) The tourist: a new theory of the leisure class London: Macmillan
O’Grady, R. (1982) Tourism in the Third World – Christian reflections Maryknoll: Orbis Books
Unesco, (1975) The effects of tourism on socio-cultural values Aix-en-Provence:UNESCO
Vukonić, B. (1996) Tourism and religion Oxford: Pergamon
World Tourism Organisation, (1980) Declaration on World Tourism Madrid: WTO
Web Addresses
http://it.stlawu.edu/~mmac/virtualpilgrimmacpaper.html, 2004.
Autobiographical note
Felicité Fairer-Wessels lectures in the Department of Tourism Management (a WTO Tedqual accredited institution in Africa) in the Faculty of Business & Management Sciences at the University of Pretoria. Her areas of speciality are Attractions & Event Management, and Tourism Entrepreneurship on under- and post-graduate level. Visiting and experiencing World Heritage Sites is her passion.
e-mail: [email protected]
tel: +27 12 420 4000
47
I n t e r n a t i o n a l J o u r n a l o f M a n a g e m e n t C a s e s
THE IMPACT OF RELATIONSHIP MARKETING STRATEGY ON HOST
COMMUNITY THROUGH SPECIAL EVENTS AND FESTIVALS
RAZAQ RAJLEEDS METROPOLITAN UNIVERSITY, LEEDS, UK
SAI SUMAN.YERRAPATRUNILEEDS, UK
Abstract
Relationship marketing is becoming one of those fashionable terms that every marketer uses now a days. Relationship marketing was developed in response to the criticisms of traditional marketing models such as marketing mix and is a diverse concept (Lindgreen, 2001). It is concerned with all the stages of developing relationships, and much care should be taken in order to be successful. There are certain requirements for developing a successful relationships which can be encompassed under three headings of Supportive culture, Internal marketing and communication process. A supportive culture is important to develop long-term relationships and to apply more customer centred approach (Gronroos, 1994). Internal marketing plays a vital role in order to develop more and successful relationships with the customers by staff involvement and commitment to develop long-term relationships David Ballantyne (2000). And a planned, interactive, two-way communication process is also required to support the development of relationships (Gronroos, 2004).
It has been suggested that companies would benefit from adopting relationship marketing strategies, due to heavy competition and the need to understand the customers and stakeholders of the organisation to help and develop long-term relationships (Merlin&Neil, 1995). With special events now featuring mainly on the profile of the companies’ activities, there was a need for consideration of their role in such strategies. Therefore the aim of this research is ‘To investigate
the role of relationship marketing within special events’.
Mini case studies were compiled for six special event organising companies, based on the primarily on the data obtained from the interviews with event managers. This qualitative approach was chosen to enable a richer picture to be developed of the companies’ relationship marketing practices, and more specifically of the way events contribute for such practice.
The findings showed that there was a good level of awareness amongst the companies of the need to develop long-term relationships. The key points identified for future research were the extent to which feedback obtained from the customers is acted upon, the effectiveness of branding the companies at the events, and the use of technology in developing and managing relationships.
Keywords: Impact, festivals, relationship marketing, host community
IntroductionThe aim of this chapter is to discuss the background to the research topic, and justify the need in this area for research in this area. This will be achieved through discussion of the evolution of relationship marketing, and consider relationship marketing for the special events sector. The aim and objectives of this research will be outlined and each chapter will address the key issues.
The concept of marketing mix paradigm was introduced around 40 years ago and it has
I n t e r n a t i o n a l J o u r n a l o f M a n a g e m e n t C a s e s
48
dominated marketing thought, research and practice. But today it started to loose its importance as markets tend to change and new approaches and trends are adopted in the markets. Globalisation of business and the importance of customer retention was identified and followed as customers are having many alternatives for any product. To maintain the relationship with the customers relationship building and management, or what has been labelled relationship marketing, is one leading new approach to marketing which eventually has entered the marketing literature (Grönroos, 1994).
The growing interest in customer retention / share and the idea of fulfilling the need of customers from an organisation, contributed to further recognition of the benefits of having firm relationship with the existing / new customers (Gummesson, 1998). Acknowledgement that it costs significant more to attract a new customer than to retain an existing customer these changes also influenced in practice, which in turn led to the need to manage the existing customer base as effectively as possible (Wilson & Gilligan, 2002).
As there is a huge growth and development of relationship marketing there are so many questions arising, one such question is how it can be achieved in practice. How ever it remains as a matter for debate and further research is carried onto how relationship works in organisations (Lindgreen, 2001).
Models of relationship marketing It is very useful to discuss about the models of developing and maintaining relationships before studying about relationship marketing theory in more detail.
There are number of models given by different authors on relationship development, which is broadly divided into two categories ‘stages theory’ and ‘states theory (Rao& Perry, 2002). According to them Stages theory emphasises that inter-firm relationship development goes through stages (Rao& Perry, 2002). This means that the relationship development happens gradually and sequentially. And in states theory, relationship development is much more complex and may not be evolving in the structured manner that the stages theory implies (Anderson et al., 1994; Håkansson and Snehota, 1995). Relationship
or network development can move forward and backward or even stay in the same state for an undetermined period in the development process.
Other authors have proposed similar models. Dwyer (1986,quoted in Worthington& Horne, 1998) considered relationships move through five stages of
Awareness•
Exploration •
Expansion•
Commitment •
Dissolution.•
These phases are based on a research, which investigated the development of interpersonal relationships, and each phase represents a major transition in how each party regards the other (Worthington& Horne, 1998). According to them the above model is used to examine the development of relationships over the time but it does not offer the opportunity to test the strengths of relationships, which were developed.
In order to test the strength of the relationships Worthington & Horne (1998) developed a new model of relationships, based on the biological model called ‘symbioses. Symbiosis is the association or living together of two unlike organisms, for the benefit of each other (Worthington& Horne, 1998). Their model is classified into five classifications. From this model it can be identified that who are the parties involved in the relationship development are benefiting.
Rao and Perry (2002) criticised the sequential model they questioned whether relationships develop in an ordered way. They proposed an alternate theory called ‘states theory’. States theory focuses on the unstructured and unpredictable nature of relationship development. The states theory shows that relationship development can move forwards, backwards or stay in the same state, which is similar to the traditional life cycle model.
49
I n t e r n a t i o n a l J o u r n a l o f M a n a g e m e n t C a s e s
Special Events SectorThe special events sector is a very crowded arena, with count less organisations operating all around the world and there are number of events happening at different places every year. The term special events can be categorized from western music concerts to devout religious festivals, glitzy sports contests to natural phenomena (Mintel, 2005). According to Robyn Stokes (2006), “networks as relationships” perspective is based on the premise that multiple stakeholders in events and connections between them will influence the success of events.
This proves that by adopting the relationship marketing strategy the event organising companies could organise successful events in collaboration with its stakeholders. In addition, searches on Ebsco and Emerald have suggested that there has not been much research or study on relationship marketing in the events sector. It is therefore appropriate for this research to focus on how relationship marketing helps the event management companies to develop long-term relationships with its customers/stakeholders.
Special eventsThe body of literature on festival an event research is voluminous and distinct with four themes or tracts emerging as important and timely to managers. These themes, which include guest satisfaction research, sponsorship evaluations, economic impact assessments, and host perceptions of festival/event impacts, form the major discussion points of this article. Whatever the reasons for conducting research, festival and event managers should be concerned about the validity and utility of the information gained. The concluding section of this article presents several methodological recommendations for those interested in conducting festival and event research.
Hosts’ Perceptions of EventsMuch has been written on festival and event guests with relatively little about those who stage these attractions or the hosts (residents of the community where the event takes place). Relatively few impact studies have specifically examined residents’ attitudes toward festivals
and special event tourism in their community. one study involving residents’ attitudes toward a large-scale festival revealed that those who benefited economically and/or socially from the event had more positive attitudes than residents who did not experience these benefits (Turco, 1994). These findings are consistent with the social exchange theory which suggests that hosts who receive benefits from festivals and special events are likely to perceive it positively and be supportive, whereas those who do not receive benefits, or who perceive the costs associated with the event outweigh the benefits, are likely to perceive it negatively.
Why do communities and organizations stage festivals and events? lie answers to this question have been recently sought by several researchers. Mayfield and Crompton (1995) identified eight generic reasons why nonprofit and government entities stage festivals: recreation/socialization, culture/education, tourism, internal revenue generation, natural resources, agriculture, external revenue generation, and community pride/spirit. Of the thirty items identified that operationalized the eight domains, community spirit/pride” and `family’ were ranked by respondents as being the most important reasons for staging festivals. Wicks (1995) found that business owners and managers felt it was most important that the production of the event brought the community together generated an economic benefit to businesses, and promoted a Positive image for the host town.
Large-scale festivals and events seeking to attract visitors to their host communities, should examine the contributory social impacts on residents and their reactions. Examples of social cost include traffic congestions and crowding, crime, trespassing, disruption in daily schedules, litter and noise pollution. Without resident and local business support, several sanctions against the event may be imposed by the community including: (1) loss of local support for the organizations and authorities which Promote the event; (2) an unwillingness to work at the event or the tourism industry; (3) lack of enthusiasm in Promoting the event by word of mouth; and (4) hostility to visitors manifested in overcharging, rudeness and indifference (Crompton and Ap, 1994). An important factor in the avoiding these problems, while at the same time benefiting the host community would be to focus greater time
I n t e r n a t i o n a l J o u r n a l o f M a n a g e m e n t C a s e s
50
on measuring the needs and expectations of the residents as they relate to the festival or event.
Research approachThe overall research approach is used was proposed by Saunders, Lewis and Thornhill (2003). As they identified, whilst the linear assists with forward planning, some stages will be needed to revisit and adapted, as ideas are refined.
As suggested in the title, the first stage of sampling for this paper was 15 India based Event management companies with a minimal of 35 employees. Sampling tactics were applied to this sample that will assist the researcher in making decisions of which organisation to approach.
The second stage was then to filter the companies for whom no named or contact details were present on their websites and search directories. This reduced to 6 companies; these companies were contacted by email or phone to ask if they are willing to be interviewed for this research. Response was received from all the above companies and interviews were confirmed.
Question development for InterviewThe question development for the interviews were categorised into two divisions, which is similar to Lindgreen, 2001.
The first division is completely focussed on obtaining the background information of the organisation from its websites and brouchers, such a number of staff employed by the company, the number of events organised by the company annually and the other companies associated in organising events. The second division is based on the relationship development, with questions asked about how and why the company wants to build relationships with its customers or stakeholders.
The third division of the interview is completely focussed on the events. Because there seems to be no research undertaken in accordance with
relationship marketing and events. The questions were designed by how each stage of the event (pre-event, event, and post-event) issues could contribute to relationship marketing based on the literature.
The main points from the interviews were placed in tabular form, as it will be helpful in cross case comparison. Analysis of each case study was carried out in parallel with mixing the data in accordance to literature.
Current and future trends were considered across the cases and conclusions were drawn according to the way in which relationship marketing strategies were used in special events.
Result Analysis
Supportive Culture
All the companies interviewed identified the importance of developing long-term relationships. The main reason for these companies to develop long-term relationships was financial which a common thing was also across their company objectives. Customer satisfaction and cross selling and business development were thought to be other benefits, all which are similar to the view of Priluck (2003).
A key and a common factor for the developing relationship are the personal or social relationships with the individual or a company. This is very hard and it consumes lots of time, to develop long-term relationships, the companies should be very patient and spend many resources.
In the literature there are no barriers mentioned about developing long-term relationships, however most of the companies were identified that they develop relationships in order for the financial benefits. A variety of reasons were discussed why companies organise events, some of which has been concurred and some others added to the literature. The findings suggest that the
51
I n t e r n a t i o n a l J o u r n a l o f M a n a g e m e n t C a s e s
company which gets more business develop more relationships.
Many authors suggested that events could be used to develop relationships, yet only three companies addressed their role of developing relationships. One such role is thanking their customers and attracting new customers.
There are many developments happing towards developing relationship, one such development is technological development. Two of the organisations wide databases in place manage this process, while the other companies are trying to develop their database. The ability of the technology is helping the companies to reach their customers directly with out any mediators in between; the response for this is highly subjective and varies according to the location of the customer. Almost all the companies felt that events at the early stage of relationship development will help the organisation to be more close to their customers. But one company felt that the relationship develops only after the event, this is because the customer will interact with the people from the organisation at the time of the event. These differences could be derived from the companies experience and it varies according to the organisations core competences.
Internal Marketing
The two companies which are smaller compared to the others in the case studies interviewed were the only ones to involve all the staff in their relationship development process as recommended by Gronroos (1994). However rest of the four companies does not involve all the staff in developing relationships they work with other internal departments when building their relationships, because they do not want all of their staff to develop relationships if they do so then the costs will increase which the companies are not ready to bear them.
To the extent of which the companies are concerned they are operating in a customer-centric approach as suggested by Priluck (2003) is unidentified. Three of the companies always contacted their customers directly for feedback of the events so that improvements can be made and other two companies get the feedback from the customers through the staff of the company. And the other company always involve their
customers in the events they do so they can do the events according to the customer choice and give the best of customer service. However is it evident that that there is some way of customer interaction for the events. As far as such feedback is considered would require further investigation.
Communication Process
All of the companies that are interviewed have a planned communication process to maintain and develop relationships with their customer/participants..
These communications seems to have limited levels of interaction with the customers of the organisations. However, two of the companies interviewed mentioned that events would help in communicating with the customers/participants of the events and those who are not part of the event as well. Almost all the corporate companies these days identified that events are a tool for communicating with their customers. They identified that they can also communicate with the customers not only by organising events but also sponsoring the events they can communicate their message.
All of the companies contact their customer post-event for further business and they also send some information about the organisation and its activities. They believe that by sending the information about the organisation will help the company to maintain relationships and the customers will know more about the activities the company is doing in the future. This way of communicating with the customers/participants was suggested by Gronroos (2004).
Three of the companies interviewed said that they will send the information about the company even that client/customer is a one time event organiser and he has no intention of continuing the relationship with the company for example of such events are wedding which happen once and there will be no relationship development after the event. The companies are ready to spend some resources in order to share information with this kind of customers, as they will recommend the company to others who are willing to do any event. This way of relationship development is also called as word-of-mouth publicity.
There is evidence of increase use of technology in developing relationships with the customers/

I n t e r n a t i o n a l J o u r n a l o f M a n a g e m e n t C a s e s
52
participants.. Three of the companies are increasingly using emails to maintain relationship with it past and present customers. And the information about the events is publicised using the companies website and registrations can also be done on the website if any. And two companies are also allowing discounts to the customers who make their reservations through the event sponsors website so that can also promote the sponsors.
Cross-case analysis
In summary, all the companies interviewed have common trends that have been identified from cross-case analysis. There is a good knowledge of developing relationships with their customers in all the companies interviewed, but there seem to be less concentration on how to contribute this knowledge in achieving their targets. All the companies work for the financial benefits and they develop the relationships in order to achieve organisations financial goals and to stay in the market.
Development of technology is also helping the organisations to develop relationships in an easy and cost effective way. Half of the companies interviewed are currently implementing new databases to develop relationships more effectively. If the use of technology in developing relationships is increased there will also be an increase in contacting the customers directly with out any mediators like agencies in between.
All of the companies recognised the need for cross-departmental working to develop long-term relationships with its customers/participants, two of the companies who involved all the staff to develop relationships are the small companies ESP (Entertainment Solution Providers) and Rainbow Events. The involvement of all the staff who work for the organisation to develop relationships was first coined by Gronroos (1990).
There is some customer centric approach in the way the special event organising companies organise their events. The information they get from their customers post-event will help them in evaluating the event and give better service for the future events. However there are only two companies out of all the six interviewed companies involve their customer pre-event in the operational issues of the event. This gives a personal touch and also
helps in developing long-term relationships with the customers/participants.
All of the companies have a communication process in place to develop relationships with their customers, but the type of communication process each company has choose varies. This variation is because of size of the company, the number of people employed by the company and the number of events the company does per annum. These all factors are considered by the organisations to implement the communication process in a large scale.
The majority of the organisations/companies prove that there is an interactive communication with the customers post-event in the form of evaluation that helps the company to develop long-term relationships with its customers.
Conclusions The purpose of this research was to understand the role and impact of relationship marketing strategy on the demand for special events. Though many marketing executives report that they are using a relationship marketing strategy, this has not resulted in high demand for variable data printing.
Business-to-business marketing firms create what might be called a collaborative advantage by demonstrating special skills in managing relationships with key customers. To effectively initiate and sustain a profitable relationship with a customer, the business marketer must carefully manage the sales and service connections that provide the central points of customer contact and define the relationship.
Modern marketing revolves around the Customer. It is an old and by-now universally accepted concept that the Customer is the King. Customers are treated as the eyeballs of all major companies in the world. The customer is the person who has unique interests, needs, attitude preferences, issues and opportunities, and most importantly the authority to spend the money on the offerings of the company. Therefore the traditional approach of making one-time sales is being replaced with making long-term commitment to the customer. The former approach is popularly known as transactional marketing, while making long-term commitment is the basic of relationship marketing.

53
I n t e r n a t i o n a l J o u r n a l o f M a n a g e m e n t C a s e s
A thorough review of the relationship marketing literature has been undertaken, using books, journal, reports and web articles. Relationship marketing is a diverse and evolving concept incorporating not only just marketing theories but also components of communication, strategic management and ethical points. This Objective 1 was therefore been achieved.
By drawing on both special events and literature, it was identified that special events have a very important role to play in all the stages of relationship development.
The case study approach helped to exploratory study into the way in which special events companies try to build and develop long-term relationships through their events. By analysing each case individually at the staring point, the important elements were identified from the literature prior to the cross-case analysis.
ReferencesAbratt,R. & Russell, J. (1999) Relationship marketing in private banking South Africa. International Journal of Bank Marketing, Vol.17, No.1, pp. 5-19.
Adamson, I., chan, K & Handford, D (2003) Relationship marketing: customer commitment and trust as a strategy for the smaller Hong Kong corporate banking sector. International Journal of Bank marketing, Vol.21, No.6, pp.347-358.
Aijo, T.S. (1996) The theoretical and philosophical underpinnings of relationship marketing. European Journal of Marketing, Vol.30, No.2, pp. 8-18.
Anon (2004) Keep asking the customer: Dagbladet Borsen increase customer loyalty through relationship marketing. Strategic Direction, Vol.20, No.9, pp.24-26.
Anderson, J.C., Håkansson, H., Johanson, J. (1994), Dyadic business relationships within a business network context. Journal of Marketing, Vol. 58 pp.1-15.
Bansal, M.K. (2004) Optimising value and quality in general practice within the primary health care sector through relationship marketing: a conceptual framework. International Journal of Health Care Quality Assurance, Vol.17, No.4, pp.180-188.
Bennett, R. & Barkensjo, A. (2005) Relationship quality, relationship marketing, and client perceptions of the levels of service quality of charitable organisations. International Journal of Service Industry Management. Vol.16, No.1, pp. 81-106.
Bull, C. (2003) Strategic issues in customer relationship management (CRM) implementation. Business Process Management. Vol. 9, No.5, pp.592-602.
Crompton, J. L. & Ap, J. (1994). Development of a Tourism Impact Scale in Host Resident context. Research Enhancement Program Final Report. College Station, Texas: Texas A&M University.
Cunningham, M. H. & Taylor, S. F. (1995). Event Marketing: State of the Industry and Research Agenda. Festival management and Event Tourism, 2(3/4): 123-137.
David Ballantyne (2002) DNA Networks, INDIA (2006) [Internet]. Available from http://www.dnanetworks.com [ Accessed 11 July 2006].
Drummond. S. & Anderson, H. (2004) Service quality & managing your people. In: Yeoman, I., Robertson, M., Ali-Knight, j., Drummond, S. & McMahon Beattie, U. (2004) Festival & Events Management: an international arts & culture perspective. Oxford, Elsevier Butterworth-Heinemann.
Durkin, M.G. & Howcroft, B. (2003) Relationship marketing in the banking sector: the impact of new technologies. Marketing Intelligence and Planning, Vol.21, No.1, pp. 61-71.
Encore Events, INDIA (2006) [Internet]. Available from http://eventsencore.com [Accessed 11 July 2006].
Entertainment Solution Providers (ESP), INDIA (2006) [Internet]. Available from http://espindia.org [ Accessed 11 July 2006].
Egan, J. (2001) Relationship Marketing: Exploring relational strategies in marketing. Pearson Education Ltd, Harlow.
Friedman, A. (1990). Sport Marketers Must Work Harder and Smarter to Score. Athletic Business, (December) p. 22.
I n t e r n a t i o n a l J o u r n a l o f M a n a g e m e n t C a s e s
54
Gronroos, C. (1994) From marketing mix to relationship marketing: towards a paradigm shift in marketing. Management Decision, Vol.32, No.2, pp.4-20.
Gronroos , C. (1996) Relationship marketing: strategic and tactical implications. Management Decision, Vol.34, No.3, pp.5-14.
Gronroos, C. (2004) The relationship marketing process: Communication, interaction, dialogue, value. Journal of Business and Industrial Marketing, Vol.19, No.2, pp.99-113.
Gummesson, E. (1994), Making relationships marketing operational. International Journal of Service Industry Management, Vol.5, No.5, pp.5-20.
Gummesson, E. (1996) Relationship marketing and imaginary organisations: a synthesis. European Journal of Marketing, Vol.30, No.2, pp.31-44.
Gumesson, E. (1997) Relationship marketing as a paradigm shift: some conclusion from the 30R approach. Management Decision, Vol.35, No.4, pp.267-272.
Gummesson, E. (1998) Productivity, quality and relationship marketing in service operations. International Journal of Contemporary Hospitality Management, Vol.10, No.1, pp.4-15.
Gummesson, E. (2005) Qualitative research in marketing. European Journal of Marketing. Vol.39, No.3/4, pp.309-327.
Gitelson, R., Guadagnolo, F. & Moore, R. (1988). Economic Impact Analysis of a Community-Sponsored Ten Kilometer Road Race. Journal of Park and Recreation Administration, 6, 79-89.
Harker, M.J. (1999) Relationship marketing defined? An examination of current relationship marketing definitions. Marketing Intelligence and Planning, Vol.17, No.1, pp.13-20.
Johnson, R. (1 992). How the Chicago Mayor’s Office of Special Events Uses Surveys in its Sponsorship Program. IEG Sponsorship Report, 11 (1): 4-5.
Lindgreen, A. (1999) Implementing, monitoring and measuring a programme of relationship
marketing. Marketing Intelligence and Planning, Vol.17, No.5, pp.231-239.
Lingreen, A. (2001) A framework for studying relationship marketing dyads. Qualitative Market Research: An International Journal. Vol.4, No.2, pp.75-87.
Long, P. T. & Perdue, R. R. (1990). The Economic Impact of Rural Festivals and Special Events: Assessing the Spatial Distribution of Expenditures. Journal of Travel Research, 61, 10-14.
Mayfield, T. L. & Crompton, J. L. (1995). Development of an instrument for Identifying Community Reasons for Staging a Festival. Journal of Travel Research, 34(l): 37-44.
Miles, M.B. & Huberman, A.M. (1994) Qualitative Data Analysis. Sage Publications Ltd., London.
Mintel (2003) Special events, 2003. [Internet] London, Mintel International Group Ltd. Available from http://reports.mintel.com [Accessed 25 April 2006].
McDonnell, I. Allen, J. and O’Toole, W. (1999) Festival and Special Event Management. Brisbane: John Wiley and Sons Australia Ltd.
Payne, A. (1994) Relationship marketing- making the customer count. Managing Service Quality, Vol.4, No.6, pp.29-31.
Pressey A.D. & Mathews, B.P. (2000) Barriers to relationship marketing in consumer retailing. Journal of Service Marketing, Vol.14, No.3, pp. 272-280.
Priluck, R. (2003) Relationship marketing can mitigate product and service failures. Journal of Service Marketing, Vol.17, No.1 pp.37-52.
Rao, S. & Perry, C. (2002) Thinking about relationship marketing: Where are we now? Journal of Business & Industrial Marketing, Vol.17, No.7, pp. 598-614.
Raindow Events, INDIA (2006) [Internet]. Available from http://www.rainbowevents.in [Accessed 11 July 2006].
Razaq Raj(2006),Identifying Economic Impacts of Events on Host Communities:Creating Expression of Local Heritage Through Outdoor Events.

55
I n t e r n a t i o n a l J o u r n a l o f M a n a g e m e n t C a s e s
Saunders, M., Lewis,P. & Thornhill, A. (2003) Research Methods for Business Students. 3rd ed. Pearson Education Ltd. Harlow.
Scott Erickson,G. & Kushner, R.J.(1999) Public event networks: an application of marketing theory to sporting events. European Journal of Marketing, Vol.33 No.3/4, pp.348-364.
Scholar.google (2006) [Internet] Available from http://scholar.google.com/scholar?q=relationship+marketing+and+special+events+&ie=UTF-8&oe=UTF-8&hl=en [Accessed 25 April 2006].
Shaw, E. (1999) A guide to the qualitative research process: evidence from a small firm study. Qualitative Market Research: An International Journal. Vol.2, No.2, pp.59-70.
Sheth, J.N. (2002) The future of relatiosnhip marketing. Journal Services Marketing. Vol.16, No.7, pp.590-592.
Sin, L., Tse, A., Yau, O., Lee,J. & Chow, R. (2002) The effect of relstionship marketing orientation on business performance in a service-oriented economy. Journal of Services Marketing, Vol.16, No.7, pp.656-676.
Turco, D. M. (1995). Economic Impact Research. (In M. Stallings, Ed.) Leveraging Parks and Recreation: The Phoenix Project State College, PA: Venture Publishing.
Turco, D. M. (1995). Measuring the Tax Impacts of an International Festival: Justification for Government Sponsorship. Festival Management and Event Tourism, 2(3/4): 191-196.
Turco, D. M. (1994). Residents’ Attitudes Toward the 1993 Kodak Albuquerque International Balloon Fiesta. Technical report prepared for the AIBF, Inc., Albuquerque, NM.
Turco, D. M. & Navarro, R. L. (1993). Measuring the Economic Impact of a National Sport Championship. Sport Marketing Ouarterly, 2(2): 14-19.
Tzokas, N, & Saren, M. (2004) Competative advantage, Knowledge & relationship marketing: where what & How? Journal of Business & Industrial Marketing, Vol.19, No.2, pp.278-298.
Wicks, B. (1995). The Business Sector’s Reaction to a Community Special Event in a Small Town: A Case Study of the “Autumn on Parade” Festival. Festival Management and Event Tourism, 2(3/4):177-184.
Wilson, R.M.S. & Gilligsn, C. (2002) Strategic Marketing Management: Planning, Implemetation and control. 2nd ed. Oxford, Butterworth Heinemann.
Wizcraft Entertainment (2006) [Internet]. Available from http://www.wizcraftworld.com/cntnt/intro.htm [Accessed 11 July 2006].
Wood, E. (2004) Marketing information for the events industry. In: Yeoman, I., Robertson, M., Ali-Knight, J., Drummond, S. & McMahon-Beattie, U. (2004) Festival & Events Management: an international arts & culture perspective. Oxford, Elsevier Butterworth- Heinemann.
Yardley, J. K., MacDonald, J. H. & Clarke, B. D. (1990). The Economic Impact of a Small Short-Term Recreation Event on a Local Economy. Journal of Park and Recreation Administration, 4, 71-82.
Yin, R.K. (2003) Case Study Research: Design and Methods. 3rd Ed. Sage Publications Ltd., London.
360 Degrees Entertainment (2006) [Internet]. Available from http://360degrees.co.in [Accessed 11 July 2006]
I n t e r n a t i o n a l J o u r n a l o f M a n a g e m e n t C a s e s
56
MARKETING AND DEVELOPMENT IN FOUR WESTERN EUROPEAN SANCTUARY-
TOWNS
VITOR AMBRÓSIOESCOLA SUPERIOR DE HOTELARIA E TURISMO DO ESTORIL, PORTUGAL
IntroductionIn this paper, four Catholic sanctuary-towns, founded after the apparitions of the Virgin Mary, Banneux in Belgium (1933), Fatima in Portugal (1917), Knock in Ireland (1879), and Lourdes in France (1858), will be compared in terms of urban development. I will argue that these sanctuary-towns represent two different evolutionary situations: one associated with successful development and marketing and the other with weaknesses in planning and marketing. Although their importance as pilgrimage destinations differs, Banneux and Knock are considered medium-sized sanctuary towns, while Fátima and Lourdes are considered large. A similar, summarized description will be applied to each destination.
Banneux is a sanctuary town situated in eastern Belgium (a few kilometres away from Liège). Annually, it receives over 0.5 million visitors, mainly from European countries.
The eight apparitions took place from 15 January to 2 March, 1933. The Church approved them in 1942 and more solemnly in 1949. The seer, Mariette Beco, was 11 years old and was the daughter of poor, non-churchgoing parents.
The Virgin Mary’s message focused on the title she attributed to herself: ‘I am the Virgin of the poor’, thus revealing by that the simplicity of the gospel. During the apparitions she asked people to pray a lot and to have a chapel built in her honour, stressing the need for prayer. During the apparitions she showed the seer the site of a fountain whose waters would mitigate the sufferings of the sick of all nations.
After this divine manifestation there was a period of hesitation, but due to the considerable affluence of pilgrims, the local priest instigated the building
of the chapel, which was inaugurated on 15 August 1933. It is the heart of Banneux even today, as the shrine does not have a proper church. Instead, many open-air sites and altars exist, which are complemented by sacred itineraries and nursery homes for sick pilgrims (who have always been numerous at Banneux). To commemorate the 50th anniversary, a large pavilion was built for the winter season.
Fátima is situated in the heart of Portugal (a few kilometres away from Leiria). Annually, it welcomes over 4 million visitors, who come from all over the world.
The six apparitions here took place between 13 May and 13 October, 1919, and were finally approved by the Church in 1930. The seers, Lúcia, Francisco and Jacinta, were aged 10, 9 and 7, respectively, their parents being poor and churchgoers.
During the apparitions, the Virgin Mary introduced herself as ‘Our Lady of the Rosary’, and asked people to pray a lot and to have a chapel built in her honour, stressing the need to pray and to meditate on the rosary mysteries. She asked for the reparation of the sins committed against her Sacred Heart, as well as the consecration of Russia to It. No other apparition may, indeed, be so linked to historical events as this one. This is probably the reason why it gave origin to an intense spiritual movement, which is the source of inspiration for the preservation of peace on earth.
In 1919, after the above divine manifestation, a small chapel was built. Ten years later construction of the basilica was started, with consecration in 1953. Besides those constructions, one should also mention the esplanade (bigger than the one at St. Peter’s in Rome); the scarlet oak tree, under whose shadow the little shepherds and the pilgrims waited and prayed before the Virgin Mary’s
57
I n t e r n a t i o n a l J o u r n a l o f M a n a g e m e n t C a s e s
apparitions; the nursery home; the retreats’ home; and the pastoral centre, with a 2124-seat conference room. In the village of Aljustrel, where the shepherds were born, their houses are still to be seen, as well as the Valinhos Calvary.
Knock is situated in north-western Ireland, a few kilometres away from Galway. Annually, it receives over 1 million visitors, who come mainly from the Anglo-Saxon nations.
The only apparition here took place on 21 August 1879. The Church approved it in 1879, and more solemnly in 1939. The group of seers was constituted by 15 people of varying ages. This is one of the few apparitions of the Virgin Mary, said to have occurred in Ireland. Our Lady appeared accompanied by St Joseph and St John the Baptist, and at their right-hand side there was an altar with angels hovering over a lamb and a cross.
Although there was no spoken message, the divine manifestation was interpreted as a sign of heavenly assistance, an appeal for the Irish to remain faithful to the Catholic Church, especially as regards the cults of the Eucharist and of the Virgin Mary – the temptation to resort to violence would then be eliminated. The event helped to reduce social tensions and anger towards the English, who were the ruling body in Ireland at that time.
Because the apparition occurred at the rear of the small local church, a new church was not built; instead, an addition to the existing building was constructed. The present-day basilica holds 10,000 people and is set on 32 pilasters, representing the number of Irish Counties; it was built in the 1970s, having been consecrated in 1979. Besides these buildings, there are others worth mentioning: the chapel of reconciliation, the prayer guidance centre, the nursery home, the esplanade and the Calvary.
Lourdes is situated in south-western France (a few kilometres away from Tarbes), annually receives over 5 million visitors, who come from all over the world.
The 18 apparitions recorded here took place between 11 February and 16 July, 1858, and were approved by the Church in 1862. The seer, Bernadette Soubirous, was 14 years old, her parents being poor and churchgoers.
When the apparitions occurred, the Virgin Mary presented Herself as ‘Our Lady of the Immaculate Conception’, and called on people to pray and to do penance. She also asked that a chapel be built and processions held. As a sign of her presence, she also pointed out a spring at Massabielle to the seer. A number of cures have been attributed to this spring, and it has become a special destination for the sick from all over the world. The simplicity of the message and the atmosphere of the place have turned this sanctuary into a spiritual centre for the entire Catholic world.
A few years after this divine manifestation, a basilica was added to the grotto, thus replacing the small chapel that had previously been built. A second basilica was built in 1889, and a third one was consecrated in 1958 (this time constructed underground), with a capacity of 20,000. Besides these buildings, there are others worth mentioning: the esplanade (where processions of the sacraments and of the candles are held daily); the pools where the pilgrims bathe; the Calvary; the retreats’ home; and the nursery homes for the sick. In the town, all the sites connected with the life of Bernadette are of special importance.
Considering the bibliography of these four sanctuary towns, one may observe that, for the medium-sized shrines (Banneux and Knock), the literature focuses on description and analysis of the spiritual components. Even when the focus is on the sanctuary towns’ physical structures, most authors prefer to expound on their spiritual functions than to analyse the territorial impacts that may ensue. A possible justification for this fact is that the manifestations of religious tourism in these two sanctuary towns are not obvious – either in the landscape or socio-economically – and, consequently, they do not arouse enough interest among scholars for study.
With regard to the larger sanctuary towns (Fátima and Lourdes), one may observe two different kinds of academic approach: the first referring to the spiritual elements, the second to the physical structures and their functions. The first analyses the spiritual meanings of both buildings and atmosphere within the towns, while the second evaluates the impacts that religious tourism provokes, either physically or socio-economically.

I n t e r n a t i o n a l J o u r n a l o f M a n a g e m e n t C a s e s
58
The Retrospective Evaluation of the Evolutionary Cycles of Sanctuary TownsSince the existing bibliography provides insufficient material with which to chart the development of these four sanctuary towns, it has been complemented by observations made in situ. Analysis of the information available has afforded identification of three variables that help understand the ways in which these towns have developed: the seers’ level of consecration; the construction of a basilica to celebrate the centenary of the apparitions; and the facilities for overnight visitors.
Consecration of seers - In spiritual terms, the fame of a shrine is closely linked to the consecration of the seers and their testimonies of the Virginal apparitions. When considering these, one should take into account whether or not the seer is still alive, and what title was granted them by the Catholic Church.
In Lourdes the seer is dead, having been canonized in the 1930s. In Fátima, two of the seers have been dead for many years: they were beatified at the beginning of the new millennium; the third (the most important) died in 2005, and so it is too early to advance her canonical process. In Banneux, the seer is alive; in Knock, all 15 seers are dead, none of them having been beatified or canonized.
The situation for each of the four sanctuary towns is therefore different: in Lourdes, all goals have been achieved; in Fátima, partially so; in Banneux, canonization remains something for the future and, in Knock, the opportunities were wasted and cannot easily be recreated. Thus, the level of consecration has a direct bearing on the degree of development and on the marketing of each town.
The basilica - It represents the physical aspect of development. There are usually three stages in the construction process here: a chapel; a medium-sized basilica; and a large basilica.
Considering this logical sequence, it will be noted that Banneux did not reach the second phase, substituting the medium-sized basilica for the great pavilion (with capacity of about 2000). Maybe in the distant future, the opportunity will arise to move directly to the third stage, by way of marking the centenary celebrations. Another option might be to develop the shrine into a reference/meeting point for the Catholic Belgian community, something that does not yet exist.
In Knock, the second stage was bypassed, for two main reasons: the lack of interest shown in the earlier years; and the dynamism of its rector in the beginning of the 1970s. As far as development is concerned, this situation demonstrates that a shrine that has, for some time, not created a great deal of interest, can eventually be transformed into a major religious tourism destination.
In Fátima, all three stages have been witnessed, although construction of the third (a larger basilica) has been brought forward 10 years in time. Two factors seem to be involved in the current situation: the urgency of creating better conditions for the reception of large numbers of pilgrims (mainly on Sundays); and uncertainty about the dynamism and energy of the team that will manage the shrine in the next decennium.
In Lourdes, the reference model for every sanctuary town in the Western world (as much for the positive as for the negative aspects), these three stages have occurred. The building of the chapel was followed by the construction of a medium-sized basilica; a few years later saw the building of a second basilica (with a similar capacity). Soon afterwards, it was realized that the scope of the tourism and pilgrimage markets demanded the construction of a larger basilica, in order to celebrate the centenary of the apparitions.
Overnight stays - In the medium-sized sanctuary towns of Banneux and Knock, the scale of existing religious activities does not justify the provision of overnight facilities.
In Fátima, and above all in Lourdes, the opposite is the case. Over the years, religious and business leaders have worked closely together in the creation of overnight facilities for pilgrims. One important factor in creating overnight facilities is the popularity of candle-lit processions.
Schematization of developmental processesSince the data utilized for the four sanctuary towns in this study are extensive, with countless interconnections, it is convenient to combine the information and to schematize the development processes involved. This allows observation of the developmental stages of each of the four towns, as shown in Fig. 1.

59
I n t e r n a t i o n a l J o u r n a l o f M a n a g e m e n t C a s e s
Fig. 1 - Schematic Representation of the Evolutionary Cycle of a Sanctuary-Town
Fig. 2 - Development of Banneux
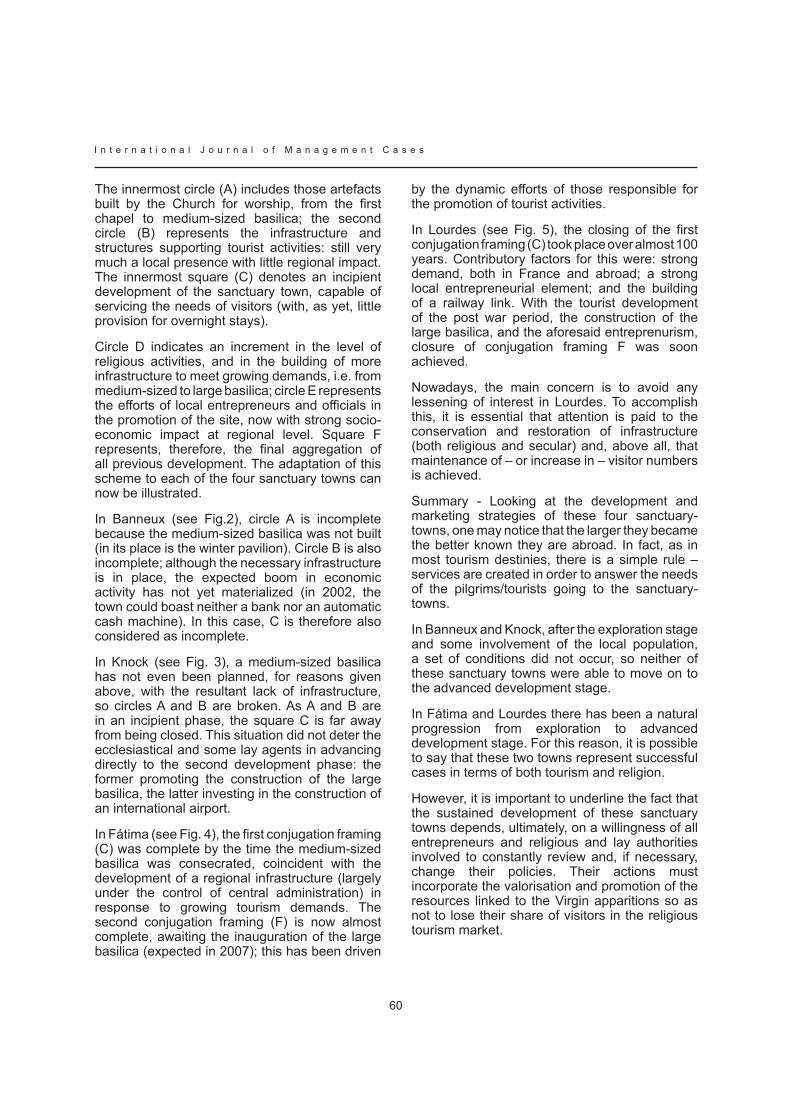
I n t e r n a t i o n a l J o u r n a l o f M a n a g e m e n t C a s e s
60
The innermost circle (A) includes those artefacts built by the Church for worship, from the first chapel to medium-sized basilica; the second circle (B) represents the infrastructure and structures supporting tourist activities: still very much a local presence with little regional impact. The innermost square (C) denotes an incipient development of the sanctuary town, capable of servicing the needs of visitors (with, as yet, little provision for overnight stays).
Circle D indicates an increment in the level of religious activities, and in the building of more infrastructure to meet growing demands, i.e. from medium-sized to large basilica; circle E represents the efforts of local entrepreneurs and officials in the promotion of the site, now with strong socio-economic impact at regional level. Square F represents, therefore, the final aggregation of all previous development. The adaptation of this scheme to each of the four sanctuary towns can now be illustrated.
In Banneux (see Fig.2), circle A is incomplete because the medium-sized basilica was not built (in its place is the winter pavilion). Circle B is also incomplete; although the necessary infrastructure is in place, the expected boom in economic activity has not yet materialized (in 2002, the town could boast neither a bank nor an automatic cash machine). In this case, C is therefore also considered as incomplete.
In Knock (see Fig. 3), a medium-sized basilica has not even been planned, for reasons given above, with the resultant lack of infrastructure, so circles A and B are broken. As A and B are in an incipient phase, the square C is far away from being closed. This situation did not deter the ecclesiastical and some lay agents in advancing directly to the second development phase: the former promoting the construction of the large basilica, the latter investing in the construction of an international airport.
In Fátima (see Fig. 4), the first conjugation framing (C) was complete by the time the medium-sized basilica was consecrated, coincident with the development of a regional infrastructure (largely under the control of central administration) in response to growing tourism demands. The second conjugation framing (F) is now almost complete, awaiting the inauguration of the large basilica (expected in 2007); this has been driven
by the dynamic efforts of those responsible for the promotion of tourist activities.
In Lourdes (see Fig. 5), the closing of the first conjugation framing (C) took place over almost 100 years. Contributory factors for this were: strong demand, both in France and abroad; a strong local entrepreneurial element; and the building of a railway link. With the tourist development of the post war period, the construction of the large basilica, and the aforesaid entreprenurism, closure of conjugation framing F was soon achieved.
Nowadays, the main concern is to avoid any lessening of interest in Lourdes. To accomplish this, it is essential that attention is paid to the conservation and restoration of infrastructure (both religious and secular) and, above all, that maintenance of – or increase in – visitor numbers is achieved.
Summary - Looking at the development and marketing strategies of these four sanctuary-towns, one may notice that the larger they became the better known they are abroad. In fact, as in most tourism destinies, there is a simple rule – services are created in order to answer the needs of the pilgrims/tourists going to the sanctuary-towns.
In Banneux and Knock, after the exploration stage and some involvement of the local population, a set of conditions did not occur, so neither of these sanctuary towns were able to move on to the advanced development stage.
In Fátima and Lourdes there has been a natural progression from exploration to advanced development stage. For this reason, it is possible to say that these two towns represent successful cases in terms of both tourism and religion.
However, it is important to underline the fact that the sustained development of these sanctuary towns depends, ultimately, on a willingness of all entrepreneurs and religious and lay authorities involved to constantly review and, if necessary, change their policies. Their actions must incorporate the valorisation and promotion of the resources linked to the Virgin apparitions so as not to lose their share of visitors in the religious tourism market.

61
I n t e r n a t i o n a l J o u r n a l o f M a n a g e m e n t C a s e s
Fig. 3 - Development of Knock
Fig. 4 - Development of Fatima
I n t e r n a t i o n a l J o u r n a l o f M a n a g e m e n t C a s e s
62
Fig. 5 - Development of Lourdes
63
I n t e r n a t i o n a l J o u r n a l o f M a n a g e m e n t C a s e s
THE INFLUENCE OF RELIGIOUS BELIEF ON DESTINATION IMAGE THE CASE OF THE HASHEMITE KINGDOM OF JORDAN
SALEM HARAHSHEHSCHOOL OF SERVICES MANAGEMENT, BOURNEMOUTH UNIVERSITY, UK
MICHAEL MORGANSCHOOL OF SERVICES MANAGEMENT, BOURNEMOUTH UNIVERSITY, UK
DR JONATHAN EDWARDSSCHOOL OF SERVICES MANAGEMENT, BOURNEMOUTH UNIVERSITY, UK
Abstract
This paper reports on research into the images of Jordan as a tourist destination held by British and Swedish people. The focus of this paper will be the influence of tourists’ religious beliefs and traditions upon destination image and destination selection. The literature suggests that an individual’s image of a destination will be influenced by their beliefs, attitudes and values. These are in part derived from the cultural traditions and narratives which they have learnt from their upbringing and social environment. Religion is an important element of that culture.
Research was undertaken to measure potential tourists’ perceptions of the attributes of Jordan and their holistic images of the destination, using a framework derived from Echtner and Ritchie. Respondents were also asked to state the strength of their religious belief and their commitment to the practice of their religion. As a control element, they were also asked about their commitment to other cultural factors – their monarchy, their national football team, their parliament and the European Union. . Kruskal Wallis Tests found significant differences in perceptions and attitudes towards Jordan between tourists based on their strength of religious belief and their commitment to the practice of their religion. These religious factors did not however seem to influence the images of Jordan chosen in unprompted open questions. While religious sites and associations are important elements of Jordan as a tourist destination, the results suggest that they work as facets of a broader historical and cultural image
which appeals to believers and non-believers alike.
Keywords: Jordan, destination image, religious motivations for tourism, tourism marketing
IntroductionThis paper reports on research into the images of Jordan as a tourist destination held by British and Swedish tourists. The focus of this paper will be the influence of tourists’ religious beliefs and traditions on their perceptions and images of the destination. The image a tourist holds of a destination plays an important part in the process of deciding whether to visit it. Images form a link between an individual’s motivations and destination selection process (Watkins et al, 2006; Murphy, 1999; MacInnis and Price 1987). Researchers, therefore, attempt to define the nature of destination image, identify the elements from which it is formed and analyse the factors which influence its formation. (For example, Chon (1990); Echtner and Ritchie (1991, 1993); Goodall (1992); Selby and Morgan (1996); Baloglu and McCleary (1999); Schneider and Sönmez (1999); Vaughan and Edwards (1999); Gallarza et al (2002)). Such research can be used by destination marketers as the basis of marketing communication strategies which project selected favourable elements of the image as a ‘destination brand’ (Middleton, 2001; Morgan, Pritchard and Pride, 2004).
I n t e r n a t i o n a l J o u r n a l o f M a n a g e m e n t C a s e s
64
Literature ReviewThere are many definitions of image (Jenkins, 1999) but Chon (1990)’s, that image is ‘the interaction of person’s beliefs, ideas, feelings and impressions about an object’, is typical in emphasising that image is personal and subjective, containing emotional as well as cognitive responses.
Baloglu and McCleary (1999) model shows that there are two types of factor influencing image formation: stimulus factors and personal factors. Stimulus factors include communications from destinations and travel intermediaries. Personal factors include both the psychological traits of the individual such as values, motivations and personality, and also social factors such as age, education, and marital status. Other examples of this distinction between external and internal factors include the push-pull theories of Dann (1977) and Crompton (1979) and the demand/supply model of Stabler (1988). Image therefore can be viewed from two contrasting perspectives, the receiver (tourist) and the marketer (destination) (Hussey and Duncombe, 1999; Gartner, 1993; Tuohino, 2002; Kapferer 1997). It follows that destination image research needs to take account of the characteristics of the people holding the image, i.e. in marketing terms the target market segment for the destination.
A number of studies have examined the variations in destination image held by different socio-demographic segments of tourist (Baloglu, 1997; Ryan, 2002; Watkins et al, 2006). Other authors stress the emotional and symbolic aspects of destination image. Holbrook and Hirschmann (1982) criticise the view of consumer decision-making as rational information-processing and see tourists as seeking emotional experiences, laden with symbolic meaning. The destination has symbolic significance and meaning that the visitors seek to be associated with (Pearce, 1988; Goossens, 2000; Voase, 2002; Kavanagh, 2000).
The meanings tourists ascribe to destination images will be derived not only from their personal characteristics and experience but also from the values of their culture. Tourists visit a certain destination because a meaning is created by the interaction of the visitor’s own cultural background and their understanding of the historical and
cultural significance of the location (Chhetri et al, 2004; Seddighi et al 2001)
This paper focuses on one important constituent of that culture - religion. Although we live in a secular life, ‘religion and spirituality are still among the most common motivations for travel’ (Timothy and Olsen, 2006). Jackowski ((2000) in Timothy and Olsen, 2006) estimated that 35% of all international tourists travelled for the purpose of religion (pilgrimages). According to Poria and Airey (2003) religion can influence tourism in a number of ways. It can be a motivator for travel. It can be an influence on the tourists’ visitation patterns, or it can be a constraint. It can also influence the social experiences of the tourists and the relationships between the tourists and the host community.
What their analysis underplays is the effect of religion on the meanings a tourist gives his/her image of the destination. Religion is not only beliefs and codes of behaviour but stories - cultural narratives and scripts which shape the way tourists see the world (Durgee et al 1991, Arnould and Price 1993; Vukonic, 1996) An individual’s image of a destination, therefore, will be influenced by their beliefs, attitudes and values, which are in part derived from the cultural traditions and narratives which they have learnt from their upbringing and social environment.
Research HypothesisThe hypothesis of this research was: a tourist with a strong religious belief or culture will hold different perceptions and holistic images of a destination from those a tourist with no strong religious culture has for the same destination
The assumption which this research aimed to test was that, for a country like Jordan, part of the Holy Lands of the Jewish, Christian and Islamic religions, religion would play an important part both in the images of the destination and the way that tourists interpret and perceive those images. Where a secular Western tourist might see Jordan in terms of its shared recent history (Lawrence, King Hussein and his British wife) or as part of the troubled Middle East or as the site of ancient wonders like Petra, and see a visit as a cultural experience of discovery, a Christian might see it as a pilgrimage to the land of Lot, Moses, John the Baptist and Jesus.

65
I n t e r n a t i o n a l J o u r n a l o f M a n a g e m e n t C a s e s
In countries such as Britain where only 6.3% attend church regularly (English Church Census 2005) but 71.8% of people still consider themselves Christians (National Statistics, UK, 2001); it is necessary to distinguish between respondents’ religious affiliation, their strength of religious belief and the commitment to the practice of religion. As a control element, respondents were also asked about their commitment to other cultural factors – the monarchy, the national football team, the European Union and the parliament. The hypothesis was that those with strong religious beliefs and/or commitment would hold different images of Jordan than others with no strong belief or commitment.
MethodologyTo test this, we used a research methodology based on the work of Echtner and Ritchie, 1991 which has been widely used by later researchers such as Baloglu and Mangaloglu (1999), Vaughan and Edwards (1999) Watkins et al (2006). This identified three main components of destination image, the functional-psychological, the attribute-holistic and the common-unique components. The functional components are those characteristics of the destination that can be observed and measurable. They include activities such as scenery, climate etc. Psychological characteristics include relaxation, interest, discovery and the friendliness of the local people. These were turned into a list of 22 attributes from which a questionnaire was designed. Respondents were asked to rate the importance of each attribute in their choice of destination, and their perception of how well Jordan performs in each attribute.
The holistic component of destination image consists of images that come into the respondents’ mind in response to unstructured open questions. They were asked to write a word or statement that came into their mind about Jordan. The next question asked them to describe the atmosphere or mood that they would expect to experience when visiting Jordan. The common/unique continuum distinguishes those attribute, impressions and images which are unique to the destination. The respondents were asked to name one unique or distinctive tourist attraction
in Jordan. We used the model of Brand Prism by Kapferer (1997) to analyse the holistic images of Jordan.
A survey was made of potential tourists from the UK and Sweden in two cities (Bournemouth in England and Borlänge in Sweden. Respondents were chosen randomly in a street survey. ). A total of 594 questionnaires were filled and valid for analysis (275 Britons and 319 Swedes)
FindingsThe relationship between respondents’ degree of religious belief and Jordan’s attributes
The respondents were asked to rate the strength of their religious belief on a scale of 1-7. 280 rated their belief as strong (5-7) 245 as weak (1-3) with 71 in the neutral midpoint (4). They were also asked to rate their commitment to the practice of their religion, which produced very similar results: 280 rated their commitment as strong (5-7) 243 as weak (1-3) with 69 in the neutral midpoint (4).
A Kruskal Wallis Test on the relationship between respondents’ strength of religious belief and Jordan’s destination attributes found ten attributes that showed degree of significance (significance <= 0.050): historical sites, religious sites, beaches, scenery and natural beauty, shopping, tourist information, accommodation, cleanliness, accessibility, and restful and relaxing atmosphere (Table 1).
In order to examine the where the significant differences lay, a cross tabulation between those variables is summarised in Table 2 below.
Table 2 shows the percentage of those in each of the three groups who rated the performance of Jordan high in that attribute. It shows that those without religious beliefs were less likely to have a high opinion of Jordan as a tourist destination than those with some degree of belief. Therefore, this appears to confirm the hypothesis that ‘a tourist with a strong religious belief or culture will have different perceptions of a destination from those a tourist with no strong religious culture chooses for the same destination’.
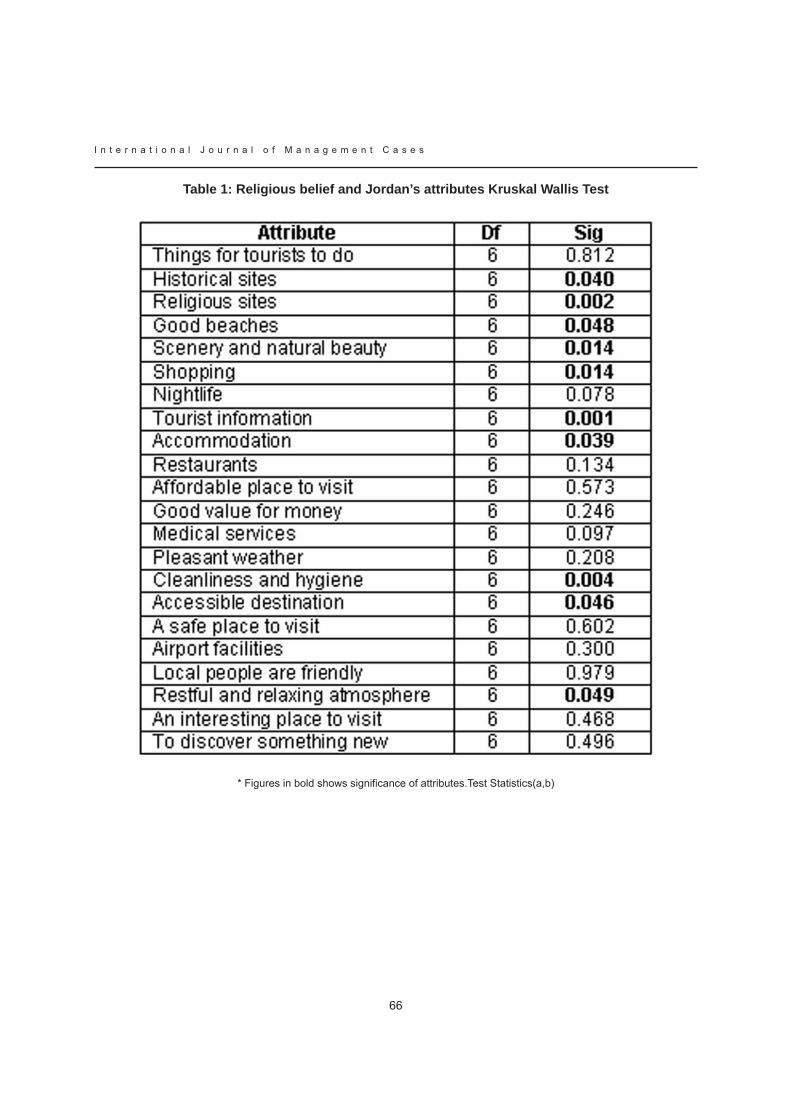
I n t e r n a t i o n a l J o u r n a l o f M a n a g e m e n t C a s e s
66
Table 1: Religious belief and Jordan’s attributes Kruskal Wallis Test
* Figures in bold shows significance of attributes.Test Statistics(a,b)
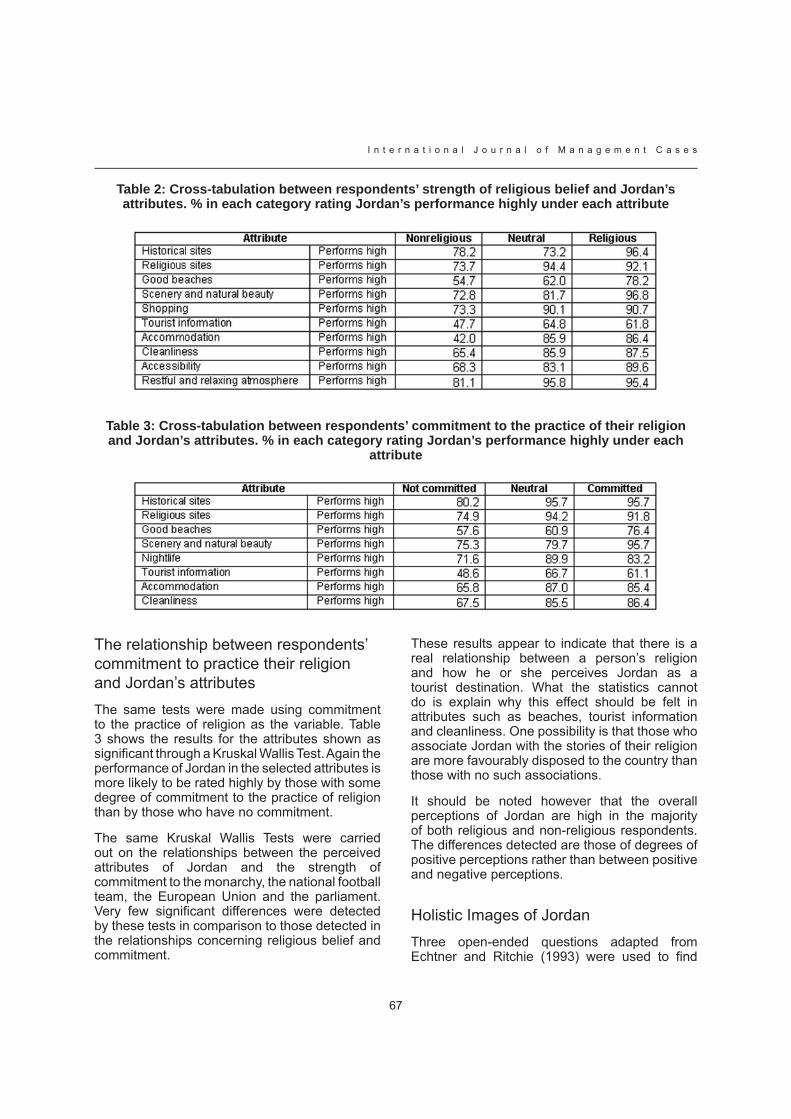
67
I n t e r n a t i o n a l J o u r n a l o f M a n a g e m e n t C a s e s
Table 2: Cross-tabulation between respondents’ strength of religious belief and Jordan’s attributes. % in each category rating Jordan’s performance highly under each attribute
Table 3: Cross-tabulation between respondents’ commitment to the practice of their religion and Jordan’s attributes. % in each category rating Jordan’s performance highly under each
attribute
The relationship between respondents’ commitment to practice their religion and Jordan’s attributesThe same tests were made using commitment to the practice of religion as the variable. Table 3 shows the results for the attributes shown as significant through a Kruskal Wallis Test. Again the performance of Jordan in the selected attributes is more likely to be rated highly by those with some degree of commitment to the practice of religion than by those who have no commitment.
The same Kruskal Wallis Tests were carried out on the relationships between the perceived attributes of Jordan and the strength of commitment to the monarchy, the national football team, the European Union and the parliament. Very few significant differences were detected by these tests in comparison to those detected in the relationships concerning religious belief and commitment.
These results appear to indicate that there is a real relationship between a person’s religion and how he or she perceives Jordan as a tourist destination. What the statistics cannot do is explain why this effect should be felt in attributes such as beaches, tourist information and cleanliness. One possibility is that those who associate Jordan with the stories of their religion are more favourably disposed to the country than those with no such associations.
It should be noted however that the overall perceptions of Jordan are high in the majority of both religious and non-religious respondents. The differences detected are those of degrees of positive perceptions rather than between positive and negative perceptions.
Holistic Images of JordanThree open-ended questions adapted from Echtner and Ritchie (1993) were used to find
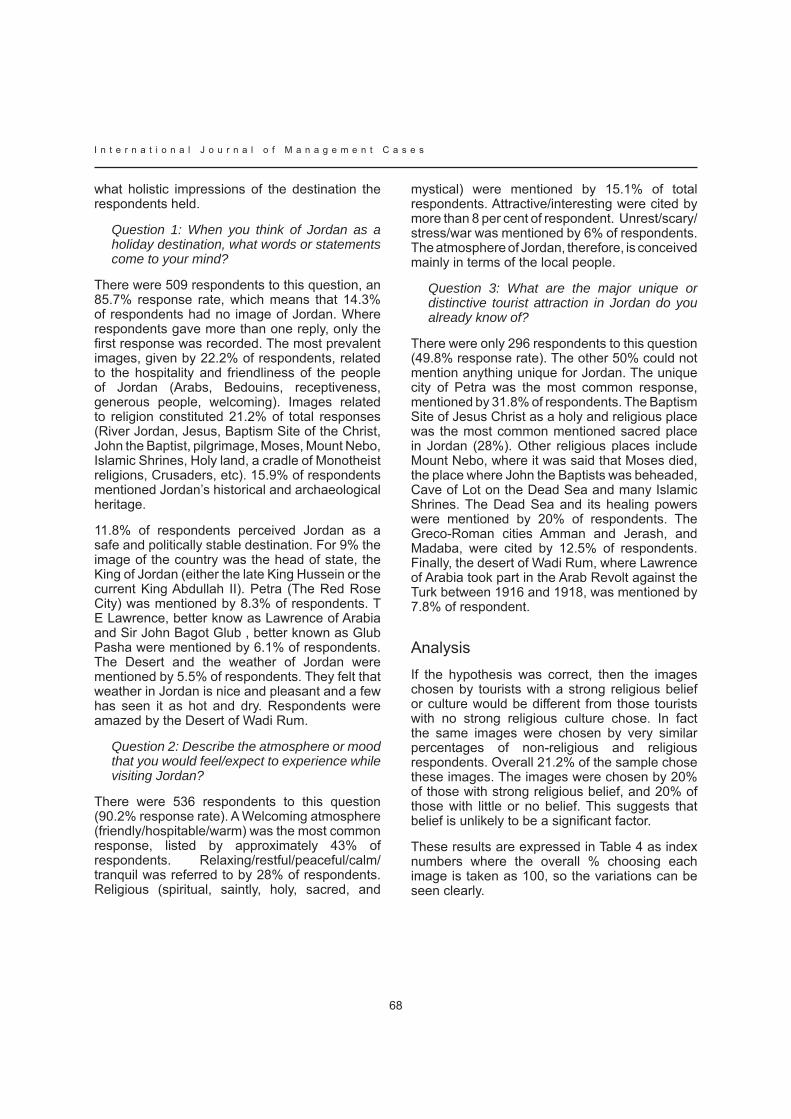
I n t e r n a t i o n a l J o u r n a l o f M a n a g e m e n t C a s e s
68
what holistic impressions of the destination the respondents held.
Question 1: When you think of Jordan as a holiday destination, what words or statements come to your mind?
There were 509 respondents to this question, an 85.7% response rate, which means that 14.3% of respondents had no image of Jordan. Where respondents gave more than one reply, only the first response was recorded. The most prevalent images, given by 22.2% of respondents, related to the hospitality and friendliness of the people of Jordan (Arabs, Bedouins, receptiveness, generous people, welcoming). Images related to religion constituted 21.2% of total responses (River Jordan, Jesus, Baptism Site of the Christ, John the Baptist, pilgrimage, Moses, Mount Nebo, Islamic Shrines, Holy land, a cradle of Monotheist religions, Crusaders, etc). 15.9% of respondents mentioned Jordan’s historical and archaeological heritage.
11.8% of respondents perceived Jordan as a safe and politically stable destination. For 9% the image of the country was the head of state, the King of Jordan (either the late King Hussein or the current King Abdullah II). Petra (The Red Rose City) was mentioned by 8.3% of respondents. T E Lawrence, better know as Lawrence of Arabia and Sir John Bagot Glub , better known as Glub Pasha were mentioned by 6.1% of respondents. The Desert and the weather of Jordan were mentioned by 5.5% of respondents. They felt that weather in Jordan is nice and pleasant and a few has seen it as hot and dry. Respondents were amazed by the Desert of Wadi Rum.
Question 2: Describe the atmosphere or mood that you would feel/expect to experience while visiting Jordan?
There were 536 respondents to this question (90.2% response rate). A Welcoming atmosphere (friendly/hospitable/warm) was the most common response, listed by approximately 43% of respondents. Relaxing/restful/peaceful/calm/tranquil was referred to by 28% of respondents. Religious (spiritual, saintly, holy, sacred, and
mystical) were mentioned by 15.1% of total respondents. Attractive/interesting were cited by more than 8 per cent of respondent. Unrest/scary/stress/war was mentioned by 6% of respondents. The atmosphere of Jordan, therefore, is conceived mainly in terms of the local people.
Question 3: What are the major unique or distinctive tourist attraction in Jordan do you already know of?
There were only 296 respondents to this question (49.8% response rate). The other 50% could not mention anything unique for Jordan. The unique city of Petra was the most common response, mentioned by 31.8% of respondents. The Baptism Site of Jesus Christ as a holy and religious place was the most common mentioned sacred place in Jordan (28%). Other religious places include Mount Nebo, where it was said that Moses died, the place where John the Baptists was beheaded, Cave of Lot on the Dead Sea and many Islamic Shrines. The Dead Sea and its healing powers were mentioned by 20% of respondents. The Greco-Roman cities Amman and Jerash, and Madaba, were cited by 12.5% of respondents. Finally, the desert of Wadi Rum, where Lawrence of Arabia took part in the Arab Revolt against the Turk between 1916 and 1918, was mentioned by 7.8% of respondent.
AnalysisIf the hypothesis was correct, then the images chosen by tourists with a strong religious belief or culture would be different from those tourists with no strong religious culture chose. In fact the same images were chosen by very similar percentages of non-religious and religious respondents. Overall 21.2% of the sample chose these images. The images were chosen by 20% of those with strong religious belief, and 20% of those with little or no belief. This suggests that belief is unlikely to be a significant factor.
These results are expressed in Table 4 as index numbers where the overall % choosing each image is taken as 100, so the variations can be seen clearly.
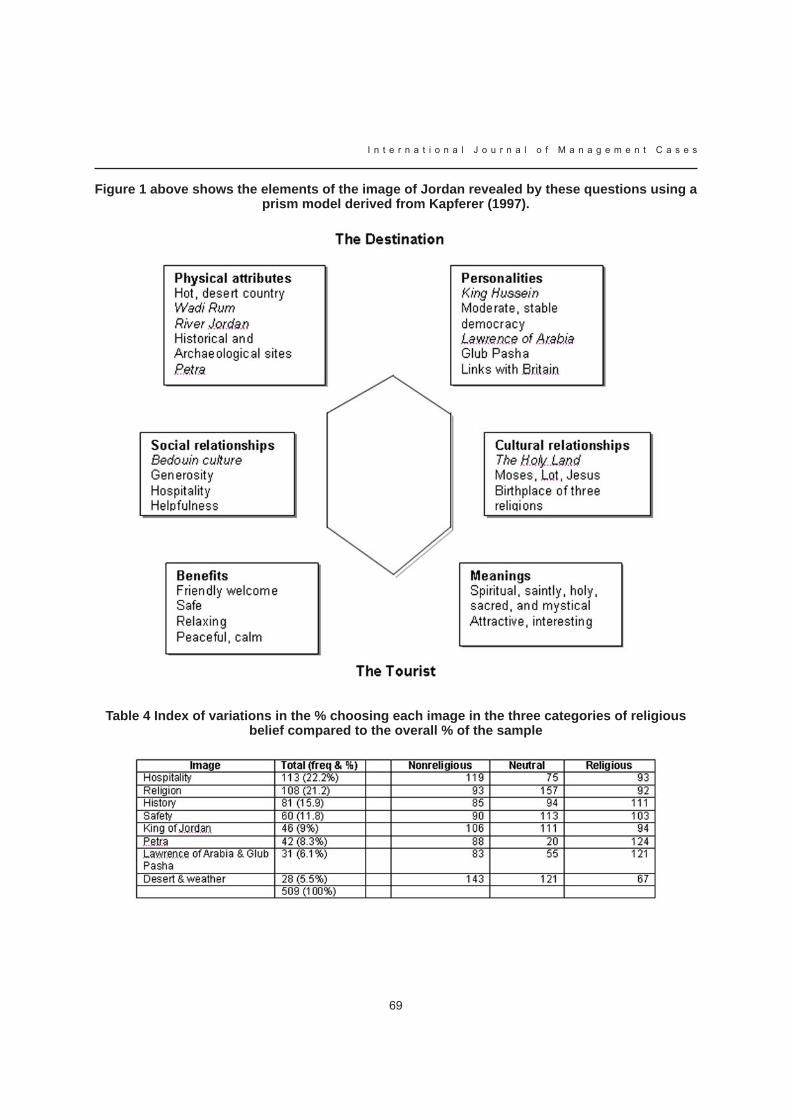
69
I n t e r n a t i o n a l J o u r n a l o f M a n a g e m e n t C a s e s
Figure 1 above shows the elements of the image of Jordan revealed by these questions using a prism model derived from Kapferer (1997).
Table 4 Index of variations in the % choosing each image in the three categories of religious belief compared to the overall % of the sample
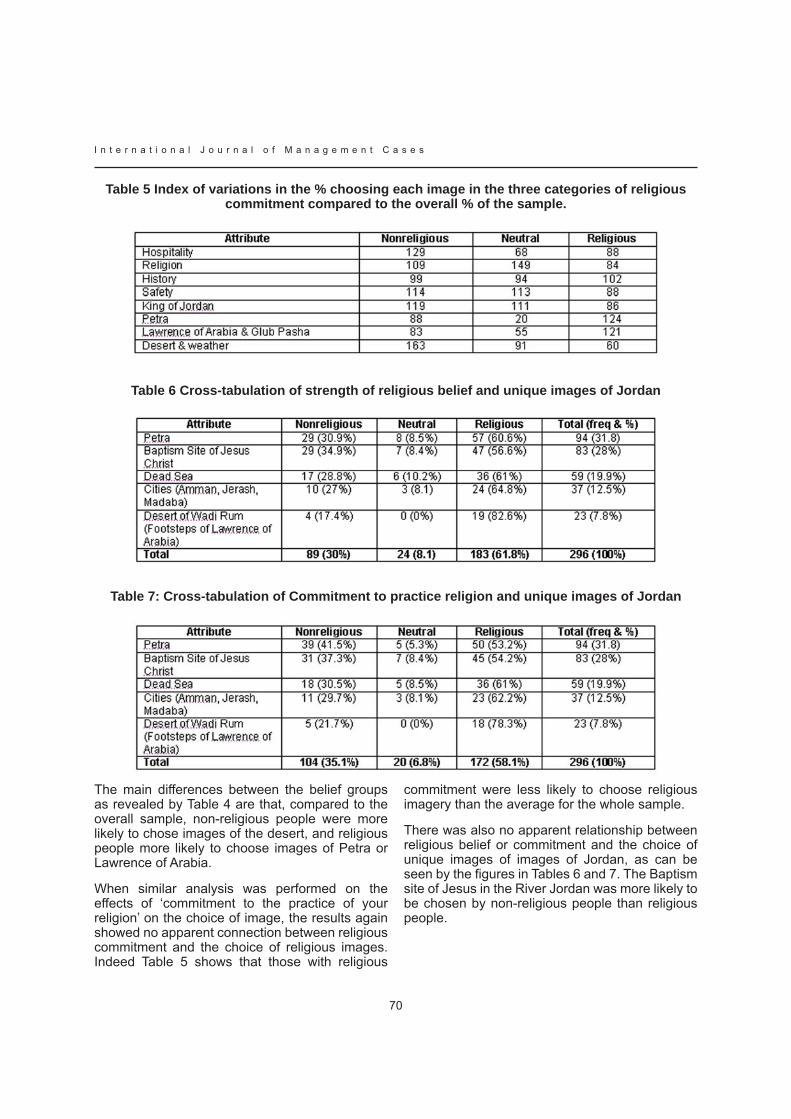
I n t e r n a t i o n a l J o u r n a l o f M a n a g e m e n t C a s e s
70
Table 5 Index of variations in the % choosing each image in the three categories of religious commitment compared to the overall % of the sample.
Table 6 Cross-tabulation of strength of religious belief and unique images of Jordan
Table 7: Cross-tabulation of Commitment to practice religion and unique images of Jordan
The main differences between the belief groups as revealed by Table 4 are that, compared to the overall sample, non-religious people were more likely to chose images of the desert, and religious people more likely to choose images of Petra or Lawrence of Arabia.
When similar analysis was performed on the effects of ‘commitment to the practice of your religion’ on the choice of image, the results again showed no apparent connection between religious commitment and the choice of religious images. Indeed Table 5 shows that those with religious
commitment were less likely to choose religious imagery than the average for the whole sample.
There was also no apparent relationship between religious belief or commitment and the choice of unique images of images of Jordan, as can be seen by the figures in Tables 6 and 7. The Baptism site of Jesus in the River Jordan was more likely to be chosen by non-religious people than religious people.
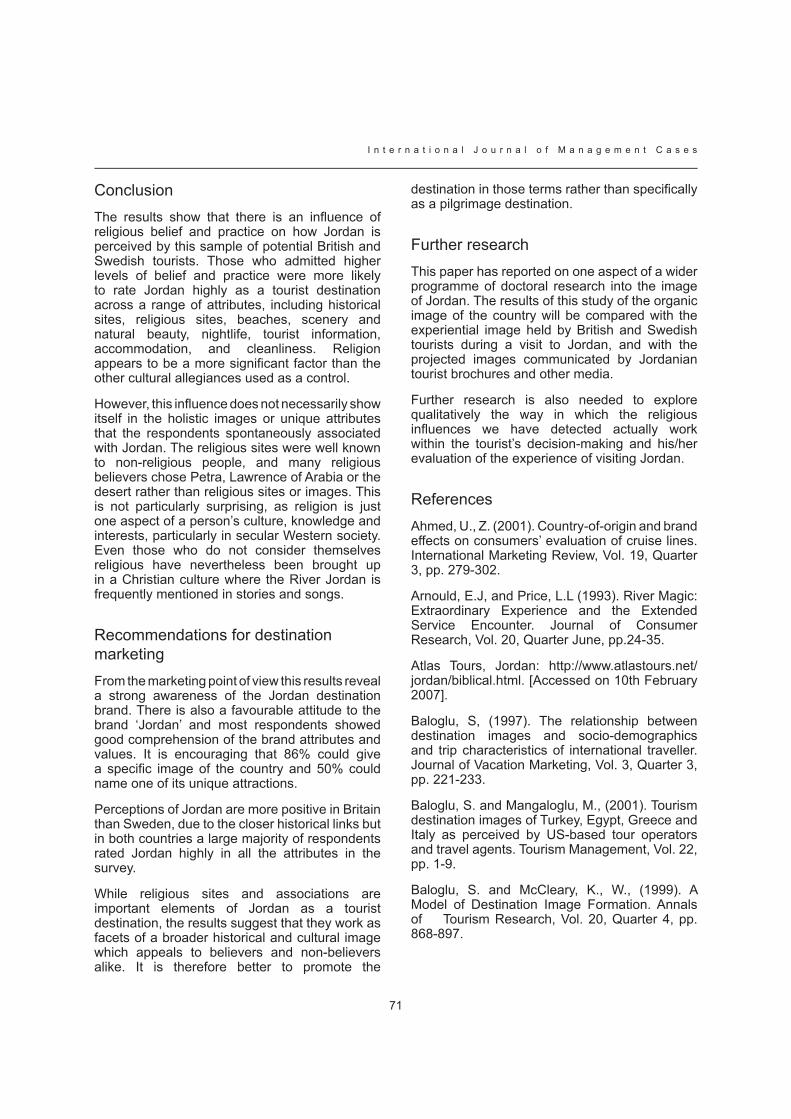
71
I n t e r n a t i o n a l J o u r n a l o f M a n a g e m e n t C a s e s
Conclusion The results show that there is an influence of religious belief and practice on how Jordan is perceived by this sample of potential British and Swedish tourists. Those who admitted higher levels of belief and practice were more likely to rate Jordan highly as a tourist destination across a range of attributes, including historical sites, religious sites, beaches, scenery and natural beauty, nightlife, tourist information, accommodation, and cleanliness. Religion appears to be a more significant factor than the other cultural allegiances used as a control.
However, this influence does not necessarily show itself in the holistic images or unique attributes that the respondents spontaneously associated with Jordan. The religious sites were well known to non-religious people, and many religious believers chose Petra, Lawrence of Arabia or the desert rather than religious sites or images. This is not particularly surprising, as religion is just one aspect of a person’s culture, knowledge and interests, particularly in secular Western society. Even those who do not consider themselves religious have nevertheless been brought up in a Christian culture where the River Jordan is frequently mentioned in stories and songs.
Recommendations for destination marketingFrom the marketing point of view this results reveal a strong awareness of the Jordan destination brand. There is also a favourable attitude to the brand ‘Jordan’ and most respondents showed good comprehension of the brand attributes and values. It is encouraging that 86% could give a specific image of the country and 50% could name one of its unique attractions.
Perceptions of Jordan are more positive in Britain than Sweden, due to the closer historical links but in both countries a large majority of respondents rated Jordan highly in all the attributes in the survey.
While religious sites and associations are important elements of Jordan as a tourist destination, the results suggest that they work as facets of a broader historical and cultural image which appeals to believers and non-believers alike. It is therefore better to promote the
destination in those terms rather than specifically as a pilgrimage destination.
Further researchThis paper has reported on one aspect of a wider programme of doctoral research into the image of Jordan. The results of this study of the organic image of the country will be compared with the experiential image held by British and Swedish tourists during a visit to Jordan, and with the projected images communicated by Jordanian tourist brochures and other media.
Further research is also needed to explore qualitatively the way in which the religious influences we have detected actually work within the tourist’s decision-making and his/her evaluation of the experience of visiting Jordan.
References Ahmed, U., Z. (2001). Country-of-origin and brand effects on consumers’ evaluation of cruise lines. International Marketing Review, Vol. 19, Quarter 3, pp. 279-302.
Arnould, E.J, and Price, L.L (1993). River Magic: Extraordinary Experience and the Extended Service Encounter. Journal of Consumer Research, Vol. 20, Quarter June, pp.24-35.
Atlas Tours, Jordan: http://www.atlastours.net/jordan/biblical.html. [Accessed on 10th February 2007].
Baloglu, S, (1997). The relationship between destination images and socio-demographics and trip characteristics of international traveller. Journal of Vacation Marketing, Vol. 3, Quarter 3, pp. 221-233.
Baloglu, S. and Mangaloglu, M., (2001). Tourism destination images of Turkey, Egypt, Greece and Italy as perceived by US-based tour operators and travel agents. Tourism Management, Vol. 22, pp. 1-9.
Baloglu, S. and McCleary, K., W., (1999). A Model of Destination Image Formation. Annals of Tourism Research, Vol. 20, Quarter 4, pp. 868-897.

I n t e r n a t i o n a l J o u r n a l o f M a n a g e m e n t C a s e s
72
Beerli, A. and Martín, J., D. (2004). Factors influencing destination image. Annals of Tourism Rsearch, Vol. 31, Quarter 3, pp. 657-681.
Beerli, A., and Martín, J., D., (2004). Tourists’ Characteristics and the Perceived Image of Tourist Destination: A Quantitative Analysis- A Case Study of Lanzarote, Spain. Tourism Management, Vol. 25, pp. 623-636.
Chen, J., 2001. A case study of Korean Outbound Travellers’ Destination Images by using Correspondence Analysis. Tourism Management, Vol. 22, pp. 345-350.
Chhetri, P., Arrowsmith, C. and Jackson, M, (2004). Determining hiking experiences in nature based tourism destinations. Tourism Management, 25:1 31-43.
Chon, K-S., (1990). The Role of Destination Image in Tourism: A Review and Discussion. The Tourist Review, Vol. 2, pp. 2-9.
Crompton, J., L., (1979). Motivation for Pleasure Vacation. Annals of Tourism Research, Vol. 6, pp. 408-424
Dann, G., (1977). Anomie, Ego-enhancement and Tourism. Annals of Tourism Research, Vol. 4, pp. 184-194.
Dann, G., (1996a). The People of Tourist Brochures. In: T., Selwyn, ed. The Tourist Image: Myths and Myth Making in Tourism. Chichester: John Wiley & Sons, 61-81.
Dann, G., (1996b). Tourist Images of a Destination: An Alternative Analysis. Journal of Travel and Tourism Marketing, Vol. 5, Quarter 1/2, pp. 41-55.
Durgee, J.F., Holbrook, M. B. and Sherry J. F. (1991). The delivery of Vacation Performances, in Highways and Byways: Naturalistic Research from the Consumer Behaviour Odysee. (R. W. Belk ed). Association for Consumer Research, pp. 131-140.
Echtner, C.M, and Ritchie, J. R. B., (1991). The meaning and measurement of destination image. Tourism Studies, Vo. 2, Quarter 2, pp. 2-12.
Echtner, C.M, and Ritchie, J., R. B., (1993). The Measurement of Destination Image: An Empirical
Assessment. Journal of Travel Research, Quarter Spring, pp. 3-13.
English Church Census (2005). http://www.christian-research.org.uk/. [Accessed on 10th February 2007].
Fleischer, A., (2000). The tourist behind the pilgrim in the Holy Land. Hospitality Management, Vol. 19, pp. 311-326.
Gallarza, M., Saura, I., G. and García, H., C., (2002). Destination Image toward a Conceptual Framework. Annals of Tourism Research, Vol. 29, Quarter 1, pp. 65-78.
Gartner, W., C, (1989). Tourism image: attribute measurement of state tourism products using multidimensional scaling techniques. Journal of Travel Research, Quarter Fall, pp. 16-20.
Gartner, W., C., (1993). Image Formation Process. Journal of Travel and Tourism Marketing, Vol. 2, Quarter 2/3, pp. 191-215.
Goossens, C., (2000). Tourism information and pleasure motivation. Annals of Tourism Research, Vol. 27, Quarter 2, pp. 301-321.
Hofstede, G. (1981, 1984). Culture’s consequences: international differences in work-related values. London: Sage.
Holbrook, M.B. and Hirschmann, E.C, (1982) The Experiential Aspects of Consumption: Fantasies, Feelings and Fun. Journal of Consumer Research, Vol. 9, Quarter 2, pp. 132-9.
Hussey, M. and Duncombe, N, (1999). Projecting the right image: using projective techniques to measure brand image. Qualitative Market research: An International Journal, Vol. 2, Quarter 1, pp. 22-30.
Jenkins, O., H., (1999). Understanding and measuring tourist destination images. International Journal of Tourism Research, Vol. 1, pp. 1-15.
Jordan Embassy USA website: http://www.jordanembassyus.org/new/pr/pr06242005.shtml. [Accessed on 10th February 2006].
Jordan Tourism Board: http://www.visitjordan.com/. [Accessed on 10th February 2007].

73
I n t e r n a t i o n a l J o u r n a l o f M a n a g e m e n t C a s e s
Kapferer, J-N., (1997). Strategic Brand Management: Creating and Sustaining Brand equity Long Term. 2nd ed. London: Kogan Page.
Kavanagh, G, (2000). Dream spaces: memory and the museum. Leicester University Press
Litvin, S, W. and Goh, H., K., (2002). Self-image congruity: A valid tourism theory? Tourism Management, Vol. 23, pp. 81-83.
MacInnis, D., J. and Price, L., L., (1987). The Role of Imagery in Information Processing: Review and Extensions. Journal of Consumer Research, 13, 473-491
Middleton, V., T., C., (2001). Marketing in Travel and Tourism. 3rd ed. Oxford: Butterworth Heinemann.
Morgan, N. Pritchard, A. and Pride, R, (2004). Destination Branding. Butterworth Heinemann
Murphy, L. (1999). Australia’s image as a holiday destination –perceptions of backpacker visitors. Journal of Travel and Tourism Marketing Vol. 8, Quarter 3, pp. 21-45.
National Statistics UK (2001). http://www.statistics.gov.uk/. [Accessed 10th February 2007].
Pearce, P., L., (1993). Fundamentals of Tourist Motivation. In: D., G., Pearce and R., W., Butler, eds. Tourism Research: Critiques and Challenges. London: Routledge. 113-134.
Pike, S., (2002). Destination image analysis: A review of 142 papers from 1973 to 2000. Tourism Management, Vol. 23, pp. 541-549.
Poria, Y and Airey, D, (2003). Tourism, religion and religiosity: A Holy Mess. Current Issues in Tourism, Vol. 6, Quarter 4, pp. 340-363.
Ryan, C (Ed.) (1997, 2002). The Tourist Experience. London: Thomson Learning.
Schneider, I. and Sönmez, S., (1999). Exploring the tourist image of Jordan. Tourism Management, 20, 539-542.
Schofield, P., (1996). Cinematographic images of a city: alternative heritage tourism in Manchester. Tourism Management, Vol. 17, Quarter 5, pp. 333-340.
Seddighi, H., R. and Theocharous, A., L., (2002). A model of tourism destination choice: a theoretical and empirical analysis. Tourism Management, Vol. 23, pp. 475-487.
Seddighi, H., R. Nuttall, M., W. and Theocharous, A., L., (2001). Does cultural background of tourists influence the destination choice? An empirical study with special reference to political instability. Tourism Management, Vol. 22, pp. 181-191.
Selby, M. and Morgan, N., J., (1996). Reconstruing Place Image: A Case Study of its Role in Destination Market Research. Tourism Management, Vol. 17, Quarter 4, pp. 287-294.
Sönmez, S. and Sirakaya, E., (2002). A distorted destination image? The case of Turkey. Journal of Travel Research, Vol. 41, Quarter 2, pp. 185-192.
The Baptism Site of Jesus Christ: http://www.baptismsite.com/index.asp. [Accessed on 10th Febrauary 2007].
Timothy, d., J., and Olsen, D., H., (2006). Tourism, religion and spiritual journies. London: Routledge.
Tuohino, A., (2001). The destination image of Finnish Lake Districts. Paper presented in the 10th Nordic Tourism Research Symposium in Vaasa, Finland, 18-20 October.
UNWTO: Tourism Market Trend (2006).
Vaughan, R. and Edwards, R., (1999). Experiential Perceptions of two Winter Sun Destinations: the Algarve and Cyprus. Journal of Vacation Marketing, Vol. 5, Quarter 4, pp. 356-368.
Vaughan, R., (2002). Images of a Museum. Museum Management and Curatorship, Vol 19, Quarter 3, pp. 253-268.
Voase, R., ed. (2002). Tourism in Western Europe- a collection of case histories. Wallingford: CABI Publishing, pp 263.
Weaver, D. and Lawon, L. (2002). Tourism Management. Sydney: Wiley.
Vukonic, B., (1996). Tourism and religion. Oxford: Pergamon.
Watkins, S. Hassanien, A.and Dale, C. (2006). Exploring the image of the Black Country as a tourist destination. Place Branding Vol. 2, Quarter 4, pp. 321-33.
I n t e r n a t i o n a l J o u r n a l o f M a n a g e m e n t C a s e s
74
DOES FAIRTRADE REPRESENT A MARKETING OPPORTUNITY FOR THE UK
TOURISM INDUSTRY?
NEIL RICHARDSONLEEDS BUSINESS SCHOOL, LEEDS METROPOLITAN UNIVERSITY, UK
CHARLOTTE G. EILERTSENLEEDS BUSINESS SCHOOL, LEEDS METROPOLITAN UNIVERSITY, UK
ALEXANDRA J. KENYON, LEEDS METROPOLITAN UNIVERSITY, UK
Abstract
The UK tour operating sector is highly competitive and dominated by large mass operators selling low-priced holidays, increasingly to long-haul destinations. Consumers’ concerns about the environmental, social and economic impacts of tourism have grown in prominence over recent years. This trend has contributed to the growth in ethical tourism which is increasingly being used as a means of product differentiation. This coincides with the growth in the UK Fairtrade market which is moving into the mainstream as the brand is continually being applied to new products and services.
This research seeks to establish whether the ethical concept of fair trade represents a marketing opportunity for the UK tourism industry. Relevant literature is reviewed to analyse the tourism industry’s market opportunities and threats, to evaluate ethical market trends and to identify potential key marketing approaches for ethical businesses. Preliminary research carried out among tourism industry representatives provides contextualisation for the research topic. At this juncture the idea of fair trade in tourism has been found to be new; however the respondents’ attitudes towards the concept are largely positive and they deem it to be germane to the industry. Information gained through the preliminary and secondary research has been synthesized and, in order to test the study’s objectives, a telephone survey has been conducted among a probability sampled group of ABTA tour operators.
The tour operators’ awareness of the growing ethical market trend is limited and yet most respondents perceive fair trade to be useful to the tourism industry. Around 70% of these operators actually undertake business practices they defined as fair trade, but only 10% promote these practices. The main explanation for this is lack of awareness when it comes to the branding opportunity fair trade represents. This study concludes that fair trade does represent a marketing opportunity for the tourism industry. It improves product quality, motivates staff, creates a competitive advantage and is a social responsibility the tour operators take seriously.
Key Words
Ethical Tourism, Tour Operators, Fairtrade
IntroductionThe UK is the world’s third highest spender on international tourism (Key Note, 2005b) with visits abroad having increased by 55% over the last decade and counting for 64 million trips in 2004 (ONS, 2006). Independent holidays have increased rapidly over the last 5 years at double the rate of package holidays (Key Note, 2005b) which, in 2004, comprised 19.8 million package holiday trips (ibid). The UK has a highly developed tour-operating industry where the competition is fierce (Key Note, 2004). There were 5 475 UK VAT-based tour operators and travel agents in 2004 (Key Note, 2005b) of which around 1800 are members of the Association of British Travel Agents (ABTA) (ibid). ABTA is the UK’s major trade
75
I n t e r n a t i o n a l J o u r n a l o f M a n a g e m e n t C a s e s
association for tour operators and travel agents. Its members are responsible for around 85% of the holidays sold in the UK (ABTA, 2006a).
The Fairtrade Labelling Organisations International (FLO), which is the global umbrella organisation for all national Fairtrade certification initiatives, has not developed a label for tourism yet (Buitrago, 2006). Consumers’ awareness and preference of ethical products are rapidly increasing, and the Fairtrade Mark has become a well-known brand in supermarkets across the UK (Fairtrade Foundation, 2006c). Travellers are now seeking a range of other attributes besides price (Doyle, 2002). One area within tourism that is increasing in popularity is ethical travels (Butcher, 2003; Goodwin and Francis, 2003; Tearfund, 2002; Weeden, 2001).
There is evidence of a consumer trend towards the purchase of more ethically traded products across differing sectors (Tearfund, 2000; Weeden 2001; Goodwin and Francis, 2003; Key Note, 2005a; Mintel, 2005; Nicholls and Opal, 2005; Wagner, 2005). Increasingly UK consumers are buying products that are identified as Fairtrade or other ethically-produced label goods, up from 29% in 2002 to 32% in 2004 (Key Note, 2005a). The UK ethical market was worth £24.7 billion in 2003, a 16.3% increase from the previous year (EPI, 2004). The overall market share of ethical consumerism in the UK has increased by almost 40% in the last five years (Mintel, 2005).
Terms of ReferenceThe World Tourism Organisation and United Nations define tourism as “the activities of persons travelling to and staying in places outside their usual environment for not more than 1 consecutive year for leisure, business and other purposes” (Key Note, 2004, p3). Tour operators “assemble travel packages usually targeted at the leisure market. These generally include transportation and accommodations…Retail travel agents sell these packages. The tour wholesaler has …to give consumers a package that is perceived to be a better value than what they could arrange on their own” (Kotler, Bowen and Makens, 1999, p457).
The aim of Fairtrade is
“to offer the most disadvantaged producers in developing countries the opportunity to move out of extreme poverty through creating
market access … under beneficial rather than exploitative terms. The objective is to empower producers to develop their own businesses and wider communities through international trade. Fairtrade offers a new model of the producer-consumer relationship … which distributes its economic benefits more fairly between all stakeholders” (Nicholls and Opal 2005, p6).
Fairtrade in Tourism as a concept has existed since the late 1990s. The International Network on Fairtrade in Tourism has facilitated discussions at international level which have resulted in an agreed definition and a set of common criteria (Cleverdon, 2001; Kalisch, 2001; Plüss, 2003; Tourism Concern, n.d) namely Fairtrade in Tourism is:
“a key aspect of sustainable tourism. It aims to maximise the benefits from tourism for local destination stakeholders through mutually beneficial and equitable partnerships between national and international tourism stakeholders in the destination. It also supports the right of indigenous host communities, whether involved in tourism or not, to participate as equal stakeholders and beneficiaries in the tourism development process” (Kalisch 2001:11).
Aims and ObjectivesThe aim of this study is to establish if Fairtrade represents a marketing opportunity for UK tour operators. In order to achieve this overall research aim, the following objectives have to be met:
To establish UK tour operators’ frame of • reference when it comes to business ethics and ethical demand and supply in the market place
To investigate UK tour operators’ awareness • and attitudes towards Fairtrade in tourism including barriers and opportunities
To establish whether Fairtrade represents a • marketing opportunity for the tourism industry
Literature ReviewThis study contributes knowledge to the nascent area of fair trade tourism. As a relatively new area of study there is little existing academic material.

I n t e r n a t i o n a l J o u r n a l o f M a n a g e m e n t C a s e s
76
There is a movement towards more active, explorative and independent holiday makers (Butcher, 2003; Goodwin and Francis, 2003; ABTA, 2005; ABTA 2006b) and travel is increasingly “about experiences, fulfilment and rejuvenation” rather than about “places and things” (King, 2002). More tourists pursue experiences which satisfy social and emotional needs. As they become more conscious of how they spend their holidays, they also turn more critical as consumers (Goodwin and Francis, 2003).
Many consumers preferred companies with written codes to guarantee good working conditions, environmental protection and support to local charities in the destination (Tearfund, 2002). They were willing to pay more for their holiday if these practices were guaranteed. Surveys carried out by ABTA in 2000 and 2002 support these findings (Key Note, 2004). These preferences may not provide guaranteed patterns of how tourists actually will behave when booking holidays (Goodwin and Francis, 2003) however travel companies’ ethical practices can have a decisive role in a competing climate as travel consumers “can reasonably be expected to exercise their preference for a holiday that meets their ethical consumption aspirations” (ibid, p278).
Hence tourism companies with ethical practices have an opportunity to differentiate themselves from the competitors and thus gain a competitive advantage (Tearfund, 2000; Weeden, 2001). In response to this ethical and sustainable tourism is being practiced by an increasing number of travel organisations (Key Note, 2005c; Mintel, 2003; Mintel, 2005).
Whilst only representing 1% of the overall tourism market 1% (Mintel, 2005), UK ecotourism is forecast to grow to 2.5 million holidays by 2010 (ibid). A growing number of companies are using eco-friendly features as a marketing tool to position themselves from the mass tourism operators (Key Note, 2005a). The growth in ethical tourism demand and supply has been followed up by industry initiatives addressing ethical issues in particular. The Tour Operators’ Initiative for Sustainable Development (TOI) is an international programme developed by tour operators where they commit themselves to sustainable development (TOISD, 2001). In the UK, ABTA’s Responsible Tourism Awards is a similar initiative which rewards companies with outstanding responsible and sustainable practices (ABTA, 2006b).
The general growth of ethical consumerism provides the main driver behind the development of the Fairtrade market (Nicholls and Opal, 2005). Global sales of Fairtrade products rose by approximately 50% from 2002 to 2003 (Vidal, 2004) with sales estimated to top £1 billion by 2007 (Demetriou, 2003). Fairtrade is now on the agenda globally for leading retailers (and other stakeholders) and is being recognised by supra-national organisations including the UN and EC.
Of the 20 countries that make up FLO, the UK has the largest Fairtrade market (Fairtrade Foundation, 2006c). The Fairtrade Mark was first introduced in the UK in 1994, and ten years later the estimated UK sales of Fairtrade retail products were more than £140 million. There are now over 1500 Fairtrade products in the UK (Fairtrade Foundation, 2005; Fairtrade Foundation, 2006c). 50% of the adult UK population can identify the Fairtrade Mark (Fairtrade Foundation, 2005) which was initially a commodity brand, but has grown to include the textile and sports industries (Fairtrade Foundation 2006b). Fairtrade has developed into a strong brand (Nicholls and Opal 2005) resulting from various initiatives.
FLO has not developed a label for tourism yet, but they are studying the possible value that their label could add to this sector (Buitrago, 2006). Tourism Concern (in an e-mail to the Author) do not think that Fairtrade - as far as the Fairtrade movement recognises it - is particularly well understood among the major tour operators and they doubt it is on their agenda (James, 2006)
MethodologySurvey methodology was selected as the research design most suitable to test the study’s objectives as it sought to investigate a particular business activity (Zikmund, 2003) as well as establishing what a representative section of respondents think, believe, value and feel (Jankowicz, 2005).
Exploratory qualitative research clarified the research problem ensuring a more rigorous study (Zikmund, 2003) and suggested the extent of Fairtrade’s awareness in the tourism industry. Tour operators and travel agents were sampled on the basis of maximum variation (size, market share, services and target segments). The four companies that participated in the preliminary research were a local travel agent, a small niche tour operator,

77
I n t e r n a t i o n a l J o u r n a l o f M a n a g e m e n t C a s e s
a major travel agent and a mass tour operator. The preliminary research highlighted a noticeable difference in levels of awareness between travel agents and tour operators when it came to ethical issues within tourism which contributed to the decision to focus on UK tour operators.
Research method and data collection techniquesThis cross-sectional study was conducted from March to October 2006 using a multi-method approach as suggested (Saunders, Lewis and Thornhill, 2000;Jankowicz, 2005) for situations where the research topic is unexplored. Interviewer-administered telephone questionnaires (Saunders, Lewis and Thornhill 2000) were used to collect quantitative and qualitative (Zikmund, 2003) data to address the complex issues. A pilot survey detected problems in the design and administration of the questionnaire as well as testing the accuracy of the estimated response rate.
Respondents were chosen from the ABTA List of Members (November 2003). Probability sampling was used on a target frame (stratified from the overall population) that included mass and niche tour operators. The respondents held either general management or marketing related positions. Of the 531 companies approached, 309 (58%) were non-respondents (wrong phone number or no response or were otherwise ineligible). However, among the 222 potential respondents there were only 43 direct refusals. The result of the data collection was 30 completed questionnaires, a response rate of 14%.
Discussion of fi ndings
Tour operators’ marketing orientation
The dominant target segment among the respondents is the luxury, top-end group of travellers which may be due to most operators differentiating themselves by offering either niche holidays or high quality services to consumers with higher disposable incomes. The tour operating sector is perceived as highly intensive by most respondents. When it comes to competition within their target segments it is perceived as less intensive. This chimes with market assessments (Key Note 2004; 2005b; 2005c) however there is
no clear correlation between type of market (mass and niche) and level of competitive intensity, the way the respondents perceive it.
Over 80% of the respondents tend towards customer orientation as they cite raising customer satisfaction as very important to their business. Customer acquisition is also rated highly in terms of strategic importance. These foci suggest the marketing concept has a strong position within the travel companies.
Tour operators’ ethical awareness
The respondents demonstrate high degrees of awareness with respect to business ethics and its implications, recognising many issues deemed to be central to ethical business practices. That said their awareness of ethical consumerism produced ambiguous findings with 60% believing consumers are increasingly ethically aware whereas 37% are doubtful. Similarly when considering the travel companies’ perceptions of consumer demand for ethical products. More than 50% believe ethical product demand is increasing whereas 33% remain doubtful. These similarities suggest that the companies do not perceive a gap between consumers’ ethical awareness and their actual behaviour. This contradicts previous studies (Goodwin and Francis, 2003) which suggest consumers profess concern about ethical issues but do not behave accordingly.
Charity support is part of corporate philanthropy and one of the traditional, more reactive elements of ethical business behaviour (Kotler and Lee, 2005). This study found a trend towards more direct, proactive socially responsible business practices. 70% of the travel companies claim to have a strong emphasis on ethical business practices which could be argued to be high considering the findings in ethical awareness and this may be attributed to this study identifying the respondents’ perceptions of business behaviour rather than the corresponding practices or realities. That said 57% of respondents believe they must behave ethically to stay competitive in the market. This might indicate that some businesses’ ethical practices are not driven by solely commercial motives.
Fairtrade in tourism: tour operators’ attitudes
The respondents show good knowledge of the Fairtrade concept and brand, and what it involves
I n t e r n a t i o n a l J o u r n a l o f M a n a g e m e n t C a s e s
78
throughout the supply chain. 60% correctly related Fairtrade to fair treatment of suppliers in terms of payment, contracts and work conditions. The perceptions of Fairtrade’s growth pattern are ambiguous as 63% believe Fairtrade is growing in popularity, 23% are uncertain and 7% disagree with this. This is despite the previously discussed the UK being FLO’s largest Fairtrade market. The tour operators are not fully aware of this market trend which may result from Fairtrade being associated with commodity brands and the tourism industry does not necessarily analyse such data. That said a clear majority of the respondents see Fairtrade business practices as useful to the tourism industry (73%) and their own business (64%). Some operators believe Fairtrade practices convey better product quality, can act as a motivational tool in HR management, that it represents a marketing opportunity that can convey competitive advantage and can improve corporate image. These attitudes concur with previous studies (Tearfund, 2002; Kotler and Lee, 2005; Tourism Concern, 2002).
74% of the niche operators believe Fairtrade business practices can be useful to their own company, while only 29% of the mass operators concur. Fairtrade is deemed to be more applicable in niche orientated companies where small scale operations make it easier to adopt. Also mass operators focus on volume and low prices.
Those who see Fairtrade as applicable to their industry show a good understanding of what Fairtrade in tourism would involve. The respondents’ answers were comprehensive and covered many elements central to Tourism Concern’s criteria (Kalisch, 2001). Nearly 70% say their business practices include elements they would define as Fairtrade. This significant proportion of tour operators practicing Fairtrade contradicted previous studies which suggested a low awareness within this field (James, 2006; Kalisch, 2001; Key Note, 2005a). This does not mean they practice Fairtrade consciously with a business aim in mind (e.g. to gain differential advantage), nor are they necessarily labelling these practices Fairtrade. This may explain why consumers are not aware of the industry’s’ Fairtrade practices. These findings are based upon the respondents’ self-perceptions and the actuality may differ. There is no direct correlation between type of operator (mass and niche) and Fairtrade practices. The mass operators practice Fairtrade to the same extent as niche operators.
Of those respondents practicing Fairtrade only 10% promote themselves as such. This is arguably this study’s key finding which may result from the companies’ ethical behaviour not being driven by marketing opportunities. Alternatively it could be due to not fully appreciating Fairtrade’s potential for re-branding and repositioning.
Barriers to Fairtrade adoption
Several respondents had no particular answer as to why they do not promote their Fairtrade practices. This suggests they are not deliberately desisting from Fairtrade promotion, rather they have not considered the implications. What can be deduced is that these respondents do not perceive any barriers to Fairtrade adoption. For some, limited resources such as time and money prevent Fairtrade adoption and promotion. The fiercely competitive climate forces them to focus on price as this is believed to be consumers’ key decision making criteria.
Among respondents who do not ‘practice’ Fairtrade, some alluded to the lack of scope for adoption due to the structure of the supply chain, suggesting it is up to their business partners (hotels and other service suppliers) if they want to operate in line with Fairtrade criteria. Such barriers are recognised by stakeholders working towards fairer practices in the tourism industry.
Fairtrade criteria and the certification processes are perceived to be barriers to adoption among some tour operators. The findings are consistent with previous studies in that the process is complicated due to the complex product structure and value chain (Nicholls and Opal, 2005). Also not all products produced within Fairtrade guidelines carry the Fairtrade Mark (ibid). To-date there is no certification system in place for the UK tourism industry and the tour operators believe that Fairtrade adoption is only practically possible through an internationally agreed certification scheme.
The Fairtrade Brand
61% of respondents perceive Fairtrade as an overall investment, not a cost, adding value to the company some way. Only 13% believe it represents an overall cost. As discussed only 10% of the companies with Fairtrade practices promote themselves as such even though the brand holds
79
I n t e r n a t i o n a l J o u r n a l o f M a n a g e m e n t C a s e s
ethical components that consumers perceive as valuable. Consumers are increasingly choosing brands that add value to the product through corporate social responsibility (Ind’s, 2003). Findings suggest that the transfer of the Fairtrade brand over to the respondents’ companies will involve challenges and a certain level of risk. The challenge of applying the brand to a completely new and different industry may cause brand confusion ultimately jeopardising the Fairtrade brand’s identity. Some respondents perceive a risk of what has been labelled fair washing. This involves spurious use of the Fairtrade label for commercial purposes, without real Fairtrade policies and practices in place. This concern was also evident in earlier studies (Butcher,2003; Kalisch,2001).
Conclusions and RecommendationsFairtrade represents a marketing opportunity for the UK tourism industry. It creates competitive advantage as it adds value from the consumer’s perspective and differentiates the company from direct competitors.
Fairtrade contributes to improved product quality in terms of services and the natural environment. It has grown to become a strong brand with clear ethical values, and business examples show that the brand identity can be successfully transferred to travel companies. Adoption of the label represents a major marketing opportunity for the tourism industry in terms of customer acquisition, retention due to enhanced brand loyalty by offering a clear and familiar ethical profile of the tour operator.
There are however some factors that confine these opportunities, notably business resources. Fairtrade adoption requires resources, both time and money, and convey price increase. In a highly competitive climate the tour operators have to address consumers’ primary decision making criteria, namely price. Mass operators particularly focus on cost leadership as their target segment is very price sensitive. Fairtrade is in this way less of a marketing opportunity for those tour operators who are strongly driven by a high volume/low price strategy.
Key barriers to Fairtrade adoption are the lack of certification or monitoring systems. FLO and Tourism Concern are both working on these issues, however if tour operators want to adopt Fairtrade today, this has to be based on independent
initiatives. Uncertainty of whether independent business practices will ultimately comply with Fairtrade criteria will act as barriers to adoption.
There is however a gap between the surveyed tour operators’ attitude and behaviour within one important strategic area of marketing. They recognize Fairtrade’s business opportunities related to competitive advantage and improved corporate image. Still, only 10% of the tour operators with Fairtrade practices promote themselves as Fairtrade. This identified gap is the research’s most interesting finding. The main explanation to this is an overall lack of understanding when it comes to the benefits Fairtrade labelling and promotion is likely to create. Tour operators are failing to recognise the opportunity that lies in Fairtrade brand equity. Lack of Fairtrade branding within the industry can partly explain why the public perceives tour operators to be less ethical than they appear to be in this study.
The majority of the tour operators have Fairtrade practices in place but do not promote them which represents a potential for re-branding or repositioning. It is vital that the Fairtrade core values of quality and fairness are included in the brand message to the consumers. The tour operators should also seek to build direct linkages between the host community and the travellers through the brand, as this is one of the core elements of the Fairtrade model. By helping travellers to better understand their role in the tourism trading system and how Fairtrade benefits the destinations, the consumers’ brand loyalty will be strengthened.
Tour operators can not be expected to comply with all Fairtrade criteria as it is unlikely that their whole product range will include Fairtrade elements. It is more realistic to brand individual trips or other types of holiday products as Fairtrade. The tour operators should clearly communicate core Fairtrade brand values to create and maintain one uniform Fairtrade expression within the tourism industry. Multiple interpretations of Fairtrade may confuse consumers and reduce the public trust in Fairtrade brand.
BibliographyArmstrong, G. and Kotler, P. (2006) Marketing: An Introduction. 8th ed. Upper Saddle River, N.J.: Pearson Prentice Hall.

I n t e r n a t i o n a l J o u r n a l o f M a n a g e m e n t C a s e s
80
Association of British Travel Agents (2005) Travel Statistics & Trends 2005.
Association of British Travel Agents (2006a) ABTA Facts (Internet). Available from: www.abta.com. http://www.abtamembers.org/press/kit/facts.htm. Accessed 30. April 2006.
Association of British Travel Agents (2006b) ABTA’s Holiday Trends for 2006.
Association of British Travel Agents, Tour Operators Initiative and Tearfund (2002) Improving tour operator performance: the role of corporate social responsibility and reporting. Association of British Travel Agents (ABTA), Tour Operators Initiative (TOI) and Tearfund, November 2002.
Association of Independent Tour Operators (2005) Responsible Tourism (Internet). Available from: www.aito.co.uk. http://www.aito.co.uk/corporate_Responsible-Tourism.asp. Accessed 30. April 2006.
Buitrago, G. (2006) RE: request: fair trade tourism info (E-mail). ([email protected]). E-mail to Charlotte G. Eilertsen ([email protected]), 17. March 2006.
Butcher, J. (2003) The moralisation of tourism: sun, sand ... and saving the world? London: Routledge.
Cleverdon, R. (2001) “Introduction: Fair Trade in Tourism- Applications and Experience”, in International Journal of Tourism Research. Vol. 3, issue 5, Sept. 2001, pp.347-349.
Cleverdon, R. and Kalisch, A. (2000) “Fair Trade in Tourism”, in International Journal of Tourism Research. Vol. 2, issue 3, May/June 2000, pp.171-187.
Crane, A. (1997) “The Dynamics of Marketing Ethical Products: A Cultural Perspective”, in Journal of Marketing Management. Vol. 13, pp. 561-577.
Doyle, P. (2002) Marketing Management and Strategy. 3rd ed. Harlow: Pearson Education Ltd.
Fairtrade Foundation (2002) Spilling the Beans on the Coffee Trade. Fairtrade Foundation, March 2002.
Fairtrade Foundation (2005) Awareness of the Fairtrade Mark Rockets to 50% (Press release)
(Internet). Available from: www.fairtrade.org.uk. http://www.fairtrade.org.uk/pr270505.htm. Accessed 28. April 2006.
Fairtrade Foundation (2006a) About us (Internet). Available from: www.fairtrade.org.uk. http://www.fairtrade.org.uk/about_us.htm. Accessed 29. April 2006.
Fairtrade Foundation (2006b) Products (Internet). Available from: www.fairtrade.org.uk. http://www.fairtrade.org.uk/products.htm. Accessed 29. April 2006.
Fairtrade Foundation (2006c) Sales of Fairtrade products in the UK (Internet). Available from: www.fairtrade.org.uk. http://www.fairtrade.org.uk/about_sales.htm. Accessed 29. April 2006.
Fair Trade in Tourism South Africa (2006) Fair Trade (Internet). Available from: www.fairtourismsa.org.za. http://www.fairtourismsa.org.za/fairtrade/index.html. Accessed 10. May 2006.
Font, X. (2001) “Regulating the Green Message: the Players in Ecolabelling”, in Tourism Labelling: Certification and Promotion of Sustainable Management. Xavier Font and Ralf C. Buckley (eds). Wallingford: CABI Publishing.
Goodwin, H. and Francis, J. (2003) “Ethical and responsible tourism: Consumer trends in the UK”, in Journal of Vacation Marketing. Vol. 9, issue 3, 2003, pp. 271-284.
Hattersley, G. (2006) “Does it really make any difference?”, in The Sunday Times. 2. April 2006, pp. 4:3.
Ind, N. (2003) Beyond Branding: How the New Values of Transparency and Integrity are changing the World of Brands. Nicholas Ind (ed.). London: Cogan Page.
James, G. (2006) RE: research (E-mail). ([email protected]). E-mail to Charlotte G. Eilertsen ([email protected]), 25. April 2006.
Jankowicz, A. D. (2005) Business Research Projects. 4th ed. London: Thomson.
Kalisch, A. (2001) Tourism as Fair Trade: NGO Perspectives. London: Tourism Concern.
81
I n t e r n a t i o n a l J o u r n a l o f M a n a g e m e n t C a s e s
Kapferer, J. (2004) The New Strategic Brand Management: Creating and Sustaining Brand Equity Long Term. London: Kogan Page.
Key Note (2004) Holiday Purchasing Patterns: Market Assessment 2004. 3rd ed. Jean Etherton (ed.). Hampton: Key Note.
Key Note (2005a) Green and Ethical Consumer: Market Assessment 2005. 3rd ed. Emma Wiggin (ed.). Hampton: Key Note.
Key Note (2005b) Travel Agents & Overseas Tour Operators: Market Report 2005. 18th ed. Samantha Kidd (ed.). Hampton: Key Note.
Key Note (2005c) Travel & Tourism Market: Market Review 2005. 12th ed. Isla Gower (ed.). Hampton: Key Note.
King, J. (2002) “Destination marketing organisations – Connecting the experience rather than promoting the place”, in Journal of Vacation Marketing. Vol. 8, issue 2, 2002, pp. 105-108.
Kotler, P. and Armstrong, G. (2004) Principles of Marketing. 10th ed. Upper Saddle River, N.J.: Pearson Prentice Hall.
Kotler, P., Bowen, J. and Makens, J. (1999) Marketing for Hospitality and Tourism. 2nd ed. Upper Saddle River, N.J.: Prentice Hall.
Kotler, P., Bowen, J. and Makens, J. (2003) Marketing for Hospitality and Tourism. 3rd ed. Upper Saddle River, N.J.: Prentice Hall.
Kotler, P. and Lee, N. (2005) Corporate Social Responsibility: Doing the Most Good for Your Company and Your Cause. Hoboken, N.J.: John Wiley & Sons, Inc.
Marconi, J. (2002) Cause Marketing: Build Your Image and Bottom Line Through Socially Responsible Partnerships, Programs, and Events. Chicago, Illinois: Dearborn.
Mintel International Group (2003) Eco and Ethical Tourism – UK – October 2003 (Internet). Available from: www.mintel.co.uk. http://academic.mintel.com/sinatra/academic/search_results/show&&type=RCItem&page=0&noaccess_page=0/display/id=1414. Accessed 25. May 2006.
Mintel International Group (2005) Ethical Holidays – UK – October 2005 (Internet). Available from: www.mintel.co.uk. http://academic.mintel.
com/sinatra/reports/display/id=125548/display/id=185075/display/id=125548. Accessed 25. May 2006.
National Statistics (2006) MQ6 Transport Travel and Tourism: Overseas Travel and Tourism. Quarter 3 2005.
Nicholls, A. and Opal, C. (2005) Fair Trade: Market-driven Ethical Consumption. London: SAGE Publications Ltd.
Not so fair trade (2006). London: BBC2, 10. March 2006 (DVD)
Plüss, C. (2003) “Fair Trade- also in Tourism!”, in Contours. Vol. 13, issue 4, Oct.-Dec.2003, pp.9-14.
Saunders, M., Lewis, P. and Thornhill, A. (2000) Research Methods for Business Students. Harlow: Pearson Education Ltd.
Smith, M. and Duffy, R. (2003) The Ethics of Tourism Development. London: Routledge.
Tearfund (2000) Tourism- an Ethical Issue, Market Research Report. Tearfund, January 2000.
Tearfund (2001) Tourism: putting ethics into practice. Tearfund, January 2001.
Tearfund (2002) Worlds Apart: A call to responsible global tourism. Tearfund, January 2002.
The Heaven & Earth Show (2006). London: BBC1, 30. April 2006, 10:00 (DVD).
The Travel Foundation (n.d.) Who We Are (Internet). Available from: www.thetravelfoundation.org.uk. http://www.thetravelfoundation.org.uk/who_we_are.asp. Accessed 26. May 2006.
Tourism Concern (2002) Corporate Futures: Social Responsibility in the Tourism Industry. London: Tourism Concern.
Tourism Concern (n.d.) The International Network on Fair Trade in Tourism. London: Tourism Concern.
Tour Operators’ Initiative for Sustainable Development (2001) About (Internet). Available from: www.toinitiative.org. http://www.toinitiative.org/about/about.htm. Accessed 26. May 2006.
I n t e r n a t i o n a l J o u r n a l o f M a n a g e m e n t C a s e s
82
Tribe, J. (2002) “Education for Ethical Tourism Action”, in Journal of Sustainable Tourism. Vol. 10, issue 4, 2002, pp. 309-324.
Tribes Travel (2006) Fair Trade Travel (Internet). Available from: www.tribes.co.uk. http://www.tribes.co.uk/default.asp?MIS=11. Accessed 10. July 2006.
Wagner, C. G. (2005) “The Conscientious Tourist”, in The Futurist. Vol. 39, Issue 5, Sep/Oct 2005, pp. 14-15.
Weeden, C. (2001) “Ethical tourism: An opportunity for competitive advantage?”, in Journal of Vacation Marketing. Vol. 8, issue 2, 2001, pp.141-153.
World Commission on Environment and Development (1987) Our Common Future. United Nations General Assembly, August 1987.
World Tourism Organization (1999) Global Code of Ethics for Tourism. Santiago: World Tourism Organization, October 1999.
World Tourism Organization (2002) Tourism and Poverty Alleviation. Madrid: World Tourism Organization.
World Tourism Organization (2005) Tourism Highlights: 2005 Edition. Madrid: World Tourism Organization.
World Tourism Organization (2006) Tourism 2020 Vision (Internet). Available from www.world-tourism.org. http://www.world-tourism.org/facts/menu.html. Accessed 30. April 2006.
World Tourism Organization (n.d.) Ethics in Tourism: Background (Internet). Available from: www.world-tourism.org. http://www.world-tourism.org/code_ethics/eng/global.htm. Accessed 30. April 2006.
Zikmund, W. G. (2003) Business Research Methods. 7th ed. Australia: Thomson / South-Western.

83
I n t e r n a t i o n a l J o u r n a l o f M a n a g e m e n t C a s e s
TERRITORIAL COMMUNICATION AS TOOL TO PROMOTE THE TERRITORIAL DEVELOPMENT: CALABRIA AND SAINT FRANCESCO FROM PAOLA PROJECT.
PIER AUGUSTO BERTACCHINIDEPARTMENT OF LINGUISTICS, UNIVERSITY OF CALABRIA, ITALY
ANTONELLA REITANODEPARTMENT OF MANAGEMENT, UNIVERSITY OF CALABRIA, ITALY
ROCCO SERVIDIODEPARTMENT OF MANAGEMENT, UNIVERSITY OF CALABRIA, ITALY
ELEONORA PANTANODEPARTMENT OF MANAGEMENT, UNIVERSITY OF CALABRIA, ITALY
ANTONIO FERACO1DEPARTMENT OF MANAGEMENT, UNIVERSITY OF CALABRIA, ITALY
Abstract
In a global context where interchanges are facilitated by always newer and newer technologies as the actual one, territorial communication became of strategic relevance for the territory, cause it can promote and facilitate territorial development.
The aim of this particular kind of communication is to attract more financial flows in the territory through the valorisation of its own characteristics; financial flows that could be meant as tourism, industries, research centre and so on.
Territorial communication wants to create a territorial image through diffusion of its main characteristics to differentiate its own offer from the others’. It supplies information, underlines the environmental peculiarities and creates interests to the target audience.
Its persuasive function plays a key role in this kind of communication, especially in the choice process of tourist destination: this is particularly influenced by several factors: the image of the tourist product and the one of the environment, by geographical, socio - cultural and economic information. To
encourage tourism to the environment is needed an effective communication strategy.
New ICT, computer-mediated communication systems can effort in a significant way the efficiency of the territorial communication giving new tools, easy to integrate, decreasing time spent to reach target audience and augmenting the diffusion of information, telematics facilitate evaluation ways and measurements of the efficiency of communication and of advertisements.
Territorial Communication can be realized through the classical distribution channel (Tv advertisements, brochure, magazine and so on) and even using new channel as Internet: it is possible to present the territory in the net, building websites and portals related to it, data warehouse with all needed information, 3D reconstruction of places to give the final user the possibility to live an immersive experience to influence him/her to visit the environment live.
The aim of this paper is to show how a good territorial communication can promote the environment development. Particularly we are going to show the example of Saint Francesco from Paola project, in which, because of His 5th
I n t e r n a t i o n a l J o u r n a l o f M a n a g e m e n t C a s e s
84
century anniversary of birth, Calabria Region is communicating through cultural manifestation, fairs, religious event, to develop economic, cultural and tourist background.
Keywords: Territorial communication, territorial marketing, territorial product, event marketing
IntroductionThe tourism market has drastically changed over past years. Many researches related to psychology, geography, economics have considerably contributed to a new scenario of tourism. Particularly, the role of Psychology was to explore consumer behaviour in order to explore in one hand the main factors which push to action, on the other hand the factors which allow to foresee the relation between global changing and buying behaviour. In the meanwhile the results of these studies allow marketing researchers to achieved new market segments. Related to this process the communication has gained a very important role.
To communicate means to transfer information, to influence the consumer behaviour, to improve the acquisition of new knowledge and abilities, and the formation of attitudes; it means to establish an interest, an involvement, an enthusiasm and a loyal atmosphere: to communicate means to relate with others. In the tourism sector, the role of communication is to make the potentiality of a place growing up and to transfer it to other people. In these contexts is needed to underline those elements believed attractive and stimulating for potential customer audience. In a tourist context it is important being able to enhance the face expressions (to create an emotional involvement), body movements, and the typical tradition of a territory. All these variables give information about the place and contribute to create the mental image of it in the subject’s mind and, indeed, the birth of the expectations that the subject want to realize.
This paper illustrates how to associate a model and techniques of territorial communication to a religious event: the fifth centenarian of San Francesco’s death. In this way we can show the marketing model realized by organizers of this event in order to communicate it and to underline the role and the ends of the territorial communication as a marketing tool to promote the characteristic of the territory where the event will take place. An important characteristic of this kind
of communication is its persuasive end, because it has to create interest in who is receiving the message. Furthermore it becomes a critical factor during the phase of choosing destination, because tourist is influenced by different factors as the image of the tourist product, of the territory, from the geographical, cultural, economic and eno-gastronomic information (Reitano et al., 2006). The goal of this paper is to analyse the relation between territorial communication and territorial development.
Territorial Marketing and communicationIn the last years a new branch of marketing has been developed, its strategies are entirely oriented towards promotion and towards the divulgation of the territory, territorial marketing. The core of this strategy is the idea that the territory, with its material and immaterial resources, is similar to the positioning of a brand inside a market, in order to attract the consumers’ interest and to influence their buying behaviour to prefer a place instead of another. Because of the relevance of the financial aspects related to the tourist activities, the challenge to attract new visitors is very intensive (Solomon & Stuart, 2005). Each territory tries to communicate its resources as the best it can, trying to enhance the peculiarities of the destination in order to maximize the benefits coming from choosing it.
In the context of territorial marketing the success of a product is strongly influenced by an efficient strategy of communication (Moshin, 2005). Strategy has to pursue to satisfy stakeholders’ needs (Buhalis, 2000): host population, tourists, tourism enterprises and SMTEs, public sector and government, tour operators. In this case strategy has strongly to account for the cultural value of the product (Moshin, 2005). In the meanwhile, territorial marketing do not have only to take care about promoting a tourist destination, but even to integrate itself in a system that pushes and sustains the achievement of higher economic goals. This aspect is important because territorial marketing should guarantee a certain returns-on-resources utilized for the production and the delivery of tourist products, as for the regeneration of the same resources that promotes.
Territories are not all the same, in fact their particular geographical position conditions and influences their tourist development. Because

85
I n t e r n a t i o n a l J o u r n a l o f M a n a g e m e n t C a s e s
of this, some territories are more disadvantaged compared to others.
Territorial communication is the way how the territorial product is wanted to be communicated (Bertacchini et al., 2007). The peculiarities of territorial communication tools are based on the exploitation of the visual potentialities of the territorial image of a destination.
During the creation of the message is needed to consider the referent public because the message has to be customized related to its typology. Related to tourism target, not always tourists live their holiday with the same intensity: there are passive tourists that just visit and see places, without taking part actively to the possible activities; there are visitors that consumes activities and experiences enthusiastically, associating themselves to the life in that place; and active visitors that use to make experiences usually not associated with the intangible cultural value of the destination (McKercher et al., 2005). The model of the communication process suggests a series of mental steps that push potential visitors to choose a certain destination this sequence follows the AIDA model (Attention-Interest-Desire-Action) (McWilliams & Crompton, 1997). Particularly the exposition to advertisement influences above all the low involvement decisions (McWilliams & Crompton, 1997).
The end of communication is to create the territorial image of destination in the subjects’ mind: its position, the characteristics, the uses, the traditions of the place, and everything they believe to be important to attract the tourists’ attention. After the creation of the territorial image, subjects are able to differentiate what the territory has to offer compared to others. Territorial image is only one aspect that contributes in creating a mental representation of the potentialities offered by the territory in the subjects’ mind. It is a business card for the territory, made by slogan easily memorizable, by images clearly recognisable, by distinctive signs that synthetically tend to represent the territory (Papotti, 2001). Because of this, the territorial image is an integrant part of the decision process of the tourist decision (Schenider & Sonmez, 1999; Choi et al., 2007).
In the process of creation of a positive territorial image, to stimulate the knowledge and the intention to visit the proposed destination in the subjects is fundamental. After the creation of the
positive image, the tourist feel the need to spend a period of his life in that place and, above all, if he will be satisfied he will recommend it to other people. According to Syrgy and Su (Syrgy & Su, 2000) the components that concurs in the creation of a territorial image are (Fig. 1):
Definitely the image of the territory is the result of the following process: collecting mentally the destination images (until having a unique and homogeneous image), modifying the initial image after having gathered information, deciding to visit the destination, sharing the destination, going back home, modifying the image on the base of the lived experience in that destination (Beerli & Martin, 2004; Son, 2005). Furthermore, the formation of the destination image is influenced both from motivational aspects and emotional ones, that influence the choice of detecting the destination that better satisfies one’s own needs.
Calabria as territorial productThe territory is seen as a product, whose characteristics are given by the resources that offers. The products of a territory can be classified in three categories (Scicutella & Maizza, 2003):
products related to the productive investments;•
residential products;•
tourist products.•
First category of product comprehend all the elements that give economic growth opportunities for the territory: geographical position, policy, economic potentialities, research and development centre and institutions, industries, agricultures, labor and existing services. Residential products are infrastructures, living centres; furthermore, they comprehend other categories as quality of life index, occupational level and occupational perspectives, fun and wellbeing centres, public services on the territory. Tourist products are related to all that territory has to offer as tourist destination: architectural beauties, landscapes, gastronomy, acceptance level, hospitality.
Calabria is a land rich of places with high and strong tourist connotations. This made Calabria a place of a particular interest in order to attract tourist flows coming from other Italian regions and from all the rest of Europe. Religious events represent for Calabria an important moment for the diffusion

I n t e r n a t i o n a l J o u r n a l o f M a n a g e m e n t C a s e s
86
of its own tourist image. For example, the event of the V centenarian of the death of San Francesco from Paola represents an occasion to promote both the city of Paola and Calabria, and the places of the Sanctuary where the Saint lived. Religiosity becomes the opportunity to promote a place with its peculiarities, beauties and landscapes, in a national and international level. The image that represents one of the principal component to communicate the event organization is linked to the product diffusion. In this phase organizers establish what to communicate of the territory in order to define the elements that allow to quantify the level of consumers satisfaction for the proposed tourist product; it let us understand if the event communication is efficient and, indeed, if tourists will be back. Tourist destination are considered objective entities that have a set of quantifiable attributes (Chhetri et al., 2004). To understand the way that consumer value those attributes is important for an efficient territorial marketing strategy. Literature proposes to consider customer satisfaction through evaluation after purchase that
derives from the result of the comparison between the expected performance and the experimented one, and as psychological estate produced from the emotional answer deriving from it (disconfirmation) (Maeran, 2004).
Not always expectations are the same as the perceived performance: personal hope can influence the performance level perceived (Spreng & Droge, 2001): the results of many researches underline that people see what they wants, determining a positive link between the starting expectations and the perceived performance. This implies that companies can participate in some way in the process of influencing the level of the customer satisfaction (Spreng & Droge, 2001). If customer is satisfied probably he will be back and he will also suggests that place; his satisfaction is an answer in the tourist context, it is a judge where the emotive component is predominant, and it is related to a particular moment (i.e. before the choice, after the choice, after vacation, and so on).
Figure 1: Effects of the destination environment on the destination visitor image
Events as marketing tool: the V centenarian of S. Francesco from Paola. According to Eurispes, every year about 31 millions of tourists use to visit sacred Italian places, it shows the importance of the studies about this phenomena. Marketing dedicates many studies on it because of the large number of events, this subject is called Event Marketing.
The event is configured as a mix of products and services that have to be well mixed and coordinated to obtain prefixed goal. In the event organization
some principal phases can be identified, from the ideation to the evaluation of the event. In the organization of an event different principal steps can be identified: event idea, service concept, economic analysis, feasibility, business plan, execution, rectifying, evaluation.
The first can be considered the phase of the presentation, where promoters advance the candidacy to organize a specific event. In service concept phase the performance that are willed to be done are defined from a technical point of view, the localization one, the time scheduling ; during this phase marketing has a primary role, because
87
I n t e r n a t i o n a l J o u r n a l o f M a n a g e m e n t C a s e s
it investigates on the possible options, and defines the preferences of the various target groups. Third phase is related to the economic point of view of the event, it is strongly related to the feasibility phase, where the effective actability of the event is analysed. In the phase of the business plan the choices before evaluated are defined in details and marketing has to prepare a specific marketing plan both for the final customers and for the partners to be involved. The execution phase of the event regards the services allocation, the tickets management and subscriptions, the detailed communication, the entrance management to the place of the event. In the phase of the rectifying only the information related to the administrative data, to the quantities, to the returns, and to the costs are supplied. In the last phase, the one related to the post event, marketing takes care of comparing the expected objectives with the results, interpreting how it went, and particularly has to focus on the consumer’s satisfaction and on the involved partners’ satisfaction.
Event marketing is a set of activities that starts from the analysis of opportunities and risks related to the event and that are developed in an integrated form both inside and outside the organization to reach the goals in the short, medium and long term period through the event participants’ satisfaction.
Calabria has a cultural and environmental heritage of an undoubted and inestimable value (Franco & Reitano, 2006).
Paola has about 17.159 inhabitants (http://www.comune.paola.cs.it/), situated in the proximity of Cosenza, with a territorial extension of 4.251 hectares and positioned between m 70 and m 180 on the sea level; this year it has the possibility to make its territory known from the entire Christian world thanks to the celebration of the 500 years from the death of the patron Saint, Saint Francesco from Paola. As declared
in the web site dedicated to the event (http://www.comnazionalesanfrancescodipaola.it) this event is the occasion for Paola and Calabria region to show itself to the collective attention for the historical, artistic and cultural heritage that characterizes it. From a celebrative point of view some commissions inside the religious order have been instituted with the aim to valorise the event in all its aspects: liturgical, historical, cultural, artistic, informative and mediatico, recreation. The first step of the organization of the event is the creation of a logo (figure 2) and of a dedicated web site (the home page is in figure 3):
The logo drawn rightly for the event is inspired to an episode, maybe the most famous of the Saint’s life: the passing through the Straits of Messina, between Calabria and Sicily. The author took this episode as symbol of what the Order of Friars is proposing with the celebration of the 5th centenarian of the Saint’s death; what is meant with this episode and logo is that Saint Francesco can give his contribute to help society ferrying towards hopped places where the Good resides. With this logo they present the aim of Saint Francesco’s message based on the invitation to conversion of man’s heart as a basis of every change. This is the reason why at the bottom of the image there is the keyword of the spirituality and of the action of Saint Francesco: CONVERTITEVI (convert yourself). The word CHARITAS, instead, flutters as a flag on the crook that represent the main tree of this symbolic boat made by his cloak, and besides it recalls the symbol of the Saint and of the Minimum Friars Order, that remembers that every change has to start from love to be real, to be supplied of love, and to lead to love.
The message that the organization and the city of Paola want to communicate is a religious one, they are the bearers of a religious message, the message of the Saint, aimed to the Christian community.

I n t e r n a t i o n a l J o u r n a l o f M a n a g e m e n t C a s e s
88
Figure 2: logo of the event
Figure 3: home page dedicated to the event
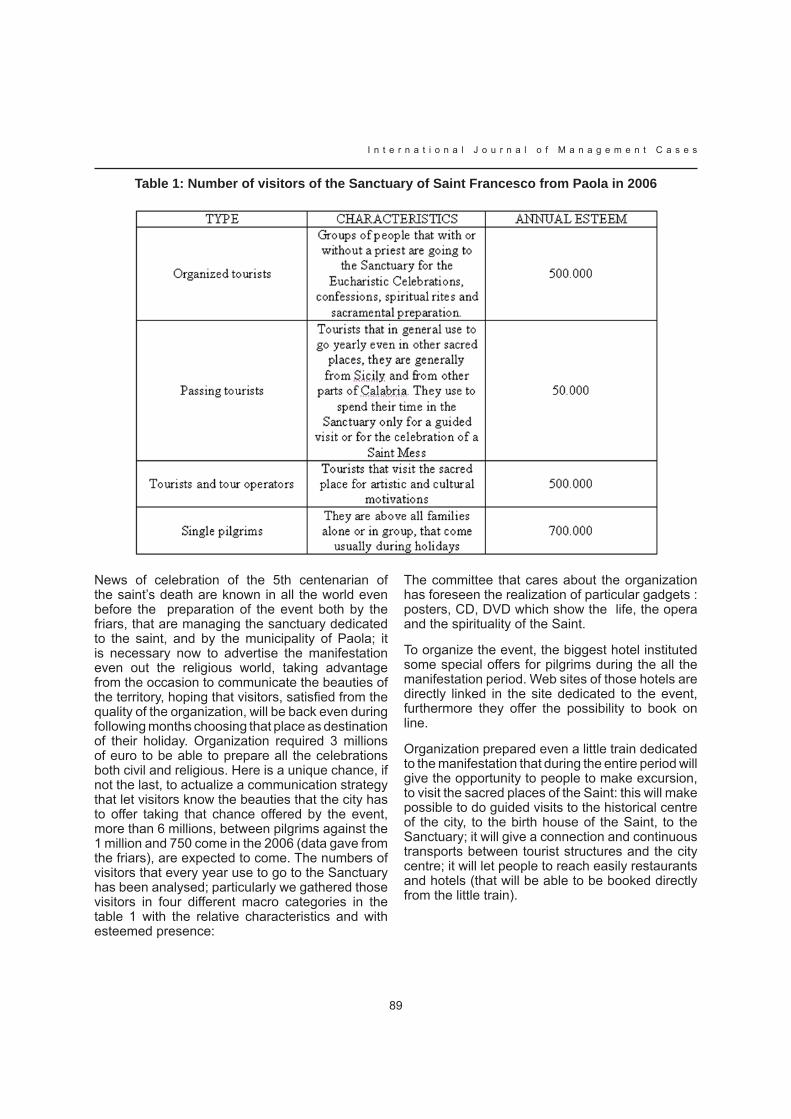
89
I n t e r n a t i o n a l J o u r n a l o f M a n a g e m e n t C a s e s
Table 1: Number of visitors of the Sanctuary of Saint Francesco from Paola in 2006
News of celebration of the 5th centenarian of the saint’s death are known in all the world even before the preparation of the event both by the friars, that are managing the sanctuary dedicated to the saint, and by the municipality of Paola; it is necessary now to advertise the manifestation even out the religious world, taking advantage from the occasion to communicate the beauties of the territory, hoping that visitors, satisfied from the quality of the organization, will be back even during following months choosing that place as destination of their holiday. Organization required 3 millions of euro to be able to prepare all the celebrations both civil and religious. Here is a unique chance, if not the last, to actualize a communication strategy that let visitors know the beauties that the city has to offer taking that chance offered by the event, more than 6 millions, between pilgrims against the 1 million and 750 come in the 2006 (data gave from the friars), are expected to come. The numbers of visitors that every year use to go to the Sanctuary has been analysed; particularly we gathered those visitors in four different macro categories in the table 1 with the relative characteristics and with esteemed presence:
The committee that cares about the organization has foreseen the realization of particular gadgets : posters, CD, DVD which show the life, the opera and the spirituality of the Saint.
To organize the event, the biggest hotel instituted some special offers for pilgrims during the all the manifestation period. Web sites of those hotels are directly linked in the site dedicated to the event, furthermore they offer the possibility to book on line.
Organization prepared even a little train dedicated to the manifestation that during the entire period will give the opportunity to people to make excursion, to visit the sacred places of the Saint: this will make possible to do guided visits to the historical centre of the city, to the birth house of the Saint, to the Sanctuary; it will give a connection and continuous transports between tourist structures and the city centre; it will let people to reach easily restaurants and hotels (that will be able to be booked directly from the little train).

I n t e r n a t i o n a l J o u r n a l o f M a n a g e m e n t C a s e s
90
ConclusionIn this paper we wanted to underline the importance of territorial marketing as a tool to promote and to valorise the peculiarities and the development of the local resources connected to the religious events. Our interest has been to investigate the communicative model developed from the organizers for the 5th centenarian of Saint Francesco from Paola’s death. Religious tourism is surely one of the activities that mostly incentives the local entrepreneurship and the development of new activities because it is able to attract a constant flow of people during the year. The presence of religious monuments with an high level of spiritual notoriety can be easily compared with known product brands. In this case the sacred monument identify a precise territorial area.
To investigate on the territorial marketing model a qualitative analysis of some website contests has been carried out with the aim to find the strengths and the weaknesses of the communicative approach used. Relating to the strength points, the web portal is always updated about the activities of the manifestation, it presents an historical description of the Saint and of the Sanctuary, and other aspects believed to be important for the potential visitors.
The weakness we found are: the contents of the web portals are only made in Italian. There is no English version of the published materials; the web portal do not have a good picture and video gallery. It is even true that from the web portal is easy to get into other web sites where are some pictures of the city, but they are not linked directly to the event in object. Another limit is the absence of a mailing list system that would allow users to register and to have information on relevant and interesting events. For the city of Paola and for the nearby countries, the presence of San Francesco’s Sanctuary represents a tourist attraction able to move tourists willing to get in touch not only with the spirituality of the Friars but even tourist willing to visit the place where the Sanctuary is located.
To these potentialities have to match some adequate public and private decision of territorial marketing in order that the presence of adequate services, able to satisfy consumers’ needs, could correspond to an increase of tourism. The development of the territory image passes through the inhabitants’ capacity , but even of public and
private operators, to understand tourists’ needs and to accept challenges coming from novelties. This means that is needed to invest in the formation of operators in order to build the consciousness, above all in the inhabitants, that tourism is source of not only economic but even cultural growth.
ReferencesBeerli, A. & Martin, J.D. (2004). Tourists’ characteristics and the perceived image of tourist destinations: a quantitative analysis-a case study of Lanzarote, Spain. Tourism Management, 25, pp.623-636
Bertacchini, P.A, Dell’Accio, A., Mallamaci, L. & Pantano, E. (2007), Benefits of Innovative Technologies for Territorial Communication: the Case of Study “Virtual Museum Net of Magna Graecia”, Eurographics Italian Chapter Conference, pp 181-185
Branzaglia C. (2003), Comunicare con le immagini, Bruno Mondadori, Milano.
Buhalis D. (2000), Marketing the competitive destination of the future, Tourism Management, 21, pp. 97-116
Chhetri, P., Arrowsmith, C. & Jackson, M. (2004), Determining hiking experiences in nature-based tourist destinations, Tourism Management, 25, pp. 31-43
Choi S., Lehto X.Y., Morrison A. M. (2007), Destination image representation on the web: Content analysis of Macau travel related websites, Tourism Management, 28, pp 118-129
Franco M. & Reitano A. (2006), Il territorio: da risorsa a prodotto, Franco Angeli, Milano
Maeran, R. (2004), Psicologia e turismo, Editori Laterza, Bari
McKercher, B., Ho P.S.Y. & du Cros, H. (2005), Relationship between tourism and cultural heritage management: evidence from Hong Kong, Tourism Management, 26, pp. 539-548
McWilliams, E. & Crompton, J.L. (1997), An expanded framework for measuring the effectiveness of destination advertising, Tourism Management, 18 (3), pp. 127-137

91
I n t e r n a t i o n a l J o u r n a l o f M a n a g e m e n t C a s e s
Moshin, A. (2005), Tourist attitudes and destination marketing- the case of Australia’s Northern Territori and Malaysia, Tourism Management, 26, pp. 723-732
Papotti, D. (2001), L’immagine regionale fra marketing del turismo e marketing territoriale, Lombardia Nordovest,. 3, pp. 27-40
Reitano A., Servidio R., Pantano E. & Feraco A. (2006), Emotion and Reason in the Buying Process of Tourist Product, The 3rd International Customer Behaviour and Retailing Research Conference-CIRCLE, 105-116, Zagreb.
Sanchez, J., Callarisa, L., Rodriguez R.M. & Moliner M.A. (2006), Perceived value of the purchase of a tourism product, Tourism Management, 27, pp 394-409
Schneider, I. & Sonmez S. (1999), Exploring the touristic image of Jordan, Tourism Management, 20, pp 539-542
Scicutella, M. & Maizza, A. (2003), Elementi di marketing I fondamenti della disciplina casi di marketing territoriale, I Liberrimi, Lecce
Sirgy, M.J. & Su, C. (2000) Destination Image, Self-Congruity, and Travel Behavior: Toward an Integrative Model, Journal of Travel Research, 38, pp 340-352
Solomon, M.R. & Stuart E.W. (2005), Marketing, Apogeo, Milano
Son, A. (2005), The Measurement of Tourist Destination Image: Applying a Sketch Map Technique, International Journal of Tourism Research, 7, pp. 279-294
Spreng, R.A. & Droge, C., (2001), The impact on satisfaction of managing attribute expectations: should performance claims be understated or overstated? ,Journal of Retailing and Consumer Services, 8, pp 261-274
Van Raaij, W.F., Strazzieri, A. & Woodside, A. (2001), New developments in marketing communications and consumer behaviour, Journal of Business Research, 53, pp59-61
Yoon, Y., Uysal M. (2005), An examination of the effects of motivation and satisfaction on destination loyalty: a structural model,

I n t e r n a t i o n a l J o u r n a l o f M a n a g e m e n t C a s e s
92
COMMUNICATE WITH CONSUMERS IN THE RETAIL SHOP
LUCA APRILETTIUNIVERSITÀ DI PAVIA, ITALY
LAURA BOTTINELLIUNIVERSITÀ DI PAVIA, ITALY
CARLA CATTANEOUNIVERSITÀ DI PAVIA, ITALY
ENRICA PAVIONEUNIVERSITÀ DELL’INSUBRIA, ITALY
Abstract
The purpose of this work is to analyse how retailers around the world, and especially in Italy, are changing their way to communicate and to interact with consumers in their shops, leveraging new technologies and new methodologies.
This significant change in the way retailers operate is influenced and driven by the major trends that are shaping the retail market.
We may summarize these trends, coming from a survey on a panel of retailers, in the following points:
While a “global consumer culture” indeed • continues to expand and extend its reach, the more significant trend driving change is the increasing diversity of customer characteristics and behavior.
The world of 2010 will be one of “ubiquitous • information access” for customers.
Today, in each national or regional market, a • very small number of major retailers is coming to dominate the retail landscape, by exploiting a virtuous cycle that creates ever-increasing value both for customers and for the business.
In addition, in response to previous trends, • we will see leading companies re-think their business models and build an expanding network of partners to achieve greater competitive advantage. Instead of traditional rigid “value chains”, retailers will recast
themselves as part of a flexible “value network”:
As we can see, these trends highlight how consumers are reacting against traditional shopping behaviour and against old-style marketing and communication processes retailers put in place in the past.
The main focus of this paper is to analyse how retailers are changing, leveraging new technologies, new processes and new ways to establish a different contact with their consumers.
The results we are aiming to obtain are relevant; we are observing retailers investing heavily on customer clustering and retailers abandoning any segmentation; in this context, companies with strong marketing capabilities are pushing their tactics to a one-to-one communication.
A large number of retailers are starting to implement their own TV broadcasted in the shop and, at the same time, mobile phones seem to be the primary interface between retailers and consumers.
We assume we are in front of a paradox between a mass marketing attitude and a personalization strategy based on clustered data.
The conclusion we can suppose at this point in time is that retailers, especially in Italy, are experimenting a new strategic visions, which can be realized through a path of innovation, with the right mix of processes and technology.
93
I n t e r n a t i o n a l J o u r n a l o f M a n a g e m e n t C a s e s
Key Words: Retail, technology, in-shop marketing and communication, in-shop services, clustering
Retail enterprises: developments and current trendsOver the last ten years, business enterprises in the industrialised world have undergone deep-seated and significant changes that have led to the development of specialised retailers, equipped with autonomous decisional powers and able to follow strategic and management policies of their own choice.
These changes have been particularly evident in grocery retailing and have taken place on both the demand and supply sides. More specifically, the major drivers for changes in distribution systems can be put down to, firstly, behavioural changes on the part of consumers, secondly, globalisation and internationalisation, and, thirdly, new technologies (Colla, 2004). On the demand side, consumers have become more knowledgeable and have adopted more rational approaches to shopping, which have meant heightened demand for sales-related services, especially those with high informational value. Increased consumer information and knowledge levels have in fact generated a marked variety in the nature of final demand. The consumer often chooses on the basis of non linear preferences that are nevertheless strongly influenced by contingent and environmental factors. Consequently, retailers’ interaction with consumers goes far beyond the traditional lever of attractive prices, which no longer appears to be the sole generator of innovation in distribution solutions .
On the supply side, despite significant differences between countries, one can identify certain common trends:
intensification of horizontal competition as a • result also of deregulation at national levels and subsequent sector liberalisation;
saturation of end-user markets (above all • with regards to mass consumption goods), which has forced retailers to implement strategies aimed at raising added value for end consumers so as to increase customer fidelity;
introduction of new technologies (ITC) that • enable automatic mass data processing and handling.
These trends are connected to an overarching process of globalisation and market integration that has progressively broadened retailers’ competitive horizons, leading to development based on internationally-based strategic approaches (Buckley and Casson, 1991; Caves, 1982; Dunning, 1993).
In this way, the phenomenon of internationalisation, which until only a few years ago appeared to be the exclusive prerogative of producers, has involved an increasing number of retailers, offering them significant increases in market openings and, consequently, greater bargaining power with producers.
Against this backdrop, the world’s leading retailers are characterised by similar strategies that appear to be heading in three main directions: concentration, diversification (Incandela, McLaughlin and Shi, 1999; Musso, 2005) and the redefinition of relations within the distribution channel. Concentration would seem to be connected to international growth in that growth in size occurs increasingly at a global level, which in turn impacts significantly the structure of the entire sector (Burt, 1991).
The current situation is characterised by a limited number of large retailer groups present throughout major world markets with significant market shares. These groups are for the most part American or European and are able to combine economies of scale, whilst at the same time centralising many activities along the value chain.
Growth in size appears closely connected to diversification, which is itself an increasingly important feature of the retailing industry. Diversification strategies have led major retailers to extend their activities into sectors which, though different, offer the opportunity to extend the range of services offered to customers. This development is above all the result of the considerable information resources retailers can now access, enabling them to know more precisely the characteristics of their target customers. The resulting customer profiles are used in tailoring services and delivery according to specific customer features .
Modernisation and concentration have brought to the fore retailers that have increasing importance within the distributive channel and which are

I n t e r n a t i o n a l J o u r n a l o f M a n a g e m e n t C a s e s
94
equipped to perform increasingly fundamental roles in the distribution process. Such developments have led to a realignment of bargaining power in the vertical relations between producers and retailers and between retailers and end consumers.
This process has generated both competitive and collaborative relations between producers and retailers operating in the same distribution channel according to dependency ties in place that result from factors such as differences in operational size, the nature of the goods in question and the degree of technological innovation.
In particular, the phases which characterise these relations typify a process of evolution from conditions of conflict between producers and retailers, with the ensuing increase of horizontal and vertical competition, to recurring forms of partnership agreements which seek to maximise not only synergies but also the value deriving from greater cooperation. In this context, producers and retailers, whilst continuing to specialise in their respective fields, have understood the strongly interrelated nature of their business and need to define suitable coordination mechanisms within the distribution channel. The development of long-term cooperation means that competitive advantage does not lie necessarily in the direct control of resources and skills, but in the capacity to identify and utilise them within the confines of cooperation agreements (Cattaneo, 2005).
In this scenario, the development of relationship marketing is particularly important in shifting the emphasis from competition to cooperation between producers and retailers.
The gradual redefinition of vertical relations between production and retail enterprises has enabled the latter to acquire increased awareness of factors relating to managing and incentivating end demand, thereby focusing increasing attention on customers (Sansone, 2005).
Retailers therefore are developing a specific and autonomous marketing approach aimed at improving their control of market opportunities by means of a set of measures and instruments which redefine supply characteristics.
In highly developed and competitive economies, the focus on the final consumer has become in fact the crucial node around which the reassessment and redefinition of retailing strategies takes place.
In particular, heightened attention is placed on the relational aspects of retailing and the understanding of consumer behaviour, not only as a means of influencing consumers to make particular purchase choices, but also as an important conduit through which to establish and preserve fidelity. In this sense, relationship marketing represents a marked break with traditional retail marketing and a starting point for policies that recognise and highlight the value of the customer and his/her fidelity according to a strategic model based on long-term relationships.
In this sense, differentiation and innovation in the “retail product” can be considered retailers’ main competitive lever (Lugli and Pellegrini, 2005). Retail enterprises tend to implement differentiation strategies with regards to their trade name through a series of measures such as: raising service quality levels for a specific target group of customers; improving and upgrading of retail outlets by increasing size and introducing multispecialisation, and reorganisation of products on offer; developing trade marks; adopting aggressive price policies; strengthening awareness of trade names; technological innovation.
In this way, in addition to those services that make up a retailer’s core business, such the ability to produce advantages for the customer in terms of time, place and product assortment, today’s retailer is strategically placed inside the store to test market changes at the end of the distribution channel and transmit them upstream towards other operators along the distribution channel (Barile, 1996). Information, in this way, flows along the distribution channel, representing an effective stimulus for improvement for operators and consequently determining constant adjustments in the strategy and tactics adopted by the system as a whole (production-retail-consumption). The opportunity to monitor constantly the market, to interact directly with end consumers and to develop relations with them assures retailers a privileged position in comparison to other intermediaries.
The changing pattern of consumers’ purchasing behaviourThe previous paragraph outlined the most recent changes to have taken place in the retail sector. These changes appear to be driven in part by the need of retailers to respond more effectively to the changing consumer demands, thereby optimising

95
I n t e r n a t i o n a l J o u r n a l o f M a n a g e m e n t C a s e s
their levels of customer satisfaction. It is with this in mind that the evolution of purchasing models has always acted as an important incentive for retailers in renewing their strategic and operational approaches.
The notion of “consumer” is a dynamic one, responding as it does directly to the principal drivers – economic, social, technological - of change in society. The word “consumer”, which tends to isolate the act of consumption from the set of behaviour patterns that make up an individual, no longer appears equipped to explain fully the present situation. The term, in fact, seems strongly linked to the classical meaning of homo oeconomicus, a rational being who makes purchase decisions detached from his/her environmental and social context as if immune from relational or emotional factors (Codeluppi, 2000).
In contrast to the classical meaning, today’s consumer is an individual whose choices can be explained less in terms of rationality and more by reference to psychological, emotional and relational factors. On one hand, this pushes the consumer to express his/her own individuality via the purchase choices made, whilst, on the other, increases the importance of the conditioning which an individual will be exposed to from the network of social relations in which he/she moves.
This evolution in consumer purchasing behaviour, which has become all the more apparent at the onset of the new millennium, has occurred concurrently with the progressive saturation of needs that typified the twentieth century. Consumption choices no longer appear today to be driven by the rational search for a product capable of satisfying an apparent need, whether that need be fundamental or not (Maslow, 1954), but the reaching of a level of status that satisfies emotional and relational needs (Fabris, 2003). The modern consumer has also developed considerable skills in critically evaluating what the market has to offer, which in turn releases him/her from the previous condition of subordination that marked relations with producers and retailers. Today’s more knowledgeable consumer places more importance on the quality rather than the quantity of the products on offer .
Clearly, the evolution of purchase behaviour and consequently of those purchase models that sought to explain it has had a significant effect on retailers. In particular, the need to build
relations with a more critical, more knowledgeable and more demanding consumer, in addition to the emergence of the emotional importance of the consumption act, has meant retailers’ having to redefine their strategic and operational approaches. The consumer behaviour patterns outlined above value the informational rather than logistical component of the overall retail service, which implies a significant rethink on the part of retailers (Pavione, 2005).
Retailers can no longer seek positions of competitive advantage by making available an assortment of products capable of satisfying a target group of consumers; today they must be able to flank the products on sale with an ever-increasing range of complementary services . Whereas initially these services were provided in order to make the act of purchasing easier and so had therefore informational value, the present trend is to offer services that satisfy the desire for pleasure and which therefore increase consumer satisfaction levels during the consumption experience (Addis, 2005).
As a result of these highly significant changes, retailers’ strategies have to be defined in terms of consumers’ new needs. The emotional and pleasure-seeking aspect of the purchasing experience means that new forms of in-store communication are required to encourage consumer involvement; these innovative forms of communication should be equipped to deliver personalised services that meet the requirements of the modern consumer (i.e. shopping as an expression of one’s personality).
The developments described have brought about a change in retailers’ strategic approach, which today is crucially centred around customer relations. The diagram above shows the different components of retailer strategy, which have to be reviewed in order to assure the renewed centricity of the consumer. The following section analyses the role new technologies can play in achieving this strategic objective.
New technologies, new frontiersAfter the general analysis provided in the previous chapter, a specific examination of the Italian market follows which aims to see how local and international retailers are changing their processes and their way to relate with their consumers.

I n t e r n a t i o n a l J o u r n a l o f M a n a g e m e n t C a s e s
96
Figure 1. Total view of the business operating model for a retailer
Many surveys show that Italians have very specific needs compared with other European citizens; customers have different value drivers for different shopping occasions or missions. The shopping missions are evolving and mood plays a major role in the shopping experience and can significantly influence how much customers spend. At the end of the day, customers want convenience and attractive prices.
Italian retailers are reacting very quickly to this changing environment and now provide more tailored shopping experiences that reflect not only who their customers are, but also how they want to shop on different occasions. Retailers are attempting to establish an emotional connection with customers by capturing their interest and creating a sense of excitement; they use technology to bridge the gap between bricks and clicks, in order to give shoppers all they need to
reach a purchasing decision and take the trouble out of hunting for the right product.
In figure 2 we have circled the three main processes involved. In the following paragraphs we analyze each in detail.
Merchandising
Achieving perfect product availability is the core issue for most retailers and it is one of the key activities classified as merchandising.
The majority of issues are perceived to be at store-level and related to the difficulty of balancing inventory with consumer wants and needs.
All major retailers in Italy are addressing this point as mishandling it can damage image, customer loyalty and performance.

97
I n t e r n a t i o n a l J o u r n a l o f M a n a g e m e n t C a s e s
Figure 2. Key processes to be aligned in order to communicate better with consumers
Figure 3. Consumer responses to out of stock
Source: Gruen, Corsten and Bharadwaj (2002)
I n t e r n a t i o n a l J o u r n a l o f M a n a g e m e n t C a s e s
98
From an operational stand point, any possible solution needs to address the following issues: the need to keep an accurate, up to date, inventory position of all products in the store, with the ability to understand whether the inventory is on the shelf and available for sale, or in the “back room” awaiting replenishment; the need to manage the physical replenishment of stock, to ensure that the right product is put on the shelf at the right time; and the need to generate accurate replenishment orders from the store to the retail.
More advanced retailers have already invested in “sales-based ordering systems”, while the “best in the class” are investing in RFID as a way of moving to the next level, with the goal of gaining supply chain visibility and efficiency. RFID solutions can automate inventory data capture and verification across the entire supply chain to increase productivity and reduce labor costs.
The current situation among Italian retailers is far from perfect for several reasons: first of all the infrastructure and the intelligence described require a level of automation and sophistication of the core processes currently possessed only by pan-European retailers or top Italian ones, the latter nevertheless operating in a market mainly characterized by small local chains.
From another stand point, the Italian context is marked by a large number of cooperatives, which, if taken as single entities, count amongst the largest retailers in Italy (i.e. Coop and Conad), but which in reality are a conglomerate of companies with different processes, stakeholders and interests, which makes it difficult to put them under the same umbrella when attempting to address and solve complex issues like store and shelf replenishment.
Last but not least, merchandising in general is a relatively new subject from an IT viewpoint: the most popular solutions available on the market have been developed to address the needs of large US and European retailers and are still complex and expensive to implement for mid-range retailers with limited budgets, even though the returns on investments are generally guaranteed in a couple of years.
Stores
As most retailers know, there are very few elements that can change their P&L picture. Adopting in-store initiatives can affect the most important of them: revenue and operating income .
As highlighted in Fig. 4, evidence we have throughout Europe, and also in Italy, is that in-store concepts and technologies could be one of the core components of the value proposition, especially for well-educated customers who prefer extra services.
There are many possible examples of initiatives retailers can take and all the major examples described hereafter are efforts to communicate better with customers and improve their shopping experience .
Dynamic digital merchandising: DDM refers to the physical in-store signage network that disseminates dynamic content to displays or monitors on the sales floor of a retail store. Digital signage should deliver content that is useful to the customer to influence spending . Retailers should ensure that content playing on the network, as well as the placement of displays, supports execution of the top customer basics for a particular sector.
Electronic shelf labels: electronic shelf labels (ESLs) are programmable wireless electronic devices that affix to store shelf labels. Alphanumeric displays are typically used to display item pricing or promotional information in real time.
Kiosks: kiosks are self-service devices that assume multiple forms with a range of retail functions, from informational to transactional. The most commonly used are kiosks for gift registries, store and product information and media playback. Demand for self-service photo kiosks is being driven by the growth of consumer use of digital photos.
Self-checkout: self-checkout terminals are deployed for consumer use as a self-service alternative to traditional point of sale (POS) checkouts in high-volume/high-traffic stores. Hardware units typically consist of a scanner, scale, monitor and payment mechanism. Customers can use the self-checkout terminal to scan, bag and pay for their purchases completely unassisted by store personnel.

99
I n t e r n a t i o n a l J o u r n a l o f M a n a g e m e n t C a s e s
Figure 4. Relationship between customer preferences and In-Store concepts
Source: Partially adapted from IBM Retail Market Intelligence, 2002
Figure 5. Example of Self check-out in a super store, Central Italy

I n t e r n a t i o n a l J o u r n a l o f M a n a g e m e n t C a s e s
100
Figure 6. Hype Cycle for Retail Technologies
Source: www.gartner.com
Personal shopping assistant: electronic device mounted on the trolley with many capabilities in order to guide shoppers through their shopping list, self scan products and provide purchasing suggestions and useful news about products and promotions.
Contact-less payment: this technology can be deployed as a key fob transponder device or payment card incorporating a radio frequency identification (RFID) chip.
Biometric payment: biometric payment systems are used by retailers to authenticate individuals’ identities and initiate payment using biometric finger scans. These systems are deployed by retailers at the point of sale (POS) or customer service areas so consumers can cash cheques or authorize payment via defined and registered tender preferences.
Mobile phone payment: mobile phone payments are customer-facing applications and programs that let consumers pay for purchases via their own mobile device in a retail environment. Mobile payment transactions are initiated or authorized via
the mobile phones and processed over wireless networks.
All these technologies have been positioned in an intuitive curve, which determines visibility in the market and the expectation coming from consumers (Figure 6).
Italian retailers can be defined as followers in this area; whilst major European and US retailers are testing (or even deploying) these technologies in their shops, Italy can count on a limited number of pioneers.
We may ask why such differences exist between the Italian market and the rest of Europe. The technological evolution of the store is the result of customer evolution and the acceptance of IT advances on one hand, and retailers’ expectations of IT’s positive impacts, on the other.
Most of the investments made in the 1990s were focused on store layout and design, characterised by attractive architectural projects, innovative use of colours and lights, valorisation of important areas and products, effective integration with Consumer Product promotions, intelligent use of advertising.

101
I n t e r n a t i o n a l J o u r n a l o f M a n a g e m e n t C a s e s
Over the last few years, some of Italy’s leading retailers (primarily, Coop and Esselunga) have begun to experiment some basic technologies such as self scanning and self check-out.
No major improvements have resulted, however. There are arguably two reasons for this situation: first of all, the average Italian consumer is not a technology addict; devices are not perceived as a kind of help, rather as complex and time consuming; second, all retailers are hesitant to invest money in technologies that do necessarily guarantee more customers and increased spending.
What can be observed in recent years is a sort of “test & deploy” model, where companies have run technology pilots in some areas and shops to sound out customers’ reactions.
Of course, this picture is changing daily; more and more retailers are building their strategic plans with the idea to differentiate from competitors through the use of in-store technology with the expectation that, sooner or later, consumers will react positively to these inputs.
4. ConclusionsCustomers walk into stores every day with specific shopping missions; it is the task of retailers to provide a product/service offering that stimulates them to make a purchase. However, the ability to develop offerings that are tailored to people with different missions, and create an experience they enjoy, requires retailers to have deeper insights than before.
Developing a better understanding of customers is an essential first step in creating a more customer-centric shopping experience. Retailers need to understand what missions attract customers to their stores, what customers need while on those missions, and how they go about shopping (and global retailers need to understand any national differences). Once they have these insights, they can develop store formats, merchandising and servicing strategies that are more closely aligned with the shopping strategies, needs and preferences of their target customers.
However, the most advanced retailers will ultimately go much further. They will use the proprietary insights they acquire to create personalized shopping experiences that are tailored to the preferences of their customers, as those
preferences change in the course of a particular shopping mission or from one shopping mission to another. The more tailored the experiences they provide, the more they will be able to differentiate themselves from their rivals.
Endnotes* The paper is the result of the joint effort of the four Authors who share the common responsibility for the results. Anyhow, paragraph 1 can be attributed to Enrica Pavione, paragraph 2 to Laura Bottinelli, paragraph 3 to Luca Apriletti and paragraph 4 to Carla Cattaneo.
The wheel of retailing theory however states 1. that price is the principal level for innovation in retailing (Hollander, 1960).
Retailers’ diversification includes areas such 2. as consumer credit, insurance, tourism, telecommunications, the car sector and, more generally, all services linked to electronic commerce.
The evaluation of product quality is a complex 3. process that requires specific competences and experience levels that differ from sector to sector. With regards to grocery goods, the object of analysis of this paper, consumer skills in evaluating the quality of products and services appear highly developed.
For a detailed analysis of consumer 4. psychology and the retailing industry see Orsingher (Orsingher, 1999).
Kotler (1973) was the first to underline the 5. possibility to create store layouts able to influence purchasing decisions in a more powerful way than the products themselves. The inside of the store includes also the initiatives and technologies described in this chapter.
The concept of “recreational shopping” or 6. “shopping experience” has been the focus of detailed examination in the literature. See above all the contribution of Westbrook and Black (1985), who classify shopping as “experiential”, product-oriented or a combination of both. In the concept of store we are presenting, “experiential shopping” is the differentiating factor and can be

I n t e r n a t i o n a l J o u r n a l o f M a n a g e m e n t C a s e s
102
achieved through an intelligent investment in technologies.
Garret (1994) suggests retailers should make 7. customer interaction easier through the use of different tools (i.e. multimedia instruments) in order to transform the shopping experience into a sort of “adventure”.
ReferencesAddis, M. (2005) L’esperienza di consumo. Analisi e prospettive di marketing Milan: Pearson Education.
Barile, S. (1996) Le formule di distribuzione al dettaglio. Analisi dei fattori condizionanti e degli aspetti evolutivi Padua: CEDAM.
Buckley, P.J. and Casson, M. (1991) The Future of the Multinational Enterprise London: MacMillan.
Burt, S. (1991) Trends in the Internationalization of Grocery Retailing: the European Experience The International Review of Retail, Distribution and Consumer Research Issue 1.
Busacca, B. and Castaldo, S. (1996) Il potenziale competitivo della fedeltà alla marca e all’insegna commerciale. Una metodologia di misurazione congiunta Milan: Egea.
Castaldo, S. and Botti, S. (1999) La dimensione emozionale dello shopping. Una ricerca esplorativa sul ruolo del punto vendita Economia & Management Vol. 1 pp.17-37.
Cattaneo, C.B. (ed.) (2005) Nascita e sviluppo dell’impresa commerciale moderna Milan: Giuffrè Editore.
Caves, E.R. (1982) Multinational Enterprise and Economic Analysis Cambridge MA: Cambridge University Press.
Codeluppi, V. (2000) Il marketing e il nuovo consumatore Micro & Macro Marketing Issue 1.
Colla, E. (2004) The Outlook of European Grocery Retailing: Competition and Format Development The International Review of Retail, Distribution and Consumer Research Vol. 14 Issue 1 pp. 47-70.
Collesei, U. and Casarin, F. (1999) La relazione industria-distribuzione tra conflitto e collaborazione Padua: CEDAM.
Dawson, J.A. (1994) Application of Information Management in European Retailing The International Review of Retail, Distribution and Consumer Research Vol. 4 Issue 2 pp. 219-238.
Dunning, J.H. (1993) The Globalization of Business London: Routledge.
Fabris, G. (2003) Il nuovo consumatore: verso il postmoderno Milan: Franco Angeli.
Garret, M. (1994) Attention, All Shoppers: Now You can Try before Buying Money Vol. 1 pp. 142-143.
Hollander, S.C. (1960) The Wheel of Retailing Journal of Marketing Vol. 54 Issue 4 pp. 37-42.
Incandela, D., McLaughlin, K.L. and Shi, C.S. (1999) Retailers to the World McKinsey Quarterly Issue 3 pp. 84-97.
Kotler, P. (1973) Atmospherics as a marketing tool Journal of Retailing Vol. 49 Issue 4.
Lugli, G. (1996) Il category management nella distribuzione grocery: una via obbligata per migliorare la performance Trade Marketing Vol. 16 pp.3-46.
Lugli, G. and Pellegrini, L. (2005) Marketing distributivo. La creazione di valore nella distribuzione despecializzata Turin: UTET.
Maslow, A.H. (1954) Motivation and Personality New York: Harper and Row.
Musso, F. (2005) L’impresa commerciale minore in Italia Padova: CEDAM.
Orsingher, C. (1999) Il servizio dalla parte del cliente. Un approccio cognitivo all’esperienza di consumo, Rome: Carocci.
Pavione, E. (2005) L’impresa commerciale come impresa di servizi in Cattaneo, C.B. (ed.) (2005) Nascita e sviluppo dell’impresa commerciale moderna Milan: Giuffrè Editore.
Pilotti, L. (1991) La distribuzione commerciale. Innovazione tecnologica, imprenditorialità e management Turin: UTET.

103
I n t e r n a t i o n a l J o u r n a l o f M a n a g e m e n t C a s e s
Sabbadin, E. (1997) Marketing della distribuzione e marketing integrato Milan: Egea.
Sansone, M. (2005) Il retailing: frequentazione del punto vendita, riconoscibilità dell’insegna e fidelizzazione del cliente nella moderna distribuzione in Baccarani, C. (ed.) (2005) Imprese commerciali e sistema distributivo. Una visione economico-manageriale Turin: Giappichelli Editore.
Solima, L. (2000) Le innovazioni tecnologiche nella gestione dell’impresa commerciale in Sciarelli, S. and Vona, R. (ed.) (2000) L’impresa commerciale Milan: McGraw-Hill.
Pastore, A. (1996) I nuovi rapporti tra industria e distribuzione. Le aree e gli strumenti per la partnership Padua: CEDAM.
Westbrook, R.A. and Black, W.C. (1985) A Motivation-Based Shopper Typology Journal of Retailing Vol. 61 Issue 1 pp. 78-103.
Ziliani, C. (1999) Micromarketing. Le carte fedeltà della distribuzione in Italia Milan: Egea.
Authors
Luca Apriletti, PhD Università di Pavia
Address: via Plinio 22, 20129 Milano - Italy
Email: [email protected]
Ph: +39 335 5999501
Fax: +39 0382 984759
Luca Apriletti is currently attentending his PhD at the University of Pavia. This is the third and last year. The main fields of research are information technology applied to the business environment and the evolution of the retail industry, in term of processes and activities.
He participated as speaker in many conferences as well as he contributed to the academic activity through various seminars.
Laura Bottinelli, Università di Pavia
Address: via S. Felice 7, 27100 Pavia – Italy
Email: [email protected]
Ph: +39 0382 984116
Fax: +39 0382 984759
Laura Bottinelli obtain a PHD in Business Management at the University of Pavia in 2006. The main field of research are service management and relationship marketing with particular attention paid to the retail sector. Since the Accademic Year 2006/2007 she is Professor of Management of Trade Enterprises at the Faculty of Economics of the University of Pavia.
Carla Cattaneo, Università di Pavia
Address: via S. Felice 7, 27100 Pavia – Italy
Email: [email protected]
Ph: +39 0382 986251
Fax: +39 0382 984759
Carla Bruna Cattaneo is an Associate Professor in Services Management and Relationship Marketing at the Faculty of Economics of the University of Pavia. Research and teaching interest focus on principles and concepts of service management and the role of quality and innovation in service sector.
Enrica Pavione, Università dell’Insubria
Address: via Monte Generoso 74, 21100 Varese – Italy
Email: [email protected]
Ph: +39 0332 395511
Fax : +39 0382 984759
Enrica Pavione is researcher in Business Management at the Faculty of Economics, University of Insubria, Varese. She has a Ph.D in business economics from the University of Pavia. She teaches Management at the University and various MBA programmes. Her research interests are in marketing and retail management, with special regard to collaborative agreements among commercial firms and in health management. She has published in these areas various articles in national and international reviews and working papers.

I n t e r n a t i o n a l J o u r n a l o f M a n a g e m e n t C a s e s
104
ECO-PURCHASING IN THE ORGANIC FOOD MARKET
GEORGE N. LODORFOSFACULTY OF BUSINESS AND LAW, LEEDS METROPOLITAN UNIVERSITY, UK
JUNE DENNISFACULTY OF BUSINESS AND LAW, LEEDS METROPOLITAN UNIVERSITY, UK
Abstract
This paper examines the determinants that influence consumers’ intention to purchase organic products. Ajzen’s theory of planned behaviour (TPB) provides the conceptual framework of this study which is predominantly explanatory, as it aims to establish an understanding of the causal relationship between variables important to consumers’ intent to purchase organic food. Initially, a pilot study was carried out to elicit the salient beliefs of the population under consideration concerning the purchase of organic food, followed by a survey. To reduce selection bias, recruitment includes random sampling of consumers aiming to determine the beliefs which influence their intent to purchase organic food. The survey of 144 respondents allowed access to respondents with a broad range of household incomes, educational attainment, occupation and age.
Based on the analyses the theory of planned behaviour was found to be predictive of factors affecting consumers’ intent to purchase organic food. Gender was also found to determine consumers’ intent to buy organic food. Attitudes, subjective norm and perceived behavioural control were examined to determine whether they affect consumers’ intention to make organic products purchases and it was found that consumers’ intent to buy organic food was predicted by attitude, subjective norm and perceived behavioural control. In addition, intent was associated with outcome beliefs.
Moreover, our empirical evidence suggest that consumers are interested in purchasing organic food because they believe that they are healthier, taste better and overall they are better quality. In addition, the cost of purchasing, availability of organic products, product information and the
subjective opinions of others were highlighted as important determinants of consumers’ intent to buy organic products. Therefore, the results show that organic businesses have plenty of scope to grow their market by paying attention to a wide range of factors affecting consumers’ intention to purchase and repurchase organic food products.
Finally this study suggests that there is some ignorance among consumers about what organic food is and what its benefits are. Therefore, in order organic sales to continue to grow in the future, it is important to educate consumers and to make them develop trust for the retailers and the products. In addition, our respondents argued that product range and availability of organic products to stores is still limited. Hence, retailers should also consider expanding their food products portfolio to include more organic products.
Keywords: Consumer Behaviour, Theory of Planned Behaviour, Organic Products, Organic Food.
IntroductionEurope has the largest and most sophisticated market for organic products in the world for organic food and has grown considerably over the past ten years (Hamm et al., 2002 Zanoli and Naspetti, 2001; FIBL, 2004, http://www.organicmonitor.com/100140.htm., accessed at 22/2/2007). Notably, high market growth rates are causing many sectors to suffer from undersupply with imports meeting the shortfall in regional supply (http://www.organicmonitor.com/100140.htm, accessed at 22/2/2007). In the UK, the demand for organic food products is estimated to be growing at rates of up to 40% per annum (Mayfield et al, 2001). For instance, the organic

105
I n t e r n a t i o n a l J o u r n a l o f M a n a g e m e n t C a s e s
meat products market is the fastest growing in the UK organic food industry with sales volume expanding by 139% between 2001 and 2004. High growth rates have made the UK organic meat market the second largest in the world (http://www.organicmonitor.com/120144.htm., accessed 22/2/2007). Similarly, the market for organic dairy products is reporting high growth due to product innovations and marketing campaigns of producers (http://www.organicmonitor.com/120243.htm., accessed at 22/2/2007). The picture is also similar in the British organic fruit market which is valued at £221 million and is the largest in Europe (http://www.organicmonitor.com/100142.htm., accessed 22/2/2007
Figures released by the Soil Association in its annual report showed a 30% growth in the UK market for organic food– averaging an extra £7 million a week – compared to growth for all UK food and drink sales of 3 per cent. The number and range of people buying organic food have also risen, with nearly two out of three consumers knowingly buying organic food (65.4 per cent) and over half of people in the most disadvantaged social groups now buying organic food and drink.
Consumers in the United States and the European Union make up 95 percent of the world’s retail sales of organic food products, which is estimated at more than £12.8 billion worldwide (USDA ERS cited in http://www.agmrc.org/agmrc/markets/Food/organicfoodtrendsprofile.htm., accessed at 14/2/2007). The organic market is more mature in the EU, with growth rates averaging 7.8 percent per year (http://www.agmrc.org/agmrc/markets/Food/organicfoodtrendsprofile.htm., accessed at 14/2/2007) ). In many EU countries, consumers are becoming more anxious about the food they eat and are increasingly concerned with food production issues such as food safety (Huang, 1996), quality (Haglund et al., 1999), health (Beharrel and MacFie, 1991), the environment (Haglund et al., 1999) and animal welfare (Fearne and Lavelle, 1996).
Despite these trends which suggest that the market for organic products is developing well, Sirieix and Schaer (2005) argue that trust in the organic offer remains an important pattern in consumers’ behaviour and they believe that the lack of trust is likely to eventually reduce the consumption of organic produce.
Previous studies have been conducted using different theories and models to attempt to establish what influences consumers purchasing of organic products. However, some of the findings have been inconclusive or contradictory (Ekelund, 1989; Wilkins and Hillers, 1994; Huang, 1996; Lockie et.al., 2004). Therefore, this study applies Ajzen’s theory of planned behaviour (TPB) in the UK organic food purchasing market, to investigate further the factors that influence consumers’ intent to buy organic food products (Ajzen 1985, 1988 and 1991).
Literature ReviewResearch literature on food choice considers product attributes as one of the perspectives to increase understanding of consumer or buyer choice (e.g. Bagozzi, 1986; Bech-Larsen et al., 1997; Assael, 1998). A product is therefore known as a collection of several characteristics and components referred as product attributes, upon which buyers makes their choices (Sloof et.al., 1996; Grunert et.al., 1995, 1996 and 2000).
Several classifications of attributes for food exist. Grunert et.al. (1995) divided them on intrinsic and extrinsic bases, whereas extended classification includes: search attributes, experience attributes and credence attributes (e.g. health and safety) (Sloof et.al., 1996 and Grunert et.al., 2000).
Consumer food choice according to Grunert (2003) is influenced by the price and quality of the food products and consumers’ income. Grunert et.al. (1996) distinguish four groups of quality attributes for food products: sensory attributes, health attributes, process attributes, and convenience attributes.
Price, in particular, is perceived as a negative attribute of organic food and its importance as a barrier to purchase organic fruit and vegetable is confirmed by an increasing number of research studies that assess the consumers’ willingness to pay a premium for organic or safe products (e.g. Weaver et al., 1992; Underhill and Figueroa, 1996; Govindasamy and Italia, 1999; Jones, 2000 and Mayfield et al., 2001).
Sensory attributes refer to the classical food quality aspects taste, appearance, and smell, with taste as the dominant aspect. Consumers according to Wier and Mørch Andersen (2003) may hold use values, such as utility from taste, health and/or freshness.

I n t e r n a t i o n a l J o u r n a l o f M a n a g e m e n t C a s e s
106
Non-use values are defined in their study as public good values related to improved environment and/or animal welfare. Their findings suggest that the majority of their sample acknowledge and value organic goods both for their non use values (i.e. environmental or animal welfare attributes), and their use values (i.e. health, taste or freshness attributes). Taste is an experience quality that can be evaluated only after the purchase, and consumers use a number of market signals, like brand, price, and quality labels, in trying to predict the taste experience (Grunert, et.al., 2001 cited in Grunert 2003). A poll conducted by MORI (1999) and a survey by the Welsh Consumer Council (2000) both indicated that taste was a significant reason for buying organic food. The MORI poll showed that 43% of consumers named taste as an important factor in their decision to purchase food (Jones, 2000). Another survey found that 25% of consumers polled considered that the main benefit of organic food was better taste (IGD, 2000 in Brown, 2001). Similarly, a study by Eden-Harris (2006) suggests that the better taste of organic produce and food is a key impetus to buying organic, and a rationale for paying higher prices. Therefore, taste is an important motivation for buying organic food (Fillion and Arazi, 2002). Similarly, Kirk et.al (2001) found a positive attitude to organic food, which was perceived as being a better quality than conventional food.
Health has been of increasing importance for consumers’ food choice for the last 50 years or so, and today analyses of consumer food quality perception many times indicate that health and sensory considerations have about equal weight. Health-related qualities are quite different from sensory qualities, in that they are, for the consumer, invisible. However, according to several studies, the image of organic products is generally positive due to their perceived health value, product safety and natural purity (Beharrell and Macfie, 1991; Tregear et al., 1994; Thompson and Kidwell, 1998; Mathias, 1999; Gil et al., 2000; ZMP, 2001; ZMP, 2002, Lockie et.al., 2004 and Eden-Harris, 2006). A survey by Hutchins and Greenhalgh (1997) indicated that 93% of their respondents purchase organic food for ‘health reasons’. Similarly, other studies demonstrate that the major motive for buying organic foods seems to be health-related (see Ekelund, 1989; Tregear et al., 1994; Mathisson and Schollin, 1994; Huang, 1996; Bugge, 1997; Schifferstein and Wandel, 1998; von Alvensleben, 1998 and Eden-Harris, 2006).
Process attributes relate to consumers’ interest in the way a food product has been produced, even when this has no measurable impact on the final food product. Consumers pay premiums for organic products which look and taste the same, for products which were produced without chemicals and with concern for animal welfare, and the environment, and products which are guaranteed GMO-free (Scholderer et.al. cited in Grunert 2003). For example Wier and Mørch-Andersen (2001) concluded that health hazards are the main motivation for purchase and correspondingly free-from-pesticides is the most important attribute of the produce. Therefore, modern intensive farming methods, and the requirement of the extensive use of chemicals, have become unacceptable to many consumers (Mayfield et al, 2001). These factors have a positive effect on consumers’ acceptance of organic food products (Morris, 1996; Kirk et.al., 2001). However, a number of studies suggest that environmental concern is not as strong a motive as health but is a key consideration (Mathisson and Schollin, 1994; Tregear et al., 1994; von Alvensleben, 1998; Schifferstein and Oude Ophuis, 1998; Ekelund, 1989).
Consumers’ interest in convenience has been rising quite considerably over the past few decades (Grunert, 2003). Research also indicates that demand for convenience is best explained by households’ subjective perceptions of their resource constraints (Scholderer and Grunert, cited in press Grunert 2003). In addition, studies by Torjusen et. al., (2004), and Jones (2000), have shown that the availability and range of products are of concern to consumers. In the case of Jones (2000), a third of consumers surveyed reported that they felt that it was difficult to find organic food.
Further research identifies culture and demographic issues such as age differences, gender and income levels as influences in the intent to purchase organic produce. The culture in which individuals are brought up has a very strong influence on the types of choices made, and hence, one may assume that social interactions will have a profound effect on their views of foods and eating behaviour. However, with a few exceptions (e.g Hofstede, 1980; McCracken, G. 1986; Applbaum and Jordt, 1996; Kirk, et.al., 2001; Shepherd et.al., 2005,) there is little research on the effect that cultural influences have upon consumer behaviour. The level of influence that family, friends and the media exert upon consumers seems to have been

107
I n t e r n a t i o n a l J o u r n a l o f M a n a g e m e n t C a s e s
largely overlooked in previous studies. Therefore, questions relating to social influences were included in the questionnaire used for this study.
Wandel and Bugge (1997) have demonstrated age differences with respect to purchase motives. Young consumers appear to base their choice of organic foods more on considerations for the environment, whereas old consumers are more influenced by considerations for their own health (Wandel and Bugge, 1997). Previous research also shows that women tend to be more interested in organic foods than men (Mathisson and Schollin, 1994; Wandel and Bugge, 1997), and that people with higher education seem to be more willing to pay more for organic foods (Jolly, 1991; Wandel and Bugge, 1997). In addition, the demand for organic foods seems to be positively correlated with income (von Alvensleben and Altmann, 1987). Thus, buying motives and interest in organic foods seem to be related to demographic factors such as age, gender, and level of education.
From the literature and previous research review it is concluded that motivation to purchase depends on several individual, situational and even national characteristics that affect the different levels of the purchasing decision making process (see Tregear et al., 1994; Grunert and Juhl, 1995; Davis et al., 1995; Roddy et al., 1996; Reicks et al., 1997; Zanoli, 1998; Worner and Meier-Ploeger, 1999; Chryssochoidis, 2000; Krystallis and Chryssochoidis, 2005). Individual socio-demographic and economic characteristics are also commonly included as determinants of choice (e.g. Ekelund, 1989; Shepherd, 1989; Mowen, 1993; Mathisson and Schollin, 1994; Engel et al., 1995; Alvensleben, 1997; Reicks et al., 1997; Grunert et.al., 2000 and Wier Mørch-Andersen, 2001; Krystallis and Chryssochoidis, 2005). In addition, consumer behaviour theories argue that the consumer perceives a product as a bundle of attributes and they choose between products on the basis of such attributes (Howard and Sheth, 1969; Engel et al., 1995). Finally, several studies summarise, price, availability, value perception, and promotion as the key factors which may discourage consumers for purchasing organic food products (Silverstone, 1993; Tregear et al., 1994; Davis et al., 1995; Roddy et al., 1996; Latacz-Lohmann and Foster, 1997; Reicks et al., 1997; Worner and Meier-Ploeger, 1999).
Methodology and Research Model
Theory of Planned Behaviour
Sparks and Shepherd (1992), studying the role of personal attitudes and beliefs of consumers when purchasing organic vegetables, found that there was strong correlation between attitudes and behavioural intentions. Their work stated that attitude usually plays a major role in forming behaviour, and that an important property of attitudes is how confidently they are held. They concluded that confidently held attitudes can usually be relied upon to guide behaviour. Similarly, Thøgersen (1999a, and 1999b) has studied consumers’ behaviour from a perspective of to what degree environmental issues influence these in their purchasing patterns. Central to his research is the link between the expressed attitudes and the final behaviour. Several studies show that it is difficult to predict final behaviour, expressed in consumers’ attitudes towards environmental issues, in terms of consumers choosing an environmentally friendly alternative instead of a less environmentally friendly product. This has led some researchers to the conclusion that it is not possible to predict this kind of consumer behaviour and hence to assume that this way of working is not feasible. Nevertheless, like Thøgersen, we aim to understand the link between consumers’ attitude towards environmental aspects of products and their behavioural intent rather than their final behaviour. Thus Ajzen’s theory of planned behaviour (Ajzen, 1985, 1988, 1991) was utilised to map this relationship.
The Theory of Planned Behaviour (TPB) (Azjen, 1991), is an extension of the Theory of Reasoned Action (Azjen and Fishbein, 1970), and is a widely used and supported model to predict consumer behaviour (see Figure 1). One of the central themes in TPB is the individual’s intention to perform a given behaviour as the principal predictor of behaviour, intention is regarded as the motivation necessary to engage in a particular behaviour: “the stronger the intention to engage in a behaviour, the more likely should be its performance” (East, 1990; Armitage and Conner, 1999).
The theory suggests that behaviour is a function of salient beliefs, relevant to the behaviour. These salient beliefs are considered to be the prevailing determinants of a person’s intentions and actions (Fishbein, 1967).
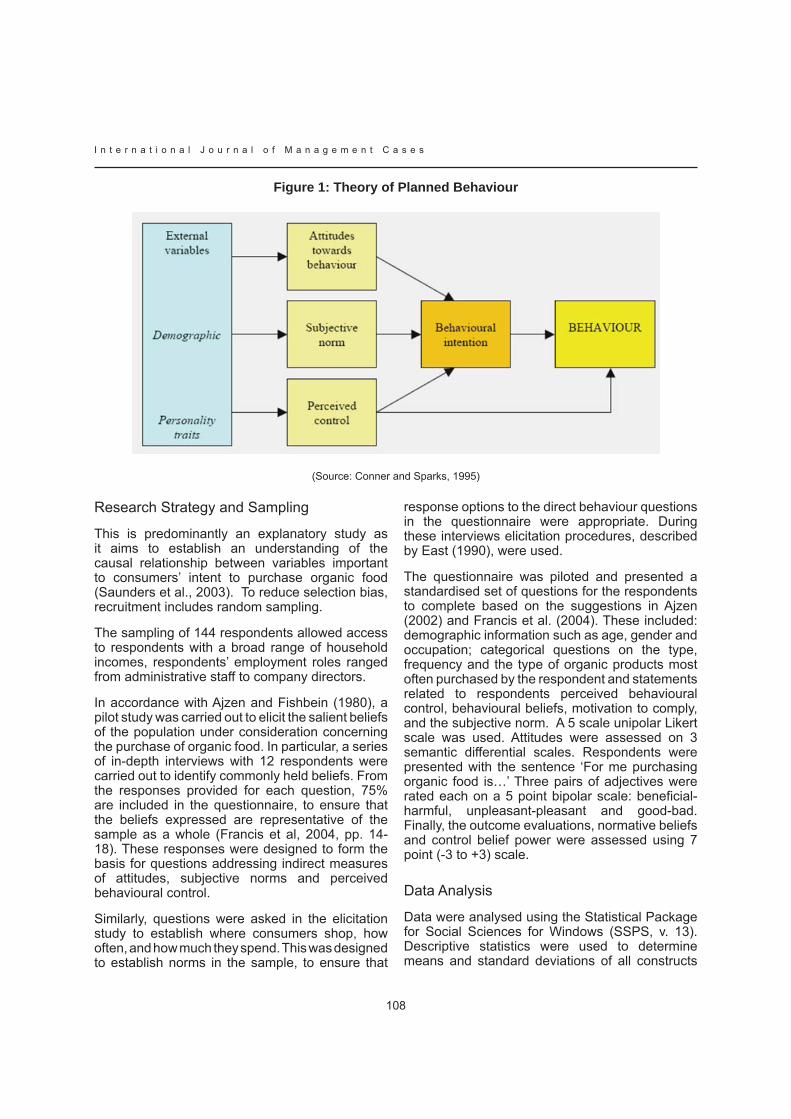
I n t e r n a t i o n a l J o u r n a l o f M a n a g e m e n t C a s e s
108
Figure 1: Theory of Planned Behaviour
(Source: Conner and Sparks, 1995)
Research Strategy and Sampling
This is predominantly an explanatory study as it aims to establish an understanding of the causal relationship between variables important to consumers’ intent to purchase organic food (Saunders et al., 2003). To reduce selection bias, recruitment includes random sampling.
The sampling of 144 respondents allowed access to respondents with a broad range of household incomes, respondents’ employment roles ranged from administrative staff to company directors.
In accordance with Ajzen and Fishbein (1980), a pilot study was carried out to elicit the salient beliefs of the population under consideration concerning the purchase of organic food. In particular, a series of in-depth interviews with 12 respondents were carried out to identify commonly held beliefs. From the responses provided for each question, 75% are included in the questionnaire, to ensure that the beliefs expressed are representative of the sample as a whole (Francis et al, 2004, pp. 14-18). These responses were designed to form the basis for questions addressing indirect measures of attitudes, subjective norms and perceived behavioural control.
Similarly, questions were asked in the elicitation study to establish where consumers shop, how often, and how much they spend. This was designed to establish norms in the sample, to ensure that
response options to the direct behaviour questions in the questionnaire were appropriate. During these interviews elicitation procedures, described by East (1990), were used.
The questionnaire was piloted and presented a standardised set of questions for the respondents to complete based on the suggestions in Ajzen (2002) and Francis et al. (2004). These included: demographic information such as age, gender and occupation; categorical questions on the type, frequency and the type of organic products most often purchased by the respondent and statements related to respondents perceived behavioural control, behavioural beliefs, motivation to comply, and the subjective norm. A 5 scale unipolar Likert scale was used. Attitudes were assessed on 3 semantic differential scales. Respondents were presented with the sentence ‘For me purchasing organic food is…’ Three pairs of adjectives were rated each on a 5 point bipolar scale: beneficial-harmful, unpleasant-pleasant and good-bad. Finally, the outcome evaluations, normative beliefs and control belief power were assessed using 7 point (-3 to +3) scale.
Data Analysis
Data were analysed using the Statistical Package for Social Sciences for Windows (SSPS, v. 13). Descriptive statistics were used to determine means and standard deviations of all constructs

109
I n t e r n a t i o n a l J o u r n a l o f M a n a g e m e n t C a s e s
as well as age, gender, and occupation. Mean values for the constructs were compared using independent t-tests to identify any gender, age or occupation differences.
Pearson correlations were conducted to examine associations between the psychosocial variables (constructs) for the TPB model. In order to examine constructs (attitude, subjective norm and PBC) most predictive of intention, standard regression analyses were performed respectively. Additionally, further standard regression analyses were conducted with the constructs (attitude, subjective norm and PBC) with outcome beliefs (OB), referent beliefs (RB) and control beliefs (CB) respectively. Finally, standard regression analyses were conducted between outcome beliefs, referent beliefs and control beliefs. The level of significance was set at p < 0.05 for all statistical tests.
Demographics
Gender, age and occupation were queried to analyse the demographic characteristics of the sample population. The age distribution of the sample is shown below (table 1)
Respondents were asked how often they shop for food. The majority of the respondents, 41%, shop several times a week. Some 36.1% shop for food once a week whilst 14.6% claimed to shop for food daily. Only 8.3% of our sample shop for food less than once a week. Respondents were asked to state which organic products they had purchased. The most popular response was fresh vegetables and fruit, although meat and fish, chocolate and coffee were also common responses. Respondent were also asked where they normally do their food shopping. Supermarkets were mentioned by the majority of the respondents (66%) followed by general markets (16%). Some 12.5% also highlighted convenience stores, and a small percentage mentioned farmers markets. Respondents also tended to buy their organic food at their preferred food shopping outlets, although a higher proportion identified local butchers and greengrocers. When the respondents were asked how much they spend on an average week for food shopping, nearly 32% said between £20-£35 (Sterling), 21% spent between £35-£49 and 24% spent between £50-£64 pounds. The remainder spent either less than £20 pounds Sterling or more than £65.
T-Test Gender
Independent t-tests were conducted to compare the responses for male and female respondents. The statements which showed significant difference were ‘If the cost for organic food was the same as non organic I would be more likely to buy more organic products’, ‘If organic food was available in all shops I would be more likely to buy more organic products’ and ‘if I knew that organic food was healthier than non organic I would be more likely to buy more organic products’ , where the equal variances assumed Sig. (2-tailed) value was 0.05, indicating a significant difference in the mean scores for males (M=1.72; M = 1.45; M=1.38, SD = 1.136; SD = 1.111; SD =1.040) and females [M=2.19; M = 1.91; M=1.79, SD =1.082; SD = 0.969; SD =0.945 t(144) = -2.443; t(144) = - 2.582; t(144) = -2.430, p=0.01] (Pallant, 2001).
Analyses of Mean Values
Analysing the mean values of different items of the questionnaire it is concluded that the majority of the respondents find food labelling confusing with the statement ‘I find food labelling confusing’ having the highest positive mean value (3.88). The mean value of the statement ‘I do not feel I have enough information about how healthy organic food is’ (3.49) was also positive, again highlighting information concerns.
The second highest mean value had statements suggesting that staying healthy is a concern for the respondents (3.74). The survey results also indicate that respondents believe that organic food both tastes better and is better quality with means of 3.14 and 3.11 respectively. The importance of health consciousness and taste as motive of organic food purchases is supported by Wier and Mørch Andersen (2003) and Chryssohoidis and Krystallis, (2005).
Finally, the respondents’ general view was that organic food is too expensive and that they would be prepared to buy more organic food, if it did not carry such price premium over non-organic food. This supports the findings of many other studies (e.g. Weaver et al. 1992; Underhill and Figueroa, 1996; Govindasamy and Italia, 1999; Jones, 2000 and Mayfield et al., 2001). The findings also resonate with those of Mayfield et al (2001), who observed that organic food is a luxury treat to many consumers, as a result of the price premium.
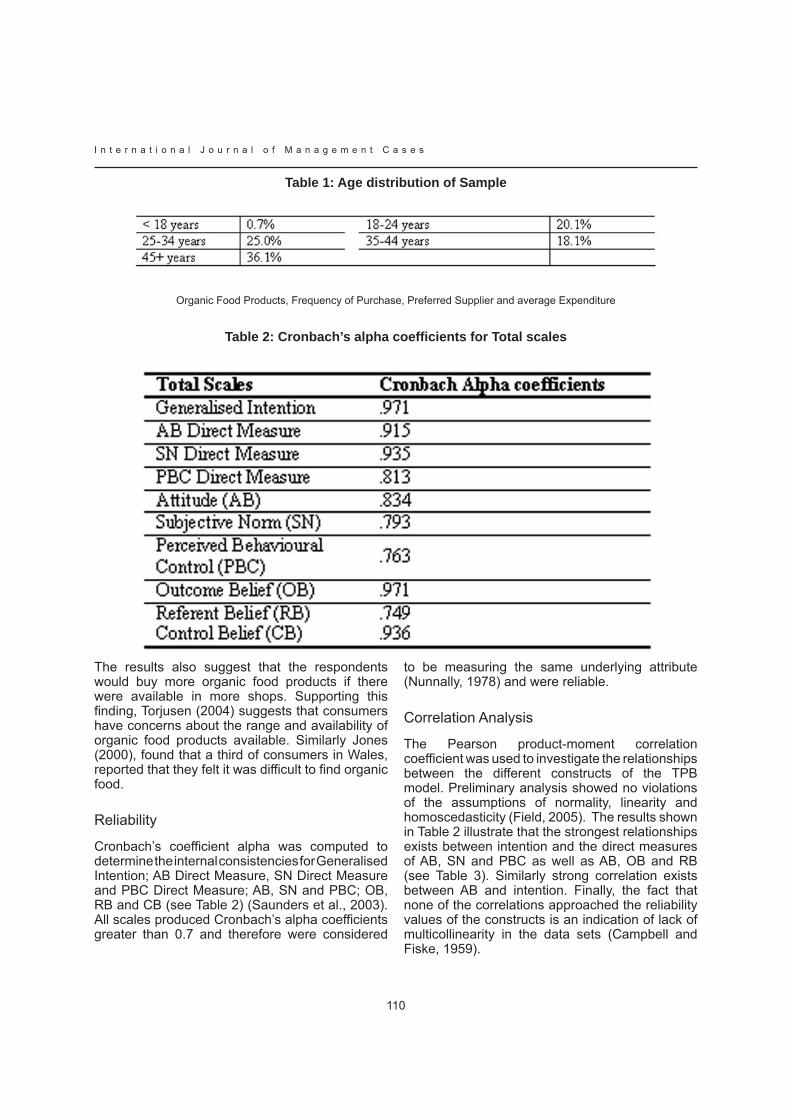
I n t e r n a t i o n a l J o u r n a l o f M a n a g e m e n t C a s e s
110
Table 1: Age distribution of Sample
Organic Food Products, Frequency of Purchase, Preferred Supplier and average Expenditure
Table 2: Cronbach’s alpha coefficients for Total scales
The results also suggest that the respondents would buy more organic food products if there were available in more shops. Supporting this finding, Torjusen (2004) suggests that consumers have concerns about the range and availability of organic food products available. Similarly Jones (2000), found that a third of consumers in Wales, reported that they felt it was difficult to find organic food.
Reliability
Cronbach’s coefficient alpha was computed to determine the internal consistencies for Generalised Intention; AB Direct Measure, SN Direct Measure and PBC Direct Measure; AB, SN and PBC; OB, RB and CB (see Table 2) (Saunders et al., 2003). All scales produced Cronbach’s alpha coefficients greater than 0.7 and therefore were considered
to be measuring the same underlying attribute (Nunnally, 1978) and were reliable.
Correlation Analysis
The Pearson product-moment correlation coefficient was used to investigate the relationships between the different constructs of the TPB model. Preliminary analysis showed no violations of the assumptions of normality, linearity and homoscedasticity (Field, 2005). The results shown in Table 2 illustrate that the strongest relationships exists between intention and the direct measures of AB, SN and PBC as well as AB, OB and RB (see Table 3). Similarly strong correlation exists between AB and intention. Finally, the fact that none of the correlations approached the reliability values of the constructs is an indication of lack of multicollinearity in the data sets (Campbell and Fiske, 1959).
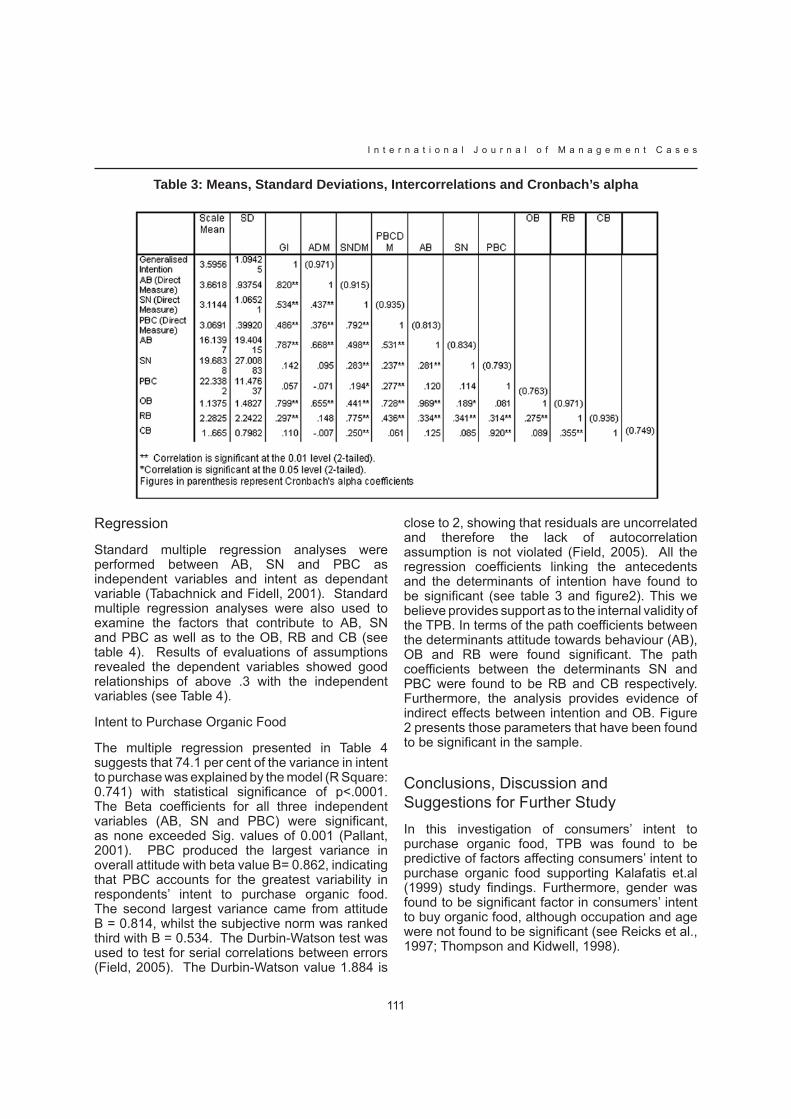
111
I n t e r n a t i o n a l J o u r n a l o f M a n a g e m e n t C a s e s
Table 3: Means, Standard Deviations, Intercorrelations and Cronbach’s alpha
Regression
Standard multiple regression analyses were performed between AB, SN and PBC as independent variables and intent as dependant variable (Tabachnick and Fidell, 2001). Standard multiple regression analyses were also used to examine the factors that contribute to AB, SN and PBC as well as to the OB, RB and CB (see table 4). Results of evaluations of assumptions revealed the dependent variables showed good relationships of above .3 with the independent variables (see Table 4).
Intent to Purchase Organic Food
The multiple regression presented in Table 4 suggests that 74.1 per cent of the variance in intent to purchase was explained by the model (R Square: 0.741) with statistical significance of p<.0001. The Beta coefficients for all three independent variables (AB, SN and PBC) were significant, as none exceeded Sig. values of 0.001 (Pallant, 2001). PBC produced the largest variance in overall attitude with beta value B= 0.862, indicating that PBC accounts for the greatest variability in respondents’ intent to purchase organic food. The second largest variance came from attitude B = 0.814, whilst the subjective norm was ranked third with B = 0.534. The Durbin-Watson test was used to test for serial correlations between errors (Field, 2005). The Durbin-Watson value 1.884 is
close to 2, showing that residuals are uncorrelated and therefore the lack of autocorrelation assumption is not violated (Field, 2005). All the regression coefficients linking the antecedents and the determinants of intention have found to be significant (see table 3 and figure2). This we believe provides support as to the internal validity of the TPB. In terms of the path coefficients between the determinants attitude towards behaviour (AB), OB and RB were found significant. The path coefficients between the determinants SN and PBC were found to be RB and CB respectively. Furthermore, the analysis provides evidence of indirect effects between intention and OB. Figure 2 presents those parameters that have been found to be significant in the sample.
Conclusions, Discussion and Suggestions for Further StudyIn this investigation of consumers’ intent to purchase organic food, TPB was found to be predictive of factors affecting consumers’ intent to purchase organic food supporting Kalafatis et.al (1999) study findings. Furthermore, gender was found to be significant factor in consumers’ intent to buy organic food, although occupation and age were not found to be significant (see Reicks et al., 1997; Thompson and Kidwell, 1998).

I n t e r n a t i o n a l J o u r n a l o f M a n a g e m e n t C a s e s
112
Table 4: Regressions
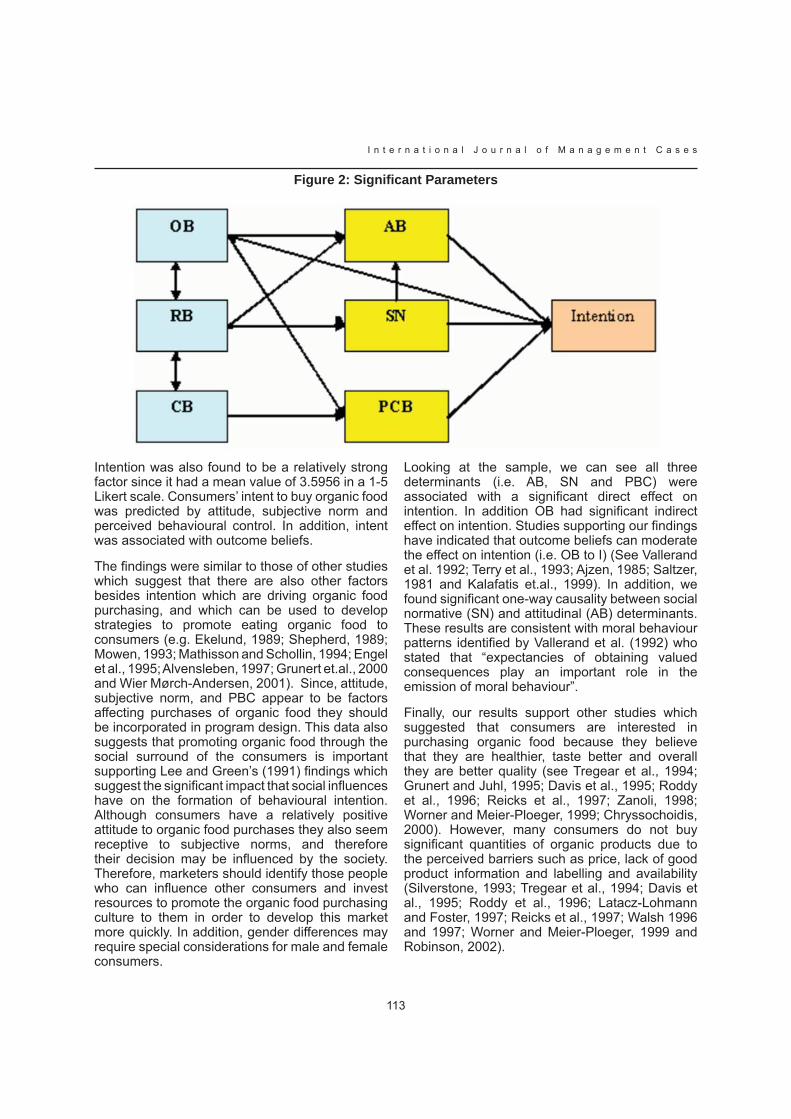
113
I n t e r n a t i o n a l J o u r n a l o f M a n a g e m e n t C a s e s
Figure 2: Significant Parameters
Intention was also found to be a relatively strong factor since it had a mean value of 3.5956 in a 1-5 Likert scale. Consumers’ intent to buy organic food was predicted by attitude, subjective norm and perceived behavioural control. In addition, intent was associated with outcome beliefs.
The findings were similar to those of other studies which suggest that there are also other factors besides intention which are driving organic food purchasing, and which can be used to develop strategies to promote eating organic food to consumers (e.g. Ekelund, 1989; Shepherd, 1989; Mowen, 1993; Mathisson and Schollin, 1994; Engel et al., 1995; Alvensleben, 1997; Grunert et.al., 2000 and Wier Mørch-Andersen, 2001). Since, attitude, subjective norm, and PBC appear to be factors affecting purchases of organic food they should be incorporated in program design. This data also suggests that promoting organic food through the social surround of the consumers is important supporting Lee and Green’s (1991) findings which suggest the significant impact that social influences have on the formation of behavioural intention. Although consumers have a relatively positive attitude to organic food purchases they also seem receptive to subjective norms, and therefore their decision may be influenced by the society. Therefore, marketers should identify those people who can influence other consumers and invest resources to promote the organic food purchasing culture to them in order to develop this market more quickly. In addition, gender differences may require special considerations for male and female consumers.
Looking at the sample, we can see all three determinants (i.e. AB, SN and PBC) were associated with a significant direct effect on intention. In addition OB had significant indirect effect on intention. Studies supporting our findings have indicated that outcome beliefs can moderate the effect on intention (i.e. OB to I) (See Vallerand et al. 1992; Terry et al., 1993; Ajzen, 1985; Saltzer, 1981 and Kalafatis et.al., 1999). In addition, we found significant one-way causality between social normative (SN) and attitudinal (AB) determinants. These results are consistent with moral behaviour patterns identified by Vallerand et al. (1992) who stated that “expectancies of obtaining valued consequences play an important role in the emission of moral behaviour”.
Finally, our results support other studies which suggested that consumers are interested in purchasing organic food because they believe that they are healthier, taste better and overall they are better quality (see Tregear et al., 1994; Grunert and Juhl, 1995; Davis et al., 1995; Roddy et al., 1996; Reicks et al., 1997; Zanoli, 1998; Worner and Meier-Ploeger, 1999; Chryssochoidis, 2000). However, many consumers do not buy significant quantities of organic products due to the perceived barriers such as price, lack of good product information and labelling and availability (Silverstone, 1993; Tregear et al., 1994; Davis et al., 1995; Roddy et al., 1996; Latacz-Lohmann and Foster, 1997; Reicks et al., 1997; Walsh 1996 and 1997; Worner and Meier-Ploeger, 1999 and Robinson, 2002).
I n t e r n a t i o n a l J o u r n a l o f M a n a g e m e n t C a s e s
114
In conclusion, consumers’ intention to purchase organic food is potentially influenced by a large range of potential factors. Many models put forward in this area involve merely listing the likely influences rather than offering a framework for empirical research and practical application. Although there is general agreement on the types of influences likely to be important, the integration of these factors into a coherent and quantitative model of consumers’ intent to buy organic food remains an area in need of further development.
Recommendations for Retailers and Marketers The findings of this study show that organic businesses have plenty of scope to grow their market by paying attention to a wide range of factors affecting consumers’ intention to purchase and repurchase organic food products. Organic sales continue to grow, and this trend seems that it will continue in the future especially if the benefits of organic food are clearly communicated to consumers. The following general recommendations for marketing organic food have been compiled on the basis of this research
Consumers need to be given detailed and in depth information about organic food.
This research shows that a wide range of factors affect consumers intention to buy organic food, to list a few include food safety, taste, health, and to some extent the environment and animal welfare.
Different factors will be stronger for different groups of people depending on age, gender, income, subjective norm, educational attainment and nationality so the organic food retailers need to give enough information and clear labelling to justify the cost of organic products and to highlight their superiority. This suggests that there is potential to attract new consumers into the market through raising awareness.
This can be achieved by improving the food labelling on the pack to communicate the benefits; developing a dedicated website; communicating the origins of the product; promoting eco-purchasing with promotional offers and/or communicating eco-messages to consumers.
The better taste that many people experience with organic food is an increasingly important affecting
consumers’ intent. Marketers should therefore focus more on taste, demonstrating to consumers for instance by product sampling the difference in taste between organic and conventional food products.
Similarly, the healthiness of organic products is strong factor in affecting consumers’ intention to eat organic food. Therefore, marketers should aim to develop health related image and connections and of the product either linked to its name or packaging, or positioning in store and/or nutritional information.
The findings of this study suggest that there is some ignorance among consumers about what organic food is and what its benefits are. Therefore, it is important to educate consumers and to make them develop trust for the retailer and the product. Furthermore, our respondents argued that product range and availability of organic products to stores is still limited. Hence, retailers should consider expanding their food products portfolio to include more organic products.
ReferencesAjzen, I. (1988). Attitudes, Personality, and Behaviour. Milton Keynes: Open University Press.
Ajzen, I. (1985). From intention to actions: A theory of Planned Behaviour. In: J Kuhl and J Beckmann (ed). Action-Control: From Cognition to Behaviour, 11-39. Heidelberg: Springer.
Ajzen, I. (1991). The theory of planned behaviour Organisational Behaviour and Human Decision Processes, 50, pp.179 – 211.
Ajzen, I. (2002). Constructing a TPB Questionnaire: Conceptual and Methodological Considerations September Available at: www.people.umass.edu/aizen/pdf/tpb.measurement.pdf .
Azjen. I and Fishbein .M (1970). The prediction of behaviour from attitudinal and normative beliefs. Journal of Personality and Social Psychology, 6, pp. 466-487.
Ajzen, I. and Fishbein, M (1980). Understanding attitudes and predicting social behaviour. Englewood Cliffs, NJ: Prentice-Hall. Quoted in: Azjen, I. (1991).

115
I n t e r n a t i o n a l J o u r n a l o f M a n a g e m e n t C a s e s
Ajzen, I. and Driver, B. L. (1992). Contingent value measurement: on the nature and meaning of willingness to pay. Journal of Consumer Psychology, 1 (4) p.297.
Armitage, C. J., and Conner, M. (1999). Distinguishing perceptions of control from self-efficacy: Predicting consumption of a low-fat diet using the theory of planned behavior. Journal of Applied Social Psychology, 29, 72-90.
Armitage, C. J. and Conner, M. (2001). Efficacy of the theory of planned behaviour: a meta-analytic review. British Journal of Social Psychology, 40 pp.471-499.
Arvola, A., Vassallo, M., Dean, M., Saba, A., Lahteenmaki, L. and Shepherd, R. (2005). Purchase intentions of organic apples and pizza. Including affective and moral attitude into the Theory of Planned Behaviour. Poster presented at the 6th Pangborn Sensory Science Symposium, Harrogate, UK, 7-11 August 2005.
Assael, H. (1998). Consumer Behaviour and Marketing Action, 6th edition, Cincinnati: South-Western.
Applbaum, K. and Jordt, I. (1996). Notes towards an application of McCracken’s `Cultural categories for cross-cultural consumer research’, Journal of Marketing Research, 23, December, pp. 204-18.
Bagozzi RP (1986). Principles of marketing management. Science Research Associates Chicago.
Bagozzi, R. P. and Yi, Y. (1989). The degree of intention formation as a moderator of the attitude-behaviour relation. Social Psychology Quarterly, 52. pp.266-279.
Bech-Larsen, T., Grunert, K.G., Poulsen, J.B. (2001). The acceptance of functional foods in Denmark, Finland and the United States, MAPP, Aarhus, Denmark, MAPP working paper (73).
Beharrell, B., and Macfie, J. H. (1991). Consumer attitudes to organic foods. British Food Journal, 93 (2), 25-30.
Brown, C.M. (2001). Marketing and consumer awareness for organic produce. In: Kyriazakis, I. and Zervas, G. (2001) Organic meat and milk from ruminants. EAAP publication No. 106, Wageningen Academic Publishers, pp. 65-71.
Campbell, D. T. and Stanley, J. C. (1966). Experimental and quasi-experimental Designs for research. Rand McNally, Chicago. Quoted in: Feldman and Lynch (1988).
Campbell, D. T. and Fiske, D.W. (1959). Convergent and Discriminant validation of the multi-trait multi-method matrix, Psychological Bulletin, 56, pp. 81-105.
Chryssohoidis M.G and Krystallis A (2005). Organic consumers’ personal values research: Testing and Validating the list of values (LOV) scale and implementing a value-based segmentation task. Food Quality and Preference 16, 585-599.
Cohen, J. (1988). Statistical power analysis for the behavioural sciences. Hillsdale, NJ. Quoted in: Pallant (2001) SPSS Survival Manual: A step-by-step guide to data analysis using SPSS. Open University Press, Buckingham.
Conner, M. and Sparks, P. (1995). The Theory of Planned Behaviour and Health Behaviours, in Predicting Health Behaviour (Conner, M. and Norman, P. eds.). Buckingham: Open University Press.
Conner, M., and Sparks, P. (1996). The theory of planned behaviour and health behaviours. In M. Conner and Norman, P (Eds), Predicting health behaviour. Milton Keynes: Open University Press.
Conner, M., and Armitage, C. J. (1998). Extending the theory of planned behaviour: A review and avenues for further research. Journal of Applied Social Psychology, 28, 1429-1464.
Conner, M., Povey, R., Sparks, P., James, R. and Shephards, R. (2003). Moderating role of attitudinal ambivalence within the theory of planned behaviour. British Journal of Social Psychology, 42, pp.75–94
Davis, A., Titterington, A.J. and Cochrane, C. (1995). Who buys organic food? A profile of the purchasers of organic food in N. Ireland, British Food Journal, 97(10), pp. 17-23.
East, R. (1990). Changing Consumer Behaviour, Cassell, London.
East, R. (1993). Investment decisions and the theory of planned behaviour. Journal of Economic Psychology, 14 (2) p.337.
I n t e r n a t i o n a l J o u r n a l o f M a n a g e m e n t C a s e s
116
East, R., Harris, P., Wilson, G. and Hammond, K. (1995). Correlates of first-brand loyalty. Journal of Marketing Management, 11 (5) pp.487-497.
Eden-Harris, J (2006). Buying Organics: What’s the Buzz?, Source: http://www.naturalproductsmarketplace.com/articles/6c1online.html# accessed at 12/2/2007.
Ekelund, L. (1989). Vegetable consumption and consumer attitudes towards organically grown vegetables the case of Sweden, Acta Horticulturae, 259, pp. 163-72.
Engel, J.F., Blackwell, R.D., Miniard, P.W. (1995). Consumer Behaviour, Dryden, Fort Worth, TX.
Everitt, B. (1996). The Cambridge dictionary of statistics in the medical sciences, Cambridge, Cambridge University Press. In: Francis, J.J. et al. (2004) Constructing Questionnaires Based on The Theory of Planned Behaviour: A Manual for Health Service Researchers. Newcastle upon Tyne, Centre for Health Services Research University of Newcastle.
Fearne, A. and Lavelle, D. (1996). Segmenting the UK egg market: results of a survey of consumer attitudes and perceptions, British Food Journal, 98(1), pp. 7-12.
Feick, L.F., Herrmann, R.O., Warland, R.H. (1986). Search for nutrition information: a probit analysis of the use of different information sources, Journal of Consumer Affairs, 20 (2), pp.173-92.
Feldman, J. M. and Lynch, Jr. J. G. (1988). Self-generated validity and other effects of measurement on belief, attitude, intention, and behaviour. Journal of Applied Psychology, 73 (3) pp.421-435.
FIBL, (2004). The organic market in Switzerland and in the European Union, Fich, Switzerland.
Field, A. (2005). Discovering statistics using SPSS (2nd edition). Sage Publications Ltd, London.
Fillion, L and Arazi, S., (2002). Does organic food taste better? A claim substantial approach. Nutrition and Food Science, 32 (4), pp. 153-157.
Fishbein, M. (1963). An Investigation of the Relationships between Beliefs about an Object and Attitude toward That Object. Human Relations 16, pp.233-240.
Fishbein, M (1967). Readings in Attitude Theory and Measurement, New York, NY: Wiley.
Fishbein, M., Ajzen, I. (1975). Belief, Attitude, Attention and Behaviour: An Introduction to Theory and Research, Addison-Wesley, Reading, MA.
Fishbein M, Triandis H.C, Kanfer F. H., Middlestadt S. E, Eichler .A., (2001). Factoring influencing behaviour and behaviour change, In Handbook of Health Psychology By: Baum A, Revenson T A, Singer J E. Mahwah, N J, Lawrence Earlbaum Association.
Francis, J.J. et al. (2004). Constructing Questionnaires Based on The Theory of Planned Behaviour: A Manual for Health Service Researchers. Newcastle upon Tyne, Centre for Health Services Research University of Newcastle.
Gil, J. M., Gracia, A., and Sanchez, M. (2000). Market segmentation and willingness to pay for organic products in Spain. International Food and Agribusiness Management Review, 3, 207-226.
Godin, G., and Kok, G. (1996). The theory of planned behaviour: A review of its applications to health-related behaviours. American Journal of Health Promotion, 11, 87-98.
Govindasamy R., Italia J. (1999). Predicting Willingness-to-Pay a Premium for Organically Grown Fresh Produce, Journal of Food Distribution Research, 30: 44-53
Grunert, K. G (2003). How changes in consumer behaviour and retailing affect competence requirements for food producers and processors, ERS/USDA workshop, Washington, DC, 14 February.
Grunert, K. G., A. Baadsgaard, H. H. Larsen and T. K. Madsen (1996). Market orientation
in food and agriculture. Boston, Kluwer Academic.
Grunert, K. G., Bech-Larsen, T and Bredahl, L (2000). The issues in consumer quality perception and acceptance of dairy products, International Dairy Journal, 10 (8), pp. 575-84.
Grunert, C.S. and Juhl, J.H. (1995), Values, environmental attitudes and buying of organic foods, Journal of Economic Psychology, 6, pp. 39-62.

117
I n t e r n a t i o n a l J o u r n a l o f M a n a g e m e n t C a s e s
Grunert, K. G., Grunert, S. C., and Sorensen, E. (1995). Means-end chains and laddering: an inventory of problems and an agenda for research. MAPP Working paper no. 34.
Grunert, K. G., H. J. Juhl and C. S. Poulsen (2001). Perception de la qualité en alimantaire et rôle des labels. Revue Francaise du Marketing 183/184: 181-196.
Grunert, S.C. and Kristensen, K. (1995). Den danske forbruger og ùkologiske fùdevarer, Working Papers in Marketing, No. 1, Department of Marketing, Odense University, February.
Ha, C. L. (1998). The theory of reasoned action applied to brand loyalty. Journal of Product and Brand Management, 7(1) pp.51-61.
Haglund, A., Johannson, L., Berglund, L. and Dahlstedt, L. (1999). Sensory evaluation of carrots from ecological and conventional growing systems, Food Quality and Preference, 10 (2), pp. 23-9.
Hahn. A and von Lengerke T (1998). Evaluating a cholesterol screening: Risk appraisals, outcome expectancies, and self-efficacy beliefs as predictors of physical exercise and alcohol consumption. Institute of Educational Psychology, Humboldt-University of Berlin.
Hamm, U., Gronefeld, F., and Halpin, D. (2002). Analysis of the European market for organic food. Organic marketing initiatives and rural development, 1, Aberystwyth: School of Management and Business, University College of Wales.
Hofstede, G. (1980). Culture’s Consequences: International Differences in Work-Related Values, Sage Publications, Newbury Park and London.
Holt, G.C., (1993). Ecological eating”, food ideology and food choice. An analysis of the changing British diet with reference to the consumption of meat and organically produced food. PhD thesis, Bradford, University of Bradford.
Howard, J.A., Sheth, J.N. (1969). The Theory of Buyer Behaviour, John Wiley and Sons, New York, NY.
Huang, C.L. (1996). Consumer preferences and attitudes towards organically grown produce’, European Review of Agricultural Economics, 23, pp. 331-42.
Hughes, G.D. (1971). Attitude Measurement for Marketing Strategies, Scott Foresman, Glenview, IL.
Hutchins, R.K., Greenhalgh, L.A. (1997). Organic confusion: sustaining competitive advantage, British Food Journal 99(9): pp.336-338.
Jolly, D. (1991). Differences between buyers and non-buyers of organic produce and willingness to pay organic price premiums, Journal of Agribusiness, 9(1), pp. 97-111.
Jones A, (2001). Eating Oil: Food supply in a changing climate (Sustain, London and Elm Farm Research Centre, Newbury).
Jones, T. (2000). Food Fears: Consumer Attitudes to GM and Organic Food. Cardiff, Welsh Consumer Council.
Kaiser, H. (1970). A second generation Little Jiffy. Pschometrika, 35, pp.401-415. cited in: Pallant (2001).
Kalafatis P.S, Pollard M, East R Tsogas H. (1999). Green marketing and Ajzen’s theory of planned behaviour: across-market examination, Journal of Consumer Marketing, 16(5).
Kirk, J. Soffe, R. Hall, R. (2001). Attitudes and beliefs toward organic meat in the South West of England. In: Kyriazakis, I. and Zervas, G. (2001) Organic meat and milk from ruminants. EAAP publication No. 106, Wageningen Academic Publishers, pp. 65-71.
Krystallis A and Chryssohoidis M.G (2005). Consumers’ willingness to pay for organic food; Factors that affect it and variation per organic product type. British Food Journal, 107 (5), pp. 320-343.
La Trobe, H. (2002). Local Food, Local Directions (Friends of the Earth, London) labels.Revue Francaise du Marketing 183/184: 181-196.
Lampkin, N.H., 1990. Organic Farming. Farming Press, UK.
Latacz-Lohmann, U. and Foster, C. (1997). From niche to mainstream. Strategies for marketing organic food in Germany and the UK, British Food Journal, 99 (8), pp. 275-82.
Lebensmittelzeitung (2003). Streik wegen Bio-Milch. Lebensmittelzeitung, 37 (12.9.2003), 22.
I n t e r n a t i o n a l J o u r n a l o f M a n a g e m e n t C a s e s
118
Lee, C. and Green, R.T. (1991) Cross-cultural examination of the Fishbein behavioural intentions model, Journal of International Business Studies, 22 (2), pp. 289-305.
Lockie S, Lyons K, Lawrence G, Grice J (2004). Choosing organics: a path analysis of factors underlying the selection of organic food among, Australian consumers Appetite 43 (2004) 135–146.
Mathias, D. (1999). The Consumer and Organic Foods, pp.13-19, Cardiff, Welsh Consumer Council.
Mathisson, K. and Schollin, A. (1994) in Magnusson M K, and Arvola A (2001), Attitudes towards organic foods among Swedish consumers. British Food Journal, 103(3) 2001, pp. 209-226.
Mayfield, L., Holt, G., Tranter, R. (2001). Literature Review: National Comparison, Working paper DL1.O, Reading, University of Reading.
McCracken, G. (1986). Account of the structure and movement of the cultural meaning of consumer goods, Journal of Consumer Research, 13, June, pp. 71-84.
Morris, L., (1996). The Ethical Consumer: A new force in the food sector?, Market Intelligence Section, April.
Mowen, J.C. (1993). Consumer Behaviour. Macmillan, New York.
Murcott A (1989). Sociological and social anthropological approaches to food and eating. World Review of Nutrition and Dietetics 55, 1–40.
Norberg-Hodge H, Merrifield T, Gorelick S, 2000. Bringing The Food Economy Home: The social, ecological and economic benefits of local food (ISEC, Dartington).
Nunnally, J. O. (1978). Psychometric Theory. McGraw-Hill, New York. Quoted in: Pallant (2001).
Pallant, J. (2001). SPSS Survival Manual: A step-by-step guide to data analysis using SPSS. Open University Press, Buckingham.
Pearson, E. S. and Hartley, H. O. (1958). Biometrika tables for statisticians (2nd edition). Cambridge University Press, New York. Quoted in: Tabachnick, B. G. and Fidell, L. S. (1996) Using
multivariate statistics (3rd edition). HarperCollins, New York.
Pretty, J. (2001). Some Benefits and Drawbacks of Local Food Systems, briefing note for Processes, 50, 179-211 TVU/Sustain AgriFood Network, November 2, 2001.
Randall E and Sanjur D (1981). Food preferences - their conceptualization and relationship to consumption. Ecology of Food and Nutrition 11, 151–161.
Reicks, M., Splett, P. and Fishman, A. (1997). Shelf labelling of organic foods: effects on customer perceptions and sales, Working Paper No. 97-03, The Retail Food Industry Center, University of Minnesota, St Paul, MN.
Richardson, D.P. (1993). The role of the food industry in developing and communicating better nutrition, in Leathwood, P., Horisberger, M., James, W.P.T. (Eds),For a Better Nutrition in the 21st Century, Nestec Ltd, Switzerland.
Robinson, R (2002). Psychosocial and Demographic Variables Associated with Consumer Intention to Purchase Sustainably Produced Foods as Defined by the Food Alliance. Journal of Nutritional Educational Behaviour, 34, 316-325.
Roddy, G., Cowan, C.A. and Hutchinson, G. (1996). Consumer attitudes and behaviour to organic foods in Ireland, Journal of International Consumer Marketing, 9 (2), pp. 41-63.
Saltmarsh, N. (2004). Mapping the Food Supply Chain in the Broads and Rivers Area East Anglia Food Link, Watton.
Saltzer, E. (1981). Cognitive moderators of the relationship between behavioural intentions and behaviour, Journal of Personality and Social Psychology, 41, pp. 260-71.
Saunders, M, Lewis, P. and Thornhill, A. (2003). Research Methods for Business Students. (3rd edition) Prentice-Hall Financial Times, Harlow, London.
Schifferstein, H.N.J. and Oude Ophuis, P.A.M. (1998), Health-related determinants of organic food consumption in The Netherlands, Food Quality and Preference, 9 (3), pp. 119-33.
Scholderer, J., K. Brunsø, K. G. Grunert, C. S. Poulsen and J. Thøgersen (in press). On chickens

119
I n t e r n a t i o n a l J o u r n a l o f M a n a g e m e n t C a s e s
and eggs and organic foods: What constitutes a consumer trend?. Food Quality and Preference.
Shepherd R and Stockley L (1985). Fat consumption and attitudes towards food with a high fat content. Human Nutrition: Applied Nutrition 39A, 431–442.
Shepherd R (1999). Social determinants of food choice. Proceedings of the Nutrition Society (1999), 58, 807–812 807.
Shepherd R (editor) (1989). Factors influencing food preferences and choice. In Handbook of the Psychophysiology of Human Eating, pp. 3–24. Chichester, West Sussex: Wiley.
Shepherd, R., Dean, M., Arvola, A., Lahteenmaki, L., Saba, A. and Vassallo, M. (2005). Methods for eliciting consumer beliefs about fresh and processed organic foods. Paper presented at the Soil Association’s 17th Annual Conference ‘Organic farming, food quality and health’, Newcastle, 6-9 January 2005.
Shepherd, R., Magnusson, M. K. and Sjoden, P. O. (2005). Determinants of consumer behaviour related to organic foods. Ambio, 34, 252-359.
Silverstone, R. (1993). Organic farming: food for the future?, Nutrition and Food Science, 5, September/October, pp. 10-14.
Sirieix, L and Schaer, B (2005). Buying Organic Food in France: Shopping Habits and Trust. Proceedings of the 15th IFMA Congress, Sao Paulo, Brazil, 14-19th August.
Sloof, M., Tijskens, L.M.M. and Wilkinson, E.C. (1996). Concepts for modelling the quality of perishable products. Trends in Food Science and Technology 7:165-171.
Sparks, P.(1994). Attitudes towards food: applying, assessing and extending the `theory of planned behaviour’. In D. R. Rutter and L. Quine (Eds), Social psychology and health: European perspectives. (pp. 25-46). Aldershot: Avebury Press.
Sparks, P., Shepherd, R. (1992). Self Identity and the Theory of Planned Behaviour; Assessing the role of Identification with Green Consumerism. Social Psychology Quarterly 55 (4): pp.388- 399.
Tabachnick, B. G. and Fidell, L. S. (1996). Using multivariate statistics (3rd edition). HarperCollins, New York. Quoted in: Pallant, J. (2001) SPSS
Survival Manual: A step-by-step guide to data analysis using SPSS. Open University Press, Buckingham.
Tabachnick, B. G. and Fidell, L. S. (2001). Using multivariate statistics (4th edition). Allyn and Bacon, Needham Heights, MA.
Terry, D.J., Galligan, R.F. and Conway, V.J. (1993). The prediction of safe sex behaviour: the role of intentions, attitudes, norms and control beliefs, Psychology and Health, Vol. 8, pp. 355-68.
Thogersen, J. (1996). Recycling and morality: A critical review of the literature. Environment and Behavior, 28 (4), 536-558.
Thøgersen, J. (1999a). Making Ends Meet. A Synthesis of Research on Consumer Behavior and the Environment. Working paper 1. Aarhus, Danmark: the Department of marketing, Faculty of business administration, The Aarhus School of Business.
Thøgersen, J. (1999 b). Spillover processes in the development of a sustainable consumption pattern. Journal of Economic Psychology, 20, 53-81.
Thompson, G. D., and Kidwell, J. (1998). Explaining the Choice of Organic Produce: Cosmetic Defects, Prices and Consumer Preferences. American Journal of Agricultural Economics 80 (2), 277-287.
Torjusen, H., Sangstad, L., O’Doherty Jensen, K., Kjaernes, U. (2004). European Consumers’ Conceptions of Organic Food: A Review of Available Research, Professional Report No.4, Oslo, National Institute for Consumer Research: pp.69-70.
Trail, B. (1989). Prospects for the European Food System, Elsevier Applied Science, London.,
Treagar, A., Dent, J.B., McGregor, M.J. (1994). The Demand for Organically-grown Produce. British Food Journal 96 (4): pp. 21-25.
Triandis, H. C. and Marin, G. (1983).Distortions introduced by the use of bipolar scales in stereotype research. Journal of Social Psychology, 121, pp. 153-154.
Underhill S.E., Figueroa E.E. (1996). Consumer Preferences for Non-Conventionally Grown Produce. Journal of Food Distribution Research, 27: 56-66
I n t e r n a t i o n a l J o u r n a l o f M a n a g e m e n t C a s e s
120
Vallerand, R.J., Pelletier, L.G., Deshaies, P., Currier, J-P. and Mongeau. C. (1992), Ajzen and Fishbein theory of reasoned action as applied to moral behaviour: a confirmatory analysis, Journal of Personality and Social Psychology, 62 (1), pp. 98-109.
Van den Putte, B. (1991). 20 years of the theory of reasoned action of Fishbein and Ajzen: A meta-analysis. Unpublished manuscript, Source University of Amsterdam.
von Alvensleben, R. (1997). Consumer behaviour In Padberg, D., Ritson, C. and Albisu, L.(Eds), Agro-food Marketing, CAB International, Wallingford.
von Alvensleben, R. (1998). Ecological aspects of food demand: the case of organic food in Germany, AIR-CAT 4th Plenary Meeting: Health, Ecological and Safety Aspects in Food Choice, 4 (1), pp. 68-79.
von Alvensleben, R. and Altmann, M. (1987). Determinants of the demand for organic food in Germany, Acta Horticulturae, 202, pp. 235-43.
Walsh, B (1996). Food and the environment: A consumer’s perspective phase I. Hartman Group.
Walsh, B (1997). Food and the environment: A consumer’s perspective phase II. Hartman Group.
Wandel, M. and Bugge, A. (1997). Environmental concern in consumer evaluation of food quality. Food Quality and Preference, 8 (1), pp. 19-26.
Weaver R.D., Evans D.J., Luloff A.E. (1992). Pesticide use in tomato production: consumer concerns and willingness-to-pay, Agribusiness, 8:
131-142 West of England. In: Kyriazakis, I. and Zervas, G. (2001). Organic meat and milk from ruminants. EAAP publication No. 106, Wageningen Academic Publishers, pp. 65-71.
Wier, M and Mørch Andersen L. M, (2003). Consumer demand for organic foods – attitudes, values and purchasing behaviour , AKF - Institute of Local Government Studies, Denmark.
Wilkins, J.L. and Hillers, V.N. (1994). Influences of pesticide residue and environmental concerns on organic food preference among food cooperative members and non-members in Washington State, Journal of Nutrition Education, 26 (1), pp. 26-33.
Worner, F. and Meier-Ploeger, A. (1999). What the consumer says, Ecology and Farming, 20, January-April, pp. 14-15.
Zanoli, R. (1998). The economics and policy of organic farming: the state-of-the-art,
Proceedings of the 4th ENOF Workshop, Edinburgh, 25-26 June, pp. 57-68.
Zanoli, R., and Naspetti, S (2001). Consumer Motivations in the Purchase of Organic Food: A Means-End Approach. Proceedings of the 72nd Seminar, Chania, Crete, June, 411-415.
ZMP (2001). Einstellung und Käuferprofile bei Bio-Lebensmitteln. Bonn.
ZMP (2002). Wie viel Bio wollen die Deutschen? Bonn.
121
I n t e r n a t i o n a l J o u r n a l o f M a n a g e m e n t C a s e s
INFLUENCING FACTORS OF CONSUMERS’ PERCEPTION TOWARDS DELICATESSEN
DIFFERENTIATED BY CONSUMERS’ FAVOURITE SHOPPING LOCATIONS
HANNES WECHNERLEEDS METROPOLITAN UNIVERSITY, UK
HANS RÜDIGER KAUFMANNINTERCOLLEGE, CYPRUS
CLAUDIO VIGNALILEEDS METROPOLITAN UNIVERSITY, UK
Abstract:
Rapid changes in the global business environment mark their effects on consumer behaviour: the retailing concentration process of the last years will, according to Mintel (2003), continue and especially in Germany the multiples and the discounters created the equivalent of a competitive battlefield. The high discounter market share and the impressive development in recent years reflects the affinity of German consumers for shopping at the discounters. 98% of all purchasing households in Germany are shopping at the discounters on a regular basis (Sinick, 2005). Additionally, retailing experts agree on a continuing rise of the pre-packed products within the next few years (Liening, 2005; Lujan-Zilbermann, 2005). However, at the same time, delicatessen experience increasing popularity and, contradictory to previous consumer behaviour patterns, achieved a broader presence in the supermarket shelves (Wessel, 2005).
A review of contemporary literature in food perception models reveals that, although they have been constantly modified, they do not integrate the above mentioned structural changes in environmental framework conditions. The models of Streenkamp (1989) or Grunert et al (1996) do not differentiate by the various shopping patterns of consumers’, such as referring to multiples versus discounters.
This paper presents the research findings of a multivariate analysis of quantitative research data collected by questionnaires distributed
to consumers. Researching the differences of consumers’ perception towards delicatessen products within the two major retail channels, such as discounters and multiples, was the main focus. Due to its high level of competitiveness implying implying trendsetting repercussions for other markets the German market place was chosen as the research field. The consumer sample was drawn, using the proportionally stratified sampling technique (probability sampling) from a demographically balanced online panel of German consumers.
The rational for adopting a quantitative approach representing the second research stage can be explained by referring to Johnson and Onwuegbuzie (2004, p. 19) holding that “in a qualitative research study the researcher might want to qualitatively observe and interview, but supplement this with a closed ended instrument”. This approach could improve reliability and, if findings correspond across different approaches, referring to triangulation, then greater confidence can be achieved as to validity as well. In the case of conflicts the researcher has the possibility to adjust the conclusions for the provision of new knowledge. The quantitative analysis put emphasis on two research objectives. Firstly, they aimed to test and validate the qualitatively researched influencing factors of consumers’ perception by quantitative data. Secondly, confirmation or disconfirmation should be found for the hypothesis that consumers’ favourite shopping places, such as discounters and multiples, require a necessary

I n t e r n a t i o n a l J o u r n a l o f M a n a g e m e n t C a s e s
122
distinction for explaining consumers’ perception towards delicatessen products. The paper also provides strategic and operational marketing implications as to these two consumer segments.
Key words: delicatessen marketing; consumer perception; retailing
Background: Multiples vs. DiscountersThe food market in Germany is highly competitive and has an oligopolistic market structure. According to Gordon (1998, p.102) “concentration in modern retailing is the most striking feature, which is permanently increasing throughout Europe”. In the case of Germany, the top twenty retailers are accounting for 96,4% of the total revenue in the year 2002 (M+M Eurodata, 2003). This is the 6th highest market concentration throughout Europe (Mintel 2003). Consequently, the cut-throat competition between the retailers in gaining additional market share is worsening the general market environment for food products as well as delicatessen products.
The two major multiples Rewe and Edeka are heavily suffering from the irresistible boom of the German discounters. Although the Metro Group is the biggest retailer in Germany, Edeka and Rewe are both generating higher turnovers with food products. The most important multiples are (Universen 2004):
Tengelmann•
Metro•
Rewe•
Edeka•
Spar•
Markant•
The share of foreign multiples on the German retail field is still on a very low level. Along with Wal Mart also other well-know international retailers, like Kingfisher or Intermarche had to realize, that the German market due to its structure and the manifold restrictions is tough to penetrate (KPMG 2004).
Discounters are a specialized distribution line in retailing. They are focusing on offering permanently the lowest prices on the market. For that reason
they have an enormous narrow assortment with the highest turnover within the branch. Discounters are characterized through their highly efficient retailing processes and lowest cost structures (Sinick, 2005).
The discounters are the leaders in the distribution of food and fast moving consumer goods . The distribution channel discount was represented 37% of the entire food market in Germany in the year 2002 and is currently heading for a 40% market share (KPMG, 2004).
The following discounters are operating in Germany:
Aldi •
Lidl•
Penny being part of the Rewe group. •
Plus, the discount unit of Tengelmann.•
Netto, a discount-oriented unit of Spar.•
Norma•
The market share of the discounters and the impressive development in recent years shows the affinity of German consumers for shopping at the discounters. 98% of all purchasing households in Germany are shopping on a regular basis at the discounters (Sinick, 2005). According to GFK Panel Services Germany (2005) German consumers are the most price- oriented consumers throughout Europe. For 60% of the consumers the price has a higher importance than the product brand when shopping for consumer goods. Their potential in distributing delicatessen is tremendously high in the more than 13.200 discount outlets, but the influence on how the products are presented at the point of sale is low (Lebensmittelpraxis, 2004). Not only because of the fact that there is no deli counter at all, consequently only pre-packed versions of the products are available, but agencies assigned with the task are developing designs for packaging and appealing appearance as well. In the case of private label products they are creating the private label name. The ratio between branded articles and private labels is 56,1% to 43.9%, which means more private label than in any other distribution format in Germany (LZ 2004). With earnings estimated at around 2 per cent of sales, the group of discounters is not only Germany’s most successful and most consistently
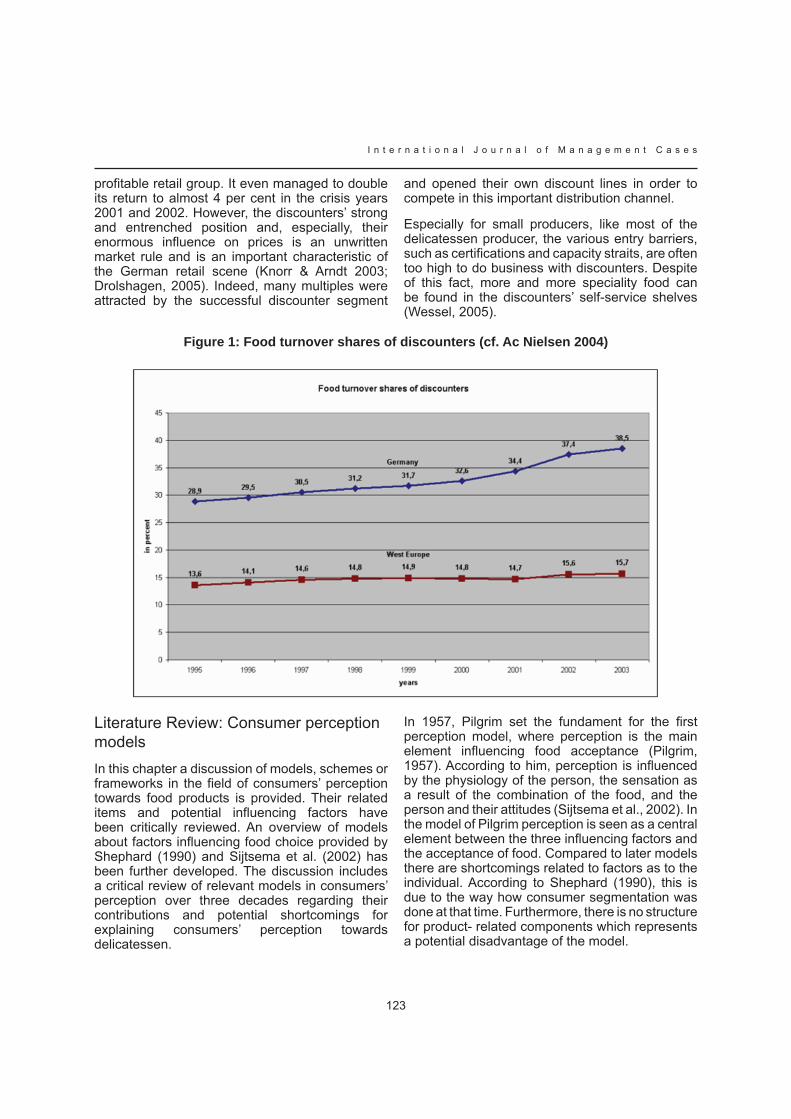
123
I n t e r n a t i o n a l J o u r n a l o f M a n a g e m e n t C a s e s
profitable retail group. It even managed to double its return to almost 4 per cent in the crisis years 2001 and 2002. However, the discounters’ strong and entrenched position and, especially, their enormous influence on prices is an unwritten market rule and is an important characteristic of the German retail scene (Knorr & Arndt 2003; Drolshagen, 2005). Indeed, many multiples were attracted by the successful discounter segment
and opened their own discount lines in order to compete in this important distribution channel.
Especially for small producers, like most of the delicatessen producer, the various entry barriers, such as certifications and capacity straits, are often too high to do business with discounters. Despite of this fact, more and more speciality food can be found in the discounters’ self-service shelves (Wessel, 2005).
Figure 1: Food turnover shares of discounters (cf. Ac Nielsen 2004)
Literature Review: Consumer perception models In this chapter a discussion of models, schemes or frameworks in the field of consumers’ perception towards food products is provided. Their related items and potential influencing factors have been critically reviewed. An overview of models about factors influencing food choice provided by Shephard (1990) and Sijtsema et al. (2002) has been further developed. The discussion includes a critical review of relevant models in consumers’ perception over three decades regarding their contributions and potential shortcomings for explaining consumers’ perception towards delicatessen.
In 1957, Pilgrim set the fundament for the first perception model, where perception is the main element influencing food acceptance (Pilgrim, 1957). According to him, perception is influenced by the physiology of the person, the sensation as a result of the combination of the food, and the person and their attitudes (Sijtsema et al., 2002). In the model of Pilgrim perception is seen as a central element between the three influencing factors and the acceptance of food. Compared to later models there are shortcomings related to factors as to the individual. According to Shephard (1990), this is due to the way how consumer segmentation was done at that time. Furthermore, there is no structure for product- related components which represents a potential disadvantage of the model.
I n t e r n a t i o n a l J o u r n a l o f M a n a g e m e n t C a s e s
124
Tolksdorf’s (1975) model of Dinner elicited the factors regarding the situation where and when the perception is taking place. This was examined for the case of dinners. The model lacks, due to its simplicity, a more detailed definition and explanation of components (Sijtsema et al., 2002).
The models of Randall & Sanjur (1981) and Kahn (1981) focused on influencing factors on food preferences. Randall & Sanjur (1981) pooled the potential factors into individual, food and environment. The independent variables were selected according to their frequency in which they were researched in past studies. Additionally, their potential link to food preference is considered. The selection of the variables reflect the major shortcoming in terms of little empirical support. In this context, Sijtsema et al. (2002) criticize that the allocation of variables into the three mentioned groups is vague. Whereas Kahn (1981) highlighted mainly variables related to the nutritional perspective when researching influencing factors on food preference. Although also results form other research fields are introduced it seems questionable to integrate them all in one study (Sijtsema et al., 2002). Furthermore, the model indicates relations between different groups of factors, however, on a general and superficial level.
Gains (1996) developed a scheme indicating factors which influence food choice. He underpins the importance for food marketers to have profound knowledge about consumers’ perceptions towards the product. Furthermore, it shows that any form of food related behaviour is dependent on the food itself, the consumer and the present context where the perception takes place. Interestingly, the element of context is defined as a separate influencing factor of consumers’ food choice. Sijtsema et al. (2002) regret that, compared to previous models, no additional information is provided about new factors influencing consumers’ food choice and that the variables need to be defined more precise for further use.
The model of Sijtsema et al. (2002) developed for providing indications for food product development can be criticised on the same issues as the model of Gains (1996). No new insides are given about new factors relevant for consumers’ perception towards food products. Although research results of several previous studies have been taken into consideration, empirical support of the factors of the model is not provided by Sijtsema et al. (2002).
The authors also indicate this critical point and suggest that further research needs to be done to provide insight as to how variables are influencing consumers’ perception towards food and as to what extent they could or could not be influenced during product development.
In literature also models focusing on the quality perception of food products (Steenkamp, 1989; Grunert et al 1996) are introduced but not discussed here in detail.
From the previous paragraph, it is deduced that each model for consumers’ food perception gives its own valuable contribution for modelling consumers’ perception towards delicatessen and research the respective influencing factors and relevant distinctions. However, an important differentiation is assumed to determine consumers’ perception towards delicatessen and is pointed out within this paper. For researching influencing factors on consumers’ perception towards delicatessen products the differences in consumers’ favourite shopping places, such as multiples and discounters, as the two major formats, have to be taken into account. Comparisons of the retail concepts of discounters and multiples result in an awareness of the profound and elementary distinctions (KPMG 2004, Sinick, 2005, Knorr & Arndt 2003; Drolshagen, 2005).
Research objectives:This paper presents the research findings of quantitatively conducted consumer survey in Germany.
In particular on the German market place a distinction between discounters and multiples is relevant, due to the fact that discounters have developed consumer coverage over 90% in recent years and are competing with the traditional multiples on equal terms (Twardawa, 2006, Sinick, 2005). It is supposed that these evolutions mark effects on influencing factors on consumers’ perception and are not sparing perceptions towards delicatessen. According to the above mentioned distinctions between the two major retail formats, multiples and discounters, it is proposed that specific determinants, such as favourite shopping place for delicatessen, are related to consumers’ perception towards delicatessen.
125
I n t e r n a t i o n a l J o u r n a l o f M a n a g e m e n t C a s e s
Methodology:This paper presents the methodology and results of the quantitative research stage of a PhD thesis. A foregoing qualitative research with a particular explorative character was utilized as fundament for the second quantitative stage discussed here (Wechner & Kaufmann, 2006).
As argued by several authors in the research methodology field (Mayer, 2002; Diekmann, 2002; Denz, 2005; Kirchhoff et al. 2001 ) the perfect research design does not exist and it is in fact a balancing of advantages and disadvantages linked to certain research designs. As claimed by Diekmann (2002), the research method survey is indispensable for researching opinions and attitudes. A study of Lebensmittelpraxis (2005) examining the role of processed-meat brands on German deli counters showed that online research is an adequate alternative for this kind of research situations. Shalofsky (1999) confirmed by Nancarrow et al (2001) summarises that “a possibility of conducting serious qualitative and quantitative research” was opened up. According to Niebrügge (2005) participants in an online interview situation are answering more freely, authentically and detailed because participants of face to face or telephone interviews tend to try finishing the questioning as fast as possible.
This refers especially to research contexts, like the present one which show low or none connection or links with internet usage. In other words, there is no plausible reason, that internet users have another attitude towards food than non internet users (Niebrügge, 2005).
The chosen sampling method within the randomized online panel is proportionally stratified sampling (probability sampling). With this sampling method the given sample population is broken down in different non overlapping sub groups using criteria such as age or sex. Subsequently, within these subgroups random sampling is used (Kröpfl et al, 1994). The advantage of this method is that for a big sample population the error interval of the probability is reduced compared to a random sample (Diekmann, 2002). Furthermore, the results are exactly, as requested, referring to the pre-defined subpopulations.
Two thousand consumers were invited to participate in the online survey about delicatessen marketing.
The questionnaire was designed for consumers to state their attitude towards different potential perception factors available at the point of sale and their attitudes about marketing and communication activities. The online survey was distributed at the beginning of June 2006 and ended on 26th of June, right before the typical summer holiday season in Germany, which could have been a potential source of distortion of results. 769 questionnaires, of the distributed 2000, were returned, yielding a response rate of 38,45%. Regarding non item responds no conspicuousness could be observed. Due to the relatively stable sample size, it was decided to clean missing values case wise instead of filling them up with mean values of the question battery.
Empirical results:An important distinction which was explored in the qualitative research stage was a differentiation between the shopping places discounters and multiples as the two major retail channels. For this purpose, two groups of consumers were formed. The first group of consumers indicated that they are always and mostly shopping for delicatessen in a discounter. Contrarily, the second group scored always and mostly for the multiples as their favourite shopping place for delicatessen products. Due to the results of the Kolmogorov- Smirnov test, p < 0,003 < α =0,05 , a Mann Whitney u- test was computed as recommended by Eckstein (2000). The values of the Mann Whitney u-test which are p < 0,05 are significantly different.
As can be seen from the results listed in the above table, there are significant differences between consumers’ shopping place preferences when looking at various influencing factors at the point of sale. The consumer perception index is significantly different measured from the consumers who are shopping mostly in discounter for delicatessen products in comparison to consumers who have multiples as their preferred shopping place for delicatessen products. Similarly, discounter shoppers’ views are different concerning the factor brand and price attitude, the factor appearance and convenience of deli counter, the factor self- service environment, the factor information on packaging and the factor authenticity as a representative of the cultural dimension.
I n t e r n a t i o n a l J o u r n a l o f M a n a g e m e n t C a s e s
126
Figure 2: Results of Kolmogorov-Smirnov and u-test for influencing factors
Figure 3: Results of Kolmogorov-Smirnov and u-test for determinates
In order to find broader confirmation for the differentiation between multiples or discounters as favourite shopping places an additional Kolmogorov-Smirnov and u-test was computed with the factors knowledge about delicatessen, expenditures on delicatessen and buying frequency. The results are presented in the following figure.
Summary and Conclusion:Clearly, there are significant differences between consumers who are shopping in multiples and consumers who are preferred shopping for delicatessen in discounters when referring to influencing factors of consumers’ perception towards delicatessen products. The distinction between multiples and discounter as favourite
shopping places for delicatessen is a crucial determination for the researched influencing factors on consumers’ perception towards delicatessen products.
Due to the different needs of delicatessen consumers who have their preferred shopping place either in discounters or in multiples, the results of the Mann Whitney u- test clearly shows the factors where these two consumer segments can be especially addressed with the same strategies, methods, instruments and activities and where not.
These differences offer valuable insights for marketing delicatessen and appropriate targeting of delicatessen consumers. In fact, activities can be adapted for the respective shopping places in
127
I n t e r n a t i o n a l J o u r n a l o f M a n a g e m e n t C a s e s
order to address the differences in perceptions factors. Summarizing, Figure 2 and Figure 3 depict the marketing factors which need to be adapted and which could remain unchanged.
EndnotesFast moving consumer goods (FMCG) are 1. defined as a product group with high levels of sale volumes which are sold within a short period of time, such as soap powder, CDs, cigarettes, packed food or toilet articles (Marketing Glossary, 2003)
References:AC Nielsen (2004): „Umsatzanteile der Discounter am Lebensmittelhandel.“ Lebensmittelzeitung, number 46. 12 November 04. p. 40.
Denz, Hermann (2005) Grundlagen einer empirischen Soziologie der Beitrag des quantitativen Ansatzes. Opladen Leske u. Budrich.
Diekmann, A. (2002) Empirische Sozialforschung Grundlagen, Methoden, Anwendungen. Rowohlt-Taschenbuch, Reinbek bei Hamburg
Drolshagen, H. (2005) “Aldi, der positive Preistreiber”, Lebensmittel Praxis, number 12, p.14.
Gains, N., Ed. (1996) The Repertory Grid Approach. Measurement of Food Preferences, Blackie Academic & Professional, London.
GFK Consumer panel Services Germany (2005): “Deutschland- in Europa angekommen”, Consumer Scan Total Grocery, February 2005-03-25
Gordon, A (1998) “Changes in food and drink consumption and the implications for food marketing”, OECD: The future of Food, Paris.
Grunert, K. et al. (1996) Market Orientation in Food and Agriculture, Norwell, Kluwer.
Johnson, B.;Onwuegbuzie, A. (2004) “Mixed Methods Research: A Research Paradigm Whose Time Has Come”, Educational Researcher, volume 33 ,number 7, pp. 14-26.
Kahn, M. (1981) “Evaluation of food selection patterns and preferences, CRC Crit. Rev.” Food Science Nutrition., pp. 129–153.
Kirchhoff, Sabine et al (2001) Fragebogen Datenbasis, Konstruktion, Auswertung. Münster.
Knorr, A., Arndt, A. (2003) “Why did Wal-Mart fail in Germany?”, Materialien des Wissenschaftsschwerpunktes Globalisierung der Weltwirtschaft, volume 24, University Bremen.
KPMG, EHI, (2004) Status Quo und Perspektiven im deutschen Lebensmittelhandel 2004.
Kröpfl, B. (1994) Angewandte Statistik eine Einführung für Wirtschaftswissenschaftler und Informatiker. Hanser, München.
Lebensmittelpraxis, (2004) Der deutsche Lebensmittelhandel 2004: Anzahl der Verkaufsstellen. Lebensmittelpraxis, number 6, 26th march.
Lebensmittelpraxis (2005) Markenbedeutung an der Wursttheke- Verbraucherstudien der Lebensmittel Praxis, Düsseldorf.
Liening, B. (2005) “Prepacking mit System- SB Ware für die Bedienungstheke” I Lebensmittel Praxis, number 6, pp.70-73.
Lujan-Zilbermann, J. (2005) “Taking advantage of consumers’ purchases”, Meat International, volume 15, number 4, pp. 18-21.
M+M Eurodata (2003) [Online] Available from : http://www.mm-eurodata.de/ [15 February 2004]
Mayer, H. (2002) Interview und schriftliche Befragung . Entwicklung, Durchführung und Auswertung, Oldenbourg, München.
Marketing Glossary (2003) American Marketing Association [Online] http://www.marketingpower.com/mg-dictionaryF.php [30.11.03]
Mintel (2003) Food Retailing UK- November 2003. Mintel International Group Limited.
Nancarrow, C. et al (2001) “A new research medium, new research populations and seven deadly sins for the Internet researchers”, Qualiatative market research: An international journal, volume 4, number 3, pp.136-149.
Niebrügge, S. (2005) Datenerhebungsmethoden Online, [Online] Available http://v2.innofact.de/index.php?id=224 [20.05.06]
I n t e r n a t i o n a l J o u r n a l o f M a n a g e m e n t C a s e s
128
Pilgrim, F. (1957) “The components of food acceptance and their measurement.” Am. J. Clin. Nutrit. Number 5, pp. 171–175.
Randall, E. and Sanjur D. (1981) “Food preferences - their conceptualization and relationship to consumption.” Ecol. Food Nutrition, number 11, pp.151–161.
Shalofsky, I. (1999) “Quality and ethics in market and social research”, in Mc Donald, C. and Vangelder, P., ESOMAR Handbook of market and opinion research ,ESOMAR.
Sijtsema et al. (2002) „Variables Influencing Food Perception Reviewed for Consumer-Oriented Product Development”, Critical Reviews in Food Science and Nutrition, 42(6) pp. 565–581
Sinick, E. (2005) “Discounter sind nicht nur billlig”, LP International, volume 11, pp.14-15.
Shepherd, R. (1990) “Overview of factors influencing food choice”, Why We Eat What We Eat. Ashwell, M., The British Nutrition Foundation Nutrition Bulletin. 15(Suppl.) 1: 12–30.
Steenkamp, J. (1989) Product Quality, Van Gorcum, Assen.
Twardawa, W (2006) GfK – Vom “Wollen” und “Walten” der Konsumenten. [Online] Available http://www.servicebarometer.de/kundenmonitor/bestpractice/gfk.php [2.12.06]
Universen (2004) Daten zum Handel in Deutschland [Online] Available from : http://www.acnielsen.de/site/documents/Universen_2004.pdf [30.08.04]
Wechner, H., Kaufmann, H. (2006) “Consumers’ Perceptions of Delicatessen”. In: The 3rd International Customer Behavior and Retailing Research Conference, 21st -22nd April 2006, University of Zagreb, Croatia.
Wessel, A. (2005) “Aldi Süd versetzt Fleischbranche in Aufregung”, Lebensmittelzeitung, volume 23, 10.06.05, p.24.
129
I n t e r n a t i o n a l J o u r n a l o f M a n a g e m e n t C a s e s
BEHAVIOURAL AND NON-BEHAVIOURAL MODELS FOR CUSTOMER SATISFACTION
MEASURE
GABRIELLA MAZZULLADEPARTMENT OF TERRITORIAL PLANNING, UNIVERSITY OF CALABRIA, ITALY
LAURA EBOLIDEPARTMENT OF TERRITORIAL PLANNING, UNIVERSITY OF CALABRIA, ITALY
Abstract
The aim of the research is the exploration of some models for measuring customer satisfaction in public transport. These models can be identified in behavioural and non-behavioural models; non-behavioural models are descriptive models in which no hypothesis on user behaviour is advanced, while behavioural models try to reproduce the workings of the user mind making their choices. Different types of data can be used for the model parameter estimation; for non-behavioural models the user judgements about service in terms of rating are used, while for behavioural models a conjoint analysis of the user choices is made.
In order to calibrate some of these models, a sample survey was conducted to University of Calabria students. The campus is attended by approximately 32,000 students and 2,000 members of staff. Interviews were directed to a sample of 510 students. Respondents were asked to provide information about their trip habits regarding getting to the university and about public transport service quality. The user gave some information about 16 service quality attributes, by expressing a rate of importance and a rate of satisfaction on each attribute, on a scale from 1 to 10. In addition, an SP experiment (Stated Preferences) was proposed to the sample, in which the user compared his RP (Revealed Preferences) context with some SP contexts in order to make a choice. In this way, it has been possible to consider some hypothetical contexts not available for the users at the time of the survey.
Some linear regression models were calibrated by using only the satisfaction rates expressed by the sample on the 16 service quality attributes.
The dependent variable is represented by global customer satisfaction and the independent variables are the service quality attributes.
Some structural equation models were calibrated by using the rates expressed on the same 16 service quality attributes. Specifically, the latent variables represent the unobserved and unmeasured factors; the observed variables represent the service quality indicators used for measuring customer satisfaction in public transport.
Finally, some behavioural Logit models were specified and calibrated by using the data collected in the SP experiment. The utility function of the alternatives is a linear combination of 9 service quality attributes. The utility of each alternative is an index of service quality (SQI) of each bus package and the parameter values are the attribute weights.
By regression and structural equation models we obtained a measure of correlation between service quality attributes and global satisfaction. In this way, we can identify the attributes more convenient to improve, which are the strongly correlated with the global satisfaction. Therefore, an increase of satisfaction of these attributes produces an increase in terms of global satisfaction.
On the other hand, by Logit models we obtained an indication of the importance assigned by users to each service quality attributes on the basis of the user choices. Therefore, we can quantify the improvement of service quality as a consequence of an improvement of the service quality attributes.
Key words: customer satisfaction, behavioural and non-behavioural models, public transport.

I n t e r n a t i o n a l J o u r n a l o f M a n a g e m e n t C a s e s
130
IntroductionNowadays customer satisfaction is at the centre of marketing interest, and companies have gradually focused on service quality and customer satisfaction. This strategy is very profitable for both companies and customers. For this reason, the development of methods for analysing and forecasting customer satisfaction is really necessary; these methods allow service quality attributes importance and influence on customer behaviour to be established, critical aspects of the supplied services to be identified and service quality to be increased.
In the literature there are many techniques of statistical analysis for determining the impact of the attributes on global service quality and customer satisfaction, based on the statements of a sample of passengers. They express an opinion by ranking or rating some service quality attributes. For a more detailed discussion of these techniques one should refer to Akan (Akan, 1995), Berger et alii (Berger et alii, 1993), Bhave (Bhave, 2002), Cuomo (Cuomo, 2000), Hartikainen et alii (Hartikainen et alii, 2004), Hill (Hill, 2000; Hill, 2003), Kano et alii (Kano et alii, 1984), and Parasuraman et alii (Parasuraman et alii, 1988).
Other methods are based on the estimation of coefficients by modelling. The models relate global service quality (dependent variable) to service quality attributes (independent variables). The models can be identified in non-behavioural models, like multiple regression models and structural equation models (Fabbris, 1997; Bollen, 1989), and behavioural models, like Multinomial (MNL) Logit models. For a more detailed discussion of Logit models one should refer to refer to Ben-Akiva and Lerman (Ben-Akiva e Lermann, 1985), Cascetta (Cascetta, 2001; Cascetta, 2006), and Ortùzar and Willumsen (1994).
The aim of this research is the exploration of different types of models for measuring customer satisfaction and service quality in public transport, by using data collected from a sample survey conducted to University of Calabria students who reach the campus by urban bus. In particular, some non-behavioural and behavioural models were calibrated.
The models for measuring customer satisfactionIn order to measure customer satisfaction and service quality some models can be used. These models can be identified in behavioural and non-behavioural models; non-behavioural models are descriptive models in which no hypothesis on user behaviour is advanced, while behavioural models try to reproduce the workings of the user mind making their choices. Different types of data can be used for the model parameter estimation; for non-behavioural models the user judgements about service in terms of rating are used, while for behavioural models a conjoint analysis of the user choices is made.
Examples of non-behavioural models more appropriate for measuring customer satisfaction are regression linear models and structural equation models.
In the regression models the dependent variable is represented by global customer satisfaction and the independent variables are the service quality attributes. By means of these models the weights of every attributes on global customer satisfaction can be calculated (Parasuraman et alii, 1988; Parasuraman et alii, 1991; Danaher and Mattsson, 1994; Rust et alii, 1994; Danaher, 1997).
The structural equation models permit the exploration of the relationship between global customer satisfaction and service quality attributes. A generic structural equation model is divided into two sub-models: the first one, named “latent variable sub-model”, describes the relationship between endogenous and exogenous latent variables; the second one, named “measurement sub-model”, describes the relationship between latent and observed variables. Specifically, the latent variables represent the unobserved and unmeasured factors; the observed variables represent the service quality indicators used for measuring customer satisfaction in public transport. Structural Equation Modelling (SEM) was adopted in several fields of research and generalized by Joreskog and Wiley (Joreskog, 1973; Wiley, 1973). Some applications were proposed in several fields of research (MacCallum and Austin, 2000; Muthén et alii, 2006; Mitchell, 1992; Grace and Pugesek, 1997; MacLean and Gray, 1998; Eskildsen and Dahlgaard, 2000; Boari, 2000; Manaresi et alii, 2000). Also in public transport some authors proposed SEM applications
131
I n t e r n a t i o n a l J o u r n a l o f M a n a g e m e n t C a s e s
(Bamberg and Schmidt, 1998; Fillone et alii, 2005; Tam et alii, 2005). Specifically, there are also some applications for describing customer satisfaction (Andreassen, 1995; Stuart et alii, 2000; Karlaftis et alii, 2001).
More recently, also behavioural models have been used for measuring service quality, like discrete choice Logit models, based on random utility theory; in these models each alternative is a bus package characterized by some service quality attributes. Some Logit models were proposed by Hensher (Prioni and Hensher, 2000; Hensher, 2001; Hensher and Prioni, 2002; Hensher et alii, 2003).
The surveyThe survey conducted as a support to this research was addressed to the students of the University of Calabria, sited in the urban area of Cosenza, in the South of Italy. It is attended by approximately 32,000 students and 2,000 members of staff. At the present time, the University is served by bus services which connect the urban area with the campus; extra-urban bus services connect the campus with the other towns of Calabria. A single transit agency manages the urban bus lines; the service is available from 7.30 to 00.30; service frequency is 1 run every 60 minutes. In a working day, about 8,800 students travel by urban bus and 1,200 by extra-urban bus to reach the campus. In this study, only the urban transport service is analysed. Interviews were conducted in February 2006 and directed to a sample of 510 students who live in the urban area and habitually use the bus to reach the campus. Therefore, the sampling rate is approximately equal to 5.8%.
Respondents were asked to provide information about their trip habits regarding getting to the University and, in addition, about public transport service quality. The interview is divided into four sections. In the first and second section some information about socioeconomic characteristics
(gender, age, income, and so on), faculty, and travel habits was elicited. In the third section the user gave some information about 16 service quality attributes. The users expressed a rate of importance and a rate of satisfaction on each attribute, on a scale from 1 to 10; in addition, a rate on global service in terms of both expected and perceived quality was requested. In the last section an SP experiment was proposed to the sample. In the experiment each user described his current bus service and compared it with some SP contexts in order to make a choice. In this way, it has been possible to consider some hypothetical contexts not available for the users at the time of the survey (Pearmain et alii, 1991; Louviere et alii, 2000). The SP alternatives are defined by only 9 attributes varying on two levels producing different alternatives, i.e. bus packages (figure 1). Only three alternatives were proposed to users.
The full factorial design consists of 29 combinations; we restricted the number of treatments to 50 representing the SP choice alternatives. These alternatives were coupled in order to produce 32 different couplings. Each SP experiment is composed by the alternative representing the current bus service and one SP couple. To some users two SP experiments were proposed. The attribute weights were estimated according to the user choices. An example of SP experiment is shown in figure 2.
A statistical-descriptive analysis of the sample was carried out. 80% of the sample is “in course” students and 20% is “out course” students. The sample is spread over 47% male and 53% female respondents. 49% of the student sample was between 21 and 24 years old; 41% was between 18 and 20 years old; the other students (10%) were over 24 years old. In figure 3 the sample sharing according to faculty (a) and family income (b) is shown.
85% of the sample has a driving license, but 90% does not have the car in the place of domicile.

I n t e r n a t i o n a l J o u r n a l o f M a n a g e m e n t C a s e s
132
Figure 1. Service quality attributes and levels
Figure 2. Example of an SP experiment proposed to the interviewed
Figure 3. Sample sharing according to faculty (a) and income (b)
133
I n t e r n a t i o n a l J o u r n a l o f M a n a g e m e n t C a s e s
By analysing the rates of satisfaction stated by users, it turns out that the global transport service is more than satisfactory (average rate 6.41). However, the passengers are not satisfied enough with some service quality attributes, like bus overcrowding (4.29), availability of furniture (shelter and benches) at bus stops (4.41), promotion of service by phone, mail, internet, etc. (4.83), information at bus stops (5.03), environmental protection by use of ecological vehicles (5.11), administration of complaints (5.43), bus stops maintenance (5.45), service frequency (5.71). On the other hand, the passengers are more satisfied with the following service quality attributes: availability of bus stop near home (8.33), personal security against crimes on buses (7.71), safety on board (7.00), route characteristics (number of bus stops, distance between bus stops, etc.) (6.75), reliability of buses that come on schedule (6.47), helpfulness of personnel (6.43), cleanliness of interior, seats and windows (6.24), ticket cost affordability (6.07).
Non-behavioural models
Regression models
Some regression models were calibrated by using the rates of satisfaction stated by sample. The models were calibrated by using the SPSS package (SPSS Inc., 1987). A stepwise regression analysis brought to a final model with only 12 attributes, as reported in table 1.
As expected, all parameters of the attributes included in the final model have a positive sign because each of them concurs to increase the overall customer satisfaction. The attributes with a major weight on global satisfaction are “BusStopAvailability” (0.139) and “Frequency” (0.139). The goodness-of-fit tests are satisfactory in terms of R square corrected (0.980), Standard error (0.915), and F-Fisher (1962.48).
Structural equation models
SEM methodology is an appropriate statistical approach for describing the specific phenomenon of customer satisfaction (MacLean and Gray, 1998; Golob, 2003).
By considering the results of an Exploratory Factor Analysis (EFA), implemented in the form of
Principal Component Analysis, 4 exogenous latent variables were identified (Eboli and Mazzulla, 2006b). These variables are the unobserved service quality aspects that can be explained by the 16 attributes (observed variables).
With SEM, each latent variable is linked to one or more attributes, as specified below. The first variable, named “Service planning and reliability”, related to the factors “Frequency”, “Reliability”, “Information”, “Promotion”, “Personnel”, and “Complaints”. The second variable, named “Safety and Cleanliness”, related to the factors “Cleanliness”, “SafetyOnBoard”, and “PersonalSecurity”. The third variable, named “Comfort and other factors”, related to the factors “BusStopFurniture”, “Overcrowding”, “Cost”, “EnvironmentalProtection”, and “BusStopMaintenance”. The fourth variable, named “Network Design”, related to “BusStopAvailability” and “RouteCharacteristics”.
The latent variable model relates the 4 exogenous latent variables to an endogenous latent variable, named “Satisfaction”; besides, the exogenous variables are correlated among them, via a regression-type relationship. The measurement model relates each latent variable to the variable that measures customer satisfaction. Specifically, we supposed that the exogenous latent variables are measured by the 16 service quality attributes (in terms of rates of satisfaction) and the latent variable “Satisfaction” is measured by the indicators “Perceptions” and “Expectations”, in terms of perceived and expected quality rate on global service.
By effecting some preparatory calibrations, the latent variable “Safety and Cleanliness” had a negative sign and was not statistically significant. Therefore, this last variable was not considered in the model structure. The final structure of the model is shown in figure 4.
The final model results are shown in tables 2 and 3. All parameters have a correct sign and assume a value statistically different from zero, at a good level of significance. Only one parameter is less statistically significant than the others (level of significance of 8.3%).
The minimum value of the discrepancy function is 370.312; this value is statistically significant according to the chi-squared test.

I n t e r n a t i o n a l J o u r n a l o f M a n a g e m e n t C a s e s
134
Table 1. Regression model results
Figure 4. General structure of the final model
Table 2. Structural equation model results

135
I n t e r n a t i o n a l J o u r n a l o f M a n a g e m e n t C a s e s
Table 2. Structural equation model results
Table 3. Structural equation model goodness-of-fit indexes
The tests on the goodness of fit are quite satisfactory; the best one can obtain with GFI, AGFI and CFI is unit. The value of RMR and RMSEA must be as low as possible. For a more detailed discussion on the indexes one should refer to Arbuckle and Bollen (Arbuckle and Wothke, 1995; Bollen, 1989).
The latent variable with a major effect on global customer satisfaction is “Service planning and reliability”, which have a coefficient value of 0.618 (standardized weight). The “Network Design” and the “Comfort and other factors” latent variables have considerable impacts, even if lower than the previous (0.231 and 0.234, respectively).
The loading factors of the observed variables can be used for identifying the attributes to be adopted as the best indicators of the unmeasured latent variables. In this specific case, the results obtained show that the “RouteCharacteristics” observed variable has a major impact on the “Network Design” exogenous latent variable (0.657); similarly, the “Complaints” factor has a major impact on the “Service planning and reliability” latent variable (0.627), even if all the other factors have a considerable weight; finally, the “BusStopMaintenance” factor has a major impact on the “Comfort and other factor” latent variable (0.657).
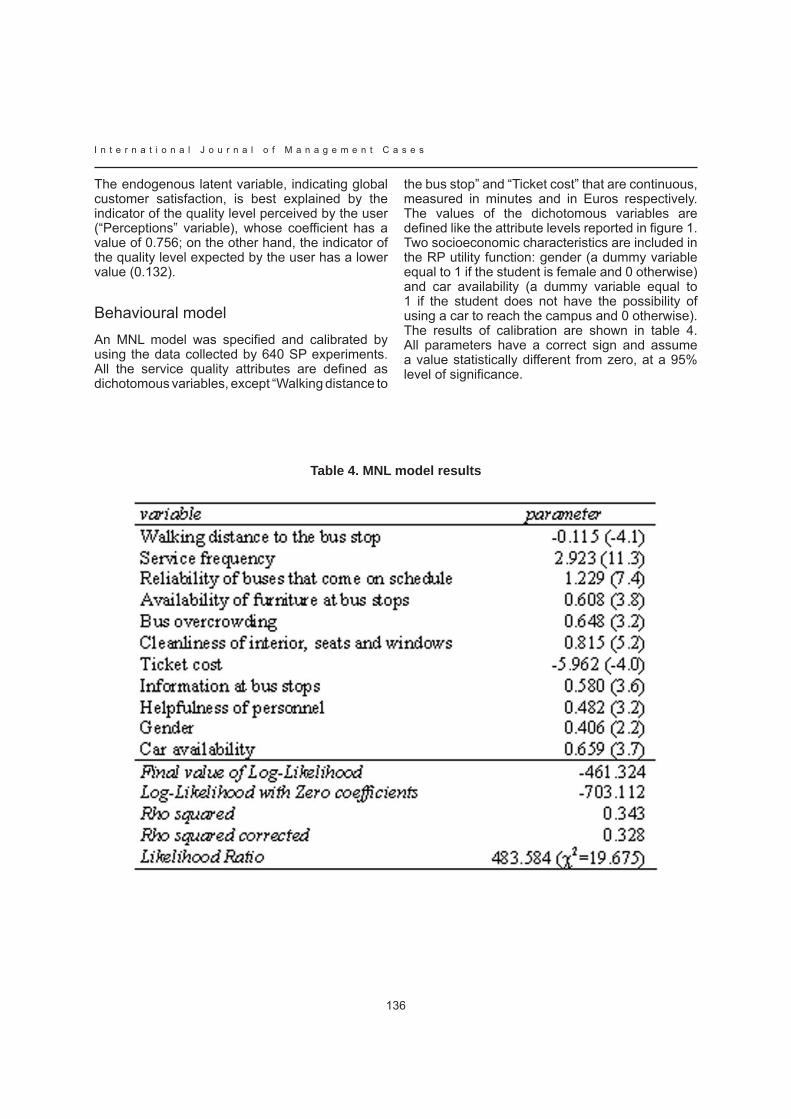
I n t e r n a t i o n a l J o u r n a l o f M a n a g e m e n t C a s e s
136
The endogenous latent variable, indicating global customer satisfaction, is best explained by the indicator of the quality level perceived by the user (“Perceptions” variable), whose coefficient has a value of 0.756; on the other hand, the indicator of the quality level expected by the user has a lower value (0.132).
Behavioural modelAn MNL model was specified and calibrated by using the data collected by 640 SP experiments. All the service quality attributes are defined as dichotomous variables, except “Walking distance to
the bus stop” and “Ticket cost” that are continuous, measured in minutes and in Euros respectively. The values of the dichotomous variables are defined like the attribute levels reported in figure 1. Two socioeconomic characteristics are included in the RP utility function: gender (a dummy variable equal to 1 if the student is female and 0 otherwise) and car availability (a dummy variable equal to 1 if the student does not have the possibility of using a car to reach the campus and 0 otherwise). The results of calibration are shown in table 4. All parameters have a correct sign and assume a value statistically different from zero, at a 95% level of significance.
Table 4. MNL model results
137
I n t e r n a t i o n a l J o u r n a l o f M a n a g e m e n t C a s e s
As expected, “Walking distance to the bus stop” and “Ticket cost” assume a negative sign because an increase of fare and distance from the bus stop involves a decrease of utility. All the other parameters have a positive sign. The model verifies the statistical tests on the goodness-of-fit. Rho-squared is equal to 0.343; the LR statistics is widely higher than critical value with 11 d.o.f. (Eboli and Mazzulla, 2006a). Service frequency is the attribute with the higher weight on global service quality, short of the attributes with a negative parameter. The parameter of the variable “Ticket cost” has a high value because the sample is composed by students with a middle or lower-middle family income. Other important attributes are the reliability, the cleanliness and the bus stop facilities. A simultaneous improvement of the three attributes is comparable to an improvement in terms of frequency.
ConclusionsIn this research different tools for measuring public transport service quality are provided. Behavioural and non-behavioural models have been introduced. The models offer empirical findings and practical implications and can be used for investing in some attributes in order to improve public transport services.
By regression and structural equation models we obtained a measure of correlation between service quality attributes and global satisfaction. In this way, we can identify the attributes more convenient to improve, which are the strongly correlated with the global satisfaction. Therefore, an increase of satisfaction of these attributes produces an increase in terms of global satisfaction.
On the other hand, by Logit models we obtained an indication of the importance assigned by users to each service quality attributes on the basis of the user choices. As introduced by Hensher, the utility of each alternative is an index of service quality (SQI) of each bus package and the values of the parameters are the attribute weights. Therefore, we can quantify the improvement of service quality as a consequence of an improvement of the service quality attributes. SQI is useful to planners and transit operators for measuring the importance of service quality attributes. Of course,
it is more convenient to operate on the attributes with a major weight.
ReferencesAkan, P. (1995) Dimensions of service quality: a study in Instanbul Managing Service Quality Vol. 5 Issue 6 pp. 39-43.
Andreassen, T. W. (1995) (Dis)satisfaction with public services: the case of public transportation Journal of Services Marketing Vol. 9 pp. 30-41.
Arbuckle, J. L. & Wothke, W. (1995) AMOS 4.0 User’s Guide Chicago: SmallWaters Corporation.
Bamberg, S. & Schmidt, P. (1998) Changing Travel-Mode Choice as Rational Choice: Results from a Longitudinal Intervention Study Rationality and Society Vol. 10 Issue 2 pp. 223-252.
Ben-Akiva, M. E. & Lerman, S. R. (1985) Dicrete Choice Analysis: Theory and Application to Travel Demand Cambridge: The MIT Press.
Berger, C., Blauth, R., Boger, D., Bolster, C., Burchill, G., DuMouchel, W., Pouliot, F., Richter, R., Rubinoff, A., Shen, D., Timko, M. & Walden, D. (1993) Kano’s methods for understanding customer-defined quality The Center for Quality Management Journal Vol. 2 Issue 4.
Bhave, A. (2002) Customer Satisfaction Measurement Quality & Productivity Journal.
Boari, G. (2000) Uno sguardo ai modelli per la costruzione di indicatori nazionali di Customer Satisfaction In: AA.VV. Valutazione della qualità e customer satisfaction: il ruolo della statistica. Milano: Vita e Pensiero pp. 317-336.
Bollen, K. A. (1989) Structural Equations with Latent Variables New York: John Wiley & Sons Inc.
Cascetta, E. (2001) Transportation Systems Engineering: Theory and Methods Dordrecht: Kluwer Academic Publishers.
Cascetta, E. (2006) Modelli per i sistemi di trasporto. Teoria e applicazioni Torino: UTET.
I n t e r n a t i o n a l J o u r n a l o f M a n a g e m e n t C a s e s
138
Cuomo, M. T. (2000) La customer satisfaction. Vantaggio competitivo e creazione di valore Padova: CEDAM.
Danaher, P. J. (1997) Using Conjoint Analysis to Determine the Relative Importance of Service Attributes Measured in Customer Satisfaction Surveys Journal of Retailing Vol. 73 Issue 2 pp. 235-260.
Danaher, P. & Mattsson, J. (1994) Customer Satisfaction during the Service Delivery Process European Journal of Marketing Vol. 28 Issue 5 pp. 5-16.
Eboli, L. & Mazzulla, G. (2006a) A multinomial logit model for service quality measurement Proceedings of 11th Meeting of the EURO Working Group on Transportation “Advances in Traffic and Transportation System Analysis”, The Local Organising Committee, Bari, pp. 30-37.
Eboli, L. & Mazzulla, G. (2006b) Un modello ad equazioni strutturali per la misurazione della customer satisfaction per i servizi di trasporto collettivo Trasporti&Territorio Vol. 4.
Eskildsen, J. K. & Dahlgaard, J. J. (2000) A causal model for employee satisfaction Total Quality Management Vol. 11 Issue 8 pp. 1081-1094.
Fabbris, L. (1997) Statistica multivariata. Analisi esplorativa dei dati Milano: McGraw-Hill Libri Italia.
Fillone, A. M., Montalbo C. M. & Tiglao, N. C. (2005) Assessing Urban Travel: a Structural Equations Modeling (SEM) Approach Proceedings of the Eastern Asia Society for Transportation Studies Vol. 5 pp. 1050-1064.
Golob, T.F. (2003). Structural Equation Modeling. In Transportation systems planning, ed. K.G. Goulias, 11:1-23. Boca Raton: CRC Press.
Grace, J. B. & Pugesek, B. H. (1997) A structural equation Model of Plant Species Richness and its Application to a Coastal Wetland The American Naturalist Vol. 149 Issue 3.
Hartikainen, M., Salonen, E.P. & Turunen, M. (2004) Subjective Evaluation of Spoken Dialogue Systems Using SERVQUAL Method ICSLP pp. 2273-2276.
Hensher, D. A. & Prioni, P. (2002) A service quality index for a area-wide contract performance
assessment regime Journal of Transport Economics and Policy Vol. 36 Issue 1 pp. 93-113.
Hensher, D. A. (2001) Service quality as a package: what does it mean to heterogeneous consumers? 9th World Conference on Transport Research, Seoul, Korea, 22-27 July 2001.
Hensher, D. A., Stopper, P. & Bullock, P. (2003) Service quality-developing a service quality index in the provision of commercial bus contracts Transportation Research Part A Vol. 37 pp. 499-517.
Hill, N. (2000) Handbook of Customer Satisfaction and Loyalty Measurement Hampshire: Gower Publishing.
Hill, N. (2003) How to Measure Customer Satisfaction Hampshire: Gower Publishing.
Joreskog, K.G. (1973) Analysis of covariance structures In: Krishnaiah, P.R. (Ed.), Multivariate Analysis-III. New York: Academic Press pp. 263-285.
Kano, N., Seraku, N., Takahashi, F. & Tsjui, S. (1984) Attractive quality and must-be quality Hinshitsu, Vol. 14 Issue 2 pp. 147-56.
Karlaftis, M. G., Golias, J. & Papadimitriou, E. (2001) Transit Quality as an Integrated Traffic Management Strategy: Measuring Perceived Service Journal of Public Transportation Vol. 4 Issue 1.
Louviere, J., Hensher, D. A. & Swait, J. D. (2000) Stated Choice Methods. Analysis and Application Cambridge: Cambridge University Press.
MacCallum, R. C. & Austin, J. T. (2000) Applications of Structural Equation Modeling in Psychological Research Annual Review of Psychology Vol. 51 pp. 201-226.
MacLean, S. & Gray, K. (1998) Structural Equation Modelling in Market Research Journal of the Australian Market Research Society.
Manaresi, A., Marzocchi, G. & Tassinari, G. (2000) La soddisfazione del cliente dei servizi di segreteria universitaria: un modello a equazioni strutturali In: AA.VV. Valutazione della qualità e customer satisfaction: il ruolo della statistica. Milano: Vita e Pensiero pp. 291-316.

139
I n t e r n a t i o n a l J o u r n a l o f M a n a g e m e n t C a s e s
Mitchell, R. J. (1992) Testing evolutionary and ecological hypotheses using path analysis and structural equation modelling Functional Ecology Vol. 6 pp. 123-129.
Muthén, B., Kaplan, D. & Hollis, M. (2006) On structural equation modeling with data that are not missing completely at random Psychometrika Vol. 52 Issue 3 pp. 431-462. Ortùzar, J. de D. & Willumsen, L. G., (1994) Modelling Transport New York: John Wiley and Sons.
Parasuraman, A., Zeithaml, V. A. & Berry, L. L. (1988) Servqual: a multiple item scale for measuring consumer perceptions of service quality Journal of Retailing Vol. 64 Issue 1 pp. 12-40.
Parasuraman, A., Zeithaml, V. A. & Berry, L. L. (1991) Refinement and Reassessment of the SERVQUAL Scale Journal of Retailing Vol. 67 Issue 4 pp. 420-449.
Pearmain, D., Swanson, J., Bradley, M. & Kroes, E. (1991) Stated Preference Techniques: A Guide to Practice Second Edition, Steer Davies Gleave and Hague Consulting Group.
Prioni, P. & Hensher, D. A. (2000) Measuring service quality in scheduled bus services Journal of Public Transport Vol. 3 Issue 2 pp. 51-74.
Rust, R. T., Zahorik, A. J. & Keiningham, T. L. (1994) Return on Qua1ity Chicago, Probus Publishing.
SPSS Inc. 1983. SPSS User’s manual, New York: McGraw-Hill.
Stuart, K. R., Mednick, M. & Bockman, J. (2000) Structural equation model of customer satisfaction for the New York City subway system Transportation Research Record Vol. 1735 pp. 133-137.
Tam, Mei Ling, Tam, Mei Lang & Lam W. H. K. (2005) Analysis of Airport Access Mode Choice: a Case Study in Hong Kong Journal of the Eastern Asia Society for Transportation Studies Vol. 6 pp. 708-723.
Wiley, D. E. (1973) The identification problem for structural equation models with unmeasured variables In: Goldberger, A. S., Ducan, O. D. (Eds.), Structural Equation Models in the Social Sciences. Seminar Press, New York pp. 69-83.
I n t e r n a t i o n a l J o u r n a l o f M a n a g e m e n t C a s e s
140
PUBLIC SERVICE CUSTOMER BEHAVIOUR COMPARISON BETWEEN TWO REGIONS:
CALABRIA (I) AND SATAKUNTA (FIN)
ANTONELLA REITANODEPARTMENT OF MANAGEMENT, UNIVERSITY OF CALABRIA, ITALY
ANGELO BRUTTODEPARTMENT OF MANAGEMENT, UNIVERSITY OF CALABRIA, ITALY
ALESSANDRO CALDERONEDEPARTMENT OF MANAGEMENT, UNIVERSITY OF CALABRIA, ITALY
ANTONINO MORANODEPARTMENT OF MANAGEMENT, UNIVERSITY OF CALABRIA, ITALY
Abstract
This research starts from a sentence Gino Zappa said more than 50 years ago about public administration, and its purpose is verifying if what then said is still acceptable: we are going to study post-purchase customer behaviour. In order to get a more complete study, this research also includes a comparative analysis of some surveys taken in two regions, one in Italy and one in Finland.
Keywords: customer satisfaction, customer behaviour, public services.
The research“In public companies, due to their large and, not often, well choose organic, responsibilities, especially economic ones, do not always match a proper degree of competence and authority skill. Public management is always under the control of the political power, which often becomes a sort of political intrusion, not particularly useful to the economic development of these companies. So productive public companies frequently show incapability to fulfill their specific purposes, a very slow and heavy bureaucracy and unsatisfactory economic outputs” .
So Gino Zappa, more than 50 years ago, stressed the inefficiency of the Italian public companies and was indicating the main reasons.
As a result, this research means to verify if these conditions keep on being effective today too, affecting the levels of the customer satisfaction; more specifically it means to study the customer behaviour after the purchase of public services.
The research methodologyThe research methodology consists of an accurate bibliography studying, followed by an on-field survey supported by a question-form . The purpose was to examine a high number of services, but it was not possible to deepen the analysis of their features: that is why the SERVQUAL model was not applied, as the research is about a general valuation of the quality perceived by the customers, whereas it means to focus its attention on customers reactions when they face an unacceptable level of customer satisfaction. As a result a specific question-form was issued; it included both multiple choice questions, based on Lickert’s scale , and open questions, for a better perception of any different reasons and reactions of unsatisfied customers.
The analyzed sample was composed of 100 Italian citizens, who were asked to judge the services offered by some Italian public companies, and of 100 Finnish citizens, who, of course, were asked to do the same with some Finnish companies.
The services that were considered are those which the average Italian and Finnish citizen uses more frequently: municipal services; mail services; public

141
I n t e r n a t i o n a l J o u r n a l o f M a n a g e m e n t C a s e s
and private televisions; railway services; airplane services; public transportation by bus; roads and highways; public education; public health service. In addiction, for a better result, both the age and the profession/job of the interviewed citizen were object of the survey. Finally, the customer behaviour was analyzed as far as the kind and the reason of the reactions were concerned.
Customer satisfaction and post-purchase customer behaviour
Customer satisfaction
Customer satisfaction is a perceptive concept that develops after a transaction and an experience linked to the use of a certain product by a customer. It comes from the perceived difference between the performance expectations and the performance perceptions, as they rise from the use experience.
Public services have a lot of specific features: they can not be either touched or stored, or transported, they are produced and consumed simultaneously; they also show a very high-degree contact with the customer, which makes the judgment about their quality particularly difficult ; they develop specific operations, which are unique, since they deal with inter-personal relationships. Due to all such features, service quality level control means the satisfaction control gotten by the customers of the public companies .
Being a service “intangible”, a quality check on the service considered as a “product” is therefore impossible with scientific or objective measurements, such as weight or dimensions. In addiction, the service transitory features prevent their storing (and consequently a direct check of their quality), since every service happens in real time and the customer is a part of the productive system as an additional production resource: this implies the need to fix the limits of reliability of the answers according to the frequency of use of services. So it must not be underestimated that they develop a sort of “forced” relationships due to the monopolistic position of many a public company; consequently, the feedback tends to modify, even retroactively, the performance expectations , and so the satisfaction.
Finally, unlike a product, that is strongly marked by its extrinsic technical quality (which is undoubtedly visible and comparable), a service implies a quality comparison that refers to another service, chosen as “quality model” . In the course of this research, such a quality model is given by the public services offered in Finland, which is a country internationally recognized as having top-quality standards.
Perceiving a quality service
There are at least two different quality aspects that are perceived by the customer of a service and that are at the base of what synthetically (even in the question-form included in this study) is called “satisfaction”.
The first aspect can be considered as the “technical quality of the result”; it is the more “material” part of the service and it refers to the practical satisfaction of the need at the base of the service request.
The second feature is defined as “process functional quality”, and it is the most intangible and unique part as it represents the way with which the quality is actually transferred, and consequently it can not be objectively valued .
Some researchers have proposed a model that considers a value as an algebraic operation, that subtracts the net costs to pay from the benefits expected thanks to the transaction . It must also be outlined that the value perception is the ratio between the value of use recognized to the service/product and the cost needed to achieve such value of use . However, it must be specified that the monopolistic feature of many public companies represents an obvious incremental factor for the value of use; and also inefficiency and poor skill of employees are at the base of a lot of disadvantages suffered by the customers of the public companies which, in turns, represent real costs for the latter.
Another definition describes the measurable value of a product offered to a customer to solve specific needs in a specific situation .
This shows a sharp separation between the two dimensions of the value: a subjective reality, which rises as a result of the specific use, and objective reality, which comes from the comparison among different products and services in competitive markets .

I n t e r n a t i o n a l J o u r n a l o f M a n a g e m e n t C a s e s
142
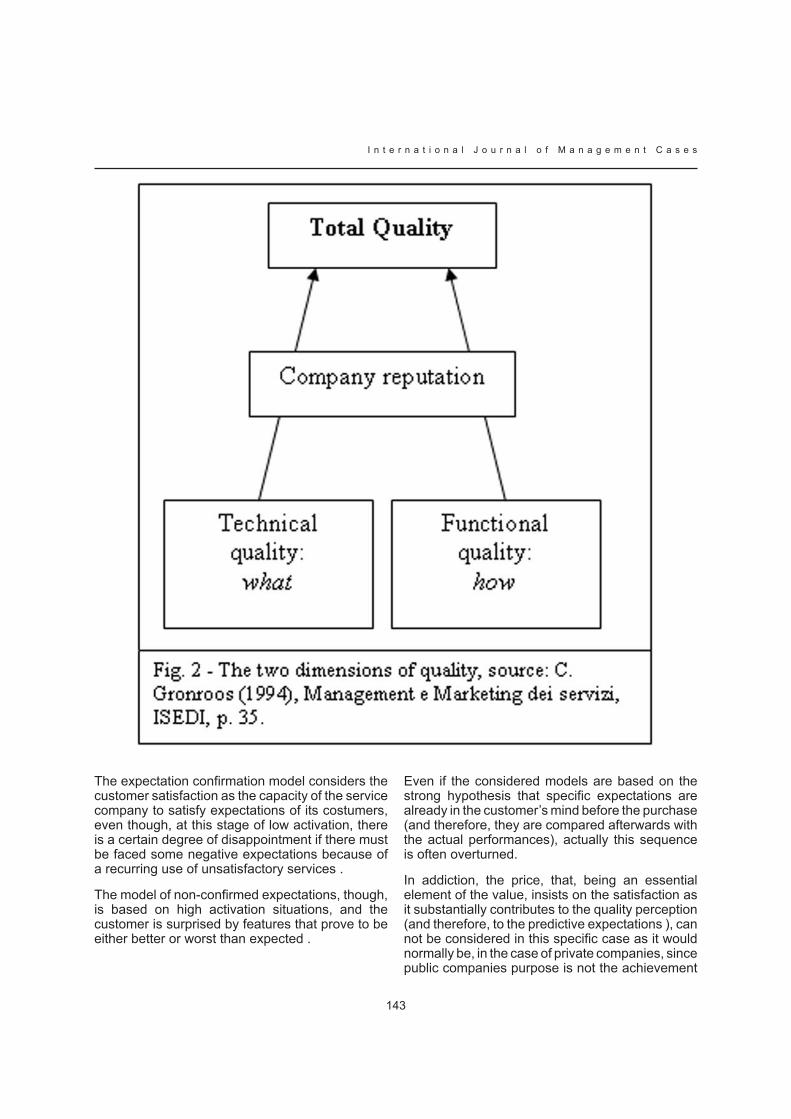
143
I n t e r n a t i o n a l J o u r n a l o f M a n a g e m e n t C a s e s
The expectation confirmation model considers the customer satisfaction as the capacity of the service company to satisfy expectations of its costumers, even though, at this stage of low activation, there is a certain degree of disappointment if there must be faced some negative expectations because of a recurring use of unsatisfactory services .
The model of non-confirmed expectations, though, is based on high activation situations, and the customer is surprised by features that prove to be either better or worst than expected .
Even if the considered models are based on the strong hypothesis that specific expectations are already in the customer’s mind before the purchase (and therefore, they are compared afterwards with the actual performances), actually this sequence is often overturned.
In addiction, the price, that, being an essential element of the value, insists on the satisfaction as it substantially contributes to the quality perception (and therefore, to the predictive expectations ), can not be considered in this specific case as it would normally be, in the case of private companies, since public companies purpose is not the achievement

I n t e r n a t i o n a l J o u r n a l o f M a n a g e m e n t C a s e s
144
of a gain; so the price is an instrument that is used in a different way if compared to the use of private companies, which modifies the perceptions of the customer satisfaction.
Post-purchase behaviour
The dissatisfactions may therefore create two different kinds of reactions among customers, which can be synthetically defined as exit and voice . The first one refers to the hypothesis of either an alternative to the unsatisfactory service that customers try to get, if possible, by asking for it to someone else, or to their decision to boycott it. The second one refers to the customers’ complaint in all its forms. On the other hand, the most satisfactory services have a much higher fidelity degree, and both feedbacks and voice-spreading are positive.
In the course of the current research, the question-forms showed two different categories of complaints, which in the following are indicated as “complaint” and “protest” .
Even though they both belong to the “voice” category, there are some basic differences which explain the need of a further classification.
“Complaint” implies a sort of “voice” reaction meant to modify an unsatisfactory situation, by contributing with suggestions or constructive
critics, as it happens when one fills up a feedback question-form or writes a complaint letter.
On the other hand, the term “protest” refers to a vocal action, once again towards those who supply a service, but it does not mean to change an uneasiness situation, either because it can not do that, or because the customer is convinced that his complaint will not be considered. In these cases, the will to continue the action becomes feeble and the customer does not go on with it.
Despite the very high number of unsatisfactory situations related to public services, consumers very rarely complain; as a matter of fact, they do absolutely nothing. Moreover, there does not seem to exist any links between the dissatisfaction degree and the chance of complaint. Therefore, dissatisfaction is a necessary condition, but, on its own, it is not sufficient to start the complaint .
The complaint management by service suppliers is an important feature. Customers will complain about the unsatisfactory level of the service they got only if they are aware that who is going to listen is actually capable to listen to them. On the contrary, the conviction that the complaint will not be considered, or that it will not help improve the service offer, reduces the customer tendency to complain directly to the company, but it increases the chance of a negative publicity which will be erased in a very difficult way.
The survey results

145
I n t e r n a t i o n a l J o u r n a l o f M a n a g e m e n t C a s e s

I n t e r n a t i o n a l J o u r n a l o f M a n a g e m e n t C a s e s
146
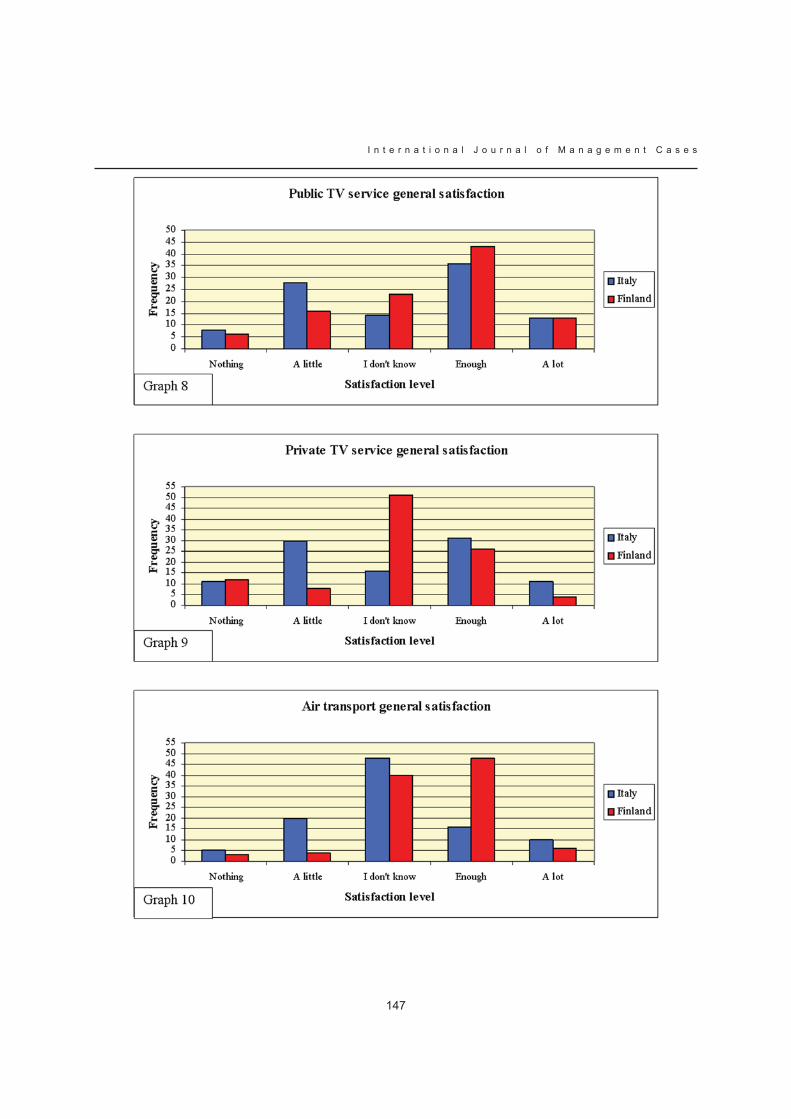
147
I n t e r n a t i o n a l J o u r n a l o f M a n a g e m e n t C a s e s

I n t e r n a t i o n a l J o u r n a l o f M a n a g e m e n t C a s e s
148

149
I n t e r n a t i o n a l J o u r n a l o f M a n a g e m e n t C a s e s
The first graph shows the general frequency of use of the services considered in this study; it outlines the differences between Italy and Finland. The trend is similar in the two countries. The first differences, though, come out in the second graph, where the different degree of general satisfaction: the Italian situation shows a Gaussian function which tops at the level “A little”, whereas the Finnish situation is marked by a growing function which culminates at the level “Enough”. It must be noted that this trend is common to almost all the graphs related to the satisfaction level.
The peak of the Finnish satisfaction function at the level “Enough” is due to two main factors: the first one is linked to the high expectation about the service quality, the second one is connected to the fact that there are no comparison terms that may fit. As a matter of fact, the survey has shown that those Finnish citizens that have answered “A lot” refer to the same service that they happened to use abroad.
The services that show such a trend are: municipal services (graph 3), mail services (graph 5), public education (graph 6), public health service (graph
7), air transport (graph 10), railway transport (graph 11), public transport by bus (graph 12). More specifically, the greatest difference between the satisfaction level of the two countries is related to the hospital services (graph 7). In addiction, it must be outlined that, despite the high satisfaction degree for the air transport (graph 10) and the public transport by bus (graph 12), several Finish people complain about the expensive price of the ticket. On the other hand, the Tax services (graph 4) and the public TV services (graph 8) have a rather similar trend.
Graph 13, though, shows a different trend: the satisfaction trend is decreasing for Italy, whereas it follows a Gaussian shape which tops at the medium average value.
Italy boasts a positive exit about private TV (graph 9), but this is not due to the contain of the TV program, but to the complete dubbing into the Italian language of the productions coming from the foreign countries, whereas in Finland such productions are broadcast respecting the original version, with subtitles in Finnish.

I n t e r n a t i o n a l J o u r n a l o f M a n a g e m e n t C a s e s
150

151
I n t e r n a t i o n a l J o u r n a l o f M a n a g e m e n t C a s e s
A comparison between graph 14 and graph 15 shows how in Italy people aged 36 to 50 are those that declare to be more satisfied, whereas in Finland this top-level of satisfaction is shown by people younger than 25.
Graph 16 shows the dissatisfaction reasons. In both countries the main reason is given by the low quality level as it is perceived by the
customer, even if in Italy this feature is much more widespread. Once again, the Finnish complaints about the expensive prices of the services must not be forgotten.
It is also interesting to notice how the dissatisfaction reasons reported in Italy are twice as much than those recorded in Finland.

I n t e r n a t i o n a l J o u r n a l o f M a n a g e m e n t C a s e s
152
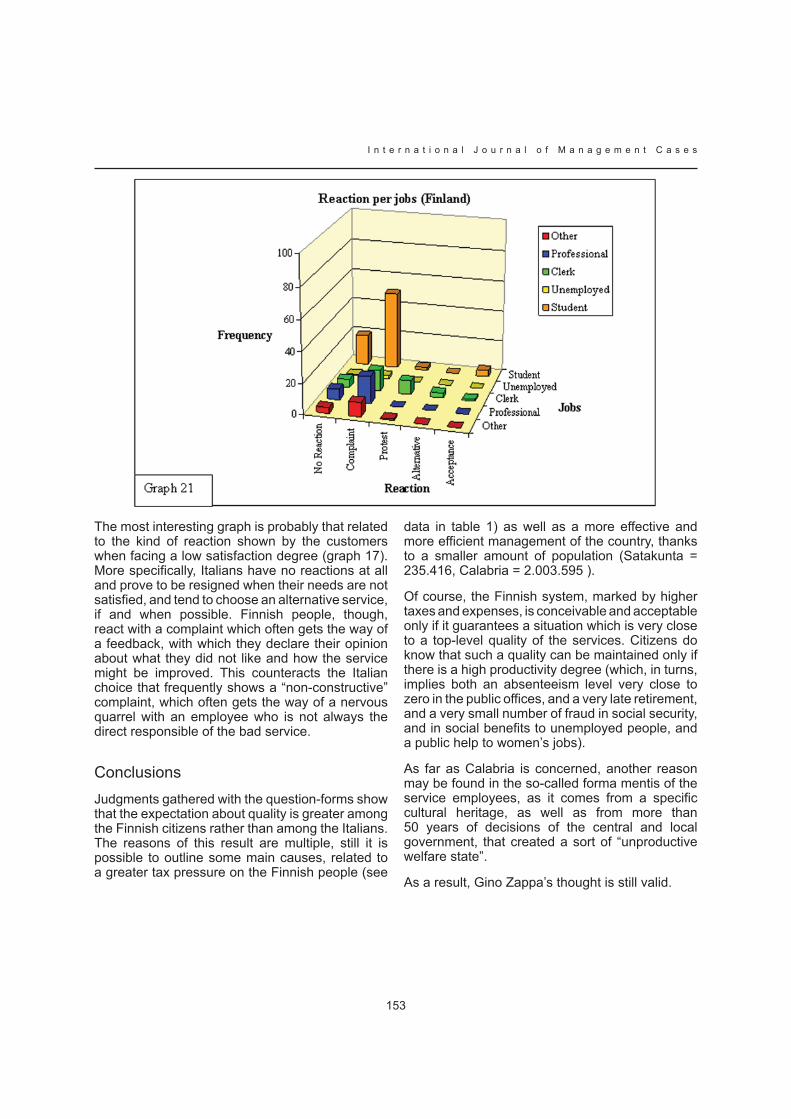
153
I n t e r n a t i o n a l J o u r n a l o f M a n a g e m e n t C a s e s
The most interesting graph is probably that related to the kind of reaction shown by the customers when facing a low satisfaction degree (graph 17). More specifically, Italians have no reactions at all and prove to be resigned when their needs are not satisfied, and tend to choose an alternative service, if and when possible. Finnish people, though, react with a complaint which often gets the way of a feedback, with which they declare their opinion about what they did not like and how the service might be improved. This counteracts the Italian choice that frequently shows a “non-constructive” complaint, which often gets the way of a nervous quarrel with an employee who is not always the direct responsible of the bad service.
ConclusionsJudgments gathered with the question-forms show that the expectation about quality is greater among the Finnish citizens rather than among the Italians. The reasons of this result are multiple, still it is possible to outline some main causes, related to a greater tax pressure on the Finnish people (see
data in table 1) as well as a more effective and more efficient management of the country, thanks to a smaller amount of population (Satakunta = 235.416, Calabria = 2.003.595 ).
Of course, the Finnish system, marked by higher taxes and expenses, is conceivable and acceptable only if it guarantees a situation which is very close to a top-level quality of the services. Citizens do know that such a quality can be maintained only if there is a high productivity degree (which, in turns, implies both an absenteeism level very close to zero in the public offices, and a very late retirement, and a very small number of fraud in social security, and in social benefits to unemployed people, and a public help to women’s jobs).
As far as Calabria is concerned, another reason may be found in the so-called forma mentis of the service employees, as it comes from a specific cultural heritage, as well as from more than 50 years of decisions of the central and local government, that created a sort of “unproductive welfare state”.
As a result, Gino Zappa’s thought is still valid.
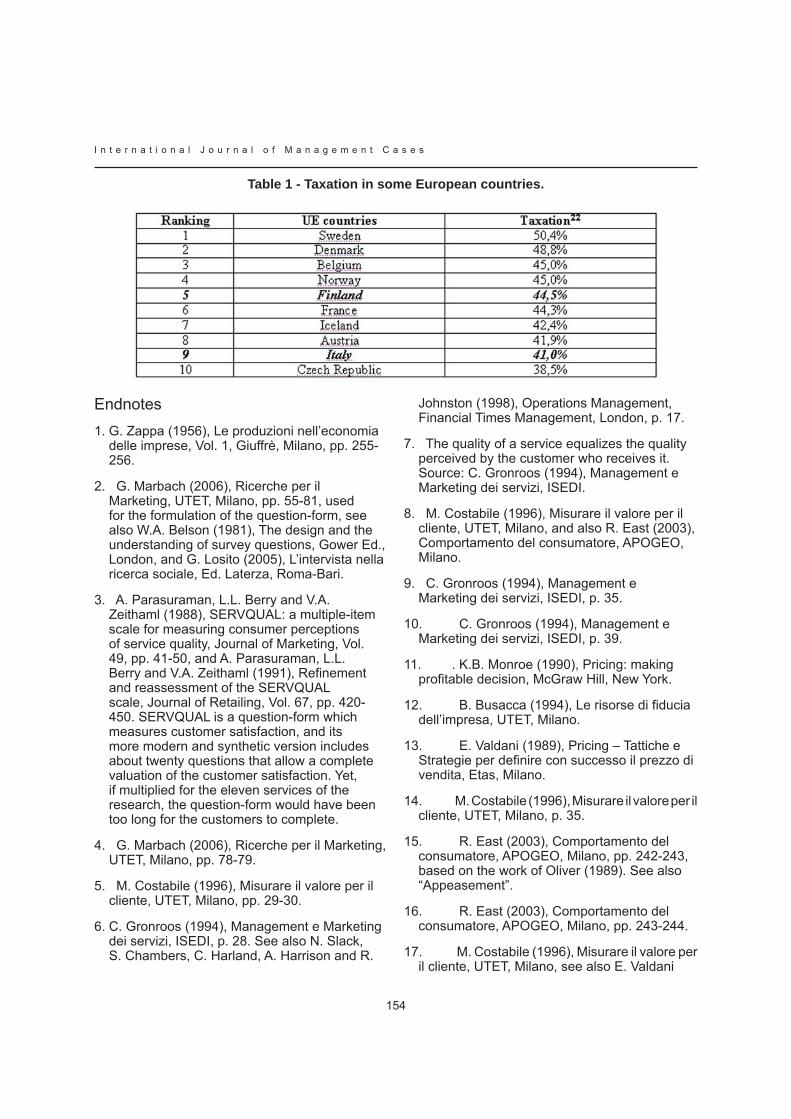
I n t e r n a t i o n a l J o u r n a l o f M a n a g e m e n t C a s e s
154
Table 1 - Taxation in some European countries.
EndnotesG. Zappa (1956), Le produzioni nell’economia 1. delle imprese, Vol. 1, Giuffrè, Milano, pp. 255-256.
G. Marbach (2006), Ricerche per il 2. Marketing, UTET, Milano, pp. 55-81, used for the formulation of the question-form, see also W.A. Belson (1981), The design and the understanding of survey questions, Gower Ed., London, and G. Losito (2005), L’intervista nella ricerca sociale, Ed. Laterza, Roma-Bari.
A. Parasuraman, L.L. Berry and V.A. 3. Zeithaml (1988), SERVQUAL: a multiple-item scale for measuring consumer perceptions of service quality, Journal of Marketing, Vol. 49, pp. 41-50, and A. Parasuraman, L.L. Berry and V.A. Zeithaml (1991), Refinement and reassessment of the SERVQUAL scale, Journal of Retailing, Vol. 67, pp. 420-450. SERVQUAL is a question-form which measures customer satisfaction, and its more modern and synthetic version includes about twenty questions that allow a complete valuation of the customer satisfaction. Yet, if multiplied for the eleven services of the research, the question-form would have been too long for the customers to complete.
G. Marbach (2006), Ricerche per il Marketing, 4. UTET, Milano, pp. 78-79.
M. Costabile (1996), Misurare il valore per il 5. cliente, UTET, Milano, pp. 29-30.
C. Gronroos (1994), Management e Marketing 6. dei servizi, ISEDI, p. 28. See also N. Slack, S. Chambers, C. Harland, A. Harrison and R.
Johnston (1998), Operations Management, Financial Times Management, London, p. 17.
The quality of a service equalizes the quality 7. perceived by the customer who receives it. Source: C. Gronroos (1994), Management e Marketing dei servizi, ISEDI.
M. Costabile (1996), Misurare il valore per il 8. cliente, UTET, Milano, and also R. East (2003), Comportamento del consumatore, APOGEO, Milano.
C. Gronroos (1994), Management e 9. Marketing dei servizi, ISEDI, p. 35.
C. Gronroos (1994), Management e 10. Marketing dei servizi, ISEDI, p. 39.
. K.B. Monroe (1990), Pricing: making 11. profitable decision, McGraw Hill, New York.
B. Busacca (1994), Le risorse di fiducia 12. dell’impresa, UTET, Milano.
E. Valdani (1989), Pricing – Tattiche e 13. Strategie per definire con successo il prezzo di vendita, Etas, Milano.
M. Costabile (1996), Misurare il valore per il 14. cliente, UTET, Milano, p. 35.
R. East (2003), Comportamento del 15. consumatore, APOGEO, Milano, pp. 242-243, based on the work of Oliver (1989). See also “Appeasement”.
R. East (2003), Comportamento del 16. consumatore, APOGEO, Milano, pp. 243-244.
M. Costabile (1996), Misurare il valore per 17. il cliente, UTET, Milano, see also E. Valdani
155
I n t e r n a t i o n a l J o u r n a l o f M a n a g e m e n t C a s e s
(1989), Pricing – Tattiche e Strategie per definire con successo il prezzo di vendita, Etas, Milano.
A. Hirschman (1970), Voice, exit and loyalty: 18. Responses to Decline in firms, Organisations and States, Harvard University Press, Cambridge.
. J.E.G. Bateson and K. Douglas Hoffmann 19. (2000), Gestire il marketing dei servizi, APOGEO, Milano, p. 270 present a complaint classification similar to the one considered in this study. Complaints are considered as instrumental and non-instrumental. According to these authors the first ones are those meant to modify a situation of dissatisfaction, whereas the second ones are issued when the customer does not expect any changes of the unsatisfactory situation. This approach, which keeps being valid, misses the specific dimension of the repetitiveness of the services use. A commuter, that writes a complaint letter to the transport company in which he complaints about a delay happened in the previous days, does know that he can not change the unsatisfactory situation that took already place, but he hopes that his complaint might improve the situation future-wise.
R. East (2003), Comportamento del 20. consumatore, APOGEO, Milano.
. Wikipedia, Calabria, Satakunta, http://www.21. wikipedia.org/ [accessed 01/02/2007].
Data coming from OCSE October 2006 (% 22. taxation on GIP 2005)
BibliographyBateson J.E.G. and Douglas Hoffmann K. (2000), Gestire il marketing dei servizi, APOGEO, Milano.
Belson W.A. (1981), The design and the understanding of survey questions, Gower Ed., London.
Busacca B. (1994), Le risorse di fiducia dell’impresa, UTET, Milano.
Costabile M. (1996), Misurare il valore per il cliente, UTET, Milano.
East R. (2003), Comportamento del consumatore, APOGEO, Milano.
Gronroos G. (1994), Management e Marketing dei servizi, ISEDI.
Hirschman A. (1970), Voice, exit and loyalty: Responses to Decline in firms, Organisations and States, Harvard University Press, Cambridge.
Losito G. (2005), L’intervista nella ricerca sociale, Ed. Laterza, Roma-Bari.
Marbach G. (2006), Ricerche per il Marketing, UTET, Milano.
Monroe K.B. (1990), Pricing: making profitable decision, McGraw Hill, New York.
Parasuraman A., Berry L.L. and Zeithaml V.A. (1988), SERVQUAL: a multiple-item scale for measuring consumer perceptions of service quality, Journal of Marketing, Vol. 49.
Parasuraman A., Berry L.L. and Zeithaml V.A. (1991), Refinement and reassessment of the SERVQUAL scale, Journal of Retailing, Vol. 67.
Slack N., Chambers S., Harland C., Harrison A. and Johnston R. (1998), Operations Management, Financial Times Management, London.
Valdani E. (1989), Pricing – Tattiche e Strategie per definire con successo il prezzo di vendita, Etas, Milano.
Zappa G. (1956), Le produzioni nell’economia delle imprese, Vol. 1, Giuffrè, Milano.

I n t e r n a t i o n a l J o u r n a l o f M a n a g e m e n t C a s e s
156
NUTRITIONAL TRADE-OFFS – A COMPARATIVE STUDY OF TWO FOODS
N. WINDRUMDEPARTMENT OF FOOD SCIENCE, QUEEN’S UNIVERSITY, NORHERN IRELAND
R. NELSONCOLLEGE OF AGRICULTURE FOOD AND RURAL ENTERPRISE, NORTHERN IRELAND
Abstract
Concern about food choices that may have adverse effects on health is currently at the forefront of public health. Despite it being reported that healthy eating is one of the top five influences on food choice and that consumers are now choosing to eat healthier foods, obesity levels still remain high. The aim of this study was to investigate consumer risk-benefit trade-offs, when applied to the consumption of two foods with different perceived levels of nutritional quality and assess if they differ accordingly. Three stages of research were carried out. Initially 20 commonly consumed foods were chosen and 27 nutritional experts were asked to rate each one in terms of their contribution to achieving a healthy balanced diet. This identified a highly correlated risk-benefit continuum (r = -0.963). For comparison purposes one food was selected from the high risk end of the continuum (beef burgers) and one from the low risk end (milk). The second stage of research involved the use of focus groups and structured interviews to determine the most important nutritional attributes and their levels involved in the purchase of each food. Finally conjoint analysis was used in order to generate data, which could be applied to model the nutritional tradeoffs amongst the two products. In this stage of research respondents were also asked to rate the nutritional risks and benefits they associated with four product scenarios (risk-benefit foods) not included in the main conjoint experiment. The effect of the socio-demographic, dietary and food attitude variables on consumer risk-benefit trade-offs were also investigated. Results from conjoint analysis demonstrated the importance of each attribute and generated utility scores for each attribute level. Beef content was the most important factor influencing choice of beef burgers followed by salt content and finally saturated fat content. For milk the most important influencing factor affecting choice was fat content
followed in turn by omega-3 fortification and the addition of a probiotic. Looking at the effect of all demographic and individual factors on importance scores it was found that in general the population exhibited homogenous behaviour. Using the utility scores generated in conjoint analysis, a likelihood to choose score (LCS) was calculated for each of the four risk-benefit foods. Taking the population as a whole and when looking at the overall product ratings a strong relationship was found between perception of risks, benefits and the LCS for both milk and beef burgers. It was found that risk was negatively correlated to benefits and LCS, whilst benefits and LCS were positively correlated. Although this relationship was evident when looking at the generic product as a whole, it was not reflected in consumer ratings of each risk-benefit food. When looking at each product individually the assigned risk scores correlated very poorly with LCS and benefit scores.
Key Words: Risks, benefits, food choice
IntroductionIn industrialised countries consumers have come to expect an ever increasing range of foods, due in some part to the dramatic changes that have been observed in food markets over recent years. Trade liberalisation and new information technology have accelerated the pace of globalisation, whilst advances in food technology have led to innovative new products that aim at higher quality and safety standards. In conjunction with this consumers have attained relatively higher levels of disposable incomes, are better educated and informed, and are more concerned about a growing list of food attributes (Senauer, 2001). Consumers are now giving a number of reasons for choosing foods. For example, a large European study in 2004 focussed on the factors affecting food choice and highlighted

157
I n t e r n a t i o n a l J o u r n a l o f M a n a g e m e n t C a s e s
quality and freshness, price, taste, trying to eat healthily and family preferences as the five most important influences (Cox and Anderson, 2004).
Despite it being reported that consumers are now choosing to eat healthier foods (Food Standards Agency, 2006), the adverse effects of poor food choice currently remain a major public health concern. Globally, more than 1 billion adults are overweight with at least 300 million of these classified as obese (WHO, 2003). In the UK, the level of obesity has more than doubled since 1980 (International Obesity Task Force (IOTF), 2006), whilst in Northern Ireland currently over half of women and about two thirds of men are either overweight or obese (Irish Universities Nutrition Alliance, 2001). Severe overweight or obesity is a key risk factor in the development of many chronic diseases such as heart and respiratory diseases, non-insulin dependant diabetes, hypertension and certain forms of cancer (IOTF, 2006). Obesity is not the only long-term consequence of poor food choice, with other health problems including underweight conditions, anaemia, food intolerance/hyperactivity and dental caries (Thomas, 2001).
Generally when making food choices consumers focus on a number of attributes. Lancaster (1966) first introduced the idea that products consist of bundles of attributes or characteristics that satisfy consumer needs and wants. Consumers aim to attain the attributes they most desire and they depend not only on income and price, as traditional economic theory states, but also on their needs, preferences, perceptions, culture and lifestyles and on their external social and economic environment (von Alvensleben, 2002). The extent of involvement present also plays a role in the consumer choice process. Involvement has been defined by Engel & Blackwell (1982) as “the activation of extended problem-solving behaviour when the act of purchase or consumption is seen by the decision maker as having high personal importance or relevance”. Foods are generally considered low involvement items (von Alvensleben, 2002), however, the level of involvement may differ depending on the product and individual involved. For example wine may be described as a high involvement item because of its intrinsic complexity and its social status at the meal table. Bread on the other hand may be considered a low involvement food. In addition, certain groups of consumers e.g. those who are concerned about their body weight, may have a greater involvement with food or certain types of food than others. The degree by which consumers
have been sensitised can also affect the level of involvement present (Fein, Lin and Levy, 1995). Recent mass communication of nutritional issues may have led to consumers becoming more aware of information regarding the risks and benefits of consuming specific foods. This may result in them actively seeking out information about these risks and benefits and becoming more selective in attending to information.
In many cases a particular food may not possess all the attributes which the consumer desires and as a result when making their choice consumers are often required to make concessions on certain attributes. In this situation consumers may weigh up the risks and benefits associated with the product and trade off low values on one dimension against high values on another. Several models may be used to describe this trading off process including the vector model, ideal point model and part worth model (Hogarth, 1987).
In light of the nutritional issues identified, the aim of this study was to investigate consumer attribute trade-offs that occur in two foods with different perceived levels of nutritional risk and benefits. This would assess if consumer attribute trade offs differ according to how risky or beneficial they perceive them to be. Individual preferences were examined in a realistic context in which both potential risks and benefits were present, thus helping explain the risk benefit relationship. These findings may therefore be used to effectively predict consumers’ willingness to choose different foods with different perceived levels of nutritional quality. This study also considered the effect of demographic and individual characteristics on consumer preferences.
MethodA three phase approach to data collection was developed. Initially, in order to select the specific food products 27 nutritional experts and 80 food consumers were asked to rate 20 commonly consumed food items (selected from the Family Food Survey 2004/2005), based upon either how risky or beneficial they perceived each of them to be, in terms of their contribution to achieving a healthy balanced diet. This identified a highly correlated risk benefit continuum (r = -0.963) (Figure 1). For comparison purposes one food was selected from the high risk end of the continuum (beef burgers) and one from the low risk end
I n t e r n a t i o n a l J o u r n a l o f M a n a g e m e n t C a s e s
158
(milk). The second stage of research involved the use of focus groups and structured interviews to determine the most important nutritional attributes and their levels involved in the purchase of each food. In the context of issues addressed in the introduction, this study focussed on consumer preferences for a subset of attributes which indicated nutritional quality. Tables 1 and 2 show the attributes and levels assigned to each food. In the final phase conjoint analysis was used in order to generate data, which could be applied to model the nutritional trade-offs among the two products. Using this method respondents were presented with various descriptions of a food, differentiated by their attributes and levels and were then asked to rate each alternative. The full profile conjoint analysis approach was used, giving rise to 16 possible product scenarios for milk (4x2x2) and 27 possible product scenarios for beef burgers (3x3x3). As it would have been unrealistic to ask respondents to rate all of these, a fractional factorial design, under SPSS conjoint, was utilised to reduce the number of profiles to a manageable number, whilst maintaining orthogonality. This generated 13 product scenarios per food. An example of a beef burger product scenario is shown in Figure 2. Each product scenario was assigned a likelihood to choose score (LCS) by consumers using a 100-point preference scale. In addition, respondents were asked to rate the nutritional risks and benefits they associated with four product scenarios not included in the main conjoint experiment. These four foods were termed risk-benefit foods and were included in order to provide information on the relationship between consumer perception of the risks and benefits and the LCS associated with each product. The questionnaire also collected information on respondents’ dietary patterns, food attitudes and demographic indicators such as age, gender, education and employment status. A representative sample of consumers completed the beef burger and milk questionnaires (84 and 88 respectively) in November 2006. A summary of the respondents’ socio-demographic characteristics for each food is shown in Table 3.
Results and DiscussionAssociation measures (Pearson’s R and Kendall’s Tau) assess how well the conjoint model fits and have a theoretical maximum of 1, indicating perfect agreement between the estimated utilities of the cards and the subjects’ ratings. For beef burgers Pearson’s R was 0.990 and Kendall’s Tau
was 0.889, whilst for milk Pearson’s R was 0.853 and Kendall’s Tau was 0.786 indicating good agreement for both foods.
Attribute utilities and ideal products
Conjoint analysis calculated both the importance of each attribute and the part-worth utility scores of each of the attribute levels (Tables 4 and 5). Beef content was the most important factor influencing choice of beef burgers followed by salt content and finally saturated fat content. For milk the most important influencing factor affecting choice was fat content followed by omega-3 fortification and finally the addition of a probiotic. The effect of the socio-demographic, dietary and food attitude variables on the importance scores was investigated and it was found that in general the population exhibited homogenous behaviour with respect to all factors investigated. Consequently, consumers use the same decision making model when making a food choice, thereby negating the need for different communication processes directed at different groups of consumers.
Relationship between product attributes and LCS
The utility scores for each attribute level (Tables 4 & 5) help to describe the likely relationship between product attributes and the LCS. The three basic types of relationships are: discrete, which is when the attribute levels are categorical and no assumption is made about the relationship; linear, which is when the attribute levels are expected to be linearly related to the LCS or ideal, which is when consumers show an ideal point of preference with the preference for each alternative decreasing as the distance from their ideal point increases.
When looking at beef burgers a linear relationship was found between both saturated fat and beef contents and the LCS. This signifies that the higher the beef content was the higher the preference was and the lower the saturated fat content was the higher the preference was. With salt content an ideal point relationship was observed (0.3g), where consumers were found to be opposed to a high amount of salt being present but still preferring a specified amount. In the case of milk a discrete relationship was found between both the presence of omega-3 oils and the LCS and the presence of a probiotic and the LCS, with the existence of both indicating a positive preference. The third

159
I n t e r n a t i o n a l J o u r n a l o f M a n a g e m e n t C a s e s
attribute (fat content), however, has an ideal point of consumption (1.7% ) revealing that although consumers are concerned about the fat content they still prefer a certain amount to be present. The relationships identified between the product attributes and the LCS indicate that consumers are discerning when it comes to making choices about the nutrient components in their foods by clearly identifying attribute levels that are more desirable than others.
Relationship between risk, benefi t and LCS
Using each attribute level utility score a LCS can be calculated for any combination of product attribute levels not included in the conjoint analysis. This allowed a LCS score to be calculated for each of the four risk-benefit foods. For each of these foods respondents had been asked to rate the nutritional risks and benefits they associated with each one. Taking the population as a whole and when looking at the overall product ratings a relationship was found between perception of risks, benefits and the LCS for both milk and beef burgers (Table 6). The risk score for both foods was negatively correlated to the benefit and LCS scores indicating that as the risk perception of a product increases the benefit perception and LCS decreases, whilst the benefit score for both foods was positively correlated to the LCS score indicating that as the benefit perception increases so too does the LCS. Although this relationship was evident when looking at the generic product as a whole, it was not reflected in consumer ratings of each risk-benefit food. When looking at each product individually the assigned risk scores correlated very poorly with LCS and benefit scores indicating that consumers find it difficult to identify the risks and benefits at an individual product and attribute level.
Conclusion
This study investigates the consumer attribute trade-offs which take place in two foods with different perceived levels of nutritional risk and benefits and assesses if they differ accordingly. Individual preferences were examined in a realistic context in which both potential risks and benefits were present, thus helping explain the risk-benefit relationship. Results reveal that consumers are very perceptive when it comes to making choices about the nutrient components in their foods as they are clearly able to identify attribute levels that are more desirable than others. Furthermore,
all consumers are similar with respect to the decision making process used when making a food choice. This indicates that there is little need for different communication processes directed at different groups of consumers. When looking at the contribution of risk and benefit perceptions to the consumer LCS two points are revealed. Firstly, taking the population as a whole and when looking at the overall product ratings a strong relationship was found between perception of risks, benefits and the LCS for both milk and beef burgers. In contrast to this, however, when looking at each product individually the assigned risk scores correlated very poorly with LCS and benefit scores indicating that although consumers are able to identify risks and benefits at generic product level they find it difficult to do this at an individual product and attribute level. These findings may be used to help predict consumers’ willingness to choose different foods with different perceived levels of nutritional quality and in turn help inform communication and education strategies with respect to healthy eating.
ReferencesCox, D.N. and Anderson, A.S, 2004. Food Choice. In Gibney, M.J, Margetts, B.M, Kearney, J.M and L. Arab (eds) Public Health Nutrition. Oxford: Blackwell Science, 144-166.
Engel, J.F. and Blackwell, R.D. (eds) 2000. Consumer Behaviour, 4th ed. New York: The Dryden Press.
Fein, S.B, Lin, J.C.T and Levy, A.S, 1995. Foodborne Illness: Perception, Experience and Preventive Behaviours in the United States. Journal of Food Protection, 58(12), 1405-1411.
Food Standards Agency, 2006. Consumer Attitudes Survey 2005: Northern Ireland. London: Food Standards Agency.
Hogarth, R. (ed.) 1987. Judgement and choice, 2nd ed. New York: John Wiley and Sons.
International Obesity Task Force, 2006. About Obesity. http://www.obesite.chaire.ulaval.ca/iotf.htm, 05/12/06.
Irish Universities Nutrition Alliance, 2001. The North/South Ireland Food Consumption Survey. Dublin: Food Safety Promotion Board.

I n t e r n a t i o n a l J o u r n a l o f M a n a g e m e n t C a s e s
160
Lancaster, K.J, 1966. A new Approach to Consumer Theory. Journal of Political Economy, 74, 132-157.
Senauer, B, 2001. The Food Consumer in the 21st Century: New Research Perspectives. In: Proceedings of the 71st EAAE Seminar: The Food Consumer in the 21st Century; April 18-20; Zaragoza, Spain.
Thomas, B. (ed.) 2001. Manual of Dietetic Practice. Oxford: Blackwell Science.
von Alvensleben, R, 2002. Consumer Behaviour. In Padberg, D.I, Ritson, C and Albisu, L.M. (eds), Agro-food Marketing. Oxford: CABI Publishing, 209-224.
World Health Organisation, 2003. Global strategy on diet, physical activity and health. Geneva: WHO.
Tables and fi gures
Figure 1. Relationship between risks and benefits for 20 commonly consumed foods

161
I n t e r n a t i o n a l J o u r n a l o f M a n a g e m e n t C a s e s
Figure 2. Beef burger product profile
Table 1. Attributes and levels for beef burger
Table 2. Attributes and levels for milk

I n t e r n a t i o n a l J o u r n a l o f M a n a g e m e n t C a s e s
162
Figure 3. Socio-demographic characteristics of the respondents

163
I n t e r n a t i o n a l J o u r n a l o f M a n a g e m e n t C a s e s
Table 4. Results of beef burger conjoint analysis (n=84)
Table 5. Results of milk conjoint analysis (n=89)
Table 6. Relationship between risk, benefit and LCS
I n t e r n a t i o n a l J o u r n a l o f M a n a g e m e n t C a s e s
164
QUALITY ASSURANCE FOR THE HOTELS IN TURIN, ITALY
ANTONELLA CAPRIELLOUNIVERSITY OF EASTERN PIEDMONT, ITALY
IAN D. ROTHERHAMSHEFFIELD HALLAM UNIVERSITY, UK.
Abstract
With the dramatic downturn of the manufacturing industry in Piedmont, it has been regional policy to promote the area as a tourist destination. This is an approach that is increasingly taken by regions with economic problems but which have heritage and natural assets from which tourism might be grown. In the case of the Piedmont, whilst the locale has varied and rich history, architectural heritage, and landscape, the hospitality industry has been slow to develop. This is in part at least, due to the lack of experience in the hospitality sector consequent on the absence of an established tourism in the wider area. In order to bridge this gap the Chamber of Commerce of Turin in 2005 introduced a quality assurance programme to help enhance the management of hotel industry. The initiative offered free access to training courses and hotel assessment procedures, as well as the promotion of the quality assured hotels through trade publications and tourism promotional exchanges. These were in accordance with the Chamber’s activities.
The aim of this working paper is to assess whether the quality assurance programme can boost the competitiveness of the regional hotel industry. In order to help assess this, a critical review of relevant literature was undertaken on quality management systems in the hotel sector. This was in relation to quality indicators such as classification, branding and grading. The detailed case-study was based on a sample of 159 firms operating in the City of Turin. It includes analysis of the quality assurance programme, the star classification system, corporate affiliation, and the criteria of the Michelin Guidebook. A logistic regression model was employed to test separately the relationship between the status of quality assured hotels and star category, chain affiliation, and the grade in the Michelin Guidebook. The
findings reveal that hotels characterised by a lower star category, independent and not listed in the Michelin Guidebook are less receptive to a quality assurance programme. This was related to the fact that due to their smaller size and often close personal supervision and teamwork, they feel less need for a formal system of quality assurance. Furthermore, the local independent sector of the hospitality industry seems to undervalue the function of the quality assurance initiative. They might not perceive quality assurance and associated labels and the programme’s promotional activities as generating benefits for themselves.
The analysis of data indicates the importance of an appropriate hospitality asset summarised by the hotel star category. It is clear that a higher rank does not necessarily ensure adherence to the specific initiative. Yet, a section of the higher star category and corporate affiliated sector does adhere to the initiative; and this seems to relate to issues of a competitive edge in the local marketplace. Finally, given the characteristics of quality assured hotels, the empirical evidence raises doubts about usefulness of the quality assurance system as an additional source of information for consumers.
Keywords: Quality; Hotel; Piedmont; Turin.
IntroductionThe Piedmont region played an important role in the economic and social development of Italy in the twentieth century, but has now embarked on a complex process of transformation. In particular, like other large European regions with a high level of industrial development, in the last twenty years, the area has seen a rebalance between the various economic macro-sectors (agriculture, industry, services). A recovery programme for the period 2000-2006 was oriented to make the area
165
I n t e r n a t i o n a l J o u r n a l o f M a n a g e m e n t C a s e s
more functional and more exploitable, with a total budget of about Euro 500 million received from the EU, the Italian Government, the Regional Council, Provincial Council, banking foundations (trusts) and Town Council (Regione Piemonte, 2005). More specifically, the Regional Laws no. 18 passed in 1999 and no. 4 passed in 2000 supported financially the transformation into a modern hospitality and tourism industry. The locale has a wealth of multi-layered historical, natural, and gastronomical features of interest and of excellence. Additionally, the global event of the Torino 2006 Winter Olympics Games was not only a celebration of sports, but a unique opportunity to build an international reputation. Yet, in comparison with other traditional Italian destinations, Piedmont is a late-comer, in a period when the economic world is populated by tourist products. Moreover, visitors become even more sophisticated in their expectations and through websites can easily compare the offers of different destinations. This is a situation common to other European regions that seek to break into the tourism and hospitality markets. Thus one of the challenges faced by local public administrators is that of helping the hospitality industry to become more competitive. In the light of the described context, the Chamber of Commerce of Turin in 2005 introduced a quality assurance programme to help enhance the management of hotel industry. The aim of this working paper is to evaluate whether the quality assurance programme can boost the competitiveness of the regional hotel industry. In particular the case-study focused on the City of Turin. This was in order to assess the quality assurance programme in an emerging urban destination, characterized by a significant increasing presence of affiliated four and five stars hotels (Regione Piemonte, 2005).
The paper presents a literature review on the relationship between quality management models and typical quality indicators in the hotel sector, such as the star classification criteria, brand, and the grading by commercial guidebooks. Subsequently, the quality assurance system proposed by the Chamber of Commerce is analysed. Then, in order to investigate the accredited hotel industry’s profile, a logistic regression model was used to explore the role of star category criteria, chain affiliation and the grade in the Michelin Guidebook. Finally, the conclusions report a reconsideration of the programme function in accordance with the empirical results.
The working paper contributes to debates on quality management system in the hotel industry; other studies being focused on the application of the quality management models in the case of large hotel businesses (Dubé & Renaghan, 1999; Dubé et al., 2000; Enz & Siguaw, 2000; Hirst, 1991; Huckstein & Duboff, 1999; Partlow, 1993) or of four and five stars hotels (Arasli, 2002; Soriano, 1999). Some research studies concern service quality assessment and customer satisfaction (Fernández & Bedia, 2004; Mohsin & Ryan, 2005) or price strategy in comparison with quality indicators such as star classification and hotel affiliation (Israeli and Uriely, 2000; Israeli, 2002), branding (Muller, 1998; Keller, 2001), or the grade in a guidebook (Hensley et al., 2004).
Quality management system: key factors in the hotel industry The literature concerning quality management systems in the hospitality industry is mostly focused on large businesses, and especially hotels such as Accor North America, Four Seasons and Regents Hotels and Resorts, Hyatt Regency, Marriott International (Dubé & Renaghan, 1999; Dubé et al., 2000; Enz & Siguaw, 2000), Hilton (Hirst, 1991; Huckstein & Duboff, 1999) and Ritz Carlton (Partlow, 1993). In particular, Soriano (1999) conducted a survey at Valencia’s eight highest–ranked hotels to compare the European Foundation for Quality Management (EFQM) model with the opinions of hotel managers. An interesting point is the high value the hoteliers gave to resources, since the raw material is represented by the space for rooms, for common areas, and for the reception. Moreover, according to Camisòn (1996, 199), one or two star hotels are a high risk group, owing to the lack of the quality demanded by the market and to their ignorance of important non–quality areas. According to Nield and Kozak (1999, 45) the companies that did not commend accreditation were the smaller ones. In fact, small businesses with close supervision of staff and tightly controlled teamwork normally have less need for a formal system. The difficult of getting them involved in quality certification has also been documented (Gouirand, 1994). As evidence of this argument the official star category could be considered as a good indicator of adherence to a specific accreditation initiative. The following suggestion can therefore be tested:
I n t e r n a t i o n a l J o u r n a l o f M a n a g e m e n t C a s e s
166
Hypothesis 1: The adherence to a quality assurance programme will increase with a raising of star category, as a higher star category hotel possesses physical assets and managerial skills to support the implementation and fulfilment of the quality certification activities.
Yet, Camisón (1996) provided evidence of the scant value of the official qualification system for hotels. This was due to their concentration on the physical standards made material in the quality of design, and to the fact they ignore service standards. A brand name instead implies the creation of a standardized product or production process, as noted by Klein and Saft (1985). In particular, when firms affiliated with a brand, they tap into multi–unit knowledge systems honed by specialised corporate functional experts (for example, in human resources and marketing). Although in Europe the hotel industry is dominated by independent hotels, entrepreneurs perceive the advantages of branding through franchising and hotel membership. These benefits are connected with marketing services and access to new markets and global reservation system (Holverson & Revaz, 2006). In comparison with branded firms, the weak position of independent hotels is associated with a shortage of human and financial resources, as well the lack of quality assurance policies and connected culture (Arasli, 2002; Buhalis & Morrison, 1997; Lewis & Chambers, 2000; Morrison, 1998). Given these arguments a second hypothesis can be considered:
Hypothesis 2: The adherence to a quality assurance programme will increase in case of affiliated hotels, as their management are more familiar with standards in services and quality assurance policies.
In the hotel industry grading is a qualitative assessment to indicate how good or bad the facilities and services offered are. This system is adopted by consumer guidebooks to provide information in such areas as value and quality. For instance, the Red Michelin Guidebook, normally called the Michelin Guide, is a widely read guide to accommodations and restaurants organized in terms of geographical areas. Its rating of “pavilions” indicates the level of quality, providing travellers with other useful information. In particular, according to the criteria of the Michelin Guidebook, a hotel has to demonstrate that it fulfils specific requirements. On the other hand in the literature on ISO 9000, the benefits of this system are normally associated
with the improvement of working systems, a more committed staff and a reduction of employee turnover. Moreover, marketing advantages, such as an enhancement of customer satisfaction, a competitive edge, and a nationwide recognition for quality, have been considered a major reason for obtaining accreditation (Walker, 1988). Thus, both in the case of quality assured hotels and in that of lodging firm as awarded by a guidebook, the management are customer-focused in undertaking the process. Moreover, considering the marketing activities of the local Chamber of Commerce, quality assured hotels seem to be interested in fostering a competitive advantage in the local market. Given the previous statements, the following hypothesis can be analysed:
Hypothesis 3: The adherence to a quality assurance programme will increase in case of hotels listed in a guidebook, as their management are more sensitive to develop a customer oriented approach and to gain a competitive edge on the local marketplace.
The case-study
The quality assurance programme
The quality assurance programme proposed by the Chamber of Commerce of Turin is oriented to the management of each hotel whatever the category. Its benefits include free access to training courses and hotel assessment procedures. Additionally, accredited hotels are promoted through the channels selected by the Chamber of Commerce, such as consumer and trade publications, and fair trade exchanges. The model is based on the principles of the most common schemes such as ISO 9000, ISO 14000, and EFQM. In order to be a quality assured hotel, an accommodation provider must fulfil over 400 conditions, divided into three categories: facilities, hospitality and service, and the environment. The requirements related to facilities concern: accessibility, availability and standard of usable space, availability of equipment and supplies, halls, amenities and furnishings, and standards of cleanliness. The issues relating to hospitality and service include fairness, courtesy, helpfulness, efficiency, punctuality, and professional standards of service. These are demonstrated in the various services on offer. These would be booking, room allocation, use of a service, or provision of useful information

167
I n t e r n a t i o n a l J o u r n a l o f M a n a g e m e n t C a s e s
during the stay. The first two areas of assessment vary according to the hotel category. They are classified as obligatory, optional or plus points. The environmental features on the other hand are assessed independent of hotel category. They concern reduced energy or water consumption, decreased waste, and provision of environmental information. Since the quality certification is valid for one year, the hotel management confirm their participation and submit the hotel for assessment annually. According to the 2007 online dataset of the Turin Chamber of Commerce there are forty-two quality-assured hotels in the City.
The model and estimation
To addresses the hypotheses 1-3, a logistic regression model was been employed to explore
the relationship between adherence to the quality assurance programme, and considered separately the effects of star category, corporate affiliation, and grade in the Michelin Guide. The logistic regression estimates the probability of an event occurrence. The expression of the model estimated is the following:
Logit (Y) = β0 +β1 (X)
Odds (Y) = e β0 +β1 (X)
Probability = odds/ (1+odds)
Y represents the adherence to the accreditation programme and assumes the value of 1 in case of a quality assured hotels and 0 in the opposite situation.
Table 1. A summary of the independent variable (X) used in each model
Table 2. Star categories: distribution of hotels
In the first model (Model 1), X is represented by the star category of each observed unit. The hotel classification criteria are identified by the Regional Law no. 14 passed in 1995. According to the regional law, each star category is identified in accordance with the minimal qualitative standards. The criteria are mainly related to the physical features of rooms, common areas, furniture and
building as well as to the presence of specific services. The data were collected by the 2007 online dataset of the Italian Hotelier Association (Federalberghi). Table 2 shows the distribution of hotels in accordance to the star category.
In the second model (Model 2), X was represented by the corporate affiliation of each observed unit.

I n t e r n a t i o n a l J o u r n a l o f M a n a g e m e n t C a s e s
168
It was based on twenty-seven affiliated hotels identified from the 2007 dataset of the Italian Hotelier Association and the information contained on the website of each hotel. Additionally, whilst some hotels in Turin are affiliated with the largest international chains, the nature of the brand was not considered in this preliminary study.
In the third model (Model 3), X was represented by presence or absence in the online list of the 2007 Michelin database. Twenty-six relevant hotels were identified from the guidebook. Other information related to provision was not evaluated relevant for this study.
Results and Discussion The relationship between the status of quality assured hotels and the described independent variables are tested at a significance level of 5% with the statistical package STATA (version 9.2). The results from the three models are presented in Table 3. In particular, the likelihood –ratio (LR) test shows the relevance of variables to the model, as the LR test statistic follows a Chi-square distribution. Additionally, the percentage of correctly classified units was also computed and is quite high.
In analysing the empirical evidences, the hypothesis 1 is validated by the fact that in the first model (Model 1) the coefficient ratio of the independent variable “star category” is significant. It reveals the importance of an appropriate asset that is represented by a higher star category to support the quality assurance programme. Yet, a higher rank does not ensure the adherence to the specific initiative. The percentage of positive predicted firms is lower (74.07%) than the average value.
The relationship between the status of quality assured industry and that of affiliated hotels was tested through Model 2. The analysis confirms that the independent hotel is less receptive to the accreditation programme (negative predictive value 85.61%). This tendency was also related to their smaller size and associated often close personal supervision by management and hence an intimate teamwork in operations. They therefore maybe have less need for a formal system of quality assurance, and perhaps perceive less of a need. Furthermore, the local independent sector of the hospitality industry seems to undervalue the
quality assurance initiative. They seem not to see the programme’s promotional activities as a way to obtain benefits for themselves. On the contrary, the affiliated hotels analysed showed a more committed participation, probably expecting to gain a competitive edge in the local marketplace. This is supported by international chain hotels tending to develop marketing strategies for their local markets (Roper et al., 1999). Moreover, as indicated by Holven and Revaz (2006) in the case of the European affiliated industry, hoteliers seem to perceive limits to the benefits of a global brand name. At the same time it seems that the affiliation process implies the adoption of the brand quality assurance procedures, and this might make adherence to the Chamber of Commerce quality assurance programme less costly and complex in comparison with a small independent hotel.
Given the significance of the coefficient ratio, Model 3 revealed a relationship between the status of accredited hotels and that of graded lodging firms by the Michelin Guide. This aspect may be related to the similarity of the inspection procedures (e.g. the presence of a mystery client). Moreover, since the commercial function of the Michelin Guide is directed at a specific, interested segment of the industry, the initiative may be considered to be a complementary opportunity to increase visibility of the hospitality industry in the local marketplace.
4. Conclusions
In the hotel industry the deployment of a quality system reflects the distinctive nature of the sector, with importance assigned to infrastructure and equipment. From a customer-based perspective, high star category and chain affiliation are marks of quality. As evidence of this, a high star category is normally considered as an asset in terms of the physical features and facilities on offer, and the services provided. A strong brand identity is instead not only a synonym of standardised products and processes, but also reassures consumers amid the unfamiliar imagery of local goods and services. Moreover a hotel which is listed in a commercial guidebook will have to conform to specific requirements and usually will undergo an inspection visit. Alternatively, small independent hotels, which are not listed in the commercial guidebooks, tend not to participate in quality assurance programmes. Features such as the predictor variables as described were used to investigate adherence to a quality assurance programme in the City of Turin.
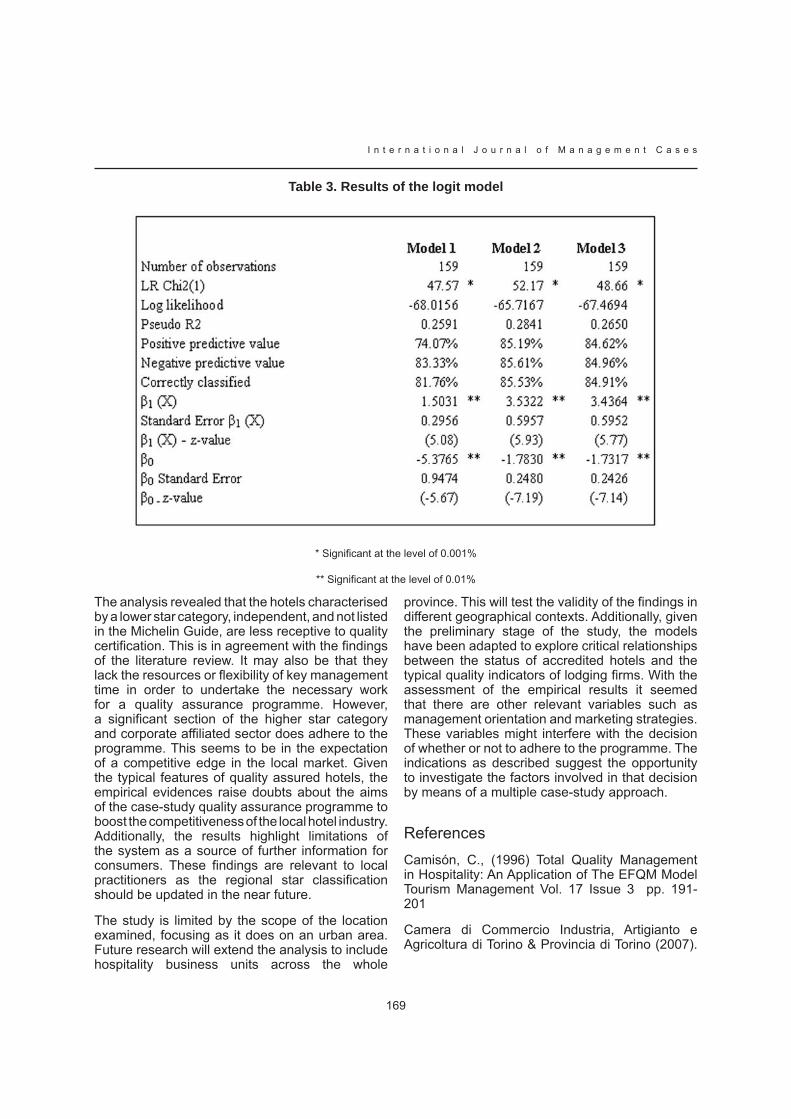
169
I n t e r n a t i o n a l J o u r n a l o f M a n a g e m e n t C a s e s
Table 3. Results of the logit model
* Significant at the level of 0.001%
** Significant at the level of 0.01%
The analysis revealed that the hotels characterised by a lower star category, independent, and not listed in the Michelin Guide, are less receptive to quality certification. This is in agreement with the findings of the literature review. It may also be that they lack the resources or flexibility of key management time in order to undertake the necessary work for a quality assurance programme. However, a significant section of the higher star category and corporate affiliated sector does adhere to the programme. This seems to be in the expectation of a competitive edge in the local market. Given the typical features of quality assured hotels, the empirical evidences raise doubts about the aims of the case-study quality assurance programme to boost the competitiveness of the local hotel industry. Additionally, the results highlight limitations of the system as a source of further information for consumers. These findings are relevant to local practitioners as the regional star classification should be updated in the near future.
The study is limited by the scope of the location examined, focusing as it does on an urban area. Future research will extend the analysis to include hospitality business units across the whole
province. This will test the validity of the findings in different geographical contexts. Additionally, given the preliminary stage of the study, the models have been adapted to explore critical relationships between the status of accredited hotels and the typical quality indicators of lodging firms. With the assessment of the empirical results it seemed that there are other relevant variables such as management orientation and marketing strategies. These variables might interfere with the decision of whether or not to adhere to the programme. The indications as described suggest the opportunity to investigate the factors involved in that decision by means of a multiple case-study approach.
ReferencesCamisón, C., (1996) Total Quality Management in Hospitality: An Application of The EFQM Model Tourism Management Vol. 17 Issue 3 pp. 191-201
Camera di Commercio Industria, Artigianto e Agricoltura di Torino & Provincia di Torino (2007).

I n t e r n a t i o n a l J o u r n a l o f M a n a g e m e n t C a s e s
170
Gli Hotel Yes! http://www.yeshotel.it [accessed 05.01.2007]
Dubè, L., &. Renaghan, L.M. (1999) Strategic Approach to Lodging Excellence Cornell Hotel and Restaurant Administration Quarterly Vol. 40 Issue 6 pp. 16-29
Dubè, L., Enz, C. A., Renaghan, L.M. & Siguaw, J.A. (2000) Managing for Excellence Cornell Hotel and Restaurant Administration Quarterly Vol. 41 Issue 5 pp. 30-39
Enz, C. A. & Siguaw, J.A. (2000), Best Practise in Human Resources Cornell Hotel and Restaurant Administration Quarterly Vol. 41 Issue 1 pp. 48-62
Fernández, López C.M.& Bedia, Serrano A. M. (2004) Is The Hotel Classification System a Good Indicator of Hotel Quality? An Application in Spain Tourism Management, Vol. 25 Issue 6 pp. 771-775
Federalberghi (2007) Italyhotels http://www.italyhotels.it [accessed 05.01.2007]
Gouirand, P. (1994) La Formation à La Gestion et à La Qualité Dans l’Hộtellerie Familiale et Indépendante In: WTO Seminar on Quality – A Challenge for Tourism, Madrid 18-19 April (pp. 91-95) Madrid: WTO
Henley, J.A. Cotter M. J. & Herrington D. J. (2004) The Importance of Consumer Guide Information to Management: The Mobil “Check” and Hotel Pricing Behavior Tourism Analysis Vol. 9 n. 3 pp. 197-205.
Hirst, M. (1991) Newer and Better Ways Managing Service Quality Vol. 1 Issue 5, pp. 247-251
Israeli, A. A. & Uriely, N. (2000) The Impact of Star Rating and Corporate Affiliation on Hotel Room Price International Journal of Hospitality and Tourism Research Vol. 2 Issue 1 pp. 27-36
Israeli, A. A. (2002) Star Rating and Corporate Affiliation: Their Influence on Room Price and Performance of Hotels in Israel International Journal of Hospitality Management, Vol. 21, Issue 4 pp. 405-424
Lewis, R. C. & Chambers R.E.. (2000) Marketing Leadership in Hospitality Foundation and Practises 3rd Edition New York, NY: John Wiley & Sons Inc.
Mohsin, A. & Ryan C. (2002) Service Quality Assessment of 4-star Hotels in Darwin, Northern Territory, Australia Journal of Hospitality and Tourism Management Vol. 12 Issue 1 pp. 25-36
Morrison, A. (1998) Small Firm Co-operative Marketing in A Peripheral Tourism Region International Journal of Contemporary Hospitality Management Vol. 10 Issue 3 pp. 191-197
Muller, C. (1998) Endorsed Branding Cornell Hotel and Restaurant Administration Quarterly Vol. 39 Issue 3 pp. 90-96
Nield, K. & Metin, K. (1999) Quality Certification in the Hospitality Industry Cornell Hotel and Restaurant Administration Quarterly Vol. 40 Issue 2 pp. 40-44
Keller, K. L. (2001) Building Customer-Based Brand Equity Marketing Management, Vol. 10 Issue 2 pp. 14-19
Klein, B., Saft, Lester F. (1985) The Law and Economics of Franchise Tying Contracts Journal of Law and Economics Vol. 28 Issue 2 pp. 345-361
Odin, Y., Odin, N. & Valette - Florence, P. (2001) Conceptual and Operational Aspects of Brand Loyalty: An Empirical Investigation Journal of Business Research Vol. 53, Issue 2 pp. 75-84
Roper, A., Brooke, M. & Hampton, A. (1999) Investigating the Centric Profile of International Groups Journal of Retailing and Consumer Services Vol. 6 Issue 3 pp. 163-172
Partlow, C. G. (1993) How Ritz – Carlton Applies ‘TQM’ Cornell Hotel and Restaurant Administration Quarterly Vol. 30 Issue 4, pp. 16-24.
Prasad, K. & Dev, C.S. (2000) Mananging hotel brand equity: A Customer – Centric Framework for Assessing Performance Cornell Hotel and Restaurant Administration Quarterly Vol. 41 Issue 3 pp. 22-31.
Regione Piemonte (2005) Tourism in Piedmont: The Figures http://www.regione.piemonte.it/lingue/english/pagine/cultura/approfondimenti/02_piemontur_en.pdf [accessed 25.01.2007]
Soriano, R. D. (1999) Total Quality Management. Applying the European Model to Spain’s Urban Hotels Cornell Hotel and Restaurant Administration Quarterly Vol. 40, Issue 1 pp. 54-59.
171
I n t e r n a t i o n a l J o u r n a l o f M a n a g e m e n t C a s e s
ViaMichelin (2007) ViaMichelin http://www.viamichelin. com/viamichelin/int/dyn/controller/Hotels# [accessed 05.01.2007]
Walker, J. R. (1988) The Viability of Quality Assurance in Hotels Hospitality Education and Research Journal Vol. 12 Issue 2 pp. 461-470.
Antonella Capriello (PhD in Business Administration, University of Turin) is an Assistant Professor at the University of Eastern Piedmont (Italy) where she teaches Marketing and Tourism Management. She was a Visiting Researcher at Sheffield Hallam University (UK). Her current research interests include quality, network and entrepreneurship, and tourism marketing. She can be contacted at Dipartimento di Studi per l’Impresa
e il Territorio, Via Perrone 18, 28100 Novara (Italia); tel: ++39(0)321375.422- fax. ++39(0)321375.405; email: [email protected].
Ian D. Rotherham (PhD in Pure Science, University of Sheffield) is Reader and Director of the Tourism and Environmental Change Research Unit at Sheffield Hallam University (UK). He leads a team of postgraduate researchers and has long-standing interests in regional regeneration and the economic impacts of nature- and heritage-based tourism. He can be contacted at Tourism and Environmental Change Research Unit (Sheffield Hallam University) City Campus Sheffield S1 1WB; Tel: ++44(0)114 2252874; email: [email protected].
I n t e r n a t i o n a l J o u r n a l o f M a n a g e m e n t C a s e s
172
SERVICE QUALITY AND TRAINING: A PARADOX
DES MONKUNIVERSITY OF CENTRAL LANCASHIRE, UK
DANIELLA RYDINGUNIVERSITY OF CENTRAL LANCASHIRE, UK
Abstract
This paper examines the role that staff training has to play in terms of creating consumer loyalty in the UK’s coffee shops. Previous work (including that by Armistead and Kiely, 2003) has suggested that perceptions of service quality are raised when staff are trained effectively. More specifically, within the coffee shop sector a number of authors (including Cravens and Piercey, 2003) have suggested that it would be rational for firms to spend money on training all staff, to ensure that customers get a memorable experience and return to that same firm.
However, there is a paradox here in that substantial numbers of coffee shop employees, especially front-line baristas, are employed on what Atkinson (1984) has described as peripheral job contracts, i.e. they are part-time and/or temporary and as such, they have traditionally enjoyed little by way of job security or voice or training. The paradox in the title refers to this phenomenon and raises the question, “Is it rational for coffee shops to provide substantial training for all employees, even if they are employed on peripheral contracts?”
A qualitative methodology is employed to examine this question. In particular, customer focus groups were contacted and management representatives of coffee shops answered questions about the quantity and quality of training provided.
By way of conclusion some policy options are examined regarding the range of training strategies available. Some directions for further research are also identified.
Keywords
Service quality/loyalty/training/baristas
Introduction: The Importance of Customer LoyaltyIn today’s dynamic global environment, changing demographics and lifestyles and advancements in communications and information technology have led to vast changes in consumer needs and expectations. It is becoming crucial, in this volatile environment, for companies to gain a competitive advantage by increasing loyalty through improved consumer satisfaction, (Reicheld and Sasser, 1990). For the purposes of this paper, customer satisfaction is assumed to be “…. a summary cognitive and affective reaction to a service or incident from experiencing a service quality encounter and comparing that encounter with what was expected”, (Rust and Oliver, 1994: p3). Moreover, Heskett et al (1997) as cited in Silvestro and Cross (2000) make reference to the service profit chain which stipulates there is a strong correlation between profit; growth; customer loyalty; customer satisfaction; the value of goods and services delivered to customers; service quality and employee capability.
Many factors may contribute to satisfying or exceeding the expectations of a consumer group. For the purpose of this paper however, two interrelated dimensions will be examined; the importance of service quality and employee training. These issues will be examined within the UK coffee shops, since this growing industry is deemed as being extremely competitive and lucrative (Barton, 2007). In particular, this paper attempts to answer the question, “Is it rational for coffee shops to provide substantial training for all employees, even if they are employed on peripheral contracts?”
173
I n t e r n a t i o n a l J o u r n a l o f M a n a g e m e n t C a s e s
The Context: The UK’s Coffee ShopsThe coffee shop market experienced rapid growth between 1999-2004, as it expanded by 109%, (Mintel, 2005). In the UK, Costa Coffee is the leading coffee shop brand with a 16% market share, (Gibbons, 2002, as cited in Coleman & Ingram, 2004). The main competitors include Starbucks which has 15 % share, followed by Café Nero at 6% and Coffee Republic at 5 %. Further research conducted within this market, clearly demonstrates that survival and achieving some sort of loyalty base is dependant on numerous value adding capabilities, such as providing quality products, in an inviting environment, where customer service and improving the overall service experience is crucial for building long term relationships, respect and credibility amongst the target groups, (Ryding et al, 2006).
Service Quality and Employee TrainingIt is evident that service firms today are under tremendous pressure to compete and improve efficiency without sacrificing the quality of the service provision. If we adopt Heskett’s account of the service profit chain, it is clear that customer loyalty, achieved through customer satisfaction, is really dependant on a well managed service provision which certainly includes (in this context) the capability, knowledge and motivation of barista employees. Where staff are trained effectively and committed to providing a high quality of service, there is evidence to suggest that customer service levels and perceptions of service quality are raised significantly, (Armistead & Kiely, 2003). However, coffee shops as well as most corporate hospitality firms are typical of what Atkinson (1984) describes as a flexible firm, employing a mixture of core employers (such as mangers) but also relying on vast numbers of peripheral employees (such as part-time or temporary employees). It may be that service managers adopting this model, might expect lower levels of employee commitment from their peripheral staff, including their baristas, which may consequently lead to lower service levels.
Training All Coffee Shop Staff: Some Problems Of course, one might argue that the issue of training employees, especially front-line workers in the UK is likely to be fraught with difficulties, despite its
potential to improve competitive advantage. Unlike many other European countries (notably France) firms in Britain do not have to comply with laws which force employers to spend a certain amount of their wage bill on training. Indeed, employers in this country do not even have to declare the extent of their annual spending on training. Nevertheless, a typical estimate (e.g. in Thomson et al, 2001), would be that 0.15% of a British employers’ wage bill is spent in this fashion, which compares to the 1.2% that is required by French legislation.
In the meantime, as Messenger (1997) and Bryon et al (2000) point out, the retail industry is an important and growing part of the British labour market and provides approximately 10% of our employment. However, as Messenger suggests, it is characterised by a heavy reliance on part-time workers and yet training budgets are skewed toward core employees. She estimates that 52% of all retail employees are part-time and it seems plausible to suggest that this reliance on peripheral staff is mirrored in that part of the retail trade that is taken up by the coffee shop industry. Similarly, writing about another related industry (corporate hospitality), Cox (2006) has pointed out that employing a high proportion of peripheral staff might pose problems in that such employees might be less committed than their core worker counterparts. Cox was writing about the problems of employing larger numbers of temporary staff in the context of providing corporate hospitality to a large sporting event but his concerns about peripheral staff are surely relevant here. More generally, as Thomson et al (2001) point out, training budgets in the UK have been historically skewed towards those doing managerial jobs, or those aspiring to such positions (for example, on graduate training schemes).
MethodologyTo test the central research question outlined above, it was felt necessary to triangulate the data collected. Such a triangulated approach would make any observations more robust and reliable. Thus, the picture emerging from the secondary sources alluded to earlier was compared with two other primary sources, namely, from customers themselves and managers of multiple coffee shops.
Two focus group sessions were held in 2006; one of these comprised customers under the age of 30

I n t e r n a t i o n a l J o u r n a l o f M a n a g e m e n t C a s e s
174
and the other group represented customers in the 30-50
age bracket. Both groups had 5 people in them; discussion was video recorded and subsequent themes were analysed. The discussion was essentially free flowing as one would expect (Saunders et al, 2003) but “kick started” by a few prompt questions, which in turn reflected the issues raised in the literature. The reason why two age-bound groups were chosen related to a key finding of Ryding et al (2006), who suggested that in the UK a key consumer group is aged under 30 and that the age group 30-50 is the next most important, in terms of turnover. By having separate groups like this, it was possible to see if the issues deemed to be important by customers were themselves age specific.
The replies from the focus groups presented a demand side picture and this was contrasted with a supply side picture by questioning two coffee shop managers. Like the focus groups, these interviews with coffee shop managers were held in the north west of England. It is important to say that the interviews with coffee shop managers (also carried out in 2006), were done independently of the customer focus groups. The managers knew that focus group sessions were to be done but were not told the results. The two firms contacted were Starbucks and Costa Coffee, i.e. two of the four major coffee shop retailers in the UK market.
Results
a) Customer Focus Groups
The first point is that there were far more similarities than differences between the two focus groups. When asked about the reasons for choosing coffee shop chains as a place to consume food and drink, the purpose of the visit across both groups was to predominantly “escape”, and consume products in comfortable surroundings. Typical responses included the following;
“I go to stay and sit in and have a chat that’s why I like Starbucks and there are comfy sofas that you can sit on and relax.” Respondent - Group 20-30 years
The second point is the majority of customers suggested that they were not particularly loyal to
one chain over another. Thus, one respondent in the 31-50 year age bracket commented:
“I tend to use Starbuck’s and Costa Coffee, but it depends where I am and what I am doing. When travelling I tend to stick to the chains because I know them.”
Thirdly, findings across both groups indicate that location for coffee shop outlets is a key critical success factor for business strategy. In the 31-50 year group one consumer commented:
“It’s the one nearest to where I am really.”
However, whilst convenience and location do play a key role, consumer satisfaction is reliant on other key variables. Of these variables, physical environment and service quality emerged as key themes. This reinforces the point made above, that achieving some loyalty base within this sector is dependent on numerous value adding capabilities, (Ryding et al 2006).
On the subject of physical environment the following was a typical comment.
“In Café Nero, there are some pictures on the walls of what I am assuming are Italian people just sitting there sipping expresso’s and stuff. There’s kind of this image that goes along with these places, especially in Café Nero, it’s got that and it makes you want to be part of it.” Respondent –Group 20-30years
Customer service and staff attitude also emerged as influential variables. Indeed, all respondents from both groups commented on the importance of customer service and on the method of service delivery:
“I just expect to be treated fairly quickly to get through the queue and when they pass me from one person to another, that there’s a logical sequence that they know the person who has taken my order has passed it on to the next person and they know exactly what that order is.” Respondent-Group 31-50 years.
Moreover, it also became evident that whilst respondents felt customer service was important whilst they were waiting to be served, consumers wished to be left alone once they had purchased their food and drink
“I wouldn’t want anyone pestering me.” Respondent-Group 31-50years
175
I n t e r n a t i o n a l J o u r n a l o f M a n a g e m e n t C a s e s
When the question of how knowledgeable staff should be was posed, most respondents from both groups refuted the idea that extensive knowledge was relevant in this sector. Respondents did agree that whilst a certain amount of basic knowledge was important;
“Sometimes I might ask questions like what’s a frappuccino and I’d expect them to know.” Respondent-Group 20-30years
However, respondents did not feel that it was essential for staff to have a deeper insight into product knowledge, than is currently the case. Interestingly however, the point was made that this is connected with the issue of cultural expectations and in the future it is possible that British consumers may expect service from more knowledgeable baristas. When asked about this issue, one respondent commented:
“But you know I think it’s also to do with the fact that nobody has cared about the history. I do think I would be interested if a barista was to recommend a coffee bean type. If they were to say oh this one is from Morocco, it’s nice, it’s got health benefits, I’d think about it. That little bit of knowledge, you would expect a little bit more every time and it would build up this culture of expecting knowledge. Why shouldn’t we have a nice experience of drinking coffee?” Respondent –Group 20-30years
(b) Interviews with store mangers
One key finding of this research was that all of the employees at both stores receive at least a basic level of training, even if many of them do not progress beyond this level. Moreover, the evidence is consistent with Barnham (2004), in that training was essentially deemed to be a devolved responsibility. Within the retail coffee chains, individual store managers make operational decisions about the pace of training and whether or not an employee has acquired sufficient knowledge to “sign off” a given competence. In the case of both of the firms contacted, barista training is centred on a workbook that the staff went through, learning on-the-job. In both companies, such front-line staff were paid as they learnt on-the-job but did not go on dedicated off-the-job training courses. Typically, it would take a member of staff approximately 6-8 weeks to complete this workbook, assuming that they were working 8-12 hours per week.
In both stores, the majority of staff (approximately two thirds) were front-line, part-time workers, paid the national minimum wage rate of ₤5.35/hour (or in the case of Starbucks, ₤5.45/hour). Again, in both stores, it was the case that the (full-time) managers (or assistant managers) would be given the opportunity to attend off-the-job training that their part-time colleagues did not have access to. Indeed, at one of the stores contacted, the manager said that there was no dedicated training budget for front-line staff, though she did concede that they were not expected to train in their own time. By implication therefore, in opportunity costs terms, we can say that to achieve a basic level of competence as a barista, costs that firm approximately £250 per member of staff (i.e. assuming that they took 6 weeks at the rate of 8 hours per week to complete the workbook, at a wage of £5.35/hour). At the other store, the manager explained that 2% of his net turnover could be used explicitly for training (widely defined to include meetings about new products). In this particular store, this would amount to £ 2800 per annum in total or £165 per person per year. Such an estimate would cover basic barista training and other types of management and supervisory training. He admitted, as did his colleague in the rival store, that many employees did not want to go beyond basic front-line training. Thus many of the front-line staff may not actually do much training in a given year, beyond being given a familiarity with new products at briefing sessions. One important point here is that in neither firm did barista wage rates rise on completion of the workbook.
It is worthwhile describing the organisational structure of the two coffee stores, as this also illuminates some of the problems of training peripheral workers. Both the Starbucks and Costa Coffee stores had a manager and an assistant manager with 10 baristas. The difference was that the Starbucks store had, in addition, employed 5 supervisors; of these supervisors, three were full-time and the other two were part-time. In both stores, the managers and assistant managers were full-time, as one might expect. However, the baristas were all part-time and typically, footloose. Indeed, at the Costa Coffee store, the manager pointed out that staff retention formed an explicit part of her staff appraisal that was conducted twice a year; if retention targets were achieved, she received a bonus equivalent to 1.5% of her salary. In that firm, staff turnover was typically 20% per annum compared to 15% in Starbucks
I n t e r n a t i o n a l J o u r n a l o f M a n a g e m e n t C a s e s
176
and an industry average of 30% (Personnel Today, 2006). Both managers mentioned that the majority of their baristas were students. In addition, the Starbucks manager described a further problem in that if an employee did not report for work for four consecutive weeks, then their contract of employment was terminated. Of course, it is highly likely that during the summer holidays young people studying at a university away from their hometown would not go to work as a barista for a number of weeks and so this arrangement added to the problem of staff retention. Such footloose behaviour raises issues about the value of barista training from an employers’ perspective.
In both stores, the managers suggested that, from a company perspective, the major purpose of barista training was to achieve consistency. This is clearly an important consideration in the context of branding and customer expectations, which were discussed earlier. According to both managers, customers expect a given standard of food or drink in their stores; a desire to maintain customer loyalty accounted for the reason that basic barista training is given. However, as both managers admitted, there is an irony here in that to achieve a consistency of a given type of coffee (for example an expresso), it would be quite simple to have staff press the appropriate buttons on a piece of equipment but that would be to do away with the “theatre of coffee making”, as one manger put it (in an interview held in November 2006). Both managers also agreed that their organisations wished to grow but that the way to achieve that growth was not primarily via staff training but rather through other methods such as strategic alliances. Thus, Starbucks had formed an alliance with Borders (the bookstore chain) whilst Costa Coffee had previously linked itself with the Abbey National and more recently had formed an alliance with Waterstones. In the context of growth, location was also viewed as a prime consideration and the Starbucks manager pointed out that they had recently strived to establish more stores in airports around the world, as part of the company’s desire to double the number of stores in the next five years. Similarly, the Costa Coffee manager pointed out that that firm had also renewed its determination to establish a presence in leading shopping malls.
In neither case was this training externally accredited, by schemes such as the NVQ system alluded to earlier, although in one of the companies there had been some discussion of such a
development. Within that company, employees were given a badge to denote that they had achieved a basic level of competence and a further badge when they had achieved the next level of competence; this system represented a version of internal rather than external accreditation. In Becker’s (1962) terminology, barista training is firm specific; employees could not expect that it would be given credence in rival firms.
ConclusionThis is a small data set and any conclusions must necessarily be tentative. However, it is interesting that the supply and demand pictures presented above are remarkably consistent; the results would seem to possess a certain level of validity. The UK’s coffee chains do provide training to all of their employees. However, this training is firm specific and rather basic. In terms of maintaining customer loyalty it would seem that this is all that is required. In the meantime, Graham (2006) has talked of the importance of “eatertainment” and others (Messenger, 1997; Craven and Piercy, 2003) have suggested that spending more on staff training is a key strategy to improve service quality and consumer loyalty in the catering industry. By contrast, these results suggest that a modest level of staff training is all that is expected by customers in this particular sector. In that sense, there would seem to be an innate difference between what experience customers expect in a coffee shop, compared to expectations in a restaurant. Whilst it might (from a firm’s perspective) represent a sound investment of resources to spend more than a few hundred pounds per employee per year on training chefs or sommeliers, this is not the case in this industry. Thus, to answer the question posed at the outset of the paper, it would not seem rational for British coffee shops to provide substantial training for all of its employees.
One caveat mentioned above should be repeated here. Customer trends are subject to volatility and this is especially true in a sector like this; it may well be that customer expectations change in the future such that they demand more of coffee shops. In such circumstances, it could be that more training will be necessary for all employees, including those on peripheral contracts.
Finally, to help contextualise these findings, it would be interesting to compare the British experience with that found in other countries, especially

177
I n t e r n a t i o n a l J o u r n a l o f M a n a g e m e n t C a s e s
those with a long-established coffee culture. This comparative element will inform future research in this area.
ReferencesAdnett N. (1996) European Labour Markets London: Longman
Armistead, C. & Kiely, J. (2003) Creating strategies for managing evolving customer service Managing Service Quality Vol. 13 Issue 2 pp. 164-170,
Atkinson, J. (1984) Manpower strategies for flexible organisations Personnel Management August, pp.28-31
Barnham, M. (2004) Time for training Caterer and Hotelkeeper Vol. 193 Number 4317, pp. 30-33
Barton L. (2007) Go froth and multiply Guardian 25th January, 2007, pp. 4-7
Becker, G. (1962) Investment in human capital: A theoretical approach Journal of Political Economy LXX, Vol. 5 Issue 2 pp. 9-49
Bryon, J., Harris, J. & Parker, C. ( 2000) Training the independent retailer: An audit of training needs, materials and systems Journal of European Industrial Training Vol. 24 Issue 7 pp. 366-373
Confederation of British Industry (CBI) (1994) Who Pays for Training? London: CBI
Cox, S. (2006) Exploring organisational commitment in the corporate hospitality industry The 3rd International Customer Behaviour and the Retailing Research Conference: Conference Proceedings, Zagreb: University of Zagreb
Coleman, G. and Ingram, H. (2004) A new approach to benchmarking learning and development strategy International Journal of Contemporary Hospitality Management Vol. 11 Issue 1, pp.11-22
Dawson, M. (2005) Costa’s “filter” gets the right employees Human Resource Management Vol. 13 Issue 4 pp. 21-22
Dillon, F. (2006) Wake up and smell the coffee Sunday Times 16th April, p.11
Cravens, D. and Piercy, N. (2003) Strategic Marketing (7th ed) New York:McGraw Hill
Eraut, M. (2001) The role and use of vocational qualifications National Institute Economic Review Vol. 178 Issue 1 pp. 88-98
Graham, D. (2006) Work in progress: Discussion paper-Relationship marketing in contemporary restaurants The 3rd International Customer Behaviour and the Retailing Research Conference: Conference Proceedings, Zagreb: University of Zagreb
Grugalis, I.(2003) The contribution of National Vocational Qualifications to the growth of skills in the UK British Journal of Industrial Relations Vol. 41 Issue 3 pp. 457-475
Handy, C. (1985) Understanding Organisations London: Penguin
Heskett, J. Sasser, W and Schlesinger, L (1997) The Service Profit Chain, New York: Free Press
Lindbeck, A. and Snower, D. (1988) The Insider/Outsider Theory of Employment and Unemployment London: MIT
Messenger, S. (1997) NVQs and the retail industry- the experience of implementation Education and Training Vol. 39 Issue 1 pp. 14-23
Monk, D. (2004) Information and communications technology training for British librarians: Why is it so difficult to complete? European Business Review Vol. 16 Issue 3, pp. 307-313
Personnel Today (2006) Sector insight: coffee beings, http://www.personneltoday.com, (accessed 16.07.06)
Piore, M. & Doeringer, P. (1971) Internal Labour Markets and Manpower Adjustment Lexington, Mass: D.C. Heath
Rajan, A. & Fryatt, J. (1988) Create or Abdicate: The City’s Human Resource Choice for the 1990s London: Witherby
Reichheld, F. & Sasser, W. (1990) Zero defects:quality comes to services Harvard Business Review Vol. 68 (Sept-Oct) pp. 105-111
Ryan, P. & McNabb, R. (1990) “Segmented labour markets” in D.Sapsford and Z. Tzannatos (eds) Current Issues in Labour Market Economics, Basingstoke: Macmillan
I n t e r n a t i o n a l J o u r n a l o f M a n a g e m e n t C a s e s
178
Ryding, D. V., Vignali, G. & Gordon, C. (2006)Corporate culture and brand communications for sustaining loyalty in the UK coffee market The 3rd International Customer Behaviour and the Retailing Research Conference: Conference Proceedings, Zagreb: University of Zagreb
Rust, R. T & Oliver, R.L. (1994) Service Quality: New Directions on theory and practice, London: Sage Publications
Shackleton, J. (1992) Training too Much ? London: Institute of Economic Affairs
Silvestro, R. & Cross, S. (2000) Applying the service profit chain in a retail environment:Challenging the satisfaction mirror International Journal of Service Industry Management Vol. 11 pp. 244-268
Stevens, M. (1994) Labour contracts and efficiency in on-the-job training Economic Journal, Vol. 104 pp. 408-419
Thomson, A., Mabey, C., Storey, J., Gray, C. & Iles, P. (2001) Changing Patterns of Management Development Oxford: Blackwell

179
I n t e r n a t i o n a l J o u r n a l o f M a n a g e m e n t C a s e s
CREATING A CROSS-CULTURAL KNOWLEDGE PUMP
DOLORES SANCHEZ BENGOALEEDS METROPOLITAN UNIVERSITY, UK
HANS RÜDIGER KAUFMANNINTERCOLLEGE, CYPRUS
Abstract
Knowledge has been identified for many decades as the most valuable asset a company has. Even before popular management terms like core competences, best practice or learning organization became en vogue, successful companies knew that their success relied on the ‘heads’ of their employees.
The more surprising it appears that many international strategic alliances, especially, between companies coming from Western and Central and Eastern Europe (CEE) face serious problems to efficiently transfer management knowledge across borders (Sanchez-Bengoa, 2006). It seems that a purely cognitive approach does not suffice to solve the problems at hand. This paper represents work in progress and reflects the critical discussion of concepts consecutively found by the researcher to be relevant. Results of a comprehensive literature review suggest knowledge management transfer methodologies to take, besides the ‘heads’, increasingly cultural aspects and the ‘hearts’ of international employees into account, hence, integrating affective and conative approaches to a larger extent. Currently, the organizational capability for knowledge and organisational memory creation is gaining momentum in management science. One of the key success factors for cross-cultural strategic alliances related to knowledge management transfer is the process of gathering information and knowledge and storing it in an intelligence pool, where its content is understood, connected, disseminated and exploited among the alliance’ members. This paper suggests a 7 step approach to create and use this pool. These key elements will constitute the core of the strategic alliance organizational memory and its resonance as a basis for concerted and successful action. They will serve as a ‘knowledge pump’ for the dissemination
to and usage by all the alliance’s members. Based on a discussion of more generic theories relating to KMT the future empirical research is based on a phenomenological research design applying the case study approach in different transitional as well as established economic settings in German speaking countries to allow for possible differentiations. The findings of a case study in St. Petersburg/Russia, conducted in March 2007, will be presented.
Keywords: cross-cultural strategic alliance, knowledge management transfer, culture and learning
IntroductionIn the last decades the internationalisation process is on top of the strategic agendas of many companies. Many factors and motivators came together in order to trigger this need, e.g. the removal of national protectionist trade policies, the deregulation of international fiscal and monetary markets, the communication revolution and, most influentially, has been the transition of former communist/socialist countries to capitalist market economies (Hutchings and Michailova, 2004). Due to the companies’ expansion and, consequently, movements of labour and capital the processes of cross - border transfer of knowledge (know-how), knowledge sharing and learning have become of paramount importance.
Knowledge has been identified for many decades as the most valuable assets a company possesses. Drucker (1999) and Raich (2000) suggest that before terms like core competences, best practice or learning organization were en vogue, successful companies knew that their own success relies on the ‘heads’ of its employees, in other words, on the employees´ knowledge. In line with this statement Harris (2001 quoted in Ford and Chan, 2003, p.12)
I n t e r n a t i o n a l J o u r n a l o f M a n a g e m e n t C a s e s
180
agrees that knowledge is a resource kept in the mind of the employees but, even more, “is possibly the only resource that, when used, can enhance the value of other capital and does not diminish in value”. Also, Alavi and Leidner (2001 quoted in Ford and Chan, ibid) stress the necessity to apply knowledge not only to increase its value but also to avoid its loss. In a time of a dizzily swift and continuously changing international macro environment the organisational capacity to create knowledge comes and the process of gathering information and knowledge in an intelligence pool where the content of it is understood, connected and exploited, comes to the fore (Baets, 2005). Regarding the materialization of this stored knowledge Davenport and Prusak (1998) recommend to convert it into organisational routine, processes and norms.
Data, information, knowledge and knowledge management: a developmentScholars differentiate between data and information although belonging to the same family.
Data is thought of as raw material being conditional for information (Ford and Chan (ibid.) or a set of discrete, objective facts (Davenport and Prusak (ibid.) whereas information is seen as organised data being meaningful for the recipient (Ford and Chan, opcit.) and defined as a message (Davenport and Prusak, opcit.).
Nowadays, due to the internationalisation dynamics and constant changes, trends are changing and what was earlier referred to as a group of processes of information is now elaborated to a knowledge creation system (Baets, ibid.). This systematic perspective is confirmed by López, Peón and Ordás (2004) holding that, due to a global approach, a knowledge strategy is affecting all areas of a company.
Knowledge is defined by Davenport and Prusak (opcit., p.5) as “a fluid mix of framed experience, values, contextual information, expert insight, and intuition that provides an environment and framework for evaluating and incorporating new experiences and information. It originates and is applied in the minds of knowers. In the same vein, Raich, (ibid., p.199) suggest that “knowledge is very often mixed with insights, intuitions, assumptions, opinions and even prejudices”. Additionally, he underlines that knowledge has meaning only in a defined context,
if this context is changed the transfer of this knowledge can be perturbed and originate often misunderstanding, wrong interpretations or even resistance to learn it. Supporting this criticism Matlay, (2001, p.3) question the effectiveness of this process of transfer, and he states that “ the knowledge imported from the West and applied to local circumstance with little if any thought as to its relevance or effectiveness”. In relation to the resistance to learn Child and Markoczy, (1993, p.11) also criticise that “about the term forced refers to how learning is brought about and not necessarily to how the process is perceived by those on the receiving end” having negative implications as to cognitive change and personal acceptance. This view is confirmed by Streatfield and Wilson (1999, p.67) arguing that “knowledge is not a thing that can be managed. It is a capacity of people and communities, continuously generated and renewed in their conversation, to meet new challenges and opportunities. People responsible for knowledge value creation can be inspired and supported, but they can not be managed as people were managed in the industrial era, as mere extensions of the machinery”. This criticism is shared by Por, (1997, quoted in Streatfield and Wilson ibid, p.67) highlighting a clear cut between the management of information and the management of people: “ we cannot manage knowledge directly- we can only manage information about the knowledge possessed by people in organisations. Even then the information to be managed is necessary incomplete because the boundaries of personal knowledge are fuzzy and continually changing as individuals get out of touch or extend their knowledge”.
From these statements it becomes apparent that culture comes into play, i.e. due to an often existing lack of construct equivalence. Knowledge is created in each individual mind although very often influenced by societal norms, common practices or organizational cultures. Due to these influences Raich, (opcit.) criticises that many authors writing about knowledge or KM do not take into account to defining the meaning of knowledge and assume that other people will understand this widely used term in the same way. This view also refers to the ethnocentric and structuralist approaches of KMT (i.e. Clark and Geppert, 2002; Lang and Steger, 2002). So far, it can be concluded that KMT should focus on innovative methodologies assuring the understanding of meaning against a diverse cultural but also individual background. For a comprehensive analysis of the influence of cultural
181
I n t e r n a t i o n a l J o u r n a l o f M a n a g e m e n t C a s e s
dimensions and cultural diversity on KMT, please, refer to Sanchez-Bengoa and Kaufmann (2006).
Knowledge managementAs mentioned previously knowledge is the most valuable asset companies have and successful management of it will increase the competitive advantage of the company or nation (Hoffman, Hoelscher and Sherif, 2005; Porter, 1980).
A comprehensive definition of knowledge management is going to be developed by referring to a variety of perspectives.
From a financial point of view Bokowitz and Williams (1999) highlight higher levels of corporate wealth (in terms of profits by lowering the cost base) or liquidity (in terms of cash flows) and a higher degree of efficiency and effectiveness of corporate processes mainly due to routine effects.
The components of knowledge management are suggested by Hoffman, Hoelscher and Sherif (ibid.) entailing:
Generation and discovery of knowledge•
Knowledge capture (scanning, organizing and • packaging of new knowledge)
Codification •
Transfer•
In addition, Turban (2003, quoted in Hoffman, Hoelscher and Sherif (ibid., p.2) suggests to facilitate the sharing of knowledge as a prerequisite for its application throughout the company.
Moreover, O’dell (quoted in Holsapple, 2003) complements these definitions by calling for a common space and system as a basis for employees to share their respective knowledge and to generate new knowledge.
Knowledge as a power resourceThe following views might have a detrimental bearing on knowledge management transfer, especially on knowledge sharing in cross border strategic alliances implying significant higher levels of uncertainty and mis-trust.
According to Garvin, (2000 p. 205) “knowledge is power, and shared knowledge usually means less power”. This finding also resulted from Michailova’s and Husted’s (2003 quoted in Hutchings and Michailova, 2004, p.3) research on knowledge sharing between Russian and Chinese subsidiaries and Western headquarters stating “that knowledge sharing is often defeated by what they term as knowledge sharing hostility”. Referring implicitly
to implications of cultural misunderstanding and un-reflected transfer approaches the authors suggest three reasons for this hostility:
the behaviour of the knowledge transmitters1.
the behaviour of knowledge receivers2.
the transmitter’s and receiver’s shared 3. understanding of the content
The transmitters’ behaviour will have a deep impact (positive or negative in nature) on the openness for knowledge sharing. Michailova and Husted (ibid) suggest that knowledge hoarding or knowledge keeping will depend on the transmitter’s behaviour.
Knowledge hoarding, for example, reflects a mechanism for coping with uncertainty as well as, a high respect for hierarchies and formal power. These views might point to the necessity to differentiate knowledge management transfer conceptualisations as to various degrees of investment and control in strategic alliances.
In order to overcome this problem leaders and managers have three options as recommended by Garvin (ibid., p.205):
a. “they can alter incentives, rewarding individuals if they share the knowledge with others
b. they can redesign work processes, legitimizing knowledge sharing as a form of behaviour
c. they can impose policies and directives that require managers to seek help from others in order to complete their assignment”.
The importance of knowledge sharing is further underlined by the social capital theory (SCT) which is described in the following paragraph.
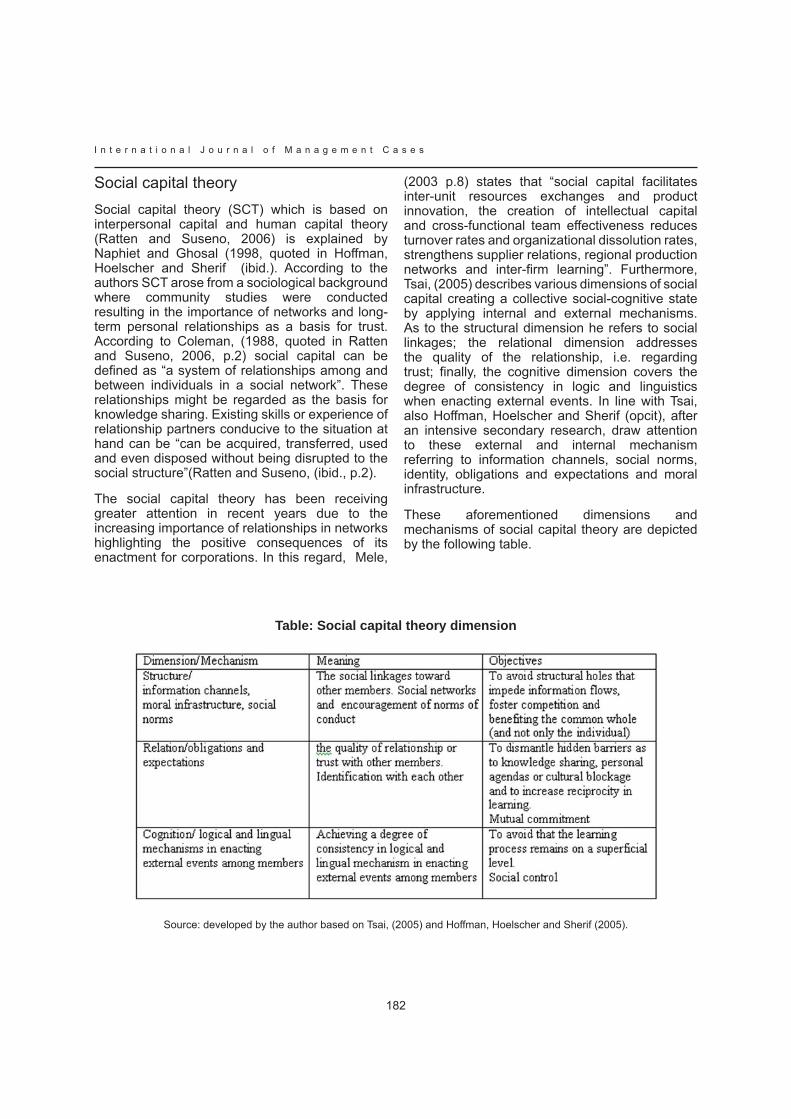
I n t e r n a t i o n a l J o u r n a l o f M a n a g e m e n t C a s e s
182
Social capital theorySocial capital theory (SCT) which is based on interpersonal capital and human capital theory (Ratten and Suseno, 2006) is explained by Naphiet and Ghosal (1998, quoted in Hoffman, Hoelscher and Sherif (ibid.). According to the authors SCT arose from a sociological background where community studies were conducted resulting in the importance of networks and long-term personal relationships as a basis for trust. According to Coleman, (1988, quoted in Ratten and Suseno, 2006, p.2) social capital can be defined as “a system of relationships among and between individuals in a social network”. These relationships might be regarded as the basis for knowledge sharing. Existing skills or experience of relationship partners conducive to the situation at hand can be “can be acquired, transferred, used and even disposed without being disrupted to the social structure”(Ratten and Suseno, (ibid., p.2).
The social capital theory has been receiving greater attention in recent years due to the increasing importance of relationships in networks highlighting the positive consequences of its enactment for corporations. In this regard, Mele,
(2003 p.8) states that “social capital facilitates inter-unit resources exchanges and product innovation, the creation of intellectual capital and cross-functional team effectiveness reduces turnover rates and organizational dissolution rates, strengthens supplier relations, regional production networks and inter-firm learning”. Furthermore, Tsai, (2005) describes various dimensions of social capital creating a collective social-cognitive state by applying internal and external mechanisms. As to the structural dimension he refers to social linkages; the relational dimension addresses the quality of the relationship, i.e. regarding trust; finally, the cognitive dimension covers the degree of consistency in logic and linguistics when enacting external events. In line with Tsai, also Hoffman, Hoelscher and Sherif (opcit), after an intensive secondary research, draw attention to these external and internal mechanism referring to information channels, social norms, identity, obligations and expectations and moral infrastructure.
These aforementioned dimensions and mechanisms of social capital theory are depicted by the following table.
Table: Social capital theory dimension
Source: developed by the author based on Tsai, (2005) and Hoffman, Hoelscher and Sherif (2005).
183
I n t e r n a t i o n a l J o u r n a l o f M a n a g e m e n t C a s e s
When applying the suggested mechanism related to the respective dimensions the social capital theory is regarded as beneficial and recommendable for knowledge transfer processes in strategic alliances. Each dimension is perceived to contribute to the coherence of the alliance members. Nevertheless, it is suggested that all dimensions should be addressed to have an effect on efficiency and effectiveness of the strategic alliance. For example, by having hidden agendas it is very difficult that the members of the alliance develop trust. Without trust is impossible to create a new common identity and this relationship will turn to a superficial connection, which is bound to fail. A new alliance identity is seen to be the fertile ground for sharing and newly creating knowledge as well as for reciprocal learning.
Synergies from different types of knowledgeThe social capital theory will be used to explain the different types of knowledge and the arising synergies. Using the SCT and its impact on alliance learning, Ratten and Suseno, (ibid) identified two different types of knowledge: a) the market specific knowledge and b) the firm specific knowledge.
Market specific knowledge refers to the concrete information that affect the way of doing business in an specific market, ranging from local business practices, do’s and don’ts in management behaviour as well as macro-environmental factors.
Firm specific knowledge relates more to the knowledge assets of a company consisting of the know-how in manufacturing a product or the experience of its employees. Ratten and Suseno (opcit., p.5) suggest that “firm specific knowledge is more of tacit nature and is a result of the organization as a whole internalising and combining its knowledge”. Using synergy between the strategic partners will contribute to get very quick and first hand market-specific knowledge of utmost importance in a time of shortening product life cycles. According to Adler (2002) synergistic advantages related to market-specific knowledge refer to better understanding of local employees, more effectively meeting the needs of local clients and increased understanding of local, political, legal, economic, and cultural environment as a basis for internationalisation strategies.
Building organizational memory for cross-border strategic alliances
Based on Peters (1996, quoted in Chen, 2005), Kruse (2003) and Oertenbal (2004) the following definition of organizational memory is provided: organizational memory is the ability acquire, retain, and retrieve knowledge and expertise for practical application. These phases of building organizational memory in a strategic alliance are very important because:
a) they will capture and store all the valuable information and knowledge possessed from each partner
b) they will store the combination of knowledge and, consequently, the creation of new knowledge between the partners.
This newly created knowledge with its mistakes and successes must be stored as the bases for the continuous development of the alliance in order to, a priori, avoid a possible failure and building the relationship on successes. Chen (2005) blames Chinese companies that they, due to their fast-growing rate and concentration on markets and customers demands, lack the time to collect and accumulate these very precious experiences and knowledge. Relating to the necessary property of knowledge resources, Örtenblad, (2004, p.7) highlights an advantage of organizational memory: “ by storing knowledge in the organizational memory, the organization is made less vulnerable to personnel turnover”. This is achieved thanks to processes designed around shared understanding, norms and values and it is taken for granted for the members as an integral learning part of their work. In the process of building organizational memory, Collison and Parcell (2001) recommend to capture knowledge being context orientated and in doing so, multiplying the benefits. Additionally they highlight the need to quickly elicit key learning themes for the actors to accelerate learning.
All the knowledge and information should be gathered in an information-knowledge system ready to be used for all the members of the strategic alliance. This information-knowledge system will be a technological tool for the actors to retrieve and use the knowledge. Attention has to be paid to the development of this IT tool, since for many actors the usage of new technological tools is often problem laden. This information system should be developed user-friendly and offer the opportunity

I n t e r n a t i o n a l J o u r n a l o f M a n a g e m e n t C a s e s
184
to provide some kind of training to help the users to maximize the potential of the system.
The authors recommend that the information system could embrace different design elements:
a) Technological and contextual: The installation of a Strategic Alliance Master Program (SAMP) for the exclusive usage of the alliance members. It should enable all the members to have easy access to all types of searchable documents (alliance´ publications –existing or commonly developed-, texts, email, web pages, interesting scanned paper according to the subject, news and developments of the alliance, members` profile for familiarizing purposes. Related to communication, programs like Skype for increasing networking and quick flows of information as well as, video-conferencing are highly recommended.
b) Distributive: The dissemination of the SAMP can be done by following the 3Ps of knowledge dissemination suggested by Holsapple (2003, p.112) “Pull, Push, Point. Pull refers to individuals going to a knowledge repository and requesting information. Push refers to knowledge being sent to one or more individuals as it becomes available. Point refers to receiving instructions on where to find knowledge”.
c) Physical: The availability of a discussion room where constantly sessions of joint work, understanding/explanations of procedures, questions and answer, discussions of interesting topics, experimenting and sharing of feelings can flow freely in a knowledge creation area. This suggestion is supported by Kaser and Miles (2002, quoted in Sharkie, 2005, p.40) stating that “ in order to get high levels of conversation, co-operation and knowledge sharing, management has to provide opportunities for workers to interact with others to develop sufficient levels of trust to enable this cooperation and sharing to proceed”.
After having applied and tested the knowledge it is very important that the users have the capacity and the time at their disposal to reflect on it in order to re-design and improve knowledge on a long-term basis. According to Nadler, (1992) performance
pressure to achieve short term objectives as well as the views of some senior managers that reflection is a luxury will lead to an insufficient capacity to reflect and, consequently, to innovate. Moreover, it is also suggested to commonly develop new approaches having sufficient time as individualistic organizational procedures among different strategic partners could be outdated an even counterproductive for the alliance’ efficiency.
A positive case is provided by Nadler (1992, p. 181): “Toyota engineers spent more than six months riding through the street of Tokyo with the users of the company`s existing van, who were predominantly owners of dry cleaners and small grocery stores. The Toyota engineers did this to better understand their customers` needs and the changes needed in the van.
Based on the information provided the following process for a knowledge management transfer system (‘knowledge pump’) for cross-border alliances is suggested:
Conclusion
The paper intended to highlight the importance of knowledge as a very valuable asset for cross border strategic alliances contributing to develop competitive advantage. The processual steps to create a knowledge management system have been provided emphasising an attitude to share knowledge. Conceptual input to provide for an attitude and relevant transfer methodologies conducive to knowledge sharing are derived from cultural dimensions and social capital theory. In this way, many problems ranging from communications barriers, misunderstanding, ethnocentric behaviour, lack of trust, or hidden agendas to name but a few. The research suggests social capital theory to create trust amongst alliance member being regarded as a prerequisite for as a means of building and integration of alliance members in order to facilitate knowledge discovery, creation, sharing and application. A reflection process is suggested to be indispensable for the continuous improvement of knowledge.

185
I n t e r n a t i o n a l J o u r n a l o f M a n a g e m e n t C a s e s
Figure 1: The Knowledge Pump for Cross Border Strategic Alliances
ReferenceAdler, N.J. 2002. International dimensions of organizational behaviour. 4th. edition. McGill University. Canada
Alavi, M. & Leidner, D. ((2001) Knowledge management and knowledge management systems in Ford, D.P and Chan, Y.E (2003) Knowledge sharing in a multi-cultural setting: a case study. Knowledge Management Research & Practice. Vol. 1 pp.11-27e
Baets, W. (2005) Knowledge Management and Management Learning. Euromed Marseille – Ecole
de Management. Springer. Science and Business Media Inc. USA
Bukowitz,W.R. and Williams, R.L (1999) The Knowledge Management Fieldbook. Pearson Education Limited. prentice Hall.
Chen, G. (2005) An organizational learning model based on western and Chinese managmements thoughts and practice. Management Decision. Vol. 43 nr. 4 p. 479500
Child,J., Markoczy, L. (1993) Host-country behaviour and learning in Chinese and Hungarian joint ventures. Journal of Management Studies, vol 30, issue 4

I n t e r n a t i o n a l J o u r n a l o f M a n a g e m e n t C a s e s
186
Clark, E. and Geppert, M.(2002) Management learning and knowledge transfer in transformation societies: approaches, issues and future directions. Human Resources Development International. Vol. 5, Issue 3
Coleman, J.S. (1988) Social Capital in the creation of human capital, in Ratten, V. & Suseno, Y. (2006) Knowledge development, social capital and alliance learning. International Journal of Education Management. Vol, 20 nr. 1, pp. 60-72
Collison,C., Parcell, G. (2001) Learning to fly. Practical Lessons from one of the World’s Leading Knowledge Companies. Capstone Publishing Limited England
Davenport, T.H. and Prusak, L (1998) Working knowledge: How Organizations Manage What They Know. Harvard business School Press. Boston, USA
Drucker, P. (1999) Management Challenges for the 21st, Century. Harper Business, New York
Garvin, D.A. (2000, p.47). Learning in Action. Harvard Business School Press, USA.
Ford, D.P and Chan, Y.E (2003) Knowledge sharing in a multi-cultural setting: a case study. Knowledge Management Research & Practice. Vol. 1 pp.11-27e
Harris,R.B. (2001) The knowledge based economy: intellectual origins and new economy in Ford, D.P and Chan, Y.E (2003) Knowledge sharing in a multi-cultural setting: a case study. Knowledge Management Research & Practice. Vol. 1 pp.11-27e
Hoffman,J.J., Hoelscher,M.L., & Sherif, K. (2005) Social Capital, Knowledge management, and sustained superior performance. Journal of Knowledge Management. Vol.9, nr. 3 pp.93400
Holsapple, C.W. (2003) Handbook on Knowledge Management 2. Springer-Verlag-Berlin-Germany
Hutchings,K. and Michailova, S. (2004) Facilitating knowledge sharing in Russian and Chinese Subsidiaries: the role of personal networks and group membership. Journal of Knowledge management. Vol. 2 pp. 84-94
Kaser,P. & Miles,M. (2002) in Sharkier,R. (2005) Precariousness under the new psychological contract: the effect on trust and the willingness
to converse and share knowledge. Knowledge Management Research & Practice. Vol. 3 pp. 37-44
Kruse,S.D. (2003) Remembering as organizational memory. Journal of Education Administration. Vol, 41, nr.4 pp. 332-347
Lang, R. and Steger, T. (2002) The odyssey of management knowledge to transforming societies: a critical review of a theoretical alternative. Human Resources Development International 5:3 p. 279-294
López, P.S, Peón, J.M.M, Ordás, C.J.V. (2004) Managing knowledge: the link between culture and organizational learning. Journal of Knowledge Management. Vol.8 nr.6 pp.93-104
Matlay, H. (2001) Entrepreneurial and vocational education and training in Central and Eastern Europe. Education + Training.Vol. 43 nr. 8/9 p.395-404
Mele, D. (2003) Organizational humanizing cultures: do they generate social capital?. Journal of Business Ethics. Vol.45 p.3-14
Michailova, S & Husted, K (2003) Knowledge Sharing in Russian companies with Western participation in Hutchings, K & Micailova, S (2004) Facilitating knowledge sharing in Russian and Chinese subsidiaries: the role of personal networks and group membership. Journal of Knowledge Management. Vol. 8 Nr.2 pp.84-94
Nadler, D. 1992 Organizational Architecture.Jossey-Bass Publishers. San Francisco
Nahapiet, J. & Ghoshal, S. (1998) Social Capital, intellectual capital and the organizational advantage in Hoffman,J.J., Hoelscher,M.L., & Sherif, K. (2005) Social Capital, Knowledge management, and sustained superior performance. Journal of Knowledge Management. Vol.9, nr. 3 pp.93400
O´dell, C. (1998) If only we knew what we know in Holsapple, C.W. (2003) Handbook on Knowledge Management 2. Springer-Verlag-Berlin-Germany
Örtenblad, A. (2004) The learning organization: towards an integrated model. The Learning Organization. Vol 11 nr. 2 p. 129144
Peters, J. (1996) A learning organization’s syllabus in Chen, G. 2005 An organizational learning model based on western and Chinese managements
187
I n t e r n a t i o n a l J o u r n a l o f M a n a g e m e n t C a s e s
thoughts and practice. Management Decision. Vol. 43 nr. 4 p. 479500
Por, G. (1997) Why knowledge management is an oxymoron in Streatfield, D., Wilson, T. (1999) Deconstructing Knowledge management. Aslib Proceedings Vol.51, Nr. 3
Porter, M. 1980. The Competitive Advantage of Nations. Free Press. New York
Raich, M. (2000) Managing in the Knowledge-Based Economy. Raich Ltd. Switzerland
Ratten, V. and Suseno, Y., (2006) Knowledge development, social capital and alliance learning. International Journal of Education Management. Vol. 20 nr. 1 p.6072
Streatfield, D., Wilson, T. (1999) Deconstructing Knowledge management. Aslib Proceedings Vol.51, Nr. 3
Tsai, F.S (2005) Composite diversity, social capital, and group knowledge sharing: a case narration. Knowledge Management research & practice. Vol.3, pp.218-228
Turban,E., Rainer, R., Potter, R. (2003) Introduction to Information technology in Hoffman, J.J., Hoelscher,M.L., & Sherif, K. (2005) Social Capital, Knowledge management, and sustained superior performance. Journal of Knowledge Management. Vol.9, nr. 3 pp.93400
Walker, D.M.,Walker, T., Schmitz, J. (2003) Doing Business Internationally. 2nd edition. Mc.Graw-Hill USA.

I n t e r n a t i o n a l J o u r n a l o f M a n a g e m e n t C a s e s
188
STRATEGIC COMMUNICATION RELATED TO ENVIRONMENTAL AND PACKAGING
CHALLENGES: CASE OF BEVERAGE AND DAIRY INDUSTRY IN CROATIA
Whereas consumers play a key role in the management of packaging and packaging waste and thus have to be adequately informed in order to adapt their behaviour and attitudes.
(European Parliament and Council Directive 94/62/EC of 20 December 1994 on packaging and packaging waste)
NIKOLA DRASKOVICLEEDS METROPOLITAN UNIVERSITY, UK
JURICA PAVICICUNIVERSITY OF ZAGREB, CROATIA
GORAN VLASICUNIVERSITY OF ZAGREB, CROATIA
Abstract
Environmental protection has recently become one of the most important issues. European Union (EU) has set clear directives for applicant countries that they must enforce. This paper analyzes the implementation of EU directives concerning packaging waste with the emphasis on communication efforts done by relevant institutions in Croatia. Recycling in Croatia, in limited form, existed during the socialism era and by late 1980s, first containers for the collection of used glass appeared, but all the activities were stopped in the early 1990s as a result of war operations. The activities resumed in the mid 1990s with the introduction of new environmental laws. As part of a harmonization of the legal system with the EU, Croatia recently introduced a number of environmental laws based on European Community (EC) directive 94/62/EC and its amendments 2004/12/EC and 2005/20/EC. After the initial failure in the 1990s, the situation dramatically changed with the introduction of the new Regulations on packaging and packaging waste which presented a new packaging recycling and recovery deposit system managed by the government agency. The new deposit system introduced a system consisting of environmental fees and a deposit stimulating the use of returnable packaging with the setting of
specific returnable packaging quotas for different product categories.
The introduction of the new Regulations was, with no doubt, quite an opportunity for the Croatian government to start an educational program for Croatian consumers in order to change public environmental consciousness and improve the acceptance of the new deposit system. However, the whole educational and informational role had been passed to the mass media journalists. The new deposit system became a front side story for many Croatian magazines, newspapers and TV stations which sometimes ended with misinterpretations. Overall quality of news published during the first few months of the new deposit system was not at the right level. Despite public appearances and statements of environmental minister and ministry secretaries, there had been a vast number of misleading information present in the mass media. It is quite unclear why the government and especially the Ministry of Environmental Protection, Physical Planning and Construction did not organise a public campaign in order to present the new environmental legislation to broader public. Journalists’ lack of professionalism also facilitated confusion and problems concerning consumers’ perception of environmental consciousness.

189
I n t e r n a t i o n a l J o u r n a l o f M a n a g e m e n t C a s e s
Lack of serious communication program (or marketing communications) directed by the government caused a serious confusion within both the mass media and consumers. Although Croatian government has developed several related laws and is preparing further regulation, the ‘missing link’ is a lack of relevant marketing research, and consequently, poor communication efforts in educating end consumers. Communication should be directed toward developing environmental conscience in addition to already existing effort on communicating financial benefits for consumers. Findings could have implications on the future strategic marketing communication for all relevant stakeholders: government agencies, producers, end consumers, etc.
Key words environment, environmental laws, packaging, consumer behaviour, Croatia
INTRODUCTION - PACKAGING AND EXTENSION OF THE STANDARD CONCEPTS The main role of packaging in the past was to protect the product and to provide functional benefits, but today it is concerned as an important sales tool (Hine, 1995). In the 1990s, additional demands have been placed on packaging especially in relation to environmental issues that were raised by the European Community (EC) packaging directive accepted in 1994 (Ruth, 2005). The main goal of mentioned directive is to minimise the impact of packaging on the environment. Through the years, many consumers realised how their purchasing behaviour affects the environment (Laroche, Bergeron and Barbaro-Forleo, 2001) making the opportunity for the niche marketing. Recent research shows an increasing number of consumers who are willing to pay more for environmentally friendly products (Laroche, Bergeron and Barbaro-Forleo, 2001). Environmental consciousness requires some level of information regarding the topic and particular ethical sensitivity. Unfortunately, producers and consumers do not necessary express the same level of ethical perception of product packaging issues since their ethical sensitivity, values, (industry) norms and perceived consequences differ (Bone and Corey, 2000). Objectives are usually different, so the behaviour of producers and consumers also differs.
European Union (EU) has set clear directives for applicant countries that they must enforce. This paper analyzes the implementation of EU directives concerning packaging waste with the emphasis on communication efforts done by relevant institutions in Croatia. In order to collect necessary data, authors conducted in-depth interviews with packaging industry professionals, together with extensive media monitoring which was conducted during the implementation of new packaging and packaging waste regulation in Croatia.
CROATIAN PACKAGING INDUSTRY AND RELATED IMPORTERSCroatian packaging industry in is relatively well developed with positive production trends (Imbriovcan, 2004). The most important branch of the Croatian packaging industry is the glass containers production with the total of 198.000 tons produced in 2004 and the growth rate at 16%. The market leader is the Vetropack Group whose Croatian factory (founded in 1860) is one of the largest packaging glass facilities in this part of the Europe. Second largest packaging industry is paper industry with 104.000 tons of paper packaging produced in 2004. With the production that reached 31.000 tons in 2004, plastic packaging industry is somewhat less developed than required, so significant quantities are being imported. Due to the nature of technology, the carton (multilayer, aseptic) packaging is being imported.
Packaging consumption per capita in Croatia is still relatively small comparing to the EU countries. For example, annual glass consumption per capita in Europe is between 124 and 251 pieces of glass packaging, while in Croatia it is about 64 pieces (Vetropack IB for clients, 2005 ). Situation is quite similar with other packaging materials. Due to such low consumption, significant part of locally produced packaging is distributed on the export markets. However, domestic market is developing steadily showing a good market indicator, as well as a possible growing problem of waste management.
IMPLEMENTATION OF ENVIRONMENTAL LAWS IN CROATIA
Recent historical context
Recycling in Croatia, in limited form, existed during the socialism era (i.e. before 1990s period) with
I n t e r n a t i o n a l J o u r n a l o f M a n a g e m e n t C a s e s
190
partially organized collection of metals, paper and glass (Buljan, 1986). It was result of initiatives started up by several state owned companies reprocessing scrap metal, paper or glass. These initiatives were occasionally introduced within the educational system (e.g. elementary schools), but cannot be considered as permanent activities, nor as a recycling system. By late 1980s, first containers for the collection of used glass appeared but all the activities were stopped in the early 1990s as a result of war operations.
The activities resumed in the mid 1990s with the introduction of new environmental laws. One of the first legal acts referred to the packaging waste was the Regulations on packaging waste treatment (1996) that was introduced with the aim to reduce the packaging waste. According to the Regulations, the industry (e.g. bottlers, importers, etc.) became responsible for the collection of packaging and recycling. Unfortunately, it was mostly ignored by the industry and was even mistreated by the government itself, so it failed to achieve its goals. Because of legislative issues and non-existence of national recycling system, the separate collection of packaging waste in Croatia was organised on the voluntarily basis in the second half of 1990s. It was based on a network of ill dispersed recycling containers managed by the local municipal companies. The distribution of recycling containers depended on the wealth of the local communities which resulted with better coverage in more developed urban areas while less developed and rural areas were neglected. Beside traditionally present glass and paper recycling facilities, collection of PET (polyethylene terephthalate), which began in late 1990s, initiated the development of rudimental PET recycling activities and also resulted in exporting significant amount of non-processed PET waste to China. Since nationwide recycling initiative was not yet introduced, except for the basic educational programs in elementary schools, recycling rates were and still are far bellow EU requirements. According to the packaging industry sources, the recycling rates in 2005 were at 19% for glass and approximately at 5% for PET while the recycling rate of multilayer (carton) packaging is negligible.
Rumours about the new Regulations that will replace the old one and establish a new recycling system based on the EC directives started in 2003. Ministry of environmental protection, physical planning and construction distributed few versions of a draft among industry associations
and professionals that should end up as new Regulations. The early versions were significantly influenced by the study prepared by the PET Eko company which has been founded by the Centre for the technology transfer and financially supported by EU Commission through the LIFE 03 TCY/CRO/0014 program . The study advocated deposit system with the utilisation of automatic pick-up points that will automatically recognise information such as the type or brand/producer of packaging simply by scanning the bar code on the packaging. The proposed study, after being presented to various industry associations, was heavily criticized and labelled as unrealistic and too expensive. However, even at that time significant antagonism existed between the industry and the government regarding the choice of the recycling model for Croatia (Milijevic, 2005a).
Croatian refl ections on newly introduced environmental laws
As part of a harmonization of the legal system with the EU, Croatia recently introduced a number of environmental laws based on European Community (EC) directive 94/62/EC and its amendments 2004/12/EC and 2005/20/EC. After the initial failure in the 1990s, the situation dramatically changed with the introduction of the new Regulations on packaging and packaging waste (2005) which presented a new packaging recycling and recovery deposit system managed by the government agency. The start of the new deposit system has been planned for 1st October 2005 but has been postponed for December 1st of 2005. In the dawn of the introduction of the new Regulations, industry formed an association called EKO-OZRA with the intention to stop or further delay the introduction of the Regulations with the implementation of a new industry managed recycling and recovery system based on some positive foreign experiences. However, this initiative came much too late and it was not realistic that the government will advocate the system proposed by the industry at the point when the new Regulations passed all the formal procedures.
In a nutshell, the new deposit system introduced a system consisting of environmental fees and a deposit stimulating the use of returnable packaging with the setting of specific returnable packaging quotas for different product categories (Regulations on the packaging and packaging waste, 2005). The system of environmental fees is

191
I n t e r n a t i o n a l J o u r n a l o f M a n a g e m e n t C a s e s
rather complicated and is related to the packaging material, container capacity and the achievement of the national returnable packaging quota. The new system is solely dealing with beverage and diary packaging with the capacity above 20 cl while the other product categories are not an element of specified regulation at the moment. The Regulations are also making slight difference in taxation among different packaging materials. The system of environmental fees also includes returnable deposit. From the consumers’ point of view, this is the amount of money that will be returned to them at the moment they bring the package back to the retail outlet or to other licensed collector. This deposit is mandatory for almost all packaging materials used for beverages and diary products. Only the carton packaging is excluded.
Complicated environmental fees and deposit system have caused some problems to retailers and resulted in massive adjustment of cash register and warehousing software. Furthermore, retailers are not too fond to be a part of the deposit system claiming that their facilities are not suited for keeping both fresh products and waste packaging together pointing out the possible health hazard. It is obvious that the system still has to be further developed and refined to meet the Croatian specifics and to calm down all the parties. However, the implementation of environmental laws within EU hasn’t been smooth all the time either for there have been similar situations e.g. in the UK (Fernie and Hart, 2001) and Germany (Livingstone and Sparks, 1994) but the initial problems were solved during the course of time. It seems that EU industry showed high level of awareness for the environmental legislation (Prandergast, 1995), which seems not to be a case in Croatia. Croatian beverage industry had the opportunity to introduce its own recycling system since 1996 when the first Regulations were introduced. However, industry seemed to fear potential cost of the recycling and recovery system so it acted very passively. In neighbouring country of Slovenia industry made a consensus with the government and in 2002 founded its own recovery organization - Slopak, which is dedicated to the achievement of goals set up by EU environmental directives and is doing well (Milijevic, 2005b).
Croatian environmental legislation and potential nonconformity with the EU directives
As mentioned, industry made huge efforts to stop or slow down the new Regulations and these efforts were also based on the criticism about the poor compatibility with EU directives and EU practice. It is not aim of this paper to take sides in this dispute, but it is necessary to analyse the real compatibility of Croatian Regulations with the EU legislation since Croatian government is strongly dedicated to the EU membership. Furthermore, detection of potential conflicts with the EU legislation could provide clear directions for further development of the Regulations and outline possible consequences on future marketing communications.
The new Regulations on packaging and packaging waste received some criticism from The European Organization for Packaging and the Environment (EUROPEN) in an open letter sent to Ivo Sanader, Croatian prime minister. EUROPEN expressed general concern about the supposed conflict between the Regulations and EU law and the European Union’s packaging policy. Particularly, it stressed possible trade barriers that might arise because of the returnable packaging quota goals specified in the Regulations. In addition, fees, deposit and quota imposed by the Regulations on specific packaging materials and product types are discriminatory and, therefore, could constitute a trade barrier or pose as a competitive disadvantage. At this point Croatia’s government did not officially react to this criticism and expressed concern by the EUROPEN. Nevertheless, further refinement of the Regulations could be expected during Croatia’s negotiation process and its preparation for the EU membership, so the Croatian recycling and recovery system will have to adopt some changes.
ANALYSIS OF COMMUNICATION EFFORTSCroatian marketing communication practice is traditionally not oriented toward modern public advocacy. Thus, such ‘mind-changing’ campaigns have certain problems with implementation. However, there were some well developed ‘benchmark’ campaigns such as: Closed shops on Sundays campaign (Pavicic, Batarelo and Adzic, 2004), Election monitoring – GONG (Pavicic, 2003), etc.
I n t e r n a t i o n a l J o u r n a l o f M a n a g e m e n t C a s e s
192
Government’s marketing communications and the new environmental Regulations in Croatia
Within the EU, with the rise in environmental concerns among the stakeholders of businesses, firms are responding with strategic environmental marketing activities designed to meet the growing demand for environmentally friendly processes, products and packaging (Pujari and Wright, 1996). Unfortunately, Croatia seems to be still quite far away from this concept. First of all, consumers should be educated about the environmental impact of packaging. The introduction of the new Regulations was, with no doubt, quite an opportunity for the Croatian government to start an educational program for Croatian consumers in order to change public environmental consciousness and improve the acceptance of the new deposit system. However, the whole educational and informational role had been passed to the mass media journalists. The new deposit system became a front side story for many Croatian magazines, newspapers and TV stations. Unfortunately, letting the journalists to educate consumers and interpret the new Regulations wasn’t exactly the boldest move for the government.
Overall quality of news published during the first few months of the new deposit system was not at the right level. Despite public appearances and statements of environmental minister and ministry secretaries, there had been a vast number of misleading information present in the mass media. Some of the media reported that the new Regulations was mostly referring to the plastic packaging (e.g. Rak Sajn and Moskaljov, 2006), while others announced that glass packaging is not included in the deposit system at all (e.g. Gataric and Rak Sajn, 2006). Likewise, there had been misinformation about the new markings on the packaging itself stating that packaging containers should be marked with the special kind of labels (e.g. RTL Vijesti, 2005). Some journalists stressed the social component of the new Regulations and presented it like an income opportunity for poorer segments of population (e.g. Martinic, 2006). The environmental message was completely nonexistent.
It is quite unclear why the government and especially the environmental ministry did not organise a public campaign in order to present the new environmental legislation to broader public. Journalists’ lack of professionalism also facilitated
confusion and problems concerning consumers’ perception of environmental consciousness.
New environmental legislation and marketing implications
Despite its importance to the modern society, packaging in Croatia has never been focal point of interest neither for companies nor consumers. Recent poll conducted by a research agency (Promocija plus) indicated that the new deposit system came into the focus of most consumers during the first couple of months of its existence (Infoarena, 2006). So, the consumers showed their interest in the new deposit system. But, what happened to the bottlers, companies affected with new environmental taxes. Among the EU countries environmental issues were recognised in mid 90s and integrated into the business strategy (Pujari and Wright, 1996). However, it seems that a majority of Croatian companies haven’t been prepared for the new situation. Instead of preparation for the new deposit system and packaging waste collection, it seems that companies and business associations were more concerned with the criticism and price increase announcements as reflection to the environmental taxes (e.g. Mrvos-Pavic, 2006; Hrnjkas and Petrovcic, 2006; Buksa, 2006). However, breweries are supporting the new Regulations since they are already using about 80% of returnable glass packaging and are not obligated to pay additional environmental taxes (Ivezic, 2006).
Lack of serious communication program (or marketing communications) directed by the government caused a serious confusion within both the mass media and consumers. Just a few companies included messages connected with the recent changes in environmental laws and the introduction of the new recycling system within their marketing communications campaigns. Their unique selling proposition (USP) stressed extra profits for end consumers resulting in changing their behavioural pattern toward ‘environmentally friendly’ behaviour (i.e. switching to returnable packaging). Although authors believe that such USP missed the main ‘big idea’ of such regulation, industry has undermined potential influences through its actions. With adequate educational efforts, government could have achieved spill over effects introducing environmentally friendly behaviour in all relevant industries and population clusters. Thus, multiplicative effects could have

193
I n t e r n a t i o n a l J o u r n a l o f M a n a g e m e n t C a s e s
increased overall acceptance of environmentally friendly behavioural patterns.
CONCLUSION
Croatia, as transitional country, still needs a number of legislation adjustments. Both producers and consumers will have to fully adapt to the new environmental laws but it is the role of the government to make this changes feasible and more understandable. However, the new recycling system achieved a preliminary success. In the period January-May 2006, more than 247 million pieces or 34.000 tons of beverage packaging have been collected (4.765 tons of PET, 28.679 tons of glass, 454 tons of metal cans) which will probably double the recycle rate in 2006 (Iksic, 2006).
It is authors’ belief that even better and more encouraging results in the long term period could be achieved through adequate education of consumers and increased environmental conscience. Environmental taxes have had more social impact on consumers than environmental education and consumers have been left to newspapers’ interpretations for law understanding – which resulted in confusion concerning ecological dimension of the presented problem. This should be especially taken into consideration in light of possible changes to the recycling and recovery system that the EU membership negotiations could end up with. Although communication campaign missed out on presenting the main idea and goals, to the certain extent it has succeeded. However, motivation for consumer actions was solely financial and thus had affected low income families who have developed recycling into their main source of income. On the other side, the industry suffered from the additional expenses that the fees and deposit have generated to their operations. The quota for returnable packaging could force the industry to increase the utilisation of returnable glass containers, with the potential for the introduction of returnable PET containers. In that case, some structural changes within the industry could be expected – especially in those branches of beverage and food industries that will profit with the switching from non-returnable to returnable packaging in mid term. This would also have implications on consumers and could cause potential changes in their behaviour and shopping habits as result of more extensive use of returnable packaging.
EndnotesSee www.vetropack.com for more info.1.
According to the Vetropack, Internal archive 2. center database: Vetropack IB for clients, 2005.
See: PET-EKO leaflet distributed by Centar 3. za transfer tehnologije (Technology Transfer Center), Zagreb (Croatia), Ivana Lucica 5.
The open letter has been published by Eko-4. Ozra recovery organization at: http://www.ekoozra.hr/korisne_informacije/europen.jpg (retrieved on May 30, 2006).
See www.gong.hr for more info.5.
REFERENCESBone, P.F. and Corey, R.J. (2000) Packaging Ethics: Perceptual Differences among Packaging Professionals, Brand Managers and Ethically-interested Consumers Journal of Business Ethics Vol. 24 pp. 199-213
Buksa, Z. (2006) Pocinje povrat ambalaznog otpada (The collection of packaging waste is about to start) Zagreb: Vjesnik Vol. IX No 2295 January p. 3
Buljan, R. (1986) Marketing i reciklaza (Marketing and recycling) Samobor: RO Zagreb
European Parliament and Council Directive (EC) No. 2005/20 of 9 March 2005 on packaging and packaging waste, final.
European Parliament and Council Directive (EC) No. 2004/12 of 11 February 2004 on packaging and packaging waste, final.
European Parliament and Council Directive (EC) No. 94/62 of 20 December 1994 on packaging and packaging waste, final.
Fernie, J. and Hart, C. (2001) UK packaging waste legislation – Implications for food retailers British Food Journal Vol. 103 No. 3 pp. 187-197
Gataric, Lj. and Rak Sajn, J. (2006) Vlada pozvala na bojkot tvrtki koje dizu cijene (The government proposed a boycott of companies that are increasing prices) Zagreb: Vecernji list No. 10/1 p. 3
I n t e r n a t i o n a l J o u r n a l o f M a n a g e m e n t C a s e s
194
Hine, T. (1995) The total package: the secret history and hidden meaning of boxes, bottles, cans, and other persuasive containers Boston: Back Bay Books
Hrnjkas, K. and Petrovcic, G. (2006) Pica poskupljuju do 30% (Beverages will be up to 30% more expensive) Zagreb: Vjesnik Vol. IX No. 2298 January pp. 2-3
Iksic, A. (2006) Pravilnik o ambalazi i ambalaznom otpadu – primjena (Regulations on packaging waste and packaging – application) Zagreb: Ambalaza Vol. 11 No. 2 pp. 77-79
Imbriovcan, Z. (2005) Stanje u ambalaznim industrijama Hrvatske u 2004. godini (Croatian Packaging Industries in 2004) Zagreb: Ambalaza, graficka industrija Vol. 10 No. 2 pp. 17-19
Infoarena (2006) Otkup plasticnih boca zasjenio sve druge sijecanjske dogadjaje (Redemption of plastic bottles belittles all other January events) http://hrklub.infoarena.hr
/vijesti/business?PLIVAweb=94784846f3c=ee3989f7375750d9b821 [Accessed 8th December 2006]
Ivezic, B. (2006) Zagrebacka pivovara ne ce povecavati cijene (Zagreb brewery will not increase prices) Zagreb: Poslovni dnevnik No. 20/1 p. 9
Laroche, M., Bergeron, J. and Barbara-Forleo, G. (2001) Targeting consumers who are willing to pay more environmentally friendly products Journal of Consumer Marketing Vol. 18 No. 6 pp. 503-520
Livingstone, S. and Sparks, L. (1994) The New German Packaging Laws: Effects on Firms Exporting to Germany International Journal of Physical Distribution & Logistics Management Vol. 24 No. 7 pp. 15-25
Martinic, M. (2006) Trideset kilometara voznje zbog 600 boca (Thirty kilometres drive because of 600 bottles) Zagreb: Jutarnji list No. 19/1 p. 48
Milijevic, D. (2005a) Pravilnik po mjeri gospodarstva (The Regulations in line with the industry) Zagreb: Ambalaza, graficka industrija Vol. 10 No. 2 pp. 47-48
Milijevic, D. (2005b) Gospodarednje ambalaznim otpadom – slovenski model (Packaging waste management – the case of Slovenia) Zagreb:
Ambalaza, graficka industrija Vol. 10 No. 2 pp. 43-45
Mrvos-Pavic, B. (2006) Sindikat i trgovci protiv Pravilnika o ambalazi (Trade union and retailers against the Regulations on packaging) Osijek: Glas Slavonije http://www.glas-slavonije.hr/rubrika.asp?rub=1&ID_VIJESTI=54678 [Accessed 18th Jun 2006]
Pavicic, J. (2003) Strategija marketinga neprofitnih organizacija Zagreb: Masmedia
Pavicic, J., Batarelo, V. J. and Adzic, B. (2004) The alliance between the Commercial trade union of Croatia and Caritas Croatia: Traditional social advocacy campaign or modern strategic partnership? International Journal of Management Cases Vol. 7 No. 2 pp. 74-97
Prandergast, G.P. (1995) The EC directive on packaging and packaging waste: current status and logistical implications Logistics Information Management Vol. 8 No. 3 pp. 10-17
Prendergast, G. and Pitt, L. (1996) Packaging, marketing, logistics and the environment: are there any trade-offs? International Journal of Physical Distribution & Logistics Management Vol. 26 No. 6 pp. 60-72
Pujari, D. and Wright, G. (1996) Developing environmentally conscious product strategies: a qualitative study of selected companies in Germany and Britain Marketing Intelligence & Planning Vol. 14 No. 1 pp. 19-28
Rak Sajn, J. and Moskaljov, V. (2006) Vlada nece odustati od pravilnika o otpadu (The government will not give up the new waste Regulations) Zagreb: Vecernji list No. 7/1 p. 8
Regulations on packaging and packaging waste (2005) Official Gazette of Republic of Croatia No. 97/05
Regulations on packaging waste treatment (1996) Official Gazette of Republic of Croatia No. 53/96
RTL vijesti (2005) Od iduce godine gradjani ce za svaku vracenu bocu u trgovini dobiti 50 lipa (From the next year citizens will get HRK 0,50 for every bottle returned to the retail store) Zagreb: RTL Television http://www.rtl.hr/vijesti/prikaz/2687/ [Accessed 18th Jun 2006]

195
I n t e r n a t i o n a l J o u r n a l o f M a n a g e m e n t C a s e s
Rundh, B. (2005) The multi-faceted dimension of packaging – Marketing logistic or marketing tool? British Food Journal Vol. 107 No. 9 pp. 670-684

I n t e r n a t i o n a l J o u r n a l o f M a n a g e m e n t C a s e s
196
QUALITY MANAGEMENT OF FOOD PRODUCTS’ PRIVATE LABELS IN CROATIA
MAJA MARTINOVIĆZAGREB SCHOOL OF ECONOMICS AND MANAGEMENT, CROATIA
TIHOMIR VRANEŠEVIĆUNIVERSITY OF ZAGREB, CROATIA
MIROSLAV MANDIĆUNIVERSITY OF ZAGREB, CROATIA
Abstract
The appearance of private labels (or private brands) in Croatia happened in the mid 90-ies.
The business policy and the aim of creating private labels basically relates to the highest possible margin to be achieved by the retailer. This is possible to realise by negotiating a much lower, i.e. a significantly lower purchase price of the product. Retail chains find private labels very acceptable and profitable, for the margin achieved by their sales provides enough space for investing funds into marketing activities. Lower prices lead to the increase of product turnover. To sum up, the fundamentals of the private labels’ policy are: setting up a price lower than the price of brands, which means mostly a significantly lower price, increasing product turnover, achieving a higher margin, ensuring a better shelf space for the product and conducting marketing activities through advertising in catalogues, various promotional activities and sales promotion. Today, private labels are increasingly developing and expanding into almost all assortments of food products, so one can say that there is an alternative in private labels for almost all those products.
With the further development of private labels and continuous pressure on producers regarding competition, retail chains arrived at undesirable situation. Producers who had to meet unceasing demands for achieving the lowest possible production price were at some point forced to change the recipe of products they produced. They pursued realising a lower price by reducing product quality. Not taking into account the quality, many retail chains reduced their premium brand to the B brand, i.e. the product of a lower quality. This is particularly harmful to the product programmes
in which different products are purchased under the same label name but only one or two products in the assortment are of a lower quality. Because of those few products consumers perceive all other products in the assortment as products of a lower value and quality, so that in time the quantity of purchased products decreases.
Having led their own private labels to an unfavourable position and in a way undermined them through their business policy, those retail chains started to change that policy and tried to preserve the labels by creating premium and B brands. The premium brand is the more recognizable one which is under constant quality control or whose name is used for products whose quality cannot be easily affected. The other private label, the so called B brand, is the one whose quality can be easily affected. This is largely a brand of a lower quality targeted at consumers of lower living standards. As private labels enhance their quality and consumers earn more trust in retail chains, so there will develop an increasingly stronger competition between private labels and national brands.
Key words: quality management, private labels, food, Croatia
IntroductionIn recent years Croatia has seen an increase in the significance of private labels, i.e. private brands, and in their number on the market (GfK, 2004). Retailers have started distributing their own private brands with the intention of making use of advantages they have regarding the product distribution and of making higher profits on the same products than they were previously able to. On the other hand, there is an increasing number
197
I n t e r n a t i o n a l J o u r n a l o f M a n a g e m e n t C a s e s
of more successful producers who have decided to work in the field of private labels. In fact, if producers working in a highly competitive market have an extra capacity to use, their decision on dealing with private labels provides them with considerable control over a part of sales.
Private labels are often very difficult to create and retailers have to frequently face certain problems in the process regarding creation, quality and long-lasting sustaining of the image of private labels. One of the fundamental reasons why private labels can easily get to the customer is their price, which is on average up to 30% lower than the price of brands. Since the decision for purchase of private labels is almost exclusively based on their price, most loyal customers of the products have a limited purchasing power. Yet, the only way of maintaining low prices means affecting the product quality.
Business policy of private labels in CroatiaThe appearance of private labels (or private brands) in Croatia happened in the mid 90-ies. The first ideas about private labels emerged in connection with some products whose packaging and sales occurred under the name of retail brands. The business policy and the aim of creating private labels basically relates to the highest possible margin to be achieved by the retailer. This is possible to realise by negotiating a significantly lower purchase price of the product. Lower prices lead to the increase of product turnover. To sum up, the fundamentals of the private labels’ policy are: setting up a price lower than the price of brands, which means mostly a significantly lower price, increasing product turnover, achieving a higher margin, ensuring a better shelf space for the product and conducting marketing activities through advertising in catalogues, various promotional activities and sales promotion. One can say that a kind of cannibalisation has occurred. The private label has actually taken up a part of the market that was previously owned by the market leader.
The first private labels emerged in the segment which did not require too many specific procedures to get a product made. At the very beginning of launching private labels for food products, such products were easily processed using alternative packaging, or a new brand could be created. This refers to production programmes which were actually programmes for packaging. Coffee
is a good example, being purely an imported product which is processed and/or packaged in Croatia. Non-alcoholic beverages belong to the same group of products because a substantial part of raw materials is imported to Croatia so that they can be used in the process of finalizing the product and packaging. Today, private labels are increasingly developing and expanding into almost all assortments of food products. Retailers can achieve higher margins because of the strong negotiating position which they find themselves in, in contrast to producers. In fact, retailers negotiate lower product prices because producers can immediately exclude costs of marketing, costs of distribution (because retail chains themselves are largely accountable for it) and part of costs intended for private label development from the product price. So, despite their own higher margins, retailers eventually offer target customers their products at lower retail prices, which is not the case with the prices of premium brands. One of the most significant reasons for that is a tendency that, over the years and with the development of marketing, an increasingly substantial part of costs and funds, i.e. product prices, included the costs of various marketing activities. Now, through eliminating promotional costs retailers can achieve a substantially lower product price while negotiating for private labels. Therefore, one can say that marketing activities used for the development of private labels, and therefore included in the calculated price of the product, have played an essential role in creating private labels. But this represents only the starting phase of creating private labels. Meanwhile, there has been a considerable change.
Production did not always manage to ensure a desirable price for retail chains, so in order to do that, it had to waive other costs. A considerable part of costs calculated in the product price itself are also costs of financing production. In order to avoid those costs, retail chains have obliged themselves to take certain quantities of products, in fact a precisely agreed number of kilograms and units and within a precisely defined period of time, and to pay for them in the agreed period of time which is much more favourable than usually. Namely, calculated private label equity included ever rising costs, which was due to higher interest rates and costs of financing production. Committing themselves to taking products instantly or within a very short period of time, retail chains managed to exclude these costs from the calculated price too. Since retailers have most funds at their disposal,

I n t e r n a t i o n a l J o u r n a l o f M a n a g e m e n t C a s e s
198
it enables them to make and fulfil such promises. Finally, consumer gets a product at a significantly lower price, which consequently increases the product turnover.
Through expanding private labels retail chains attempted to form private labels in each group of products, which led even to absurd situations in which some products, normally not in any way related in the ultimate consumption, had the very same brand name. Having realised disadvantages of that, some retail chains launched the premium brand under which they sold only a particular group of products. However, they largely created individual private labels for every kind of product. That required additional costs for marketing activities and additional investments. Thus, one can say that they, in a way, fell into their own trap of the need for development of private labels. This increase of costs partially decreased their profit.
Quality management of food products’ private labelsWith the further development of private labels and continuous pressure on producers regarding competition, retail chains arrived at another undesirable situation. Producers who had to meet unceasing demands for achieving the lowest possible production price were at some point forced to change the recipe of products they produced. They pursued realising a lower price by reducing product quality. Producers changed recipes, production processes and production methods in order to reduce the quality value of the product and subsequently its price. In addition, competition among producers continued to grow. Due to the simpler production method, lower costs, smaller investments and often lesser capacity, independent smaller businesses were enabled to produce a cheaper product, but only because of reducing the quality of that product. But there are also products which simply cannot have cheap production since the production has to follow standard recipes. An example of such a product is pasteurized fruit and vegetables packaged in jars. The only way to reduce the price of such products is to interfere in the net weight, i.e. to package fewer net products into the same volume. At first sight, consumers can hardly notice that, but taking a long-term view that cannot stay unnoticed. Therefore, this can be considered a kind of trap for retailers and their private labels. Namely, since not taking into account the product
quality and not taking production of their own products under control, retail chains positioned their private labels among the products of lower quality. Not taking into account the quality, many retail chains reduced their premium brand to the B brand, i.e. the product of a lower quality. This is particularly harmful to the product programmes in which different products are purchased under the same label name but only one or two products in the assortment are of a lower quality. Because of those few products consumers perceive all other products in the assortment as products of a lower value and quality, so that in time the quantity of purchased products decreases. Some retailers realised that the time spent on investing into their own private label, which now started to lose reputation with consumers, meant waste of time and money.
When referring to products whose quality is possible to influence significantly, almost all retail chains faced the same problem of decrease in the sales of their private labels in comparison to the sales of brands. In this context one should mention products such as crisps, coffee, non-alcoholic beverages and the like. The quality of such products can be affected by cheaper and simpler production. This refers to the use of ingredients of a lower quality (for example a smaller portion of dry matter in soft drinks) or the use of various, or even harmful additives, preservatives, dyes and flavours in soft drink, which can harm people’s health. If a more thorough analysis of some products sold under the name of private labels were conducted, one could find that many of them were not healthy. But since there has always been a kind of keeping back from the application and control of existing laws in Croatia, the quality control of such products lags behind in a way.
Having led their own private labels to an unfavourable position and in a way undermined them through their business policy, those retail chains started to change that policy and tried to preserve the labels by creating premium and B brands. The premium brand is the more recognizable one which is under constant quality control or whose name is used for products whose quality cannot be easily affected. The other private label, the so called B brand, is the one whose quality can be easily affected. This is largely a brand of a lower quality targeted at consumers of lower living standards. It is placed on shelves, kept separate from the rest of the assortment, which implies that those are products of a lower quality and price. Hence, what

199
I n t e r n a t i o n a l J o u r n a l o f M a n a g e m e n t C a s e s
consumers initially recognized as private labels is now actually recognised as B brands, whereas premium brands have a stricter quality control, a different price and are certainly presented in outlets in a different way.
Private labels of retail chains in Croatia
The first retail chain in Croatia which started with the sales of products under the name of private labels was Getro (www.getro.hr, 2006). At the very beginning the quantity of private labels produced amounted to only 5-10%, in comparison to the quantity of brands. This quantity grew and developed in time, so today more than 60-70% of the total sales of particular sorts of food products are realized by private labels. Taking into account the fact that in the retail chain Getro the price had a very significant influence on the launch of products, they produced products of a lower quality within the frame of the required price. However, consumers recognized in time that Getro’s juice Fruta was not a high quality product and that it was not a premium brand. Thereby, the quality of the whole product assortment under the name Fruta was in a way queried. Such a situation is generally not desirable since a product of a higher quality can always be found among various products under the same private label name, the label itself being ridden with a somewhat tarnished image which consumers have perceived because of possibly one product only. In this way many labels were brought into an unenviable position in which they lost their initial identifiability and appeal. Therefore, it was necessary to make changes in creating private labels by changing the label slip, appearance and design of the product, by undertaking important promotional activities, all that with the intention of changing consumers’ perceptions regarding the product quality.
The next retail chain that recognized a significant role of private labels was Konzum with its private label K plus (www.konzum.hr, 2006). The sales of that private label were extraordinary with their impressive and rapid growth, which resulted in considerable success regarding the capturing of the market share (Ranogajec, 2006). Today K plus represents a quality private label. In the meantime, Konzum introduced another label Rial with which it made an attempt at taking up the part of the market outside the reach of their retail outlets. Rial is a private label of the Konzums’s daughter company Velpro, exclusively connected with Konzum’s wholesale, i.e. with the supply of other outlets.
In the steps of Konzum, more or less all retail chains began to follow the same trend and produce private labels. This refers especially to foreign retail chains which started to run their business in Croatia after 2000. Metro is expanding its private label through retail outlets which get their supplies by purchasing there. This retail chain has only specific and not all products under the name of the private label Aro. In addition, it follows a global trend that private labels are at least of the same, if not of a higher quality than premium brands of a producer. Therefore, when the private label Aro is put out to tender, first the tasting is organized at a producer, the quality of the recipe is assessed and afterwards the decision on the most favourable producer is made. This is carried out through a public tenders, so that the most favourable price is chosen only after the quality control has been completed. Metro, which is a global retail chain, has recognized that both the relation between and the level of the price and the quality are very important.
Billa is a retail chain which has also attained a strong position concerning private labels and it produces a considerable part of products under the name of its private label Clever (www.billa.hr, 2006). It follows an example of Metro and it does not produce all products under its own label but only those that can ensure a certain quality which is not at all worse, but often better than the quality of brands.
Mercator, another retail chain, owns a private label under the very same name – Mercator. It has a strategy of forming private labels similar to the strategy employed in Metro and Billa. Another retail chain NTL develops its private label which should be common to the whole NTL group. Retail chains Kerum, Tommy, Presoflex and Plodine belong to the group which is trying to create the unique private label, whereas at the same time each of them has their own labels.
There is also the Gastro group which is a strategic alliance of around 35 wholesale units with 40% of the market share and whose main business is supplying hotels, restaurants and cafés. Their private labels are instantly positioned as labels of a high quality, for their lowest value is equal to the value of brands. The spread of their network and the accessibility to the hotels, restaurants and cafés enables the group to have a significant influence on the whole retailing in Croatia.

I n t e r n a t i o n a l J o u r n a l o f M a n a g e m e n t C a s e s
200
In the end, there is also the Ultra group which developed its private label Ultra plus, available in all the outlets across Croatia which are members of the Ultra group. Furthermore, there is a retail chain CBA that started very early with private labels, of which they own a whole range.
Most producers of private labels also produce and distribute their own labels. The production of private labels enables laying down better conditions of business operations regarding the private labels they distribute through retail chains. Besides the fact that such business operations lead to private labels obtaining a better shelf space and to additional promotional activities, it also guarantees more regular collection of payments.
Development prospects of private labels in CroatiaIn the past ten years Croatia has undergone through a period from the emergence of private labels to their regulation. Since the introduction of private labels retail chains have experienced several periods ranging from the time when products were sold at low prices under the name of private labels to the time when private labels were not sold as products of a lower quality, but as products whose relation between the quality and price was well balanced. Everything that had happened in Croatia in this short period stimulated foreign retail chains to enter our market. Moreover, the arrival of foreign trends quickened the whole process. One can say that nowadays the same standards are applied both in Croatia and in the Western world, with an exception that the share of private labels sales is still not at the same level as in Europe. Iit will take some time for Croatian consumers to adjust to new trends. Statistics show that the trend of private labels will continue to rise significantly in Croatia.
Taking into account some other circumstances from the macro-environment - as for example the recently issued new Ordinance on Packaging Waste Handling which introduces taxes, i.e. considerable fees for handling waste (which refers
mainly to products in PVC and PET packaging) – one can presuppose that the majority of cheaper products of a lower quality will soon disappear from the market. The reason for this is the fact that nowadays mostly cheaper products of a lower quality in PET packaging are sold on the Croatian market, and with such fees those products will become significantly more expensive and therefore they will not be competitive any more.
Finally one can come to the conclusion that in the so called war of brands between brands and private labels retailers are largely at an advantage. It is they who decide which products to supply and where to display those products. The price of the private label is considerably lower than the price of brands, which appeals to economical consumers, especially in difficult economic times. As private labels enhance their quality and consumers earn more trust in retail chains, so there will develop an increasingly stronger competition between private labels and national brands.
References:Ranogajec, B. (2006) Vodeća trgovačka robna marka u Hrvatskoj Konzumov K-plus, http://www.poslovni.hr/25602.aspx [accessed 30.10.2006.]
Internet pages of Billa http://www.billa.hr/eurobilla_hr/ [accessed 15.10.2006.]
Internet pages of CBA http://www.cba-zg.hr/ [accessed 13.11.2006.]
Internet pages of Getro http://www.getro.hr/ [accessed 15.10.2006.]
Internet pages of Konzum http://www.konzum.hr/aktualno/k_plus [accessed 10.10.2006.]
GfK (2004) Trgovačke robne marke (private labels) http://www.gfk.hr/press/labels.htm, [accessed 27.12.2006.]
Trgovinski Hanibal pred vratima Privredni vjesnik 13.12.2006.
201
I n t e r n a t i o n a l J o u r n a l o f M a n a g e m e n t C a s e s
INTANGIBLES ASSETS IN COMPANY SUCCESSION IN GERMAN SMES
SUSANNE DURST LIECHTENSTEIN UNIVERSITY OF APPLIED SCIENCES, LIECHTENSTEIN
HANS RÜDIGER KAUFMANNINTERCOLLEGE, CYPRUS
Abstract
On a European scale company succession in small and medium-sized enterprises is heralded to become a topic of increasing academic and practical relevance. As an example, the Commission of the European Communities (2006) states that one third of European entrepreneurs will leave within the next ten years. In absolute figures, this refers to approximately 690,000 SMEs and 2.8 million jobs every year. In this situation more and more entrepreneurs have difficulties to find an appropriate successor within the own family and are forced to consider external persons in the succession process. Consequently, the identification and assessment of relevant company assets will be of crucial interest for potential investors. However, the nature of companies has changed, and qualitative (intangible) aspects of company performance increasingly replace previously relevant assets such as tangible assets. A wide-ranging literature review revealed a myriad of articles related to “intangible assets/intellectual capital” in general and the valuation/measurement of them in particular. However, detailed analytical work on the content of these articles revealed neither a theoretical nor an empirical elaboration on providing information about the current status of this topic in SMEs. This situation represented the starting point of the Ph. D. research. Hypothesizing that these intangibles assets (IA) are the key drivers of organizational development and success in companies, the underlying research questions are concerned with the role of these factors in the company succession process in SMEs seen from the investor’s perspective.
The paper provides the results of an empirical study of the relevance of intangible assets in general and for the purpose of company succession in particular. Thereby, the descriptive study provides status quo views on the attitude towards IA, the most relevant
IA drivers in SMEs, applied IA Valuation methods compared to theory, the influence of knowledge / professional experience of the valuer and finally, decisive factors of successful SMEs indicating clues for the negotiation process between seller and buyer.
The total population consisted of the two sub-populations Trade Corporations and Chambers of Commerce. The associations play an important role in Germany. Each German company registered in Germany is obliged by law to join one of the associations. The skilled crafts in Germany are member of the trade corporation, and the rest of the companies with the exception of free professions and farms are member of the chambers of commerce. Besides providing services in different areas such as vocational training, law or general economical questions they are also first hand contact referring to business start up and transfer. Based on the central role of them in Germany and their contacts to SMEs, it was decided to choose the associations representing the total population of the quantitative research.
Keywords: SMEs, Intangible Assets, Company Succession, Germany
IntroductionThe pending change of the population structure raises the potential for company succession. According to the Commission of the European Communities (Commission of the European Communities, 2006, p. 3), one third of European entrepreneurs will leave within the next ten years. In absolute figures, this means approximately 690,000 SMEs and 2.8 million jobs every year. Additionally, more and more owners of SMEs have to consider a third party as a potential successor since there is no apparent successor within the family.

I n t e r n a t i o n a l J o u r n a l o f M a n a g e m e n t C a s e s
202
On the other hand, the terms “globalization” and “information technology” are perceived to trigger dramatic changes in the structure of companies. This might elevate intangible assets (IA) to the role of key value drivers of businesses. These intangibles and the ability to create and utilize them can be regarded as the core activities of a company for securing its continuity. Furthermore, they represent the resources a potential investor is looking for (Nonaka et al., 2001). Companies of all sizes are forced to increasingly recognize these resources as their most precious assets and staff as the most sought-after resources.
Although both topics have a great relevance and take a great public attention, respectively little is known about the relevance of IA in the succession process of SMEs.
The underlining PhD thesis, representing the basis for this paper, builds on the proposition that the decision-making process of an investor in SMEs is mainly based on the essential IA providing the basis for competitive advantage(s). Thereby, the paper in hand provides results of an empirical study of the relevance of intangible assets in general and for the purpose of company succession in particular. The empirical research, which is based on a web survey, was used in order to gather descriptive data about the present situation of IA in SMEs.
Objectives and Research Design of the empirical study The aim of the quantitative stage of the PhD thesis is to garner the perceptions of German associations dealing with SMEs on a day-to-day basis concerning their attitude and opinion towards intangibles in SMEs in general and in the context of company succession in particular. Further, they were assumed to provide a conceptual view as to whether these assets are assessed properly and if there are any additional intangibles to be taken into account.
The Trade Corporations and Chambers of Commerce were selected due to their strong focus on company succession and their good contacts to both sides of this process, namely to the seller and the buyer. Based on the research question, which centres on status quo data, the cross-sectional design was chosen. The cross-sectional design is
suitable when attitudes or retrospective aspects are of great interest (Diekmann, 2005).
Population and type of data collectionThe total population of the quantitative study consists of the sub-populations of the Trade Corporations and the Chambers of Commerce in Germany. Thereby the co-workers of the departments responsible for company succession represent the unit of analysis of the survey. The data collection comprised all associations existing during the period of examination:
54 Trade Corporation•
81 Chambers of Commerce •
Due to the small total population, it was decided to address the total population rather than drawing a sample. As every department was contacted, the work represents a census study. A census study is suitable when a small population is given (Stier, 1996) otherwise such a study is not appropriate in view of time and cost (Schnell, 2005).
Research Method: SurveyThe data were collected by conducting a survey as research method. Despites the disadvantages it may possess, the survey can be seen as appropriate in the research on attitudes and opinions (Diekmann, 2005). In order to gain an overview about the perception and assessment of IA this method is be seen as suitable.
The parent organizations of the Trade Corporation and Chambers of Commerce provided the author of this paper with up-to-date databases (including name, addresses, and e-mails) about the organizations in Germany. Good previous experiences with the co-workers of these organizations, regarding the internet usage of the persons in focus, led to the decision of conducting an online-survey. Thereby as technique, the web-survey was chosen. Since former work experiences in the internet market research are given and the study’s focus on special sub-populations (Schnell, et al., 2005), who are using e-mails and the Web, the web-survey was seen as appropriate for this research.
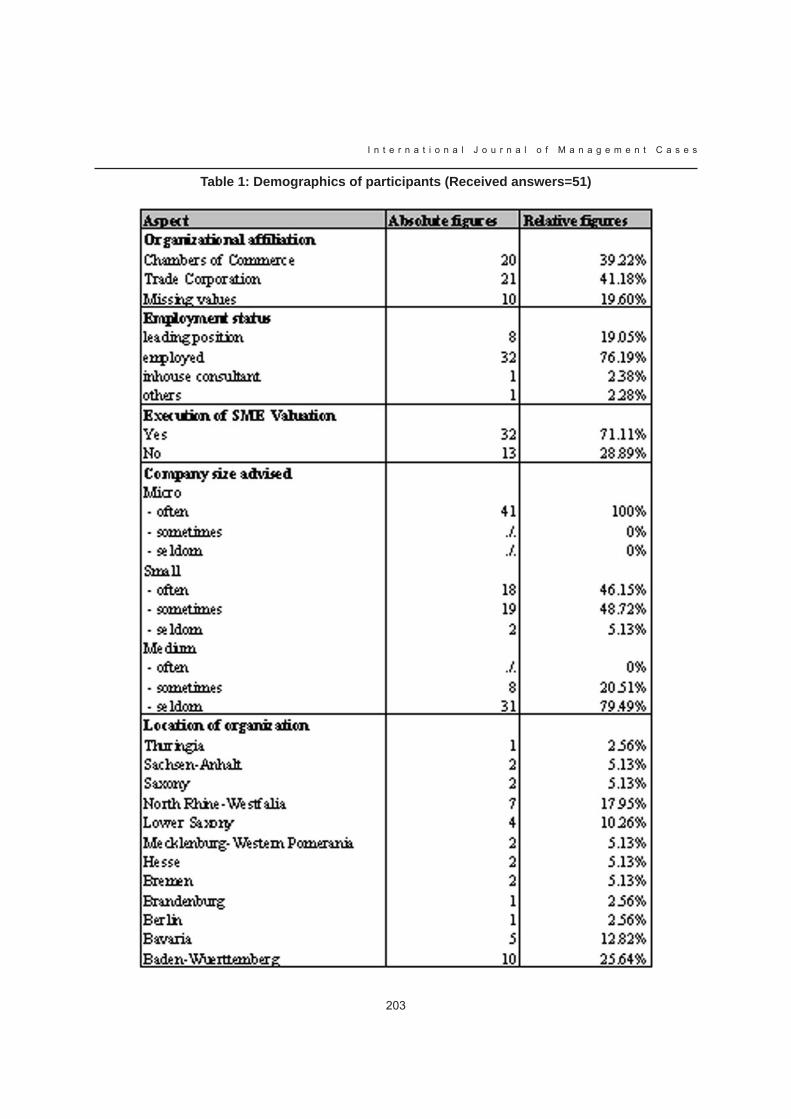
203
I n t e r n a t i o n a l J o u r n a l o f M a n a g e m e n t C a s e s
Table 1: Demographics of participants (Received answers=51)

I n t e r n a t i o n a l J o u r n a l o f M a n a g e m e n t C a s e s
204
Table 2: Relevance of IA
Figure 1: Future relevance of IA
To gather the data a standardized questionnaire was developed. The questionnaire consisted of 34 items. In order to assist the coding and analyzing as well as to overcome the weakness of brief, incomplete or left blank answers to open-ended questions, closed-ended questions with given answers were mainly used (Synodinos, 2003; Evans & Mathur, 2005). However, three questions were open-ended in order to include a more exploratory character of the survey toward the relevance of intangible assets and some questions represent a mixture of both types of questions with the purpose to gain some additional information from the respondents.
After the questionnaire had been constructed it was pre-tested. Eventually, the web questionnaire was designed using a CMS system as platform.
Results of the empirical studyThe demographic characteristics of the participants are summarized in Table 1.
The questions referring to the relevance of IA were based on a five-point rating scale, ranging from unimportant (1) to very important (5). Since the level of measurement is ordinal, the median as well as the percentiles are appropriate descriptive statistics (Leech et al., 2005; Diekmann, 2005). The results are presented in Table 2.
The median for the items impact of IA on the company value, relevance of IA within the associations and relevance of IA for customers, which is three, is a sign of a moderate assessment. However, with the item influence of IA on the investor a positive assessment can be observed. Looking at the

205
I n t e r n a t i o n a l J o u r n a l o f M a n a g e m e n t C a s e s
percentiles no differences can be stated in the variances. Consequently, it can be assumed that the opinions toward the four items are quite similar. The results indicate that so far IA takes up a higher importance with the investors rather than with the associations and their customers, underlining the assumption of this paper.
Additionally the participants were asked to assess the future relevance of IA.
Figure 1 indicates that many respondents (20 or 40%) anticipate a greater relevance of IA in the future. On the other hand, almost the same amount of respondents (17 or 34%) expects not a greater relevance but a remaining focus on TA. A smaller group of respondents (12 or 24%) supposes a balance between IA and TA. Based on the results provided so far, a higher relevance of IA can be
expected in the future. This can be explained by the fact that the demands companies will face are becoming increasingly complex. Consequently, the companies are forced to adequately exploit existing capacities, i.e. firm’s and employees´ knowledge in order to remain competitive. The fact that IA do not have this relevance so far, can be explained in that such changes, here in the way of thinking, need time. However, a significant amount of participants assumes that the relevance will remain on tangible, in the future too. This estimation would confirm the more hesitating attitude of Kaufmann & Schneider (2004) holding that IA is merely of interest for some specialists. Nevertheless, the greater share of respondents disagree with this assumption.
Furthermore, the survey provides data about the assessment of selected intangibles relating to their influence on the company value.
Table 3: Selected intangibles and their impact on the company value
The questions referring to the eight items were also based on a five-point rating-scale ranging from “unimportant” (1) to “very important” (5).
The median and mode for the areas owner, employees, knowledge management, innovation and customers, which is four indicates a positive assessment. Culture and organization are slightly lower assessed and networks the lowest. Looking at the percentiles showed that the variance with the areas culture, organization, networks is higher compared with the rest. Consequently, it can be assumed that the opinions towards these three areas are more differentiated. The results underline the great relevance of the human capital
(owner and employees) in SMEs. Moreover, the assessment of the importance of employees is roughly as high as that of the owner, which implies that the contributions of them are more and more recognized. Innovation and knowledge management as the basis for innovations are of a high relevance as well. The influence of the area customer is assessed as expected confirming that a stronger customer orientation can act as a compensation for a lack of resources in SMEs. Although many benefits are assigned to networks, so far, the result demonstrates that their influence on the company value is moderate only. This suggests that a majority of SME owners still prefer to work independently.
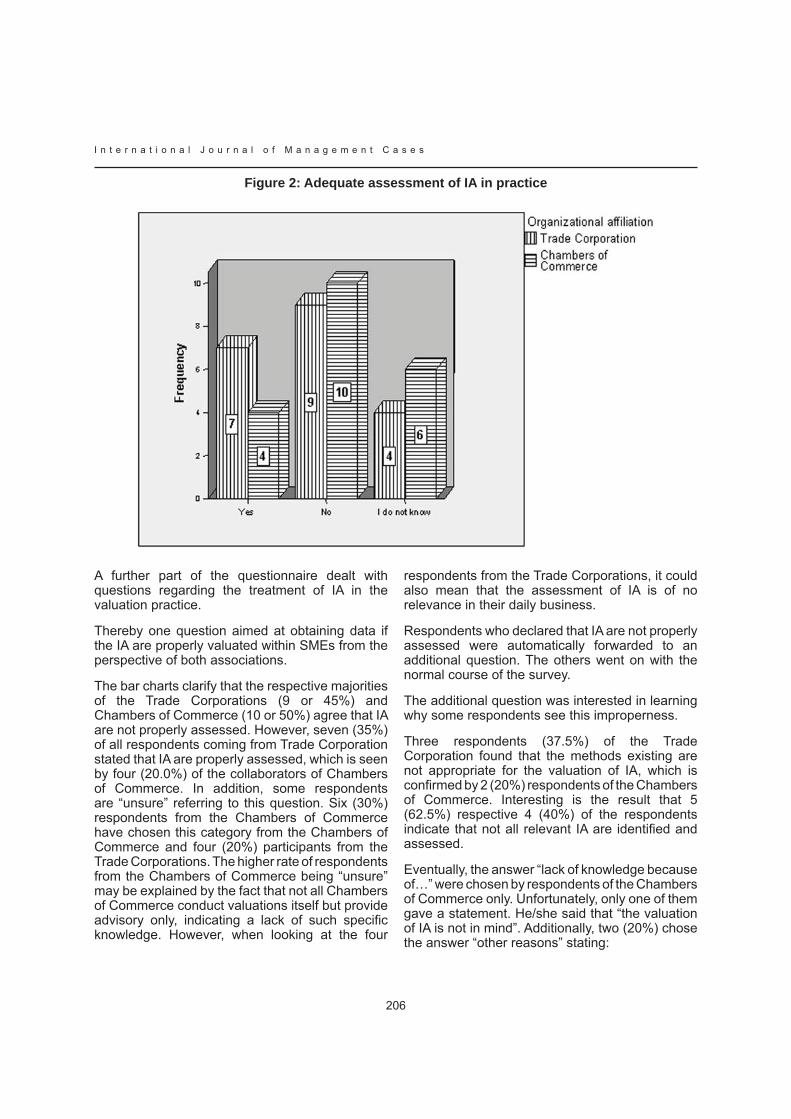
I n t e r n a t i o n a l J o u r n a l o f M a n a g e m e n t C a s e s
206
Figure 2: Adequate assessment of IA in practice
A further part of the questionnaire dealt with questions regarding the treatment of IA in the valuation practice.
Thereby one question aimed at obtaining data if the IA are properly valuated within SMEs from the perspective of both associations.
The bar charts clarify that the respective majorities of the Trade Corporations (9 or 45%) and Chambers of Commerce (10 or 50%) agree that IA are not properly assessed. However, seven (35%) of all respondents coming from Trade Corporation stated that IA are properly assessed, which is seen by four (20.0%) of the collaborators of Chambers of Commerce. In addition, some respondents are “unsure” referring to this question. Six (30%) respondents from the Chambers of Commerce have chosen this category from the Chambers of Commerce and four (20%) participants from the Trade Corporations. The higher rate of respondents from the Chambers of Commerce being “unsure” may be explained by the fact that not all Chambers of Commerce conduct valuations itself but provide advisory only, indicating a lack of such specific knowledge. However, when looking at the four
respondents from the Trade Corporations, it could also mean that the assessment of IA is of no relevance in their daily business.
Respondents who declared that IA are not properly assessed were automatically forwarded to an additional question. The others went on with the normal course of the survey.
The additional question was interested in learning why some respondents see this improperness.
Three respondents (37.5%) of the Trade Corporation found that the methods existing are not appropriate for the valuation of IA, which is confirmed by 2 (20%) respondents of the Chambers of Commerce. Interesting is the result that 5 (62.5%) respective 4 (40%) of the respondents indicate that not all relevant IA are identified and assessed.
Eventually, the answer “lack of knowledge because of…” were chosen by respondents of the Chambers of Commerce only. Unfortunately, only one of them gave a statement. He/she said that “the valuation of IA is not in mind”. Additionally, two (20%) chose the answer “other reasons” stating:
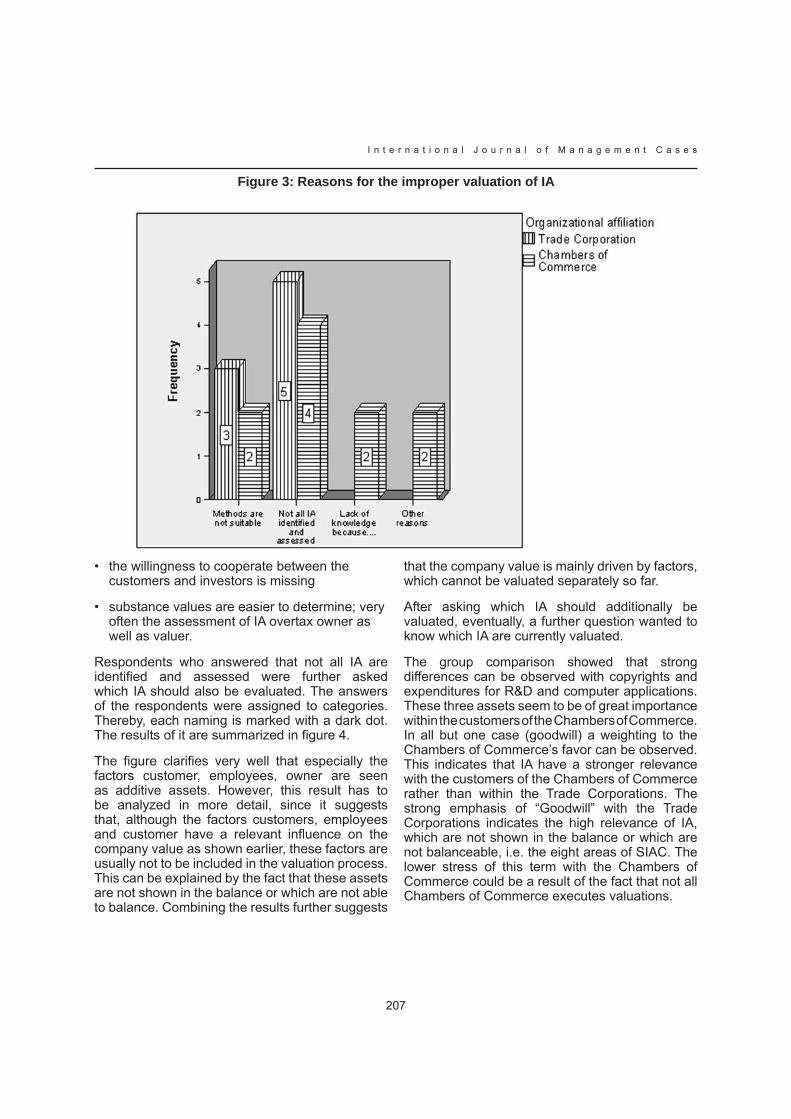
207
I n t e r n a t i o n a l J o u r n a l o f M a n a g e m e n t C a s e s
Figure 3: Reasons for the improper valuation of IA
the willingness to cooperate between the • customers and investors is missing
substance values are easier to determine; very • often the assessment of IA overtax owner as well as valuer.
Respondents who answered that not all IA are identified and assessed were further asked which IA should also be evaluated. The answers of the respondents were assigned to categories. Thereby, each naming is marked with a dark dot. The results of it are summarized in figure 4.
The figure clarifies very well that especially the factors customer, employees, owner are seen as additive assets. However, this result has to be analyzed in more detail, since it suggests that, although the factors customers, employees and customer have a relevant influence on the company value as shown earlier, these factors are usually not to be included in the valuation process. This can be explained by the fact that these assets are not shown in the balance or which are not able to balance. Combining the results further suggests
that the company value is mainly driven by factors, which cannot be valuated separately so far.
After asking which IA should additionally be valuated, eventually, a further question wanted to know which IA are currently valuated.
The group comparison showed that strong differences can be observed with copyrights and expenditures for R&D and computer applications. These three assets seem to be of great importance within the customers of the Chambers of Commerce. In all but one case (goodwill) a weighting to the Chambers of Commerce’s favor can be observed. This indicates that IA have a stronger relevance with the customers of the Chambers of Commerce rather than within the Trade Corporations. The strong emphasis of “Goodwill” with the Trade Corporations indicates the high relevance of IA, which are not shown in the balance or which are not balanceable, i.e. the eight areas of SIAC. The lower stress of this term with the Chambers of Commerce could be a result of the fact that not all Chambers of Commerce executes valuations.
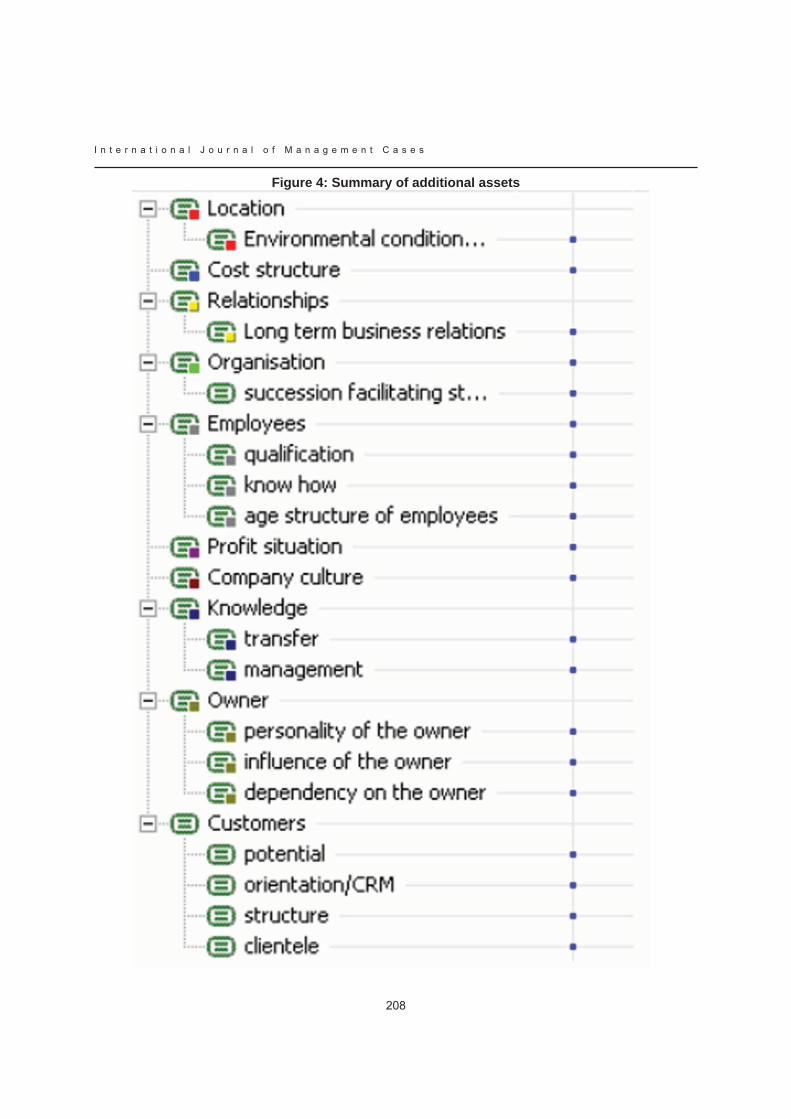
I n t e r n a t i o n a l J o u r n a l o f M a n a g e m e n t C a s e s
208
Figure 4: Summary of additional assets
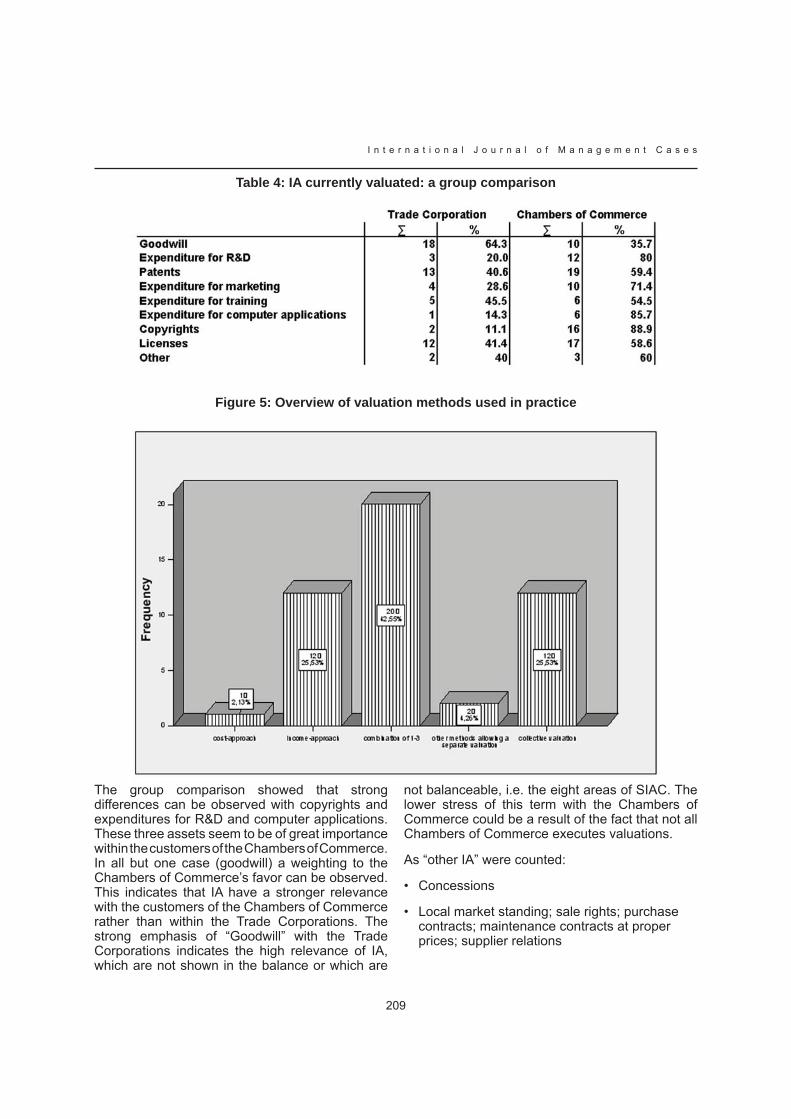
209
I n t e r n a t i o n a l J o u r n a l o f M a n a g e m e n t C a s e s
Table 4: IA currently valuated: a group comparison
Figure 5: Overview of valuation methods used in practice
The group comparison showed that strong differences can be observed with copyrights and expenditures for R&D and computer applications. These three assets seem to be of great importance within the customers of the Chambers of Commerce. In all but one case (goodwill) a weighting to the Chambers of Commerce’s favor can be observed. This indicates that IA have a stronger relevance with the customers of the Chambers of Commerce rather than within the Trade Corporations. The strong emphasis of “Goodwill” with the Trade Corporations indicates the high relevance of IA, which are not shown in the balance or which are
not balanceable, i.e. the eight areas of SIAC. The lower stress of this term with the Chambers of Commerce could be a result of the fact that not all Chambers of Commerce executes valuations.
As “other IA” were counted:
Concessions•
Local market standing; sale rights; purchase • contracts; maintenance contracts at proper prices; supplier relations
I n t e r n a t i o n a l J o u r n a l o f M a n a g e m e n t C a s e s
210
Dependency on owner and customers; age of • employees and customers
Process knowledge•
In general, the results obtained underline the discussion of the last question. Although, employees, owner, customer, innovation and knowledge management do have a great influence on the company value according to the participants, they are not assessed separately so far. Accordingly, these assets have to be assigned to the term “Goodwill”, explaining the high relevance of this term by approximately two-third of the participants of the Trade Corporations and one-third of the Chambers of Commerce after all.
Hand in hand with this discussion goes the interest, which valuation methods are currently used to assess the intangible assets.
The figure shows that many respondents use a combination of methods (here: income-, cost- and market-approach). The income-approach and collective methods show an equal frequency. Collective methods calculate the total sum of assets, whereas the income-approach is based on the estimation of the potential future returns of the company in focus. Two respondents stated that they use methods to calculate the individual financial value of the asset and finally, one respondent applies the cost-approach. The market-approach itself, meaning that the values are determined by previous transactions, has not been selected. This can mean both that the method is mainly used in combination with other methods or that the method is not seen as appropriate to value SMEs due to the difficulties to find a comparable previous transaction. In general, the finding showed that the methods used in practice are based on monetary figures, underlining the German culture to make things measurable (Usunier & Lee, 2005). A way, which does not support Sveiby´s opinion (1998) of saying that figures represent only one mean to measure something, for Germany it can be said that figures signify the only way.
Further, the survey gave no hints that for the IA assessment special methods are applied; instead, traditional methods developed for the assessment of tangible assets are used.
ConclusionsThis paper presented data about the current relevance of IA in SMEs in Germany for the purpose of company succession. The primary research undertaken for this purpose enabled to obtain explorative insights in this topic. Overall, the evaluation of the impact of IA on the company value, within the associations and their customers suggest a moderate relevance. However, the relevance of IA on the decision-making process of a potential investor showed a higher assessment. Most respondents of the web-survey stated that IA have a strong bearing from the investor’s perspective. The results also indicate that a higher relevance of IA can be expected in future; showing that such a change in the way of thinking needs its time. The median scores for eight selected intangibles propose a higher weight of the items owner, employees, customer, innovation, and knowledge management on the company value.
A great share of respondents coming from both associations said that an appropriate assessment of IA is not given. As reasons for this situation, a lack of suitable valuation models as well as the condition that not all IA are identified and assessed is mainly named. Respondents who answered that not all IA are identified and assessed stated that owner, employees and customers represent the central assets, which should also be assessed.
The income-approach, the collective approach and a combination of cost-, income-, and market-approach represent the methods, which are currently mainly applied by the associations. This indicates a focus on traditional methods. Traditional methods are developed to valuate tangible assets, which explain the difficulties to valuate intangibles. With the income and the collective approaches, the focus is not on the valuation of individual assets but on the sum of all assets.
In summary, the empirical study provided the author with essential insights into the topic of IA in SMEs, which represent an ideal basis for the preparation of the qualitative stage, representing the next step in the on-going Ph.D. work.
ReferencesCommission of the European Communities (2006) Transfer of Businesses – Continuity through a new beginning Brussels, 14.03.2006
211
I n t e r n a t i o n a l J o u r n a l o f M a n a g e m e n t C a s e s
Diekmann, Andreas (2005) Empirische Sozialforschung. Grundlagen, Methoden, Anwendungen Hamburg: Rowohlt
Evans, Joel R. & Mathur, Anil (2005) The value of online surveys Internet Research Vol. 15 Issue 2 pp. 195-219
Kaufmann, Lutz & Schneider, Yvonne (2004) Intangibles. A synthesis of current research Journal of Intellectual Capital, Vol. 5 Issue3 pp. 366-388
Leech, Nancy, Barrett, Karen C. & Morgan, George A. (2005) SPSS for intermediate statistics. Use and Interpretation Mahwah, New Jersey: Lawrence Erlbaum Associates
Nonaka, Ikujiro, Toyama, Ryoko & Konno, Noboru (2001) SECI, Ba and Leadership: a Unified Model of Dynamic Knowledge Creation. In: Nonaka, Ikujiro & Teece, David eds. Managing Industrial Knowledge. Creation, Transfer and Utilization London: Sage Publications pp. 13-43
Schnell, Rainer (2002) Antworten auf Nonresponse Presentation at the XXXVII Congress on the German Market Research, Wolfsburg, Germany, 07 Mai 2002. www.uni-konstanz.de/FuF/Verwiss/
Schnell/Antworten_auf_Nonresponse%5B1%5D.pdf [Accessed 18 September 2006]
Schnell, Rainer, Hill, Paul B. & Esser, Elke (2005) Methoden der empirischen Sozialforschung München, Wien: R. Oldenbourg Verlag
Stier, Winfried (1996) Empirische Forschungsmethoden Berlin, Heidelberg, New York: Springer
Sveiby, Karl-Erik (1998) Measuring Intangibles and Intellectual Capital – An Emerging First Standard http://www.sveiby.com/articles/EmergingStandard.htm [Accessed 16 Mai 2005]
Synodinos, Nicolaos E. (2003) The “art” of questionnaire construction: some important considerations for manufacturing studies Integrated Manufacturing Systems Vol. 14 Issue 3 pp. 221-237
Usunier, Jean-Claude & Lee, Julie Anne (2005) Marketing Across Cultures Harlow, Pearson Education Limited

I n t e r n a t i o n a l J o u r n a l o f M a n a g e m e n t C a s e s
212
THE RELATIONSHIP BETWEEN THE DESIRED SELF-IMAGES AND THE SELF-
MONITORING
IHN HEE CHUNGKUMOH NATIONAL INSTITUTE OF TECHNOLOGY, SOUTH KOREA
HYE JIN BAEKUMOH NATIONAL INSTITUTE OF TECHNOLOGY, SOUTH KOREA
HO JUNG CHOOSEOUL NATIONAL UNIVERSITY, SOUTH KOREA
Abstract
Fashion marketing research has been focusing on female consumers because fashion has traditionally been considered as a matter belonging to the woman’s domain. As man’s fashion market has been showing a rapid growth in recent years, researchers become interested in investigating male consumers’ attitudes and behaviours toward fashion and fashion products. In spite of that self-image is one of focal concepts in understanding individual consumer’s fashion consumption, few attempts have been made to examine male consumers’. The purpose of this study was to examine the relationship between the desired self-image and self-monitoring of male college students. It was hypothesized that the level of self-monitoring would affect the mode of pursuing desired self-image. A survey instrument was developed, which asked subjects to respond to 32 image words for 4 different situations respectively: attending class, meeting girlfriends, attending ceremonies, and exercising. These 4 situations reflected the representativesituations male college students experienced in every day life. In addition to it, 18 items of statements measuring self-monitoring were included in the questionnaire. Responses from 349 male students at 6 colleges in Daegu and Gyeongbuk area in Korea were collected during June 2005. With the exclusion of incomplete ones, 346 responses were analyzed. Factor analysis for desired self-image words resulted in five factor solutions: refined image, sporty image, classic image, natural image and simple image. Then, male college students were classified into 3 groups according to their desired self-images for different situations: selective image-
management group, passive image-management group, and active image-management group. The selective image-management group pursued inconsistent desired self-images appropriate for the individual situation. The passive image-management group was found that they didn’t want to appeal themselves in any settings. On the other hand, active image-management group marked high scores in all of desired self-image in every setting. Scores of self-monitoring among these 3 groups were compared. As expected, the self-monitoring level of the selective image-management group was significantly higher than other groups, and active image-management group followed it. Applying the discriminant analysis to find out powerful statements of self-monitoring measures distinguishing these 3 groups identified 4 significant statements. The findings provided strong supporting evidence that a male college student who has high level of self-monitoring would develop sophisticated desired self-image which is situation-specific. On the basis of these findings, further investigation on relationships among self-monitoring, desired self-image and other variables should be interesting research problems which have ample implications for fashion businesses targeting young male consumers.
Key words: clothing-wearing situation, desired self-image, self-monitoring
IntroductionFashion marketing research has been focusing on female consumers because fashion has traditionally been considered as matter belonging to

213
I n t e r n a t i o n a l J o u r n a l o f M a n a g e m e n t C a s e s
the woman’s domain. But as man’s fashion market has been showing a rapid growth in recent years, researchers become interested in investigating male consumers’ attitudes and behaviours toward fashion and fashion products. To understand male consumers and produce meaningful implications for fashion marketers targeting this mysterious market, it would be important to examine what they want to represent and how they consider the every situation they encounter.
Clothing image is one of focal concepts in understanding fashion product consumption, and there have been many studies that identified image words and factors of which female consumers aware, found the preference of specific clothing image according to the context, and interpreted the relationship clothing image with relevant variables such as clothing design. Desired self-image also was investigated much on relation to the clothing image. In spite of this condition, few attempts have been made to examine male consumers’ clothing image and desired self-image.
Until now, desired self-image mainly has given attention to situational variables. Most efforts were devoted to test the statement that desired self-image was situation specific. In this study, we went further to understand the desired self-image and situational contexts. The assumption was that there would exist several discrete categories of consumer who had different patterns responding to situational stimuli. While some will respond to the every situation in the similar modes, there will be some others who have different expressive needs according to situations.
Bae & Chung (2006) studied the differentiation of desired self-image of male college students, and fashion product unities according to the situation. In this study, situation was identified as an important variable which confined not also the desired self-image but also the fashion product items being bought by the respondents for the purpose of managing image. Current study develops this theme from psychological perspective. Why desired self-image changes according to the situation? Every respondent shows similar tendency? If it is not true, what is the reason of the difference among the respondents?
To answer these questions, this study proposed that the concept of self-monitoring might have role in explaining the association between desired self-image and situations. Self-monitoring is one
of critical constructs of consumer attributes which possibly affect individual consumer’s buying behaviours and attitudes (Shavitt, Lowrey, and Han, 1992 ; Bearden, Shuptrine, and Teel, 1989 ; Graeff 1996 ; Auty and Elliott, 1999), and specifically, its moderating role to affect the explaining power of a dispositional or a situational factor on consumer behaviour has been attracting interests of many researchers (Becherer and Richard 1978).
The purpose of this study was to examine the relationship between desired self-image and self-monitoring of male college students. After classifying consumers by their patterns of pursuing desired self-images in 4 different situations, their self-monitoring was compared. Discussion on the findings and implications were given.
Literature Review
Desired self-images
Chung and Rhee(1996) had reviewed the concept and measures of self-image and suggested two dimensions to measure the self-images: actual self-image vs. ideal self-image, and intrinsic self-image vs. phenomenal self-image. This 2×2 frame of concept, as showed in <Figure 1>, resulted in 4 categories of self-image. The ideal and phenomenal self-image can be termed as desired self-image, which are rather ideal than actual, depending on the context or situation (Chung, 2001).
In the field of fashion research, there have been many studies related to desired self-image (Bae & Chung, 2006 ; Chung, 2001 ; Chung, 2004 ; Kim & Kim, 2004, Kim & Lee, 1999 ; Koh, 1994 ; Lee & Park, 1997 ; Oh, 1996 ; Park & Lee, 1999). Desired self-image itself and its association with self-image, clothing image, brand image, store image, and advertising image have been agreed as a critical concept from both academic and practical perspectives in this discipline. But most of preceding studies have utilized the female sample. Until now there has been a little consideration for male consumers’ desired self-image.
Previous literature lacked in demonstrative studies for the different desired self-image according to “actually” different situations. Oh (1996), Lee & Park (1997), and Bae & Chung (2006) suggested different 4 situations in their studies respectively. Especially Bae & Chung (2006) proposed 2
I n t e r n a t i o n a l J o u r n a l o f M a n a g e m e n t C a s e s
214
dimensions of perception concerning all of situations for the male college students: social vs. individual and usual vs. unusual. Based on these dimensions, they selected 4 different types of typical situations of male college student as attending class, meeting girlfriends, attending ceremonies, and exercising.
Self-monitoring
The self-monitoring is defined as the degree to which observe and control their expressive behaviours and self expressions in accord with social cues (Snyder, 1974 ; Graeff, 1996). Consumers who have high level of self-monitoring tendency are sensitive to the feedback of others in social situation, and use these cues to manage their own behaviours (Bearden, Shuptrine & Teel 1989). As a result, high self-monitoring consumers tend to exhibit inconsistent behaviours which are tailored to accommodate the specific situational needs. On the contrary, the behaviours of the low self-monitors are largely determined by their self dispositional characteristics, and demonstrate more consistent behaviours across situations.
When the concept of self-monitoring is applied to explain consumer decision-making specifically, many previous studies proposed that high self-monitors would be concerned with image related attributes while low self-monitors emphasized utilitarian quality related product attributes (Shavitt, Lowrey & Han, 1992 ; Bearden, Shuptrine & Teel, 1989 ; Graeff 1996). High self-monitors who are more sensitive to other peoples’ expression and social appropriateness would be concerned with the self-presentational significance of products including image, brand, and visual expression. On the other hand, low self-monitors are expected to be highly attentive to quality cues such as “the taste of whiskey, the cleaning performance of shampoo, or the sound quality of audiocassettes” (Shavitt, Lowrey, & Han, 1992).
While the concept of self-monitoring has been broadly applied to explain a number of consumer behaviour and marketing problems, especially in advertising researches, there has been a little attention on this variable in fashion marketing field. Lee & Park (1997) found out some differences of desired self-image between high self-monitors and low self-monitors in diverse situations.
Auty and Elliott (1998) applied self-monitoring construct to explain consumers’ attitudes toward
fashion products. The authors expected that high self-monitors would have more positive attitudes toward branded fashion products (jeans) than low self-monitors, and low self-monitors would be more responsive to utilitarian attributes of fashion products. The analysis using 705 UK sample found that the effect of utilitarian attributes on product attitudes for low self-monitor was only significant for unbranded fashion products not for branded fashion products.
Most studies examining the effect of self-monitoring has made use of Snyder (1974 ; revised in Snyder & Gangestad, 1986)’s scale. The scale has 18 true-false statements measuring a person’s self-monitoring tendency. Snyder (1974) incorporated several attributes which were believed to be associated with self-monitoring concept into the scale development process at the original work. These five concepts included that concern for appropriateness of social behaviour, attention to social comparison information, ability to control or modify self presentation, use of this ability in particular situations, and cross-situational variability of social behaviour.
Originally Snyder (1974) proposed the scale as a uni-dimensional rather representing these five concepts as underlying dimensions. However, researchers who analyzed the factor structure of the scale produced conflicting results (Slama & Singley, 1996). On the basis of Lenox and Wolfe (1984)’s discussion, Auty and Elliot (1999) proposed three factor model of self-monitoring, which is comprised of ability to modify self presentation, sensitivity to the expressive behaviour of others, and concern for appropriateness. Similarly, Slama and Singley (1996) introduced three factors comprising self-monitoring scale under the factor name of “extraversion”, “acting ability”, and “other directedness”.
Methodology
Hypothesis
The level of self-monitoring would affect the mode of pursuing desired self-image.
Measurements
A survey instrument was developed, which consisted of 2 major parts: desired self-images for 4 different situations and degree of self-monitoring.

215
I n t e r n a t i o n a l J o u r n a l o f M a n a g e m e n t C a s e s
Desired self-image was measured with 32 image words which had been selected through literature study and pre-test process. 4 situations were determined as attending class, meeting girlfriends, attending ceremonies, and exercising, coincided with Bae & Chung (2006). Subjects were asked to respond 32 desired image words for 4 situations on 7-point scale respectively.
Self-monitoring instruments was borrowed from the study of Lee (1988) which modified the scale and confirmed validity and reliability of measurements originally introduced by Snyder & Gangestad (1986). This comprises 18 items of statements measuring individual self-monitoring attitude and behaviour on 7-point Likert-type scale. In addition to these, demographic questions (age, academic year, major, residence type, living area, monthly expenditure) were included in the questionnaire.
Data collection and analysis
By the design of this study, the participants of survey were limited to male college students. Responses from 349 male students at 6 colleges in Daegu and Gyeongbuk area in Korea were collected during June 2005. With the exclusion of incomplete ones, 346 responses were analyzed using SPSSWIN 10.1.3. Profiles of the respondents were shown in <Table 1>.
Results and DiscussionDesired self-image factors of male college students
After deleting 6 words which have not been pursued by respondents in any situation and 3 words which having similar meaning with the other which was pursued more in the Korean – English pair, factor analysis for 23 desired self-image words over 4 situations together were performed with the option of principal component analysis and the Varimax rotation. Finally, it resulted in five factor solutions consisted of 22 words. The factor loading values were all over 0.45. And total percent variance of Eigenvalue covering 5 factors was 60.45%. The reliability (Cronbach’s alpha) of 5 factors ranged from .51 to .82. This result could explain the desired self-image variable enough well.
As showed in <Table 2>, 5 factors were named as ‘Refined Image’, ‘Sportive Image’, ‘Classical Image’, ‘Natural Image’, and ‘Simple Image’. As
reported in <Table 3>, the descriptive statistics showed that some desired self-images factors such as natural image and simple image were desired by male students over all 4 situations, while certain desired self-images such as classical image and sportive image were specifically pursued depending on the situation. In the case of the refined image, the levels of pursuit were significantly different according to the situation.
Male college student groups according to the mode of pursuing desired self-image
Male college students were classified into 3 groups according to their desired self-images for different situations. 5 factors of desired self-image were applied to K-means clustering, and finally 3 groups were determined in the consideration of sample size and the differentiations of desired self-images among groups by ANOVA.
As reported in <Table 4>, sample sizes for three groups were 103, 128, and 113 respectively. In the aspects of desired self-image, generally speaking, Group 3 pursued the major part of the self-image more than other 2 groups except the refined image. And Group 2 showed lower pursuit tendency than the other 2 groups except for classical image in every situation, and the simple image limited to the situation of exercising. Instead, Group 1 showed the trend which was more situation-specific. They have differentiated desired and avoided images depending on the situation.
Thus, these groups were named as ‘Selective Image-Management Group’, ‘Passive Image-Management Group’, and ‘Active Image-Management Group’, respectively. The selective image-management group pursued desired self-images appropriate for the individual situation. The passive image-management group was found that they didn’t want to appeal themselves in any setting. On the other hand, active image-management group marked high scores in almost all of desired self-image in every setting.
The scores of self-monitoring of 3 groups
The basic statistics of self-monitoring was reported in <Table 5> with the individual mean and standard deviation (S. D.) for each measuring statement. The total mean was 75.44 in the condition of the possible score range from 18 to 126. The reliability of self-monitoring measures over 18 statements was represented as .80, that is high

I n t e r n a t i o n a l J o u r n a l o f M a n a g e m e n t C a s e s
216
enough to judge the measures as reliable. To test the hypothesis, scores of self-monitoring among 3 were compared by ANOVA.
<Table 6> showed the results. As expected, the self-monitoring score of the selective image-management group was significantly higher than other 2 groups, and active image-management group followed it. When one desires one’s own self-images differently regarding the situations, it can be said that he has situation-specific desired self-image, he is sensitive to the others’ response to their appearance, and he is in high self-monitoring level.
The discriminant functions to predict the group with self-monitoring variable
Discriminant analysis was performed to investigate the effecting structure of self-monitoring variable to classify above 3 groups. Since it was not determined yet the influencing factors related to desired self-image variable, all of 18 statements were entered as independent variable to identify powerful items for predicting groups. Using stepwise method, resultantly 2 functions with 4 significant items were produced.
<Table 7> showed the result. The items “At parties and social gatherings, I do not attempt to do or say things that others will like”, “In different situations and with different people, I often act like very different person”, “I have never been good at games like charades or improvisational acting”, and “At a party, I let others tell the jokes and stories” were remained in the discriminant functions. As showed in <Table 8>, the probability to predict the original group with these 2 functions was 49.4%.
<Figure 2> as well as <Table 7> and <Table 8> should be considered to draw some insightful interpretation of the findings. Group 2 separated first, and then Group 1 and Group 3 were divided. It was confirmed that Group 1 and Group 3, that is, selective image-management group and active image- management group would be closer in the response of self-monitoring measures as showed in <Table 6>. However, the distinction between 2 groups needed other explanative variables.
ConclusionThe purpose of this study was to examine the relationship between desired self-image and self-monitoring of male college students. Concerning
the difference of desired self-image for 4 situations, all respondents were classified into 3 groups. It was possible to find out the significant difference of self-monitoring level among these 3 groups. Besides, 4 statements were identified as powerful items distinguishing 3 groups. Selective image-management group was in the highest level of self-monitoring, active image-management group followed it, and passive image-management group was in the lowest. This finding provided a strong supporting evidence for the hypothesis that a male college student who has high level of self-monitoring would develop sophisticated desired self-image which is situation-specific.
However, there still remains a question to be solved. There would be other important variables to distinguish selective image-management group from active image-management group. It could be possible to consider some other variables such as optimum stimulus level, extroversion, or fashion innovativeness. Further investigation on relationships among self-monitoring, desired self-image and these variables should be interesting research problems which have ample implications for fashion businesses targeting young male consumers.
On the concept of self-monitoring itself, we should pay attention to the dimensions composing the concept. With the consideration of sub-dimensions, the explanation power for the fashion attitudes and behaviours would be increased. Besides, it is expected that the inconsistency in the findings of situation appropriate perception between Chung & Rhee (1999)’s and Chung, Park & Kwon (2001)’s work could be explained with the aspects of sub-dimensions.
The fashion market mainly has been segmented with lifestyle variables. If lifestyle is different, the selection of item and design also will be different. But as lifestyle measures were so vast, it becomes difficult to construct instruments and measure various lifestyles of consumers exactly. In the field of advertising, lifestyle variables are still of use, because the scenes can be presented effectively based on the consumer’s lifestyle. Now, it is considerable to utilize the desired self-image variable combined with the self-monitoring variable for the merchandising fashion product. A series of future research should be continued to build a strong support for this approach.
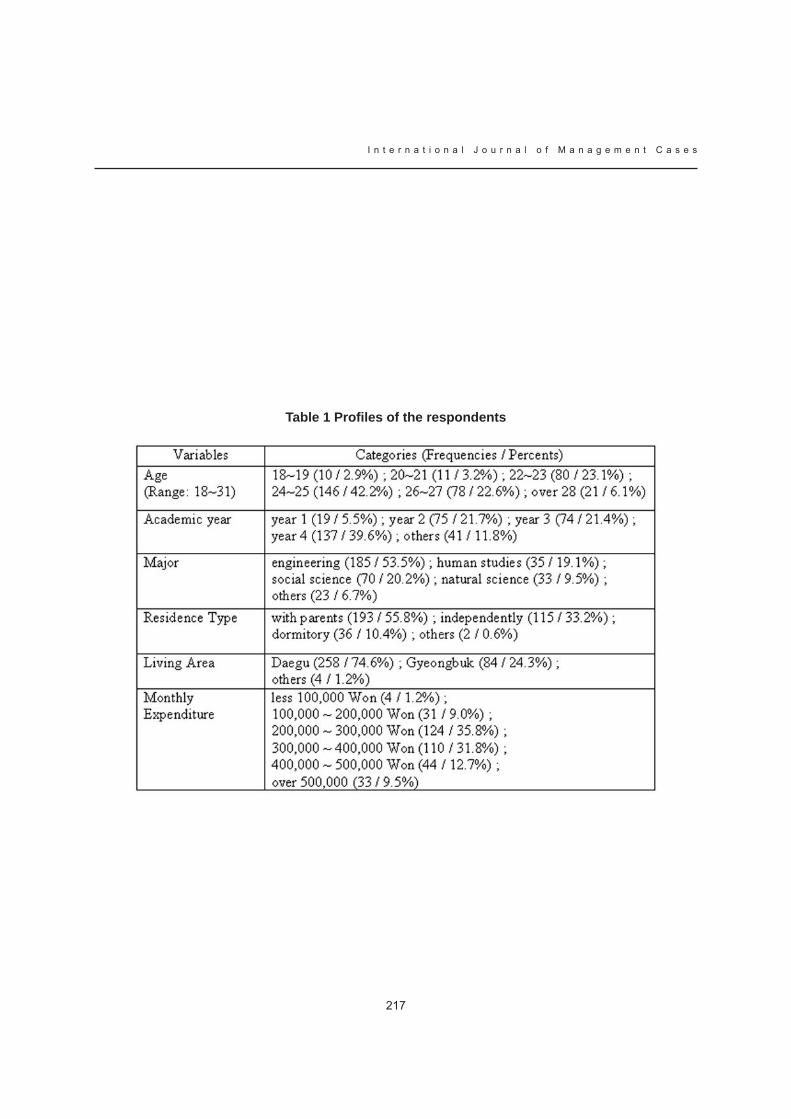
217
I n t e r n a t i o n a l J o u r n a l o f M a n a g e m e n t C a s e s
Table 1 Profiles of the respondents

I n t e r n a t i o n a l J o u r n a l o f M a n a g e m e n t C a s e s
218
Table 2 5 Factors of desired self-image
(R) reversely coded item
Table 3 Difference of desired self-image according to the situation
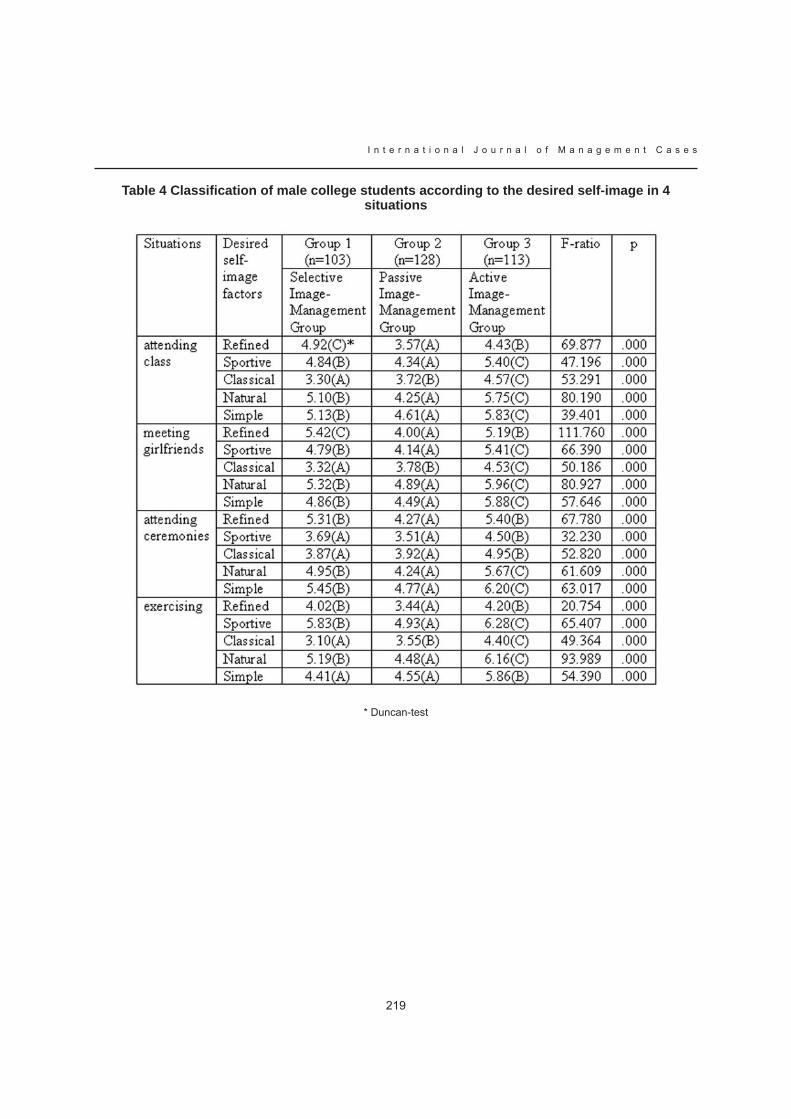
219
I n t e r n a t i o n a l J o u r n a l o f M a n a g e m e n t C a s e s
Table 4 Classification of male college students according to the desired self-image in 4 situations
* Duncan-test
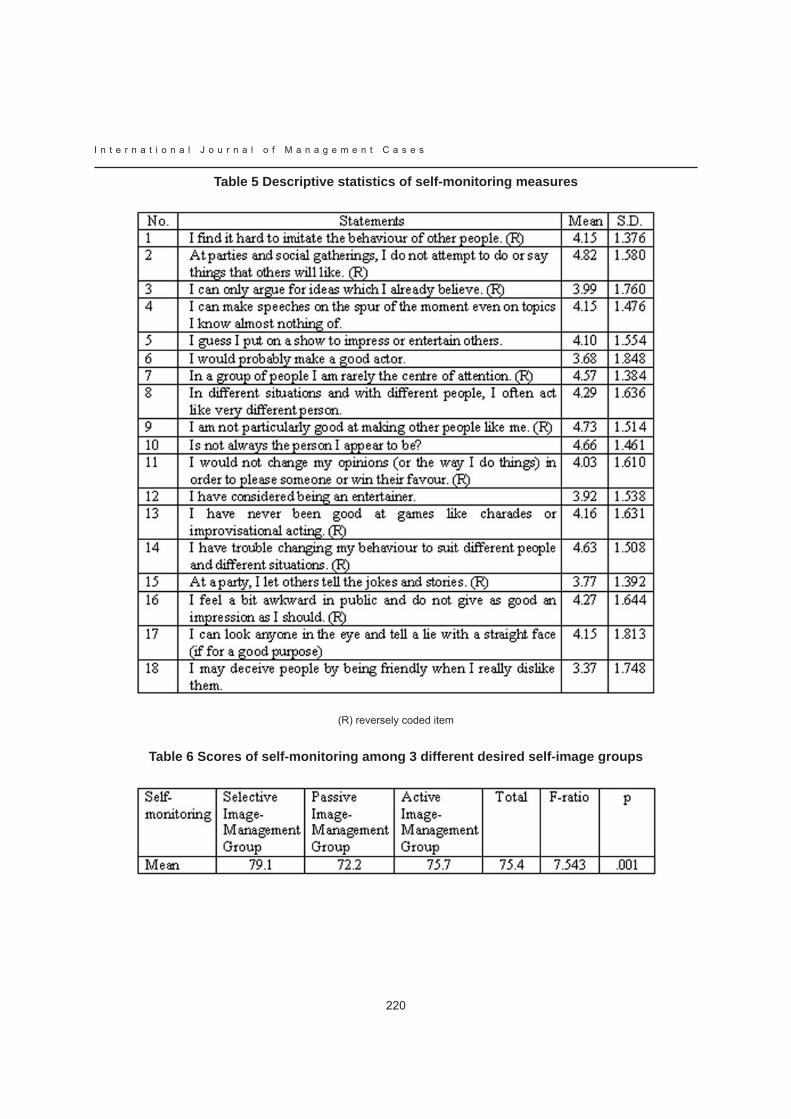
I n t e r n a t i o n a l J o u r n a l o f M a n a g e m e n t C a s e s
220
Table 5 Descriptive statistics of self-monitoring measures
(R) reversely coded item
Table 6 Scores of self-monitoring among 3 different desired self-image groups

221
I n t e r n a t i o n a l J o u r n a l o f M a n a g e m e n t C a s e s
Table 7 Statistics of the discriminant functions
Table 8 Prediction probability of discriminant functions
Figure 1 Two dimensions to measure the self-images
(source: Chung & Rhee, 1996, pp. 214)

I n t e r n a t i o n a l J o u r n a l o f M a n a g e m e n t C a s e s
222
Figure 2 Territorial map for 3 groups
223
I n t e r n a t i o n a l J o u r n a l o f M a n a g e m e n t C a s e s
ReferencesAuty, S. & Elliott, R. (1998). Fashion Involvement, Self-Monitoring and the Meaning of Brands Journal of Product & Brand Management Vol. 7 No. 2 pp. 109-123
Auty, S. and Elliott, R. (1999). Reading Advertising and Writing Identity Advances in Consumer Research Vol. 26 pp. 439-444
Bae, H. J. & Chung, I. H. (2006). The Desired Self-Images and the Fashion Product Unities of Male College Students according to Situation Journal of the Korean Society of Clothing and Textiles Vol. 30 No. 7 pp. 1135-1145
Bearden, W. O., Shuptrine, F. K. & Teel, J. E. (1989). Self-Monitoring and Reactions to Image Appeals and Claims About Product Quality Advances in Consumer Research Vol. 16 pp. 703-710
Becherer, R. C. & Richard, L. M. (1978). Self-Monitoring as a Moderating Variables in Consumer Behavior Journal of Consumer Research Vol. 5 No. 12 pp. 159-162
Chung, I. H. (2001). The Study on Desired Image and Fabric Preference of Woman College Student for Apparel The Research Journal of the Costume Culture Vol. 9 No.4 pp.629-638
Chung, I. H. (2004). Differences in Perception of Image Words and Perception Dimension of Desired Image according to Sex Variable for College Students in a School Context The Research Journal of the Costume Culture Vol. 12 No.2 pp.199-210
Chung, I. H., Park, S. J. & Kwon, Y. I. (2001). Response to Clothing Utility-Reduction according to Clothing-Wearing Motives Journal of the Korean Society of Clothing and Textiles Vol. 25 No. 7 pp. 1332-1340
Chung, I. H. & Rhee, E. Y. (1996). Clothing and Self-Image Journal of the Korean Society of Clothing and Textiles Vol. 20 No. 1 pp. 207-217
Chung, I. H. & Rhee. E. Y. (1999). The Interaction between Clothing -Wearing Motives and Fashion Phenomenon: A Qualitative Approach Journal of the Korean Society of Clothing and Textiles Vol. 23 No. 1 pp. 128-139
Graeff, T. R. (1996). Image Congruence Effects on Product Evaluations: The Role of Self-Monitoring
and Public/Private Consumption Psychology and Marketing Vol. 13 No. 5 pp. 481-499
Kim, C. S. & Lee, H. J. (1999). Analysis of Jeans Market under IMF Circumstance focused on Brand Awareness, Brand Image and Consumer’s Seeking Image of Young Adults Journal of the Korean Society of Clothing and Textiles Vol. 23 No. 3 pp. 447-458
Kim, Y. D. & Kim, M. Y. (2004). A Study on Clothing Preference Images of the Middle-Aged and Elderly Women Journal of the Korean Society of Clothing and Textiles Vol. 28 No. 6 pp. 746-757
Koh, A. (1994). Consumer Intention to Purchase Domestic/Foreign Brand Jeans: Beliefs, Attitude, and Individual Characteristics Journal of the Korean Society of Clothing and Textiles Vol. 18 No.2 pp. 263-272
Lee, E. S. & Park, J. O. (1997). A Study on Situational Self-Image, Clothing Selection Factors based on Level of Self-Monitoring of Female University Students Journal of the Korean Society of Clothing and Textiles Vol. 21 No. 7 pp. 1205-1214
Lee, J. I. (1988). The Reliability, Validity, Response Style Comparison between Dichotomous Scale and Seven-Point Likert Scale: in Self-Monitoring Scale and Self-Conscious Scale Master’s Thesis, Seoul National University.
Lenox, R. D. & Wolfe, R. N. (1984). Revision of the Self-Monitoring Scale Journal of Personality and Social Psychology Vol. 46 No. 6 pp. 1349-1364
Oh, C. (1996) Clothing Market Segmentation by Situational Self Image, Master’s Thesis, Seoul National University
Park, J. H. & Lee, S. J. (2002). A Study on Color Makeup Preference by Pursuing Clothing Image and Clothing Behavior Costume Vol. 52 No.7 pp. 87-102
Shavitt, S., Lowrey, T. M. & Han, S-P. (1992). Attitude Functions in Advertising: The Interactive Role of Products and Self-Monitoring Journal of Consumer Psychology, Vol. 1 No. 4 pp. 337-364
Slama, M. E. & Singley, R. B. (1996). Self-Monitoring and VALUE-Expressive vs. Utilitarian Ad Effectiveness: Why the Mixed Findings? Journal of Current Issues and Research in Advertising Vol. 18 No. 2 pp. 39-52

I n t e r n a t i o n a l J o u r n a l o f M a n a g e m e n t C a s e s
224
Snyder, M. (1974). Self-Monitoring of Expressive Behavior Journal of Personality and Social Psychology Vol. 30 pp. 526-537
Snyder, M. & Gangestad, S. (1986). On the Nature of Self-Monitoring: Matters of Assessment, Matters of Validity Journal of Personality and Social Psychology Vol. 51 pp. 125-139
225
I n t e r n a t i o n a l J o u r n a l o f M a n a g e m e n t C a s e s
THE CHANGING MARKETING COMMUNICATIONS MIX – A MEDIA AND
MESSAGE FRAMEWORK.
GRAHAM HUGHESLEEDS METROPOLITAN UNIVERSITY, UK
CHRIS FILLUNIVERSITY OF PORTSMOUTH BUSINESS SCHOOL, UK
Abstract
The way marketing communications are used by organisations to reach target audiences has changed significantly in recent years. Once, the emphasis was on promoting ‘to’ audiences through an acquisition and persuasion orientation, now it is about communicating ‘with’ audiences, where the focus is on interaction and relationships. The traditional promotional mix was based on the five main communications tools but it is argued that this is no longer representative of contemporary communications practice and an increasingly complex media environment.
The promotional mix element of the 4Ps marketing mix has become established as the conventional method to express the way organisations promote their products and services. Commonly agreed to consist of advertising, sales promotion, public relations, personal selling and more recently, direct marketing, each tool possesses different properties and capabilities. As a result, the promotional mix can be assembled in a variety of ways to achieve different outcomes, both cognitive and behavioural.
However, ideas that organisations should promote and hence persuade customers to think and behave in particular ways have changed. Persuasion is now regarded as just one of a number of tasks that an organisation needs to accomplish through its communication activities. For example, providing information, listening, informing and reminding customers are just some of the complexities associated with contemporary interpretations and usage of marketing communications. The emphasis has shifted from a ‘promoting to’ to a ‘communicating with’ focus. Whilst the origins of the promotional mix may have provided a basis for
firms and their representatives, to have organised their operations, today’s complex communications environment suggests that consumers and other stakeholders care little as to what terms are used to describe the forms through which they receive communications. What is also interesting is that media were regarded as an element of advertising and subservient to all the tools.
Consideration is given to the ways in which communication ‘messages’ are created and how they are received and interpreted by audiences. This leads to the presentation of a new framework for understanding the way in which the marketing communications mix interrelates primarily with media and messages, not tools and methods. This is called MCM2. Although at this stage this new configuration is derived from an audience perspective and underpinned through relational theory. It is an interpretive approach and although yet to be tested empirically, it is presented as more compatible with prevailing marketing thought. This model is presented as a starting point to stimulate further research and discussion.
Keywords : Marketing communications mix, media, messages.
Introduction‘In the 1980s, with only two commercial channels in the UK, Procter & Gamble reckoned it could reach 90 per cent of consumers with just three television advertisements. Now it would take more than 1,000 for the same impact’ (Silverman, 2006). Saatchi (2006), describes the concept of continuous partial attention (CPA) as the ability of ‘a modern teenager, in the 30 seconds of a normal television commercial, to take a telephone call,

I n t e r n a t i o n a l J o u r n a l o f M a n a g e m e n t C a s e s
226
send a text, receive a photograph, play a game, download a music track, read a magazine and watch commercials at x6 speed.’ This results in next day recall scores for TV ads, to reduce from 35% to 10%. These examples clearly identify the significant change that has occurred in the means by which organisations communicate with their customers. Further, it suggests a need for a review of the models and frameworks used by firms to organise their marketing communications activities.
The experience of P&G and other firms, discussed below, also illustrates how clients and agencies are now utilising a wider range of communications methods and developing media neutral strategies. Yet, despite these changes, the promotional, or communications mix appears relatively unchanged, as witnessed in various publications (Fill, 2006; Pelsmacker, Guens and van den Bergh 2005; Smith and Taylor, 2005; Belch and Belch, 2004; Brassington and Pettitt, 2003).
ObjectivesIt appears that the promotional mix approach does not reflect current industry practice neither does it complement contemporary marketing theory. It is accepted that there has been debate about the efficacy of the mix as a concept (Copley, 2004) but the emphasis of this paper is on the exploration of the validity of the promotional mix as a model for explaining how modern marketing communications are operationalized. It considers some of the practical and theoretical issues associated with this convention, and it reviews the way in which the tools and media are used as a focus for understanding the ways in which organisations communicate. Finally, a new framework is presented which, it is hoped, will stimulate discussion and further research in order to better represent both marketing theory and marketing communications practise.
Research method The paper is based on a review of academic literature and secondary research.
Relational and Resource Based PerspectivesFill and Hughes (2006), identified and discussed two key underpinning concepts, relational theory and the resource based view of the firm, as the basis for an explanation of the changing marketing communications landscape. These offer interesting yet contradictory perspectives and may well reflect some of the core issues underlying the marketing communications industry and the way the subject is taught.
Relational theory is derived from Macneil’s (1983) work about norms of behaviour within relational contracting activities (Brodie, 2002). It is assumed by many authors and researchers that relationship marketing only involves relational or collaborative exchanges. Macneil however, recognized that there is an element of relational content in all marketing exchanges. This may be limited in transactional exchanges and more extensive in collaborative exchanges, but a spectrum of relational content can be observed. In terms of marketing communications, this manifests itself in the use of response driven activities aimed either at customer acquisition, or to those associated with developing and establishing customer retention. The latter are often part of so-called loyalty schemes supported by off and online communications. ‘Traditional’ mass media based promotional communications are an interpretation of the linear or bullet theory of communication (Schramm, 1955). More ‘modern’ relationship building communications centre around an interactive response model. Communication theory has progressed and is now understood to be concerned with listening and considering, providing information, reassuring, reminding and differentiating organizations, products and services (Fill, 2006).
Theories concerning the Resource Based View of the Firm (RBV) hold that a firm can develop a sustainable competitive advantage based on the superior value it generates by managing its key resources more effectively than its competitors (Fhay and Smithee, 1999). Essentially, the RBV is concerned with using the right resources in order to generate long-term value for stakeholders. In a marketing communications context, the resource perspective can be seen through the development of digital technologies. Digital technologies have had a significant impact on each of the promotional tools and have served in many instances to lower costs, extend audience reach and improve
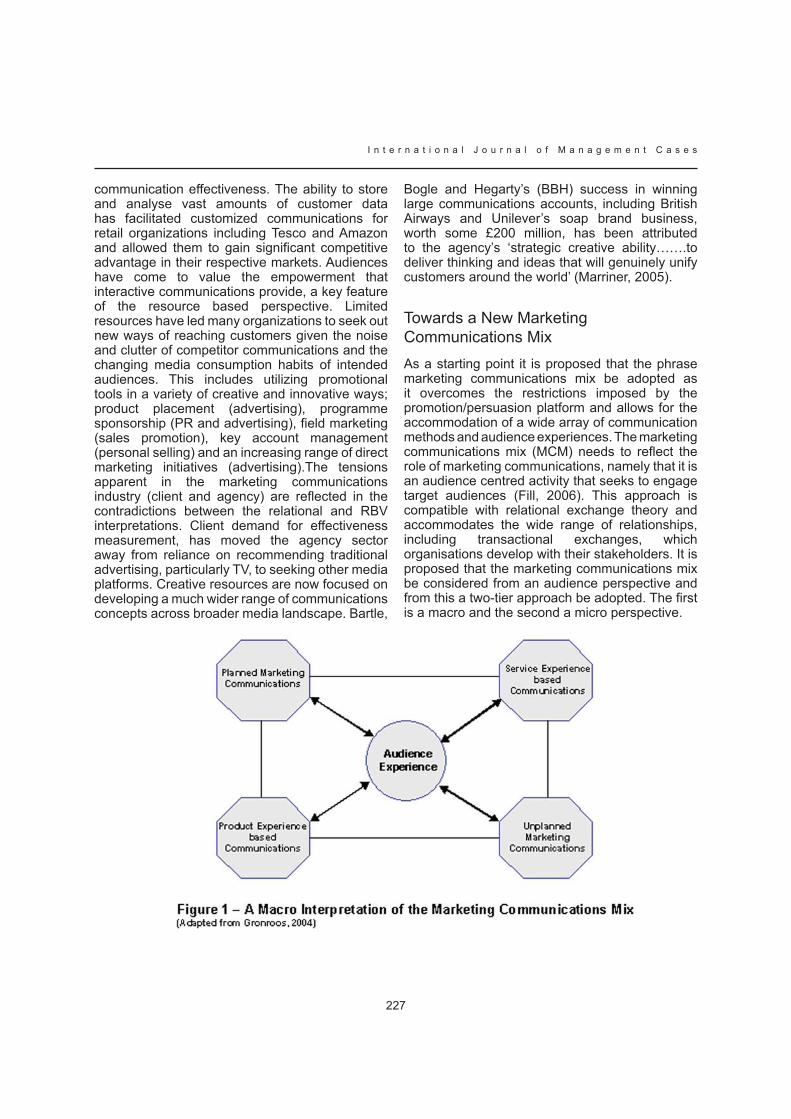
227
I n t e r n a t i o n a l J o u r n a l o f M a n a g e m e n t C a s e s
communication effectiveness. The ability to store and analyse vast amounts of customer data has facilitated customized communications for retail organizations including Tesco and Amazon and allowed them to gain significant competitive advantage in their respective markets. Audiences have come to value the empowerment that interactive communications provide, a key feature of the resource based perspective. Limited resources have led many organizations to seek out new ways of reaching customers given the noise and clutter of competitor communications and the changing media consumption habits of intended audiences. This includes utilizing promotional tools in a variety of creative and innovative ways; product placement (advertising), programme sponsorship (PR and advertising), field marketing (sales promotion), key account management (personal selling) and an increasing range of direct marketing initiatives (advertising).The tensions apparent in the marketing communications industry (client and agency) are reflected in the contradictions between the relational and RBV interpretations. Client demand for effectiveness measurement, has moved the agency sector away from reliance on recommending traditional advertising, particularly TV, to seeking other media platforms. Creative resources are now focused on developing a much wider range of communications concepts across broader media landscape. Bartle,
Bogle and Hegarty’s (BBH) success in winning large communications accounts, including British Airways and Unilever’s soap brand business, worth some £200 million, has been attributed to the agency’s ‘strategic creative ability…….to deliver thinking and ideas that will genuinely unify customers around the world’ (Marriner, 2005).
Towards a New Marketing Communications MixAs a starting point it is proposed that the phrase marketing communications mix be adopted as it overcomes the restrictions imposed by the promotion/persuasion platform and allows for the accommodation of a wide array of communication methods and audience experiences. The marketing communications mix (MCM) needs to reflect the role of marketing communications, namely that it is an audience centred activity that seeks to engage target audiences (Fill, 2006). This approach is compatible with relational exchange theory and accommodates the wide range of relationships, including transactional exchanges, which organisations develop with their stakeholders. It is proposed that the marketing communications mix be considered from an audience perspective and from this a two-tier approach be adopted. The first is a macro and the second a micro perspective.
I n t e r n a t i o n a l J o u r n a l o f M a n a g e m e n t C a s e s
228
From a macro viewpoint it is possible to appreciate the broad spectrum that constitutes marketing communications. Gronroos (2004) provides a useful framework for this when he refers to both planned and unplanned marketing communications and to product and service messages. These are presented in Figure 1. Planned marketing communications for example, takes the form of advertising, sales calls, sampling and internet banners, whereas unplanned marketing communications refer to word-of- mouth communication, news stories and general gossip. Examples of product experience based messages concern the design and durability of a product, whereas service messages refer to customer service encounters prior to, during and after consumption.
This approach enables not just the breadth but also the complexity of managing marketing communications to be observed. However, it fails to provide any detailed understanding, particularly of the planned marketing communications element, which it is argued, has the capability to influence the communications concerning both the product and service experience. The role of the micro perspective is to articulate these elements.
Any new (micro) mix needs to take account of two key points. First, in order to determine the nature of any engagement through marketing communications, it is necessary to understand the nature of the information the target audience is likely to require and to then design the message content to meet these needs. The second point concerns the manner in which the audience prefers to access the information they require, namely their media usage and preferences. It is proposed that these two elements, message and media, should lie at the heart of any new marketing communication mix. In addition, the role of creativity, both in constructing effective messages and in selecting appropriate media channels, needs to be considered. For some, this creative element has become the driving force behind communications development. Agency Saatchi & Saatchi, have restructured their business away from that associated with ‘full service’ advertising, to a framework that supports clients through innovation and change as businesses as well as providing creative communications expertise.
Message Content MixIt is apparent that the rise of digital technologies has encouraged organisations to reconsider the content of the messages they convey through their marketing communications activities. One example of this concerns the design and research associated with web sites. Having to think through the processes visitors undertake when visiting a site has encouraged thought about the content and the messages conveyed. Watts (2006) identifies examples of the creative use of web based communications to engage with visitors. Nappy brand Pampers has created a website offering advice on breastfeeding and toddler tantrums which receives over 400,000 hits per month. Social network sites such as MySpace have also been used commercially to promote brands. Unilever used a My Space website for the deodorant brand Lynx aimed at young males.
It is clear that people make various judgements about the messages they receive and work by Lutz, MacKensie and Belch (1983) led to the ‘attitude-toward-the-ad’ concept. This has had a significant impact on the marketing communications literature and has been supported by subsequent researchers. There is evidence that messages that promote a positive emotional response are positively related to subsequent brand attitudes and purchase intentions (Goldsmith and Lafferty, 2002). Similar findings have been found in the business-to-business context (Gilliland and Johnston, 1997), in new media and ecommerce (Chen and Wells, 1999), web site design and the ‘attitude-toward-the-site’ concept (Kumar and Bruner, 2000). Even in personal selling the idea that a favourable attitude-towards-the-salesperson requirement has been established, albeit anecdotally, for a very long time.
What is clear is that attitudes-towards-the-message, and it is argued associated delivery mechanisms, influence not just brand disposition but also purchase intentions. Message design in its broadest sense, is therefore an integral part of marketing communications, and should be a part of any new mix. Audiences who prefer transactional exchanges favour messages that inform them about product attributes and services and the value they will derive from entering into an exchange. Audiences that favour a relational exchange seek information that not only enables them to learn more about the topic of ‘conversation’ or relationship specific knowledge as Ballantyne
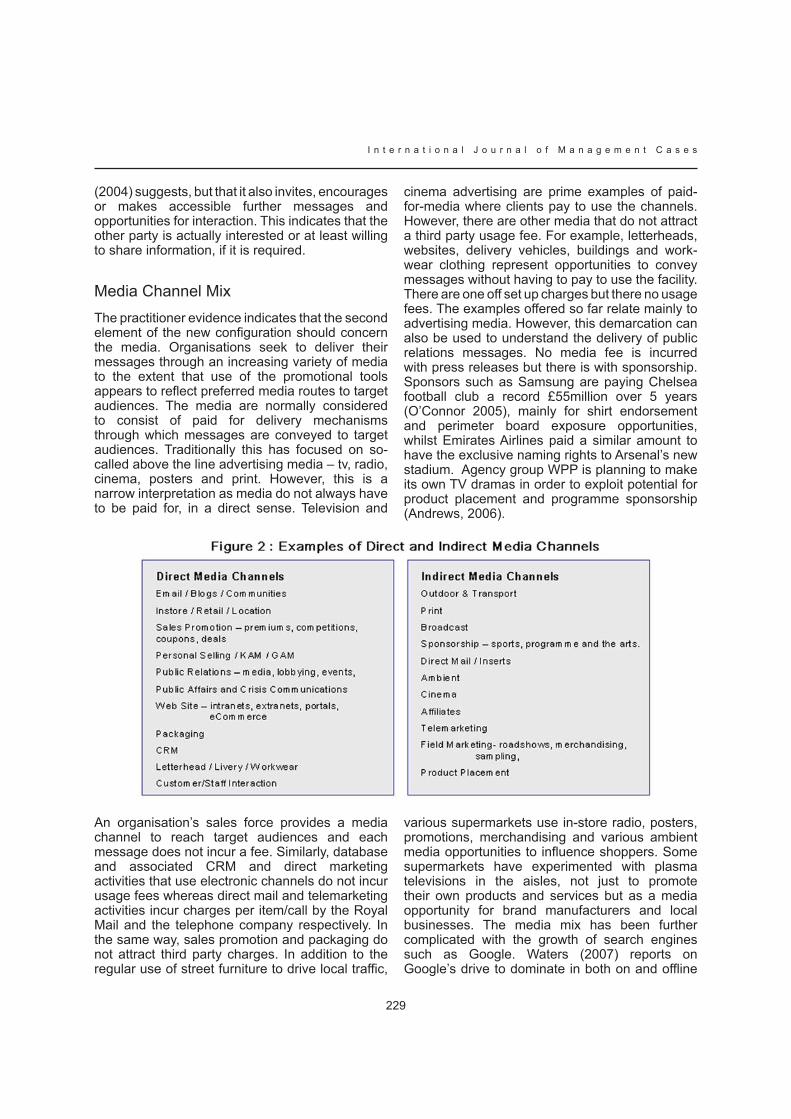
229
I n t e r n a t i o n a l J o u r n a l o f M a n a g e m e n t C a s e s
(2004) suggests, but that it also invites, encourages or makes accessible further messages and opportunities for interaction. This indicates that the other party is actually interested or at least willing to share information, if it is required.
Media Channel MixThe practitioner evidence indicates that the second element of the new configuration should concern the media. Organisations seek to deliver their messages through an increasing variety of media to the extent that use of the promotional tools appears to reflect preferred media routes to target audiences. The media are normally considered to consist of paid for delivery mechanisms through which messages are conveyed to target audiences. Traditionally this has focused on so-called above the line advertising media – tv, radio, cinema, posters and print. However, this is a narrow interpretation as media do not always have to be paid for, in a direct sense. Television and
cinema advertising are prime examples of paid-for-media where clients pay to use the channels. However, there are other media that do not attract a third party usage fee. For example, letterheads, websites, delivery vehicles, buildings and work-wear clothing represent opportunities to convey messages without having to pay to use the facility. There are one off set up charges but there no usage fees. The examples offered so far relate mainly to advertising media. However, this demarcation can also be used to understand the delivery of public relations messages. No media fee is incurred with press releases but there is with sponsorship. Sponsors such as Samsung are paying Chelsea football club a record £55million over 5 years (O’Connor 2005), mainly for shirt endorsement and perimeter board exposure opportunities, whilst Emirates Airlines paid a similar amount to have the exclusive naming rights to Arsenal’s new stadium. Agency group WPP is planning to make its own TV dramas in order to exploit potential for product placement and programme sponsorship (Andrews, 2006).
An organisation’s sales force provides a media channel to reach target audiences and each message does not incur a fee. Similarly, database and associated CRM and direct marketing activities that use electronic channels do not incur usage fees whereas direct mail and telemarketing activities incur charges per item/call by the Royal Mail and the telephone company respectively. In the same way, sales promotion and packaging do not attract third party charges. In addition to the regular use of street furniture to drive local traffic,
various supermarkets use in-store radio, posters, promotions, merchandising and various ambient media opportunities to influence shoppers. Some supermarkets have experimented with plasma televisions in the aisles, not just to promote their own products and services but as a media opportunity for brand manufacturers and local businesses. The media mix has been further complicated with the growth of search engines such as Google. Waters (2007) reports on Google’s drive to dominate in both on and offline

I n t e r n a t i o n a l J o u r n a l o f M a n a g e m e n t C a s e s
230
sectors. In addition to dominating search based advertising, their acquisition of YouTube provides a video advertising platform. Further purchases and agreements facilitate purchasing of radio and print media.
The characteristics of transactional exchanges suggest that participants prefer to engage through mass media based communications. This is because communication is one-way, and engagement occurs on a platform where there is no expectation, or indeed opportunity, of a direct response. The communication is essentially a monologue, impersonal, unidirectional, an imbalance that suggests that the relationship is asymmetric. At the other extreme, audiences involved in relational exchanges prefer personal communications and to engage with sales people, account managers, digital media and associated technologies simply because there are opportunities for both parties to interact, explore and share information. So, although interaction and dialogue are emerging concepts and critical to relationship marketing (Gronroos, 2004), media management should recognise the important role that traditional mass media communication still has with transactional exchange based audiences.
The choice of media, whether it be paid for or not, should reflect the exchange preference of the audience. For example, in order to move from an acquisition to a customer retention strategy, media choice becomes critical. Media should become more personal and capable of customisation, enable interaction and be discrete.
For some firms, the shift toward changing media availability is a gradual one, reflecting the needs of their customer base. Retailer, Marks & Spencer defines their audience as older and comfortable with traditional media, watching terrestrial TV more than satellite, read newspapers, look at billboards whilst driving and do not spend hours on the internet (Hall, 2006). They are planning to relaunch their website in conjunction with Amazon early in 2007 recognising the potential value of other new media.
It is proposed that the new marketing communications mix needs to reflect the use of direct and indirect media. Direct media do not involve third parties either as usage fees or in terms of message delivery. They are characteristically owned and managed by the client organisation. Indirect media are owned by
third parties, consequently usage fees, as rental of their service, are necessary. Some possible media allocations based on the direct and indirect criteria are presented in Figure 2. The task for marketing management is to consider the appropriate balance of direct and indirect media, in the light of the intended messages, financial resources and the target audience.
A New Marketing Communications MixIt is proposed therefore, that a new marketing communications mix should combine both the message and media elements explored earlier, as represented in Figure 3.
This new mix introduces two new terms, namely, Message Content Mix and Media Channel Mix. The Message Content Mix refers primarily to the presentation of the message and involves the informational/emotional balance, the design and style, depth, volume, direction and frequency that the content is presented. The Media Channel Mix refers to the balance of indirect and direct media used to convey messages to target audiences. Media, in its broadest sense, has become management’s key to reaching target audiences, and when combined with relevant and likeable content, enhanced audience engagement can be observed.
In keeping with conventional marketing practice, both terms can be identified by their initials, and it is suggested that the new mix be referred to as MCM2, if only to prompt recall. The level of detail that can be represented in the MCM2 mix should be varied according to the level of the audience’s knowledge and experience.
This configuration overcomes many of the problems associated with the traditional promotional mix and incorporates many of the key issues identified in this paper. It is accepted that this interpretative configuration has limitations concerning the scope and the lack of any empirical data necessary to substantiate it. However, as it is derived from an audience perspective and is underpinned by relational theory, it is argued that this is more compatible with prevailing marketing thought than the prevailing promotional mix. MCM2 is offered as a starting, not finishing line, and as such is intended to stimulate further research, discussion and consideration.

231
I n t e r n a t i o n a l J o u r n a l o f M a n a g e m e n t C a s e s
ConclusionsExamining the promotional (communications) mix using relational and RBV theories is useful because it reveals some of the contradictory developments in marketing theory and organisational practice. It also reflects some of the core issues underlying the marketing communications industry and the way the subject is taught. The exchange context provides what McNeil refers to as the atmosphere in which exchanges occur and frames the nature of the interaction. Marketing communications has a crucial role to play in the development of the requisite atmosphere.
Both theory and practice have moved forward and the new marketing communications mix presented here is intended to reflect some of the key changes. At the core of the MCM2 are two elements, what is to be said and how the message is to be delivered and these are embedded in the Message Content Mix and Media Channel Mix elements of the proposed new framework. It is through these that audiences perceive, interpret, assign meaning and in doing so develop appropriate attitudes-to-the-message, a key factor in brand management. Although there remains a question about the appropriateness of the term ‘mix’ in the marketing
vocabulary, its practise and teaching, the MCM2 provides a more accurate, helpful and detailed teaching framework for explaining how marketing communications work, from both a theoretical and practitioner perspective.
ReferencesAndrews, Amanda. (2006), WPP to make its own TV dramas, The Times, 18, October, p53.
Ballantyne, David, (2004), Dialogue and its role in the development of relationship specific knowledge, Journal of Business & Industrial Marketing, 19, 2, p114-123
Belch, George E. and Belch Michael, A. (2004), Advertising and Promotion, 6e, NY : McGraw-Hill/Irwin
Brassington, Frances and Pettitt, Stephen (2003), Principles of Marketing, 3e, Harlow : FT Prentice Hall
Brodie, Roderick J. (2002), The challenge to include relational concepts, Marketing Theory, 2, (4), 339-343
I n t e r n a t i o n a l J o u r n a l o f M a n a g e m e n t C a s e s
232
Chen, Qimei. and Wells, William. (1999), Attitude toward the site, Journal of Advertising Research, 39, (5), September/October, pp27-37
Copley, Paul. (2004), Marketing Communications Management ; concepts & theories, cases and practices, Oxford : Butterworth-Heinemann
Fhay, John. and Smithee, Alan (1999), Strategic Marketing and the Resource Based View of the Firm, Academy of Marketing Science Review [Online] (10) Available from www.amsreview.org/articles/fahy10-1999.pdf
Fill, Chris. (2006), Marketing Communications; engagement, strategies and practice, 4e, Harlow : FT Prentice Hall
Fill, Chris. and Hughes, Graham. (2006), Remixing marketing communications: perspectives on the role and value of the promotional mix, Academy of Marketing Conference, London, July.
Goldsmith Ronald, E. and Lafferty, Barbara, A. (2002), Consumer response to web sites and their influence on advertising effectiveness, Internet Research: Electronic Networking Applications and Policy, 12, 4, pp318-328
Gilliland, David, I. and Johnston, Wesley, J. (1997), Towards a model of marketing communications effects. Industrial Marketing Management, 26, pp. 15–29.
Gronroos, Christian, (2004), The relationship marketing process: communication, interaction, dialogue, value, Journal of Business and Industrial Marketing, 19, 2, p99-113
Hall, James. (2006), If it ain’t broke: why Marks & Spencer is opting for an old fashioned Crimbo, Sunday Telegraph, 12 November.
Kumar, Anand and Bruner, Gordon C. (2000), Web commercials and advertising hierarchy of effects,
Journal of Advertising Research, 40, (1) January/February, pp35-42
Lutz, Richard J., Mackensie, Scott B. and Belch, George E. (1983), Attitude toward the ad as a mediator of advertising effectiveness. Advances in Consumer Research X. Ann Arbor, MI: Association for Consumer Research.
Macneil, Ian R. (1983), Values in Contract : internal and external, Northwestern Law Review, 78 (2) 340-418
Marriner, Cosima (2005), We’re only three phone calls from disaster, The Guardian, 30 November, p. 27
O’Connor, Ashling (2006), Blue is the colour, domination the game, The Times, 26,April, p.70
Pelsmacker de, Patrick, Geuens, Maggie and Bergh van den, Joeri (2005), Marketing Communications : a European perspective, 2e, Harlow ; FT- Prentice Hall
Saatchi, Maurice. (2006), The strange death of modern advertising, Financial Times, 22 June.
Schramm, Wilbur (1955), How communication works. In The Process and Effects of Mass Communications (ed. W. Schramm). Urbana, IL: University of Illinois Press, pp. 3–26.
Silverman, Gary. (2006), How can I help you? FT Magazine, 4/5 February, p.16.
Smith, Paul R. and Taylor, Jonathan (2004), Marketing Communications : an integrated approach, 4e, London : Kogan Page
Waters, Richard. (2007), How Google is muscling its way into the advertising mainstream, Financial Times, 19, January, p.13.
Watts, Robert. (2006), Online is funnier, ruder and more creative. Sunday Telegraph, 12 November.
233
I n t e r n a t i o n a l J o u r n a l o f M a n a g e m e n t C a s e s
CAUSE RELATED MARKETING: A RESEARCH PAPER ON ITS VALUE AND EFFECTS FROM THE STAKEHOLDERS’
PERSPECTIVE.
MARLEN MARTOUDI DEMETRIOU:INTERCOLLEGE, CYPRUS
Abstract
Corporate Social Responsibility (CSR) is faced as an opportunity for Brand Equity and there are many companies which invest a considerable percentage of their budget on different CSR activities in order to enhance their image. A very popular CSR strategy is Cause-Related Marketing (CRM) according to which the profit-making companies form strategic partnerships with non-profit organizations for mutual benefits. CRM can provide great opportunities to organizations in terms of corporate reputation, brand awareness, customer loyalty, and press coverage.
This paper analyzes the findings of a research which was implemented in three faces. The first phase of the research took place between October-November 2004 and it was a survey among 740 Cypriot citizens in terms of brand recognition and brand positioning of organizations that have heavily invested on CRM activities. The second phase of the research took place on February 2005 and was based on the outcome of the first survey. It was composed of in-depth interviews of the marketing managers of the two most reputable companies in Cyprus in terms of CRM given the outcome of the first survey. The third phase of the research was composed of a survey among 40 employees of the two corporations.
Key words: Corporate Reputation, Brand Positioning, Corporate Social Responsibility, Cause Related Marketing.
Cause Related Marketing: A successful strategy in enhancing corporate reputation.
Introduction:In today’s markets, organizations have tended to focus on both tangible and intangible factors in order to effectively compete and differentiate their services or products in the dynamic environment in which they operate. In order to achieve reputation, corporations try to be active participants in the societies in which they operate and they also try to initiate activities that can contribute to the society’s well-being. CRM includes all the different ways in which businesses are benefiting charities and good causes through CRM partnerships that consist of donations, and additional support leveraged through customers, suppliers, or employees. This societal marketing approach can become an effective tool in the hands of the corporations in gaining brand reputation while contributing to the society’s well-being.
This paper analyzes the findings of a three phase research which includes a survey among 740 Cypriot Citizens, interviews with the Marketing Managers of two Financial Institutions which Cypriots named as Socially Responsible and a survey on 40 employees of the above mentioned organizations. The outcome of the research reveals the value of Cause Related Marketing on the reputation of the corporations which adopt it as well as on the moral and the motivation of their employees.

I n t e r n a t i o n a l J o u r n a l o f M a n a g e m e n t C a s e s
234
Literature Review:Marketers, given the dynamic environment they are facing today, try to identify different approaches of CSR activities that can help them enhance the reputation of their corporation in order to gain a competitive advantage in their marketplace. They also know that citizens have greater expectations from the corporations than simple CSR programs. The largest ever survey of its kind, involving interviews with more than 25,000 people across 23 countries, in five continents took place by a Canadian based company in 1999. According to the survey 2/3 of the citizens who participated in the research wanted companies to go beyond making profits, paying taxes, employing people and obeying laws. They wanted companies to contribute to broader social goals as well and pointed out that contributing to charity projects doesn’t really satisfy people expectation to CSR. (Nelson, 2000)
The expectations of all stakeholders of business roles and responsibilities have changed into the need for a more active involvement in Society’s problems. Cause Related Marketing provides the means to use the power of the brand to demonstrate a firm’s intention for an active participation in the resolution of the social problems providing resources and funding whilst addressing business marketing objectives.
The term ‘cause-related marketing’ was introduced by American Express in 1983 when it promised to make a donation to renovate the statue of Liberty each time someone used its charge card (Lane et al 2004:781). The end result was a contribution of $ 1.7 million made by the corporation, but the cause-related campaign produced a 28 percent increase in card usage. Since then, too many corporations all around the world have tried to adopt different innovative programs with the expectation to harvest the same positive results as American Express has done. Minette and Drumwright (1996) warned the corporations which wanted to adopt CRM programs that irrespective of the objectives of the campaigns, economic or non-economic, there is a need to ensure that: a) there is a long-term focus, b) the cause should fit the company, and c) the employees should believe the issues’. A marketer who wants to adopt a CRM program must be aware of the fact that well-implemented and promoted CRM programs have the potential to bring enormous benefits in the partnership. On the other hand marketers need to
understand that an ineffective CRM campaign can backfire and damage the reputation of the partner organization and harm the work of the charity or cause involved.
Pringle and Thompson (1999) viewed CRM as an activity by which a company with image, product or service to market builds a relationship with a “cause” or a number of “causes” for mutual benefit. More and more corporations are defining their CSR agenda with the aim of identifying initiatives that fit since finding the right charitable partner and forming a long-term relationship can deliver more benefits than make one-off donations.
Baker (2001) said that a very common practice for the firm which establishes an ally with a non-profit organization is to make a donation to the non-profit on the level of sales in a specified period of time. (2001: 555-557) Commercial donors will only commit themselves to support non-profit organizations only if they believe that this ally will evoke the public interest. ‘The firms want their donations and their Cause-Related activities to be tangibly correlated” (Mullen, 1997: 42).This means that all those charities which are not so popular to the public will not manage to attract the interest of commercial organizations. The more popular the charity is, the easier for them to choose the commercial organization they want to be associated with. Baker (2001) supports that giving donations is still the most common form of commercial organizations’ involvement with non-profit organizations, but this is different to cause-related campaigns. He also said that “is not uncommon for a company to invite non- profit organizations with which they want to be associated. For this reason “non-profits think carefully before they agree on an association with each commercial organization” (Baker 2001: 556).
Andreasen A.R (2000) supported that: “If companies use their advertising and promotional budget for campaigns with social and commercial impact they will obtain greater effectiveness and efficiency than they would otherwise achieve”. Two years later, Zummach (2002) underlined the value of CRM stating that the corporate partner benefits from its association with a charitable cause and the non-profit organization benefits by receiving funds or other compensation from the corporation. (http://www.charityvillage.com/cv/archive/acov/acov02/acov0214.html)

235
I n t e r n a t i o n a l J o u r n a l o f M a n a g e m e n t C a s e s
Kotler (2003:27) believes that companies see cause related marketing as “an opportunity to enhance their corporate reputation, raise brand awareness, increase customer loyalty, build sales and increase press coverage”.
Business in the Community defines Cause Related Marketing as “a commercial activity by which businesses and charities or causes form a partnership with each other to market an image, product or service for mutual benefit” (http://www.bitc.org.uk/resources/research/research_publications/21st_cent_giving.html)
These last years CRM is already gaining wide acceptance among businesses, consumers, charities and causes. It has enormous potential to make a significant difference for the company that adopts it. A Company that wants to be involved into this philosophy of making business needs to identify a cause with high impact in the society in which it operates and must try to form an ally with it. In Cyprus as well as in every other country many companies have been involved in CSR activities but not too many in Cause Related Marketing Activities. In order to sense the Cyprus situation in terms of CRM activities and the expectations of Cypriots on those matters a research took place between October-November 2004. The research continued in February 2005 with interviews and analysis of the Cause Related Marketing activities of the most reputable companies in Cyprus (according to the outcome of the October-November 2004 research) and was concluded on November 2005 with an exploratory research among a small number of employees of the most reputable companies in order to examine the feelings and the level of satisfaction of those employees related to the Cause Related Marketing activities of their employers.
Primary Research:
Research Aim:
This research aims to examine the value of a Cause Related Marketing Strategy on the reputation of the company which adopts it and on the moral and motivation of its employees.
Research Objectives:
The research was divided in three phases with their own objectives.
Phase A: Survey on 740 Cypriot Citizens.
Phase B: Interviews with the Marketing Managers of the most reputable companies in terms of CSR in Cyprus.
Phase C: Survey on 40 employees of the most reputable companies in terms of CSR in Cyprus.
Research Objectives-Phase A: The Survey among 740 Cypriot Citizens:
1. To identify the degree of agreement of consumers to the need of corporations to be involved in activities of Corporate Social Responsibility (CSR).
2. To study consumer behavior in terms of brand preference for a product that is marketed by a company which has proved its CSR as opposed to a company which has not applied this positioning approach.
3. To study the brand awareness of consumers for companies involved in activities of CRM as opposed to other companies which were simply involved in activities related to CSR.
4. To study the area of activities of the companies with the highest brand awareness given the outcome of the survey.
5. To identify the areas of social activities in which the people in Cyprus would like the profit making corporations to be involved and associated with for the benefit of the Cypriots’ well-being.
Research objectives- Phase B: Interviews with the Marketing Managers of the companies with the highest brand awareness (given the outcome of the above survey):
There was a pre-determined list of objectives for those interviews which lasted between 45-60 minutes each.
The objectives of this phase of research are the following:
1: To understand how important from the Marketing point of view is for a Company to be Socially Responsible.
I n t e r n a t i o n a l J o u r n a l o f M a n a g e m e n t C a s e s
236
2: To understand the process in selecting a social partner
3: To learn the History of those CRM activities and how difficult it was for the company to achieve the Brand positioning related to Social Responsibility it possess nowadays in the Cyprus market.
4: To learn more from the management point of view about the feelings the employees have and the way they react on the fact that their company is involved in those successful CRM activities? Do they cooperate, support and participate willingly on those activities?
5: To learn their future plans in relation to these CRM activities.
Research Objectives-Part C: An exploratory research among the employees of the companies with the highest brand awareness:
This part of quantitative research had as a goal to identify the effects of the CSR and CRM activities of those companies on their employees. The research objectives of the third phase are:
1: To identify the frequency of participation of employees to CRM activities in order to get an insight about the involvement and enthusiasm or not of employees on the cause.
2: To examine how employees feel about the need for corporations to be involved in CRM activities.
3: To identify the degree of satisfaction of employees for the CSR and CRM activities their corporations are involved into.
4: To examine whether employees feel that these CRM activities bring management closer to employees.
5: To examine whether the employees feel proud for the involvement of their companies in CSR and CRM activities.
6: To examine whether the employees expect their companies to promote their CSR and CRM activities to the public.
7: To examine whether the employees believe that a company which is involved in CSR activities is a good employer.
Methodology:A combination of qualitative and quantitative research approaches has been applied including a survey among Cypriot Citizens (Phase A), in-depth interviews with the marketing managers of the two most reputable companies in Cyprus, (Phase B), and a survey among 40 employees of the most reputable companies (Phase C)
Phase A-Survey: A survey research was the method used in order to gather descriptive information concerning Cypriots knowledge on companies’ involvement in CRM activities, and preferences in terms of causes Cypriots would like the corporations to be associated with. A short questionnaire was prepared with a combination of closed-end and open end questions. The closed end questions provide the responders with all possible answers which allow him/her to choose among them (Kotler et al. 2005). On the other hand the open-end questions allow responders to use their own words and they are common in qualitative research. The sampling method was a stratified Random Sampling approach according to which the population was divided in three mutually exclusive age groups (20-35, 36-50, 51 and above). From each group random samples were drawn in the ratio 5:3:2. The decision for this sampling method was based on the main objective of the survey which was to identify a cause that Cypriots and especially young to middle age people would like to see corporations to be associated with. The contact methods used were the personal contacts and the telephone.
The analysis of the data collected, was implemented with the use of SPSS and Excel packages.
Phase B- In-depth interviews: This qualitative research approach had as a goal to help the researcher getting an insight of the benefits Cause Related Marketing has on the companies that have adopted it.
The researcher used semi-structured interviews where the interviewees were guided to provide their opinions, feelings and precautions on matters that are of her research interest. The difficulty of this method was the analysis and evaluation of data collected. This problem was minimized with a carefully designed coding system that was prepared before the interviews took place so that I could easier collect, decode, analyze and evaluate the data. The sampling method used for these

237
I n t e r n a t i o n a l J o u r n a l o f M a n a g e m e n t C a s e s
personal interviews was the Judgment Sampling which allowed the researcher to use her judgment to select the population members who are good prospects for accurate information (Kotler et al, 2002:282). The population members were the Marketing Managers of the Popular Bank and the Bank of Cyprus. These two companies were the first and the second name mentioned by Cypriots as the most well-known companies with Corporate Social Responsibility in Cyprus. The contact method was personal.
Phase C-Survey No.2 : A survey research was the method used in order to gather descriptive information concerning employees’ feelings on CRM activities and their involvement in CRM activities. A short questionnaire was prepared with closed-end questions. The closed end questions provide the responders with all possible answers which allow him/her to choose among them (Kotler et al. 2002). The sampling method was a Convenience non-probability sampling since the researcher, for this exploratory research, wanted to select the easiest population members from each company. The contact method was personal.
The analysis of the data collected, was implemented with the use of SPSS and Excel packages.
Data Findings:Phase A:
The survey research on the 740 Cypriot Citizens has revealed five main points that organizations cannot ignore.
1. Consumers expect corporations to be socially responsible. Unrelated to the age, the gender or the status the majority of the responders of the questionnaire stated that they expect the companies to prove their Social Responsibility.
2. Consumers’ behavior in terms of Brand preference is directly related to companies’ involvement in Societal Marketing Activities.
3. Consumers recognize as “Socially Responsible Companies” mostly those companies that have formed an ally and fight for a cause which has high impact in our society. According to the research findings the majority of Cypriots named two Financial Institutions as Socially Responsible. These Financial Institutions were the Popular Bank of Cyprus and the Bank of Cyprus.
In an effort to better understand the reason for the strong positioning of these Banks, an analysis of their CSR activities is provided below
Popular Bank: has adopted “Radiomarathon” which is by far the biggest charity event in Cyprus and has also been reported in The Guinness book of records as the most successful charity activity in terms of money collected per capita. This event which started 14 years ago takes place every first Monday and Tuesday of November. More than 1,000,000 Cyprus Pounds are collected every year for the benefit of children in need. The enthusiasm of the employees and the management of the bank who volunteer every year to organize this event has positioned the Popular Bank as the organization which knows how to show love and concern to children in need. As one of the volunteers-employees has said “Radiomarathon reflects the best side of our nature and is a measure of love for our neighbors and indeed for ourselves”( www.cypruspopularbank.com/home.htm)
Bank of Cyprus. In 1992 the Bank of Cyprus signed a contract with the republic of Cyprus for the establishment of the Oncology Center. Since September 1998 the Oncology Center provides a comprehensive cancer service to the people of Cyprus and the broader region .The high quality building and equipment, the ten famous consultants who used to work in big Oncology centers in England, Germany and the U.S.A before they came to the center as well as the continuing medical education for the staff, positioned this Center as the best Medical Center in Cyprus. Since all the construction and most of the running expenses of this center are covered by the Bank of Cyprus, Cypriots feel gratitude for this Bank. Every year since 1999, the Bank of Cyprus sponsors the “Christodoula’s March” that the Cyprus Anti-Cancer Society (CAS) organizes in order to raise funds for the CAS as well as to increase public awareness about the disease. The success of this annual event reminds everyone in Cyprus the continuous interest of the Bank of Cyprus for our Society’s well-being.
(www.bankofcyprus.com.au/festival.htm)
4. At the same time the majority of the responders above the age of 35 expect the corporations to form “social Partnerships with Anti-cancer societies, organizations that strive for the protections of child’s rights as well as Anti-drug societies. A very big percentage of interviewees have indicated
I n t e r n a t i o n a l J o u r n a l o f M a n a g e m e n t C a s e s
238
their interest on anti-drug campaigns as the cause they expect corporations to form partnerships with .Drugs have a great negative impact on the Cyprus Society and a corporation that can prove its sincere concern and contribution in eliminating this problem will be “embraced” by our Society.
Part B:
The interview with the Marketing Managers of the most reputable companies in terms of Corporate Social Responsibility indicated the following important points:
1. It is very important to be Socially Responsible and to be able to prove it to the public. The Cause Related Marketing strategies applied by all three companies helped them is communicating easier all those messages of social concern to the public. Both managers said that they find it very important for a successful Societal Marketing Orientation to find a social partner and form a successful long-term partnership with it. In this way the public easier gets the messages sent from the company.
2. There are important issues in selecting a social partner and the corporation must apply a careful selection process. There is a screening process in order to reject the offers from social organizations with low impact in the Society. It needs a lot of mutual effort and dedication to form a successful partnership. Results have to be long-term rather than short-term. This means that the companies need to foretell all possible problems that may arise in the future with their social partners or even their own employees before they form the partnership. The expectations from each of the two partners have to be clearly defined in advance so as to avoid conflicts later on. At the same time the Profit organizations have to make sure and if possible to set the conditions to the social partners to avoid co-operations with competitive firms which may affect the interest of the corporate partner.
3. All three companies have tried different Social activities in the past; they spent a lot of money on corporate philanthropy and realized that the results were not as positive as expected. They decided to form social partnerships and they tried different causes before forming up today’s partnerships.
4. All managers share the view that the employees are very happy and proud for these Societal Marketing Activities and though on a voluntary basis the majority of them offer their services on
their free time with enthusiasm. All managers believe that these activities bring management closer to the employees.
5. Both corporations will continue their CRM strategies with more enthusiasm and more dedication since they feel that the social organization they formed a partnership with has become part of their company.
Part C:
The survey research on the employees of the companies indicated the following interesting data:
1: Almost all responders of the questionnaires have participated at least once in the CRM activities of their organization. The majority of them (more than 90%) have participated more than once. A big percentage of employees in the two organizations participated even more than five times. Obviously the above mentioned who have participated more than five times in CRM activities employees have been enthusiastic on the causes their companies have formed partnerships with.
2: The majority of employees (more than 90%) agree on the need for corporations to prove their Social Responsibility. This is a very big percentage and employers need to take it into consideration. Nobody disagrees on the concept and only a small percentage of employees are indifferent.
3: The majority of the employees (90-95%) are satisfied with the CRM activities their corporations are involved into. Nobody is dissatisfied and only a small percentage of employees indicated indifference.
4: The majority of employees (75-85%) feel that these CRM activities bring management closer to employees. This is important information from the management point of view since this kind of activities make employees feel that they build up better relationships with their managers.
5: Almost all the employees do not only feel satisfied with their employers’ involvement in CRM activities but proud as well.
6: The majority of the employees of the two corporations under study expect their employers to promote their CRM activities to the public.

239
I n t e r n a t i o n a l J o u r n a l o f M a n a g e m e n t C a s e s
7: The majority of employees (65-75%) feel that there is a positive correlation between an employer who is involved in CRM activities and a “Good” employer.
Conclusion:Every organization tries to build a strong reputation since a strong name generates faith and trust between an organisation and customers and the society, motivates employees, provides a competitive advantage, and affects peoples’ attitudes which in turn affect behaviour towards an organisation. It is important to acknowledge that no company can afford to ignore corporate reputation and tries to identify innovative practices that can create positive impressions at an unconscious or conscious level. Corporate Social Responsibility can be one of those practices that can send positive messages to the public creating positive impressions about the corporations. Cause Related Marketing is also a very dynamic approach in sending positive messages to the public if the corporation allies with a Social Organization with great impact in the Society. In Cyprus two Financial Institutions have formed long-lasting relationships with very important social organizations creating a strong reputation among Cypriots given the findings of a survey with 740 interviewees. The strong Brand Positioning of Popular Bank and Bank of Cyprus drives us to the conclusion that companies which form strong “partnerships” with charitable organizations with great impact in our Society have high return on their “investment” in terms of Brand recognition and positioning.
The Marketing Managers of the two banks have strong feelings about the positive effects of those Cause Related Marketing Practices. They believe that with these CRM strategies they managed to gain a lot of positive publicity enhancing their reputation as a socially responsible organization in the Cyprus community given the outcome of the in-depth interviews taken by the researcher.
The employees of the above mentioned Financial Institutions seem to have the same positive feelings about their employers who have initiated those Cause Related Marketing Approaches given the outcome of a survey among 40 of those employees.
References:Andreasen, A.R. (2000): Ethics in Social Marketing. Washington DC: Georgetown University Press
Baker, M. (2001): The Marketing Book. 4th ed. Oxford: Butterworth Heinemann, pp555-557.
Kotler,P, Wong,V. Sauders,J. & Armstrong,Gary., (2005) “Principles of Marketing”, European Edition, PEARSON, Prentice Hall, 4th Ed.
Kotler,P.,(2003) Marketing Management ,International Edition, PHIPE: Prentice Hall, 11th Ed.
Lane, W.R.; King, K.W. and Russell, T. (2004): Kleppner’s Advertising Procedures. 16th ed. New Jersey: Prentice Hall.
Minette,E. Drumwright, (1996): Company Advertising with Social Dimensions, report #96-110, Marketing Science Institute (Cambridge, MA: 1996).
Mullen, J. (1997): Performance-based corporate philanthropy: How “giving smart” can further corporate goals, Public Relations Quarterly, Vol.42 (2), pp42.
Nelson, J.(2000): The Leadership Challenge of Global Corporate Citizenship. In Perspectives on Business and Global Change. WorldBusiness Academy ,Vol. 14 (4).
Pringle,H.& Thompson, M., “Brand Soul: How Cause Related Marketing Builds Brands”; Richard Earl, The Art of Cause Related Marketing (Lincoln wood, IL: NTC, 2000).
Electronic Resources:
Bank of Cyprus (2005): web site available at [http://www.bankofcyprus.com.au/festival.htm]
Business in the Community (2002): BITC 21st Century Giving, London. Web site available at[http://www.bitc.org.uk/resources/research/research_publications/21st_cent_giving.html]
Business in the Community (2004): Business Respect newsletter No. 77, 29 July 2004.. web site available at [http://www.bitc.org.uk/directory/leadership_teams/index.html]
Cyprus Popular Bank (2005): web site available at [http://www.popularbank.com.cy]
I n t e r n a t i o n a l J o u r n a l o f M a n a g e m e n t C a s e s
240
Zummach, N. (2002): Marketing for the Cause: A Growing Trend in Corporate Philanthropy. Charity Village Newsweek, 08/04/2002.Available at [http://www.charityvillage.com/cv/archive/acov/acov02/acov0214.html]
Biography:Marlen Martoudi Demetriou is an Assistant Professor in Marketing. She holds a BSc. degree in Business Administration, a Post-Graduate Diploma in Marketing Management, an MBA degree in Marketing and a Doctorate in Professional Studies
degree in Societal Marketing. She has been at Intercollege the last 20 years as a Full-Time lecturer in Marketing. Her Research Interests are on Societal Marketing, Corporate Social Responsibility, Corporate Philanthropy and Cause Related Marketing. Her research work has been published in International Conference Proceedings and Journals (4 journal papers and more than 14 conference proceedings papers). She is also the organizer of different social activities like the Annual Festival of Young Volunteers (since 2002) and the Annual Festival of the Friends of the Mental Retardation Prevention Center (since 1995).
241
I n t e r n a t i o n a l J o u r n a l o f M a n a g e m e n t C a s e s
MARKETING ETHICS : AN ISLAMIC AND CHRISTIAN COMPARISON IN CYPRUS
RIA NICOLETTI MORPHITOU INTERCOLLEGE, CYPRUS
PAUL T. GIBBSINTERCOLLEGE, CYPRUS
Abstract
This research project is to investigate the considerations that major international companies make when advertising into countries where the market has mixed religious and secular moral traditions. In particular we are investigating what, if any, is your advice to client companies regarding marketing ethical sensitivities for Muslim customers within a predominately Judeo-Christian culture. To investigate the deeper, difference, if any, between the Islamic and Christian in respect to the offensiveness of the execution of the promotional material and to link this to religious affiliation, temporality orientation, and polychronicity.
Europe’s Muslims are, to a large extent, differentiated by their cultural and ethno-national background and not the assumed ‘some idea of a homogenous unity of Islam based on its singularity (10% being Shiites for instance). This leads to the Muslim communities of Europe to exhibit a variety of ethnic, linguistic and cultural characteristics, and to have multiple networks with major other regions of the Islamic world. In this respect the influence of Islam in Europe is growing.
The context for this study is two English speaking universities one on either side of what has become known as the ‘Green line’ that divides the island. This paper takes advantage of this closeness of otherness to study how controversial products and forms of offensive advertising executions can be related to levels of religiousness, time usage and temporality. The resulting observations are then offered as insights into the notion of ethics of the two religious groups and how these might influence marketing to multicultural communities.
The exploratory approach taken in this project is an attempt to overcome the superficial, and investigate the deeper, difference, if any, between the Islamic
and Christian in respect to the offensiveness of the execution of the promotional material and to link this to religious affiliation, temporality orientation, and polychronicity.
The separate analysis of the two groups showed that both scored low levels of offence for product/service and images although the Islamic students where, on the whole more sensitive. For the most part our results support the proposition that advertising and marketing issue or most offensive to those who judge themselves as strongly religious regardless of their faith.
Key Words
Perceptual Differences, Advertising, Cultural Characteristics, Culture
BackgroundCyprus is a micro socio-political system in Europe where two religious and ethnically different communities are situated on one island in the Eastern Mediterranean with a rich heritage of faiths and ideologies, which is currently separated along these lines since the invasion by Turkey in 1974. The communities in the North are Turkish and Turkish Cypriot (mainly Muslim) and in the South are Greek Cypriots and Greek (mainly Orthodox Christian). Although there are various forms of censorship of the media, for the most part marketing communications transcend them. The context for this study is two English speaking universities one on either side of what has become known as the ‘Green line’ that divides the island. This paper takes advantage of this closeness of otherness to study how controversial products and forms of offensive advertising executions can be related to levels of religiousness, time usage and temporality. The resulting observations are then
I n t e r n a t i o n a l J o u r n a l o f M a n a g e m e n t C a s e s
242
offered as insights into the notion of ethics of the two religious groups and how these might influence marketing to multicultural communities.
IntroductionThis paper proposes linkages that have a sound theoretical basis and could reveal more essential differences in the two communities that surface changes in marketing executions may fail to accommodate. This paper does not attempt to review the work on marketing ethics, religiousness and models of marketing ethics. This has been well discussed elsewhere (e.g. Whysall, 2000, Gaski, 1999, Smith, 2001, Murphy et al 2005). It also takes as established the importance of culture and religion on marketing ethics decisions (Hunt and Vitell, 1986, 1993), the differences that cultural frameworks have on notions of time use (Hall, 1959, McGrath and Kelly, 1992, Bluedorn, 2002) and in consumption (Kaufman et al 1991, 1999) and the importance of temporal orientation on consumer behaviour (e.g. Graham, 1981, Hirschman, 1987, Bergadaà 1990, Usunier and Vallette-Florence, 1994, Gibbs 1998). Neither does it attempt to review the literature on religiousness and marketing for, although it is fairly sparse, its linkage to consumer decision making is again established (Delener, 1994, Kennedy and Lawton, 1998, Longenecker et al, 2004 (business ethic), Michell and Al-Mossawi, 1999, Singhapakdi et al, 2000, Fam et al 2004, Angelidis and Ibrahim, 2004). Furthermore, the literature albeit predominately American and Christian indicates that highly religious individuals (students or marketers) will be influenced by their religiousness in their sensitivity to ethical evaluations and their disapproval of unethical behaviours (Clark and Dawson, 1996). However the literature has a scarcity of comment on the linkage between temporality and the time patterns of consumers and their views on ethical marketing. This paper attempts to address this issue for, it is argued, the primordial nature of temporality can distinguish communities in ways that religion affinity alone cannot achieve.
A notion of a secular market and IslamBefore embarking on a discussion of methodology I want to divert to conceptualize the notion of Islam. I take for granted an understanding of the other theistic tradition - Christianity - and its acceptance of a self-interest and notion of the market gaining
its genius from Smith’s Wealth of Nations. I argue here (as does Sauer, 1999), that the application of the moral prescriptions of religious texts to economic transactions are considered in Christian and secular societies as putting economic development under the illegitimate control of religious idealism whereas the market has its own constitutive logic. This is not to deny the rootedness of justice and fairness in the model of the market, just that when the Christian Holy texts are applied to the market they may require different ontologies than the development of the neo-liberal market has come to encourage. At the core of the different world view of Islam are the notion of unity and the divine truth of God as revealed through the Koran and its interpretation by those empowered with its authority (Choudhury, 2000a &b). Ethicizing marketing is a concept where, in the Islamic political economy the notion of ethics gets “induced on the consumption, production and distribution sides” (Choudhury, 2000a: 26) in the market model, thus increasing the social levels of market interaction.
Interpreted in term of an Islamic market, marketing is an instrument that mobilises resources towards the moral law whereas advertising for self, contested markets and undue competition is not allowed since advertising is then an act impeding the fair flow of resources for the common good. Such advertising seeks for all to be best informed and where an undue claim by some on the resources (whose ultimate owner is God) is inappropriate, as man is trustee for its good and fair use. Marketing thus seeks to satisfy customer need within his spiritual and physical well-being. The contrast is illustrated in the difference between the self-interested notion of buyer be ware and the Islamic obligation to dealer all information in a sales transaction. These Islamic marketing ethics have best been discussed in the literature based on the role of Islamic banking in the community (e.g. Choudhury and Hussain, 2005 and Harahap, 2003 ) and are similar to the view expressed by Saeed et al (2001) and Rice and Al-Mossawi (2002) in the international marketing context of Islam, and Gibbs (2004) relating to the well-being of consumers.
The few authors (e.g. Rice, 1999, Rice and Al-Mossawi, 2002, and Marta et al, 2004) who have addressed the notion of Islam in the marketing ethics literature have had relatively little concern for the epistemological position of the ideology

243
I n t e r n a t i o n a l J o u r n a l o f M a n a g e m e n t C a s e s
and have chosen and shown how pragmatic methods can be used to ‘colour’ an existing neo-liberal capitalist approach with a gloss of Islam. This approach is transparent to the faithful for it concentrates on the surface value and can lead to misleading ways of seeing the world. To offer an alternative requires an understanding of the phenomenological ontology of being a Muslim and how that constructs the nature of being.
Research hypotheses and methodThe exploratory approach taken in this project is an attempt to overcome the superficial, and investigate the deeper, difference, if any, between the Islamic and Christian in respect to the offensiveness of the execution of the promotional material and to link this to religious affiliation, temporality orientation, and use of time – polychronicity. In doing this the following hypothesises are tested:
That there would be commonality in level 1. of offence of product and service and their execution in a sample of students living in close proximity exposed to the same media outlets, local and international (MTV) and that this will be fairly low.
That in Cyprus religious intensity would be 2. expressed to be higher in the Christian Greek Cypriots than in Islamic Turkish Cypriots because of the emphasis in Turkey on secularism and EU entry.
That Islamic students would be more offended 3. by the execution of advertising as Islam has an ontological quality that the pluralistic personal representation of Christianity does not require.
That polychronicity would be high in both 4. communities given their high context cultures but that for those with high levels of faith, polychronicity would be stronger.
That both communities would share a forward 5. looking orientation but that religious intensity would lean more towards the past, for its
orientation would more reflect the truths revealed through the historic Holy texts which would direct the temporal orientation.
That religious intensity, polychronicity and past 6. temporality would be related to high level of offence regardless of religious affiliation.
MethodThe findings are based on a small-scale survey of 530 students (211 Christians, 302 Muslims and 18 undeclared) who responded to a questionnaire distributed at two privately owned, English speaking institutions, one in the North and one in the South part of Cyprus. Students were taking courses as part of their undergraduate degrees. The questionnaire consisted of a number of five point Likert scales designed to reveal offensiveness of products/services, images used in marketing to promote products/service, level of polychronicity and levels of faith. In addition data was collected on declared religious affiliation age, sex and resident city. A non-probability sampling method was used. The students were surveyed in classrooms not part of the research team teaching schedule. The respondents voluntarily participated with no pressure, penalty or reward used for those who did or did not wish to do so. The data was analyzed using the SPSS package.
Results
General characteristics of the two groups
For both groups the average levels on all attributes relating to products and services were at or below the mid-point of the scales used and the Islamic students tended to be more offended on the majority of the attributes. Table 1 show the products/services and offensiveness of image use for both groups using an average of mid-point of the scale (3) or above for inclusion listed in descending order of average score.

I n t e r n a t i o n a l J o u r n a l o f M a n a g e m e n t C a s e s
244
Table 1. Average levels of offensiveness (5 = extremely offensive)
Table 2. Significant difference is level of offensiveness between the two Groups
Furthermore, the two religious groups were significantly different (0.01 level) on levels of faith with the Christian indicating a higher level of faith.
Table 3. Inclination towards Polychronicity

245
I n t e r n a t i o n a l J o u r n a l o f M a n a g e m e n t C a s e s
As can been seen the main offending products/services and images are the same for both groups, However, when an Independent T test was performed on the whole group using religious affiliation as the independent variable, the results showed significant difference in a number of product groups and offensive images (significance is at the 5% level or below). Given the range of products and services that includes guns and armament it is interesting to consider the similarity in choices and those products which are commonly absent. (Perhaps most surprising is the inclusion of Gambling at the 0.05 level but in the North Casinos is legal whereas in the South they are not.) Indeed given the nature of the Islamic faith, hard selling with it potential to deceive was predicable point of divergence for a capitalistic tradition, moreover most of the difference between the groups views on the products and service discrimination would appear – see the guidance for advertising, Gulf Media International W.L.L. (Bahrain Code of acceptance) in Rice and Al-Mossawi, 2002.
Religion and level of faith Comparing the means the level of religious intensity it was the Islamic groups (3.01compared to 2.67) that had the highest, and significantly so scores (at 0.02) than the Moslems. The relationship between religion, ethical inclination, temporality and declared intensity is problematic from these results. An ANOVA with dependent variable level of religious faith revealed significant difference at the 0.01 level for religion, polychronicity and level of religious faith but on further investigation of the two groups this was found only to apply to the Islamic group with no relationship found in the Christian students.
An ANOVA was used on the separate grouping of religious affinity and the result indicated that for Christians intensity had very little discrimination on product/service (condoms were the only significant difference) and similarly a small discrimination on images differently only on nudity and stereotyping. Whereas for the Moslem group level of religious faith significantly distinguished within the groups those who found cigarettes, gambling political parties and racial extremism. Furthermore, all the images variables were differentiated by level of faith. Clearly level of stated faith is a more significant for the Moslem group in this project than for the Christian in regard to stimuli presented.
Time usage and TemporalityThe levels of polychronicity were calculated using the PAI3 (Lindquist et al, 2001) instrument which required recoding and aggregating the scores of the three questions that made up the PAI3, each of which was calibrated on a five part Likert scale. A score of above 9 indicated a tendency towards polychronicity. The low levels of polychronicity in both communities is a surprising results given the high levels of context of these communities yet the similarities between the two group is interesting should they hold the same common or distinctively different values.
An independent T test was performed on the whole group using the tendency scores of polychronicity. This showed there was no significant difference between religious groups, on levels of religious faith. Only gambling revealed a significant difference between the groups.
Regarding temporal orientation the group overall held 34.7% future orientation, 13.2% present, 22% past, 13.9% showed no preference and 16% gave no response.The nature of this association is difficult to ascertain but by inspection of the cross-tabulation the relationships appears to be that those with higher ethical inclination are more past orientated than with who were less inclined, those who were polychromatic were more balanced in their temporal outlook and Moslems are slightly more past orientation. This is assumed as those who score higher on these variables were more inclined to a past orientation than those who score less highly. However, in all cases the dominant orientation was future. A Kruskal-Wallis Test on variables faith, ethical and religious intensity showed there to be no significant difference between the groups regarding their temporal orientation
DiscussionRegarding the type and offensiveness of image the results of the study tend to support Fam et al 2004 and Waller et al 2005 that Islamic students were more sensitive to moral offence although, overall the group was insensitive. This may well be a reflection on the cultural similarity of the two groups in Cyprus and be more indicative of issues related to a more integrated European context.

I n t e r n a t i o n a l J o u r n a l o f M a n a g e m e n t C a s e s
246
Furthermore the higher intensity scores were a good discriminator of a high level of potential offensiveness of images regardless of the faith of the respondent. This seems to indicate that intensity and faith are distinctive attributes. This finding is support by the early study of McNichols and Zimmerer (1985:180) who found, in American students, evidence to suggest that the “strength of religious belief affects individual opinion of what is [ethically] acceptable”, (parenthesis inserted). The study’s finding is indicative and offers partial support for Hypothesis 2 in that the Christian expressed, higher levels of faith (although they we less sensitive to offensive images and products/services) perhaps because of the secular nature of the Turkish state and commerce as supported through anecdotal evidence.
The separate analysis of the two groups showed that both scored low levels of offence for product/service and images (see Table 1 & 2) the Islamic students where, on the whole, more sensitive to these issues and this offers support to Hypothesis 1 and 3. These results in the most part confirm work previously undertaken and support the proposition that advertising and marketing issue can be tailored to the specific needs of the two faiths for the majority.
Overall the levels of polychronicity (compared to Lindquist et al, 2001 for instance) do not support the notion that the two communities are high context. There was evidence that intensity and polychronicity are correlated so the evidence fails to support the first part of Hypothesis 4 although the second part is supported. Indeed this might point to the greater ontological nature of context for those holding higher levels of faith. Hypothesis 4 is considered partially supported.
ConclusionsThe results of this study are broadly consistent with the findings of Fam et al (2004) and Waller et al (2005). As indicated by Waller (when discussing Malaysia) that multi-cultural groups will tend to more liberal in its rules so as “maintain social and cultural harmony between the various groups” (2005:10) Further support for this position comes from Mike Longhurst, Senior VP, McCann-Erickson Europe and Board member of the European Association of Communications Agencies (EACA) that,
“Issues to do with particular ethics of buying and selling would normally only be considered when communications are clearly targeted at Muslims. In that case they would be expected to be very closely matched to consumer expectations. It is often found that Muslims are happy to apply double standards and recognise when non- Muslims are principally being addressed. They will take offence when Muslims are shown acting “improperly”, but not when others are.”
However, this study indicates a high degree of commonality between Islamic and Christian student Cypriots living is adjoining regimes, even given their ideological and political differences. Yet, I feel there is a deeper issue that the data points towards but fails conclusively to reveal. That is the primordial notion of temporality and its association to the self-expression of religious intensity and ethical inclination. The survey did reveal that Islamic students and Christian students see many things the same, negatively rejecting a number of the ethically objectionable promotional images, and showing a liberal attitude (lack of offensiveness) to services and products previously found to cause offence. Indeed both groups only rejected racist extreme groups at a level above the average. This finding differs from the previous work of Fam et al (2004). However, taken as a whole the outcomes of this research points towards Islamic students being more sensitive to ethical issues and Christians declare themselves more religious intense but less sensitive to offence. The common feature of these two monotheistic religions is that religious intensity is a strong indicator of how offensive the images and the type of product and service will prove.
The theorised concern with temporality proved to be significant in association with ethical inclination, polychronicity and religious intensity. The indication that an association might be linked to a past rather than the dominant future orientation does raise some issue for marketing segmentation and image use. For instance, positive and forward-looking images would stimulate most of the group regardless of their level of faith. However, images that are based on traditional values which are then respectfully used as a trajectory into the future would seem to have an appeal to, and better accommodate, those with self declared high levels of faith. Indeed it might be possible to conjecture that ethically positive activity with a positive forward-looking orientation is the least likely to offend modern Islamic and Christian students.
247
I n t e r n a t i o n a l J o u r n a l o f M a n a g e m e n t C a s e s
ReferencesAngelidis, J. and Ibrahim, N. (2004), ‘An Exploratory Study of the impact of Degree of Religiousness Upon an Individual’s Corporate Social Responsiveness’, Journal of Business Ethics
Bergadaà, M. (1990), The Role of Time in the Action of the Consumer’, Journal of Consumer Research, , Vol. 17 (3), pp. 289-303.
Choudhury, M. A. (2000), ‘Regulation in the Islamic Political Economy: Comparative Perspectives’, Journal of King Abdulaziz university, Vol. 12, pp. 21-51
Choudhury, M. A. (2000b), ‘The nature of Islamic socio-scientific inquiry theory and application in capital markets’, International Journal of Social Economics, Vol. 27 (1), pp 62-85.
Choudhury, M. A. and Hussain. Md. M (2005), ‘A paradigm of Islamic money banking’, , International Journal of Social Economics, Vol. 32 (3), pp 203-217
Clark, J.W and Dawson, L. E. (1996), ‘Personal Religiousness and Ethical Judgments: An Empirical analysis, Journal of Business Ethics, Vol. 15. pp 359-372.
Delener, n. (1994), ‘Religious Contrasts in consumer Decision Behavior Patterns: Their Dimensions and Marketing Implications’, European Journal of Marketing, Vol. 28 (5), pp 36-53.
Fam, K. S, Waller, D. S. and Erdogran, B. Z. (2004), ‘The influence of religion on attitudes towards the advertising of controversial products’, European Journal of Marketing, Vol. 38 (5/6). pp 537-555
Gaski, J.F. (1999), ‘Does Marketing Ethics Really Have anything to Say? – A Critical Inventory of the Literature’, Journal of Business Ethics, Vol. 18. pp. 315-334
Gibbs P. (2004), ‘Marketing and the notion of well-being’ Business Ethics, A European Review, Vol.13, (1), pp. 5-13
Gibbs, P. T. (1998),‘Time, temporality and consumer behaviour A review of the literature and implications for certain financial services ‘,European Journal of Marketing, Vol. 32,pp. 993-1007
Graham, R. J. (1981), “The Role of Perception of Time in Consumer Research,” Journal of Consumer Research, Vol. 7 (March), pp. 335- 342
Hirschman, E. (1987), “Theoretical Perspectives of Time Use: Implications for Consumer Behaviour Research,” Research in Consumer Behaviour, Vol. 2, pp. 55-81
Kaufman, C., Lane, P. and Lindquist, J.D. (1991) ‘Exploring more than 24 hours: A preliminary investigation of polychronic time use’, Journal of Consumer Research, Vol 18, pp 392-91.
Lindquist, J. D,; Knieling, J and Kaufman-Scarborough, C. (2001), ‘Polychronicity and Consumer Behavior Outcomes Amongst Japanese and U.S. Students: A study of Response to Culture in a U.S. Setting’, Proceedings of the Tenth Biennial World Marketing Congress
McNichols, C. w. and Zinerer, T. w. (1985), ‘Situational Ethics: an Empirical Study of differentiators of Student Attitudes’, Journal of Businesses Ethics, Vol. 4. pp. 175-180
Michell, P. and Al-Mossawi, M (1999), ‘Religious commitment related to message contentiousness’, Journal of Advertising, 1999, Vol. 18 (4), p427-43.
Rice, G. and Al-Al-Mossawi, M. (2002), The Implications of Islam for Advertising Messages: The Middle Eastern Context’, Journal of Euromarketing, Vol. 11(3), pp. 71-96

I n t e r n a t i o n a l J o u r n a l o f M a n a g e m e n t C a s e s
248
Biography
Ms. Ria Nicoletti Morphitou is an Assistant Professor in Marketing at Intercollege Nicosia. She is employed at Intercollege since the 1st of October 1990. She holds a BSc degree in Marketing from West Virginia University, an MBA from Maastricht School of Management and is a PhD degree candidate from Lacrosse University in the U.S.A. Ms. Morphitou had been the Larnaka Campus Coordinator in the Business Administration program as from October 1990 to July 2000. She has also been the Student Affairs Director of Intercollege Larnaka as from January 1994 to June 2000 where she received the Outstanding Contribution Award. She had a considerable industrial experience before joining Intercollege as a lecturer. During the last five years she has received her professional
qualifications in the field of Marketing and H.R. She is an accredited Senior Business Consultant from the Institute of Technology (September 2001) and from the Human Resource Development Association (October 2001). She is also a member of the American Marketing Association and a full member of the Chartered Institute of Marketing. She has been actively working as a Business Consultant for the last five year with a considerable clientele list which includes leading private and semi government organizations.
Her research interests include the Marketing of Tertiary Education. Her research work has been supported by various research grants and has been published in International Conference Proceedings and Journals.
249
I n t e r n a t i o n a l J o u r n a l o f M a n a g e m e n t C a s e s
ON-LINE CHANNELS AND DIRECT MARKETING MEDIA
STJEPAN DVORSKIUNIVERSITY OF ZAGREB, CROATIA
DAMIR DOBRINIĆCROATIAN POST, CROATIA
VLADIMIR KOVŠCAUNIVERSITY OF ZAGREB, CROATIA
Abstract
The scientists foresee that, in the near future, every household and company will be connected in the world computer system, and that the technological revolution will totally change our way of buying and communicating. Maybe these prophecies are too optimistic, however, regarding the existing trend of growth of the direct marketing in the practice, it is realistic to expect that the existing marketing role models will change in the future, i.e., that the mass marketing and the mass retail will continue to exist, but that their supremacy and power will diminish, regarding the fact that there is an increasing number of customers who choose different way of buying. The use of direct marketing is to be expected in the future, which point to the need to give much more attention to the problematic of direct marketing, from the scientific, as well as from the practical aspect.
The channels of direct marketing, both traditional and new ones (on-line), are at the same time the media of direct marketing. They enable the manufacturers to sell and promote their products, and to communicate directly with the customer.
Key words: on-line marketing, channels of direct marketing, Internet, e-mail, customers
INTRODUCTIONThe channels of the direct marketing provide the direct salesman with the possibility of choice of direct contact with the customer.
The manufacturers have a wide range of possibilities regarding the choice of the channel for reaching their customers. In that sense, the
companies sold their products mostly through the representatives, so we can talk about the channels of wholesale and the channels of retail. However, at the end of 20th century, we witnessed significant innovation in this segment of marketing mix.
Thanks to the possibilities of new technology, the channels of sale are being radically innovated, so today we speak about several types:
Face-to-face sale (direct sale) •
Direct post marketing •
Catalogue marketing •
Telemarketing•
TV marketing and marketing of other mass • media with direct answer
Kiosk marketing•
On - line marketing.•
On-line marketing is becoming one of the most important channels of direct marketing, demanding special attention, which is the goal of this paper.
‘’ON-LINE’’ CHANNELS“On-line” channels represent the newest sophisticated media of direct marketing, with which the users communicate through the computer and the modem.
“On-line” channels enable buying through the personal computer (“on-line shopping”, electronic “tele-shopping”), and this form of buying is also
I n t e r n a t i o n a l J o u r n a l o f M a n a g e m e n t C a s e s
250
called “virtual buying”, while the market in which it is realized is called – electronic marketing.
Advantages of “on-line” marketing:•
Both large and small firms can afford it •
The advertising space is not limited •
Access to information is very quick •
The buying can be realized quickly, from one’s • own home
Benefices of “on-line” marketing:•
Building the relationship with the customers •
Measurability of the effects •
Quick adaptation to the market circumstances •
Decrease of the business costs. •
The most widespread form of “on-line” marketing is Internet marketing, which is also the biggest marketing innovation from the end of 20th century.
During its development, the Internet was mostly used for the research in the field of sharing of the computer resources, but the unexpected growth and development emphasized its commercial exploitation, especially in the area of advertising.
The Internet is becoming a very significant promotional/selling media with several specific advantages. Besides the relatively low costs, it also enables mutual communication (company – user/customer). Unlike the classical media, in which the information are send by the principle “from one to many”, here the activity is interactive, by the principle “from many to many”. The user is in direct relation to the advertiser on Internet, but he/she also has the possibility to contact other users, and to exchange the information about product or service with them.
The Internet and its possibilities can be viewed through three basic aspects:
Internet as the media of advertising •
Internet as the sales channel •
Internet as the distribution media •
The use of Internet in the advertising purposes begins with the creation of a web site. Since its advertising role is increasing, the creation of the web sites demands special attention. The goal of the web sites is promotion of the company and its services or products. The success of such promotion depends upon the quality of web sites, which dictates the number of visitors. The basic elements of this quality are:
Speed and quality of the access to the web site • content
The quality of the content itself, its • arrangement and layout
Simple orientation and content viewing •
High number of visits results in the fulfillment of the advertising goals, but also in the higher degree of interest for other advertisers (link exchange, paid advertisements – “banners”, etc).
Besides the quality web site, the number of visits is also increased by promoting the web site itself, both on Internet sites, and on other media. There are numerous types of free-of-charge promotion of web sites on Internet, like: applying to the browsers, link exchange, participation in forums and newsgroups, applying to the lists of economic subjects, etc. Besides the free advertisement, there is also paid advertisement, in which the web site is advertised through the “banners” (little pictures, for example logo or similar sign of recognition of the company or service) on other highly visited sites. The most frequently used methods of finding particular web sites are:
Use of the browsers (71% of respondents)•
Recommendation of friends and acquaintances • (9.8% of respondents)
Information from the daily newspapers and • magazines (8.5% of respondents)
Links (8.4%)•
Accidentally (8.1%)•
Television (3.6% respondents).•
The web site becomes the integral part of the corporative identity. It is promoted to the public like other of the corporation elements.

251
I n t e r n a t i o n a l J o u r n a l o f M a n a g e m e n t C a s e s
Figure1. Internet and its possibilities
Figure 2: E-Marketing Evolution Flowchart
Izvor: Stone, B., Jacobs, R.: Successful Direct Marketing Methods, VII Edition, McGraw-Hill, New York, 2001. str. 264.

I n t e r n a t i o n a l J o u r n a l o f M a n a g e m e n t C a s e s
252
The role of the web sites is the review of the information and enabling the direct (individual) contact with the potential customers/users. On that base, its content is also created, which has to enable:
Quality presentation of the company •
Service information (type, price, discounts etc.)•
Review of the e-mail addresses of the sectors, • services and responsible persons
Contact with users (asking questions and • providing answers, newsgroups and forums)
Easy browsing through the content •
The above mentioned elements are graded by the industry and various media, which is the additional form of free advertising. For example, independent institution EEMA (European Electronic Marketing Association) proclaimed the web site of the Swedish posts to be the best European commercial web site for the year 2002.
Because of the increase of the number of users and the advantage of good accessibility, Internet becomes interesting also as the media of sale. The development in that direction has begun with the catalogue sale and the review of the brochures, and it continues by the development of the interactive sales communication with the goal of maximal satisfaction of the customers’ needs. (Figure 2.)
The possibility of delivery of the targeted information makes the Internet also the distributive media. E-mail is the basic technique of such communication with the clients.
Electronic mail Unlike the classic direct mail, whose distribution requires the postal network, electronic mail represents the type of direct communication without agents. Core differences, i.e. advantages of the e-mail over the traditional direct mail are:
Speed – independent researches have shown • that the European postal offices deliver over 90% of their packages by the second day, while the Croatian postal service, according to its own indicators, delivers only 70% of the packages by the second day. Electronic mail is not slave to the deadlines of the distributors
– it gets its goal literally in the matter of seconds. Sales campaign does not require several weeks of efforts in planning, designing, creating, testing, printing and sending of the messages, with several days of expecting the reactions of the potential customers. The results of the e-mail campaign are visible after several hours.
Quick reaction of the receivers – reactions of • the receivers of the sales messages start the same day, after sending. As a rule, 90% of the responds come within the first four days. According to the time of reaction to the sales message, the receivers can be divided to:
Immediate, so-called “hot” respondents who • give their responses within 24 hours,
“warm” respondents who give their responses • within three days
“cold” respondents, who give their responses in • more than three days
Unlimited accessibility – without the time and • space barriers, and without various postal regulative with the varying reliability and quality of the service.
Simplicity of design – e-mail is designed • directly on the computer, without the need for special skills of programming, designing, printing etc.
Low costs of sending – e-mail is often referred • to as the direct mail without the stamp; therefore, it does not require the costs of the sending (except the costs of Internet connection), graphic design and printing. Low costs of the campaign ensure its profitability in spite of the low percentage of the responses
Efficiency – the way of the response and the • ordering is adapted to the time and place of every customer. Technical possibilities ensure strong and efficient presentation of the supply, which increases the percentage of the responses.
* Roberts, S, Feit; M, Bly, R.W.: Internet Direct Mail, NTC Business Books, 2001.

253
I n t e r n a t i o n a l J o u r n a l o f M a n a g e m e n t C a s e s
CONCLUSION The scientists foresee that, in the near future, every household and company will be connected in the world computer system, and that the technological revolution will totally change our way of buying and communicating. Maybe these prophecies are too optimistic, however, regarding the existing trend of growth of the direct marketing in the practice, it is realistic to expect that the existing marketing role models will change in the future, i.e., that the mass marketing and the mass retail will continue to exist, but that their supremacy and power will diminish, regarding the fact that there is an increasing number of customers who choose different way of buying. The use of direct marketing is to be expected in the future, which point to the need to give much more attention to the problematic of direct marketing, from the scientific, as well as from the practical aspect.
The channels of direct marketing, both traditional and new ones (on-line), are at the same time the media of direct marketing. They enable the manufacturers to sell and promote their products, and to communicate directly with the customer.
REFERENCEDuncan, G.: Direct marketing, Adams Media Corporation, Massachusetts, 2001.
Geller K.Lois: Response – The Complete Guide to profitable Direct marketing, Oxford, 2002.
Douglas, J. Dalrympe; Leonard J. Parsons: Marketing Management – Text and Cases, VI Edition, John Wiley & Sons, Inc, NY, 1995.
Hennessey D.H.: Matters to Consider before Plunging Telemarketing, Marketing News, 1983.
Kotler, Ph.: Marketing management, IX Edition, Prenifce Hall, New Jersey, 1997.
Kotler, Ph.: Upravljanje Marketingom, MATE d.o.o., Zagreb, 2001.
Marušić, M., Vranešević, T.: Istraživanje tržišta, 5. izdanje, Adeco, Zagreb, 2001.
Panian, Ž.: Elektroničko poslovanje – šansa hrvatskog gospodarstva u 21. stoljeću”, Ekonomski pregled, br. 3-4, Zagreb, 2000.
Panian, Ž. : Odnosi s klijentima u E poslovanju, Sinergija, Zagreb, 2003.
Roberts, S, Feit; M, Bly, R.W.: Internet Direct Mail, NTC Business Books, 2001.
Srića, V.: Put k elektroničkom poslovanju, Sinergija, Zagreb, 2001.
Stone, B., Jacobs, R.: Successful Direct Marketing Methods, VII Edition, McGraw-Hill, New York, 2001.
Vranešević, T., Vignali, C., Demetris, V.: Upravljanje strateškim marketingom, Accent, Zagreb, 2004.

I n t e r n a t i o n a l J o u r n a l o f M a n a g e m e n t C a s e s
254
TECHNOLOGY BROADENS THE GAP BETWEEN PREMIERSHIP FOOTBALL
CLUBS
STEPHEN HENDERSONLEEDS METROPOLITAN UNIVERSITY, UK
Abstract
The English Premier League remains the envy of the rest of the world with eight clubs from this league in the top twenty based on revenue (Deloitte & Touche, 2007). This paper sets out to examine the impact of technology on those clubs. Secondary research identifies that a globalisation trend amongst the larger clubs is driving a variety of revenue streams. How technology is helping the clubs to create a wide range of service offerings for football fans in the UK and beyond is highlighted. It becomes clear that broadcasting is key in its ability to not only generate revenue in its own right but also increase merchandise and sponsorship revenues. The differing types of football fan are considered but it is discovered that the available research concentrates on fans attending matches. The global fan is expected to show a different pattern of consumption in terms of the location of consumption as well as the service itself. It becomes clear that not only is little known about the fans who don’t regularly attend matches but that there is some scepticism about whether the technology will meet their needs.
Alongside the secondary research noted above, primary research takes a look at 3G mobile phone technology as a way to examine the views on technology of the top-flight football clubs in the English Premier League. Clear, wide ranging, technically based strategies are observed amongst the larger football clubs enabling them to reach out to their global fan base. The findings support the view that there is a widening gap between the ‘haves’ and ‘have nots’. Furthermore, they confirm the view that, whilst broadcasting rights are increasing their revenues, there remain gaps in market knowledge and mistrust of technologies that are neither necessarily stable nor offer the market a product that is valued.
Key words: marketing, technology, football, sport
IntroductionCommunication between different continents for education or entertainment is not only commonplace but also quicker than ever before. Commercial organisations such as News Corporation (News Corporation, 2007), CNN (CNN, 2007) and the BBC (BBC, 2007a) transmit information around the world to a wide ranging public via both direct (one way) and interactive (two way) communications using the mediums of television, mobile phone, PC, internet, etc. To give some idea of scale, despite recent falls, News Corporation has a net income of $822 million (Bloomberg, 2007) generated from communications.
The main content of communications across the globe is sport, news and films. Consumer interest in different countries varies and, for the focus of this research, the desires of the football fan need to be considered. For example, quite clearly, the motivations of the fan of an English Premier League team residing in the Far East will be different to the fan attending matches because it is the family tradition. The potential complexity of an increasingly strong communication network and an audience of mixed motivation can be seen which implies that good marketing is central to success. The marketing of Premier League clubs has come a long way since Chadwick and Clowes (1998) looked at their brand extension strategies. Indeed, major advances in technology have led to more opportunities than those examined by Beech et al. (2000a; 2000b) in looking at the use of the Internet. However, some are rightly sceptical about the potential for technologies such as 3G mobile phones (Boyle, 2004). Given this background, the question arises as to how a football club can fit into a world of complex needs, developing technology and powerful communications companies.
255
I n t e r n a t i o n a l J o u r n a l o f M a n a g e m e n t C a s e s
Aim and MethodologyThe aim of this paper is to understand the use of new technology as a means of reaching a global market for football clubs in the English Premier League. This begins by some secondary research considering what globalisation means in terms of creating revenue streams for football clubs in a world where communication paths are shortening. Each is examined to see how technology contributes to the revenue stream and how this is being managed. Further secondary research looks at the information available to describe football fans in order that this might help to generate suitable market segmentation and fruitful marketing strategies. Finally, some primary research of the attitudes to 3G mobile phone technology shown by the English Premier League is presented to explore both general attitudes to the use of technology in marketing to a global fan base and recognise any differences between clubs of different size.
Globalisation
Revenue streams
From the point of view of the football club, the global market can be seen to offer the opportunity of constructing a variety of revenue streams. Peter Kenyon, Chief Executive of Chelsea Football Club, puts it quite simply in saying he plans to build the club into the world’s foremost commercial football property by 2014 (Waugh, 2006). Whether such aims are achievable or not for this particular club, they clearly rest on building revenue streams.
Mason (1999) takes a customer based view of revenue streams proposing four customer groups: fans, television and other media, communities that construct facilities to support local clubs and, finally, corporations that interact with the leagues and teams. In this paper, a product based view of the revenue streams is adopted with the football fans as the principle customer. Televisions and other media are simply regarded as marketing channels to reach those fans. Also, local communities are considered less relevant as they get involved to a much lesser extent in the UK than in the US. So, the revenue streams are categorised as follows:
Match day revenue from fans at the ground • itself.
Match day revenue from companies allowed • rights to broadcast to the fans on the move or relaxing.
Merchandise revenue from tangible products • such as team shirts, photographs, magazines, etc. sold directly by the club (via a club shop or website) or companies allowed licences to produce such products.
Sponsorship revenue in a variety of forms from • shirt sponsors to official partners for beer, etc.
From the point of view of looking at technology within this research, the merchandise and sponsorship revenue streams are of less concern. Merchandise provides the fan with a tangible product associated to the club but the technology aspects to this are merely within the product itself, or, as a means to sell the product i.e. via the internet. With sponsorship, the revenue accrues from benefits that the sponsor gains rather than satisfying the needs of the fan and, hence, less relevant to this look at the impact of technology on reaching the global fan base. So, the following sections will not consider either merchandise or sponsorship in any depth. Clearly, they are significant in value and requires careful management by the football clubs but are simply less influenced by the technological considerations of this paper.
Match day revenue from fans at the ground
If we consider that watching a football match is the core product of a football club, the traditional product gets delivered to the fan inside the ground in its simplest form as a visual experience. Fans will, of course, provide additional revenues by their requirements for food and drink with the opportunity to bet on the outcome of the game also becoming increasingly popular. Technology now allows for both replays via screens inside the ground and match commentary available via radio or in-house TV channels. However, for the fan at the game, most of these additional options are non-core products and either come as part of the ticket price or are discretionary items. Hence, technology has a limited influence on the match day revenue that comes from ticket sales which, for a large club, will represent around one third of the total income (Deloitte and Touche, 2007).
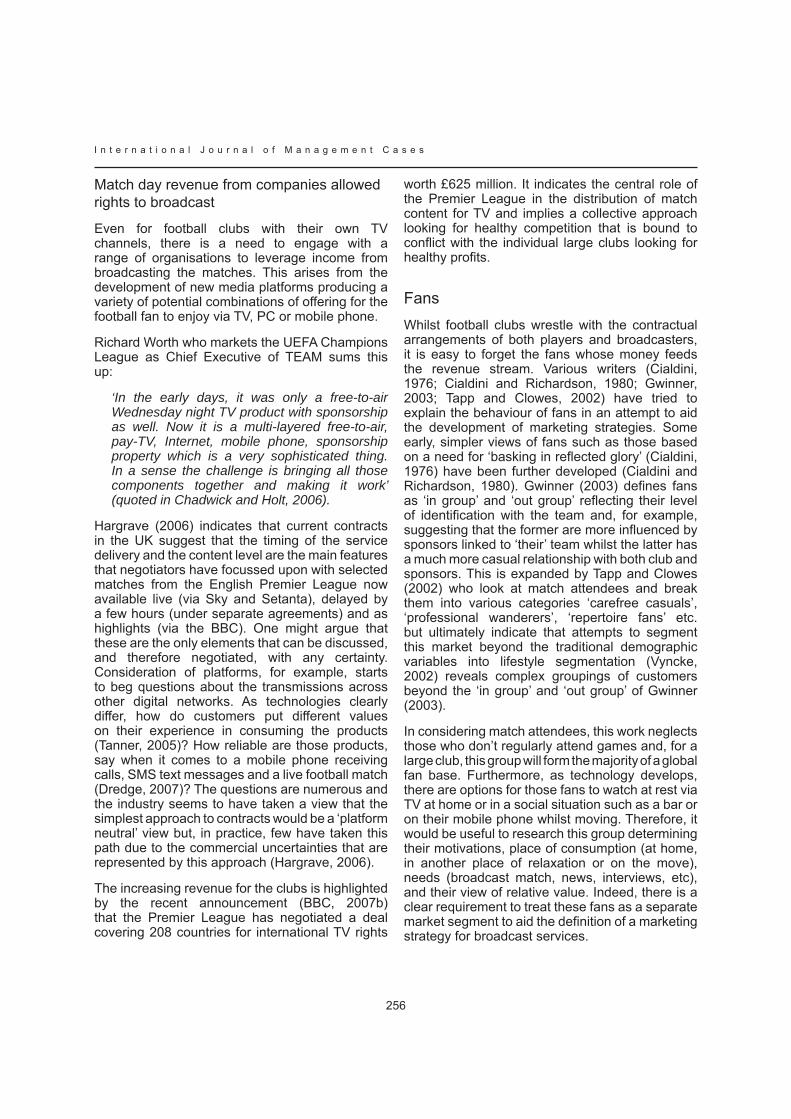
I n t e r n a t i o n a l J o u r n a l o f M a n a g e m e n t C a s e s
256
Match day revenue from companies allowed rights to broadcast
Even for football clubs with their own TV channels, there is a need to engage with a range of organisations to leverage income from broadcasting the matches. This arises from the development of new media platforms producing a variety of potential combinations of offering for the football fan to enjoy via TV, PC or mobile phone.
Richard Worth who markets the UEFA Champions League as Chief Executive of TEAM sums this up:
‘In the early days, it was only a free-to-air Wednesday night TV product with sponsorship as well. Now it is a multi-layered free-to-air, pay-TV, Internet, mobile phone, sponsorship property which is a very sophisticated thing. In a sense the challenge is bringing all those components together and making it work’ (quoted in Chadwick and Holt, 2006).
Hargrave (2006) indicates that current contracts in the UK suggest that the timing of the service delivery and the content level are the main features that negotiators have focussed upon with selected matches from the English Premier League now available live (via Sky and Setanta), delayed by a few hours (under separate agreements) and as highlights (via the BBC). One might argue that these are the only elements that can be discussed, and therefore negotiated, with any certainty. Consideration of platforms, for example, starts to beg questions about the transmissions across other digital networks. As technologies clearly differ, how do customers put different values on their experience in consuming the products (Tanner, 2005)? How reliable are those products, say when it comes to a mobile phone receiving calls, SMS text messages and a live football match (Dredge, 2007)? The questions are numerous and the industry seems to have taken a view that the simplest approach to contracts would be a ‘platform neutral’ view but, in practice, few have taken this path due to the commercial uncertainties that are represented by this approach (Hargrave, 2006).
The increasing revenue for the clubs is highlighted by the recent announcement (BBC, 2007b) that the Premier League has negotiated a deal covering 208 countries for international TV rights
worth £625 million. It indicates the central role of the Premier League in the distribution of match content for TV and implies a collective approach looking for healthy competition that is bound to conflict with the individual large clubs looking for healthy profits.
FansWhilst football clubs wrestle with the contractual arrangements of both players and broadcasters, it is easy to forget the fans whose money feeds the revenue stream. Various writers (Cialdini, 1976; Cialdini and Richardson, 1980; Gwinner, 2003; Tapp and Clowes, 2002) have tried to explain the behaviour of fans in an attempt to aid the development of marketing strategies. Some early, simpler views of fans such as those based on a need for ‘basking in reflected glory’ (Cialdini, 1976) have been further developed (Cialdini and Richardson, 1980). Gwinner (2003) defines fans as ‘in group’ and ‘out group’ reflecting their level of identification with the team and, for example, suggesting that the former are more influenced by sponsors linked to ‘their’ team whilst the latter has a much more casual relationship with both club and sponsors. This is expanded by Tapp and Clowes (2002) who look at match attendees and break them into various categories ‘carefree casuals’, ‘professional wanderers’, ‘repertoire fans’ etc. but ultimately indicate that attempts to segment this market beyond the traditional demographic variables into lifestyle segmentation (Vyncke, 2002) reveals complex groupings of customers beyond the ‘in group’ and ‘out group’ of Gwinner (2003).
In considering match attendees, this work neglects those who don’t regularly attend games and, for a large club, this group will form the majority of a global fan base. Furthermore, as technology develops, there are options for those fans to watch at rest via TV at home or in a social situation such as a bar or on their mobile phone whilst moving. Therefore, it would be useful to research this group determining their motivations, place of consumption (at home, in another place of relaxation or on the move), needs (broadcast match, news, interviews, etc), and their view of relative value. Indeed, there is a clear requirement to treat these fans as a separate market segment to aid the definition of a marketing strategy for broadcast services.

257
I n t e r n a t i o n a l J o u r n a l o f M a n a g e m e n t C a s e s
Figure 1: Size of clubs based on average attendances in 2005/06 season
Figure 2: Use of technology by club size
Figure 3: Reasons for internet use (in decreasing order of mention)
Primary Research – 3G TechnologyA survey of the English Premier League clubs was conducted in March 2006 to understand their attitudes towards new technology. In particular, focussing on 3G mobile phone technology as an issue of current interest in terms of its potential to broadcast football based services to fans.
In Figure 1, the clubs are categorised into small, medium and large based on the average attendances in the 2005/06 (Soccernet, 2006) in order that, later, some indication of attitudinal link to size might be established. The categories were determined based on approximately equal groupings of small, medium and large. Using attendance might penalise clubs with grounds which are often full and do not meet demand but using a revenue based category proved difficult due a lack of access to consistent data.
Of the 20 clubs in the leagues, 60% (12) responded to the survey and 50% or more responded in
each size category. When asked whether they felt that 3G technology offered an opportunity, all the clubs with the exception of one medium sized club agreed with this statement. The club that considered the technology as a threat suggested that control was a potential problem as a number of websites already broadcast their matches, legally or illegally.
General use of technology, Figure 2, indicates that the large clubs take advantage of the three main routes to the fan base. The technologies noted in Figure 2 were the main ones mentioned by the clubs though radio (one medium club), SMS text messaging (one medium club) and email (one small club) were also mentioned. Despite the overwhelming view that 3G technology offers an opportunity only the large clubs appear to have taken this seriously in terms of investment.
However, the internet clearly dominates and the main reasons for this are indicated in Figure 3. The comments from the clubs are revealing in that
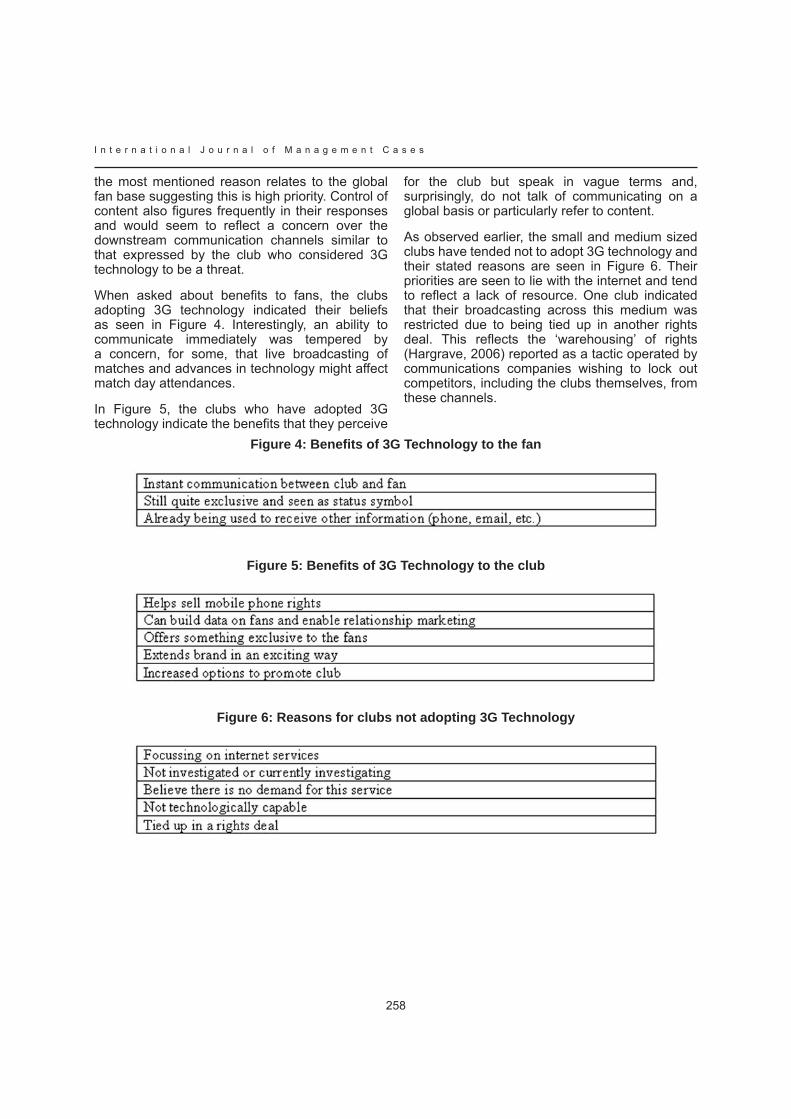
I n t e r n a t i o n a l J o u r n a l o f M a n a g e m e n t C a s e s
258
the most mentioned reason relates to the global fan base suggesting this is high priority. Control of content also figures frequently in their responses and would seem to reflect a concern over the downstream communication channels similar to that expressed by the club who considered 3G technology to be a threat.
When asked about benefits to fans, the clubs adopting 3G technology indicated their beliefs as seen in Figure 4. Interestingly, an ability to communicate immediately was tempered by a concern, for some, that live broadcasting of matches and advances in technology might affect match day attendances.
In Figure 5, the clubs who have adopted 3G technology indicate the benefits that they perceive
for the club but speak in vague terms and, surprisingly, do not talk of communicating on a global basis or particularly refer to content.
As observed earlier, the small and medium sized clubs have tended not to adopt 3G technology and their stated reasons are seen in Figure 6. Their priorities are seen to lie with the internet and tend to reflect a lack of resource. One club indicated that their broadcasting across this medium was restricted due to being tied up in another rights deal. This reflects the ‘warehousing’ of rights (Hargrave, 2006) reported as a tactic operated by communications companies wishing to lock out competitors, including the clubs themselves, from these channels.
Figure 4: Benefits of 3G Technology to the fan
Figure 5: Benefits of 3G Technology to the club
Figure 6: Reasons for clubs not adopting 3G Technology
259
I n t e r n a t i o n a l J o u r n a l o f M a n a g e m e n t C a s e s
ConclusionThe aim of this paper was to examine the use of new technology in the English Premier League by consideration of the globalising football market, its fans and some primary research of attitudes towards 3G mobile phone technology.
The following conclusions can be drawn:
Within the secondary research, changing • broadcasting technologies are seen to be the key revenue stream.
The stable TV platform is increasing the • financial gap between the Premier League and the rest due to the collective negotiation.
A tipping point in terms of financial reward • seems to have been reached with other stabilising technology though doubts about platform reliability remain.
In addition to this, there is limited • understanding of the global fan who has yet to fully experience the wide variety of broadcast services and may not value the offering.
However, the primary research reveals that, in • practice, mainly the larger clubs are using the latest 3G mobile phone technology increasing the gap between the elite at the top and those further down the Premier League.
AcknowledgmentsThe author would like to thank Catherine Evans, a final year Events Management at Leeds Metropolitan University student, for collecting the primary data used in this paper during March 2006.
BibliographyBBC (2007a) BBC [Internet]. Available from: <http://www.bbc.co.uk/> [Accessed 12 January 2007].
BBC (2007b) Premiership in new £625m TV deal [Internet] London, BBC. Available from: <http://news.bbc.co.uk/2/hi/business/6273617.stm> [Accessed 22 January 2007].
BBC (2007c) Football takeover trends [Internet] London, BBC. Available from: <http://news.bbc.co.uk/sport2/hi/football/eng_prem/6179569.stm > [Accessed 13 February 2007].
Beech, John; Chadwick, Simon and Tapp, Alan (2000a), Emerging trends in the use of the Internet – lessons from the football sector Quantitative Market Research: An International Journal, Vol 3, No 1, pp.38-46.
Beech, John, Chadwick, Simon and Tapp, Alan (2000b) Surfing in the premier league: key issues for football club marketers using the Internet Managing Leisure 5, pp.51–64.
Bloomberg (2007), News Corp. 2nd-Qtr Net Falls [Internet] New York, Bloomberg.com. Available from: <http://www.bloomberg.com/apps/news?pid=20601087&sid=aeZ.VV.45ed8&refer=home> [Accessed 12 February 2007].
Boyle, R. (2004). Mobile Communication and the Sports Industry: The Case of 3G Trends in Communication. 12 (2&3) pp.73-82.
Chadwick, Simon and Clowes, Jeff (1998) The use of extension strategies by clubs in the English Football Premier League Managing Leisure, 3, pp.194-203.
Chadwick, Simon and Holt, Matthew (2006) A Case Study of Global Success in Sport The Effective Marketing and Branding of the UEFA Champions League.In: Proceedings of the Academy of Marketing Conference – Marketing Excellence, July 2006, The University of Middlesex, London.
Cialdini, R. B., Borden, R. J., Thorne, A., Walker, M.R., Freeman, S., Sloan, L. R. (1976) Basking in reflected glory: Three (football) field studies Journal of Personality and Social Psychology, Vol 24, No 2, pp.366-375.
Cialdini, Robert. B., and Richardson, Kenneth D. (1980) Two Indirect Tactics of Image Management: Basking and Blasting Journal of Personality and Social Psychology, Vol 39, No 3, pp.406-415.
CNN (2007) CNN.com [Internet]. Available from: <http://edition.cnn.com/> [Accessed 12 January 2007].

I n t e r n a t i o n a l J o u r n a l o f M a n a g e m e n t C a s e s
260
Deloitte & Touche (2007), Football Money League 2007 [Internet] United Kingdom, Deloitte & Touche LLP. Available from: <http://www.deloitte.com/dtt/article/ 0,1002,sid%253D70402%2526cid%253D73888,00.html> [Accessed 12 February 2007].
Dredge (2007) Handset Overload [Internet] United Kingdom, New Media Age. Available from: <http://www.mad.co.uk/Main/Home/Articles/bb34499ef48f4839ac8fac43f87e23cb/Handset-overload.html> [Accessed 12 February 2007].
Hargrave, Sean (2006) Playing to the crowd New Media Age, 13 July, pp17-19.
Mason, D. (1999) What is the sports product and who buys it? The marketing of professional sports Leagues European Journal of Marketing, 33, 3/4, pp.402-418.
Soccernet (2006) ESPNsoccernet [Internet] Premiership Attendance - 2005/06 Available from: <http://soccernet.espn.go.com/stats/attendance?league=eng.1&year=2005&cc=5739> [Accessed 12 December 2006].
News Corporation (2007) News Corporation [Internet]. Available from: <http://www.newscorp.com/index2.html> [Accessed 12 January 2007].
Tanner, John (2005) Is there a business case for 3G TV? America’s Network 15 January 2005, Vol. 109, Issue 1, p14.
Tapp Alan and Clowes, John (2002). `From “carefree casuals” to “professional wanderers”: Segmentation possibilities for football supporters’ European Journal of Marketing , Vol. 36, No 11/12, pp1248-1269.
Vyncke, Patrick (2002) Lifestyle Segmentation: From Attitudes, Interests and Opinions, to Values, Aesthetic Styles, Life Visions and Media Preferences European Journal of Communication, Vol. 17, No. 4, pp.445-463.
Waugh, Noelle (2006) Chelsea aims for worldwide brand success [Internet] London, Marketing Week. Available from: <http://www.marketingweek.co.uk/cgi-bin/item.cgi?id=54300&d=pndpr&h=pnhpr&f=pnfpr> [Accessed 12 January 2007].
Author’s biographical information:Joined The UK Centre for Events Management at Leeds Metropolitan University in 2005. Prior to this, worked on various MBA courses for leading UK Business Schools and, today, researches strategy and marketing issues in events.
261
I n t e r n a t i o n a l J o u r n a l o f M a n a g e m e n t C a s e s
RELATIONSHIP MARKETING ON A UNIVERSITY WEBSITES: AN ANALYSIS
OF LEEDS METROPOLITAN UNIVERSITY WEBSITE
TAHIR RASHIDLEEDS METROPOLITAN UNIVERSITY, UK
Abstract
It has been widely accepted that the last decade has witnessed the explosive growth in computer, telecommunications and information technology. New technologies such as the Internet, The World Wide Web, digital television, interactive kiosks and videophones are doing with the need for visiting shops. With all the technological advances, the way business is conducted has been altered dramatically. The internet has been described as the most important innovation since the development of the printing press, which may radically transform not just the way individuals go about conducting their business with each other, but also the very essence of what it means to be a human society.
The reasons for a company to get involved in internet commerce can be classified into the short term and long term. In the short term, the internet enables organizations to reach new customers and create more intimate relationships, or e-relationships, and it also enables reduction in distribution and customer service costs. Over the long term, the internet may well change the structure of the competitive landscape.
In the era of network or relationship marketing, just-in-time delivery, maintaining effective communications with all stakeholders, the internet provides various low-cost tools to improve on-going communications. It has been argued that competitiveness in an on-line world lies at successful creation and management of virtual community involving customers, suppliers, partners and competitors. Further more, effective exploitation of the internet and electronic information would occur if organizations viewed technology as a foundation
stone upon which to build closer relationship with customers.
Relationship Marketing (RM) is about establishing, maintaining, enhancing and commercializing customer relationships through promise fulfillment. It has a long-term customer orientation, involving ongoing interactive communication between a firm and selected stakeholders and focuses on individual customers with the intention of retaining them rather than always looking for new ones. Despite the considerable literature on relationship, marketing it will remain underdeveloped until its key dimensions have been identified and operationalised. The identification of the key dimensions of relationship marketing orientation (RMO) is important because it is no longer sufficient to advise practitioners or researchers that the key to successful marketing is through relationship marketing without providing information on what dimensions actually constitute relationships on which RMO can be considered to exist. Considering higher educations institutions as service originations there are gaps in the research in this sector, in particular, as to how the internet can be used to enhance university student relationship.
This paper will examine literature on the internet, internet marketing, customer relationship marketing and website design to better understand how relationship between a university and students can be enhanced using the internet. Using case study approach the paper will analyse the Leeds Metropolitan University website to identify the relational drivers adopted and make recommendations based on the mainstream internet literature to further improve the websites for relationship building.
I n t e r n a t i o n a l J o u r n a l o f M a n a g e m e n t C a s e s
262
Keywords: e-learning, higher education, relational drivers, website design
Introduction Relationship Marketing (RM) is about establishing, maintaining, enhancing and commercializing customer relationships through promise fulfillment. The identification of the key dimensions of relationship marketing orientation (RMO) is important because it is no longer sufficient to advise practitioners or researchers that the key to successful marketing is through relationship marketing without providing information on what dimensions actually constitute relationships on which RMO can be considered to exist. Considering higher educations institutions as service originations there are gaps in the research in this sector, in particular, as to how the internet can be used to enhance relationship between a university and its students.
MethodologyThis paper will examine literature on the internet, internet marketing, customer relationship marketing and website design to better understand how relationship between a university and students can be enhanced using the internet. Using a case study approach the paper will present the findings of a primary research using observation and analysis exercise of the Leeds Metropolitan University website carried out by fifteen final year undergraduate students in the International Faculty. The students used a relational dimension measurement instrument for the exercise where each relational driver was analysed and given a score on a scale to 0-6 (0 being nothing was observed concerning that relational driver on the website and 6 being excellent evidence observed concerning the respective relational dimension. Students also described and commented against each dimension what they observed. The exercise was carried out for approximately one hour in a computer lab on the 7th of February, 2007.
Internet in Higher EducationThere has been a growing debate regarding the use of information and communication technologies (ICTs) for teaching and learning within universities. In particular, higher education has experienced some radical changes since the
advent of the Internet and the potential of ICTs in higher education is well documented and has been much promoted by policy makers and enthusiasts within the sector.
Reviewing the literature on the internet in higher education it was found that majority of the research that has been conducted examines it from the university or academics perspectives in the area of distance learning courses or alumni. For example: Chan and Welebir (2003), Eynon (2005) and Lairson (1999).
Nevertheless, recently, there is a growing body of research that is concentrating on the use of the Internet as an e-learning medium through platforms such as WebCT and Blackboard to support distance learning and classroom learning. However, for students, besides e-learning, the university website may also be used for personal and university announcements, student interest pages, links to other websites of interest to students both internally and externally to the university, socialising links, help, student blogs, fee payment, library, web forums, email, careers and employability and calendar. On the other hand, it may be argued that these facilities on a university website are available to support directly or indirectly the e-learning experience of the student and therefore can be included as an integral part of e-learning environment.
E-Learning Environment in HE Most of the definitions of e-learning are deliberately broad and therefore there is a lack of a widely accepted definition of what is e-learning. As the focus of this paper is relationship marketing on the internet the researcher believes that e-learning is simply the learning delivered or received mainly through the internet, intranet or extranet.
Holmes and Gardner (2006) state that e-learning offers new opportunities for both the educator and learner to enrich their teaching and learning experience through virtual environments that support not just the delivery, but also the exploration and application of information.
Electronic learning does enable HE institutions the potential to further facilitate student relationship and therefore impact positively upon student development.
263
I n t e r n a t i o n a l J o u r n a l o f M a n a g e m e n t C a s e s
Relational Drivers Applied on Leeds Metropolitan University Website
The identification of the key dimensions of relationship marketing is important because it is through understanding these dimensions that relationships could be developed and made successful. From the literature research in relationship marketing, customer relationship management, marketing communications, consumer behaviour, internet marketing, e-commerce and higher education the following key relational drivers were identified that could be applied on a university website:
Customer orientation;•
Service quality; •
Experience;•
Trust; •
Shared values;•
Communication;•
Satisfaction; •
Commitment; and •
Loyalty•
Customer OrientationThe debate of regarding students as customers (or consumers) has been evident in the education and marketing literature for several years. (Conway et al. 1994; Driscoll and Wicks 1998; Comm and Labay 1996; Licata and Frankwick 1996). Over three decades ago Kotler (1971, 1972) and later Kotler and Andreassen (1987) believed that when universities face falling demand they should focus on the customer (i.e. the student) and remarket the product (i.e. education). More recently, Seeman and O’Hara (2006) add to this argument by stating that viewing students as customers provides a competitive advantage for higher education institutions and enhances their ability to attract, retain and serve its customers.
Applying to the Leeds Metropolitan University WebsiteThe university website needs to be designed with a customer orientation policy thought out at a corporate level. Therefore, the website should be designed with the student needs in mind. These include that the website is easy to navigate, user friendly and updated daily. Developing e-learning courses that support face-to face-teaching, provide flexibility and enhance student job prospects and are not simply traditional lecture notes posted on to WebCT. In addition, the website should have platforms available to support many-to-many communication between staff and students as well as between students and students using E-mail, real time chat rooms and discussion group. Student queries should be responded by tutors and admin staff quickly as possible. In short, in applying the principles of one-to-one marketing the university website needs to be sympathetic to the student’s individual needs.
The student portal on the Leeds Metropolitan University website is popular with most students taking part in the exercise. They made the following comments:
PositiveInternal relationship marketing: being able to • access modules through WebCT, email facility, library online, help zone, student personal information available to students
Mission statement available on the student • portal
Achievements of past and current students • presented on the home page.
Places the customer at the heart of the • organisation
Home page shows the university as part • of Leeds , part of the local community with several facts and pictures
Use friendly website: easy to navigate, most • relevant categories listed on the home page
Appealing design: use of university colours • (Purple and green) with white background, logo, simple and clear

I n t e r n a t i o n a l J o u r n a l o f M a n a g e m e n t C a s e s
264
1-2-1 specific: the student portal addresses the • students by name
Offers flexibility: available to students 24/7 • and accessible from inside and outside the university
Regularly up-dated: various images and • information on the website are updated daily
Areas for improvementStudent portal home page takes too long to • load
Security certificate needs to be rectified •
The logo could be enlarged•
No customer orientation policy on the website•
The website scored well from a customer orientation point of view with an average score of 4.5 (Very Good/ Good). One student quoted the university mission statement:
It can be concluded that even though the university does not have a customer orientation policy or refers to students as students but the website is designed around the student.
Service quality Christopher (1991) provides a simple definition of service quality as: “the ability of the organisation to meet or exceed customer expectations”. In this context customer expectations may be defined as the desire or wants of consumers, i.e. what they feel a service provider should offer rather than would offer. In service organizations, as customer expectations are highly dynamic and complex in nature, service providers need to think different about their business in contrast to their manufacturing counterparts who produce tangible goods.
Customer satisfaction should be made the goal and ultimate measure of service quality. In today’s world of intense competition satisfying the customer may not be enough.
Applying to the Leeds Metropolitan University Website
The students made the following comments regarding the service quality on the university website.
PositiveReliable: up-to-date information, references of • facts stated
Supports many-to-many communication: • staff phone directory available, email facility available through the student portal & WebCT
Assessment marks available on WebCT•
Online help desk available•
Response period stated for queries•
The website is welcoming•
Information about the university available from • A-Z search
Students can give feedback about the website • by filling in a feedback form
Availability of student e-learning platforms: • WebCT and Skills for Learning
Easy to navigate •
Online library & timetables available•
Help Zone•
Student union offerings•
There were no areas of improvement suggested by the students. The average score awarded for the service quality elements was 4 (Good). This further demonstrates that the service quality aspect of the university website is acknowledged by the students. This, however, does not mean that there is no room for improvement.
ExperienceParties involved in a relationship must have positive experiences in order to reach the required overall level of satisfaction over a period of time and develop the relationship further. Negative experiences may, of course, hinder the relationship, or even lead to customer defection. Furthermore, one tends to remember best the last experience. Thus one positive experience may be

265
I n t e r n a t i o n a l J o u r n a l o f M a n a g e m e n t C a s e s
sufficient to alter perceptions of more than one preceding negative experience, and vice versa. This suggests the important influence experience can have on customer satisfaction and, the more satisfied the customer, the more durable the relationship. Storbacka et al. (1994) believes that customer satisfaction can be experienced at both an episodic and at a more general relationship level.
Applying to Leeds Metropolitan University Website Therefore it follows that students must have positive episodic experiences on the university website during their course of study in order to develop the relationship with the university. Unfortunately, according to Bonk (2004) currently most online learning tools focus on recording and facilitating student enrolments and reporting progress and completions, not on engaging learners in rich, interactive experiences. Bonk and Dennen (2003) state that there is a need for motivationally engaging content. They continue by pointing out that there is a need to know how to build effective interaction, collaboration, and engagement with online technologies. Furthermore, the availability of materials that support their learning experience, such as up-to-date time table for both staff and students available online.
The students made the following comments about their experiences on using the Leeds Metropolitan University website
PositiveContains relevant and engaging content in • relation to the university, students, courses, and campus news
Provides academic as well as socialising • related information
Offers interaction facilities with the university, • lecturers and other students
Effective and informative website •
Submission of assignments and feedback • on assessments could be received through WebCT
Areas for improvementTraining on using WebCT and other online • tools needs to be improved for students at the start of the course.
More use could be made of the online forums • and notice boards to enhance social bonding
The average score awarded for the experience is 5 (Very good). This demonstrates that student have an overall positive experience by using the university website.
TrustTrust is generally ill defined, (Egan 2004), but is often taken to mean “an acceptance of vulnerability to another’s possible, but not expected , ill will or lack of good will” (Blois 1997:58). Another commonly cited definition of trust states that trust is a willingness to rely on a partner in one whom one has confidence. Mooreman et al. (1992). The initial wave of studies in e-commerce demonstrate that perceived risk of using the Internet has been a major deterrent to the take up of the Internet. The problems include concerns about credit card and personal details security. These problems can be expressed as one of trust. Empirical studies carried out by Mukhergee and Nath (2003) attempted to identify the antecedents of on-line trust.
The Mukherjee and Nath research is based on Morgan and Hunt’s (1994) commitment and trust theory and focuses on conceptualising trust in online relationship banking. The main findings of the study were:
Shared Value. This is the most significant • determinant of trust and this has a significant positive influence on relationship commitment; within shared values privacy, security and ethics are important variables. Organisation can introduce customer oriented information policy models which will allow the customers to control their personal information. This will help customers to identify the organisations concern for customer privacy, to check the website’s reliability and trustworthiness.
Communication- this plays a secondary • influence in building trust. Speed of response, quality of information and openness were important.

I n t e r n a t i o n a l J o u r n a l o f M a n a g e m e n t C a s e s
266
Applying to the Leeds Metropolitan University WebsiteIn the context of the university website shared values symbolises the extent to which the university and students share common beliefs on values such as ethics, security and privacy.
Ethical values determine the chances of university providing incomplete course information or divulging confidential personal information about students or selling student information to other organisations. Ethical values also determine that students do not use university’s ICT systems to download or view material which is inappropriate and obscene. Mechanism such as the Data Protection Act and the university’s own rules and regulations can build trust by addressing security and privacy concerns.
The students made the following comments regarding shared values on using the Leeds Metropolitan University website:
Positive To access the student portal requires the • student’s username & password
Disclaimer link at the bottom of the home page. • Clicking on this takes the user to the Terms and Condition of Use Page. This page has details on privacy policy, use of web material, limitation on the type and use of the website, moral rights, advertising, privacy /cookies, contracts and links to other websites.
To access the privacy statement further • requires username and password entry
University ethics policy stated •
University regulation policy stated•
Secure internet surfing•
Secure payment of fees•
The website enables many-to-many • communication facilities
Personalisation of the student portal•
Response time to queries is stated•
Up to date and correct information available•
‘Update my Data’ link. This allows students to • update their personal information
There were no areas for improvements that were suggested. The average score awarded for trust was 5 (Very Good). Once again this demonstrates that the students trust the university website for security, privacy and the general communication possibilities it allows through the various channels such as email, discussion forums, telephone directory and WebCT.
SatisfactionA great deal has been written on satisfaction as an important outcome variable to successful relationship. As discussed in the previous sections it has links with experience, trust and commitment. The writer, Hocutt (1998), also links satisfaction with commitment and trust. Although she proposes that trust directly influences commitment, she also sees the relationship between trust and commitment as being mediated by both satisfaction with the service provider and relative dependence. Satisfaction, then, is an important component of relationships, both in its own right and in the way it can influence other components.
Applying to the Leeds Metropolitan University websiteThe students made the following comments about their satisfaction of the university website:
PositiveMeets and in some cases exceeds the needs • of the students
Happy and content•
Most of the students use it on a regular basis•
Promise fulfilment•
Gives hope and positive feelings towards the • university and prospects after graduation
Relevant content•

267
I n t e r n a t i o n a l J o u r n a l o f M a n a g e m e n t C a s e s
Areas for improvementLack of dynamism and inspiration from the • website
Homepage is pleasant but there is something • not quite right- a nagging feeling that it could be better
The home page is too structured.•
Too much information on the home page•
The average score awarded for the satisfaction was 4 (Good). It appears that students are overall fairly satisfied with the university website.
CommitmentVarious researchers have elaborated upon the dependence of commitment on a successful relationship. Egan (2004, 2000) suggested that commitment is central to relationship marketing. Hocutt (1998) views commitment as an intention to continue a course of action or activity or the desire to maintain a relationship. This is often indicated by an ongoing investment into activities which are expected to maintain the relationship. (Blois, 1998).
Mukherjee and Nath (2003) proposed that the degree and length of association and sense of belonging are the dimensions of commitment.
Applying to the Leeds Metropolitan University website
The length and degree of belonging as well as a sense of belonging in an HE e-learning context is depended upon on the length of the course, the students overall experience during the course of study and their emotional attachment to the university.
The students made the following points regarding commitment:
PositiveUsed the university website and email through • out the duration of the course
The option of being part of the alumni•
The option of using the university email and • website after the graduation
The average score awarded for commitment was 4 (Good). This is a good indication that students are fairly committed to the university through its website and may continue to demonstrate commitment after their graduation.
LoyaltyAccording to Oliver, (1999) customer loyalty is defined as a deeply held commitment to re-buy or re-patronise a preferred product/service consistently in the future, thereby causing repetitive same-brand or same brand-set purchasing, despite situational influences and marketing efforts having the potential to cause switching behavior. In other words by enhancing on the relationship building partnerships between students and their universities will increase loyalty amongst the two as well as success. Loyalty revolves around commitment towards a service provided and a decision is taken whether that commitment remains in the near future
Applying to the Lees Metropolitan University Website Loyalty together with trust is two very important relational drivers in developing a relationship. It is the willingness to rely on an organisation such as a university its reliability and integrity that their students have confidence in. Loyalty refers to when good high-quality service is delivered (the core) and how it is delivered (the relational) by the university and its staff members. Understanding the expectations and needs of the students and getting to know their strengths and weaknesses will ensure their continued loyalty.
Conclusion The paper has shown by analysing the Leeds Metropolitan University website that in order to develop relationship with students relational drivers such as customer orientation, service quality, experience, trust, shared values and communication are needed to achieve student satisfaction, commitment and loyalty. When a community of people will meet together regularly by participating in newsgroups, chat forums at

I n t e r n a t i o n a l J o u r n a l o f M a n a g e m e n t C a s e s
268
the university web site, a type of social bond that builds relationship between the university and its students can be expected. Furthermore, the availability of chats, bulletin board system as well as voice and video conferencing facilities on the internet will also provide the chance for universities to have online meetings or conferences with their students, no matter geographically where they are. As a result, understanding and implementation of these variables will enable universities to enhance student loyalty during and after their course.
ReferencesBlois, K.J. (1998), Don’t all firms have relationships, Journal of Business and Industrial Marketing, Vol.13, No.3, pp 256-270
Blois, K.J. (1997) When is a relationship a relationship? in Gemünden, H.G., Rittert, T. and Walter, A. (eds) Relationships and Networks in International Markets. Elsevier, Oxford, pp53-64
Bonk, C. J. (2004) The Perfect E-Storm- emerging technology, enormous learner demand, enhanced pedagogy, and erased budgets, Part 2: Storm No.3 & 4, June, The Observatory on Borderless Higher Education, London.
Bonk, C.J., and Dennen, V. (2003) Frameworks for research, design, benchmarks, training and pedagogy in Web-based distance education, In M.G. Moore & B Anderson (Ed.), Handbook of distance education, pp331-348. Mahwah, NJ: Lawrence Erlbaum Associates
Chan, S.P. and Welebir, B. (2003) Strategies in e-education, Industrial and Commercial Training, Vol.35, No. 5, pp. 196-202
Christopher, M., Payne.A, Ballantyne. D, (1991) Relationship Marketing- Bringing quality, customer service and marketing together, Butterworth Heinemann, Oxford
Comm, C. L. and LaBay, D. G. (1996) Repositioning colleges using changing student quality perceptions: An exploratory analysis, Journal of Marketing for Higher Education, Vol. 7, No. 4, pp21-34
Conway, T. and Swift, J.S., (2000), International relationship marketing- The importance of psychic distance, European Journal of Marketing, Vol. 34, No.11/12, pp1391-1413
Conway, T., Mackay, S. and Yorke, D. (1994) Strategic Planning in Higher Education- Who are the customers, International Journal of Educational Management, Vol. 8, No. 6, pp29-36
Driscoll, C. and Wicks, D. (1998) The Customer-Driven Approach in Business Education: A Possible Danger? Journal of Education for Business, Sept/ Oct, pp 58-61
Eynon, R (2005) The use of the internet in higher education- Academics experiences of using ICTs for teaching and learning, Aslib Proceedings: New Information Perspectives, Vol.57, No.2, pp.168-180
Egan. J. (2004) Relationship Marketing: Exploring relational strategies in marketing, 2nd ed, Prentice Hall, London
Egan. J. (2000), Drivers to relational strategies in retailing, International Journal of Retail & distribution Management, Vol.28, No.8, pp 279-386
Hocutt, A.M., (1998) Relationship dissolution model: antecedents of relationship commitment and the likelihood of dissolving a relationship, International Journal of Service Industry Management, Vol. 9, No.2, pp89-200
Holmes, B. and Gardner, J. (2006) e-Learning: concepts and practice, London, Sage publications
Kotler, P. (1971) Defining the limits of marketing, Journal of Marketing, July, pp48-56
Kotler, P. (1972) A generic concept of marketing, Journal of Marketing, April, pp 46-54
Kotler, P. and Andreassen, A. R. (1987) Strategic Marketing for nonprofit organisations, 3rd ed, Prentice Hall, Englewood Cliffs
Lairson, D.T., (1999) Rethinking the `course` in an online world, Campus-Wide Information Systems, Vol. 16, No.5, pp.186-89
Licata, J. and Frankwick, G. L. (1996) University marketing: a professional service organisation perspective, Journal for Marketing Higher Education, Vol. 7, No. 2, pp1-16
Moorman, C., Deshpande, R. and Zaltman, G. (1992) Factors affecting Trust in a Market Relationships, Journal of Marketing, No.57, Jan, pp. 81-101

269
I n t e r n a t i o n a l J o u r n a l o f M a n a g e m e n t C a s e s
Morgan, R.M. and Hunt, S.D, (1994) The commitment –trust theory of relationship marketing, Journal of Marketing, Vol.58, No.3, pp20-38
Mukherjee, A and Nath, P. (2003) A model of trust in online relationship banking, International Journal of Bank Marketing, Vol. 21, No. 1, pp5-15
Seeman, D.E. and O’Hara, M. (2006) Customer Relationship Management in higher education- Using information systems to improve the student
–school relationship, Campus-Wide Information Systems, Vol. 23, No. 1, pp. 24-34
Storbacka, K., Strandvik, T. and Grönroos, C. (1994) Managing customer relations for profit: the dynamics of relationship quality International Journal of Service Industry Management, Vol.5, pp21-38
www.leedsmet.ac.uk; [accessed 7/02/2007]
I n t e r n a t i o n a l J o u r n a l o f M a n a g e m e n t C a s e s
270
EUROPEAN AIR NAVIGATION SERVICE PROVIDERS AT THE CROSSROADS
THORSTEN QUENDTZEMENTOL GMBH, AUSTRIA
CLAUDIO VIGNALILEEDS METROPOLITAN UNIVERSITY, UK
HANS-RÜDIGER KAUFMANNINTERCOLLEGE, CYPRUS
Abstract
The safe, fast, and cost-optimised transport of persons and cargo is a key need for the modern, internationalised European economies. Any dysfunction of the air transport system could profoundly harm the economic development while economic slumps or catastrophic impacts (e.g. SARS, 9/11, bird flue) will directly impact the air transport system.
The European Air Navigations Service Providers (ANSP) form an integral part of the air transport industry. While other parts of the industry have been privatised, the ANSPs remain government agencies or public companies covering their control areas defined by national boundaries.
The important cost pressure on airlines is transmitted to ANSPs, since the air navigation service (ANS) charges account for 5 to 10% of the airlines operating cost. Further indirect cost is caused to airlines by operational bottlenecks of the ANSPs, resulting for example in suboptimal aircraft routing or holding patterns. The cost pressure is accompanied by capacity pressure and safety questions, since a doubling of European air transport has been forecasted until 2020. Budget restraints of most European governments and inefficiencies of the current ANS-system demand for new technical and organisational approaches, privatisation and deregulation being one.
Various interdisciplinary aspects arise when analysing the complex ANS-industry. Potentially significant approaches and models might be provided for example by micro economics, ethics, public goods and privatisation theories, nevertheless there does not exist a holistic model
to analyse the privatisation and deregulation of European ANSPs.
The paper is based on literature research and comprehensive documentary analysis.
Keywords: air transport, air navigation service, ANSP, privatisation
The Signifi cance of ANSPs for the Air Transport System
The Structure of the word-wide Air Transport SystemThe air transport system operates from entering the departure until leaving the destination airport. It covers three major needs: transport of passenger for business and leisure purposes as well as air cargo transport (EU, 2000). Passenger transport generates more than 90% of total airline revenues (IATA, 2005).
Based on Porter’s value chain concept (Porter, 1985) the air transport system can be broken down into the air transport industry and its supply chain:
a. Air transport industry with two distinct sectors:
The aviation sector covers all activities serving • directly the air transport of passengers and cargo. This sector constitutes the core value chain of air transport, with the airlines being customers of airports and ANSPs.
There exist more than 130 European airlines, • which compares to about 900 airlines word-

271
I n t e r n a t i o n a l J o u r n a l o f M a n a g e m e n t C a s e s
wide (Forum of Air Transport Stakeholders, 2003; ATAG, 2005). Airlines operate on a widely liberalised EU market (EC, 2006b; Saß, 2005) and are to a large extent in private ownership.
About 450 European airports and 1.670 • airports word-wide are in operation (Forum of Air Transport Stakeholders, 2003; ATAG, 2005). The privatisation of airports started during the 90s (Ter Kuile, 2002).
There exist 47 ANSPs in Europe (160 world-• wide), all but one (NATS UK) being public agencies or corporations (IATA, 2006b; GAO, 2005; Zetsche, 2004).
The aerospace sector is composed of aircraft • equipment manufacturers (e.g. Boeing and EADS), and maintenance providers.
b. Air transport supply chain
Various direct and indirect suppliers (e.g. construction and food), manufacturers (e.g. information technology) and service providers linked to the air transport industry generate indirect economic effects.
The total economic impact of the European air transport system can be estimated on basis of macroeconomics. The spending of the direct employees as well as induced and catalytic economic effects of the air transport industry and its supply chain on other industries have to be considered: e.g. air transport is the principle means by which tourist access some European countries. Therefore air transport is an important prerequisite for the EU tourism sector which accounts for 5% of total European employment (equivalent to 8 million persons) and GDP (ACI, 2004).
The economic and social Importance of the European Air Transport SystemAir transport provides the only worldwide transportation network (ATAG, 2005). It facilitates cultural exchanges, business and leisure opportunities as well as the development of
international institutions and relationships (EU, 2001). The increasing globalisation of the European economy, cross investments between European countries and the rest of the world, and the rapid carriage of people and high-value goods over long distances have both driven and been driven by air transport (ACI, 2004) Therefore the air transport system has become an indispensable part of the whole European economic infrastructure (EU, 2001).
The European air transport industry increases the GDP mainly by directly employing about 1.5 million persons. Taking into account indirect and induced economic effects, employment generated is estimated to be around 4.2 million persons. The related GDP amounts to USD 274 billion or 2.2% of the EU25’s GDP in 2004. Further catalytic and spin off effects like the contribution to world trade, stimulation of tourism and significant tax payments have to be added (ATAG, 2005). Other sources put the annual contribution of air transport to the European GDP to EUR 220 billion or 1.5% of the European GDP and the employment generated to 3 million (EUROCONTROL 2006a; EC, 2006b).
The air transport’s rate of growth is highly correlated to the development of the GDP. Measuring the world-wide air traffic in scheduled passenger-km, macroeconomic theory provides an elasticity of around 1.5 to 2. This is equivalent to a double increase of air transport as compared to a certain augmentation of the world’s GDP (Doganis, 2005; Tarry, 2006).
The Air Navigation Service-IndustryThe ANS-mission is to ensure the safe, regular, efficient and economical operation of air traffic (EUROCONTROL, 2006a). The main tasks of the ANSP are the management of the air traffic, the provision of communication, navigation and surveillance systems, and the delivery of aeronautical information and meteorological services (see table 3). The direct ANSP-customers are airlines, military/ air force and the general aviation.

I n t e r n a t i o n a l J o u r n a l o f M a n a g e m e n t C a s e s
272
Table 1: The Air Transport Industry and its economic Impact
Source: ATAG (2005)
Table 2: European Air Transport Industry Employment and GDP in 2004*
Source: ATAG (2005), *data for EU25 and non-EU countries (e.g. Switzerland) plus former Soviet Union countries
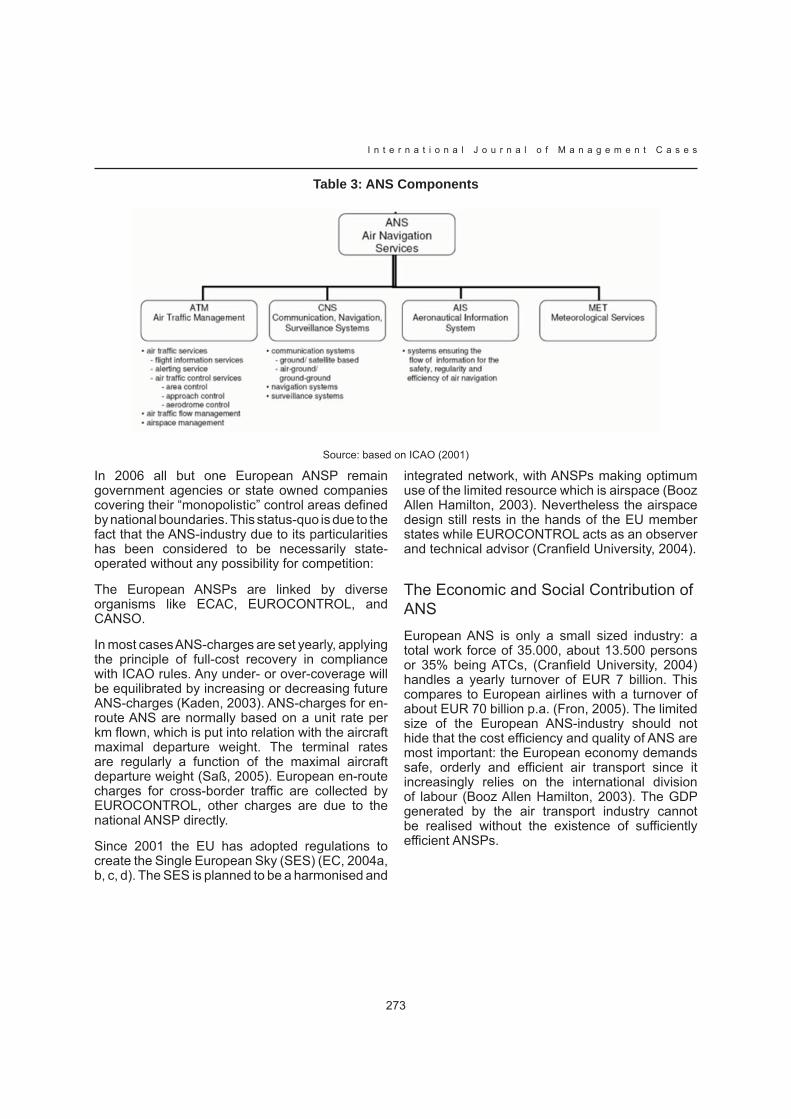
273
I n t e r n a t i o n a l J o u r n a l o f M a n a g e m e n t C a s e s
Table 3: ANS Components
Source: based on ICAO (2001)
In 2006 all but one European ANSP remain government agencies or state owned companies covering their “monopolistic” control areas defined by national boundaries. This status-quo is due to the fact that the ANS-industry due to its particularities has been considered to be necessarily state-operated without any possibility for competition:
The European ANSPs are linked by diverse organisms like ECAC, EUROCONTROL, and CANSO.
In most cases ANS-charges are set yearly, applying the principle of full-cost recovery in compliance with ICAO rules. Any under- or over-coverage will be equilibrated by increasing or decreasing future ANS-charges (Kaden, 2003). ANS-charges for en-route ANS are normally based on a unit rate per km flown, which is put into relation with the aircraft maximal departure weight. The terminal rates are regularly a function of the maximal aircraft departure weight (Saß, 2005). European en-route charges for cross-border traffic are collected by EUROCONTROL, other charges are due to the national ANSP directly.
Since 2001 the EU has adopted regulations to create the Single European Sky (SES) (EC, 2004a, b, c, d). The SES is planned to be a harmonised and
integrated network, with ANSPs making optimum use of the limited resource which is airspace (Booz Allen Hamilton, 2003). Nevertheless the airspace design still rests in the hands of the EU member states while EUROCONTROL acts as an observer and technical advisor (Cranfield University, 2004).
The Economic and Social Contribution of ANSEuropean ANS is only a small sized industry: a total work force of 35.000, about 13.500 persons or 35% being ATCs, (Cranfield University, 2004) handles a yearly turnover of EUR 7 billion. This compares to European airlines with a turnover of about EUR 70 billion p.a. (Fron, 2005). The limited size of the European ANS-industry should not hide that the cost efficiency and quality of ANS are most important: the European economy demands safe, orderly and efficient air transport since it increasingly relies on the international division of labour (Booz Allen Hamilton, 2003). The GDP generated by the air transport industry cannot be realised without the existence of sufficiently efficient ANSPs.

I n t e r n a t i o n a l J o u r n a l o f M a n a g e m e n t C a s e s
274
Table 4: Particularities of the ANS-industry
Source: author
Challenges to the European ANS-SystemDuring past decades the progress of air transport was based on the development of new aircraft (“higher, further, faster”). Nowadays the development of the air transport system has become prior (“more affordable, safer, cleaner, quieter”). The competition in the air industry has changed from airlines and their alliances to the competition of systems composed out of airlines, airports and ANSPs. Efficiency and the quality of cooperation between those parties as well as the regulatory and political surrounding constitute decisive success factors (Lufthansa, 2006). Therefore the European ANS-customers exert pressure on the ANSPs to simultaneously optimise capacity, cost, and safety.
The Capacity ChallengeIn absolute terms about 1.9 billion passengers and 38 million tons of cargo were transported by air in 2004 (ICAO, 2005), with Europe accounting for about one third of this market (Airbus, 2004). Since 1995 worldwide passenger air transport has increased by 45% (see table 5), while air cargo transport has grown by over 80% (ATAG, 2005). From 1980 until 2000 the European demand for air travel had tripled (Forum of Air Transport Stakeholders, 2003). Negative impacts like 9/11, the 3rd Gulf War, and SARS have temporarily overridden this positive long-term development (Hirschhausen, 2004), but average yearly increases of around 5% have been forecasted for the period from 2005 to 2025 (Airbus, 2004; Boeing, 2005).
The demand for ANS is closely correlated to the demand for air transport and can be expressed by the number of Instrument Flight Rules (IFR) flights. European ANSPs are expected to handle an overall increase of 80% in IFR-flight movements until 2025.
The Cost ChallengeSince 2001 world-wide airlines have experienced losses of USD 43 billion (mainly attributable to US-airlines), eliminating all accumulated profits since 1968 (IATA, 2006a). Further losses of USD 1.7 billion have been forecasted for 2006 (IATA, 2006b).
IATA holds inefficiencies and monopolistic power in the airlines supply chain to be responsible for the losses. Certain sectors of the value chain with a niche character (e.g. computer reservation systems), intermediaries with high pricing power (e.g. fuel suppliers) or monopolistic structures (e.g. airports) show excess rates of return on investment as compared to investments of equal specific risk (IATA, 2006a). Since most potential efficiency increases have been realised by airlines and the market does not allow for price increases, airlines endeavour to transmit their cost pressure on other parts of the value chain, like ANSPs.
ANS charges amounted to EUR 7.0 billion in Europe or about 6% of the airline ticket prices in 2004 (EUROCONTROL, 2006a; EC, 2006b). Additional indirect costs are caused to airlines by operating bottlenecks of the air transport system, resulting for example in non-efficient air routes and waiting times. The cost of inefficient routing for airlines is estimated to be EUR 1.0 to 1.5 billion p.a. in Europe (EUROCONTROL 2006a; Fron, 2005). In 2003 flight delays caused 350.000 unnecessary flight hours, while 50% of the delays were attributed to ANS (Hirschhausen, 2004). The associated costs have been estimated by the European Commission to be EUR 5.4 billion p.a. while other sources come up with EUR 10 billion p.a. (Ewers/ Tegner, 2002). The cost of flight delays exceeds the airlines cost for en-route ANS-charges (Klingenberg, 2001).
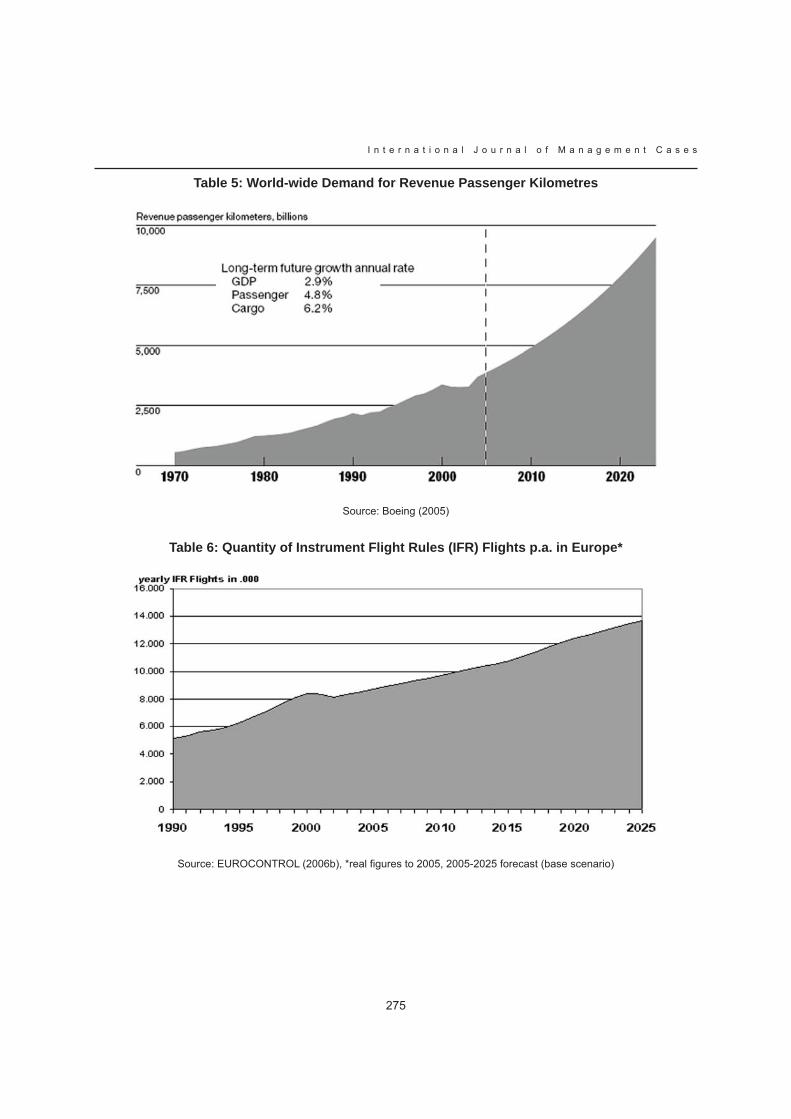
275
I n t e r n a t i o n a l J o u r n a l o f M a n a g e m e n t C a s e s
Table 5: World-wide Demand for Revenue Passenger Kilometres
Source: Boeing (2005)
Table 6: Quantity of Instrument Flight Rules (IFR) Flights p.a. in Europe*
Source: EUROCONTROL (2006b), *real figures to 2005, 2005-2025 forecast (base scenario)

I n t e r n a t i o n a l J o u r n a l o f M a n a g e m e n t C a s e s
276
Table 6: Net Profits and Profitability of Airlines world-wide
Source: Pierce (2006)
Table 7: Comparison of European and US-ANS
Source: Zetsche (2004), EUROCONTROL (2006a), *without MET cost
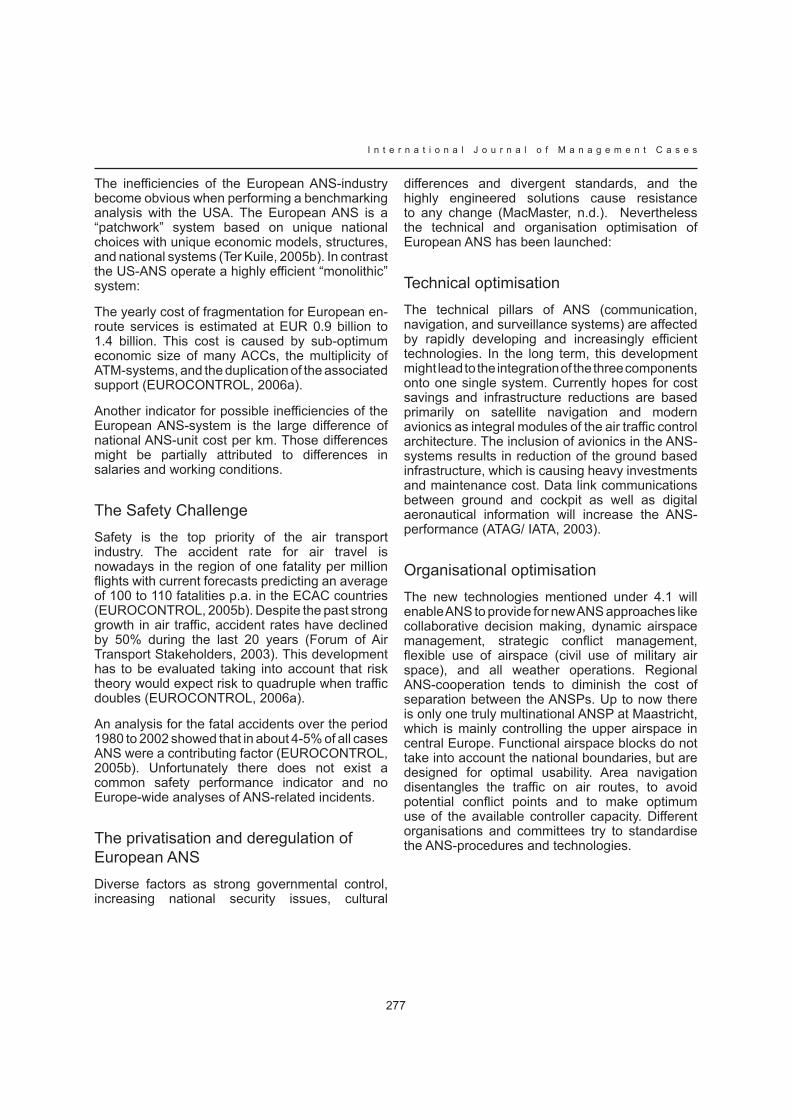
277
I n t e r n a t i o n a l J o u r n a l o f M a n a g e m e n t C a s e s
The inefficiencies of the European ANS-industry become obvious when performing a benchmarking analysis with the USA. The European ANS is a “patchwork” system based on unique national choices with unique economic models, structures, and national systems (Ter Kuile, 2005b). In contrast the US-ANS operate a highly efficient “monolithic” system:
The yearly cost of fragmentation for European en-route services is estimated at EUR 0.9 billion to 1.4 billion. This cost is caused by sub-optimum economic size of many ACCs, the multiplicity of ATM-systems, and the duplication of the associated support (EUROCONTROL, 2006a).
Another indicator for possible inefficiencies of the European ANS-system is the large difference of national ANS-unit cost per km. Those differences might be partially attributed to differences in salaries and working conditions.
The Safety ChallengeSafety is the top priority of the air transport industry. The accident rate for air travel is nowadays in the region of one fatality per million flights with current forecasts predicting an average of 100 to 110 fatalities p.a. in the ECAC countries (EUROCONTROL, 2005b). Despite the past strong growth in air traffic, accident rates have declined by 50% during the last 20 years (Forum of Air Transport Stakeholders, 2003). This development has to be evaluated taking into account that risk theory would expect risk to quadruple when traffic doubles (EUROCONTROL, 2006a).
An analysis for the fatal accidents over the period 1980 to 2002 showed that in about 4-5% of all cases ANS were a contributing factor (EUROCONTROL, 2005b). Unfortunately there does not exist a common safety performance indicator and no Europe-wide analyses of ANS-related incidents.
The privatisation and deregulation of European ANSDiverse factors as strong governmental control, increasing national security issues, cultural
differences and divergent standards, and the highly engineered solutions cause resistance to any change (MacMaster, n.d.). Nevertheless the technical and organisation optimisation of European ANS has been launched:
Technical optimisationThe technical pillars of ANS (communication, navigation, and surveillance systems) are affected by rapidly developing and increasingly efficient technologies. In the long term, this development might lead to the integration of the three components onto one single system. Currently hopes for cost savings and infrastructure reductions are based primarily on satellite navigation and modern avionics as integral modules of the air traffic control architecture. The inclusion of avionics in the ANS-systems results in reduction of the ground based infrastructure, which is causing heavy investments and maintenance cost. Data link communications between ground and cockpit as well as digital aeronautical information will increase the ANS-performance (ATAG/ IATA, 2003).
Organisational optimisationThe new technologies mentioned under 4.1 will enable ANS to provide for new ANS approaches like collaborative decision making, dynamic airspace management, strategic conflict management, flexible use of airspace (civil use of military air space), and all weather operations. Regional ANS-cooperation tends to diminish the cost of separation between the ANSPs. Up to now there is only one truly multinational ANSP at Maastricht, which is mainly controlling the upper airspace in central Europe. Functional airspace blocks do not take into account the national boundaries, but are designed for optimal usability. Area navigation disentangles the traffic on air routes, to avoid potential conflict points and to make optimum use of the available controller capacity. Different organisations and committees try to standardise the ANS-procedures and technologies.
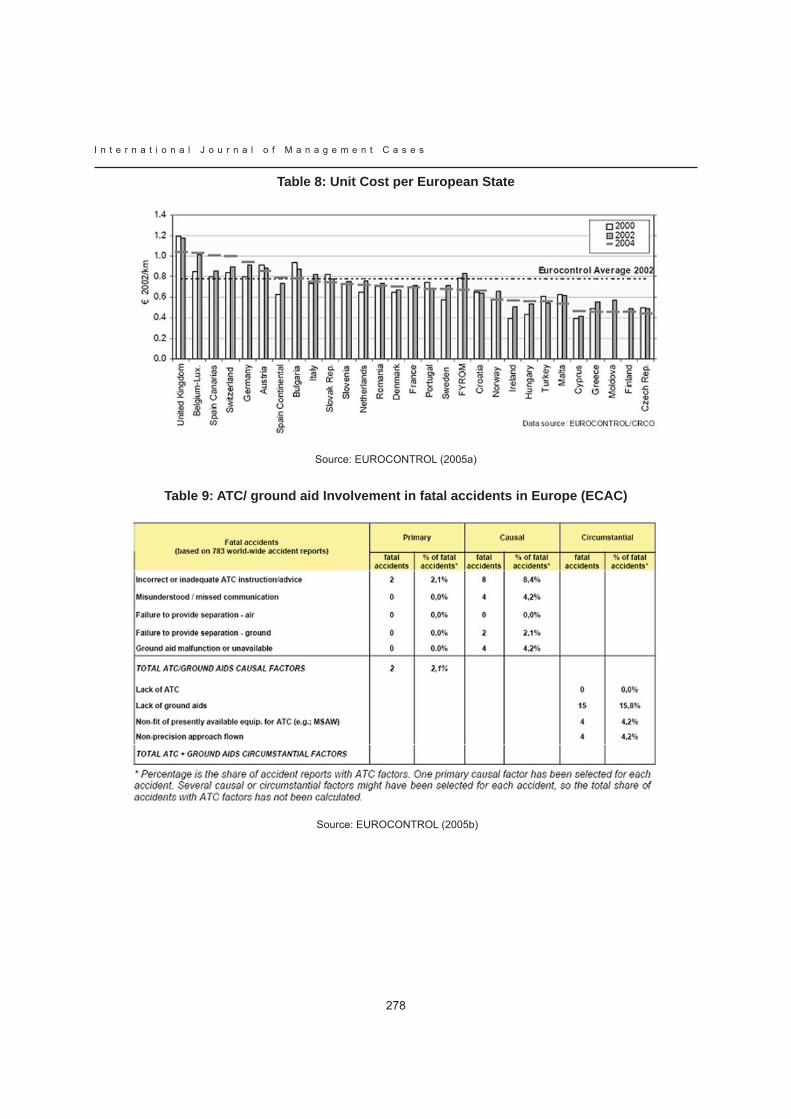
I n t e r n a t i o n a l J o u r n a l o f M a n a g e m e n t C a s e s
278
Table 8: Unit Cost per European State
Source: EUROCONTROL (2005a)
Table 9: ATC/ ground aid Involvement in fatal accidents in Europe (ECAC)
Source: EUROCONTROL (2005b)
279
I n t e r n a t i o n a l J o u r n a l o f M a n a g e m e n t C a s e s
Liberalisation: privatising and deregulating of European ANSThe beginning liberalisation of ANS has been described by CANSO as follows: “A previously unthinkable thing is happening in the world of ANS. What used to be considered an untouchable, purely governmental function is being assigned to authorities having administrative and even often financial autonomy” (CANSO, 1999). European ANSPs still exhibit very different states of governance, ranging from state departments, state agencies, non-profit institutions to privatised for-profit companies (Ter Kuile, 2005a).
Privatisation can be defined as selling at least 50% of the state ownership to private shareholders (Beesley/ Littlechild, 1994; Bishop/Key, 1988). By contrast commercialisation (or corporatisation) has been described as the ability of an organization to act as an autonomous body with greater freedom in conducting its financial affairs, to be self-financing, to be subject to business taxes, and to seek a return on capital (GAO, 2005).
The technical and organisational optimisation will not solve the core problems of European ANS but relieve the distress, only:
The optimisation hits state agencies or enterprises operating national monopolies and setting their prices applying the principles of full-cost recovery. Budget constraints hamper states to invest in optimised ANS-technology, which gets increasingly expensive. Technical and organisational optimisation alone does not abolish the very expensive fragmentation of European ANS (ATAG/ IATA, 2003). Based on a strategic view bilateral or regional blocs of ANSPs might emerge, which can exacerbate fragmentation problems at the wider level. The current cost recovery regime for ANS-charges does no produce microeconomic incentives to deliver performance and awareness to user needs (EUROCONTROL, 2003).
Privatisation and deregulation might solve those problems:
Privatisation will change the public service • aspects of ANS. For example the rather self (than public) motivation of government employees, the possible interference of politicians or the fact, that poor management will not depress the value of the enterprise as
described by the theory of public goods could be abolished (Hinde, n.d.).
Privatisation will allow for M&A-operations • of the European ANSPs. Stakeholders like airlines might acquire shares in ANSPs.
Private companies may find financing on the • capital market in order to acquire more efficient ANS-technologies.
Deregulation will discharge into competition, • destroying detrimental monopoly positions.
Nevertheless it remains unclear if ANSP-privatisation could be a successful (long-term) solution:
Because commercialised ANSP rely on user • charges to cover cost, an industry downturn represents fundamental financial risks (GAO, 2005): the collapse of the transatlantic traffic after 9/11 undermined the finances of NATS, demanding a capital injection (ATAG/ IATA, 2003) to rescue this privatised company from bankruptcy.
Merging ANSP will cause conflicts with national • laws in many EU countries, which exclude the control of ANS by non-nationals. Furthermore carriers acquiring shares in ANSPs following a strategy of vertical integration might contravene competition regulations (Cranfield University, 2004).
Transition costs from a fragmented system to a • de-fragmented one may be substantial or even prohibitive (ATAG/ IATA, 2003).
ANS (or parts of it) might be natural • monopolies (IATA; Hautau, 2006) which should either publicly controlled or operated as proposed by microeconomic theory. In general the technical solutions for ANS cause heavy (sunk cost) investment into equipment and important staff cost and resulting high (in a medium-term perspective) fixed cost. Therefore the typical decreasing average cost curve of natural monopolies might result.
Privatisations may result in increased charges • and not cost savings for the customers due to profit requirements exerted by the new owners. Therefore, investors aiming on financial return might not be appropriate to guaranty the long-
I n t e r n a t i o n a l J o u r n a l o f M a n a g e m e n t C a s e s
280
term development of safe, customer oriented and efficient ANS (Lufthansa, 2006).
The public ownership of ANS might have • important merits (Gaberell/ Friedrich, 2005). E.g. private ANSPs should neither administer a limited good in the possession of a state nor exert police functions (Spiegel, 2006).
Future ResearchExisting scientific concepts and studies are not specific enough and too fragmented to explain if the privatisation and deregulation of European ANSPs might provide a long-term solution for the air transport system. For instance, the value chain concept neither covers any ethical aspects (e.g. increase investments for higher safety and causing lower profitability) nor implications caused by the public ownership of the European ANS-industry or the role of trade unions and civil servants. The potential significance of very diverse scientific concepts seems to render a multidisciplinary approach most promising to establish a holistic model. Furthermore, this model should allow for analyses which privatisation and deregulation methods and strategies should be employed to maximise its success potential. Closing this scientific gap will be the aim of further research.
ANSP must not be the bottleneck limiting future development of the European air transport system and the European economy.
ReferencesACI (2004) The social and economic Impact of Airports in Europe. Study by York Aviation, January 2004. Geneva: ACI.
Airbus (2004) Global Market Forecast 2004-2023. Blagnac: Airbus.
ATAG (2005) The economic and social Benefits of Air Transport. Geneva: ATAG.
ATAG/ IATA (2003) One Sky…global ATM- the Way forward. Geneva/ Montreal: ATAG/ IATA.
Beesley, M./ Littlechild, S. Privatization: Principles, Problems, and Priorities. (1994) In: Bishop, M./ Kay. J./ Mayer, C. Privatization & economic Performance. Oxford/ New York: Oxford University Press.
Bishop, M./ Kay. J. (1988) Does Privatization work? Lessons from the UK. London: London Business School.
Boeing (2005) Economic Market Outlook 2005. Seattle: Boeing.
Booz Allen Hamilton (2003) Study on common Requirements for the Provision of Air Navigation Services Final report. London: Booz Allen Hamilton.
CANSO (1999) Corporatisation of Air Navigation Services. Special report, August 1999. Hoofddorp: CANSO.
Cranfield University (2004) Analysis of the EU Air Transport Industry. Final report. Cranfield: Cranfield University.
Doganis, R. (2005) The Airline Business. 2nd edition. London: Routledge.
EC (2004a) Regulation EC No.549/2004 “Framework Regulation”. Brussels: European Union.
EC (2004b) Regulation EC No.550/2004 “Service provision Regulation”. Brussels: European Union.
EC (2004c) Regulation EC No.551/2004 “Airspace Regulation”. Brussels: European Union.
EC (2004d) Regulation EC No.552/2004 “Interoperability Regulation”. Brussels: European Union.
EC (2006) Air Transport Portal of the European Commission. Available from: http://ec.europa.eu/transport/air_portal/safety/ black_list_en.htm [accessed 02.01.2007].
EU (2000) External Advisory Group: Aeronautics for Europe. Luxemburg: Office for official publications of the European communities.
EU (2001) European Aeronautics: A Vision for 2020 meeting Society’s Needs and winning Global Leadership. Luxemburg: Office for official publications of the European Communities.
EUROCONTROL (2003) PRR 6, an Assessment of Air Traffic Management in Europe during the Calendar Year 2002. Brussels: Performance Review Commission.

281
I n t e r n a t i o n a l J o u r n a l o f M a n a g e m e n t C a s e s
EUROCONTROL (2005a) PRR 8, an Assessment of Air Traffic Management in Europe during the Calendar Year 2004. Brussels: Performance Review Commission.
EUROCONTROL (2005b) SRC Document 2 ATM Contribution to Aircraft Accidents/ Incidents. Brussels: Safety Regulation Commission.
EUROCONTROL (2006a) PRR 2005, an Assessment of Air Traffic Management in Europe during the Calendar Year 2005. Brussels: Performance Review Commission.
EUROCONTROL (2006b) Long-Term Forecast Flight Movements 2006-2025. December 2006. Brussels: EUROCONTROL.
Ewers,H.-J./Tegner,H.(2002)Volkswirtschaftlicher Nutzen durch Wettbewerb im Europäischen Air Traffic Management am Beispiel Deutschland. Berlin: TU Berlin.
Forum of Air Transport Fast Facts. February 2003. Stakeholders (2003)
Fron, X. (2005) ATM Performance and Contributions to Air Transport. The Airline Industry’s financial Crisis. KUL conference. Brussels: EUROCONTROL Performance Review Unit.
Gaberell,R./Fridrich,R.(2005)Air Navigation Services: public Service or „any other business“? Skymag November 2005, No.11, Zurich: Skyguide.
GAO (2005) Air Traffic Control, Characteristics and Performance of selected international Air Navigation Service Providers and Lessons learned from their Commercialisation. Washington: GAO.
Hautau, H. (2006) Luftverkehr im wettbewerbspolitischen Umbruch: Flughäfen und Flugkontrolldienst als natürliche Monopole. Hamburg: University of Hamburg.
Hinde, K. (n.d.) Public Utilities: Privatisation and Regulation. University of Durham Business School. Available from http://www.kevinhinde.com/home.htm [accessed 30.06.2005].
Hirschhausen, C.v. (2004) Privatisierung und Regulierung der deutschen Flughäfen. Deutsche Bank Research Aktuelle Themen No. 291 10.03.2004. Frankfort: Deutsche Bank.
IATA (2005) Fact Sheet Industry Statistics, IATA Corporate Communications 12th September 2005. Geneva: IATA.
IATA (2006a) Value Chain Profitability, IATA Economics Briefing No. 04. Geneva: IATA.
IATA (2006b) Fact Sheet. Available from http://www.iata.org/ pressroom/facts_figures/fact_sheets/economic_social_benefits.htm [accessed 31.01.2007].
IATA (n.d.) Snapshot User Charges. Geneva: IATA.
ICAO (2001) Air Traffic Services Annex 11 to the Convention on International Civil Aviation 13th edition July 2001. Montreal: ICAO.
ICAO (2005) Annual report 2004. Montreal: ICAO.
Kaden, D. (2003) Initiative Luftverkehr für Deutschland. Ausschuß Safety/ Security. Parlamentarischer Abend des Deutschen Verkehrsforums 27.11.2003. Berlin: Deutsches Verkehrsforum.
Klingenberg, C. (2001) Infrastrukturengpässe im Luftverkehr? Seminar Infrastrukturpolitik und –management 27.11.2001. Berlin: TU Berlin.
Lufthansa (2006) DFS-Privatisierung: Know-how eines deutschen Branchenkonsortiums nutzen. Politikbrief Januar 2006. Frankfurt: Lufthansa.
MacMaster, A. (n.d.) AIS Key to Interoperability- Changing Times. Hoofddorp: CANSO.
Pierce, B. (2006) Industry financial Performance improves but Risk drives cautious Outlook. IATA economics. Geneva: IATA.
Porter, M.E. (1985) Competitive Advantage. New York: The Free Press.
Saß, U. (2005) Die Privatisierung der Flugsicherung. Goettingen: Vandenhoeck & Ruprecht.
Spiegel (2006) Köhler stoppt Privatisierung. Spiegel 24.10.2006, Hamburg: Spiegel.
Tarry, C. (2006) Analyst Viewpoint: Managing the Airline economic Cycle. IATA economics June 2006. Geneva: IATA.
I n t e r n a t i o n a l J o u r n a l o f M a n a g e m e n t C a s e s
282
Ter Kuile, A. (2002) Global Developments at ANSPs. Presentation at ICAO Tegucigalpa. Hoofddorp: CANSO.
Ter Kuile, A. (2005a) Industry View on SES Airspace/ ATM Priorities. Edinburgh 18.11.2005. Hoofddorp: CANSO.
Ter Kuile, A. (2005b) The need for Global ANS Harmonisation, IOAC/05. Hoofddorp: CANSO.
Zetsche, F. (2004) Single European Sky. Mehr Freiheit am Himmel? DESY innerbetriebliche Fortbildung 27.10.2004. Hamburg: DESY.
GlossaryACC Air Control Center
ANS Air Navigation Service
ANSP Air Navigation Service Provider
ATAG Air Transport Action Group
ATCO Air Traffic Controler
ATM Air Traffic Management
CANSO Civil Air Navigation Services Organization
CNS Communications, Navigation, Surveillance
DFS Deutsche Flugsicherung GmbH (German ANSP)
EC European Commission
ECAC European Civil Aviation Conference
EU European Union
EUROCONTROL European Organisation for the Safety of Air Navigation
FTK Freight Ton Kilometres
GAO US Government Accountability Office
IATA International Air Transport Organization
ICAO International Civil Aviation Organization
IFR Instrument Flight Rules
MET Meteorology
NATS National Air Traffic Services Ltd. (UK ANSP)
RPK Revenue Passenger Kilometres
SES Single European Sky Initiative of the EU
VFR Visual Flight Rules

283
I n t e r n a t i o n a l J o u r n a l o f M a n a g e m e n t C a s e s
BRAND EXTENSION STRATEGY
TIHOMIR VRANEŠEVIĆUNIVERSITY OF ZAGREB, CROATIA
MIROSLAV MANDIĆUNIVERSITY OF ZAGREB, CROATIA
IRENA PANDŽAUNIVERSITY OF ZAGREB, CROATIA
Abstract
Development of a new brand calls for big investments and managing effort, but with uncertain success, so it is understandable that the most of the new products are actually launched as an extension of existing brand. The basic expectations, which company aims to achieve by brand extension, are business growth and further building of brand image. One way of capitalizing successful brands is using them as presumptions for success in launching a new products and new (sub) brands in the market. Companies often do the extensions because they want to decrease investment in new brands. The question is how successful or unsuccessful will be the new brands if company invests the same amount of money in them as it has invested in «parent» brand. When company plans to launch new product on the market and take the advantages of already existing and often successful brand, it has the following strategic possibilities: brand extension strategy – launching a new product under the existing brand; and brand confirmation strategy – launching a new product under new brand but with support and connection with existing brand. Launching new brand is always followed by risk, which is the main reason why the most of new brands do not realize the expectations of companies, but the biggest problem is that companies often can not easily define the real reasons of failure. Extension of existing brands often seems to be opportune instead building a entirely new brand. Brand extension can be described as process in which the core, essential part, associations and values of basic brand, are transmitted to their extension. Besides the advantages there are certain risks of extension. The main risk is cannibalism inside business portfolio – company does not increase total revenue despite of higher investments, then it comes negative recoil effect to “parental” brand
and watery, erosion of brand i.e. losing the unique significance of basic brand. For avoiding these risks it is needed to control costs (investments) of brand extension and return of investment, allocate the resources on products with higher return (except if products have the supporting and/or “fighting” tasks in business portfolio) and educate the sell staff about the importance, role and specialty of each product in brand extended assortment. Companies which want to make success by “parental” brand extension have to consider that narrow assortment down (withdraw the product) is not just acceptable, even more recommended, depending on market results. This article present different possibilities of brand extension and confirmation as well as of advantages and disadvantages of different approaches.
Keywords: brand extension, extension forms
IntroductionThe basic way for achieving business growth can be accomplished by attracting new clients, creating new ways of using the product and achieving premium prices. (Taylor, 2003, adjusted; Figure 1).
Evident is the transmission (transfer) of image from the basic product to brand extension and vice versa. Intensity of that process can not be conceived easily without research, but it’s intuitively logical. Example of successful extension is Bacardi rum extension to Bacardi Breezer, refreshing drink, prepared for drinking – cocktail with original Bacardi rum, fruit juice and water-which has 5,4% of alcohol. Bacardi Breezer attracted new clients (mostly young people that did not want to drink strong alcohol drinks, vines or beers), offered new options for drinking cocktails (on dance floor, in disco clubs, informal meetings – basic drinking
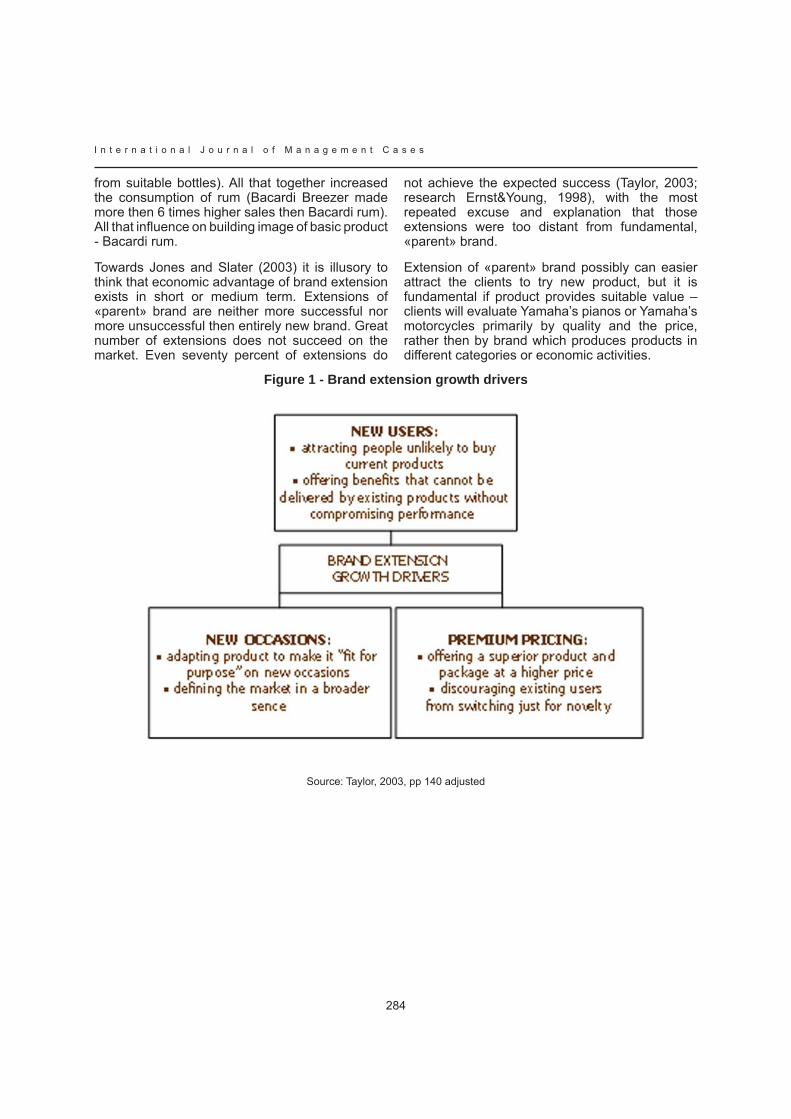
I n t e r n a t i o n a l J o u r n a l o f M a n a g e m e n t C a s e s
284
from suitable bottles). All that together increased the consumption of rum (Bacardi Breezer made more then 6 times higher sales then Bacardi rum). All that influence on building image of basic product - Bacardi rum.
Towards Jones and Slater (2003) it is illusory to think that economic advantage of brand extension exists in short or medium term. Extensions of «parent» brand are neither more successful nor more unsuccessful then entirely new brand. Great number of extensions does not succeed on the market. Even seventy percent of extensions do
not achieve the expected success (Taylor, 2003; research Ernst&Young, 1998), with the most repeated excuse and explanation that those extensions were too distant from fundamental, «parent» brand.
Extension of «parent» brand possibly can easier attract the clients to try new product, but it is fundamental if product provides suitable value – clients will evaluate Yamaha’s pianos or Yamaha’s motorcycles primarily by quality and the price, rather then by brand which produces products in different categories or economic activities.
Figure 1 - Brand extension growth drivers
Source: Taylor, 2003, pp 140 adjusted

285
I n t e r n a t i o n a l J o u r n a l o f M a n a g e m e n t C a s e s
www.47central.com
http://en.wikipedia.org
www.bacardi-breezer.co.uk

I n t e r n a t i o n a l J o u r n a l o f M a n a g e m e n t C a s e s
286
http://oz.irtc.org
http://en.wikipedia.org
www.pipemasters.net
2. Forms and basic rules of extension
There is a difference between brand extension in the same kind of products, that is line product extension (for example: Absolute Vodka to new vodka based: Absolute Lemon, Absolute Mandarin and Absolut Currant), extension in the same category or same activity (Nivea in cosmetics) and extension outside the fundamental business activity (Calvin Klein brand in different businesses – underwear, glasses and fragrances).
Successful extension outside the basic activity can be done in more directions, as in case prestige car brand Porsche, whose new brand Porsche
Design includes clothes, glasses, cameras, home devices; or brand Caterpillar (producer of firs-class agriculture and construction machines) whose new brand CAT includes clothes and foot-wear. The example of these brands shows that brands focused on «philosophy» of living and values which represent (less on products) are more suitable and successful in extension outside the basic activity and product category. It is harder to expect successful brand extension which is more focused on product and not highly differenced from the brand that promotes and represents «philosophy» of living and which is highly differenced from competition’s brands. (Figure 2).
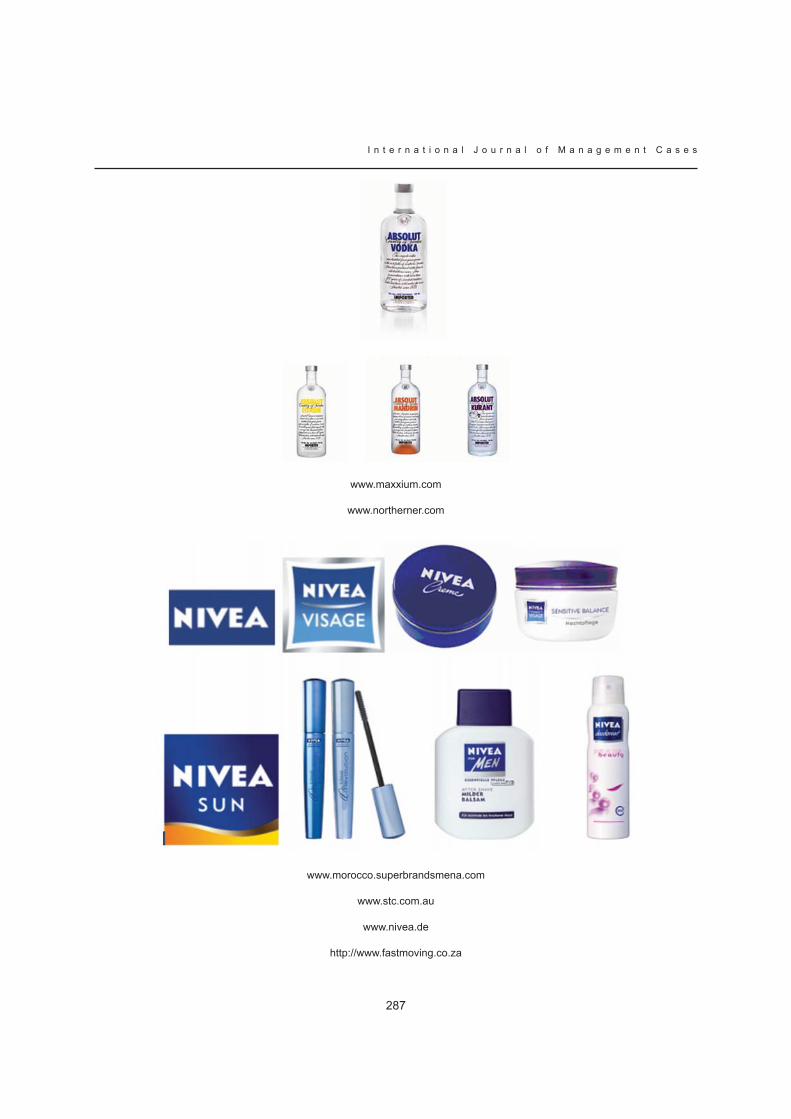
287
I n t e r n a t i o n a l J o u r n a l o f M a n a g e m e n t C a s e s
www.maxxium.com
www.northerner.com
www.morocco.superbrandsmena.com
www.stc.com.au
www.nivea.de
http://www.fastmoving.co.za

I n t e r n a t i o n a l J o u r n a l o f M a n a g e m e n t C a s e s
288
www.pvh.com
Examples of «real» extensions can be CAT shoes (Caterpillar), beer and Harley-Davidson lotion as well as leather products and man cosmetics by Mont Blanc. As it can be concluded, brand extension can move in different directions. Basic
idea of the brand extension starts from positive brand image, which is advantage comparing to competition’s products (or products without the brand) and presumes higher possibility for success of that product on the market.
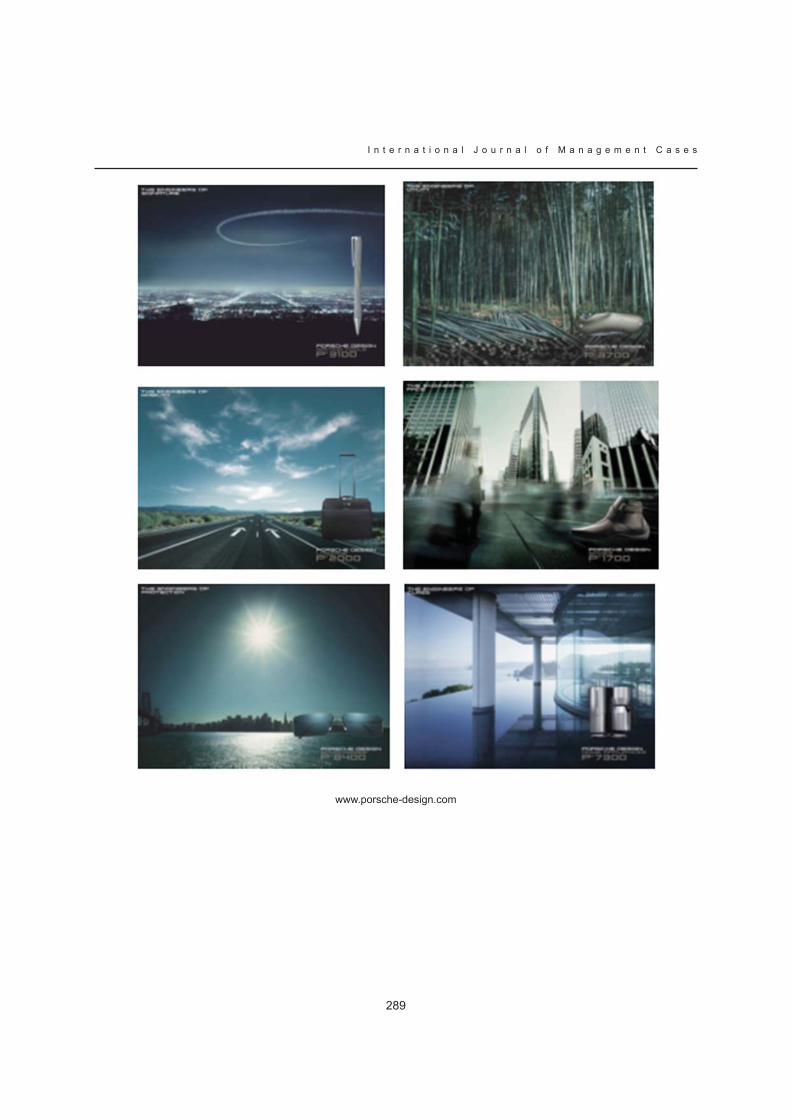
289
I n t e r n a t i o n a l J o u r n a l o f M a n a g e m e n t C a s e s
www.porsche-design.com
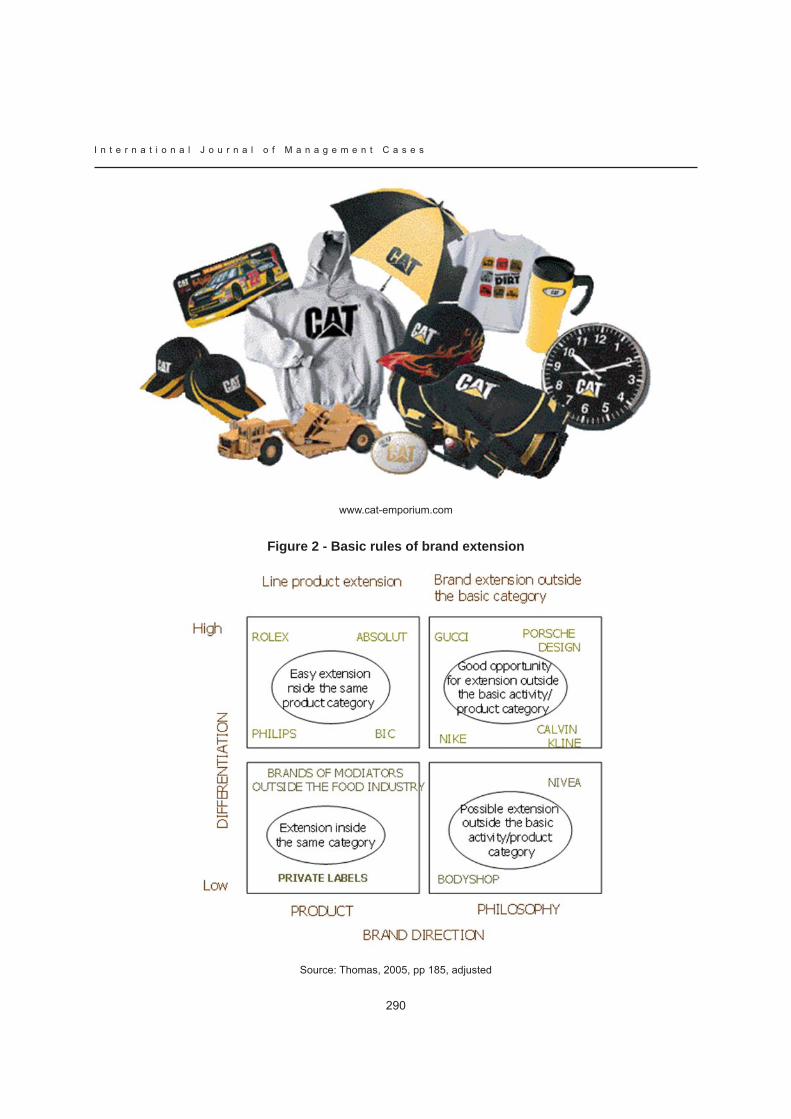
I n t e r n a t i o n a l J o u r n a l o f M a n a g e m e n t C a s e s
290
www.cat-emporium.com
Figure 2 - Basic rules of brand extension
Source: Thomas, 2005, pp 185, adjusted

291
I n t e r n a t i o n a l J o u r n a l o f M a n a g e m e n t C a s e s
Figure 3 - Brand extension options
Source: Riezebos, 2003, pp 189, adjusted
Reasons for brand extension strategy can be found in smaller assets needed to achieve certain initial level of well-knowing new product with existing brand. Beside that, funds invested in promotion of new product enable increase of awareness of brand in general, and also they are supposition for further building and maintaining the positive image. That is why brand extension (product/service owned by extended brand) has to be in accordance with basic brand product which is the “flag ship product” and dominates in the portfolio. Often it is case that company wants to use the success of one brand by making possible to introduce the new products either in the same or in the other product category. Brand extension can be different depending on the difference in price and similarity in technological complexity of the products which are included in
extension compared to basic product owned by brand – brand carrier (Figure 3).
Towards Aaker & Keller (1990) there are two forms of horizontal extension which are different by directions:
extension of limited line and•
franchise extension.•
Line extension implies using the brand name for entering a new market segment in the same product category. Example for this approach is Coca Cola Light.
Different from line extension, franchise extension uses existing brand for entering the other product category.

I n t e r n a t i o n a l J o u r n a l o f M a n a g e m e n t C a s e s
292
If there is the extension to the new products whose price level differs from the basic product, then we speak about vertical extension. Vertical extension offers very small distance and gives the company possibility to quickly capitalize the market value of the basic product brand – usually that product is superior in quality. Because a new product is in the same category and the distance is small, the higher demand is expected, for example cheaper Dox’s watch.
Vertical brand extension is convenient in the case when brand represents the products determined to target client segment which primarily value functional characteristics and are not price sensitive. Maybe, it can be named as an exception which confirms the rule, that vertical extension upward is suitable for prestige brands. On the other hand, vertical extension downward is not that big danger for brands that emphasis functional characteristic.
Using this generic approach it is possible to confirm that it is logical and acceptable to use brand extension inside the same product category (line extension) which results with extension to new technologically more developed products with increased price or to technologically less developed products with decreased price (Figure 4).
The main goals of extension are:
occupy new space on the market with offensive • strategy of attracting new clients
defend present market share by offering • more options to present clients and increase frequency of their shopping
In the fist stage positive reaction is directed to extension, but if extension isn’t at least on the expected level product quality, then negative reactions and projections of extension are coming back to basic product and the entire brand (Figure 5.).
Figure 4 - Options of brand extension

293
I n t e r n a t i o n a l J o u r n a l o f M a n a g e m e n t C a s e s
Figure 5 - Forms of brand extension
Source: Davis, 2002, pp 145, adjusted
It’s understandable that the impact of extension is bigger in both directions if product categories have more similarities e.i. similarities in targeted segments or market position (example: prestige basic brand implicates and the prestige extension). Beside that, companies should take care about brand awareness in the sense of target segment real experience with the basic product. The rule is simple: if the brand is more successful and extension more similar (new product similar to basic product), then the possibility that extension strategy will succeed is higher – except if potential clients ask themselves what is the difference between new and fundamental product and why extension was needed. On one side the extended product needs to be more similar to basic product, but on the other side it has to be differenced enough to justify launching a new product.
Extension categoriesSome of the basic categories are:
give the characteristics of basic product/brand • to the other product (example: smell and color)
“same” products (same purpose of product) • in different shape (e.g. shaving-paste and shaving-foam)
complemented products (e.g. tooth-paste and • tooth-brush)
substitute products (e.g. butter and margarine)•
transfer the expertise to the other product • categories (e.g. HP printer - HP computer - HP digital camera; Canon camera - Canon printer; or Mont Blanc pens - Mont Blanc cosmetics - Mont Blanc leather products)
transfer the brand experience and the • reputation to the other product categories or activities (YSL – fashion line - perfume, cigarette)
Presumptions for extension success It is good to take clients perceptions of the basic brand as a base for perceiving potential clients reactions on brand extension and to make perception map of basic brand as well as perception map of brands which are in the product segment where basic brand wants to expand. The basic presumptions for acceptance and success of brand extension are (Keller, 2003, adjusted):
clients are familiar with basic brand and brand • associations are connected to “parent” brand
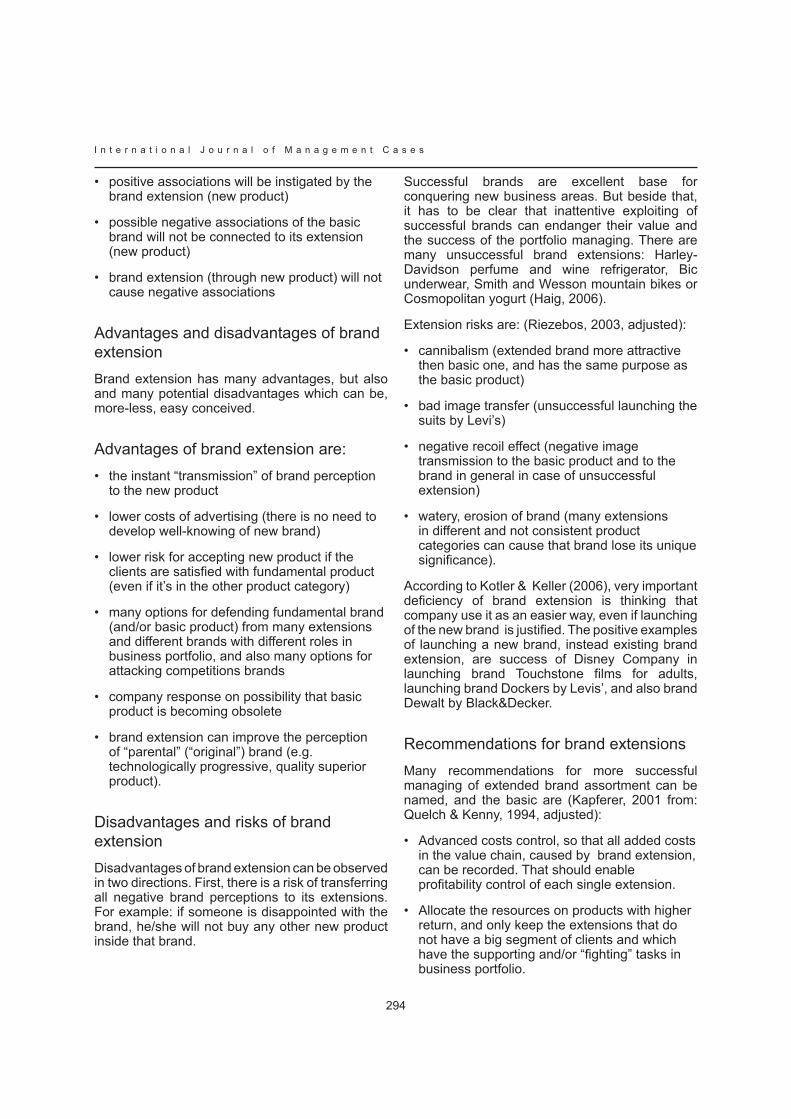
I n t e r n a t i o n a l J o u r n a l o f M a n a g e m e n t C a s e s
294
positive associations will be instigated by the • brand extension (new product)
possible negative associations of the basic • brand will not be connected to its extension (new product)
brand extension (through new product) will not • cause negative associations
Advantages and disadvantages of brand extensionBrand extension has many advantages, but also and many potential disadvantages which can be, more-less, easy conceived.
Advantages of brand extension are:the instant “transmission” of brand perception • to the new product
lower costs of advertising (there is no need to • develop well-knowing of new brand)
lower risk for accepting new product if the • clients are satisfied with fundamental product (even if it’s in the other product category)
many options for defending fundamental brand • (and/or basic product) from many extensions and different brands with different roles in business portfolio, and also many options for attacking competitions brands
company response on possibility that basic • product is becoming obsolete
brand extension can improve the perception • of “parental” (“original”) brand (e.g. technologically progressive, quality superior product).
Disadvantages and risks of brand extensionDisadvantages of brand extension can be observed in two directions. First, there is a risk of transferring all negative brand perceptions to its extensions. For example: if someone is disappointed with the brand, he/she will not buy any other new product inside that brand.
Successful brands are excellent base for conquering new business areas. But beside that, it has to be clear that inattentive exploiting of successful brands can endanger their value and the success of the portfolio managing. There are many unsuccessful brand extensions: Harley-Davidson perfume and wine refrigerator, Bic underwear, Smith and Wesson mountain bikes or Cosmopolitan yogurt (Haig, 2006).
Extension risks are: (Riezebos, 2003, adjusted):
cannibalism (extended brand more attractive • then basic one, and has the same purpose as the basic product)
bad image transfer (unsuccessful launching the • suits by Levi’s)
negative recoil effect (negative image • transmission to the basic product and to the brand in general in case of unsuccessful extension)
watery, erosion of brand (many extensions • in different and not consistent product categories can cause that brand lose its unique significance).
According to Kotler & Keller (2006), very important deficiency of brand extension is thinking that company use it as an easier way, even if launching of the new brand is justified. The positive examples of launching a new brand, instead existing brand extension, are success of Disney Company in launching brand Touchstone films for adults, launching brand Dockers by Levis’, and also brand Dewalt by Black&Decker.
Recommendations for brand extensions Many recommendations for more successful managing of extended brand assortment can be named, and the basic are (Kapferer, 2001 from: Quelch & Kenny, 1994, adjusted):
Advanced costs control, so that all added costs • in the value chain, caused by brand extension, can be recorded. That should enable profitability control of each single extension.
Allocate the resources on products with higher • return, and only keep the extensions that do not have a big segment of clients and which have the supporting and/or “fighting” tasks in business portfolio.
295
I n t e r n a t i o n a l J o u r n a l o f M a n a g e m e n t C a s e s
Train the sales staff, so that they could warn • and advice the clients about the importance, role and specialty of each product in brand extended assortment.
Introduce the new approach (“philosophy”) that narrows the assortment, depending on market results. That withdraw can be instant or progressive, but in any case they need to make sure that clients have possibility of switching to the other products, extensions or brands inside assortment or the company portfolio.
According to Keller (2003, adjusted) the process of successful extensions of existing brands is consisted in following:
1. determination present and desirable knowledge about the brand (creating brand perception map and establish the main source of brand value),
2. determination possible options (“candidate”) for extension based on associations to the basic (“parental”) product and similarity and convenience of extension in accordance with it,
3. evaluation potentials of extension for creating values towards
• a key associations of the basic brand
• desirable associations of extension (extended brand)
• unique associations of extension,
4. evaluations the options of extended brands based on perception targeted segment and depended on
• attractiveness
• importance
• consistence
• conviction of extension,
5. perception (by research) of possible competition advantages and client’s reaction to extension,
6. creating advertising campaign for extension launching,
7. evaluation of extension success and impact on the basic (“parental”) brand
Brand extension which use the “parental”, “family” or “umbrella” brand is suitable for all products and services, no matter if they are lasting or consumption goods. The only presumption is that supportable “parental” (“family” or “umbrella”) brand has a value and that positively contribute to the total value of expanded brand, considering the clients expected value.
ConclusionBesides the brand image improving, extension of successful brands can result in business growth. There are many goals of brand extension, but the most important is the attempt to occupy new market space with offensive strategy of attracting new clients. Presumptions for market success of brand extension are: brand well-knowing and positive associations with basic (“parental”, “family”, “umbrella”) brand, realizing the well-knowing and positive associations with brand extension and avoiding the possible negative associations of “parental” brand and brand extension. Advantages of brand extension are: the instant “transmission” of brand perception to the new product, lower costs of advertising for developing well-knowing of new brand, lower risk for accepting new product because of value of basic product, many options for defending and attacking the competition brands, easier to control life circle of basic product, and possibility for improvement the “parental” brand image with technologically progressive, quality superior product.
References:Kapferer, J-N. (2001) Strategic Brand Management, Kogan Page
Keller, L.K. (2003) Strategic Brand Management, Prentice Hall
Haig, M. (2006) Brand Failures, Kogan Page
Kotler, Ph., Keller, L.K. (2006) Marketing Management, Prentice Hall
Taylor, D. (2003) The Brandgym, John Wiley & Sons
Riezebos, R. (with Kist, b.& Koostra, G.) (2003) Brand Management, Pearson Education
Thomas, G. (2005) 4-D Branding, Differo

I n t e r n a t i o n a l J o u r n a l o f M a n a g e m e n t C a s e s
296
Aaker, D.A., Keller, L.K. (1990) Consumer evaluations of brand extensions, Journal of Marketing, Vol. 54, No.1, pp.27-41
Davies, M.S. (2002) Brand Asset Management, Jossey-Bass
Quelch, J., Kenny, D. (1994) Extend Profits not Product Lines, Harvard Business Review 72, No. 5

297
I n t e r n a t i o n a l J o u r n a l o f M a n a g e m e n t C a s e s
EXPLORING SHOPPERTAINMENT: LEEDS CITY CENTRE AND DEVELOPMENTS FOR
CONSUMPTION SPACES.
ALEXANDRA KENYONLEEDS METROPOLITAN UNIVERSITY, UK
Abstract
Leeds is in high demand. Over one hundred retailer stores want to come to Leeds; but Leeds is unable to to supply the needs of the retail stores because they are running out of space. This paper, therefore, begins with an outline of the Eastgate and Harewood Urban Quarter Development, in Leeds, United Kingdom, which should solve the demand/supply impasse. The paper is then split into three further sections. The first section considers the needs and motivations of the stakeholders. The second section discusses, in detail, the motivation of shoppers and the paper concludes with suggestions for Leeds to introduce shoppertainment, which will satisfy the hedonic needs of shoppers.
Outline planning permission was recently been granted for an exciting and innovative retail development. There are always numerous stakeholders when developing City or Town Centers and the Eastgate and Harewood Urban Quarter Development, Leeds is no exception. Stakeholders in the Leeds retail project include investors, retailers and shoppers; each with their own set of motivations and requirements. This paper reflects and adapts the marketing mix show that, whilst each stakeholder has different needs, their requirments intertwine with each other. Each stakeholders, therefore, has their role to play in the Leeds City Retail Development, however, the heart of the development lies with understanding the needs and motivations of the shopper. The “managable” and “benefit” elements that are attributal to the basic needs of the shopper are, therefore, explored. In addition, the attributes that retail developers must provide, to stay competive with surrounding Cities, Towns and Shopping Centres, are also addressed; the main focus of this paper then follows.
Shoppers are motivated in a number of ways to shop. It is these motivations that bring consumers out of their homes and into shopping arenas. There is a general concensus that the motivational dimensions are threefold; the utilitarian shopper, the social shopper and the hedonic shopper. Each shopping type is explored and details shown as to the added features that retail development managers should supply to satisfy the shoppers’ needs. The paper then moves specifically to the motivations of the hedonic shopper and their entertainment/exploratory requirements. Details of what shoppertainment is and the different types available around the world shown in the the concluding section; together with shoppertainment suggestions that Leeds should incorporate in the Eastgate and Harewood retail arena.
Key Words: Shopping, Hedonic, Utilitarian, Motivation
IntroductionNational and international retailers are queueing to open modern purpose-built properties in Leeds. Unfortunately, at present, the City can not accommodate this demand; there just isn’t enough space within the City Centre’s retail units for new tenents. This is due, in part, to the fact that tenents are now requesting unit sizes of between 5,000 and 6,000 ft² . This is double the request from tenents of five years ago. Another reason why there is no retail space in Leed City Centre is because existing retail stores are happy to stay in Leeds, therefore, units in Leeds rarely become vacant. Therefore, Leeds is unable to supply space. Indeed there are “180 outstanding requiements for space from retailers” according to Newns (2006) p. 1. However, following the outline planning approval of the Eastgate and Harewood Urban Quarter (Carter 2007); at a cost of £700

I n t e r n a t i o n a l J o u r n a l o f M a n a g e m e n t C a s e s
298
million no less, Leeds should be able to bridge the supply and demand impasse.
Leeds is also in competition with other major City, Town and Out-of-Town Shopping Centres. It is hoped that The Eastgate and Harewood Urban Quarter, will catapult Leeds from 6th place in the annual CACI Retail Footprint (2006) to 2nd place; or even 1st ahead of London!
The bold and innovative ideas set out in the Urban Quarter Development will keep Leeds as a historical space, but it will include modern and vibrant new streets, linked by open spaces, fronted by big named stores and niche outlets and there will also be extentions to the already popular cultural quarters. In addition, there will also be 600 homes in the heart of the City, theatres, cinemas, cafés, bars and family friendly restaruants. As is seen from this list and from just looking at the rejuvenation of many City and Town centres, over the last 10 years, shopping is not just about buying products. Shopping can be categorised as a leisure activity, a day out with friends, a hedonic experience, as well as a process that satisfies utilitaniran necessities. This paper will explore the developments that Leeds City Centre should include in terms of the entertainment factors that “shopping for pleasure” consumers would enjoy.
The Marketing MixRetail centre developers have to attract many stakeholders. Stakeholders include retail property developers, mortgage providers and of course prospectives buyers (Kirkup & Rafiq 1999), who wish for income streams and a healthy return on their investment. Further stakeholders are national government departments and local authorities who provide a whole host of tomes from Good Practice in Managing the Evening and Late Night Economy to Planning for Town Centres: Guidence on Design and Implementation tools respectively. Further stakeholders are retailers who often subscribe to the words of wisdom from government and local authorities, particularly when discussing access for disabled people, safety and secutiry or transportation issues. Another major stakeholder is the visitor to the retail development; either as a
shopper, a theatre goer or tourist; to name but a few.
The manager, therefore, has to provide an environment that is acceptable to each stakeholder in their own way. All stakeholders have a general desire for a City or Town centre to have a “diversity of uses, accessibility, inward investment, refurbishment of buildings and an attractive environment” Roberts (2004) p. 12. The marketing mix has been used to summarise all the needs of the stakeholders. The traditional mix has been sub-divided and adapted to cater for ‘manageable’ elements (Howard 1995) and ‘benefit’ elements (Warnaby and Davies 1997, Bloch, et al 1994) shown in Table 1 below:-
The keys to success, therefore, are many, due to the fact that there are many stakeholders involved; whose psychological and economic needs are very different. Kirkup and Rafiq (1999) provided a model which provides a framework for the marketing strategy of attracting and retailing customers; see figure 1 below:-
Attracting and retaining customers is the maxim for all marketing managers, which is why consumers are at the heart of Kirkup and Rafiq’s model. The model clearly supports the manageable and benefit elements referred to in Table 1. The model also shows that each element interacts with each other, via the consumer and retail marketing mix. Whilst the interactive activity is paramount to the overall success of new City Centre developments; clearly the upper elements of the model (mainly location, internal environment, external design and anchor stores of the retail mix) take priority within the early days of the project plan. The main reason for this is that it is difficult to reengineer infrastructure, such as access and/or highways, at later date. For the Eastgate and Harewood Urban Quarter Development in Leeds; these elements have already been approved by the local authority at outline planning permission was granted on 8th February 2007 (Carter 2007). For the purposes of this paper, therefore, the leisure, assortment and participants, shown in Figure 1, will be discussed and recommendations made how Leeds should include these elements of the mix in their future plans.
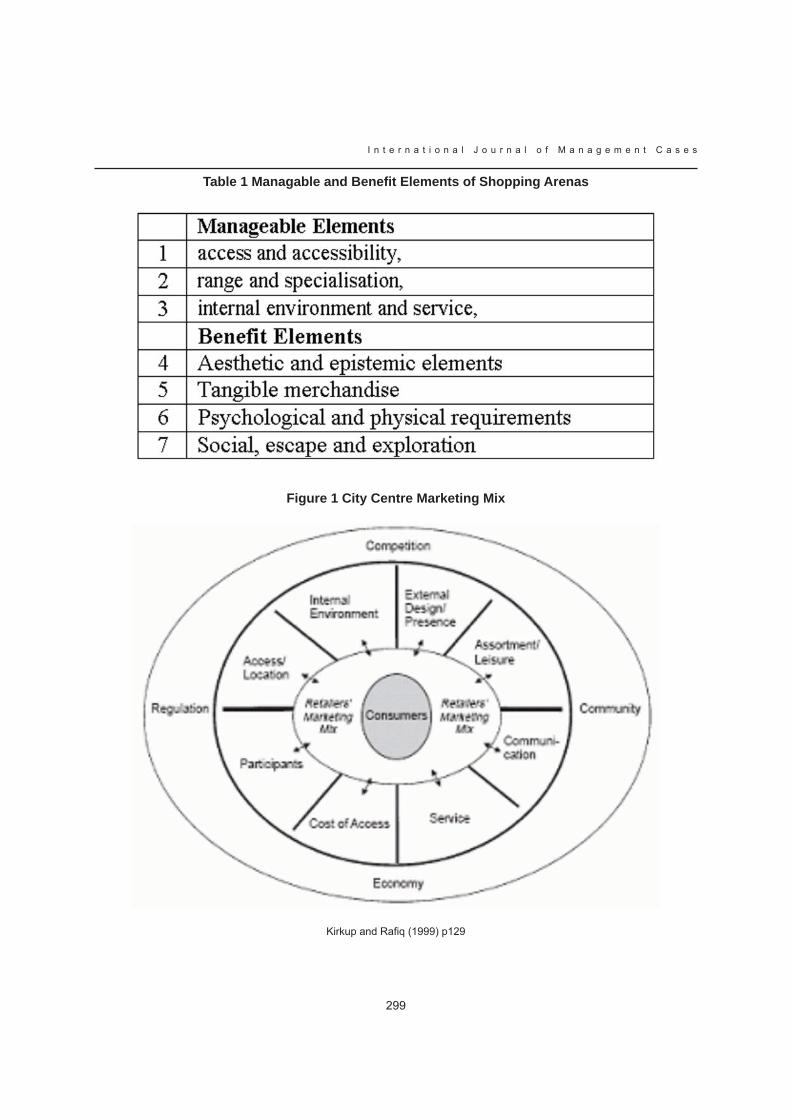
299
I n t e r n a t i o n a l J o u r n a l o f M a n a g e m e n t C a s e s
Table 1 Managable and Benefit Elements of Shopping Arenas
Figure 1 City Centre Marketing Mix
Kirkup and Rafiq (1999) p129

I n t e r n a t i o n a l J o u r n a l o f M a n a g e m e n t C a s e s
300
Why Shoppers ShopShopping, is not just shopping (Buttle (1992). The shopping, that will take place in the Leeds City Centre Uban Development arena, may be for one of the three most common episodes, which are 1) Groceries and household items; 2) clothing; and 3) gifts. But the ‘joy’ of shopping and the ‘motivation’ for shopping, often does not have anything to do with the actual purchase of products. Shopping is an activity where consumers examine or purchase goods or services. And it’s an activity that takes up a lot of our leisure time. According to Mintel Leisure Time(2006), 37% of the adult population leisure time is take up by shopping. Shopping, therefore, is a leisure time activity, lying forth behind Reading books/newspapers 61%, Listening to music 54% and Eating out at pubs or restaurants 42%. Therefore, shopping is high on the list of ‘things to do’ in a person’s leisure time. If it is high on the consumers list, then it should be high on list for Town and City planners. And, because, something that takes up so much leisure time, and takes place in Towns and Cities and has a billion pound exchange of money for goods and services, needs to be researched and understood.
Research has already been conducted ,at length, with regards to economic factors, recreational trends and motives of shopping (Bell et al 1998, Bellenger et al 1977, Darden & Dorsch 1990, Dholakia 1999, Finn & Louviere 1990, Hortman et al 1990, Kau & Ehrenberg 1984, Krantz 1998, Schneiderman 1996, Shim & Eastlick 1998). Indeed, from previous scholarly activity, Yavas (2001) provided a framework of the attributes that shoppers found important to them when they shop; as well as the main products sought whilst out shopping. The top 7 attributes and products are shown in Table 2 below.
The above findings give good information as to what is required during a shopping trip. The findings are interesting in that they back up some of the ‘managable’ elements from Table 1. They do not, however, provide information as to the why people shop or ‘benefit’/leisure elements that the consumer wants whilst shopping.
It was, therefore, considered necessary to assertain if a consumer can be so rational in the attributes sought and the type of products they buy or does the City Centre Marketing Mix have to accommodate the various dimensions that
each consumer wants from a shopping trip. As far back as 1972 Tauber claimed there is more to shopping that shopping in a rational and utilitarian way. Indeed Lunt & Livingstone (1992) provided the concept of shopping as a
“…spectacle in which one is both performer and spectators… it is seeing and being seen, meeting and being met, a way of interacting with others.” P. 189
Dholakia (1999) agrees and states that there are numerous motivations for shopping that appeal more to the benefit/leisure elements referred to in Figure 1. Shopping motives, incorporating the psyhological elements of shopping trips, are defined as 1) Interactions with family, 2) Utilitarian and; 3) Shopping for Pleasure (Dholakia 1999).
These motivational elements clearly show that shopping stimulates hedonic and experiential attibutes, in addition to the product/environment attributes provided by Yavas (2001) (see Table 2 above).
Rintamaki et al (2006) also considered the motives, that stimulate the need for visiting a shopping arena, from the a retail store development point of view. They recognise that a retailer, or in the case of Leeds’ Eastgate and Harewood Urban Quarter, the Development Manager, should satisfy all of the customer motivations. Rintamaki et al (2006) chose to call motivations – ‘values’ – but the underlying elements are the same as Dholakia’s (1999):- Utilitarian, Social and Hedonic see Table 3 below.
Table 3, above, provides a summary of the value needs of the shopper. It also provides a clear perspective view from learnt knowledge by cognition (the Utilitarian) to learning through the experience as it happens, right here, right now (the Hedonist). This is also the same for Criterion Benefits which again deals with the fundamental, existing knowledge and functional understanding of saving time and money (the Utilitarian) to the rush of excitement, emotional values of exploration and fun-seeking (the Hedonist). The schematic (Figure 2) also shows a model of Table 3 and how a shopper can be sub-divided based upon the motivations and benefits that they wish to satisfy or seek when shopping. Examples, of each type of benefit sought, are also shown below the schematic.
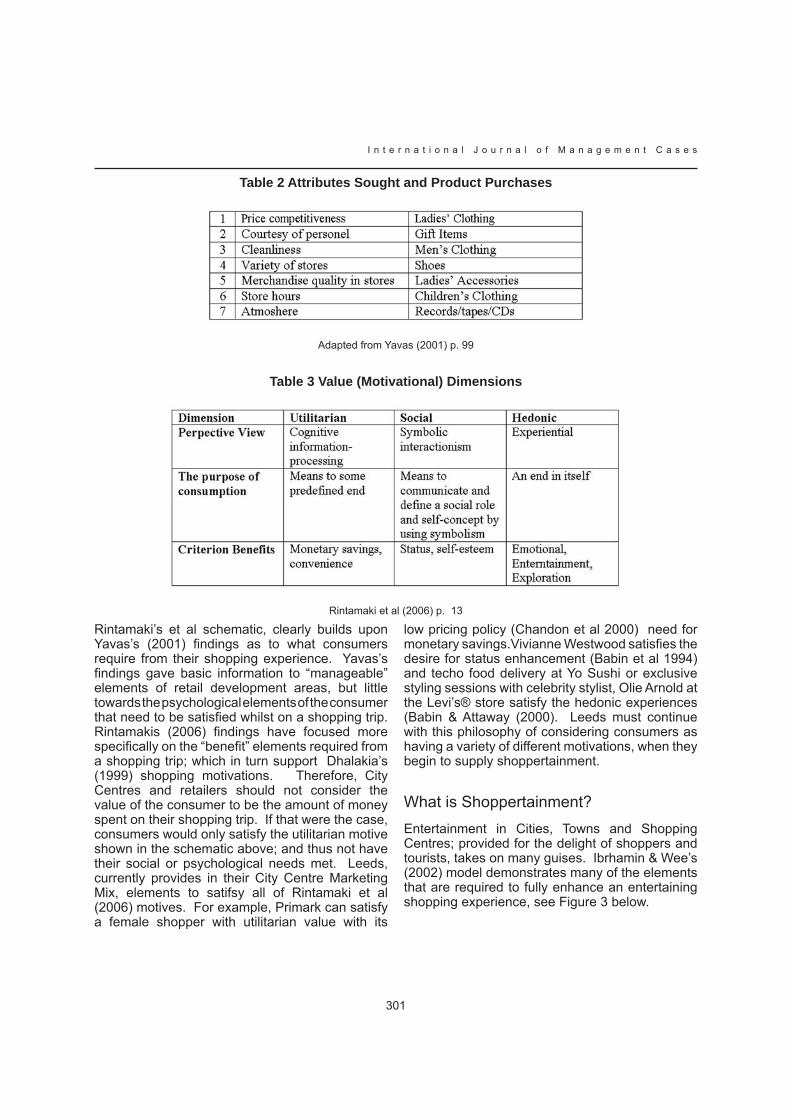
301
I n t e r n a t i o n a l J o u r n a l o f M a n a g e m e n t C a s e s
Table 2 Attributes Sought and Product Purchases
Adapted from Yavas (2001) p. 99
Table 3 Value (Motivational) Dimensions
Rintamaki et al (2006) p. 13
Rintamaki’s et al schematic, clearly builds upon Yavas’s (2001) findings as to what consumers require from their shopping experience. Yavas’s findings gave basic information to “manageable” elements of retail development areas, but little towards the psychological elements of the consumer that need to be satisfied whilst on a shopping trip. Rintamakis (2006) findings have focused more specifically on the “benefit” elements required from a shopping trip; which in turn support Dhalakia’s (1999) shopping motivations. Therefore, City Centres and retailers should not consider the value of the consumer to be the amount of money spent on their shopping trip. If that were the case, consumers would only satisfy the utilitarian motive shown in the schematic above; and thus not have their social or psychological needs met. Leeds, currently provides in their City Centre Marketing Mix, elements to satifsy all of Rintamaki et al (2006) motives. For example, Primark can satisfy a female shopper with utilitarian value with its
low pricing policy (Chandon et al 2000) need for monetary savings.Vivianne Westwood satisfies the desire for status enhancement (Babin et al 1994) and techo food delivery at Yo Sushi or exclusive styling sessions with celebrity stylist, Olie Arnold at the Levi’s® store satisfy the hedonic experiences (Babin & Attaway (2000). Leeds must continue with this philosophy of considering consumers as having a variety of different motivations, when they begin to supply shoppertainment.
What is Shoppertainment?Entertainment in Cities, Towns and Shopping Centres; provided for the delight of shoppers and tourists, takes on many guises. Ibrhamin & Wee’s (2002) model demonstrates many of the elements that are required to fully enhance an entertaining shopping experience, see Figure 3 below.

I n t e r n a t i o n a l J o u r n a l o f M a n a g e m e n t C a s e s
302
Figure 2 “Value” Motivational Dimensions
Rintamaki et al (2006) p. 13
Figure 3 Model of an Entertaining Shopping Experience
Ibrahim & Wee (2002) p. 252

303
I n t e r n a t i o n a l J o u r n a l o f M a n a g e m e n t C a s e s
This model combines the previously discussed concepts of the Retail Factors, namely “Atomosphere” and “Value-Added Features” and Customer Factors namely “Hedonic Oriented”. The atmoshere and value-added features can be many things in terms of an entertaining experience. The experiences include cinemas (Bellenger et al 1977), special events and exhibitions (Frasquest 2001, Haynes & Talpade 1996, Nevin & Houston 1980). Sit et al (2003) give more details as to what classifies as entertainment by stating that it can be:- a selection of seasonal events, such as Birdal Fayres, Christmas decorations and the chance to see Father Christmas, lucky prize draws for Ferrari, and more permenant entertainment venues such as cinemas, bars, cafes, restaurants or amusement arcades.
With these categorisations in mind, this section will now travel around the world to see what shoppertainment is currently available and provide some suggestions for Eastgate and Harewood Urban Quarter Development in Leeds.
The first place to visit is Dubai where the Dubai Shopping Festival takes place each year (20th December 2006 to 7th February 2007). The extravaganza provides haute couture shops, concerts, plays, computer festivals and exhibitions, food and sports events – clearly there is entertainment for all. Indeed the festival in 2005 “attracted 3.3 million visitors, who spent 6.67 billion dirhams. Of the visitors, about one million were tourists” Al Nabouda in the The Straits Times (Singapore).
The next trip is to Westfield Garden State Plaza in Paramus, New Jersey USA. The plaza will soon host an “entertainment lifestyle precinct” which will have a stadium seated theatre and 10 specialty retailers, including “experiential” stores where shoppers are encouraged to try out the merchandise before they buy. The entertainment precinct will enable shoppers to relax and enjoy a film or become more interactive with staff and the merchandise in the specialist stores.
Entertainment does not have to be high tech or fast and furious. The next trip is to Paris – which of course has high tech, high fashion and the high life available - but it also has secret arcades that enable the shopper to explore and satiate their hedonic needs by investigating an old dolls house shop or ‘finding’ M and G Segas’s walking stick collection; both to be found in Passage Jouffroy.
And to rest the mind, but be entertained in a gentle way, the next visit is to the magical dancing fountains in Barcelona or Playa de la Americas, Tenerife. Both are a delight to watch whilst having the perfect café latte.
ConclusionThe Eastgate and Harewood Urban Quarter Development in Leeds has many great attributes to offer consumers who are out shopping. It needs to cater for their utilitarian, social and hedonic needs. The new development should also consider the entertainment values that shoppers require. The first suggestion, therefore, is that there should be a shopping festival, each year, to put Leeds on the map as a City serious about shopping. A whole month should be dedicated to haute couture, big brand fashion houses, new and up and coming fashion designers and student work from Leeds Metropolitan University. Fashion shows would increase the use of space in Leeds, which would indeed increase spending in the City, both in stores and the hospitality and tourism industry. The second suggestion is for Leeds to host several music events where bands from the region, of all cultures and styles, play music and entertain shoppers in the open-air walkways and plazas. Leeds has not forgotten its heritage and the third suggestion is to continue to support small independent stores and encourage more specialist shops to settle in the alleyways and arcades. The smaller stores will need to be clearly signposted so that hedonic shoppers can ‘discover’ their delicacies. Finally, Leeds should have their own magical dancing fountains as a centrepiece. There are small fountains already in Leeds, and Leeds is not without water(!) but for some reason seems shy to put fountains as a centrepiece for relaxing entertainment and joy.
ReferencesAl Nabouda (2007) The Straits Times (Singapore) 21 February 2007
Babin, B. J. & Attaway, J. S. (2000) Atmospheric efect as a tool for creating cutomer value and gaining share of customer Journal of Business Research Vol. 49 No. 2 pp. 91-99
Babin, B. J., Darden, W.R. and Griffin, M. (1994) Work and/or fun: measuring hedonic and utilitarian
I n t e r n a t i o n a l J o u r n a l o f M a n a g e m e n t C a s e s
304
shopping value Journal of Consumer Research Vol. 20 No. 4, pp 644-656
Bell, D.R., Ho, T.-H., & Tang, C.S. (1998) Determining where to shop: fixed and variable costs of shopping Journal of Marketing Research, No.3, pp.352-69...
Bellenger, D.N., Robertson, D.H., & Greenberg, B.A. (1977) Shopping Centre patronage motives Journal of Retailing, No.2, pp.29-38.
Block, P.H., Ridgway, N. M. & Dawson, S. A. (1994) The Shopping Mall as Consumer Habitat Journal of Retailing Vol. 70 No. 1 pp. 23-42
Butlle, F. (1992) Shopping motives contructionist perspective The services Industies Journal Vol.12 No. 3 pp. 349-367
Carter, A. (2007) Eastgate Harewood Quarter Outline Planning Approval http://www.leeds.gov.uk/files/pressReleases/2007/month2/inter_73B668FCBCD3AF708025727C0033A304_PR_1.pdf [accessed 7th February 2007]
Chandon, P., Wansink, B. & Laurant, G. (2000) A benefit congruency framework of sales promotion effectiveness Journal of Marketing Vol. 64 No. 4 pp 65-81
Darden, W.R. & Dorsch, M.J. (1990) An action strategy approach to examining shopping behaviour Journal of Business Research, No.3, pp.289-308...
Dholakia, R.R. (1999) Going shopping: key determinants of shopping behaviours and motivations International Journal of Retail & Distribution Management, No. 1 pp.154-65...
Frasquet, M., Gil, & Molla, A. (2001) Shopping-centre selection modelling: a segmentation approach International Review of Retail, Distribution and Consumer Research Vol. 11 No. 1 pp 23-38
Haynes, J. & Talpade, S. (1996) Does entertainment draw shoppers? The effects of entertainment centres on shopping behaviours in malls Journal of Shopping Centre Research Vol. 3 No. 2 pp 29-48
Hortman, S., Allaway, A.W., Mason, & J.B., Rasp, J. (1990) Multi-segment analysis of supermarket
patronage Journal of Business Research, No.3, pp.209-23...
Kirkup, M. H. & Rafiq, M. (1999) Marketing Shopping Centres: Challenges in the UK Context Journal of Marketing Practice: Applied Marketing Science Vol. 5, No. 5 pp 119-133
Kasrel, D. (1998) Feeding frenzy at the malls Philadelphia Business Journal, pp.3-4...
Kau, A.K., & Ehrenberg, A.S.C. (1984) Patterns of store choice Journal of Marketing Research, pp.399-409...
Krantz, M. (1998) Click till you drop, Time, pp.34-41...
Mintel Leisure Time (2006 ) http://academic.mintel.com/sinatra/academic/search_results/show&&type=RCItem&page=0&noaccess_page=0/display/id=173575/display/id=203122§ion#hit1 [accessed 9th February 2007]
Nevin, J. & Houston, M. (1980) Image as a component of attraction to intrauban shopping areas Journal of Retailing Vol. 56 No. 1 Spring pp 77-93
Rintamaki, T., Kanto, A., Kusela, H. & Spence, M. T. (2006) Decomposing the value of department store shopping into utilitarian, hedonic and social dimensions Evidence from Finland International Journal of Retail & Distribution Management Vol. 34 No. 1 pp 6-24
Shim, S., Eastlick, M.A. (1998) The hierarchical influence of personal values on mall shopping attitude and behaviour, Journal of Retailing, No.1, pp.139-60...
Sit, J., Merrilees, B. & Birch, D. (2003) Entertainment- seeking Shopping Centre partons: the missing segments International Journal of Retail & Distribution Management Vol. 31 No. 2 pp 80-94
Warnaby, G. & Davies, B. J. (1997) Cities as service factories International Journal of Retail & Distribution Management June-July Vol. 25 No. 6-7 pp 204 -11
Yavas, U. (2001) Patronage motives and product purchase patterns: a correspondence analysis Marketing Intelligence & Planning Vol. 19, Issue 2 pp. 97-102

305
I n t e r n a t i o n a l J o u r n a l o f M a n a g e m e n t C a s e s
TITLE: RETAIL BRANDING MODELS IN TAIWANESE RETAIL GROCERY MARKET
CHING-WEI HOLEEDS METROPOLITAN UNIVERSITY, UK
JOHN TEMPERLEY LEEDS METROPOLITAN UNIVERSITY, UK
CLAUDIO VIGNALILEEDS METROPOLITAN UNIVERSITY, UK
Abstract
Global businesses are a current trend and global retail markets are changing rapidly over the past decades. With the growth of retailing, retail brand power has emerged to compete against manufacturer brands and the concept of retail branding has become more and more important for both industry observers and academics. In a review of contemporary studies, many of these previous researches tend to focus on strategy or company aspects rather than the consumer facet. It cannot be ignored that understanding customer needs and desires is very important for managing retail brands successfully and also customer perceptions have to be studied because perception is basic to other activities. Especially for international retail brands, whether the international retail branding is successful in a local market, it depends on these local consumers’ perceptions. Therefore, in order to complete this gap this paper is going to consider the perception of international retail brands from the consumer perspective and to explore what key factors influence these perceptions leading to the development of a perception model for international retail branding.
Meanwhile, a proposed framework model for the development of retail branding is involved in this study and three research propositions are set up,
Proposition 1: Taiwanese consumer perceptions of retail branding are different in Taiwan and UK where are with the different retail branding development.
Proposition 2: Consumer behaviours can influence consumer perceptions of retail branding.
Proposition 3: International retailers have to adapt local consumers’ perceptions and Taiwanese consumer perceptions of each main international retail branding in Taiwan are the same.
Through satisfying these research propositions, key factors are coming out and can be filled in the framework model to become an initial perception model of international retail branding.
The study has been carried out in the Taiwan market based on UK’s experiences as this topic and concept are quite new in Taiwan and there are few previous researches in this field in terms of the Taiwanese market. The research method involves semi-structured interviews with 22 Taiwanese shoppers. The research analysis is qualitative with the content analysis approach. Content analysis has been defined as a systematic, replicable technique for compressing many words of text into fewer content categories based on explicit rules of coding. Finally, the outcome of this study is not only to contribute to retail branding knowledge in terms of consumer perceptions, but also to take this initial perception model for retail branding as a foundation for the next research stage in Taiwan.
Keywords: International Retail Branding, Consumer Perceptions, Modelling Process, Taiwan
IntroductionGlobal businesses are a current phenomenon and global retail markets are changing rapidly over the past decades. With the growth of retailing, retail brand power has emerged to compete against manufacturer brands and the concept of retail branding has become more and more important for both industry observers and academics.

I n t e r n a t i o n a l J o u r n a l o f M a n a g e m e n t C a s e s
306
However, many of these previous studies tend to focus more on strategy/company aspects rather than the consumer facet. It cannot be ignored that understanding customer needs and desires is very important for managing retail brands successfully and also customer perceptions have to be studied because perception is basic to other activities. Especially for international retail brands, whether the international retail branding is successful in a local market, it depends on these local consumers’ perceptions. Therefore, in order to fulfill this gap this study is going to investigate the perception of international retail brands from the consumer perspective and to explore what key factors influence these perceptions. Meanwhile, a proposed framework which combines both the retailer aspect and the consumer aspect is involved and lead to the development of a perception model for international retail branding.
Meanwhile, the concept of retail branding is still new in Taiwan and there are few previous researches in this field in terms of the Taiwanese market, so a comparative research with UK’s experiences is conducted in this paper. The qualitative research is undertaken in this paper and the method is semi-structured interviews (Saunders, Lewis and Thornhill, 2003; Creswell, 2003; Wright and Crimp, 2000) with Taiwanese consumers. The outcome of this study is not only to contribute to retail branding knowledge in terms of consumer perceptions, but also to take this initial perception model for international retail branding as a foundation for the next research stage in Taiwan.
Theoretical Background In a review of previous literatures, a great deal lessons have been discussed and analysed in the concept of retail brands (Gordon, 1994; Aaker, 1996; Kapferer, 1997; Wileman and Jary, 1997; de Chernatony and McDonald, 1998; McGoldrick, 2002; Ailawadi and Keller, 2004). Meanwhile, more and more researchers believed that retail brands do not represent just “product” brands, the idea of “the retailer as a brand” has been accepted and applied in contemporary studies (Davies, 1992; Wileman and Jary, 1997; Randell, 2000; Burt and Sparks, 2002 Ho, Vignali and Temperley, 2006). Table 1 is a summary to illustrate the review of retail branding theories.
Therefore, investigating consumer perceptions of retail branding should consider the broad retail branding issues which comprise retail corporate, store and product brands rather than focusing on the specific own product brands in this research.
Research Methods In this study, data collections are used both primary and secondary approaches. Before investigating consumer perceptions in the primary research, this research had to identify with the Taiwanese current situation and retail market as well as the development trend of retail branding in global. These facts are from a wide of secondary data and information collection, particularly focusing on the relevant governmental statistical data, annual reports, market reports, journals, textbooks, business newspapers, previous academic dissertations and on-line resources, and so on.
In order to explore the feeling and perception from the consumers’ perspective, qualitative research was conducted to help the conceptual development. Along with the definition of semi-structured interview, “wide-ranging category of interview in which the interviewer commences with a set of interview themes but is prepared to vary the order in which questions are asked and to ask new questions in the context of the research situation” (Saunders, Lewis and Thornhill, 2003, p.489), research technique was decided as semi-structured interview with consumers.
Twenty two Taiwanese interviewees were contacted to carry out this research and all of them were selected carefully by these following features:
have living experience in the UK at least one • year: this means these people can realise the basic shopping behaviour and the market environment in the UK
have shopping experiences at hypermarkets • both in the UK and Taiwan in recent years
all respondents are from three major districts of • Taiwan (i.e. Taipei in the Northern, Taichung in the Central and Kaohsiung in the Southern) in order to validate this research

307
I n t e r n a t i o n a l J o u r n a l o f M a n a g e m e n t C a s e s
Table 1: A retail branding model matrix
Source: Summarised from the research in this study
As the sample was not easy to get, snowball sampling was conducted in this research, which “is commonly used when it is difficult to identify members of the desired population” (Saunders, Lewis and Thornhill, 2003, p.176). At the beginning, the researcher looks for the suitable sample as the initial respondent from researcher’s existing Taiwanese friends in the UK or the Taiwanese Student Society in the UK’s universities. The first interviewee possibly studied in the UK at least one year and has backed to Taiwan for working. After then through his/her relationship network, the next respondent will be found out. Once the system has been developed, recruiting research participants is not difficult to achieve.
The analysis of qualitative data was conducted by content analysis which is a popular method of qualitative analysis. Content analysis has been defined as a systematic, replicable technique for compressing many words of text into fewer content categories based on explicit rules of coding. It can be a useful technique for allowing researchers to discover and describe the focus of individual (Weber, 1990; Page and Meyer, 2000).
Research Propositions and Finding Analyses Here are three research propositions which are achieved through the primary research in this
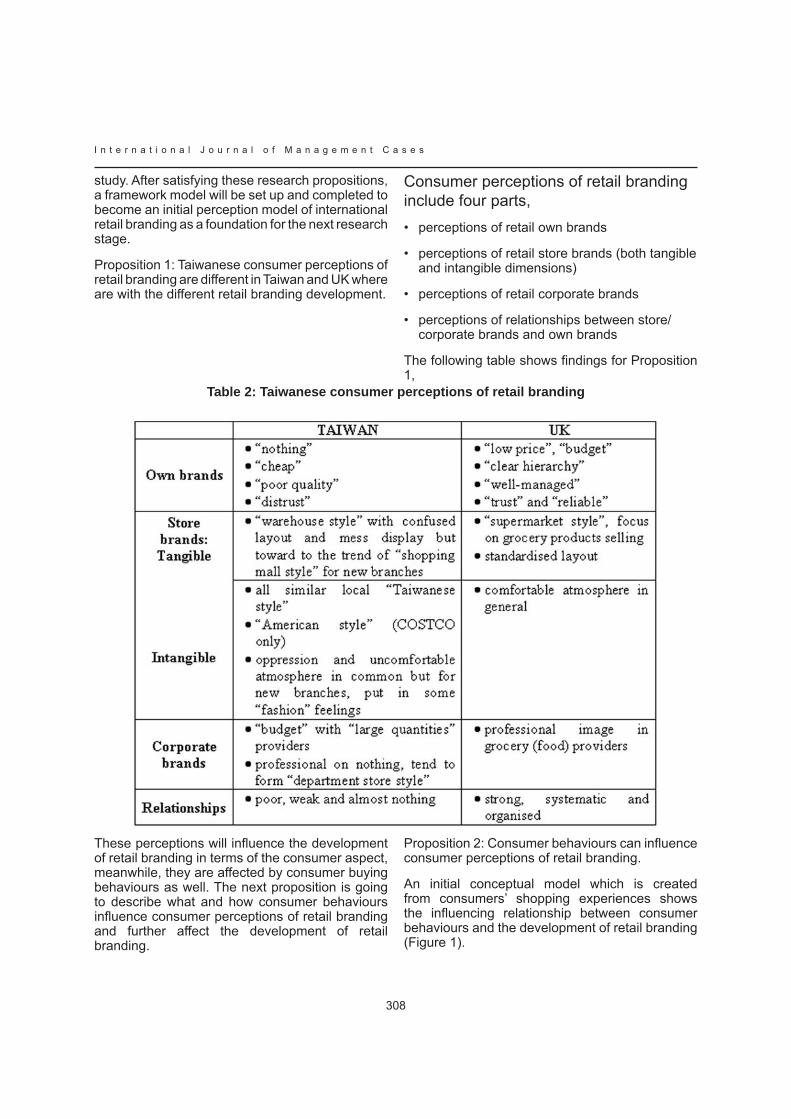
I n t e r n a t i o n a l J o u r n a l o f M a n a g e m e n t C a s e s
308
study. After satisfying these research propositions, a framework model will be set up and completed to become an initial perception model of international retail branding as a foundation for the next research stage.
Proposition 1: Taiwanese consumer perceptions of retail branding are different in Taiwan and UK where are with the different retail branding development.
Consumer perceptions of retail branding include four parts,
perceptions of retail own brands•
perceptions of retail store brands (both tangible • and intangible dimensions)
perceptions of retail corporate brands•
perceptions of relationships between store/• corporate brands and own brands
The following table shows findings for Proposition 1,
Table 2: Taiwanese consumer perceptions of retail branding
These perceptions will influence the development of retail branding in terms of the consumer aspect, meanwhile, they are affected by consumer buying behaviours as well. The next proposition is going to describe what and how consumer behaviours influence consumer perceptions of retail branding and further affect the development of retail branding.
Proposition 2: Consumer behaviours can influence consumer perceptions of retail branding.
An initial conceptual model which is created from consumers’ shopping experiences shows the influencing relationship between consumer behaviours and the development of retail branding (Figure 1).

309
I n t e r n a t i o n a l J o u r n a l o f M a n a g e m e n t C a s e s
Figure 1: An initial conceptual retail branding model in terms of the consumer aspect
Initially, many alternative retail outlets reflect a situation of “fewer opportunities to shop at hypermarkets and meet retail own brands” for Taiwanese consumers. Meanwhile, from exploring consumer behaviours, Taiwanese attitudes of “shopping for convenience” and Taiwanese behaviours of shopping allocations and patterns also reveal the trend of “fewer frequencies to shop at hypermarkets”, which means that consumers have less chance to meet retail own brands, and then they have less knowledge about retail own brand products and fewer using experiences. Therefore people distrust retail own brands and have less perceptions of retail branding. Finally, this will seriously affect the development of retail branding.
Taking the UK’s experience as a comparative example, fewer alternative retailers make consumers have few choices to buy all grocery products at one super/hypermarket. Therefore, they have more chance to meet and try own brand products. The more using experiences they have, the more understanding they are. Therefore, customers have stronger perceptions of retail own brands and retail branding, which further facilitate the development of retail branding.
However, optimistically, Taiwanese younger generations have a trend to change the traditional shopping habits and buying behaviours. Meanwhile, youth lifestyles also have been changing. Shopping at modern grocery retailers (hypermarkets) seems to be a trend in the future. These would be an opportunity for development retail branding in Taiwan.
Proposition 3: International retailers have to adapt local consumers’ perceptions and Taiwanese consumer perceptions of each main international retail branding in Taiwan are the same.
Table 3 shows a comparative review for these three specific typologies of international retail brands in Taiwan.
As can be seen from Table 3, in local identity, brand image and retailer culture Carrefour are all Taiwanese and COSTCO are all US, but TESCO are mixed Taiwanese and UK. In brand positioning, both Carrefour and COSTCO have clear positions whilst TESCO is ambiguous. Applying Porter’s three generic strategy model (1985), it can be analysed more clearly, which is shown in Figure 2.

I n t e r n a t i o n a l J o u r n a l o f M a n a g e m e n t C a s e s
310
Table 3: Consumer perceptions of three international retail brands in Taiwan
Figure 2: Three generics strategy
Source: Based on Porter (1985)
Carrefour can be located as “cost leadership” because its competitive advantage is lower cost and competitive scope is broad public. COSTCO can be placed as “differentiation focus” since its competitive advantage is differentiation and competitive scope is narrow group. Although these two use different marketing strategies and brand positioning, they both are successful in Taiwan. TESCO’s brand positioning was not apparent, neither low price nor differentiation, and its target market was major products for broad public but minor specific UK’s foods for narrow group of people. So TESCO is almost located in the middle and actually this is a dangerous place without understandable strategies.
In addition to adapt local consumer perceptions of retail branding, the more important is to understand local consumers’ knowledge of retail branding and acceptance of foreign culture or images (cultural marketing) for international retailers. In this case of the Taiwanese retail market, consumers would like to accept the one who has clear and specific brand image and positioning, no matter localisation or
internationalisation. So international retailers have to build the differentiation from other competitors, and clearly communicate their retail branding with local consumers in order to create and remain their competitive advantages to be survival. These are also the key issues to drive the development of international retail branding.
A Proposed FrameworkMany of these previous studies in the field of evolution of retail branding tend to focus on strategy or retailer aspects rather than the consumer facet. In fact, however, the development of retail branding should be influenced by both the consumer aspect and the retailer aspect. Through reviewing secondary researches and the primary research in this study, a proposed framework for retail branding model is built up and presented in Figure 3 which also shows influencing relationships among them.

311
I n t e r n a t i o n a l J o u r n a l o f M a n a g e m e n t C a s e s
Figure 3: Framework for retail branding model
I n t e r n a t i o n a l J o u r n a l o f M a n a g e m e n t C a s e s
312
In Figure 3, it involves both macro-environments which have an effect on each mirco-environment with push-pull dimension for developing retail branding. This framework expresses that the development of retail branding is affected by local consumer perceptions and the development of local grocery market, which is so-called micro-environment of consumer aspect and micro-environment of retailing respectively. For micro-environment of retailing, it is directly influenced by macro retail environment which includes the retail globalisation, retail own-brands development and retail branding trend. Macro-environment of retailing, as a push dimension, pushes local grocery players toward the development of retail branding.
Meanwhile, in the consumer aspect, when local consumer perceptions of retail branding are more and more strong and positive, it is as a pull dimension for the development of retail branding. Micro-environment of consumer aspect is affected by consumer behaviours and cultural context, which is named as macro-environment of consumer aspect, includes many relevant and complicated factors, e.g. local culture issues and consumer buying habits. Moreover, both issues of cultures and consumer behaviours are interaction with each other.
Main issues in the retailer aspect have been mentioned and considered from previous literature reviews and secondary researches. Key factors in the consumer aspect have been explored and investigated from the primary research with semi-structured interviews (in previous sections). The next is to combine these interdependencies factors together and model them into this framework as a new initial model.
Two-Dimension Aspects Basing on finding analyses and the framework, key influencing factors are come out from the two-dimension aspects, i.e. the retailer aspect and the consumer aspect.
The Retailer Aspect: Macro-environment of retailingThere are some development trends in macro-environment for retailing in general, which are summarised from literature reviews:
The trend of retail brands development: • with the growth of retailers, retail brands are become more and more powerful
The trend of increasing concentration of • multiple retailers
The trend of changing retail management • philosophy: from trading to brand leadership
The trend of retail branding development: from • generics/unbranded to brand leadership; from value lines to exclusive lines; from own brand products to store and corporate brands
Forming a hierarchy retail brands•
The trend of retail internationalisation •
Furthermore, main key points for macro-environment of retailing in Taiwan are reviewed as well, which are from secondary researches:
Technology issues: technological skills help • a great deal of business management for retailers, e.g. POS systems. On the other hand, technology also provides new virtual distributors. This could be an advantage, as well as a threat for actual distributors.
Economics: the development trend of global • economic and markets
Political issues: WTO and other open market • policies facilitate the internationalisation and the expansion of global retailers. However, some political considerations still limit the development for international retailers.
The Retailer Aspect: Micro-environment of retailing About micro-environment of retailing, major trends for the local grocery market in Taiwan are detailed in Chapter 3 and summarised as follows:
The increasing development trend of modern • retailers, although traditional markets still have the biggest market scales
Many other alternative retailers are substitutes • for hypermarkets
The growth trend of own brands, although it is • lower own brand shares currently
313
I n t e r n a t i o n a l J o u r n a l o f M a n a g e m e n t C a s e s
The trend of increasing retailer centralisation, • although it is lower retailer concentration
New concepts for retail branding which include • own brands, store brands and corporate brands are brought into and influenced by international retailers
The Consumer Aspect: Micro-environment of consumer aspectFrom the primary research, local Taiwanese consumer perceptions of retail branding have four facets: retail own brands, retail store brands (tangible and intangible), retail corporate brands, and relationships between own brands and store/corporate brands,
Retail own brands: “nothing”, “cheap”, “poor • quality”, and “distrust”
Retail store brands (Tangible): “warehouse • style” with confused layout and mess display but toward to the trend of “shopping mall style” for new branches
Retail store brands (Intangible): •
all similar local “Taiwanese style”•
“American style” (COSTCO only)•
oppression and uncomfortable atmosphere in • common but for new branches, put in some “fashion” feelings
Retail corporate brands:•
“budget” with “large quantities” providers•
professional on nothing, tend to form • “department store style”
Relationships between own brands and store/• corporate brands: poor, weak and almost nothing
Moreover, with regard to local consumer perceptions of international retail branding, specific retail brand images and clear positioning are better than fuzzy mixed (e.g. TESCO) whether localisation (e.g. Carrefour) or internationalisation (e.g. COSTCO).
The Consumer Aspect: Macro-environment of consumer aspectMacro-environment of consumer aspect involves general consumer behaviours and cultural background. From primary research in this stage, relevant key issues are listed:
Typology of shoppers: one-stop shopping or • compared shopping style; quality-orientated or price-orientated shoppers
Different ages/generations and lifestyle •
Acceptance of unknown or new brands • (including retail own brands) versus well-known manufacturer brands
Using experiences, understanding and • trustiness of retail own brands
Acceptance of Western culture and modern • shopping habits
In the case of the Taiwanese hypermarket market, there are both inhibitors and facilitators for influencing the development of retail branding.
Facilitators:
Younger generations and youth lifestyle adopt • modern shopping habits
Cultural transformation and Western culture • acceptance
Price-orientated shoppers and one-stop • shopping style
Inhibiters:
Older generations are used to shop at • traditional retailers
Loyalty to well-known manufacturer brands and • assumed unknown brands (including retail own brands) are unsafe
Less knowledge and trust of retail own brands •
Quality-orientated shoppers and compared • shopping style
I n t e r n a t i o n a l J o u r n a l o f M a n a g e m e n t C a s e s
314
Conclusions and Recommendations for Further ResearchAfter analysing these outcomes the next stage is to develop an initial perception model for international retail branding through structuring these key factors with two dimensions. Moreover, the key factors from the consumer aspect have formed by the qualitative research which can be seen as a pilot research to explore and find out the initial key factors. Subsequently, in order to validate the adapted perception model, testing these key issues and generalising their relationships with each other are necessary. This will be recommended to carry out for the further research in the next stage.
References Aaker, D.A. (1996) Building Strong Brands, The Free Press, New York
Ailawadi, K.L. and Keller, K.L. (2004) “Understanding retail branding: conceptual insights and research priorities”, Journal of Retailing, 80(4), pp.331-342
Burt, S. L. and Sparks, L. (2002) “Corporate branding, retailing, and retail internationalization”, Corporate Reputation Review 5(2/3), pp.194-212
Creswell, J.W. (2003) Research Design (Second Edition), Sage, California
Davies, G. (1992) “The two ways in which retailers can be brands”, International Journal of Retail and Distribution Management 20(2), pp.24-34
de Chernatony, L. and McDonald, M. (1998) Creating Powerful Brands (Second Edition), Butterworth-Heinemann, Oxford
Gordon, W. (1994) “Retailer brands- the value equation for success in the 90s”, Journal of the Market Research Society, 36(3), pp.165-181
Ho, C.W., Vignali, C. and Temperley, J. (2006) “Comparing grocery own-brands in the UK and Taiwan”, International Journal of Management Cases 8(3), pp.41-52
Kapferer, J.N. (1997) Strategic Brand Management (Second Edition), Kogan Page, London
McGoldrick, P. (2002) Retail Marketing, (Second Edition), McGraw-Hill, Maidenhead
Page, C. and Meyer, D. (2000) Applied Research Design for Business and Management, McGraw-Hill, Australia
Porter, M.E. (1985) Competitive Advantage, The Free Press, New York
Randall, G. (2000) Branding (Second Edition), Kogan Page, London
Saunders, M., Lewis, P. and Thornhill, A. (2003) Research Methods for Business Students (Third Edition), Pearson Education Limited, Essex
Weber, R.P. (1990) Basic Content Analysis (Second Edition), Newbury Park, CA
Wileman, A. and Jary, M. (1997) Retail power Plays: From Trading to brand Leadership, Macmillan, Basingstoke
Wright, L.T. and Crimp, M. (2000) The Marketing Research Process (Fifth Edition), Pearson Education Limited, Essex

315
I n t e r n a t i o n a l J o u r n a l o f M a n a g e m e n t C a s e s
THE MARKETING ROLE OF PACKAGING: A REVIEW
NIKOLA DRASKOVICLEEDS METROPOLITAN UNIVERSITY, UK
Abstract
Many scholars agree that the area of packaging is not getting much attention from researchers. Therefore, the main goal of this paper is analyse the status of research related to the marketing function of packaging by the critical review of available literature. In the past the most important role of packaging was to protect the product and to provide functional benefits. However, the functions of packaging expanded with the time. Packaging became more important from the marketing point of view with the recent marketing trends, like switching marketing budgets from advertising to other promotional tools, increasing nondurable product buying decisions at the point of purchase, etc. It is usually the mean of differentiation and the last brand advocate when it comes to the consumers’ time to choose between the products on the shelves. In more recent literature packaging is usually pointed as a communication element rather than just a part of the product within the 4Ps. In some cases packaging is even considered as a part of the communicational (i.e. promotional) mix. With no doubt, packaging is having tremendous impact on consumer thanks to its communicational aspects. One of the functions of packaging within marketing communications is to help in the process of building the brand personality and to create links with consumers.
Marketers are usually conducting various packaging related tests and are researching consumer’s preferences toward product and its packaging in order to determine the packaging design’s success. However, those research activities are commercial in their nature and mostly confidential, while the findings are related only to the particular package rather to the packaging in general and are not published publicly, despite its potential value and contribution to the wider knowledge. The effect of package shape on consumer’s purchasing behaviour seems to initiate some debate among scholars like no other packaging related topic and there is a number of studies covering this topic.
It could be concluded that most of the packaging related topics are still not getting much attention from researchers. The majority of topics are still having a huge research potential. Packaging design, for example, is a well presented topic from the practitioners’ point of view but there is very little of empirical research. There are also just few marketing models related to packaging and further research is needed if packaging would like to be concerned as an element of the communicational mix by the main-stream marketing theoreticians. Without marketing models, research and related findings there is not enough material about packaging that could be used in the marketing textbooks. However, it is the author’s belief that packaging will attract much more attention in the future because of the current trends on the consumer market and the switching of marketing budgets. Probably the key for making the area of packaging more attractive from the marketing point of view is also the availability of research funding which will have to increase as the interest of practitioners for packaging related topics is growing.
Keywords
packaging, marketing communications, packaging design, marketing models
INTRODUCTIONAccording to the Encyclopaedia Britannica (2006) the term ‘packaging’ refers to the technology and art of preparing a commodity for convenient transport, storage, and sale. In nowadays packaging is considered as an integral part of product. Meyers and Lubliner (1998) stated how successful marketers understand that for the consumer the package is the product, pointing out the impression and importance of packaging from the consumer’s point of view. Packaging is sometimes referred as ‘the fifth P’ of the marketing mix, beside product, price, place and promotion (Kotler, 2003), or

I n t e r n a t i o n a l J o u r n a l o f M a n a g e m e n t C a s e s
316
as ‘the silent salesman’ (Dichter, 1957; Pildich, 1973), yet its importance seems to be slightly underestimated within the mainstream marketing literature. Many scholars (e.g. Underwood, Klein and Burke, 2001; Underwood, 2003; Rundh, 2005) agree that the area of packaging still has a large research potential for both academic community and practitioners.
The main purpose of this paper is to analyse the status of research related to marketing functions of packaging and to give a critical look at the available literature in order to analyse the status of research and detect possible gaps. Rather than presenting the findings chronologically, this review is using a thematic approach which is organized around a topic or issue, with occasional shift between time periods within each section according to the point made (Literature Reviews, 2006). Because of the fact that packaging is related to many areas and types of products, this paper is mainly dealing with the literature focused on the consumer products packaging.
THE EVOLUTION OF PACKAGING FUNCTIONS In the past the dominant purpose of packaging was to protect and contain the product (Pilditch, 1973). It was simply intended to provide functional benefits, or how Calver (2004) stated, packaging was essentially utilitarian. With the growing competition and retail development packaging became very important sales tool and its functions emerged. There seems to be some kind of consensus about the functions of packaging in more recent publications (e.g. Prandergast and Pitt, 1996; Smith and Taylor, 2004; Robertson, 2005) and there are usually just three core functions pointed out:
Packaging contains and protects product. • It must contain the product to function successfully. This function is determined by the packaging technology and is primarily logistically related.
Packaging attracts attention to a product, • reinforces a product’s image, and provides an attractive method to convey the virtues of the product. The packaging must provide the necessary information to consumer who needs to instantly recognize products through distinctive branding and labelling.
Packaging provides convenience for both • middlemen and consumers in terms of handling, storing and in the time of product consumption. This function relates to both marketing and logistics.
Packaging seems to be related to both marketing and logistics and is difficult to separate marketing functions of packaging from the logistical functions (Prendergast and Pitt, 1996). Logistical function of packaging is strongly related to the type of the packaging material and design approach, since product design, packaging and logistics are highly interdepended, and together they have a great impact on supply chain activities (Klevås, 2005).
MARKETING FUNCTION: THE FUNCTION OF ALL FUNCTIONS?In marketing literature, packaging is considered to form a part of the product mix and brand (Ampuero and Vily, 2006). For Smith and Taylor (2004) packaging is an element of communicational (i.e. promotional) mix, together with personal selling, advertising, sales promotion, direct marketing, publicity and public relations, sponsorship, exhibitions, point-of-sale merchandising, word of mouth, e-marketing and corporate identity. With no doubt, packaging is having tremendous impact on consumer thanks to its communicational aspects.
The importance of packaging within sales and marketing function has been recognised quite early (e.g. Vanderblue, 1921; Converse, 1926). According to Underwood, Klein and Burke (2001) and Underwood (2003), packaging is becoming an increasingly important factor for several reasons. Firstly, marketers are no more relying solely on advertising so they are switching marketing budgets to other communicational tools (Wells, Burnett and Moriarty, 2003; Belch and Belch, 2004). Secondly, studies are showing that there is an increase in nondurable product buying decisions at the point of purchase (Gordon and Valentine, 1996; Scheier and Egner, 2003; Silayoi and Speece, 2004). Indeed, with the introduction of the self-service retail the salesman as the communicator and mediator has been removed from the process and the role of packaging changed because information to consumers has to be put on the package (Olsson and Györei, 2002). Development in retail resulted with larger outlets providing the proliferation of products, offering consumers vast choice and resulting with more competitive context

317
I n t e r n a t i o n a l J o u r n a l o f M a n a g e m e n t C a s e s
(Silayoi and Speece, 2004). And finally, there is growing management recognition of the volume of packaging as an element of differentiation and product’s attractiveness (Krishna and Raghubir, 1999; Folkes and Matta, 2004; Yang and Raghubir, 2005; Raghubir and Greenleaf, 2006), which is pointing the packaging as a vehicle for communication and branding (Underwood and Ozzane, 1998; Silayoi and Speece, 2004). In this context, packaging became an essential part of the selling process (Rettie and Brewer, 2000).
Packaging and marketing communications
Packaging is becoming a very important part of marketing communications because of its ability to communicate messages to consumers within the retailing environment. As for the advertising in general, the packaging should try to attract and keep the consumer’s attention to be effective by the deployment of various messages (De Pelsmacker, Geuens and Van den Bergh, 2004). Fill (2006) explained the marketing communications aspect of packaging by pointing out colour, shape, package size and the carried information (i.e. labels) as the communication dimensions of packaging. For some reason, he omitted packaging material as the communication dimension while some other authors (e.g. Kesic, 1997; Shimp, 2003; Underwood, 2003) usually consider it as an integral part of the package structure and, therefore, as a communicator. Shimp (2003) argued how the sales often increase when upgraded packaging materials are used to design more attractive and effective packages, which is the result of packaging material attributes arousing consumers emotions, usually subconsciously.
The packaging form can communicate images that influence consumer perception, appeal to the consumer’s emotions, and motivate desire for the product before the consumer ever reads the label or sees the actual product (Meyers and Lubliner, 1998). Since packaging is obviously a necessity because of its utilitarian nature, consumers do not tend to often stop to think what the pack is communicating, like it is a case with other persuasive means of communication (e.g. advertising), so it is more likely to get the message through (Verebelyi, 2000). Packaging is also important builder of brand personality, which is improving consumer loyalty (Smith and Taylor, 2004). It must not be forgotten that packaging is
the last and sometimes the only opportunity to communicate with and sell to a customer (ibid).
Packaging as an element of branding
As it was mentioned, one of the functions of packaging within marketing communications is to help to build brand personality and to create links with consumers. According to Gobé (2001) and his ‘emotional branding’, a brand is brought to life first and foremost by the personality of the company behind it and that company’s commitments to reaching people on an emotional level. Packaging could be concerned as a brand element which is having important brand equity benefits for a company (Keller, 2003).
Packaging communicates brand personality via multiple structural and visual elements, including a combination of brand logo, colours, fonts, package materials, pictorials, product descriptions, shapes and other elements that provide rich brand associations (Underwood, 2003). A study by Pieters and Warlop (1999) shows that brand choice can be predicted from observations of the visual attention to the packages of competing brands. Recent research (Warlop, Ratneshwar and van Osselaer, 2005) showed that in a situation when brand names are highly similar, differentiation in packaging shapes and colours can enhance accuracy in memory-based quality judgements. Therefore, packaging should be concerned as an important brand differentiator. This is especially important if the brand perception is considered as a result of both visual and non-visual experience through all the senses (Lindstrom, 2005). According to Lindstorm (2005) and results of his study, consumers are strongly associated with the packaging and packaging material (e.g. Coca-Cola or Absolut Vodka bottle), while the change of packaging design can sometimes result with the downgraded structure of the brand. The packaging becomes a manifestation of the brand itself and, because a brand is more than just the product itself, the packaging becomes a compound of consumers’ perceptions, memories, and feelings (Calver, 2004).
Packaging and design
Packaging design needs to address many requirements. According to the packaging industry reports (Oertel, Peterman, and Scherz, 2002; Future Innovation Today, 2006), usage
I n t e r n a t i o n a l J o u r n a l o f M a n a g e m e n t C a s e s
318
convenience of packaging is one of the key drivers because busier lifestyles, smaller household units and a general lack of time is changing consumption habits. Therefore, it is the task of design to create packaging that will comply with the consumer’s perception of convenience. Marketers are usually conducting various packaging related tests and are researching consumer’s preferences toward product and its packaging in order to determine the packaging design’s success (e.g. Malhotra and Birks, 2003; Calver, 2004). However, those research activities are commercial in their nature and mostly confidential, while the findings are related only to the particular package rather to the packaging in general and are not published publicly, despite its potential value and contribution to the wider knowledge. Packaging design literature recognised the growing importance of design in area of packaging and its implications on product’s branding and differentiation. However, available literature (e.g. Fishel, 2003; Calver, 2004; Gordon, 2005; Hargreaves, 2006; Groth, 2006; Klimchuk and Krasovec, 2006) is mostly focused on ‘design cases’ and stories about successful brands. This could be considered as a helpful tool for practitioners and apprentice designers but with limited scientific contribution. Unfortunately, there is little general empirical research (Rettie and Brever, 2000).
Packaging design is usually going through the process of permanent improvement in both technical and aesthetical view. It is industry practice to improve packaging design in order to improve the visual dimension of the product or to improve the logistic function by decreasing the packaging weight and optimizing the package’s design. For example, the lightweighting of the package results with the reduction of used raw materials making also environmental benefits and cost savings (Ortel, Petermann and Scherz, 2002). However, research results indicate that a trade-offs has to be made by manufacturers and package designers between the ability of modified packages to draw attention and to avoid negative package evaluations of such packages (Schoormans and Robben, 1997). Moderate package deviations of modified packages appeared to give the best
trade-off with regards to drawing attention and creating favourable consumer evaluations of a well-established brand (ibid).
In the process of packaging design and development the usage of visual codes should be adapted to the specifics of the target segment. While for adults brand name and/or logo could be perceived as important and distinctive parts of packaging design, children’s evoked set is not just a list of brand names in the mind, but an elaborate symbolic environment made up of visual and verbal codes in which the brand name is nested (McNeal and Ji, 2003). Furthermore, consumer’s culture is also important factor that should be taken into consideration (e.g. Saito, 1999). Research studies also show a presence of some apparent inconstancy between marketing practitioner and children’s views, and illustrate the possibility of adults underestimating how aware children are as consumers in today’s society (Hill and Tilley, 2002).
In the field of packaging design and its communicational function it is necessary to mention the Bloch’s Model of Consumer Responses to Product Form. The model describes how the form of a product relates to consumers’ psychological and behavioural responses (Figure 1). According to Bloch (1995), the physical form or design of a product is an unquestioned determinant of its marketplace success. Bloch’s model concentrates on response to product form and discusses the problem of gaining attention in cluttered markets (Rettie and Brewer, 2000). Based on the Bloch’s model, the ideal form is that form which is superior to alternatives in its ability to evoke positive beliefs, positive emotions, and approach responses among members of the target market; it should be sympathetic with consumers’ aesthetic tastes and should complements existing assortment of goods (Bloch, 1995). When it comes to the design and the new product development it is necessary to define the project with enough details to be understandable for both designer and packaging producer.
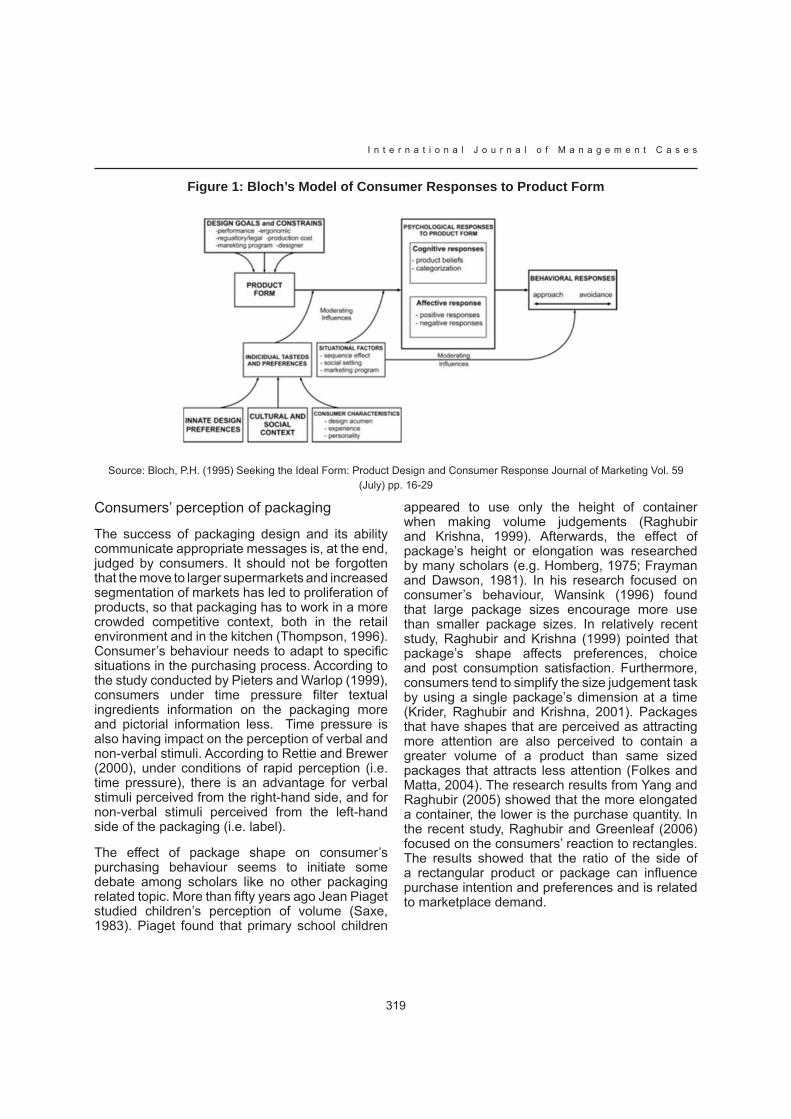
319
I n t e r n a t i o n a l J o u r n a l o f M a n a g e m e n t C a s e s
Figure 1: Bloch’s Model of Consumer Responses to Product Form
Source: Bloch, P.H. (1995) Seeking the Ideal Form: Product Design and Consumer Response Journal of Marketing Vol. 59 (July) pp. 16-29
Consumers’ perception of packaging
The success of packaging design and its ability communicate appropriate messages is, at the end, judged by consumers. It should not be forgotten that the move to larger supermarkets and increased segmentation of markets has led to proliferation of products, so that packaging has to work in a more crowded competitive context, both in the retail environment and in the kitchen (Thompson, 1996). Consumer’s behaviour needs to adapt to specific situations in the purchasing process. According to the study conducted by Pieters and Warlop (1999), consumers under time pressure filter textual ingredients information on the packaging more and pictorial information less. Time pressure is also having impact on the perception of verbal and non-verbal stimuli. According to Rettie and Brewer (2000), under conditions of rapid perception (i.e. time pressure), there is an advantage for verbal stimuli perceived from the right-hand side, and for non-verbal stimuli perceived from the left-hand side of the packaging (i.e. label).
The effect of package shape on consumer’s purchasing behaviour seems to initiate some debate among scholars like no other packaging related topic. More than fifty years ago Jean Piaget studied children’s perception of volume (Saxe, 1983). Piaget found that primary school children
appeared to use only the height of container when making volume judgements (Raghubir and Krishna, 1999). Afterwards, the effect of package’s height or elongation was researched by many scholars (e.g. Homberg, 1975; Frayman and Dawson, 1981). In his research focused on consumer’s behaviour, Wansink (1996) found that large package sizes encourage more use than smaller package sizes. In relatively recent study, Raghubir and Krishna (1999) pointed that package’s shape affects preferences, choice and post consumption satisfaction. Furthermore, consumers tend to simplify the size judgement task by using a single package’s dimension at a time (Krider, Raghubir and Krishna, 2001). Packages that have shapes that are perceived as attracting more attention are also perceived to contain a greater volume of a product than same sized packages that attracts less attention (Folkes and Matta, 2004). The research results from Yang and Raghubir (2005) showed that the more elongated a container, the lower is the purchase quantity. In the recent study, Raghubir and Greenleaf (2006) focused on the consumers’ reaction to rectangles. The results showed that the ratio of the side of a rectangular product or package can influence purchase intention and preferences and is related to marketplace demand.

I n t e r n a t i o n a l J o u r n a l o f M a n a g e m e n t C a s e s
320
Figure 2: Conceptual model of packaging elements and product choice
Source: Silayoi, P. and Speece, M. (2004) Packaging and purchase decision: An exploratory study on the impact of involvement level and time pressure British Food Journal Vol. 106 No. 8 p. 624
Based on their research findings, Silayoi and Specee (2004) developed a conceptual model of packaging elements and product choice (Figure 2). According to the model, visual elements influence the product choice more in the low involvement situation, while informational elements tend to play a key role in higher involvement situation However, it should be noted that their findings on the packaging technology are more dealing with the convenience than with the communicational dimensions per se. This approach favours the consumer’s rational perception of the package and minimises the irrational component. The research findings also show that informational elements on the label are becoming increasingly important and influence choice because the participants tended to judge food product performance by reading the label if they were considering products more carefully.
CONCLUSIONWith no doubt, packaging is today concerned as an important part of marketing process. Its role is well recognised within marketing communications, branding, design, and even in the context of consumer behaviour. However, it should be concluded that most of the packaging related topics are still not getting much attention from researchers. Some areas, like the influence of the shape on consumer, attracted some attention from researchers with a number of published studies. However, the majority of topics are still having a huge research potential. The communicational dimensions elements of packaging need to be further explored in the marketing context, especially the role of packaging material and its communicational value. The influence of packaging size has been somewhat explored, but there are still gaps and some of the research should be replicated on a larger scale. Packaging design, on the other hand, is a well presented topic from the practitioners’ point of view but there is very little of empirical research. There are also just few marketing models related

321
I n t e r n a t i o n a l J o u r n a l o f M a n a g e m e n t C a s e s
to packaging and further research is needed if packaging would like to be concerned as an element of the communicational mix by the main-stream marketing theoreticians. Without marketing models, research and related findings there is not enough material about packaging that could be used in the marketing textbooks. However, it is the author’s belief that packaging will attract much more attention in the future because of the current trends on the consumer market and the switching of marketing budgets. Probably the key for making the area of packaging more attractive from the marketing point of view is also the availability of research funding which will have to increase as the interest of practitioners for packaging related topics is growing.
REFERENCESAmpuero, O. and Vila, N. (2006) Consumer perceptions of product packaging Journal of Consumer Marketing Vol. 23 No. 2 pp. 100-112
Belch, G.E. & Belch, M.A. (2004) Advertising and promotion: An integrated marketing communications perspective New York: McGraw-Hill/Irwin
Bloch, P.H. (1995) Seeking the Ideal Form: Product Design and Consumer Response Journal of Marketing Vol. 59 (July) pp. 16.-29
Converse, P.D. (1926) Some Notes on Marketing Functions The Journal of Political Economy Vol. 34 No. 3 pp. 377-382
Dichter, E. (1957) The Package and the Label London: Packaging Carton Research Council. In: Vazquez, D., Bruce, M. and Studd, R. (2003) A case study exploring the packaging design management process within a UK food retailer British Food Journal Vol. 105 No. 9 pp. 602-617
Encyclopaedia Britannica (2006) http://www.britannica.com/eb/article-9057931 [accessed 10.09.06]
Fill, C. (2006) Marketing communications: contexts, strategies, and applications Harlow: Pearson Education
Fishel, C. (2003) Design Secrets: Packaging Gloucester: Rockport Publishers
Folkes, V. and Matta, S. (2004) The Effect of Package Shape on Consumers’ Judgements of
Product Volume: Attention as a Mental Contaminant Journal of Consumer Research Vol. 31 September pp. 390-401
Frayman, B.J. and Dawson, W.E. (1981) The effect of object shape and mode of presentation on judgements of apparent volume Perception and Psychophysics Vol. 29 No. 1 pp. 56-62
Future Innovation Today (2006) Consumer Packaging Report 2005/6 London: Rexam
Gobé, M. (2001) Emotional Branding: The New Paradigm For Connecting Brands To People New York: Allworth Press
Gordon, S.K. (2005) Packaging Makeovers: Graphic Redesign For Market Change Gloucester: Rockport Publishers
Gordon, W. and Valentine, V. (1996) Buying the brand at the point of choice London: MRS Conference
Groth, C. (2006) Exploring Package Design Clifton Park: Thomson Delmar Learning
Hargreaves, B. (2006) Successful Food Packaging Design Mies: RotoVision
Heckman, J.H. (2005) Food packaging regulation in the United States and the European Union Regulatory Toxicology and Pharmacology Vol. 42 No. 1 pp. 96-122
Hill, H. and Tilley, J. (2002) Packaging of children’s breakfast cereal: manufacturers versus children British Food Journal Vol. 104 No. 9 pp. 766-777
Jahre, M. & Hatteland, C.J. (2004) Packages and physical distribution: Implications fro integration and standardisation International Journal of Physical Distribution & Management Vol. 34 No. 2 pp.129-139
Keller, K.L. (2003) Strategic Brand Managemet: Building, Measuring, and Managing Brand Equity Upper Saddle River: Pearson Education
Kesic, T. (1997) Marketinska komunikacija (Marketing communications) Zagreb: Mate
Klevås, J. (2005) Organization of packaging resources at product-developing company International Journal of Physical Distribution & Management Vol. 35 No. 2 pp.116-131
I n t e r n a t i o n a l J o u r n a l o f M a n a g e m e n t C a s e s
322
Klimchuk, M.R. and Krasovec, S.A. (2006) Packaging Design: Successful Product Branding From Concept To Shelf Hoboken: John Wiley & Sons
Kotler, P. (2003) Marketing Management New Jersey: Pears Education
Krider, R.E., Raghubir, P. and Krishna, A. (2001) Pizzas: π or Square? Psychophysical Biases in Area Comparisons Marketing Science Vol. 20 No. 4 pp. 405-425
Lien, N-H. (2002) Elaboration Likelihood Model in Consumer Research: A Review Proceedings of the National Science Council of Republic of China Vol. 11 No. 4 pp. 301-310
Literature Reviews (2006) http://www.unc.edu/depts/wcweb/handouts/
literature_review.html [accessed 25.10.06]
Malhotra, N.K. and Birks, D.F. (2003) Marketing Research: An Applied Approach Harlow: Pearson Education
McNeal, J.U. and Ji, M.F. (2003) Children’s visual memory of packaging Journal of Consumer Marketing Vol. 20 No. 5 pp. 400-427
Meyers, H.M. and Lubliner, M.J. (1998) The Marketers Guide to Successful Package Design Chicago: NTC Business Books
Nancarrow, C., Wright, L.T. and Brace, I. (1998) Gaining competitive advantage from packaging and labelling in marketing communications British Food Journal Vol. 100 No. 2 pp. 110-118
Oertel, D., Peterman, T. and Scherz, C. (2002) Technologische Trends bei Getränkverpackungen und ihre Relevanz für Ressourcenschonung und Kreislaufwirtschaft (Technological trends in beverage packaging and its relevance for the economy of resources protection and circulation) Bonn: Das Büro für Technikfolgen-Abschätzung beim Deuthchen Bundestag (TAB)
O’Keefe, D. (2002) Persuasion: Theory & Research 2nd ed. London: Sage Publications
Olsson, A. and Györei, M. (2002) Packaging throughout the Value Chain in the Customer Perspective Marketing Mix Packaging Technology and Science No. 15 pp. 231-239
Olsson, A., Petterson, M. and Jönson, G. (2004) Packaging demands in the food service industry Food Service Technology Vol. 4 pp. 97-105
Pieters, R. and Warlop, L. (1999) Visual attention during brand choice: The impact of time pressure and task motivation International Journal of Research in Marketing Vol. 16 No. 1 pp. 1-16
Pilditch, J. (1973) Silent Salesman: How to Develop Packaging that Sells 2nd revised ed. London: Business Books Limited
Prendergast, G. and Pitt, L. (1996) Packaging, marketing, logistics and the environment: are there any trade-offs? International Journal of Physical Distribution & Logistics Management Vol. 26 No. , pp. 60-72
Raghubir, P. and Greenleaf, E (2006) Ratios in Proportion: What Should be the Shape of the Package Journal of Marketing Vol. 70 No. 2 pp. 95-107
Raghubir, P. and Krishna, A. (1999) Vital Dimensions in Volume Perception: Can the Eye Fool the Stomach? Journal of Marketing Research Vol. 36 pp. 313-326
Rettie, R. and Brewer, C. (2000) The verbal and visual components of package design Journal of Product & Brand Management Vol. 9 No. 1 pp. 56-70
Robertson, G.L. (2005) Food Packaging: Principles and Practice Abingdon: Taylor & Francis Ltd.
Rundh, B. (2005) The multi-faceted dimension of packaging – Marketing logistic or marketing tool? British Food Journal Vol. 107 No. 9 pp. 670-684
Saito, Y. (1999) Japanese Aesthetics of Packaging The Journal of Aesthetics and Art Criticism Vol. 57 No 2 pp. 257-265
Saxe, G.B. (1983) Piaget and Anthropology American Anthropologist, New Series Vol. 85 No. 1 pp. 136-143
Scheier, C. and Egner, S. (2003) Tracking Consumer Attention At The Point-Of-Sale: New approach and case study Amsterdam: ESOMAR
Schoormans, J.P.L. and Robben, H.S.J. (1997) The effect of new package design on product attention, categorization and evaluation Journal of Economic Psychology Vol. 18 pp. 271-287
323
I n t e r n a t i o n a l J o u r n a l o f M a n a g e m e n t C a s e s
Shimp, T.A. (2003) Advertising, Promotion, and Supplemental Aspects of Integrated Marketing Communications Mason: South-Western
Silayoi, P. and Speece, M. (2004) Packaging and purchase decision: An exploratory study on the impact of involvement level and time pressure British Food Journal Vol. 106 No. 8 pp.607-628
Smith, P.R. and Taylor, J. (2004) Marketing Communications: An Integrated Approach 4th ed. London: Kogan Page
Underwood, R.L. (2003) The communicative power of product packaging: Creating brand identity via lived and mediated experience Journal of Marketing Theory and Practice Vol. 11 No. 1 pp. 62-76
Underwood, R.L. and Ozzane, J.L. (1998) Is your package an effective communicator? A normative framework for increasing the communicative competence of packaging Journal of Marketing Communications Vol. 4 No. 4 pp. 207-220
Underwood, R.L., Klein, N.M. and Burke, R.R. (2001) Packaging communication: attentional effects of product imagery Journal of Product & Brand Management Vol. 10 No. 7 pp. 403-422
Vanderblue, H.B. (1921) The Functional Approach to the Study of Marketing The Journal of Political Economy Vol. 29 No. 8 pp. 676-683
Verebelyi, N. (2000) The power of the pack Marketing (UK) 27 March p. 37
Wansink, B. (1996) Can Package Size Accelerate Usage Volume? Journal of Marketing Vol. 60 No. 3 pp. 1-14
Wansink, B. and van Ittersum, K. (2003) Bottoms up! The Influence of Elongation on Pouring and Consumption Volume Journal of Consumer Research Vol. 30 pp. 455-463
Warlop, L., Ratneshwar, S. and van Osselaer, S.M.J. (2005) Distinctive brand cues and memory for product consumption experiences International Journal of Research in Marketing Vol. 22 pp. 24-44
Wells, W., Burnett, J. and Moriarty, S. (2003) Advertising principles and practice New Jersey: Pearson Education
Yang, S. and Raghubir, P. (2005) Can bottles speak volumes? The effect of package shape on how much to buy Journal of Retailing Vol. 81 No. 4 pp. 269-281
ABOUT THE AUTHORNikola Draskovic is a PhD student at the Metropolitan University of Leeds and marketing and sales deputy director at the Croatian subsidiary of Swiss owned glass corporation Vetropack. His current research is focused on the role of packaging within marketing communications.
I n t e r n a t i o n a l J o u r n a l o f M a n a g e m e n t C a s e s
324
SHOPPING CENTRES IN TOWN VERSUS OUT OF TOWN
JOHN TEMPERLEYLEEDS METROPOLITAN UNIVERSITY, UK
Abstract
This paper examines developments in shopper’s usage and experiences using Leeds City centre shopping facilities as its UK example. The UK has Europe’s highest proportion of total retail space within shopping centres,32% compared with 29% France and 10% Germany ( Birkett 2000 ) City centres have faced strong competition from other retail forms such as – mail order ,internet retailing, other local retail centres within a city or edge of city/motorway developments such as regional centres. Current shopping trends in the face of these developments are explored in the form of a review of existing published work including how Leeds shopping facilities and shopper profiles relate to both UK and International examples.
The planned shopping centre as opposed to a city centre shopping district has arisen as a viable alternative to these counter city centre shopping trends. It has more control over its tenant mix ( Kirkup and Rafiq 1994) and can therefore be positioned and marketed as unit (Dawson and Lord 1985) Regional shopping centres have generated considerable interest due to the fact that they come closest to offering the complete alternative to city centre shopping. In the case of Leeds the major alternatives are the Meadowhall centre near Sheffield and the more local out of town centre development off the M621 near Batley.
In terms of comparing and contrasting the relative attractions of these differing retail locations to shoppers experiential marketing needs to be recognised as an important factor as well as the tenant mix (Schmitt 1999) Factors to be considered in this area cover the ability to excite the shopper with a mix of shops, catering and entertainment facilities including cinemas on offer. In addition the experience and atmospherics generated by the stores themselves cannot be ignored.
Consideration is therefore given to how these conflicting trends impact on the shopper and
their shopping experiences. A set of tentative conclusions on the potential for resurgence in in –town shopping centres compared to regional shopping centres and other alternatives.
Key words: Planned shopping centres, retail location
Introduction The UK has Europe’s highest proportion of total retail space within shopping centres,32% compared with 29% France and 10% Germany (McGoldrick PJ 2002 a citing Birkett 2000 ) All retail formats now face strong competition from each other such as – mail order ,internet retailing, other local retail centres within a city or edge of city/motorway developments such as regional centres. Current shopping trends in the face of these developments are explored in the form of a review of existing literature on UK planned shopping centres related to Leeds City Centre shopping facilities and shopper preferences with a view to further study.
Planned Shopping CentresThere are around 225 shopping centres in the UK that meet the definition of shopping centres given below (Dennis et al a 2005, Warnaby et al a 2005)
A planned retail development comprising at least three shops, under one freehold, managed and marketed as a unit with a minimum gross retail area of 5000m2
These centres are a major part of the UK retail scene .They have been the subject of major research from a number of different aspects ( Warnaby 2005) covering their impact on town centres particularly unplanned retail provision ,consumer choice and preferences and more recently effective marketing

325
I n t e r n a t i o n a l J o u r n a l o f M a n a g e m e n t C a s e s
and promotion (Warnaby et al b 2005, Dennis et al b2005 , Kirkup and Rafiq 1999 )
Planned or Covered shopping centres (incorporating in-town and out – of town schemes) are the largest sector of the retail market .This is a buoyant sector with the total amount of letting space has increased by over 10% in the period 2001 to 2005 from 13.9 million sq meters to 15.4 million sq meters as a result of both new schemes and extensions to others. (Keynote 2006 a)
In – town shopping centres are the majority sector within this sector accounting for around 93% of total shopping centre letting space in 2005 based on 1100 centres. The rest is accounted for by 8 regional out-of –town centres the three largest being the Metro Centre in Gateshead ( 165,3562 sq metres ) Bluewater in Kent and the Whitgift Centre in Croyden.
Some recently revamped in –town shopping centres such as the Arndale centre in Manchester ( 130,060 sq metres and the Bullring Birmingham ( 124,900 sq metres ) are comparable in size and attractiveness to shoppers. Currently there are no comparable existing developments in Leeds City centre whose nearest rival is Meadowhall Sheffield covering 132,800 sq metres .( Keynote 2006 b)
International Comparisons Based on the analysis above it is evident that when we compare the UK to the US the home of the shopping mall we can see why we do not have the same problems that US cities have experienced (Dennis 2005) Probably currently the worlds busiest centre is the Mall of America in Bloomington Minnesota which attracts around 40 million visitors per year ( Keynote 2006 c)
According to Cushman and Wakefield’s Shopping Centre Development report (Keynote 2006 d) the total letting area of shopping centres continues to increase at a significant rate throughout Europe and beyond .34 European countries were surveyed and the total has been increasing at around 5% per year in recent years. A current total in 2005 of 88.1 million sq metres is forecast to rise to 95 million sq metres at the end of 2006 and the major countries are the UK France and Germany with the UK having the largest Shopping Centre floor space .in Europe. This trend is not confined to the enlarged Europe however with examples such as Beijing’s Golden Resources Shopping Mall at
600,000 sq metres opening in 2004 followed by the Mall of Arabia in Dubai UAE at 929,000 sq metres in 2006. The trend for covered shopping centres is therefore becoming a global phenomena and one of significant increases in scale. (Keynote 2006 e)
Future Trends The planned shopping centre as opposed to a city centre shopping district has therefore arisen as a viable alternative to traditional city centre shopping .Current forecasts are that a substantial amount of additional shopping centre space will be added to the market between 2006 and 2010.According to a research report by property consultants Colliers in November 2006 the UK shopping development pipeline is now at its highest level since the late 1980s. There is some 53.6 million sq ft scheduled for completion in the period 2006 – 2010 covering schemes under construction, planning consent or proposed. Previously the highest level was in 1990 with around 9 million starting to trade in that year current predicted completions are a peak of 11.8 million sq ft in 2009.
The large scale of this pipeline being the biggest on record suggests the possibility that either not all the proposals will get built due to the possibility of weak demand and a potential shortage of anchor tenants. In addition of the developments built not all are forecast to be winners as schemes being developed in close proximity will compete for the same consumer expenditure and possibly the same tenants (Colliers CRE 2006)
In –Town versus Out –of Town Shopping Centres The growth of regional centres has been slowed considerably due to new planning restrictions to favour town centre developments involving various new guidelines from PPG 6 1993 to PPS6 2003 ( McGoldrick 2002 b ,Dennis et al 2005 c) and the latest PPS6 Planning for Town Centres 2005 .
The PPS6 of 2005 is significant in that it is the first time that specific emphasis has been placed on the town centre to promote their vitality and viability and extends this approach to include all town centre uses – offices, leisure, catering, hotels etc
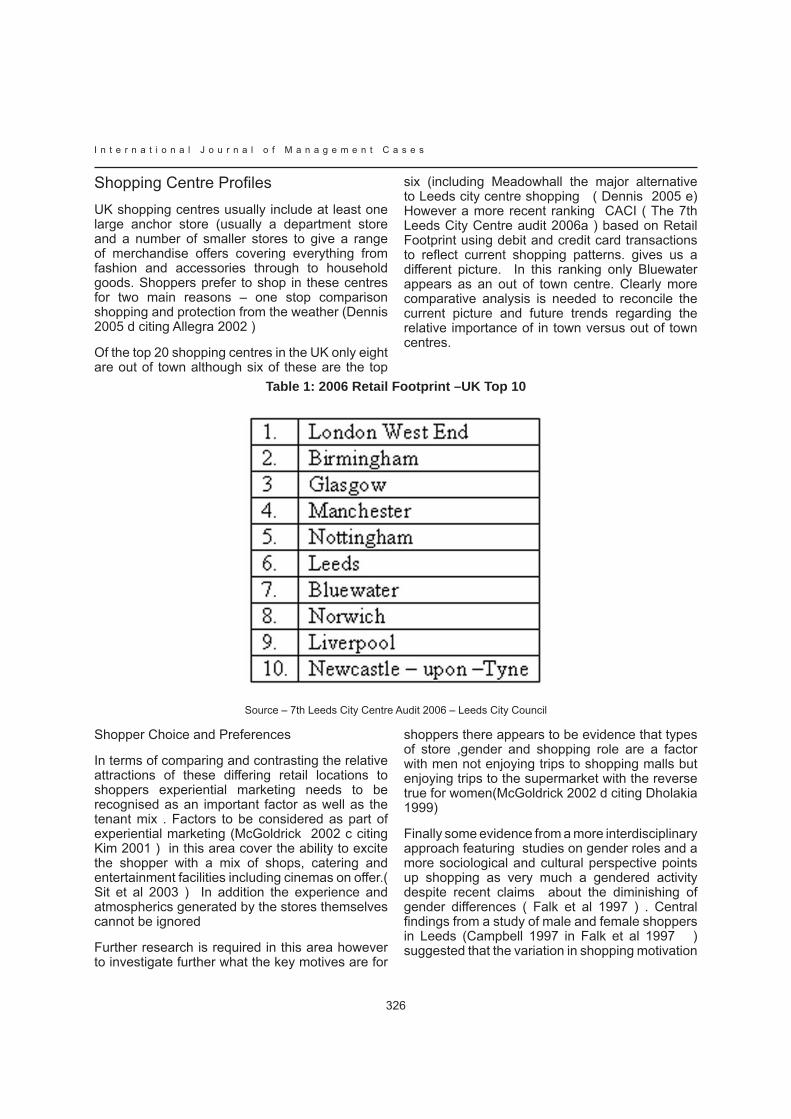
I n t e r n a t i o n a l J o u r n a l o f M a n a g e m e n t C a s e s
326
Shopping Centre Profi les UK shopping centres usually include at least one large anchor store (usually a department store and a number of smaller stores to give a range of merchandise offers covering everything from fashion and accessories through to household goods. Shoppers prefer to shop in these centres for two main reasons – one stop comparison shopping and protection from the weather (Dennis 2005 d citing Allegra 2002 )
Of the top 20 shopping centres in the UK only eight are out of town although six of these are the top
six (including Meadowhall the major alternative to Leeds city centre shopping ( Dennis 2005 e) However a more recent ranking CACI ( The 7th Leeds City Centre audit 2006a ) based on Retail Footprint using debit and credit card transactions to reflect current shopping patterns. gives us a different picture. In this ranking only Bluewater appears as an out of town centre. Clearly more comparative analysis is needed to reconcile the current picture and future trends regarding the relative importance of in town versus out of town centres.
Table 1: 2006 Retail Footprint –UK Top 10
Source – 7th Leeds City Centre Audit 2006 – Leeds City Council
Shopper Choice and Preferences
In terms of comparing and contrasting the relative attractions of these differing retail locations to shoppers experiential marketing needs to be recognised as an important factor as well as the tenant mix . Factors to be considered as part of experiential marketing (McGoldrick 2002 c citing Kim 2001 ) in this area cover the ability to excite the shopper with a mix of shops, catering and entertainment facilities including cinemas on offer.( Sit et al 2003 ) In addition the experience and atmospherics generated by the stores themselves cannot be ignored
Further research is required in this area however to investigate further what the key motives are for
shoppers there appears to be evidence that types of store ,gender and shopping role are a factor with men not enjoying trips to shopping malls but enjoying trips to the supermarket with the reverse true for women(McGoldrick 2002 d citing Dholakia 1999)
Finally some evidence from a more interdisciplinary approach featuring studies on gender roles and a more sociological and cultural perspective points up shopping as very much a gendered activity despite recent claims about the diminishing of gender differences ( Falk et al 1997 ) . Central findings from a study of male and female shoppers in Leeds (Campbell 1997 in Falk et al 1997 ) suggested that the variation in shopping motivation

327
I n t e r n a t i o n a l J o u r n a l o f M a n a g e m e n t C a s e s
correlated best with gender more than any other single variable.
The implications of this type of study point up the need for both more detailed research into this key factor and also a highlighting of the danger of too much emphasis on the shopping experience without reference to gender. The implications of the current trend towards shopping as a leisure activity with a focus on experiential marketing means that the male shopper who is focused on needs rather than wants and desires will become more and more marginalised in this emerging post – modern consumer society where the emphasis is currently focused on the type of shopping experience which has a much greater appeal to the female shopper.
Shopping Centre Marketing Management The planned shopping centre has more control over its tenant mix ( Kirkup and Rafiq 1994) and can therefore be positioned and marketed as a unit . Regional shopping centres have generated considerable interest due to the fact that they come closest to offering the complete alternative to city centre shopping. In the case of Leeds the major alternatives are the Meadowhall centre near Sheffield and the more local out of town centre development off the M621 near Batley representing more of an edge of town development plus the nearby White Rose centre representing a mini regional centre.
Active management of the shopping centre therefore appears to be the critical success factor (Howard 1997) shopping centres are therefore competing with town centre management schemes to attract shoppers. ( Alzubaidi et al 1997 ) In terms of Leeds City Centre there are currently seven indoor shopping malls with two proposed major retail developments in the pipeline Trinity Quarter ( 400,000 sq ft ) and Harewood and Eastgate Quarter ( 1.5 million sq ft ) .
Ethical Issues The impact of recent legislation has been highlighted in this paper and also previous papers reviewed however the societal aspects of these developments have not been given the same attention. .It is clear from current government policy and its impact on future development planning will play an increasingly greater role . If we examine the
specific situation in Leeds this gives us some clues as to the further direction we need to go as retail marketers and highlights the interdisciplinary and economic objectives at the same time approach needed.
The key term from public policy in the UK is sustainable development which is about improving the quality of life now and for generations to come ( 7th Leeds City Centre Audit 2006b) In Leeds this is expressed through the priorities in the Vision for Leeds 2004 to 2020 by Leeds City Council ( 7th Leeds City Centre Audit c)
It is about achieving social, environmental and economic objectives at the same time ,and not at the expense of each other . We need to link these objectives together and recognise that the decisions we take in Leeds affect the rest of the world and our children
These laudable objectives are enshrined in the revised planning system ( planning and compulsory purchase act 2004, Egan review ODPM 2004 , response to Egan review ODPM 2005 ) which is an attempt to define the key features of a sustainable community.
In addition current retail debates around issues such as more local sourcing of produce particularly food (e.g. farmers markets ) linked to carbon footprint issues and the promotion of more local retail services by independent retail groups to discourage shoppers travelling long distances.
Conclusions and Recommendations for further research It is clear that following the current and planned growth evident both in the UK and Internationally that the planned shopping centre format is a mature one and that in the UK given the direction of current government policy the balance of growth will be in city centres for the foreseeable future. In addition the size of these units has increased significantly rendering the definitions outlined in the text out of date with developments in excess of 300,000 sq metres becoming much more of the norm.
These larger units are being developed in the city centre and thus represent a significant competitive threat to out of town developments given that their size matches or exceeds out of town planned centres
I n t e r n a t i o n a l J o u r n a l o f M a n a g e m e n t C a s e s
328
.In consequence the large increase in capacity forecast indicates an increasingly competitive retail environment demonstrating the need for an increasing focus on marketing communications to ensure a successful development.
In addition shoppers preferences need further exploration from the differing shopping expectations dependent on gender roles through to its practical implications in terms of the type of shopping experience which is needed for differing genders and where a joint appeal is needed e.g. couples and families
Finally for both academic and practitioner alike there is a need for further research. We need to assess in more detail this emerging trend for a combination of a more interdisciplinary approach . This approach seeks to balance both societal and economic concerns as part of a sustainable development approach now expected by government policy and an increasing number of consumers.
References Alzubaidi H , Vignali C , Davies BJ and Schmitt R ( 1997) Town Centre versus out of town shopping : a consumer perspective International Journal of Retail and Distribution Management Vol 25 no 2 pp 78-89
P J ( 20
Colliers CRE ( 2006) Research Report : UK Shopping Centre development Pipeline Autumn 2006 www.collierscre.com accessed 14.02.07
Dennis C with Newman A and Marsland D ( 2005) Objects of Desire :Consumer Behaviour
in Shopping Centres Basingstoke :Palgrave Macmillan
Falk P and Campbell C ( 1997) The Shopping Experience London :Sage Publications
Howard E ( 1997) The Management of Shopping Centres : conflict or collaboration ? International Review of Retail, Distribution and Consumer Research Vol 7 No 3 pp263-65
Keynote ( 2006) Market Assessment Report 2006 Shopping Centres June 2006
Kirkup M and Rafiq M ( 1994) Managing tenant mix in new shopping centres International Journal of Retail and Distribution Management Vol 22 No 6 pp26-37
Kirkup M and Rafiq M ( 1999 ) Marketing Shopping Centres : challenges in a UK context Journal of Marketing Practice :Applied Marketing Science Vol 5 No 5 pp119-33
Leeds City Council ( 2006) The 7th Leeds City Centre Audit April 2006 www.Leeds.gov.uk accessed 14.02 07
McGoldrick PJ 2002) Retail Marketing 2nd ed McGraw Hill Maidenhead Berkshire
Sit J , Merrilees B and Birch D ( 2003) Entertainment –seeking shopping centre patrons :the missing segments International Journal of Retail and Distribution Management Vol 31 No 2 pp 80-94
Warnaby G , Bennison D and Davies B J ( 2005) Marketing Communications in planned shopping centres :evidence from the UK International Journal of Retail and Distribution Management Vol 33 no 12 pp 893-904

329
I n t e r n a t i o n a l J o u r n a l o f M a n a g e m e n t C a s e s
BEHAVIOURAL BRANDING - THE INTERDISCIPLINARY HILTI CASE
HANS RUEDIGER KAUFMANNINTERCOLLEGE, CYPRUS
MARTIN CAJTHAMLCEO OF THE INTERNATIONAL PLATO CENTRE OF THE INTERNATIONAL ACADEMY FOR PHILOSOPHY IN
THE PRINCIPALITY OF LIECHTENSTEIN
MICHAEL M. MEIERHILTI CORPORATION, PRINCIPALITY OF LIECHTENSTEIN
IntroductionAgencies that are concerned with destination, corporation and product branding only recently discovered corporate identity and the subsequent behavioural aspects of brand management as a promising field of action. It is obvious that in a more and more ambiguous business environment, strong brands come into existence not only with excellent products or services but with a consistent, all-encompassing and differentiated presence that can be experienced by the customer. This paper illuminates the interdisciplinary conceptual roots of behavioural branding resulting from an academic-practitioner dialogue of representatives from three Liechtenstein institutions.
Two underpinning interrelated concepts: identity and valuesSuccessful brand building today depends on aligning the day-to-day behaviour of everyone in the organization with the promise of the brand. “Live the brand” isn’t just a catchy buzzword-it’s an imperative. Behavioural branding in this sense reflects any type of brand oriented verbal and nonverbal employee behaviour that directly or indirectly determines brand experience and brand value (following Tomczak et. al. 2005).
There are two fundamental concepts that are involved in behavioural branding. The first of them is the concept of identity. The concept of identity refers to behavioural branding at least as to two aspects. The first of them is the identity of a brand or of a company as a whole. The second one is the personal identity of the employees and the role that the company values play in it. If one talks also
about the identification of the employee with the brand it should not mean that the employee and the brand become identical, but rather that the company values and goals are being interiorized by the employee. Thus no actual identification, i.e. becoming identical, takes place in this case.
The second fundamental concept is that of value. This concept is involved in behavioural branding since behavioural branding is a human action and human actions are motivated by values. The concept of identity and the concept of value are, as we shall see, mutually intertwined.
The role of identity
Whereas culture refers more to the formal and peripheral roles we play in society, identity focuses on our central spiritual or behaviouristic repertoire.
Identity is the relation each thing bears just to itself (Audi, 1995, p. 415). The sociological and philosophical discussion of identity is relatively complex and it includes many different aspects. Personal identity is the identity over time of persons (Audi, 1995, p. 660). Personal identity can be meant either in the strict sense in which no person can loose it as long as it exists or in the more psychological or ethical sense in which the same person can loose its (psychological or ethical) identity by loosing some basic character traits or set of values (character identity) that structured his or her life so far. Vice versa, this implies that a person (i.e. a sales person) might also develop a new identity based on a new set of values by morally growing through continuous reflection (see also existential identity) and affirmative coping

I n t e r n a t i o n a l J o u r n a l o f M a n a g e m e n t C a s e s
330
(Kaufmann, 1998, 2004, Snell, 1990, Wellbourne and Cable, 1995).
Burke (1991) describes the identity process as an internal control system applied by individuals to interpret events. This interpretation leading finally to emotional responses and behaviour occurs in correspondence to the different role identities (Gecas and Mortimer in Honess and Yardley, 1987) and structured relationships in which the individual is involved. The salient and determinant roles act as a kind of lense in interpreting the events (Welbourne and Cable, 1995; German, Arnett and Hunt, 2003).
Character identity refers to the qualities the individual and others attribute to self, typically expressed in terms of values, beliefs, and special character traits.
Existential identity is used to refer to the individual’s sense of uniqueness and continuity as a consequence of his/her continuous reflection of the past and anticipation of the future from the perspective of the presence (Honess and Yardley, 1987). The crucial influence of experiences, mainly positive experiences with the new system on motivation becomes obvious.
Based on this definition personal identity of an employee cannot be reduced to the identity he or she possesses in virtue of his adherence to the company values. An important aspect of the development of personal identity of the employees consists in the proper integration of the identity they have as employees in their overall identity roles as human persons. In other words, it is important that the employees integrate properly company values in the overall character identity they have as human persons. On the other hand, it might be argued that corporate culture of a company gains the more momentum the more it occupies a salient identity of its employees. As persons tend to repeatedly enact their salient identity roles as they expect a positive return from the enactment of this role a precondition for the application of the identity concept in management or marketing is the return of a value to the person being beyond an economic exchange value only (i.e. an emotional or social value) (on the application of the identity concept in marketing, see also Arnett, German and Hunt, 2003, Pracht in Kaufmann, 2005, Lins and Kaufmann, 2006).
Values and subsequent behaviour
The identity of a company may be conceived of as an identity of a specific kind of community, namely the community of the company’s employees. As phenomenological analyses of the nature of communities show, values play an essential role in the constitution of a community in virtue of their “unifying power” (see Hildebrand, 1975, p. 102-105). For this reason communities based on disvalues or idols can never constitute such a strong unity among its members as communities based on values (see Hildebrand 1975, p. 150-152) pointing to the paramount importance of a mission statement and transformational leadership (Antonakis, 2006). By value is meant here the intrinsic preciousness of something, the good as it is in itself, not as it is for someone. This objectivistic notion of value is sharply opposed to all relativistic notions of value which are fashionable in the contemporary post-modern philosophical literature (for arguments against value relativism see, for example, Spiegelberg, 1935).
Behaviour is rooted in personal values and beliefs that are transformed in tangible actions. Although company cultures are not as character shaping as national identities, many companies dispose of an individual genetic code (corporate design, code of conduct, mission statement, vision and purposes, etc) that in some instances is strong enough to create an all-encompassing company culture representing the basis for authentic brand behaviour. For any company these brand shaping “moments of truth” are essential as customer image is influenced enormously by direct interaction. As Watzlawick pointed out, one cannot not communicate, which holds especially true for companies that dispose of a heavy service component and an active sales organization (see Watzlawick et al. 1967, p. 47).
Hilti- a case study for behavioural brandingIn the following case study the authors want to exemplify a successful behavioural branding approach using a major global player in the construction industry. The Hilti Corporation developed an internationally renowned award-winning corporate culture that is transformed both intangibly and tangibly into behavioural branding.
331
I n t e r n a t i o n a l J o u r n a l o f M a n a g e m e n t C a s e s
Founded in the small Principality of Liechtenstein more than 60 years ago, Hilti is today the world leader in developing, manufacturing and marketing added-value, top-quality power tools, systems and accessories in the field of measuring, drilling and demolition, diamond coring and cutting, cutting and sanding, screw fastening, direct fastening, anchoring, installation, fire stop and foam. The company focuses on the segment of construction professionals.
In the headquarter of Hilti in Schaan, Principality of Liechtenstein about 1500 people work from a total of 39 nations representing the biggest industrial employer in the country having developed from a small family business (see URL: www.hilti.com).
Hilti not only strives for excellence in quality, research and innovation, engineering or total quality but also tries to excel in direct customer relationships and effective marketing by unique services for their clients as warranty coverage and services, world wide rapid repair service or professional advice.
This is reflected in the claims: ‘Leading partner for professionals in construction and maintenance’ and ‘Hilti.Outperform.Outlast’. In 2004 sales increased to CHF 3.3 bio representing a rise of 10% compared to 2003. The operating result increased by 8% to CHF 299 Mio. Worldwide, the Hilti Group operates in more than 120 countries with more than 18000 employees.
Expanding on the role of the corporate culture for the company’s success, Michael Hilti, chairman of the board of directors stated in a media conference in 2005: “after more than 30 years of working in our company I still find it fascinating to experience the happiness, enthusiasm and high level of commitment that our employees worldwide continue to show. The same goes for their identification with the company and its goals and values. This brings me to the topic of our mission statement and corporate culture. I view corporate culture as a very significant, if not the most significant, driver of corporate success. A clear orientation is required to harmonize personal development and corporate growth, and to be able to focus on common values and goals. …The mission statement is brief, a fact, that gives it a more powerful message: we passionately create enthusiastic customers and build a better future”(URL: http://www.hilti.com/holcom/modules/editorial/edit_singlepage.jsp?contentOID=154...).
Behavioural Branding at Hilti
At Hilti behavioural branding is seen as a seamless process that combines strategic development processes with a powerful implementation and execution program. The goal: to help everyone in the organization understand their role in shaping brand perceptions, enthusiastically support the brand-building goals and believe they make a difference.
Hilti applies a direct sales model that heavily relies on personal direct contacts with their customers. Here, behavioural branding is most visible and has the most direct influence on business success. The result in such an environment is behavioural branding in its original sense – reflecting values via personal interaction that lead to a value congruent proposition for the customer. Ideally, the salesperson creates not only a strong value proposition for the business transaction, but also convinces by company values brought to life by personal behaviour.
Hilti strikes a balance between uniform message and segment-specific positioning across more than 10,000 brand representatives in daily action. This leads to blurred borders between internal and external communication and authenticity becomes a litmus test for Hilti. Within this peculiar sales environment, Hilti has developed a very explicit corporate culture due to several reasons:
the salesperson is representing the company • on his/her own, thus acting as a brand ambassador towards the customer
a strong “esprit de corps” exists as tacit • knowledge in a direct sales force is transferred to new members via anecdotal evidence and shared experience.
Tool design, web design, sales force outfit, branded cars and gadgets are only outward pieces of evidence for a strong inherent behavioural code of conduct shared by the sales force that will be explained in more detail. It is believed that in the experience economy, Hilti can only become a preferred and trusted partner by a differentiated experience they create for the stakeholders. In this context, the Hilti brand is re-defined as the sum of the good and the not-so- good experiences stakeholders have - directly or indirectly - with products, services, communications and people. Brand is no more what is said. It is more what
I n t e r n a t i o n a l J o u r n a l o f M a n a g e m e n t C a s e s
332
is done. It is the core behavioural identity of the whole organization” (Tomczak et. al. 2006, p. 16).
Hilti organizes its behavioural branding activities around four key processes:
Brand research as quantitative basis
Before defining or implementing any behavioural branding activities, it was imperative for Hilti to trace the origin of the brand and understand the brand character, mainly by asking customers in several countries. At the same time stakeholders were involved in discovering / co-creating an authentic brand identity. Hilti has chosen the Causal analysis (LISREL) as the key research method with additional focus groups for deeper understanding of some challenges. On the basis of this extensive brand research, the company embarked on the journey to connect people to the brand through their authentic identities and values internally and to create compelling brand experiences for respective stakeholders. The aim was and is to inculcate enthusiasm, commitment and pride amongst stakeholders and help them create a brand community / culture through experience sharing.
Sharing brand knowledge within the organization
Beyond the more theoretical brand identity and corporate culture information it is essential to use localized sources of brand knowledge and tap into the constantly evolving development of the brand itself. Here, we finally come close to the actualization of brand in the form of behaviour, albeit still in a codified form. Necessary requirements are knowledge sharing platforms like intranet, brand policies and handbooks or in house-road shows.
In this context, Hilti follows a motivational bottom-up approach with a strong involvement of employees. One example for this are monthly meetings of board members with randomly chosen employees. In these meetings, which take place in the context of a business breakfast, employees have the chance to ask questions and get board information directly from the source. From a behavioural branding perspective these meetings are especially important to learn more about brand messages and cultural developments both in the top management and among employees.
Additionally top management at Hilti spends at least 60 days in the field to both, learn from customers and disseminate their brand behaviour in tangible form.
The use of Brand Champions and brand stories
Additionally, Hilti uses key employees with a strong brand attachment and knowledge as brand champions. These colleagues undergo special training and are used to coach other employees regarding brand values. Their behaviour is essential for a multiplication of the desired corporate approach. Lately, Hilti also uses storytelling as a technique to sample and redistribute key brand stories that encapsulate the brand essence of Hilti, e.g. at the newly created Brand World at the Hilti headquarters in Schaan, Principality of Liechtenstein. This happens also with customers and their stories are later re-fed into the Hilti internal communication processes to make the brand and products tangible also for employees.
Key brand stories are designed to create a brand legend and build on existing legendary elements to form a loyal band of brand fans both internally and externally. It has proven to be necessary to define the desired and co-ordinate brand behaviour to create compelling value-adding experiences in line with expectation of stake holders.
Create tangible brand knowledge
Creating brand knowledge is a tedious and difficult process which involves interdisciplinary teams that discuss internal and external trends influencing the brand knowledge repository. The brand-as-experience perspective focuses on the associations of the company’s people, culture, programs and values -- such as making a priority of innovation, a quality- or customer-focus, or leadership. Such brand experiences and later following associations based on congruence on clients and corporate values (Kaufmann, 2005) are more endearing and more resistant to imitation by competitors than are product attributes. Following Aaker, it is much easier to copy a product than to duplicate an organization with unique values, people and behaviour (Aaker 1996, p. 232).
Hilti is pursuing this direction with strong and consistent sales force training that includes behavioural aspects. These aspects are directly
333
I n t e r n a t i o n a l J o u r n a l o f M a n a g e m e n t C a s e s
linked to the brand identity and other customer input. It comes to live not only in personal sales interaction but also in diverse customer events that are designed to make the Hilti brand more interesting and memorable. Some events are interactive and can even become a vehicle to express a customer’s identity, e.g. involving its attendants’ lifestyle.
Measuring authenticity and consistency
As the whole organization becomes enrolled to the brand culture for living the brand, Hilti has established numerous processes and activities to measure the outcome, not only on a quantitative basis but also regarding qualitative measurements. Thus it becomes possible to correct and sustain the brand experiences. Ongoing knowledge sharing and reinforcement through metrics is the basis to not only a core identity but an extended identity, which fills in the picture, adding details that help portray what the brand stands for (Aaker, 2000, p. 156). Only with constant checks can this process be measured and thus managed efficiently and effectively.
Implications for a European and global brand from a philosophical point of viewGlobally appealing philanthropic values applied by Hilti are not only reflected in their missionary phrase ‘to build a better future’ but also in the company’s image video featuring cultural understanding and ‘building bridges between people’ and in various sponsoring activities. This is in line with the following philosophical stance.
The identity of any company is always embedded in a more general kind of cultural identity, be it of regional, national or supranational kind. In our cultural environment the most general kind of cultural identity is the European cultural identity. This kind of identity has some particular features which might be worthwhile to be discussed shortly.
The most ancient source of Europe’s cultural identity is undoubtedly the Greek philosophy which in its classical period referring to Socrates, Plato or Aristotle helped to overcome both the traditional mythological image of the world and the anthropocentric relativistic interpretation of reality introduced by the Greek sophists. European culture is indebted to Greek classical philosophy
for both offering the first rational explanation of the reality as a whole and the first philosophical formulation of its great moral ideals. The most splendid examples of the first contribution are Plato’s and Aristotle’s metaphysical systems. The moral ideals are rooted in the concept of the soul and of the “care of the soul” discovered by Socrates and further developed by Plato. To Roman culture we owe a new articulation of this moral ideal in the changed social and political context. The most profound effect on the formation of European spiritual life had, however, Christianity. It absorbed and transformed the Greek and Roman moral ideal of the care of the soul and articulated the notion of man as a person, i.e. as a free and responsible agent and as a bearer of an absolute value called human dignity (see Reale 2003, p. 65-108).
From the beginning 16th century, the spiritual trend characterized by the “care of the soul” was substituted by a new spiritual trend which can be characterized as a “care of the world”. (Patočka 2002, p. 88, 247). An integral part of this new spiritual trend is the new ideal of knowledge formulated by Bacon and Descartes according to which the aim of knowledge is not anymore the contemplation of the truth as it was the case for Plato, Aristotle and the Christian philosophers and theologians, but an instrument of the domination of the world (Patočka 2002, p. 89, 247-8). A new radically rationalistic civilisation developed on the basis of this new ideal of knowledge. It helped Europe to become – for certain period of time – the leading world power, but in its ultimate consequences it led to the auto-destruction of Europe in the two world wars of the 20th century.
In the meantime the rationalistic civilisation based on science and technique was exported to the rest of the world. Thus according to Patočka, the question that Europe is facing today is ultimately the following one: Is Europe able to come back to its original spiritual inspiration, namely to the “care of the soul” or will it continue to pursue power and wealth without adequate consideration of moral and spiritual dimension? How can companies in the 21st century take advantage of these philosophical and sociological ideas to further develop their brands in an increasingly competitive environment?

I n t e r n a t i o n a l J o u r n a l o f M a n a g e m e n t C a s e s
334
ConclusionsThis paper illuminated the relevant interdisciplinary interplay between marketing, sociology and philosophy on behavioural branding. The company practice of Hilti, a blue chip in the construction industry, was chosen as an economic setting. By building on their strong corporate culture a very consistent and structured brand management process has been established that sees its key aim in nurturing and steering behavioural branding among its employees. If authentically, enthusiastically and responsibly applied corporate values might contribute to ‘build a better future’ in many respects. The application of the identity concept implying ‘the care for the soul’ might herald a new era in Marketing referring to both, in terms of salient personal identity of employees and clients as well as to meso- organizational corporate culture and macro political and economic globalization issues.
BibliographyAaker, D.A..; Joachimsthaler.E. (2000). Brand Leadership. New York The Free Press
Aaker, D.A. (1996). Building Strong Brands. New York. The Free Press, New York
Antonakis, J. (2006). Leadership: What is it and how it is implicated in Strategic Change. International Journal of Management Cases. Volume 8. Issue 4. pp. 4-20
Arnett,D.B., German, S.D. and Hunt, S.D. (2003).The Identity Salience Model of Relationship Marketing Success: The Case of Non Profit Marketing. Journal of Marketing. Vol.57. pp.89-105
Audi, R. (ed). (1995). The Cambridge Dictionary of Philosophy. Cambridge.
Herrmann, A.; Tomczak, T. ; Brexendorf, T. ; Kernstock, J. (2005). Behavioral Branding - Markenprofilierung durch persönliche Kommunikation, in: Thexis p. 28-31, 2005
Hildebrand, D.von.(1976). Ethik. Gesammelte Werke.Bd.2. Stuttgart.
Hildebrand, D.von.(1975). Das Wesen der Gemeinschaft. Gesammelte Werke. Bd. 4. Stuttgart.
Honness, T. and Yardley, K. (1987). Self and Identity: Psychological Perspectives. Wiley.
Kaufmann, H.R. (1998). Hungarian Entrepreneur-Quo Vadis? The Hongkong University of Science and Technology. IEA Press. pp. 219-222.
Kaufmann, H.R. (2005). Wirksame Oeffentlichkeitsarbeit in Museen und anderen Kultureinrichtungen. In: Adamer, I. und Quaderer, D. Moeglichkeiten und Grenzen Strategischer Kommunikationspolitik in Museen und anderen Kultureinrichtungen unter besonderer Bedeutung der Oeffentlichkeitsarbeit. pp. 19-30.
Lins, M. and Kaufmann, H.R. (2006). Die Bedeutung des Event Marketings fuer das Customer Relationship Management im Private Banking des Rheintals. In: International Journal of Management Cases. Volume 8. Issue 4. pp 70-79
Patočka, J. (2002). Sebrané spisy, Bd. III, Praha
Pracht, A. (2006). Customer Orientated Contact Management in Private Banking with Multi Channel Management. In: Kaufmann, H.R. International Customer Behaviour and Retailing Research. pp. pp 232-240. Hamburg. Dr. Kovac
Reale, G. (2003). Radici culturali e spirituali dell’Europa. Milano
Snell, R. (1990). Manager’s Development of Ethical Awareness and Personal Morality. Personnel Review.19.1.13-20
Spiegelberg, H. (1935). Antirelativismus. Zürich
Tomczak, T. Brexendorf, T.O. (2006). Morhart, F. Die Marke nach aussen und nach innen leben, in: IO New Management, p. 15-19
Watzlawick, P., Beavin, J., & Jackson, D. (1967). Pragmatics of Human Communication. W. W. Norton: New York
Welbourne, M. and Cable, D. (1995). Group Incentives and Pay Satisfaction: Understanding the Relationship Through Identity Theory Perspective. Human Relations. 48.6.pp 711-726.
www.hilti.com

335
I n t e r n a t i o n a l J o u r n a l o f M a n a g e m e n t C a s e s
FOOD CONSUMERS: STIGMATISATION AND THE MANAGEMENT OF
COMMUNICATION
POTTS, M, AND NELSON, R.QUEENS UNIVERSITY BELFAST
Abstract
Stigmatisation has only recently been linked with the perception of risk and research into this area has mainly concentrated on measuring the differences between nationalities, gender and socio-economic status. To date little has been done to assess the relationships between the effects of stigmatisation on situations and people’s decision making capabilities with regard to food. The concept of stigmatisation helps us understand why the public view certain places, products, technology and environments as dangerous and in a negative manner. The aim of this research is to provide insight into the process of stigmatisation and its relationship to the management of communication within the Northern Ireland food supply chain thereby improving relations between food consumers and those related with the agric-food industry in Northern Ireland. To meet this aim, four phases of data collection were implemented. Phase 1 employed a baseline survey to investigate consumer’s knowledge of food risk related issues, and identify how much attention consumers pay to information and what they remember about the issues. Factors affecting respondents’ recollection included how recently the event associated with the issue occurred, the level of media coverage and the reported severity of risk outcome. Phase 2 brought academic and industry professionals together in a focus group to determine areas of stigmatisation and avoidance. Phase 3 implemented in-depth structured interviews to further explore areas identified in Phases 1 and 2 of the research and explore the process of stigmatisation involved when consumers analyse food risk issues. Areas discussed during the interviews included determining the characteristics of the risk, whether the effects were immediate or long term, and how the perceived risk was communicated. Phase 4 involved surveys to investigate consumer’s knowledge of food risk
issues and determine any changes in consumer’s behaviour. Research results and conclusions of the study will be presented along with a theoretical conceptual model of particular relevance to the agric-food supply chain. This model explores the interrelationships related to the twin processes of stigmatisation and risk communication. This will be presented within an overall societal framework that recognises how social amplification operates within the consumer environment with respect to food related issues.
Key words: Stigmatisation, Food, Consumer Behaviour, Communication
INTRODUCTIONOver recent years there has been an increase in consumer concern about the management of information on food related issues which has contributed to the problem of erosion of trust between consumers, government and industry bodies. As there is a constant demand for timely information on food risk issues, risk communicators are being asked to actively involve and educate food consumers about such issues, but how effective are they at communicating this message?
There have been numerous high profile food issues in the public eye over recent years including Bovine Spongiform Encephalopathy (BSE), Salmonella in eggs and Dioxins in Belgian meat and egg products. More recently, food consumers’ attention has been directed at the possible spread of avian flu into the UK and Northern Ireland and its possible threat to human health. Due to the abundance of information available from numerous sources, food consumers have to deal with a vast array of information covering a range of issues, all relating to food. The food issues consumers face include diet related concerns including cholesterol, fat, sugar and alcohol, food contamination issues
I n t e r n a t i o n a l J o u r n a l o f M a n a g e m e n t C a s e s
336
including foreign bodies, chemical contaminants and agricultural related residues, and technological issues such as irradiation, the use of food additives and genetically modified foods.
The Nature of Risk PerceptionThere is no clear definition of risk but many explanations agree risk is associated with a degree of future loss. Risk perception theories have generally stated that the public’s perception of risk is conducted in a rational and focused manner that considers all probabilities, costs and benefits of particular outcomes through the use of strategic thinking and decision making (Knox, 2000). Determinates of risk perception are measured differently by people as everyone tends to measure the potential of any risk against criteria that is personally important to them (Hardaker et al., 2002; Slovic, 2000). This view presumes that if someone thinks something is beneficial they will tolerate the greater risk in order to attain the benefits (Dhalokia, 2001; Slovic, 2000).
Knox (2000) believes risk is perceived in terms of benefit to society and measured against variables including perceived control, risk severity, dread, familiarity, and effects to the personal and social life of the individual. Whereas Dhalokia (2001) believes risk is measured against experience, involvement, situation and emotional attachment; an idea supported by Slovic (2000) who argues people assess the possible benefits and effects of the relationship between perceived risk, perceived benefit and acceptance of the risk.
Managing Risk, Communication and Consumer BehaviourThe management of risk refers to learning how to effectively deal with risk messages so that people can assess the reliability of the message to then judge the potential risks, the associated benefits and the actions required to deal with the situation successfully (Hardaker et al., 2002). Risk management acknowledges that the ineffective management of risk can depend on consumers lacking experience and education of competent decision making and risk assessment skills (Bast, 2003; Fuller, 2001; Kettlitz, 2003), signifying a need for education in these areas. Hardaker et al. (2002) outlines the steps they recommend for assessing and overcoming risk (Figure 1). The
diagram demonstrates that managing risk is a continuous process, an idea supported by Chipman et al. (1995) and Fuller (2001), as all situations of (potential) risk should be continuously monitored and reviewed to allow individuals to be aware of future changes and the possible implications of such a situation.
Communication from sources such as the media, advisory bodies, government, and word of mouth are believed to influence changes in consumer behaviour (Davis, 2002; Garretson and Burton, 2000) causing a dramatic impact on the food industry, and more specifically on the food supply chain, e.g. food consumers perception of the short and long term effects of genetically modified foods.
Consumer behaviour refers to the dynamic process of understanding the exchanges of opinion and beliefs of consumers and industry, a process that permits forecasting of future trends in purchasing behaviour (Antonides and van Raaij, 1998). Studies have demonstrated that factors such as age, gender, education, income and demographics can influence consumer buying behaviour, decision making and risk perception (Grobe et al., 1999; Yelkur, 2000). It is evident one element of consumer behaviour refers to consumer’s search for knowledge about matters that are relevant to their individual tastes and lifestyles, which is one reason why they pay attention to risk messages. Literature highlights the need for consumers to have awareness of the potential risks and benefits associated with particular issues discussed by the government and media (Clow et al., 1998; Fuller, 2001; Kettlitz, 2003). Although it appears many of the messages are misinterpreted, resulting in dramatic and unanticipated changes in consumer behaviour, as consumers report feeling threatened and unsafe (Davis, 2002; Fuller, 2001; Yeung and Yee, 2002). This indicates a better and more comprehensive awareness of risk perception is essential for consumers if potential risk situations are to be acknowledged. An essential element of risk management is realising the role of perception and indeed risk perception.
The Role of StigmatisationIt has been documented that stigmatisation tends to be associated with risk, danger and unpredictable situations which are often connected with one’s negative emotion. These connections
337
I n t e r n a t i o n a l J o u r n a l o f M a n a g e m e n t C a s e s
with negative emotion may encourage the implementation of negative action, and such behaviour may be considered justifiable due to the individual’s belief system or their ability to only select and use negative information (Jones et al., 1984). Therefore it is comprehensible that people associate negative imagery and perception with stigma and stereotypical ideas.
Gregory et al. (1995) suggests the media plays an influential role in shaping public perception of various situations involving stigma or any possible hazard. Public perception may be influenced by the media’s ability to communicate instantly to a worldwide audience, but as with all forms of communication the issue of bias should be considered. Public misinterpretation of messages or the untrustworthiness of communication sources can influence the effectiveness of communication. Windahl et al. (1999) believe when a communication message does not have the desired effect it tends to be treated as a problem, when the real problem may be a lack of communication or using the wrong type of communication to transfer the message.
Understanding the concept of stigma should allow individuals to acknowledge that within any situation there is the possibility of both benefit and risk. It is suggested the idea of stigma arises when the public feel let down or fearful that something has gone wrong (Gregory et al., 1995). Slovic (1987) believes the source of stigma, whether it relates to places, products or technology, is considered a hazard thus intensifying the public’s reaction of dread and uncertainty. If society is to successfully progress they must acknowledge that moderate levels of risk are acceptable; thus highlighting the need for effective assessment of the risks, costs and benefits of a situation. It is recognised that stigma is associated with fear and mistrust (Gregory et al., 1995) and a method of reducing the level of public fear may be to direct communication at specific groups in a timely manner that allows consumers to understand what is being done and what future actions entail. To effectively deal with stigma open channels of communication and maintaining trusting relationships are essential.
METHODSIn order to develop a theoretical conceptual model that explores the interrelationships relating to the twin processes of stigmatisation and risk communication four methods of data collection
were implemented. Phase 1 employed a baseline survey which investigated consumer’s knowledge of 38 food risk related issues that had been in the public domain over the last few decades, to identify how much attention consumers pay to information and what they remember about these issues. Phase 2 brought academic and industry professionals together in a focus group to determine areas of stigmatisation, e.g. if foods or food products are avoided at all times, and attribute levels of risk aversion to the areas identified. Phase 3 implemented in-depth one-to-one structured interviews to further explore areas identified in Phases 1 and 2 and explore the process of stigmatisation involved when consumers analyse food risk issues. Areas discussed during the interviews included determining the characteristics of the risk, whether the effects were immediate or long term, how the perceived risk was communicated and their level of trust with various sources of food related information. Phase 4 involved surveys to further investigate consumer’s knowledge of 5 food risk issues and establish any changes in consumer’s behaviour.
RESULTS / DISSCUSSIONThe following were the main findings from each phase of data collection.
Phase 1 Findings
The results from Phase 1 illustrated that respondents recalled issues according to the recency of the issue, the nature of the risk involved and level of public profile attributed to the issue. Examination of the 38 food related issues illustrated respondents have a complex decision making process, a summary of some of the main findings are illustrated in Table 1. Responses for the issue of baby food highlighted that respondents had knowledge of the issue (13%), were able to connect it with an actual food issue (20%) but as the issue was linked with babies and human health it was associated with potential stigma (51%). Responses for factory farming indicated a low response level for each category yet 80% of references connected it with potential stigma. Fatty foods had similar findings in that only 1% of respondents demonstrated knowledge of the issue and 76% of responses connected it with potential stigma. The food related issues of avian flu and genetically modified (GM) illustrated similar findings in that respondents had reasonable knowledge of
I n t e r n a t i o n a l J o u r n a l o f M a n a g e m e n t C a s e s
338
the issues (25% and 40%) but connected it with a potentially stigmatising event. Avian flu and GM have been largely in the public eye over recent years and indeed in the case of avian flu more recently within the last year. Increased awareness of these issues is due to them being regularly in the public eye, although respondents lacked accurate knowledge and complete understanding of the potential risks and benefits.
Phase 2 Findings
In Phase 2 a focus group consisting of academic and industry professionals were used to identify areas of stigmatisation and avoidance for food consumers which could be used for prompting discussion and exploring the level of stigmatisation and avoidance respondents had during Phase 3, the one-to-one interviews. The outcomes of the focus group are summarised in Figure 2 and Figure 3.
Phase 3 Findings
Phase 3 implemented in-depth structured one-to-one interviews which further explored the findings of Phases 1 and 2, investigated the process of stigmatisation involved when consumers analyse food risk issues, assessed participants level of involvement with food, their perception of communication regarding food issues and their level of trust with these sources of communication. The findings illustrate that on the topic of involvement with food respondents pay some attention (48%) to food issues, they worry a lot (38%) and a little (38%) about how their food is produced whilst 5% do not worry at all. When respondents were asked to rate the level of importance they attribute to paying attention to information on food issues 48% stated they pay a lot of attention but then later admitted they are not particularly concerned about listening to food issues. Many respondents were of the understanding if an issue was associated with risk they would become aware of it, although they were not entirely sure how this would happen. Involvement was the only area found to be significantly (.005) influenced by gender.
The topic of communication presented mixed responses to levels of satisfaction with how food issues are communicated as respondents were dissatisfied a little (29%), neither satisfied or dissatisfied (38%) and satisfied a lot (29%). A lot of exposure to information was reported from the Health Promotion Agency (HPA) (an advisory
body offering information and support in health promotion and public health) (38%) and the media (38%). The level of trust associated with these sources of communication varied, e.g. the media (33%), government (38%), Food Standards Agency (FSA) (an independent government department established to protect the public’s health and consumer interests in relation to food) (48%) and HPA (62%) were associated with a lot of trust.
Respondents identified foods they choose to avoid, e.g. meat and cereals, and identified their main reasons for avoidance as disliking the taste of the food, having had a ‘bad experience’ related to the food, having dietary or health concerns regarding consumption, being concerned about the quality of the food, its origin and the standard of treatment it received before reaching the consumer. Discussion during the interviews revealed that many respondents avoid certain foods (e.g. certain qualities and types of meat, from certain places, e.g. certain supermarkets or shops) as they lack trust in how the food has been handled. This lack of trust was not only associated with the perceived quality or standard of service of certain supermarkets; respondents lack of trust stemmed from various points along the food supply chain.
Phase 4 Findings
The survey used during Phase 4 assessed consumer’s knowledge and behaviour toward 5 food related issues, namely avian flu, campylobacter, GM, school lunches and Sudan 1. These five issues were included in the survey in Phase 1 but further exploration of consumer’s knowledge of each issue and identification of any behavioural changes was thought necessary to allow more insight into how consumers view food issues that may be linked with stigma. The 5 issues were included as they represented current, ongoing issues, a scientifically related issue, high public profile events and a specific food risk incident.
The findings highlighted that respondents were able to link campylobacter with an actual food issue (32%) and identify the consequences of consuming school lunches (44%) e.g. linking them with children’s obesity levels. Interestingly, respondents demonstrated moderate knowledge of GM (19%) and Sudan 1 (11%) yet these issues had the highest links with potentially stigmatising information (30% and 30%) of all five issues. There were high response rates for no change to behaviour in all five issues but GM (22%) and

339
I n t e r n a t i o n a l J o u r n a l o f M a n a g e m e n t C a s e s
school lunches (29%) caused a change to personal behaviour. It appears food issues that are not constantly in the public eye tend to be forgotten; issues that consumers associate with scientific jargon, e.g. campylobacter, are discarded; and issues that the public can personally associate with, e.g. school lunches, are easily recalled and understood.
CONCLUSIONThe aim of this research was to provide insight into the process of stigmatisation and its relationship to the management of communication within the Northern Ireland food supply chain thereby improving relations between food consumers and those related with the agric-food industry in Northern Ireland. It is evident from the findings that understanding consumer’s perception and decision making regarding areas of possible risk is a complex task due to the intricacy of all the components requiring consideration. The findings have highlighted consumers tend to recall food issues depending on how recently they occurred; the level of public profile they received; how relevant or important the issue was to them personally; the level of the risk involved (e.g. whether the food issue was minor or a threat to human health); and how well the issue can be dealt with by the authorities (e.g. Sudan 1 was perceived as being a high risk issue as it had carcinogenic links but because the affected foods were quickly recalled and information was readily communicated, the level of stigma associated with it was reduced). Consideration of all these factors and their individual complexity will remain personal to each consumer as they must weigh up the potential costs and benefits of their actions to determine if the issue warrants a change in behaviour or caution toward what remains unknown.
REFERENCESAntonides, G. and van Raaij, W.F. (1998) Consumer behaviour: A European perspective. Wiley: Chichester
Bast, A. (2003) “The risk of eating: The toxicity of natural versus man-made chemicals”. In Voss, G. and Ramos, G. (eds.) Chemistry of crop protection: progress and prospects in science and regulation. Weinham: Wiley-VCH.
Clow, K.E., Baack, D. and Fogliasso, C. (1998) “Reducing perceived risk through advertising service quality cues”. Journal of Professional Services Marketing, 16, (2), pp. 151 – 163.
Chipman, H., Kendall, P., Auld, G., Slater, M. and Keefe, T. (1995) “Consumer reaction to a risk/benefit/option message about agriculture chemicals in the food supply”. The Journal of Consumer Affairs, 29, (1), pp. 144 – 164.
Davis, S. (2002) “The precautionary principle and food policy”. Consumer Policy Review, 12, (2), pp. 65 – 72.
Fuller, G.W. (2001) Food consumers, and the food industry: Catastrophe or opportunity? Florida: CRC Press.
Garretson, J.A. and Burton, S. (2000) “Effects of nutrition facts panel values, nutrition claims, and health claims on consumer attitudes, perceptions of disease related risks and trust”. Journal of Public Policy and Marketing, 19, (2), pp. 213 – 227.
Gregory, R., Flynn, J. and Slovic, P. (1995) “Technological stigma”. American Scientist, 83, (3), pp. 220 – 223.
Grobe, D., Douthitt, R. and Zepeda, L. (1999) “Consumer risk perception profiles regarding Recombinant Bovine Growth Hormone (rbGH)”. Journal of Consumer Affairs, 33, (2), pp. 254 – 275.
Hardaker, J.B., Huirne, R. B. M. and Anderson, J. R. (2002) Coping with risk in agriculture. Oxon: CABI Publishing.
Jones, E., Farina, A., Hastorf, A. H., Markus, H., Miller, D.T., Scott, R.A. and French, R. des (1984) Social stigma: The psychology of marked relationships. New York: W.H. Freeman.
Kettlitz, B. (2003) “Consumer perception of food risk and consumer trust in Europe”. In Voss, G. and Ramos, G. (eds.) Chemistry of crop protection: progress and prospects in science and regulation. Weinham: Wiley-VCH.
Knox, B. (2000) “Consumer perception and understanding of risk from food”. British Medical Bulletin, 56, (1), pp. 97 – 109.
Slovic, P. (1987) “Perception of risk”. Science, 236, pp. 280 – 289.

I n t e r n a t i o n a l J o u r n a l o f M a n a g e m e n t C a s e s
340
Slovic, P. (2000) The perception of risk. London: Earthscan Publishing.
Windahl, S., Signitzer, B. and Olson, J.T. (1999) Using communication theory: An introduction to planned communication. London: Sage.
Yelkur, R. (2000) “Consumer perceptions of generic products: A Mexican study”. Journal of Product and Brand Management, 9, (7), pp. 446 – 456.
Yeung, R. M. W. and Yee, W. M. S. (2002) “Multi-dimensional analysis of consumer-perceived risk in chicken meat”. Nutrition and Food Science, 32, (6), pp. 219 – 226.
Figure 1. Steps to assess and overcome risk
(Hardaker et al., 2002)
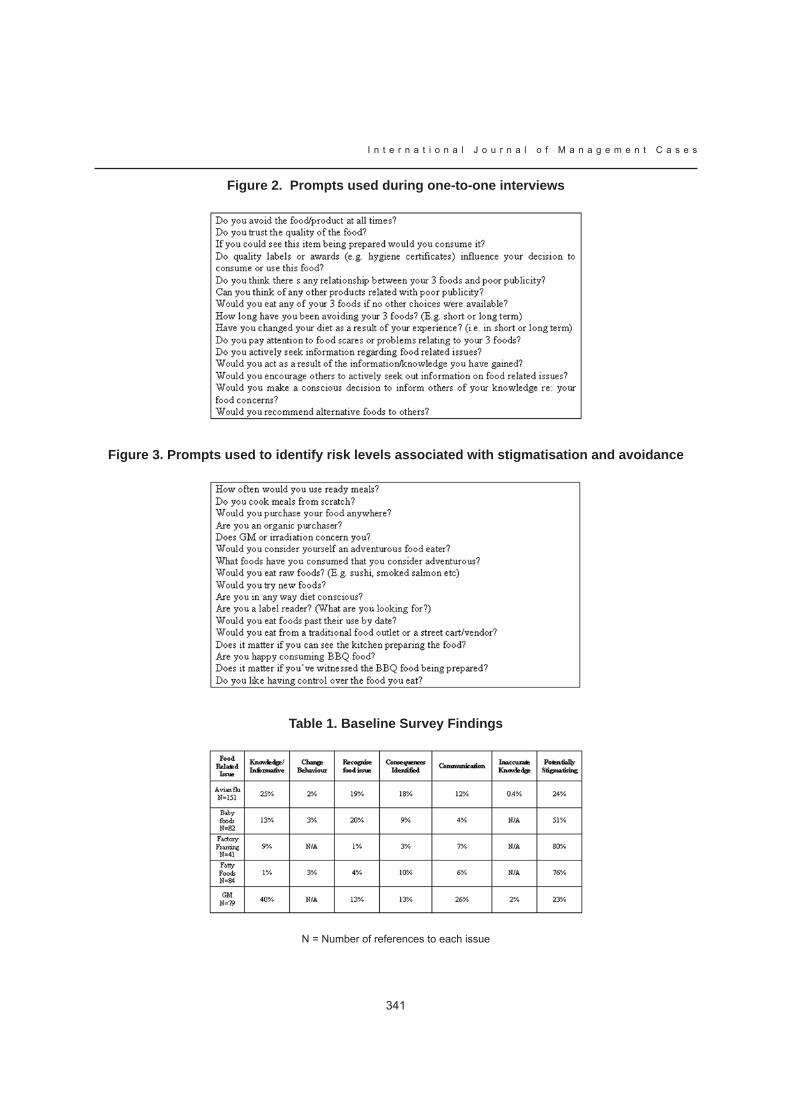
341
I n t e r n a t i o n a l J o u r n a l o f M a n a g e m e n t C a s e s
Figure 2. Prompts used during one-to-one interviews
Figure 3. Prompts used to identify risk levels associated with stigmatisation and avoidance
Table 1. Baseline Survey Findings
N = Number of references to each issue
I n t e r n a t i o n a l J o u r n a l o f M a n a g e m e n t C a s e s
342
CO-BRANDING OR ALLIANCE OF BRANDS
TIHOMIR VRANEŠEVIĆUNIVERSITY OF ZAGREB, CROATIA
MIROSLAV MANDIĆUNIVERSITY OF ZAGREB, CROATIA
SANDRA HORVATUNIVERSITY OF ZAGREB, CROATIA
Abstract
Due to the new market circumstances, many companies are starting to cooperate and form alliances with other companies in order to keep their market position or attract the new customers on the new market segments. In general, they are trying to succeed, if possible, by cooperating with other companies. Companies often do not have enough assets or they find the risk to be too high to take the advantage of the growth possibilities conditioned by globalization processes. Co-branding, as a marketing alliance of different brands formed with the intention to generate synergic effects, can help to overcome these problems. That kind of alliance can be manifested through joined promotional activities and/or through joint investments, to achieve different goals (increasing brand awareness, value affirmation, accentuation of components in a final product, exploitation of complementary abilities). For some companies, co-branding represents tactical response on current opportunities and threats on the market while others see it as a strategic directionality and prerequisite of growth and sometime even survival. With tactical response, in a form of co-branding, companies can fill their production capacities, increase revenues as well as still work on developing and maintaining market value of their brands. For the dominant brand, co-branding can, in a certain way, also provide the opportunity for widening of the brand in a unique way without endangering brand core. An interesting fact is, that if two brands engaged in co-branding do not have the same values, clients, in most cases, tend to evaluate the final product (co-branded product) according to the value of the dominant brand i.e. brand with the higher value. Also it seams that despite the lower value of one brand; the dominant brand does not need to endure great damage because clients tend to direct “shortcomings” on the brand that had lower value prior to engagement in a
co-branding relationship (Washburn, Till & Priluck, 2000, adjusted). Co-branding offers a whole range of advantages as are taking advantage of market opportunities and avoiding threats, increase in perceived quality, attracting new clients, increase in brand awareness, positive image “spill over” as well as many others. Regardless of the numerous advantages, co-branding does not guarantee success for the engaged companies and that is why before engaging in co-branding activities companies must asses will the alliance with another brand (or brands), which is not in the ownership of the company, undermine the value of their own brand. Maine reasons for failures of co-branding activities lie in the company’s late realization that aligned brands do not have equal market value within chosen clients segment and that cooperation does not bring equal benefits as well as in overestimation of clients’ abilities and willingness to realise logical connection between aligned brands.
Keywords: brand alliance, co-branding forms
IntroductionAlongside other alliances and cooperations, there is a growing number of co-branding alliances i.e. alliances connected to brand management of different company brands through which companies try to maintain, consolidate or captivate new market position for their brands.
The term co-branding, besides joined promotional activities, implies other ways and different activities that can link two brands of different companies with the intention of generating synergic effects and increasing brand value of all involved brands. It is very important that none of the brands involved in co-branding loses its own basic identity, although there are exceptions to that rule.

343
I n t e r n a t i o n a l J o u r n a l o f M a n a g e m e n t C a s e s
Today’s market relations between global, regional and local brands have more dimensions and it looks all the more like children’s game of “football with small goals”, where more teams play at the same field at the same time, and every team has its own goal to defend. The winner is the team that received the smallest number of goals. The tactic that is mostly used is quick alliances against some other team with independent defence of its own goal. The team can depend on help from the others as long as it has the ball i.e. initiative. Alliances are temporary and never completely based on unconditional trust, but rather on short-term benefits whereat every team is designing their own success strategy. Described game has a lot of similarities with today’s different strategic “alliances” that are quickly assembled and disassembled, depending on the assessment of a good response to the brand current threat and potential long term benefits or defending and capturing favourable market position on global, regional or local market.
The main reason for creating co-branding alliances is expected synergy. Companies ally in order to achieve goals they would not be able to achieve on their own. Co-branding is a medium to long-term marketing alliance, in which partners stay legally independent, because expected created value usually does not justify joint investment in creating a third company (legal entity) that would launch a new brand.
Forms of co-brandingCo-branding alliances are usually created as attempts to retain and develop each brand in an alliance, as long as the conditions for the beginning or continuing independent market presence are not realised. In Croatia, the example could be short-term alliance in which Mars used Ledo’s freezers as a distribution channel. During that time, Ledo got the opportunity to widen and deepen their assortment of ice-creams and consolidate market position of their brand, while Mars penetrated the market with low cost. Another example of co-branding could be agreement by which Podravka became general distributor for Nestlé products in Croatia.
Co-branding is sometimes also called cross-platform marketing while it reflects the idea that all participants of such association (both companies of associated brands as well as the customers)
should gain from it. Therefore it is especially important, before the company decides to use co-branding of two or more brands, to research (Temporal, 2002, adjusted):
will the clients be able to distinguish the benefits they will have as a result of co-branding
are there any similarities in client target • segments of both brands (sociodemographic and even more important psychographics similarities)
do the brands represent the same value • systems for their clients (internal and external)
are all the partners exhibiting outright • readiness to take on equal roles.
Co-branding activities according to complexity and duration of the relationshipForms of co-branding according to complexity and duration can easily be seen as:
Common promotional activities – usually • intensive short-term cooperation with the goal to remind the clients of the brand existence, encourage them to buy and use it, as well as to develop and maintain desirable image of partner brands, and all that with lower costs. This approach is generally used among strong and, at least when image is concerned, complementary brands.
Common investment and strategic alliances • – in the sense of co-branding activities that usually imply investments in:
conquering new markets with the existing • complementary brands or market acquis (e.g. advantage in distribution)
developing of the new brand and product in • order to respond on the market opportunities or engage in joint battle against competition.
Co-branding activities according to achieved value According to archived value we can distinguish several types of co-branding (Blacket & Boad, 1999, adjusted):
I n t e r n a t i o n a l J o u r n a l o f M a n a g e m e n t C a s e s
344
Co-branding used to increase awareness • about the brand – prerequisite is that all involved brands are complementary and at approximately the same level of brand awareness; usually it is carried out trough common promotional activities.
Co-branding used to validate the values • – involvement of brands with comparable market values that are not directed on the same market segments realised with the whole number of common promotional activities which can result with alignment of values if those values have not been at the same level from the beginning.
Ingredient co-branding – approach based on • the accentuation of well known brands (that are perceived to be of extreme quality) which are essential part of final product or service of host brand. In this way companies are sending a massage about the quality of the final product to current and potential customers.
Co-branding of complementary capabilities is • joining of strong complementary brands, but usually companies with strong brands that develop the product and launch new brand for that innovative product. This approach is achieved through joined investments and long-term strategic alliances.
Mutual promotional activities are used in order to sustain image and the position of corporate, mainly supporting brands – example is cooperation between McDonalds and Disney which can be called a co-branding.
Alongside companies co-branding can include organizations, associations and/or national teams with respectable sporting achievements that have certain ways of behaviour and attitudes which can be considered as their culture. For example firmness, humbleness, tradition, sporting spirit and collectiveness, alongside long-term competition successes make All Blacks (New Zealand national rugby team – multiple world champions and the best team in the world) a desirable partner in co-branding activities.
Co-branding as a partnership in brand managementSome practical examples of co-branding as a partnership primarily developed in the field of brand management (Kapferer, 2001, adjusted) are:
New product is clearly identified with mutually • created brand as in the case of yogurt ice-cream “Yolka” developed by Danone and Mott which has clear logos of both companies on the wrapper. Similarly, M&M’s and Pillsbury have created new cookies concept while Compaq and Mattel are combining their knowledge in developing new “hi-tech” interactive toys.
Many extensions are capitalising the power • of their partners’ brand - Haagen Dazs, for example, has launched Bailey’s flavoured ice-cream; brand Delicious manufactures cookies made from Chiquita bananas and Yoplait sells Cote d’Or chocolate cream.
In an effort to maximize the success of their • brand extensions many companies are expecting help from the other brands they own and whose established reputation can be crucial on the new markets. For example, Kellogg’s is extending its assortment to brand Healthy Choice which is directed to the adults who want to live healthy.
Co-branding can also help by increasing • usage of the product as in the case of joined advertising of Bacardi rum and Coca Cola. This approach is helpful seeing that it calls the attention to additional different ways of consuming Bacardi rum and it is additionally amplifying position of Coca Cola as the ideal mixing drink.
Ingredient co-branding presumes embedding • of one brand product (e.g. Intel) in the product of another brand (e.g. Compaq) what can be highlighted with a number of joined promotional activities as well as with the jointed investments and alliances. Examples could be final products that contain NutraSweet, Lycra, Woolmark, Intel or Gore-tex. Ingredient brands want the co-branding relationship to be highlighted on every product (e.g. Intel Inside” or “Sweetened with NutraSweet”) as well as in all promotional activities. According to Keller (2003, adjusted) ingredient co-branding does
345
I n t e r n a t i o n a l J o u r n a l o f M a n a g e m e n t C a s e s
not have to mean that the clients are able to clearly identify features and advantages of compounds rather that they just perceive that the “basic” brand (or the product with a brand) thereby has additional value. Ingredient co-branding can be extremely successful in increasing the value of private brands in a way that it has a strong brand as a component of the product with the private (own) brand (Vaidyanathan & Aggarwal, 2000).
Improvement or amplification of brand image • can also be a goal of co-branding as in a case of joined promotional campaign of Ariel and Whirlpool. At one time Orangina was caned in a specially designed soda cans that were developed in co-branding with popular youth brands (e.g. Lee Cooper). Renault launched limited edition of the car Twingo in cooperation with a famous designer Kenzo. Acer and Olympus engaged in a co-branding with a Ferrari after its success in Formula 1 and designed limited edition of notebooks and cameras.
Co-branding can be used as a way of • increasing sales - Whirlpool encloses coupons for Findus (brand owned by Nestle) or Bird’s Eye (brand owned by P&G) products inside the handling manuals for their products.
Loyalty programs also increasingly include • co-branding. Companies share expenses of such programmes, as well as their own brands included in the programmes. In that sense Nestle designed collection booklet which includes all brands the company owns.
Co-branding can also refer to merchant • marketing activities. For instance, a product can be designed especially for distributors and marked with both producers and distributors logo. Danone designed special yogurt for Quick (European fast food chain that competes with McDonald’s) and Yoplait did the same for McDonald’s.
Capitalization of the synergy of more brands • is also one of the co-branding forms. Nestlé is conducting joined marketing actions for more of its brands at the same time (e.g. Nestlé yogurt, Nescafé, Besquik, Herta’s pork and ham). In order to compete with Kellog’s and increase its own market share in the “breakfast” segment, Nestlé has launched joined advertising
campaigns, linking all mentioned brands around the “healthy breakfast” motive.
Branding “Coopetition”Contemporary standpoint says that strategic alliances are often necessary for achieving and maintaining competitive position. New term “coopetition” which was first introduced by Bradenburger & Nalebuff (1996; source Kapferer, 2001) refers to new circumstances in which companies cooperate and compete with each other at the same time. Although co-branding is mostly visible and companies use it in promotional activities, there are situations when companies do not want to publicly accentuate cooperation between them and their brands. Kapferer states some examples of such approach (2001, adjusted):
On the photocopier market many machines • that were sold under the brand name Canon were in fact produced by the company Ricoh which has its own brand with the same name.
Daimler-Benz Mercedes and Swatch • have undertaken joint-venture project for development and launch of Smart – new revolutionary vehicle concept. Each company has, besides funds, invested their own specific expertise but because of the perceived risk of the project Mercedes did not want the new brand directly linked to their successful brand.
In the attempt of conquering the ice-tea • market (despite late market entry) Nestle and Coca Cola have joined against competition, attacking market leader (Lipton tea produced by the company Unilever) and other brands on attractive markets. Nestea is a marginal example of public co-branding because Coca-Cola is not clearly marked on the packaging.
Advantages and risks of co-brandingDue to expected synergy co-branding offers a whole range of advantages:
taking advantage of market opportunities • (e.g. conquering new market segments) and avoiding threats (e.g. defence against competitors attack) with lower investments

I n t e r n a t i o n a l J o u r n a l o f M a n a g e m e n t C a s e s
346
intensified role of guaranties and perceived • quality due to cooperation between two or more brands (off course brands have to have positive images)
attracting new clients (e.g. clients of partner • brand) and retaining existing clients (because of greater product selection)
increasing brand awareness through news • of “cooperation” as a basic massage of promotional activities (attracting the attention by stepping back from usual promotional massages that might already bore target segments)
possibility of monitoring and preparing the • market for new products and expansion of brands (in a direction of partner brand expertise in the future and in other directions as well in an attempt to evaluate reactions of current and potential clients to such expansion)
possibility of retention and sometimes even • increase in premium prices of basic brands due to higher synergic value of both brands i.e. effects of additional value of partner brand
positive image “spill over” from one brand to • another and in that way on the image and cultural values of the companies, owners of the brands
assumption of widening and continuity of • cooperation between partner companies – even with the possibility of merger or permanent strategic activities on the market.
Companies undertake co-branding activities because they expect synergy effect but often they neglect possible difficulties and risks. Two basic assumptions for success of co-branding are complementary of brands and avoidance of decrease in market value of any brand in the “alliance”. The challenge in co-branding is to conclude are the brands compatible and will any of them suffer negative consequences because of joined actions. The biggest risks are loosing brand identity and general inferior position of the brand with reference to position before co-branding, what can result with:
diminished brand credibility•
decrease in clients’ loyalty •
weak return on investments in co-branding • activities and general
disturbed relationship with partner company in • co-branding activities.
ConclusionAdvantages of co-branding are numerous (accessing new segments, emphasised role of guarantees and perceived quality of more brands with positive image, achieving higher brand awareness through news of “alliance”, possibility of monitoring and preparing the market for new products and expansion of brands, possibility of retention of premium prices level, positive image “spill over” from one brand to another and creating assumptions for long lasting and tighter association of companies). Besides all mentioned advantages co-branding can sometimes result in development of new hybrid “brand” which has its own place on the market and can thereby endanger basic value of the brand as well as the companies which have engaged in co-branding activities in a good faith. Co-branding is an important business opportunity for many companies but possibility of failing to achieve desired goals and number of other consequences for the engaged brands also have to be taken into consideration. Reasons for failures of co-branding activities lie in the late realization that aligned brands do not have equal market value within chosen clients segment and that cooperation does not bring equal benefits as well as in overestimation of clients’ abilities and willingness to realise logical connection between aligned brands.
In thinking about conquering new segments and/or introducing new products in their assortment companies may insist on developing corporate brand, extending existing brands and introducing independent unique brands which own products or on co-branding strategy among successful complementary brands owned by different companies.
References:Blackett, T., Boad, B. (1999) Co-Branding – The Science of Alliance, MacMillan Press Ltd.
Brandenburger, A.M., Nalebuff, B.J. (1996) Co-opetition, Currency, Doubleday

347
I n t e r n a t i o n a l J o u r n a l o f M a n a g e m e n t C a s e s
Kapferer, J-N. (2001) Strategic Brand Management, Kogan Page
Keller, L.K. (2003) Strategic Brand Management, Prentice Hall
Motion, J., Leitch, Sh., Brodie, J.R. (2003) Equity in corporate co-branding – The case of Adidas and the All Blacks, European Journal of Marketing, Volume 37, Number 7/8, pp 1080-1094
Temporal, P. (2002) Advanced Brand Management, John Wiley & Sons
Vaidyanathan, R., Aggarwal, P. (2000) Strategic brand alliances: implications of ingredient branding for national and private label brands, The Journal of Product & Brand Management, Volume 9, Number 4, pp. 214-228
Washburn, H.J., Till, D.B., Priluck, R. (2000) Co-branding: brand equity and trial effects, Journal of Consumer Marketing, Volume 17, Number 7, pp. 591-604

I n t e r n a t i o n a l J o u r n a l o f M a n a g e m e n t C a s e s
348
RETAIL SECTOR IN CROATIA: GROWTH FUELED BY MARKETING INNOVATIONS
MARIJA TOMASEVIC LISANINUNIVERSITY OF ZAGREB, CROATIA
MIRKO PALICUNIVERSITY OF ZAGREB, CROATIA
Abstract
Retail industry represents vibrant and dynamic business sector in every advanced national economy. Over 14 million workers are employed in retailing in the European Union while in the United States this number is argued to be close to 20 million. In the fiscal year 2004, the global retail marketplace has been estimated at $9 trillion. During the last two decades a retail sector has undergone through a tremendous changes fuelled by innovative management thinking and development of technology. Retail companies that developed and/or adopted innovations faster gained competitive edge that enabled them to grow faster and outperform the competition. The major changes in the sector include increase in market concentration, shift of power in the channels of distribution, mergers and acquisitions, increased internationalization, widespread use of technology and innovative marketing concepts in the area of store formats, merchandising, category management, ECR, loyalty schemes, branding and so on. The purpose of this paper is to explore retail sector in Croatia and compare its developments to global trends with specific emphasis on adoption of retail innovation. Retail sector in Croatia displayed a strong growth over the past decade. In the Croatian economy retail sector contributes to BDP with 10% and accounts to 14% share of national employment. Due to the open market in the last 15 years and low market concentration a number of international retail chains set up business operations in Croatia. Within last few years market concentration (top 5 retailers) reached 51% in the year 2004 comparing to 16.6% in 2000. At the same time total number of retail stores decreased by 2.500. At the same time structure of retail stores changed and selling space has been increased as a result of more supermarket and hypermarket formats being
favoured. Innovative marketing concepts such as new store formats, merchandising techniques, category management, retail branding and private labels influenced and changed Croatian retailing forever as stronger competition on the marketplace resulted in lower prices and wider assortments. However, domestic retailers faced large international, market oriented competitors and had to adopt innovative retailing concepts fast in order to stay competitive and preserve or expand its market share. This paper explores and summarizes findings on rate of innovation adoption in the Croatian retail sector and rate of market success as a correlative relationship that has been widely accepted as a key leverage for business success of a company that operates in a volatile market environment.
Key words: retailing, marketing, innovation, Croatia
Innovations as fundamental business success driverTerm innovation has been widely used in business literature. Many authors provided different definitions. In 1968 the Zuckermann Committee defined innovation as a “series of technical, industrial and commercial steps” (Cumming, 1998). In 1969 Marquis defined innovation as “a unit of technological change” and quoted Schmookler’s definition of technical change as an enterprise production goods or services or using a method or input that is new to it” (Kandampully, 2002). Importance of this definition is the concept that only the first enterprise that adopts the change executes innovation, subsequent adopters are imitators, not innovators. Tinnesand in year 1973 published results of his research which showed that term innovation has been used for the introduction of the new idea in 36% of the cases, for the introduction
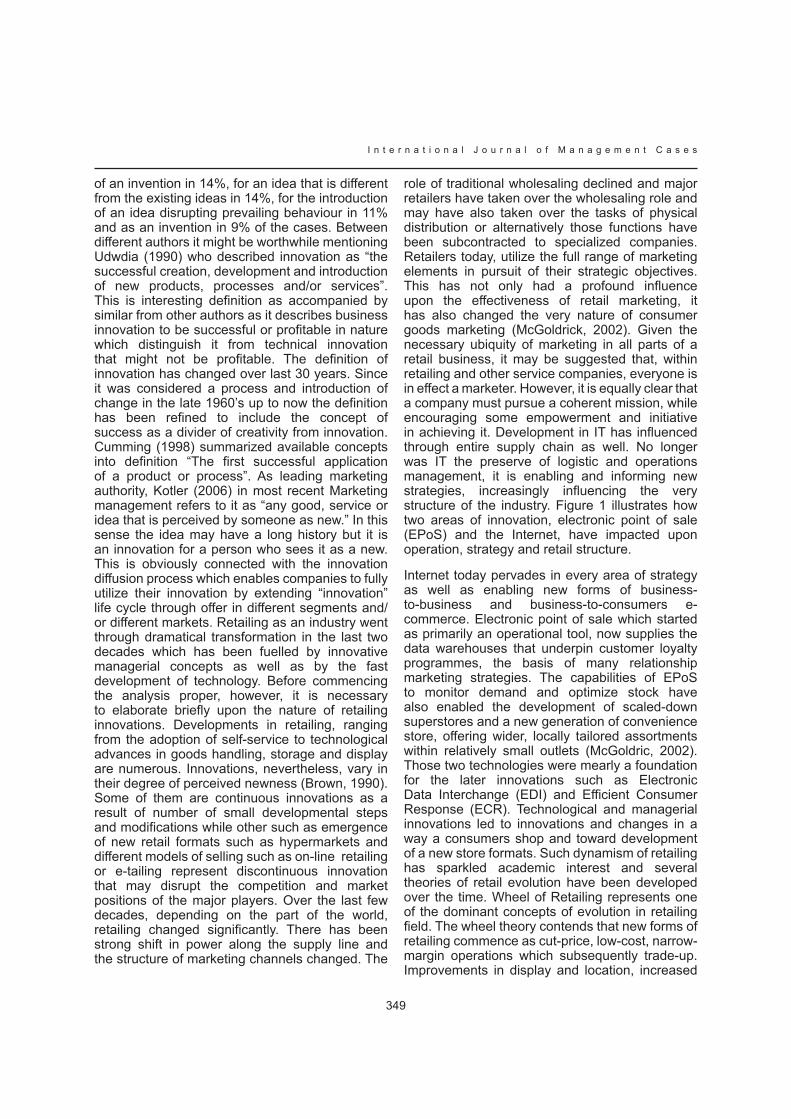
349
I n t e r n a t i o n a l J o u r n a l o f M a n a g e m e n t C a s e s
of an invention in 14%, for an idea that is different from the existing ideas in 14%, for the introduction of an idea disrupting prevailing behaviour in 11% and as an invention in 9% of the cases. Between different authors it might be worthwhile mentioning Udwdia (1990) who described innovation as “the successful creation, development and introduction of new products, processes and/or services”. This is interesting definition as accompanied by similar from other authors as it describes business innovation to be successful or profitable in nature which distinguish it from technical innovation that might not be profitable. The definition of innovation has changed over last 30 years. Since it was considered a process and introduction of change in the late 1960’s up to now the definition has been refined to include the concept of success as a divider of creativity from innovation. Cumming (1998) summarized available concepts into definition “The first successful application of a product or process”. As leading marketing authority, Kotler (2006) in most recent Marketing management refers to it as “any good, service or idea that is perceived by someone as new.” In this sense the idea may have a long history but it is an innovation for a person who sees it as a new. This is obviously connected with the innovation diffusion process which enables companies to fully utilize their innovation by extending “innovation” life cycle through offer in different segments and/or different markets. Retailing as an industry went through dramatical transformation in the last two decades which has been fuelled by innovative managerial concepts as well as by the fast development of technology. Before commencing the analysis proper, however, it is necessary to elaborate briefly upon the nature of retailing innovations. Developments in retailing, ranging from the adoption of self-service to technological advances in goods handling, storage and display are numerous. Innovations, nevertheless, vary in their degree of perceived newness (Brown, 1990). Some of them are continuous innovations as a result of number of small developmental steps and modifications while other such as emergence of new retail formats such as hypermarkets and different models of selling such as on-line retailing or e-tailing represent discontinuous innovation that may disrupt the competition and market positions of the major players. Over the last few decades, depending on the part of the world, retailing changed significantly. There has been strong shift in power along the supply line and the structure of marketing channels changed. The
role of traditional wholesaling declined and major retailers have taken over the wholesaling role and may have also taken over the tasks of physical distribution or alternatively those functions have been subcontracted to specialized companies. Retailers today, utilize the full range of marketing elements in pursuit of their strategic objectives. This has not only had a profound influence upon the effectiveness of retail marketing, it has also changed the very nature of consumer goods marketing (McGoldrick, 2002). Given the necessary ubiquity of marketing in all parts of a retail business, it may be suggested that, within retailing and other service companies, everyone is in effect a marketer. However, it is equally clear that a company must pursue a coherent mission, while encouraging some empowerment and initiative in achieving it. Development in IT has influenced through entire supply chain as well. No longer was IT the preserve of logistic and operations management, it is enabling and informing new strategies, increasingly influencing the very structure of the industry. Figure 1 illustrates how two areas of innovation, electronic point of sale (EPoS) and the Internet, have impacted upon operation, strategy and retail structure.
Internet today pervades in every area of strategy as well as enabling new forms of business-to-business and business-to-consumers e-commerce. Electronic point of sale which started as primarily an operational tool, now supplies the data warehouses that underpin customer loyalty programmes, the basis of many relationship marketing strategies. The capabilities of EPoS to monitor demand and optimize stock have also enabled the development of scaled-down superstores and a new generation of convenience store, offering wider, locally tailored assortments within relatively small outlets (McGoldric, 2002). Those two technologies were mearly a foundation for the later innovations such as Electronic Data Interchange (EDI) and Efficient Consumer Response (ECR). Technological and managerial innovations led to innovations and changes in a way a consumers shop and toward development of a new store formats. Such dynamism of retailing has sparkled academic interest and several theories of retail evolution have been developed over the time. Wheel of Retailing represents one of the dominant concepts of evolution in retailing field. The wheel theory contends that new forms of retailing commence as cut-price, low-cost, narrow-margin operations which subsequently trade-up. Improvements in display and location, increased

I n t e r n a t i o n a l J o u r n a l o f M a n a g e m e n t C a s e s
350
advertising and the provision of credit, delivery, and many other customer services all serve to drive up expenses, margins and prices. Eventually, they mature as high-cost, conservative and moribund institutions with a sales policy based on quality goods and services rather than price appeal. This, in turn, opens niche for the next dynamic, low-cost innovator, and spins the wheel. Since its publication “The Wheel of Retailing” has been subjected to many research and debates as well as controversy at some point. Nevertheless, there is substantial evidence that many retail innovations in the United States, including department stores, mail order businesses, discount stores, supermarkets, catalogue showrooms, warehouse clubs and off-price shops and shopping centres, began as a form of marketing innovations in retail sector (Brown, 1990). Other theories such as “The Retail Accordian”, “The Retail Life Cycle”, “Combined model”, etc. all have certain degree of retail innovation as the foundation for the theory or change agent.
Innovations in the retail sector are numerous. For example, RfID is the generic name for technologies that use radio waves to identify and track objects automatically. A wide range of perceived benefits are being claimed for RfID technology within retailing. The initial benefits associated seem likely to be focused upon improving the efficiency, accuracy and security of both supply chain and inventory management with attendant cost savings. Within food retailing the introduction of RfID will facilitate traceability, which will in turn, allow food retailers to comply with increasingly strict national and international regulatory requirements. This technology will enable retailers to check in goods automatically and almost instantly. Pilot test in the USA have indicated 7% of sales increase with RfID because of the greater visibility of inventory on the shop floor, reduction of shrinkages and theft (Jones et.all, 2005). Efficient consumer response is arguably the most complex managerial innovation in distribution to be introduced in Croatia. As such ECR holds great potential for retailers. It consists of four distinct but related principles (1) efficient store assortments, (2) efficient replenishment, (3) efficient promotion and (4) efficient product introductions (Brockman & Morgan, 1999). Efficient
store assortments involve active implementation of category management through joint efforts between retailers, distributors, and manufacturers. The efficient replenishment initiative calls for the gradual establishment of a continuous replenishment inventory system and restructuring of the order process with sophisticated integrated information systems. Efficient promotion is call to eliminate forward buying and diverting practices. Finally, efficient product introduction is intended to reduce the number of similar products (followers) that add little or no value for the consumer. It involves joint planning efforts between retailers, vendors, and manufacturers in order to decide which new products should be sold by retailers, and determine potential areas of new product development (Palic, 2005). With the efficient product introduction, the marketing distribution function has been expanded from availability and quality issues to include new product decisions as well. Thus, the term efficient consumer response may be a misnomer since efficient product introduction represent a major expansion in the distribution function’s responsibility in the firm’s market effectiveness. Adoption of Electronic data interchange (EDI) is a key enabling technology for efficient replenishment. However, not all retail innovations are of such complexity. Sensory marketing used in retail settings involves innovative engaging (stimulation) of customer’s senses (touch, olfaction, vision and audition). Use of different colors, smells and music are well known for stimulating consumer behaviour and could be used in a number of different ways. Even retail pricing developed toward innovative concepts such as everyday low pricing (ELDP). ELDP might be seen as having tree relative benefits in relation to Hi-Lo pricing (Levy & Waitz, 2004): (1) reduced price wars as a successful ELDP strategy enables retailers to withdraw from highly competitive price wars based on Hi-Lo sales promotions, (2) reduced advertising as the stable ELDP prices need not to be weekly advertised for sales, and (3) reduced stockouts and improved inventory management as ELDP process reduces the large variations in demand caused by frequent sales with large markdowns.

351
I n t e r n a t i o n a l J o u r n a l o f M a n a g e m e n t C a s e s
Figure 1: Examples of innovation multi-level impacts
Source: McGoldrick, P. (2002): Retail Marketing, 2. edition, McGraw-Hill, Berkshire, p. 11
Figure 2: Wheel of Retailing
Source: McGoldrick, P. (2002): Retail Marketing, 2. edition, McGraw-Hill, Berkshire, p. 20

I n t e r n a t i o n a l J o u r n a l o f M a n a g e m e n t C a s e s
352
As the market grows more mature and the growth opportunities began to shrink, the struggle over the market share intensifies. One of the consequence of intense competition and innovation experienced by the retail sector in recent decades has been the diversification of store formats. For example, in the context of grocery shopping, the introduction of a supermarket as a generic self service format has been followed by the hypermarket as a larger version of supermarket and the development of the discount store as a low-price-oriented supermarket. (Gonzalez-Benito et al, 2005) Similar events happened for specialized stores where large “category killers” emerged. Although definitions of these store formats are often different and sometimes confusing, they reveal the increasing variety of store formats models in more and more heterogeneous retail market. Retail firms have established distinctive retail store formats which are differentiated from each other based on a single dimension or a combination of a several dimensions (Uusitalo, 2001). All of the earlier mentioned retail innovations have to prove its validity in every day purchasing contacts that occur between the customer and the store settings. At the end marketing innovations have to help bring the customer in the store and than to lead him within a store in a fashion that will result with the maximal optimization of sales per measuring unit (such as square meter, meter of shelf space, or average basket value) at the same time keeping the customer satisfaction high as a way of boosting up the loyalty for repeated a purchases.
Retail Sector in CroatiaIn the last two decades retail sector in Croatia has been influenced by two main political and economic processes. First is transition and restructuring of Croatian economy from socialistic to market economy and second process is marked by preparations for integration into common European market. Transitional process in Croatia has been similar to those in other eastern European countries and manifested in decrease of industrial production, decrease in BDP, rise of unemployment and war damages that alone in retail sector are estimated up to $10 billion (Brcic-Stipcevic & Renko, 2004). The retail network in Croatia is still quite fragmented, i.e. dominated by
small shops (smaller than 100 sq m). However, large retail establishments are taking increasing number of market share every consecutive year in a row. According to available data some 1,000,000 sq m large retail facilities were built between 1994 and 2004. (CCE, 2006). As there is often no urban planning policy for sales establishments, the construction of malls in Croatia has been notably increased in the last several years. Thus, large mercantile establishments are territorially concentrated in or around urban areas of largest cities – most of them in Zagreb, Rijeka, Split and Osijek. As seen on the chart bellow (Figure 3), for example in 2004. capital city of Croatia – Zagreb accounted for 36.3% of newly built retail establishments nationwide, followed by Split (10.3%) and Osijek (9.2%).
It is only with the Regulation Concerning the Special Requirements for Retail Trade in Specific Types of Shops (NN [Official Gazette] 105/01) that Croatia established control over the development of outlets with usable (net) areas of 3,000 sq m or more, and of areas exceeding 1,500 sq m in cases when an outlet is a part of a larger complex, such as shopping parks, centers and malls. Large sales establishments are developing at an accelerated pace also in Croatia, because there is a need to adjust to changing living styles and customers’ new needs. Many surveys conducted so far indicate that customers are trying to reduce the frequency of shopping errands, to concentrate their purchases and increase their supply of goods at home. Besides this, the latest trends are towards building modern shopping centers that provide various shopping amenities and entertainment under a single roof. They are also becoming places for gathering and social contact. Due to internationalization and open market retail structure changed dramatically in a few recent years. Number of larger store formats (hyper & supermarkets) almost doubled in period 2001-2005 as shown at the table 1. At the same time number of small and medium FMCG stores has been reduced by almost 3.000 (ACNielsen 2005). Most dramatically, the number of small stores in that period has been reduced by more than 33%. Total number of FMCG stores decreased and at the same time selling space has been increased due to the opening of larger store formats.

353
I n t e r n a t i o n a l J o u r n a l o f M a n a g e m e n t C a s e s
Figure 3: Newly built retail establishments by Counties in 2004
Source: CEE Trade department estimate
Table 1: Structure of FMCG stores in Croatia (2001-2005)
Source: ACNielsen, 2005
Figure 4: Top 10 Accounts by financial measures
Source: GfK – Market share in Croatian retail sector, 2004

I n t e r n a t i o n a l J o u r n a l o f M a n a g e m e n t C a s e s
354
Large foreign retailers such as Metro, Rewe, Lidl as well as regional chains such as Ipercoop, Spar and Mercator has set up new standards and increased competitive pressure on the Croatian market. This in turn lead to the consolidation of FMCG retailing in Croatia and several national retailers emerged through organic growth, mergers and acquisitions and formation of cooperative groups. Obviously, a large number of the small independent stores and some of the regional chains could not endure the competition and went out of business. This in turn led to the increase in market concentration. According to the GfK ConsumerScan top 10 retailers increased market share from 16.6% in the year 2000 to 51% in 2004 as shown on the Figure 4. Those numbers best describe a volatile dynamic of the Croatian retail market in recent years. For example, national retail chain Konzum in the observed period more than doubled number of its retail outlets – to present 560 stores in various formats ranging from small to hypermarkets and since the year 2000 it increased its sales figures from 1.14 billon Kn to 8.51 billion Kn (1.14 bil.Euro) in the year 2005 making it three times larger in comparison to the largest competitor (Fina, 2006).
Increasingly competitive environment and market concentration led toward increased efficiency of the retail operations. At the beginning, majority of retailers fueled fast growth in order to reach economies of scale which are of great importance especially in supply, distribution, and retail network branching part of operations. However, once the basic organizational requirements have been met application of the modern marketing practice and marketing innovation become tool that might prove to be of significant influence for a future distribution of the market share among top competitors. Marketing offer appealing to the customer consists of various techniques and tools that are used in order to attract customer to the store, to keep him in the store and encourage positive buying behavior and appropriate level of satisfaction and thus loyalty. Marketing offer of the top retailers today is radically different in comparison to that of a decade or two ago. Under such circumstances shopping behavior and patterns of the consumers changed. Some of the changing patterns include: frequency of shopping, value of single purchase, preferred method of payment, level of services required, types of assortment needed, relative location in comparison to place of residence, etc. On the following figure (Fig. 5) it is possible to observe how spending for average basket of basic
food categories changed in Croatia in a last few years. Due to a stronger competition and discount operators average prices dropped 10% (index 90.3) comparing to year 2002 but the number (quantity) of the products sold has increased by 16% (index 116.2), and sales financially grew by 5% (index 104.9) which is a result of larger volume of goods sold at the lower prices.
Indeed, average Croatian consumer today is more likely to use car in order to go to the store, everyday small food purchases have been replaced with the larger purchases on weekly or monthly basis. Furthermore, time spent on those purchases is longer and volumes purchased larger. The structure of spending is also changing, following the European trends. Medium segment is yielding to the increased share of premium brands on the one side and discounted products on the other side, quite similar to the Figure 6 bellow showing European’s purchasing patterns. Today, shopping is not only a means of supplying necessary goods for the household but it is also becoming a social event which may include friends and family, dining and entertainment.
Level of retail innovation application in CroatiaIn light of earlier described structural changes in retail sector and changed customer behaviour patterns and expectations it is necessary for retail operators to adopt suitable marketing strategies and furthermore to increase rate of innovation introduction and adoption throughout its organization in order to gain certain form of competitive advantage or merely to stay enough competitive to continue its presence on the marketplace. Purpose of this paper is to explore rate of innovation application in retail operations in Croatia and to establish connection between the rate of innovation and the rate of business success in the retail sector. Exploratory research has been conducted in October and November 2006 in order to encompass the body of knowledge necessary for designing further in-depth research. Data collected from the field have been further enhanced with the data from secondary sources containing information for each of the researched retailer such as statistical information, annual reports, web pages, and specialized magazines for the subject. Field research included observations at the retail outlets and filling of the checking form. Research included top 10 FMCG retailers and sample of
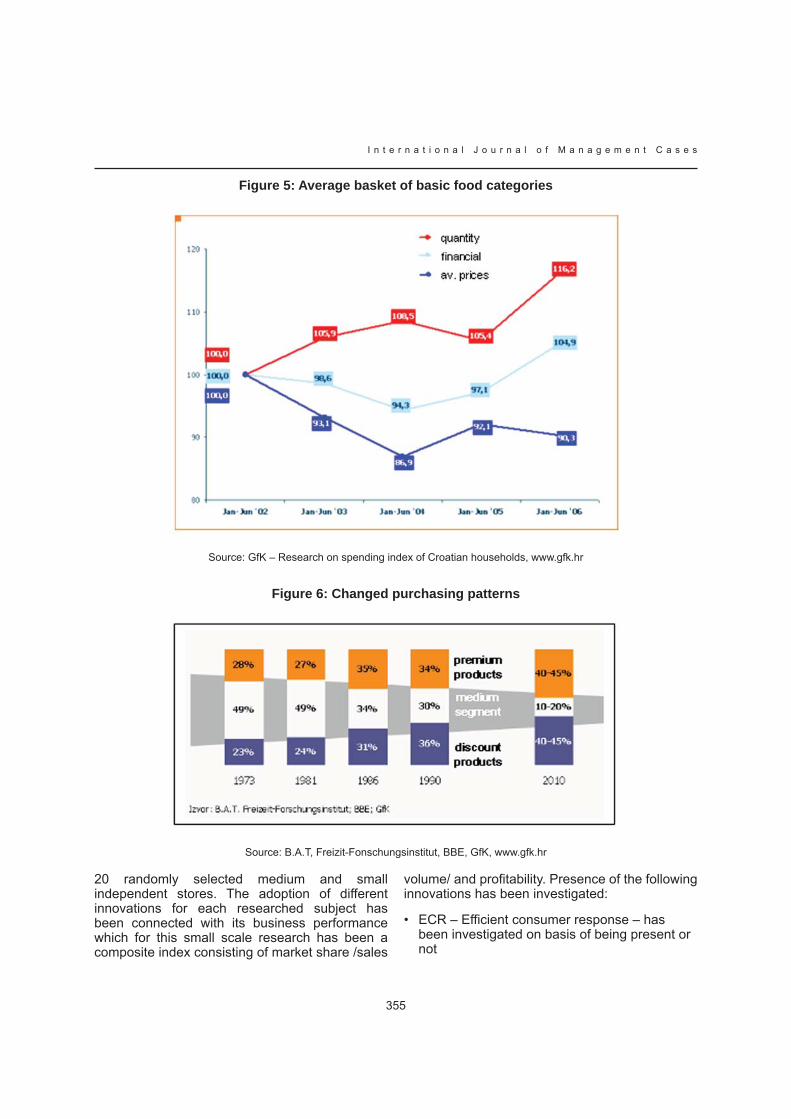
355
I n t e r n a t i o n a l J o u r n a l o f M a n a g e m e n t C a s e s
Figure 5: Average basket of basic food categories
Source: GfK – Research on spending index of Croatian households, www.gfk.hr
Figure 6: Changed purchasing patterns
Source: B.A.T, Freizit-Fonschungsinstitut, BBE, GfK, www.gfk.hr
20 randomly selected medium and small independent stores. The adoption of different innovations for each researched subject has been connected with its business performance which for this small scale research has been a composite index consisting of market share /sales
volume/ and profitability. Presence of the following innovations has been investigated:
ECR – Efficient consumer response – has • been investigated on basis of being present or not

I n t e r n a t i o n a l J o u r n a l o f M a n a g e m e n t C a s e s
356
EDI – Electronic data interchange – has been • investigated on basis of being present or not
CM – Category Management – as a process of • managing retail business with the objective of maximizing the sales and profits of a category has been investigated on basis of being present or not at the retail organization
RfID – Radiofrequency identification – has • been investigated on basis of being present or not.
Advanced use of display & merchandising on • influence on impulse purchasing included checking for presence of hot spots, action displays, etc.
Advanced pricing policies – investigated use of • Hi-Lo pricing, ELDP pricing, action pricing etc.
Level of nonpersonal service – has been • investigated as composite index consisting of different services such as availability of different methods of payment, presence of toilets, child-facilities, parking, elevators, disabled availability, etc.
Private brand use and availability – has been • investigated in order to find its presence or not, than to distinguish between different levels of private brandings, consistency, and availability through the assortment.
Loyalty program – has been investigated on • basis of being present or not.
E-retailing – has been investigated on basis • whether retailer offers on-line purchases as an extension of its brick establishment
Findings showed different marketing strategies employed by different retail operators. It however can be concluded that adoption of general retail innovation have been fairly equal between the largest competitors. Latest technical innovations such as RfID, ECR and EDI that have been recently applied in USA and Europe have not been
found among researched subjects on the Croatian market. However, category management, private branding and loyalty programs seems to be adopted by large majority of the top retailers and by none of the small and medium independent stores as it has been expected because of their size and available resources. The application of private branding among top ten retailers has been rather different ranging from single brand (Metro, Konzum) applicated through many different categories to different private brands for specific categories (Getro). Over, all private brands are most used by the FMCG retailers in Croatia for the discount segment offering lower prices than manufacturer’s brands, even though there have been recently some exceptions with rolling out of the some private labels targeted at medium and premium segment. The same advantage of top retailers have been found to be true in regard to level of nonpersonal service, but not always in the area of display and merchandising techniques, and advanced use of pricing policies.
In order to use EDI and RfID a nation wide initiative among retailers and suppliers have to be made as it requires certain amount of industry wide stnadardization. Since this is not yet the case none of the players on the market can claim application of this innovation. EDI could be easily used as it has become low-cost solution and basis for the development of ECR. In 2006 ECR Croatia has been founded by a group of leading retailers and producers of FMCG and expert group is working on strategies for the implementation. Independent stores are limited in their adoption of such innovations as it is not efficient for them to copy complex processes used by large organizations. However, in the area of display and merchandising they can apply various, effective tactics. Personal service and development of local customer relationships might be another area where independents might compete with large chains. Extension of its brick enterprise on internet has been offered by only one major retailer.
The findings about success rate and adoption of innovations are as follows:

357
I n t e r n a t i o n a l J o u r n a l o f M a n a g e m e n t C a s e s
Table 2: Presence of selected innovations at retailers by type
*coop private brands or brands from wholesalers designed form independents
Table 3: Success rate and adoption of innovation in Croatian retail sector
The most innovative retailer according to the preliminary research is actually the dominant retail chain in Croatia - Konzum. It is interesting to note that Konzum is a Croatian company and it has been expected that international retailers will be the most innovative. However, presently, Konzum is the only retailer out of top ten that offered internet shopping for groceries, posses largest number of different store formats, was second to apply loyalty programmes on Croatian market, was one of the first to seriously use private brands, has the best logistical and distribution system and displays advanced use of merchandising and pricing but not better then some of the other competitors. At the same time international competitors did not bring to the Croatian market latest technical innovations that some of them are starting to adopt on more developed and more mature markets. Instead, they almost all applied tactics of building larger
format stores on the outskirts of the urban areas making them growing fast but after the market saturation - actually vulnerable to the arrival of next large international competitor that use the same strategy.
ConclusionDynamic development of the Croatian retail sector fuelled by the fast internationalization changed the retail market structure. As retail market concentration reached more than 50% and signals the beginning of the mature phase, top retailers will not be able to experience fast growth by simply opening new stores. Due to the saturation and increased competition, application of innovative marketing concepts that appear in various dimensions of the firm’s market operation might be

I n t e r n a t i o n a l J o u r n a l o f M a n a g e m e n t C a s e s
358
the key for building competitive advantage. Indeed exploratory research carried out in this paper confirmed that level of the innovation application among leading retailers by large surpasses that of the smaller independent stores. However, when rate of innovation adoption has been compared among leading retailers with their success level the mutual connection between the mentioned two variables become unclear in some cases. This unarguably calls for the more refined instrument of measurement and better understanding of a way in which a particular innovation contributes towards the retailer’s market performance and success. According to the adopted retail innovations in general, Croatian market has developed fast in the last decade trying to close an innovation gap that separated it from the more mature markets. However, due to the small size and purchasing power, in comparison to the main European markets such as Germany, France and Italy, some very large international retailers choose not to be present at it. Not surprisingly, rate of retail innovation is slower in comparison to that of the top markets leaving in turn an opportunity for the domestic retailers to innovate and develop.
References
Brčić-Stipčević, V., Renko, S. (2004): Croatian retail in transformation and approaching the European Union, Zbornik Ekonomskog fakulteta u Zagrebu, Vol. 2, No. 1, pp. 97-108
Brockman, B.K., Morgan, R.M. (1999): The evolution of managerial innovations in distribution: what prospects for ECR?, International Journal of Retail and Distribution Management, Vol. 27, No. 10, MCB University Press, pp. 397-408
Brown, S. (1990): Innovation and Evolution in UK Retailing: The Retail Warehouse, European Journal of Marketing, Vol. 24, No. 9, pp. 39-54
Byus, K., Lomerson, W.L. (2004): Consumer originated value: A framework for performance analysis, Journal of Intellectual Capital, Vol. 5, No. 3, Emerald Group Publishing, pp. 464-477
CCE – Croatian Chamber of Economy, (2006): Distributive trade, CCE, Trade Department, Zagreb
Clarke, I. (2000): Retail power, competition and local consumer choice in the UK grocery sector, European Journal of Marketing, Vol. 34, No. 8, MCB University Press, pp. 975-1002
Cumming, B.S. (1998): Innovation overview and future challenges, European Journal of Innovation Management, Vol. 1, No. 1, MCB University Press, pp. 21-29
Dabholkar, P.A., Bobbit, L.M., Lee, E-J. (2003): Understanding consumer motivation and behaviour related to self-scanning in retailing, International Journal of Service Industry Management, Vol. 14, No. 1, MCB University Press, pp. 59-95
Fina (2006): Poslovanje sektora trgovine u 2005. godini, Fina, Registar godišnjih financijskih izvještaja, Zagreb
Gonzales-Benito, O., Munoz-Gallego, P.A., Kopalle, P.K. (2005): Asymmetric competition in retail store formats: Evaluating inter- and intra-format spatial effects, Journal of Retailing, Vol. 81, No. 1, Elsevier, pp. 59-73
Jones, P., Clarke-Hill, C., Hiller, D., Comfort, D. (2005): The benefits, challenges and impacts of radio frequency identification technology (RFID) for retailers in the UK, Marketing Intelligence & Planning, Vol. 23, No. 4, MCB University Press, pp. 395-402
Kandampully, J. (2002): Innovation as the core competency of a service organisation: the role of technology, knowledge and networks, European Journal of Innovation Management, Vol. 5, No. 1, MCB University Press, pp. 18-26
Kotler, P., Keller, K.L. (2006): Marketing Management, 12. izdanje, Pearson Prentice Hall, Upper Saddle River, New Jersey
Levy, M., Weitz, B.A. (2004): Retailing Management, 5. izdanje, McGraw-Hill, New York
McGoldrick, P. (2002): Retail Marketing, 2. edition, McGraw-Hill, Berkshire
Palic, M. (2005): ECR – Efficient Consumer Response, Progressive magazine, Vol. IV, No. 42, Crier Media Grupa, Zagreb, pp. 38
Udwadia, F.E. (1990): Creativity and innovation in organizations, Technological Forecasting and Social Change, Vol. 38, No. 1, pp. 66-72
Uusitalo, O. (2001): Consumer perceptions of grocery retail formats and brands, International Journal of Retail & Distribution Management, Vol. 29, No. 5, MCB University Press, pp. 214-225

359
I n t e r n a t i o n a l J o u r n a l o f M a n a g e m e n t C a s e s
Underhill, P. (2006): Zašto kupujemo: Znanost kupnje, Olympic International, Zagreb
Weber, M.M., Kantamneni, S.P. (2002): POS and EDI in retailing: an examination of underlying benefits and barriers, Supply Chain Management:
An International Journal, Vol. 7, No. 5, MCB University Press, pp. 311-317
Wrigley, N. (2002): The landscape of pan-European food retail consolidation, International Journal of Retail & Distribution Management, Vol. 30, No. 2, MCB University Press, pp. 81-91
I n t e r n a t i o n a l J o u r n a l o f M a n a g e m e n t C a s e s
360
THE ROLE OF NONSTORE RETAILING FROM CROATIAN CONSUMERS
PERSPECTIVE
SANDA RENKO,UNIVERSITY OF ZAGREB, CROATIA
VESNA BRČIĆ-STIPČEVIĆUNIVERSITY OF ZAGREB, CROATIA
Abstract:
This paper focuses on the nonstore retailing forms and its main purpose is to investigate the attitude of Croatian consumers towards this new trend in retailing. The paper presents results of the field research carried out on the sample of 200 respondents in two Croatian counties: Zagreb and surroundings and Osjecko-baranjska County. In such a way, this field research could be the logical continuation of the exploratory research whose findings were presented on the Circle Conference in 2006. Contrary to the findings of the exploratory research, the findings of the field research show high level of importance and acceptance of nonstore retailing forms among Croatian consumers.
Key words: nonstore retailing, Croatian consumers
IntroductionAs a result of the development of the information society and growing investments in technology, consumers new needs, new consumption patterns, new lifestyles, etc. we have been witnessing the existence of large number of retailing forms. Therefore, retailing is recognized as one of the most competitive and rapidly changing industries in the world. New retailing forms attract consumers and retailers as well. Consumers are attracted by the ease of purchasing, lower prices, opening hours, convenient location and similar. On the other side, in some cases, retailers are attracted by the low start up costs, reduced inventories, small number of sales force needed, etc. This paper focuses on the nonstore retailing forms. Its main purpose is to investigate the attitude of Croatian consumers towards this new trend in
retailing. The basic hypothesis for this paper are: (H1) Croatian consumers prefer both store and nonstore retailing forms in deciding where to make small purchases (i.e. small purchases are chosen because the authors imply that nonstore forms are retailing forms for purchasing small quantities of goods) and (H2) convenient location and opening hours are the main reasons for choosing non-store retailing forms for Croatian consumers. The paper presents results of the field research carried out on the sample of 200 respondents in two Croatian counties: Zagreb and surroundings and Osjecko-baranjska County. The main reason for choosing those two counties lies in their diversity. Zagreb and surroundings county (with the Metropolitan City of Zagreb as economical, political and administrative centre of Croatia) is well known for its high level of concentration in retailing and large number of foreign retailers. The other county – Osječko-baranjska County presents one of the richest parts of Croatia. The findings of the exploratory research (Renko & Andrianić, 2006) (they were presented on the Circle Conference in 2006) showed high regional allocation in the Croatian retailing. As this research observed the emerging trend in retailing – nonstore retailing, only by analyzing data gathered from the Croatian Chamber of Economy and municipal authorities, this field research could be its logical continuation. In other words, this paper was developed in an effort to hedge the limitations of the previously conducted exploratory research.
As previously conducted exploratory research examined the literature concerning retailing, nonstore retailing postulations (as well as different forms of nonstore retailing), the Central Bureau of Statistics – First Release (according to the National Classification of Economic Activities for nonstore retail trade), Trade Act and many data gathered from the Croatian Chamber of Economy
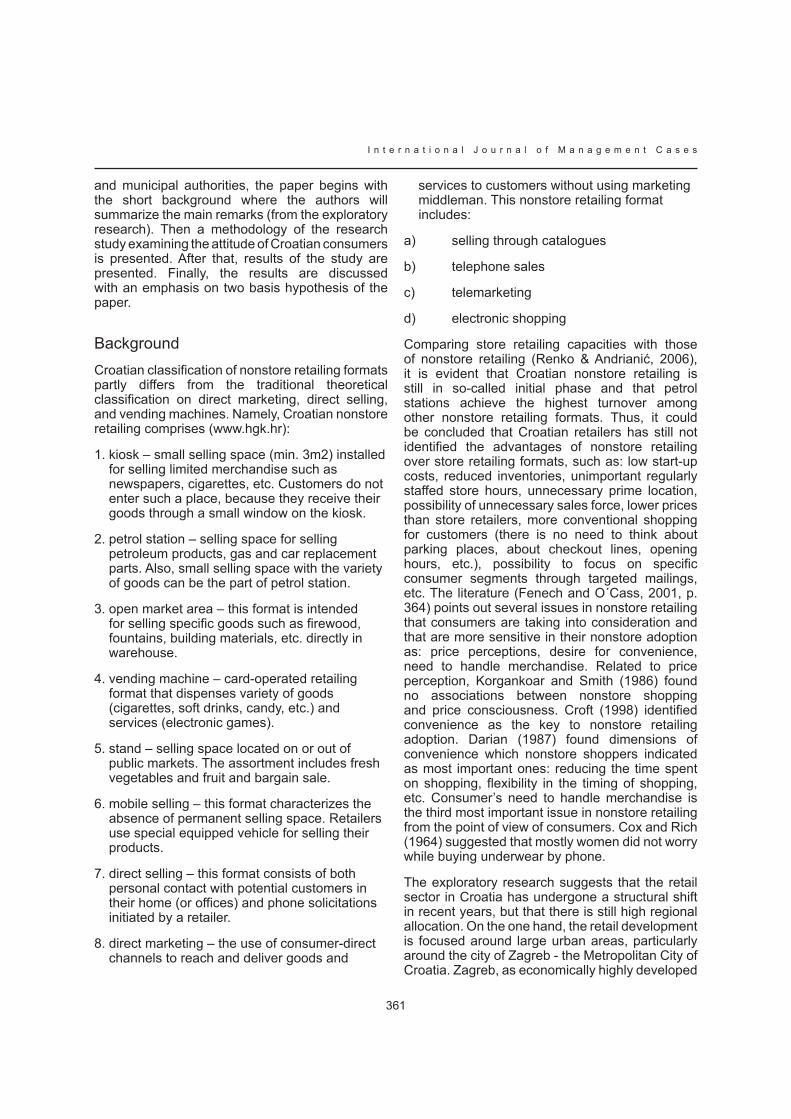
361
I n t e r n a t i o n a l J o u r n a l o f M a n a g e m e n t C a s e s
and municipal authorities, the paper begins with the short background where the authors will summarize the main remarks (from the exploratory research). Then a methodology of the research study examining the attitude of Croatian consumers is presented. After that, results of the study are presented. Finally, the results are discussed with an emphasis on two basis hypothesis of the paper.
BackgroundCroatian classification of nonstore retailing formats partly differs from the traditional theoretical classification on direct marketing, direct selling, and vending machines. Namely, Croatian nonstore retailing comprises (www.hgk.hr):
kiosk – small selling space (min. 3m2) installed 1. for selling limited merchandise such as newspapers, cigarettes, etc. Customers do not enter such a place, because they receive their goods through a small window on the kiosk.
petrol station – selling space for selling 2. petroleum products, gas and car replacement parts. Also, small selling space with the variety of goods can be the part of petrol station.
open market area – this format is intended 3. for selling specific goods such as firewood, fountains, building materials, etc. directly in warehouse.
vending machine – card-operated retailing 4. format that dispenses variety of goods (cigarettes, soft drinks, candy, etc.) and services (electronic games).
stand – selling space located on or out of 5. public markets. The assortment includes fresh vegetables and fruit and bargain sale.
mobile selling – this format characterizes the 6. absence of permanent selling space. Retailers use special equipped vehicle for selling their products.
direct selling – this format consists of both 7. personal contact with potential customers in their home (or offices) and phone solicitations initiated by a retailer.
direct marketing – the use of consumer-direct 8. channels to reach and deliver goods and
services to customers without using marketing middleman. This nonstore retailing format includes:
a) selling through catalogues
b) telephone sales
c) telemarketing
d) electronic shopping
Comparing store retailing capacities with those of nonstore retailing (Renko & Andrianić, 2006), it is evident that Croatian nonstore retailing is still in so-called initial phase and that petrol stations achieve the highest turnover among other nonstore retailing formats. Thus, it could be concluded that Croatian retailers has still not identified the advantages of nonstore retailing over store retailing formats, such as: low start-up costs, reduced inventories, unimportant regularly staffed store hours, unnecessary prime location, possibility of unnecessary sales force, lower prices than store retailers, more conventional shopping for customers (there is no need to think about parking places, about checkout lines, opening hours, etc.), possibility to focus on specific consumer segments through targeted mailings, etc. The literature (Fenech and O´Cass, 2001, p. 364) points out several issues in nonstore retailing that consumers are taking into consideration and that are more sensitive in their nonstore adoption as: price perceptions, desire for convenience, need to handle merchandise. Related to price perception, Korgankoar and Smith (1986) found no associations between nonstore shopping and price consciousness. Croft (1998) identified convenience as the key to nonstore retailing adoption. Darian (1987) found dimensions of convenience which nonstore shoppers indicated as most important ones: reducing the time spent on shopping, flexibility in the timing of shopping, etc. Consumer’s need to handle merchandise is the third most important issue in nonstore retailing from the point of view of consumers. Cox and Rich (1964) suggested that mostly women did not worry while buying underwear by phone.
The exploratory research suggests that the retail sector in Croatia has undergone a structural shift in recent years, but that there is still high regional allocation. On the one hand, the retail development is focused around large urban areas, particularly around the city of Zagreb - the Metropolitan City of Croatia. Zagreb, as economically highly developed

I n t e r n a t i o n a l J o u r n a l o f M a n a g e m e n t C a s e s
362
market, offers higher opportunities for success to companies which chose to sell products out of store, and also to large international companies. One of the advantages of Zagreb County is big concentration of population and also higher incomes.
On the other hand, nonstore retailing has a very small possibility to succeed in Osječko-baranjska County because a lot of population lost their jobs due to the privatisation and bad financial results of the companies they had worked for. Low incomes or not having any income can not create demand for a great number of products, except the essential ones. Only with high export activity, recovering of manufacturing industries and rising rate of employment this trend could be changed.
MethodologyAs it was mentioned above, the major method of the previously conducted exploratory research was secondary data collection.
The field research presented in this study was carried out on the sample of 200 respondents in two Croatian counties: Zagreb and surroundings and Osjecko-baranjska County in October and November 2006. Respondents consisted of students of the Faculty of Economics and Business in Zagreb and of the Faculty of Economics in Osijek.
The research instrument was a highly structured questionnaire and it was consisted of three parts.
In order to separate three group of consumers: a) consumers which make purchases only in stores, b) consumers which make purchases only in some of nonstore retailing forms, and c) consumers which make purchases both in stores and in some of nonstore retailing forms, in Part I of the research instrument respondents were firstly asked to identify where they usually make small purchases: a) store retailing forms, b) nonstore retailing forms or c) both store and nonstore retiling forms. Then, respondents had to indicate which nonstore forms they prefer for purchasing and were asked to assign a number from 1 to 8 (1= the least used nonstore retailing form, 8 = the most often used nonstore retailing form).
Part II of the questionnaire asked questions about the frequency of shopping, the most often
purchased goods, and the reasons for purchasing for each nonstore retailing form particularly.
In Part III respondents were asked to evaluate the quality of services offered in each of nonstore retailing form. It was conducted using 5-point rating scale (respondents assigned a grade from 1= the extremely bad service to 5 = extremely quality service, for each nonstore retailing form).
ResultsThe survey was designed to include several issues relating to Croatian population perceptions and attitudes toward nonstore retailing. Accordingly, the presentation and the additional interpretation of obtained results were classified (divided) into folowing sections:
the identification of what types of retailing • Croatian consumers used for the purchases,
the rang of nonstore retailing forms, •
the frequency of shopping in some nonstore • retailing formats,
the most often purchased goods,•
the reasons for purchasing in nonstore retailing • formats,
the quality of services offered in each of • nonstore retailing forms.
We have to point out that the comparison between two Croatian counties: Zagreb and surroundings and Osjecko-baranjska County, concerning the attitude of their consumers towards nonstore retailing, is present in each section.
Section I - The identification of what types of retailing Croatian consumers used for purchasing
The purpose of this section was to find out where respondents usually make small purchases. Respondents could choose among: a) store retailing shopping, b) nonstore retailing shopping or c) both store and nonstore retiling shopping. Figure 1. shows that in both counties the highest level of respondents usually buy in stores and nonstore retailing forms (87% of respondents from Zagreb and surroundings usually buy both in stores and in nonstore retailing formats and only 13% of respondents buy only in stores; 88% of respondents from Osjecko-baranjska county

363
I n t e r n a t i o n a l J o u r n a l o f M a n a g e m e n t C a s e s
Figure 1. Where respondents used to make their purchases
usually buy both in stores and in nonstore retailing formats and only 12% of respondents buy only in stores). It confirms the notion of Coughland et al. (2006) who suggest that no single retail form is necessarily sufficient to reach the market or to satisfy a particular target consumer’s set of service output demands. It should be mentioned that in case of both counties there was not respondent who used to make purchases only in nonstore retailing formats.
Section II - The rang of nonstore retailing forms
Assuming that respondents do not used to make purchases in all of nonstore retailing forms, we designed the question in such way that respondents could choose to rang all of the
given nonstore retailing formats or to leave blank space for the format where they have never made purchases. The findings revealed that in both counties respondents mostly buy in kiosks (72% of respondents from Zagreb and surroundings and 78% of respondents from Osjecko-baranjska county). Telemarketing, electronic shopping and telephone sales are the least used nonstore retailing forms. Also, lot of respondents left blank those forms in ranging suggesting that large number of respondents did not buy in such nonstore retailing forms at all. Table 1 and Table 2 show the ranking of four most important nonstore retailing formats. It is interesting that respondents from Zagreb and surroundings did not put vending machines in this group. Rather we can see selling through catalogues.
Table 1. The rang of four most important nonstore retailing formats in Zagreb and surroundings county

I n t e r n a t i o n a l J o u r n a l o f M a n a g e m e n t C a s e s
364
Table 2. The rang of four most important nonstore retailing formats in Osjecko-baranjska county
Figure 2. The frequency of shopping in kiosks

365
I n t e r n a t i o n a l J o u r n a l o f M a n a g e m e n t C a s e s
Section III - The frequency of shopping in some nonstore retailing formats
The purpose of this section was to find out the frequency of shopping in nonstore retailing formats. The questionnaire offered few possibilities for each form of nonstore retailing:
everyday shopping,•
3-4 times a week shopping, •
several times a month shopping, •
once a month shopping, and •
less than once a month shopping.•
Figure 2 and Figure 3 show the percentage of respondents in both counties that most often
make purchases in kiosks and petrol stations, respectively.
At the same time, respondents answered that they used all other nonstore retailing forms less than a month.
The explanation for this could be seen from the findings in the following section, because there are the findings derived from the question “What type of merchandise do you usually purchase in particular nonstore retailing form?” and the question “What are the reasons for making purchase in particular nonstore retailing form?”. In the case of kiosks we find out that majority of respondents in both counties usually buy newspapers at kiosks and that location is the main reason why they chose this format.
Figure 3. The frequency of shopping at petrol stations

I n t e r n a t i o n a l J o u r n a l o f M a n a g e m e n t C a s e s
366
The analysis of the category of merchandise that respondents mostly buy at petrol stations shows that respondents in both counties go to petrol stations because of long opening hours and to buy varius things (according to its definition petrol station is the space for selling not only petroleum products, gas and replacement parts yet also variety of goods).
Seciton IV - The most often purchased goods
This research includes various nonstore retailing formats which mutually differ from each other regarding merchandise, locatin, selling space, opening hours, etc. The purpose of this section was to find out what merchandise do respondents most often buy in specific nonstore retailing formats. Findings reveal that among: newspapers, food, cigarettes, toys, cosmetics, lottery and other things respondents mostly buy newspapers in kiosks (70% of respondents in Zagreb and surroundings county; 53% of respondents in Osjecko-baranjska county), food in vending machines (54% of respondents in Zagreb and surroundings; 74% of respondents in Osjecko-baranjska county). According to the answers respondents used all other nonstore retailing formats for purchasing other things.
Section V - The reasons for purchasing in nonstore retailing formats
Nonstore retailing formats have many advantages but we have focused only on: offered merchandise, opening hours, good service, acceptable prices and location.
Respondents chose opening hours and location as the main reasons for deciding to make purchases in kiosks, petrol stations and vending machines.
Low prices are attributed to stands where fresh vegetables and fruit and bargain sale are offered. According to the respondents´ answers, good services and low prices are advantages of mobile selling and telephone sales.
Respondents chose selling through catalogues, telephone sales, telemarketing and electronic shopping as nonstore retailing forms where they could find the best offered selection of merchandise.
Section VI -The quality of services offered in each of nonstore retailing forms
Analyzing the evaluation of the quality of services which are offered in nonstore retailing formats, we find out that respondents in both counties gave the highest grade to kiosks (Table 3) and petrol stations (Table 4).
Table 3. The results of the evaluation of the quality of services offered in kiosks
Table 4. The results of the evaluation of the quality of services offered on petrol stations
As we can see in Table 5 and Table 6 , the lowest grade for the quality of services respondents gave
to telephone sales, telemarketing.

367
I n t e r n a t i o n a l J o u r n a l o f M a n a g e m e n t C a s e s
Table 5. The results of the evaluation of the quality of services offered through telemarketing
Table 6. The results of the evaluation of the quality of services offered through telephone sales
ConclusionThis paper examined the role of the new trend in retailing – nonstore retailing, from the point of view of consumers. The results indicate that although that retailing type is in the initial phase in the Republic of Croatia, there is a favourable attitude of Croatian consumers towards using nonstore retailing formats for conducting small shopping. The highest level of respondents usually buy in stores and nonstore retailing forms (87% of respondents from Zagreb and surroundings usually buy both in stores and in nonstore retailing formats and 88% of respondents from Osjecko-baranjska county usually buy both in stores and in nonstore retailing formats) which confirms hypothesis H1. Findings show that Croatian consumers mostly buy in kiosks because of their location. However, telemarketing, electronic shopping and telephone sales have still not been completely adopted by Croatian consumers. The results show that respondents chose opening hours and location as the main reasons for deciding whether to make purchases in kiosks, petrol stations or vending machines. However, in the case of stands low prices are the main reason for shopping. Respondents prefer service and low prices in the case of mobile selling and telephone sales. The selection of merchandise was identified as the main reason for shopping in telephone sales, selling through catalogues, telemarketing and electronic shopping. In such a way, hypothesis H2 is partially confirmed.
Conclusively, although previously conducted exploratory research shows that Croatian nonstore
retailing is in the initial phase, there is very positive atmosphere for its development. In other words, the results of the research among Croatian consumers suggest high level of acceptance and awareness of nonstore retailing advantages.
ReferencesCoughland, A.T.; Anderson, E.; Stern, L.W. & El-Ansary, A.J. (2006), Marketing Channels, 7ed, Pearson Education Inc. Upper Saddle River, New Jersey.
Cox, D.F. & Rich, S.U. (1964), Perceived rosk and consumer decision making – the case for telephone shopping, Journal of Marketing Research, vol. 1: 32-39.
Croft, M. (1998), Shopping at your convenience, Marketing Week, 2 July.
Darian, J.C. (1987), In-home shopping: are there consumer segments?, Journal of Retailing, vol. 63, no.2: 163-186.
Fenech, T. & O´Cass, A. (2001), Internet users´ adoption of Web retailing: user and product dimensions, Journal of Product & Brand Management, vol. 10, no.6: 361-381.
Korgaonkar, P.K. & Smith, A.E. (1986), Psychographic and demographic correlates of electronic in-home shopping and banking service, in Shimp, T.A. et al., American Marketing Association Educatorś Proceedings, AMA, Chicago, IL: 67-69.

I n t e r n a t i o n a l J o u r n a l o f M a n a g e m e n t C a s e s
368
Renko, S. & Andrianić, V. (2006), The Emerging Trend in the Croatian Retailing – Nonstore Retailing, Proceedings, The 3rd International Customer Behavior and Retailing Conference – CIRCLE, April 21-22, 2006, Zagreb: 299-308.
www.hgk.hr
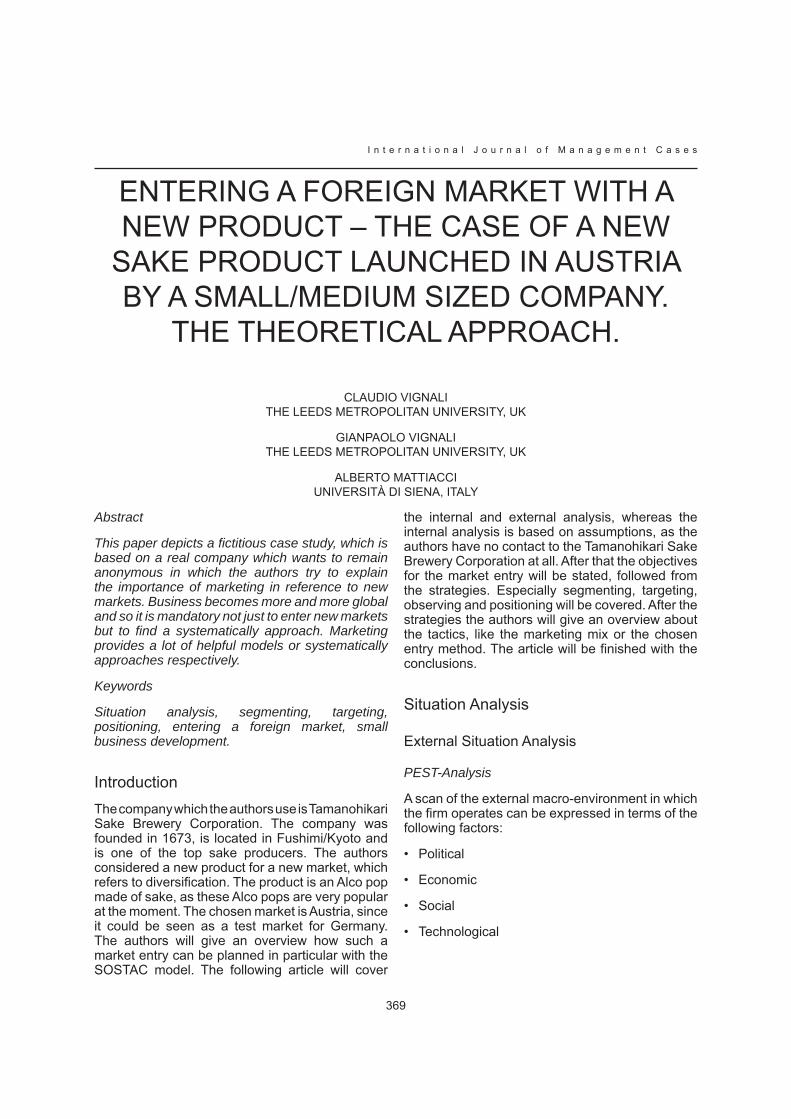
369
I n t e r n a t i o n a l J o u r n a l o f M a n a g e m e n t C a s e s
ENTERING A FOREIGN MARKET WITH A NEW PRODUCT – THE CASE OF A NEW
SAKE PRODUCT LAUNCHED IN AUSTRIA BY A SMALL/MEDIUM SIZED COMPANY.
THE THEORETICAL APPROACH.
CLAUDIO VIGNALITHE LEEDS METROPOLITAN UNIVERSITY, UK
GIANPAOLO VIGNALITHE LEEDS METROPOLITAN UNIVERSITY, UK
ALBERTO MATTIACCIUNIVERSITÀ DI SIENA, ITALY
Abstract
This paper depicts a fictitious case study, which is based on a real company which wants to remain anonymous in which the authors try to explain the importance of marketing in reference to new markets. Business becomes more and more global and so it is mandatory not just to enter new markets but to find a systematically approach. Marketing provides a lot of helpful models or systematically approaches respectively.
Keywords
Situation analysis, segmenting, targeting, positioning, entering a foreign market, small business development.
IntroductionThe company which the authors use is Tamanohikari Sake Brewery Corporation. The company was founded in 1673, is located in Fushimi/Kyoto and is one of the top sake producers. The authors considered a new product for a new market, which refers to diversification. The product is an Alco pop made of sake, as these Alco pops are very popular at the moment. The chosen market is Austria, since it could be seen as a test market for Germany. The authors will give an overview how such a market entry can be planned in particular with the SOSTAC model. The following article will cover
the internal and external analysis, whereas the internal analysis is based on assumptions, as the authors have no contact to the Tamanohikari Sake Brewery Corporation at all. After that the objectives for the market entry will be stated, followed from the strategies. Especially segmenting, targeting, observing and positioning will be covered. After the strategies the authors will give an overview about the tactics, like the marketing mix or the chosen entry method. The article will be finished with the conclusions.
Situation Analysis
External Situation Analysis
PEST-Analysis
A scan of the external macro-environment in which the firm operates can be expressed in terms of the following factors:
Political •
Economic •
Social •
Technological •
I n t e r n a t i o n a l J o u r n a l o f M a n a g e m e n t C a s e s
370
The acronym PEST (or sometimes arranged as “STEP”) is used to describe a framework for the analysis of these macro environmental factors.
Political Factors
Political factors include government regulations and legal issues and define both formal and informal rules under which the firm must operate.
Austria — one of the smaller European countries with an area of 83.845 square kilometres (32,373 square miles) and 8 million inhabitants — is situated in the very heart of the continent. With no immediate access to the sea, Austria shares its borders with eight countries: Switzerland, Liechtenstein, Germany, the Czech Republic, Slovakia, Hungary, Slovenia and Italy.
Austria’s main advantages lie in its economic and political stability, social and labour harmony, reliable internal security and extensive integration into the world economy (membership of the EU and the Euro-Zone, gateway to the new EU member states which joined in 2004 and their neighbours to the east and south). Additional benefits are well-developed cultural attributes (sports, music, nature, etc.), a dependable legal system and a low crime rate.
Since joining the European Union (EU) in 1995, Austria has embarked on an ambitious programme of structural reforms that included privatisation in banking and industry as well as the liberalisation of the telecom and energy sectors. The surge of cross-border mergers and acquisitions — particularly in retail, construction and banking — also provided a new means of finally relaxing and altering traditional structures.
The foreign trade of the EU can be considered as principally liberalised. There are, however, certain exceptions and restrictions in the form of import-quotas, surveillance measures, as well as antidumping and anti-subsidiary measures etc. In addition, trade embargoes decided by the UN and the EU — must be respected.
The Austrian customs tariff is based on the TARIC (Integrated Tariff of the EU). In principle the customs duties have to be paid at customs clearance. The average import duty applied by the European Union amounts to only 4 per cent; roughly 60 per
cent of the merchandise from outside the EU is imported duty-free into the European Union.
Corporate profits are subject to a corporation tax at a rate of 34 per cent. In 2005 Austria’s tax system will be even more attractive: the corporation tax rate will be lowered to 25 per cent and a very attractive group taxation system will become effective. Austria has signed double taxation treaties with many countries following the OECD Model Convention.
The most common method for importing goods into Austria is to sell through wholesale importers, many of whom are also engaged in exporting. Some importers deal with goods from all over the world. Others are specialised in certain regions or countries. Sometimes an importer will exclusively sell the products of one particular foreign supplier and will therefore consider additional products only if they can supplement the established line of business.
It is important to know that the Austrian business code allows imports not only to wholesalers but also to retailers. Large chain stores, mail-order companies and department stores are also major importers, in particular from overseas countries. In addition to trading agents, some industries and smaller manufacturers are also engaged in import activity.
Economic Factors
Economic factors affect the purchasing power of potential customers and the firm’s cost of capital.
With a per capita gross domestic product (GDP) — the typically internationally comparable wealth indicator — of EUR 23,170 (USD 27,803), Austria is ranked fifth in the EU (behind only Luxembourg, Denmark, Ireland and the Netherlands) and fourteenth in the world.
In general and absolute terms Austria does not represent a huge market, but should be considered as an open and rewarding opportunity in the heart of the ‘New Europe’.
Open because of the country’s traditional role as a meeting and trading place between East and West, North and South and its full participation in the common economic and monetary policies of the European Union since 1995.
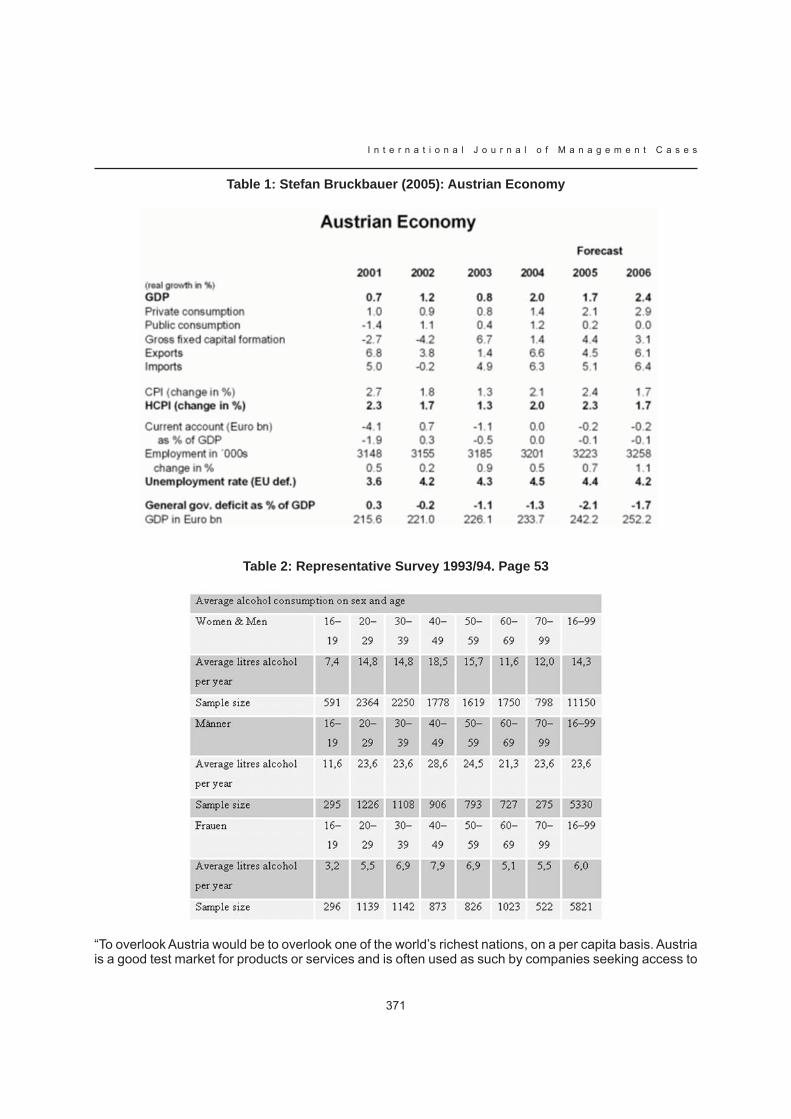
371
I n t e r n a t i o n a l J o u r n a l o f M a n a g e m e n t C a s e s
Table 1: Stefan Bruckbauer (2005): Austrian Economy
Table 2: Representative Survey 1993/94. Page 53
“To overlook Austria would be to overlook one of the world’s richest nations, on a per capita basis. Austria is a good test market for products or services and is often used as such by companies seeking access to

I n t e r n a t i o n a l J o u r n a l o f M a n a g e m e n t C a s e s
372
broader European markets. Doing business in and from Austria definitely has its advantages.”
To give you a quick overview about the Austrian alcohol market please take attention to the following tables:
Table 3: Statistik Austria (2004): Handbook Alcohol - Austria.
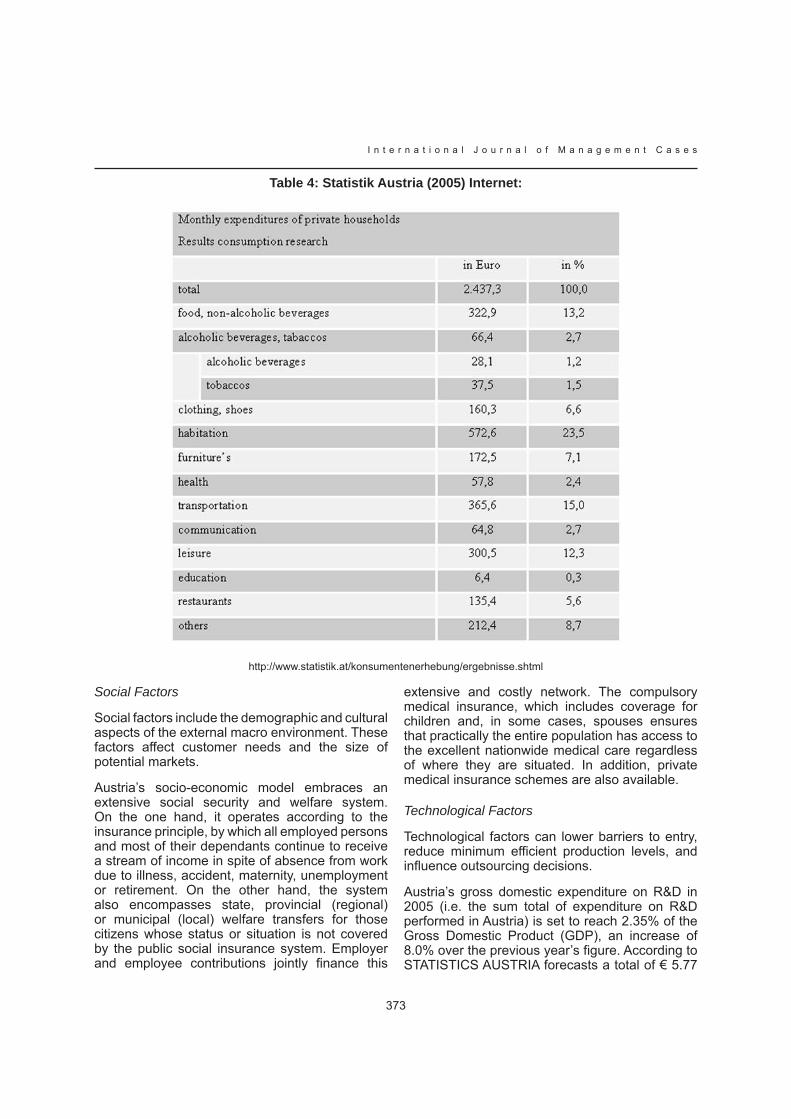
373
I n t e r n a t i o n a l J o u r n a l o f M a n a g e m e n t C a s e s
Table 4: Statistik Austria (2005) Internet:
http://www.statistik.at/konsumentenerhebung/ergebnisse.shtml
Social Factors
Social factors include the demographic and cultural aspects of the external macro environment. These factors affect customer needs and the size of potential markets.
Austria’s socio-economic model embraces an extensive social security and welfare system. On the one hand, it operates according to the insurance principle, by which all employed persons and most of their dependants continue to receive a stream of income in spite of absence from work due to illness, accident, maternity, unemployment or retirement. On the other hand, the system also encompasses state, provincial (regional) or municipal (local) welfare transfers for those citizens whose status or situation is not covered by the public social insurance system. Employer and employee contributions jointly finance this
extensive and costly network. The compulsory medical insurance, which includes coverage for children and, in some cases, spouses ensures that practically the entire population has access to the excellent nationwide medical care regardless of where they are situated. In addition, private medical insurance schemes are also available.
Technological Factors
Technological factors can lower barriers to entry, reduce minimum efficient production levels, and influence outsourcing decisions.
Austria’s gross domestic expenditure on R&D in 2005 (i.e. the sum total of expenditure on R&D performed in Austria) is set to reach 2.35% of the Gross Domestic Product (GDP), an increase of 8.0% over the previous year’s figure. According to STATISTICS AUSTRIA forecasts a total of € 5.77
I n t e r n a t i o n a l J o u r n a l o f M a n a g e m e n t C a s e s
374
billion will be spent in Austria this year on research and experimental development (R&D).
As in recent years the three main sources of financing for R&D in Austria in 2005 are therefore the business enterprise sector (43.0%), the public sector (36.6%), and abroad (20.1%). Most of the financing from abroad (around € 1.16 billion) comes from European multinational enterprises which are associated with Austrian enterprises and which have chosen Austria as their research location; it also includes return flows from EU framework programmes for research, technological development and demonstration, which in 2004 and 2005 will amount to as much as € 70 million per annum.
Structure and Trends of the Market
Overview
In the year 2002 approximately 34 million litres spirituous beverages were sold and the spirituous beverages massively growth especially in this year in which high-percentage spirituous beverages decreased steadily.
The imported spirituous beverages increases by about 120% in the years from 1998 to 2002 and had a market share of around 60% at this time. In the same length of time Local spirituous beverages decreased 53%.
The mixed spirituous beverages showed in 2002 that they are able to increase their market share by three times. The market share in the year 2002 was 27%.
Distribution Channels
The classical distribution channels of spirituous beverages are the food trade (retail) and the gastronomy, which plays an important role in the Austrian economy.
Opportunities
member of the European Union•
high standard of living•
attractive test-market•
important role of gastronomy in Austrian • economy
trend of mixed beverages (“Alco-pops”)•
Threats
dominant key player with Bacardi •
negative image of Alco-pops•
Internal Analysis (assumptions)
Strengths
As written in the introduction the internal audit is based on assumptions, as the authors have no contact to the sake brewery. It is assumed that the company is in very good financial situation, as they are one of the top sake producers. This refers also to the top quality of their products. So the core competence of the Tamanohikari Sake Brewery Corporation is their high quality and experience. Strength is that it is completely new on the market. The company is able to increase economies of scale and creates an added value for their core product, sake itself.
very good market position•
very good financial situation•
top quality product•
production know-how of the company•
production facilities of the company•
Good reputation (article in the New York Times • on the 18th of March 2005)
Increase of the reputation for sake itself•
Weaknesses
The Austrian market as well as the product is completely new for the company. Sake is produced in Japan, which means high distribution costs. Diversification can be very risky; however, the innovation rate and the very strong R&D department should be a guarantee for success.
no experience with the Austrian market•
no experience with the product•
distribution costs•
diversification always risky•

375
I n t e r n a t i o n a l J o u r n a l o f M a n a g e m e n t C a s e s
Figure 1: Bacardi-Martini GmbH (2002): Market Report. Spirituous Beverages Market.
Figure 2: Bacardi-Martini GmbH (2002): Market Report. Sales headed by distribution channel.
SWOT Analysis
A scan of the internal and external environment is an important part of the strategic planning process. Environmental factors internal to the firm usually can be classified as strengths (S) or weaknesses (W), and those external to the firm can be classified as opportunities (O) or threats (T). Such an analysis of the strategic environment is referred to as a SWOT analysis.
The SWOT analysis provides information that is helpful in matching the firm’s resources and capabilities to the competitive environment in which it operates. As such, it is instrumental in strategy formulation and selection. The following
diagram shows how a SWOT analysis fits into an environmental scan:
The SWOT Matrix
A firm should not necessarily pursue the more lucrative opportunities. Rather, it may have a better chance at developing a competitive advantage by identifying a fit between the firm’s strengths and upcoming opportunities. In some cases, the firm can overcome a weakness in order to prepare itself to pursue a compelling opportunity.
To develop strategies that take into account the SWOT profile, a matrix of these factors can be constructed. The SWOT matrix is shown below:

I n t e r n a t i o n a l J o u r n a l o f M a n a g e m e n t C a s e s
376
Figure 3: Bacardi-Martini GmbH (2002): Market Report. Market Share headed by Company
Figure 4: SWOT Analysis Framework

377
I n t e r n a t i o n a l J o u r n a l o f M a n a g e m e n t C a s e s
Figure 5: SWOT Analysis Matrix
Figure 6: Ansoff-Matrix
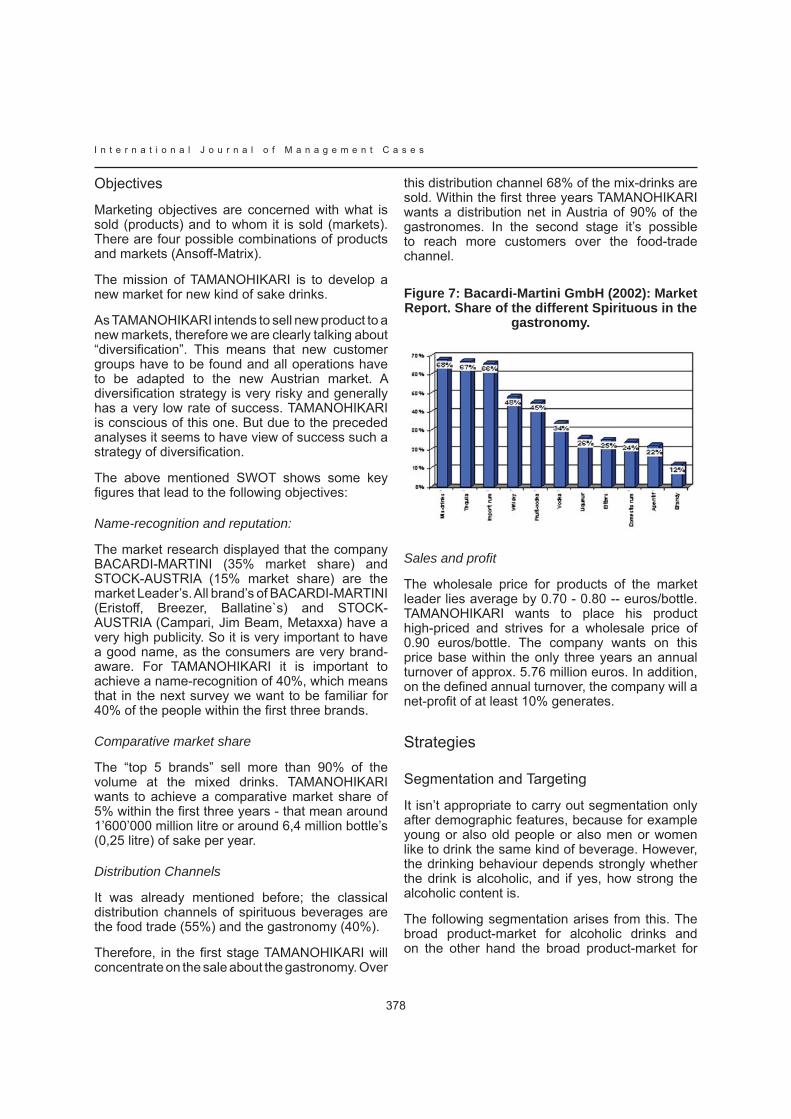
I n t e r n a t i o n a l J o u r n a l o f M a n a g e m e n t C a s e s
378
Objectives
Marketing objectives are concerned with what is sold (products) and to whom it is sold (markets). There are four possible combinations of products and markets (Ansoff-Matrix).
The mission of TAMANOHIKARI is to develop a new market for new kind of sake drinks.
As TAMANOHIKARI intends to sell new product to a new markets, therefore we are clearly talking about “diversification”. This means that new customer groups have to be found and all operations have to be adapted to the new Austrian market. A diversification strategy is very risky and generally has a very low rate of success. TAMANOHIKARI is conscious of this one. But due to the preceded analyses it seems to have view of success such a strategy of diversification.
The above mentioned SWOT shows some key figures that lead to the following objectives:
Name-recognition and reputation:
The market research displayed that the company BACARDI-MARTINI (35% market share) and STOCK-AUSTRIA (15% market share) are the market Leader’s. All brand’s of BACARDI-MARTINI (Eristoff, Breezer, Ballatine`s) and STOCK-AUSTRIA (Campari, Jim Beam, Metaxxa) have a very high publicity. So it is very important to have a good name, as the consumers are very brand-aware. For TAMANOHIKARI it is important to achieve a name-recognition of 40%, which means that in the next survey we want to be familiar for 40% of the people within the first three brands.
Comparative market share
The “top 5 brands” sell more than 90% of the volume at the mixed drinks. TAMANOHIKARI wants to achieve a comparative market share of 5% within the first three years - that mean around 1’600’000 million litre or around 6,4 million bottle’s (0,25 litre) of sake per year.
Distribution Channels
It was already mentioned before; the classical distribution channels of spirituous beverages are the food trade (55%) and the gastronomy (40%).
Therefore, in the first stage TAMANOHIKARI will concentrate on the sale about the gastronomy. Over
this distribution channel 68% of the mix-drinks are sold. Within the first three years TAMANOHIKARI wants a distribution net in Austria of 90% of the gastronomes. In the second stage it’s possible to reach more customers over the food-trade channel.
Figure 7: Bacardi-Martini GmbH (2002): Market Report. Share of the different Spirituous in the
gastronomy.
Sales and profi t
The wholesale price for products of the market leader lies average by 0.70 - 0.80 -- euros/bottle. TAMANOHIKARI wants to place his product high-priced and strives for a wholesale price of 0.90 euros/bottle. The company wants on this price base within the only three years an annual turnover of approx. 5.76 million euros. In addition, on the defined annual turnover, the company will a net-profit of at least 10% generates.
Strategies
Segmentation and Targeting
It isn’t appropriate to carry out segmentation only after demographic features, because for example young or also old people or also men or women like to drink the same kind of beverage. However, the drinking behaviour depends strongly whether the drink is alcoholic, and if yes, how strong the alcoholic content is.
The following segmentation arises from this. The broad product-market for alcoholic drinks and on the other hand the broad product-market for
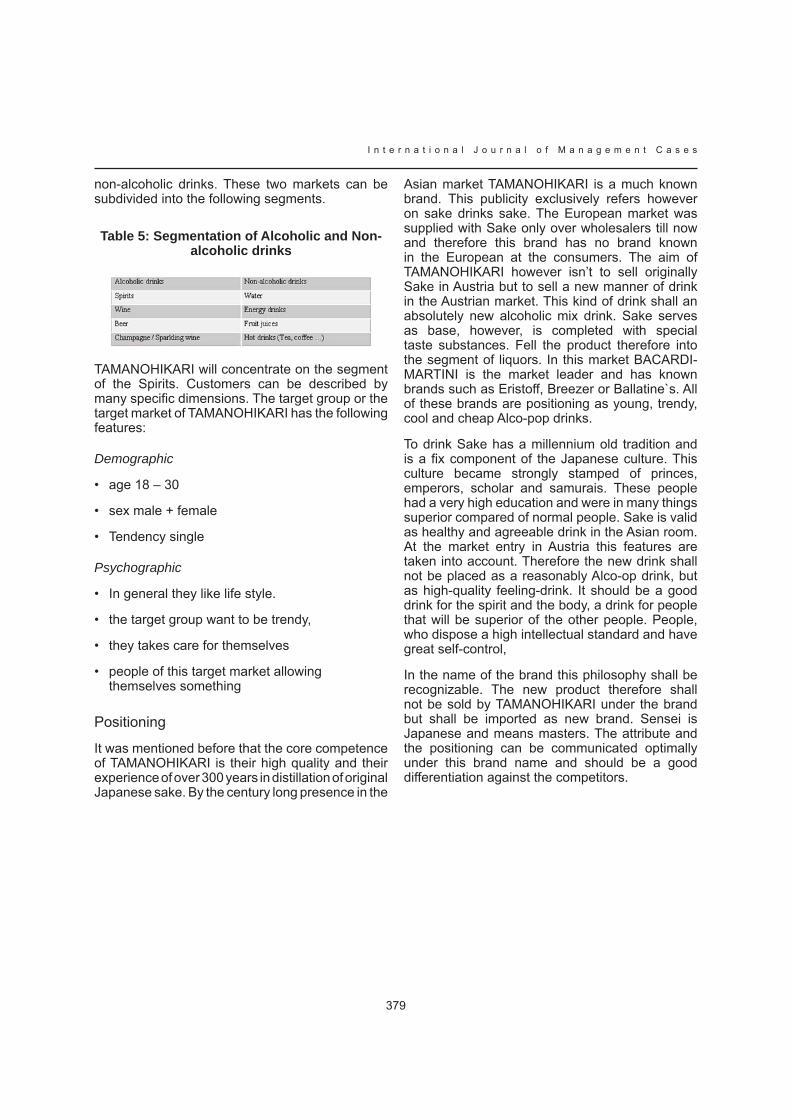
379
I n t e r n a t i o n a l J o u r n a l o f M a n a g e m e n t C a s e s
non-alcoholic drinks. These two markets can be subdivided into the following segments.
Table 5: Segmentation of Alcoholic and Non-alcoholic drinks
TAMANOHIKARI will concentrate on the segment of the Spirits. Customers can be described by many specific dimensions. The target group or the target market of TAMANOHIKARI has the following features:
Demographic
age 18 – 30•
sex male + female•
Tendency single•
Psychographic
In general they like life style. •
the target group want to be trendy,•
they takes care for themselves•
people of this target market allowing • themselves something
Positioning
It was mentioned before that the core competence of TAMANOHIKARI is their high quality and their experience of over 300 years in distillation of original Japanese sake. By the century long presence in the
Asian market TAMANOHIKARI is a much known brand. This publicity exclusively refers however on sake drinks sake. The European market was supplied with Sake only over wholesalers till now and therefore this brand has no brand known in the European at the consumers. The aim of TAMANOHIKARI however isn’t to sell originally Sake in Austria but to sell a new manner of drink in the Austrian market. This kind of drink shall an absolutely new alcoholic mix drink. Sake serves as base, however, is completed with special taste substances. Fell the product therefore into the segment of liquors. In this market BACARDI-MARTINI is the market leader and has known brands such as Eristoff, Breezer or Ballatine`s. All of these brands are positioning as young, trendy, cool and cheap Alco-pop drinks.
To drink Sake has a millennium old tradition and is a fix component of the Japanese culture. This culture became strongly stamped of princes, emperors, scholar and samurais. These people had a very high education and were in many things superior compared of normal people. Sake is valid as healthy and agreeable drink in the Asian room. At the market entry in Austria this features are taken into account. Therefore the new drink shall not be placed as a reasonably Alco-op drink, but as high-quality feeling-drink. It should be a good drink for the spirit and the body, a drink for people that will be superior of the other people. People, who dispose a high intellectual standard and have great self-control,
In the name of the brand this philosophy shall be recognizable. The new product therefore shall not be sold by TAMANOHIKARI under the brand but shall be imported as new brand. Sensei is Japanese and means masters. The attribute and the positioning can be communicated optimally under this brand name and should be a good differentiation against the competitors.
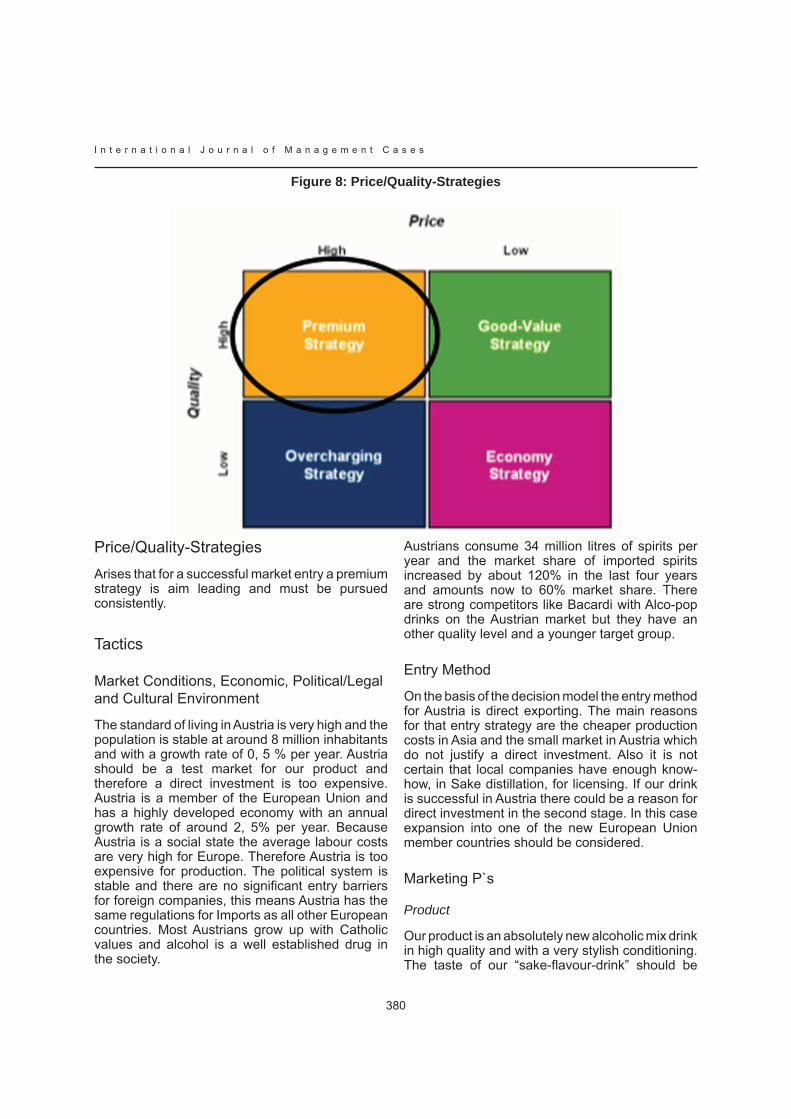
I n t e r n a t i o n a l J o u r n a l o f M a n a g e m e n t C a s e s
380
Figure 8: Price/Quality-Strategies
Price/Quality-StrategiesArises that for a successful market entry a premium strategy is aim leading and must be pursued consistently.
Tactics
Market Conditions, Economic, Political/Legal and Cultural Environment
The standard of living in Austria is very high and the population is stable at around 8 million inhabitants and with a growth rate of 0, 5 % per year. Austria should be a test market for our product and therefore a direct investment is too expensive. Austria is a member of the European Union and has a highly developed economy with an annual growth rate of around 2, 5% per year. Because Austria is a social state the average labour costs are very high for Europe. Therefore Austria is too expensive for production. The political system is stable and there are no significant entry barriers for foreign companies, this means Austria has the same regulations for Imports as all other European countries. Most Austrians grow up with Catholic values and alcohol is a well established drug in the society.
Austrians consume 34 million litres of spirits per year and the market share of imported spirits increased by about 120% in the last four years and amounts now to 60% market share. There are strong competitors like Bacardi with Alco-pop drinks on the Austrian market but they have an other quality level and a younger target group.
Entry Method
On the basis of the decision model the entry method for Austria is direct exporting. The main reasons for that entry strategy are the cheaper production costs in Asia and the small market in Austria which do not justify a direct investment. Also it is not certain that local companies have enough know-how, in Sake distillation, for licensing. If our drink is successful in Austria there could be a reason for direct investment in the second stage. In this case expansion into one of the new European Union member countries should be considered.
Marketing P`s
Product
Our product is an absolutely new alcoholic mix drink in high quality and with a very stylish conditioning. The taste of our “sake-flavour-drink” should be
381
I n t e r n a t i o n a l J o u r n a l o f M a n a g e m e n t C a s e s
bittersweet with only a slight sense of the original sake. The taste is adapted for the European, especially for the Austrian market. Because of our special target group the taste should not be that sweet like our competitors “Eristoff Ice”. We decide to do the premium strategy and so our product has to be higher in quality than our competitors drink. It starts with the high quality content and ends up with a very stylish appearance and packaging of our drink. Our customers have to know that they drink the best and then they are willing to pay for that.
Place
First we will go into the gastronomy witch means we have to be listed in the wholesale shops like AGM, Wedel, Metro, where the gastronomy is buying from. This is the way we want to distribute our product because to build up our own distribution network is too expensive. We believe that bars, discos and nightclubs in the high end segment (like hangar 7 in Salzburg or the Planthers in Vienna) are the right environment to bring our customers in first contact with our product. Also we would like to reach restaurants witch work in the Asian fusion segment or classical high end Asian style restaurants. Secondly we want to be listed in retail and fancy food stores with Asian influences.
Price
Our prices reflect the “premium strategy” and are on the high end compared to those of our competitors. Because of the “pull-strategy” we want to make special discounts for the gastronomy (buy 10 get 15, for example) to give the bar owners a special incentive, to sell our product, in the beginning. Trough that, we believe we can generate publicity in the gastronomy.
Promotion
For the first year of the promotion we want to create a promotion team, which drive through Austria with a special “Sensei-Truck”. This truck should be in the same style as our bottles. The promotion team, especially girls (Sensei-Bunnies), should have an extra “Sensei outfit”. With this truck we want to organize special “Sensei-Parties” with trendy and hip bars and discos with bigger volume. At these parties the Sensei girls should sell our drink for half price and the owner gets the extra earnings. For that incentive the owner has to buy a minimum of 500 bottles which he than has an interest to sell.
In addition to that we want to reach special cultural and sports invents like the Bregenzer Festspiele, Porsche meetings, new BMW launch, skirace Kitzbühel or Jazz festivals where we can sell our product with our truck as well as sponsoring to generate PR in radio, TV or newspapers.
Another part of our promotion is classical advertising with billboards in urban areas and advertising in trendy newspapers.
We also want to make a lottery with numbers on the inside of the labels of our bottles where people can win some units of our product and the main prize is an all paid trip to Japan including an inspection of our brewery. To know who has won a prize they have to go on our homepage where they can check the winning numbers. With this we can also enhance the attraction of our homepage and give more information about us to our customers.
ConclusionThe Sostac-system is a good way to prepare a market entry. In the situation analysis, which includes the external as well as the internal audit companies gets an overview about the macro and the micro environment. In the next part a company has to decide the objectives which should be specific, measurable, achievable, realistic and timely. After the objectives the strategy will be defined. In this paper the authors used the STP-model as well as the Price/quality strategy. Within the tactics an enterprise decides how to follow the strategy to achieve the objectives. The actions would be the tactics in more detail. At the end a company would control the overall plan, that it will be a success. Nowadays it is the most important thing to observe the market in advance, otherwise companies can not succeed.
EndnotesAustrian Federal Economic Chamber Austrian 1. Trade (2004): The Austrian Import Market.
Austrian Federal Economic Chamber Austrian 2. Trade (2004): The Austrian Import Market.
Austrian Federal Economic Chamber Austrian 3. Trade (2004): The Austrian Import Market
Statistik Austria (2005): Internet: http://www.4. statistik.at/fachbereich_forschung/txt.shtml

I n t e r n a t i o n a l J o u r n a l o f M a n a g e m e n t C a s e s
382
ReferencesAustrian Federal Economic Chamber (2004): The Austrian Import Market. Guide to Business with Austria. 10th Edition.
Bacardi-Martini GmbH (2002): Marktbericht.
Bruckbauer, Stefan (2005): Austrian Economy. Published by Bank Austria Creditanstalt AG. Vienna:Imprint
Buy USA .GOV (2005): The Investment Climate in Austria. Internet: http://www.buyusa.gov/austria/en/investment_climate_austria.html
Statistik Austria (2000): Bevölkerung und Kosumerhebung 1999/2000. Internet: http://www.statistik.at/konsumerhebung/ergenbisse.shtml last updated July 2001
Statistik Austria (2004): Handbook Alcohol – Austria. Auszug aus dem hanbuch Alkohol – Österreich (in preparation) last update 28.04.2004. Uhl & Springer

383
I n t e r n a t i o n a l J o u r n a l o f M a n a g e m e n t C a s e s