13201-A-2019.pdf - International Journal of Recent Scientific ...
Upload
khangminh22Category
view
1download
0
Vol. 10 No. 1 January-April 2013
Editorial Advisory Board
Lizzette Rojas, PhD, Editor
Norma Cruz, MD
Judith González, EdD
Miguel Oppenheimer, MD
Edwina Sánchez, PharmD
Flordeliz Serpa, PhD
Axi Díaz, JD
Gloria Eva Rolón, JD
Scientific International Journal™ is an
official publication of Non-Profit
Evaluation & Resource Center, Inc.
Copyright 2013 by Non-Profit Evaluation
& Resource Center, Inc. All rights
reserved. Authors are fully responsible
for data, statements of fact and
opinion. Statements by authors do not
imply an opinion on the part of the
Editor, the Editorial Advisory Board and
the officers. Scientific International
Journal™ assumes no liability or
responsibility for any claims, actions, or
damages resulting from the publication
of any article.
Scientific International Journal™
605 Condado Street, Suite 706
San Juan, Puerto Rico 00907
787-550-5964
Cover graphic design:
Jonathan Castro
Developed in Puerto Rico.
ISSN 1548-9639 (print)
ISSN 1554-6349 (online)
Featured Articles:
THE ROLE OF THE TOBACCO CONTROL PROGRAM
AND ITS COLLABORATORS IN THE EFFORTS TO
TRANSFORM PUERTO RICO IN A SMOKE-FREE
ISLAND 4 Alex Cabrera-Serrano, MS, Antonio Cases-Rosario, MPA and Suzie
Rivera-Pacheco, JD, LLM
MAIN ACHIEVEMENTS FROM THE CIVIL RIGHTS
STRUGGLE AND THE REELECTION OF PRESIDENT
BARACK OBAMA 16 Mylord Reyes Tosta, EdD
EL PODER ESTADÍSTICO. DIFERENCIAS
OBSERVADAS CUANDO SE CAMBIA EL ALFA
ESTABLECIDO EN UN ESTUDIO DE
INVESTIGACIÓN 23
Mylord Reyes Tosta, EdD
Sharing knowledge. Promoting excellence.
SScciieennttiiffiicc IInntteerrnnaattiioonnaall JJoouurrnnaall™™
605 Condado Street, Suite 706 San Juan, Puerto Rico 00907
787-550-5964
[email protected] www.nperci.org
Non-Profit Evaluation & Resource Center, Inc.
Improving Performance through EvaluationSM
NPERCI
Scientific International Journal™
Vol. 10 No. 1 · January-April 2013 4
______ FEATURED ARTICLES
THE ROLE OF THE TOBACCO CONTROL PROGRAM AND
ITS COLLABORATORS IN THE EFFORTS TO TRANSFORM
PUERTO RICO IN A SMOKE-FREE ISLAND
Alex Cabrera-Serrano, MS, Antonio Cases-Rosario, MPA and
Suzie Rivera-Pacheco, JD, LLM
Abstract
Over the last 20 years, it has been shown that the adoption of more restrictive public
policies regarding tobacco use has had a major impact in preventing and controlling
tobacco use and their derivatives. The objective of this study was to establish how the
efforts made by the Puerto Rico Tobacco Control Program (PRTCP) and its collaborators
contributed in the transformation of the island into a smoke-free jurisdiction. To evaluate
the role of the PRTCP and its collaborators, data of the following sources were analyzed:
Microjuris, Puerto Rico Behavioral Risk Factor Surveillance System (PRBRFSS), Puerto
Rico Youth Substance Abuse Survey (PRYSAS), and the Puerto Rico Department of
Revenue (PRDR). The results of this report demonstrate that reducing tobacco use is a
public health concern that implies the development of multiple strategies in collaboration
with multiple sectors of the population. This has been the key strategy of the PRTCP to
meet its goals despite its budgetary constraints.
Keywords: tobacco, smoking, Tobacco Control Program, tobacco policies, smoke free
countries
Resumen
En los últimos 20 años, se ha demostrado que la adopción de políticas más restrictivas
sobre el uso de tabaco ha tenido un impacto importante en la prevención y control de este
vicio y sus derivados. El objetivo de este estudio fue establecer cómo los esfuerzos
realizados por el Programa de Control del Tabaco de Puerto Rico y sus colaboradores han
contribuido a la transformación de la isla en una jurisdicción libre de humo. Para evaluar
estos esfuerzos, datos de las siguientes fuentes fueron analizados: Microjuris, Puerto Rico
Behavioral Risk Factor Surveillance System, Consulta Juvenil y el Departamento de
Hacienda. Los resultados de este informe demuestran que la reducción del consumo de
tabaco es un problema de salud pública que implica el desarrollo de múltiples estrategias,
en colaboración con múltiples sectores de la población. Esta ha sido la estrategia clave
del Programa de Control del Tabaco y sus colaboradores para cumplir con sus metas a
pesar de sus limitaciones presupuestarias.
Palabras claves: tabaco, fumar, Programa de Control del Tabaco, leyes sobre tabaco,
países libres de humo
Scientific International Journal™
Vol. 10 No. 1 · January-April 2013 5
INTRODUCTION
igarette smoking is the single cause of
preventable disease and death in United States.
It is also responsible for more than 400,000
deaths annually (1). Irrefutable scientific
evidence in the past 50 years shows that tobacco use or exposure
to tobacco smoke damages the human body with deadly
consequences (2). Although for 2011 the tobacco use prevalence
remains lower in Puerto Rico (14.8%) than in the United States (21.1%) (3), seven of the
twelve leading causes of death in the Island are associated with smoking (heart disease,
malignant tumors, Alzheimer, cerebrovascular disease, chronic pulmonary disease,
nephritis, and hypertension) (4). In relation to the exposure to second hand smoke (SHS),
it is worth mentioning that it is associated with a variety of chronic diseases including
cancer, cardiovascular disease, asthma, and obstructive pulmonary disease (5). The SHS
protection is among the six most important and effective tobacco control public policy
outlined by the World Health Organization (WHO). It is joined by taxes and prices,
health warnings, cessation programs, banning on advertising and sponsorships, as well as,
careful surveillance of tobacco epidemic and prevention policies (6).
Over the past 20 years, the adoption of new strategies and more restrictive public
policies to prevent and control tobacco use has had a major impact on people’s health.
Undoubtedly, public policies have an enormous influence on people’s behavior and
lifestyles. Scientific research has shown that public policies that prohibit smoking in
hospitality venues such as restaurants and bars are associated with rapid reductions in self-
reported respiratory and sensory symptoms among nonsmoking hospitality workers (7).
Currently, Puerto Rico is one of the jurisdictions with the most restrictive and
comprehensive public policy in tobacco use, as well as, protection of SHS exposure in the
entire United States (8). During the past twenty-one years, there have been many efforts
to reduce tobacco consumption in Puerto Rico. Therefore, it is important to determine
how the efforts made by the Puerto Rico Tobacco Control Program (PRTCP) and its
collaborators contributed in the transformation of Puerto Rico into a smoke-free island,
and with that purpose, the authors reviewed the laws and initiatives carried out before and
C
Scientific International Journal™
Vol. 10 No. 1 · January-April 2013 6
after the program foundation. This report describes the results of that analysis and what
has been the impact on the tobacco use prevalence and the exposure to second hand
smoke.
METHODS
o analyze the role of the PRTCP and its collaborators in the efforts to
transform Puerto Rico in a smoke-free island, data from the following
sources were analyzed: Microjuris 2011, Puerto Rico Behavioral Risk
Factor Surveillance System (PRBRFSS) 2011, Puerto Rico Youth
Substance Abuse Survey (PRYSAS) 1997 to 2007, and the Puerto Rico Department of
Revenue (PRDR) 2011. Microjuris is an electronic legal research tool that offers a
complete and updated range of digital content such as laws, regulations and case law that
allows the user to consult the legal spectrum of his or her public policy strategic plan.
The BRFSS is a telephone survey of non-institutionalized adults conducted annually in
all 50 states, the District of Columbia, Guam, Puerto Rico, and the US Virgin Islands. In
Puerto Rico, this survey began since 1996 and is part of the Puerto Rico Department of
Health. The PRYSAS is a biennially survey conducted since 1990 by the Puerto Rico
Substance Abuse and Mental Health Services Administration. This survey consists of a
self-administered questionnaire aimed at a representative sample of elementary, middle,
and high level students in Puerto Rico’s public and private schools. Its purpose is to
determine the percentage of students enrolled in 5th
to 12th
grade who engage in high-risk
behaviors such as tobacco, alcohol and drug use, and premature sexual activity, among
others. The PRDR is the public agency responsible for administering the public policy
related to tax matters, financial and management of public funds. This agency is
responsible for collecting the excise tax on cigarettes and grant cigarette’s sale permits.
RESULTS
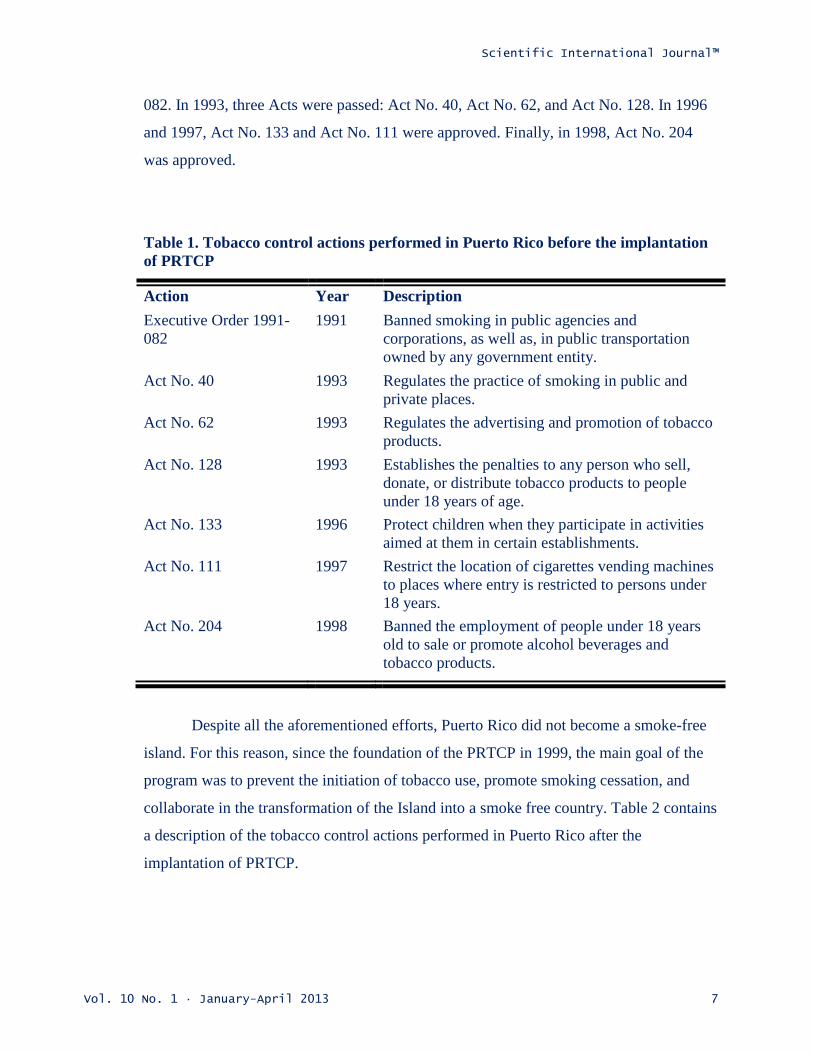
he first step to transform Puerto Rico into a smoke-free island began in
the early 90’s. Table 1 contains a description of the tobacco control
regulations adopted in Puerto Rico before the foundation of the PRTCP.
In 1991, the first public policy adopted was the Executive Order 1991-
T
T
Scientific International Journal™
Vol. 10 No. 1 · January-April 2013 7
082. In 1993, three Acts were passed: Act No. 40, Act No. 62, and Act No. 128. In 1996
and 1997, Act No. 133 and Act No. 111 were approved. Finally, in 1998, Act No. 204
was approved.
Table 1. Tobacco control actions performed in Puerto Rico before the implantation
of PRTCP
Action Year Description
Executive Order 1991-
082
1991 Banned smoking in public agencies and
corporations, as well as, in public transportation
owned by any government entity.
Act No. 40 1993 Regulates the practice of smoking in public and
private places.
Act No. 62 1993 Regulates the advertising and promotion of tobacco
products.
Act No. 128 1993 Establishes the penalties to any person who sell,
donate, or distribute tobacco products to people
under 18 years of age.
Act No. 133 1996 Protect children when they participate in activities
aimed at them in certain establishments.
Act No. 111 1997 Restrict the location of cigarettes vending machines
to places where entry is restricted to persons under
18 years.
Act No. 204 1998 Banned the employment of people under 18 years
old to sale or promote alcohol beverages and
tobacco products.
Despite all the aforementioned efforts, Puerto Rico did not become a smoke-free
island. For this reason, since the foundation of the PRTCP in 1999, the main goal of the
program was to prevent the initiation of tobacco use, promote smoking cessation, and
collaborate in the transformation of the Island into a smoke free country. Table 2 contains
a description of the tobacco control actions performed in Puerto Rico after the
implantation of PRTCP.
Scientific International Journal™
Vol. 10 No. 1 · January-April 2013 8
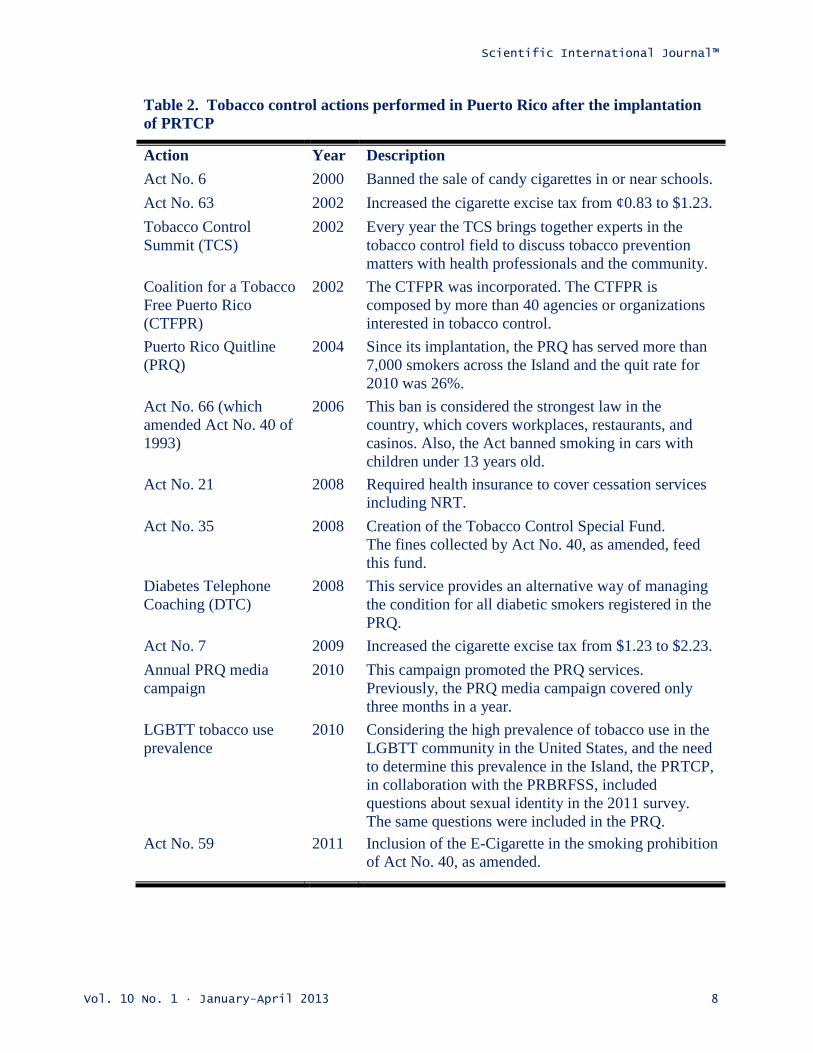
Table 2. Tobacco control actions performed in Puerto Rico after the implantation
of PRTCP
Action Year Description
Act No. 6 2000 Banned the sale of candy cigarettes in or near schools.
Act No. 63 2002 Increased the cigarette excise tax from ¢0.83 to $1.23.
Tobacco Control
Summit (TCS)
2002 Every year the TCS brings together experts in the
tobacco control field to discuss tobacco prevention
matters with health professionals and the community.
Coalition for a Tobacco
Free Puerto Rico
(CTFPR)
2002 The CTFPR was incorporated. The CTFPR is
composed by more than 40 agencies or organizations
interested in tobacco control.
Puerto Rico Quitline
(PRQ)
2004 Since its implantation, the PRQ has served more than
7,000 smokers across the Island and the quit rate for
2010 was 26%.
Act No. 66 (which
amended Act No. 40 of
1993)
2006 This ban is considered the strongest law in the
country, which covers workplaces, restaurants, and
casinos. Also, the Act banned smoking in cars with
children under 13 years old.
Act No. 21 2008 Required health insurance to cover cessation services
including NRT.
Act No. 35 2008 Creation of the Tobacco Control Special Fund.
The fines collected by Act No. 40, as amended, feed
this fund.
Diabetes Telephone
Coaching (DTC)
2008 This service provides an alternative way of managing
the condition for all diabetic smokers registered in the
PRQ.
Act No. 7 2009 Increased the cigarette excise tax from $1.23 to $2.23.
Annual PRQ media
campaign
2010 This campaign promoted the PRQ services.
Previously, the PRQ media campaign covered only
three months in a year.
LGBTT tobacco use
prevalence
2010 Considering the high prevalence of tobacco use in the
LGBTT community in the United States, and the need
to determine this prevalence in the Island, the PRTCP,
in collaboration with the PRBRFSS, included
questions about sexual identity in the 2011 survey.
The same questions were included in the PRQ.
Act No. 59 2011 Inclusion of the E-Cigarette in the smoking prohibition
of Act No. 40, as amended.
Scientific International Journal™
Vol. 10 No. 1 · January-April 2013 9
Through mobilizing different sectors of the
population such as health professionals, academics,
policymakers and the general community, the first
achievement in tobacco control, with the
collaboration of the PRTCP, was the approval of
Act No. 6 in 2000. In 2002, the approval of Act
No. 63 to increase the cigarette excise tax was another accomplishment. During this year,
the PRTCP launched the first Tobacco Control Summit (TCS) and the Coalition for a
Tobacco Free Puerto Rico (CTFPR) was incorporated. In 2004, the PRTCP implemented
the Puerto Rico Quitline (PRQ). After multiple efforts made by the PRTCP and its
collaborators in different areas of tobacco control such as prevention, education and
smoking cessation, Act No. 66 (which amended Act No. 40 of 1993) was approved in
2006. With the implementation of this Act in 2007, Puerto Rico finally became a smoke-
free island. Despite this achievement, the PRTCP and its collaborators have continued
their mission to reduce tobacco use prevalence, achieving in 2008 the approval of Act
No. 21 and Act No. 35. In addition, in 2008 the PRQ included, as part of their services,
the Diabetes Telephone Coaching. In regard to legislation, Act No. 7, which was
approved in 2009, increased the cigarette excise tax once again. In November 2010,
combining funds of the PRTCP core proposal and the American Recovery and
Reinvestment Act funds (ARRA), the program established a first annual media campaign
to promote the PRQ services. Also, in 2010, considering the high prevalence of tobacco
use in the LGBTT community in the United States, the PRTCP, in collaboration with the
PRBRFSS, included questions about sexual identity in the 2011 survey. The same
questions were included in the PRQ. Finally, in 2011, the last achievement of the PRTCP
and its collaborators was the approval of the Act No. 59.
A review of different data sources showed that the efforts made by the PRTCP
and its collaborators have contributed significantly in reducing tobacco use and the
exposure to the SHS on the Island. The PRBRFSS data demonstrated that Puerto Rico
has remained among the lowest prevalence of tobacco use among the 50 states and
territories of the United States (14.8% vs. 21.1%). At the same time, according to the
PRYSAS data (2005-2007), there has been a consistent decrease in the percent of
Scientific International Journal™
Vol. 10 No. 1 · January-April 2013 10
students who report using tobacco products in the past month from 1997 to 2007. The last
month’s tobacco use decreased in: 9th
grade from 22.5% (1997) to 5.6% (2007); 10th
grade from 25.4% (1997) to 8.3% (2007); 11th
grade from 21.8% (1997) to 10.3% (2007);
12th
grade from 24.4% (1997) to 11.7% (2007).
Researchers Marín and Díaz demonstrated the impact of the implementation of
Act No. 66 in the reduction of the risk of SHS exposure and the reduction in cigarette
packs’ monthly sales. In the first research, Marín and Díaz evaluated the effect of the
implementation of Act No. 66 in restaurants, pubs and discos in the metropolitan area of
San Juan (9). The researchers took samples of particulate concentration level in the air
before and after the implementation of the Act (scientific literature showed that smoking
is one of the main sources of indoor levels of PM2.5). The research results showed that,
after the implementation of Act No. 66, restaurants experienced a reduction of 83.6% (p
= 0.013) in average PM2.5 levels of 0.169 to 0.028 mg/m3 and in pubs and discos there
was a reduction of 95.6% (p = 0.004) of 0.626 to 0.028 mg/m3. With these results, the
researchers concluded that the implementation of Act No. 66 has been successful in
reducing the risk of SHS exposure to the population who live and work in the
metropolitan area of San Juan. In the second research, Marín and Díaz evaluated the
association of the implementation of Act No. 66 and the monthly per capita sales of
cigarettes packs in Puerto Rico (10). The evaluation period was from January 1989 until
February 2010. The data sources used were the PRDR, the Puerto Rico Planning Board,
and the Puerto Rico Department of Labor. After analyzing the data and controlling
confounding variables (time trend, monthly seasonal effects, price of cigarettes, exports
per capita, and the employment rate), the researchers concluded that the implementation
of Act No. 66 was associated with a significant average reduction in the monthly sales of
cigarette packs. The reduction was 16.1% [CI95%: 6.9%, 24.5%] from March 2007 to
February 2010. This represents a reduction of 5 packs of cigarettes capita per year, which
implies a total annual reduction of 19 million cigarette packs using the year 2006 as
reference.
Scientific International Journal™
Vol. 10 No. 1 · January-April 2013 11
DISCUSSION
estricting smoking in workplaces and
public places by regulations, as well as,
tobacco advertising and youth access to
tobacco products are part of a
comprehensive, evidence-based approach to promote
tobacco control (11). Some of the changes in tobacco use shown in this report can be
attributed to the multiple tobacco control policies implemented (12). It is worth noting
that the legislation adopted in Puerto Rico takes into consideration international efforts to
regulate tobacco use and promote prevention. Specifically, the smoking restrictions
included in Act No. 66 comply with those promoted under the Framework Convention on
Tobacco Control (FCTC) (FCTC’s Article 8). The FCTC entered into force in February
2005 and is the world’s first global public health treaty. It is also the first treaty
negotiated under the auspices of the WHO. Currently, 174 member states have ratified it.
United States has not ratified the treaty and, since it is not a party to the FCTC, Puerto
Rico is not a member. Nevertheless, the health policy promoted by the PRTCP and its
collaborators has not ignored the FCTC’s provisions. In fact, the PRTCP has aimed much
of its efforts to strengthen public awareness of tobacco control issues in accordance with
FCTC’s Article 12.
In May 2009, the Morbidity and Mortality Weekly Report (MMWR) reported the
largest cigarette excise tax in history (13). The combined federal and average state tax for
cigarettes was raised to $2.21 per pack. Unfortunately, Puerto Rico is not included under
the federal excise tax. Therefore, in 2009, Puerto Rico approved the Act No. 7 to increase
the excise tax from $1.23 to $2.23 to keep pace with the rest of the country. Once again,
the PRTCP and its collaborators have made a strategic move to continue to support
tobacco prevention initiatives in Puerto Rico. Despite of this achievement, the PRBRFSS
2009 data showed that 90.9% of Puerto Ricans agreed to continue raising taxes on
cigarettes.
Tobacco use among youth minors continues to be a problem worldwide.
Estimates indicate that in the United States, every day, approximately 6,000 youth under
18 years old smoked for the first time and more than 3,000 became regular smokers (14,
R
Scientific International Journal™
Vol. 10 No. 1 · January-April 2013 12
15). Restrict youth access to tobacco products includes different strategies such as
businesses’ managers and owners education campaigns, signage, required ID checks,
bans on self-service displays, the elimination of vending machines, and other strategies
designed to make it more difficult for youth to obtain tobacco products (14). The
analyzed data of the PRYSAS demonstrated that the combination of these strategies to
control tobacco access to young people really works. Consistent decreases in the percent
of students who reported using tobacco products in the past month in Puerto Rico have
occurred for each group from 9th
to 12th
grade from 1997 to 2007.
The findings of this report are subject to at least three limitations. First, the
PRBRFSS is a self-report survey that only includes non-institutionalized adults with
home telephones. This may cause an underestimation of the tobacco use prevalence on
the Island. Second, the PRYSAS data is updated up to 2007, which does not led us
confirm if the tobacco use diminution trend in adolescents is still happening. Finally, the
results of the Marín and Díaz research demonstrated the effectiveness of the
implementation of Act No. 66 only in the San Juan metropolitan area. Additional
research is needed to verify the effectiveness of the implementation of this Act Island
wide.
CONCLUSIONS
ince the eighties, the decrease of the smoking prevalence in the United
States has been associated to different tobacco control interventions such
as price increases, comprehensive statewide smoke-free air law, and
socio-cultural support of tobacco-free regulations (16). These
achievements have been supported by comprehensive state tobacco control programs and
the implementation of evidence-based interventions (16, 17). Comprehensive tobacco
control programs are the most effective means to reduce tobacco use (12). However,
comprehensive tobacco control programs require the coordinated efforts of both
statewide and local coalitions to advocate for policies, combat the tobacco industry, and
influence social norms (18).
Currently, on the Island, the PRTCP is the lead entity for the statewide
management of tobacco use prevention and cessation. The findings of this research
S
Scientific International Journal™
Vol. 10 No. 1 · January-April 2013 13
demonstrated that the efforts made by the PRTCP and its collaborators have contributed
to reducing the use of tobacco and the exposure to secondhand smoke. However, many
people are not aware that the success of the program was predicated on a mere $239,040
budget from the CDC to serve a population of almost four million residents. Although
Puerto Rico received Master Settlement Agreement dollars, the PRTCP did not receive
anything of these funds, and from the Tobacco Control Special Fund created in 2009, the
PRTCP has not yet receive these funds. Nevertheless, with limited funding and a
population greater than almost half of the States in the United States, the PRTCP
contributed monumentally in the transformation of Puerto Rico into a smoke-free island.
Finally, the results of this research demonstrated that reducing tobacco use is a public
health concern that implies the development of multiple strategies in collaboration with
multiple sectors of the population. This has been the key of the PRTCP to meet its goals
despite its budgetary constraints.
ACKNOWLEDGMENTS
The authors wish to thank Ralph S. Caraballo, Ph.D., MPH, EIS 95, Michele
Williams, MPH, Heriberto Marín, PhD, and Elba Díaz, DMD, MSD, MPH, for their
contribution to this paper.
REFERENCES
1. Rumberger JS, Hollenbeak CS, Kline D. Potential Costs and Benefits of Smoking
Cessation: An Overview of the Approach to State Specific Analysis. Penn State
University, 2010. Available at: http://www.lungusa.org/stop-smoking/tobacco-control-
advocacy/reports-resources/cessation-economic-
benefits/reports/SmokingCessationTheEconomicBenefits.pdf
2. U.S. Department of Health and Human Services. How Tobacco Smoke Causes
Disease: The Biology and Behavioral Basis for Smoking-Attributable Disease: A
Report of the Surgeon General. Atlanta, GA: U.S. Department of Health and Human
Services, CDC, 2010. Available at:
http://www.surgeongeneral.gov/library/tobaccosmoke/report/executivesummary.pdf
3. Centers for Disease Control and Prevention. Behavioral Risk Factor Surveillance
System. Available at: http://apps.nccd.cdc.gov/brfss/
4. Instituto de Estadísticas de Puerto Rico. Nuevas estadísticas de mortalidad, 2000-08.
2010; 12. San Juan, Puerto Rico. Available at: www.estadisticas.gobierno.pr
5. Shavers VL, Fagan P, Jouridine LA, Clayton R, Coucent J, Baezconde L. Workplace
and home smoking restriction and racial/ethnic variation in the prevalence and
Scientific International Journal™
Vol. 10 No. 1 · January-April 2013 14
intensity of current cigarette smoking among women by poverty status, TUS-CPS
1998-1999 and 2001-2002. Journal of Epidemiology & Community Health. 2006; 60
Suppl 2:34-43.
6. Beauchamp A, Stevenson C. The Importance of Extinguishing Secondhand Smoke
Circulation. Journal of the American Heart Association. 2009; 120:1339-1341.
7. Bauer U, Juster H, Hyland A, Farrelly M, Emgelen M, Weitzenkamo D, et al. Reduced
Secondhand Smoke Exposure After Implementation of a Comprehensive Statewide
Smoking Ban—New York, June 26, 2003—June 30,2004. Morbidity and Mortality
Weekly Report. 2007; 56 (28):705-708.
8. Americans for Nonsmoker’s Rights. Smokefree Air: U.S. Commonwealths and
Territories. 2009; 28:1. Available at: http://anr.no-
smoke.org/site/DocServer/Winter_UPDATE.pdf?docID=161
9. Marín HA, Díaz-Toro E. The Effect of the Smoke-Free Workplace Policy in the
Exposure to Secondhand Smoke in Restaurants, Pubs, and Discos in San Juan, Puerto
Rico. PRHSJ 2010; 29:279-285.
10. Marín HA, Díaz T. Effect of the smoking free work places ban law on the cigarette
sales in Puerto Rico: a time-series analysis. University of Puerto Rico, Medical
Science Campus. Forthcoming 2012.
11. Griffin M, Babb SD, Tynan M, MacNeil AE. State Preemption of Local Control
Policies Restricting Smoking, Advertising, and Youth Access – United States, 2000 –
2010. MMWR 2011; 60:1124-1127.
12. Gunasekara PW, Rahman K, Sinba DN, Warren CW, Lee J, Lea V, Asma S. Tobacco
Use among Students Age 13-15 Years – Sri Lanka, 1999 – 2007. Morbidity and
Mortality Weekly Report 2008; 57:545-552.
13. Janison N, Tynan M, MacNeil A, Merritt R, Federal and State Cigarette Excise
Taxes---United States, 1995—2009. Morbidity and Mortality Weekly Report 2009;
58:524-527.
14. Hobart R, Shopland DR, Shields D, Hallett C, Burms DM. The Role of Public Policy
Change in Tobacco Control. Current State of the Science. Smoking and Tobacco
Control Monograph No. 11, Section I. Available at:
http://cancercontrol.cancer.gov/tcrb/monographs/11/section1_mono_11.pdf
15. Crump C, Packer L. Incidence of Initiation of Cigarette Smoking—United States,
1965-1996. Morbidity and Mortality Weekly Report 1998; 47:837-840.
16. Jay SJ, Torabi MR, Spitznagle MH. A decade of sustaining best practices for tobacco
control: Indiana’s story. Preventing Chronic Disease. 2012; 9:E37.
17. U.S. Department of Health and Human Services, Centers For Disease Control and
Prevention. Best practices for comprehensive tobacco control program – 2007.
Available at:
http://www.cdc.gov/tobacco/stateandcommunity/best_practices/index.htm
18. Centers for Disease Control and Prevention. Best Practices User Guide: Coalitions—
State and Community Interventions. Available at:
http://www.cdc.gov/tobacco/stateandcommunity/bp_user_guide/pdfs/user_guide.pdf

Scientific International Journal™
Vol. 10 No. 1 · January-April 2013 15
AUTHORS
Alex Cabrera-Serrano, MS – Epidemiologist/Evaluator, Tobacco Control and Oral
Health Division, Puerto Rico Department of Health, and member of the scientific
committee of the Coalition for a Tobacco Free Puerto Rico (CTFPR). Electronic mail:
Antonio Cases-Rosario, MPA – Director of the Tobacco Control and Oral Health
Division, Puerto Rico Department of Health, and director of the Coalition for a Tobacco
Free Puerto Rico (CTFPR). Electronic mail: [email protected]
Suzie Rivera-Pacheco, JD, LLM – Lawyer and member of the public policy committee
of the Coalition for a Tobacco Free Puerto Rico (CTFPR). Electronic mail:
Copyright 2013 Non-Profit Evaluation & Resource Center, Inc.
Scientific International Journal™
Vol. 10 No. 1 · January-April 2013 16
MAIN ACHIEVEMENTS FROM THE CIVIL RIGHTS
STRUGGLE AND THE REELECTION OF PRESIDENT
BARACK OBAMA
Mylord Reyes Tosta, EdD
Abstract
This paper presents remarkable events that occurred in the decade of the 1940s and
the1950s related to the struggle for equality between blacks and whites in the United
States of America (USA). Rosa Parks, who with her husband worked for this cause,
became famous in 1955 when she was arrested for refusing to give up her seat to a white
person on a bus in Montgomery, Alabama. Dr. Martin Luther King, Jr. and other partners
took advantage of this fact to begin in this city a famous boycott that lasted a little over a
year. From then on, there were many achievements for black people. People like Dr.
Martin Luther King, Jr. and Rosa Parks, who fought for many years in favor of civil
rights in the USA, perhaps never imagined that an African American could be president
of this country. To this date, Barack Obama has been elected twice as President of the
USA.
Keywords: Montgomery Bus Boycott, Civil Rights Movement, reelection of the
President of the USA
Resumen
En este artículo se presentan eventos notables que ocurrieron en la década de los años
cuarenta y de los años cincuenta del siglo pasado relacionados a la lucha por la igualdad
entre negros y blancos en los Estados Unidos de América. Rosa Parks, quien luchó junto
a su esposo por esta causa, se volvió famosa cuando en 1955 fue arrestada por negarse a
dar su asiento a una persona blanca en un autobús de Montgomery, Alabama. El Dr.
Martin Luther King, Jr. y otros colaboradores tomaron ventaja de este hecho para
comenzar en esta ciudad el famoso boicot que duró un poco más de un año. De aquí en
adelante, hubo muchos logros para la gente negra. El Dr. Martin Luther King, Jr. y Rosa
Parks, quienes lucharon por muchos años en favor de los derechos civiles en los Estados
Unidos de América, quizás nunca se imaginaron que un afroamericano pudiera llegar a
ser presidente de este país. Para esta fecha, Barack Obama ha sido electo dos veces como
Presidente de los Estados Unidos de América.
Palabras claves: Boicot del Autobús de Montgomery, Movimiento de los Derechos
Civiles, reelección del Presidente de los Estados Unidos de América
Scientific International Journal™
Vol. 10 No. 1 · January-April 2013 17
INTRODUCTION
lthough the Montgomery Bus Boycott in Alabama officially started on
December 1, 1955, several facts had occurred before that could have
caused this important event for black people. In 1945, Rosa Parks paid
her bus fare and then watched the bus drive off as she tried to re-enter
through the rear door, as the driver had told her to do. Later, in 1955, Rosa Parks refused
to give up her seat to a white man even though the bus driver ordered her to do that. As a
result of the behavior of Parks at the time, the Montgomery Improvement Association
was created and Dr. Martin Luther King, Jr. was the president. In that historic day, blacks
of Montgomery, Alabama, decided that they would boycott the city buses until they could
sit anywhere they wanted, instead of being relegated to the back when a white boarded
(Cozzens 55). Decisions made by the leaders and participants of the Montgomery
Improvement Association, led to the start and end of the Montgomery Bus Boycott,
which achieved a very important legal change issued by the Supreme Court in November
1956.
According to Rosa Parks’ biography, the Montgomery city code operated in
relation to the treatment of blacks and whites when they used the Alabama buses as a
means of public transportation, the code required that all public transportation was
segregated and that bus drivers had the powers of a police officer to carry out the
provisions of the code. Also, the Rosa Parks’ biography said, that “while operating a bus,
drivers were required to provide separate but equal accommodations for white and black
passengers by assigning seats” (2). This was accomplished with a line roughly in the
middle of the bus separating white passengers in the front of the bus and African-
American passengers in the back. When an African-American passenger boarded the bus,
they had to get on at the front to pay their fare and then get off and re-board the bus at the
back door. When the seats in the front of the bus filled up and more white passengers got
on, the bus driver would move back the sign separating black and white passengers and,
if necessary, asked black passengers to give up their seat (Rosa 3). The era of slavery that
existed for hundreds of years, and by which blacks had to tolerate more discriminatory
laws in Alabama, caused black people seeking their civil rights equality with whites to
rebel. For this reason, Montgomery’s black residents had prepared the ground for the bus
A
Scientific International Journal™
Vol. 10 No. 1 · January-April 2013 18
boycott long in advance; many had boycotted the buses on their own, or threatened to do
so (“Montgomery”).
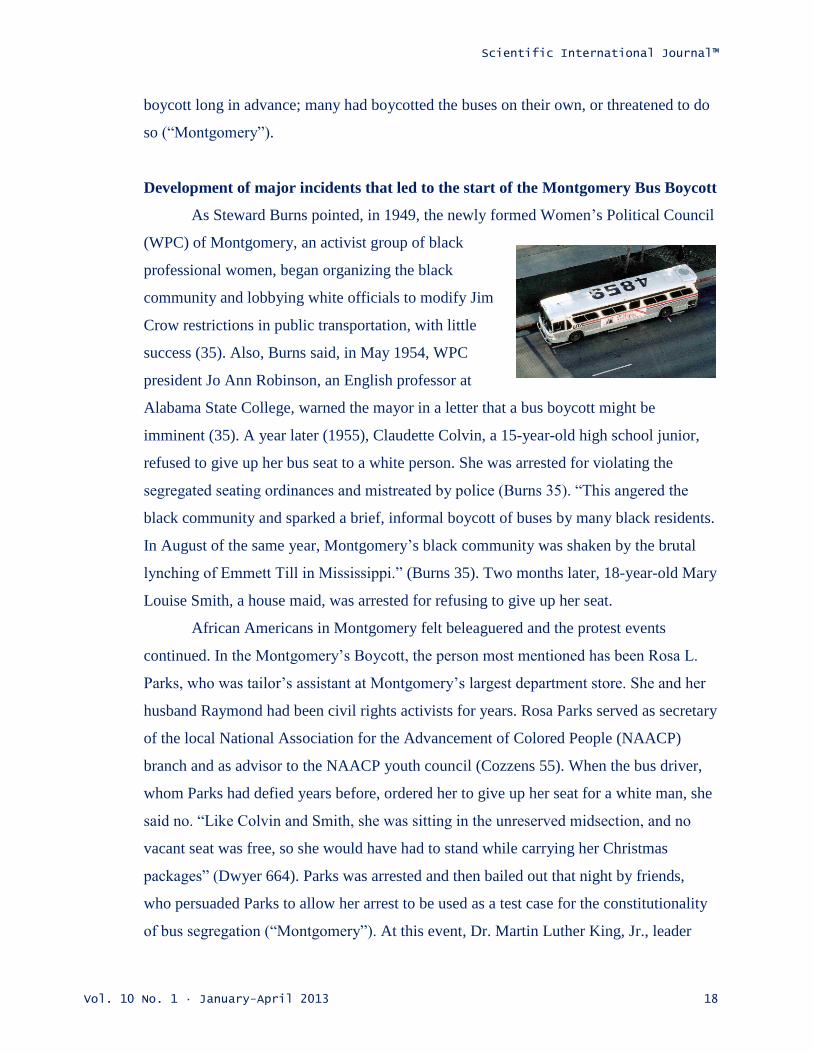
Development of major incidents that led to the start of the Montgomery Bus Boycott
As Steward Burns pointed, in 1949, the newly formed Women’s Political Council
(WPC) of Montgomery, an activist group of black
professional women, began organizing the black
community and lobbying white officials to modify Jim
Crow restrictions in public transportation, with little
success (35). Also, Burns said, in May 1954, WPC
president Jo Ann Robinson, an English professor at
Alabama State College, warned the mayor in a letter that a bus boycott might be
imminent (35). A year later (1955), Claudette Colvin, a 15-year-old high school junior,
refused to give up her bus seat to a white person. She was arrested for violating the
segregated seating ordinances and mistreated by police (Burns 35). “This angered the
black community and sparked a brief, informal boycott of buses by many black residents.
In August of the same year, Montgomery’s black community was shaken by the brutal
lynching of Emmett Till in Mississippi.” (Burns 35). Two months later, 18-year-old Mary
Louise Smith, a house maid, was arrested for refusing to give up her seat.
African Americans in Montgomery felt beleaguered and the protest events
continued. In the Montgomery’s Boycott, the person most mentioned has been Rosa L.
Parks, who was tailor’s assistant at Montgomery’s largest department store. She and her
husband Raymond had been civil rights activists for years. Rosa Parks served as secretary
of the local National Association for the Advancement of Colored People (NAACP)
branch and as advisor to the NAACP youth council (Cozzens 55). When the bus driver,
whom Parks had defied years before, ordered her to give up her seat for a white man, she
said no. “Like Colvin and Smith, she was sitting in the unreserved midsection, and no
vacant seat was free, so she would have had to stand while carrying her Christmas
packages” (Dwyer 664). Parks was arrested and then bailed out that night by friends,
who persuaded Parks to allow her arrest to be used as a test case for the constitutionality
of bus segregation (“Montgomery”). At this event, Dr. Martin Luther King, Jr., leader

Scientific International Journal™
Vol. 10 No. 1 · January-April 2013 19
and president of Montgomery Improvement Association, led the actions to the
Montgomery Bus Boycott. At the age of thirty-five, Martin Luther King, Jr. was the
youngest man to have received the Nobel Peace Prize. He announced that he would turn
over the prize money of $54,123, from the Nobel Foundation, to the furtherance of the
civil rights movement (“Martin”). On the evening of April 4, 1968, he was assassinated
in Memphis, Tennessee, where he was to lead a protest march in sympathy with striking
garbage workers of that city (“Martin”).
The Long Walk Home film, which was presented by New Visions Pictures and
starred by Whoopi Goldberg, Sissy Spacek, and Dwight Schultz, dramatized the bus
boycott events of 1945-1956 in Montgomery, Alabama. According to the drama of this
film, Whoopi Goldberg as Odessa Cotter, worked as a black maid for a white family. In
this white family, the Thompsons, Miriam Thompson always supported Odessa but her
husband did not (“Long”). Given the situation at that time about the use of Montgomery
buses for black people, Odessa felt it was her duty to walk to work although arrived late
and exhausted to work. In this sad story, Odessa was nanny of Miriam’s young daughter,
Mary Catherine, who played a very important role. Odessa was married and had three
children. They had to face many problems of their race such as discrimination and
violence among others (“Long”).
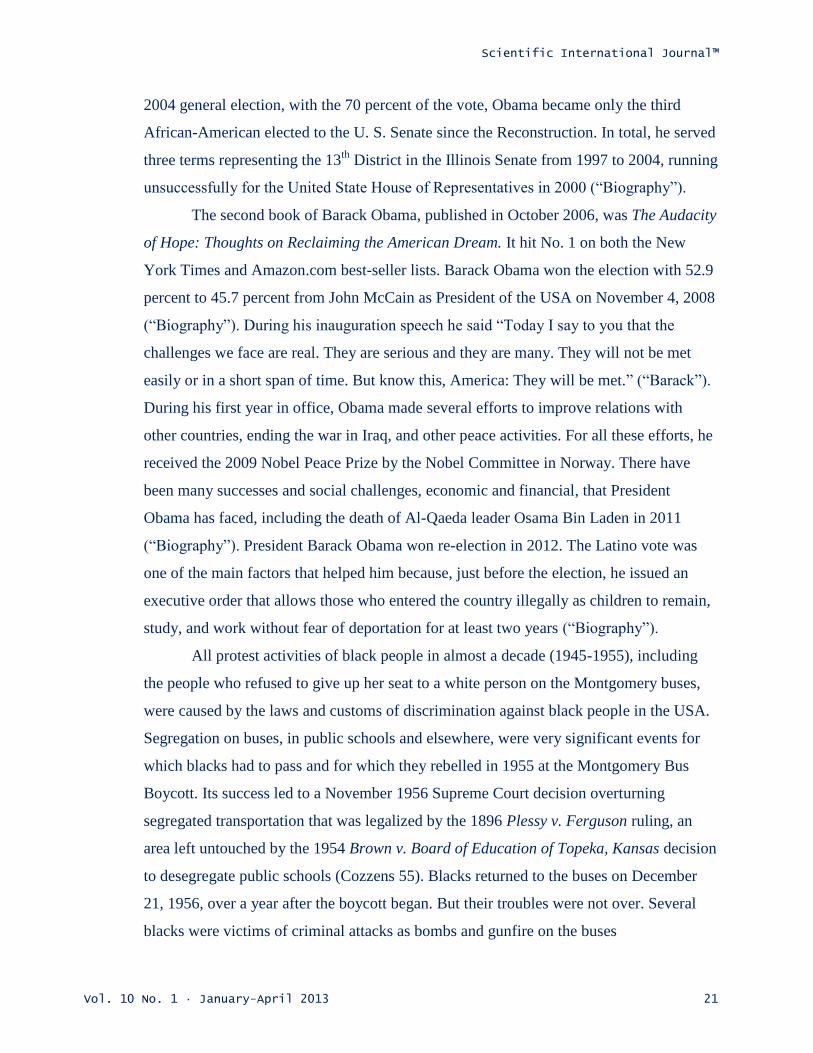
The first scene of The Long Walk Home movie that
showed racism problems was a policeman that forced Odessa
to leave the park. He later apologized to Odessa. The next
racist scene was when a young person, along with others
traveling on a bus, told Odessa’s daughter that she should have
been sitting in the back. Subsequently, outside the bus, these
young people beat her and her brother. When a boycott of the city buses prevented
Odessa from riding the bus to work, Miriam Thompson offered to give her a ride two
days a week in order to ensure she arrived to work on time and alleviate the effect the
long walk home was having on her. However, as the boycott advanced, tensions rose and
giving Odessa a ride to work became an issue with the white prominent members of her
community, as well as, with her husband (“Long”). Miriam was faced with the choice
between doing what she believed was right or succumbing to pressure from her husband
Scientific International Journal™
Vol. 10 No. 1 · January-April 2013 20
and friends. After a fight with her husband, Miriam decided to follow her heart and
became involved in a carpool group for other workers like Odessa. At the end, Miriam
and her daughter join Odessa and the other protesters were standing against oppression.
Consequently, Miriam Thompson received insults, beatings and rejection of her family
and the white community (“Long”).
Today, laws in the United States of America (USA) provide equality and non-
discrimination by race. The struggle for civil rights in the USA has never stopped and the
black people still struggling to excel in social, political, educational, and economic fields.
In addition, each day blacks continue to gain ground as employees and as entrepreneurs.
The public and private companies hire them on an equal basis with others, and to close
with a flourish, the American people elected Barack Obama as president. Barack Hussein
Obama, Jr. was born on August 4, 1961, in Honolulu, Hawaii. He is the 44th
and current
President of the USA. Obama was born to a white American mother and a black Kenyan
father (“Biography”). His mother is Stanley Ann Dunham; she died in 1995. His father,
who died in a car accident in Nairobi, is Barack Obama, Sr. At school, Obama excelled in
basketball and graduated with academic honors in 1979. “As one of only three black
students at the school, Obama became conscious of racism and what it meant to be
African-American.” (“Barack”). In 1983, Obama obtained a degree in political science
from Columbia University and, in 1988, he entered at Harvard Law School. In February
1990, Obama was elected the first African-American editor of the Harvard Law Review,
and he graduated from Harvard, magna cum laude, in 1991. On October 3, 1992, he and
Michelle Robinson were married and welcomed two daughters: Malia and Sasha. Obama
worked as civil rights lawyer, as teacher, and helped organize voter registration drives
during Bill Clinton’s presidential campaign (“Biography”).
The political career of Barack Obama began just after publishing the book
Dreams from My Father: A Story of Race and Inheritance, in 1995, for which he received
two awards. In 1996, Obama won a seat in the Illinois State Senate. “During these years,
Obama worked with Democrats and Republicans to draft legislation on ethics, and
expand health care services and early childhood education programs for the poor. He also
created a state earned-income tax credit for the working poor.” (“Barack”). Obama
opposed the war in Iraq, but despite his protests, the war began in 2003. In November
Scientific International Journal™
Vol. 10 No. 1 · January-April 2013 21
2004 general election, with the 70 percent of the vote, Obama became only the third
African-American elected to the U. S. Senate since the Reconstruction. In total, he served
three terms representing the 13th
District in the Illinois Senate from 1997 to 2004, running
unsuccessfully for the United State House of Representatives in 2000 (“Biography”).
The second book of Barack Obama, published in October 2006, was The Audacity
of Hope: Thoughts on Reclaiming the American Dream. It hit No. 1 on both the New
York Times and Amazon.com best-seller lists. Barack Obama won the election with 52.9
percent to 45.7 percent from John McCain as President of the USA on November 4, 2008
(“Biography”). During his inauguration speech he said “Today I say to you that the
challenges we face are real. They are serious and they are many. They will not be met
easily or in a short span of time. But know this, America: They will be met.” (“Barack”).
During his first year in office, Obama made several efforts to improve relations with
other countries, ending the war in Iraq, and other peace activities. For all these efforts, he
received the 2009 Nobel Peace Prize by the Nobel Committee in Norway. There have
been many successes and social challenges, economic and financial, that President
Obama has faced, including the death of Al-Qaeda leader Osama Bin Laden in 2011
(“Biography”). President Barack Obama won re-election in 2012. The Latino vote was
one of the main factors that helped him because, just before the election, he issued an
executive order that allows those who entered the country illegally as children to remain,
study, and work without fear of deportation for at least two years (“Biography”).
All protest activities of black people in almost a decade (1945-1955), including
the people who refused to give up her seat to a white person on the Montgomery buses,
were caused by the laws and customs of discrimination against black people in the USA.
Segregation on buses, in public schools and elsewhere, were very significant events for
which blacks had to pass and for which they rebelled in 1955 at the Montgomery Bus
Boycott. Its success led to a November 1956 Supreme Court decision overturning
segregated transportation that was legalized by the 1896 Plessy v. Ferguson ruling, an
area left untouched by the 1954 Brown v. Board of Education of Topeka, Kansas decision
to desegregate public schools (Cozzens 55). Blacks returned to the buses on December
21, 1956, over a year after the boycott began. But their troubles were not over. Several
blacks were victims of criminal attacks as bombs and gunfire on the buses

Scientific International Journal™
Vol. 10 No. 1 · January-April 2013 22
(“Montgomery”). To date, Rosa Parks and Dr. Martin Luther King, Jr. have been the
most outstanding people for their courage, their willingness, their vision, and their desire
for social equality in the United States of America. They, supported by other civil rights
activists, achieved their dream. Finally, the Montgomery Bus Boycott, which lasted over
a year, helped to launch ten years of national struggle for freedom and justice, the Civil
Rights Movement, which changed the life of blacks in the USA. No doubt that a united
community can make big changes in a society; the Montgomery Bus Boycott was a
decent example that was successful regardless of the skin color of those who performed
it. As a result, the USA is now chaired by Mr. Barack Obama.
REFERENCES
“Barack Hussein Obama, Jr. – Biography.” Bio. TRUE STORY. n.d. Web. 23 November
2012.
“Biography for Barack Obama.” IMDb.com, Inc. 2008. Web. 18 November 2012.
Burns, Stewart, ed. Daybreak of Freedom: The Montgomery Bus Boycott. Chapel Hill:
University of North Carolina Press, 1997.
Cozzens, Lisa. “The Civil Rights Movement 1955-1965.” African American History.
http://fledge.watson.org/~lisa/blackhistory/civilrights- 55-65 (25 May 1998).
Dwyer, Owen J. “Interpreting the Civil Rights Movement: Place, Memory, and Conflict.”
Indiana University–Purdue University at Indianapolis. 52.4 (2000): 664-666. 21
November 2012.
<https://resources.oncourse.iu.edu/access/content/user/odwyer/dwyer_
2000_PG.pdf>.
“Martin Luther King, Jr. – Biography.” Nobelprize.org. n.d. Web. 20 November 2012.
“Rosa Parks – Biography.” Bio. TRUE STORY. 2012. Web. 16 November 2012.
“The Montgomery Bus Boycott and the Woman Who Started It: The Memoir of Jo Ann
Robinson.” National Humanities Center Resource Toolbox, ed. David J. Garrow
(1987). Web. 19 November 2012.
The Long Walk Home. Dir. Richard Pearce. Perf. Whoopi Goldberg, Sissy Spacek and
Dwight Schultz. Platinum. 2003. DVD.
AUTHOR
Mylord Reyes Tosta, EdD – Consultant. Electronic mail: [email protected]
Copyright 2013 Non-Profit Evaluation & Resource Center, Inc.
Scientific International Journal™
Vol. 10 No. 1 · January-April 2013 23
EL PODER ESTADÍSTICO. DIFERENCIAS OBSERVADAS
CUANDO SE CAMBIA EL ALFA ESTABLECIDO EN UN
ESTUDIO DE INVESTIGACIÓN
Mylord Reyes Tosta, EdD
Resumen
Se utilizaron dos ejemplos para una prueba de hipótesis pareada, en donde se calculó el
poder estadístico utilizando un alfa de 5% y un alfa de 1% con los mismos datos. En el
primer ejemplo, utilizando un alfa de 5% con una muestra de 48 sujetos y con una
diferencia entre las medias de 40.69, se obtuvo un valor p = 0.000 y un poder estadístico
de 1.000 en una prueba de hipótesis pareada. En el mismo ejemplo, utilizando los mismos
datos, se calculó el poder estadístico utilizando un alfa de 1% y el resultado fue el mismo.
Es decir, se obtuvo un poder estadístico de 1.000 en la prueba de hipótesis pareada. En el
segundo ejemplo, utilizando un alfa de 5% con una muestra de 30 sujetos y con una
diferencia entre las medias de 2.33, se obtuvo un valor p = 0.012 y un poder estadístico
de .738 en una prueba de hipótesis pareada. En el mismo ejemplo, utilizando los mismos
datos, se calculó el poder estadístico utilizando un alfa de 1% y el resultado fue de .483
en la prueba de hipótesis. Es decir, se obtuvo un poder estadístico menor en la prueba de
hipótesis pareada. El análisis y las conclusiones de estos resultados se presentan en este
artículo.
Palabras claves: poder estadístico, prueba de hipótesis, tamaño del efecto, alfa, beta
Abstract
Two examples were used for paired hypothesis test, where the statistical power was
calculated using an alpha of 5% and an alpha of 1% with the same data. In the first
example, using an alpha of 5% with a sample of 48 subjects and with a difference
between the means of 40.69, yielded a p-value = 0.000 and a power of 1.000 in the paired
hypothesis test. In the same example, using the same data, the statistical power was
calculated using an alpha of 1% and the result was the same. That is, it was obtained a
power of 1.000 in the paired hypothesis test. In the second example, using an alpha of 5%
with a sample of 30 subjects and with a difference between the means of 2.33, it was
obtained a p-value = 0.012 and a power of .738 in the paired hypothesis test. In the same
example, using the same data, the statistical power was calculated using an alpha of 1%
and the result was of .483 in the hypothesis test. That is, it was obtained a lower statistical
power in the paired hypothesis test. The analysis and conclusions from these results are
presented in this paper.
Keywords: statistical power, hypothesis test, size of effect, alpha, beta

Scientific International Journal™
Vol. 10 No. 1 · January-April 2013 24
INTRODUCCIÓN
l poder de una prueba estadística es la probabilidad de que la prueba va
a rechazar la hipótesis nula cuando la hipótesis nula es falsa. Es decir, la
probabilidad de no cometer un error de tipo II o tomar una decisión de
falsos negativos (Cohen, 1988). Es decir, representa la capacidad de una
prueba para detectar como estadísticamente significativas diferencias o asociaciones de
una magnitud determinada (Díaz & Fernández, 2003). Cuando el poder aumenta, las
posibilidades de un error de tipo II disminuyen. La probabilidad de que ocurra un error de
tipo II se refiere a la tasa de falsos negativos (β). Por lo tanto, la potencia es igual a 1 - β,
donde β (beta) es el error tipo II que también se conoce como la sensibilidad.
Un análisis de poder se puede utilizar para calcular el tamaño mínimo de muestra
requerida. También, puede utilizarse para calcular el efecto mínimo de un tamaño de
muestra dado. Además, el concepto de poder se utiliza para hacer comparaciones entre
diferentes procedimientos de análisis estadísticos. Por ejemplo, entre una prueba
paramétrica y una prueba no paramétrica con las mismas hipótesis (Cohen, 1988).
Factores que influyen en el poder estadístico de cualquier estudio
os factores que influyen en el poder
estadístico de un estudio van a depender de
cada situación que es particular de un
estudio dado. Los cuatro factores siguientes
siempre influyen en el poder estadístico de una prueba.
1. El tamaño de la muestra usado para detectar el efecto. Este determina la cantidad
de error de muestreo inherente al resultado de la prueba. Es difícil detectar un
efecto en muestras pequeñas. Aumentando el tamaño de la muestra, se puede
obtener un poder más alto.
2. La magnitud del efecto de interés en la población. Esta puede ser cuantificada en
términos del tamaño del efecto. Donde hay un poder mayor, hay un efecto mayor.
3. El nivel de significancia estadística utilizado en la prueba. Un nivel de
significancia estadística es una declaración de lo improbable que puede ser un
resultado, si la hipótesis nula es verdadera, para ser considerada significativa.
E
L
Scientific International Journal™
Vol. 10 No. 1 · January-April 2013 25
En otras palabras, cuánto se está dispuesto para tomar el riesgo de asumir una
conclusión equivocada. Los criterios más utilizados son las probabilidades de
0.05 (5%, 1 en 20), 0.01 (1%, 1 en 100) y 0.001 (0.1%, 1 en 1000). Si el
criterio es 0.05, la probabilidad de obtener el efecto observado cuando la
hipótesis nula es verdadera, debe ser inferior a 0.05 y así sucesivamente. Si se
utiliza un nivel de significancia de 5%, conocido como alfa o la probabilidad
de cometer el error de tipo I, significa que se tiene un nivel de confiabilidad de
95%. Una manera fácil de aumentar la potencia de una prueba, es realizar una
prueba menos conservadora al utilizar un nivel de significancia mayor. Esto
aumenta la probabilidad de rechazar la hipótesis nula. Es decir, la obtención de
un resultado estadísticamente significativo cuando la hipótesis nula es falsa. De
esta forma, se reduce el riesgo de cometer un error tipo II. Pero también
aumenta el riesgo de obtener un resultado estadísticamente significativo
rechazando la hipótesis nula cuando la hipótesis nula es verdadera. En este
caso, se aumenta el riesgo de cometer un error de tipo I (Cohen, 1988).
4. La variabilidad de la respuesta o desviación estándar del estudio. Así, cuanto
mayor sea la variabilidad en la respuesta, más difícil será detectar diferencias
entre los grupos que se comparan y menor será el poder estadístico del estudio.
Se recomienda estudiar grupos que sean equivalentes.
Interpretación de los resultados
l análisis adecuado del poder estadístico de una investigación, que es en
definitiva la capacidad que tiene el estudio para encontrar diferencias si
es que realmente las hay, es un paso fundamental tanto en la fase de
diseño como en la interpretación y discusión de sus resultados. A la hora
del diseño, por lo tanto, debe establecerse la magnitud mínima de la diferencia o
asociación que se considere de relevancia, así como el poder estadístico que se desea para
el estudio y, de acuerdo con ello, calcular el tamaño de la muestra necesario
(Gordon, Finch, Nothnage & Ott, 2002). Tanto si los hallazgos son estadísticamente
significativos como si no lo son, la estimación de intervalos de confianza pueden también
facilitar la interpretación de los resultados en términos de magnitud y relevancia,
E
Scientific International Journal™
Vol. 10 No. 1 · January-April 2013 26
proporcionándonos una idea de la precisión con la que se ha efectuado la estimación, de
la magnitud y de la dirección del efecto. De este modo, los intervalos de confianza nos
permiten tener una idea acerca del poder estadístico de un estudio y, por tanto, de la
credibilidad de la ausencia de hallazgos significativos (Díaz & Fernández, 2003). Se
pueden considerar los siguientes puntos para interpretar los resultados del poder
estadístico:
a) De acuerdo a Myoung (2003), el estándar adecuado de poder por la mayoría de los
investigadores es 0.80
b) 0.20 = error tipo II
c) Un poder estadístico ≥ 0.80 indica las probabilidades de decir que hay una relación,
diferencia o ganancia. Son las probabilidades que confirman nuestra teoría correctamente.
d) Un poder estadístico de 0.80 indica que 80 de cada 100 veces, cuando hay un efecto,
vamos a decir que lo hay (Myoung, 2003).
e) Si el poder estadístico es mayor de 0.80, el poder es más dominante.
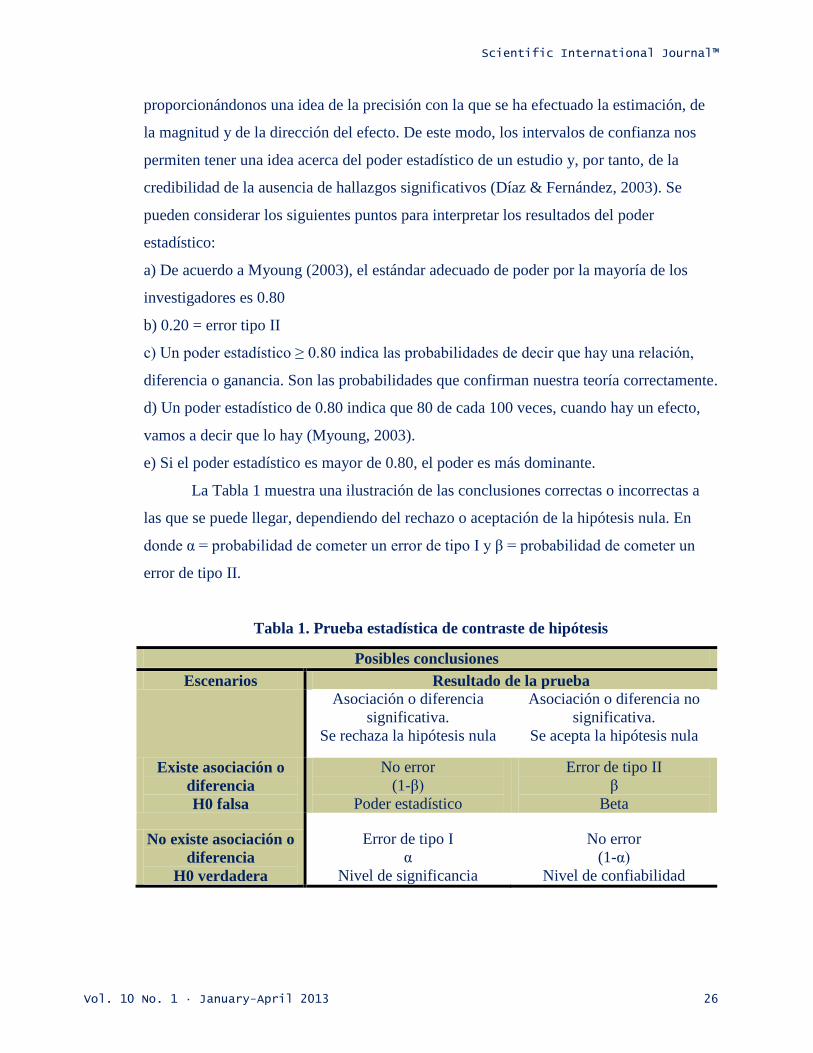
La Tabla 1 muestra una ilustración de las conclusiones correctas o incorrectas a
las que se puede llegar, dependiendo del rechazo o aceptación de la hipótesis nula. En
donde α = probabilidad de cometer un error de tipo I y β = probabilidad de cometer un
error de tipo II.
Tabla 1. Prueba estadística de contraste de hipótesis
Posibles conclusiones
Escenarios Resultado de la prueba
Asociación o diferencia
significativa.
Se rechaza la hipótesis nula
Asociación o diferencia no
significativa.
Se acepta la hipótesis nula
Existe asociación o
diferencia
H0 falsa
No error
(1-β)
Poder estadístico
Error de tipo II
β
Beta
No existe asociación o
diferencia
H0 verdadera
Error de tipo I
α
Nivel de significancia
No error
(1-α)
Nivel de confiabilidad
Scientific International Journal™
Vol. 10 No. 1 · January-April 2013 27
Con el objetivo de analizar el comportamiento del poder estadístico cuando
cambia el alfa establecido en un estudio, se presentan dos ejemplos. En el primer
ejemplo, se cuenta con los resultados de una preprueba y una posprueba realizadas a un
grupo de 48 sujetos. Se asume que son las notas obtenidas por ellos en una escala del 1 al
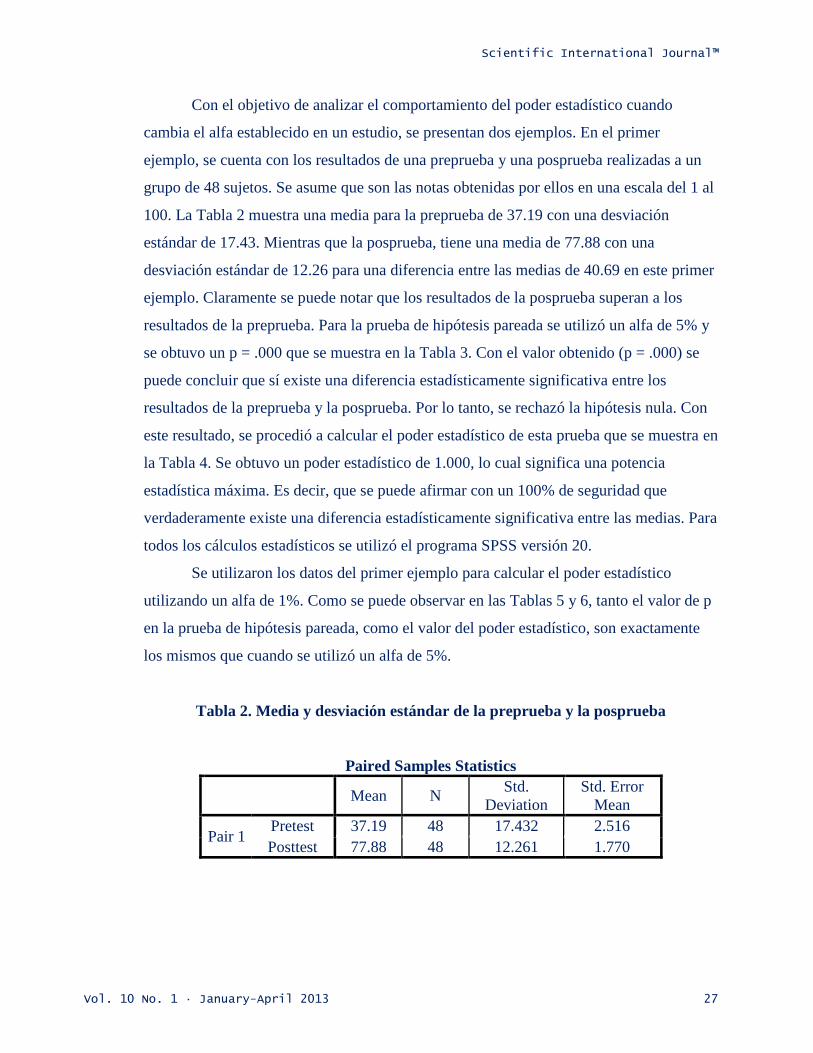
100. La Tabla 2 muestra una media para la preprueba de 37.19 con una desviación
estándar de 17.43. Mientras que la posprueba, tiene una media de 77.88 con una
desviación estándar de 12.26 para una diferencia entre las medias de 40.69 en este primer
ejemplo. Claramente se puede notar que los resultados de la posprueba superan a los
resultados de la preprueba. Para la prueba de hipótesis pareada se utilizó un alfa de 5% y
se obtuvo un p = .000 que se muestra en la Tabla 3. Con el valor obtenido (p = .000) se
puede concluir que sí existe una diferencia estadísticamente significativa entre los
resultados de la preprueba y la posprueba. Por lo tanto, se rechazó la hipótesis nula. Con
este resultado, se procedió a calcular el poder estadístico de esta prueba que se muestra en
la Tabla 4. Se obtuvo un poder estadístico de 1.000, lo cual significa una potencia
estadística máxima. Es decir, que se puede afirmar con un 100% de seguridad que
verdaderamente existe una diferencia estadísticamente significativa entre las medias. Para
todos los cálculos estadísticos se utilizó el programa SPSS versión 20.
Se utilizaron los datos del primer ejemplo para calcular el poder estadístico
utilizando un alfa de 1%. Como se puede observar en las Tablas 5 y 6, tanto el valor de p
en la prueba de hipótesis pareada, como el valor del poder estadístico, son exactamente
los mismos que cuando se utilizó un alfa de 5%.
Tabla 2. Media y desviación estándar de la preprueba y la posprueba
Paired Samples Statistics
Mean N Std.
Deviation
Std. Error
Mean
Pair 1 Pretest 37.19 48 17.432 2.516
Posttest 77.88 48 12.261 1.770

Scientific International Journal™
Vol. 10 No. 1 · January-April 2013 28
Tabla 3. Prueba de hipótesis pareada con un alfa de 5%
Paired Samples Test
Paired Differences
t df Sig.
(2-tailed) Mean Std.
Deviation
Std.
Error
Mean
95% Confidence
Interval of the
Difference
Lower Upper
Pair 1 Pretest -
Posttest -40.688 20.133 2.906 -46.533 -34.842 -14.002 47 .000
Tabla 4. Poder estadístico de la prueba de hipótesis pareada con un alfa de 5%
Tests of Within-Subjects Contrasts
Measure: MEASURE_1
Source factor1
Type III
Sum of
Squares
df Mean
Square F Sig.
Noncent.
Parameter
Observed
Powera
factor1 Linear 39731.344 1 39731.344 196.046 .000 196.046 1.000
Error
(factor1) Linear 9525.156 47 202.663
a. Computed using alpha = .05
Tabla 5. Prueba de hipótesis pareada con un alfa de 1%
Paired Samples Test
Paired Differences
t df Sig.
(2-tailed) Mean Std.
Deviation
Std.
Error
Mean
99% Confidence
Interval of the
Difference
Lower Upper
Pair 1 Pretest -
Posttest -40.688 20.133 2.906 -48.489 -32.886 -14.002 47 .000
Scientific International Journal™
Vol. 10 No. 1 · January-April 2013 29
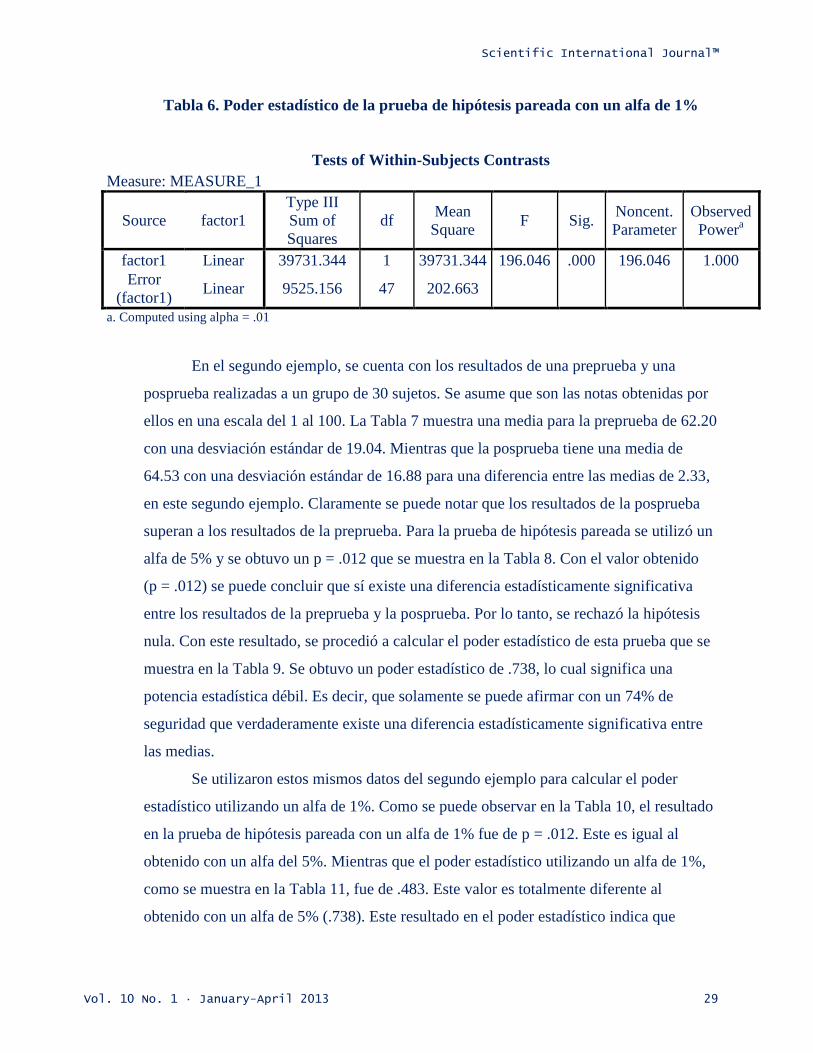
Tabla 6. Poder estadístico de la prueba de hipótesis pareada con un alfa de 1%
Tests of Within-Subjects Contrasts
Measure: MEASURE_1
Source factor1
Type III
Sum of
Squares
df Mean
Square F Sig.
Noncent.
Parameter
Observed
Powera
factor1 Linear 39731.344 1 39731.344 196.046 .000 196.046 1.000
Error
(factor1) Linear 9525.156 47 202.663
a. Computed using alpha = .01
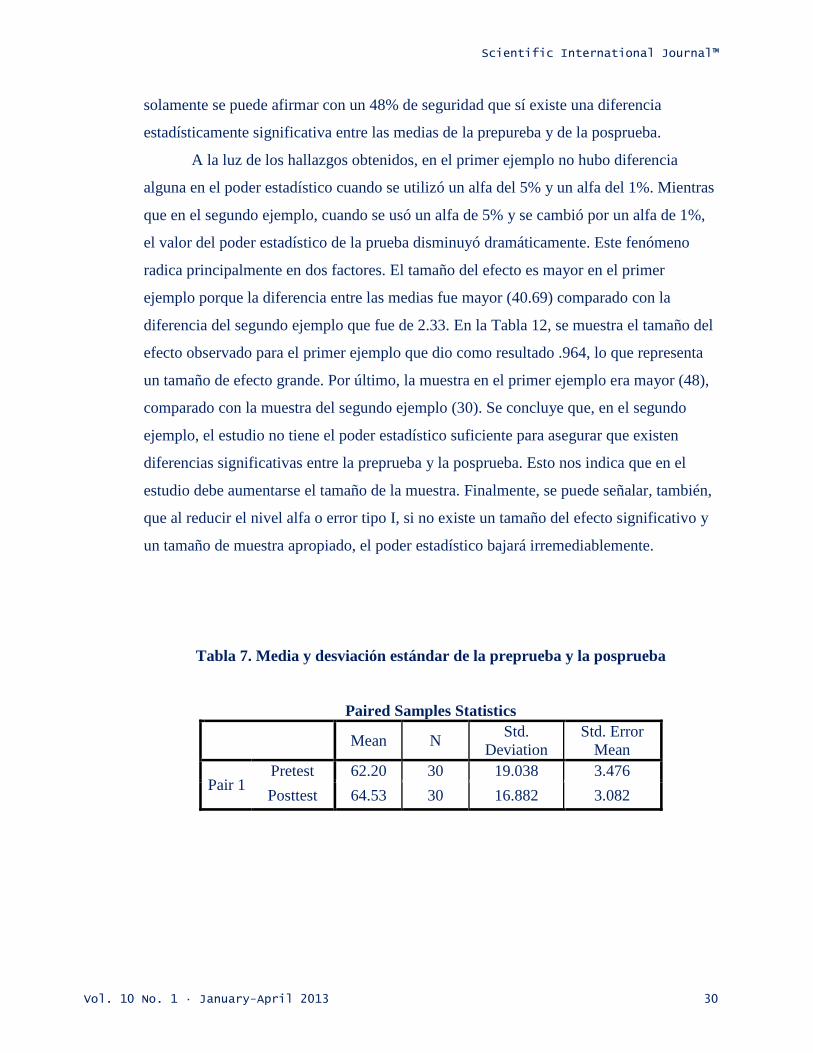
En el segundo ejemplo, se cuenta con los resultados de una preprueba y una
posprueba realizadas a un grupo de 30 sujetos. Se asume que son las notas obtenidas por
ellos en una escala del 1 al 100. La Tabla 7 muestra una media para la preprueba de 62.20
con una desviación estándar de 19.04. Mientras que la posprueba tiene una media de
64.53 con una desviación estándar de 16.88 para una diferencia entre las medias de 2.33,
en este segundo ejemplo. Claramente se puede notar que los resultados de la posprueba
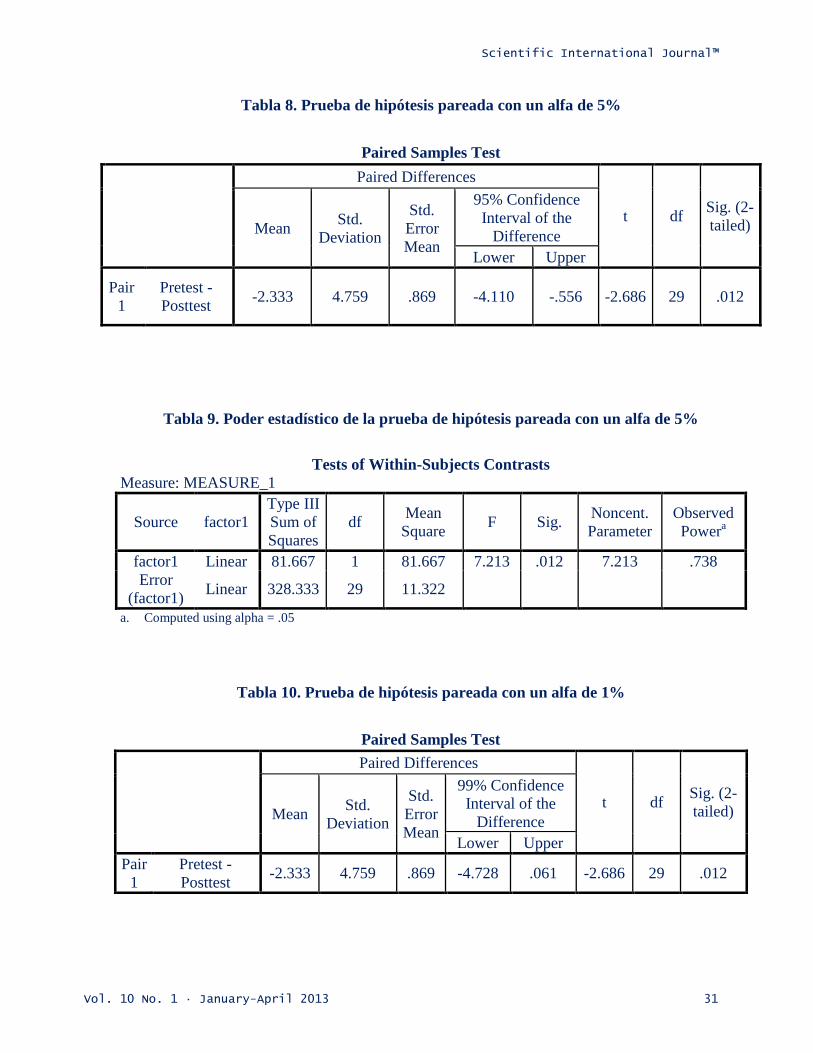
superan a los resultados de la preprueba. Para la prueba de hipótesis pareada se utilizó un
alfa de 5% y se obtuvo un p = .012 que se muestra en la Tabla 8. Con el valor obtenido
(p = .012) se puede concluir que sí existe una diferencia estadísticamente significativa
entre los resultados de la preprueba y la posprueba. Por lo tanto, se rechazó la hipótesis
nula. Con este resultado, se procedió a calcular el poder estadístico de esta prueba que se
muestra en la Tabla 9. Se obtuvo un poder estadístico de .738, lo cual significa una
potencia estadística débil. Es decir, que solamente se puede afirmar con un 74% de
seguridad que verdaderamente existe una diferencia estadísticamente significativa entre
las medias.
Se utilizaron estos mismos datos del segundo ejemplo para calcular el poder
estadístico utilizando un alfa de 1%. Como se puede observar en la Tabla 10, el resultado
en la prueba de hipótesis pareada con un alfa de 1% fue de p = .012. Este es igual al
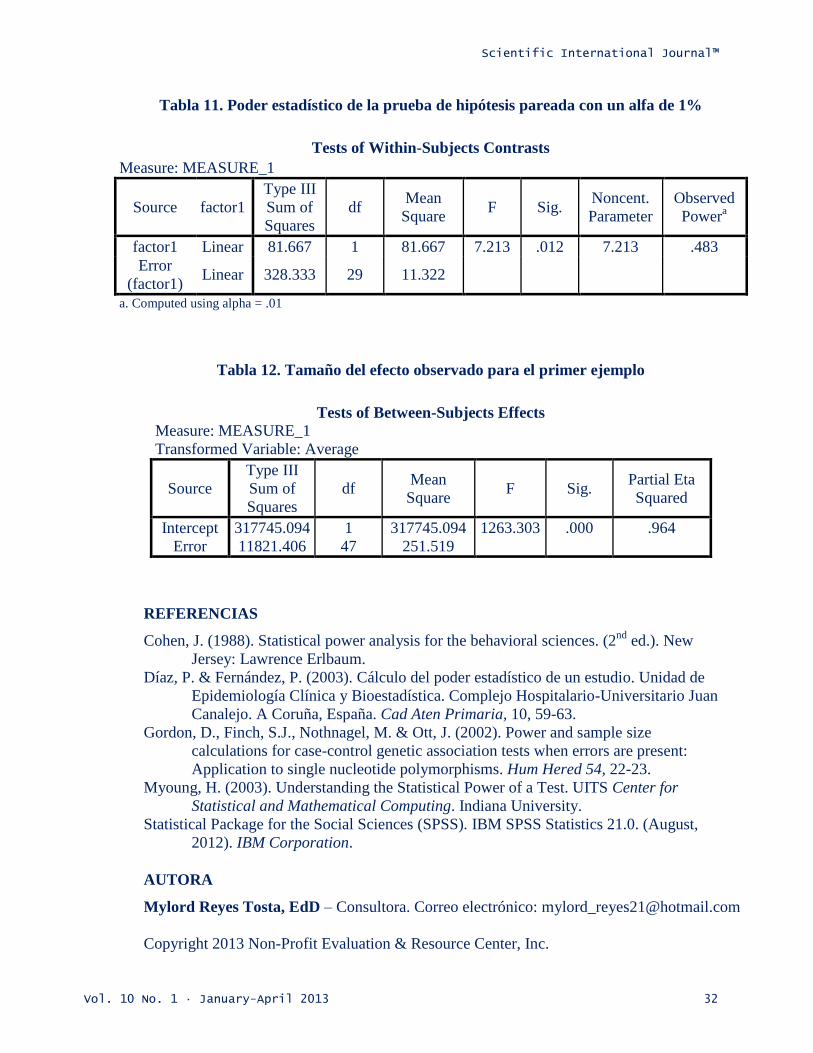
obtenido con un alfa del 5%. Mientras que el poder estadístico utilizando un alfa de 1%,
como se muestra en la Tabla 11, fue de .483. Este valor es totalmente diferente al
obtenido con un alfa de 5% (.738). Este resultado en el poder estadístico indica que
Scientific International Journal™
Vol. 10 No. 1 · January-April 2013 30
solamente se puede afirmar con un 48% de seguridad que sí existe una diferencia
estadísticamente significativa entre las medias de la prepureba y de la posprueba.
A la luz de los hallazgos obtenidos, en el primer ejemplo no hubo diferencia
alguna en el poder estadístico cuando se utilizó un alfa del 5% y un alfa del 1%. Mientras
que en el segundo ejemplo, cuando se usó un alfa de 5% y se cambió por un alfa de 1%,
el valor del poder estadístico de la prueba disminuyó dramáticamente. Este fenómeno
radica principalmente en dos factores. El tamaño del efecto es mayor en el primer
ejemplo porque la diferencia entre las medias fue mayor (40.69) comparado con la
diferencia del segundo ejemplo que fue de 2.33. En la Tabla 12, se muestra el tamaño del
efecto observado para el primer ejemplo que dio como resultado .964, lo que representa
un tamaño de efecto grande. Por último, la muestra en el primer ejemplo era mayor (48),
comparado con la muestra del segundo ejemplo (30). Se concluye que, en el segundo
ejemplo, el estudio no tiene el poder estadístico suficiente para asegurar que existen
diferencias significativas entre la preprueba y la posprueba. Esto nos indica que en el
estudio debe aumentarse el tamaño de la muestra. Finalmente, se puede señalar, también,
que al reducir el nivel alfa o error tipo I, si no existe un tamaño del efecto significativo y
un tamaño de muestra apropiado, el poder estadístico bajará irremediablemente.
Tabla 7. Media y desviación estándar de la preprueba y la posprueba
Paired Samples Statistics
Mean N Std.
Deviation
Std. Error
Mean
Pair 1 Pretest 62.20 30 19.038 3.476
Posttest 64.53 30 16.882 3.082
Scientific International Journal™
Vol. 10 No. 1 · January-April 2013 31
Tabla 8. Prueba de hipótesis pareada con un alfa de 5%
Paired Samples Test
Paired Differences
t df Sig. (2-
tailed) Mean Std.
Deviation
Std.
Error
Mean
95% Confidence
Interval of the
Difference
Lower Upper
Pair
1
Pretest -
Posttest -2.333 4.759 .869 -4.110 -.556 -2.686 29 .012
Tabla 9. Poder estadístico de la prueba de hipótesis pareada con un alfa de 5%
Tests of Within-Subjects Contrasts
Measure: MEASURE_1
Source factor1
Type III
Sum of
Squares
df Mean
Square F Sig.
Noncent.
Parameter
Observed
Powera
factor1 Linear 81.667 1 81.667 7.213 .012 7.213 .738
Error
(factor1) Linear 328.333 29 11.322
a. Computed using alpha = .05
Tabla 10. Prueba de hipótesis pareada con un alfa de 1%
Paired Samples Test
Paired Differences
t df Sig. (2-
tailed) Mean Std.
Deviation
Std.
Error
Mean
99% Confidence
Interval of the
Difference
Lower Upper
Pair
1
Pretest -
Posttest -2.333 4.759 .869 -4.728 .061 -2.686 29 .012
Scientific International Journal™
Vol. 10 No. 1 · January-April 2013 32
Tabla 11. Poder estadístico de la prueba de hipótesis pareada con un alfa de 1%
Tests of Within-Subjects Contrasts
Measure: MEASURE_1
Source factor1
Type III
Sum of
Squares
df Mean
Square F Sig.
Noncent.
Parameter
Observed
Powera
factor1 Linear 81.667 1 81.667 7.213 .012 7.213 .483
Error
(factor1) Linear 328.333 29 11.322
a. Computed using alpha = .01
Tabla 12. Tamaño del efecto observado para el primer ejemplo
Tests of Between-Subjects Effects Measure: MEASURE_1
Transformed Variable: Average
Source
Type III
Sum of
Squares
df Mean
Square F Sig.
Partial Eta
Squared
Intercept 317745.094 1 317745.094 1263.303 .000 .964
Error 11821.406 47 251.519
REFERENCIAS
Cohen, J. (1988). Statistical power analysis for the behavioral sciences. (2nd
ed.). New
Jersey: Lawrence Erlbaum.
Díaz, P. & Fernández, P. (2003). Cálculo del poder estadístico de un estudio. Unidad de
Epidemiología Clínica y Bioestadística. Complejo Hospitalario-Universitario Juan
Canalejo. A Coruña, España. Cad Aten Primaria, 10, 59-63.
Gordon, D., Finch, S.J., Nothnagel, M. & Ott, J. (2002). Power and sample size
calculations for case-control genetic association tests when errors are present:
Application to single nucleotide polymorphisms. Hum Hered 54, 22-23.
Myoung, H. (2003). Understanding the Statistical Power of a Test. UITS Center for
Statistical and Mathematical Computing. Indiana University.
Statistical Package for the Social Sciences (SPSS). IBM SPSS Statistics 21.0. (August,
2012). IBM Corporation.
AUTORA
Mylord Reyes Tosta, EdD – Consultora. Correo electrónico: [email protected]
Copyright 2013 Non-Profit Evaluation & Resource Center, Inc.
Copyright © 2022 FDOKUMEN