
Scientific Journal - Interdisciplinary Description of Complex ...
66
15(3), pp.174-227, 2017 ISSN 1334-4684 INTERDISCIPLINARY DESCRIPTION OF COMPLEX SYSTEMS Scientific Journal G. Mester 174 Ranking Baltic States Researchers I. Čatić, J. Čaloska, D. Godec, M. Kovačić, A. Pilipović and K. Skala 180 Fluid-Deposition of Rocks is Natural Model for Additive Production S. Banerjee 190 A Computational Technique to Estimate Within-Host Productively Infected Cell Lifetimes in Emerging Viral Infections S. Banerjee 199 Automated interpretable computational biology in the clinic: a framework to predict disease severity and stratify patients from clinical data H. Jakopović 209 Predicting the Strength of Online News Frames J. Simon 222 Autonomous Wheeled Mobile Robot Control
-
Upload
khangminh22 -
Category
Documents
-
view
0 -
download
0
Transcript of Scientific Journal - Interdisciplinary Description of Complex ...

15(3), pp.174-227, 2017 ISSN 1334-4684
INTERDISCIPLINARY
DESCRIPTION OF
COMPLEX SYSTEMS Scientific Journal
G. Mester 174 Ranking Baltic States Researchers
I. Čatić, J. Čaloska, D. Godec, M. Kovačić, A. Pilipović and K. Skala
180 Fluid-Deposition of Rocks is Natural Model for Additive Production
S. Banerjee 190 A Computational Technique to Estimate Within-Host Productively Infected Cell Lifetimes in Emerging Viral Infections
S. Banerjee 199 Automated interpretable computational biology in the clinic: a framework to predict disease severity and stratify patients from clinical data
H. Jakopović 209 Predicting the Strength of Online News Frames
J. Simon 222 Autonomous Wheeled Mobile Robot Control

Scientific Journal
INTERDISCIPLINARY DESCRIPTION OF COMPLEX SYSTEMS
INDECS, volume 15, issue 3, pages 174-227, year 2017 Published 24
th October 2017 in Zagreb, Croatia
Released online 24th October 2017
Office
Croatian Interdisciplinary Society c/o Faculty of Mechanical Engineering & Naval Architecture I. Lučića 1, HR – 10 000 Zagreb, Croatia E-mails: [email protected] (for journal), [email protected] (for publisher)
Editors
Josip Stepanić, Editor-in-Chief, University of Zagreb, Zagreb (HR)
Josip Kasač, Assistant Editor, University of Zagreb, Zagreb (HR)
Mirjana Pejić Bach, Assistant Editor, University of Zagreb, Zagreb (HR)
Advisory Board
Vjekoslav Afrić, University of Zagreb, Zagreb (HR)
Aleksa Bjeliš, University of Zagreb, Zagreb (HR)
Marek Frankowicz, Jagiellonian University, Krakow (PL)
Katalin Martinás, Eötvös Loránd University, Budapest (HU)
Gyula Mester, University of Szeged, Szeged (HU)
Dietmar Meyer, Budapest University of Technology and Economy, Budapest (HU)
Sibila Petlevski, University of Zagreb, Zagreb (HR)
Wei-bin Zhang, Ritsumeikan Asia Pacific University, Beppu (JP)
Editorial Board
Serghey A. Amelkin, Program Systems Institute, Pereslavl-Zalesskij (RU)
Željko Božić, University of Zagreb, Zagreb (HR)
Nikša Dubreta, University of Zagreb, Zagreb (HR)
Robert Fabac, University of Zagreb, Varaždin (HR)
Erik W. Johnston, Arizona State University, Phoenix (US)
Urban Kordeš, University of Ljubljana, Ljubljana (SI)
Dean Korošak, University of Maribor, Maribor (SI)
Anita Lee-Post, University of Kentucky, Lexington (US)
Olga Markič, University of Ljubljana, Ljubljana (SI)
Damir Pajić, University of Zagreb, Zagreb (HR)
Petra Rodik, University of Zagreb, Zagreb (HR)
Biserka Runje, University of Zagreb, Zagreb (HR)
Armano Srbljinović, University of Zagreb, Zagreb (HR)
Karin Šerman, University of Zagreb, Zagreb (HR)
Technical Editors
Jelena Ćosić Lesičar, University of Zagreb, Zagreb (HR)
Amalija Horvatić Novak, University of Zagreb, Zagreb (HR)
Morana Mihaljević, University of Zagreb, Zagreb (HR)
Published by Croatian Interdisciplinary Society (http://www.idd.hr) quarterly as printed (ISSN 1334-4684) and online (ISSN 1334-4676) edition. Printed by Redak d.o.o. (HR) in 50 pieces. Online edition, http://indecs.eu, contains freely available full texts of published articles.
Journal INDECS is financially supported by Croatian Ministry of Science and Education.
Content of the journal INDECS is included in the DOAJ, EBSCO, EconLit, ERIH PLUS, Ulrich’s and Web of Science Core Collection.
INDECS publishes original, peer-reviewed, scientific contributions prepared as reviews, regular articles and conference papers, brief and preliminary reports and comments to published articles. Manuscripts are automatically processed with the system Comet, see details here: http://journal.sdewes.org/indecs.
The accessibility of all URLs in the texts was checked one weak before the publishing date.

Interdisciplinary Description of Complex Systems 15(3), i, 2017
TABLE OF CONTENTS
REGULAR ARTICLES
Gyula Mester 174 Ranking Baltic States Researchers
Igor Čatić, Jasmina Čaloska, Damir Godec, Marijan Kovačić, Ana Pilipović and Karolj Skala
180 Fluid-Deposition of Rocks is Natural Model for Additive Production
Soumya Banerjee 190 A Computational Technique to Estimate Within-Host Productively Infected Cell Lifetimes in Emerging Viral Infections
Soumya Banerjee 199 Automated interpretable computational biology in the clinic: a framework to predict disease severity and stratify patients from clinical data
Hrvoje Jakopović 209 Predicting the Strength of Online News Frames
Janos Simon 222 Autonomous Wheeled Mobile Robot Control
ii Abstracts in Croatian

Interdisciplinary Description of Complex Systems 15(3), 174-179, 2017
*Corresponding author, : [email protected]; +36 1 666 5322; *1081 Budapest, Népszínház utca 8, Hungary
RANKING BALTIC STATES RESEARCHERS
Gyula Mester*
Óbuda University, Doctoral School of Safety and Security Sciences Budapest, Hungary
DOI: 10.7906/indecs.15.3.1 Regular article
Received: 10th July 2017.
Accepted: 25th September 2017.
ABSTRACT
In this article, using the h-index and the total number of citations, the best 10 Lithuanian, Latvian and
Estonian researchers from several disciplines are ranked. The list may be formed based on the h-index
and the total number of citations, given in Web of Science, Scopus, Publish or Perish Program and
Google Scholar database. Data for the first 10 researchers are presented. Google Scholar is the most
complete. Therefore, to define a single indicator, h-index calculated by Google Scholar may be a good
and simple one. The author chooses the Google Scholar database as it is the broadest one.
KEY WORDS
ranking Baltic states researchers, Lithuanian, Latvian and Estonian researchers, h-index, number of
citations, Google Scholar database
CLASSIFICATION ACM: D.1.1.
JEL: O31
PACS: 89.70.Hj

Ranking Baltic states researchers
175
INTRODUCTION
The Academic Ranking of World Universities (ARWU) was first published in June 2003 by
the Center for World-Class Universities (CWCU), Graduate School of Education (formerly
the Institute of Higher Education) of Shanghai Jiao Tong University, China [1]. Due to the
requests in a variety of activities ranking researchers in different disciplines of science
become very important in last decade. Ranking is possible on different criteria: number of
published articles, number of citations, h-index, g-index, etc.
One of these measures is h-index which includes both the productivity and citation impact of
the publications of a scientist. The index was suggested in 2005 by Jorge E. Hirsch [2]:
“A scientist has index h if h of his/her Np papers have at least h citations each, and the other
(Np-h) papers have no more than h citations each.” (Figure 1.)
Figure 1. Graphical presentation of h-index.
h-index can be determined according to the different sources:
Google Scholar,
WOS (Web of Science),
Scopus,
Publish or Perish Program.
In this article the list of the best 10 Lithuanian, Latvian and Estonian (three Baltic states)
researchers from several disciplines is ranked. List covers researchers from natural sciences,
techniques and human sciences.
Table 1. Rate of citations in Scopus and Web of Science according to Google Scholar ones.
Discipline Scopus citations as percentage
of Google Scholar citations, %
Web of Science citations as
percentage of Google Scholar
citations, %
Humanities 11,5 7,0
Social Sciences 30,0 22,7
Engineering 57,6 45,7
Sciences 64,2 65,6
Life Sciences 70,5 66,8

G. Mester
176
As a primary source Google Scholar [3] has been used [4-25]. The author chooses the Google
Scholar database as it is the widest (see Table 1). Introduced by Google in 2004, Google
Scholar has become a very popular alternative data source. Google Scholar is the most
complete. Therefore, to define a single indicator, h-index calculated by Google Scholar may
be a good and simple one. Ranking is possible to be based on h-index (primary) and total
number of citations.
The article is organized as follows:
in Section 1 the Introduction is given,
in Section 2 the Ranking list of best 10 Lithuanian researchers,
in Section 3 the Ranking list of best 10 Latvian researchers,
in Section 4 the Ranking list of best 10 Estonian researchers is considered.
Conclusions are given in Section 5.
RANKING LIST OF THE BEST 10 LITHUANIAN RESEARCHERS
In the following text detail information about Lithuanian researchers on the list based on
Google Scholar are presented [26]. List of 10 best Lithuanian researchers can be constructed
based on different sources. The primary condition for ranking is the h-index and the total
citation number of the publications.
Researchers, from Google Scholar data, were ranked according h-index in decreasing order as
a first criteria and then by the total number of citations (Table 2).
Table 2. Ranking list of best 10 Lithuanian researchers from several disciplines, from Google
Scholar.
No. Researchers h-index Citations
1. Edmundas K. Zavadskas 62 13 681
2. Algirdas Avižienis 45 16 143
3. Arunas Ramanavicius 41 5 572
4. Zenonas Turskis 39 5 400
5. Artūras Kaklauskas 35 4 840
6. Saulius Klimašauskas 33 4 733
7. Kestutis Pyragas 29 8 087
8. Česlovas Venclovas 28 3 073
9. Arunas Krotkus 27 2 829
10. Gintaras Valušis 27 2 718
RANKING LIST OF THE BEST 10 LATVIAN RESEARCHERS
In the following text detail information about Latvian researchers on the list based on Google
Scholar are presented [27]. Latvian Researchers, from Google Scholar data, were ranked
according h-index in decreasing order as a first criteria and then by the total number of
citations (Table 3).
RANKING LIST OF THE BEST 10 ESTONIAN RESEARCHERS
In the following text detail information about Estonian researchers on the list based on
Google Scholar are presented [28].

Ranking Baltic states researchers
177
Estonian Researchers, from Google Scholar data, were ranked according h-index in
decreasing order as a first criteria and then by the total number of citations (Table 4).
Table 3. Ranking list of best 10 Latvian researchers from several disciplines, from Google
Scholar.
No. Researcher h-index Citations
1. Eugene Kotomin 49 8 855
2. Susanne Iwarsson 46 7 340
3. Andris Ambainis 38 7 028
4. Alexei Kuzmin 31 3 240
5. Juris Purans 30 2 674
6. Janis Klovins 27 3 610
7. Indrikis Krams 27 2 081
8. Rusins Freivalds 26 3 029
9. Anatoly Trukhin 25 2 080
10. Andris Auliciems 23 2 051
Table 4. Ranking list of best 10 Estonian researchers from several disciplines, from Google
Scholar.
No. Researcher h-index Citations
1. Risto Näätänen 124 58 489
2. Martti Raidal 121 76 095
3. Andres Metspalu 84 31 373
4. Ülo Niinemets 75 23 336
5. Tõnu Esko 63 24 177
6. Marlon Dumas 63 21 738
7. Martin Zobel 62 15 922
8. Jüri Allik 55 15 456
9. Reedik Mägi 52 17 710
10. Pärt Peterson 51 8 850
CONCLUSIONS
Ranking of the best 10 Lithuanian, Latvian and Estonian (three Baltic states) researchers from
several disciplines using Google Scholar database is presented. The ranking is made based
primary on h-index and total citation number based on the database in Google Scholar.
Researches ranked first by h-index in decreasing order and then by the total number of
citations. Based on the Tables 2, 3 and 4, in accordance with the h-index, the country's
ranking is the following: 1. Estonian, 2. Lithuanian, 3. Latvian.
REFERENCES
[1] ShanghaiRanking Consultancy: Academic Ranking of World Universities. http://www.shanghairanking.com/aboutarwu.html, accessed 11
th August, 2017,
[2] Hirsch, J.E.: An index to quantify an individual's scientific research output. Proceedings of the National Academy of Sciences of the United States of America 102(46),
16569-16572, 2005,
http://dx.doi.org/10.1073/pnas.0507655102,

G. Mester
178
[3] http://scholar.google.com, accessed 11th
August, 2017, [4] Mester, G.: New Trends in Scientometrics.
Proceedings of the 33rd
International Conference Science in Practice, May 7-8, 2015. Schweinfurt, pp.22-27, 2015,
[5] Mester, G.: Massive Open Online Courses in Education of Robotics. Interdisciplinary Description of Complex Systems 14(2), 182-187, 2016, http://dx.doi.org/10.7906/indecs.14.2.7,
[6] Mester, G.: Rank of Hungarian Researchers Born in Vojvodina in Natural Sciences. Review of the National Center for Digitization 30, 28-34, 2017,
[7] Mester, G.: Cloud Robotics Model. Interdisciplinary Description of Complex Systems 13(1), 1-8, 2015, http://dx.doi.org/10.7906/indecs.13.1.1,
[8] Mester, G.: Intelligent Mobile Robot Motion Control in Unstructured Environments. Acta Polytechnica Hungarica7(4), 153-165, 2010,
[9] Mester, G.: Rankings Scientists, Journals and Countries Using h-index. Interdisciplinary Description of Complex Systems 14(1), 1-9, 2016, http://dx.doi.org/10.7906/indecs.14.1.1,
[10] Mester, G.L.: Measuring the results of scientific work. In Serbian. Tehnika 70(3), 445-453, 2015, http://dx.doi.org/10.5937/tehnika1503445M,
[11] Mester, G.: Wireless Sensor-based Control of Mobile Robots Motion. Proceedings of the IEEE 7th International Symposium on Intelligent Systems and Informatics, September 25-26, 2009. Subotica, pp.81-84, 2009, http://dx.doi.org/10.1109/SISY.2009.5291190,
[12] Mester, G. and Rodic, A.: Autonomous Locomotion of Humanoid Robots in Presence of
Mobile and Immobile Obstacles. Studies in Computational Intelligence, Towards Intelligent Engineering and Information Technology, Part III Robotics, Springer, 2009, http://dx.doi.org/10.1007/978-3-642-03737-5_20,
[13] Mester, G.; Pletl, S.; Pajor, G. and Basic, D.: Adaptive Control of Rigid-Link Flexible- -Joint Robots. Proceedings of 3
rd International Workshop of Advanced Motion Control, March 20-23, 1994.
Berkeley, 1994, [14] Mester, G.: Neuro-Fuzzy-Genetic Trajectory Tracking Control of Flexible Joint Robots.
Proceedings of the I ECPD International Conference on Advanced Robotics and Intelligent Automation, Athens, 1995,
[15] Mester, G.; Pletl, Sz.; Pajor, G. and Rudas, I.: Adaptive Control of Robot Manipulators with Fuzzy Supervisor Using Genetic Algorithms. In Kaynak, O., ed.: Proceedings of International Conference on Recent Advances in Mechatronics, Istanbul, 1995,
[16] Mester, G.; Pletl, S.; Pajor, G. and Jeges, Z.: Flexible Planetary Gear Drives in Robotics. Proceedings of the 1992 International Conference on Industrial Electronics, Control, Instrumentation and Automation – Robotics, CIM and Automation, Emerging Technologies, November 9-13, 1992. San Diego, 1992, http://dx.doi.org/10.1109/iecon.1992.254556,
[17] Rodic, A; Mester, G. and Stojković, I.: Qualitative Evaluation of Flight Controller Performances for Autonomous Quadrotors. Intelligent Systems: Models and Applications, Topics in Intelligent Engineering and Informatics 3(2), 115-134, Springer-Verlag, Berlin & Heidelberg, 2013, http://dx.doi.org/10.1007/978-3-642-33959-2_7,
[18] Skeivalas, J.; Jurevicius, M.; Kilikevicius, A. and Turla, V.: An analysis of footbridge vibration parameters. Measurement 66, 222-228, 2015, http://dx.doi.org/10.1016/j.measurement.2015.02.034,

Ranking Baltic states researchers
179
[19] Jurevicius, M.; Turla, V.; Bureika, G. and Kilikevicius, A.: Effect of external excitation
on dynamic characteristics of vibration isolating table. Maintenance and Reliability 17(2), 260-265, 2015,
http://dx.doi.org/10.17531/ein.2015.2.13,
[20] Spruogis, B.; Jakstas, A.; Gican, V. and Turla, V.: Overhead crane anti-swing system
based on the Pontryagin's maximum principle. Transport, Vilnius, Technika 30(1), 61-68,
http://dx.doi.org/10.3846/16484142.2015.1020872,
[21] Kasač, J.; Stevanović, S.; Žilić, T. and Stepanić, J.: Robust Output Tracking Control of a
Quadrotor in the Presence of External Disturbances. Transactions of Famena 37(4), 29-42, 2013,
[22] Stepanić, J.; Kasać, J. and Ćosić Lesičar, J.: What is Taken for Granted about
Quadrotors: Remarks about drive and communication. Proceedings of the 3
rd International Workshop on Advanced Computational Intelligence and
Intelligent Informatics (IWACIII 2013). Shanghai, 2013,
[23] Mester, G.: Ranking of Croatian Researchers from Several Disciplines using Google
Scholar Database. Interdisciplinary Description of Complex Systems 15(2), 169-174, 2017,
http://dx.doi.org/10.7906/indecs.15.2.6,
[24] Puskas, B. and Rajnai, Z.: The Requirements of the Installation of the Critical
Informational Infrastructure and its Management. Interdisciplinary Description of Complex Systems 13(1), 48-56, 2015,
http://dx.doi.org/10.7906/indecs.13.1.7,
[25] Rubóczki, E.S. and Rajnai, Z.: Moving towards Cloud Security. Interdisciplinary Description of Complex Systems 13(1), 9-14, 2015,
http://dx.doi.org/10.7906/indecs.13.1.2,
[26] http://scholar.google.hu/citations?hl=en&view_op=search_authors&mauthors=Lithuania, accessed 14
th August, 2017,
[27] http://scholar.google.hu/citations?mauthors=Latvia&hl=en&view_op=search_authors, accessed 14
th August, 2017,
[28] http://scholar.google.hu/citations?mauthors=Estonia&hl=en&view_op=search_authors, accessed 14
th August, 2017.

Interdisciplinary Description of Complex Systems 15(3), 180-189, 2017
*Corresponding author, : [email protected]; +385 1 6168 292; *Ivana Lucica 5, HR – 10 000 Zagreb, Croatia
FLUID-DEPOSITION OF ROCKS IS NATURAL MODEL FOR ADDITIVE PRODUCTION
Igor Čatić1, *, Jasmina Čaloska2, Damir Godec1, Marijan Kovačić3, Ana Pilipović1 and Karolj Skala4
1University of Zagreb, Faculty of Mechanical Engineering and Naval Architecture 1Zagreb, 1Croatia
2University Ss. Cyril and Methodius, Faculty of Mechanical Engineering 2Skopje, Macedonia
3University of Zagreb, Faculty of Science 3Zagreb, Croatia
4Ruđer Bošković Institute 4Zagreb, Croatia
DOI: 10.7906/indecs.15.3.2 Regular article
Received: 10th October 2017.
Accepted: 17th October 2017.
ABSTRACT
All created in the Nature is the result of natural technology. Solutions from Nature can be incentive
for artificial, man's technology of living (biotechnology) and technology of abiogenesis. We have set
ourselves the question what is a natural additive model for making parts. After geological analysis and
playback of some products of Nature and man-making procedures of additive components was found.
Natural model for these procedures to create additive components is the formation of sedimentary
rocks 3,75 billion years ago. At the same time we made systematization of additive production and
additive manufacturing of these procedures, the first revolutionary change in the primary shaping after
4,3 billion years.
KEY WORDS
natural rocks, natural model of additive processes, additive production, additive manufacturing
CLASSIFICATION JEL: O14
PACS: 91.60.-x

Fluid-deposition of rocks is natural model for additive production
181
INTRODUCTION
The first additive production process, stereolithography has been introduced by 3D Systems
in 1986 1. Only three decades later, additive production is on the way to be a regular
process for production of material products from living and non-living substances 2.
Stereolithography (SLA or STL) is an additive production process (generic deposition
primary shaping) which employs a vat of liquid ultraviolet curable photopolymer resin and an
ultraviolet laser to build parts' layers one at a time 1.
In our time among other trends, one very strong trend is interconnection between
biotechnology and technology (of non-living systems). This demands looking into natural
technology solutions, to receive ideas for our human, artificial technology. But one trend is
underestimated, synthesiological way of thinking. We have too much information, too much
partial research, but without the effort to attempt to put this knowledge into new structured
cognitive systems.
We try to introduce into our research a synthesiological approach 3. While describing the
history of natural technology for the past 4,4 billion years, we assume to discover the natural
model for all deposition procedures of generic, additive production of prototypes, tools,
including moulds and more and more, parts and things. This discovery is based on a
description – probably the oldest fluid-deposited rocks on Earth, 3,75 billion years old 4.
How do we connect this description with the additive production of parts? According to the
origin, rocks can among others sedimentary (depositional) one. At the same time about 95%
of additive production procedures of are based on deposition. So, we come to conclusion that
natural deposition primary shaping is at least 3,75 billion years old. To support this
conclusion, we must make clear difference between the words production and manufacturing.
DIFFERENCE BETWEEN WORDS PRODUCTION TECHNOLOGY AND MANUFACTURING TECHNOLOGY
Production (fabrication) technology is according the systematization given in DIN 8580 5
and G. Ropohl 6 a common name for processing technology and manufacturing
technology1. Mostly the procedures of the additive method of making parts are production
based. This means that the primary shaping (manufacturing technology) precedes the making
of material (processing technology). In clear text, during deposition additive production
methods we made first the layers (primary shaping – manufacture technology) which would
be than solidified by some chemical reactions like polymerization and/or curing (processing
technology). An excellent example for the description of additive production is mentioned
SLA procedure 7. First we must to build up from liquid epoxy resin (substance) a necessary
layer (primary shaping – manufacturing) and then followed by a laser-induced
polymerization and cross-linking of photo activated resins (processing technology) 7. Not
before the reactions of polymerization and cross-linking are finished, we have no product
with necessary application properties 8.
Primary shaping in manufacturing is connected with a given primary shape to produce, but
can only occur with a change of the state of materials: solid – liquid – solid. Example of this
is process fused deposition modelling – FDM 9-11.
It will be shortly described in the additive production of parts with the aim of visualisation of
the difference between additive production and manufacturing technologies, based on the
state of the substance.

I. Čatić, J. Čaloska, D. Godec, M. Kovačić, A. Pilipović and K. Skala
182
ADDITIVE PRODUCTIONS OF PARTS
The important revolution in the whole history of the production of parts is primary shaping, without using a cavity in a mould, as means of action. The introduction of computers into the production of parts makes it possible.
We start with the hypothesis that the natural model of the most of generative, additive making procedures (methods) is the fluid-deposition making of sedimentary rocks.
From time of making first natural product, inorganic polymer, zircon 4,3 billion years ago, primary shaping and primary structuring was always in some sort of mould. In the case of
zircon the mould was the core of Earth 3.
Additive making procedures (methods) allow the production of parts without a cavity (hollow which is difference between impression and core). For the production of parts by additive procedures we need two steps: preparation of the file with the necessary data as output, and then those data as input transformed into a proper means of action, like 3D-printers.
PREPARATION OF FILES FOR ADDITIVE MANUFATURING
They are two principle modes to prepare the necessary files. The first one is the result of development and design of new part (CAD model). The second way is starting with a real
part which would be transformed into necessary file by using 3D scanning 12.
3D scanning is a modern technology that can analyse a real-world object or environment to collect data on its shape and possibly its appearance. There are a variety of technologies for digitally acquiring the shape of a 3D object. A well-established classification divides them into two types: contact and non-contact 3D scanners.
PRODUCTION OF PARTS BY LAYER-BY-LAYER PROCESSES
The basic principle of additive manufacturing is adding material layer-by-layer until the part is finished. Therefore, in literature also can be find term additive layered manufacturing - ALM. This principle is for e.g. opposite of the classic cutting procedures which belong to the group of
subtractive processes (turning, drilling, milling, etc.) 12.
Although procedures of additive making parts results with very complicated geometrical 3D shapes of finished parts, generally they are 2½D procedures, in which 2D layers are in general
deposited one on each other, and thus a third dimension of the part is achieved 13.
A special characteristic of the additive method of making parts is the fact that the final, physical parts are made directly from the computer 3D data about the part. It is irrelevant what the origin of those 3D data is: CAD design, reverse engineering, computer tomography (CT) or magnetic resonance (MR). From the part’s point of view, parts made by procedures of additive making can be considered as a three-dimensional print of the existing CAD data.
Additive making procedures can be divided into a two basic steps: 12
generation of mathematical information on layers (virtual environment),
generation of the layers of physical part (real environment).
The second step is more interesting for this paper, but also for the systematisation of mostly commercial procedures of additive making. In available scientific and professional literature which deals with area of additive making, a lot of many different types of systematisation of those procedures can be found. One of the favourite systematisation of additive making
procedures is based on DIN 8580 5 and DIN 8581 12 guidelines.
Additive making procedures are classified based type of making (production or manufacturing), state of substances (solid, liquid or gas) – physics and chemistry of the process (Figure 1).

Fluid-deposition of rocks is natural model for additive production
183
Fig
ure
1. S
yst
emat
isat
ion o
f th
e ad
dit
ive
mak
ing p
roce
dure
s.
I. Čatić, J. Čaloska, D. Godec, M. Kovačić, A. Pilipović and K. Skala
184
Basically it is possible to summarize systematisation as 12:
solidification of liquid materials (polymerisation and/or cross-linking process),
generating a part from a solid state (cutting of foils and plates; application of partly or
completely melted solid materials such as powders and powder mixes – processes of
extrusion and laser sintering; bonding of powder particle by binder),
generating a part from pastose state,
precipitation from gas state.
EXAMPLES OF ADDITIVE PRODUCTION AND ADDITIVE MANUFACTURING PROCESSES
Stereolithography (SLA or SL) is an example of primary shaping and primary structuring on
molecular level, where primary shaping is followed by polymerisation and cross-linking,
reactive primary shaping, by laser beam.
Reactive primary shaping we found in processing of thermosets (e.g. epoxy resin), rubbers,
ceramics and in some cases during primary shaping of thermoplastics is like the casting of
poly(methyl methacrylate) (PMMA) 8.
Primary shaping in manufacturing is connected with a given primary shape to the product,
but only occurs with a change of the state of materials: solid – liquid – solid. An example of
this is Fused deposition modelling – FDM. The solid polymer filament is supplied to the
machine through a nozzle, which is computer-controlled and in one layer it forms the raster
of the item in the respective layer. The material exits the nozzle in liquefied/softened state
and at ambient temperature solidified quickly to solid body. The entire system is usually in a
heated environment. After making the first layer, the working bed is lowered for the thickness
of the new layer and the new layer is extruded 9-11. In more complex product geometry, the
support structure may be used. In this case a double extrusion head is used. It is possible to
extrude PE-HD, PE-LD, PP, ABS and also biocompatible and/or biodegradable materials
(e.g. polycaprolacton – PCL) and elastomers and it is possible to simultaneously produce
several prototypes. FDM can also produce support structure made from same material as
product and with one head only. Support structure in this case and at the end of production is
removed mechanically 11, 14, 15.
The described procedures are in principle deposition one. We try to proof our hypothesis. Is
possible the natural model of additive making of parts fluid-deposition of rocks? This idea
has been proved first by geological analysis.
GEOLOGICAL ANALYSIS
During this analysis we study two examples of sedimentary rocks 16, 17.
Starting from the assumption that the sedimentary rocks are a natural model for making a
product by additive processes, there been found two examples, gypsum and pelite
sedimentary rocks.
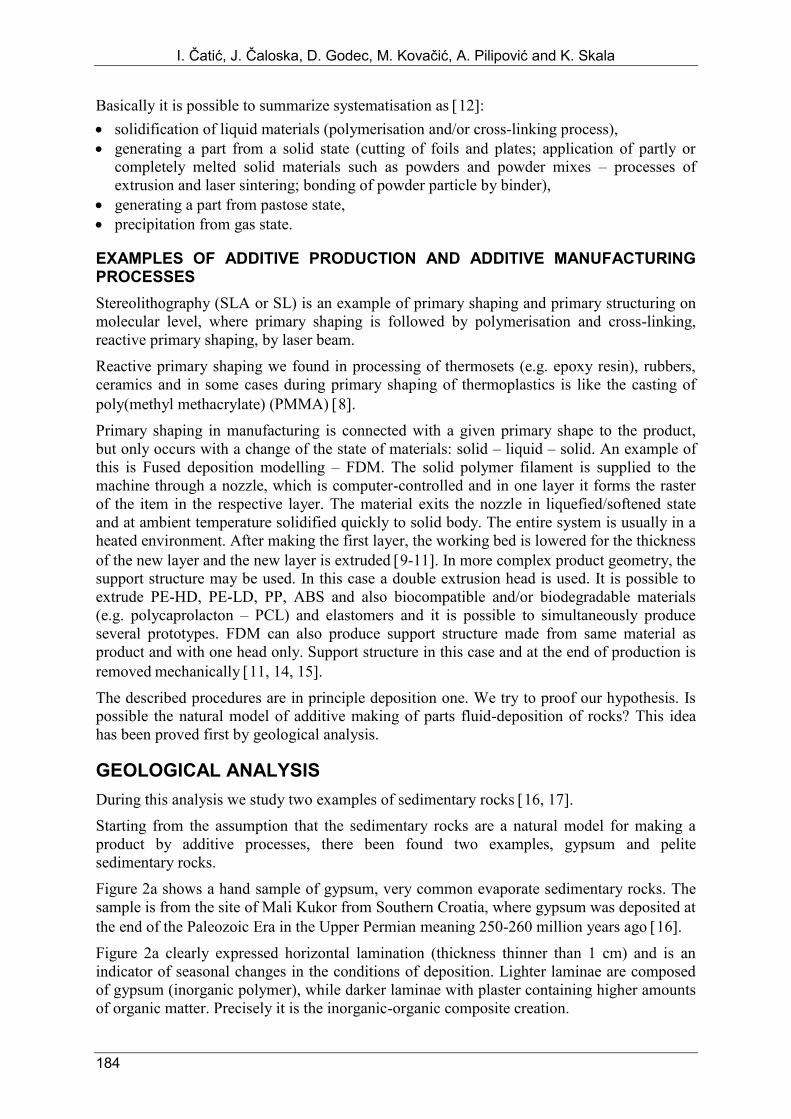
Figure 2a shows a hand sample of gypsum, very common evaporate sedimentary rocks. The
sample is from the site of Mali Kukor from Southern Croatia, where gypsum was deposited at
the end of the Paleozoic Era in the Upper Permian meaning 250-260 million years ago 16.
Figure 2a clearly expressed horizontal lamination (thickness thinner than 1 cm) and is an
indicator of seasonal changes in the conditions of deposition. Lighter laminae are composed
of gypsum (inorganic polymer), while darker laminae with plaster containing higher amounts
of organic matter. Precisely it is the inorganic-organic composite creation.

Fluid-deposition of rocks is natural model for additive production
185
a) b)
Figure 2. a) the sample of horizontally laminated gypsum from the site of Mali Kukor (age
250-260 million years) 16, b) the hand sample of horizontally laminated pelite sedimentary
rock from the site Voćin 12 million year old 17.
Figure 2b shows hand sample of pelite sedimentary rock from Voćin locality, Eastern
Croatia, composed of alternate laminae of silt and marl. The rock is an inorganic polymer
with a well-defined horizontal lamination deposited in the Middle Miocene Epoch, about 12
million years ago 17.
An important property of sedimentary rock is the arrangement in the layers, in our case, the
most interesting is the horizontal layering (lamination). Which indicates that the initial
assumption that the natural model for additive production, formation of sedimentary rocks is
acceptable.
We decided to proof our hypotheses using CD scanning equipment, 3D printers and used
geological materials.
EXPERIMENTAL PROOF
Using three different types of printers and different materials for printing we produce parts
which demonstrate the origin of additive production and we made a comparison with
historical materials found in the nature.
MATERIALS AND EQUIPMENT
We used for scanning following cameras: ATOS II (procedure A), AVT Guppy F080B
FireWire 400 camera (procedure B) and ATOS Core 135 (procedure C).
In Table 1 is given some technical specifications of 3D printing devices for all cases (A, B
and C) which is shown in Figure 3a - f.
PROCEDURE A
The rock specimen originating from Ilidža, Bosnia and Herzegovina and exported scan made
with non-contact 3D scanner ATOS II is given in Figure 3a and 3d 17, 18.
The scan presents the rock called aragonite. Prismatic crystals of mineral aragonite (CaCO3,
polymorphic modification) originated from hydrothermal solution at low temperatures (60 °C).
Aragonite is a very unstable mineral and is easily converted into more stable calcite
(CaCO3). Brown – yellow colour of aragonite comes from the presence of Fe oxide and
hydroxide – (limonite).

I. Čatić, J. Čaloska, D. Godec, M. Kovačić, A. Pilipović and K. Skala
186
Because of the bright colour of the rock, it is difficult to notice the layered texture of the real
material. After the polygonization, created CAD model can be exported into the some
software for next analyses or printing.
For producing the replicas in the procedure A the material used has been a kind of composite
material based on blaster compounded with binder. After each layer, the substances must to
react with the binder. After this description of used materials and the necessity of reaction,
give us right to call this procedure the production one.
The replicas has been successfully made, however, due to the type of available material, the
printed layers are not clearly visible, so the replica missed here 18.
Table 1. Technical specifications of 3D printing device.
Technical
specification Procedure A Procedure B Procedure C
Procedure used Z 510 Zprinter 450 PolyJet
Reactive procedure,
yes-no yes yes yes
Build speed,
layers/min 2 2
Layer thickness, mm 0,089-0,203 0,089-0,102 0,016
Resolution, dpi 600 540 300 450 600 600 1600
Material options
High-performance
Composites,
Casting Materials,
Elastomeric Material
High-performance
Composites Photopolymers
Material used Composite material
(USA)
Composite material
(USA) VeroWhite (Izrael)
System software ZPrint
Z Corporation’s
proprietary software
accepts solid models
in STL, VRML PLY,
and 3DS file formats
as input. ZPrint™
software features 3D
viewing, text
labelling, and scaling
functionality
Objet Studio for
Connex 350
Input formats STL, VRML, PLY and
3DS
STL, VRML, PLY,
ZPR and 3DS STL, OBJDF, SLC
Printer Z 510 Zprinter 450 Connex 350
Printing system inkjet layer printing
system inkjet printing system UV hardening
PROCEDURE B
For second test procedure we found specimen from a place in the pedestal of a mountain in
Vlašić, Bosnia and Herzegovina (Figure 3b). This rock has been collected for making stone
tools during an education process at the University of Zagreb, Department Archaeology. The
material of the stone is chert, sedimentary rock originating from radiolarite of Triassic or
Jurassic time.
Fluid-deposition of rocks is natural model for additive production
187
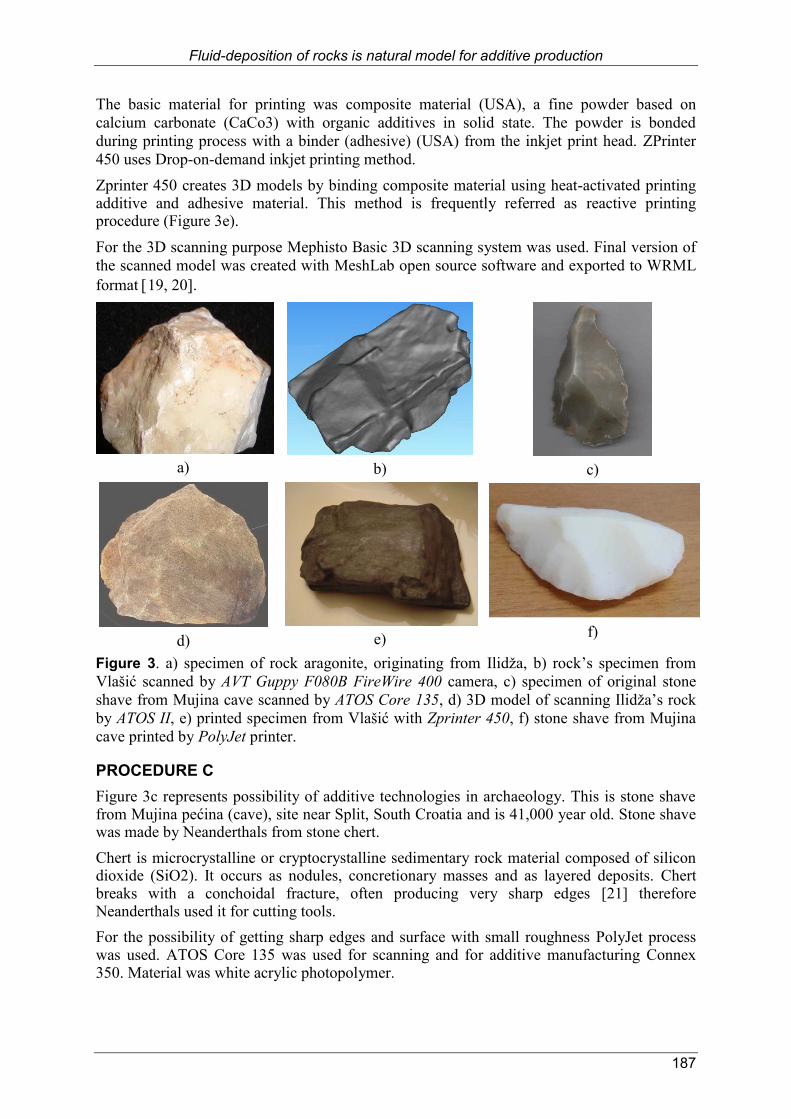
The basic material for printing was composite material (USA), a fine powder based on
calcium carbonate (CaCo3) with organic additives in solid state. The powder is bonded
during printing process with a binder (adhesive) (USA) from the inkjet print head. ZPrinter
450 uses Drop-on-demand inkjet printing method.
Zprinter 450 creates 3D models by binding composite material using heat-activated printing additive and adhesive material. This method is frequently referred as reactive printing procedure (Figure 3e).
For the 3D scanning purpose Mephisto Basic 3D scanning system was used. Final version of
the scanned model was created with MeshLab open source software and exported to WRML
format 19, 20.
a)
b)
c)
d)
e)
f)
Figure 3. a) specimen of rock aragonite, originating from Ilidža, b) rock’s specimen from
Vlašić scanned by AVT Guppy F080B FireWire 400 camera, c) specimen of original stone
shave from Mujina cave scanned by ATOS Core 135, d) 3D model of scanning Ilidža’s rock
by ATOS II, e) printed specimen from Vlašić with Zprinter 450, f) stone shave from Mujina
cave printed by PolyJet printer.
PROCEDURE C
Figure 3c represents possibility of additive technologies in archaeology. This is stone shave from Mujina pećina (cave), site near Split, South Croatia and is 41,000 year old. Stone shave was made by Neanderthals from stone chert.
Chert is microcrystalline or cryptocrystalline sedimentary rock material composed of silicon dioxide (SiO2). It occurs as nodules, concretionary masses and as layered deposits. Chert breaks with a conchoidal fracture, often producing very sharp edges [21] therefore Neanderthals used it for cutting tools.
For the possibility of getting sharp edges and surface with small roughness PolyJet process was used. ATOS Core 135 was used for scanning and for additive manufacturing Connex 350. Material was white acrylic photopolymer.

I. Čatić, J. Čaloska, D. Godec, M. Kovačić, A. Pilipović and K. Skala
188
Figure 3c shows the original stone, and 3e printed. In the Figure we can observe sharp edges
and smooth surface. On the printed product it can’t be seen layers because Polyjet process
produces layers of 16 m thickness.
CONCLUSION
The specimen’s researchers found of rock gypsum and pelite encouraged researchers to scan
mode two mineral from other substances. Scanning and procedures described in additive
production have been proven to be a natural model of additive production that began before
3,75 billion years ago. It should be noted that the development of additive production without
moulds, back in 1986 is the first revolutionary change in the primary shaping of parts, since
the making of zircon formation period, 4,3 to 4,4 billion years ago.
ACKNOWLEDGEMENT
We give a credit to all persons who support us in this project. Particularly to Prof Ivor
Karavanić from University of Zagreb, Faculty of Humanities and Social Sciences. This work
has been induced by first author who is retired scientist, mostly occupied by synthesiological
research. Other authors help him within other different projects, only few a mentioned.
The contribution to this paper is based on project Application of theory of systems in analysis
of general technology, supported by the Ministry of Science, Education and Sports of the
Republic of Croatia.
This work is also part of the research financed by the project IPA III c – Additive
Technologies for the SMEs – AdTecSME, supported by the European Union and the Ministry
of Science, Education and Sports of the Republic of Croatia.
The authors would like to thank all those help in financing our projects, from which part is
included in this article.
REMARK 1Čatić, I.: Get Talking – Plastics Manufacturing expert talks new classification in material 1designs. Materials World 24(1), 23, 2016.
REFERENCES
1 Pilipović, A.: Influence of processing parameters on the properties of polymer prototype.
Ph.D. Thesis. University of Zagreb – Faculty of Mechanical Engineering and Naval Architecture, Zagreb, 2012,
2 Schürmann, H.: 3-D-Druck ist auf dem Weg in die industrielle Praxis. VDI-N, October 10
th, 2014,
3 Čatić, I. and Rujnić-Sokele, M.: Synthesiological approach to artificial materials
technologies. Management of Technology Step to Sustainable Production, June 2-3, 2010. Rovinj, 2010,
4 Papineau, D.; De Gregorio, B.T.; Steele, A.; Stroud, R.M.and Fogel, M.: Fluid-
-deposition of graphite with apatite in an Eoarchean banded iron formation from the
Nuvvuagittuq Supracrustal Belt, Québec, Canada. Goldsmith Conference, June, 2010. Knoxville, 2010,
5 DIN 8580: Manufacturing processes – Terms and definitions, division. Deutsches Institut für Normung E.V. (German National Standard), 2003,
6 Ropohl, G.: Eine Systemtheorie der Technik, zur Grundlegung der allgemeinen Technologie. Carl Hanser Verlag, München & Wien, 1979,

Fluid-deposition of rocks is natural model for additive production
189
7 Esposito Corcione, C.; Greco, A.; Maffezzoli, A.: Photopolymerization kinetics of an
epoxy-based resin for stereolithography. Applied Polymer 92(6), 3484-3491, 2004, http://dx.doi.org/10.1002/app.20347,
8 Čatić, I.; Barić, G. and Rujnić-Sokele, M.: Polymers and non-polymers – a new systematisation of substances and materials. Polimeri 36(1-2), 15-22, 2014,
9 Liou, F.W.: Rapid Prototyping and Engineering applications: A Toolbox for Prototype Development. Taylor & Francis Group, New York, 2008,
10 Gibson, I.L.; Rosen, D.W. and Stucker, B.: Additive Manufacturing Technologies: Rapid Prototyping to Direct Digital Manufacturing. Springer, New York, 2010, http://dx.doi.org/10.1007/978-1-4419-1120-9,
11 Pahole, I.; Drstvenšek, I.; Ficko, M. and Balič, J.: Rapid prototyping processes give new possibilities to numerical copying techniques. Journal of Materials Processing Technology 164-165, 1416-1422, 2005, http://dx.doi.org/10.1016/j.jmatprotec.2005.02.167,
12 Gebhardt, A.: Rapid Prototyping. Carl Hanser Verlag, München, 2003, http://dx.doi.org/10.3139/9783446402690,
13 Godec, D. and Šercer, M.: Additive production of parts. In Croatian. University textbook. Univerity of Zagreb, Faculty of Mechanical Engineering and Naval Architecture, Zagreb, 2015,
14 Den Ouden, A.:Historical engineering and technology, ndustral archaeology and history. http://www.alexdenouden.nl, accessed 20
th January 2017,
15 Pilipović, A.; Šercer, M. and Valentan, B.: Use of low-cost printers and the influence of parameters on the precision and mechanical properties. 13
th International scientific conference on production engineering, Jun 16-18, 2011. Biograd,
pp.187-194, 2011,
16 Šušnjara, A.; Sakač, K.; Jelen, B. and Gabrić, A.: Upper Permian Evaporites and Associated Rocks of Dalmatia and Borderline Area of Lika and Bosnia. Geologia Croatica 45, 96-114, 1992,
17 Tišljar, J.: Sedimentology of Clastic and Siliceous Deposits. In Croatian. Institute of Geology, Zagreb, p.425, 2004,
18 Kochov, A.; Chaloska, J. and Lazarev, J.: Support of reverse engineering in the development
of moulds for injection molding and tools for sheet metal forming. Bilateral project report. CIRKO MES CE, Faculty of Mechanical Engineering, Republic of
Macedonia & TECOS, Republic of Slovenia, 2007-2009,
19 Micevska, J.; Spiroski, Z.; Čaloska, J. and Kočov, A.: Product quality control by using
reverse engineering. 34
th International Conference for Production Engineering. University of Niš, Niš, 2011,
20 Callieri, M.; Cignoni, P.; Dellepiane, M.; Ranzuglia, G. and Scopigno, R.: Processing a
complex architectural sampling with MeshLab: the case of Piazza della Signoria. International Society of Photogrammetry and Remote Sensing, 2011,
21 King, H.: Cert. http://geology.com/rocks/chert.shtml, accessed 9
th February 2017.

Interdisciplinary Description of Complex Systems 15(3), 190-198, 2017
*Corresponding author, : [email protected]; +1 505 277 3122; 1Department of Computer Scinece, 1, University of New Mexico, Albuquerque, NM, 87131, USA
A COMPUTATIONAL TECHNIQUE TO ESTIMATE WITHIN-HOST PRODUCTIVELY INFECTED CELL LIFETIMES IN EMERGING VIRAL INFECTIONS
Soumya Banerjee*
University of Oxford, Oxford, United Kingdom
Ronin Institute Montclair, United States of America
Complex Biological Systems Alliance North Andover, United States of America
DOI: 10.7906/15.3.3 Regular article
Received: 17th July 2017.
Accepted: 18th September 2017.
ABSTRACT
Emerging viruses cause a lot of fatalities as they jump to humans from other species. Here we develop
a novel technique to computationally estimate an important parameter of within-host viral infection:
the lifespan of infected cells. Our approach is general and can be applied to a large class of viruses
and leverages experimental data from replicon studies. Current techniques have difficulties reliably
estimating infected cell lifetimes due to parameter identifiability and correlation of parameters. The
infected cell lifetime is an important parameter that gives an estimate of how fast virus levels will
decline. Our method would also help determine if some infected cells are short-lived or have longer
lifespans with the consequence that longer lived cells could be reservoirs of infection. This would
give a mechanistic understanding of why particular cell types are reservoirs of infection and may
motivate therapy targeted towards these cell types. We apply our technique to West Nile virus
(WNV), an emerging disease of public health relevance related to Zika virus. Our analysis suggests
that the most abundant infectible cells are short-lived and could motivate therapy that targets these
particular cells. Our approach is very general and can be combined with more traditional methods of
using differential equation models to simulate viremia in hosts: the combination of these two
techniques will likely yield results that may not be achievable using the models in isolation. This will
be of great interest especially in modelling emerging diseases.
KEY WORDS
viral infections, West Nile virus, replicon studies
CLASSIFICATION
JEL: I19, Z19

A Computational Technique to Estimate Within-Host Productively Infected Cell Lifetimes ...
191
INTRODUCTION
Emerging viruses cause a lot of fatalities as they jump to humans from other species.
Accurate estimates characterizing the dynamics of the effects of the virus within hosts would
give insights into the disease. Here we develop a novel technique to computationally estimate
an important parameter of within-host viral infection: the lifespan of infected cells. This is
difficult to directly estimate based on only in-vivo (within animals) experiments. Our
approach is general and can be applied to a large class of viruses and leverages experimental
data from replicon studies. Mathematical models have provided important insights into
within-host viral dynamics. For example, human immunodeficiency virus (HIV) infection
was modeled to analyze dynamics of the virus in patients which led to estimates of the in-
vivo rate of HIV replication and the average life span of productively infected cells [1-4].
These models gave insights into how the virus remained quiescent for years before leading to
detectable symptoms. Our primary goal is to outline a novel computational technique to
characterize in-vivo productively infected cell lifetimes. Our computational technique
leverages advances in genetically modified viruses called replicons. Our approach can
complement existing techniques using differential equations and help overcome issues of
parameter identifiability and correlation of parameters [5]. The infected cell lifetime is an
important parameter that gives an estimate of the how fast virus levels will decline following
treatment with antivirals [4]. Accurate estimates of infected cell lifetimes would also be able
to suggest if certain long lived cells could be reservoirs of infection. We motivate our
analysis by applying our technique to an emerging disease: West Nile virus (WNV), which
infects multiple species including humans and has caused high fatalities [6-8]. It is an
arbovirus and is in the same family as other viruses such as Zika and hepatitis C virus which
are of significant public health concern. Our analysis suggests that the most abundant
infectible cells are short-lived (most likely dendritic cells and macrophages) and could
motivate therapy that targets these particular cells. We suggest that our approach is very
general and can be combined with more traditional methods of using differential equation
models to estimate viral parameters within hosts [5]: the combination of these two techniques
will likely yield results that may not be achievable using the models in isolation. This will be
of great interest in modelling emerging diseases of public health significance.
MATERIALS AND METHODS
STUDY DATA
We use data on in-vivo infection of B6 mice with WNV replicons [9]. The WNV replicon
was genetically engineered to encode a Renilla luciferase reporter and had the genes
encoding for WNV structural proteins deleted. Viral structural proteins were packaged in
trans to create virus-like particles as described in [10]. The WNV replicon was injected
subcutaneously into the footpad of six week old B6 mice. At various time points, the draining
popliteal lymph node was harvested, homogenized and assayed for luciferase activity.
RESULTS
ANALYSIS OF DATA ON IN-VIVO INFECTION USING A WNV REPLICON
We analyzed data on in-vivo infection of B6 mice with WNV replicons [9]. Replicons are
synthetically modified viruses and in this experiment they were modified:
1) to express a gene for bioluminescence so that virus activity could be monitored, and
2) structural genes were deleted so that the replicons could not get outside the cell.

S. Banerjee
192
Translation of the gene for bioluminescence produces luciferase within the infected cell
which converts a substrate to photons. The activity or expression of the luciferase reporter
was monitored regularly. This study has several features which help us get constraints on
productively infected cell lifespans:
1) The WNV replicon kills cells in-vitro and also presumably in-vivo (personal communication
Dr. Kristen Bernard, University of Wisconsin-Madison). We note however that insertion of the
gene for Renilla luciferase into the WNV genome could negatively impact replication efficiency.
2) WNV replicon leads to only a single round of infection in cells.
3) The luciferase reporter is not secreted. Hence we only have to consider intracellular decay
of luciferase and not clearance of luciferase outside cells (by the action of blood,
extra-cellular degra- dation, etc).
We note the caveat that since the viral structural genes are deleted, there is no viral budding
from infected cells and hence cytopathicity can be lower than due to the full length virus. The
cells in the draining popliteal lymph node are likely dendritic cells and macrophages
(personal communication, Dr. Kristen Bernard). The decline in luciferase reporter expression
late in the infection is due to:
a) killing of cells in-vivo by WNV replicon leading to a decline in luciferase expression,
b) decay of luciferase within the cell,
c) migration of replicon infected dendritic cells and macrophages out of the draining lymph
node and
d) inhibition of replicon replication by cellular interferon.
One study observed a small dendritic cell population in thoracic duct lymph that had
presumably migrated from the lymph node and measured it to be a very small percentage
(approximately 0,013 %) of all viable cells [11]. It is also not completely understood whether
and how dendritic cells exit the lymph node [12]. Hence in what follows, we ignore migration
of infected dendritic cells and macrophages from the draining lymph node. We represent the
dynamics of luciferase activity in the declining phase by the following model:
, (1)
. (2)
Cells that are infected with the replicon and actively producing luciferase intracellularly are
represented by I2. Productively infected cells (I2) die at a rate δ per cell because of the WNV
replicon, where 1/δ is the average life span of a productively infected cell. The kinetics of
intracellular luciferase (L) is dictated by luciferase expression within productively infected
cells (I2) mediated by a constant κ and intracellular decay at rate μ. Solving the equations
above, assuming initial conditions L(0) = 0, leads to the following equation for the kinetics of
luciferase expression within productively infected cells:
. (3)
where a is a constant. Luciferase decays rapidly within cells with a half-life of approximately 2
hours [13] yielding a decay rate (μ) of 8,3 / day. Because of this rapid decay, we can approximate
the dynamics of intracellular luciferase after an initial transient phase by the following equation:
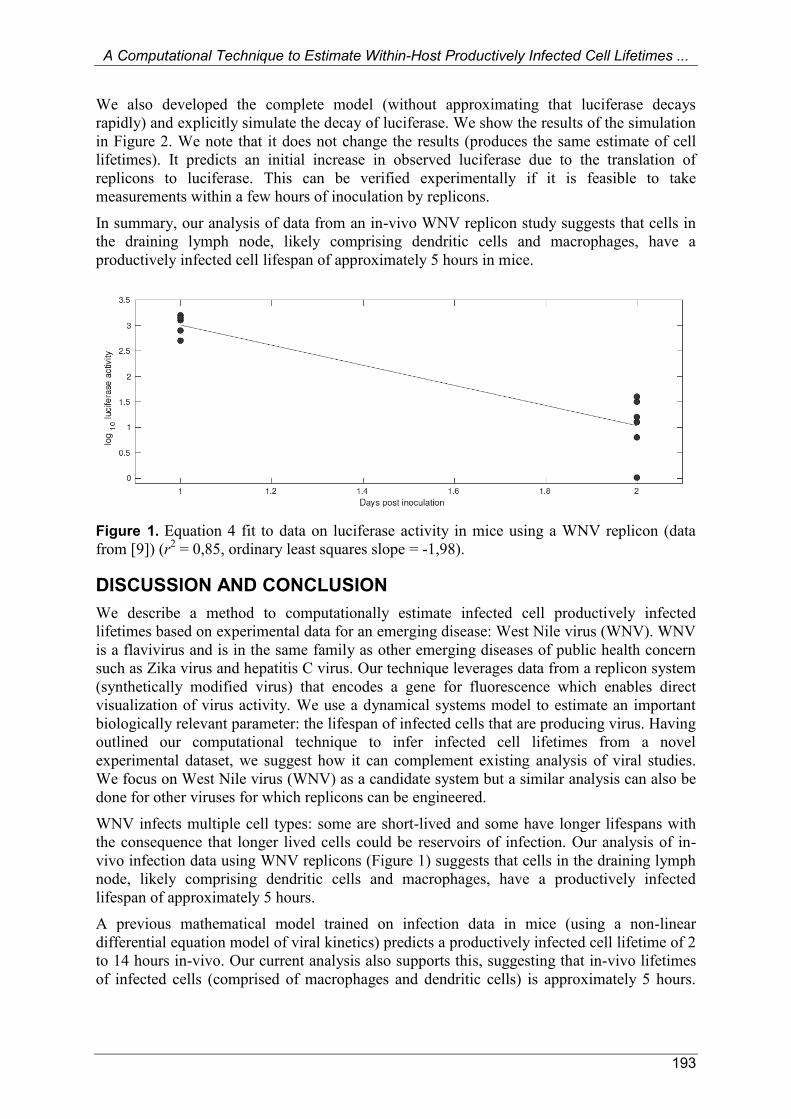
. (4) We fit Equation 4 to data in [9] (Figure 1) for the decaying phase of luciferase and estimate δ
to be approximately 5.2 / day, giving us a mean productively infected lifespan (1 / δ) of
approximately 5 hours (r2 = 0,85, ordinary least squares slope = -1,98).
A Computational Technique to Estimate Within-Host Productively Infected Cell Lifetimes ...
193
We also developed the complete model (without approximating that luciferase decays
rapidly) and explicitly simulate the decay of luciferase. We show the results of the simulation
in Figure 2. We note that it does not change the results (produces the same estimate of cell
lifetimes). It predicts an initial increase in observed luciferase due to the translation of
replicons to luciferase. This can be verified experimentally if it is feasible to take
measurements within a few hours of inoculation by replicons.
In summary, our analysis of data from an in-vivo WNV replicon study suggests that cells in
the draining lymph node, likely comprising dendritic cells and macrophages, have a
productively infected cell lifespan of approximately 5 hours in mice.
Figure 1. Equation 4 fit to data on luciferase activity in mice using a WNV replicon (data
from [9]) (r2 = 0,85, ordinary least squares slope = -1,98).
DISCUSSION AND CONCLUSION
We describe a method to computationally estimate infected cell productively infected
lifetimes based on experimental data for an emerging disease: West Nile virus (WNV). WNV
is a flavivirus and is in the same family as other emerging diseases of public health concern
such as Zika virus and hepatitis C virus. Our technique leverages data from a replicon system
(synthetically modified virus) that encodes a gene for fluorescence which enables direct
visualization of virus activity. We use a dynamical systems model to estimate an important
biologically relevant parameter: the lifespan of infected cells that are producing virus. Having
outlined our computational technique to infer infected cell lifetimes from a novel
experimental dataset, we suggest how it can complement existing analysis of viral studies.
We focus on West Nile virus (WNV) as a candidate system but a similar analysis can also be
done for other viruses for which replicons can be engineered.
WNV infects multiple cell types: some are short-lived and some have longer lifespans with
the consequence that longer lived cells could be reservoirs of infection. Our analysis of in-
vivo infection data using WNV replicons (Figure 1) suggests that cells in the draining lymph
node, likely comprising dendritic cells and macrophages, have a productively infected
lifespan of approximately 5 hours.
A previous mathematical model trained on infection data in mice (using a non-linear
differential equation model of viral kinetics) predicts a productively infected cell lifetime of 2
to 14 hours in-vivo. Our current analysis also supports this, suggesting that in-vivo lifetimes
of infected cells (comprised of macrophages and dendritic cells) is approximately 5 hours.

S. Banerjee
194
However, another study suggests that other cell types (keratinocytes) have longer
productively infected lifespans in-vitro than our estimates in-vivo from mice [5].
Figure 2. Simulation of complete system (Equation 3) over time (days) (explicitly modelling
luciferase decay).
Is it possible to reconcile all these studies? We suggest the possibility that cells with short
productively infected cell lifespans (like dendritic cells and macrophages) contribute significantly
more to viremia in serum in mice than keratinocytes with longer productively infected cell
lifespans. That would explain the relatively short infected cell lifetime (2 to 14 hours) in
previous models [5] since the short-lived cells (dendritic cells and macrophages) are possibly
more abundant. There are likely more susceptible dendritic cells and macrophages in the
lymph node, spleen and kidney than there are keratinocytes in skin. We can reason about this
as a two compartment system: one compartment is long-lived but less abundant (comprised of
keratinocytes) and another compartment is short-lived but abundant (comprised of macrophages
and dendritic cells). Hence the short-lived cells could contribute more to viremia and
estimates of lifetimes would be closer to the lifetimes of these cells (2 to 14 hours).
This is akin to the situation in HIV, where infected CD4+ T-cells are short-lived and
contribute significantly more to peripheral viral load than longer lived cell populations, such
as macrophages [4]. Taken together with previous experimental results, our modeling
suggests that cells with relatively short productively infected lifespans (likely dendritic cells
and macrophages) in lymph node, spleen and kidney likely contribute significantly towards
WNV viremia in serum during the acute phase of infection.
This would also be consistent with studies that inhibited replication in dendritic cells and
macrophages and observed reduction of WNV titer in serum to undetectable levels [14] (also
personal communication Dr. Manjunath Swamy, Texas Tech University). We note however,
A Computational Technique to Estimate Within-Host Productively Infected Cell Lifetimes ...
195
that keratinocytes also play a very important role in WNV pathogenesis. Long lived infected
keratinocytes contribute towards persistent viremia in skin and peripheral organs months after
infection, even well after viremia has declined to undetectable levels in serum [15]. Keratinocytes
are also the initial targets of WNV infection [9] and promote migration of infected Langerhans
cells to the draining lymph node [16], which in turn facilitates systemic spread of WNV [16].
In summary, our analysis suggests that the most abundant infectible cells in WNV are
short-lived. These cells are most likely dendritic cells and macrophages and could be reservoirs
of infection. This could motivate therapy that specifically targets these cells. Therapy during
the acute phase of infection could be targeted towards short-lived cells (dendritic cells and
macrophages) whereas therapy during the chronic phase can be directed towards keratinocytes.
Our computational technique yields biological insights that complement approaches using
differential equation models to fit viremia data [5]. This suggests a novel way to combine
traditional differential equation models with models fit to replicon data and could be applied to
other emerging diseases, e.g. Dengue virus for which replicons have also been constructed [17].
Finally, we note that we analyzed data from in-vivo infection of mice with WNV replicon
particles modified to be capable of only one round of infection and encoding an intracellular
luciferase reporter. The fact that these particles are capable of only round of infection and that
they decay very rapidly in the intra-cellular environment is critical since it considerably
reduces the parameters that need to be estimated.
Our modeling makes suggestions for further experimental work. More frequent measurement of
replicon and simultaneous measurements with viremia in serum (both in-vivo and in the same strain
of mice) may help in getting more accurate estimates of biologically relevant model parameters.
Our method is general and can be applied to other emerging viral infections where replicon
experiments are feasible, e.g. in Dengue virus [17]. Our technique can complement current
approaches using ordinary differential equations and can help overcome problems of
parameter identifiability and correlation of parameters (like the lifetime of infected cells) [5].
The infected cell lifetime is an important parameter that gives an estimate of the how fast
virus levels will decline following treatment with antivirals [4].
Accurate estimates of infected cell lifetimes can also suggest if some cell types are long-term
reservoirs of infection as we have shown in the preceding analysis with WNV. This would
give a mechanistic understanding of why particular cell types are reservoirs of infection and
give insights into why some viruses seem to be specialized for certain cell types (cell tropism).
Accurate estimates of infected cell lifetimes can also be compared to the theoretically predicted
value for optimal propagation [18] giving insights into how far a given strain of virus is from
mutating into a more virulent strain. Such an analysis can also be incorporated in scaling
parameters of disease progression between hosts [19]. This would enable us to couple within
host models of viral kinetics to models of how viruses spread between hosts, enabling modelling
of diseases at multiple scales. Our work also suggests a generality and power of dynamical
models in capturing rich features of diverse complex systems ranging from immune systems
and intra-cellular regulatory networks to global scientific collaboration networks [20-34].
In summary we suggest that our approach is very general and can be combined with more
traditional methods of using differential equation models to estimate parameters of viremia in
hosts [5]: the combination of these two techniques will likely yield results that may not be
achievable using these models in isolation. This will be of great interest especially in
modelling emerging diseases and viral infections of public health significance.

S. Banerjee
196
ACKNOWLEDGEMENTS
Author thanks to Dr. Alan Perelson, Dr. Kristen Bernard and Dr. Manjunath Swamy for
helpful discussions.
REFERENCES
[1] Ho, D.D. et al.: Rapid turnover of plasma virions and CD4 lymphocytes in HIV-1
infection. Nature 373(6510), 123-126, 1995,
http://dx.doi.org/10.1038/373123a0,
[2] Perelson, A.S.; Kirschner, D.E. and De Boer, R.: Dynamics of HIV infection of CD4+ T cells. Mathematical Biosciences 114(1), 81-125, 1993, http://dx.doi.org/10.1016/0025-5564(93)90043-A,
[3] Perelson, A.S. et al.: HIV-1 dynamics in vivo: virion clearance rate, infected cell life-
-span, and viral generation time. Science 271(5255), 1582-1586, 1996, http://dx.doi.org/10.1126/science.271.5255.1582,
[4] Perelson, A.S. et al.: Decay characteristics of HIV-1-infected compartments during
combination therapy.
Nature 387(6629), 188-191, 1997,
http://dx.doi.org/10.1038/387188a0,
[5] Banerjee, S. et al.: Estimating Biologically Relevant Parameters under Uncertainty for
Experimental Within-Host Murine West Nile Virus Infection. Journal of the Royal Society Interface 13(117), 2016,
http://dx.doi.org/10.1098/rsif.2016.0130,
[6] Ceausu, E. et al.: Clinical manifestations in the West Nile virus outbreak. Romanian Journal of Virology 48(1-4), 3-11, 1997,
[7] Petersen, L.R. and Marfin, A.A.: West Nile virus: a primer for the clinician. Annals of Internal Medicine 137(3), 173-179, 2002,
[8] Sejvar, J.J. et al.: Neurologic manifestations and outcome of West Nile virus infection. JAMA 290(4), 511-515, 2003,
http://dx.doi.org/10.1001/jama.290.4.511,
[9] Lim, P.Y.; Behr, M.J.; Chadwick, C.M.; Shi, P.Y. and Bernard, K.A.: Keratinocytes are
cell targets of West Nile virus in vivo.
Journal of Virology 85(10), 5197-5201, 2011,
http://dx.doi.org/10.1128/JVI.02692-10,
[10] Puig-Basagoiti F. et al.: High-throughput assays using a luciferase-expressing replicon,
virus-like particles, and full-length virus for West Nile virus drug discovery. Antimicrobial Agents and Chemotherapy 49(12), 4980-4988, 2005,
http://dx.doi.org/10.1128/AAC.49.12.4980-4988.2005,
[11] Cavanagh, L.L. et al.: Activation of bone marrow–resident memory T cells by circulating,
antigen-bearing dendritic cells. Nature Immunology 6(10), 1029-1037, 2005,
http://dx.doi.org/10.1038/ni1249,
[12] Alvarez, D.; Vollmann, E.H. and von Andrian, U.H.: Mechanisms and consequences of dendritic
cell migration.
Immunity 29(3), 325-342, 2008,
http://dx.doi.org/10.1016/j.immuni.2008.08.006,
[13] Ignowski, J.M. and Schaffer, D.V.: Kinetic analysis and modeling of firefly luciferase as a
quantitative reporter gene in live mammalian cells.
Biotechnology and Bioengineering 86(7), 827-834, 2004,
http://dx.doi.org/10.1002/bit.20059,

A Computational Technique to Estimate Within-Host Productively Infected Cell Lifetimes ...
197
[14] Ye, C.; Abraham, S.; Wu, H.; Shanka, P.; and Manjunath, N.: Silencing early viral replication
in macrophages and dendritic cells effectively suppresses flavivirus encephalitis. PloS One 6(3), e17889, 2011,
http://dx.doi.org/10.1371/journal.pone.0017889,
[15] Appler, K.K. et al.: Persistence of west nile virus in the central nervous system and
periphery of mice. PLoS One 5(5), e10649, 2010,
http://dx.doi.org/10.1371/journal.pone.0010649,
[16] Welte, T. et al.: Toll-like receptor 7- induced immune response to cutaneous West Nile
virus infection.
Journal of General Virology 90(pt11), 2660–2668, 2011,
http://dx.doi.org/10.1099/vir.0.011783-0,
[17] Yang, C.C. et al.: Characterization of an efficientdengue virus replicon for development
of assays of discovery of small molecules against dengue virus. Antiviral Research 98(2), 228-241, 2013,
http://dx.doi.org/10.1016/j.antiviral.2013.03.001,
[18] Banerjee, S.: Optimal Strategies for Virus Propagation. preprint arXiv:1512.00844 [q-bio.CB], 2015,
[19] Banerjee, S.: Scaling in the Immune System. Ph.D. Thesis. University of New Mexico, Albuquerque, 2013,
[20] Banerjee, S. and Moses, M.: Scale invariance of immune system response rates and times:
perspectives on immune system architecture and implications for artificial immune
systems. Swarm Intelligence 4(4), 301-318, 2010,
http://dx.doi.org/10.1007/s11721-010-0048-2,
[21] Levin, D. et al.: A spatial model of the efficiency of T cell search in the influenza-infected lung.
Journal of Theoretical Biology 398, 52-63, 2016,
http://dx.doi.org/10.1016/j.jtbi.2016.02.022,
[22] Banerjee, S.: Analysis of a Planetary Scale Scientific Collaboration Dataset Reveals
Novel Patterns. preprint arXiv:1509.07313 [cs.SI], 2015,
[23] Banerjee, S.: An Immune System Inspired Approach to Automated Program Verification. preprint arXiv:0905.2649 [cs.NE], 2009,
[24] Banerjee, S. and Moses, M.: Immune System Inspired Strategies for Distributed Systems. preprint arXiv:1008.2799 [cs.DC], 2010,
[25] Banerjee, S.; Levin, D.; Moses, M.; Koster, F. and Forrest, S.: The value of inflammatory
signals in adaptive immune responses. In: Lio, P.; Nicosia, G. and Stibor, T., eds.: Artificial Immune Systems. 10
th International
Conference. Springer, Berlin & Heidelberg, 2011,
http://dx.doi.org/10.1007/978-3-642-22371-6,
[26] Banerjee, S.: A Stage Structured Hybrid Model for Disease Dynamics Modelling. The 2nd Annual Cybersecurity Early Careers Researchers Symposium, University of Oxford,
Oxford, 2016,
http://dx.doi.org/10.13140/RG.2.2.13054.79683,
[27] Banerjee, S. and Hecker, J.: A Multi-Agent System Approach to Load-Balancing and
Resource Allocation for Distributed Computing. Complex Systems Digital Campus 2015, World e-Conference, Conference on Complex Systems, 2015,
[28] Moses, M. and Banerjee, S.: Biologically Inspired Design Principles for Scalable,
Robust, Adaptive, Decentralized Search and Automated Response (RADAR). Proceedings of the 2011 IEEE Conference on Artificial Life, pp.30-37, 2011,
http://dx.doi.org/10.1109/ALIFE.2011.5954663,

S. Banerjee
198
[29] Banerjee, S. and Moses, M.: A hybrid agent based and differential equation model of
body size effects on pathogen replication and immune system response. In: Andrews, P.S. et al.: Artificial Immune Systems. 8th International Conference, ICARIS,
Lecture Notes in Computer Science. Springer Verlag, Berlin, 2009,
[30] Banerjee, S.; van Hentenryck, P. and Cebrian, M.: Competitive dynamics between
criminals and law enforcement explains the super-linear scaling of crime in cities. Palgrave Communications 1(15022), 2015,
http://dx.doi.org/10.1057/palcomms.2015.22,
[31] Liu, P. et al.: A Bioorthogonal Small-Molecule- Switch System for Controlling Protein
Function in Live Cells. Angewandte Chemie – International Edition 53(38), 2014,
http://dx.doi.org/10.1002/anie.201403463,
[32] Balch, C. et al.: Science and technology consortia in U.S. biomedical research: a
paradigm shift in response to unsustainable academic growth. BioEssays 37(2), 119-122, 2015,
http://dx.doi.org/10.1002/bies.201400167,
[33] Banerjee, S.: A Biologically Inspired Model of Distributed Online Communication
Supporting Efficient Search and Diffusion of Innovation. Interdisciplinary Description of Complex Systems 14(1), 10-22, 2016,
http://dx.doi.org/ 10.7906/indecs.14.1.2,
[34] Banerjee, S.: A Roadmap for a Computational Theory of the Value of Information in
Origin of Life Questions. Interdisciplinary Description of Complex Systems 14(3), 314-321, 2016,
http://dx.doi.org/ 10.7906/indecs.14.3.4.

Interdisciplinary Description of Complex Systems 15(3), 199-208, 2017
*Corresponding author, : [email protected]; +1 505 277 3122; 1Department of Computer Science, 1, University of New Mexico, Albuquerque, NM, 87131, USA
AUTOMATED INTERPRETABLE COMPUTATIONAL BIOLOGY IN THE CLINIC: A FRAMEWORK TO PREDICT DISEASE SEVERITY AND STRATIFY
PATIENTS FROM CLINICAL DATA
Soumya Banerjee*
University of Oxford Oxford, United Kingdom
Ronin Institute Montclair, United States of America
DOI: 10.7906/15.3.4 Regular article
Received: 7th September 2017.
Accepted: 6th October 2017.
ABSTRACT
We outline an automated computational and machine learning framework that predicts disease
severity and stratifies patients. We apply our framework to available clinical data. Our algorithm
automatically generates insights and predicts disease severity with minimal operator intervention. The
computational framework presented here can be used to stratify patients, predict disease severity and
propose novel biomarkers for disease. Insights from machine learning algorithms coupled with
clinical data may help guide therapy, personalize treatment and help clinicians understand the change
in disease over time. Computational techniques like these can be used in translational medicine in
close collaboration with clinicians and healthcare providers. Our models are also interpretable,
allowing clinicians with minimal machine learning experience to engage in model building. This work
is a step towards automated machine learning in the clinic.
KEY WORDS
disease severity prediction,machine learning, computational technique, big data
CLASSIFICATION
JEL: I19, C63

S. Banerjee
200
INTRODUCTION
The advent of big data and clinical records databases opens possibilities for clinical data science. Machine learning techniques coupled with clinical data is thought to be critical in delivering the next generation of healthcare [1].
Here we present an automated computational framework to derive insights from clinical data. The computational framework presented here can be used to stratify patients, predict disease severity and propose novel biomarkers for disease. Our approach automatically performs model inference, cross-validation, model selection and generates insights with minimal operator intervention. Our models are also interpretable, allowing domain experts like clinicians (with minimal machine learning experience) to engage in model building. Insights from machine learning algorithms coupled with clinical data may help guide therapy, personalize treatment and help clinicians understand the change in disease over time. Our approach is a step towards automated machine learning and computational biology in the clinic.
METHODS
We have developed an automated machine learning framework that performs predictions with minimal operator intervention. First, we perform feature scaling to ensure that all input features are on the same scale. We then look at a suite of different machine learning techniques like neural networks, random forests, regularized generalized linear model (logistic regression) with LASSO (least absolute shrinkage and selection operator), support vector machines, linear regression and principal components analysis. Crucially, we perform inference, cross-validation, model selection and insight generation with minimal operator intervention.
DATA
We used data from the UCI machine learning repository (Wisconsin breast cancer dataset, which are available for download from [2]), [3, 4]. The dataset consists of 699 patients divided into healthy and patients with breast cancer. The disease status is reported as benign or malignant. The different attributes measured were clump thickness, uniformity of cell size, uniformity of cell shape, marginal adhesion, single epithelial cell size, bare nuclei, bland chromatin, normal nucleoli and mitoses. All predictors are numeric (there are no categorical predictors) and were scaled to be within a range of 0 to 10. We replaced missing values with a 0. Future work will look at schemes to impute these values. Finally, we split the data into training, cross-validation and test sets.
RESULTS
STRATIFYING PATIENTS
We used principal component analysis (PCA) to gain insights into the clinical data. The PCA analysis suggests that there are a few clusters that the data can be separated into (Figure 1 and Figure 2). Single epithelial cell size and uniformity of cell shape seem to separate the data into distinct clusters (Figure 2). The attribute mitoses seem to account for many outliers (Figure 2).
We note that the first principal component explains about 65 % variance in the data (Figure 3).
Finally, the PCA analysis suggests the most extreme points in the data (outliers). Five patients with codes 1123061, 1198128, 1147748, 1165926 and 760001 are predicted to be outliers. For example, patients coded as 1123061 and 76001 have a very low value (< 3) for the uniformity of cell shape. Patient coded as 760001 has a very low value of mitoses (value of 1 on a scale of 1 to 10). All patients predicted to be outliers also have low values of the attribute bare nuclei. This kind of analysis can be used to stratify patients.

Automated interpretable computational biology in the clinic: a framework to predict disease...
201
Figure 1. Principal components analysis of data. Analysis shows a few clusters for the first
two principal components.
Figure 2. Principal components analysis of the data showing clusters for the first two
principal components.

S. Banerjee
202
Figure 3. Percentage of variation explained by each principal component in a PCA.
PREDICTING DISEASE SEVERITY
We predict disease severity or probability of getting the disease using a suite of different
machine learning algorithms. We looked at artificial neural networks (Figure 4) which are
composed of an input layer of features, hidden layers and an output layer that predicts disease
severity (on a scale of 0 to 1). We varied the number of hidden layers from 1 to 100. A neural
network with 10 hidden layers was found to give the best performance (mean squared error
eqal to 0,01) as shown in Figure 5 and Figure 6.
We also used random forests which are collections of trees. Each tree can be interpreted as a
set of rules that suggest how to combine the attributes to predict a disease severity. A forest is
a collection or ensemble of such trees. We varied the leaf size from 5 to 100 and the number
of trees that are grown from 1 to 50 (Figure 7). The best random forest model achieved a
cross-validation mean squared error of 0,04.
Figure 4. Architecture of neural network used to predict disease severity. The network shown
has an input layer, 30 hidden layers and an output layer.

Automated interpretable computational biology in the clinic: a framework to predict disease...
203
Figure 5. Neural network performance on training, validation and test dataset with 30 hidden layers.
Figure 6. Neural network performance on training, validation and test dataset with 10 hidden layers.

S. Banerjee
204
Figure 7. Performance of a random forest algorithm (out of bag prediction error). The leaf
sizes are varied from 5 to 100 and up to 50 trees are grown.
Representative trees used for predicting disease severity are shown in Figure 8 (regression)
and Figure 9 (classification). Random forests are very interpretable. For example, the tree
shown in Figure 9 is very interpretable since it represents a rule of the form:
IF [(single epithelial cell size 2,5) AND (uniformity of cell shape < 1,5)] THEN healthy (1)
Figure 8. A representative tree from the random forest used in predicting disease severity
(regression).

Automated interpretable computational biology in the clinic: a framework to predict disease...
205
Figure 9. A representative tree from the random forest used in predicting disease severity
(classification).
Insights from interpretable machine learning algorithms like random forests can inform
decisions in the clinic. The top predictors in random forests are shown in Figure 10.
Uniformity of cell size (2nd
feature) and bare nuclei (6th
feature) are important predictors.
Mitoses (9th
feature) is the least important predictor. We note however that mitoses separates
two different clusters in the PCA plot (Figure 2) and may be useful as a biomarker.
We note that even though artificial neural networks have the best performance
(cross-validation mean squared error = 0,01 for neural networks; cross-validation mean
squared error = 0,04 for random forests), the most interpretable models are random forests.
We also used a logistic regression model with LASSO (L1 regularization). We performed
10-fold cross validation to determine the regularization parameter (Figure 11). We found that
Figure 10. Top predictors in a random forest algorithm.

S. Banerjee
206
Figure 11. A plot of the effect of changing the regularization parameter (lambda) in a logistic
regression model with LASSO (L1 regularization). The cross-validation error is used to find
the optimal value of lambda.
all predictors are non-zero after cross-validation. Hence the logistic regression model
suggests that all the predictors are important.
Finally, we also looked at linear regression models for correlations of attributes with each
other (within patients). We did not observe any meaningful relationships.
BIOMARKERS
The predictors uniformity of cell shape and single epithelial cell size separate the data into a
few different clusters in the PCA plot (Figure 2). Mitoses separates the data into a third
cluster in the PCA plot (Figure 2). Bare nuclei is an attribute that accounts for some outliers
in the PCA analysis (see Section 4.1 Stratifying Patients).
Our random forest algorithm suggests that the top predictors are uniformity of cell size and
bare nuclei (Figure 10). Taken together, we suggest that uniformity of cell size and bare
nuclei maybe important biomarkers for disease.
DISCUSSION AND CONCLUSION
Big data technologies coupled with massive clinical records databases opens possibilities for
data science in the clinic. Machine learning techniques coupled with clinical big data are
thought to be critical in delivering the next generation of healthcare [2].
Here we present an automated machine learning framework that generates insights from
clinical data with minimal operator intervention. The computational framework presented
here can be used to stratify patients, predict disease severity and propose novel biomajkers
for disease. This can be used to guide therapy and intervention in the clinic.

Automated interpretable computational biology in the clinic: a framework to predict disease...
207
We use a suite of machine learning algorithms to predict disease severity and stratify patients.
We found that a PCA analysis combined with random forests can suggest biomarkers and
ways to stratify patients. Our analysis suggests that uniformity of cell size and bare nuclei
maybe important biomarkers for disease.
Even though artificial neural networks have better performance predicting disease severity
than random forests, the most interpretable models are random forests. This is critical in
communicating these insights to clinicians and healthcare professionals who may not be
machine learning experts. We show a representative rule from a tree in a random forest
(Figure 9) which takes the form (1).
Insights from interpretable machine learning algorithms like random forests can be very
informative to clinicians. Our framework automatically performs model inference, cross-
validation, model selection and generates insights into data with minimal operator
intervention. Our models are also interpretable, allowing domain experts like clinicians (with
minimal machine learning experience) to engage in model building. Coupling automated and
interpretable machine learning techniques with clinical data may help guide therapy,
personalize treatment and help clinicians understand the change in disease over time.
Our approach can be combined with multi-scale models [5-9]. Hybrid modelling approaches
can be combined with machine learning techniques presented in the current work to gain
mechanistic insights into disease, as has done previously for infectious diseases [10-12].
In summary, we present an automated and interpretable machine learning framework for
generating insights. We demonstrate how this computational framework can be applied to
clinical data. Computational techniques like these can be used in translational medicine in
close collaboration with clinicians and healthcare providers. Our approach is a step towards
automated machine learning and computational biology in the clinic.
ACKNOWLEDGEMENTS
The author wishes to thank Joyeeta Ghose, Dr. Beverly Kloeppel and Dr. Stephen Haben for
fruitful discussions.
REFERENCES
[1] Clifton, D.A.; Gibbons, J.; Davies, J. and Tarassenko, L.: Machine learning and software
engineering in health informatics. First International Workshop on Realizing AI Synergies in Software Engineering (RAISE). IEEE,
Zürich, 2012,
http://dx.doi.org/10.1109/RAISE.2012.6227968,
[2] –: Breast Cancer Wisconsin (original) Data Sets. https://archive.ics.uci.edu/ml/datasets/Breast+Cancer+Wisconsin+%28Original%29,
[3] Wolberg, W.H. and Mangasarian, O.L.: Multisurface method of pattern separation for
medical diagnosis applied to breast cytology. Proceedings of the National Academy of Sciences of the United States of America 87(23), 9193-9196, 1990,
[4] Zhang, J.: Selecting typical instances in instance-based learning. In: Proceedings of the Ninth International Machine Learning Conference, pp.470-479, Aberdeen, 1992,
[5] Banerjee, S. and Moses, M.: A hybrid agent based and differential equation model of
body size effects on pathogen replication and immune system response. In: Andrews, P.S. et al., eds., Artificial Immune Systems, 8
th International Conference, ICARIS,
Lecture Notes in Computer Science. Springer Verlag, Berlin, 2009,
[6] Banerjee, S.: Scaling in the Immune System. Ph.D. Thesis. University of New Mexico, Albuquerque, 2013,

S. Banerjee
208
[7] Banerjee, S. and Hecker, J.: A Multi-Agent System Approach to Load-Balancing and
Resource Allocation for Distributed Computing. preprint arXiv:1509.06420 [cs.NE], 2015,
[8] Banerjee, S. and Moses, M.: Scale invariance of immune system response rates and times:
perspectives on immune system architecture and implications for artificial immune systems. Swarm Intelligence 4(4), 301-318, 2010,
http://dx.doi.org/10.1007/s11721-010-0048-2,
[9] Banerjee, S. et al.: Estimating Biologically Relevant Parameters under Uncertainty for
Experimental Within-Host Murine West Nile Virus Infection. Journal of the Royal Society Interface 13(117), 2016,
http://doi.org/10.1098/rsif.2016.0130,
[10] Banerjee, S.; Van Hentenryck, P. and Cebrian, M.: Competitive dynamics between
criminals and law enforcement explains the super-linear scaling of crime in cities. Palgrave Communications 1, No. 15022, 2015,
http://dx.doi.org/10.1057/palcomms.2015.22,
[11] Banerjee, S.: Analysis of a Planetary Scale Scientific Collaboration Dataset Reveals
Novel Patterns. preprint arXiv:1509.07313 [cs.SI], 2015,
[12] Banerjee, S.: Optimal Strategies for Virus Propagation. preprint arXiv:1512.00844 [q-bio.CB],2015.

Interdisciplinary Description of Complex Systems 15(3), 209-221, 2017
*Corresponding author, : [email protected]; +385 1 4642 000; *Faculty of Political Science of Zagreb University, Lepušićeva 6, HR – 10 000 Zagreb, Croatia
PREDICTING THE STRENGTH OF ONLINE NEWS FRAMES
Hrvoje Jakopović*
Faculty of Political Science, University of Zagreb Zagreb, Croatia
DOI: 10.7906/indecs.15.3.5 Regular article
Received: 9th July 2017.
Accepted: 23rd
October 2017.
ABSTRACT
Framing theory is one of the most significant approaches to understanding media and their potential
impact on publics. Leaving aside that fact, the author finds that publicity effects seem to be dispersed
and difficult to catch for public relations. This article employs a specific research design, which could
be applied to public relations practice, namely with a view to observing correlations between specific
media frames and individual frames. The approach is based on the typology of news frames. The
author attributes negative, positive and neutral determinants to the types of frames in his empirical
research. Online news regarding three transport organizations and the accompanying user comments
(identified as negative, positive and neutral) are analysed by means of the method of content and
sentiment analysis. The author recognizes user comments and reviews as individual frames that take
part in the creation of online image. Furthermore, he identifies the types of media frames as well as
individual frames manifested as image, and undertakes correlation research in order to establish their
prediction potential. The results expose the most frequently used types of media frames concerning
the transport domain. The media are keen to report through the attribution of responsibility frame, and
after that, through the economic frame and the conflict frame, but, on the other hand, they tend to
neglect the human interest frame and the morality frame. The results show that specific types of news
frames enable better prediction of user reactions. The economic frame and the human interest frame
therefore represent the most predictable types of frame.
KEY WORDS
framing theory, user comments, online news, transport, sentiment analysis
CLASSIFICATION
JEL: L82

H. Jakopović
210
INTRODUCTION
Measuring of PR effectiveness is important because it proves that public relations
professionals produce value for the organization. This value is not tangible and visible at first
sight. As contemporary public relations are above all strategic, the idea of measurement by
objectives has become a standard for different evaluation types. Many authors [2, 3] agree
that PR goals and outcomes are set on these levels:
1. Cognitive (refers to thoughts, opinions, consciousness) – it implies informing target
publics about a certain topic, stimulating thoughts, awakening the existence of an issue,
rising awareness
2. Affective (refers to emotions) – the activities are focused on shaping opinions and attitudes
and provoking emotional reactions concerning a certain issue
3. Conative (refers to behaviour and doing) – it includes encouraging behaviour of target
publics towards a certain direction.
In the context of media relations, public relations effectiveness should be measured primarily
on the cognitive level and on the affective level. The conative level is characterized by too
many interventions of different variables, which makes it hard to control. Therefore,
associating behaviour with media effects turns out to be more complex. Kim [4] explains that
it is necessary to correlate PR activities with financial benefits for the organization. It is
crucial to reach the bottom-line impact of public relations efforts which could be described
through reputation measurement and measurement of impact on income. Reputation is in this
light defined as an integrated symbolic and behavioural relationship between corporate PR
and target publics [4], while image is, according to [5] determined and lies on a symbolic
relationship between the organization and target publics, being thus a middle step for
reaching and measuring bottom-line impact of public relations. The image and extensively
reputation form an outcome for public relations and present an independent variable for
measuring PR impact on income (see also [6]). Marklein [7] points out that contemporary
public relations experts should take into account ‘reach’ (as a potential that content will be
seen by a certain number of users), ‘engagement’ (as user reaction to exposure) and
‘relevance’ (as content significance) for media metrics. The combination of these three
communication dimensions should provide meaningful results on PR outcomes rather than
just evaluating media coverage and reach. When it comes to PR outcomes, Macnamara
[8] gives an overview of terms used for PR and social media measurement in contemporary
practice: 1. ‘engagement’, 2. ‘influence’, 3. ‘impact’, 4. ‘awareness’, 5. ‘attitudes’, 6. ‘trust’,
7. ‘loyalty’, 8. ‘reputation’, 9. ‘relationships’, 10. ‘return on investment’ (ROI). From there
on, it is clear that standardization in public relations measurement is required for PR
professionals but also for the purpose of presenting the campaign results to the boards with
more clarity. As shown, there are various outcomes of PR campaigns that need to be
described more precisely. Zerfass's et al. [9] research shows that the diffusion of current
academic knowledge of PR methodology represents a weakness when it gets transferred into
PR practice. It is possible to conclude that standardization is necessary for PR research and
evaluation.
Kim [4] in his regression analysis found a statistically significant correlation between
reputation and organizational income. In the context of predicting consumer behaviour and
associating it with profit, it is necessary to discuss behavioural economics [10] and related
decision-making theories which can be useful for setting an evaluation model in public
relations. Behavioural economics deals with cognitive elements that can influence decision-
making and their relationship with certain behaviour. It can also be associated with

Predicting the strength of online news frames
211
contemporary ideas of neuroeconomics and neuromarketing. Jelić [11] mentions some of the
methods and tools that are used in neuromarketing: electroencephalography – monitoring of
the electrical impulses in the brain; positron emission tomography – scanning and measuring
various body functions; functional magnetic resonance – measures brain activity and brain
blood flow; eye tracking glasses – measures direction of the eye, openness of the pupil and
fixation length which can be correlated with different cognitive processes; physical
manifestations – breathing speed, heart rate, perspiration. Tversky [12] developed some of
the principles of behavioural economics by relying on the concept of framing.
Scheufele and Tewksbury [13] point out that framing is significantly different from agenda-
setting theory because it is focused on the representation of the story in the news and on the
influence it may have on the media consumers (see also [14-16]). The agenda-setting theory
is focused on what to think about, but not explicitly what to think of a certain issue [17]. On
the other hand, framing is a much more suitable theory for public relations professionals and
PR measurement because it assumes that the media framing (a certain news perspective in the
story) will affect and eventually change the individual frame of a media consumer on a
certain topic. The framing theory existence is necessary for the comprehension of the way
how individuals manage everyday situations and process information. The frame as a derivate
of framing theory represents a ’mental map‘ [18] which allows an individual to manage and
store experience. Framing theory is seen as a more refined version because it takes into
account change in opinion and attitude. Therefore, it is also known as ’second-level agenda-
setting‘ (as writen by McCombs, cited in [13]; p. 11). Raupp [19; p.4] points out that PR
effects in media relations are: “effects on the media presence of organizations and issues,
effects on the tone and framing of the coverage, and effects on organizational reputation”.
This research design relies on the types of media frames as presented in [1]. The centre of the
news release amounts to the media frame which gives its story a clear determinant and
purpose. It is possible to identify five types of frames used in media reporting [1]:
1. Conflict frame – this type of media frame emphasizes the conflict in the story between two
or more sides, whether they are individuals, groups or institutions. This approach is one of
the ways of drawing media consumers’ attention.
2. Human interest frame – it is the media frame which includes a human example and
emotion. The frame personalizes, dramatizes news and provokes emotion to keep interest
of media publics
3. Economic consequences frame – this frame includes media reports about an event, an issue
or a topic through economic indicators and consequences for an individual, a group, an
institution or a country. It is a frame that puts finance in the centre as an element for
attracting publics.
4. Morality frame – it is a type of media frame which puts an event, an issue or a topic in the
context of religious and moral principles. In regard to the journalism principle of
objectivity in reporting, this frame is recognized in statements of various sources of
information.
5. Attribution of responsibility frame – the media frame presents a topic in a way that assigns
responsibility for a cause of a problem to an individual, a group or the government or as a
solution.
There is a rise of news portals which attract various publics, with respect to growth in number
of users. Nowadays there is not a television or radio station, or even a newspaper without an
online edition or a modified news site. As the readership, viewership and listenership are
moving from traditional media towards social media, interactivity of the Web 2.0 became a
serious reason for transferring public relations online. Chung suggests that in interactive news
presentation there exist four styles:

H. Jakopović
212
1. Presentation of the news with the possibilities which allow users to experience news
through different options and modalities – for example, selecting and deselecting news
content
2. Presentation of the news with the possibilities of personalization and content shaping
3. Presentation of the news with the possibilities of modifying content in terms of adding
user's own comments and expressing opinions
4. Presentation of the news with the possibilities of interpersonal communication with other
users
This article is especially focused on user opinions and their comments as reactions to the
article published online. Furthermore, the sum of their opinions towards organizations in the
transport domain is interpreted as the online image or ’cyber image‘ [20]. The assumption is
that the transport domain is a very fruitful research matter because of frequent oscillations in
reporting caused by crises such as accidents, delays and weather. The question arises whether
it is possible to predict user reactions and handle the online image on the basis of online news
and the media frame involved. These findings could lead one step closer to associating public
relations efforts with financial value.
MATERIAL AND METHODS
RESEARCH OBJECTIVES
Identify and assess the media frames when reporting on Croatian organizations of the
transport domain on online news sites.
Assess user comments on online news sites as reactions to online media reports on Croatian
transport organizations.
Correlate media frames present in online new reports on Croatian transport organizations
with user comments expressed as online image variants.
RESEARCH QUESTIONS
Which media frames in online media reports on Croatian transport organizations are
represented more and which ones are represented less?
What is the online image of Croatian transport organizations among users of online news
sites?
What is the correlation between the media frames in online reports on Croatian transport
organizations and their online image?
HYPOTHESIS
The existence of a moderate-strong positive correlation between media frames present when
reporting about transport and user comments on online news sites – this hypothesis is tested
on the examples of three Croatian organizations from the transport domain.
SAMPLE
The unit of analysis in this correlation research makes online news report (news release) on
Croatia Airlines (CA), Croatian Railways (HŽ) and Zagreb Electric Tram (ZET). For the
other correlate, the unit of analysis is one user comment which belongs to the online news
report on Croatia Airlines, Croatian Railways and Zagreb Electric Tram. The period of
analysis on online news sites 24sata.hr and Index.hr encompasses two years (from January 1,
2013 to December 31, 2014). The author selected this period with the intention to get
varieties of data (strikes, delays, accidents, negative financial situations that were present in

Predicting the strength of online news frames
213
that period of time). 24sata.hr and Index.hr online news sites are recognized as the ones with
highest user engagement as well as reach in that period of time. The simple random sample
was taken from the population consisting of all news releases dealing with Croatia Airlines,
Croatian Railways and Zagreb Electric Tram, which were published by the web portals
24sata.hr and Index.hr during the analysed period (from January 1, 2013 to December 31,
2014). The sample consists of at least 30 % of units of analysis which make the whole
population for each aforementioned transport organization (Croatia Airlines 2013/2014 –
N = 102; Croatian Railways 2013/2014 – N = 106; Zagreb Electric Tram 2013/2014 –
N = 106). The accompanying user comments were extracted on the basis of the expressed
opinion towards three transport organizations. Multiple comments of the same user in a single
online news release and other comments not concerning these organizations were isolated.
The user comments pertaining to a single news release were summed and presented through a
dominant represented opinion (image) – positive, negative or neutral. The number of user
comments varied in news releases. The overall sample of analysed comments is 3,068.
METHODS
The method of content analysis is used for identifying and assessing media frames within the
online news, while human sentiment analysis [21-23] was applied to user comments. Sentiment
(human) analysis in the context of public relations can be understood as “analysis of a comment
or post, aiming to determine the attitude of the speaker towards a brand or topic”. Moreover,
the sentiment analysis shows what “people feel about a subject or brand, often expressed in
simple terms as positive, negative or neutral”.
Media frames are identified in online news releases with the coding scheme based on [1]. There
is a possibility of the presence of more than one media frame in certain news releases, however
in this correlation research only the dominant frame is taken into consideration. The dominant
frames are identified by using a scale from 0 to 1 for positive answers (0 – without positive
answers; 1 – all positive answers). Two trained coders were engaged for conducting research.
The Holsti reliability test [24] was used on twenty randomly selected online news releases from
population and the achieved result was 0,89. Landis and Koch [25; p.165] suggest that inter-
coder reliability from 0,81 to 1,00 belongs to the category of almost perfect. The same test was
conducted on one hundred user comments from selected population with the result of 0,97.
Further disagreement between coders was discussed. Each of the identified media frame was
attributed as negative, positive and neutral. For providing trustworthiness of these attributes, the
categories on the scale from extremely positive to extremely negative were determined as
follows:
1. Extremely positive implies that three out of three entries are confirmed: there is no negative
journalist opinion towards organization; the information sources express a positive opinion
towards the organization; the reporting event is positive for the organization.
2. Positive implies that two from three entries are confirmed: there is no negative journalist
opinion towards organization; the information sources express positive opinion towards the
organization; the reporting event is positive for the organization.
3. Neutral implies that: there is no negative nor positive journalist opinion towards the
organization; the information sources do not express positive nor negative opinion towards
the organization; the reporting event is neither positive nor negative for the organization.
4. Negative implies that two out of three entries are confirmed: there is no positive journalist
opinion towards organization; the information sources express a negative opinion towards
the organization; the reporting event is negative for the organization.

H. Jakopović
214
5. Extremely negative implies that three out of three entries are confirmed: there is no positive
journalist opinion towards the organization; the information sources express a negative
opinion towards the organization; the reporting event is negative for the organization.
VARIABLES
In this research the correlation is determined between:
The predictor variable – dominant media frame in online news reports by 24sata.hr and
Index.hr on Croatia Airlines, Croatian Railways and Zagreb Electric Tram. Media frames are
attributed as positive, negative and neutral and categorized as follows: 1. Conflict frame, 2.
Human interest frame, 3. Economic consequences frame, 4. Morality frame 5. Attribution of
responsibility frame.
The criterion variable – user comments accompanying the online news reports by 24sata.hr and
Index.hr on Croatia Airlines, Croatian Railways and Zagreb Electric Tram. User comments are
determined as positive, negative and neutral online image.
The correlation will be determined with the Pearson's coefficient on the interval from -1 to 1.
A positive value of the correlation coefficient shows variable change in the same direction,
(for predictor and criterion variables), on the other side a negative correlation coefficient
indicates the opposite directions of prediction and criterion variables.
The correlation will be determined with the Pearson’s coefficient on the interval from -1 to 1.
A positive value of the correlation coefficient shows variable change in the same direction,
(for predictor and criterion variables), on the other side a negative correlation coefficient
indicates the opposite directions of prediction and criterion variables.
RESULTS
In their research Semetko and Valkenburg [1] analysed in what way the media reported on
European politics and their findings showed that most of the news were framed through
attribution of responsibility, conflict, economic consequences, human interest and, in the end,
morality. The results in this primary research show a certain pattern or matching in media
reporting. The application of the foregoing principle when applied to the transport domain, as
exemplified by the three transport organizations, is presented mostly through attribution of
responsibility (39 %), economic consequences (29 %), conflict (18 %), human interest (12 %)
and morality (2 %) (Figure 1).
The presence of media frames when reporting on transport indicates that there are different
media approaches concerning these organizations. The reports are specific for each
organization (Table 1).
In the reports on Croatia Airlines the frame of economic consequences is the most frequent
(34 %), illustrated in the article “For the First Time in Five Years: Croatia Airlines Runs Without
Loss” (24sata.hr, 16.2.2014). This article reports positively on the profit of almost 670 000 kuna1
for Croatia Airlines, and turnover in comparison with the year 2011 when the loss was 488,17
million kuna. Frame of economic consequences was attributed also negatively in the example
“Slavko Linić2
Cuts of Salaries” (24sata.hr, 4.11.2013) where Croatia Airlines losses in past
years and high directors’ salaries in state firms are mentioned. In addition, a similar example of
the negative economic frame is the article entitled “Croatia Airlines in First Six Months Had a
Loss of 37,7 Millions” (Index.hr, 29.7.2014).
The conflict frame (23 %) is the second most frequent in the case of CA. This kind of reports is
mostly associated with the employees strike and dispute with the board of directors in CA,
which is confirmed by the following example: “Union vs. Board: In Croatia Airlines Attitudes
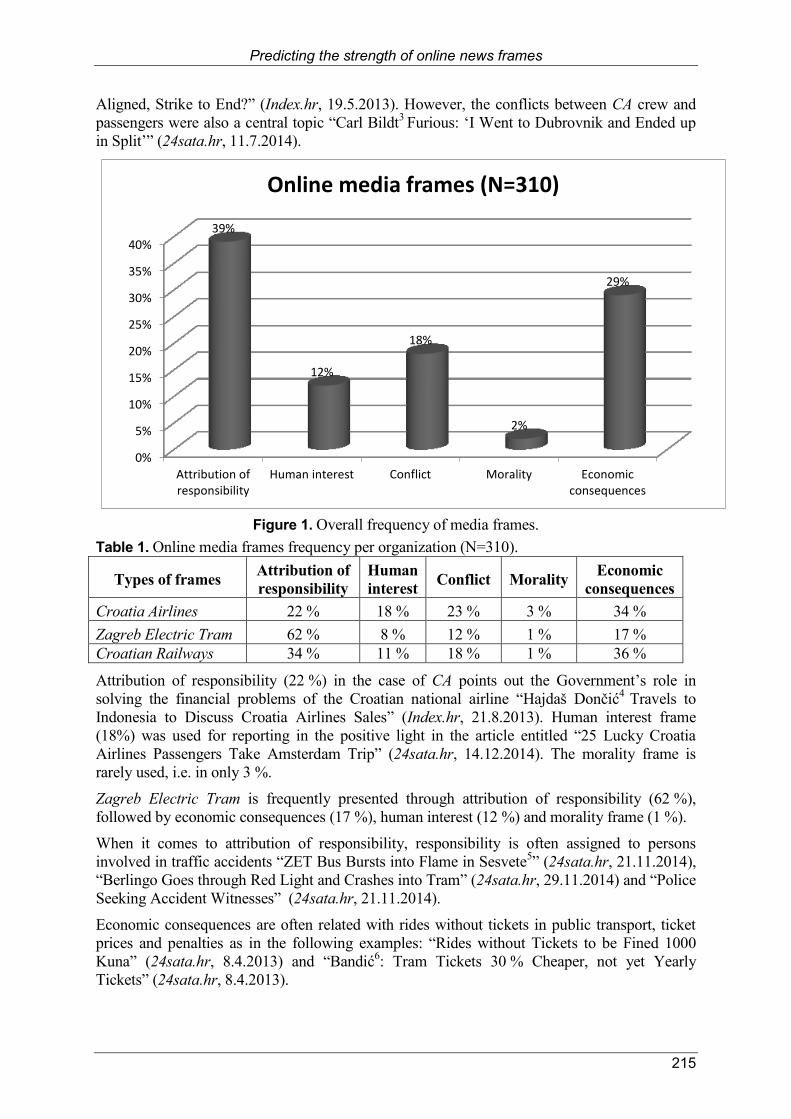
Predicting the strength of online news frames
215
Aligned, Strike to End?” (Index.hr, 19.5.2013). However, the conflicts between CA crew and
passengers were also a central topic “Carl Bildt3 Furious: ‘I Went to Dubrovnik and Ended up
in Split’” (24sata.hr, 11.7.2014).
0%
5%
10%
15%
20%
25%
30%
35%
40%
Attribution ofresponsibility
Human interest Conflict Morality Economicconsequences
39%
12%
18%
2%
29%
Online media frames (N=310)
Figure 1. Overall frequency of media frames.
Table 1. Online media frames frequency per organization (N=310).
Types of frames Attribution of
responsibility
Human
interest Conflict Morality
Economic
consequences
Croatia Airlines 22 % 18 % 23 % 3 % 34 %
Zagreb Electric Tram 62 % 8 % 12 % 1 % 17 %
Croatian Railways 34 % 11 % 18 % 1 % 36 %
Attribution of responsibility (22 %) in the case of CA points out the Government’s role in
solving the financial problems of the Croatian national airline “Hajdaš Dončić4
Travels to
Indonesia to Discuss Croatia Airlines Sales” (Index.hr, 21.8.2013). Human interest frame
(18%) was used for reporting in the positive light in the article entitled “25 Lucky Croatia
Airlines Passengers Take Amsterdam Trip” (24sata.hr, 14.12.2014). The morality frame is
rarely used, i.e. in only 3 %.
Zagreb Electric Tram is frequently presented through attribution of responsibility (62 %),
followed by economic consequences (17 %), human interest (12 %) and morality frame (1 %).
When it comes to attribution of responsibility, responsibility is often assigned to persons
involved in traffic accidents “ZET Bus Bursts into Flame in Sesvete5” (24sata.hr, 21.11.2014),
“Berlingo Goes through Red Light and Crashes into Tram” (24sata.hr, 29.11.2014) and “Police
Seeking Accident Witnesses” (24sata.hr, 21.11.2014).
Economic consequences are often related with rides without tickets in public transport, ticket
prices and penalties as in the following examples: “Rides without Tickets to be Fined 1000
Kuna” (24sata.hr, 8.4.2013) and “Bandić6: Tram Tickets 30 % Cheaper, not yet Yearly
Tickets” (24sata.hr, 8.4.2013).

H. Jakopović
216
The conflict frame is associated with the confrontation between ZET employees and
passengers: “Bus Driver Refuses to Open Front Doors, Passenger Attacks Him” (24sata.hr,
18.4.2013.). Human interest is used for positive ZET presentation as in example “They Paid
Tickets: Bride and groom Go to Wedding by Tram (24sata.hr, 31.10.2014).
When it comes to Croatian Railways, the frame of economic consequences is mostly
represented (36 %), following attribution of responsibility (34 %), conflict (18 %), human
interest (11 %) and morality frame (1 %).
Investments are often mentioned through the economic consequences as in the example “In the
Year 2014 the Investment Wave Worth 73 Billions Kuna is Starting” (24sata.hr, 12.12.2013),
but also negative financial results “Government Takes Over HŽ Debt of 1,77 Billion Kuna,
Housing Savings to be Boosted with 245 Kuna“ (Index.hr, 23.12.2014).
Attribution of responsibility often refers to the Croatian government and the ministry in
charge, which is responsible for solving HŽ problems: “Exhilarated Leko7: Best Fried
Chicken is in Railways“ (24sata.hr, 20.3.2014) and “Hajdaš Dončić AnnouncesRailway
Construction with EU Funds, Stanić Replies: It is Easy to Make Promises without
Responsibility“ (Index.hr, 22.10.2014).
The conflict frame is related to confrontations between the Croatian Government and HŽ
employees as in the example ”HŽ Cargo Workers Protested in Front of the Government and
Announced Strike: We Know How to Work, but You Don’t Know How to Manage”
(Index.hr, 27.2.2014). Human interest is used in negative HŽ presentation in the examples
such as “Train Full of Children Derails, but HŽ doesn’t Report Accident because ‘It is not
Important’” (24sata.hr, 19.7.2013). The article reports about “frightened” children and a
“calm” train driver.
While reporting on these three transport organizations (Table 2) through the conflict frame is
formed mostly negative presentation of organizations (79 %). The morality frame is the most
positive (60 %), but it is less frequent for making conclusions. Therefore, the human interest
frame should be considered as the most positive for organizations (40 %). Nevertheless, the
economic consequences frame is also partly positive for organizations (25 %). The attribution
of responsibility frame is mostly neutral for organizations (53 %). Table 2 shows that the
presentation of organizations in online news is predominantly negative.
Table 2. Organizational presentations in the online media frame.
Attribution values Positive Negative Neutral
Attribution of responsibility, N=122 13 % 34 % 53 %
Human interest, N=38 40 % 47 % 13 %
Conflict, N=54 4 % 79 % 17 %
Morality, N=5 60 % 20 % 20 %
Economic consequences, N=91 25 % 44 % 31 %
User comments are assessed as positive, negative and neutral. These online opinions represent
the organizational online image. They are actually direct reactions to online news and therefore
through the sum of user comments, for each news release, the dominant image is identified.
The most predictable frame is human interest (48 %) when it comes to identifying common
individual and media frames concerning positive image. The human interest frame is based on
the reports about satisfied passengers and employees. Secondly, the economic consequences
frame is also responsive in terms of positive reactions. It reports about positive financial results
and benefits for passengers. Nevertheless, statistical average (mean) shows that online image is

Predicting the strength of online news frames
217
dominantly negative for Croatian transport organizations (55,67 %) (Table 3), then follows the
neutral (37,3 %) online image and the positive one (7 %).
Table 3. Online image per media frame (N=310).
Attribution values Positive Negative Neutral
Organizational image through user comments 7 % 55,67 % 37,3 %
The correlation analysis determined the relationship between predictor and criterion variables
in the set of variables which refer to the evaluation of online news through media frames, as
predictor variables, and user comments (online image), as criterion variable.
The significance of correlation coefficient indicates the existence of the statistically significant
relationship between variables which are in this article observed on the level of 1 %. This
describes model representativeness with uncertainty of 1 % (p < 0,01).
The correlation of media frames and online image is shown in Table 4 and described with the
Pearson correlation coefficient r = 0,364. This is determined as a moderate-strong positive
correlation with uncertainty of 1 %. From these results it is possible to deem that the research
hypothesis is confirmed.
Table 4. The correlation between online media frames in the transport domain and online
organizational image.
Pearson Correlation (N=310)
Criterion Variable –
online organizational image
(user comments)
Coefficient Significance
Predictor Variable – online media frames in reports on CA, HŽ
and ZET 0,364 p < 0,001
The hypothesis is confirmed for the each transport organization included in this research. The
correlation of media frames on CA and CA online image shows a moderate-strong positive
relationship, r = 0,313, with uncertainty of 1% (Table 5).
Table 5. The correlation between online media frames on CA and CA online image.
Pearson Correlation (N=102)
Criterion Variable – CA
online image (user
comments)
Coefficient Significance
Predictor Variable – online media frames on CA 0,313 p < 0,001
The Pearson correlation coefficient r = 0,389 in the case of HŽ indicates also a moderate-strong
positive relationship on the level of 1 % (Table 6).
The highest correlation coefficient is marked in reports on ZET where the relationship between
media frames and online image is r = 0,402, with significance of 1 % (Table 7).
Table 6. The correlation between online media frames on HŽ and HŽ online image.
Pearson Correlation (N=106)
Criterion Variable – HŽ
online image (user
comments)
Coefficient Significance
Predictor Variable – online media frames on HŽ 0,389 p < 0,001

H. Jakopović
218
In regard to types of frames, the results show (Table 8) the highest correlation between the
economic consequences frame and online image, r = 0,375. This is a moderate-strong positive
relationship with significance of 1 %. The human interest frame comes second with the
correlation coefficient r = 0,372, which is a moderate-strong positive relationship on the level
of 1 %. The correlation coefficient of the attribution of responsibility frame is lower and
represents a weak positive relationship, r = 0,237, with the significance of 1%. In the end, the
conflict frame proved to be the most unreliable in predicting user reactions because of a weak
positive relationship (r = 0,160) and with an unsatisfactory significance.
Table 7. The correlation between online media frames on ZET and ZET online image.
Pearson Correlation (N=102)
Criterion Variable – ZET
online image (user
comments)
Coefficient Significance
Predictor Variable – online media frames on ZET 0,402 p < 0,001
Table 8. The correlation per frame with online organizational image.
Pearson Correlation (N=310)
Criterion Variable – Online
organizational image (user
comments)
Predictor Variable – online media frames Coefficient Significance
Morality 0,839 0,076
Attribution of responsibility 0,237 p < 0,001
Human interest 0,372 p < 0,005
Conflict 0,160 0,248
Economic consequences 0,375 p < 0,001
DISCUSSION
The implementation of framing theory in this research design was used for determining
frequency of five media frames [1] in online news reporting on transport organizations and also
for correlations between the media frames and user comments (online image). The results show
that the attribution of responsibility is the most frequently used frame and also the most neutral
for organizations. It is not surprising that the frame of economic consequences came second
considering that profit and the financial situation is one of the prerequisites for a positive or
negative organizational reputation. Soroka et al. [26] in his research shows that economic topics
provoke much stronger public response/reaction when there is negative information. The
conflict frame is the most negative for organizations and follows the trend of negativity in
mainstream media reporting. The human interest frame could be observed as very useful for
organizations because of an often-positive approach in reporting. We can assume that users are
keen to identify with persons involved in the reporting event and that kind of frame provokes
sympathy and other positive emotions associated with organizations. The morality frame is not
used in online media reporting and it seems that this approach does not sell news well enough.
This kind of frequency also suggests which values are emphasized in society.
The correlation analysis showed that certain frames allow prediction of user reactions. Thus,
the economic frame provides clear and precise data on business (positive or negative; growth or
drop of income) and consequently users often have homogeneous opinions in this respect. The
human interest frame proved to be good for predicting user reactions and the reason could be
the users’ identification with persons, satisfied employees and passengers, presented in the story.

Predicting the strength of online news frames
219
In the example of attribution of responsibility the correlation coefficient is lower and unreliable for predictions. We could interpret that responsibility in reporting is abstract and fluid. Responsibility could be dispersing and depending on various user perspectives. Their viewpoints in determining responsibility for certain issue could be different than in media report. The conflict frame provides an even lower prediction possibility. Users can also choose sides in confrontation and they are not necessary the same as in the media report. In the Croatian transport domain frequent confrontations refer to the following relationships:
employees-board, employees-passengers, employees-government. This study did not cover other domains (except transport) in media reporting. Therefore, this can be found as one of the limitations of the study.
CONCLUSION
The research results show that it is possible to predict user reactions through a framing theory model. This research gives an insight into the fact that certain online media frames have more strength than the others, especially economic and human interest frame. They are responsive with user reactions therefore these findings could be used in public relations practice for preparing online news releases and managing organizational image and reputation through media. Considering that evaluation and measurement in public relations is one of the imminent challenges, this research design offers a concept and idea for further development of a standardised evaluation model through the use of framing theory in media. As pointed by Hallahan (cited in [19]; p.5), “the establishment of common frames of reference is necessary for building successful relations”.
Nowadays every organization in the corporate sector should take into account the importance of planned communication and strategic media relations. Moreover, media studies are in
search for measurable connection between media and their effects on media publics, since there are many different variables that intervene in opinion-making process. These findings offer a viewpoint from where user comments, representing direct reactions to media content (news releases), are identified as a valuable PR and marketing research material for managing image and reputation, being thus very insightful for the creation of communication strategies within the organizations. Strategic framing should be taken seriously for media relations, as a part of corporate communication.
REMARKS 1The Croatian national currency. 2The then Croatian Minister of Finance. 3A Swedish politician and diplomat. 4The then Croatian Minister of Maritime Affairs, Transport and Infrastructure. 5Zagreb’s countryside. 6The then Mayor of Zagreb. 7The then Speaker of the Croatian Parliament.
REFERENCES
[1] Semetko, H.A. and Valkenburg, P.M.: Framing European Politics: A Content Analysis of Press and Television News. Journal of Communication 55(2), 93-109, 2000, http://dx.doi.org/10.1111/j.1460-2466.2000.tb02843.x,
[2] Stacks, D. and Michaelson, D.: A Practitioner's Guide to Public Relations Research, Measurement and Evaluation (Public Relations Collection). Business Expert Press, New York, 2010, http://dx.doi.org/10.4128/9781606491027,

H. Jakopović
220
[3] Anderson, F.W.; Hadley, L.; Rockland, D. and Weiner, M.: Guidelines For Setting
Measurable Public Relations Objectives: An Update. Institute for Public Relations, 2009,
http://painepublishing.com/wp-content/uploads/2014/04/Setting_PR_Objectives-1.pdf, accessed
21st Januar 2017,
[4] Kim, Y.: The Impact of Brand Equity and the Company's Reputation on Revenues. Journal of Promotion Management 6(1-2), 89-111, 2009,
http://dx.doi.org/10.1300/J057v06n01_09,
[5] Grunig, J.E.: Image and Substance: From Symbolic to Behavioral Relationships. Public Relations Review 19(2), 121-139, 1993,
http://dx.doi.org/10.1016/0363-8111(93)90003-U,
[6] Löwensberg, D.: Corporate image, reputation and identity. In Tench. R. and Yeomans. L., eds.: Exploring Public Relations. Pearson Education Limited,
Harlow, pp.237-251, 2009,
[7] Marklein, T.: Impressions Are A Sham: The Path to Better Media Metrics. Institute for Public Relations, 2016,
http://www.instituteforpr.org/impressions-are-a-sham-and-the-path-to-better-media-metrics,
accessed 20st
January 2017,
[8] Macnamara, J.: Emerging international standards for measurement and evaluation of
public relations: A critical analysis. Public Relations Inquiry 3(1), 7-29, 2014,
http://dx.doi.org/10.1177/2046147X14521199,
[9] Zerfass, A.; Verčič, D. and Volk, S. C.: Communication evaluation and measurement:
skills, practices and utilization in European organizations. Corporate Communications: An International Journal 22(1), 2-18, 2017,
http://dx.doi.org/10.1108/CCIJ-08-2016-0056,
[10] Kahneman, D. and Tversky, A.: Prospect Theory: An Analysis of Decision under Risk. Econometrica 47(2), 263-291, 1979,
http://dx.doi.org/10.2307/1914185,
[11] Jelić, N.: Behavioral Economics, Neuroeconomics, Neuromarketing. In Croatian. JAHR – European Journal of Bioethics 5(9), 193-209, 2014,
[12] Tversky, A. and Kahneman, D.: The Framing of Decisions and the Psychology of
Choice. Science 211(4481), 453-458, 1981,
http://dx.doi.org/10.1126/science.7455683,
[13] Scheufele, A.D. and Tewksbury D.: Framing, Agenda Setting, and Priming: The
Evolution of Three Media Effects Models. Journal of Communication 57(1), 9-20, 2007,
http://dx.doi.org/10.1111/j.0021-9916.2007.00326.x,
[14] Froehlich, R. and Rűdiger B.: Framing political public relations: Measuring success of
political communication strategies in Germany. Public Relations Review 32, 18-25, 2006,
http://dx.doi.org/10.1016/j.pubrev.2005.10.003,
[15] de Vreese, C.H.: News framing: Theory and typology. Information Design Journal 13(1), 51-62, 2005,
http://dx.doi.org/10.1075/idjdd.13.1.06vre,
[16] Hallahan, K.: Seven Models of Framing: Implications for Public Relations. Journal of Public Relations Research 11(3), 205-242, 1999,
http://dx.doi.org/10.1207/s1532754xjprr1103_02,
[17] Cohen, B.: The press and foreign policy. Harcourt, New York, 1963,
[18] Goffman E.: Frame analysis: An essay on the organization of experience. Northeastern University Press, Boston, 1974,

Predicting the strength of online news frames
221
[19] Raupp, J.: Public Relations: Media Effects The International Encyclopedia of Media
Effects. http://onlinelibrary.wiley.com/doi/10.1002/9781118783764.wbieme0132/full, accessed 10
th February
2017,
[20] Stacks, D.W.: Primer of Public Relations Research. Guilford Press, New York, 2011,
[21] Jakopović, H. Detecting the Online Image of “Average” Restaurants on TripAdvisor. Medijske studije 7(13), 102-119, 2016,
[22] Makarem, S.C. and Jae, H.: Consumer Boycott Behavior: An Exploratory Analysis of
Twitter Feeds. The Journal of Consumer Affairs Spring 50(1), 193-223, 2016,
http://dx.doi.org/10.1111/joca.12080,
[23] Minazzi, R.: Social Media Marketing in Tourism and Hospitality. Springer International Publishing, 2015,
http://dx.doi.org/10.1007/978-3-319-05182-6,
[24] Holsti, O.: Content analysis for the social sciences and humanities. Addison-Wesley, Reading, 1969,
[25] Landis, J.R and Koch, G.G.: The measurement of observer agreement for categorical
data. Biometrics 33(1), 159-174, 1977,
http://dx.doi.org/10.2307/2529310,
[26] Soroka, S.; Young, L. and Balma, M.: Bad News or Mad News? Sentiment Scoring of
Negativity, Fear, and Anger in News Content. American Academy of Political and Social Science 659(1), 108-121, 2015,
http://dx.doi.org/10.1177/0002716215569217.

Interdisciplinary Description of Complex Systems 15(3), 222-227, 2017
*Corresponding author, : [email protected]; +36 62 546-509; *University of Szeged, Faculty of Engineering, 6724 Szeged, Mars tér 7., Hungary
AUTONOMOUS WHEELED MOBILE ROBOT CONTROL
Janos Simon*
University of Szeged – Faculty of Engineering Szeged, Hungary
DOI: 10.7906/indecs.15.3.6 Regular article
Received: 23rd
August 2017. Accepted: 16
th September 2017.
ABSTRACT
The autonomous wheeled mobile robots are very interesting subject both in scientific research and
practical applications. The article deals with the fuzzy control of autonomous wheeled mobile robotic
platform motion in an unstructured environment with obstacles. The simulation results show the
effectiveness and the validity of the obstacle avoidance behaviour in unstructured environments and
the velocity control of a wheeled mobile robotic platform motion of the proposed fuzzy control
strategy.
KEY WORDS
autonomous wheeled mobile robots, fuzzy control strategy, unstructured environments, obstacles,
simulation results
CLASSIFICATION ACM: D.1.1.
JEL: L64

Autonomous wheeled mobile robot control
223
INTRODUCTION
A wheeled mobile robot is a vehicle which is capable of an autonomous motion. The
autonomous wheeled mobile robots are very interesting subject both in scientific research and
practical applications [1-3].
Figure 1. show the recent situation and the future of the market size of the personal and
service robots (source: Japan Robotics Association).
Figure 1. Market size of the personal and service robots.
The article deals with the fuzzy velocity control of an autonomous wheeled mobile robots
motion in an unstructured environment with obstacles [4-9]. This article presents how to
control of motion and velocity of wheeled mobile robots in an unstructured environment that
contains obstacles with using ultrasonic sensors and a stereovision system.
The simulation results show the effectiveness and the validity of the obstacle avoidance
behaviour in unstructured environment and velocity control of a wheeled mobile robot
motion of the proposed fuzzy control strategy.
The article is organized as follows:
Section 1: Introduction.
Section 2: The structure of the general indoor/outdoor applications of mobile robots.
Section 3: Control strategy for wheeled mobile robots.
Section 4: Simulation results.
Section 5: Conclusions.

J. Simon
224
THE STRUCTURE OF THE GENERAL INDOOR/OUTDOOR APPLICATIONS OF MOBILE ROBOTS
The structure of the general indoor/outdoor applications of autonomous mobile robots are
presented in Table 1 and Table 2.
Table 1. Indoor applications of mobile robots.
Indoor/Structured Environments
Cleaning large buildings
Transportation industry and service
Research entertainment
Surveillance buildings
Customer support museums, shops
Table 2. Outdoor applications of mobile robots.
Outdoor/Unstructured Environments
Agriculture
Forest
Space
Underwater
Military
Fire fighting
Sewage tubes
Mining
CONTROL STRATEGY FOR WHEELED MOBILE ROBOTS
In this section fuzzy control is applied to the navigation of the autonomous wheeled mobile
robotic platform in unstructured environments with obstacles and slopes [10-15].
It is supposed that: the autonomous wheeled mobile robotic platform has two wheels driven
independently and groups of ultrasonic sensors to detect obstacles in the front, to the right
and to the left of the autonomous wheeled mobile robotic platform.
When the autonomous wheeled mobile robotic platform is moving towards the target and the
sensors detect an obstacle, an avoiding strategy is necessary.
While the autonomous wheeled mobile robotic platform is moving it is important to
compromise between:
avoiding the obstacles and
moving towards the target position.
With obstacles present in the unknown environment, the autonomous wheeled mobile robotic
platform reacts based on both the sensed information of the obstacles and the relative position
of the target [16-23].
In moving towards the target and avoiding obstacles, the autonomous wheeled mobile robotic
platform changes its orientation and velocity.
When an obstacle in an unknown environment is very close, the mobile robot slows down
and rapidly changes its orientation. The navigation strategy has to come as near to the target
position as possible while avoiding collision with the obstacles in an unknown environment.

Autonomous wheeled mobile robot control
225
The block diagram of the fuzzy inference system is presented in Figure 2.
In the present implementation of the fuzzy controller the Center of Area method of
defuzzification is used.
Figure 2. The block diagram of the fuzzy inference system.
SIMULATION RESULTS
The author applied the proposed fuzzy controller to the autonomous wheeled mobile robotic
platform moving in an unstructured environment with obstacles. The control strategy was
tested through simulations of wheeled mobile robot motion [24-27]. A simulation example of
a wheeled autonomous mobile robotic platform is presented in Figure 3. The corresponding
fuzzy control is implemented to perform tasks of obstacle and collision avoidance. In
particular, the navigation strategy proved to be extremely sensitive to the balance between
avoid obstacle and reach the target behaviors. Simulation results are shown in Figure 3.
Figure 3. Obstacle avoidance trajectory of wheeled mobile robot platform.
CONCLUSIONS
The article deals with the fuzzy control of autonomous wheeled mobile robotic platform
motion in an unstructured environment with obstacles. The simulation results show the
effectiveness and the validity of the obstacle avoidance behaviour in unstructured
environments and the velocity control of a wheeled mobile robotic platform motion of the
proposed fuzzy control strategy.
Wheeled mobile robot navigation strategies using fuzzy logic have major advantages over
analytical methods also simulation results recommends fuzzy logic controller for the wheeled
mobile robot motion in unstructured environments.
J. Simon
226
REFERENCES
[1] Simon, J. and Martinović, G.: Navigation of Mobile Robots Using WSN’s RSSI
Parameter and Potential Field Method. Acta Polytechnica Hungarica 10(4), 107-118, 2013,
[2] Simon, J.: Concepts of the Internet of Things from the Aspect of the Autonomous Mobile
Robots. Interdisciplinary Description of Complex Systems 13(1), 34-40, 2015,
http://dx.doi.org/10.7906/indecs.13.1.5,
[3] Simon, J.: Optimal Microclimatic Control Strategy Using Wireless Sensor Network and
Mobile Robot. Acta Agriculturae Serbica XVIII(36), 3-12, 2013,
[4] Mester, G.: Wireless Sensor-based Control of Mobile Robots Motion. Proceedings of the IEEE 7th International Symposium on Intelligent Systems and Informatics,
September 25-26, 2009. Subotica, pp.81-84, 2009,
http://dx.doi.org/10.1109/SISY.2009.5291190,
[5] Mester, G.; Pletl, S.; Pajor, G. and Basic, D.: Adaptive Control of Rigid-Link Flexible-
-Joint Robots. Proceedings of 3
rd International Workshop of Advanced Motion Control, March 20-23, 1994.
Berkeley, pp.593-602, 1994,
[6] Mester, G.: Neuro-Fuzzy-Genetic Trajectory Tracking Control of Flexible Joint Robots. Proceedings of the I ECPD International Conference on Advanced Robotics and Intelligent
Automation, 1995. Athens, pp.93-98, 1995,
[7] Mester, G.; Pletl, Sz.; Pajor, G. and Rudas, I.: Adaptive Control of Robot Manipulators
with Fuzzy Supervisor Using Genetic Algorithms. In Kaynak, O., ed.: Proceedings of International Conference on Recent Advances in Mechatronics,
August 14-16, 1995. Bogazici University Bebek, Istanbul, pp.661-666, 1995,
[8] Mester, G.; Pletl, S.; Pajor, G. and Jeges, Z.: Flexible Planetary Gear Drives in Robotics. Proceedings of the 1992 International Conference on Industrial Electronics, Control,
Instrumentation and Automation – Robotics, CIM and Automation, Emerging Technologies,
IEEE IECON ‘92, Vol. 2. November 9-13, 1992. San Diego, pp.646-649, 1992,
http://dx.doi.org/10.1109/iecon.1992.254556,
[9] Kasac, J.; Milic, V.; Stepanic, J. and Mester, G.: A Computational Approach to Parameter
Identification of Spatially Distributed Nonlinear Systems with Unknown Initial Conditions. Proceedings of the IEEE Symposium on Robotic Intelligence in Informationally Structured
Space RiiSS, Vol. 1. December 9-12, 2014. Orlando, pp.55-61, 2014,
http://dx.doi.org/10.1109/RIISS.2014.7009170,
[10] Rodic, A.; Mester, G. and Stojković, I.: Qualitative Evaluation of Flight Controller
Performances for Autonomous Quadrotors. In Pap, E., ed.: Intelligent Systems: Models and Applications. Topics in Intelligent Engineering
and Informatics Vol. 3, Part 2. Springer-Verlag, Berlin & Heidelberg, pp.115-134, 2013,
http://dx.doi.org/10.1007/978-3-642-33959-2_7,
[11] Mester, M. and Rodic, A.: Autonomous Locomotion of Humanoid Robots in Presence of
Mobile and Immobile Obstacles. In Rudas, I.J.; Fodor, J. and Kacprzyk, J., eds.: Studies in Computational Intelligence, Towards
Intelligent Engineering and Information Technology. Part III Robotics, Volume 243/2009.
Springer-Verlag, Berlin & Heidelberg, pp.279-293, 2009,
http://dx.doi.org/10.1007/978-3-642-03737-5_20,
[12] Rodic, A,; Mester, G. and Stojkovic, I.: Navigation and Control of Indoor Mobile Robot
in Unknown Environments. Proceedings of the 56
th ETRAN Conference, Society for Electronics, Telecommunications,
Computers, Automatic Control and Nuclear Engineering, June 11-14, 2012. Zlatibor, pp.1-5, 2012,

Autonomous wheeled mobile robot control
227
[13] Rodic, A. and Mester, G.: Ambientally Aware Bi-Functional Ground-Aerial Robot-
-Sensor Networked System for Remote Environmental Surveillance and Monitoring Tasks. Proceedings of the 55
th ETRAN Conference, Section Robotics, Society for Electronics,
Computers, Automatic Control and Nuclear Engineering, June 11-14, 2012. Zlatibor, pp.1-4, 2012. Banja Vrućica – Teslić, 2011,
[14] Mester, G. and Rodic, A.: Contribution to the Simulation of Humanoid Kondo Robot. Annals of Faculty Engineering Hunedoara IX(1), 73-78, 2011,
[15] Nemes, A. and Mester, G.: Unconstrained Evolutionary and Gradient Descent-Based
Tuning of Fuzzy Partitions for UAV Dynamic Modeling. FME Transactions 45(1), 1-8, 2017,
[16] Mester, G.: Massive Open Online Courses in Education of Robotics. Interdisciplinary Description of Complex Systems 14(2), 182-187, 2016,
http://dx.doi.org/10.7906/indecs.14.2.7,
[17] Gyeviki, J. and Mester, G.: Dynamics of a Servopneumatic Positioning System. Proceedings of the Workshop on Mechatronics. Varna, pp.1-5, 2003,
[18] Mester, G.: Backstepping Control for Hexa-Rotor Microcopter. Acta Technica Corviniensis – Bulletin of Engineering VIII(3), 121-125, 2015,
[19] Mester, G. and Kutri, L.: Non-linear Paramtetric Vibrations of Motor Gear Machinery. Proceedings of the International Symposium on Gearing & Power Transmissions. Tokyo, pp.37-42, 1981,
[20] Mester, G.: Cloud Robotics Model. Interdisciplinary Description of Complex Systems 13(1), 1-8, 2015,
http://dx.doi.org/10.7906/indecs.13.1.1,
[21] Mester, G.: Design of the Fuzzy Control Systems Based on Genetic Algorithm for
Intelligent Robots. Interdisciplinary Description of Complex Systems 12(3), 245-254, 2014,
http://dx.doi.org/10.7906/indecs.12.3.4,
[22] Mester, G. and Rodic, A.: Sensor-Based Intelligent Mobile Robot Navigation in Unknown
Environments. International Journal of Electrical and Computer Engineering Systems 1(2), 1-8, 2010,
[23] Mester, G.: Sensor Based Control of Autonomous Wheeled Mobile Robots. The Ipsi BgD Transactions on Internet Research 6(2), 29-34, 2010,
[24] Kasač, J.; Stevanović, S.; Žilić, T. and Stepanić, J.: Robust Output Tracking Control of a
Quadrotor in the Presence of External Disturbances. Transactions of Famena 37(4), 29-42, 2013,
[25] Stepanić, J.; Kasać, J. and Ćosić Lesičar, J.: What is taken for granted about quadrotors:
Remarks about drive and communication. Proceedings of the 3
rd International Workshop on Advanced Computational Intelligence and
Intelligent Informatics (IWACIII 2013), October 18-21, 2013. Shanghai, pp.1-4, 2013,
[26] Nemes, A.: Genetic Algorithm-Based Adaptive Fuzzy Logic Systems for Dynamic
Modeling of Quadrotors. Proceedings of the 3
rd International Conference MechEdu, May 14-15, 2015. Subotica, pp.96-103, 2015,
[27] Puskas, B. and Rajnai, Z.: The Requirements of the Installation of the Critical
Informational Infrastructure and its Management. Interdisciplinary Description of Complex Systems 13(1), 48-56, 2015,
http://dx.doi.org/10.7906/indecs.13.1.7.

Interdisciplinary Description of Complex Systems 15(3), ii, 2017
RANGIRANJE ISTRAŽIVAČA IZ BALTIČKIH DRŽAVA
G. Mester
Sveučilište Óbuda – Doktorska škola sigurnosti Budimpešta, Madžarska
SAŽETAK
U ovom radu, temeljem h-indeksa i ukupnog broja citata, rangirano je deset najboljih litavskih,
letonskih i estonskih istraživača iz različitih područja znanosti. Lista može biti sastavljena prema
h-indeksu i ukupnom broju citata navedenim u bazama Web of Science, Scopus, Publish or Perish
Program ili bazi Goggle Znalac. Navedeni su podaci za deset najboljih istraživača. Baza Google
Znalac je najpotpunija. Zato, ako se želi uvesti jedinstveni indikator, h-indeks određen prema
podacima u bazi Google Znalac može biti jednostavan i prikladan. Autor je odabrao tu bazu jer je
najopsežnija.
KLJUČNE RIJEČI
rangiranje istraživača iz Baltičkih država, istraživači iz Litve, Latvije i Estonije, h-indeks, broj citata,
baza Google Znalac

Interdisciplinary Description of Complex Systems 15(3), iii, 2017
TALOŽNO STVARANJE STIJENA – PRIRODNI MODEL ADITIVNE PROIZVODNJE
I. Čatić1, J. Čaloska2, D. Godec1, M. Kovačić3, A. Pilipović1 i K. Skala4
1Sveučilište u Zagrebu – Fakultet strojarstva i brodogradnje 1Zagreb, Hrvatska
2Sveučilište Sv. Ćirila i Metoda – Strojarski fakultet 2Skoplje, Makedonija
3Sveučilište u Zagrebu – Prirodoslovno-matematički fakultet 3Zagreb, Hrvatska
4Institut Ruđer Bošković 4Zagreb, Hrvatska
SAŽETAK
Sve stvoreno u prirodi rezultat je prirodne tehnologije. Rješenja iz prirode mogu biti poticaj za
umjetnu, čovjekovu tehnologiju samog života (biotehnologiju) i tehnologiju biogeneze. Sukladno
tome, u radu je postavljeno pitanje što je prirodni model za aditivnu proizvodnju tvorevina. Nakon
geološke analize nekih proizvoda prirode i usporedbom s aditivnim tvorevinama načinjenih s pomoću
čovjekovih umijeća ustanovilo se preklapanje. Prirodni model za proizvodnju aditivnih tvorevina je
formiranje sedimentnih stijena prije 3,7 milijardi godina. Istodobno je napravljena sistematizacija
aditivnih postupaka i aditivne proizvodnje, prve revolucionarne promjene u primarnom oblikovanju
nakon 4,3 milijardi godina.
KLJUČNE RIJEČI
prirodne stijene, prirodni model aditivnih postupaka, aditivni postupci, aditivna proizvodnja

Interdisciplinary Description of Complex Systems 15(3), iv, 2017
NUMERIČKA TEHNIKA PROCJENE ŽIVOTNOG VIJEKA STANICA INFICIRANIH RAZVIJAJUĆOM VIRUSNOM INFEKCIJOM
S. Banerjee
Broad Institut – MIT i Harvard Cambridge, SAD
Ronin Institut Montclair, SAD
Savez za kompleksne biološke sustave North Andover, SAD
SAŽETAK
Nove vrste virusa izazivaju znatne nesreće kad prelaze na ljude s ostalih vrsta. Ovdje se razmatra novu
tehniku za numeričku procjenu značajnog parametra virusne infekcije u organizmu: životni vijek
inficiranih stanica. Pristup je općenit i može biti primijenjen na velik broj eksperimentalnih podataka o
virusima dobivenim u proučavanju replikacije.
Određivanje životnog vijeka inficiranih stanica postojećim metodama je problematično zbog problema s
identificiranjem i korelacijama parametara. Životni vijek inficirane stanice značajan je parametar na
temelju kojega se procjenjuje brzina uklanjanja virusa. Metoda opisana u ovom radu omogućava
određivanje jesu li inficirane stanice kratkoživuće ili dugoživuće. Dugoživuće inficirane stanice mogu
biti spremnici infekcije. To daje mehanicističko razumijevanje zašto su neke stanice spremnici infekcije
i može motivirati terapiju usmjerenu na takve stanice. Metoda je primijenjena na virus Zapadnog Nila,
jednu nastajuću epidemiju od interesa za javno zdravstvo, a koja je povezana sa Zika virusom. Analiza
upućuje na to da su od svih stanica koje se mogu inficirati najbrojnije kratkoživuće, što može motivirati
terapiju usmjerenu na takve stanice. Ovaj pristup je vrlo općenit i može biti kombiniran s tradicionalnim
metodama temeljenim na sustavima diferencijalnih jednadžbi za simuliranje djelovanja virusa u
organizmu. Kombinacija navedene dvije tehnike vjerojatno će dovesti do rezultata koje se ne može
postići izoliranim modelima, što je od interesa za modeliranje razvoja zaraze.
KLJUČNE RIJEČI
virusna oboljenja, virus Zapadnog Nila, istraživanja replikacije

Interdisciplinary Description of Complex Systems 15(3), v, 2017
RAČUNALNA BIOLOGIJA S AUTOMATSKOM INTERPRETACIJOM U KLINICI: OKVIR ZA
PREDVIĐANJE OZBILJNOSTI ZARAZE I GRUPIRANJE PACIJENATA NA TEMELJU KLINIČKIH PODATAKA
S. Banerjee
Broad Institut – MIT i Harvard Cambridge, SAD
Ronin Institut Montclair, SAD
Savez za kompleksne biološke sustave North Andover, SAD
SAŽETAK
Rad opisuje okvir za automatsko računanje i strojno učenje koji predviđa ozbiljnost zaraze i premat
tome grupira pacijente. Okvir koristi dostupne kliničke podatke. Algoritam automatski generira uvide i
predviđa ozbiljnost zaraze, uz minimalno uključivanje operatera. Računalni okvir razvijen u ovom
radu omogućava grupiranje pacijenata slijedom predviđanja ozbiljnosti zaraze, kao i uočavanje novih
biomarkera zaraze. Uvidi dobiveni primjenom algoritama strojnog učenja u kombinaciji s kliničkim
podacima mogu pomoći usmjeravanju terapije, individualizaciji pristupa i razumijevanju promjena
zaraze u vremenu. Računalne tehnike poput ove mogu biti korištene u translacijskoj medicini u bliskoj
suradnji kliničara i drugih zdravstvenih djelatnika. Model može biti interpretiran tako da u njegovom
nadogradnjama mogu sudjelovati kliničari relativno malog iskustva sa strojnim učenjem. Ovaj je rad
doprinos primjeni automatskog strojnog učenja u klinikama.
KLJUČNE RIJEČI
predviđanje ozbiljnosti zaraze, strojno učenje, računalna tehnika, big data

Interdisciplinary Description of Complex Systems 15(3), vi, 2017
PREDVIĐANJE UČINKA ONLINE MEDIJSKIH OKVIRA
H. Jakopović
Sveučilište u Zagrebu – Fakultet političkih znanosti Zagreb, Hrvatska
SAŽETAK
Uokvirivanje pripada u neke od najznačajnijih teorija za razumijevanje medija i njihovog potencijalnog
utjecaja na javnosti. Pored toga, autor publicitet i njegove učinke promatra kao raspršene i teško
uhvatljive za odnose s javnošću. Ovaj rad donosi specifičan dizajn istraživanja koji bi se mogao
primijeniti u praksi odnosa s javnošću, s osobitim usmjerenjem na korelaciju medijskih okvira i
individualnih okvira. Pristup je temeljen na tipologiji medijskih okvira. Autor u empirijskom
istraživanju atribuira tipove medijskih okvira s negativnim, pozitivnim i neutralnim odrednicama.
Analiza sadržaja i sentimenta uključuju online vijesti koje izvještavaju o tri transportne organizacije i
pripadajuće komentari korisnika (identificirane kao negativne, pozitivne i neutralne). Autor promatra
korisničke komentare i recenzije kao individualne okvire koji sudjeluju u kreaciji online imidža.
Nadalje, identificiraju se tipovi medijskih okvira kao i individualni okviri koji se manifestiraju kao
imidž. Korelacijsko istraživanje služi za ispitivanje potencijala predviđanja na temelju medijskih
okvira. Rezultati otkrivaju najfrekventnije tipove medijskih okvira u domeni transporta. Online mediji
su prema tome skloni izvještavati kroz okvir odgovornosti, zatim okvir ekonomskih posljedica i okvir
sukoba, a s druge strane često zanemaruju okvir ljudske priče i okvir moralnosti. Rezultati pokazuju da
specifični tipovi okvira omogućuju bolje predviđanje reakcija korisnika. Okvir ekonomskih posljedica i
okvir ljudske priče u tom smislu omogućuju najbolju predikciju.
KLJUČNE RIJEČI
teorija uokvirivanja; komentari korisnika; online vijesti; transport; analiza sentimenta

Interdisciplinary Description of Complex Systems 15(3), vii, 2017
UPRAVLJANJE AUTONOMNIM MOBILNIM ROBOTOM S KOTAČIMA
J. Simon
Sveučilište u Szegedu – Strojarski fakultet Szeged, Madžarska
SAŽETAK
Autonomni mobilni roboti s kotačima zanimljivi su i za znanstvena istraživanja i za primjene. The
article deals with the fuzzy control of autonomous wheeled mobile robotic platform motion in an
unstructured environment with obstacles. The simulation results show the effectiveness and the
validity of the obstacle avoidance behaviour in unstructured environments and the velocity control of
a wheeled mobile robotic platform motion of the proposed fuzzy control strategy.
KLJUČNE RIJEČI
autonomni mobilni robot s kotačima, strategija neizrazitog upravljanja, nestrukturirana okolina,
prepreke, rezultati simulacije


MANUSCRIPT PREPARATION GUIDELINES Manuscript sent should contain these elements in the following order: title, name(s) and surname(s) of
author(s), affiliation(s), summary, key words, classification, manuscript text, references. Sections
acknowledgments and remarks are optional. If present, position them right before the references.
ABSTRACT Concisely and clearly written, approx. 250 words.
KEY WORDS Not more than 5 key words, as accurate and precise as possible.
CLASSIFICATION Suggest at least one classification using documented schemes, e.g., ACM, APA, JEL, PACS.
TEXT Write using UK spelling of English. Preferred file format is Microsoft Word. Provide manuscripts
in grey tone. For online version, manuscripts with coloured textual and graphic material are admissible.
Consult editors for details.
Use Arial font for titles: 14pt bold capital letters for titles of sections, 12pt bold capitals for titles of
subsections and 12pt bold letters for those of sub-subsections. Include 12pt space before these titles.
Include figures and tables in the preferred position in text. Alternatively, put them in different
locations, but state where a particular figure or table should be included. Enumerate them separately
using Arabic numerals, strictly following the order they are introduced in the text. Reference figures
and tables completely, e.g., “as is shown in Figure 1, y depends on x …”, or in shortened form using
parentheses, e.g., “the y dependence on x shows (Fig. 1) that…”, or “… shows (Figs. 1-3) that …”.
Enumerate formulas consecutively using Arabic numerals. In text, refer to a formula by noting its
number in parentheses, e.g. expression (1). Use regular font to write names of functions, particular
symbols and indices (i.e. sin and not sin, differential as d not as d, imaginary unit as i and not as i, base
of natural logarithms as e and not as e, xn and not xn). Use italics for symbols introduced, e.g. f(x). Use
brackets and parentheses, e.g. ( ). Use bold letters for vectors and matrices. Put 3pt of space above
and below the formulas.
Symbols, abbreviations and other notation that requires explanation should be described in the text,
close to the place of first use. Avoid separate lists for that purpose.
Denote footnotes in the text by using Arabic numerals as superscripts. Provide their description in
separate section after the concluding section.
References are listed at the end of the article in order of appearance in the text, in formats described
below. Data for printed and electronic references is required. Quote references using brackets, e.g. 1,
and include multiple references in a single bracket, e.g. 1-3, or 1, 3. If a part of the reference is used,
separate it with semi-colon, e.g. 3; p.4, 3; pp.4-8, 3; p.4, 5; Ch.3. Mention all authors if there are not
more than five of them, starting with surname, and followed with initial(s), as shown below. In other
cases mention only the first author and refer to others using et al. If there are two or more authors,
separate the last one with the word “and”; for other separations use semicolon. Indicate the titles of all
articles, books and other material in italics. Indicate if language is not English. For other data use 11pt
font. If both printed version and the Internet source exist, mention them in separate lines. For printed
journal articles include journal title, volume, issue (in parentheses), starting and ending page, and year
of publication. For other materials include all data enabling one to locate the source. Use the
following forms:
[1] Surname, Initial1.Initial2.; Surname, Initial1.Initial2. and Surname, Initial1.Initial2.: Article title. Journal name Vol(issue), from-to, year,
http://www.address,
[2] Surname, Initial1.Initial2. and Surname, Initial1.Initial2.: Book title. Publisher, city, year,
[3] Surname, Initial1.Initial2.; Surname, Initial1.Initial2., eds.: Title. Editor(s) listed similarly as authors, ed(s).: Proceedings title. Publisher, city, year.
If possible, utilise the template available from the INDECS web page.
CORRESPONDENCE Write the corresponding author’s e-mail address, telephone and address (i.e., ).

ISSN 1334-4684 (printed)
http://indecs.eu