Perspectives on Truancy: An Interdisciplinary Approach
95
ABSTRACT OF THESIS PERSPECTIVES ON TRUANCY: AN INTERDISCIPLINARY APPROACH Student truancy from school is widespread throughout the U.S. and has become an epidemic with hundreds of thousands children daily missing classes (Siegel, Walsh, & Senna, 2006; Flannery, Frank, & Kato, 2012). The present study utilizes an interdisciplinary research approach to examine the phenomenon of truancy. Exploratory factor analyses provide empirical evidence that the four disciplinary perspectives — criminal justice, psychology, education, sociology – have common underlying constructs regarding the phenomenon. Jeanne Spaulding February 9, 2015
Transcript of Perspectives on Truancy: An Interdisciplinary Approach

ABSTRACT OF THESIS
PERSPECTIVES ON TRUANCY:
AN INTERDISCIPLINARY APPROACH
Student truancy from school is widespread throughout the U.S. and has become an
epidemic with hundreds of thousands children daily missing classes (Siegel, Walsh, &
Senna, 2006; Flannery, Frank, & Kato, 2012). The present study utilizes an
interdisciplinary research approach to examine the phenomenon of truancy. Exploratory
factor analyses provide empirical evidence that the four disciplinary perspectives —
criminal justice, psychology, education, sociology – have common underlying constructs
regarding the phenomenon.
Jeanne Spaulding
February 9, 2015

PERSPECTIVES ON TRUANCY:
AN INTERDISCIPLINARY APPROACH
By
Jeanne Spaulding
William Attenweiler, Ph.D., Committee Chair
Willie Elliott, Ph.D., Committee Member
Susan Mospens, Ph.D., Committee Member

PERSPECTIVES ON TRUANCY:
AN INTERDISCIPLINARY APPROACH
Thesis
A thesis submitted in partial fulfillment of the
requirements for the degree of Master of Arts in Integrative Studies
at Northern Kentucky University
By
Jeanne Spaulding
Highland Heights, Kentucky
Program Director: Dr. Bill Attenweiler
Associate Professor of Integrative Studies
Highland Heights, Kentucky
2015

DOCUMENT RELEASE
____X___ I authorize Steely Library to reproduce this document in whole or in part for
the purpose of research.
________ I do not authorize Steely Library to reproduce this document in whole or in
part for purposes of research.
Signed: Jeanne Spaulding
Date: May 31, 2015

Copyright by
Jeanne Spaulding
2015

Acknowledgments
I would like to extend my gratitude to Dr. William Attenweiler, Dr. Willie Elliott, and Dr.
Susan Mospens for serving as my thesis committee. Your patience, support, and
encouragement made this process possible. Thank you to my committee chair and
advisor, Dr. William Attenweiler, for his never-ending patience in guiding me through
this process. Also, I would like to extend a thank you to my daughter, Olivia, for her
patience in sharing her mom with the world of academia, and being my personal
cheerleader along the way.

Table of Contents
List of Tables iii 1 Introduction 2 Review of Literature 2 Criminal Justice Perspective 7 Psychological Perspective 10 Education Perspective 16 Sociological Perspective 18 3 Method 25 Measures 25
Participants 25 Procedures 26 4 Results 28 Data Screening 28 Exploratory Factor Analysis 30 Descriptive Statistics 34 Analysis 34 5 Discussion 54 References 58 Appendices 63 Appendix A: Informed Consent- Parent 66 Appendix B: Informed Assent- Participant 67 Appendix C: Questionnaire Instrument- Coded 68 Appendix D: Questionnaire Instrument- Actual 76 Appendix E: Description of Individual Factor Items 82 Appendix F: IRB Approval 83

iii
List of Tables
Table 1 Multiple imputation for items with missing data values 29 Table 2 KMO and X2 comparisons between principal axis factoring and principal component analysis 36 Table 3 Factor loadings and communalities for interaction theory principal axis factoring and principal component models 37 Table 4 Factor loadings and communalities for control theory principal axis factoring and principal component models 37 Table 5 Factor loadings and communalities for labeling theory principal axis factoring and principal component models 38 Table 6 Factor loadings and communalities for 4-factor theory principal axis factoring and principal component models 41 Table 7 Comparison of factor loadings and communalities for full 4 factor theory
model including strain items anmd 3 factor theory model excluding strain items 43
Table 8 Factor loadings and communalities for school section principal axis factoring and principal component models 44 Table 9 Factor loadings and communalities for teacher/classes section principal axis factoring and principal component models 45 Table 10 Factor loadings and communalities for parent section principal axis factoring and principal component models 46 Table 11 Factor loadings and communalities for friend section principal axis factoring and principal component models 46 Table 12 Factor loadings and communalities for you section principal axis factoring and principal component models 47 Table 13 Factor loadings and communalities for 5-factor section principal axis factoring and principal component models 50 Table 14 Comparison of Cronbach’s alpha, split-half, and Lambda 2 reliabilites for each exploratory factor analysis model 52

iv
Table 15 Multiple regression analysis summary for school record demographic variables predicting number of days absent 54
. Table 16 Multiple regression analysis summary for item statement variables
predicting number of days absent 55

PERSPECTIVES ON TRUANCY
In this study, I utilize an interdisciplinary research approach, with support of
interpretative phenomenological analysis (IPA) and grounded theory, to evaluate the
main disciplinary perspectives on student truancy. Student truancy from school is
widespread throughout the U.S. and has become an epidemic with hundreds of
thousands children daily missing classes (Siegel, Walsh, & Senna, 2006; Flannery,
Frank, & Kato, 2012). Lawrence (2007) states that “truancy cases in juvenile
courts…significantly increased from 22,000 cases in 1989 to 41,000 cases in 1998” (p.
118) – an increase of 85 percent. Kim and Barthelemy (2011) found that from 1995 to
2005 truancy cases increased 60 percent with truancy accounting for 35 percent of all
juvenile status offenses by 2005. Researchers believe the actual nationwide rate of
truancy is most likely even higher; however, the rate is unknown due to inconsistent
definitions and the lack of national requirements (Kim & Barthelemy, 2011; Zhang,
Willson, Katsiyannis, Barrett, Ju, & Wu, 2010; Flannery et al., 2012).
Truancy is a multifaceted problem of numerous factors (Eastman et al., 2007; Reid,
2010; Kearney, 2007; Dimmick, Correa, Liazis, & McMichael, 2011; Dube & Orpinas,
2009; Williams, 2010; Guare & Cooper, 2003). Research states that, “The truancy
‘equation’ involves a complex interaction between parents and care[give]rs, society,
schools, the government, pupils, local authorities, the local economy, cultural diversity
and research” (Reid, 2010, p. 4). The causes of truancy are innumerable and continue
to change, resulting in the phenomenon’s increasing complexity (Reid, 2010; Spencer,
2009; Wilson et al., 2008). Truancy has taken on a complexity which no single
discipline has been able to affect in a sufficient manner (Guare & Cooper, 2003;
Eastman, Cooney, O’Connor & Small, 2007; Reid, 2010). An interdisciplinary approach
is required in order to understand insights the relevant disciplines offer to the issue.
The main contributing disciplines involved in studying the phenomenon of truancy
are criminal justice, psychology, education, and sociology. A review of the literature has
determined distinct perspectives within each of the aforementioned contributing
disciplines. Each discipline’s respective view contains its own set of defining elements
inclusive of explicit assumptions and theories. The literature does, however, lack
research on certain key elements-- the most important of which is the integration of the

PERSPECTIVES ON TRUANCY
2
disciplines. This research stands to fill the need of an interdisciplinary approach and
understanding.
Review of Literature
The present study explores the phenomenon of truancy by following the
interdisciplinary research process model as defined by Repko (2008) in his volume
Interdisciplinary Research: Process and Theory. Repko’s (2008) process looks to find
“new meanings” and solutions through the bringing together of disciplines (p. 138). He
states that the purpose of an interdisciplinary research process is to produce “…a
cognitive advancement or interdisciplinary understanding of a particular
problem…through the integration of knowledge and of modes of thinking from two or
more disciplines” (p. 20). The interdisciplinary research approach is a three stage
process. The stages are identification, integration and understanding (Repko, 2008).
First, a problem, or phenomenon, must be identified as researchable. A problem is
researchable in an interdisciplinary sense when 1) it is the focus of two or more
disciplines, and 2) there is a gap in attention to the problem beyond one domain. Once
the problem has been identified, the disciplines relevant to the problem are identified.
Disciplines most relevant are often three or four disciplines which are directly connected
to the problem, have generated the more important research, and have advanced
compelling theories to explain the problem (Repko, 2008).
Second, the identified most relevant disciplines are subjected to the process of
integration. Integration, according to Repko (2008) is defined as “the activity of critically
evaluating and creatively combining ideas and knowledge to form a new whole…” (p.
116). Integration is the heart of the interdisciplinary research process and may be
considered the most important of the three stages as it is what distinguishes
interdisciplinary research from other research processes.
Integration requires that a set of prerequisites be satisfied in order to properly
complete this stage of the interdisciplinary research process. Prerequisites include the
use of “(1) disciplinary knowledge, (2) integrative skills, (3) integrative knowledge, and
(4) integrative mind-set” (Repko, 2008, p. 125). Disciplinary knowledge is two-fold: it
includes understanding of the overall disciplinary perspectives and sufficiently defining

PERSPECTIVES ON TRUANCY
3
the disciplinary elements pertinent to the phenomenon (Repko, 2008). A researcher
draws disciplinary knowledge from review of the literature. Integrative skills are the
combination of four areas of knowledge- 1) integration models, 2) integration
techniques, 3) awareness of the process, 4) critical evaluation (Repko, 2008).
Integrative knowledge is the ability to define elements, conflicts, discover common
ground, and integrate the disciplines through the application of common theory (Repko,
2008). The fourth prerequisite is an integrative mind-set. An integrative mind-set
requires the use of intellectual abilities to search for what is useful, inclusive thinking,
responsivity to perspectives, balance and flexibility (Repko, 2008).
The third, and final, stage of the interdisciplinary process is to create
interdisciplinary understanding of the phenomenon. Repko (2008) defines
interdisciplinary understanding as “the capacity to integrate knowledge and modes of
thinking in two or more disciplines to produce a cognitive advancement” (p. 310) by
explaining or solving a problem or offering new questions regarding the phenomenon.
Interdisciplinary understanding may be presented in several modes – a metaphor, a
model, a narrative, a new question, a new process, a new policy – or any combination
of the aforementioned. During the production of understanding, the researcher tests the
knowledge gained, or discovered, from the integration process (Repko, 2008).
In addition to following an interdisciplinary research process, this study will utilize
Interpretative Phenomenological Analysis encompassing the methodology of grounded
theory. Interpretative Phenomenological Analysis (IPA), founded by Jonathan Smith, is
“… [An] examination of how people make sense of their major life experiences” (Smith,
Flowers, and Larkin, 2009, p. 1). The focus of IPA in the context of this study is how
truancy, as an event, is experienced in the lives of the students involved. The
significance is particularly “…in [the] reflections, thoughts and feelings…” (Smith et al.,
2009, p. 3) sparked in each individual. IPA is concerned with the details surrounding
each individual case and begs the questions, “What is the experience like for this
[emphasis added] person?” (Smith et al., 2009, p. 3).
The grounded theory method, as used in this study, serves a multitude of purposes.

PERSPECTIVES ON TRUANCY
4
The five essential purposes are as follows:
1. To enable prediction and explanation of behavior,
2. To be useful in theoretical advancement,
3. To be usable in practical applications- giving understanding and some control to
situations,
4. To provide perspective on behavior, and
5. To guide and provide a style for research on particular areas of behavior.
(Glaser, 1992)
Grounded theory has been shown to be useful in qualitative social research by
offering a general method of comparative analysis (Glaser, 1992). The method is
grounded in the data. Rather than verifying information, its goal is to explore, discover
and bridge disciplines’ perspectives of the same phenomenon (Glaser, 1992).
What is a truant? The definitions of truant and truancy are widely debated.
Operational definitions of truant vary dependent upon the source -- whether it be
governance, academic discipline, school district or researcher (Reid, 2010; Wilson,
Malcolm, Edward, & Davidson, 2008; Kearney, 2007; Donoghue, 2011; Guare &
Cooper, 2003; Williams, 2010). Reid (2010) determined the most simplistic definition of
truant to be “… [one who is] deliberately missing school without good cause” (Reid,
2010, p. 1; Eastman et al., 2007). Beyond this simple definition, the consensus ends.
The lack of an established definition becomes problematic as it confounds studies
attempting to get at the true nature and basis of truancy (Sheppard, 2005). In order to
clarify for her recent research, Sheppard (2007) defines a truant “…as one who either
skips select classes or an entire school day without any prior consent” (p. 350). In
contrast, Claes, Hooghe, and Reeskens (2009) determined truant to best be defined as
a student who has “any unexcused or undocumented absence from school,” (p. 124) in
accordance with laws, whether it be consistent late morning arrival, early afternoon
departure or failure to appear to school at all (Claes et al., 2009).
According to Reid (2010) being truant includes the following: skipping specific
classes, parent condoned absence and psychological absence. (Reid, 2010).
Demographically, according to federal data, a staggering number of truant youth have
many of the following characteristics:

PERSPECTIVES ON TRUANCY
5
One-half of truant students live in single-parent family households,
One-third of truant students live in households below poverty level,
Truant students are equally boys and girls, age 15, and mostly 10th grade
status.
(Kronholz, 2011; Crabtree, J., personal communication, 2012)
This study explores truancy from the perspective of 10th grade youth from two schools in
the Commonwealth of Kentucky.
Compulsory education is not a new concept and truancy is not a new problem. The
first compulsory attendance statute was adopted in Massachusetts in 1852 (Siegel et
al., 2006; Barusch, 2009). In the Commonwealth of Kentucky, compulsory education
became enforceable in 1942 under Title 8, Chapter 159, of Kentucky Revised Statutes
(2000). Title 8, Chapter 159 is devoted solely to compulsory school attendance in
Kentucky. KRS 8: 159.010 sets forth “…each parent, guardian or other person residing
in the state and having in custody or care…any child between the ages of six (6) and
sixteen (16) shall send the child to…school” (Kentucky Revised Statute, 2000).
A parent who fails to consistently send his or her child to school is reported by the
school district to the local Commonwealth Attorney who files a complaint in family court.
The parent is then summonsed to appear before the family court judge at which time the
parent is charged with educational neglect (Children’s Law Office, sec. 2). Educational
neglect is included under state child abuse and neglect statutes and comes with
penalty. Habitual violation of the statute results in a parent being fined or even jailed.
Indicators of educational neglect include, but are not limited to: a child is of school age
but not of an appropriate age to care for him or herself, parent(s) are uncooperative with
school in addressing a student’s absences, or other signs of child neglect.
In addition to the parents’ responsibility to send their child-(ren) to school, school
aged children have the responsibility to remain in attendance at school. A child who
has accumulated three (3) days of unexcused absences and/or tardiness is defined as
truant and in the Commonwealth of Kentucky considered to be in violation of KRS Title
8, Chapter 159.150. Any child who is reported to the courts on two (2) or more
instances of truancy is then defined as a habitual truant under KRS Title 8, Chapter

PERSPECTIVES ON TRUANCY
6
159.150 (Kentucky Revised Statute, 2000). Additionally, any person who aides a
habitual truant is also subject to prosecution. According to Gary Edmondson, a
Kentucky Commonwealth Attorney (2007), “Those who knowingly assist or cause a
minor to become a habitual truant can be charged with unlawful transaction with a
minor…[which] carries a 90-day to 12-month jail sentence and/or up to a $500 fine”
(Para. 4). Lawrence (2007) has determined compulsory school attendance laws are
overall beneficial (p. 108). Ken Kippenbrock, Deputy Sheriff and Director of Pupil
Personnel for an urban school district, concurs with Lawrence (2007) stating that in his
experience the laws work effectively to divert approximately 75% of students referred to
him for truancy intervention (Kippenbrock, K., personal communication, 2012).
Kippenbrock believes the 75% of referred students who are diverted by regulatory laws
from further truancy is a success (Kippenbrock, K., personal communication, 2012).
The remaining 25% of referred students end up in a juvenile detention facility. It is this
remaining 25% of referred students, who end up in detention, for which compulsory
attendance laws are perhaps counterproductive. Lawrence (2007) argues that
“Enforcing compulsory attendance on students who do NOT want to attend [school]
INCREASES…[their truant] behavior” (p. 108). Reid (2010) corroborates that applying
laws to student attendance has not been effective: “Effective solutions to pupils’ non-
attendance and truancy require comprehensive, multi-faceted strategies [rather than
just one]…” (p. 12).
Each of the four contributing disciplines holds a unique perspective in considering
the potential reason(s) for truancy. The epistemologies are, respectively:
Some criminal justice researchers propose truancy is a precursor or
antecedent to deeper criminal problems.
Some psychologists propose truancy stems from a child’s disassociation
with school and peers, or is a symptom of deeper psychological issues
within the individual child.
Some educational researchers propose truancy results from lack of
respect for academia.
Some sociologists propose truancy is the byproduct of environmental
factors and circumstances beyond a student’s control.

PERSPECTIVES ON TRUANCY
7
The following sections discuss the four disciplines individually to provide an
understanding of each discipline’s perspective on the phenomenon of truancy.
Criminal Justice Perspective
The criminal justice perspective regards truancy as a form of, or precursor to,
criminality. Many theories of criminality have been proffered; however, four basic
assumptions have emerged from the criminal justice perspective: 1) humans are
inherently rational beings, 2) human actions result from a combination of rational
thought and free will, 3) humans use rational thought to calculate the potential rewards--
pain or pleasure-- prior to the committal of any act, and 4) human beings inherently
know right and wrong (Schmalleger, 2009).
An early criminal justice theorist, Cesare Beccaria, wrote regarding criminal acts as
being the product of a person’s free will. Burfeind and Bartusch (2006) further discuss
Beccaria’s theory stating it was through “calculated choice” that a person came to
criminality and quote Beccaria’s rationale, “Every man thinks of himself as the center of
the world’s affairs” (p.253). Early belief was that the punishment for criminal acts must
be swift, certain, and fitting for the illicit act. Otherwise, the punishment would not be
deemed useful as a consequence of the action (Schmalleger, 2009).
Unfortunate for juveniles today, assumptions have not evolved much in the last 250
years. In the United States, there are three states which incarcerate 40% of the nation’s
juvenile offenders, the most prevalent offense for incarceration being truancy. The
Commonwealth of Kentucky holds the second place surpassed only by Washington
State in numbers. The remaining 60% of the nation’s incarerated juveniles are
scattered among the remaining 23 states which will incarcerate juvenile offenders (J.
Crabtree, personal communication, 2012). A juvenile who is involved with the court
system becomes unofficially labeled as juvenile delinquent whether they are
incarcerated or not.
Juvenile delinquency is a social construct. Burfiend & Bartusch (2006) state that
this construct is “…a product of myriad social, political, economic and religious changes”
(p. 52). A delinquent, and delinquency, are determined by two factors: 1) age under
legal age of majority, and 2) exhibit illegal behavior(s) (Burfiend & Bartusch, 2006).

PERSPECTIVES ON TRUANCY
8
Hirschi (1969), however, argues that delinquency is as much a positive as it is a
negative construct. His theory postulates that the assumptions incorporate not only
those juveniles who exhibit illicit behavior(s), but also those who do not.
In 1969, Hirschi published his work “A Control Theory of Delinquency” which has
come to be one of the prominent criminological theories. Hirschi (1969) offers a
different approach to delinquency by discussing not what causes juveniles to deviate
from abiding by the laws, but rather what causes them not to deviate. The concept is
known as social control and, according to Lawrence (2007), “emphasize[s] factors that
help youth avoid delinquent involvement” (p. 105). When the social control of
conventional society is weak young people begin to deviate toward truancy and
delinquency (Hirschi, 1969). Hirschi (1969) defines social control as consisting of three
attachments, or bonds, to society: commitment, involvement, and belief.
Commitment is defined as having an investment in society. Society offers the
opportunity to acquire material wealth, prospects, and a favorable reputation; this is
what Hirschi (1969) calls society’s “insurance that they [the public] will abide by the
rules [laws]” (p. 253). The risks of illicit behavior(s) are not worth losing the investments
in society. Oftentimes merely the fear of potential consequences and repercussions
deter individuals from illicit acts (Hirschi, 1969). Kippenbrock notes that out of 100
students referred for truancy, the mere threat of court works to deter approximately 50
of the students from further truancy (Kippenbrock, K., personal communication, 2012).
Furthermore, Hirschi (1969) argues, “the decision to commit a criminal act may well be
rationally determined--that the actor’s decision was not irrational given the risks and
costs [the individual] faced” (p. 253).
Kronick and Thomas (2008) follow up with the point that some individuals are
socialized to a set of values, means, and goals that are different from those of general
society, thus forming a counterculture (p. 115). Students raised within such a
counterculture find school to be a difficult place to form commitment to, unlike on the
streets of their communities (Kronick and Thomas, 2008). Upchurch (1996) tells of his
experience as a child, “Everything I had experienced in my childhood was the opposite
of what I needed to survive…at school. My socialization in school felt like an assault to
my culture and values” (p. 17).

PERSPECTIVES ON TRUANCY
9
Rocque and Pasternoster (2011) propose there is a disproportionate number of
minority to white students who become habitual truants. They argue that white students
who become truant result from a perceived threat that minorities pose to a white school
culture while minorities perceive a white school culture as a threat (p. 636). The
rationale for this cultural threat theory is that students who come from a minority group
“are less likely to buy into a predominantly white school culture…due to their own
[differing] cultural values…” (Rocque & Pasternoster, 2011). Minority students find it
difficult to form commitment to the school culture while white students find their
commitment to the school culture weakened.
The second of Hirschi’s (1969) attachments is involvement. Individuals are simply
too busy being engrossed in their own life activities to be involved in illicit acts.
Involvements- -such as work, sports, or other extracurricular activities--are time
consuming, leaving little time for anything else beyond the necessities of living, such as
eating, and sleeping (Hirschi, 1969).
The third attachment, belief, deters individuals from illicit acts for no reason other
than the fact that such acts go against their personal accepted values and norms. As
Hirschi (1969) explains, “We are moral beings to the extent that we have ‘internalized
the norms’ of [general] society” (p. 252). Individuals have been imperfectly socialized to
a common system of values, conforming behaviors, and sensitivity to the approval of
others. The individual who deviates from general society’s norms rationalizes violation
of the norms by arguing that he/she does not believe, or agree with, the societal view.
Also, oftentimes it may be that the individual has not had access to, or learned of,
general society’s approved structures through his or her interactions on the streets of
their community, with family, or peers (Kronick & Thomas, 2008). When a person is
insensitive to the larger group of general society, he or she does not feel bound to the
group’s beliefs, norms, or values, and thus, feels free to deviate (Hirschi, 1969).
Kelly (1978) discusses in his seminal work that juveniles who commit illicit acts are
the byproduct of their interactions within general society, specifically the interactions
occurring among the juveniles and authority or other forms of social control. Whether a
student becomes truant, and thus delinquent, depends upon his or her interactions
within the school culture (Kelly, 1978). Differences in cultural values and perspectives

PERSPECTIVES ON TRUANCY
10
lend to stereotyping of individuals or groups of individuals. According to Kelly (1978),
stereotyping in turn leads to a labeling effect that is a major determinant of further
behavior. Labeling effects are prevalent in schools with a disproportionate racial
composition according to the research of Rocque and Pasternoster (2011). Their study
found that minority students, especially African-American students, were twice as likely
as white students to receive disciplinary actions from teachers, even though minority
students comprised a smaller portion of the school population (Rocque & Pasternoster,
2011).
Reactions to external influences are considered to be a strong determinant of truant
behavior. Although influences may be positive or negative, the final determination to
truant, and risk delinquency, is for the student to decide (Guare & Cooper,
2003).Therefore, in 2003, Guare and Cooper reported their research study that focused
specifically on the student, or truant. They note that “few researchers have consulted
students about their own truancy” (p. 1). In an attempt to fill this void of student
perceptions, Guare and Cooper (2003) administered the Student Truancy and
Attendance Review II (STAR-II) to a sample of 230 middle school and high school
students in the United States. The STAR-II was designed to measure student reactions
to and perceptions of truancy and school attendance. Their findings echo themes found
throughout criminal justice of “…students as thinking, rational decision makers who
assess their situation and decide…” whether or not to attend school (Guare & Cooper,
2003, p. 2). The study determined that the decision to truant is based heavily on
student reaction to external influences. The psychological perspective delves deeper
into the concept of the student, or truant, as the focus for truancy research.
Psychological Perspective
Psychology is concerned with the heterogeneous behavioral problems and child-
motivated aspects of truancy. Psychologists typically assume the individual and his or
her internal processes to be the focus of research. Motivations and behaviors stem
from these internal processes in conjunction with the individual’s personality traits. An
individual’s behavior is purposeful and only becomes wrong in the context of general
society (Schmalleger, 2009). Behaviors that are deemed wrong in the external context

PERSPECTIVES ON TRUANCY
11
of society are determined to be potentially symptomatic of a greater syndrome, “problem
behavior syndrome” (Sullivan et al., 2009). Also, psychologists believe truancy is likely
a sign, or symptom, of deeper psychological issues, such as anxiety, depression, and
school refusal behavior, as well as bullying or other peer victimization (Sullivan, Childs,
& O’Connell, 2009; Dube & Orpinas, 2009). Applied to the context of this study,
truancy is considered a latent variable which is symptomatic of any one of these, or
other, psychological problems.
Regular school attendance is integral for proper and healthy development of
children. Truants become at risk of suffering health and social problems due their
attendance issues. According to Fiske (2004), “…[B]elonging to a group helps
individuals survive psychologically and physically” (p. 17). Some psychologists argue
that truancy results from the failure of the student to socialize or associate with peers.
Peer association aids in fulfillment of an individual’s core social motives. According to
Fiske (2004), “Core social motives describe fundamental psychological processes that
impel people’s thinking, feeling and behaving in situations involving other people” (p.
14).
Core social motives are comprised of five unifying themes: belonging,
understanding, controlling, enhancing self, and trusting others (Fiske, 2004). The most
important of these themes is belonging, since it serves as a foundation for the other
motives. Students, like most people, possess the basic psychological need to belong.
Students satisfy their need through interaction and ties with peers, family, and teachers
(De Wit, Karioja, and Rye, 2010). According to Kronholz (2011), “School is the center of
social life for youngster” (p. 34). It is reasonable to surmise that students are not having
their need to belong met at school and are therefore seeking belonging elsewhere
outside of the school environment.
Another psychological consideration which regards a student’s lack of belonging is
antisocial behavior. Dishion et al. (2010) state, “early onset antisocial behavior is
correlated with academic failure, peer rejection, and disaffection from the school
context” (p. 605). Thus, the student has an increased tendency to deviate from school
and become truant.

PERSPECTIVES ON TRUANCY
12
In their study, Dishion et al. (2010) found statistically significant evidence to support
the association of certain factors with school marginalization. Factors included: truancy,
aggression, committal of property crimes, dislike of school, and being disliked by peers
(p. 610). Additionally, the study found that some students have higher risk factors than
others. Students with antisocial behavior appear to be more vulnerable to socialization
that “…creates[s] a mindset that minimizes the consequence of their behavior on the
others and optimizes a sense of grandiosity and fearlessness associated with
committing harmful and destructive acts” (Dishion et al., 2010). Antisocial behavior may
also result from the isolation and marginalization truants experience as a result of their
peers’ response to their truancy (Wilson et al., 2008). Students caught up in the cycle
of truancy become estranged from school and peers. Truant students experience
difficulty with making and keeping friends, which leads to loss of support and reinforces
antisocial behavior (Wilson et al., 2008; De Wit et al., 2010).
In regards to truants, it is reasonable to surmise that students are not having their
need to belong met at school and are therefore motivated to seek belonging elsewhere
outside of the school environment. According to Dishion, Veronneau, and Myers
(2010), “…the peer domain is particularly salient to understanding the development of
adolescent problem behavior” (p. 603). Sullivan et al. (2009) have coined the term
problem behavior syndrome to refer to these adolescent behaviors. They define
problem behavior syndrome as “…the tendency to simultaneously engage in a
constellation of behaviors thought to reflect a unified disposition toward deviance”
(Sullivan et al., 2009, p. 542).
In studying the generality of problem behavior, Sullivan et al. (2009) deemed the
best approach to understanding the relationship among problem behaviors to be an
individual-centered and categorical one. Also, consideration is given to race, gender,
and age as primary indicators of some problem behaviors. Common factors tend to
decrease the severity of problem behavior, such as parental involvement and strength
of informal or formal support systems. Dishion et al.’s (2010) study also suggests a
negative correlation between truancy and increased social attachments.
An increasing trend in research is the link between bullying and truancy, and peer
victimization and truancy. A recent study by Faris and Felmlee (2011) published in

PERSPECTIVES ON TRUANCY
13
American Sociological Review states, “[It is] estimate[d] that each weekday [emphasis
added], 160,000 students skip school [just] to avoid being bullied” (p. 48). Gastic (2008)
conducted a study which focuses on the highest truancy age group, 12-18 years old,
and reports of bullying. He found the prevalence of bullying among 12-18 year olds
doubled from 14% in 2001 to 28% in 2005 (Gastic, 2008, p. 391). To date most
research has focused on the psychosocial and emotional effects of bullying rather than
its link to truancy and discipline problems. Gastic (2008) argues that because much of
the previous research has focused on younger students, it has left gaps in defining the
relationship between bullying and truancy among the most prevalent population.
Bullying is a proactive, psychological or physical aggression toward another person
in an effort to gain something (Gastic, 2008; Faris & Felmlee, 2011). Bullying effects
can be present as psychological and physical manifestations. Reid (2010) adds
“…bullying in all forms (physical, psychological, cyber) is becoming increasingly a cause
of pupils’ non-attendance and truancy” (p. 11). Additionally, Faris and Felmlee (2011)
discuss the presence of a fourth category of bullying, indirect which they define as
“…harmful actions perpetrated outside of the victim’s purview, such as spreading
rumors and ostracism” (p. 49). Gastic (2008) states, “…bullied youth are more likely to
miss class, be absent for a full school day or not attend an extra-curricular activity for
fear of being attacked” (p. 392). The psychosocial effects of bullying are measured
using indicators, such as depression and loneliness--both of which are also associated
with truancy (Gastic, 2008).
The problem with bullying is two-fold. Victims become truant in an effort to avoid
the bullying, but what tends to go unnoticed is the transformation of the victims into
bullies themselves, which in turn causes others to then become truant (Gastic, 2008).
Gastic (2008) refers to this as the “bullying continuum” (p. 393). Students go from
uninvolved to victim to bully to uninvolved bystander (Gastic, 2008). The process is
cyclical.
Also, research has shown the existence of a dramatic increase in truancy and the
rate of peer victimization, especially for girls (Young, Grey, and Boyd, 2008; Kronholz,
2011). Peer victimization results in the victim feeling ashamed, hopeless, helpless, and
socially disengaged. The isolation and marginalization by peers, as well as having poor

PERSPECTIVES ON TRUANCY
14
adult connections, lead to problems, such as truancy (Gastic, 2008). Initially, a student
may only miss school, or classes, for short periods of time, but reintegration to school
after each absence becomes increasingly difficult (Wilson et al., 2008). A student will
fall into a pattern of truancy which Wilson et al. (2008) state, “is cyclical” (p. 7).
Research by Dimmick et al. (2011) found no statistically significant evidence to
support that a link exists between peer victimization and truancy; however, they found a
statistically significant link between peer victimization and tardiness (p. 18-19). Dimmick
et al. (2011) suggest that further studies need to be conducted to examine the role of
peer victimization in truancy. “Acknowledging this link between victimization and school
truancy…and further investigating how, why, and when victims begin to show signs of
externalizing behaviors may inform efforts to address the unrelenting [truancy] crisis in
the U.S.” (Gastic, 2008, p. 399). Bullying and peer victimization, however, are only a
few of many potential antecedents to truancy.
Another potential antecedent which has spurred research is school refusal behavior.
Kearney (2008) has studied the phenomenon of school refusal behavior for the past
twenty years. In a 1995 study, Kearney measured for specific attributes he believed to
correlate with school refusal behavior. He administered the School Refusal
Assessment Scale (SRAS) to a sample of students. The scale contained sixteen items,
was based on four functional criteria, and used a Likert-type scoring scale. In 2007,
Kearney repeated the study with a revised version of the School Refusal Assessment
Scale (SRAS- Revised) to assess the reliability and validity. The new instrument
contained twenty-four items, and utilized the same criteria and Likert-type scale.
Once complete, his study provided evidence of support that the two instruments
were significantly correlated; thus, the instrument met the standards for reliability and
validity. Kearney (2007) concluded that attributes uncovered in the SRAS- Revised
were not only indicative of school refusal behavior, but also showed that the behavior
sustained over time.
School refusal behavior is more than merely a child not wanting to attend school. It
encompasses youth who consistently miss and those who do not miss, but attend
school under duress (Fritz, 2008). School refusal behavior has been highly studied by

PERSPECTIVES ON TRUANCY
15
mental health professionals and educators alike (Fritz, 2008; Kearney, 2007; Kearney,
2008). Common symptoms of school refusal behavior are as follows:
Excessive school absence and/or tardiness,
Skipping class(es) throughout the day,
Extreme dread and/or anxiety about school,
Unusual duress and/or anxiety during school,
Misbehavior, crying or other outbursts, and
Begging or pleading to be kept out of school. (Fritz, 2008; Kearney, 2007)
Currently, school refusal behavior is not recognized as a diagnostic clinical disorder;
however, it is associated with several psychiatric problems (Fritz, 2008). “A key feature
of school refusal behavior is its considerable symptom heterogeneity of internalizing and
externalizing behavior problems” (Kearney, 2007, p. 53). Internalizing behaviors are
manifested in the form of worry, anxiety, isolation or depression, while externalizing
behaviors are manifested in more physical form(s) of aggression, oppositional defiance,
or violence (Fritz, 2008).
Psychological research has determined four reinforcing behaviors as to why a child
does not attend school: 1) avoidance of a fearful, anxiety producing situation(s), 2)
escaping from adverse situation(s), 3) attention seeking, and 4) tangible reward (Fritz,
2008; Kearney, 2007; Kearney, 2007). These four behaviors are further classified into
two groups of either a positive or negative reinforcement: the two former—avoidance
and escapism—being negative reinforcement and the two latter—attention seeking and
tangible reward—being positive reinforcement (Fritz, 2008; Kearney, 2007).
In addition to the proffered reinforcement models, psychology theorists have long
argued in favor of learning theory models. Klein and Mowrer (1989) define learning as
“…a relatively permanent change in the probability of exhibiting a specific
behavior…occur [ring] as the result of experience, either successful or unsuccessful” (p.
3). Behaviors may be learned through peers, society, or present environments. Peer
groups tend to be central to behavior issues, though the debate continues as to whether
the behavior is learned from the group, or the group association chosen because of like
behaviors (Dishion et al., 2010). In regards to truancy, it is assumed the motivation to
attend school is learned. Likewise the motivation to be truant is learned (Dube &

PERSPECTIVES ON TRUANCY
16
Orpinas, 2009); however, it may be argued that truancy results from a failure in learning
the motivation to attend school (Wilson et al., 2008; Klein & Mowrer, 1989). Similar to
the psychological school of thought, from an educational perspective, truancy is often
considered to be a student problem, not a systemic problem.
Education Perspective
Education has held a place as a societal institution for more than a century, but
never before has it been more important than it is today. On the Kentucky Court of
Justice Truancy Diversion Program webpage, Chief Justice Joseph E. Lambert simply
states, “Education can mean the difference between a life of hardship and struggle or
one of fulfillment and success” (Para. 1). The field of education operates under the
assumption that educational institutions, regardless of locale, are beneficial, serve the
greater good of the students, and guide students to become productive adults.
Therefore, students who fail to attend school must do so because they are unhappy
children, failing in school, or delinquent. Reid (1985) speaks of educators as
“…believ[ing] that all truants are either maladjusted or delinquent…” (p. 63). Reid
(1985), however, continues to explain that there is no statistically significant evidence
showing truants to be any more maladjusted or delinquent than other students.
In her 2005 exploratory study on truancy, Sheppard states that the general
consensus among educational institutions is that truant students “…show little interest in
schoolwork, have behavioral difficulties at school, associate with antisocial peers and
attempt to hide their truancy from their parents” (p. 19). Poor school attendance has
been linked through research to personality, mental, or behavior disorders, present and
future socio-economic status, increased stress, dropout, and criminality (Henry, 2007;
Kronholz, 2011; Reid, 2010; Sander, Sharkey, Fischer, Bates, & Herren, 2011;
Sheppard, 2007; Wilson et al., 2008); however, no “direct causal effect” has been found
between poor attendance and criminality, or poor socio-economic situations (Sheppard,
2005).
The age at which truancy rates are highest, between 13 – 15 years old, is also a
time when student support systems are developmentally important. An unmet need of
greater student support may explain the changes in educational attachment and

PERSPECTIVES ON TRUANCY
17
teacher-student socialization (De Wit et al., 2010; Studsrod & Bru, 2011). Hallinan
(2008) found significant statistical evidence in support of the substantial effect teachers,
even more than peers, have in student school disassociation and attachment. Their
study stresses two factors which greatly affect teacher-student socialization, as well as
a student’s perceptions of school: 1) support offered by teachers, and 2) academic
expectations of the teacher (Hallinan, 2008, p. 272). De Wit et al. (2010) state, “School
falls short of meeting the developmental needs of students [and] many will experience
academic and psychosocial difficulties [as a result]” (p. 452). In their current research
on student perceptions of support and truancy, De Wit et al. (2010) take a closer look at
the support offered to students.
Studsrod and Bru (2011) measure teacher support from the student’s perspective
as the determinant for the level of students’ school attachment, and adjustment.
School adjustment, also known as school failure, is a significant precursor of truancy.
“…[L]ack of [school] adjustment in the late adolescent period includes dropout, reduced
motivation, increased class absence, truancy, and alienation” (Studsrod & Bru, 2011).
Studsrod and Bru (2011) view school adjustment as a direct result of teacher
socialization with students. A student’s level of school adjustment is in direct relation to
their school success. Low school adjustment involves a myriad of concerning issues,
one of the most prominent being truancy (Studsrod & Bru, 2011).
Hallinan (2008) agrees that students spend a considerable amount of their time in
school; therefore, lack of attachment to school is likely to be a significant contributing
factor to student truancy. The more a child likes school then the greater the “likelihood
that [the] student will complete school” (Hallinan, 2008, p. 272). It seems reasonable,
and logical, that a child who has a lack of attachment to school would have a poor
attendance record and inevitably become labeled truant. Students themselves have
reported school to be a major cause of their truancy. According to Dube and Orpinas
(2009) truant students often report that, “…school is boring, classes are unengaging,
[and] staff members are unapproachable…” (p. 92). Eastman et al. (2007), Reid (1985,
2000, 2008) and Kippenbrock (personal communication, 2012) have similar reports of
truants’ lack of school attachment results from students’ difficulty with peers and

PERSPECTIVES ON TRUANCY
18
teachers, problems with teaching methods, bullying, feeling school is boring, feeling
alienated, disliking the school leadership, or finding the work is too easy or irrelevant.
Reid (2010) has been studying school absenteeism, and truancy, for the past 40
years. He has conducted countless research studies on the effectiveness of truancy
related initiatives, policies, as well as contributing school, student, and parent factors.
During his tenure as a researcher and educator, Reid (2000, 2010) has developed a
questionnaire on attendance. The questionnaire is written in an open-response format
along with demographic indicators. Reid (2000) asks simple questions regarding school
attendance, not by asking what keeps them out of school, but rather what keeps them at
school. Question topics include favorite/least favorite subjects, positive/negative school
attributes, and suggested changes to the school (Reid, 2000).
Response data from Reid’s (2000) survey sample of secondary school students
indicated that there were no less than sixteen different teacher-related problems which
influenced student attendance. Teacher-student interactions, according to Hallinan
(2008) are “…of considerable importance in shaping how students feel about
themselves and their surroundings” (p. 273). It then stands to reason that teacher
approval, or disapproval, would impact student attachment to school and truancy. In
addition to teachers, myriad other external stimuli influence student attachment, or lack
of attachment, to the school institution. External stimuli are the focus of the sociological
perspective.
Sociological Perspective
Truancy, under a sociological epistemology, adheres to assumptions that are
counterintuitive to those often found in criminal justice, psychology and education.
Sociologists typically assume that the focal point is not the individual, but rather the
focus is on society and groups within society. The relationship among groups, society
and groups, or the organization of groups, can create an atmosphere conducive to
delinquency and thus, truancy. It is the organization, or disorganization, of society’s
formal and informal groups that serve as the determinant for the severity of individuals’
behavior(s) (Schmalleger, 2009).

PERSPECTIVES ON TRUANCY
19
Kronick and Thomas (2008) expand on the idea of societal groups as determinants
by looking at the reactions of what they deem as “audiences”. They classify audiences
as: society-at-large, agents of social control, and significant others. Labeling of
behavior results from the reaction of one or more of these audiences to a person’s
displayed behavior(s). Kronick and Thomas (2008) state that “Audience reactions are
more important than the behaviors themselves…” (p. 114). In regards to truancy, the
family institution is the most prominent audience whose reactions influence juvenile
behavior, followed closely by the school institution.
Parents are significant factors with respect to truant students. School attendance is
ultimately a parental responsibility; however, not all parents are cognizant of the fact, or
simply choose to ignore it. Research has shown that differences exist in perceptions of
education between rural and urban adults (Xu, 2011). Parents in urban settings tend to
have higher educational aspirations for their children than parents in more rural settings
(Xu, 2011); however, in both settings there are some parents whose perceptions result
in their acceptance of or motivation for their children’s truancy. Sheppard (2007),
Wilson et al. (2008), Reid (2010) and Donoghue (2011) define such occurrences as
“parent-condoned absences” (p. 352; p. 2-3; p.1; p. 224). Parent-condoned absence
consists of a child missing school at the behest of their parent(s). According to Wilson
et al. (2008), “…at least 40,000 pupils absent from school each day are being kept off
by their parents” (p. 2-3).
A myriad of circumstances may be at fault when dealing with these parents.
Parents may have had prior negative educational experiences themselves as students,
simply lack sufficient education, lack confidence, or deem school to be a frivolous
endeavor (Sheppard, 2007; Eastman et al., 2007; Reid, 2010). Some parents feel
school is an unsafe or ineffective environment that conflicts with their parental desire to
care for their child’s safety and well-being (Eastman et al., 2007). Students have stated
they could “resist the temptation to truant for frivolous reasons” (Wilson et al., 2008, p.
6), but would have cause for a “serious dilemma” if their parents asked them to be
absent from school (Wilson et al., 2008).
Additionally, research has shown a predominance of truancy among students who
are living in poverty, of low social status, or part of a transient family (Henry, 2007;
PERSPECTIVES ON TRUANCY
20
Kronholz, 2011; Reid, 2010). Of great concern is that the issue of truancy may be
symptomatic of parental disengagement, dependency, child neglect, or abuse (Claes et
al., 2009; Reid, 2010); however, research shows that parents from all cultural and social
classes do value education (Reid, 2010; Xu, 2011). Parents with economic and
educational challenges tend to have less positive experiences with schools, thus
weakening the parental bond to education.
Reid (2010) has defined four classifications, or types, of parents:
Parents who fight against their child’s poor attendance,
Parents who are overprotective or dependent upon their child,
Parents who feel powerless to combat their child’s truancy issues,
Parents who are simply unengaged or apathetic (Reid, 2010, p. 5).
Each of the four parent classifications involves interaction with the school and teachers
to some degree. Over time, it is inevitable that a bond, whether positive or negative, will
be formed between the teacher and the parent. Research has shown that a connection
exists between parent engagement in schooling and the positive or negative feedback
received from school (Reid, 1985; Reid, 2000; Reid, 2010). Constant negative
feedback results in judgment of teachers and schools, which in turn results in conflict
between parents and schools (Reid, 1985; Reid, 2010).
Goffman (1963) argues that the problem is in the subject. The student(s) are not
the subject which should be studied in what he calls “situational improprieties” (p. 3).
He explains, “the study of situational improprieties has led to studying the offender
rather than the rules and social circles that are offended” (Goffman, 1963, p. 3). The
values and norms of the situation are the driving force behind behaviors. Each
individual involved maintains the behaviors in a manner that Goffman (1963) refers to
as “structure of involvement in the situation” (p. 193). Involvement, however, is not
merely taking part in, or being a member of, the situation. Goffman (1963) clarifies
involvement to be “a kind of respect and regard for [the situation] to which attachment
and belongingness are owed” (p. 196). He also goes on to explain that individuals
involved in a situation band together to form a little society, or subculture. The
subculture has its own social life and form of social reality (Goffman, 1963). Thus,
truancy is not an individual response, but a collective one.

PERSPECTIVES ON TRUANCY
21
Truancy is not only a collective response, but is also a contextual issue. The
behavior is accepted as a norm within the subculture and accepted as standard. The
standard is part of the members’ societal reality. The group becomes problematic when
interacting with the institutional society of the school and goes against its societal norms
(Goffman, 1963). Goffman (1963) exposes the danger of these subcultures which
partake in the adverse behaviors: “[W]hen persons are joined in this way they can
command and plead with each other, insult or complement each other, inform and
misinform each other, or be seen (by others) as being on close terms…” (Goffman,
1963, p. 196-197). The societal association is what sustains the adversity of the
interaction between the subculture and school society since the smaller bond of the
subculture remains stronger, and more intimate, than the larger bond of the school.
Furthermore, Goffman (1963) argues dangers are omnipresent with the potential to
occur at any time in any place even when the presence is not realized (p. 197). He
goes on to specifically reference middle class society as being oblivious to the existence
of these subcultures (Goffman, 1963, p. 197).
One could rationalize that conforming to the subcultures, as Goffman (1963)
discusses, is the result of conditioning through social structure and strain. Murphy and
Robinson (2008) take a closer look at Merton’s theory of strain to explain why some
people are more likely to have antisocial or illegal behaviors than others. Merton
theorized that societal pressures, in regards to societal institutions, continually build until
resulting in strain upon an individual. Individuals are conditioned through social
structure in what Merton classified as a type of aspiration framework of reference, which
leads to strain. The strain then manifests in deviant behavior(s), such as truancy
(Murphy & Robinson, 2008).
There are two defining elements that comprise Merton’s social strain theory: 1)
cultural goals, and 2) institutional, or societal, norms. Society defines the cultural goals,
purposes, and interests, which Merton argued involve variations and levels of prestige
relating to the driving force of man (Murphy & Robinson, 2008). In addition, society
defines “normal,” or acceptable behaviors. According to Murphy and Robinson (2008),
there exists a “disjuncture between the goals valued by society and the means available
to people to achieve them” (p. 503).

PERSPECTIVES ON TRUANCY
22
Social causes, such as compulsory school attendance, increase pressures on students
to graduate and succeed in life. However, every student does not have the means or
culture that supports academic success. As an example of a child with the most
unfortunate circumstances, Upchurch (1996) tells his personal account in his seminal
work Convicted in the Womb, “I had no preparation to help me adjust to
[school]…without models, without instruction, without emotional nourishment, or
intellectual preparation, a child cannot possibly perform to the standards set by society”
(p. 16-17). The variants of success in pursuing societal goals lead to feelings of strain
and oppression in both individuals and groups (Murphy & Robinson, 2008).
Family and parents are considered to be a child’s principal socialization institution
where the child’s behavior is contained through social control mechanisms (Donoghue,
2011). Reid (2010) discusses the family institution and compulsory school attendance,
“Having statutory responsibility for school attendance regulations does not always sit
happily alongside existing social work paradigms, especially when it comes to taking
court action against some of the most needy families (often single mothers) in society”
(p. 10). Statistically, mothers are more likely to have custody of children and thus are
the parent the laws affect most. Donoghue (2011) believes this is an unfair burden
society has placed upon single mothers. Single mothers tend to be women judged by
society against the defined cultural societal norms. They are seen as being “flawed” as
a mother, and then shamed by society through punitive measures by the state
(Donoghue, 2011). According to Donoghue (2011), punitive court sanctions for truancy
are “…effective at deterring truancy if the parent is the only cause of the child’s non-
attendance at school and, moreover, the child is able to be controlled by the parent’s
methods” (p. 243). She continues stating that truancy laws “…serve only to scapegoat
parents of truanting children while failing to have any substantive effect on truancy
rates. [They] fail to perform the functions they strive to address” (Donoghue, 2011, p.
244).
Summary
Previous research in criminal justice, psychology, education and sociology shows
the diversity of perspectives in relation to the issue of truancy; however, even with their

PERSPECTIVES ON TRUANCY
23
differences, four common theories emerge – control theory, interaction theory, strain
theory, labeling theory. Each theory is incorporated into the disciplinary perspectives.
The first of the theories, control theory, suggests that there is some force which
exhibits control, thus, affecting truancy. In criminal justice, control lies with the parents
who are expected to send their children to school; however, there is also the hidden
imposition of control by the state. The state enacts truancy laws, as well as,
punishments when those laws are not followed. In psychology, control is seen in the
psychological processes of the student. The student determines whether or not to
truant. This may be in the form of rational choice, or a more subconscious drive.
Education holds control to be the school systems and school administrators. The duty
of the school system and its administrators is to retain and educate students. In
sociology, control has a layered effect, from micro to a macro level. Levels begin with
family and progress to society-at-large.
Second, interaction theory suggests that there is some form of interaction taking
place. In criminal justice, the interaction, positive or negative, between the student and
the police, government, or other authority figures to affect truancy. Psychology sees the
interaction between feelings versus cognition to influence truancy. Education follows
the interactions within the school environment with classmates, teachers, staff and
administrators. In sociology, the societal interactions that the student experiences, such
as community life or street life, are thought to drive the student to attend school or not.
Third, strain theory suggests there are pressures that students are faced with which
affect truancy. In criminal justice, strains are considered external factors, such as peer
pressure or approval seeking, as determinants that underlie truancy. Psychology sees
strain as an internal struggle with feelings inside the student, or the strain of existing
psychological issues which may be present. Education promotes strain by imposing
unattainable and unrealistic high academic standards on students. In sociology, it is the
strain of meeting society’s defined goals, such as striving for the American dream.
Finally, labeling theory suggests that when a student is labeled it becomes a self-
fulfilling prophecy. In criminal justice, education, and sociology labeling as an external
phenomenon. Police, educators, or society attached an identity to a student which
determines further responses. Labels take all forms and may be positive or negative.

PERSPECTIVES ON TRUANCY
24
In the case of truancy, often times it is the negative labels that have the greater effect.
Psychology considers labeling as an internal problem with the student’s self-image.
Beliefs, such as being worthless, stupid, or not good enough, are internalized to the
point of exhibiting behaviors which attract external labeling. The student sees this as
confirmation of his/her beliefs.
These theories lay the foundation for the aforementioned disciplines to be
integrated together in a manner to better comprehend and address a very complex
problem; however, even today no integration has been sought. As a result, there has
been no effective method(s) of combating the present epidemic: As long as the
arguments rage on among the disciplines, it is unlikely that an effective method(s) will
ever be found.
The purpose of this study is to bring the disciplinary perspectives together in such a
manner as to adhere to an instrumental interdisciplinary approach defined by Repko
(2008) as “…a pragmatic approach…focus[ing] on research, methodological borrowing,
and practical problem solving…” (p. 18). Instrumental interdisciplinarity is pertinent for
the purpose of this study as the foci are in alignment. Instrumental interdisciplinarity,
according to Repko, seeks “…to illuminate and critique the assumptions of the
perspectives…” (p. 18). The objective of the present work is to do the same, illuminate
and critique.
Review of the literature shows two distinct characters: student(s) and society.
Regardless of the disciplinary perspective, both must be present for the phenomenon of
truancy to exist. The main research question to be addressed is: what underlies
truancy? There is no simplistic explanation. The present study does not seek to
simplify the explanation or undermine the complexity of the problem: Rather, the intent
is to further expose and clarify in such a manner as to draw together the
aforementioned insights. It is hypothesized that the constructs underlying truancy will
present common theoretical underpinnings which broach disciplinary boundaries
forming an interdisciplinary relationship.

PERSPECTIVES ON TRUANCY
25
METHOD
Measures
Item compilation
A 100-item questionnaire instrument, with additional demographic information, was
developed for this study to assess student perspectives on truancy. The purpose of
creating a new questionnaire for truancy was dual purposed: 1) to assess the under
lying constructs of truancy as defined in the review of the literature, and 2) to gain
insights on student perspective in an effort to advance truancy research. The
questionnaire instrument was presented in a Likert-type response format. Participants
indicated agreement on a 5-point scale to each item statement. The agreement scale
was broken down as: 1- strongly disagree, 2- somewhat disagree, 3- neither agree or
disagree, 4- somewhat agree, 5- strongly agree.
The newly created questionnaire instrument for this study was compiled using
adapted, adopted, and original item statements (see Appendix C). Each statement was
based on one of four underlying theories which were uncovered in the literature review.
Certain statements were reverse coded to ensure that participants were paying
attention and taking the survey seriously. The questionnaire instrument consisted of
five sections of twenty statements each. Sections were: “about school”, “about teachers
and classes”, “about parents”, “about friends”, and “about you”. Demographic questions
were presented at the end of the instrument to aid in classification and statistical
comparisons.
Participants
According to Crabtree (personal communication, 2012), the managing attorney at
the Children’s Law Center, the average age of a truant youth in the Commonwealth of
Kentucky is approximately 15 years old, or 10th grade status. Therefore, 10th grade
students have been deemed the most appropriate population for this study. All
members of the current 2012-13 academic year 10th grade class from a Kentucky urban
and a rural high school were invited to participate in the present study.
Participants were recruited from the 10th grade student population at these two area
high schools. The high schools are similar in socioeconomic status and population size.

PERSPECTIVES ON TRUANCY
26
The two areas where the schools are located both have poverty issues, and low
education attainment. According to the Kentucky Department of Education website, the
two schools have a class size of approximately 200 students, respectively
(http://education.ky.gov/Pages/default.aspx). The schools were selected based on their
proximity, should the principle investigator decide to do a follow-up study. Also, the
principle investigator had contacts at each school that provided easier access to the
research population.
The first high school was located in an urban setting while the second was located
in a rural community. Knoblauch and Hoy (2008) found “…that rural and urban schools
face more challenges regarding resources, teacher quality and supply, and discipline…”
(p. 168). Both urban and rural areas are stricken with poverty and instability in their
school systems; however, urban areas tend to have higher educational aspirations
(Partlow and Ridenour, 2008; Xu, 2011). Rural areas are increasing in crime, drug, and
gang activity, with some substance use being greater in rural than in urban areas
(Stanley, Comello, Edwards, and Marquart, 2008). Although the settings differ, the
difficulties met by students are much the same (Baker & Holloway, 2009; Hutchison and
Henry, 2010). Research has found that for children in both areas “…their social,
environmental, and educational difficulties are magnified by the overall lack of resources
and opportunities, and further reduced services” (Baker and Holloway, 2009). The
principal investigator does not anticipate a statistically significant difference in truancy
patterns to exist between the urban and rural school settings. The belief of the principal
investigator was that the factors leading to truancy were not dependent on setting, but
rather were an underlying issue regardless of locale.
Procedure
Informed consent was obtained from parents and participants (see appendix A & B).
Initially, an opt-out consent for parents was agreed upon with the schools where parents
needed to return the consent to the school only if they did not want their child to
participate in the study; however, due to the population of interest, the Institutional
Review Board required that an opt-in consent be used which required the parents to
return the consent form to the school. Parents and participants were informed of the

PERSPECTIVES ON TRUANCY
27
purpose and nature of the research as well as the voluntary nature of student
participation, and confidentially of the study. They were also assured participation
would in no way affect grades or student records. Parent consent forms were sent
home via the respective English teacher.
Once in the classroom, the principal investigator reiterated the purpose of the study,
provided information on questionnaire completion instructions, and reminded
participants they were free to withdraw from the study at any time, should they choose
to do so. Participants were once again assured of the confidentiality of their responses
and student data. Participants were presented with an active consent form (see
appendix B). Consents were signed by participants in the presence of the principle
investigator and collected with the individual questionnaires.
The principle investigator presented the self-completion questionnaire to
participants in the school setting during school hours in their respective 10th grade
English class. Questionnaires were given to the students who had consented once the
teacher was no longer present in the room. Completion of the questionnaire required
between 15 and 25 minutes. Questionnaires were collected in an unmarked manila
envelope to retain confidentiality, and stored in a secure and locked location. In
accordance with the request of the IRB, students were provided with additional
information post-survey regarding available services should they experience any
emotional reaction to the survey items.
Prior to formal analysis, actual student record data were obtained from school
administration. The student data consisted of: grade point average, number of days
absent in the past year, number of tardy events in the past year, age and gender.
Student record data were matched with survey responses in order to understand the
connection between data and survey responses.
Questionnaires were matched via the signed informed consent to student data and
then assigned a participant number. The participant number linked the participant
responses to school information without indicating identity. After a participant number
was assigned, any identifying information was deleted from the data and informed
consent separated from the survey responses, leaving no way to rematch the student
record data or survey responses to an individual participant. Once the student record

PERSPECTIVES ON TRUANCY
28
data and survey responses were matched and ready to be analyzed, the signed
consent forms were separated from questionnaire responses and housed in a secure
and locked location. All research data has been stored on a password protected
computer which is accessible only by the principle investigator.
The sample for the present study was anticipated to be approximately 400
participants between the two schools; however, due to the requirement of a n opt-in
consent for parents, a smaller sample size was obtained. Initially, exploratory factor
analyses were to be completed separately for each school, one for urban and one for
rural. Then, the results of the two analyses were to be compared to determine common
theoretical perspectives underlying truancy. The use of an opt-in consent greatly
diminished the sample size for this study. Due to the small sample, n = 70, the principle
investigator decided to combine the two school populations.
Results
Data Screening
Prior to analysis, the data was examined through various SPSS programs for
evaluation of assumptions, missing values, and data entry. Assessment of missing
values showed a single case without values for an entire page of the questionnaire.
The case was removed from any further analysis. After removal of the case, data
showed a total of 14 randomly dispersed missing values. Multiple regression for data
imputation was performed (see Table 1). Post regression four variables were below the
criteria for data imputation, R2 > 0.5; therefore, the four variables were removed from
further analyses due to the missing data values.

PERSPECTIVES ON TRUANCY
29
Table 1 Multiple imputations for items with missing data values.
Item Missing R2 Imputed value value
5 2 .570 3, 4 8 1 .559 4 30 1 .592 4 34 1 .512 5 41 1 .708 3 71 1 .638 3 80 1 .671 5 93 1 .668 3 97 1 .540 3
Note: p < 0.05; Item descriptions can be found in Appendix E.
Reverse scored items were recoded prior to computing frequency statistics to
evaluate assumptions of multivariate analysis. A total of 55 variables appeared to be in
violation of normality with 15 variables determined to require logarithmic transformations
for severe skewness/kurtosis. Skewness and kurtosis of variables represents the data
have a significant amount of reported values which are clustered around a single value
for that variable. The variable is then considered non-normal and requires a
transformation to correct for the issue in order to proceed with analyses. In the event
that non-normal variables are not transformed when presenting skewness or kurtosis,
results of analyses would be a misrepresentation of actual findings. When a larger
sample size is obtained, the recorded values of a variable become more normal and do
not require transformation. The small sample size for this study was believed to have
affected the skewness and kurtosis of the variables. If the original anticipated sample
size of approximately 300 to 400 participants was obtained, the variables would be less
likely to require transformation.
Post transformation assessment for this study showed 3 variables – “My parent(s)
want me to succeed”, “My parent(s) do not care if I graduate”, “I have run-ins with the
police often” – to still have a skewness/kurtosis issue; however, the it was not a severe
issue and the variables were retained for analysis. Remaining variables were tolerable
for normality post transformation.
Exploratory Factor Analysis

PERSPECTIVES ON TRUANCY
30
Exploratory factor analysis was conducted using principal axis factoring (PAF) and
principal component analysis (PCA) on the survey responses. The use of exploratory
factor analysis was dual purposed: first, to reduce the large set of item statement
variables into a smaller set, or factor structure, which then allows for factor loadings of
item variables to be evaluated, and second, to summarize patterns among the
variables. The use of exploratory factor analysis allowed for the principle investigator to
discover underlying latent constructs through the reduction of the set of variables into
distinct factors (Tabachnick & Fidell, 2007; Fabrigar & Wegener, 2012; Kline, 2005).
The constructs were then analyzed for interdependences among the item statement
variables (Fabrigar & Wegener, 2012; Thompson, 2004; Walkey & Welch, 2010).
Exploratory factor analysis examines strong relationships between continuous
variables without pattern restrictions using a general linear model. Strong relationships
allow data to be organized and factors, which assess the phenomena of interest, to be
determined and extracted from the model. The extraction of indicated factors not only
simplifies the manageability of data, but also clarifies the distribution of variance
(Fabrigar & Wegener, 2012; Walkey & Welch, 2010; Brown, 2006).
Extraction of factors, however, is only the first phase of exploratory factor analysis.
Extraction serves as the best explanation of factor variance in relation to the total
variance within the model (Meyers, Gamst, & Guarino, 2006; Bryant & Yarnold, 1995;
Thompson, 2004). The choice of factor extraction method is one of the most important
decisions when performing exploratory factor analysis (Tabachnick & Fidell, 2007). The
two most common methods of extraction are principal component analysis and principal
factor analysis, also known as principal axis factoring. Although other methods are
available, principal component analysis and principal axis factoring are the most
understood, respected, and utilized as extraction methods within research (Tabachnick
& Fidell, 2007; Fabrigar & Wegener, 2012; Kline, 2005; Williams, Brown, & Onsman,
2010).
Principal axis factoring and principal component analysis have some similarities in
respect to interpretations; however, key differences exist between the two methods
(Kline, 2005). First, and foremost, the most important consideration is what is the goal
of the research? According to Tabachnick & Fidell (2007), “PCA [principal component
PERSPECTIVES ON TRUANCY
31
analysis] is the solution of choice for the researcher who is primarily interested in
reducing a large number of variables down to a smaller number of components” (p.
635). Conversely, principal axis factoring should be chosen, according to Fabrigar &
Wegener (2012), “…when the goal of the research is to identify latent constructs for
theory building, or to create measurement instruments in which the researcher wishes
to make the case that the resulting measurement instrument reflects a meaningful
underlying construct…” (p. 32). As previously stated in the review of the literature, the
purpose of the present study is to further explore and uncover the interdisciplinary
relationships between the theoretical constructs underlying the phenomenon of truancy
for the disciplines discussed in the review of the literature. Therefore, the principal
investigator chose to execute principal component analysis, as well as, principal axis
factoring for the study.
The decision to employ principal component analysis and principal axis factoring
was founded on an additional difference which exists between the two methods. Unlike
principal component analysis, principal axis factoring was designed to account for both
systematic and random error in order to extract common factors which elucidate the
variance in items (Tabachnick & Fidell, 2007; Fabrigar & Wegener, 2012; Kline, 2005).
The variance in the items is comprised of the common, or shared, variance in addition
to the unique variance of each item. There is less of a chance that the variance will be
heavily weighted on the first factor in principal axis factoring as is the case with principal
component analysis.
According to Fabrigar and Wegener (2012), “…when the data correspond to
assumptions of the common factor model, principal axis factoring procedures produce
more accurate estimates than PCA [principal component analysis]” (p. 33). The
common factor model is the mathematical model which underlies principal axis
factoring. The basic concept of the common factor model is that correlations will not
equal zero due to the influence of an unobservable construct(s) on the measured
variables. This concept is in direct contrast to the model underlying principal
component analysis where correlations are all assumed to be zero (Fabrigar &
Wegener, 2012). The assumptions of the common factor model and principal axis
factoring are more realistic due to the acknowledgment of error being present in addition

PERSPECTIVES ON TRUANCY
32
to common and unique variance in the items. In practice, it is unrealistic to assume, as
principal component analysis does, that data are measured without error (Fabrigar &
Wegener, 2012; Kline, 2005).
Extraction method is the first phase of exploratory factor analysis. The second
phase requires determination of what rotation method to employ in the analysis. The
purpose of the second phase, rotation of the factors, is to simplify the model via
correlations (Meyers, Gamst, & Guarino, 2006; Bryant & Yarnold, 1995; Thompson,
2004). Rotation does not change the variance, but rather redistributes the variance
across factors for clarity. Rotation of the factor analysis solution clarifies the pattern of
results for easier interpretation. Rotation of the solution does not alter the analysis,
factors, or solution. The mathematical structure and formulas which underlie the
analysis remain unaffected (Fabrigar & Wegener, 2012). Numerous rotation methods
are available; however, two basic classifications exist- orthogonal and oblique.
An orthogonal rotation assumes that factors are uncorrelated. Factor axes remain
held at 90 degrees. Variance, communalities, and the uncorrelated nature of factors are
held constant, only the factor loadings are altered (Kline, 2005; Tabachnick & Fidell,
2007). Orthogonal methods are widely used; however, it must be remembered that
orthogonal methods operate under the assumption that all factors are uncorrelated. In
practical application, possessing true uncorrelated factors in a dataset is unrealistic
(Fabrigar & Wegener, 2012; Kline, 2005).
In contrast, oblique rotation was introduced as a more plausible approach to data
which allows for the correlation of factors. Implementation of an oblique rotation does
not cause, or need, factors to be correlated. Oblique rotation works well with both
correlated and uncorrelated factors since it is a more general rotation than an
orthogonal (Kline, 2005; Tabachnick & Fidell, 2007; Fabrigar & Wegener, 2012). Unlike,
in orthogonal rotation, oblique rotation does not hold the factor axes at 90 degrees, but
rather allows for reduction in angles. The reduction in angles offers a better factor
structure for interpretation. The principal researcher chose an oblique rotation method,
specifically a promax rotation.
Promax rotation is one method which is applicable in a variety of contexts.
Therefore, it has been widely used in research (Verleger, Paulick, Mocks, Smith, &
PERSPECTIVES ON TRUANCY
33
Keller, 2013; Dien, 2010; Fabrigar & Wegener, 2012). A promax rotation begins with an
orthogonal rotation as a starting point which is then mathematically transformed. The
mathematical transformation takes the factor loadings of the orthogonal rotation and
raises them to the power of two, three, or four which results in an oblique solution.
In addition to extraction and rotation methods, an important consideration with
exploratory factor analysis is the size of the sample. General rules of thumb for
minimum sample size are that analysis requires a large sample of at least 300 cases,
(Fabrigar & Wegener, 2012; Walkey & Welch, 2010) or 5 times the number of items plus
100 (Tabachnick & Fidell, 2007). However, the aforementioned are only general rules
of thumb. Adequate sample size for conducting exploratory factor analysis has been
the subject of debate among researchers for some time. Varying opinions and lack of
agreement lead to much confusion when undertaking exploratory factor analysis.
Williams, Brown, and Onsman (2010) argue that lack of consensus “…can at times be
misleading and often do not take into account many of the complex dynamics of
[exploratory] factor analysis” (p. 4). Mundfrom, Shaw, and Ke’s (2005) study on
minimum sample size recommendations for exploratory factor analysis found that no
absolute minimum exists among the literature; however, certain criteria have been
noted in previous literature, such as the aforementioned general rules of thumb. They
found that the relationship between sample size, number of variables and factors, and
strength of communalities was more indicative of strong analyses than a minimum
single sample size requirement. A study that has a small sample (< 100), but presents
higher communality values and lower variable to participant ratio (1:5) would be
considered, according to Mundfrom, Shaw, and Ke, to be as adequate for analyses as a
sample of 300 or more. In a study by Hogarty, Hines, Ferron, and Mundford (2005),
they found that good factor recovery was not dependent upon a minimum sample size,
rather higher communality levels had a greater affect upon good factor recovery. Item
retention for factors was determined using the criteria of a factor loading at 0.500 or
higher with no cross loadings at 0.350 or higher (Tabachnick & Fidell, 2007, 649; Kline,
2005, 245), which represents 25% overlapping explained variance among items.
Descriptive Statistics
PERSPECTIVES ON TRUANCY
34
Four hundred parental consent forms were sent to students’ parents. A total of 81
consents were returned for a response rate of approximately 20%. Of the 81 returned
consents, 73 parents consented to their student’s participation and 8 did not give
consent, for a final response rate of 18.25%. Student age ranged from 15 to 17 years
old (M = 15.76, SD = 0.52). The vast majority, n = 56, of students identified as “White”
(1) (M = 1.20, SD = 0.40). Two-thirds, n = 46, of students were “Female” (1) (M = 1.34,
SD = 0.94). Students reported their average grades to be “Mostly A’s” (1) and “Mostly
B’s” (2) with n = 27 for both (M = 1.91, SD = 0.94). This was slightly higher than the
school reported student grade point average (GPA) scores, “Mostly B’s” (2) and “Mostly
C’s (3), (M = 2.92, SD = 0.81). The mean analyzed in the descriptive statistics was the
mean coded score not the mean of actual GPA values. Student reported grades were
reported as a general categorization of overall grades; therefore, school record GPA
data was coded in the same manner for comparison purposes. The higher sample
mean was most likely a result of the time lapse between participation and obtainment of
the school record data from the school. Parents’ highest level of education showed
88.6% to have at least obtained a high school diploma (2), with 42.9% possessing some
form of post-secondary degree (3, 4, 5) (M = 2.70, SD = 1.16). After evaluation of the
sample’s descriptive statistics, means and standard deviations for individual item
statements were verified as measures of central tendency and variability. Item
statements that met the criteria requirement for a factor loading of .0.500 or higher with
no cross-loading were included.
Analysis
Exploratory Factor Analysis
Exploratory factor analyses were conducted for the following: four defined theories–
control, interaction, strain, labeling - individually, combined theories, five categorical
sections – school, teacher & classes, parents, friends, you - individually, and combined
sections. As stated previously, the four underlying theories discovered to underlie
truancy across disciplinary perspectives were: control theory, interaction theory, strain
theory, and labeling theory.

PERSPECTIVES ON TRUANCY
35
Initially, principal axis factoring extraction was conducted followed by principal
component analysis for logical comparison of factor results. Kaiser’s measure of
sampling adequacy and Bartlett’s test of sphericity (see Table 2) were assessed
(Hogarty et al., 2005; Kline, 2005; de Winter et al., 2009; MacCallum et al., 2001;
Mumfrom et al., 2005; Williams et al., 2010). Kaiser’s measure of sampling adequacy
(KMO) is a more sophisticated method of determining the adequacy and presence of
factors. In reference to KMO, according to Tabachnick and Fidel (2007), “Values of 0.6
and above are required for good FA [factor analysis]” (p. 614). Leech, Barrett, &
Morgan (2011) state, that KMO “…is inadequate if less that .50” (p. 72).
Bartlett’s test of sphericity is another measure assessed for indication of the
presence of correlations. Bartlett’s test is sensitive measure which tests for zero
correlations among the variables. Bartlett’s test is measured using chi-square. The chi-
square value is evaluated to determine the significance of the test (Tabachnick & Fidell,
2007). A significant Bartlett’s test value indicates that the model is suitable for factor
analysis. In addition KMO and Bartlett’s test of sphericity, communalities were
assessed to determine interpretability and recovery of factors (Hogarty et al., 2005;
Kline, 2005; de Winter et al., 2009; MacCallum et al., 2001; Mumfrom et al., 2005;
Williams et al., 2010).
After validation of KMO, Bartlett’s test of sphericity (see Table 2), and
communalities for appropriateness of analysis, both quantitative and qualitative
interpretation of each model were conducted for both the exploratory factor analysis
with principal axis factoring, as well as, with principal component analysis.

PERSPECTIVES ON TRUANCY
36
Table 2
KMO and chi-square values for models
KMO Χ2 df
Full 4 theory model .521 2262.554 1128 Interaction .768 307.393 78 Control .631 181.479 66 Strain** .437** 16.378** 10 Labeling .688 467.288 120 Full 5 section model .521 2262.554 1128 School .653 154.949 45 Teacher/Class .749 179.758 28 Parent .641 163.285 55 Friend .672 82.893 21 You .792 251.366 45
Note: Bartlett’s test of sphericity significant, p < 0.005. Χ2 = Bartlett’s chi-square. **Insignificant Bartlett’s chi-square test, p = 0.089. Values for both principal axis factoring and principal component analysis were the same.
Exploratory factor analysis using principal axis factoring (PAF) and principal
component analysis (PCA) extraction were performed on each theory individually. Item
retention was determined using the criteria of a factor loading at 0.500 or higher with no
cross loadings at 0.350 or higher (Tabachnick & Fidell, 2007, 649; Kline, 2005, 245),
which represents 25% overlapping explained variance among items. First, the
interaction model was assessed as having good factorability and being interpretable, X2
(78) = 307.393, p < 0.005, KMO = 0.768, although communalities were low with a few
moderate (see Table 3). The PAF model was comprised of 3 items, as well as, the PCA
model. Items that were contained in both models were, “I get along well with my
teachers” (22), and “I get into fights often” (89). The PAF model contained the
additional item, “I am nice to others” (100) while the PCA model contained, “School is a
positive part of my day” (4).

PERSPECTIVES ON TRUANCY
37
Table 3
Factor communalities and loadings for interaction theory principal axis factoring and principal component models.
PAF PCA Item Loading h2 Loading h2
100 .781 .560
22 .745 .628 .804 .664 89 (rev) .544 .392 .681 .471
4 .561 .331
Note: h2 denotes communality values. Boldface indicates factor loadings. Items designated (rev) were reverse scored. Item descriptions can be found in Appendix E.
Second, the control model was assessed as being interpretable with good factor
recovery, X2 (66) = 181.479, KMO = 0.631, communalities were mostly moderate (see
Table 4). The PAF model was comprised of 3 items, as well as, the PCA model;
however, only one item overlapped in the two models, “My friends attend school
regularly” (80). The PAF model also contained the additional items, “School is a waste
of time” (1) and “I do not feel like I am a part of my classes” (37), while the PCA model
contained the additional items, “It is ok to skip school when I feel like it” (10) and “I want
to succeed in school” (2).
Table 4 Factor communalities and loadings for control theory principal axis factoring and principal component models.
PAF PCA Item Loading h2 Loading h2
37 (rev) .768 .561 80 .744 .572 .759 .623 1 (rev) .678 .439 2 .550 .306 10 (rev) .530 .283
Note: h2 denotes communality value. Boldface type indicates factor loading. Items with (rev) designation were reverse scored. Item descriptions can be found in Appendix E.

PERSPECTIVES ON TRUANCY
38
Third, the strain model did not meet the requirement for sampling adequacy, KMO =
0.437, and presented an insignificant Bartlett’s test of sphericity, as well as an
insignificant chi-square value, X2 (10) = 16.378, p < 0.089; therefore, the model was
uninterpretable. The model produced two extracted items, “My family depends on me
for help” (48), and “My parent(s) need my help during the day” (53). This proved true for
both the PAF and PCA models.
Lastly, the labeling model was assessed. The model presented good factor
recovery and was interpretable, KMO = 0.688, Bartlett’s test of sphericity was significant
X2 (120) = 467.288, p < 0.005, and communalities were moderate (see Table 5). The
PAF model contained 8 items while the PCA model contained 11. Both models
contained items such as, “I have a good reputation” (19) “I am in trouble at school often”
(93), “I am known for my risky lifestyle” (97), “I am frequently sent to the office for
misbehavior in class” (27), and “I am a good student” (35). The PAF model, however,
also contained the item “I consider myself to be deviant” (96). Additionally, the PCA
model contained the items, “My friends are frequently in trouble at school” (71), “My
parent(s) are good people” (57), “My parent(s) do not care if I graduate” (60), and “I am
frequently in trouble at home” (61).
Table 5
Factor communalities and loadings for labeling theory principal axis factoring and principal component models.
PAF PCA Item Loading h2 Loading h2
19 (rev) .757 .594 .782 .621
27 .741 .517 .702 .566 93 .687 .461 .697 .512 35 (rev) .663 .455 .704 .500 96 .616 .376 94 .614 .402 .671 .452 56 (rev) .573 .367 .650 .423 97 .524 .276 .565 .332 71 .616 .418 57 (rev) .529 .286 60 .535 .289 61 .505 .257 Note: h2 denotes communality value. Boldface type indicates factor loadings. Items with (rev) designation were reverse scored.

PERSPECTIVES ON TRUANCY
39
As seen in Table 6, the full theoretical model analyzed with principal axis factoring
presented four distinct factors explaining 42.66% of the variance in the model; however,
it was noted that even though the Bartlett’s test of sphericity was significant, X2 (1081) =
2179.110, p < 0.005, the KMO = 0.511 did not meet the 0.6 or above requirement for
adequate sampling or good factorability. Therefore, with this in mind, interpretation of
factors was approached with caution.
Three of the four factors closely aligned with original hypothesized underlying
theories. Factor 1 contained 8 items which incorporated items such as, “I get into fights
often” (89), “I am known for my risky behavior” (97), “I am in trouble at school often”
(93), and “I am frequently sent to the office for misbehavior in class” (27). Three items
which appeared in factor 1 were not originally coded as representing labeling theory.
Two of the items, “I get into fights often” (89) and “I am nice to others” (100), were
coded as representing interaction theory. The third, “I often get into arguments with my
teachers” (31), was intended to represent strain theory. Most likely the cross over from
the intended theory into labeling theory resulted from the items having not been written
clearly or concisely enough to capture the intended concepts. However, collectively,
since the majority of the items were intended as labeling, the factor sufficiently
represented labeling theory and, as such, has been give the title of “Labeling”.
Factor 2 contained 5 items and incorporated items such as, “My parent(s) require
me to attend school” (46), “My parent(s) would be angry if I missed school regularly”
(44), and “I am afraid of being caught if I skip school” (12). Two items included in the
factor were not intended as control items. The items, “My parent(s) are good people”
(57) and “My parent(s) are proud of me” (56), were intended as representative of
labeling theory; however, upon further examination, the researcher determined that the
two factors did appear more appropriate as control items than as labeling since the
items was not as indicative of labeling in this context. Collectively the 5 items were
indicators of control theory, and were labeled “Control”.
Factor 3 contained 2 items and included items such as, “I enjoy being with others”
(99), and “I get along with other students” (74). The three items were each
representative of, and coded as, interaction theory items; therefore, factor 3 was labeled
as “Interaction”. Factor 4 did not adhere to any of the hypothesized underlying theories.
PERSPECTIVES ON TRUANCY
40
The items contained within the factor were “Education is only for smart kids” (20),
“School is meant only for kids going to college” (18), and “School is a waste of time” (1).
The remaining theory would have been strain theory, however, collectively the items are
more aligned with stress than internal strain.
The PCA model presented two important differences from the PAF model. First, the
PCA model produced only 3 factors rather than the requested 4 factors. Also seen in
Table 6, the full theoretical model analyzed with principal component analysis of the 3
factors presented only 1 that was interpretable which explained 24.79% of the variance
in the model. Once again, it was noted that even though the Bartlett’s test of sphericity
was significant, X2 (1081) = 2197.110, p < 0.005, the KMO = 0.511, did not meet the 0.6
or above requirement for sampling adequacy or good factorability. Therefore,
interpretation of factors was approached with caution.
Second, it was noted that Factor 1 of the principal component model contained 3
more items than the principal axis factoring model. The researcher attributes this to the
fact that, as stated in the literature, principal component analysis tends to weigh items
more heavily on the first factor. Additionally, item statements contained in factor 1 were
equally representative of 3 of the 4 theories – labeling, control, and interaction. As a
result, factor 1 was more difficult to interpret. Labeling items contained in the factor
were items such as, “I have a good reputation” (19), “My parent(s) are proud of me”
(56), and “My friends are frequently in trouble at school” (71). Control items were items
such as, “I do not feel like a part of my classes” (37), and “My friends attend school
regularly” (80). Interaction items included items such as, “I get along well with my
teachers” (22), “I get into fights often” (89), and “I am nice to others” (100).
Factor 2 and factor 3 contained only a single item, “My teachers notice when I am
absent” (25) in factor 2, and “My friends dare me to do things” (73) in factor 3. Both
factors were deemed uninterpretable due to containing too few items.

PERSPECTIVES ON TRUANCY
41
Table 6 Comparison of factor scores and communalities for full 4 factor theory model using principal axis factoring and principal component analysis with promax (oblique) rotation PAF PCA
Factor Factor
Item 1 2 3 4 h2 1 2 3 4 h2
89 (rev) .867 .706 .744 .706 93 .765 .550 27 .761 .516 17 .737 .484 .605 .537 31 .706 .602 19 (rev) .628 .607 .767 .627 96 .602 .307 100 .517 .371 .578 .408 35 (rev) .675 .509 22 .778 .613 46 .697 .517 57 (rev) .668 .501 44 .560 .254 12 .545 .210 56 (rev) .530 .529 4 .544 .354 99 .783 .794 74 .776 .732 51 (rev) .506 .391 37 (rev) .701 .557 20 .966 .759 18 .655 .457 1 (rev) .520 .503 .606 .556 80 .686 .520 56 (rev) .679 .541 71 .608 .417 25 .604 .411 73 .524 .371 Note: h2 indicates communality value. Boldface type indicates factor loadings. Items with (rev) designation were reverse scored. Item descriptions can be found in Appendix E.

PERSPECTIVES ON TRUANCY
42
Ad hoc exploratory factor analysis was conducted excluding strain items from
analysis for comparison. Results showed the communalities for the 3 factor model
excluding strain were slightly lower than for the 4 factor model; however, there was little
difference in between the strength of factor loadings for the two models (see Table 7).
KMO for the 3 factor model excluding strain items was higher, and fell just below the 0.6
criterion suggesting better factorability, KMO = 0.591. Bartlett’s test of sphericity was
significant, X2 (861) = 1903.813, p < 0.005. Interpretation of the 3 factor exclusion
model factors presented 3 distinct factors which explained 39.34% of the variability in
the model while the 4 factor inclusion model explained 42.66%. Two factors were
consistent with the 4 factor inclusion model. Factor 1 was indicative of labeling theory,
and factor 3 was indicative of interaction theory; however, the second factor did not
align with the 4 factor inclusion model. In the 4 factor inclusion model, factor 2 was
indicative of control theory; however, in the 3 factor exclusion model, factor 2 contained
only two items from differing theoretical perspectives. Although one item within factor 2
was coded as a control theory item, the factor loading was closely matched to the
second item and did not provide strong enough evidence for the factor to be indicative
of control (see Table 7).

PERSPECTIVES ON TRUANCY
43
Table 7 Comparison of factor loadings and communalities for full 4 factor theory model including strain items and 3 factor theory model excluding strain items Strain Included Strain Excluded
Factor Factor
Item 1 2 3 4 h2 1 2 3 h2
89 (rev) .867 .706 .744 .706 93 .765 .550 .688 .525 27 .761 .516 .761 .487 17 .737 .484 .754 .495 31 .706 .602 19 (rev) .628 .607 .594 .432 96 .602 .307 .605 .323 100 .517 .371 .531 .367 94 .799 .522 46 .697 .517 57 (rev) .668 .501 44 .560 .254 12 .545 .210 56 (rev) .530 .529 21 .680 .490 99 .783 .794 .762 .714 74 .776 .732 .834 .783 20 .966 .759 18 .655 .457 1 (rev) .520 .503 .658 .490 82 .513 .262 Note: h2 indicates communality value. Boldface type indicates factor loadings. Items with
(rev) designation were reverse scored. Item descriptions can be found in Appendix E.
After completing analyses of the theoretical perspectives, analyses of the five
categorical groupings, or sections, of the questionnaire items were conducted – school,
teachers/classes, parents, friends, you. These sections were determined by dividing
the item statements in categorical groups which were uncovered in the review of the
literature to be potential influences affecting truancy. Individual models for each section
along with a full 5-factor section model were produced.
Exploratory factor analyses using both PAF and PCA extraction were performed on
each of the five categorical sections individually. First, the school section model was

PERSPECTIVES ON TRUANCY
44
assessed as having good factorability and being interpretable, X2 (45) = 154.949, p <
0.005, KMO = 0.653, communalities were low to moderate (see Table 8). The PAF
model was comprised of 2 items while the PCA model was comprised of 5. Items
contained in the PAF model were, “School is meant for everyone” (11), and “Education
is only for smart kids” (20). The PCA model also contained item number 11, in addition
to, “School is meant only for kids going to college” (18), “School is a waste of time” (1),
“I have a good reputation” (19), and “I want to succeed in school” (2).
Table 8 Factor loadings and communalities for school section
principal axis factoring and principal component models.
PAF PCA Item Loading h2 Loading h2
20 .833 .625 11 (rev) .530 .352 .656 .452 18 .545 .369 1 (rev) .746 .558 19 (rev) .635 .480 2 .502 .294
Note: h2 denotes communality value. Boldface type indicates factor loadings. Items with (rev) designation were reverse scored. Item descriptions can be found in Appendix E.
Second, the teachers/classes section model was assessed as having good
factorability and being interpretable, X2 (28) = 179.758, p < 0.005, KMO = 0.749,
communalities were moderate to high (see Table 9). The PAF model was comprised of
4 items while the PCA model was comprised of 5. Both models contained the same 4
items, “I am a good student” (35), “I often lie to my teachers” (21), “I often get into
arguments with my teachers” (31), and “I am frequently sent to the office for
misbehavior” (27). Additionally, the PCA model contained the item, “I get along well
with my teachers” (22).

PERSPECTIVES ON TRUANCY
45
Table 9 Factor loadings and communalities for teacher/classes section
principal axis factoring and principal component models.
PAF PCA Item Loading h2 Loading h2
31 .884 .704 .791 .614
27 .814 .587 .737 .687 35 (rev) .715 .550 .790 .642 21 (rev) .502 .345 .676 .458 22 .750 .618
Note: h2 denotes communality value. Boldface type indicates factor
loadings. Items with (rev) designation were reverse scored. Item descriptions can be found in Appendix E.
Third, the parent section model was assessed as having good factorability and
being interpretable, X2 (55) = 163.285, p < 0.005, KMO = 0.641, communalities were
low to moderate (see Table 10). The PAF model was comprised of 3 items, while the
PCA model was comprised of 6 items. Two items overlapped between the two models,
“My parent(s) are good people” (57), and “My parent(s) are proud of me” (56). The PAF
model also contained the item “I am frequently in trouble at home” (61). In addition to
the aforementioned 3 items, the PCA model also contained the items, “My parent(s) do
not care if I graduate” (60), “My parent(s) require me to attend school” (46), My
parent(s) would be angry if I missed school regularly” (44), and “Education is important
in my family” (51).
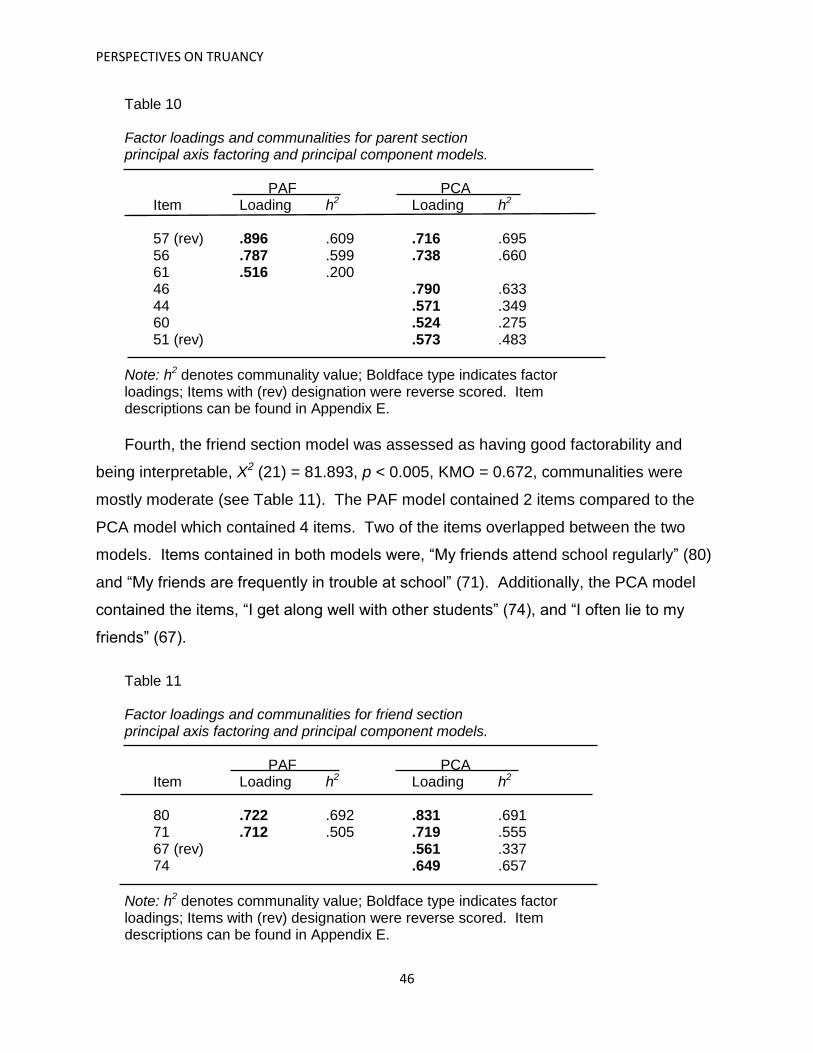
PERSPECTIVES ON TRUANCY
46
Table 10 Factor loadings and communalities for parent section
principal axis factoring and principal component models.
PAF PCA Item Loading h2 Loading h2
57 (rev) .896 .609 .716 .695
56 .787 .599 .738 .660 61 .516 .200 46 .790 .633 44 .571 .349 60 .524 .275 51 (rev) .573 .483
Note: h2 denotes communality value; Boldface type indicates factor
loadings; Items with (rev) designation were reverse scored. Item descriptions can be found in Appendix E.
Fourth, the friend section model was assessed as having good factorability and
being interpretable, X2 (21) = 81.893, p < 0.005, KMO = 0.672, communalities were
mostly moderate (see Table 11). The PAF model contained 2 items compared to the
PCA model which contained 4 items. Two of the items overlapped between the two
models. Items contained in both models were, “My friends attend school regularly” (80)
and “My friends are frequently in trouble at school” (71). Additionally, the PCA model
contained the items, “I get along well with other students” (74), and “I often lie to my
friends” (67).
Table 11 Factor loadings and communalities for friend section
principal axis factoring and principal component models.
PAF PCA Item Loading h2 Loading h2
80 .722 .692 .831 .691
71 .712 .505 .719 .555 67 (rev) .561 .337 74 .649 .657
Note: h2 denotes communality value; Boldface type indicates factor loadings; Items with (rev) designation were reverse scored. Item descriptions can be found in Appendix E.
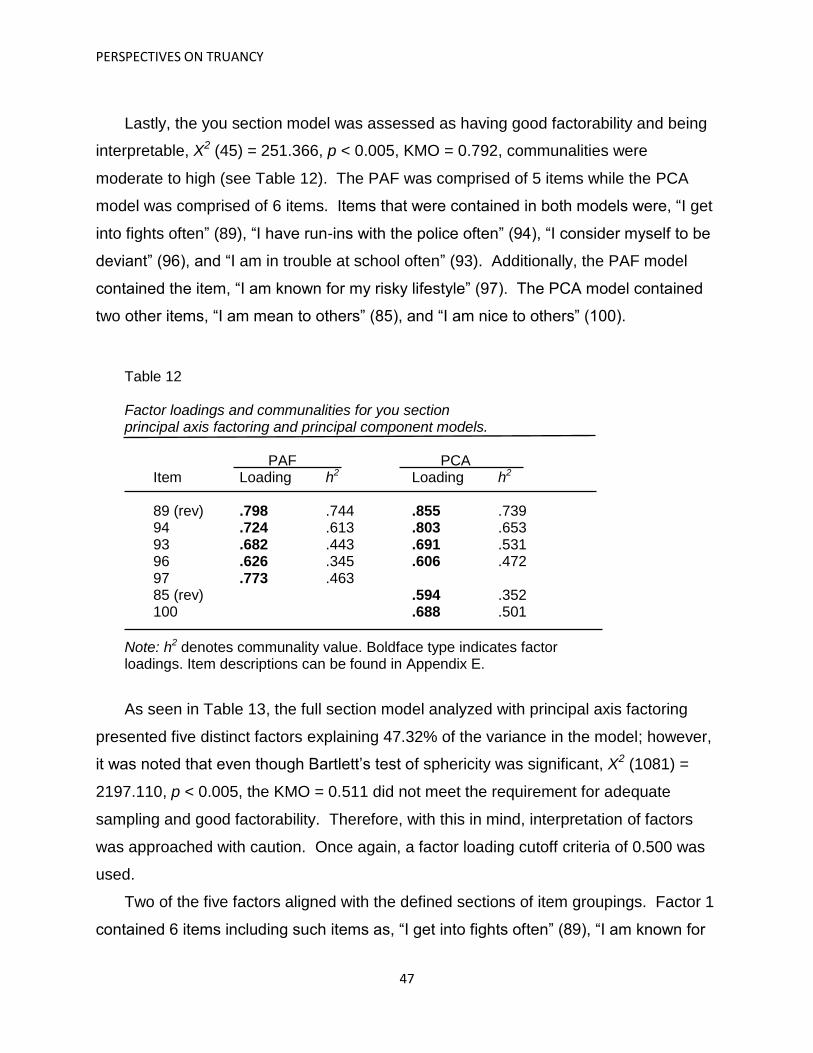
PERSPECTIVES ON TRUANCY
47
Lastly, the you section model was assessed as having good factorability and being
interpretable, X2 (45) = 251.366, p < 0.005, KMO = 0.792, communalities were
moderate to high (see Table 12). The PAF was comprised of 5 items while the PCA
model was comprised of 6 items. Items that were contained in both models were, “I get
into fights often” (89), “I have run-ins with the police often” (94), “I consider myself to be
deviant” (96), and “I am in trouble at school often” (93). Additionally, the PAF model
contained the item, “I am known for my risky lifestyle” (97). The PCA model contained
two other items, “I am mean to others” (85), and “I am nice to others” (100).
Table 12 Factor loadings and communalities for you section
principal axis factoring and principal component models.
PAF PCA Item Loading h2 Loading h2
89 (rev) .798 .744 .855 .739
94 .724 .613 .803 .653 93 .682 .443 .691 .531 96 .626 .345 .606 .472 97 .773 .463 85 (rev) .594 .352 100 .688 .501
Note: h2 denotes communality value. Boldface type indicates factor loadings. Item descriptions can be found in Appendix E.
As seen in Table 13, the full section model analyzed with principal axis factoring
presented five distinct factors explaining 47.32% of the variance in the model; however,
it was noted that even though Bartlett’s test of sphericity was significant, X2 (1081) =
2197.110, p < 0.005, the KMO = 0.511 did not meet the requirement for adequate
sampling and good factorability. Therefore, with this in mind, interpretation of factors
was approached with caution. Once again, a factor loading cutoff criteria of 0.500 was
used.
Two of the five factors aligned with the defined sections of item groupings. Factor 1
contained 6 items including such items as, “I get into fights often” (89), “I am known for
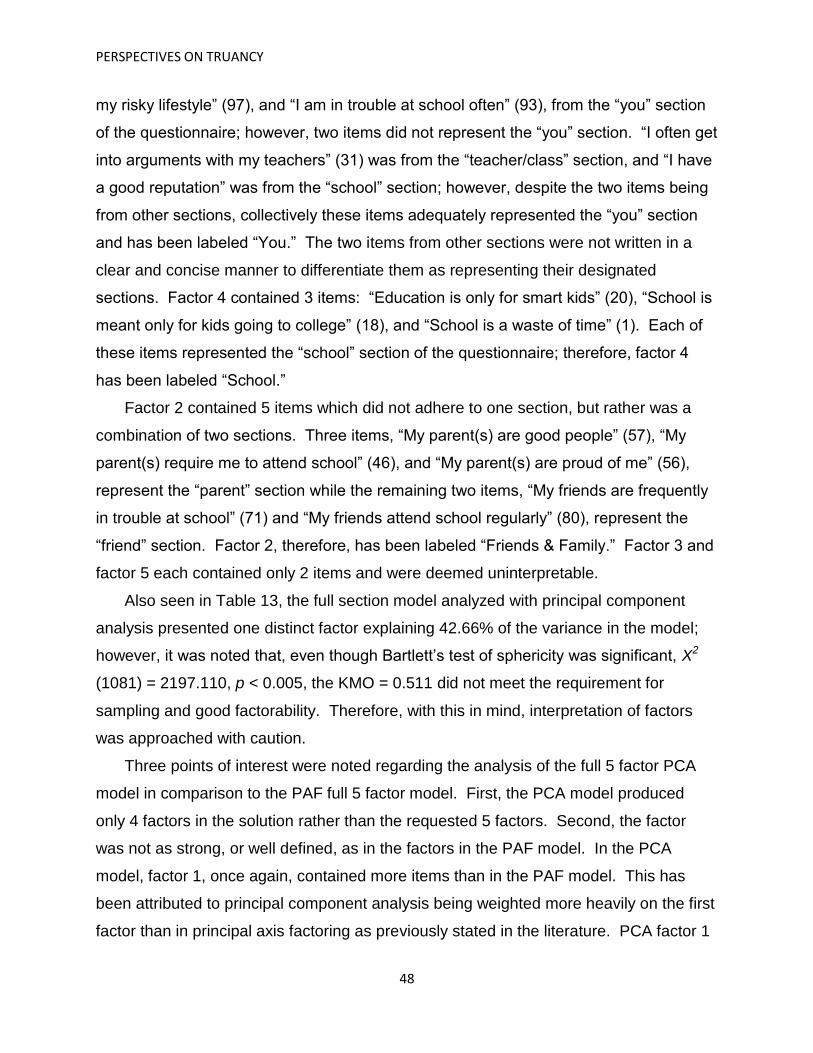
PERSPECTIVES ON TRUANCY
48
my risky lifestyle” (97), and “I am in trouble at school often” (93), from the “you” section
of the questionnaire; however, two items did not represent the “you” section. “I often get
into arguments with my teachers” (31) was from the “teacher/class” section, and “I have
a good reputation” was from the “school” section; however, despite the two items being
from other sections, collectively these items adequately represented the “you” section
and has been labeled “You.” The two items from other sections were not written in a
clear and concise manner to differentiate them as representing their designated
sections. Factor 4 contained 3 items: “Education is only for smart kids” (20), “School is
meant only for kids going to college” (18), and “School is a waste of time” (1). Each of
these items represented the “school” section of the questionnaire; therefore, factor 4
has been labeled “School.”
Factor 2 contained 5 items which did not adhere to one section, but rather was a
combination of two sections. Three items, “My parent(s) are good people” (57), “My
parent(s) require me to attend school” (46), and “My parent(s) are proud of me” (56),
represent the “parent” section while the remaining two items, “My friends are frequently
in trouble at school” (71) and “My friends attend school regularly” (80), represent the
“friend” section. Factor 2, therefore, has been labeled “Friends & Family.” Factor 3 and
factor 5 each contained only 2 items and were deemed uninterpretable.
Also seen in Table 13, the full section model analyzed with principal component
analysis presented one distinct factor explaining 42.66% of the variance in the model;
however, it was noted that, even though Bartlett’s test of sphericity was significant, X2
(1081) = 2197.110, p < 0.005, the KMO = 0.511 did not meet the requirement for
sampling and good factorability. Therefore, with this in mind, interpretation of factors
was approached with caution.
Three points of interest were noted regarding the analysis of the full 5 factor PCA
model in comparison to the PAF full 5 factor model. First, the PCA model produced
only 4 factors in the solution rather than the requested 5 factors. Second, the factor
was not as strong, or well defined, as in the factors in the PAF model. In the PCA
model, factor 1, once again, contained more items than in the PAF model. This has
been attributed to principal component analysis being weighted more heavily on the first
factor than in principal axis factoring as previously stated in the literature. PCA factor 1

PERSPECTIVES ON TRUANCY
49
contained 14 items while PAF factor 1 contained only 8. Third, it was noted that the
PCA factor structure, or items constructing a factor, was very weak in comparison to the
PAF model. Although factor 1 presented 14 items, the remaining factors collectively
presented only 4 items – 1 items in factor 2, 1 item in factor 3, 2 items in factor 4, 0
items in factor 5 (see Table 13).
Factor 1 of the PCA model, did not present an overall distinct theme. Items
contained within the factor represented each of the five categorical sections. Some
items presented were, “I get into fights often” (89) from the “you” section, “My friends
attend school regularly” (80) from the “friend” section, “My parent(s) are proud of me”
(56) from the “parent” section, “School is a waste of time” (1) from the “school” section,
and “I am a good student” (35) from the “teacher/class section. Three items were
represented for each of the “teacher/class,” “school,” and “you” sections. Two items
were represented for each of the “friend” and “parent” sections. However, there were
no patterns present in the ordering or arrangement of the items within the factor. Items
were representative of both positive and negative aspects, thoughts, and behaviors.
Of the remaining factors, factor 2 and factor 3 contained only a single item. Neither
of the factors were interpretable. Factor 4 contained 2 items, but still contained too few
for it to be interpretable. Factor 5 contained no items, and was, therefore, unable to be
interpreted as well.
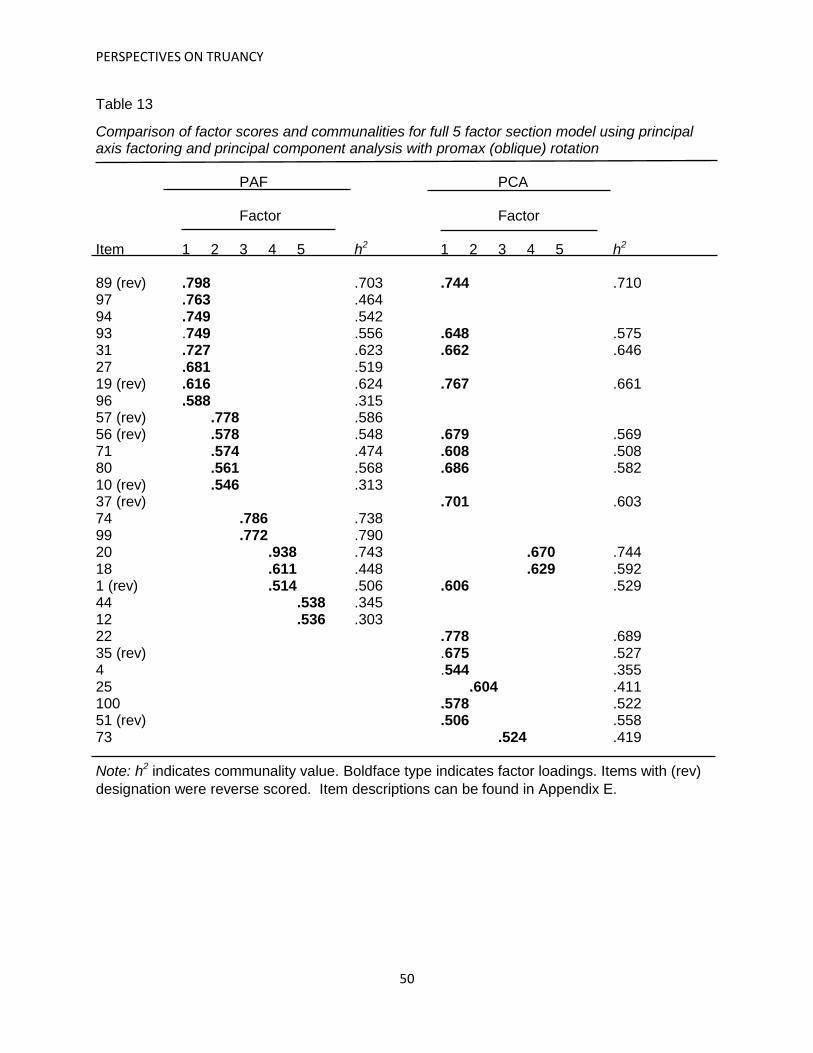
PERSPECTIVES ON TRUANCY
50
Table 13
Comparison of factor scores and communalities for full 5 factor section model using principal axis factoring and principal component analysis with promax (oblique) rotation PAF PCA
Factor Factor
Item 1 2 3 4 5 h2 1 2 3 4 5 h2
89 (rev) .798 .703 .744 .710 97 .763 .464 94 .749 .542 93 .749 .556 .648 .575 31 .727 .623 .662 .646 27 .681 .519 19 (rev) .616 .624 .767 .661 96 .588 .315 57 (rev) .778 .586 56 (rev) .578 .548 .679 .569 71 .574 .474 .608 .508 80 .561 .568 .686 .582 10 (rev) .546 .313 37 (rev) .701 .603 74 .786 .738 99 .772 .790 20 .938 .743 .670 .744 18 .611 .448 .629 .592 1 (rev) .514 .506 .606 .529 44 .538 .345 12 .536 .303 22 .778 .689 35 (rev) .675 .527 4 .544 .355 25 .604 .411 100 .578 .522 51 (rev) .506 .558 73 .524 .419 Note: h2 indicates communality value. Boldface type indicates factor loadings. Items with (rev)
designation were reverse scored. Item descriptions can be found in Appendix E.

PERSPECTIVES ON TRUANCY
51
Reliabilities
After factor analyses were completed, reliabilities were calculated for each model to
measure internal consistency in order to determine the stability of responses across
item statements, and the reliability of the defined factors (Tabachnick & Fidel, 2005;
Kline, 2007) (see Table 14). Three measures of internal consistency were assessed –
Cronbach’s coefficient alpha, split-half reliability, and Lambda 2. Each of these three
measures have the ability to be calculated from a single sample and questionnaire
administration. Cronbach’s coefficient alpha is the more recognized of the reliability
measures; however, it is a very conservative estimate of the true reliability and
oftentimes is an underestimate. Cronbach’s coefficient alpha is considered a lower
bound of the true reliability estimate. Split-half reliability measures the internal
consistency using a split-half method which requires that two equal portions to be
compared within any given set of items. The third measure, Lambda 2, is a more
complex method than Cronbach’s coefficient alpha, and does not require equal halves
as split-half reliability does. There were a few instances of negative reliability values
with the split-half reliability method. A negative reliability is not plausible, yet the split-
half method will produce such values due to the estimate calculation requiring equally
split halves for proper computation. When halves are unable to be divided equally due
to an odd number of total items, a negative reliability is produced. Lambda 2, although
less common, is preferred by some researchers since it is believed to be a closer
estimate of true reliability.
A comparison of the PAF and PCA reliabilities for each model are seen in Table 14.
Values are presented for each of the three measures to provide a greater sense of true
reliability. A cutoff criteria for good internal consistency of 0.60 has been used (Kline,
2007).

PERSPECTIVES ON TRUANCY
52
Table 14
Comparison of Cronbach’s alpha, split-half, and Lambda 2 reliabilities for each exploratory factor analysis model
Reliability
split- Model α half λ2 PC Theories:
Control .328 .336 .420 Interaction .728 .675 .739 Strain ** ** ** Labeling .772 .824 .801 Full 4-Factor .306 .429 .457
PAF Theories: Control .613 .447 .587 Interaction .729 .628 .740 Strain ** ** ** Labeling .589 .719 .691 Full 4-Factor .513 .676 .633
PC Sections: School .410 .509 .458 Teacher /Class .698 .659 .699 Parent .675 .542 .731 Friend .673 -.710 .694 You .693 -.393 .678 Full 5-Factor .306 .429 .457
PAF Sections School .146 -.043 .362 Teacher/Class .718 .701 .755 Parent -.426 .018 .142 Friend .145 -.543 .457 You .633 .675 .678 Full 5-Factor .513 .676 .633
Note: **No viable factor analysis model was produced; α indicates Cronbach’s Coefficient alpha; λ2 indicates Lambda 2; Boldface indicates good reliability.
Multiple Regression
In addition to the exploratory factor analysis, multiple regression analysis with both
forward and backward elimination was conducted using number of recorded absences
as the dependent variable against the independent variables age, race, gender, grade

PERSPECTIVES ON TRUANCY
53
point average, number of siblings, approximate number of days missed per month,
approximate number of days missed per week, and number of recorded tardies, as well
as item statements, to determine any potential predictors.
Assumptions were examined using SPSS regression and explore functions.
Examination presented no significant violations. Sample size (n = 70) was large enough
to satisfy the size requirement for multiple regression analysis. Outliers were analyzed
using Mahalanobis distance at a p < 0.001 criterion. No outliers were present.
Initial regression of the demographic variables was significant with F (3, 66) =
21.106, p < 0.001 criterion. R2 = 0.490 with the value of adjusted R2 = 0.466 which
proposed that nearly half of the variability in the number of recorded absences is
predicted by students’ demographic profile. Race, approximate number of days missed
per month, and the number of recorded tardies were significant in the regression at
significant level p < 0.05. However, both approximate number of missed days per
month and number of recorded tardies were potentially influenced by differing school
policies, procedures, and tracking methods, as well as, data collection occurring late in
the school year. Therefore, the approximate number of days missed per month and the
number of recorded tardies were determined to not be relevant predictors. Additional
regression analysis of the demographic variables excluding these two variables was
warranted.
Multiple regression of the remaining demographic variables included the variables
race, age, grades, gender, parent(s) highest level of education, and number of siblings
was significant with F (6, 69) = 2.919, p < 0.05 criterion. R2 = 0.187 with the value of
adjusted R2 = 0.163 which proposed that nearly 19% of the variability in the number of
recorded absences is predicted by the students’ demographic profile once the
approximate number of days missed per month and the number of recorded tardies
were removed from the regression. The lower value of the adjusted R2 results from R2
being statistically adjusted for the number of predictor variables in the model and
sample size. The adjusted R2 decreases every time a predictor variable is added which
does not improve the model more than what would be expected by chance. The
variables grades and gender were significant in the regression at significance level p <
0.05, while race no longer presented as significant (see Table 15).

PERSPECTIVES ON TRUANCY
54
Table 15
Regression Analysis Summary for School Record Demographic Variables Predicting Number of Days Absent
Variable B β p r sr2
Grades -2.928 -0.369 0.002 -0.369 0.152 Gender -4.422 -0.271 0.023 -0.282 0.062
Note: R2 = 0.187, adj R2 = 0.163, R = 0.432. (n = 70, p < .05). Intercept = 26.764
A negative correlation existed between the number of recorded absences and
grades. The grades variable was coded so that ‘1’ represented mostly F’s through ‘5’
which represented mostly A’s; therefore, as the coded grades score decreased –
meaning grades were poorer – then the number of absences increased (see Table 15).
According to semi-partial squared correlation (sr2), the significant correlation between
the number of recorded absences and grades accounted for over one-third of the
unique variability contributed to the total R2 value (see Table 15). This independent
variable accounted for 15.2% of the shared variance in the number of recorded
absences when the item response value was known.
The independent variable gender also presented as significant in the regression;
however, this variable was believed to be a suppressor. The initial significant variable’s,
i.e. grades’, impact in the model was inflated when suppression was present. The
suppressor variable, gender, was not correlated with the dependent variable, or a
significant predictor when examined without grades. The suppression that was evident
in the model has been classified as classic suppression, meaning that the significant
independent variable, gender, was not correlated with the number of recorded
absences by itself, but was correlated with the other significant independent variable,
grades. Non-significant predictors were age, race, parent(s) highest level of education,
and number of siblings.
Multiple regression analysis with forward and backward elimination was also
performed using item statements as independent variables predicting absences. Item

PERSPECTIVES ON TRUANCY
55
statements were analyzed utilizing multiple regression in order to determine if
responses to certain statements would serve as potential predictors to number of
absences. Regression was significant with F (8, 69) = 12.825, p < 0.05 criterion. R2 =
0.627 with the value of adjusted R2 = 0.578 which means that more than half of the
variability in the number of recorded absences is predicted by students’ responses to
item statements. Predictor variables “I get into fights often”, “My friends dare me to do
things”, “My parent(s) require me to attend school”, “My parent(s) are good people”, “I
am mean to others”, “School is a positive part of my day”, “I get along with other
students”, and “I am afraid of being caught if I skip school” were significant in the
regression at p < 0.05. The combination of student responses for these eight
independent variables accounted for 57.8% of the variability in the number of recorded
absences when values of the predictors are known (see Table 16).
Table 16
Multiple Regression Analysis Summary for Item Statement Variables Predicting Number of Days Absent
Variable B β p r sr2
I am mean to others. 1.937 .267 .003 .371 .060 My parent(s) require me to attend school. 22.501 .497 .000* .553 .164 I get into fights often. 4.542 .564 .000* .608 .218 My friends dare me to do things.
R 1.920 .278 .002 .381 .063
My parent(s) are good people. -15.654 -.386 .000* -.453 .096 I am afraid of being caught if I skip school.
R -0.886 -.176 .036 -.265 .028
School is a positive part of my day. -1.297 -.203 .029 -.276 .031 I get along with other students.
R -1.793 -.238 .018 -2.98 .036
Note: R2 = 0.627, adj R2 = 0.578, R = 0.792 (n = 70, p < 0.05). Intercept = -0.292. R indicates item was reversed scored. *p < .0001.
A positive correlation existed between number of recorded absences and “I get
into fights often”, “My friends dare me to do things”, and “I am mean to others” after
adjustment for reverse scoring. The positive correlation of the items to the number of
absences meant that as response scores increase, or as the agreement with the item
statements increase, the numbers of absences increase. Therefore, in the instance of “I

PERSPECTIVES ON TRUANCY
56
get into fights often”, higher response scores represented stronger agreement which
correlated with higher numbers of absences. The same held true for the item
statements, “I am mean to others”, and “My friends dare me to do things”. Additionally,
a positive correlation existed between number of recorded absences and “My parent(s)
require me to attend school”.
Unlike the aforementioned item statements, a negative correlation existed
between number of recorded absences and “My parent(s) are good people”, “School is
a positive part of my day”, “I get along with other students”, and “I am afraid of being
caught if I skip school” after adjustment for reverse scoring. The negative correlation of
the item statements to the number of absences meant that as response scores
increase, the number of absences decrease. Therefore, in the instance of “My parent(s)
are good people”, higher response scores presented stronger agreement which
correlated with a lower number of absences. The same held true for the item
statements, “School is a positive part of my day”, “I get along with other students”, and “I
am afraid of being caught if I skip school”.
According to semi-partial squared correlation (sr2), the greatest impact upon the
number of recorded absences was attributed to “I get into fights often” at 0.218. Semi-
partial squared correlation (sr2) for “My parent(s) require me to attend school” followed
at 0.164. “My parent(s) are good people” attributed 0.096 unique variance. The
remaining item statements – “I am mean to others”, “My friends dare me to do things”, “I
am afraid of being caught if I skip school”, “School is a positive part of my day”, “I get
along with other students” - were significant; however, each presented approximately
0.050 or less unique variance in the model (see Table 16). Variance shared among the
variables in the model was 0.304.
Additionally, the significant demographic predictor variables and the significant item
statement predictor variables were combined for multiple regression analysis with both
forward and backward elimination. Multiple regression was used to determine if the
demographic characteristics of grades and gender along with responses to the
aforementioned item statements were potential predictors to number of absences.
Neither students’ grades nor gender were significant in the regression when combined
with the eight item statements. Each of the eight item statements remained as
PERSPECTIVES ON TRUANCY
57
significant predictors at significance level p < 0.05; therefore, the regression analysis
summary of variables predicting number of days absent is consistent with Table 16
which represented only significant item statements (see Table 16).
Discussion
Truancy has been discussed as a widespread issue which has reached epidemic
proportions (Siegel et al., 2006; Flannery et al., 2012). The question is: what underlies
truancy? The present study has explored the phenomenon of truancy through the use
of an interdisciplinary approach. According to the knowledge of the principal
investigator, this is the first interdisciplinary study regarding truancy. Disciplinary
perspectives of criminal justice, psychology, education, and sociology were identified
and critiqued, and their subsequent similarities were illuminated to present the
interdisciplinary nature of the phenomenon of truancy. As discussed in the review of the
literature, previous research shows the diversity of these perspectives in relation to the
issue of truancy; however, even with their differences, four common theoretical themes
emerged – control theory, interaction theory, labeling theory, and strain theory.
The four hypothesized theories were assessed via a new questionnaire instrument
compiled by the principal investigator. The purpose of implementing a new
questionnaire was to not only assess the hypothesized theories, but to also capture
student perspectives. Students were, on average, fifteen and a half years old, which is
in accordance with previous research (Kronholz, 2011; Crabtree, J., personal
communication, 2012), as well as identified as White, and predominantly female.
Four theories were hypothesized to underlie truancy- labeling theory, control theory,
interaction theory, and strain theory. Exploratory factor analysis with both principal axis
factoring and principal component analysis extraction were conducted and compared to
test the hypothesized theories as underlying constructs of truancy. Exploratory factor
analysis with principal axis factoring extraction conformed more closely to multiple
theoretical dimensions underlying the phenomenon through strong factor structures.
Principal axis factoring was more successful than principal component analysis by
providing evidence to support 3 of the 4 theories, as well as, a discernible interpretation

PERSPECTIVES ON TRUANCY
58
of the factor model, higher factor loadings, better reliabilities, and better overall factor
structure.
Multiple regression analysis was performed on both demographic information and
item statements which were tested as predictors for the number of days absent from
school. Grades and gender were significant in the demographic regression model as
predictors. Item statements, “I get into fights often”, “My friends dare me to do things”, “I
am mean to others”, “My parent(s) require me to attend school”, “I afraid of being caught
if I skip school”, “I get along with other students”, “School is a positive part of my day”,
and “My parent(s) are good people” were significant predictors in the item statement
regression model. A final multiple regression analysis combined the significant
predictor variables from both the demographic and item statement regression models.
Each of the eight aforementioned item statements remained as significant predictors in
the final combined model.
Item statements were written to represent the underlying theoretical constructs
which were discovered as common ground among the four disciplines. According to
multiple regression analyses, each theory was represented among the eight significant
item statement predictors. Not only do these findings provide evidence of potential
predictors of truancy, but also provide supporting statistical evidence for the
interdisciplinary nature of the construct. Overall, the importance of the findings are the
discovery of a potential predictive tool which would allow for the identification of
students at risk for truancy, and a proactive, rather than reactive, approach to affect the
problem.
Previous research in the review of the literature discussed the numerous entities
from differing disciplines involved in the truancy “equation” (Reid, 2010), as well as, that
no single discipline has had a significant effect on truancy (Guare & Cooper, 2003;
Eastman et al., 2007, Reid, 2010). Previous research has lacked insight in examining
truancy from an integrated perspective. The present research study fills the need by
providing evidence of integrated disciplines as underlying truancy. The information
contained herein lays the groundwork for integrated truancy initiatives to be developed.
No other research has provided a theoretical foundation of underlying constructs for
building truancy responses, and/or programs.

PERSPECTIVES ON TRUANCY
59
Limitations
Limitations of the present study warrant consideration. First, a small sample was
obtained which hinders generalizability of the findings. It is recommended that the study
be replicated with a larger sample size (n ≥ 300) to validate results. Also, differing
school policies and procedures, and the potential for inconsistent reporting hinder the
generalizability. Differing school policies, procedures, and reporting methods warrant
further investigation. Second, it is possible that some of the item statements were not
as clear and concise for representing the intended theory and/or categorical group, or
may have been unclear for the students’ understanding. These item statements would
require revision for clarification prior to any further study. Third, the present study was
conducted late in the school year which may have impacted the sample by not capturing
the responses of more truant or at risk students. Finally, the honesty of the student
when responding to the item statements must be considered. Some students may have
been less forthcoming in their responses to particular item statements.
Future research could benefit from the exploration of truancy as a school-based
phenomenon. The differences between urban, suburban, and rural school truancy
patterns would aid in establishing targeted, and larger scale truancy initiatives. Also,
further study of the discordance with school policies and procedures would provide
knowledge and insights to devise and implement core standards across school districts.
Additionally, further research performing test – retest validation of the present study
instrument could provide a solid predictive tool for schools to identify students who
would benefit from targeted interventions.
Ad hoc analysis provided evidence that the exclusion of the strain items marginally
improved factorability of the model. The replication of the study with a larger sample
size would be beneficial to verify the results for the inclusion and exclusion of strain
items, and its effect on the full models. Further research of strain would provide greater
insight on the issue.
Implications

PERSPECTIVES ON TRUANCY
60
Implications of the present study extend beyond future research to practical
application. The interdisciplinary nature of the present study yields evidence of the
interrelatedness of criminal justice, psychology, education, and sociology, in regards to
truancy, thus, supporting the requirement for collaboration. Collaborative action would
not only reduce the impact of truancy on the justice and education systems, but would
also reduce the impact of truancy on the lives of truant and at risk students. The
availability of a predictive tool like the one in the present study would allow schools to
have a proactive stance against truancy rather than a reactive one.
Conclusion
Four common theories – control, interaction, strain, labeling - were discovered
during review of the literature to underlie truancy. Statistical evidence, through the use
of exploratory factor analysis with principal axis factoring, presented 3 of the 4 theories
– control, interaction, labeling – as affecting truancy. These findings provide support for
the existence of interdisciplinary gaps between the disciplines of criminal justice,
education, psychology, and sociology which have prevented an effective method(s) for
combatting the truancy epidemic to be discovered. The three common theoretical
dimensions bridge together the four disciplines signifying interdisciplinarity. The
interdisciplinary nature of truancy warrants the need for an interdisciplinary response.
The lack of an interdisciplinary response will continue to be disadvantageous in
affecting the phenomenon.

PERSPECTIVES ON TRUANCY
61
References
Baker, J. and Hollaway, D.M. (2009). A comprehensive approach to disruptive behaviors in the classroom and home. The International Journal on School Disaffection, 37-40. Barusch, A.S. (2009). Foundations of social policy. Third Edition. Belmont, CA: Brooks/Cole Brown, T.A. (2006). The common factor model and exploratory factor analysis. In Confirmatory factor analysis for applied research (12-39). New York, NY: Guilford Press. Bryant, F.B. and Yarnold, P. R. (1995). Principal components analysis and exploratory and confirmatory factor analysis. In L. Grimm, and P. Yarnold (Eds.), Reading and understanding multivariate statistics (99-136). Washington, D.C.: American Psychological Association. Burfeind, J.W. and Bartusch, D.J. (2006). Juvenile delinquency: an integrated approach. 63-566. Sudbury, MA: Jones and Bartlett Publishers. Children’s Law Office. (n.d.). Truancy and educational neglect. University of South Carolina School of Law webpage. Retrieved from: http://childlaw.sc.edu/frmPublications/TruancyEducationalNeglect.pdf. Claes, E., Hooghe, M., and Reeskens, T. (2009). Truancy as a contextual and school-related problem: a comparative multilevel analysis and school characteristics on civic knowledge among 14 year olds. Educational Studies, 35(2), 123-142.
De Winter, J.C.F., Dodou, D., and Wieringa, P.A. (2009). Exploratory factor analysis with small sample sizes. Multivariate Behavioral Research, 44, 147-181. De Wit, D.J., Karioja, K., and Rye, B.J. (2010). Student’s perceptions of diminished teacher and classmate support following the transition to high school: are they related to declining attendance? School Effectiveness and School Improvement, 21(4), 451-472. doi: 10.1080/09243453.2010.532010 Dien, J. (2010). Evaluating two-step PCA of ERP data with geomin, infomax, oblimin, promax, and varimax rotations. Psychophysiology, 47, 170-183. Dimmick, J., Correa, Y., Liazis, A., and McMichael, H. (2011). “Playing hooky”: examining factors that contribute to adolescent truancy. Sociological Viewpoints, Fall 2011, 15-23. Dishion, T.J., Veronneau, M.H., and Myers, M.W. (2010). Cascading peer dynamics underlying the progression from problem behavior to violence in early to late adolescence. Development and Psychopathology, 22, 603-619. doi: 10.1017/S0954579410000313 Donoghue, J. (2011). Truancy and the prosecution of parents: an unfair burden on mothers. The Modern Law Review, 74(2), 216-244. Dube, S.R. and Orpinas, P. (2009). Understanding excessive school absenteeism as school refusal behavior. Children & Schools, 31(2), 87-95.

PERSPECTIVES ON TRUANCY
62
Eastman, G., Cooney, S.M., O’Connor, C. and Small, S.A. (2007). Finding effective solutions to truancy. Research to Practice, Series 5. Madison, WI: University of Wisconsin. Edmondson, G.L. (2007). Back-to-school preparations. Kenton County Attorney Webpage. Retrieved from: http://www.kentoncoatty.com/Backtoschoollaw.htm. Fabrigar, L.R. and Wegener, D.T. (2012). Exploratory factor analysis. New York, NY: Oxford University Press. Faris, R. and Felmlee, D. (2011). Status struggles: network centrality and gender segregation in same- and cross-gender aggression. American Sociological Review 76(1), 48-73. Fiske, S.T. (2004). Social beings: a core motives approach to social psychology. Hoboken, NJ: John Wiley & Sons, Inc.
Flannery, K.B., Frank, J.L., and Kato, M.M. (2012). School disciplinary responses to truncy: current practice and future directions. Journal of School Violence, 11, 118-137. Fritz, G.K. (2008). Understanding why your kids refuse school. The Brown University Child and Adolescent Behavior Newsletter. Gastic, B. (2008). School truancy and the disciplinary problems of bullying victims. Educational Review, 60(4), 391-404. doi: 10.1080/00131910802393423 Glaser, B.G. (1992). Basics of grounded theory analysis. Mill Valley, CA: Sociology Press. Goffman, E. (1963). Behavior in public places: notes on the social organization of gatherings. New York, NY: The Free Press. Guare, R. and Cooper, B. (2003). Truancy revisited: students as school consumers. Lanham, MD: Scarecrow Press, Inc. Hallinan, M. (2008). Teacher influences on students’ attachment to school. Sociology of Education, 81, 271-283. doi: 10.1177/003804070808100303 Henry, K.L. (2007). Who’s skipping school: characteristics of truants in the 8th and 10th grade. Journal of School Health, 77(1), 29-35. Hirschi, T. (1969). A control theory of delinquency. Causes of delinquency. 251-258. Los Angeles, CA: University of California Press. Hogarty, K.T., Hines, C.V., Kromey, J.D., Ferron, T.M., and Mumford, K.R. (2005). The quality of factor solutions in exploratory factor analysis: the influence of sample size, communality, and overdetermination. Educational and Psychological Measurement, 65(2), 202-226. Hutchison, A. and Henry, L.A. (2010). Internet use and online literacy among middle grade students at risk of dropping out of school. Middle Grades Research Journal, 5(2), 61-75. Kearney, C.A. (2007). Forms and functions of school refusal behavior in youth: an empirical analysis of absenteeism severity. Journal of Child Psychology and Psychiatry, 48(1), 53-61. doi: 10.1111/j.1469-7610.2006.01634x

PERSPECTIVES ON TRUANCY
63
Kearney, C.A. (2008). Helping school refusing children and their parents: a guide for school- based professionals. New York, NY: Oxford University Press, Inc. Kelly, D.H. (1978). How the school manufactures “misfits”. South Pasadena, CA: Newcal Publications. Kentucky Court of Justice. (n.d.). Truancy diversion program. Kentucky Court of Justice Webpage. Retrieved from: http://courts.ky.gov/stateprograms/truancydiversion. Kentucky Department of Education. (n.d.). Kentucky Department of Education webpage. Retrieved from: http://education.ky.gov/Pages/default.aspx. Kentucky Revised Statutes. (2000). Education: compulsory attendance. KRS Title 8, Chapter 159, Sections .010 - .080. Retrieved from: http://www.lrc.ky.gov/KRS/159-00/CHAPTER.HTM. Kim, H., and Barthelemy, J.J. (2011). A tool for assessing truancy risk among school children: predictive and constructive validity of the risk indicator survey. Journal of Social Service Research, 37(1), 50-60. Klein, S.B. and Mowrer, R.R. (1989). Contemporary learning theories: Pavlovian conditioning and the status of traditional learning theory. Hillsdale, NJ: Lawrence Erlbaum Associates. Kline, T.J. (2005). Psychological Testing: a practical approach to design and evaluation. Thousand Oaks, CA: Sage Publications, Inc. Knoblauch, D. and Hoy, A.W. (2008). “Maybe I can teach those kids.” The influence of contextual factors on student teachers’ efficacy beliefs. Teaching and Teacher Education, 24, 166-179. doi: 10.1016/j.tate.2007.05.005 Kronholz, J. (2011). Truants. Education Next, Winter 2011, 32-38. Retrieved from: www.educationnext.org. Kronick, R. and Thomas, D. (2008). Prisoner citizen: Carl Upchurch, labeling theory and symbolic interactionism. Journal of Progressive Human Services, 19(2), 112-124. doi: 10.1080/10428230802475406 Lawrence, R. (2007). School crime and juvenile justice. Second Edition. New York, NY: Oxford University Press. MacCullum, R.C., Widaman, K.F., Preacher, K.J., and Hong, S. (2001). Sample size in factor analysis: the role of model error. Multivariate Behavioral Research, 36(4), 611-637. Meyers, L.S., Gamst, G., and Guarino, A.J. (2006). Principal components and factor analysis. In Applied multivariate research: design and interpretation (465-514). Thousand Oaks, CA: Sage Publishing. Mundfrom, D.J., Shaw, D.G., and Ke, T.L. (2005). Minimum sample size recommendations for conducting factor analyses. International Journal of Testing, 5(2), 159-168.

PERSPECTIVES ON TRUANCY
64
Murphy, D.S. and Robinson, M.B. (2008). The maximizer: clarifying Merton’s theories of anomie and strain. Theoretical Criminology, 12(4), 501-521. doi: 10.1177/1362480608097154 Partlow, M.C. and Ridenour, C.S. (2008). Frequency of principal turnover in Ohio’s elementary schools. Mid-Western Educational Researcher, 21(2), 15-23. Reid, K. (1985). Truancy and school absenteeism. London: Hodder and Stoughton. Reid, K. (2000). Tackling truancy in schools. London, England: Routeledge. Reid, K. (2008). Behavior and attendance: the national picture; a synopsis. Educational Review, 60(4), 333-344. doi: 10.1080/00131910802393365 Reid, K. (2010). Finding strategic solutions to reduce truancy. Research in Education, November 2010, 1-18. Repko, A.F. (2008). Interdisciplinary research: process and theory. Thousand Oaks, CA: Sage Publishing. Rocque, M. and Paternoster, R. (2011). Understanding the antecedents of the “school-to-jail” link: the relationship between race and school discipline. Journal of Criminal Law and Criminology, 101(2), 633-665. Sander, J.B., Sharkey, J.D., Fischer, A.L., Bates, S., and Herren, J.A. (2011). School policies academic achievement and general strain theory: applications to juvenile justice settings. OJJDP Journal of Juvenile Justice, 1(1), 107-120. Schmalleger, F. (2009). Criminology today: an integrative introduction. Fifth Edition, 122- 374. Columbus, OH: Prentice Hall. Schwalbe, M. (2005). The sociological examined life: pieces of the conversation. New York, NY: McGraw-Hill. Sheppard, A. (2005). Development of school attendance difficulties: An exploratory study. Pastoral Care, 9, 19-25. Sheppard, A. (2007). An approach to understanding school attendance difficulties: pupils’ perceptions of parental behavior in response to their request to be absent from school. Emotional and Behavioural Difficulties, 12(4), 349-363. Siegel, L.J., Welsh, B.C. and Senna, J.J. (2006). Juvenile delinquency: theory, practice and law. Ninth Edition, 24-25, 292. Belmont, CA: Thomson Learning. Smith, J.A., Flowers, P. and Larkin, M. (2009). Interpretive phenomenological analysis: theory, method and research. Thousand Oaks, CA: SAGE Publications, Inc. Spencer, A.M. (2009). School attachment patterns, unmet educational needs and truancy: a chronological perspective. Remedial and Special Education, 30(5), 309-319. doi: 10.1177/0741932508321017

PERSPECTIVES ON TRUANCY
65
Stanley, L.R., Comello, M.L., Edwards, R.W. and Marquart, B.S. (2008). School adjustment in rural and urban communities: do students from “Timbuktu” differ from their “city slicker” peers? Journal of Youth and Adolescence, 37, 225-238. Studsrod, I. and Bru, E. (2011). Upper secondary school students perceptions of teacher socialization practices and reports of school adjustment. School Psychology International, 33(3), 308-324. Sullivan, C.J., Childs, K.K., and O’Connell, D. (2009). Adolescent risk behavior subgroups: an empirical account. Journal of Youth and Adolescence, 39, 541-562. Tabachnick, B.G. and Fidell, L.S. (2007). Using Multivariate Statistics. Fifth Edition. Boston, MA: Pearson Education, Inc. Thompson, B. (2004). Exploratory and confirmatory factor analysis: understanding concepts and applications. Washington, D.C.: American Psychological Association. Upchurch, C. (1996). Convicted in the womb: one man’s journey from prisoner to peacemaker. New York, NY: Bantam Books. Verleger, R., Paulick, C., Mocks, J., Smith, T.L., and Keller, K. (2013). Parafac and go/no-go: disentangling CNV return from the P3 complex b trilinear component analysis. International Journal of Pschophysiology, 87, 289-300. Walkey, F. and Welch, G. (2010). Demystifying factor analysis: how it works and how to use it. Bloomington, IN: Xlibris. Williams, B., Brown, T., and Onsman, A. (2010). Exploratory factor analysis: a five-step guide for novices. Journal of Emergency Primary Health Care, 8(3), 1-13. Williams, L.B. (2010). Investigating truancy in secondary schools (Unpublished doctoral dissertation). University of the Incarnate Word, San Antonio. Wilson, V., Malcolm, H., Edward, S., and Davidson, J. (2008). ‘Bunking off’: the impact of truancy on pupils and teachers. British Educational Research Journal, 34(1), 1-17. doi: 10.1080/01411920701492191 Xu, J. (2011). Homework purpose scale for middle school students: a validation study. Middle Grades Research Journal, 6(1), 1-13. Young, A.M., Grey, M., and Boyd, C.J. (2008). Adolescents’ experiences of sexual assault by peers: prevalence and nature of victimization occurring within and outside of school. Journal of Youth and Adolescence, 38, 1072-1083.
Zhang, D., Willson, V., Katsiyannis, A., Barrett, D., Ju, S., and Wu, J.Y. (2010). Truancy offenders in the juvenile justice system: a multicohort study. Behavioral Disorders, 35(3), 229-242.

PERSPECTIVES ON TRUANCY
66
Appendix A Informed Consent- Parent
Dear Parent(s)/ Guardian(s), I am writing today to invite your son or daughter to participate in research that I am conducting to study student perspectives on truancy. This study will be conducted with the 10th grade students at Holmes High School, and has been approved by its superintendent, Ms. Lynda Jackson. I am conducting this research study to fulfill the requirements needed to earn my Master’s degree at Northern Kentucky University. Participants in the study will complete a survey consisting of questions about student school experiences, activities, and individual feelings. The printed survey will be given during school and will take approximately 15 to 20 minutes to complete. To understand the connection between student perspective and truancy rate, I would also like permission to use your child’s attendance records and GPA. Your child’s survey responses are confidential. A participant number is assigned to your child’s information in order to match school information with survey responses. After a participant number is assigned, any identifying information will be destroyed in accordance with University policy. I will have no way to connect any of the information provided back to your child. Even though I will not be able to connect any of the information to your child, responses, attendance records, and GPA will continue to be treated as confidential information. I will secure all research data on a password protected computer which is accessible only by me. Participation in this research study is completely voluntary. Your decision to allow or not allow your child to participate will have no effect upon your child’s education, grades, or how he/she is treated at school. Any insights gained will be used to benefit further research endeavors in the area of school truancy. Should you decide at a later time that you would prefer your child not be included, you may withdraw your permission at any time. If you have any questions or concerns, please contact me at 859-250-0298 or at my email address, [email protected]. You may reach my faculty advisor, Dr. Bill Attenweiler, at 859-572-5831 or at [email protected]. If you have questions about your rights as a parent or your child’s rights as a participant in the research study, you may contact Philip Moberg, Ph.D., Chair, Institutional Review Board, Northern Kentucky University, at 859-572-1913 or at [email protected]. Please indicate below if you agree to the use of your child’s responses, attendance records, and GPA in this research study by marking one of the blanks below, signing this form, and returning it to school. I appreciate your help. ______ Yes, I agree to allow my child to participate and their data to be used in this research. ______ No, I do not agree to allow my child to participate and their data to be used in this research. Your signature: ________________________________________ Date: _____________ Student Name: ____________________________________________

PERSPECTIVES ON TRUANCY
67
Appendix B Informed Assent- Participant
Dear Participants, I am writing today to invite you to participate in research that I am conducting to study student perspectives on truancy. This study will be conducted with the 10th grade students at Holmes High School, and has been approved by its superintendent, Ms. Lynda Jackson. I am conducting this research study to fulfill the requirements needed to earn my Master’s degree at Northern Kentucky University. As a participant in the study you will complete a survey compiled of questions about your school experiences, activities, and individual feelings. The printed survey will be given during school and will take approximately 15 to 20 minutes to complete. Your survey responses will be confidential. Your information will be assigned to a participant number in order to match school data with survey responses. After being assigned a participant number, any identifying information will be destroyed in accordance with University policy. I will have no way to connect any of the information provided back to you. Even though I will not be able to connect any of the information to you, responses will continue to be treated as confidential information. I will secure all research data on a password protected computer which is accessible only by me. Participation in this research study is completely voluntary. Your decision to participate or not will have no effect upon your school records, grades, or how you are treated at school. Any insights gained will be used to benefit further research endeavors in the area of school truancy. Should you decide at a later time that you would prefer not to be included, you may withdraw at any time. If you have any questions or concerns, please contact me at 859-250-0298 or at my email address, [email protected]. You may reach my faculty advisor, Dr. Bill Attenweiler, at 859-572-5831 or at [email protected]. If you have questions about your rights as a participant in the research study, you may contact Philip Moberg, Ph.D., Chair, Institutional Review Board, Northern Kentucky University, at 859-572-1913 or at [email protected]. Please indicate if you agree to the use of your responses for the research study by marking one of the blanks below, and by signing this form. I appreciate your help. ______ Yes, I agree to participate and for my responses to be used in this research. ______ No, I do not agree to participate and for my responses to be used in this research. Your signature: _______________________________________ Date: ___________
Print Name: _______________________________________________
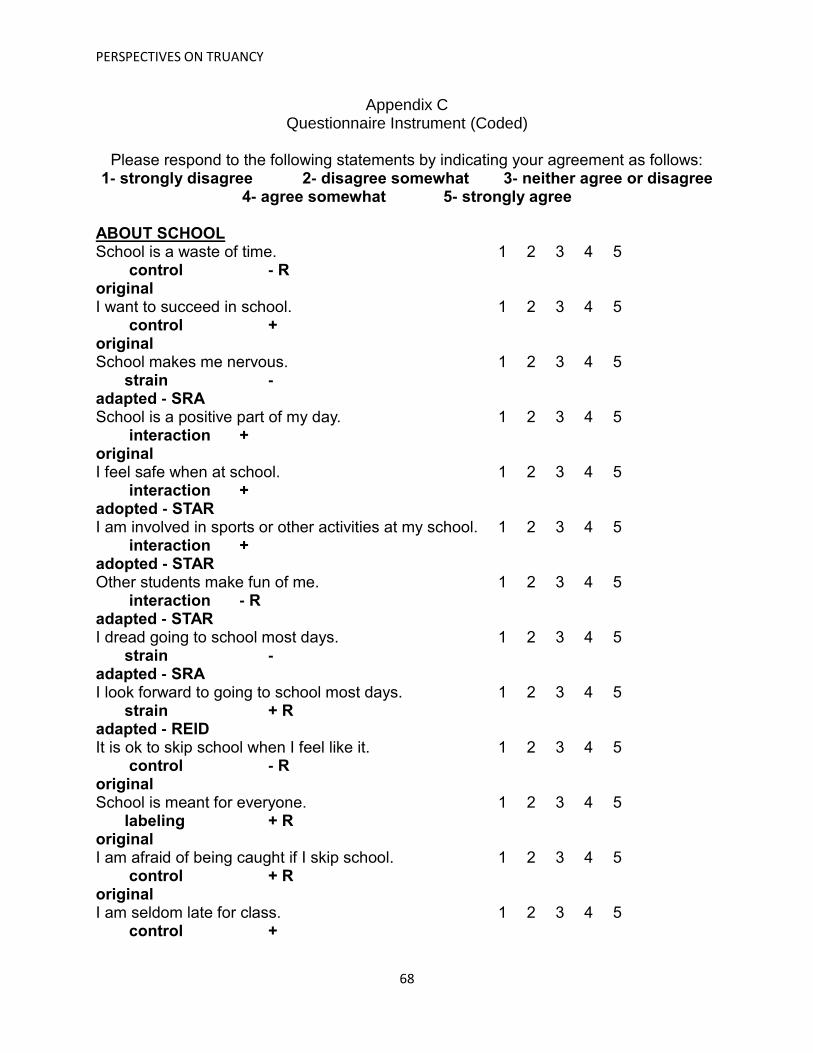
PERSPECTIVES ON TRUANCY
68
Appendix C Questionnaire Instrument (Coded)
Please respond to the following statements by indicating your agreement as follows:
1- strongly disagree 2- disagree somewhat 3- neither agree or disagree 4- agree somewhat 5- strongly agree
ABOUT SCHOOL School is a waste of time. 1 2 3 4 5 control - R original I want to succeed in school. 1 2 3 4 5 control + original School makes me nervous. 1 2 3 4 5 strain - adapted - SRA School is a positive part of my day. 1 2 3 4 5 interaction + original I feel safe when at school. 1 2 3 4 5 interaction + adopted - STAR I am involved in sports or other activities at my school. 1 2 3 4 5 interaction + adopted - STAR Other students make fun of me. 1 2 3 4 5 interaction - R adapted - STAR I dread going to school most days. 1 2 3 4 5 strain - adapted - SRA I look forward to going to school most days. 1 2 3 4 5 strain + R adapted - REID It is ok to skip school when I feel like it. 1 2 3 4 5 control - R original School is meant for everyone. 1 2 3 4 5 labeling + R original I am afraid of being caught if I skip school. 1 2 3 4 5 control + R original I am seldom late for class. 1 2 3 4 5 control +
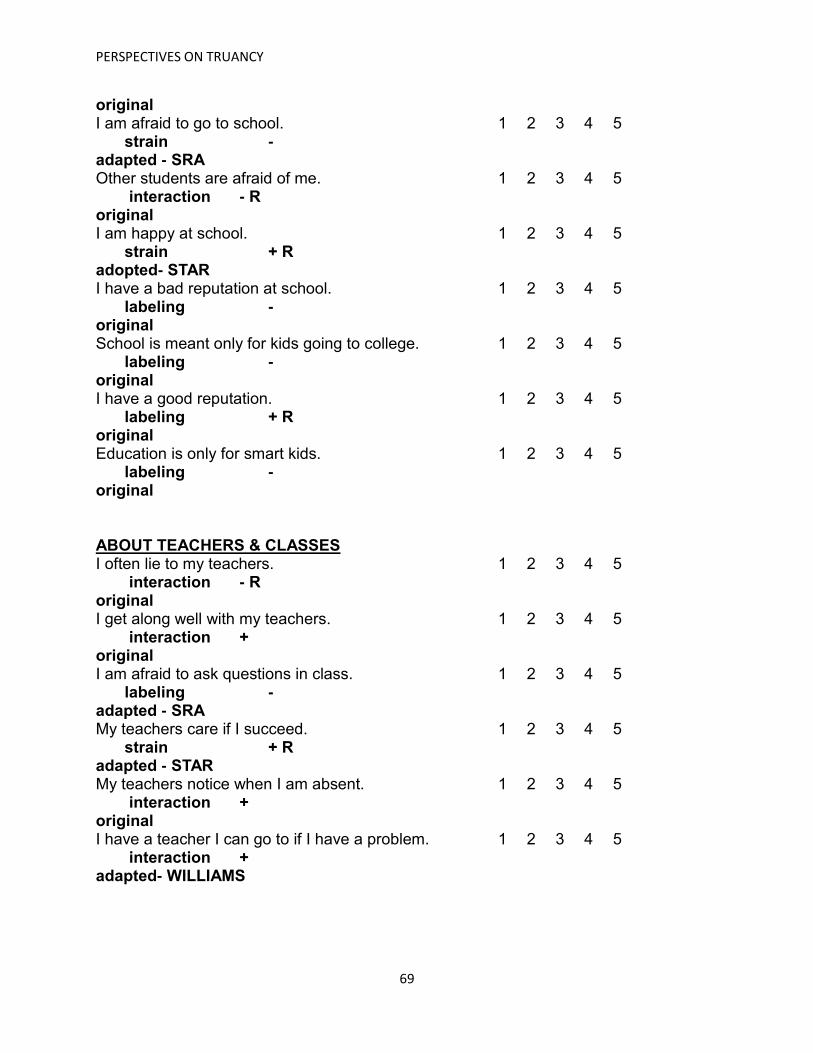
PERSPECTIVES ON TRUANCY
69
original I am afraid to go to school. 1 2 3 4 5 strain - adapted - SRA Other students are afraid of me. 1 2 3 4 5 interaction - R original I am happy at school. 1 2 3 4 5 strain + R adopted- STAR I have a bad reputation at school. 1 2 3 4 5 labeling - original School is meant only for kids going to college. 1 2 3 4 5 labeling - original I have a good reputation. 1 2 3 4 5 labeling + R original Education is only for smart kids. 1 2 3 4 5 labeling - original ABOUT TEACHERS & CLASSES I often lie to my teachers. 1 2 3 4 5 interaction - R original I get along well with my teachers. 1 2 3 4 5 interaction + original I am afraid to ask questions in class. 1 2 3 4 5 labeling - adapted - SRA My teachers care if I succeed. 1 2 3 4 5 strain + R adapted - STAR My teachers notice when I am absent. 1 2 3 4 5 interaction + original I have a teacher I can go to if I have a problem. 1 2 3 4 5 interaction + adapted- WILLIAMS
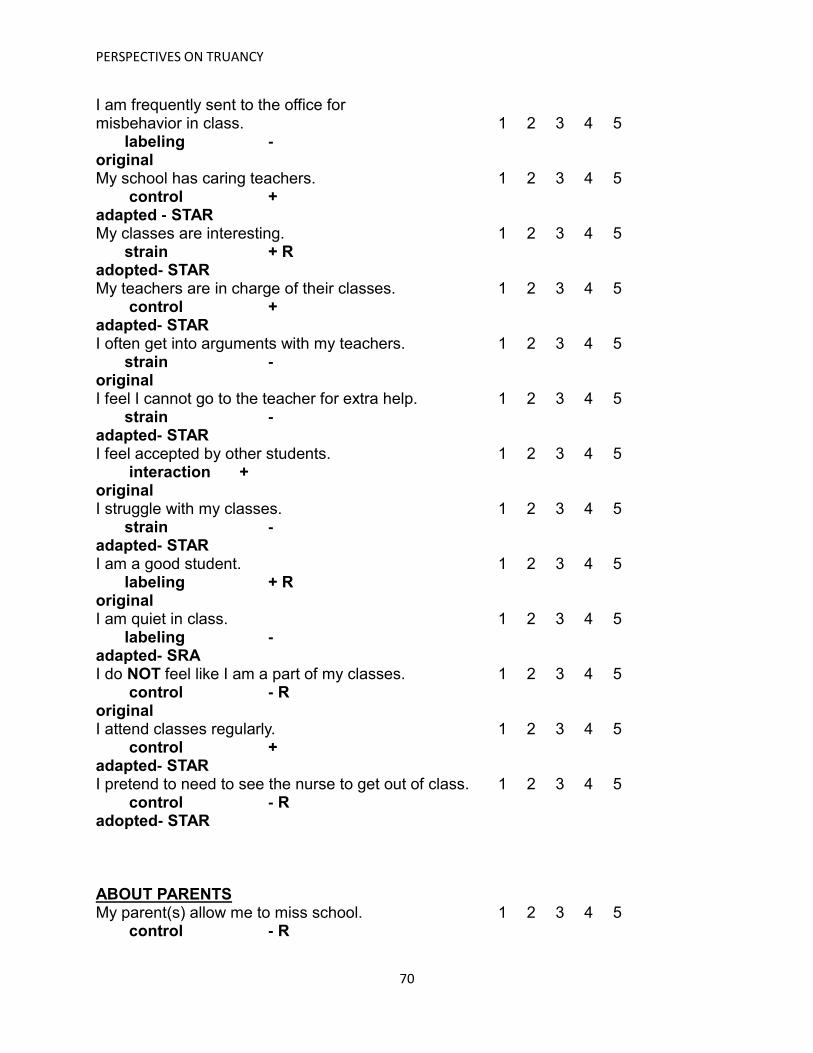
PERSPECTIVES ON TRUANCY
70
I am frequently sent to the office for misbehavior in class. 1 2 3 4 5 labeling - original My school has caring teachers. 1 2 3 4 5 control + adapted - STAR My classes are interesting. 1 2 3 4 5 strain + R adopted- STAR My teachers are in charge of their classes. 1 2 3 4 5 control + adapted- STAR I often get into arguments with my teachers. 1 2 3 4 5 strain - original I feel I cannot go to the teacher for extra help. 1 2 3 4 5 strain - adapted- STAR I feel accepted by other students. 1 2 3 4 5 interaction + original I struggle with my classes. 1 2 3 4 5 strain - adapted- STAR I am a good student. 1 2 3 4 5 labeling + R original I am quiet in class. 1 2 3 4 5 labeling - adapted- SRA I do NOT feel like I am a part of my classes. 1 2 3 4 5 control - R original I attend classes regularly. 1 2 3 4 5 control + adapted- STAR I pretend to need to see the nurse to get out of class. 1 2 3 4 5 control - R adopted- STAR ABOUT PARENTS My parent(s) allow me to miss school. 1 2 3 4 5 control - R

PERSPECTIVES ON TRUANCY
71
adapted- STAR I argue with my parents often. 1 2 3 4 5 interaction - R original My parent(s) will get in trouble if I miss school regularly. 1 2 3 4 5 control + original My parent(s) would be angry if I miss school regularly. 1 2 3 4 5 control + original My parent(s) keep in contact with my teachers. 1 2 3 4 5 interaction + adopted- STAR My parent(s) require me to attend school. 1 2 3 4 5 control + original My parent(s) has a college degree. 1 2 3 4 5 control + original I go to my parent(s) when I have a problem. 1 2 3 4 5 interaction + adopted- STAR My family depends on me for help. 1 2 3 4 5 strain - original My parent(s) get angry when I do NOT follow direction. 1 2 3 4 5 strain - original Education is important in my family. 1 2 3 4 5 labeling + R original My parent(s) want me to succeed in school. 1 2 3 4 5 strain + R adopted- STAR My parent(s) ask about, or help me with, my homework. 1 2 3 4 5 interaction + adopted- STAR My parent(s) need my help during the day at home. 1 2 3 4 5 strain - original My parent(s) ask me to miss school occasionally. 1 2 3 4 5 strain - original My parent(s) are proud of me. 1 2 3 4 5 labeling + R original

PERSPECTIVES ON TRUANCY
72
My parent(s) are good people. 1 2 3 4 5 labeling + R original My parent(s) are involved in my school and activities. 1 2 3 4 5 interaction + adopted- STAR I am a good kid. 1 2 3 4 5 labeling + R adapted- STAR My parent(s) do not care if I graduate. 1 2 3 4 5 labeling - original I am frequently in trouble at home. 1 2 3 4 5 labeling - original ABOUT FRIENDS My friends are good students. 1 2 3 4 5 labeling + R adapted- STAR No one talks to me at school. 1 2 3 4 5 interaction - R adapted- SAR I follow my friends' lead. 1 2 3 4 5 labeling - adapted- STAR My friends are mostly older than me. 1 2 3 4 5 interaction - R original I have no close friends at school. 1 2 3 4 5 strain - adopted- STAR I often lie to my friends. 1 2 3 4 5 interaction - R original I have close friends at my school. 1 2 3 4 5 interaction + adapted- STAR I have more close friends outside of school than at school. 1 2 3 4 5 strain - adapted- SAR

PERSPECTIVES ON TRUANCY
73
My friends ask about me when I miss school. 1 2 3 4 5 control + adopted- STAR My friends are frequently in trouble at school. 1 2 3 4 5 labeling - original My friends are good kids. 1 2 3 4 5 labeling + R adapted- STAR My friends dare me to do things. 1 2 3 4 5 strain - original I get along with other students. 1 2 3 4 5 interaction + original My friends follow my lead. 1 2 3 4 5 labeling ? adapted- STAR My friends are smarter than I am. 1 2 3 4 5 strain - adapted- STAR My friends want me to do well in school. 1 2 3 4 5 control + adopted- STAR My friends encourage me to be myself. 1 2 3 4 5 control + original Friends are meant to help one another. 1 2 3 4 5 control + adapted- STAR My friends attend school regularly. 1 2 3 4 5 control + original ABOUT YOU I have a job after school. 1 2 3 4 5 control + adopted- STAR I am a loner. 1 2 3 4 5 interaction - R original I like to learn. 1 2 3 4 5 strain + R adapted- STAR

PERSPECTIVES ON TRUANCY
74
I have family responsibilities. 1 2 3 4 5 control + adopted- STAR I am mean to others. 1 2 3 4 5 interaction - R original It is my choice to attend school regularly. 1 2 3 4 5 control - R adapted- STAR Homework is hard for me. 1 2 3 4 5 strain - adapted- STAR I keep up with school news. 1 2 3 4 5 control + original I get into fights often. 1 2 3 4 5 interaction - R original School spirit is important to me. 1 2 3 4 5 control + adapted- STAR I take great care in my appearance. 1 2 3 4 5 labeling + R adapted- STAR School is too difficult for me. 1 2 3 4 5 strain - adapted- STAR I am in trouble at school often. 1 2 3 4 5 labeling - original I have run-ins with the police often. 1 2 3 4 5 labeling - original I have a good life. 1 2 3 4 5 strain + R adapted- STAR I consider myself to be deviant. 1 2 3 4 5 labeling - original I am known for my risky lifestyle. 1 2 3 4 5 labeling - original I do my homework regularly. 1 2 3 4 5 strain + R adapted- STAR

PERSPECTIVES ON TRUANCY
75
I enjoy being with others. 1 2 3 4 5 interaction + original I am nice to others. 1 2 3 4 5 interaction + original
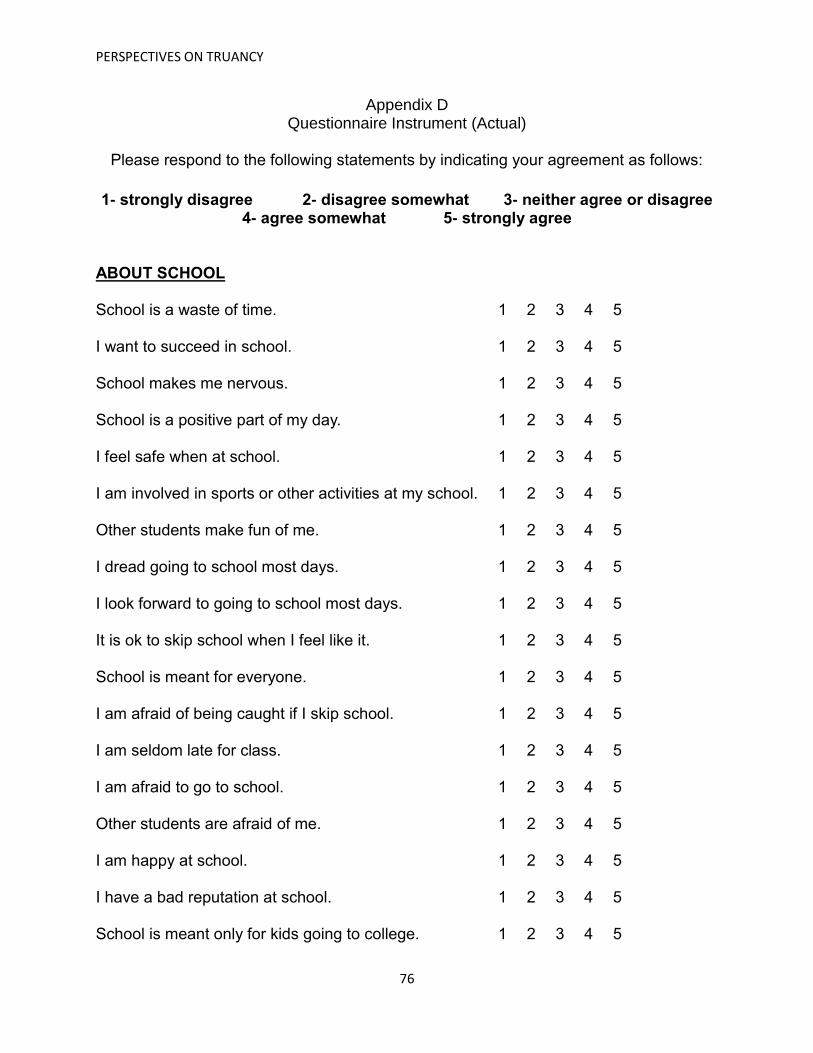
PERSPECTIVES ON TRUANCY
76
Appendix D Questionnaire Instrument (Actual)
Please respond to the following statements by indicating your agreement as follows:
1- strongly disagree 2- disagree somewhat 3- neither agree or disagree
4- agree somewhat 5- strongly agree ABOUT SCHOOL School is a waste of time. 1 2 3 4 5 I want to succeed in school. 1 2 3 4 5 School makes me nervous. 1 2 3 4 5 School is a positive part of my day. 1 2 3 4 5 I feel safe when at school. 1 2 3 4 5 I am involved in sports or other activities at my school. 1 2 3 4 5 Other students make fun of me. 1 2 3 4 5 I dread going to school most days. 1 2 3 4 5 I look forward to going to school most days. 1 2 3 4 5 It is ok to skip school when I feel like it. 1 2 3 4 5 School is meant for everyone. 1 2 3 4 5 I am afraid of being caught if I skip school. 1 2 3 4 5 I am seldom late for class. 1 2 3 4 5 I am afraid to go to school. 1 2 3 4 5 Other students are afraid of me. 1 2 3 4 5 I am happy at school. 1 2 3 4 5 I have a bad reputation at school. 1 2 3 4 5 School is meant only for kids going to college. 1 2 3 4 5

PERSPECTIVES ON TRUANCY
77
I have a good reputation. 1 2 3 4 5 Education is only for smart kids. 1 2 3 4 5 ABOUT TEACHERS & CLASSES I often lie to my teachers. 1 2 3 4 5 I get along well with my teachers. 1 2 3 4 5 I am afraid to ask questions in class. 1 2 3 4 5 My teachers care if I succeed. 1 2 3 4 5 My teachers notice when I am absent. 1 2 3 4 5 I have a teacher I can go to if I have a problem. 1 2 3 4 5 I am frequently sent to the office for misbehavior in class. 1 2 3 4 5 My school has caring teachers. 1 2 3 4 5 My classes are interesting. 1 2 3 4 5 My teachers are in charge of their classes. 1 2 3 4 5 I often get into arguments with my teachers. 1 2 3 4 5 I feel I cannot go to the teacher for extra help. 1 2 3 4 5 I feel accepted by other students. 1 2 3 4 5 I struggle with my classes. 1 2 3 4 5 I am a good student. 1 2 3 4 5 I am quiet in class. 1 2 3 4 5 I do NOT feel like I am a part of my classes. 1 2 3 4 5 I attend classes regularly. 1 2 3 4 5 I pretend to need to see the nurse to get out of class. 1 2 3 4 5

PERSPECTIVES ON TRUANCY
78
ABOUT PARENTS My parent(s) allow me to miss school. 1 2 3 4 5 I argue with my parents often. 1 2 3 4 5 My parent(s) will get in trouble if I miss school regularly. 1 2 3 4 5 My parent(s) would be angry if I miss school regularly. 1 2 3 4 5 My parent(s) keep in contact with my teachers. 1 2 3 4 5 My parent(s) require me to attend school. 1 2 3 4 5 My parent(s) has a college degree. 1 2 3 4 5 I go to my parent(s) when I have a problem. 1 2 3 4 5 My family depends on me for help. 1 2 3 4 5 My parent(s) get angry when I do NOT follow direction. 1 2 3 4 5 Education is important in my family. 1 2 3 4 5 My parent(s) want me to succeed in school. 1 2 3 4 5 My parent(s) ask about, or help me with, my homework. 1 2 3 4 5 My parent(s) need my help during the day at home. 1 2 3 4 5 My parent(s) ask me to miss school occasionally. 1 2 3 4 5 My parent(s) are proud of me. 1 2 3 4 5 My parent(s) are good people. 1 2 3 4 5 My parent(s) are involved in my school and activities. 1 2 3 4 5 I am a good kid. 1 2 3 4 5 My parent(s) do not care if I graduate. 1 2 3 4 5 I am frequently in trouble at home. 1 2 3 4 5

PERSPECTIVES ON TRUANCY
79
ABOUT FRIENDS My friends are good students. 1 2 3 4 5 No one talks to me at school. 1 2 3 4 5 I follow my friends' lead. 1 2 3 4 5 My friends are mostly older than me. 1 2 3 4 5 I have no close friends at school. 1 2 3 4 5 I often lie to my friends. 1 2 3 4 5 I have close friends at my school. 1 2 3 4 5 I have more close friends outside of school than at school. 1 2 3 4 5 My friends ask about me when I miss school. 1 2 3 4 5 My friends are frequently in trouble at school. 1 2 3 4 5 My friends are good kids. 1 2 3 4 5 My friends dare me to do things. 1 2 3 4 5 I get along with other students. 1 2 3 4 5 My friends follow my lead. 1 2 3 4 5 My friends are smarter than I am. 1 2 3 4 5 My friends want me to do well in school. 1 2 3 4 5 My friends encourage me to be myself. 1 2 3 4 5 Friends are meant to help one another. 1 2 3 4 5 My friends attend school regularly. 1 2 3 4 5

PERSPECTIVES ON TRUANCY
80
ABOUT YOU I have a job after school. 1 2 3 4 5 I am a loner. 1 2 3 4 5 I like to learn. 1 2 3 4 5 I have family responsibilities. 1 2 3 4 5 I am mean to others. 1 2 3 4 5 It is my choice to attend school regularly. 1 2 3 4 5 Homework is hard for me. 1 2 3 4 5 I keep up with school news. 1 2 3 4 5 I get into fights often. 1 2 3 4 5 School spirit is important to me. 1 2 3 4 5 I take great care in my appearance. 1 2 3 4 5 School is too difficult for me. 1 2 3 4 5 I am in trouble at school often. 1 2 3 4 5 I have run-ins with the police often. 1 2 3 4 5 I have a good life. 1 2 3 4 5 I consider myself to be deviant. 1 2 3 4 5 I am known for my risky lifestyle. 1 2 3 4 5 I do my homework regularly. 1 2 3 4 5 I enjoy being with others. 1 2 3 4 5 I am nice to others. 1 2 3 4 5
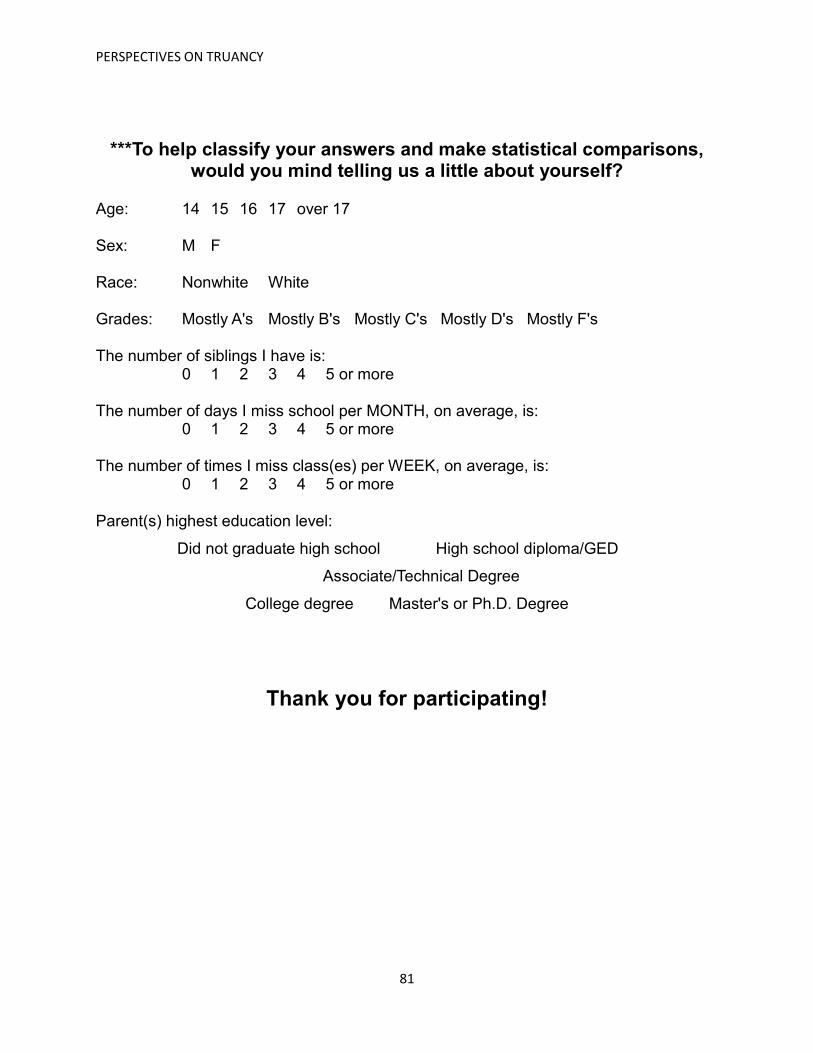
PERSPECTIVES ON TRUANCY
81
***To help classify your answers and make statistical comparisons, would you mind telling us a little about yourself?
Age: 14 15 16 17 over 17 Sex: M F Race: Nonwhite White Grades: Mostly A's Mostly B's Mostly C's Mostly D's Mostly F's The number of siblings I have is: 0 1 2 3 4 5 or more The number of days I miss school per MONTH, on average, is: 0 1 2 3 4 5 or more The number of times I miss class(es) per WEEK, on average, is: 0 1 2 3 4 5 or more Parent(s) highest education level:
Did not graduate high school High school diploma/GED
Associate/Technical Degree
College degree Master's or Ph.D. Degree
Thank you for participating!

PERSPECTIVES ON TRUANCY
82
Appendix E Description of individual factor items
Item Description 1 School is a waste of time 2 I want to succeed in school 4 School is a positive part of my day 10 It is ok to skip school when I feel like it 11 School is meant for everyone 12 I am afraid of being caught if I skip school 17 I have a bad reputation at school 18 School is meant only for kids going to college 19 I have a good reputation 20 Education is only for smart kids 21 I often lie to my teachers 22 I get along well with teachers 25 My teachers notice when I am absent 27 I am frequently sent to the office for misbehavior in class 31 I often get into arguments with my teachers 35 I am a good student 37 I do not feel like a part of my classes 44 My parent(s) would be angry if I miss school regularly 46 My parent(s) require me to attend school 51 Education is important in my family 56 My parent(s) are proud of me 57 My parent(s) are good people 60 My parent(s) do not care if I graduate 61 I am frequently in trouble at home 65 My friends dare me to do things 67 I often lie to my friends 71 My friends are frequently in trouble at school 73 My friends dare me to do things 74 I get along with other students 80 My friends attend school regularly 85 I am mean to others 89 I get into fights often 93 I am in trouble at school often 94 I have run-ins with the police often 96 I consider myself to be deviant 97 I am known for my risky lifestyle 99 I enjoy being with others 100 I am nice to others

INSTITUTIONAL REVIEW BOARD
Notice of Approval
Expedited Review
The NKU Institutional Review Board (IRB) has reviewed and approved this research protocol for the period indicated.
Federal Requirements for Principal Investigators
Federal Regulations (45.CFR.46.) require that Principal Investigators (PIs): Renew annually: PIs must reapply for IRB approval each year until the study is inactive. To renew, submit a request in writing to the IRB Administrator prior to the expiration date. If no changes have been made to the research project, simply complete the first two-pages of the IRB Application with signatures, mark the box labeled “Continuation”, attach most recent CITI scores and consent form and submit to the IRB Administrator in 724 of the Lucas Administrative Center. You will receive a pending expiration notice from the IRB Administrator approximately 60 days prior that date. IRB forms and information can be found at http://rgc.nku.edu/irb/IRB.php Report immediately: PIs must report any proposed changes in design, procedures, consent process or forms, recruiting announcements, risk to participants, or participant sample to the IRB for approval. Changes may be implemented only after IRB approval has been received, except to prevent immediate hazards to the participant. PIs also are required to report unanticipated problems to the IRB immediately. Advise promptly: PIs must notify the IRB when the study is complete (data collection finished). You will receive a closure report that we request you complete and return. Retain data / consent: PI’s must retain all data and signed consent forms for three years after the end of the study. Data that includes HIPAA protected personal health identifiers must be retained for six years after the end of the study. (Subpart A: 46.115) Submit reports: PIs must provide a copy of any audit, inspection report, or finding issued to them by any sponsor, funding agency, regulatory agency, cooperative research group, or contract research organization.
http://www.hhs.gov/ohrp/humansubjects/guidance/45cfr46.htm
Federal Wide Assurance #FWA00009011
Attachment: Documentation of Review and Approval Signatures
DATE: May 13, 2013
TO: Jeanne Spaulding, Integrative Studies
CC: Bill Attenweiler, Integrative Studies
FROM: Philip J. Moberg, NKU IRB Chair
RE:
IRB Protocol Titled: Perspectives on Truancy: An Interdisciplinary Approach
IRB Protocol: # 13-233
APPROVED: May 13, 2013 EXPIRES: May 12, 2014
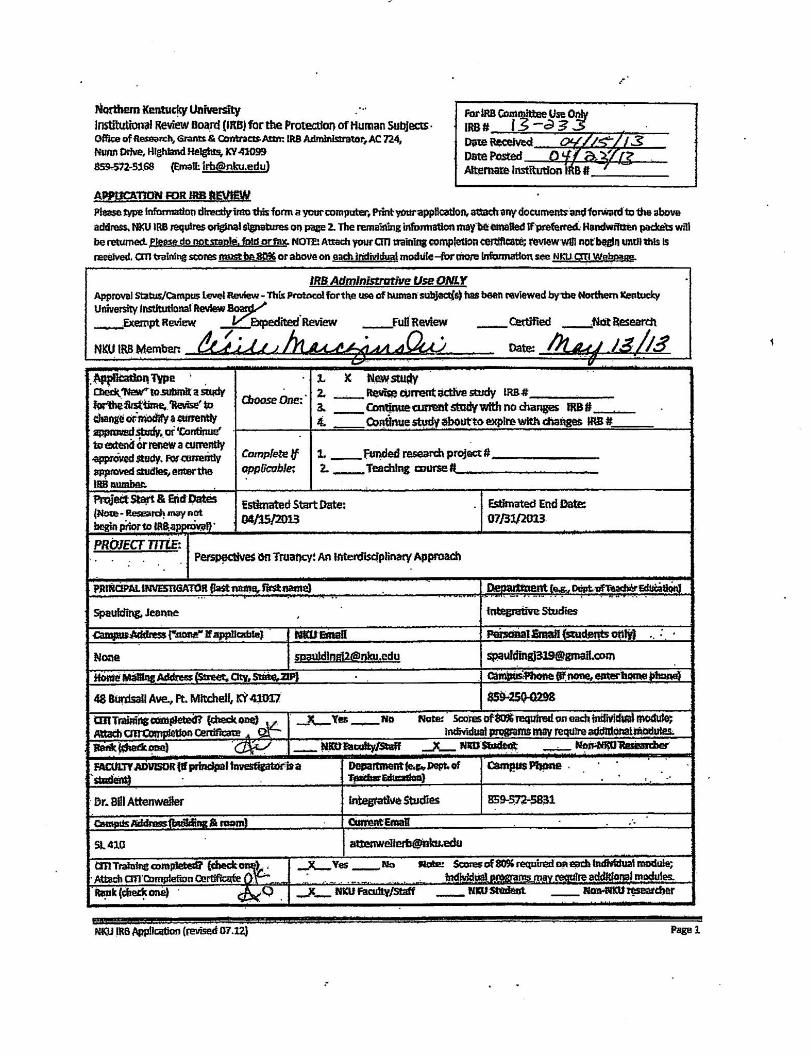


Jeanne Spaulding
Curriculum Vitae
Education Northern Kentucky University, Highland Heights, KY
Masters of Arts in Integrative Studies, expected
Bachelor of Science: Sociology
Bachelor of Arts: Criminal Justice
Experience Cincinnati Children’s Hospital Medical Center
Clinical Research Coordinator, Division of General and Community Pediatrics
Northern Kentucky University
Research Assistant
Research Presentations, Peer Reviewed
Organizational Commitment: A New Perspective
Jeanne Spaulding, Zakiya McNeal, Andrew Pirruccello, Philip J. Moberg, Ph.D.
Poster presentation at Association of Psychological Science Conference in San Francisco,
CA, May 2014
Perspectives on Truancy: An Interdisciplinary Approach
Jeanne R. Spaulding, William Attenweiler, Ph.D.
Accepted for poster presentation at International Convention of Psychological Science
Conference in Amsterdam, Netherlands, March 2015
Beyond Psychology: Expanding the Psychological Dimensions of Organizational Commitment
Andrew Pirruccello, Jeanne R. Spaulding, Zakiya McNeal, Philip J. Moberg, Ph.D.
Accepted for poster presentation at International Convention of Psychological Science
Conference in Amsterdam, Netherlands, March 2015
Publications, Peer Reviewed
Recognizing the Role of Geography in Pediatric Primary Care: Does an educational curriculum
for pediatric residency on local neighborhoods impact the usefulness of anticipatory guidance?
F. Joseph Real, MD, Andrew F. Beck, MD, MPH, Jeanne R. Spaulding, Heidi
Sucharew, PhD, Melissa Klein, MD, Med
Service Association of Psychological Science, APSSC Student Research Grant Competition
Peer Reviewer