vol02no01_rjcbs.pdf - The International Journal
83
-
Upload
khangminh22 -
Category
Documents
-
view
0 -
download
0
Transcript of vol02no01_rjcbs.pdf - The International Journal


Table of Contents
Articles
IDENTIFICATION OF EDIBILITY OF LEFTOVER FOOD AND ITS IMPACT ON FOOD SAFETY
Ramesh Kumar S
INNOVATION: ADOPTION AND IMPLEMENTATION IN MALAYSIAN HEAVY CONSTRUCTION SECTOR
Dileep Kumar Mohanachandran
“ENVIRONMENTALLY CONSCIOUS CONSUMER BEHAVIOR: AN EMPIRICAL STUDY”
Namita Rajput, Preeti Bajaj, Geetanjali Batra
MANAGEMENT OF OCCUPATIONAL STRESS IN INDIAN CONTEXT
Dr. K. Sundar, Dr. G. Ezhilan
ALIGNING CSR WITH HUMAN RESOURCE MANAGEMENT – THE KEY ROLE OF AN ORGANISATION
Dr. A. Savari muthu, M. Irudhaya Raj
A STUDY ON EXPORT OF WHEAT AND DOCUMENTS REQUIRED
Kalpana Agrawal
A STUDY ON IMPORT SCENARIO OF COLORED GEMSTONE AND DIAMONDS IN INDIA
Kalpana Agrawal
Case Studies
QUALITATIVE CASE STUDY: SHOULD ENTREPRENEUR’s BELIEVE, “LEADERSHIP IS INNATE”?
Dileep Kumar Mohanachandran

www.theinternationaljournal.org > RJCBS: Volume: 02, Number: 01, November-2012 Page 1
Identification of Edibility of leftover Food and its impact on Food Safety
Ramesh Kumar S, Associate Professor and Head, Department of Commerce, V.O.C.College, India
Abstract
In India, food borne diseases are an important reason for diarrhoeal deaths among children (<5 years)
are attributed to edibility of food. The main object of this research work is to identify the edible food.
The identification of edible food is based on different methods. This study identifies the right method.
Majority of the mothers identified the edibility of the food by a smell. Mothers in the age group of 31-
36 years identify the edibility of leftover food by sight. Housewives are expert in identifying the
edibility of food by sight. Quantitative data collected from mothers (n=2685) using Knowledge,
Beliefs and Practices (KBP). Percentage, Crosstabs and chi-Square statistical tools are used to identify
the exact result. The food handlers should be trained is identifying the edible food. Investment should
be made in modern facilities and utilities and the development should be in food safety education
programs.
INTRODUCTION
Contaminated food contributes to 1.5 billion cases of diarrhea in children each year, resulting in more
than three million premature deaths, according to the World Health Organization (WHO). Most
consumers still do not follow recommended safe food handling practices, such as safely defrosting
meat and poultry, properly using a food thermometer, safely handling leftovers, and immediately
discarding food that may be unsafe (Kurtzweil, P. 1999). In their study revealed that, food borne
diseases are an important reason for diarrhoeal among Indian children (< 5 years). Since many food
borne illnesses arise from home kitchens, mothers are the final line of defense against food become
diseases. The result of their analysis shows that, over (90%) wash hands before feeding children,
sending or cooking food. (60%) Store leftover cooked foods at room temperature. High incidence of
food borne illnesses was reported in the families (21%) and community (12%), 48% buy packed foods
and majority (78%) do not recognize symbols on the food labels (Subha 2001).
2. MATERIALS AND METHODS
2.1 RESEARCH DESIGN
The survey examines the consumption of half cooked food among the mothers in different
demographic characters during the period of 5th
February 2010 to 30th
September 2011 as a part of
Ph.D research work. The study covers Tuticorin, Tirunelveli, Virudhunagar, Kanyakumari and
Ramanathapuram districts in Tamil Nadu, India. The balanced structure of sample of 2685 mothers has
been taken through convenience sampling method. The questionnaire has two sections: (1) a
demographic profile, (2) identification of edibility of leftover food. The research scholar and research
assistants were well trained in collecting data. Each respondent took 25 to 30 minutes to complete a
questionnaire. The questionnaires were prepared in both English and Tamil. In rural areas, Tamil
questionnaires were given to collect data. In addition, the research assistants explained the questions in
detail. They collected data in the afternoon in rural areas due to the respondents engaged with farm
activities in the morning session.
2.2 PILOT STUDY
The questionnaire was pre-tested by collecting data from 105 mothers both in urban and rural
areas in the months of November and December 2010. This helped to confirm practical applicability,
clarity and to avoid unnecessary questions. The questionnaire was revised and restructured based on
www.theinternationaljournal.org > RJCBS: Volume: 02, Number: 01, November-2012 Page 2
the results of the pilot study. Some additional questions were added after evaluating the questionnaire
in the pilot study.
2.3 DATA ANALYSIS
The responses from mothers were analyzed by using a statistical package. Scores for each test
category were calculated by assigning correct responses. Cross tabulations were used to compare
indicators across demographic characteristics. Chi-Square analysis and percentage analysis of each
category were calculated and presented in the tabular form.
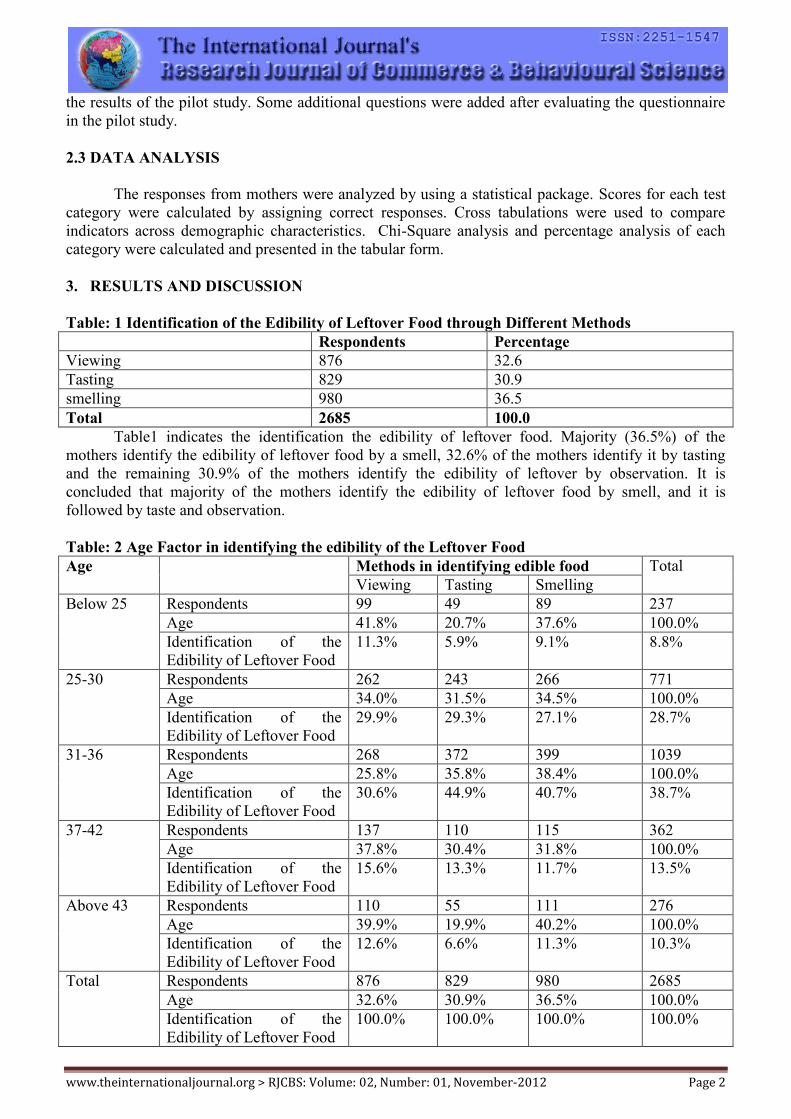
3. RESULTS AND DISCUSSION
Table: 1 Identification of the Edibility of Leftover Food through Different Methods
Respondents Percentage
Viewing 876 32.6
Tasting 829 30.9
smelling 980 36.5
Total 2685 100.0
Table1 indicates the identification the edibility of leftover food. Majority (36.5%) of the
mothers identify the edibility of leftover food by a smell, 32.6% of the mothers identify it by tasting
and the remaining 30.9% of the mothers identify the edibility of leftover by observation. It is
concluded that majority of the mothers identify the edibility of leftover food by smell, and it is
followed by taste and observation.
Table: 2 Age Factor in identifying the edibility of the Leftover Food
Age Methods in identifying edible food Total
Viewing Tasting Smelling
Below 25 Respondents 99 49 89 237
Age 41.8% 20.7% 37.6% 100.0%
Identification of the
Edibility of Leftover Food
11.3% 5.9% 9.1% 8.8%
25-30 Respondents 262 243 266 771
Age 34.0% 31.5% 34.5% 100.0%
Identification of the
Edibility of Leftover Food
29.9% 29.3% 27.1% 28.7%
31-36 Respondents 268 372 399 1039
Age 25.8% 35.8% 38.4% 100.0%
Identification of the
Edibility of Leftover Food
30.6% 44.9% 40.7% 38.7%
37-42 Respondents 137 110 115 362
Age 37.8% 30.4% 31.8% 100.0%
Identification of the
Edibility of Leftover Food
15.6% 13.3% 11.7% 13.5%
Above 43 Respondents 110 55 111 276
Age 39.9% 19.9% 40.2% 100.0%
Identification of the
Edibility of Leftover Food
12.6% 6.6% 11.3% 10.3%
Total Respondents 876 829 980 2685
Age 32.6% 30.9% 36.5% 100.0%
Identification of the
Edibility of Leftover Food
100.0% 100.0% 100.0% 100.0%

www.theinternationaljournal.org > RJCBS: Volume: 02, Number: 01, November-2012 Page 3
Table 2 analyses the different age groups of mothers and their identification methods of
edibility of left over food. Out of 2685 respondents, majority (38.7%) of the mothers are in the age
group of 31-36 years. In this age group, 38.4% of mothers identify the edibility of left over food by a
smell, 35.8% by taste and 25.8% by sight. It is followed by 28.7% of mothers in the age group of 25-
30 years. In this age group 34.5% of the mothers identify the edibility of the leftover food by a smell,
34% by sight and 31.5% by taste. Further, 13.5% of the mothers are in the age group of 37-42 years.
Among them, 37.8% of the mothers identify the edibility of left over food by sight, 31.8% by smell
and 30.4% by taste. It is followed by 10.3% of the mothers where in above 43 years of age. In this
category, 40.2% of the mothers identify the edibility of left over food by a smell, 39.9% by sight and
19.9% by taste. Further, 8.8% of the mothers are below 25 years of age. In this age group 41.8% of
mothers identify the edibility of the leftover food by sight, 37.6% by smell and 20.7% by taste. It is
concluded that mothers in the age group of 31- 36 years identify the edibility of leftover food by sight,
taste and smell.
Table: 3 Association between Mothers’ Age and their Identifying the Edibility of the Left over
Food
Value df Asymp. Sig.
(2-sided)
Pearson Chi-Square 61.036a 8 .000
*
Likelihood Ratio 63.527 8 .000
Linear-by-Linear Association .036 1 .850
N of Valid Cases 2685
*Significant at 5% level
Since, the P value is less than 0.05, in this study. Null Hypothesis is rejected at 5% level of
significance. It is concluded that there is a significant association between the identification of edibility
of leftover food and age. Hence, the mother’s age influences the identification of the edibility of
leftover food. As the age increases, the capacity to identify the edibility of leftover food also increases.
Table: 4 Mothers’ Educational level and its impact on Identification of Edibility of Left over
Food
Educational
level
Methods in identifying edible food Total
Viewing Tasting Smelling
Illiterate Respondents 275 234 261 770
Educational level 35.7% 30.4% 33.9% 100.0%
Identification of the edibility
of Leftover Food
31.4% 28.2% 26.6% 28.7%
School level Respondents 437 472 544 1453
Educational level 30.1% 32.5% 37.4% 100.0%
Identification of the edibility
of Leftover Food
49.9% 56.9% 55.5% 54.1%
College Level
Respondents 164 123 175 462
Educational level 35.5% 26.6% 37.9% 100.0%
Identification of the edibility
of Leftover Food
18.7% 14.8% 17.9% 17.2%
Total
Respondents 876 829 980 2685
Educational level 32.6% 30.9% 36.5% 100.0%
Identification of the edibility
of Leftover Food
100.0% 100.0% 100.0% 100.0%
Table 4 analyses the educational qualification of mothers and their methods to identify the
edibility of leftover food. Out of 2685 respondents, 54.1% of mothers have completed school level
education. Among them, 56.9% of mothers identify the edibility of leftover food by taste, 55.5% by

www.theinternationaljournal.org > RJCBS: Volume: 02, Number: 01, November-2012 Page 4
smell and 49.9% by sight. It is followed by 28.7% of illiterate mothers. In it, 35.7% identify the
edibility of leftover food by sight, 33.9% by smell and 30.4% by taste. Further, between 17.2% of
mothers who have completed college level education, 37.9% identify the edibility of leftover food by a
smell, 35.5% by observing and 26.6% by taste. It is concluded that majority of the mothers who have
completed school level education identify the edibility of leftover food by sight, taste and smell.
Table: 5 Associations between Mothers’ Education and their Identification of Edibility of
Leftover Food
Value df Asymp. Sig. (2-sided)
Pearson Chi-Square 12.321a 4 .015
*
Likelihood Ratio 12.441 4 .014
Linear-by-Linear Association 1.652 1 .199
N of Valid Cases 2685
*Significant at 5% level
In this table, since the P value is less than 0.05, the null hypothesis is rejected at 5%
significance level. It is concluded that there is a significant association between educational
qualification of mothers and their methods of identifying the edibility of left over food. Hence,
mother’s educational qualification is related to the methods of identifying the edibility of leftover food.
Table: 6 Impact of Occupation in Identify the edibility of the Leftover Food
Occupation Methods in identifying edible
food
Total
Viewing Tasting smelling
Housewife Respondents 578 461 538 1577
Occupation 36.7% 29.2% 34.1% 100.0%
Identification of the Edibility of Leftover
Food
65.9% 55.6% 54.9% 58.7%
Employed Respondents 139 237 248 624
Occupation 22.3% 38.0% 39.7% 100.0%
Identification of the Edibility of Leftover
Food
15.9% 28.6% 25.3% 23.2%
Daily
wages
Respondents 159 131 194 484
Occupation 32.9% 27.1% 40.1% 100.0%
Identification of the Edibility of Leftover
Food
18.2% 15.8% 19.8% 18.0%
Total Respondents 876 829 980 2685
Occupation 32.6% 30.9% 36.5% 100.0%
Identification of the Edibility of Leftover
Food
100.0% 100.0% 100.0% 100.0%
Table 6 analyses the occupation of mothers, and their methods used to identify the edibility of leftover
food. Out of 2685 respondents, 58.7% of the mothers are housewives. Among them, 36.7% of mothers
identify the edibility of leftover food by sight, 34.1% by smell and 29.2% by taste. It is followed by
23.2% of employed mothers. Among the employed mothers, 39.7% identify the edibility of leftover
food by a smell, 38% by taste and 22.3% by sight. Further, 18% of the mothers obtain daily wages. In
it, 40.1% of mothers identify the edibility of the leftover food by a smell, 32.9% by sight and 27.1% by
taste. It is concluded that majority of the mothers who are housewives identify the edibility of leftover
food by sight, taste and smell.

www.theinternationaljournal.org > RJCBS: Volume: 02, Number: 01, November-2012 Page 5
Table: 7Association between Occupation of Mothers and their Awareness of Safety of Leftover
Food
Value df Asymp. Sig. (2-sided)
Pearson Chi-Square 51.981a 6 .000
*
Likelihood Ratio 53.626 6 .000
Linear-by-Linear Association 13.696 1 .000
N of Valid Cases 2685
*Significant at 5% level
Since the P value in this table is less than 0.05, the null hypothesis is rejected at 5%
significance level. It is concluded that there is a significant association between occupation and
methods to identify the edibility of leftover food. Hence mothers’ occupation is related to methods to
identify the edibility of leftover food. Therefore, mothers at home identify the edibility of leftover food
better than employed mothers.
Table: 8 Influence of Monthly Income in Identifying the Edibility of the Leftover Food
Monthly Income Methods in identifying edible food Total
Viewing Tasting Smelling
Below Rs.5000 Respondents 504 534 646 1684
Monthly Income 29.9% 31.7% 38.4% 100.0%
Identification of the
Edibility of Leftover
Food
57.5% 64.4% 65.9% 62.7%
Rs.5000-Rs.15000 Respondents 284 193 258 735
Monthly Income 38.6% 26.3% 35.1% 100.0%
Identification of the
Edibility of Leftover
Food
32.4% 23.3% 26.3% 27.4%
Above Rs.15000 Respondents 88 102 76 266
Monthly Income 33.1% 38.3% 28.6% 100.0%
Identification of the
Edibility of Leftover
Food
10.0% 12.3% 7.8% 9.9%
Total Respondents 876 829 980 2685
Monthly Income 32.6% 30.9% 36.5% 100.0%
Identification of the
Edibility of Leftover
Food
100.0% 100.0% 100.0% 100.0%
Table 8 indicates the monthly income of mothers and their identification methods of edibility
of leftover food. Majority (62.7%) of the mothers’ income is below Rs.5000. In it, 38.4% of mothers
identify the edibility of leftover food by a smell, 31.7% by taste and 29.9% by sight. It is followed by
27.4% of mothers in the income group of Rs.5000-15000. Here 38.6% of the mothers identify the
edibility of leftover food by sight, 26.3% by taste and 35.1% by a smell. Further 9.9% of the mothers’
income is above Rs.15000. In it, 33.1% identify the edibility of leftover food by sight, 38.3% by taste
and 28.6% by a smell. It is concluded that majority of the mothers’ monthly income is below Rs. 5000
and they identify the edibility of leftover food by sight, smell and taste.
www.theinternationaljournal.org > RJCBS: Volume: 02, Number: 01, November-2012 Page 6
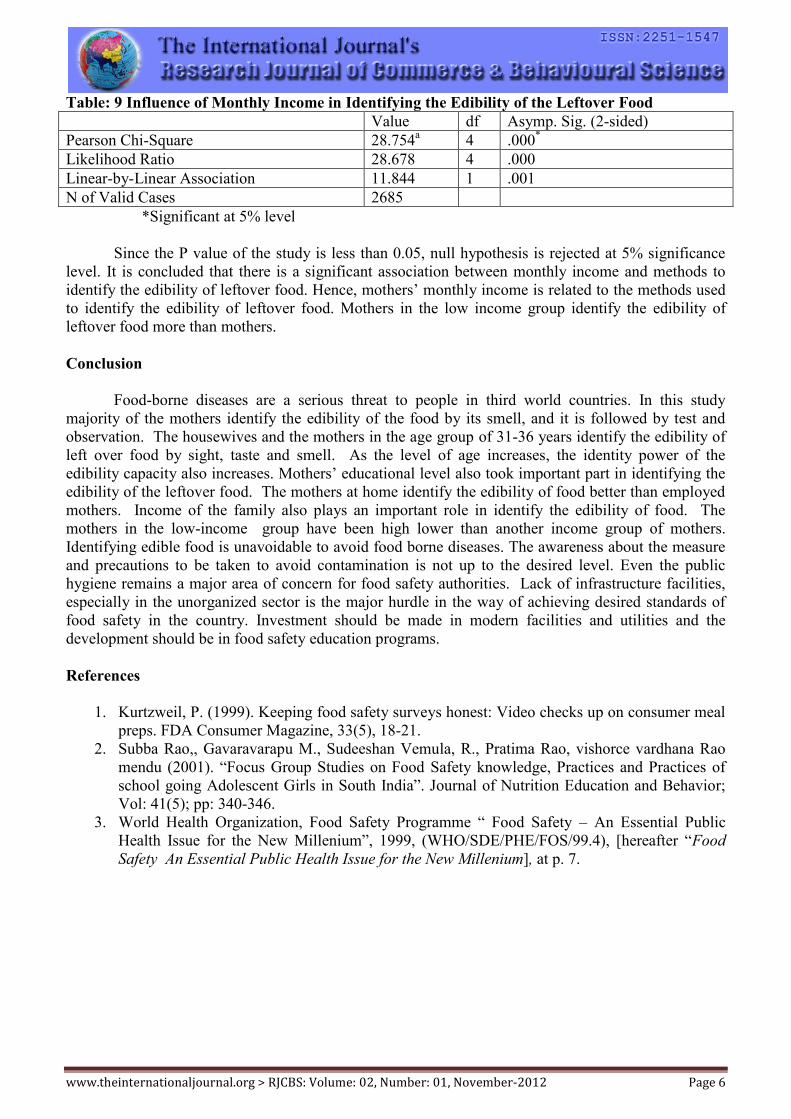
Table: 9 Influence of Monthly Income in Identifying the Edibility of the Leftover Food
Value df Asymp. Sig. (2-sided)
Pearson Chi-Square 28.754a 4 .000
*
Likelihood Ratio 28.678 4 .000
Linear-by-Linear Association 11.844 1 .001
N of Valid Cases 2685
*Significant at 5% level
Since the P value of the study is less than 0.05, null hypothesis is rejected at 5% significance
level. It is concluded that there is a significant association between monthly income and methods to
identify the edibility of leftover food. Hence, mothers’ monthly income is related to the methods used
to identify the edibility of leftover food. Mothers in the low income group identify the edibility of
leftover food more than mothers.
Conclusion
Food-borne diseases are a serious threat to people in third world countries. In this study
majority of the mothers identify the edibility of the food by its smell, and it is followed by test and
observation. The housewives and the mothers in the age group of 31-36 years identify the edibility of
left over food by sight, taste and smell. As the level of age increases, the identity power of the
edibility capacity also increases. Mothers’ educational level also took important part in identifying the
edibility of the leftover food. The mothers at home identify the edibility of food better than employed
mothers. Income of the family also plays an important role in identify the edibility of food. The
mothers in the low-income group have been high lower than another income group of mothers.
Identifying edible food is unavoidable to avoid food borne diseases. The awareness about the measure
and precautions to be taken to avoid contamination is not up to the desired level. Even the public
hygiene remains a major area of concern for food safety authorities. Lack of infrastructure facilities,
especially in the unorganized sector is the major hurdle in the way of achieving desired standards of
food safety in the country. Investment should be made in modern facilities and utilities and the
development should be in food safety education programs.
References
1. Kurtzweil, P. (1999). Keeping food safety surveys honest: Video checks up on consumer meal
preps. FDA Consumer Magazine, 33(5), 18-21.
2. Subba Rao,, Gavaravarapu M., Sudeeshan Vemula, R., Pratima Rao, vishorce vardhana Rao
mendu (2001). “Focus Group Studies on Food Safety knowledge, Practices and Practices of
school going Adolescent Girls in South India”. Journal of Nutrition Education and Behavior;
Vol: 41(5); pp: 340-346.
3. World Health Organization, Food Safety Programme “ Food Safety – An Essential Public
Health Issue for the New Millenium”, 1999, (WHO/SDE/PHE/FOS/99.4), [hereafter “Food
Safety An Essential Public Health Issue for the New Millenium], at p. 7.
www.theinternationaljournal.org > RJCBS: Volume: 02, Number: 01, November-2012 Page 7
Innovation: Adoption and Implementation in Malaysian Heavy construction sector
Dr. Dileep Kumar M, Professor – HRM/OB/ Strategic Management, Othman Yeop Abdullah
Graduate School of Business, Universiti Utara, Malaysia.
Abstract
The distinctive characteristics of construction sector significantly differentiate itself from
manufacturing. Past researches seem have been given less attention to the innovation in the
construction sector. The purpose of this study reviews the relationship of firm’s innovativeness in
regard to the degree of innovation implementation and adoption. A total of fourteen hypotheses is
developed and tested in this study. These hypotheses are established within the context of heavy
construction sector characteristics that are consistently considered to be significant determinants of
firm innovativeness. These characteristics include (1) market structure characteristics, (2) organization
and task characteristics, (3) adopter industry competitive environment, and (4) external cooperation
linkage. Hypotheses were tested utilizing survey data collect from Malaysia Construction Industry
Development Board, which registered as CIDB Grade 7 construction firms throughout the Malaysia.
This study has reviewed the problem of determinants of firms’ innovativeness in technological
innovation the Malaysian heavy construction sector to meet the outlined objectives. The results
indicate that adopter industry competitive environment and external cooperation linkage are among the
variables that significantly affect the degree of innovation implementation. Results also indicate that
13 out of 14 hypotheses are supported and positively affecting the degree of innovation
implementation and adoption. Therefore, the results suggest that increasing the rate of innovation
implementation and adoption may be enhanced to a greater degree by increasing adopter industry
competitive environment and external linkage rather than implementing market structure environment
characteristics or organization and task characteristics. This study has pertinent value and has
advanced knowledge in the construction industry, especially, and hence the aim of this study has
successfully attained.
Keywords: innovation, determinants of firms, innovativeness, heavy construction sectors
1.0 Overview of Study
The aim of this research was to investigate and evaluate issues related to the nature of technological
innovation implementation and adoption within the Malaysian construction industry, with particular
reference to the heavy construction sector.
Based on an exhaustive review of the literature and discussions with Malaysian construction industry
experts, a total of fourteen hypotheses was developed. These hypotheses were established within the
context of Malaysian construction industry characteristics that are consistently suggested to be
significant determinants of firms’ innovativeness. These characteristics included: 1) Industry
fragmentation; 2) Metropolitan location; 3) Firm size; 4) Presence of trade unions; 5) Professional and
trade association affiliations; 6) Complexity; 7) Management intensity; 8) Firm experience; 9)
Construction industry; 10) Perceived environmenttal uncertainty; 11) Competitive rivalry; 12) Firm-
university cooperation; 13) Firm-research center cooperation; 14) Firm-government cooperation.
A survey was developed, pretested, and administered to 703 CIDB G7 contractors throughout the
Malaysia. Returned surveys provided information concerning firm demographics, structure, operation,
and perceptions of the innovation. Two forms of data analysis were utilized to test the fourteen
hypotheses, to determine how the individual characteristic affects the dichotomous choice of firms’
innovation implementation and adoption or rejection in the heavy construction sector. MRA was
adopted to test all the hypotheses. Similarly, a new model was established using the combination of
www.theinternationaljournal.org > RJCBS: Volume: 02, Number: 01, November-2012 Page 8
PCA and MRA as determinants of firms’ innovativeness to predict the degree of innovation
implementation and adoption.
The results of the regression analyses indicate that external cooperation linkage which consists of firm-
university cooperation, firm-research center cooperation and firm-government cooperation was the
variable found to be statistically significant in affecting technological implementation and adoption of
innovation across the Malaysian heavy construction sector.
Although the literature continually cites organization and task characteristics as being the major
inhibitor of construction firms on implementation and adoption of innovations, the results of this study,
conducted within the context of the heavy construction sector, clearly indicated that firm size, type of
construction and experience in construction have little or no influence on firm innovation
implementation and adoption behavior. In fact, the results indicate that external cooperation linkage
and adopter industry competitive environment were more likely to affect firm adoption behavior than
factors related to organization and task characteristic. Therefore, the results suggest that increasing the
rate of implementation and adoption may be enhanced to a greater degree by increasing external
cooperation, perceived environmental uncertainties and competitive rivalry attributes rather than
implementing and adopting such measures as increasing organizational and task characteristic.
2.0 Research Objective
This research focuses on determinants of firms’ innovativeness on construction technologies in
affecting the degree of innovation implementation and adoption, which has been received little or no
attention from those researchers in the construction industry. Thus, it is the objective of this study to
extensively review the determinants of firms’ innovativeness in the Malaysian construction industry
context, or specifically to test and analyze all hypotheses established from the extensive literature
review, in relation to the degree of technological innovation implementation and adoption in the heavy
construction sector.
3.0 Research Questions
Through the investigation of the determinants of innovativeness in the Malaysian construction
industry, this research addresses the research questions of to what extends the hypotheses influence
and affect the implementation and adoption of innovation? Further, are all the hypotheses established
from the literature review supported in the local construction industry context? The research questions
assist to test the hypotheses established from the extensive literature review. Although the focus of this
research is on firms’ innovativeness on technological innovation implementation and adoption,
construction materials suppliers can also be benefited from the results of this research.
4.0 Significance of the Research
The project price instability has provided an opportunity for contractors to determine the
implementation and adoption of better construction technologies to increase their market share in the
construction industry. Despite their ability to produce cost-competitive, resource-efficient outputs,
most contractors have had only limited success in gaining wide-scale acceptance of their outputs by
project owners. This lack of market success has been attributed to inefficient market planning,
implementation and adoption. An even more fundamental factor causal to this problem is the basic
lack of information related to identifying those factors that affect the rate of innovation implementation
and adoption, as well as determination of the relative importance of the different factors that influence
construction firms’ innovativeness.

www.theinternationaljournal.org > RJCBS: Volume: 02, Number: 01, November-2012 Page 9
Much of the concern for innovation in the construction industry has focused on innovation in design
than construction processes (Seng, 2012). An emphasis on individual construction projects as the basis
for analysis has supported increasingly misleading views of the rate of innovation and by the way
many new technologies are introduced in the industries. Contractors that involved in the construction
processes are an important and neglected source in implementation and adoption of new technologies,
a source that is often ignored by studies of innovation in the construction industry. From the standpoint
of applied research, the significance of this study is that it provides contractors guide to general
determinant factors in the implementation and adoption of innovative construction technologies that
can be used to devise strategic marketing plans and finally for enjoyment of competitive advantages.
5.0 Research Framework
Figure 1 illustrates the conceptual model of factors that are hypothesized to influence construction
firms’ innovativeness with regard to the implementation and adoption of construction technologies.
This model integrates several components of competitive effects that were investigated in Gatignon &
Robertson (1989), Abdullah (1991), Seng (2011&2012) and Ghassan (2011). Additionally, some
factors corresponding to the extant theory of innovation implementation and adoption by organizations
are included in the model since they can contribute to the prediction of innovation implementation and
adoption choice behavior. These factors are fully developed based on existing theories. Hypotheses are
then formulated to explain construction firms’ innovativeness with regard to the implementation and
adoption of construction technologies, in the next section of this research.
Figure 1 Conceptual model of construction firms’ innovativeness
6.0 Hypotheses
A total of fourteen hypotheses has been developed in this study as determinants of firms’
innovativeness in the heavy construction sector, Malaysia. The hypotheses are mainly classified into
one of four domains; 1) market structure characteristics, 2) organization and task characteristics, 3)
adopter industry competitive environment, and 4) external cooperation linkage. The domain of market
structure characteristics consists of the following hypothesizes determinants of firms’ innovativeness:
industrial fragmentation, metropolitan location, and firm size. The domain of an organization and task
characteristics consists of the type of construction, presence of trade unions, professional and trade

www.theinternationaljournal.org > RJCBS: Volume: 02, Number: 01, November-2012 Page 10
association affiliations, complexity, management intensity, and experience in the construction industry.
The domain of the adopter industry competitive environment consists of perceived environmental
uncertainty and competitive rivalry as determinants of firms’ innovativeness. The domain of external
cooperation linkage consists of firm-university cooperation, firm-research center cooperation, and
firms-government cooperation. Table 1 provides a summary of the determinants of firms’
innovativeness in the construction industry with regard to the implementation and adoption of
construction technologies.
Table 1 Summary of the hypothesized determinants of firms’ innovativeness in the construction
industry
Determinants of Firms Innovativeness
Market Structure Characteristics
H1 Industry fragmentation is negatively associated with construction firms’ innovativeness with
respect to construction technologies implementation and adoption.
H2 The degree of urbanization of the firm's primary operating location is positively associated
with construction firms’ innovativeness with respect to construction technologies.
H3 The innovativeness of firms with respect to construction technologies implementation and
adoption in the construction industry is positively affected by the firm size.
Organization and Task Characteristics
H4 Type of construction will significantly affect the firms’ innovativeness with respect to
construction technologies implementation and adoption.
H5 Increasing presence of trade union within construction firms is positively associated with
firms’ innovativeness with respect to construction technologies implementation and adoption.
H6 There is a positive association between affiliation with professional and trade associations and
construction firms’ innovativeness with respect to construction technologies implementation
and adoption.
H7 Construction firms’ innovativeness with respect to particular construction technologies
implementation and adoption is positively affected by the complexity nature of the
construction technologies.
H8 A positive relationship exists in the construction industry between firm management intensity
and innovativeness with respect to construction technologies implementation and adoption.
H9 Construction firm experience interacts to influence firms’ innovativeness with respect to
construction technologies implementation and adoption.
Adopter Industry Competitive Environment
H10 Construction firms’ innovativeness with respect to construction technologies implementation
and adoption will be greater for firms that exhibit low levels of state uncertainty relative to
those firms that exhibit high levels of state uncertainty.
H11 Firm perception of the competitive rivalry in the construction industry will positively affect
the decision on implementation and adoption of particular construction technologies.
External cooperation linkage
H12 Firm-university cooperation is positively influencing the degree of firms’ innovativeness in
construction technologies implementation and adoption.
H13 Firm-research center cooperation has provided some exposure to the high capabilities and
expertise in innovation of construction technologies.
H14 Firm-government cooperation will help the firms’ intensity to extensively try new
construction technologies.
7.0 Results and Discussion
A total of 703 questionnaire surveys was mailed to randomly selected construction firms that operating
in Malaysia and registered as G7 contractor with CIDB. The number of returning usable surveys

www.theinternationaljournal.org > RJCBS: Volume: 02, Number: 01, November-2012 Page 11
totaled 383, yielding an effective response rate of 45.52%. In order to answer the research question,
which addressed the relationship between the various determinants of firms’ innovativeness in
technological innovation implementation and adoption, linear regression analyses were conducted. In
light of the results of the regression analysis, some improvements have to be made, if it is not
supported by the statement of hypotheses stated earlier. The hypotheses tested in this study are as
follows:
H1: Industry fragmentation is negatively associated with construction firms’ innovativeness with
respect to construction technologies implementation and adoption.
Based on the 383 firms, the following results were recorded. Table 2 shows the result which indicates
the two variables are positively associated; R2 = 0.058, Adj. R
2 = 0.055 and F = 23.080, p<0.01. This
means 5.8% of the variance increase in the degree of technological innovation implementation and
adoption was explained by the industrial fragmentation. Approximately 5.8% of the variance of the
construction technology innovation implementation and adoption is accounted for by its linear
relationship with the industrial fragmentation in the regression equation for predicting the construction
technology implementation and adoption.
Table 2 Results of regression analysis for industrial fragmentation
Therefore, hypothesis are not supported and then regressing is written as follows;
CFI = 15.505 + 0.229X + e……..Formula 1 …..Formulae 1
H2: The degree of urbanization of the firm's primary operating location is positively associated with
construction firms’ innovativeness with respect to construction technologies.
Based on the 383 firms, the following results were recorded. Table 3 shows the result which indicates
the two variables are positively associated; R2 = 0.075, Adj. R
2 = 0.072 and F = 30.338, p<0.01. This
means 7.5% of the variance increase in the firms’ innovativeness was explained by the degree of
urbanization of the firm’s primary operating location. Approximately 7.5% of the variance of the
construction technologies innovation implementation and adoption is accounted for by its linear
relationship with the urbanization of the firm’s primary operating location in the regression equation
for predicting the firms’ innovativeness.
Model Summaryb
Model R R
Square
Adjusted R
Square
Std. Error of the Estimate
1 . 240a .058 .055 4.47690
a. Predictors: (Constant), IF
b. Dependent Variable: CFI
Coefficientsa
Model Unstandardized
Coefficients
Standardized
Coefficients
t
Sig.
B Std. Error Beta
1 Constant) 15.505 .898 17.258 .000
IF .229 .048 .240 4.804 .000
a. Dependent Variable: CFI

www.theinternationaljournal.org > RJCBS: Volume: 02, Number: 01, November-2012 Page 12
Table 3 Results of regression analysis for operation location
Model Summaryb
Model R R Square Adjusted R Square Std. Error of the Estimate
1 .273a .075 .072 4.43922
a. Predictors: (Constant), OL
b. Dependent Variable: CFI
Coefficientsa
Model
Unstandardized Coefficients
Standardized
Coefficients
t Sig. B Std. Error Beta
1
(Constant)
OL
14.905 .902
.273
16.522 .000
.480 .087 5.508 .000
a. Dependent Variable: CFI
Therefore, hypothesis are supported and then regressing is written as follows;
CFI = 14.905 + 0.480X + e …..Formulae
H3: The innovativeness of firms with respect to construction technology implementation and adoption
in the construction industry is positively affected by the firm size.
Based on the 383 firms, the following results were recorded. Table 4 shows the result which indicates
the two variables are positively associated; R2
= 0.073, Adj. R2
= 0.071 and F = 29.957, p<0.01. This
means 7.3% of the variance increase in the innovativeness of firms was explained by the firm size.
Approximately 7.3% of the variance of the construction technologies innovation implementation and
adoption is accounted for by its linear relationship with the firm size in the regression equation for
predicting the firms’ innovativeness.
Therefore, hypothesis are supported and then regressing is written as follows;
CFI = 15.755 + 0.287X + e …..Formulae 3
Table 4 Results of regression analysis for firm size
Model Summaryb
Model R R Square Adjusted R Square Std. Error of
the Estimate
1 .271a 0.073 0.071 4.43699
a. Predictors: (Constant), FS
b. Dependent Variable: CFI
Coefficientsa
Model Unstandardized
Coefficients
Standardized
Coefficients
t Sig.
B Std. Error Beta
1 (Constant) 15.755 0.756 20.833 0
FS 0.287 0.052 0.271 5.473 0
a. Dependent Variable: CFI
H4: Type of construction will significantly affect the firms’ innovativeness with respect to construction
technologies implementation and adoption.
Based on the 383 firms, the following results were recorded. Table 5 shows the result which indicates
the two variables are positively associated; R2
= 0.024, Adj. R2 = 0.021 and F = 9.264, p<0.01. This
means 2.4% of the variance increase in the innovativeness of firms was explained by the type of
construction. Approximately 2.4% of the variance of the construction technologies innovation

www.theinternationaljournal.org > RJCBS: Volume: 02, Number: 01, November-2012 Page 13
implementation and adoption is accounted for by its linear relationship with the type of construction in
the regression equation for predicting the firms’ innovativeness.
Table 5 Results of regression analysis for type of construction
Model Summaryb
Model R R Square Adjusted R
Square
Std. Error of the Estimate
1 .154a .024 .021 4.54638
a. Predictors: (Constant), TOC
b. Dependent Variable: CFI
Coefficientsa
Model Unstandardized Coefficients Standardized
Coefficients
t Sig.
B Std. Error Beta
1 (Constant) 17.352 .802 21.635 .000
TOC .170 .056 .154 3.044 .002
a. Dependent Variable: CFI
Therefore, hypothesis are supported and then regressing is written as follows;
CFI = 17.352 + 0.170X + e …..Formulae 4
H5: Increasing presence of trade union within construction firms is positively associated with Firms’
innovativeness with respect to construction technologies implementation and adoption.
Based on the 383 firms, the following results were recorded. Table 6 shows the result which indicates
the two variables are positively associated; R2
= 0.031, Adj. R2
= 0.028 and F = 12.150, p<0.01. This
means 3.1% of the variance increase in the innovativeness of firms was explained by the presence of
trade unions. Approximately 3.1% of the variance of the construction technologies innovation
implementation and adoption is accounted for by its linear relationship with the presence of trade
unions in the regression equation for predicting the firms’ innovativeness.
Table 6 Results of regression analysis for presence of trade unions
Model summary
Model R R Square Adjusted R Square Std. Error of the Estimate
1 .176a .031 .028 4.52962
a. Predictors: (Constant), PTU
b. Dependent Variable: CFI
Coefficientsa
Model
Unstandardized Coefficients
Standardized
Coefficients
t Sig. B Std. Error Beta
1 (Constant) 16.684 .893 18.692 .000
PTU .215 .062 .176 3.486 .001
a. Dependent Variable: CFI
Therefore, hypothesis are supported and then regressing is written as follows;
CFI = 16.684 + 0.215X + e …..Formulae 5
H6: There is a positive association between affiliation with professional and trade associations and
construction firms’ innovativeness with respect to construction technologies implementation and
adoption.
Based on the 383 firms, the following results were recorded. Table 7 shows the result which indicates
the two variables are positively associated; R2 = 0.022, Adj. R
2 = 0.019 and F = 8.342, p<0.01. This
means 2.2% of the variance increase in the innovativeness of firms was explained by the professional
trade association affiliate. Approximately 2.2% of the variance of the construction technologies
www.theinternationaljournal.org > RJCBS: Volume: 02, Number: 01, November-2012 Page 14
innovation implementation and adoption is accounted for by its linear relationship with the
professional trade association affiliate in the regression equation for predicting the firms’
innovativeness.
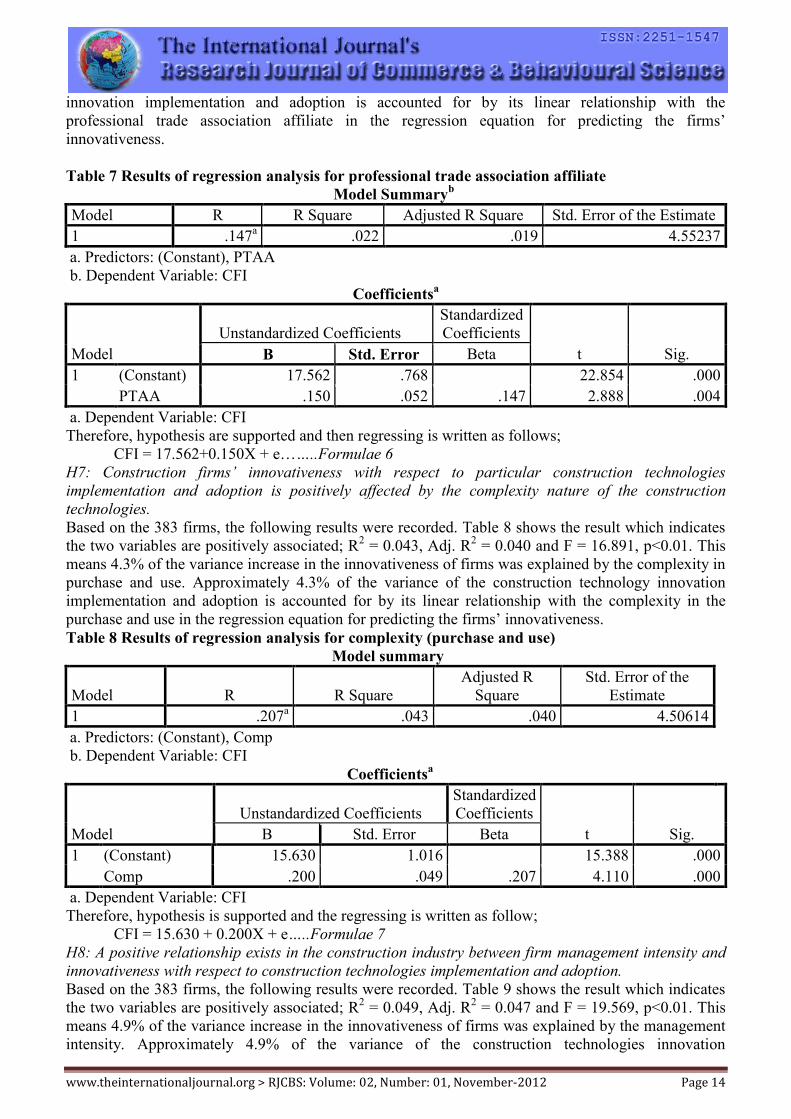
Table 7 Results of regression analysis for professional trade association affiliate
Model Summaryb
Model R R Square Adjusted R Square Std. Error of the Estimate
1 .147a .022 .019 4.55237
a. Predictors: (Constant), PTAA
b. Dependent Variable: CFI
Coefficientsa
Model
Unstandardized Coefficients
Standardized
Coefficients
t Sig. B Std. Error Beta
1 (Constant) 17.562 .768 22.854 .000
PTAA .150 .052 .147 2.888 .004
a. Dependent Variable: CFI
Therefore, hypothesis are supported and then regressing is written as follows;
CFI = 17.562+0.150X + e……..Formulae 6
H7: Construction firms’ innovativeness with respect to particular construction technologies
implementation and adoption is positively affected by the complexity nature of the construction
technologies.
Based on the 383 firms, the following results were recorded. Table 8 shows the result which indicates
the two variables are positively associated; R2 = 0.043, Adj. R
2 = 0.040 and F = 16.891, p<0.01. This
means 4.3% of the variance increase in the innovativeness of firms was explained by the complexity in
purchase and use. Approximately 4.3% of the variance of the construction technology innovation
implementation and adoption is accounted for by its linear relationship with the complexity in the
purchase and use in the regression equation for predicting the firms’ innovativeness.
Table 8 Results of regression analysis for complexity (purchase and use)
Model summary
Model R R Square
Adjusted R
Square
Std. Error of the
Estimate
1 .207a .043 .040 4.50614
a. Predictors: (Constant), Comp
b. Dependent Variable: CFI
Coefficientsa
Model
Unstandardized Coefficients
Standardized
Coefficients
t Sig. B Std. Error Beta
1 (Constant) 15.630 1.016 15.388 .000
Comp .200 .049 .207 4.110 .000
a. Dependent Variable: CFI
Therefore, hypothesis is supported and the regressing is written as follow;
CFI = 15.630 + 0.200X + e…..Formulae 7
H8: A positive relationship exists in the construction industry between firm management intensity and
innovativeness with respect to construction technologies implementation and adoption.
Based on the 383 firms, the following results were recorded. Table 9 shows the result which indicates
the two variables are positively associated; R2 = 0.049, Adj. R
2 = 0.047 and F = 19.569, p<0.01. This
means 4.9% of the variance increase in the innovativeness of firms was explained by the management
intensity. Approximately 4.9% of the variance of the construction technologies innovation

www.theinternationaljournal.org > RJCBS: Volume: 02, Number: 01, November-2012 Page 15
implementation and adoption is accounted for by its linear relationship with the management intensity
in the regression equation for predicting the firms’ innovativeness.
Table 9 Results of regression analysis for management intensity
Model Summaryb
Model R R Square
Adjusted R
Square
Std. Error of the
Estimate
1 .222a .049 .047 4.49325
a. Predictors: (Constant), MI
b. Dependent Variable: CFI
Coefficientsa
Model
Unstandardized Coefficients
Standardized
Coefficients
t Sig. B Std. Error Beta
1 (Constant) 15.980 .864 18.486 .000
MI .247 .056 .222 4.424 .000
a. Dependent Variable: CFI
Therefore, hypothesis is supported and the regressing is written as follow;
CFI = 15.980+0.247X + e… Formula 8 …..Formulae 8
H9: Construction firm experience interacts to influence firms’ innovativeness with respect to
construction technologies implementation and adoption.
Based on the 383 firms, the following results were recorded. Table 10 shows the result which indicates
the two variables are positively associated; R2 = 0.065, Adj. R
2 = 0.063 and F = 26.429, p<0.01. This
means 6.5% of the variance increase in the innovativeness of firms was explained by the experience in
construction. Approximately 6.5% of the variance of the construction technologies innovation
implementation and adoption is accounted for by its linear relationship with the experience in
construction in the regression equation for predicting the firms’ innovativeness.
Table 10 Results of regression analysis for experience in construction
Model Summaryb
Model R R Square Adjusted R Square Std. Error of the Estimate
1 .255a .065 .063 4.44934
a. Predictors: (Constant), EIC
b. Dependent Variable: CFI
Coefficientsa
Model
Unstandardized Coefficients
Standardized
Coefficients
t Sig. B Std. Error Beta
1 (Constant) 15.251 .893 17.083 .000
EIC .306 .060 .255
5.141
.000
a. Dependent Variable: CFI
Therefore, hypothesis is supported and then regressing is written as follows;
CFI = 15.251 + 0.306X + e…. Formulae 9 …..Formulae 9
www.theinternationaljournal.org > RJCBS: Volume: 02, Number: 01, November-2012 Page 16
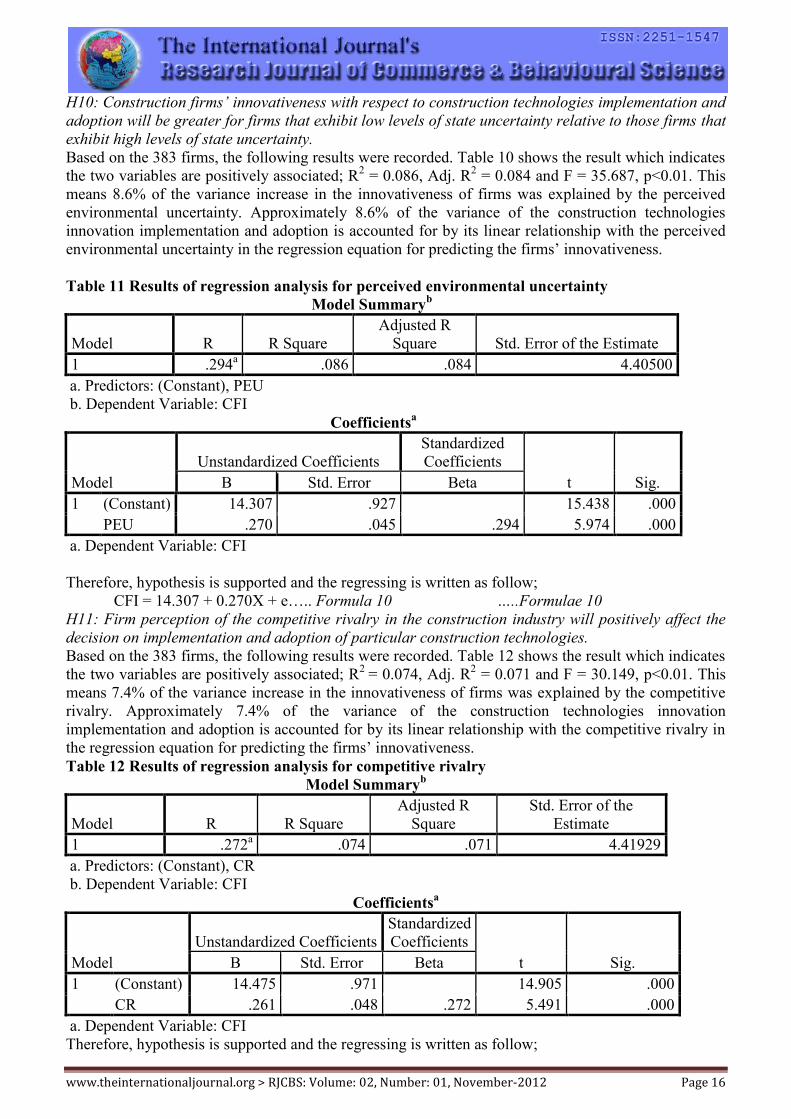
H10: Construction firms’ innovativeness with respect to construction technologies implementation and
adoption will be greater for firms that exhibit low levels of state uncertainty relative to those firms that
exhibit high levels of state uncertainty.
Based on the 383 firms, the following results were recorded. Table 10 shows the result which indicates
the two variables are positively associated; R2 = 0.086, Adj. R
2 = 0.084 and F = 35.687, p<0.01. This
means 8.6% of the variance increase in the innovativeness of firms was explained by the perceived
environmental uncertainty. Approximately 8.6% of the variance of the construction technologies
innovation implementation and adoption is accounted for by its linear relationship with the perceived
environmental uncertainty in the regression equation for predicting the firms’ innovativeness.
Table 11 Results of regression analysis for perceived environmental uncertainty
Model Summaryb
Model R R Square
Adjusted R
Square Std. Error of the Estimate
1 .294a .086 .084 4.40500
a. Predictors: (Constant), PEU
b. Dependent Variable: CFI
Coefficientsa
Model
Unstandardized Coefficients
Standardized
Coefficients
t Sig. B Std. Error Beta
1 (Constant) 14.307 .927 15.438 .000
PEU .270 .045 .294 5.974 .000
a. Dependent Variable: CFI
Therefore, hypothesis is supported and the regressing is written as follow;
CFI = 14.307 + 0.270X + e….. Formula 10 …..Formulae 10
H11: Firm perception of the competitive rivalry in the construction industry will positively affect the
decision on implementation and adoption of particular construction technologies.
Based on the 383 firms, the following results were recorded. Table 12 shows the result which indicates
the two variables are positively associated; R2
= 0.074, Adj. R2 = 0.071 and F = 30.149, p<0.01. This
means 7.4% of the variance increase in the innovativeness of firms was explained by the competitive
rivalry. Approximately 7.4% of the variance of the construction technologies innovation
implementation and adoption is accounted for by its linear relationship with the competitive rivalry in
the regression equation for predicting the firms’ innovativeness.
Table 12 Results of regression analysis for competitive rivalry
Model Summaryb
Model R R Square
Adjusted R
Square
Std. Error of the
Estimate
1 .272a .074 .071 4.41929
a. Predictors: (Constant), CR
b. Dependent Variable: CFI
Coefficientsa
Model
Unstandardized Coefficients
Standardized
Coefficients
t Sig. B Std. Error Beta
1 (Constant) 14.475 .971 14.905 .000
CR .261 .048 .272 5.491 .000
a. Dependent Variable: CFI
Therefore, hypothesis is supported and the regressing is written as follow;

www.theinternationaljournal.org > RJCBS: Volume: 02, Number: 01, November-2012 Page 17
CFI = 14.475 + 0.261X + e ..Formulae 11
H12: Firm-university cooperation is positively influencing the degree of firms’ innovativeness in
construction technologies implementation and adoption.
Based on the 380 firms, the following results were recorded. Table 13 shows the result which indicates
the two variables are positively associated; R2 = 0.116, Adj. R
2 = 0.113 and F = 49.474, p<0.01. This
means 11.6% of the variance increase in the innovativeness of firms was explained by the firm-
university cooperation. Approximately 11.6% of the variance of the construction technologies
innovation implementation and adoption is accounted for by its linear relationship with the firm-
university cooperation in the regression equation for predicting the firms’ innovativeness.
Table 13 Results of regression analysis for firm-university cooperation
Model Summaryb
Model R R Square Adjusted R Square Std. Error of the Estimate
1 .340a .116 .113 4.31670
a. Predictors: (Constant), FUC
b. Dependent Variable: CFI
Coefficientsa
Model
Unstandardized Coefficients
Standardized
Coefficients
t Sig. B Std. Error Beta
1 (Constant) 13.499 .903 14.945 .000
FUC .418 .059 .340 7.034 .000
a. Dependent Variable: CFI
Therefore, hypothesis is supported and the regressing is written as follow;
CFI = 13.499+0.418X + e…. Formula 12 …..Formulae 12
H13: Firm-research center cooperation has provided some exposure to the high capabilities and
expertise in innovation of construction technologies.
Based on the 383 firms, the following results were recorded. Table 14 shows the result which indicates
the two variables are positively associated; R2 = 0.121, Adj. R
2 = 0.118 and F = 52.073, p<0.01. This
means 12.1% of the variance increase in the innovativeness of firms was explained by the firm-
research center cooperation. Approximately 12.1% of the variance of the construction technology
innovation implementation and adoption is accounted for by its linear relationship with the firm-
research center cooperating in the regression equation for predicting the firms’ innovativeness.
Table 14 Results of regression analysis for firm-research center cooperation
Model Summaryb
Model R R Square
Adjusted R
Square Std. Error of the Estimate
1 .348a .121 .118 4.31952
a. Predictors: (Constant), FRCC
b. Dependent Variable: CFI
Coefficientsa
Model
Unstandardized Coefficients
Standardized
Coefficients
t Sig. B Std. Error Beta
1 (Constant) 13.639 .868 15.720 .000
FRCC .412 .057 .348 7.216 .000
a. Dependent Variable: CFI
Therefore, hypothesis is supported and the regressing is written as follow;
CFI = 13.639 + 0.412X + e… Formula 13 …..Formulae 13

www.theinternationaljournal.org > RJCBS: Volume: 02, Number: 01, November-2012 Page 18
H14: Firm-government cooperation will help the firms’ intensity to extensively try new construction
technologies.
Based on the 383 firms, the following results were recorded. Table 15 shows the result which indicates
the two variables are positively associated; R2 = 0.348, Adj. R
2 = 0.346 and F = 201.388, p<0.01. This
means 34.8% of the variance increase in the innovativeness of firms was explained by the firm-
government cooperation. Approximately 34.8% of the variance of the construction technology
implementation and adoption is accounted for by its linear relationship with the firm-government
cooperation in the regression equation for predicting the firms’ innovativeness.
Table 15 Results of regression analysis for firm-government cooperation
Model Summaryb
Model R R Square Adjusted R Square
Std. Error of the
Estimate
1 .590a .348 .346 3.71561
a. Predictors: (Constant), FGC
b. Dependent Variable: CFI
Coefficientsa
Model
Unstandardized Coefficients
Standardized
Coefficients
t Sig. B Std. Error Beta
1 (Constant) 8.260 .826 10.002 .000
FGC .761 .054 .590 14.191 .000
a. Dependent Variable: CFI
Therefore, hypothesis is supported and the regressing is written as follow;
CFI = 8.260 + 0.761X + e…. Formulae 14 …..Formulae 14
As a conclusion to the hypothesis testing, all the hypotheses were found satisfactory, supported and
accepted except Hypothesis 1, where Hypothesis 1 was rejected in Malaysia context. Although all the
recorded R2 and adjusted R
2 are found relatively low to strengthen the purposes of prediction, it is still
valid and useful for an explanation of the relationship between the variables that under investigate.
8.0 Recommendations for further researches
The research analysed and explained the determinants of firms’ innovativeness that influence the
degree in the implementation and adoption of innovation. Nonetheless, there are areas which
necessitate further research. Further developments of this work in possible in seven main areas.
1. The findings of the research are applicable only to heavy construction sector with particular
reference to the contractor G7 that registered with CIDB. Therefore, future research should
consider replicating the research in other registration groups or extending it to include other
types of sectors i.e. residential, commercial, industrial, and etc.
2. One area of future investigation that should be explored is the relationship between use of
different of construction technologies and engineering design. Observers of the construction
industry continuously cite industry structure variables and uncertainties as being the primary
factors inhibiting the implementation and adoption of new building materials.
3. Another natural extension of the research would be investigating the innovation implementation
and adoption processes in selected construction firms, in order to better understand the dynamics
of the innovation implementation and adoption processes to understand the actual predictive
power of the proposed model in this research. In order to supplement the variance approach used
in this research, future research should include a process approach including detailed interview
data and archival sources.

www.theinternationaljournal.org > RJCBS: Volume: 02, Number: 01, November-2012 Page 19
4. Additional area of research that should be seriously explored is the implementation and adoption
of interrelated innovations. It is highly likely that a construction firms’ implementation and
adoption of one product innovation directly affects their implementation and adoption of a
complementary product innovation. Therefore, an approach to investigating innovation
implementation and adoption in construction may yield some important information.
5. Future research should also concentrate on evaluating the relationship between product
implementation, adoption and marketing strategies. No research to date has been conducted in
the construction industry examining the impact of marketing strategy on technological product
implementation and adoption. Consequently, measures of marketing strategy effectiveness and
efficiency with innovation implementation and adoption are lacking in the construction industry.
9.0 Conclusion
Regression analysis is a statistical technique that attempts to explore and model the relationship
between two or more variables. Therefore, hypotheses were tested by the aid of regression analysis to
accomplish the objective of this research. The used of linear regression analysis was also aimed to
validate the hypotheses established through the exhaustive and intensive literature review. Based on
the analysis, all hypotheses except hypothesis 1 are supported. The models were formulated in
Formulae 1 to Formulae 14. As competitive pressures increase, there is a need to continuously adapt,
develop and innovate for organizational excellence. It again emphasizes the need of innovativeness as
structures, processes and a good blend of which will lead to organizational excellence. Innovation has
always been at the centerpiece of competitiveness. Experimentation, exploration and a drive to
maximize resources is as essential for the organization. True innovation often occurs in sudden
dynamic shifts.
References
[1] Abdullah, A.A. Technology adoption and innovation patterns in construction industry in Saudi
Arabia: An exploratory study. Ph.D. Dissertation, Austin: University of Texas, 1991.
[2] Gatignon, Hubert and Thomas R. Robertson. “Technology diffusion: An empirical test of
competitive effects”. Journal of Marketing, vol. 53, ,no. pp. 35-49, 1989.
[3] Ghassan A. “Facilitating innovation in construction”. Construction innovation, vol. 10, no. 4,
2010.
[4] Seng, N.W. Creativity and innovation in Design and Build Consortium – China Habour
Engineering Co. for Penang 2nd
Bridge. Consultation project, University Utara Malaysia, 2011.
[5] Seng, N.W. The model for determinants of firms’ innovativeness in Malaysian construction
industry. Proceeding in 3rd
ICTOM. Bandung, Indonesia, 4-6 July, 2012.

www.theinternationaljournal.org > RJCBS: Volume: 02, Number: 01, November-2012 Page 20
Environmentally Conscious Consumer Behavior: An Empirical Study
Namita Rajput, Associate Prof., Sri Aurobindo College, Delhi University, India
Preeti Bajaj , Assistant Prof, Amity University, Noida
Geetanjali Batra, Assistant Prof.,ARSD College, Delhi University
Abstract
Environmental problems are mainly attributable to the impact of humans on natural systems. Rapid
urbanization and rising consumer oriented lifestyle has intensified the environmental problems
management. There is an urgent need to increase public environmental awareness to counter and
conquer the problem. Studies of green behavior have awakened a growing interest, since the
accelerated environmental degradation is partly attributed to a lack of such behavior which is very
difficult to change. The objective of this study is to study those variables which influence “green-
buying”, investigate whether environmental attitudes are translated into actual consumer behavior in
relevant situations and to determine variables that predict environmentally conscious consumerism.
This paper summarizes variables extracted from four models of green behavior: Environmental beliefs,
Ecological knowledge, Environmental concern and Environmental Attitudes, with a special focus on
the sample taken from Delhi and NCR individuals as an example of application of environmental
marketing strategies. Analysis shows that there is a strong relationship between the five variables
discussed above and environmentally favorable behavioral intentions. Factor analysis was conducted
using CFA (Confirmatory Factor analysis) to find out relationship of variables within the construct.
Five hypothesis asserting relationships between major variables were established. Factors influencing
green purchase intention were correlated to form a linear relationship. These hypotheses were tested
using Chi Square. To analyse the data from a different perspective, a one-way multivariate analysis of
variance (MANOVA) was performed to investigate gender differences in green purchase behaviour.
Three dependent variables were used: environmental knowledge, environmental concern and
environmental attitudes towards green purchase. The fixed variable was gender. There was a
statistically significant difference between men and women on the combined dependent variables. Men
have greater environmental knowledge, concern and attitude towards Green Purchase as compared to
women. It is recommended to relate environmental issues to survival process, in order to apply
efficient environmental marketing strategies. The results of the study indicate that environmental
knowledge, habits and concern are strongly related to environmental beliefs and influence
Environmental attitude. However this is not reflected in intention to purchase or actual purchase
behaviour.
Key words: Green buying, environmental attitude, Factor analysis, linear relationship.
Introduction
The issue of environment has grown important over the past few decades, however the critical part of
this issue remains that the rate at which the problems related to environment are increasing is quite
higher than the rate at which the actions are taken to solve these problems. Whether it is government,
population or other organizations all are responding to the furies caused by the nature or human actions
rather than behaving proactively & taking a check at their current actions. The most important part in
this environmentally friendly behavior is to be played by the consumer. Follows & Jobber (1999) in
their study to develop a model to predict environmentally purchase behavior found that there will be a
positive relationship from attitude towards environmental consequences & a negative relationship from
attitude towards individual consequences to environmentally responsible purchase intention. Their
study also indicated that motivation to promote & enhance the welfare of others underlies positive
environmental attitudes. This behavioral intention is further formed by the combination of a positive or
negative attitude towards the behavior, a subjective norm to perform the behavior, and perceived
www.theinternationaljournal.org > RJCBS: Volume: 02, Number: 01, November-2012 Page 21
control over the behavior. Moreover, the attitude is determined by strengths of beliefs about
consequences of the behavior & evaluations of these consequences (Minton & Rose, 1997). By
imposing informal social sanctions the personal norm is tied to the self concept & is experienced as a
feeling of moral obligation (Schwartz, 1977). It refers to what “I feel morally obligated to do” &
motivates behavior by the desire to act in ways that are consistent with one’s values (Minton & Rose,
1997). Behavioral intention is an indication of an individual's readiness to perform a given behavior. It
is assumed to be an immediate antecedent of behavior (Ajzen, 1991). The strength of behavioral
intention further determines the likelihood of the behavior. Increasing economic activities in
developing countries result in more energy and consumption demand, which generally lead to
environmental degradation. There is a conventional belief that such environmental degradation would
resolve as soon as these countries grow economically since that would enable them to afford
environmental friendly technology as well as pro-environmental regulations and policies. However,
several studies indicated that many developing countries already equipped with environmental
policies, legal frameworks and economic instruments, which are regarded as highly sophisticated by
international standards (Hueber et al, 1998, Fujisaki et al, 1997) and yet face the worsening of
environmental conditions. Major difficulties these countries confront are not only the lack of legal and
economic framework for environmental protection, but also lack of participation among general public
in pro-environmental behavior. From the last three decades there has been gradual increase in public
concern for environmental issues.
The purpose of the study presented in this paper is to develop and test a model that explains the
potential influences of consumer‘s green buying behavior and general pro environmental concerns.
Moreover, there are increasing needs for such public participation due to the recent change in sources
of environmental problems. Today, the sources of pollution have shifted from production to
consumption processes. The Human Development Report of 1998 (UNDP) affirms this trend and states
that growth in consumption and unbalanced consumption patterns are placing unprecedented pressure
on the environment. In this light, the acceptance of pro-environmental behavior by general public, that
is, to adopt sustainable life style, is an urgent issue in protecting environment. Customer-centric
approaches put the customers into the central point of the marketing management processes of
companies. Therefore, the influence of environmental issues on marketing is an area of increasing
significance to industry and commerce.
A socially conscious consumer takes into account the public consequences of his or her private
consumption or who attempts to use his or her purchasing power to bring about social change. That is,
consumers incorporate social issues into their purchase decisions by evaluating the
consequences of their consumption upon society. Consumers who consider the environment to be
important will therefore evaluate the environmental consequences associated with the purchase of a
product. If the environmental consequences are important enough to the consumer, the result may be
the purchase of an environmentally responsible product. These products not only satisfy a consumer's
immediate needs and wants, but also serve to benefit the environment in the long term. The difficulty
with investigating environmentally responsible purchase behavior has been with its measurement.
First, many of the measures are normative in nature and can lead to socially desirable responses
(Roosen and De Pelsmacker, 1997). A scale composed of several statements all worded to represent
positive environmentally responsible actions can produce a halo- effect that encourages respondents to
over-report environmentally responsible behaviors. The result is an inflated level of environmentally
responsible behavior that does not correspond to actual market share data. Second, it is important for
researchers to clearly delineate between environmentally responsible intention and behavior.
Environmentally responsible products in general tend to be viewed as the socially acceptable choice
which can inflate intention relative to actual behavior. Finally, researchers often combine a wide range
of environmental purchase behaviors into a single measure. The scientists and ecologists worldwide
have come up with various ways to reduce the damage caused to the earth by using gases which emit
no pollution and are eco friendly, technological innovations, such as development of alternative fuels,

www.theinternationaljournal.org > RJCBS: Volume: 02, Number: 01, November-2012 Page 22
to resolve such dilemmas, rather than changing their behavior patterns and lifestyle choices. Though
such remedies and innovations have made remarkable gains in conserving resources and reducing
pollution, many scientists and environmentalists hold that solutions to environmental problems do not
lie in technology alone (Hardin, 1993; Stern, Young, & Druckman, 1992). Consumers must adopt
environmentally sound behaviors, such as reliance on public transportation and recycling of household
wastes and buy products that are environmental friendly in order to sustain the environment. This
paper aims to study variables that predict "green buying" (i.e., buying products that are
environmentally beneficial)-consumers' knowledge and beliefs about environmental products, green
buying habits, general environmental attitudes, and factors that influence environmentally conscious
purchases to find whether people with a pro-environment attitude act in ways consistent with that
attitude. The purpose of this research was to study the effect of environmental beliefs, knowledge,
concern and attitudes on environmental friendly behavioral intentions.
Marketers have reacted to consumers’ growing environmental consciousness by developing
“environmentally friendly” products. However, only a few “green” products have been successful
(Reitman 1991) despite the vast majority of consumers reporting that their purchases were influenced
by environmental concerns (Chase and Smith 1992). Little empirical evidence exists to support that
pro-environmental attitudes and beliefs translate into environmentally conscious behavior such as
green buying and recycling (Hume 1991). It is notable that pro-environmental behaviors differ from
general purchase-related consumer behaviors. Engaging in a general purchase behavior is driven by an
assessment of its benefits and costs that are relevant solely to the individual consumer performing the
behavior. Prior research has identified several key factors motivating environmentally conscious
behavior, including individuals’ concerns about the environment, their beliefs about their ability to
ease the problem (Ellen, Cobb- Walgren 1991), and an overall orientation towards the welfare of
others (Schwartz 1977; Stern, Dietz, and Kalof 1993) or towards their relationship with others
(McCarty and Shrum 2001).
In this backdrop the purpose of this paper is:
To study variables those influence “green- buying”.
To investigate whether environmental attitudes are translated into actual consumer behavior in
relevant situations.
To determine variables those predict environmentally conscious consumerism.
To achieve the objectives the study is divided into following sections: Section I gives the overview
and insights of green buying stating also giving the brief review of existing Literature, Section II gives
description of Data & methodology, Section III gives the analysis and interpretations of the results.
Section IV gives summary and conclusions and references are contained in the last section.
Section II: Data and Methodology
The Data and Data Collection
The study was carried out in the Delhi and NCR Region. The subjects of the study were aged over 18
and were residents of the community in the relevant district. A total of 500 respondents were
approached. However, only 244 questionnaires were received back which contained the complete
necessary information and were thus usable. Respondents were either interviewed or filled in the same
questionnaires online. The questionnaires covered respondents’ socio-demographic and economic
back- ground, their attitudes about, and knowledge of the environment, and self-reported
environmentally responsible consumption practices, confusion about environmental claims, and
intention to purchase green products.
Demographic characteristics of the sample:
In our sample of 244, 63.9% respondents were in the age group of (20 – 30), 26.2% between (30 – 40)
and 9.8% between (40 – 50). 41% respondents were post graduates, 57.4% were graduates and 1.6%
was high school pass outs. 49.2% had annual family income less than 5 lakhs, 41% had annual family

www.theinternationaljournal.org > RJCBS: Volume: 02, Number: 01, November-2012 Page 23
income between 5 to 11 lakhs, 3.3% had annual income between 11 to 17 lakhs and 6.6% had annual
income between 17 to 22 lakhs. 36.1% respondents are male and 63.9% respondents are females.
49.6% respondents are married and 50.4% are single.
Figure 1: Demographic Characteristics of the population
Survey Instrument
Dependent measure: Actual green buying behaviour of the consumer which measures the extent to
which individual respondents purchase goods and services believed to have a more positive (or less
negative) impact on the environment.
Independent measures: Five key psychographic correlations as shown to be significant in the past are
included in the present study. These include environmental beliefs, environmental knowledge,
environmental habit, environmental concern and pro-environmental attitudes were the main
independent variables.
The purpose of this study is to systematically assess the effects of environmental belief, Ecological
Knowledge, Environmental Concern, Environment attitude, Intention to purchase on green purchase
behaviour and to elucidate the interrelationships among the constructs. In light of the aforementioned
discussion, a model is constructed and Figure 2 presents the proposed model with the hypothesized
structural linkages among the variables.
Figure 2: Model Estimation
+
+
+
+
+ +
+
F
ENVIRONMENTAL
BELIEFS
ENVIRONMENTAL
KNOWLEDGE ENVIRONMENTAL
ATTITUDE
GREEN PURCHASE
INTENTION
ACTUAL GREEN
PURCHASE
BEHAVIOR
ENVIRONMENTAL
CONCERN
ENVIRONMENTAL
HABIT

www.theinternationaljournal.org > RJCBS: Volume: 02, Number: 01, November-2012 Page 24
Testable Hypothesis
Five hypothesis asserting relationships between major variables were established.
1) H0: People with strong Environmental belief have less knowledge about ecological
issues.
H1: people with strong environmental belief have more knowledge about ecological issues.
2) H0: Consumers with strong Environmental belief have less concerned response towards
ecological issues.
H1: Consumers with strong environmental belief have more concerned response towards
ecological issues.
3) H0: Consumers concerned about the environment do not tend to have pro environmental attitude.
H1: Consumers concerned about the environment tend to have pro environmental attitude.
4) H0: Consumers who tend to have pro environmental attitudes do not show intention to purchase.
H1: Consumers who tend to have pro environmental attitudes show intention to purchase.
5) H0: Consumers with strong intention to purchase are not likely to actually purchase green
products.
H1: Consumers with strong intention to purchase are not likely to actually purchase green
products.
Section III: Analysis and Interpretations of Results
3.1 The Reliability Test of Scales
Cronbach’s alpha coefficient was used to determine the internal consistency reliability of each scale
used in this study. Cronbach's alpha is a measure of internal consistency, that is, how closely related a
set of items are as a group. A "high" value of alpha signifies that the items measure an underlying (or
latent) construct. The results of Cronbach Alpha are shown in table 1
Table 1: Summary of the Alpha Value for Each Scale.
SCALES NO. OF ITEMS α VALUES
Environmental Habits 14 .768
Environmental Belief 6 .801
Environmental Concern 11 .712
Environmental Knowledge 20 .778
Environmental Attitude 12 .689
Green Purchase Intention 11 .803
The results of Cornbach alpha test show that all the variables are significant as the value of each
variable is close to one. The intention to purchase green products has maximum influence on green
buying decisions followed by environmental beliefs, environmental knowledge, environmental habits,
and environmental concern.
3.2: Environmental Beliefs
Consumer environmental beliefs were judged on basis of 6 items. All items were ranked on 5 point
Likert scale. The items included were aimed to understand level of responsibility of the respondents
towards protecting the environment. The items were designed in such a manner so as to enable us in
drawing inferences about environmental beliefs of the respondents. Items Included questions like if we
have responsibility to avoid products that are damaging to the environment, we have responsibility use
products made from recyclable material, is it beneficial to use products that are produced locally, is it
beneficial to buy products from local store, is it beneficial to look for products using less packaging, is

www.theinternationaljournal.org > RJCBS: Volume: 02, Number: 01, November-2012 Page 25
it beneficial to carry own bag rather than a plastic carrier provided by shop owner. Factor analysis was
done using confirmatory Factor analysis technique on AMOS output results of which are shown below
in Figure 3 and Table 2(A) and 2(B).
Figure 3: Factor analysis using the confirmatory Factor analysis technique. (Environmental
Belief)
Table 2(A): Results of Confirmatory Factor Analysis (Environmental Beliefs)
Name of
the
variable
Enviro
nm
ental B
elief
S.E.
Estimate
Regression
Estimate
Squared
multiple
correlation P
EB5 <--- 1 0.074 0.006
EB1 <--- 6.622 0.648 0.42 0.28
EB2 <--- 9.92 0.923 0.852 0.282
EB3 <--- 2.546 0.243 0.059 0.299
EB4 <--- 1.442 0.09 0.008 0.403
EB6 <--- 5.84 0.476 0.227 0.283
Table 2(B): Results of Confirmatory Factor Analysis (Environmental Beliefs)
Model Fit Statistic
Chi-square 276.88
Comparative Fit Index (CFI) 0.607
Normed Fit Index (NFI) 0.796
RFI 0.745
Root Mean Square Error of
Approximation (RMSEA)
0.025
Interpretation
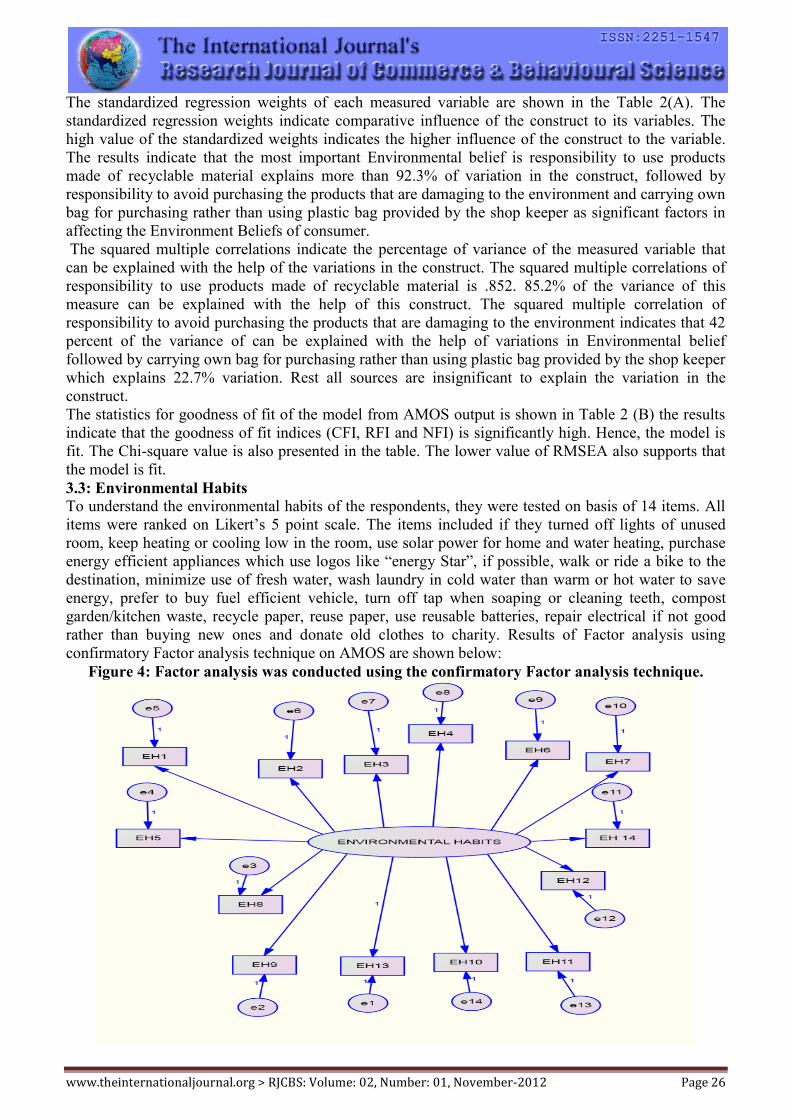
www.theinternationaljournal.org > RJCBS: Volume: 02, Number: 01, November-2012 Page 26
The standardized regression weights of each measured variable are shown in the Table 2(A). The
standardized regression weights indicate comparative influence of the construct to its variables. The
high value of the standardized weights indicates the higher influence of the construct to the variable.
The results indicate that the most important Environmental belief is responsibility to use products
made of recyclable material explains more than 92.3% of variation in the construct, followed by
responsibility to avoid purchasing the products that are damaging to the environment and carrying own
bag for purchasing rather than using plastic bag provided by the shop keeper as significant factors in
affecting the Environment Beliefs of consumer.
The squared multiple correlations indicate the percentage of variance of the measured variable that
can be explained with the help of the variations in the construct. The squared multiple correlations of
responsibility to use products made of recyclable material is .852. 85.2% of the variance of this
measure can be explained with the help of this construct. The squared multiple correlation of
responsibility to avoid purchasing the products that are damaging to the environment indicates that 42
percent of the variance of can be explained with the help of variations in Environmental belief
followed by carrying own bag for purchasing rather than using plastic bag provided by the shop keeper
which explains 22.7% variation. Rest all sources are insignificant to explain the variation in the
construct.
The statistics for goodness of fit of the model from AMOS output is shown in Table 2 (B) the results
indicate that the goodness of fit indices (CFI, RFI and NFI) is significantly high. Hence, the model is
fit. The Chi-square value is also presented in the table. The lower value of RMSEA also supports that
the model is fit.
3.3: Environmental Habits
To understand the environmental habits of the respondents, they were tested on basis of 14 items. All
items were ranked on Likert’s 5 point scale. The items included if they turned off lights of unused
room, keep heating or cooling low in the room, use solar power for home and water heating, purchase
energy efficient appliances which use logos like “energy Star”, if possible, walk or ride a bike to the
destination, minimize use of fresh water, wash laundry in cold water than warm or hot water to save
energy, prefer to buy fuel efficient vehicle, turn off tap when soaping or cleaning teeth, compost
garden/kitchen waste, recycle paper, reuse paper, use reusable batteries, repair electrical if not good
rather than buying new ones and donate old clothes to charity. Results of Factor analysis using
confirmatory Factor analysis technique on AMOS are shown below:
Figure 4: Factor analysis was conducted using the confirmatory Factor analysis technique.

www.theinternationaljournal.org > RJCBS: Volume: 02, Number: 01, November-2012 Page 27
Table 3(A): Results of Confirmatory Factor Analysis (Environmental Habits)
Name of
the
Variable
S.E
Estimate
Regression
Estimates
Squared
Multiple
Correlation P
EH13
EN
VIR
ON
ME
NT
AL
HA
BIT
S
1 0.425 0.181
EH9 <--- 3.183 0.765 0.586 ***
EH8 <--- 0.527 0.242 0.059 0.002
EH5 <--- 0.841 0.295 0.087 ***
EH1 <--- 0.247 0.271 0.073 ***
EH2 <--- 0.226 0.123 0.015 0.098
EH3 <--- 2.145 0.506 0.256 ***
EH4 <--- 1.128 0.521 0.272 ***
EH6 <--- 0.495 0.169 0.029 0.026
EH7 <--- 0.921 0.3 0.09 ***
EH14 <--- 0.277 0.075 0.006 0.301
EH12 <--- 1.026 0.309 0.096 ***
EH11 <--- 1.596 0.561 0.315 ***
EH10 <--- 2.226 0.598 0.357 ***
Table 3(B): Results of Confirmatory Factor Analysis (Environmental Habits)
Model Fit Statistic
Chi-square 278.88
Comparative Fit Index (CFI) 0.607
Normed Fit Index (NFI) 0.796
RFI 0.745
Root Mean Square Error of
Approximation (RMSEA)
0.045
Interpretation
The standardized regression weights of each measured variable are shown in the Table 3(A). The
results in Table 3(A) indicate that the most important Environmental Habit is turning off tap while
soaping or cleaning teeth which explains more than 70% of variation in the construct, followed by
purchasing appliances with logos like Energy Stars, using solar power, recycling or reuse of paper.
The squared multiple correlations of turning off tap as an environmental habit is .315. This indicates
that 31.5 percent of the variance of this measure can be explained with the help of construct. The
squared multiple correlations of energy efficient electronic appliances indicate that 21.5 percent of the
variance can be explained with the help of variations in environmental habit.
The statistics for goodness of fit of the model from AMOS output is shown in Table 3(B) the results
indicate that the goodness of fit indices (CFI, RFI and NFI) is significantly high. Hence, the model is
fit. The Chi-square value is also presented in the table. The lower value of RMSEA also supports that
the model is fit.
3.4: Environmental Concerns
To understand the level of participation of the respondents in pro environmental activities
environmental concern was tested on basis of 11 items. The responses were measured on a 5 Point
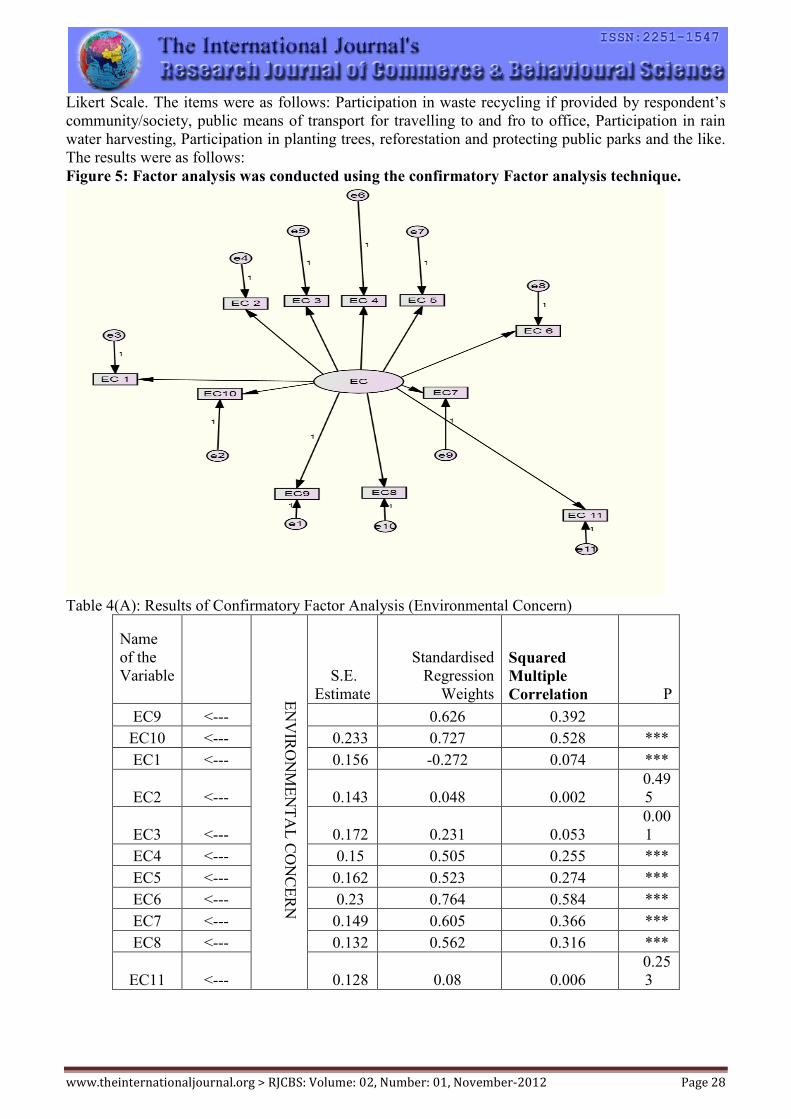
www.theinternationaljournal.org > RJCBS: Volume: 02, Number: 01, November-2012 Page 28
Likert Scale. The items were as follows: Participation in waste recycling if provided by respondent’s
community/society, public means of transport for travelling to and fro to office, Participation in rain
water harvesting, Participation in planting trees, reforestation and protecting public parks and the like.
The results were as follows:
Figure 5: Factor analysis was conducted using the confirmatory Factor analysis technique.
Table 4(A): Results of Confirmatory Factor Analysis (Environmental Concern)
Name
of the
Variable
EN
VIR
ON
ME
NT
AL
CO
NC
ER
N
S.E.
Estimate
Standardised
Regression
Weights
Squared
Multiple
Correlation P
EC9 <---
0.626 0.392
EC10 <--- 0.233 0.727 0.528 ***
EC1 <--- 0.156 -0.272 0.074 ***
EC2 <--- 0.143 0.048 0.002
0.49
5
EC3 <--- 0.172 0.231 0.053
0.00
1
EC4 <--- 0.15 0.505 0.255 ***
EC5 <--- 0.162 0.523 0.274 ***
EC6 <--- 0.23 0.764 0.584 ***
EC7 <--- 0.149 0.605 0.366 ***
EC8 <--- 0.132 0.562 0.316 ***
EC11 <--- 0.128 0.08 0.006
0.25
3
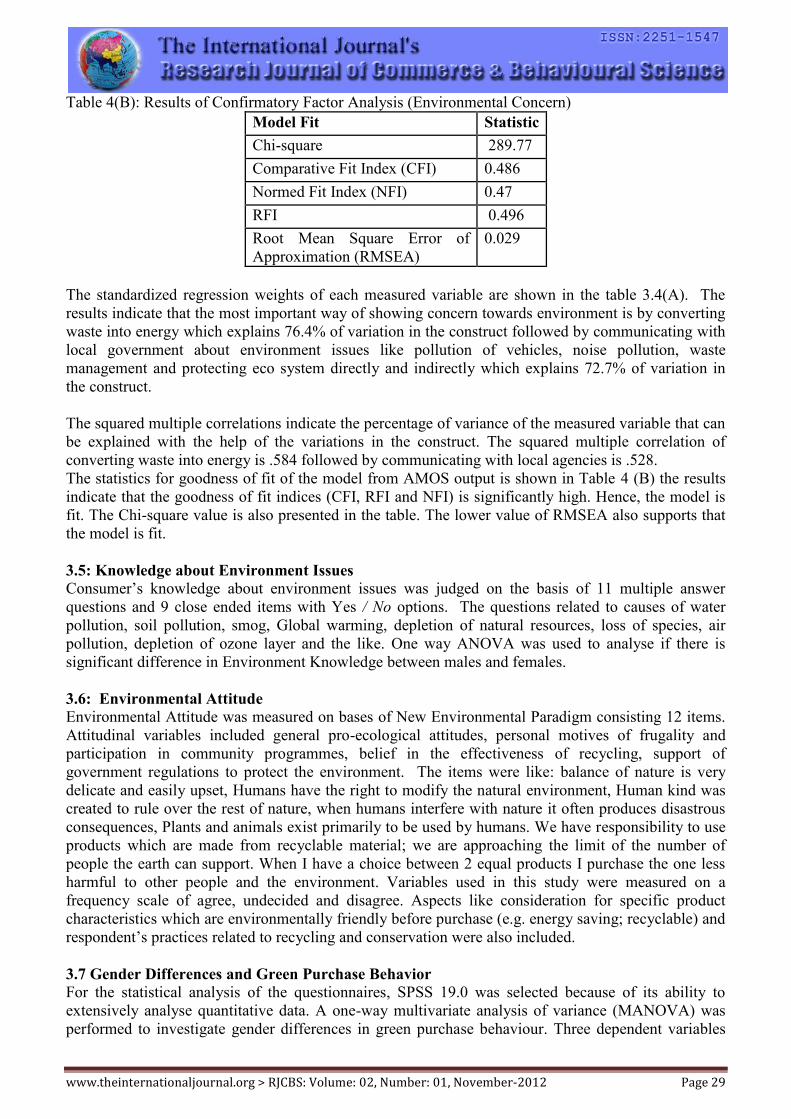
www.theinternationaljournal.org > RJCBS: Volume: 02, Number: 01, November-2012 Page 29
Table 4(B): Results of Confirmatory Factor Analysis (Environmental Concern)
Model Fit Statistic
Chi-square 289.77
Comparative Fit Index (CFI) 0.486
Normed Fit Index (NFI) 0.47
RFI 0.496
Root Mean Square Error of
Approximation (RMSEA)
0.029
The standardized regression weights of each measured variable are shown in the table 3.4(A). The
results indicate that the most important way of showing concern towards environment is by converting
waste into energy which explains 76.4% of variation in the construct followed by communicating with
local government about environment issues like pollution of vehicles, noise pollution, waste
management and protecting eco system directly and indirectly which explains 72.7% of variation in
the construct.
The squared multiple correlations indicate the percentage of variance of the measured variable that can
be explained with the help of the variations in the construct. The squared multiple correlation of
converting waste into energy is .584 followed by communicating with local agencies is .528.
The statistics for goodness of fit of the model from AMOS output is shown in Table 4 (B) the results
indicate that the goodness of fit indices (CFI, RFI and NFI) is significantly high. Hence, the model is
fit. The Chi-square value is also presented in the table. The lower value of RMSEA also supports that
the model is fit.
3.5: Knowledge about Environment Issues
Consumer’s knowledge about environment issues was judged on the basis of 11 multiple answer
questions and 9 close ended items with Yes / No options. The questions related to causes of water
pollution, soil pollution, smog, Global warming, depletion of natural resources, loss of species, air
pollution, depletion of ozone layer and the like. One way ANOVA was used to analyse if there is
significant difference in Environment Knowledge between males and females.
3.6: Environmental Attitude
Environmental Attitude was measured on bases of New Environmental Paradigm consisting 12 items.
Attitudinal variables included general pro-ecological attitudes, personal motives of frugality and
participation in community programmes, belief in the effectiveness of recycling, support of
government regulations to protect the environment. The items were like: balance of nature is very
delicate and easily upset, Humans have the right to modify the natural environment, Human kind was
created to rule over the rest of nature, when humans interfere with nature it often produces disastrous
consequences, Plants and animals exist primarily to be used by humans. We have responsibility to use
products which are made from recyclable material; we are approaching the limit of the number of
people the earth can support. When I have a choice between 2 equal products I purchase the one less
harmful to other people and the environment. Variables used in this study were measured on a
frequency scale of agree, undecided and disagree. Aspects like consideration for specific product
characteristics which are environmentally friendly before purchase (e.g. energy saving; recyclable) and
respondent’s practices related to recycling and conservation were also included.
3.7 Gender Differences and Green Purchase Behavior
For the statistical analysis of the questionnaires, SPSS 19.0 was selected because of its ability to
extensively analyse quantitative data. A one-way multivariate analysis of variance (MANOVA) was
performed to investigate gender differences in green purchase behaviour. Three dependent variables

www.theinternationaljournal.org > RJCBS: Volume: 02, Number: 01, November-2012 Page 30
were used: environmental knowledge, environmental concern and environmental attitudes towards
green purchase. The fixed variable was gender. There was a statistically significant difference between
men and women on the combined dependent variables: [F (18, 225) = 5.398, P< 0.05; Wilks’ Lambda
= 0.698]. Men reported higher levels of Environment Knowledge, environment concern and attitude to
Green Purchase. The results of MANOVA are shown in Table 5 below:
Table 5: The Multivariate Tests Conducted On The Combined Dependent Variables.
Table 6 Tests of Between-Subjects Effects
Source
Dependent
Variable
Type III Sum
of Squares Df Mean Square F Sig.
Model EC* 3145.277a 2 1572.639 1693.548 0
EA** 3811.012b 2 1905.506 2.71E+04 0
EK*** 198.368c 2 99.184 1109.601 0
GENDER EC 3145.277 2 1572.639 1693.548 0
EA 3811.012 2 1905.506 2.71E+04 0
EK 198.368 2 99.184 1109.601 0
Error EC 224.723 242 0.929
EA 16.988 242 0.07
EK 21.632 242 0.089
Total EC 3370 244
EA 3828 244
EK 220 244
a. R Squared = .933 (Adjusted R Squared = .933)
b. R Squared = .996 (Adjusted R Squared = .996)
c. R Squared = .902 (Adjusted R Squared = .901)
*EC=Environmental Concern
**EA=Environmental attitude
***EK = Environmental Knowledge
Table 7: Mean Scores
Descriptive Statistics
GENDER Mean Std. Deviation N
EC Male 3.64 0.776 88
Female 1.56 1.055 156
Total 2.59 0.962 244
EA Male 4.82 0.388 88
Female 3.03 0.159 156
Total 3.95 0.283 244
EK Male 0.91 0.289 88
Female 0.6 0.304 156
Total 0.85 0.298 244
An inspection of the estimated marginal means shown in Table 7 indicated that men reported higher
levels of environmental knowledge, concern and attitudes towards green purchase than women. Bray
and Maxwell (1982) suggest that if a significant MANOVA effect is detected, the follow-up test is to
Multivariate Tests
Effect Value F Hypothesis df Error df Sig.
GENDER Pillai's Trace .302 5.398a 18.000 225.000 .000
Wilks' Lambda .698 5.398a 18.000 225.000 .000
Hotelling's Trace .432 5.398a 18.000 225.000 .000
Roy's Largest Root .432 5.398a 18.000 225.000 .000

www.theinternationaljournal.org > RJCBS: Volume: 02, Number: 01, November-2012 Page 31
perform Univariate ANOVA for each dependent variable. To test whether the difference between the
mean score of environmental knowledge in men (.91) and women (.60) is statistically significant, one-
way ANOVA was used. The results (D.F. 1, P < 0.05) suggest that there is a significant difference
between men and women in overall environmental knowledge. This result implies that men are
generally more knowledgeable in environmental issues than women. This result provides strong
support for the first hypothesis. The result also corroborates the results of previous research conducted
in the West. For example, Arcury and Johnson (1987) found that the degree of environmental
knowledge was dependent on gender: men gave correct answers to the knowledge questions more
often than women. Table 3.7 shows also that men reported higher levels of environmental concern. To
test whether the difference between the mean score of concern in men (3.64) and women (1.56) is
statistically significant, one-way ANOVA was used. The results (D.F. 1, 225 = 276.229, P < 0.05)
suggest that there is a significant difference between men and women in overall environmental
concern.
This result implies that men are generally more concerned about environmental issues than women.
This result fails to support the second hypothesis. This result also contradicts previous research
conducted in the West (e.g. Davidson and Freudenburg, 1996). However, it should be noted that
whether women are, in reality, more concerned about the environment than men has not been
determined conclusively by empirical studies (Momsen, 2000). It appears that more analyses and
explanations are needed in this area. Finally, Table 7 indicates that men reported more positive
attitudes towards green purchase. To test whether the difference between the mean score of green
purchase attitudes in men (4.82) and women (3.03) is statistically significant, one-way ANOVA was
used. The results (D.F. 1, 225 = 359.388, P < 0.05) suggest that there is a significant difference
between men and women in overall green purchase attitudes. This result implies that men have
generally more positive attitudes towards green purchase than women. This result fails to support the
third hypothesis. It is also at odds with previous research conducted in the West (e.g. Tikka et al.,
2000). However, in a Canadian study Eagles and Muffitt (1990) found no environmental attitude
differences between the genders.
3.8: Intention to Buy Green Products
Consumer’s intention to buy green products was judged on the basis of 11 questions like if they would
like to buy less polluting products or switch to different brands because of ecological reasons or switch
to a green version of the product. Their opinion was taken on a 5 point likert scale.
Figure 6: Factor analysis was conducted using the confirmatory Factor analysis technique.
(Intention to Purchase)

www.theinternationaljournal.org > RJCBS: Volume: 02, Number: 01, November-2012 Page 32
Table 8 (A): Results of Confirmatory Factor Analysis (Intention to Purchase)
Name
of the
Variable Estimate
Regression
Estimate
Squared
Multiple
Correlations P
ITP9 <---
INT
EN
TIO
N T
O P
UR
CH
AS
E
1
ITP8 <--- 0.569 0.265 0.145 0.032
ITP7 <--- 2.379 0.582 0.709 ***
ITP1 <--- 1.158 0.338 0.343 ***
ITP2 <--- 2.26 0.592 0.688 ***
ITP3 <--- 1.644 0.402 0.408 ***
ITP4 <--- 0.314 0.303 0.036 0.3
ITP5 <--- 1.93 0.496 0.395 ***
ITP6 <--- 1.958 0.498 0.334 ***
ITP11 <--- 1.581 0.433 0.353 ***
ITP10 <--- 1.538 0.405 0.38 ***
Table 8 (B): Results of Confirmatory Factor Analysis (Intention to Purchase)
Model Fit Statistic
Chi-square 256.78
Comparative Fit Index (CFI) 0.607
Normed Fit Index (NFI) 0.796
RFI 0.745
Root Mean Square Error of
Approximation (RMSEA)
0.225
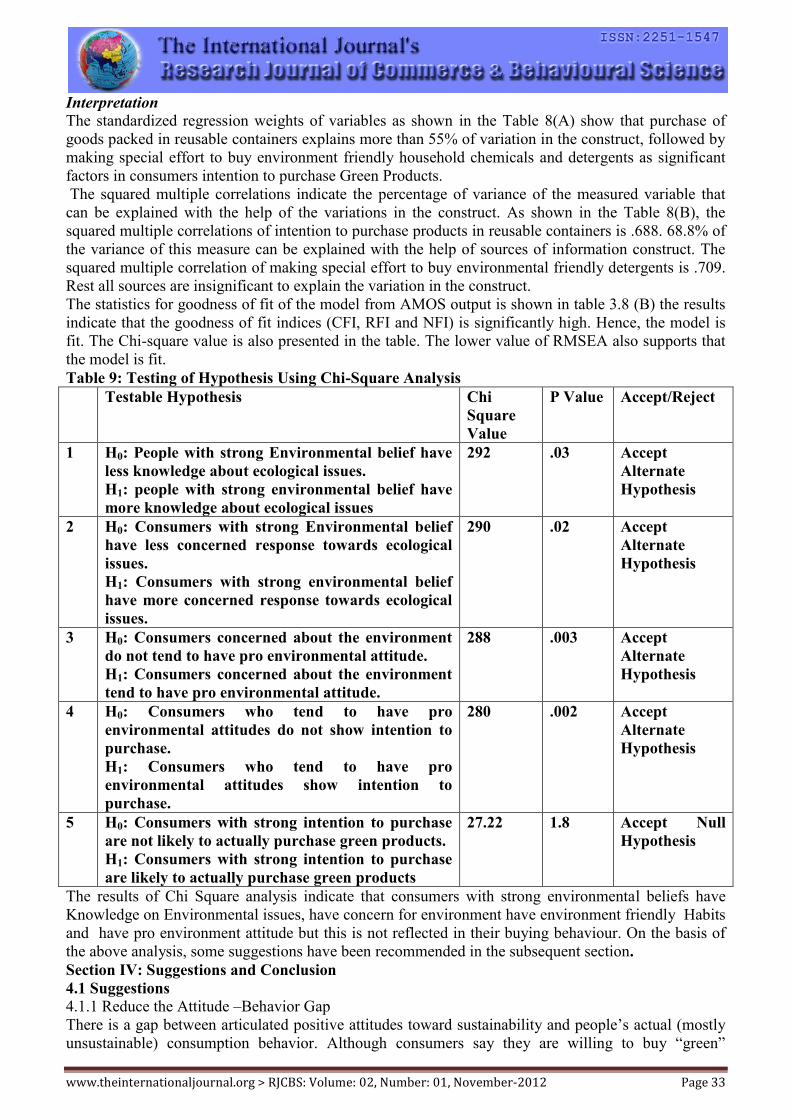
www.theinternationaljournal.org > RJCBS: Volume: 02, Number: 01, November-2012 Page 33
Interpretation
The standardized regression weights of variables as shown in the Table 8(A) show that purchase of
goods packed in reusable containers explains more than 55% of variation in the construct, followed by
making special effort to buy environment friendly household chemicals and detergents as significant
factors in consumers intention to purchase Green Products.
The squared multiple correlations indicate the percentage of variance of the measured variable that
can be explained with the help of the variations in the construct. As shown in the Table 8(B), the
squared multiple correlations of intention to purchase products in reusable containers is .688. 68.8% of
the variance of this measure can be explained with the help of sources of information construct. The
squared multiple correlation of making special effort to buy environmental friendly detergents is .709.
Rest all sources are insignificant to explain the variation in the construct.
The statistics for goodness of fit of the model from AMOS output is shown in table 3.8 (B) the results
indicate that the goodness of fit indices (CFI, RFI and NFI) is significantly high. Hence, the model is
fit. The Chi-square value is also presented in the table. The lower value of RMSEA also supports that
the model is fit.
Table 9: Testing of Hypothesis Using Chi-Square Analysis
Testable Hypothesis Chi
Square
Value
P Value Accept/Reject
1 H0: People with strong Environmental belief have
less knowledge about ecological issues.
H1: people with strong environmental belief have
more knowledge about ecological issues
292 .03 Accept
Alternate
Hypothesis
2 H0: Consumers with strong Environmental belief
have less concerned response towards ecological
issues.
H1: Consumers with strong environmental belief
have more concerned response towards ecological
issues.
290 .02 Accept
Alternate
Hypothesis
3 H0: Consumers concerned about the environment
do not tend to have pro environmental attitude.
H1: Consumers concerned about the environment
tend to have pro environmental attitude.
288 .003 Accept
Alternate
Hypothesis
4 H0: Consumers who tend to have pro
environmental attitudes do not show intention to
purchase.
H1: Consumers who tend to have pro
environmental attitudes show intention to
purchase.
280 .002 Accept
Alternate
Hypothesis
5 H0: Consumers with strong intention to purchase
are not likely to actually purchase green products.
H1: Consumers with strong intention to purchase
are likely to actually purchase green products
27.22 1.8 Accept Null
Hypothesis
The results of Chi Square analysis indicate that consumers with strong environmental beliefs have
Knowledge on Environmental issues, have concern for environment have environment friendly Habits
and have pro environment attitude but this is not reflected in their buying behaviour. On the basis of
the above analysis, some suggestions have been recommended in the subsequent section.
Section IV: Suggestions and Conclusion
4.1 Suggestions
4.1.1 Reduce the Attitude –Behavior Gap
There is a gap between articulated positive attitudes toward sustainability and people’s actual (mostly
unsustainable) consumption behavior. Although consumers say they are willing to buy “green”
www.theinternationaljournal.org > RJCBS: Volume: 02, Number: 01, November-2012 Page 34
products, only a few do so (Ehrich and Irwin, 2005). If left unaddressed, this gap will continue to
frustrate producers of sustainable product alternatives who rely on traditional, attitudinal market
research methods, only to find that actual demand often falls far short of their initial projections. This
limits the availability of sustainable product alternatives and thus limits movement toward more
sustainable consumption.
4.1.2 A Focus on Reducing Consumption
While prior research has attempted to identify and characterize the “green consumer,” less attention
has been paid to understanding the behaviors of people who focus on reducing their overall
consumption. While some choose reduced consumption because of a desire to “buy time” and to
improve their quality of life, others do so because of values such as concerns about the environmental
and social consequences of consumption (Shaw and Newholm 2002). At the extreme, some consumers
actively reject consumption, a phenomenon referred to as “anti -consumption” (Zavestoski 2002).
4.1.3 Consideration of the Full Consumption Cycle
More research is needed to better understand consumer’s full consumption cycle—not just initial
choice. Consumers’ post choice behaviors, including product usage, product life extension, and
disposal, all have a significant impact on the sustainability of consumption (Pieters 1991). For
example, how and how often consumers use products can determine the consumption of related goods
(e.g., fuel, accessories). How consumers maintain products has an impact on product life and,
therefore, product replacement. Decisions about when and how to dispose of a product, when disposal
can lead to alternate usage or another person’s use, also directly influence the sustainability of
consumption (Mannetti, Pierro, and Livi 2004; Ölander and Thøgersen 2006).
4.1.4 Expanding the Scope of Consumption Research
Researchers must also strive to expand the scope of their research. The majority of consumer behavior
researchers have focused on the consumption of packaged goods and other relatively low-involvement
products. A concerted push is needed for additional research on the consumption of major purchases,
such as automobiles, appliances, and housing—all of which have significant implications for
sustainability (Marell, Gärling, and Laitila 2009). For example, the purchase of a home has significant
implications both directly (e.g., energy use) and indirectly (e.g., commuting distance).
4.1.5 The Marketization of Politics and the Citizen–Consumer
Marketers and consumer researchers are not alone in framing people as consumers. Increasingly,
governments, media, and even environmental nongovernmental organizations address people as
consumers rather than citizens (Slocum 2004; Trentmann 2007). This “marketization” of politics has
led to the construction of the citizen–consumer in sociology and political science (e.g., Martens and
Spaargaren 2005; Soper 2007). The increasing marketization of politics influences people’s inclination
to assume responsibility for detrimental environmental impacts of their consumer behavior.
4.2 Conclusion
From environmental perspective, there is a need for public policies and establishing marketing and
business systems that encourage organizations and people to produce and consume within ecological
limits. This paper addressed opportunities for moving toward an era of green consumption. The focus
was on the value, belief, concern, attitudes and intention as main components of actual green buying
behavior and on how these components interrelate. To test this, we framed 5 hypotheses. These
hypotheses were tested using Confirmatory Factor Analysis. The results suggest that environmental
beliefs have direct effects on Environmental Concern, Environmental Habits and Environmental
Knowledge, the latter in turn influence Pro Environmental Attitudes and help in predicting green
buying behavior. To find the impact of gender differences on Environmental Knowledge, Concern and
attitude, Manova and Univariate ANOVA were performed for each dependent variable. The results
suggested that there are significant differences between men and women in overall Environmental
Knowledge, Concern and Attitude. Men reported higher levels of Knowledge on Environment issues
are more concerned about environment and have more positive attitude towards Green Purchase.

www.theinternationaljournal.org > RJCBS: Volume: 02, Number: 01, November-2012 Page 35
Section V: References
Ajzen, I (1991). The theory of planned behavior. Organizational Behavior and the Human
Decision Process, 50: 179
http://dx.doi.org/10.1016/0749-5978(91)90020-T
Arcury, T. A. & Johnson, T. P. (1987). Public environmental knowledge: A statewide survey.
Journal of Environmental Education, 18(4), 31-37.
http://dx.doi.org/10.1080/00958964.1987.9942746
Bray, James H. and Scott E. Maxwell (1982), "Analyzing and Interpreting Significant
MANOVAs," Review of Educational Research, 52, 340-67. (1985), Multivariate Analysis of
Variance, Beverly Hills, CA: Sage
Chase, Dennis and Therese Kauchak Smith (1992), “Consumers Keen on Green but Marketers
Don’t Deliver,” Advertising Age, 63 (June 29), s2-s4.
Davidson, D and Freudenburg, W. (1996).Gender and environmental Risk Concerns: A review
and analysis of available Research. Environment and Behaviour, 28, 302-339.
http://dx.doi.org/10.1177/0013916596283003
Ellen, Pam S., Joshua L. Wiener, and Cathy Cobb-Walgren (1991), “The Role of Perceived
Consumer Effectiveness in Motivating Environmentally Conscious Behaviors,” Journal of
Public Policy & Marketing, 10 (Fall), 102-117
Eagles, P. F. J. & Muffitt, S. (1990). An analysis of children's attitudes toward animals. Journal
of Environmental Education, 21 (3):41-44.
Ehrich, Kristine R. and Julie R. Irwin (2005), “Willful Ignorance in the Request for Product
Attribute Information,” Journal of Marketing Research, 42 (August), 266-277.
http://dx.doi.org/10.1509/jmkr.2005.42.3.266
Follows, Scott B. & Jobber, David (1999). Environmentally responsible purchase behavior: a
test of a consumer model. European Journal of Marketing. 34: 723-746
http://dx.doi.org/10.1108/03090560010322009
Fujisaki, Shigeaki and others (1997), Hattentojyo koku no kankyo ishiki (Environmental
Awareness in Developing Countries: Case of China and Thailand), Tokyo, Institute of
Developing Economies.
Hardin Tibbs(1993), Industrial Ecology An environmental Agenda for Industry.pp1-29
Huber, Richard, Jack Rultenbeek and Ronaldo Seroa da Motta (1998), "Instrumentos de
mercado para la politica ambiental en América Latina y Caribe: lecciones de once países",
Discussion Paper, No. 381 S, Washington, D.C., World Bank.
Hueber, G (1991), “Americans Report High Levels of Environmental Concern,” Gallup Poll
Monthly, 307, 6-12.
Hume, S., Strand, P., Fisher, C., Fitzgerald, K. and Freeman, L. (1989), ``Consumers go green'',
Advertising Age, September 25, pp. 3-5.
Mannetti, L., Pierro, A., & Livi, S. (2004). Recycling: Planned and self- expressive behaviour.
Journal of Environmental Psychology, 24, 227-236.
http://dx.doi.org/10.1016/j.jenvp.2004.01.002
Marell, A., Gärling, T. and Laitila, T. (2009), Need vs. opportunity recognition in household
car replacements. International Journal of Consumer Studies, 33: 639–643.
http://dx.doi.org/10.1111/j.1470-6431.2009.00816.x
Martens S. & Spaargaren G. (2005). The politics of sustainable consumption: the case of the
Netherlands. Sustainability: Science, Practice, & Policy 1(1):29-42. Published online Feb 08,
2005. http://www.google.co.in/archives/vol1iss1/0410-009.martens.html.
McCarty, J. A. and Shrum, L. J (2001), “The Influence of Individualism, Collectivism, and
Locus of Control on Environmental Beliefsand Behavior,” Journal of Public Policy &
Marketing, 20(Spring), 93-104.
http://dx.doi.org/10.1509/jppm.20.1.93.17291

www.theinternationaljournal.org > RJCBS: Volume: 02, Number: 01, November-2012 Page 36
Minton, Ann P. & Rose Randall L. (1997). The Effects of Environmental Concern on
Environmentally Friendly Consumer Behavior: An Exploratory Study. Journal of Business
Research. 40: 37-48.
http://dx.doi.org/10.1016/S0148-2963(96)00209-3
Momsen, Janet H. (2004). Gender and Development. London: Routledge.
Olander, Folke and Thogersen, John (2006), “The A-B-C of Recycling,” Advances in
Consumer Research, 7, 297-302.
Reitman, Valarie (1992), “Green Products Sales Seem to Be Wilting,” The Wall Street Journal,
May 18, B1.
Roozen, Irene and De Pelsmacker, Patrick. (1998), “Attributes of Environmentally Friendly
Consumer Behavior”, Journal of International Consumer Marketing, Vol. 10, No. 3. p. 21.
http://dx.doi.org/10.1300/J046v10n03_03
Schwartz, Shalom H. (1977), “Normative Influences on Altruism,” Advances in Experimental
Social Psychology, 10,221-279.
Stern, P. C., Dietz T., and Kalof, L., “Value orientations and environmental concern,”
Environment and Behavior, No. 25, pp. 332–348, 1993.
Soper, Kate and Trentmann, Frank (Eds) (2007) Citizenship and Consumption. Basingstoke:
Palgrave Macmillan.
Shaw, D and Newholm T. (2002), Voluntary Simplicity and the Ethics of consumption,
Psychology and Marketing, 19(2):167-185.
http://dx.doi.org/10.1002/mar.10008
Slocum R, (2004), "Consumer citizens and the Cities for Climate Protection campaign"
Environment and Planning A 36(5) 763 – 782
http://dx.doi.org/10.1068/a36139
Trentmann, Frank (2007) ‘Before “Fair Trade”: Empire, Free Trade, and the Moral Economies
of Food in the Modern World’, Environment and Planning D 25:1079–102
http://dx.doi.org/10.1068/d448t
Tikka, P. M., Kuitunen, M. T. & Tynys S. M. (2000). Effects of educational background on
students’ attitudes, activity levels and knowledge concerning the environment. The Journal of
Environmental Education, 31(3), 12-19
http://dx.doi.org/10.1080/00958960009598640
UNDP (United Nations Development Program) (1998), Human Development Report 1998,
Baltimore, Johns Hopkins University Press.
Wiener, J.L. and Sukhdial, A. (1990), “Recycling of solid waste: directions for future
research”, in Parasuraman, A. et al. (Eds), AMA Summer Educators’ Conference Proceedings,
American Marketing Associations, Chicago, IL, Vol. 1, pp. 389 – 92.
Young, O.R and Druckman D. (eds. 1992) Global Environmental Change. Understanding the
Human Dimensions. National Academy Press.
Zavestoski, S. (2002), Guest editorial: Anticonsumption attitudes. Psychol. Mark., 19: 121–
126. doi: 10.1002/mar.10005
http://dx.doi.org/10.1002/mar.10005

www.theinternationaljournal.org > RJCBS: Volume: 02, Number: 01, November-2012 Page 37
Management of Occupational Stress in Indian Context
Dr. K. Sundar, Associate Professor, Commerce Wing, DDE,
Annamalai University, Annamalai Nagar-608 002, Tamil Nadu. India.
&
Dr. G. Ezhilan, Associate Professor, Department of Commerce,
Muthurangam Govt. Arts College, Vellore – 632 002. Tamil Nadu, India.
ABSTRACT
The stress on individuals ranges from personal day to day life to their organizational activities”.
Growing urbanization, industrialization and trigger stress. In this changing environment, participation,
interaction, transaction planning and regulation become stressors. People feel stress when they can no
longer have complete control over what happens in life. There is no escape from stress in modern life.
In today’s context, stress is a costly expense that affects both the employer and the employee. In this
back group, this paper examines the sources of stress in one’s occupation, the effects of stress and
techniques of managing stress. It concludes that the complete wiping out of stress is out of question.
The various strategies recommended for employees and the management are expected to help the
employees combat stress effectively. This write up appeals to the organization to be proactive in
addressing the stressful situation and any effort put in by any organization in managing the issue of
work place stress can have a dramatic impact on bottom line.
Key words: Burnout, Eustress, Relaxation, Stress.
Introduction
In the words of Susan L. Find Fred (1994) “Modern life is full of stress. The stress on
individuals ranges from personal day to day life to their organizational activities”. Growing
urbanization, industrialization and trigger stress. In this changing environment, participation,
interaction, transaction planning and regulation become stressors. People feel stress when they can no
longer have complete control over what happens in life. There is no escape from stress in modern life.
In today’s context, stress is a costly expense that affects both the employer and the employee.
In India, over half of the call centre employees have been experiencing stress at their work spot
and keep on quitting their work. The Canadian Institute of Health Information reports that over one
quarter of employees in the suffer from stress of different types. The Japanese Govt. which keeps track
of job related stress every five years has reported that a percentage of Japanase employees who
experience stress, anxiety, burnout in their work life has increased from 51 in 1982 to almost 70 during
2007. Most recently, more than 6000 UK firms paid an average of over 80,000 on stress related
damages to employees. Bill Challashan, Chairman of UK Health Commission has expressed that half a
million people a year report that they experience depression, anxiety or burn-out due to work – related
stress. Stress is an adaptive response to a situation that is perceived as challenging or threatening to a
person’s well being. The stress is a negative consequence of modern living. People are stressed
because of ‘certain causes like over work’ ‘job-insecurity’ ‘information overload’ and the ‘increasing
pace of life’. These events produce distress. Which strikes a persons psychological and physiological
well being and is associated with several work-related behaviour. There is also positive dimension to
stress called ‘eustress’ which connotes a healthy and positive outcome of stressful events.
Intense or prolonged stress can produce physiological symptoms like high blood pressure.
Ulcers, sexual dysfunction, headaches, coronary heart discase and so on. Behavioural symptoms of
stress include poor job performance, poor decision making, workplace accidents, higher absenteeism
and increased work place aggression. The stress reduces psychologically job satisfaction; increases,

www.theinternationaljournal.org > RJCBS: Volume: 02, Number: 01, November-2012 Page 38
moodiness, depression and job burn out. The Job-burn out means complete emotional exhaustion,
cynicism and reduced efficiency resulting from prolonged exposure to stress.
Thus stress is negative outcome causing enormous strain on physical and mental well being of
employees on one hand and financial resources of the organization on the other hand. Only a few elite
organizations address the issue seriously. Many do not have any formal process for tackling concerns
stemming from stress. Perhaps these companies do not fully understand its implications on various
performance dimensions of employees. Some employers do not understand the source of stress and its
manifestation in work spot. Some do not promote an environment where employees can express the
stress experienced by them at work spot without any fear of repercussions.
In this back drop, this write up deliberates on the issues and prescribes the remedies for
addressing the stress both at the organizational as well as at individual levels. Before taking up deep
deliberation a brief review of literature is made to find out the gap to be filled up by the current
researches.
Review of Literature
Beech (1984) in his research has concluded that job stress is a condition arising from the people
and their jobs and characterized by changes within people that force them to deviate from their normal
functioning. According to Arthur et.al (2001), personality characteristics such as authoritarianism,
rigidity, masculinity, femininity, extraversion supportiveness, spontaneity, emotionality and tolerance
for work ambiguity, locus of control, anxiety and need for achievement are particularly relevant to
individual stress. Thomas et.al (1979) proved in his research that the employees who served in the
credit card company experienced a high level of stress and cholesterol and became ulcer and arthritics
patients”. Cynthia E. Corder (1993) work addicts or work alcoholics are susceptible to burnout.
According to her, such of those employees in the helping professions like counsellors, heath care
professionals and social workers those controlling vehicular traffic, customer services representatives
and stock brokers are more likely get burnt out.
Joseph Seltzer (1979) views that when people are burned out, they are more likely to complain;
to attribute their errors to other and tend to be highly irritable. They feel alienated and the stress
experienced by them drives many to think about leaving their jobs and to seek out a opportunities else
where. Warriars (2004) in his research study on bank employees in South Tamil Nadu, India, has
unearthed the fact that higher dosage of technical infusion in banking industry has contributed to great
stress among the employees, Veeramani (2006) has established in his study on one hundred credit card
managers in a private sector bank that inability to achieve the target drives the employees crazy.
Pastonjee (1999) has identified certain organizational stressors namely work overload, ill-
defined authority-responsibility relationship, poor physical environment, non-transparent employee
evaluation, and poor performance reward in his study on one of the automobile units in Chennai city.
Robbins (2006) had recommended a slew of strategies to combat stress experienced by individuals at
work spot. They include meditation, breathing, walking are and relaxing. Pareek (1983) has traced the
sources of occupational stress in police department. Harrison (1976) has deliberated about the different
types of stress experienced by misfit employees Gupta (2008) has singled out the stress factors
responsible for employee attrition in BPO industry in India.
It is clear from the review that most of the literatures are addressing stress experienced in
western contexts. In view of a limited work done in Indian context, the present study addresses the
need for addition of fresh literature in the area.
Globalization has ushered in competition among the various players across the industries. The
various corporate entities in their bid to maintain or increase their market share in their respective
industries pressure the employees to realize their goals of different hues. Thus different types of
organizational problems lead them to different kind of stress. In this context, identification of

www.theinternationaljournal.org > RJCBS: Volume: 02, Number: 01, November-2012 Page 39
prominent stressors and application of right solution are important both in the interest of organization
and employees.
Discussion of Issues and Strategies
Stress stems from many different sources and can involve virtually all aspects of our daily
lives. This part of analysis, however, deals primarily with only two sets of factors that produce or
influence stress: those relating to aspects of organization and those involving personal characteristics
of individuals. Basically the discussion revolves around three sub-themes:
Sources of stress (occupational stress, in particular).
Effects of stress (including the impact on health and other work related behaviour).
Techniques for managing stress. McGrath (1976) observes that “There is potential for
occupational stress when an environmental situation is perceived as presenting the demands
which threaten to exceed the persons’ capabilities and resources for meeting it. The adverse
effects of stress, in general, are frustration, decreasing productivity, disease and early morality.
“American of Institute of stress estimates the work related stress costs American business about
300 billion every year”. Lydia Nathan (2008). This includes man-days lost; medical treatment and
deaths. It is more difficult to assess an indirect costs, which includes employees turn-over, alcoholism
and drug abuse. Given this, it become apparent that the estimate of 300 billion dollars will be a very
insignificant part of the total costs and that the magnitude of the problem phenomenal.”
Work we all do fulfils a number of basic human needs. It
provides income for survival;
provides purposeful physical and mental activity;
increases self-esteem and feeling of competence,
meets social needs;
actualizes talents and capabilities;
leaves behind some enduring creation;
earns reputation and wins recognition.
When there is a failure to satisfy these needs or when there is a perceived threat to their
fulfilment, a situation of stress arises. The extent or the nature of stress, of course, differs from person
to person and how he looks at it.
The diagrammatic representation of sources stress is given below.
www.theinternationaljournal.org > RJCBS: Volume: 02, Number: 01, November-2012 Page 40
Sources of Occupational Stress
Occupational stress falls into five broad categories which are discussed below:
1. Workload
Two sets of situations can exist i.e., ‘overload’ and ‘underload’. The overload can be
quantitative or qualitative or both. The situation of quantitative overload exists when the targets
assigned or deadlines fixed are unrealistic. Despite the workers being professionally competent to do
their jobs, the time restrictions generate stress. Qualitative overload takes place when the work
demands more than what the workers possess by way of technical and intellectual competence. The
effects of this stress are reported to be mental fatigue, headache and gastrointestinal disorders.
Aruthor Blanna Richard (2002) says that a combination of quantitative and qualitative overload
takes place mostly in higher administrative and managerial positions. Decision making at this level
relates to complex situations affecting the well-being of the organization, the people who work in it
and the society at large.
In the Indian context the major problem mostly is that of qualitative overload. It is only
recently that this has been given serious attention by way of training of personnel at various levels to
improve their competence and sharpen their professional skills. In Afghanistan for instance, the
commercial accounting system was introduced in Government departments on the recommendations of
a consultant from USAID when the country did not have even a single chartered accountant of its own.
The result was a total chaos of Government accounts and the resultant frustration among those who
were required to work on the system.
Under the underload situation, the job does not provide adequate reinforcement and the indices
of underload are monotony, lack of opportunities to use skills and expertise, repetitive performance
and high degree of specialization.
People sometimes even go to extent of committing suicide due to the stress of underload
syndrome involving absence of intellectual involvement and opportunities to use their specialized
knowledge.
Hans Seyle (1974) terms these problems “asdeprivational stress”. The most common
consequence of derivational stress is that the employees work at a minimally acceptable level showing
no real interest in work. It has been observed that wherever norms have been fixed (e.g. by the staff
inspection unit in departments like posts and telecommunications) the employees work just upto that
level and thereafter their involvement and commitment ceases.
2. Occupational Frustrations
Hindrances in the attainment of goals by job holder lead to stressful reactions. The important
components of occupational frustration and their effects are the following:
a. Job ambiguity: Saranya (1998) observes that job ambiguity arises when there is no clarity
of the nature of job reporting relationship is ill-defined and the precise lines of authority and
accountability are blurred.”
The cutting edge level of administration in India is district and sub-district level administration.
Unfortunately, it is at these levels that confusion abounds over the roles of various functionaries and
their accountability. There is multiplicity of development schemes with overlapping jurisdictions,
multiplicity of agencies responsible for their implementation with none to coordinate specifically and

www.theinternationaljournal.org > RJCBS: Volume: 02, Number: 01, November-2012 Page 41
everybody almost treading on the toes of others. There is also ambiguity about the role of the Collector
of the district. This not only jeopardizes the achievement of goals, but also results in frustration among
those responsible for implementation of schemes.
b. Role conflict: This situation exists when roles and responsibilities of workers directly
conflict with each other. This conflict is more at middle management level, which is sandwiched
between the senior and lower management levels. In such a scenario, there are conflicting job
demands, particularly when subordinates have to report to more than one supervisor and is entrusted
with unrelated group of activities. Smith Carilla (2001) “Conflicts also arise because of the problem of
conflicting policies, the personal aspirations, group needs and societal requirements.” The classic
example of role-conflict is the conflict between the line and staff officers. The line officers feel
hamstrung by the clearances required from the staff officers before any substantive decision can be
taken. The staff officers often do not feel themselves as an integral part of the organizational group.
c. High degree of specialization: “Specialization is necessary and good because it helps in
innovation, increasing efficiency and quality. But over-specialization is frustrating because the
individual concerned feels distanced from the end product, having too few opportunities to identify
with the organization, its policies and the services it renders or the goods its produces”, (Seward Brain,
2000).
d. Poor Career Development: Maran (2005) Stagnation in a particular grade and absence of
opportunities to upgrade the existing skills or pressure to acquire newer ones is the important stressors.
Reinforcement can be provided by formal training and counseling.
3. Occupational Changes
Whenever technological advancement is absorbed in any enterprise, workers used to the
existing technology undergo stress on adapting to newer technology. Similarly employees promoted to
higher cadres experience stress in the initial phase. Employees on the verge of retirements and after
retirement perceive a higher sense of stress when they are pulled out from their daily routines.
Many retirees don not live long in their post retirement life due to perception of loss of self
esteem, depression, loss of motivation general apathy, sleep disturbance and lack of appetite.
Therefore enterprises need to put in place the right measures to address the stress resulting from
aforesaid situations. As regards stress emanating from ever changing technical advancement,
employees may be given financial and non-financial incentives in acquiring new skills. As for retirees,
post retirement benefits sufficient to have comfortable living may be ensured.
Resick Patrician (2004) when a person is suddenly-pulled away from a reinforcing factor like a
steady employment, stress is quite natural. Therefore, a proper planning and psychological preparation
for retirement are strongly recommended by developing alternative sources of reinforcement e.g.,
hobbies, social contacts, financial security.
4. Stress of Accountability
In the opinion of Mason L. John, (2005), persons those as the higher level who are accountable
for others performance experience higher levels of stress. Feelings of tension and anxiety are often
reported by them. They are also more likely to suffer from diseases like ulcers and hyper-tension them
the actual performances. It may be pertinent to recall the experience that Baron Robbert (1983) has
undergone. In his own words. dollars, share holders, dividends, market changes all these are just
numbers. They bother me sure but the decisions that eat away at me are the ones that involve people. If
I have to lay off the father of a family or call someone on the carpet, i am a wreck for days”. The
aforesaid statement clearly reinforces the stress resulting from accountability for others performance.

www.theinternationaljournal.org > RJCBS: Volume: 02, Number: 01, November-2012 Page 42
5. Other sources of Occupational Stress
Other sources of occupational stress include physical environments (e.g. noise, lighting, etc.)
and interpersonal relationships.
Effects of Stressors
Walter B Cannon, an eminent Harvard physiologist recognized in 1920 the importance of
hormones and chemical mediators in body’s response to stressors. As the body prepares itself for
defence against stress or to avoid threat, three systems are most directly involved and the effects of
stressors thereon are summarized as under:
Cardiovascular system Heart rate elevated
Increased blood pressure
Increased heart rate variability
Coronory heart disease
Digestive system Increased stomach acidity
Loss of appetite
Reduction in the flow of saliva
Nausea
Ulcers
Muscular system Tense muscles
Tension headache
Tightness of chest cavity
Tension at the back of neck
Tension around the stomach
Back-ache
Hans Seyle (1974) introduced his concept of “Generalized Adaptation Syndrome”, meaning
physiological reactions brought about by a broad range of environmental stimuli. He regarded stress as
a non-specific response of body to any new demand on his energy, efforts, skill or existing knowledge.
It has three phases. In the first phase, i.e., Alarm phase, stress is generalized and is manifested
by increased activity in most of the body systems. In the second phase or, Resistance phase, adaptation
to stressor is localized to one or two bodily systems with little or no evidence of development of
symptoms. In the final phase i.e., Exhaustion Phase, the system or systems appear to be overloaded
with consequent development of symptoms and this phase can result in illness or even mortality.
It should be remembered that many of these problems are the product of many factors such as
genetic pre-disposition, excessive smoking over-use of drugs and high consumption of alcohol. Hence,
while these may be pre-disposing factors, stress may become a precipitating factor.
Personality factor contributes significantly to stressful reactions. Friedman and Roseman
(1974), categorized people into two days : type A and type B. We find that there are certain people
who always seem to work under pressure, and stay competitive and are both impatient and aggressive.
In contrast, there are others who are more positive in their approach, who are relaxed and easy going.
These two types respectively have been called type A and type B. Research shows that most of the
people in the united states actually seem to fall into one category or the other. Specifically, about 40
per cent of the general population is type A and 60 percent is type B (Byrne, 1981).
www.theinternationaljournal.org > RJCBS: Volume: 02, Number: 01, November-2012 Page 43
The peculiar traits of type A personality are the following:
An eagerness to complete.
A desire for recognition.
Quickness of physical and mental functioning.
Fierce driving towards poorly defined objectives.
Self-imposed deadlines.
Anguish at repetitive chores.
Multiple thinking and action.
Impatient at the rate of progress.
A sense of unease and guilt at relaxation.
The difference between type A and B persons have important implications for organizational
behaviour. Under hard-driving, competitive environment, individual would behave very differently
from those relaxed and easy going in any job-related activities. Further, type A and type B persons also
differ in other key areas like personal health, social relations and performance of many tasks.
Those showing type B traits experience less serious heart disease while type A category is
more likely to suffer heart ailments.
Type an individuals pay a very high price for their hard driving and for their high pressure life
style. The findings are that type A individuals have higher resting pulse rate than type B in a wide
range of situations. They react to several types of stresses (e.g. of threat of failure) with a larger
increment in blood pressure.
In the sphere of interpersonal relationship, these two types demonstrate a highly contrasting
pattern of social behaviour. Types A is more impatient with others and prefer to work alone rather than
as a part of the team. They are more irritable than type B.
Viewed in the context of organizational behaviour, type A persons appear to work faster on
many tasks simultaneously even if there is no pressure or deadline. Similarly, they generally complain
less about hard work than type B. They also appear to be better able to handle tasks involving multiple
demands than type B (Fazio et al, 1981).
On the other hand, additional findings suggest that Glass, et.al (1974) type A may not always
have the advantage. For example, they do more poorly than type B on tasks requiring delayed
responses. They are simply too impatient to wait (Friedman et.al 1974). More importantly, most
members of top management are type A and not type B. Several factors contribute to this finding. It is
possible that many do not live long due to health risks as they rise to the top levels. It is also possible
that disposition of impatience is incompatible with the skills (e.g., considered judgment) required for
effective functioning at top levels.
Strategies for Stress Management
Many different procedures for combating stress have been developed and these fall into two
major categories: personal strategies (approaches that can be adopted by individuals to their own
behaviour) and organizational strategies (i.e., strategies organizations can follow to minimize stress
among its employees).
The following are personal strategies for combating stress at work place.
A. PERSONAL STRATEGIES
1. Self-improvement and self-help are simple but effective techniques. These focus on physical
strategies as well as on psychological strategies.

www.theinternationaljournal.org > RJCBS: Volume: 02, Number: 01, November-2012 Page 44
2. Factors which increase physical fitness (e.g., exercise and good / balanced diet) help in
withstanding the adverse effects of stress. Physically fit people generally have better immunity
to disease than those who are less fit (Mataji, 2000).
3. Strategies based on psychological or behavioural factors are more in vogue now than in the
past. The one which has received the maximum amount of firm support from careful research is
“development of network of social support”. Persons who enjoy close friendly ties with others
are often able to cope with job-related stress in contrast to individuals who lack such support.
This is so because the former are confident of receiving help in times of need (Rose Julin,
(2003).
4. Another simple but effective technique is “plan ahead”. Generally people expose themselves to
unnecessary stress simply because they allow the stressful events to overtake them rather than
anticipate them in advance and devise measures to out beat them or to formulate protective
strategies to lesson their impact.
5. “Take a vacation”, “adopt a hobby” or “participate in enjoyable activities” are another set of
simple devices. Growing evidence suggests that such measures negate stressors greatly.
Persons most likely to benefit in this manner are those most in need of assistance i.e.,
individuals who recently experienced negative and upsetting life events (Resick Patrician JW,
(2004).
6. The next strategy is relaxation training. The attempt is to deal with stress through mastering
techniques that induce deep muscle and mental relaxation. The muscular over-tension disrupts
the adaptive functioning of various bodily systems. From the scientific point of view,
relaxation refers to the lengthening of skeletal muscle fibres, while tension refers to the
contraction or shortening of muscle fibres. There are some 620 skeletal muscles in the human
body (Beech et.al, 1984).
There are two distinct stages in the history of relaxation training.
The first phase began with the work of Burns, (2004) the recognized pioneer in the field of
relaxation therapy. He established the principle that relaxation is the direct physiological opposite of
tension or excitement; it is the absence of nerve muscle impulses.
The second phase began with Joseph Arnold, (1988). He produced experimental neurosis in
cats by evoking anxiety brought about by placing them in a restricted environment and administering
harmless but unpleasant shocks. The result obtained by Arnold was that there could be inhibition of
adaptative functions (e.g., failure to eat, impaired social activities, sexual inadequacies, etc.) if the
anxiety persists. Using similar reasoning Stephen, (1994) concluded that deep relaxation could be used
to inhibit anxiety evoked by fear arousing stimuli in humans.
The major benefits claimed for relaxation include:
1. More competent management of stress.
2. Elimination or amelioration of stress related problems.
3. Reducing the need to depend on stress inhibitors.
4. Significant reduction in anxiety level
5. Improvement in performance.
6. Removal of fatigue.
7. Increased level of self-esteem and self-assuredness.
It needs to be remembered that relaxation training is not a routine ritualistic and simple process
as it might seem to be. In fact, it requires a high degree of self-control, disciplined and regular practice
and it is only one of the many methods of controlling stress. L.E. Burns (2004) has developed a three-
stage technique of relaxation which aims at progressive muscle relaxation.

www.theinternationaljournal.org > RJCBS: Volume: 02, Number: 01, November-2012 Page 45
Meditation
Meditation is another technique for obtaining similar results. It has received a great deal of
popular attention in the recent past in the West as well. Many yogic techniques are also available and
have been practiced in our country from ancient times. The benefits claimed by this technique have
been well established and it has been adopted by millions throughout the world. In a sense, the basic
procedures are fairly simple. After assuming a comfortable posture, persons meditating close their eyes
and attempt to clear all disturbing thoughts from their minds. They silently chant the single syllable (or
mantra e.g., OM) over and over again.
The studies designed to investigate the effect of meditation have yielded the following
interesting results: Schultz, (1972)
1. Persons engaged in this practice report such positive changes as increased feeling of well-
being, higher reserve of energy and clarity of thought.
2. Meditation appears to produce important changes in bodily functions.
Wallace et.al (1972) obtained careful records of physiological reactions of 36 individuals
before, during and after meditation. Results indicated that 30 minutes of quiet meditation reduced the
subjects oxygen intake, lowered their respiration, increased the electrical resistance of their skin (a
change linked to reduced emotional arousal), and shifted their brain waves towards a pattern reflecting
calm relaxation.
Chakravorty (1987) of the Indian Institute of Management, Calcutta has developed a method of
“mind-stilling” and management of stress through what he calls the Sadhana way.
Any kind of stress-mental or physical – destabilizes vital energy or Prana. And the most
immediate and gross manifestation of this dis-equilibrium always takes place through our breathing
process. In Patanjali’s Rajyoga, the art and science of Pranayama was evolved. The Indian psychology
tells that not much can be achieved in this direction by confining oneself only to intellectual
knowledge. It calls for transintellectual approach. The approach suggested for daily life by Prof.
Chakravorty is that of Compose – Decompose – Recompose.
At the beginning of each day one should try to consciously compose oneself. During the day
we are involved in numerous activities, thoughts and reactions. This is decomposition of our beings.
We become thoroughly exteriorized. Therefore, at the close of the day, a planned and regular process
of recomposition becomes imperative.
The process of composing and recomposing can be attempted through breathing
exercises e.g., breathing from one nostril while keeping the other closed and breathing out from the
nostril other than the one from which the breathing took place.
B. ORGANISATIONAL STRATEGIES FOR COMBATING OCCUPATIONAL STRESS
Personal strategies for coping with stress differ greatly but they converge on one common point
i.e., enabling the individuals, through various techniques, to deal with stress when it occurs.
Organizational strategies minimize such reactions by removing causes that produce them from the
work environment. They range from changes in the organizational structure to changes in the nature of
specific jobs.
The origin of stress in relation to the jobs and the factors leading thereto have already been
analysed and therefore, the first requirement is to remove or minimize their occurrence. For example,
role ambiguities, unrealistic targets, lack of participation in decision making process, etc., are some of
the stress inducing factors and these need to be judiciously managed. Additionally, reinforcement
through positive factors should be provided and these in brief can be:
www.theinternationaljournal.org > RJCBS: Volume: 02, Number: 01, November-2012 Page 46
Both organizations and employees have to share a joint responsibility for effective management
of stress Healthy organizations invest time energy and resources in putting in place a system to spot
out the sources of stressors in the organization and take proactive measures to stop the feeling of
discomfort and inconvenience by employees from developing into organizational stress. The following
strategies are recommended in general for both proactive and reactive organizations for taking on
organizational stress.
1. Assess the Level of Stress
There is variety of ways to diagnose the level of stress affecting the employees. Surveying the
employees using a questionnaire can unearth a lot of facts relating to the level of stress experienced by
employees. Another way is conducting an interview with employees. Such interview may bring to light
a lot of emotional output of employees. But all employees may not be comfortable with such
interview. Alternately, organization can entrust job of diagnosis to consultants or stress management
experts who can simply observe the working style of employees over a period of time either at
individual level or at organization level and make valid recommendations. Besides, there are other
stress measurement scales developed by Human Resource Consultants namely French and Khan
(1962), Cooper, Sloan and Williams, (1988). These scales command a high reliability and validity.
These scales provide organizations point in times score card that can be used as bench mark indicator
for future measurement and growth.
2. Employee Assistant Programmes (EAPs) Many reputed companies offer counseling services to stress affected employees. Most EAPs
are broad – brush programmes that counsel employees on job – related as well as personal problems.
This mechanism helps the employees understand, acquire stress management skills and practise them.
3. Work Balance Initiatives
Companies have introduced a variety of strategies to help employees achieve work – life
balance in India. They include Flexi time options. job – sharing, telecommuting, child care support.
Flexi working hours: Some firms are flexible on the hours, days and amount of time
employees spend on working. Employees under this arrangement rearrange the work schedule to
accommodate family events, ranging from attending children’s school activities to caring for elderly
parents.
Job-Sharing: This arrangement splits career position between two people so that they
experience less time – based stress between work and family.
Telecommuting: This strategy reduces the time and stress of commuting to work and provides
employees with time to fulfill familial obligations.
Childcare Support: Nearly one quarter of US employees utilize onsite or subsidized child care
facilities. Companies in India have been providing these facilities. This reduces stress resulting from
taking care of their children during the working hours of employees.
4. Temporary Withdrawal Strategies
Keeping the employees off the stressful work climate for a temporary period by giving them
sabbaticals or paid vacation helps the stressed out employees to recuperate their lost energies and
return to work invigorated.
5. Wellness Programmes
Research indicates that physical exercise has potentials to reduce physiological consequences
of stress by relaxing their muscle tension lowering heart beat and arresting stomach acidity. Many
companies in India have put in place fitness centres to enable the employees keep in shape. Similarly
firms provide facility for meditation and provide advisory services in the matter of diet, nutrition,
regular sleep, sitting posture and other good habits. Park Place Entertainment Corporation in Los
Vegas recently introduced a wellness programmes in which its’ 19000 employees have a free access to
a wide array of wellness classes, individualized health appraisals with health and disease prevention
information. Even in India, all blue chip companies have been offering these facilities as a matter of

www.theinternationaljournal.org > RJCBS: Volume: 02, Number: 01, November-2012 Page 47
routine employee welfare measure. Generally all these activities normalise an individual’s heart rate,
blood pressure, muscle tension and breathing rate.
6. Social Support
Social support in an organization can be in the form of emotional support among the colleagues
through exchange of information or knowledge or in the form of actual help on the job, in addition to
one’s own work responsibilities. In this connection, firms can institute mentorship programmes either
formally by the organization or informally by like – minded individuals to facilitate their personal and
professional development. The mentors provide coaching and counselling to develop self awareness
among the stressed out employees.
7. Participative Management
Participative management allows employees to take part in decision – making so that there is a
sense of control over this jobs. Kaisen management, suggestions scheme. Quality circles, employee
empowerment, formation of autonomous work groups, brainstorming, joint consultative committees,
and so on are different forums that promote employee participation. It is one of the stress fighting
interventions increasing the value of employees and paving for higher employee productivity.
8. Physical and Well Being Facilities
Organizations are realizing the impact of work ambience that appeals to the restless
professionals of new millennium. Physical environment can be a strong overt expressions of an
organizations unique persona, influencing employee behaviour. A well lit office subsidized canteen,
gymnasium and sports facilities, ergonomic chairs and desks, sound proof walls, cubical provision of
state of the art office gadgets, devises and personal computers staff quarters, recreating facilities
supportive superiors, invited talks on matters of current importance, accident insurance, arranging get
together on important occasion, medicare facilities, tours, picnics, and so on are contributing overtly or
covertly in great measure to counteract the impact of occupational stress.
9. Delegation and Decentralisation
Job stress can be greatly reduced by decentralization i.e., dispersal of authority and
responsibility throughout the organization. This is particularly relevant in the Indian context where the
responsibility has been assigned to field functionaries but powers have been held back. The
constitution of autonomous teams would help in this direction.
10. Performance Management System
Through proper adjustment in the reward system, job-related stress can be avoided
considerably. Performance management system should be perceived as reasonable and the distribution
of rewards be seen as fair by the employees. There should be no arbitrariness in dispensing rewards
arising from predilections and subjective judgments of the superiors. The large number of cases
before the Central Administrative Tribunal and the high percentage of judgments going against the
Government show that a fairly large number of Government employees are not satisfied with the way
the HR policies in relation to areas like pay and promotion are being implemented. The performance
criteria, method of appraisal and results of review of performance should be transparent so that
employees concerned can know exactly where he/she stands in relation to others and what they should
do to climb the career path. This would counteract the stress experienced due to biased reviews.
A feeling of justice and fair play is supposed to debilitate the stress.
11. Sound Training
Improved techniques of training and placement of employees should be introduced to help
individuals perform their jobs with the minimum strain and to avoid mis-match between the persons
and the jobs.
12. Free Flow of Communication
The lines of communication within organization should be improved, so that information flows
in an uninterrupted fashion in all directions.
13. Change in the nature of job
www.theinternationaljournal.org > RJCBS: Volume: 02, Number: 01, November-2012 Page 48
A change in the nature of specific jobs can also aid in controlled stress arising out of mal-
adjustment e.g., boredom, monotony, etc. three-prolonged strategy is suggested i.e., job enrichment,
job enlargement and the skill improvement.
Conclusion
The write up has brought to the fore the fact that stress is taking a heavy toll on work force.
The different types of occupational stress and their impact on workers have been addressed. The
employee by pursuing various strategies suggested in the article can beat the stress to the maximum
possible extent. The strategies recommended for organization have the potential to stem the occurrence
of the stress. Last but not least, the modern day work practices are stress laden. The complete wiping
out of stress is out of question. The strategies suggested can certainly help the employees combat stress
effectively.
Many avenues are open to manage work – related stress. Some directly remove unwarranted
stress or remove employees from stressful environments others help employees alter their perception
of environment as stressful. Wellness programmes encourage employees to build belter physical
defences against stressful experience. Social support provides emotional, informational and material
resource to support and buffer stressful experiences. The cost of ignoring the impact of stress can be
very damaging to the growth of an organization. As the adage goes prevention is belter cure, the
organizations have to be proactive in addressing stressful situations. Eventually an organization’s
ability to effectively manage the issue of workplace stress can have a dramatic impact on bottom line.
References: 1. Arthur P. Brief, Randell S. Schuler and Mary Van Sell, 1978. Managing Job Stress, Little
Brown, Bostan..
2. Aruthur Blanna, Richard, 2002. Coping with Stress in Changing World New York, Mcgraw Hill,
Publishing Company.
3. Baron, Robbert A., 1983. Behaviour in Organizations: Understanding in Managing Human Side
of Work, Allyn and Bacon, Inc.
4. Beech, H.R., 2004. Burns, L.E. 1984. and Sheffield, B.F., A Behavioural Approach to
Management of Stress : A practical guide to techniques, Johnson Wiley and Sons, New York.
5. Burns L.E., Relaxation Techniques in the Control of Tension: tape Recording.
6. Byrne, D. and Kelly, 1981. An Introduction to Personality (3rd ed.) Englewood …. N.J.,
Prentice-Hall.
7. Chakravorty, S.K., 1987. Managerial Effectiveness and Quality of Working Life Indian Insights :
Tata McGraw-Hill, New Delhi.
8. Cynthia L. Corders and Thomas W. Dougherty, 1993. “A review and integration of Desecrate on
Job Burnout.” Academy of Management Review. Vol. 89, No. 10, pp. 621-656.
9. Fazio, R.H., Cooper, M., Dayson, K., and Johnson, M., 1981. “Control and Coronary Prone
Behaviour pattern : Responses to Multiple Situational demands,” Personality and Social
Psychology Bulletin, Vol. 7, No. 11, pp. 97-102.
10. Friedman, M. Roseman, R.H., 1974. Type A Behaviour and Your Heart, New York, Knopf.
11. Glass, D.C., Snyder, M.L. and Hollis J., 1974. “Time Urgency and the Type A Coronary Prone
Behaviour Pattern,” Journal of Applied Social Psychology, Vol. 4, pp. 125-140.
12. Greenbery, Jerrold, 2007. Comprehensive Stress Management, (10th
edn), New Jersy: Vital
Source Technology inc.
13. Gupta S.S. and Gupta A, 2008. “Vicious Circle of Attition in the BPO Indudstry”. The far
Journal of Organisational Behaviour, Vol. VII, No. 2, pp. 57-66.
14. Hans Selye, 1974. “Stress without Distress, Philadephics: Lippincott.
15. Harrison R.V., 1976. “Job Stress as Person Environment Misfit” Presented at the Annual meeting
of the American Psychological Association, Washington, Dc.
16. Jenkins, C.D., 1976. “Recent Evidence Supporting Psychological and Social …. Factors for
Coronary Disease,” New England Journal of Medicine, 1976, Vol: 292, No. 10, pp. 1033-1038.

www.theinternationaljournal.org > RJCBS: Volume: 02, Number: 01, November-2012 Page 49
17. Joseph Arnold, 1988, Treating anxiety Syndrome through relaxation technique; Journal of
Applied Psychology, Vol XXVII, No.3, pp. 334-660.
18. Joseph Seltzer Rita E. Womeroff. 1988. “Supervisory Leadership and subordinate Burnout”.
Academy of Management Journal, Vol. 84, No. 6, pp. 439-466.
19. Lydic Nathan, T and T. Moses Chiropters, 2008. Global Challenges for HR Professionals Edited
by Kumar KBS, Ifcas University Press, Hyderabad, p. 155.
20. Maran Kumarraj, 2005. Strategic Mangement of Occupational Stress (paper presented at the
international conference on Global Business Challenges held in Chennai Dep 2007), Chennai,
Department of Management Studies, Sai Ram Engineering College.
21. Mason. L. John, 2005. Guids to Stress Reduction (86th
Edn) Florida: Celestial Arts publishers.
22. Mataji, Nirmala Devi, 2000. “Stress Management by Yogic exercise” Times of India, Mumbai
Edision, March.
23. McGrath, J.E., 1976 “Stress and Behaviour in Organizations,” in M.D. Dunnette … Handbook
of Industrial and Organizational Psychology, Chicago.
24. Pareek D 1983. “Organisational Role Stress”, in Goodstein L. D and Pfeiffer JW (Edu), The 1983
Annual, University Associates, San Diego California, pp. 115-123.
25. Pastonjee DM 1999. “Stress and Coping”: The Indian Exterience, 2nd
edition, Sage Publications,
India Pvt. Ltd, New Delhi.
26. Reich, J.W. and Zautra A., 1981. “Life Events and Personal Caution : Some Relationship with
Satisfaction and Distress,” Journal of Personality and Social Psychology, Vol. 41, No. 5, pp.
1002-1012.
27. Resick Patrician, 2004. Stress and Trauma London, Psychology Press.
28. Robbins SP and Sanghi. S 2006. Organisational Behaviour, Burling Kindersley (India) Pvt.Ltd.,
New Delhi, p. 542.
29. Ross, Julin, 2003. “Mood Culture” New Delhi: Penguin Books inc.
30. Saranya.S. 1998. Stress – Management in Select Public Sector Banks in Chennai, Doctoral
dissertation, University of Madras, Chennai.
31. Schultz, T., 1972. “Discovering the Potential benefits of Meditation,” Today’s Health, Vol. 50,
No. 10, pp. 34-37.
32. Seaward, Brain 2001. Essentials of Managing Stress (6th
edu) New York: Jone and Bartett inc.
33. Seyle, H., 1976. “Stress in Health and Disease, Boston”, Butterworths.
34. Smith Carilla, 2001. Work Stress (5th
Edn) New Delhi: Words worth, inc.
35. Stephen, Y, 1994. “Anxiety Management” Journal of Syndicate, Vol. 10, No. 5, p. 100-102.
36. Stephensen, R. 1994, Impact of mind calming and relaxation on employee productivity, Journal
of behavioural psychology, Vol. IV, No: 4. pp. 55-63.
37. Susan L. Find and Fred L. Otte. 1994. “Management Styles, Mediating Variables, and stress
among HRD Professionals”, Human Resources Development Quarterly winter, Vol. 120, No. 6,
p. 301.
38. Swamy Chinmayananda, 1980. “The Art of Man making”, Chinmayananda Mission, Bombay.
39. T.A. Beech and Newmon, 1978. “Job Stress Employee Health and Organisational Effectiveness;
A Facet Analysis: Model, and Literature Review, Personal Psychology Winter, Vol. 112, No. 8,
pp. 665-699.
40. Thomas G. Cummings and Cary L. Cooper, 1979. A Cybernetic Framework for studying
occupational stress” Human Relations, Vol. 87, No. 5, pp. 395-418.
41. Veeramani.C, 2006. Impact of stress on job holders in BPO industries: Office highest 8(10), p.
70-72.
42. Wallace, R.K. and Benson, H., 1972. “The Psychology of Meditation,” Scientific American, Vol.
50, No. 8, pp. 84-90.
43. Warriar.Y 2004. Work place stress in banking industry: “Integrated Management”, 16(1) Oct
27-12 p. 42.

www.theinternationaljournal.org > RJCBS: Volume: 02, Number: 01, November-2012 Page 50
Aligning CSR With Human Resource Management – The Key Role of an
Organisation
Dr. A. Savarimuthu,
Dean, St. Joseph’s Institute of Management, St.Joseph’s College(Autonomous), Tiruchirappalli – 2.
Mr. M. Irudhayaraj*
Ph. D Research Scholar, Dept. of HRM, St. Joseph’s College, Trichy
Abstract— Human resource managers are well positioned to play an instrumental role in helping
their organization achieve its goals of becoming a socially and environmentally responsible firm – one
which reduces it’s negative and enhances its positive impacts on society and the environment. As
human resources influence many of the key systems and business processes underpinning effective
delivery, it is well positioned to foster a CSR ethic and achieve a high performance CSR culture.
The involvement of employee is a critical success factor for CSR performance. Human
resource managers have the tools and the opportunity to leverage employee commitment to, and
engagement in, the firm’s CSR strategy. High performing CSR organizations foster a culture of CSR
and fully integrate CSR throughout their operations, rewarding and incentivizing CSR decisions and
initiatives. Employees prefer to work for organizations aligned with their values; thus, incorporating
CSR into the employee brand can enhance recruitment and retention, particularly in tight labour
markets.
CSR can be applied to the HR toolkit, resulting in a roadmap or pathway for human resource
practitioners to follow the ethical code in the achievement of their organization’s sustainability and
business aspirations, thereby improving social and environmental conditions locally and globally.
Hence, this paper makes a conceptual analysis of the role played by organizations in aligning their
sustainability principles in to their core business functions with the help of a strong band of human
resources.
Keywords— Corporate Social Responsibility, Human Resource Management. Role of HR
Manager, Engaging CSR with HR.
I. INTRODUCTION
Perhaps a greater part of man’s early business history revolves around the monolithic object of
profit maximization and improving shareholders’ values. Because the benefits accrued to
shareholders/investors ultimately cascade to the society, some economic theorists assume businesses
do not owe the society more than economic responsibility. Milton Friedman argues that CSR distracts
business leaders from economic goals, and the only social responsibility of business is to increase its
profits. However, as the human society progresses and the nature of interrelationship and
interdependence between business and society become obvious, different interest groups began to
mount pressure on the business organization to assume more responsibilities for the society, beyond
the economic function.
CSR rests its assumptions on the fact that the organization is a creation of society; therefore it
has a responsibility to aid in the accomplishment of society’s goals. A company’s corporate
responsibility must be inseparable from its economic function and must be focused towards its
stakeholders. Professor Cohen considers the stakeholders as “All those who have an effect on a
business, and all those who are affected by a business”.1 The stakeholders in terms of CSR issues are:
managers, employees, customers, investors, shareholders, suppliers, government, the local community
and the society at large and even the natural environment. In fact, CSR commitment has been extended
to include both ecological sustainability and social development with focus on a ‘triple bottom line’

www.theinternationaljournal.org > RJCBS: Volume: 02, Number: 01, November-2012 Page 51
(economic, social and environmental) performance. The employees are the most strategic of these
stakeholders, and their involvement in CSR initiative impacts significantly on the organization’s
bottom line. “It is through employee actions and decision-making that many CSR strategies come to
life.
HR can be the key organizational partner to ensure that what the organization is saying
publicly aligns with how people are treated within the organization. HR is in the enviable position of
being able to provide the tools and framework for the executive team and CEO to embed CSR ethic
and culture into the brand and the strategic framework of the organization. It is the only function that
influences across the entire enterprise for the entire ‘lifecycle’ of the employees who work there – thus
it has considerable influence if handled correctly. HR is poised for this lead role as it is adept at
working horizontally and vertically across and within the organization, so important for successful
CSR delivery.
II. HR’s Role In Promoting Corporate Social Responsibility
With the growing importance of CSR in companies, HR professionals play a key role in
initiating, developing and sustaining CSR activities in the organization. While some companies have
separate CSR executives who are responsible for coordinating and managing events, most companies
expect HR personnel and other employees to invest their time and participate in such activities. In
today’s corporate scenario employees typically work for more than 8-10 hours a day and are expected
to multitask in their sphere of work. Given this hectic pace of work it‘s a challenge for any
organization to sustain CSR initiatives. Therefore, HR professionals have an indispensable role to play
in the areas of creating strong organizational culture aligning with core company values, fostering
relationship that is sensitive to the community culture, engaging every employee in active community
activities, and assessing the environment in order to identify threats to the community.
HR professionals need to co-ordinate the CSR activities and demonstrate company‘s
commitment to CSR. Effective CSR depends on being seen as important throughout an organization.
HR professional needs to include CSR in an organizational culture to make a change to actions and
attitudes and ensure the support of the top team which is critical factor to success. HR should
communicate; implement ideas, policies, cultural and behavioral change across organization. HR is
also responsible for the key systems and processes underpinning effective delivery.
The way a company treats its employees contributes directly to the company being seen as
willing to accept organizations wider responsibilities. Building credibility and trusting their employer
are being increasingly seen as important by employees when they choose who they want to work for.
HR manager should instill individual social responsibility in every employee in the organization. He
should make employees aware that every single person in the society has responsibility to the society
they belong irrespective of the job, class, caste or gender. HR should make employees think that only
when one fulfills or at least do the sincere attempts to do so, one can lead a complacent life in the
society. HR team can motivate the employees to contribute a certain amount or few hours in a period
of time to any organization worth. Even one can start with helping the needy in their neighborhood.
Human Resource Departments play a critical role in ensuring that the company adopts
Corporate Social Responsibility programs. Furthermore, HR can manage the CSR plan implementation
and monitor its adoption proactively, while documenting and celebrating its success throughout the
company. Human Resources technology can help with a Corporate Social Responsibility program,
including reducing the company‘s carbon footprint to benefit the planet. Start with these areas:
Implement and encourage green practices.
Foster a culture of social responsibility.
Celebrate successes.
Share and communicate the value of corporate social responsibility to employees and the
community.
www.theinternationaljournal.org > RJCBS: Volume: 02, Number: 01, November-2012 Page 52
III. The Basics Of Integrating CSR In to HR Management2
This guide has been developed recognizing the constrained economic environment of our
times; the tools and tactics proposed in this roadmap are those which can readily be integrated into the
HR practitioner’s daily regimen.
Step 1: Vision, mission, values and CSR strategy development Successful CSR requires a clearly articulated vision, mission and values. The HR practitioner
could initiate or support the development or upgrade, of a vision, mission and values of the
organization. The mission of a socially responsible HR Manager should specify that it will engage in
ethical and responsible business practices and seek to make decisions in particular HR practices that
balance the needs of key stakeholders, employees and society at large.
Step 2: Employee codes of conduct The HR Manager’s function is typically responsible for drafting and implementing employee
codes of conduct. As such, HR managers hold the pen on the principles contained in the employee
codes. Since a number of recent high profile corporate frauds, boards of directors have become very
concerned about the ethical culture within their organizations, looking for 100% sign-off on and
compliance with codes of conduct which articulate their ethical values.
Step 3: Workforce planning and recruitment Workforce planning consists of analyzing present workforce competencies; identification of
competencies needed in the future; comparison of the present workforce to future needs to identify
competency gaps and surpluses; the preparation of plans for building the workforce needed in the
future; and an evaluation process to assure that the workforce competency model remains valid and
that objectives are being met.
Step 4: Orientation, training and competency development Orientation is designed to set the employees in a direction that is compatible with the firm’s
mission, goals, and culture. Before training or development takes place employees proceed through an
orientation to learn what the organization stands for and the type of work they are expected to perform.
During the orientation process employees should be given a thorough overview of the clear line of
sight between the company’s vision, mission and core CSR values and goals.
Step 5: Compensation and performance management The most critical HR tool of all is the compensation and incentive program. The total reward
and recognition program, including base salary, incentive pay, long term incentives and other non-
monetary recognition benefits (such as award programs, employee of the month, promotions, career
path, etc.), needs to be aligned with the company’s CSR values and strategy. To do less is to guarantee
under-achievement of a company’s CSR objectives.
Step 6: Change management and corporate culture Companies have come to realize that innovation and independent thinking are the foundation of
a modern business. The advocates of HR practices must close the gap between what the companies say
and the reality of their actual performance. Goals and ambitions should be encouraged and companies
must mean what they say.
Step 7: Employee involvement and participation Employees are among the key stakeholders for the development of any CSR strategy or
program. A critical first step in mission, vision, values and strategy development is to understand the
key concerns, priorities and perspectives of all key stakeholders, particularly employees. In addition to

www.theinternationaljournal.org > RJCBS: Volume: 02, Number: 01, November-2012 Page 53
ensuring employees are included in key decisions, an employee CSR involvement and participation
program can help develop the employee value proposition that can foster retention and enhance
recruitment.
Step 8: CSR Policy and Program Development HR Manager is also in a position to drive policy development and program implementation in
HR areas that directly support CSR values. Wellness, diversity, work-life balance and flex-time
policies are CSR programs directly within the HR manager’s purview. Wellness programs can become
a platform for engaging employees in discussions about “personal sustainability” and provide support
for employees in the areas of stress management, spirituality at work, health and fitness, healthy
lifestyles, etc.
Step 9: Employee Communications Every CSR strategy requires the development and implementation of an employee
communication program to convey the corporate direction, objectives, innovation and performance on
its CSR efforts. Intranets, websites, blogs, wikis, social networking sites, podcasting, videos, forums,
town hall meetings, regular team briefings, webcasts, voicemails, print and electronic newsletters and
other forms of social media need to be deployed to bring the CSR message to the workforce – in ways
that are attuned to the communication channels of the employee, which are changing rapidly in this
age of web 2.0.
Step 10: Measurement, Reporting – and celebrating successes along the way! As what gets measured gets managed, it is vital that both CSR performance and employee CSR
engagement be actively measured and reported to executive, the board of directors and public.
Typically this is done in the form of an annual CSR report which demonstrates CEO and senior
leadership support. It provides verified performance data against HR practices along with social,
environmental and economic performance indicators. Objectively, both good and bad news are shared
and outlines goals for improvement. Often this report is verified by external auditors.
IV. Challenges In HR Involvement With CSR3
HR has to understand how CSR strategy is aligned to business and HR practices.HR has to get
endorsement for the CSR strategy from inside and outside the organization and communicate
consistently.
HR needs to ensure that their organization CSR can stand up to the inevitable scrutiny by stake
holders and that training and communication mean its embedded throughout the culture of an
organization
HR needs to be an active business partner working with other functions like finance, public
relations, marketing etc.
HR has to implement CSR as a strategic opportunity which should be market-led and It should be
restrained by bureaucracy. Because trust build through successful CSR is hard to regain if lost.
HR has to get the Top team on board and know how to sell benefits of CSR to different
stakeholders.
HR has to develop CSR code based laws and regulations of the country and also ensure that
reporting systems are accountable and transparent.
HR has to look for ways to leverage social responsibility initiatives internally. Communicate the
contributions company is making in the community and get employees involved.
The separation of employees during mergers, acquisitions, downsizing etc. should be strategically
aligned with the business strategy as well as Corporate Social responsibility. Retraining, retention,
redeployment of people can be worked out with aggressive communication, information campaigns
and outplacement services in place to assist the transition of people from the organization.

www.theinternationaljournal.org > RJCBS: Volume: 02, Number: 01, November-2012 Page 54
The Human Resource department should effectively measure and evaluate CSR activities. The
value added by CSR in the form of direct results, such as, economic savings and indirect results like
increase in employee satisfaction, less employee turnover, measured by staff attitude surveys, shall
indicate contribution to improved business performance. There is also a need to conduct periodic
review of the CSR activities.
V Benefits In HR Involvement With CSR
Generally, there is a growing desire among employees to derive a sense of greater purpose
from their work; happier employees with increased job satisfaction can unleash innovation in a
firm. The following list provides an overview of the key business benefits and economic value from
employee CSR engagement.
Increased retention and reduced recruitment and training costs A survey conducted for the Conference Board of Canada in 2000 found that 71% of employees
want to work for companies that commit to social and community concerns. In a similar Corporate
Citizenship study by Cone Inc. in the U.S., 77% of respondents indicated that “a company’s
commitment to social issues is important when I decide where to work”. A Scotiabank 2007 study
of employed Canadians concluded that 70% would consider changing jobs if their employers did
not operate in a socially responsible manner. With the replacement costs for the average worker
about $50,000 including lost output, recruitment, training and other elements, it pays for companies
to manage their CSR as well as their financial performance. Further evidence of the importance of
social and environmental performance management comes from a World Business Council for
Sustainable Development (WBCSD) publication, in which it was reported that “three-fifths of the
graduates and potential employees surveyed by Accenture in 2004 rated ethical management as an
important factor in their job search. And in the UK, 75% of professionals take social or ethical
considerations into account when changing employment, while over half of graduates will not work
for companies they believe to be unethical.4
Better able to attract the best and the brightest, especially amongst graduates The Aspen Institute’s 2007 study of MBA students found them to be expressing more interest in
finding work that offers the potential of making a contribution to society. Further, in a 2006 study
of 14 – 18 year-olds, 78% said money “was less important to them than personal fulfillment”. They
went on to work for “companies that promote equality, a green environment, and social
responsibility.” Even more remarkable, a 2003 Stanford University study Corporate Social
Responsibility Reputation Effects on MBA Job Choice found that MBA graduates would sacrifice an
average of $13,700 in salary to work for a socially responsible company. Some predict that the war
for talent will not be won through money, but through these intangibles.
Cost savings and income produced through improved employee morale and productivity It has long been known that a more motivated, engaged and inspired workforce produces higher
long-term productivity. A 2002 GlobeScan International survey showed that eight in ten people
who worked for a large company felt greater motivation and loyalty towards their jobs and
companies the more socially responsible their employers became. Another study, reported on in the
WBCSD publication revealed that 70% of staff who were committed to the values of the company
said that their productivity had increased in the past year while of those staff not committed to the
company only 1% had productivity improvements. Bob Willard, retired Canadian
telecommunications executive and well known CSR author and thought leader, has predicted that
companies can expect a 2% increase in employee productivity from improved company-wide
teaming around common sustainability issues that transcend departmental boundaries, and a 2%
increase in employee productivity from an improved work environment as a result of CSR. Further,
it is well understood that boosted employee satisfaction and performance leads to increased

www.theinternationaljournal.org > RJCBS: Volume: 02, Number: 01, November-2012 Page 55
customer satisfaction, generating a further win-win for CSR oriented companies. Brand research
reveals that in a study of customer behaviour, “8% of customers switching brands are lured away by
competition; in contrast, 68% are turned away by an employee’s indifferent attitude.” Engaged
employees are the company’s best defense against this Word – of – Mouth Virus. Employees
working for organizations aligned with their values are more likely to foster customer satisfaction
and loyalty. 5
VI Conclusion
It is a foregone conclusion that business enterprises have social obligations. Instead of single
objective enterprises are required to pay attention to multiple objectives like social, environmental,
information and ethical objectives all of which are integrated. Indian enterprises must graduate from
thinking in terms of just charity to the concept of respectability. More particularly, HR activities must
realize that neither office nor position gives immunity form responsibility. It is important to link HR
with external environment to chart out a better future for the society. “C” no longer stands for
Corporate and Cash, now it also includes Care and Community development as socially
responsible enterprises help in building a better tomorrow for the underprivileged. Companies
must earn respect and affection of the community through good deeds and enlightened HR policies.
Successful programmes on social responsibility rely heavily on enlightened people
management practices. In this context HR department is assumed to be the coordinator of CSR
activities in getting the employment relationship right which is a precondition for establishing effective
relationships with external stakeholders and thus can orient the employees and the organization
towards a socially responsible character. There is also an increasing trend in the corporate sector which
has started leveraging upon employees and their management for exhibiting their commitment towards
CSR. Armed with a strong and committed organizational culture reinforced by responsible Human
Resource Management practices, the organizations can achieve heights of success by improved
profitability, employee morale, customer satisfaction, legal compliance and societal approval for its
existence. It is high time for all other organizations which have been paying only lip service to CSR
that they must capitalize upon the existing Human Resource Department in framing such practices,
procedures and policies that ensure the internalization of quality, ethics and excellence in the whole
system. By doing this they can sensitize the employees and the whole organization towards CSR
without adding any additional cost.
To recapitulate it can be said that companies have increasingly felt the need to co-ordinate their
CSR activities and demonstrate their commitment to social responsibility. But delivery, not rhetoric, is
the key in developing the trust of external stakeholders for any organisation and it cannot be done
without beginning charity at home. To do that social responsibility needs to be embedded in an
organisation’s culture to bring change in actions and attitudes in which Human Resource can play a
significant role. Otherwise, CSR may run the risk of being categorised as shallow ‘window-dressing’.
X. REFERENCES
[1]Available:http://www.csrforhr.com/
[2]Available:http://corostrandberg.com/wp-content/uploads/.../CSR_and_HR_Management1.pdf)
[3]Available:http://www.mmbgims.com/docs/full_paper/14_MOHAMMAD%20KHALIL%20AHME
D_2_pp.pdf
[4]Available:http://CSR -an-Introduction.asp (accessed on February 8, 2009).
[5]Available:http://www.ic.gc.ca/eic/site/csr-rse.nsf/eng/rs00555.html
www.theinternationaljournal.org > RJCBS: Volume: 02, Number: 01, November-2012 Page 56
Qualitative Case Study:
Should entrepreneur’s believe, “LEADERSHIP IS INNATE”?
Dr. Dileep Kumar.M. , Professor- HRM/OB and Strategic Management, Othman Yeop Abdullah
Graduate School of Business (OYA-GSB), Universiti Utara Malaysia, Malaysia.
ABSTRACT
The issue of entrepreneurship and leadership is well discussed in the past and present. How far these
two terms related to each other is still a core debatable topic. Some says all entrepreneurs are born
leaders, while some other says; all entrepreneurs have to build up leadership qualities. While this
debate is going on a case study is conducted on a self moulded entrepreneur from Sultanate of Oman.
This case describe the journey of Mr. Hussain, as an entrepreneurial leader, gives many answer to the
above discussed aspects: leader-entrepreneur. The researcher followed sensitive case analysis method
to collect data and observe its validity and reliability. The debate of leader-entrepreneur needs to be
answered through the incidents Mr. Hussain has experienced across throughout his life. This is a real
case from the Sultanate of Oman. This is the journey of an entrepreneur who faced extreme challenges
and overcame struggles in business through common sense – “the sixth sense.”
HUSSAIN: THE ENTREPRENEUR
Family and early adulthood
Hussain was born in a poor family. His family consisted of four members. Those days, the sole income
to maintain his family came from Hussain’s father. He had a steel workshop, which was closed due to
his terminal illness. When his father got the terminal illness, Hussain didn’t have any option. To
support his family and his father he sold chocolates to the village community and in schools.
Chocolate sales as a small individual business was his first effort to enter into business. But whatever
money he got from his chocolate sales, he spent it for his father’s medicine and treatment. His
responsible attitude as a son to his family was moulded by the realities of life and the practical
situations from his childhood though it was a very much challenging task for a four-year old child who
had just started his journey of life. He went every day to the market to sell chocolates, sitting on the
ground. His shop was a piece of wood. He put his chocolates in front of him. He had no idea that this
would be his first step to his business career. However, due to these miserable circumstances, Hussain
did not enjoy his childhood as his peers did. He spent all his childhood time selling chocolates in the
market. During those years, not all students went to school. But, Hussain’s family sent him to school
and to the market at the same time. Studying and selling chocolates became one to Hussain. While he
was selling chocolates he continued studying and doing his homework.
When he reached the age of ten years, his father died. Despite his father’s death, he did not stop selling
chocolates. However, his father’s death was like a shock to him. The circumstances of life forced
Hussain to become the bread earner of the family as neither his mother nor anybody in his family had
any job. So, he worked seven days a week. The steel workshop was rented during his father’s illness
but the amount coming from the rented workshop did not meet the basic needs of the family.
THE CHANGE
During those days, the growth of Oman’s economy was at a low level as the government was involved
in developing basic infrastructures and had a long plan and way for proper development. The country
faced many barriers like lack of good roads, good drinking water, electricity supply,
telecommunication and poor technology and centralised decision-making. These turned to be barriers

www.theinternationaljournal.org > RJCBS: Volume: 02, Number: 01, November-2012 Page 57
to many business opportunities and starting new business ventures, whether on a small scale, medium
scale or big scale. On the other hand, Hussain’s small business was growing much faster than his
expectations. He faced a lot of challenges and witnessed many changes in his personal and
professional life. Hussain continued to sell chocolates with more vigour to provide more income for
his family. From a small market in the 1980s, he grew up to widen his knowledge about the market
sellers, the buyers, the good people as well as the bad ones. He got full respect from the old people in
the market as they knew his father’s circumstances. Circumstances further led him to many situations
in life. Due to the rising price index and low income he found it difficult to make ends meet. The
family situation became worse. Hussain turned to be impatient in his life, as the profit he was receiving
every day became too low and it was insufficient to meet the day-to-day needs. Sometimes he came
back home without selling a single bar of chocolate. Life looked at him very harshly. He became more
worried about his small business and family.
FINDING MORE AVENUES IN BUSINESS
Reading books was one of the unique habits Hussain had during those days. Even in the impatient days
of his life he used to read lot of books. This reading habit led his uncle to offer a book to him to read.
The book was much classical and provided entertainment to him. Although the book which was given
to him by his uncle was not for sale, he got an offer to sell it to an old man. Hussain sold the book at
double the price. Understanding the better prospects of getting more money from selling a book, he re-
bought two more copies of the same book. The surprising factor was within three hours, the two copies
were sold. He realised one thing from this selling of books: people were in need of good books. He
made a comparative analysis between these two products. He realized further that the total profit he
gained from selling three books was equal to two months’ profit he gained from the chocolate sale.
Considering the wide opportunity to earn more money, Hussain started selling books along with
chocolates. It was a good opportunity; he kept on buying books from the small hawkers or vendors
while maintaining the sale of chocolates. It seemed that people were attracted by the boy’s love to read
and sell chocolates. There was a stable growth in selling chocolates, but this could not gain that much
of his attention. Hussain stopped selling chocolates when he realized that the book profit was worth
more than the chocolate profit. Hussain distributed chocolates to the people in the market, but
everyone was surprised why he distributed chocolates freely. “I have a new business, I am a bookseller
now”. This was his answer to the people. With his creative way in the form of a celebration, he made a
marketing campaign for his new business. Hussain’s uncle was proud of the decision he made, the
profit he gained from the books, and because he was a good reader and trader at the same time. His
uncle noted his behaviour and the way he used to buy books from the vendors then sit on the market
corners and sell them quickly with double profit. Hussain had many books to sell, but he did not have a
shop to keep all those books. It became very difficult to carry home all those books everyday and
return with them the next day.
STARTING A BOOKSHOP
Hussain’s uncle was a moral supporter of all his best efforts in business and personal life. One day he
asked his uncle, “Why do only the old people have shops, why don’t we small kids have shops?” His
uncle replied, “Why not my son? But you already have a steel workshop.” Hussain was impatient to
tell his ideas to him. He further asked his uncle, “Can I convert the steel workshop to a bookshop?”
After being silent for a while and making a rough calculation, Hussain’s uncle replied, “With your
existing income, you cannot cover the steel workshop rent that you are going to lose if you utilise it as
a bookshop”. But, Hussain insisted that he could gain more profit in the future, therefore, he convinced
his uncle to support him and arranged to convert the steel workshop into a bookshop. Hussain’s uncle
was very much proud of his ambitious way, achieving nature and his sophisticated way of looking at
things differently.

www.theinternationaljournal.org > RJCBS: Volume: 02, Number: 01, November-2012 Page 58
FIRST BOOKSHOP IN THE VILLAGE
Hussain’s bookshop was the fi rst in the area. Hussain became the sole book seller in that market. He
had a good knowledge of all the available books in his bookshop. However, in those days, there was
no technology such as computers, where you could easily search for the data on books you would need
and get that information in seconds. Therefore, people depended mostly on their memories regarding
the titles of many books that could be easily sold in the market. As he was a good reader, customers
got surprised with his ability to reply many questions regarding any book in his bookshop. This ability
built better customer maintenance and relationship with the customers. He was not a good achiever in
school, but he was not so bad. He had a kind personality. He behaved like a sophisticated person with
his teachers. However, he knew his teachers as many of them used to visit him in his bookshop. Most
of his teachers became valuable customers, as they bought books as incentive prizes for the students.
THE SOCIETY SCHOOLS
Although the market was far away from the school, Hussain’s teacher knew that Hussain had a
bookshop in the market. Therefore, he gave him a mission to buy some gifts that were available in a
shop at the same market. Hussain bought the required gifts at a cheaper price than expected. Another
teacher heard about the cheaper price gifts. He asked him to provide him with the same ones. Hussain
started thinking, “Why don’t I provide such products in my bookshop?” As a result, Hussain provided
such products that were used as gifts such as notebooks, pens, pencils, etc. Since then, Hussain started
to satisfy all the school’s needs. In a few months, he became popular, not only in his school, but in
many other schools. Doing business properly required adequate storing space and a building. Hussain
faced a problem of space in doing business. Hussain’s uncle, however, had a plot of land on which a
store could be built. To build a store he needed at least OMR.15000. Finding an alternative for money,
Hussain signed a contract with his uncle to invest on the plot for 10 years in return for receiving the
plot with the ‘built store’ after ten years. Through this deal, Hussain was exempted from paying rent
for ten years. Certainly, there could be some risks in investing money for ten years while you are in
need of that money to develop your business. However, with his new stores, Hussain was able to buy
in bulk. He became the main supplier of books to many schools. Moreover, providing the schools’
needs led him to think of the students’ needs such as bags, rulers, erasers, and sharpeners. At this
point, Hussain succeeded in converting the bookshop concept to a wider concept where all the
schools’, teachers’, and students’ needs were met. Hussain was able to explore much more business
opportunities from the school by convincing his teachers to buy from his bookshop.
HOW DREAMS DIE FIRST: THE SUDDEN FIRE
Hussain was joyful with the incorporation of various school products like pens, notebooks, staplers,
and box fi les in his bookshop, which catered to the needs of the school children as well as the
teachers. Moreover, he got good profits as his bookshop became popular among the schools as well as
the parents. Unfortunately this success formula did not last for long. Due to an electrical short circuit, a
big fi re spread in the market, so more than 14 shops were totally damaged and Hussain’s bookshop
was damaged, too. Hussain was shocked when he heard the news. During those days, there was no
insurance company where people were secured against such disasters. He couldn’t fulfil his vision of a
better business and maximization of profi ts. All his keen efforts in the materialization of his dreams
faced a setback. However, Hussain, was well experienced in facing the challenges and coping with
those difficult situations with a more pragmatic outlook. All along, Hussain was continuing his
education with a business option. He was maintaining these the two activities equally well. Actually,
those were the days he wanted to complete his secondary education. He decided to concentrate more in
education for the time being, to complete his fi rst activity, where he had invested his energy and time.
Therefore, he stopped any action on the restructuring of the business till he finished his final exams.
The school management also felt sorry for the disaster that Hussain suffered. After he had finished his

www.theinternationaljournal.org > RJCBS: Volume: 02, Number: 01, November-2012 Page 59
final exams, Hussain reinvested his savings to restart the same business. Hussain found a good place
close to various schools and re-started his business of supplying educational goods. During the
following academic year, he got a huge demand from many schools as he became close to most of the
schools. Husain had two assistants to run the bookshop. The business started picking up once again.
He had come up with flying colors even in the midst of all turbulences in his life.
KNOCK ON THE DOOR FOR MORE OPPORTUNITIES THAN SIT IDLE
Meanwhile he applied to work in the government. The post of a store keeper has helped him a lot. He
could convince his sponsor to supply him with the needed Office stationery at a low price. His boss
was convinced with the idea. Furthermore, he convinced his friends in other ministries to get supplies
from the same bookshop at low prices. During that period, the market was slowly picking up. Such
products were sold in many places. There was no specific buyer for the stationery with a good system
in servicing orders and delivering products. Therefore, the bookshop became the only Office supplier
for the government offices. By that time, many government departments, offices, and companies
became valuable customers for the bookshop. The high growth in demand led to an expansion of four
times its first size, and it moved to a better location in the market. Obviously, with the old paperwork,
where the technology had not yet taken place, the work was overloaded for a sole proprietor of the
bookshop to handle a huge number of transactions.
THREE PROBLEMS LED TO AN OPPORTUNITY
The first problem was the overload capacity, the huge demand, and less staff that led to a decrease in
the customer-service quality. Many orders were fulfilled wrongly. Because they were involved in
serving customers, the staff could not focus properly on the orders received by phone and fax.
The second problem was price management. Hussain’s strategy was to purchase stationery in bulk
from Dubai. Although he could depend on others, he drove for five hours to Dubai on a weekly basis.
The third problem was that due to the increasing demand, he was unable to meet all the requests on
time. This was due to the lack of financial ability to lease appropriate storage to keep larger quantities.
The change of the bookshop concept from selling books only to cover all the educational purposes was
his main concern. The big demand created pressure in achieving this goal. However, he realized his
three problems, which could be summarized in three needs: managing customers’ orders in proper
ways, avoiding travelling to Dubai and finding another outsource to import the product, and making
use of the space in his big store. China was his new destination. This would reduce the cost of the
products and gain a good profit besides avoiding travelling to Dubai.But the big stores would ensure
extra cost, therefore, he started to look for a financing resource. Because of the lack of a guarantee
pledge, all his attempts failed. No bank accepted his application as he did not have any clear financial
position to borrow from any of them. He had 50 percent of the amount required to cover the purchase
in bulk from China as he planned. Therefore, he decided to somehow get hold of the money required.
When he failed to find financial support, he decided to sell the bookshop and the pickup truck. Due to
the bookshop’s good reputation in the market, Hussain sold it at a high price. Therefore, he did not
need to borrow from the bank. Hussain was able to know what the strength of his business was, who
his valuable customers were, and who his good employees were. Therefore, before selling the
bookshop, he convinced the dedicated and honest staff that he would soon reopen the same bookshop,
but with a new innovative look. Moreover, he looked at his customers’ records such as government
departments and companies. These records included all the addresses, phones and fax numbers,
people’s names, and types of products they would order. These aspects are considered as an asset to
any organization. He realized that without building a good relationship one would not gain profits.
Further he believed that building a good relationship would be possible only with valuable customers
and effective employees. Therefore, he repeated what he had done when he was a boy, when he

www.theinternationaljournal.org > RJCBS: Volume: 02, Number: 01, November-2012 Page 60
distributed chocolates and announced his new business. Therefore, he did pre-marketing to his
valuable customers.
He contacted his valuable customers and informed them of his new option of setting up a company
which specialized in stationery which would meet the needs of the entire market. It would be the first
company in this area.
THE RENAISSANCE
Husain established his new company for office supplies near the bookshop. He decided to leave his
job, as the new project would take all his time. He rented a small offi ce equipped with fax and
telephone, and he had two employees only. He found a appropriate store in a cheap location, not far
from the office, with two workers. This change reduced the cost to the lowest. Hussain started buying
stationery from abroad. His revenues and profits dramatically increased. The customer service was
well managed accurately by applying JIT techniques as the company focused only on wholesale
orders.
NEW CHALLENGE
His ex-bookshop did not last for long. It only lasted three months until it was closed due to a shortfall
in its income. The bookshop buyer did not realize the failure causes. Therefore, he sold it immediately
to cover part of his losses. The same loss scenario was repeated with the new buyer. The bookshop was
permanently closed. As he liked serving the education field he leased the ex-bookshop location but this
time at a lower rent because of the struggle faced by the previous buyers of the bookshop. He reopened
the bookshop but in an innovative way where he provided all the educational products required by the
individuals. He closed the new office and relocated it inside the bookshop for serving wholesale orders
only, and the bookshop served individual customers as well. This action served both types of
customers. Furthermore, all the products displayed in the bookshop shelves, facilitated the wholesale
buyers to see the products and test them before placing orders. This action provided another advantage
to the wholesale buyers, and reduced costs.
ADOPTION OF TECHNOLOGY FOR POTENTIAL BUSINESS GROWTH
Hussain improved the bookshop capacity by making use of the new technology that had just entered
the country. Computer with Windows95 was a solution to feed all customers’ data, accelerate the
delivery of customer’s orders, and get typed invoices. During those days, most of the offices were not
equipped with computers. Hussain was one of the first persons who brought this technology to his
bookshop. This reduced the time of every transaction they fulfilled. All the above innovative ideas
were the reasons behind his success. Hussain felt that he had achieved his dream as he was able to
convert the bookshop into a big company for office supplies. Hussain felt that he could provide new
office equipment such as photocopiers, printers, and other related devices. At this time, there was an
indication of growth in many industries. The business in high-tech products started to be promising.
Being one of the founders and contributors of the technological infrastructure base in Oman, it was a
good opportunity to develop his business.
SOLVING PROBLEM THROUGH A FOOLISH SOLUTION! “WEAKNESS MAKES
STRENGTH”
Hussain was also involved in other businesses ventures. He was busy and he could not run his
business. Therefore, he preferred to delegate and hand over all his responsibilities to his son who had
just graduated. His son had a degree in Business Administration, but he did not have any experience.
Hussain’s son was ambitious, so he immediately started an expansion strategy without having a proper
www.theinternationaljournal.org > RJCBS: Volume: 02, Number: 01, November-2012 Page 61
study of the financial recourses, human resources, operational knowledge and market intelligence. He
signed post-dated cheques to many companies. He was unable to provide sufficient funds as the sales
dramatically were decreasing to the lowest level. The company went from bad to worse. Hussain was
informed about the matter, and he reacted positively to the matter. He immediately reflected on his
success. He learnt from his accumulated experiences that his weakness was the resource of his
strength. Therefore, he did not panic as he was sure that there should be some solution to the problem.
RISK MANAGEMENT
Hussain’s bank balance was enough to solve his son’s problems, but he refused to help him. Instead,
he joined him in Dubai to attend a businessmen’s conference. This was another business opportunity
that Hussain was looking forward to. There were a few traders who attended that conference. They met
representatives from the Xerox Global Solutions (XGS) Group and many other companies. Hussain
and his son looked for business opportunities but due to his son’s financial problem, they could not
attract any partnership opportunity. Therefore, they signed agency agreements with many companies.
However, most of the companies agreed to deliver their products to Hussain in return for post dated
cheques. “How do you sign other postdated cheques?” We have 24 cheques returned due to
“insufficient funds” for a total of OMR.175000,” Hussain’s son asked. “That is true but this is another
opportunity son, and there is a good demand for such products and our expansion will have reasonable
justification” Hussain confidently replied. Hussain did not wait to solve the existing problem. Instead
he came with a foolish idea as his son and many people might have seen. Hussain made use of all the
expansion and his son prepared to enhance the new opportunity. Due to Hussain’s good knowledge, he
took a high risk as he had struggled in the company due to lower growth in sales, liquidity problems
taking place, and many postdated cheques returned due to insufficient funds. Hussain successfully
investigated the matter and realized that recruitment was not fixed properly, especially in the
marketing department. Therefore, he made many changes in his company aiming to improve its
marketing efficiency.
THE SUCCESSFUL STEPS OF A LEARNED ENTREPRENEUR
Hussain evolved a performance-basis structured programme for the salesmen in the company. This
programme showed remarkable growth. In a few years, he achieved extraordinary growth. As a result
he gained respect from many companies and manufacturers. Hussain became a major supplier of
stationery and office supplies, photocopy paper for every brand of copier, printer, and multi-function
devices. A few years later, another expansion took place and the company was awarded the Quality
Certificate ISO 9001:2000. Today, the office is an agent of many international IT, and office
technology giants such as, Xerox Brother International, Lexmark, Kodak, Benq and Optoma. Today,
the company provides the following services: office supplies, production printing, copying, graphic
arts, and document management technology, fax machines and the P-Touch labelling systems used in
offices and homes. The company provides both types of printers for Network and Wi-Fi. The company
has different products whose prices range from the cheap home printer to the sophisticated home/office
devices. The company offers digital LCD projectors, audio and video conferencing by Konftel. It
provides a range of screens, PA systems, and Smart. These are just examples of the companies which
Hussain’s company deals with. Today, customers expect ease of use, less consumption cost, reliability,
excellent services and professional maintenance support. Hussain always provides solutions that
exceed all expectations. Hussain was able to attract the Xerox Global Solutions (XGS) group. This
group outsourced solutions for Archiving, Enterprise and Digitizing Document Management Solutions
(EDMS), providing innovative Enterprise-wide total solutions for all needs. Hussain was able to bring
the Access, Security, Control and CCTV with products and support from Bosch, Gallagher, Zicom,
Miditec, RCS, and a host of other international specialists in Security and Time & Attendance systems.
Hussain became a well-known person worldwide, American Science and Engineering, AS & E
manufactures, patented the Z-Backscatter Technology. It has a range of surveillance vehicles with

www.theinternationaljournal.org > RJCBS: Volume: 02, Number: 01, November-2012 Page 62
baggage scanners that are capable of detecting metals. Hussain was able to bring specialty to the
company though the Point-of-Sale field (POS) solutions. His partner was VeriFone, the world’s largest
manufacturer and supplier of POS solutions. All major banks and the petroleum retailers are the
customers receiving Verifone Terminals and solutions in Oman. Hussain Service and Customer Care
network is expanding and is available in many states. Oman’s such as the capital area, Sur, Nizwa,
Sohar, and Salalah each have a branch. The company has developed an extraordinary customer base in
the government and private sectors and has earned client loyalty.
Today, Hussain has become an icon in the business for both entrepreneurial and leadership fields. He
is the CEO of the Oman Cable Company. In addition, he has an ownership in many companies and has
board memberships in many companies.
PREPARATORY REFERENCES:
[1] Brockhaus, R, H. “Risk Taking Propensity of Entrepreneur”. Academy of Management Journal,
vol. 3 no. 3, pp. 509-520, 1980.
[2] Drucker, P. F. Tasks, responsibilities, practices. New York, NY: Harper & Row, 45, 1974.
[3] Hisrich, R.D., Michael P. P. & Shepherd, D. A. Entrepreneurship. 6 eds. New York: McGraw-Hill
Irwin, 2005.
[4] Knight, G. “Entrepreneurship and marketing strategy: The SME under globalization”. Journal of
International Marketing, vol. 8, no. 2, pp. 12-32, 2000.
[5] Koh. Testing Hypothesis of Entrepreneurial Characteristics, A Study of Hongkong MBA Students.
Journal of Managerial Psychology, vol. 11, no. 3, pp. 12- 26, 1996.
[6] Lee, S.M. & Peterson, S.J. “Culture, entrepreneurial orientation, and global competitiveness”.
Journal of World Business, vol. 35, no. 4, pp. 401-16, 2000.
[7] Naman J.L. & Slevin D.P. “Entrepreneurship and the concept of fit: A model and empirical tests”.
Strategic Management Journal, vol. 14, no. 2, pp. 137-153, 1993.
[8] Okpara, F. O. (2000) Entrepreneurship (Text and Cases). Enugu: Precision Publishers Ltd.
9] Peters, T. W. & Waterman, R. H., In Search of Excellence, New York: Harper & Row, 1982.
[10] Richard L. O. “The essence of entrepreneurial success. Management Decision”, vol. 33, no. 7,
pp. 4 – 9, 1995.
[2] Say J.B. (1803). In Nagarajan (2009). “Nagarajan A History of Entrepreneurship”. International
Journal of Business and Social Science, vol. 2, no. 9. [Special Issue - May 2011]
[2] Soyibo, A. “The Concept of Entrepreneurship.” In: Mike D. (2011). “Entrepreneurship
opportunities and challenges in Nigeria”. Business and Management Review,vol.1 , no. 1,pp. 41-48,
March, 2011.
BOOKS FOR ADDITIONAL READING
[1] Charles, E. B & Garry, D. B. Entrepreneurship: A Small Business Approach. Mc Graw Hill
International Edition.New Yor, 2011.
[2] Cynthia, L. G. (2007). Entrepreneurship: Ideas in Action. South Western Cengage Learning.
Mason, USA, (2007).
[3] John, B. & Joe, T. Innovation and Entrepreneurship (2nd
Edn). John Wiley and Sons Ltd, 2011.
[4] Thomas, W. Z. & Norman M. S. Essentials of Entrepreneurship and Small Business Management.
International Edition 3rd (Edn). Pearson Education, New jersey, 2002.
[5] Silke S. (2009). The Entrepreneur as Business Leader. Edward Elagar (EE) publication.
Northampton, MA. UK, 2002.

www.theinternationaljournal.org > RJCBS: Volume: 02, Number: 01, November-2012 Page 63
A Study on Import Scenario of Colored Gemstone and Diamonds in India
Dr.Kalpana Agrawal, Assistant Professor, Prestige Institute of Management and Research
Mitisha Agrawal, Prestige Institute of Management and Research
Abstract
Gems and Jewellery is being consumed by Indians for ages for its aesthetic as well as investment value
and also form an essential part of the tradition .We import rough diamonds, cuts and polishes them,
and then exports them. Gem and jewellery sector which is a powerful engine, driving India's export-led
growth. As per the latest import-export statistics released by the Gems and Jewellery Export
Promotion Council (GJEPC), imports of polished diamonds declined by huge 59% to $944.93 million
by value, and by 52% to 1.966 million carats by volume in January 2012 compared to same month
previous year. Last year, the import of polished diamond in January 2011 was $.2.2 billion in value
and 4.7 million carats in volume. While, polished diamond export in January-2012 fell 19% year-on-
year to $1.7 billion and declined by 37% by volume at 3.32 million carats compared to the same month
in previous year. On the same time, rough diamond import increased by 7% to $1 billion in January,
while the rough exports surged 45% to 153.27 million compared to the same month in previous year.
The present study is an attempt to comprehend the import scenario of colored gems and diamonds in
India and to observe their future import trend in India.
Introduction
A gemstone or gem (also called a precious or semi-precious stone, a fine gem, or jewel) is a piece
of mineral, which, in cut and polished form, is used to make jewellery or other adornments. However
certain rocks, (such as lapis lazuli) and organic materials (such as amber or jet) are not minerals, but
are still used for jewelry, and are therefore often considered being gemstones as well. Most gemstones
are hard, but some soft minerals are used in jewelry because of their luster or other physical properties
that have aesthetic value. Rarity is another characteristic that lends value to a gemstone.Jewellery is
made from variety of material. Jewellery can be carved out of stones or made from various other
minerals and metals. Jewellery are also rare pieces of belongings and their value is derived from the
material used like gold, silver , platinum etc and also the stones like diamond , ruby , sapphire , quartz
etc. Jewellery has been in use since ages. India being a very old and rich country was also known as
‘the golden bird’. Since India was ruled by many rulers if different cultures and also India was invaded
by many countries, their impact can be seen on the Indian jewellery.
India is a leading player in the global gems and jewellery market. The gems and jewellery industry
occupies an important position in the Indian economy. It is a leading foreign exchange earner, as well
as one of the fastest growing industries in the country. The two major segments of the sector in India
are gold jewellery and diamonds. Gold jewellery forms around 80 per cent of the Indian jewellery
market, with the balance comprising fabricated studded jewellery that includes diamond studded as
well as gemstone studded jewellery. Major portions of the rough, uncut diamonds processed in India
are exported, either in the form of polished diamonds or finished diamond jewellery. The Indian gems
and jewellery industry is competitive in the world market due to its low cost of production and the
availability of skilled labor. In addition, the industry has set up a worldwide distribution network, of
more than 3,000 offices for the promotion and marketing of Indian diamonds. The Indian diamond
industry has the world's largest cutting and polishing industry, employing around 800,000 people
(constituting 94 per cent of global workers) with more than 500 hi-tech laser machines. The industry is
well supported by government policies and the banking sector with around 50 banks providing nearly
$3 billion of credit to the Indian diamond industry

www.theinternationaljournal.org > RJCBS: Volume: 02, Number: 01, November-2012 Page 64
Review of literature
India has always excelled in the field of diamond cutting, gem cutting, polishing and processing.
India’s diamond tradition goes back thousands of years and is one of the oldest in the world. In fact, it
was reported that diamonds were discovered by India and were the only source of diamonds until
1730s. At present, India is one of the world’s leading diamond cutting and polishing centers in the
world. According to USGS data , diamond production ( gem and industrial) in India in the year
2007 Was 55 thousand carats and has remained more or less stagnant over the years. As per United
Nations Framework Classification (UNFC) system, as on 1.4.2005, India had total resources of around
4.5 million carats, of which 1.2 million carats was reserves. By grades, about 17%of resources are of
gem variety, 18% are of industrial variety, while bulk of the resources (65%) is placed under
unclassified category. Andhra Pradesh accounts for 40% of diamond resources, followed by
Madhya Pradesh and Chhattisgarh (28%) .Gujarat is one of the major states in India promoting gems
and jewellery sector as one of the thrust areas for development . Gujarat having the largest human
resource pool in the country in diamond cutting and polishing, accounts for 80% of the total diamonds
processed in India. India imports rough diamonds and process them for value addition and exports. As
a result, India is a net exporter under this category in value terms .India exported diamonds valued
US$ 14.2 billion during 2007-08, an increase of 34%over the previous year. India imported diamonds
valued US $ 7.7 billion in 2007-08; during t h e year 2008-09 , the imports increased by 110% from
US $ 7.7 billion to US $ 16.3 billion. In the case of diamond exports, major destinations include: Hong
Kong (30.1%), UAE (22.5%), USA(17.6%), Belgium(11.4%) and Israel (5.0%). As regards diamond
imports, Hong Kong (27.6%), UAE (25.6%), UK (6.4%), and USA (4.8%) were the major source
countries for India.
Precious Stones
Gems or precious stones have fascinated mankind since ancient times. Precious stones are not only
adorned as the items associated with royalty, they are considered as valuable gifts along with gold. The
role played by precious and semiprecious stones in Indian mythology and society is well-known. In
India, people, for astrological reasons, have used gems as they are considered to be influencing various
planetary positions, which in turn are believed to be influencing human life cycle and human destiny.
Gems are also used in preparation of some ayurvedic medicines .
Indian gemologists have identified around 84 precious and semi -precious stones, amongst them 9
stones namely: Ruby, Emerald, Pearl, Diamond, Red coral, Zircon, Blue sapphire, Yellow sapphire,
and Cat’s Eye, form the ‘Navratnas’ or nine gems. India was more an exporter of precious stones than
an importer of the same, and the difference between these two being minimal. During 2007- 08, the
exports of precious stones were US $ 280.8million, an increase of 6.5% over the previous year, and in
the year 2008-09 , exports of precious stones witnessed a marginal decline of (-)0.1%, over the
previous year. Import of precious stones has grown marginally; during the year 2008-09 imports grew
by 4.6% over the previous year. The source countries for colored gemstones include Thailand (23.3%),
Hong Kong (19.1%), and Zambia (13.9%). In the case of articles of precious stones other than
diamonds (natural/ synthetic), the major export destinations include: USA (38.8%), Germany (23.9%),
and Switzerland (9%), and the source countries for the same include: Hong Kong (27.8%), Sri Lanka
(22.2%), and Germany (16.7%).
Rationale of the study
The gems and jewellery sector has been one of the fastest-growing sectors in India in the past few
years. The sector has gained global popularity because of its talented craftsmen, its superior practices
in cutting and polishing fine diamonds and precious stones, and its cost-efficiencies.

www.theinternationaljournal.org > RJCBS: Volume: 02, Number: 01, November-2012 Page 65
The gems and jewellery sector in India is engaged in sourcing, manufacturing, and processing, which
involves cutting, polishing and selling precious gemstones and metals such as diamonds, other
precious stones, gold, silver and platinum. The past and present statistical data will a provide a
platform for colored gems and jewellery from India. This study will explore the trends being
undertaken in import of colored gemstones in India.
Objectives of the study:
To analyze the present import scenario of colored gemstone in India.
To forecast the future trend of import of colored gemstones in India.
To analyze the present import scenario of diamonds in India.
To forecast the future trend of import of diamonds in India.
To do the SWOT of the Industry.
Research Methodology
The universe of research was IMPORT POTENTIAL OF COLORED GEMSTONES IN INDIA. The
period of study was from 2002 to 2011 spanning 10 years and future predictions for next 5 years. The
study was descriptive in nature and was based on secondary data. The data was collected from various
secondary sources like books, journals, trade journals, internet sources, official websites like
commerce.nic.in, etc. Descriptive statistics along with trend analysis was used for forecasting.
The Study
The study is analytical in nature and it aims to know the import potential of colored gemstones and
diamonds in India.
The Sample
The sample includes the import data collected through the secondary sources for the period of last ten
years (2002-2011).
The Tools
Tools for data collection:
Secondary data was used as a source of data collection. It includes internet, trade journals, official
government websites and whichever applicable and usable in the study.
Tools for data analysis:
The data for the period 2002-2011 depicting the import of colored gemstones and diamonds in India
were analyzed using Trend analysis method.

www.theinternationaljournal.org > RJCBS: Volume: 02, Number: 01, November-2012 Page 66
Results :
Table 1.1 Shows The Trend Values of Import Potential of Diamonds.
Source: Ministry of commerce, government of India (www.commere.nic.in ), import of diamonds
Graph 1.1: Shows total import value and trend value of import of diamonds.
0
5000000
10000000
15000000
20000000
25000000
1 2 3 4 5 6 7 8 9 10 11 12 13 14 15
Year
Total import
Trend Value
Year Total Import Trend Value
2002 2163607.0 2099770.764
2003 2893489.0 2481916.738
2004 3227394.0 2933611.041
2005 4179216.0 3467511.059
2006 3964639.0 4098577.752
2007 3309165.0 4844494.884
2008 3124589.0 5726164.564
2009 7845161.0 6768292.959
2010 7440230.0 8000082.614
2011 15274190.0 9456050.769
2012 11176996.595
2013 13211144.477
2014 15615495.353
2015 18457423.998
2016 21816567.004
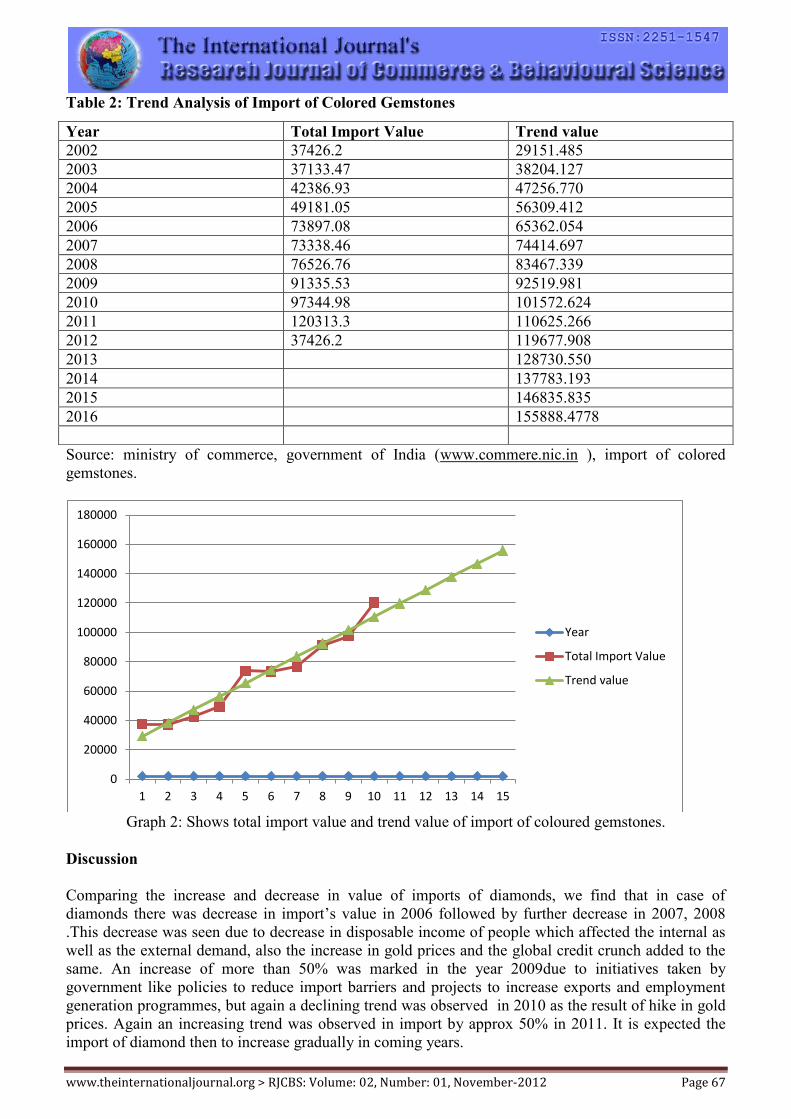
www.theinternationaljournal.org > RJCBS: Volume: 02, Number: 01, November-2012 Page 67
Table 2: Trend Analysis of Import of Colored Gemstones
Source: ministry of commerce, government of India (www.commere.nic.in ), import of colored
gemstones.
Graph 2: Shows total import value and trend value of import of coloured gemstones.
Discussion
Comparing the increase and decrease in value of imports of diamonds, we find that in case of
diamonds there was decrease in import’s value in 2006 followed by further decrease in 2007, 2008
.This decrease was seen due to decrease in disposable income of people which affected the internal as
well as the external demand, also the increase in gold prices and the global credit crunch added to the
same. An increase of more than 50% was marked in the year 2009due to initiatives taken by
government like policies to reduce import barriers and projects to increase exports and employment
generation programmes, but again a declining trend was observed in 2010 as the result of hike in gold
prices. Again an increasing trend was observed in import by approx 50% in 2011. It is expected the
import of diamond then to increase gradually in coming years.
0
20000
40000
60000
80000
100000
120000
140000
160000
180000
1 2 3 4 5 6 7 8 9 10 11 12 13 14 15
Year
Total Import Value
Trend value
Year Total Import Value Trend value
2002 37426.2 29151.485
2003 37133.47 38204.127
2004 42386.93 47256.770
2005 49181.05 56309.412
2006 73897.08 65362.054
2007 73338.46 74414.697
2008 76526.76 83467.339
2009 91335.53 92519.981
2010 97344.98 101572.624
2011 120313.3 110625.266
2012 37426.2 119677.908
2013 128730.550
2014 137783.193
2015 146835.835
2016 155888.4778

www.theinternationaljournal.org > RJCBS: Volume: 02, Number: 01, November-2012 Page 68
In case of gemstones, an increase in import of gemstones is seen upto 2011due relaxation in import
policy by government, increase in price of gold and diamond jewellery made jewellery of
semiprecious stones more attractive to common people. The import value of colored gemstones is
expected to increase in coming years.
From 2009, a change was observed in Indian culture , the people became more fashion conscious, and
became more aware of astrological importance of gemstones,also the consciousness of the status and
the willingness to spend larger amounts became the major factor that affected the import potential of
precious and semi precious gems and jewelleries.
As a result, the prospects for an increase in imports of gold jewellery studded with gems and diamonds
studded gold jewellery got increased considerably. So the significant changes were observed in import
values of gems as the branded jewellery studded with gems gave ample beat to the family jewellers.
The Indian gems and jewellery industry has provided its mettle in international competitiveness.
Simultaneously, it has also made significant socio economic contributions:
1. Employment generation with low investment: The investment required for creating employment
in the diamond processing and jewellery making units is quite low. Employment generation in
other industries call for heavy investments.
2. Hard currency foreign exchange earnings: The countries to which India exports gems and
jewellery are among the hard currency areas. The industry contributes continuously to the
country’s foreign exchange reserves.
3. Pollution-free industry: diamond processing and jewellery manufacture do not pollute the
environment, neither air nor water.
4. Environmental friendly industry: being an import-based industry it does not deplete natural
resources and also leaves the flora and fauna intact.
5. Assists in urban decongestion: through decentralized location, the gems and jewellery industry
helps in the removal of unemployment in the rural sector, prevention of migration to cities and
the avoidance of slums in the urban areas.
6. Low power consumption: the gems and jewellery manufacturing processes do not aggravate the
country’s energy problems.
7. No burden on the country’s transport infrastructure: the raw materials as also the finished
products are of high-value but of low weight. They do not put any burden on the country’s road,
rail, sea or air transport.
SWOT ANALYSIS
Strength
Gems and jewelleries is one of the identified developmental category of products in which
government is willing to invest lots of capital and energy to upgrade this industry.
A wide pool of skilled labour are engaged in adding values in the raw gems and stones.
The total cost of finished gems and jewelleries is less because of cheap labour cost.
Another advantage to India is nearness to Afghanistan from where low cost import of precious
stones is possible.
Import free machinery, raw materials and input are allowed.
www.theinternationaljournal.org > RJCBS: Volume: 02, Number: 01, November-2012 Page 69
India can import duty free diamonds.
State’s liberal policy.
Continuous emphasis is given on training and skill development of young craftsmen.
Various incentives are offered to importers of jewellery manufacturers so that they expand their
business in faster manner.
Indians are specialized in traditional jewelleries and also is handicraft items, thus they import
raw gems and precious stones and add value in it and export them.
When we talk about craftsmanship, Indian labours are producing jewelleries of much smaller
sizes and the quality of cutting is incomparable in the world.
Raw gems, precious and semi precious are procured from DTC (Diamond Trading
Corporation), whereby it becomes very easy for India to buy diamonds, as India have bilateral
treaty with UK and for this we don’t have to pay any import duty on rough diamonds.
One of the greatest strength of India is gem and jewellery sector is the presence of 2000
marketing offices in various parts of the world.
Weakness
Unavailability of finance.
Financial assistance is provided but at very high rate of interest.
Illegal flow of mechanized international jewellery.
Due to illiteracy among the skilled cbv.`raftsman they are not able to add value to raw gems in
more efficient and effective way.
India does not have modern cutting and polishing machinery and expertise that leads to
increase in overall cost of production
Unnecessary extra documentation by Government agencies.
Inefficient and ineffective role of staff of customs and income tax who are creating lots of
hurdles.
Lack of distinctive and innovative designs.
Indian importers are facing big problem due to exchange rate fluctuations and inflation.
Opportunities
High growth of global demand of gems, jewelleries and diamonds.
Rising demand of oriental jewellery ( ethnic jewellery of 21-22 carats ).
Government’s liberal policies about gems and jewellery promising industrial policy.
India’s Gems and Jewellery Export Promotion Council ( GJEPC ) is aiming at turning India
into an International Diamond Trading Centre.
Threats
Loss of opportunity because of delaying tactics.
International standards on quality products.
Brand loyalty of customers may hinder a lot because India lacks in branding of gems and
jewelleries.
Conclusion
Recent changes in market structure
The Indian gem and jewellery industry is experiencing rapid changes in the last few years. A
lot of emphasis is being laid on the jewellery designing and many Indian importers and

www.theinternationaljournal.org > RJCBS: Volume: 02, Number: 01, November-2012 Page 70
exporters are engaging foreign designers for designing their collections. Indian designers are
also making a mark on the world jewellery scene and have won recognition for design
development as well.
Indian designers are learning quickly and winning awards at international competitions
reinstating the ability of the Indian industry to cater to varied markets.
More significant changes are being witnessed in the domestic jewellery market where branded
jewellery is providing ample of competition to the family jewellers.
The domestic market for branded diamond jewellery is the fastest growing segment of the gem
and jewellery market. But standardization of jewellery across the country may still not work so
well in India, as every region of India demands not just different designs but different raw
materials as well.
Indian jewellery industry is seen changing its trend due to strong western influence. Traditional
and ethnic jewellery is becoming lighter, being object of adornment rather than an investment.
In last few years, gold has lost some of its sheen as an investment option particularly in urban
India, where people are exposed to alternate forms of savings and investment like equities and
bonds. The proliferation of modern gadgetry like laptops, cell phones and white goods has
grabbed away a part of the urban Indian’s disposable income and this also affected their
investments in plain gold jewellery.
More and more consumer are experimenting with the diamond and colour stone jewellery and
it is this category, which is driving the domestic market to new high of consumption. The last
few years have also seen the entry of prominent international brands in the jewellery and watch
segment. The advent of various foreign players in the Indian retail scene has greatly affected
the design and display of the entire industry, which has become all the more creative.
On the manufacturing scene, India is being seen as the ideal market for outsourcing jewellery.
With rising costs becoming a problem in the traditional strongholds for jewellery
manufacturing in the world, India will see more and more global giants coming to India for
their jewellery requirements. Already there are talks about US companies like Wal-Mart and K
mart coming to India for their jewellery supplies.
With Indian government committed to reduce custom duties for the jewellery raw materials and
semi-finished jewellery (mountings and findings), it is becoming all the more relevant for the
foreign companies to join hands with the Indian jewellery manufacturers and thereby control
the rising jewellery manufacturing costs.
The current report on jewellery clearly brings out that while U.S. is a world leader in jewellery
imports, there is no match for India in the diamond processing. While U.S. leads the world in
jewellery design and manufacturing technology, the vast pool of skilled craftsmen are the
biggest assets for Indian the gem and jewellery sector. Thus, India with some improvement can
have cost advantage over U.S..
It is also observed that while increased competition from emerging centres of jewellery
manufacturing like Turkey ,China, Thailand, and Italy are putting pressure on the U.S.
jewellery industry, India’s formidable position as a diamond processing centre is being
challenged by emerging cutting centres like China. To overcome future challenges and further
erosion of markets to emerging markets, the two world leaders of the gem and jewellery
industry should see each other more as collaborators rather than competitors.
Suggestions
To move up in the imports of colored gemstones and diamonds , various importers and
exporters should move for forward and backward integration so that the need for strategic
alliances with the producers of rough gemstones and diamonds and retailers of jewellery can
lead to economies of scale and higher market share. It would also be advantageous for
importers of rough gemstones, diamond and jewellery

www.theinternationaljournal.org > RJCBS: Volume: 02, Number: 01, November-2012 Page 71
Efforts to be taken towards development of skills and infrastructure for India to become a
known importer of raw gems, jewelleries and diamonds to trade them by adding values in it.
The industry should adopt modern technology in cutting and polishing segments that will
increase its overall export value. Increase in exports directly affects the value of imports. It is
so because increase in exports leads to increase in imports.
Low entry barriers have resulted in ‘Not so good players’ in industry adversely affecting the
image of overall Indian importers. So, need for ‘certification’ is required.
Need to encourage corporatization in this sector as proprietary concerns/ partnership model of
governance limits the expansion this field.
Need to expand the gemstone sector by increasing its import value, it is because of the reason
that labor is cheaply and abundantly available.
The sector of jewellery is still being ignored presently. Thus, there is a need to move towards
exports by increasing imports of raw colored gemstones, diamonds and jewelleries.
India needs to integrate throughout the jewellery supply chain from mining of raw material to
the retailing of end products.
India can go for joint ventures for importing raw gemstones and diamonds to manufacture with
leading suppliers of the world such as U.S., Italy etc.
Government should change policies according to convenience of importers.
Procedural hazels should be minimized to enable importers to apply entire men, time and
energy on business.
Implications of the study
The study of import potential of colored gemstones and diamonds of India is advantageous to many
parties:
Importer
This project is helpful to importers who mainly deals in imports of raw gemstones and
diamonds in order to take advantage of potential markets available in international business.
Students of International Business
This project is helpful to study different potential markets in present global market. It is helpful
to students in getting deep knowledge about international market.
Researchers
The study of import potential of colored gemstones and diamonds of india helps researchers
who are interested in this field and provides various information related to future aspects by
considering various trend analysis.
Government
This research study has generated useful suggestions for government. If suggestions generated
on basis of study are implemented by government it will help to promote import and export of
gems and jewellery sector.
References
Webliography :
‘import potential of colored gemstones in India’ retrieved on 17/2/12 at 1:45pm.
www.eximbankofindia.com
‘ data on import of colored gemstones and diamonds in India’ retreived on 22/3/12 at 12:45pm.
www.commerce.nic.in
www.eximkey.com
www.gjepc.com
www.theinternationaljournal.org > RJCBS: Volume: 02, Number: 01, November-2012 Page 72
A Study on Export of Wheat and Documents Required
Dr. Kalpana Agrawal, Assistant Professor, Prestige Institute of Management and Research,Indore.
Ritesh Sharma, Rinita Verma, Student of Prestige Institute of Management and Research,Indore.
Abstract:
India is the second largest producer of wheat in the world, with production hovering around 68–
75 million tons for past few years. The latest estimated demand for wheat production for the year 2020
is approximately 87.5 million tons, or about 13 million tons more than the record production of
75 million tons harvested in crop season 1999–2000. Since 2000, India has struggled to match that
record production figure and thus faces a critical challenge in maintaining food security in the face of
its growing population. The current major challenges facing future wheat production in India are
increasing heat stress; dwindling water supplies for irrigation; a growing threat of new virulence of
diseases such as wheat rusts (yellow, brown, and black) and leaf blight; continuous adoption of rice-
wheat systems on around 11 million hectares; changes in urbanization patterns, and demand for better
quality wheat. In addition, the threat posed by the new stem rust race Ug99 cannot be underestimated.
The wide gap (around 2.5 t/ha) between the potential and harvested yield in the eastern Genetic Plains
also cries out for solutions. Addressing issues related to different stresses will require harnessing genes
discovered in landraces and wild relatives following conventional as well as non-conventional
approaches. For effective technology delivery in areas that suffer from poor linkages with farmers,
participatory research needs to be strengthened.
Keywords Wheat - Tritium aestivum - Wheat improvement - India - Present status - Challenges -
Future prospects
INTRODUCTION:
In the realm of food crops in the world, wheat (Triticum spp.) occupies the number one
position. India is one of the principal wheat producing and consuming countries in the world. Its
importance in Indian agriculture is second to only rice. Wheat flour based products, such as
the chapati, is part of the staple diet in most parts of India - particularly in northern India. Wheat straw
is also used for feeding cattle. The Green Revolution, which was initiated in the country in the late
1960s, has had a very significant effect in increasing the yield of wheat. The output ratio of wheat to
rice has steadily increased 1:3 to 4:5. Since 1991, the Ministry of Agriculture has been giving massive
thrust to boost its output in the country. At present Uttar Pradesh, Punjab and Haryana are the three
major wheat producing states. They account for nearly 70 per cent of the total wheat produced in the
country. Though Uttar Pradesh has the highest production In India, it lags
behind Punjab and Haryana in terms of yield. Better irrigation facilities in these states are responsible
for higher yield. In Haryana, 98 per cent of the area under wheat is irrigated and in Punjab the ratio is
96 per cent. However, in Uttar Pradesh, only 88 per cent of the area under wheat is irrigated. Wheat
output in non-traditional states is also being popularized by improving irrigation facilities and
developing seeds suitable for cultivation in these regions.
Wheat is cultivated in an area of around 25 million hectares which represents a fifth of the total area
under food grains in India. Around 80 per cent of the area under wheat is irrigated. India accounts for
about 11 per cent of the total area under wheat cultivation in the world. Efforts were initiated in 1976
to popularise the cultivation of wheat in areas, which had traditionally not cultivated it, such as West
Bengal, Kerala, Assam, Orissa and Andhra Pradesh. India is broadly divided into 5 wheat zones based
on agro-climatic conditions.

www.theinternationaljournal.org > RJCBS: Volume: 02, Number: 01, November-2012 Page 73
The wheat crop is harvested when the grains harden and the straw becomes dry and brittle. The
harvesting time varies from zone to zone and also depends whether the wheat is under irrigated
or rained conditions. The rained crop reaches harvesting stage much earlier than the irrigated crop.
However, the yields under the rainfed crops are much lower compared to the irrigated crop.
This hard wheat is cultivated in clayey soil and is highly sought after for its physical characteristics. Its
high gluten strength and uniform golden colour makes it ideal for bread making and pasta preparation
unlike the softer commercially high yielding wheat, which lacks the strength and consistency of
durum. Today, India is exporting sufficient quantities of all types of wheat and extensive research
efforts are underway for improving its cereals and grain output in the years to come. Wheat cultivation
has traditionally been dominated by the northern region of India. The northern states of Punjab and
Haryana Plains in India have been prolific wheat producers. While this cereal grass has been studied
carefully in the past, recent years of painstaking research by India's finest scientific talent has paid off
with the development of distinctly superior varieties of Durum Wheat. With a production reaching ten
times in past five years, India is today the second largest wheat producer in the whole world. Various
studies and researches show that wheat and wheat flour play an increasingly important role in the
management of India’s food economy.
Exports of wheat:
When saturation of domestic demand was observed and further compulsion of sustaining the present
market condition, the only avenue of liquidation of inventories was Exports. But disparity of domestic
and international prices were dealt with subsidized issue price which served prime objective of quick
and faster replacement, reducing carrying cost which ultimately form the major share of subsidy and
ultimately earn the foreign exchange which shall provide India a dependable supplier in the Wheat
world market.
India’s Position in World Wheat Market: (TABLE NO. 1)
Country %Share of Country
China 22
India 13
USA 13
France 7
Romania 6
Russian federation 6
Canada 5
Australia 4
Italy 4
Turkey 4
Pakistan 3
Wheat importing countries from India
Chicago (CBOT)
Canada (Winnipeg commodity exchange)
Kansas (Kansas city board of trade)
Missouri
Japan
Australia
Bulgaria (Sofia commodity exchange)
China

www.theinternationaljournal.org > RJCBS: Volume: 02, Number: 01, November-2012 Page 74
Production of wheat:
Wheat is one of the most important staple food grains of human race. India produces about 70 million
tons of wheat per year or about 12 per cent of world production. It is now the second largest producer
of wheat in the world. Being the second largest in population, it is also the second largest in wheat
consumption after China, with a huge and growing wheat demand. Wheat is one of the most important
staple food grains of human race. India produces about 70 million tons of wheat per year or about 12
per cent of world production. It is now the second largest producer of wheat in the world. Being the
second largest in population, it is also the second largest in wheat consumption after China, with a
huge and growing wheat demand.
YEAR TY PRODUCTION UNIT OF MEASURE GROWTH RATE
2002 72770 (1000 MT) 4.43%
2003 65760 (1000 MT) -9.63%
2004 72150 (1000 MT) 9.72%
2005 68640 (1000 MT) -4.86%
2006 69350 (1000 MT) 1.03%
2007 75810 (1000 MT) 9.32%
2008 78570 (1000 MT) 3.64%
2009 80680 (1000 MT) 2.69%
2010 80800 (1000 MT) 0.15%
2011 85930 (1000 MT) 6.35%
2012 85133.333 (1000 MT) 5.10%
2013 86967.394 (1000 MT) 5.61%
2014 88801.455 (1000 MT) 6.12%
2015 90635.515 (1000 MT) 6.63%
2016 92469.576 (1000 MT) 7.14%
2017 94303.636 (1000 MT) 7.65%
2018 96137.697 (1000 MT) 8.17%
2019 97971.758 (1000 MT) 8.68%
2020 99805.818 (1000 MT) 9.19%
(TABLE NO. 2)
-15.00%
-10.00%
-5.00%
0.00%
5.00%
10.00%
15.00%
0 5 10 15 20 Series1

www.theinternationaljournal.org > RJCBS: Volume: 02, Number: 01, November-2012 Page 75
Government Policy Regarding Wheat:- Since wheat prices at procurement level and at disposal level are placed under controlled mechanism
with defined objectivity, scope of general price trend analysis also becomes govt. policies centric. The
related price in the open market has got a substantial relationship with the prices of wheat traded in the
open market. Therefore this aspect has a notion that the price elasticity of demand has got direct
relationship on prices of wheat of other varieties (whatsoever be the size of share in total production).
However availability of targeted variety (Mexican/Dara) wheat shall increase, if Govt. withdraws
gradually from procurement at MSP; in the open market, which shall concede volatility.
Geographical Area under Wheat Cultivation:
It is cultivated from a sea level up to even 10,000 feet. More than 95 percent of the wheat area in India
is situated north of a line drawn from Bombay to Calcutta and also in Mysore and Madras in small
amounts.
The Major Wheat producing states in India is placed in the Northern hemisphere of the country with
UP, Punjab and Haryana contributing to nearly 80% of the total wheat production.
Achievements of Indian wheat programme:
372 wheat varieties released in the country since 1965
119 genetic stocks for various traits
Advanced production technologies with eco-sustainability through resource conservation
The crop protection strategies acted as barrier to disease havoc since last 4 decades
Germplasm enrichment and sharing across the country
Infrastructure created to produce more around 30,000q of breeder seed
Quality parameters standardized for specific products
Strengthening the wheat research to partner countries for global food security
Sound international linkages
Documentation:
An exporter without any commercial contract is completely exposed of foreign exchange risks that
arises due to the probability of an adverse change in exchange rates. Therefore, it becomes important
for the exporter to gain some knowledge about the foreign exchange rates, quoting of exchange rates
and various factors determining the exchange rates. In this section, we have discussed various topics
related to foreign exchange rates in detail. Export from India required special document depending
upon the type of product and destination to be exported. Export Documents not only gives detail about
the product and its destination port but are also used for the purpose of taxation and quality control
inspection certification.
Shipping Bill / Bill of Export:
Shipping Bill/ Bill of Export is the main document required by the Customs Authority for allowing
shipment. A shipping bill is issued by the shipping agent and represents some kind of certificate for
all parties, included ship's owner, seller, buyer and some other parties. For each one represents a
kind of certificate document. Documents Required for Post Parcel Customs Clearance
In case of Post Parcel, no Shipping Bill is required. The relevant documents are mentioned below:
Customs Declaration Form:
It is prescribed by the Universal Postal Union (UPU) and international apex body coordinating
activities of national postal administration. It is known by the code number CP2/ CP3 and to be
prepared in quadruplicate, signed by the sender.
Dispatch Note-
It is filled by the exporter to specify the action to be taken by the postal department at the
destination in case the address is non-traceable or the parcel is refused to be accepted.

www.theinternationaljournal.org > RJCBS: Volume: 02, Number: 01, November-2012 Page 76
Commercial Invoice –
Issued by the exporter for the full realisable amount of goods as per trade term
Consular Invoice –
Mainly needed for the countries like Kenya , Uganda, Tanzania, Mauritius, New Zealand, Burma,
Iraq, Ausatralia, Fiji, Cyprus, Nigeria, Ghana, Zanzibar etc. It is prepared in the prescribed format
and is signed / certified by the counsel of the importing country located in the country of export.
Customs Invoice –
Mainly needed for the countries like USA , Canada, etc. It is prepared on a special form being
presented by the Customs authorities of the importing country. It facilitates entry of goods in the
importing country at preferential tariff rate.
Legalised / Visaed Invoice –
This shows the seller's genuineness before the appropriate consulate or chamber or commerce/
embassy.
Certified Invoice-
It is required when the exporter needs to certify on the invoice that the goods are of a particular
origin or manufactured/ packed at a particular place and in accordance with specific contract. Sight
Draft and Usance Draft are available for this. Sight Draft is required when the exporter expects
immediate payment and Usance Draft is required for credit delivery.
Packing List –
It shows the details of goods contained in each parcel / shipment.
Certificate of Inspection–
It is a type of document describing the condition of goods and confirming that they have been
inspected.
Manufacturer's Certificate-
It is required in addition to the Certificate of Origin for few countries to show that the goods
shipped have actually been manufactured and is available.
Certificate of Chemical Analysis-
It is required to ensure the quality and grade of certain items such as metallic ores, pigments, etc.
Certificate of Shipment-
It signifies that a certain lot of goods have been shipped.
Health/ Veterinary/ Sanitary Certification –
Required for export of foodstuffs, marine products, hides, livestock etc.
Certificate of Conditioning-
It is issued by the competent office to certify compliance of humidity factor, dry weight, etc.
Shipping Order-
Issued by the Shipping (Conference) Line which intimates the exporter about the reservation of
space of shipment of cargo through the specific vessel from a specified port and on a specified
date.
Literature review:-
According to Mishra (2004) slow growth in total wheat production up to 1965 necessitated a large-
scale grain import by India under the PL480 system. The series of agricultural changes following the
utilization and exploitation of Norin 10 dwarfing gene in wheat after 1965 was called “green
revolution”, the impact of green revolution made India self-sufficient in food grain production. The
80’s witnessed quantum jump of wheat production making India worth of stockpiling adequate buffer
stock to thwart the adverse weather and other calamities.
Wheat production is now seeking a turning point towards keeping the wheat price and supply
affordable for more than 240 million people below the poverty line. The Indian council of agriculture
research (ICAR) having taken into cognizance the previous efforts, struggled to increase the
productivity, concern the augment and sustain what has been achieved, issued the directives and
guidance to develop the vision for research mandate to adopt in the forthcoming decades.
www.theinternationaljournal.org > RJCBS: Volume: 02, Number: 01, November-2012 Page 77
According to Kumbhar (2007), agriculture is the main occupation of the Indian people. Performance of
Indian economy is dependent upon the growth of agriculture sector. It contributes nearly 16% of
India’s gross domestic product (GDP) and 13% of total export. It provides employment to 52% of the
countries work force and livelihood security to more than 620 million people. Agriculture plays an
important role in economies development, such as provision of food to the nation, enlarging exports,
transfer of manpower to non-agriculture sector, contribution to capital formation, and securing markets
for industrialization. Agriculture forms the backbone of Indian economy and even though large
industraliasation in last 60 year, agriculture still occupies a place of pleasure.
Ahmed and Rustagi (2004) emphasised that liberalization of Indian economy has opened immense
opportunities for exports of agriculture products. GCC countries are heavily dependent on import of
agriculture commodities to fulfill the needs of rapidly growing population. Due to geographical
proximity to GCC countries and natural comparative advantages to Indian farmers there is a large
scope for exports of agriculture commodities to GCC.
Mitra and Ghosh (2008) found that agricultural exports from developing countries are facing stringent
barriers in the form of sanitary and phytosanitary measures as well as technical barriers in the form of
sanitary and phytosanitary measures as well as technical barriers: the need of the hour, therefore, is to
develop robust agricultural exporting zones (AZEs) to promote organic cultivation of exportable
produce. The analysis of the future growth potential of AEZs in India is based on two planks: a
theoretical cost benefit analysis and a case study approach. The theoretical cost benefit analysis
highlight the tradeoff between factors that enhance profitability on the one hand and other that lead to
a reduction in profitability.
Venkatraman and Prahaladachar (1981) estimated and analyzed the growth rate in area, yielding and
output of major crops in six states including Bihar, for the period 1950-51 to 1974 to 1975 and also the
impact of growth rates on cropping pattern in these states. In Bihar, the review of cropping pattern
changes during 1950 to 1975 indicated that within the cereals rice, maize and wheat gained in area
whereas barley lost in area. In the cropping pattern the relative importance of wheat and maize
improved from 6 to 15 per cent and 6 to 18 per cent, respectively. The output growth rate during the
period 1950 to 1975 was highest for wheat (9.5%), followed by maize (3.7%).
SyeedaKhatoon (2005) in his study found that Indian agricultural has been hit hard during post WTO
period (1995-2005). The share of agro goods in India’s global export has declined during this period.
During post WTO period, agricultural subsidies of developed countries have been rather increased.
Therefore it is very difficult for India to face global agricultural competitiveness. In this scenario, the
global agricultural trade would likely to become oligopolistic. The returns of various crops have
declined due to increase in cost of production, slow growth of agricultural productivity, weak
marketing mechanism, increase in input intensity and fall of water table. As a result farmers have
become highly indebted and resorting to suicides. In the near future also the total quantum of exports
particularly agriculture and light manufacturing goods cannot be raised significantly in the global
market in the near future because of limited and uncertain domestic export surplus and particularly
their inelastic demand at world market. In other words, Indian exports were considered to be supply
constrained and also were not responsive to relative price changes at the global level. Raising the
levels of productivity and quality standards to internationally competitive level is one of the major
challenges following the dismantling of quantitative restriction on imports, as per the WTO agreement
on agriculture.
Mitra (2007) contended that given the slow growth of wheat in the recent past, the increased provision
for agricultural infrastructure is an essential prerequisite not only for inclusive growth but also for
sustained reduction in the propensity to import food will imply that more earned income are ploughed
back into the economy and subjected to the multiplies.

www.theinternationaljournal.org > RJCBS: Volume: 02, Number: 01, November-2012 Page 78
Objectives of the study:-
To study the trend of export of wheat from India.
To study the documents required for the export of wheat.
To study the problems faced by exporters of wheat.
Research Methodology
The Study:
The present study was undertaken to comprehend the export of wheat from India and
documents required for it.
The Sample: The sample of the study comprises of secondary data, which was collected from secondary
sources like internet, government official website and journals. The sample includes the export
data for the period of last ten years (2002-2011).
Tools for data collection:
Data required for the present study was secondary in nature. The yearly export reports of wheat
from India have been used. The data were gathered from various official websites such as,
www.commerce.nic.in, www.exim.com, www.books.google.co.in,
http://nmce.com/default.aspx etc.
Tools for data analysis:
The trend analysis was used to analyze the trend of export of wheat from 2002-2011 from
India.
Trend Equation: S = a + bt
∑S = Na + b∑T
∑ST = a∑T + b∑ [T]2
Where S=results
a,b= constant
T= Time, Total
Results:
YEAR TY EXPORT Trend value GROWTH RATE
2002 5350 3727.36 65.43%
2003 5425 3209.46 1.40%
2004 1605 2691.55 -70.41%
2005 369 2173.65 -77.01%
2006 33 1655.75 -91.06%
2007 43 1137.84 30.30%
2008 21 619.94 -51.16%
2009 62 102.04 195.24%
2010 60 -415.86 -3.23%
2011 1000 -933.76 1566.67%
2012 -1451.67 -1451.66 656.81%
2013 -1969.57 -1969.56 747.76%
2014 -2487.47 -2487.47 838.70%
2015 -3005.38 -3005.37 929.65%
2016 -3523.28 -3523.27 1020.59%
www.indexmundi.com

www.theinternationaljournal.org > RJCBS: Volume: 02, Number: 01, November-2012 Page 79
Discussion:
Wheat exports from India reached a hike of above 5000 Million tons during the year 2002-2003 and
then markedly declined at an even pace to 1605 Million tons in 2004.Again in 2005 it further showed a
deep declining trend as the government halted export subsidies because of tightening of domestic
supplies and reduced Indian competitiveness in international markets, although private traders
remained free to export wheat. Further the fate of Indian wheat export bleak as the trend above during
2006-2010 wheat exports were almost nil. Due to unmanageable food grains stocks, the Govt. of India
decided to export its Wheat stocks at a highly subsidized price (declared at port cities) through Govt.
agencies such as STC, MMTC and PEC. As there was generally a flat moment during these periods,the
possibility of increasing our wheat exports was dangled.But it got proved wrong and then suddenly
during 2011 the export of wheat raised to 1000 million tons. Still after having a look of the exports of
the previous years, there may be a possibility of a rise in the exports in the future time period. Looking
ahead to 2017, an inclining trend is expected and also the average level of wheat prices is expected to
go higher than the previous years.
Wheat: India may be out of the world market
After heavy exports over the past several months, Indian wheat exports have started tapering off, with
few vessels now loading at Indian ports. According to trade sources, if no government export subsidy
is forthcoming, exports will cease, as Indian wheat will no longer be competitive vis-a-vis wheat from
other origins like the Ukraine, Romania, Eastern Europe, and Australia will take lead. With wheat
currently priced at $170 FOB, even neighboring importers like Bangladesh and Sri Lanka have started
looking at other origins for their wheat requirements. Although private importers still have wheat
stocks they procured this year from the domestic market in the hope of a government export subsidy,
they will soon start selling it in the domestic market if no government subsidy is offered.
Conclusion:
The study also revealed that India is growing more wheat than it ever has. That may sound like very
good news given the fact that India along with China is the largest consumer of wheat, but the fact is, it
does not quite know what to do with it. India doesn’t have policies that will allow the country to use
the wheat efficiently. It doesn’t even have enough places to store it. There is also no surety that wheat

www.theinternationaljournal.org > RJCBS: Volume: 02, Number: 01, November-2012 Page 80
production will be equally robust in the coming years. The current state of plenty is just two seasons
old. Following the bumper harvest (80.17 million tons) of 2010, the country is now looking at another
81.74 million tons in a harvest season that has just begun.
The last couple of years, India have had a good monsoon and hence the production was good. But if
she has even one bad monsoon, there will be dire shortage. These bumper harvests are the outcome of
a two-pronged government approach of banning exports, and raising the minimum support price
(MSP) as an incentive to bring more land under wheat cultivation. The gains at the height of the Green
Revolution in the 1970s and 80s riding on the back of high-yield seeds and pesticide use have been
slowing down. Between 2000 and 2010, the land under wheat cultivation grew by just 1.21 percent and
there was a drop in yield (compared to the 1980s). Wheat production had fallen to 9.23 million tons in
2006-07 and export was banned in October 2007, however, such an approach doesn’t provide
sustained support for wheat farming.
One part of the problem “lies with the procurement system. Any farmer can sell any amount of wheat
to the government and the government has to buy it. The MSP too has been raised to an unreasonable
level as it is a political issue.”
The other part of the problem is that the government is not equipped to efficiently store and use
bumper crops for future consumption, thanks to the pathetic conditions of the warehouses run by the
Food Corporation of India (FCI). Enormous volumes of grains rot every year.
Implications of the study:
It may be concluded from the present study that the production and productivity of wheat in India is
expected to increase in the present decade, even then the country is likely to remain in deficit, so far
demand supply balance of wheat is concerned. Comparatively higher prices of wheat during lean
period suggest that more warehouse and storage facilities be created so that farmers could store wheat
during post harvest period and release it when prices are higher. So far as price spread in wheat
marketing is concerned an efficient transportation system and reduction in cost on commission charges
and taxes as well as margin of profit taken by the wholesalers and retailers may further improve the
marketing efficiency.
From the above discussion the following policy implications emerges:
There is need to establish adequate storage and warehousing facilities and also to popularize
their advantages among the farmers to encourage them to store the produce to create time
utility.
To improve the technology of wheat production and needs to be extended in a big way to
farmers in order to increase the productivity level of wheat in India and to wipe off the deficit
or gap.
Suggestions:
Govt. Should Encourage Private Players:
Encouraging private players in the procurement and storage process will enable the government to
absorb the production from states where FCI infrastructure is inadequate.
In its attempts at increasing storage capacity, last year the FCI started a scheme to invite private
participation in building more warehouses. The plan invites private players to build granaries and
the FCI guarantees at least 10 years of rent for them. So far, deals to build 10 million tonnes of
storage have been signed but these granaries will be completed only by next years.

www.theinternationaljournal.org > RJCBS: Volume: 02, Number: 01, November-2012 Page 81
Limited Procurement: The government should set a quota for how much wheat it will buy from farmers, and let them
export the rest or sell in the domestic market itself. the total production is at the end of the harvest
season and only if we have enough for our buffer stocks should we take a call on whether to allow
export of wheat or not. Countries such as Russia and China, which are large producers of wheat,
have had a poor harvest and are not exporting their produce. If we starts exporting now, and then
realize we will be falling short later, we will face a problem where availability and price of wheat
in the import market is concerned.
Build Strategic Reserves: For safety from fluctuations in supply, globally as well as domestically, maintain a constant stock
of wheat by creating long-term storage facilities. This will ensure food security. It will also give
clarity on the possibilities of exporting wheat when international demand is high. The global wheat
scenario is already raising concerns in many countries. Russia, the world’s third largest exporter,
stopped wheat exports after it lost a quarter of its crop last year to its worst drought in 50 years.
China, the world’s largest producer, too may lose about two-thirds of its crop after an exceptionally
dry winter in its wheat growing region. The impending shortage in the import market has pushed
global prices close to their all-time high of 2008.
Countries in West Asia and North Africa are stocking up with orders being placed for several
thousand tones. These points to fears of an impending crisis of availability and price.
Russia had announced its intent to build strategic wheat reserves along with China and India and
even give out 20 million hectares in joint ventures for wheat farming in early 2010. This would
protect Russia’s wheat prices and be a counter to the US’ wheat diplomacy (the US is sitting on a
stockpile of 30 million tons). But that, of course, was in the months following Russia’s 100 million
tone production and before drought brought that figure down to 60-65 million tones.
REFERNCES:
Webliography:
Data were retrived on 12/1/12 at 12.30a.m. from www.commerce.nic.in.
Data were retrived on 12/1/12 at 1.am from www.exim.com.
Data were retrived on 12/1/12 at 1.30am from www.books.google.co.in.
Data were retrived on 15/1/12 at 2.00pm from http://nmce.com/default.aspx.
Data were retrived on 20/1/12 at 3.00pm from www.indexmundi.com.
Data were retrived on 1/2/12 at 2.35pm fromhttp://www.financialexpress.com/news/adverse-
weather-to-hit-grain-production-thismarketing-year/61499/0.
Data were retrived on 15/2/12 at 2.45p.m. from http://www.business-
standard.com/india/news/govt-may-lift-banexportwheat/428265/.