International Journal of Research
12
International Journal of Research Available at https://edupediapublications.org/journals e-ISSN: 2348-6848 p-ISSN: 2348-795X Volume 04 Issue 14 November 2017 Available online: https://edupediapublications.org/journals/index.php/IJR/ Page | 1942 An Empirical Study on Perception of Consumers about Soft Drinks in Tamil Nadu with Special Reference to Chennai 1. Divakar.K, STUDENT, SAVEETHA SCHOOL OF MANAGENENT, INDIA 2. Dr. Ch. Bala Nageshwara Rao, Director, SAVEETHA SCHOOL OF MANAGEMENT, INDIA 3. B. Neeraja, ASSISTANT PROFESSOR, SAVEETHA SCHOOL OF MANAGEMENT, INDIA ABSTRACT Perception is the group, identification, and understanding in order to represent and understand the presented information, or the environment. Customer perception is typically affected by advertising, reviews, public relations, social media, personal experiences and other channels. The aim of the study is to perception of consumers about soft drinks with the special reference to Chennai. The main objective of the study is to know the consumer perception about Frooti drinks. The research is to analyze the reasons for preferring to drink Frooti. Another aspect of the study isto know how the respondent came to know aware of Frooti drinks. The data collected by the research method through survey questionnaire from the 100 respondents and analyzed for the consumer perception about the soft drinks. Keywords: consumer perception Soft drinks. INTRODUCTION The process by which an individual chooses, categorises, and understands stimuli into a meaningful and clear picture of the world.Perception is the organization, identification, and interpretation, in order to represent and understand the presented information, or the environment. Perception can be divided into two processes, (1) processing the physical input, which changes this lowest information to highest information level (2) processing which is connected with a person's concepts and expectations (or knowledge) that influence perception. REVIEW OF LITERATURE DilberUlas, H. Bader Arslan (2006) the purpose of this study is to present a brand view and analysis of brand switching of cola consumers in Turkish cola market. Cola turka. The new cola brand has captured almost one-quarter of the market. It has the potential to create loyal consumers. Despite Coca-Cola preserving its dominance, Pepsi cola has been surpassed by this new product. Gunne
-
Upload
khangminh22 -
Category
Documents
-
view
3 -
download
0
Transcript of International Journal of Research
International Journal of Research Available at https://edupediapublications.org/journals
e-ISSN: 2348-6848 p-ISSN: 2348-795X Volume 04 Issue 14
November 2017
Available online: https://edupediapublications.org/journals/index.php/IJR/ P a g e | 1942
An Empirical Study on Perception of Consumers about Soft Drinks in
Tamil Nadu with Special Reference to Chennai
1. Divakar.K, STUDENT, SAVEETHA SCHOOL OF MANAGENENT, INDIA
2. Dr. Ch. Bala Nageshwara Rao, Director, SAVEETHA SCHOOL OF
MANAGEMENT, INDIA
3. B. Neeraja, ASSISTANT PROFESSOR, SAVEETHA SCHOOL OF
MANAGEMENT, INDIA
ABSTRACT
Perception is the group, identification, and understanding in order to represent and understand the
presented information, or the environment. Customer perception is typically affected by advertising,
reviews, public relations, social media, personal experiences and other channels. The aim of the study
is to perception of consumers about soft drinks with the special reference to Chennai. The main
objective of the study is to know the consumer perception about Frooti drinks. The research is
to analyze the reasons for preferring to drink Frooti. Another aspect of the study isto know
how the respondent came to know aware of Frooti drinks. The data collected by the research
method through survey questionnaire from the 100 respondents and analyzed for the
consumer perception about the soft drinks.
Keywords: consumer perception Soft drinks.
INTRODUCTION
The process by which an individual
chooses, categorises, and understands
stimuli into a meaningful and clear picture
of the world.Perception is the organization,
identification, and interpretation, in order
to represent and understand the presented
information, or the environment.
Perception can be divided into two
processes, (1) processing the physical
input, which changes this lowest
information to highest information level
(2) processing which is connected with a
person's concepts and expectations (or
knowledge) that influence perception.
REVIEW OF LITERATURE
DilberUlas, H. Bader Arslan (2006) the
purpose of this study is to present a brand
view and analysis of brand switching of
cola consumers in Turkish cola market.
Cola turka. The new cola brand has
captured almost one-quarter of the market.
It has the potential to create loyal
consumers. Despite Coca-Cola preserving
its dominance, Pepsi cola has been
surpassed by this new product. Gunne

International Journal of Research Available at https://edupediapublications.org/journals
e-ISSN: 2348-6848 p-ISSN: 2348-795X Volume 04 Issue 14
November 2017
Available online: https://edupediapublications.org/journals/index.php/IJR/ P a g e | 1943
Grankvist, Hans Lekedal, Maarit
Marmendal (2007), Gupta & Gupta
(2008)Fruit drinks: how healthy and safe‖
discussed that fruit drinks are popularly
used in most urban households today
markets are flooded with large variety of
juices.
Charles (2009)Market news service: fruit
juices report‖ in his studies discussed that
the fruit juice market is presently relatively
quiet, provided one ignores the continued
collapse in the price of FCOJ.
MarianelaFornerino,
Francoisd’Hauteville (2010) this
experimental research seeks to offer a
method for measuring the respective
product and brand contributions to the
global perceived quality dimension in the
case of five brands of orange juices.
Results specify an integrationweight for
the national brands, mostly strong with the
preferred brand effect for the retailer’s
brand, although both products were rated
the same in the unsightedvaluation.
Puri and Sangera (1989),conducted a
survey to know the consumption pattern of
processed products in Chandigarh. Jam
was found to be most popular irrespective
of income. Orange squash consumption
was maximum in high and middleincome
families. Pineapple juice consumption
increased with a rise in the income.
Shivkumar (2004),conducted that the
consumer, irrespective of income groups,
was mainly influenced to purchase by
the opinions of their family members.
Consumers are influenced by the dealers’
recommendation, followed by
advertisement.
Rajarashmi and Sudarsana (2004)
revealed that, almost all the sample
respondents preferred branded products
and if their favorite brand is not available
in the retail shop, they will go for another
store and their favorite brand. If it is not
available in the market, the respondents
are ready to postpone their decision.
Narang(2006),concluded that, a buyer
does not stick to one brand in case of
foodpurchasing. They should be able recall
different brand names when they go for
purchase.Repetitive advertising can be
used to promote brand recall. The product
should be associatedwith style and trend,
so that it appeals to the youth and the
brand name should be developed as a
fashion statement. Promotional schemes
such as discounts and free offers with
purchase were suggested to increase rates.
Sarwade (2002), conducted by Sarwade it
has been observed that the price was the
factor, which influenced the purchasing
International Journal of Research Available at https://edupediapublications.org/journals
e-ISSN: 2348-6848 p-ISSN: 2348-795X Volume 04 Issue 14
November 2017
Available online: https://edupediapublications.org/journals/index.php/IJR/ P a g e | 1944
decision as against the quality of the
product. It is very interesting to find out
that the company image and brand image
were not totally considered by the
households.
Kubendran and Vanniarajan (2005)
founded that, the change in consumption
design is due to changes in food habits. If
income and growth increase among
consumers, the percentage of income spent
on drinking increases. The city consumers
prefer mostly branded products compared
to rural consumers. The most significant
factors influencing buying decisions were
acceptability, quality, regular supply, door
delivery and the mode of payment.
Ramasamy et al. (2005) reported that, the
buying behaviour is hugely influenced by
awareness and attitude towards the
product. Commercial advertisements over
television was said to be the most
important source of information, followed
by 18 displays in retail openings.
Consumers do build the view about a
brand on the basis of which various
product structures play an important part
in decision making process. A large
number of respondents setimportance on
quality and felt that price is an
important factor while the others
attached importance to image of
manufacturer.
Nagaraja (2004),opined that, buying
behavior is very much influenced by
experience of their own and of neighbor
consumers and his own family. The
involvements of his own family members
were exerting maximum influence on his
purchases. Above all, the quality of the
product and its easy availability were the
primary and the vital determinants of his
buying behavior. Consumers were
influenced by touch and feel aspect of any
promotional activity.
Banumathy and Hemameena (2006),in
their study suggested that, the
company’s manufacturing soft drinks must
manufacture high quality soft drinks in
order to compete with soft drinks of
multinational companies (MNC). The
MNCs can promote demand by effective
advertising, improving quality by keeping
a check on the taste and price. They can
adopt innovative improvements in the
production and marketing of soft drinks
in order to compete with the
international brands. Study also revealed
that there is no association between age,
education, occupation and choice of
brands but there is association between
monthly income and brand preference and
also there is close relationship between
price and satisfaction level.

International Journal of Research Available at https://edupediapublications.org/journals
e-ISSN: 2348-6848 p-ISSN: 2348-795X Volume 04 Issue 14
November 2017
Available online: https://edupediapublications.org/journals/index.php/IJR/ P a g e | 1945
Singh and Singh (1981), found that
consumers had single or multi-brand
loyalty based on the nature of product, like
necessities or luxuries. Brand choice and
store loyalty were found to affect the brand
loyalty of the consumer. The factors that
influence and strengthen loyalty to
brand were quality of product, habit of
use and ready and regular availability.
Ali (1992) studied the brand loyalty and
switching pattern of processed fruit and
vegetable products in Bangalore city by
using Markov Chain analysis. The result of
study revealed that Kissan brand of
jam and Maggi brand of ketchup had a
19 maximum brand loyalty among
consumers, and less amount of brand
switching occurred for these brands.
Vincent (2006)stimulated that quality is an
important factor that appeals consumers
towards branded products. Branded
products are accepted as good quality
products. People do not mind paying extra
for branded products, as they get value for
money. Media is a key constituent in
promoting and influencing brand. A
child’s resolve affects family’s buying
Behavior. Children are highly aware and
conscious of branded items. Although
unbranded
Products sometimes give same satisfaction
as branded products; customers would still
prefer to purchase a branded product.
NEED FOR THE STUDY
To find out the perception and
mind set of the consumer about the
Frooti drink
To identify steps that can be taken
to solve some negative perception
of the consumer about the product
in future.
OBJECTIVES OF THE STUDY
To study the consumer perception
about Frooti drinks.To identify which
drink is mostly preferred by the people and
their perception on comparative preference
of Frooti drink.To analyze what are the
changes required to improvise Frooti
beverage.
SCOPE OF THE STUDY
This study helps to identify the
buying behavior of consumers and their
taste in the food habits as well as their
preference in Frootidrinks.
LIMITATIONS OF THE STUDY
International Journal of Research Available at https://edupediapublications.org/journals
e-ISSN: 2348-6848 p-ISSN: 2348-795X Volume 04 Issue 14
November 2017
Available online: https://edupediapublications.org/journals/index.php/IJR/ P a g e | 1946
The study was conducted
only in Chennai district.
Hence, the results arrived
from the study may or may
not be applied to other area
in Tamilnadu.
The consumer preference
may change according to
time, fashion, technology
and development etc.
No respondents are forced
to fill the survey
questionnaire or gave the
interview.
Return and risk
characteristics are expected
only, not exactly measured
or calculated.
METHODOLOGY OF THE STUDY
Primary data
The data for the present study is
collected by means of primary data.The
respondents were administered with a
structured schedule to collect the data
required for the study.Besides the primary
data, the secondary data was also collected
for the study. Websites, books were
referred for this purpose the library to
facilitate the proper understanding of the
study. The size of the sample is 100
respondents. Sample size refers to the
number of items to be selected from
universe to constitute the
samples.Sampling technique used in this
study non-probability sampling, which is
also known as deliberate sampling or
Convenience sampling. This type of
sampling is very convenient and is
relatively inexpensive.The data collected
from the both the sources and are analyzed
and interpreted in the systematic manner
with the help of statistical tool like
percentage analysis and spss tool.
DATA ANALYSIS AND INTERPRETATION
PERCENTAGE ANALYSIS
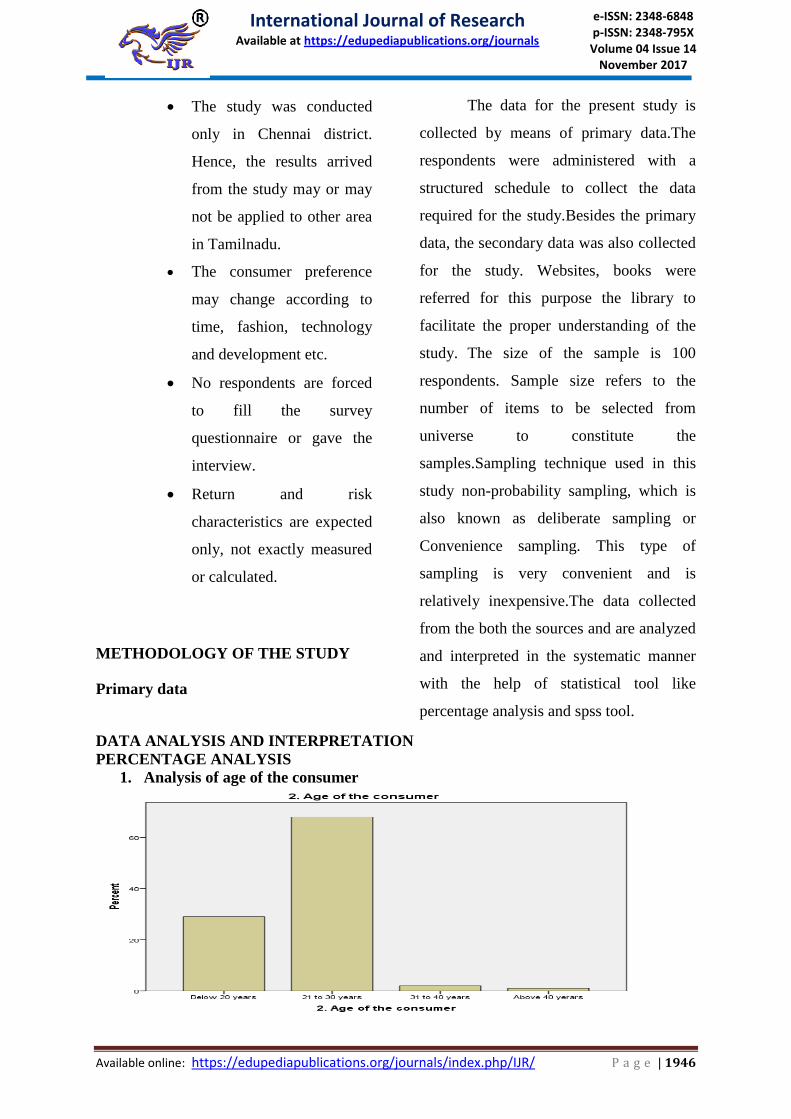
1. Analysis of age of the consumer

International Journal of Research Available at https://edupediapublications.org/journals
e-ISSN: 2348-6848 p-ISSN: 2348-795X Volume 04 Issue 14
November 2017
Available online: https://edupediapublications.org/journals/index.php/IJR/ P a g e | 1947
Interpretation
The above table and chart shows that 68% of the respondent is 21 to 30 years and
29% of the respondent is Below 20 years and 2% of respondent is 31 to 40 years and 1% of
the respondent is above 40 years. So, it can be concluded that majority of the respondent is
between 21 to 30 years.
2. Analysis of what is the Mango fruit drinks respondent aware of
Interpretation
The above table and chart shows that 41% of the respondent aware from Frooti and
29% of the respondent aware from Mazza and 23% of respondent aware from Slice and 7%
of the respondent aware from Maa, Real & others fruit drinks. So, it can be concluded that
majority of the respondent aware from Frooti.
3. Analysis of how often you would give importance to the brand

International Journal of Research Available at https://edupediapublications.org/journals
e-ISSN: 2348-6848 p-ISSN: 2348-795X Volume 04 Issue 14
November 2017
Available online: https://edupediapublications.org/journals/index.php/IJR/ P a g e | 1948
Interpretation
The above table and chart shows that 39% of the respondent sometime gives
importance to the brand and 32% of the respondent mostly gives importance to the brand and
18% of respondent every time gives importance to the brand and 11% of the respondent
rarely gives importance to the brand. So, it can be concluded that majority of the respondent
sometimes gives importance to the brand
4. Analysis of taste
Interpretation
The above table and chart shows that 52% of the respondent has been satisfied with
the taste and 29% of the respondent has highly satisfied with the taste and 11% of respondent
has says that taste is neutral and 6% of the respondenthas dissatisfied with the taste and 2% of
the respondent has been highly dissatisfied with taste. So, it can be concluded that majority of
the respondent has been satisfied with the taste.
5. Analysis of price
Interpretation

International Journal of Research Available at https://edupediapublications.org/journals
e-ISSN: 2348-6848 p-ISSN: 2348-795X Volume 04 Issue 14
November 2017
Available online: https://edupediapublications.org/journals/index.php/IJR/ P a g e | 1949
The above table and chart shows that 39% of the respondent has been highly satisfied
with the price and 32% of the respondent has satisfied with the price and 16% of respondent
has says that price is neutral and 9% of the respondenthas dissatisfied with the price and 4%
of the respondent has been highly dissatisfied with price. So, it can be concluded that
majority of the respondent has been highly satisfied with the price.
6. Analysis of quality
Interpretation
The above table and chart shows
that 45% of the respondent has been highly
satisfied with the quality and 24% of the
respondent has satisfied with the quality
and 21% of respondent has says that
quality is neutral and 7% of the
respondenthas dissatisfied with the quality
and 3% of the respondent has been highly
dissatisfied with quality. So, it can be
concluded that majority of the respondent
has been highly satisfied with the quality.
ANOVA ANALYSIS
Difference between Income and Price
Null Hypothesis: There is no significant
difference between Income and Price.
Alternate Hypothesis: There is
significantdifference between Income and
Price.
Anova for Income and Price:
International Journal of Research Available at https://edupediapublications.org/journals
e-ISSN: 2348-6848 p-ISSN: 2348-795X Volume 04 Issue 14
November 2017
Available online: https://edupediapublications.org/journals/index.php/IJR/ P a g e | 1950
Sum of Squares df Mean Square F Sig.
Between Groups 3.576 3 1.192 1.046 .376
Within Groups 109.424 96 1.140
Total 113.000 99
Interpretation
The significant values is 0.376
which is greater than 0.05. Hence, null
hypothesis is accepted, Alternative
hypothesis is rejected. Hence, there is no
significant difference between Income and
Price.
Difference between Income and
Quantity
Null Hypothesis: There is no significant
difference between Income and Quantity.
Alternate Hypothesis: There is
significantdifference between Income and
Quantity.
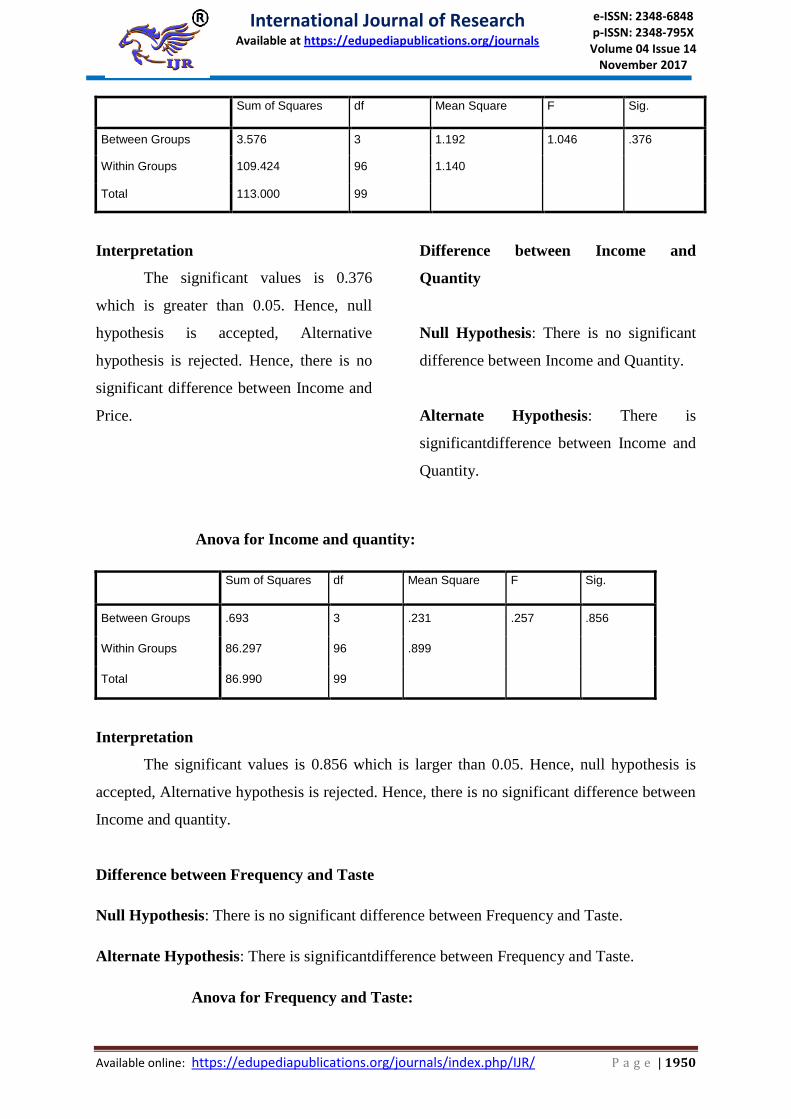
Anova for Income and quantity:
Sum of Squares df Mean Square F Sig.
Between Groups .693 3 .231 .257 .856
Within Groups 86.297 96 .899
Total 86.990 99
Interpretation
The significant values is 0.856 which is larger than 0.05. Hence, null hypothesis is
accepted, Alternative hypothesis is rejected. Hence, there is no significant difference between
Income and quantity.
Difference between Frequency and Taste
Null Hypothesis: There is no significant difference between Frequency and Taste.
Alternate Hypothesis: There is significantdifference between Frequency and Taste.
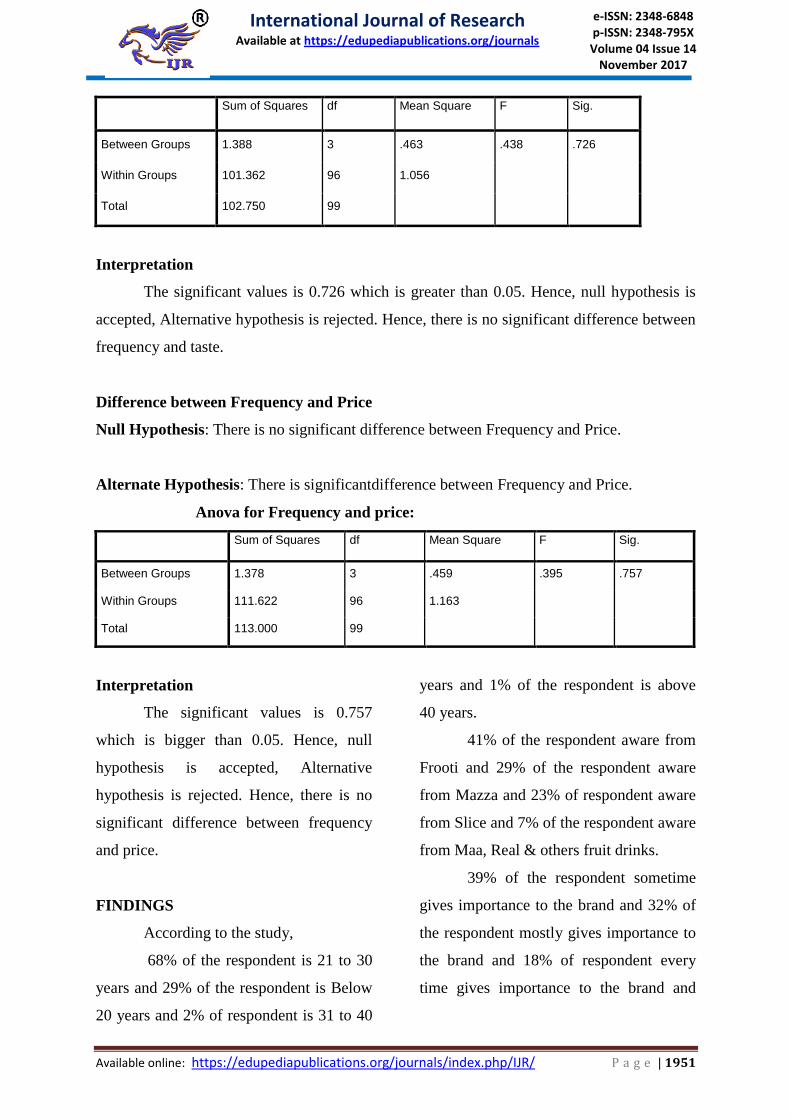
Anova for Frequency and Taste:
International Journal of Research Available at https://edupediapublications.org/journals
e-ISSN: 2348-6848 p-ISSN: 2348-795X Volume 04 Issue 14
November 2017
Available online: https://edupediapublications.org/journals/index.php/IJR/ P a g e | 1951
Sum of Squares df Mean Square F Sig.
Between Groups 1.388 3 .463 .438 .726
Within Groups 101.362 96 1.056
Total 102.750 99
Interpretation
The significant values is 0.726 which is greater than 0.05. Hence, null hypothesis is
accepted, Alternative hypothesis is rejected. Hence, there is no significant difference between
frequency and taste.
Difference between Frequency and Price
Null Hypothesis: There is no significant difference between Frequency and Price.
Alternate Hypothesis: There is significantdifference between Frequency and Price.
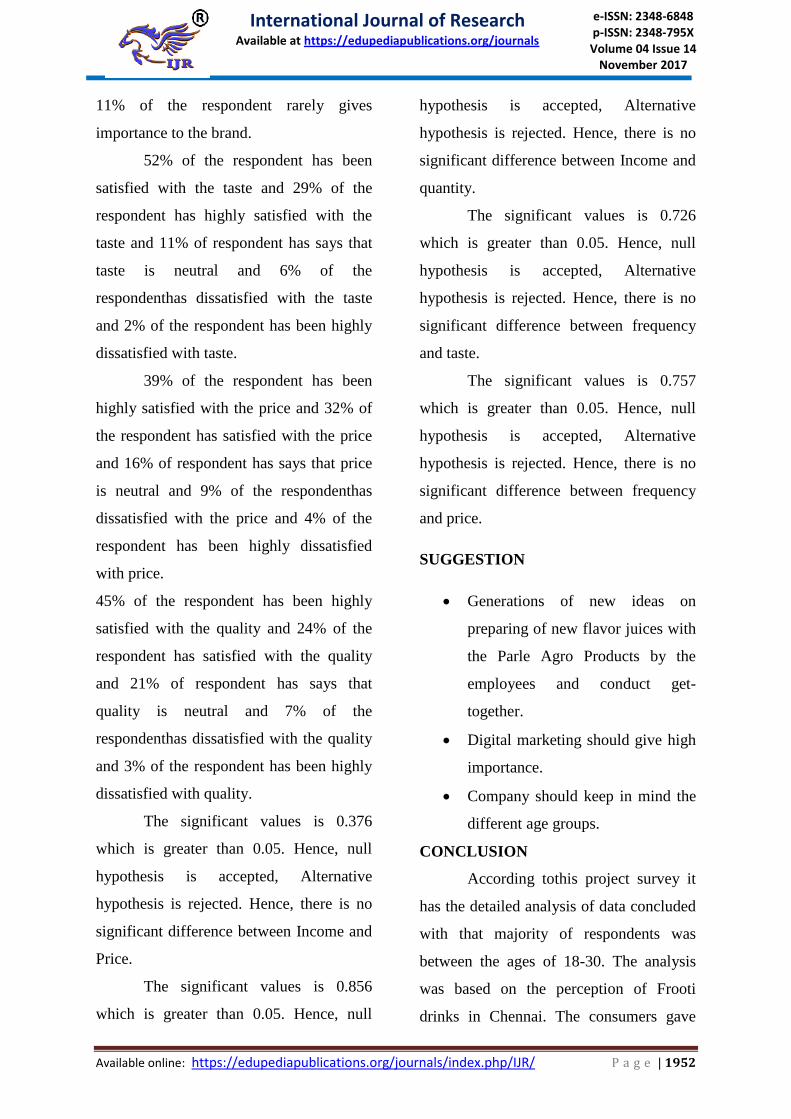
Anova for Frequency and price:
Sum of Squares df Mean Square F Sig.
Between Groups 1.378 3 .459 .395 .757
Within Groups 111.622 96 1.163
Total 113.000 99
Interpretation
The significant values is 0.757
which is bigger than 0.05. Hence, null
hypothesis is accepted, Alternative
hypothesis is rejected. Hence, there is no
significant difference between frequency
and price.
FINDINGS
According to the study,
68% of the respondent is 21 to 30
years and 29% of the respondent is Below
20 years and 2% of respondent is 31 to 40
years and 1% of the respondent is above
40 years.
41% of the respondent aware from
Frooti and 29% of the respondent aware
from Mazza and 23% of respondent aware
from Slice and 7% of the respondent aware
from Maa, Real & others fruit drinks.
39% of the respondent sometime
gives importance to the brand and 32% of
the respondent mostly gives importance to
the brand and 18% of respondent every
time gives importance to the brand and
International Journal of Research Available at https://edupediapublications.org/journals
e-ISSN: 2348-6848 p-ISSN: 2348-795X Volume 04 Issue 14
November 2017
Available online: https://edupediapublications.org/journals/index.php/IJR/ P a g e | 1952
11% of the respondent rarely gives
importance to the brand.
52% of the respondent has been
satisfied with the taste and 29% of the
respondent has highly satisfied with the
taste and 11% of respondent has says that
taste is neutral and 6% of the
respondenthas dissatisfied with the taste
and 2% of the respondent has been highly
dissatisfied with taste.
39% of the respondent has been
highly satisfied with the price and 32% of
the respondent has satisfied with the price
and 16% of respondent has says that price
is neutral and 9% of the respondenthas
dissatisfied with the price and 4% of the
respondent has been highly dissatisfied
with price.
45% of the respondent has been highly
satisfied with the quality and 24% of the
respondent has satisfied with the quality
and 21% of respondent has says that
quality is neutral and 7% of the
respondenthas dissatisfied with the quality
and 3% of the respondent has been highly
dissatisfied with quality.
The significant values is 0.376
which is greater than 0.05. Hence, null
hypothesis is accepted, Alternative
hypothesis is rejected. Hence, there is no
significant difference between Income and
Price.
The significant values is 0.856
which is greater than 0.05. Hence, null
hypothesis is accepted, Alternative
hypothesis is rejected. Hence, there is no
significant difference between Income and
quantity.
The significant values is 0.726
which is greater than 0.05. Hence, null
hypothesis is accepted, Alternative
hypothesis is rejected. Hence, there is no
significant difference between frequency
and taste.
The significant values is 0.757
which is greater than 0.05. Hence, null
hypothesis is accepted, Alternative
hypothesis is rejected. Hence, there is no
significant difference between frequency
and price.
SUGGESTION
Generations of new ideas on
preparing of new flavor juices with
the Parle Agro Products by the
employees and conduct get-
together.
Digital marketing should give high
importance.
Company should keep in mind the
different age groups.
CONCLUSION
According tothis project survey it
has the detailed analysis of data concluded
with that majority of respondents was
between the ages of 18-30. The analysis
was based on the perception of Frooti
drinks in Chennai. The consumers gave
International Journal of Research Available at https://edupediapublications.org/journals
e-ISSN: 2348-6848 p-ISSN: 2348-795X Volume 04 Issue 14
November 2017
Available online: https://edupediapublications.org/journals/index.php/IJR/ P a g e | 1953
more importance to the Brand and they
were aware from the television
advertisements. Consumer’s perception of
Frooti drinks had the good satisfaction
level taste and Price among the
respondents. Finally I conclude that the
consumers werevery much loyal to the
Frooti drinks.
BIBLIOGRAPHY
http://ir.inflibnet.ac.in:8080/jspui/handle/1
0603/44567
http://euroasiapub.org/wp-
content/uploads/2016/09/12FMSepRohDel
-1.pdf
http://www.icmrr.org/dec_2015/IJMRR/15
1202010.pdf
https://books.google.co.in/books?hl=en&lr
=&id=koFFqPST0HcC&oi=fnd&pg=PR1
3&dq=consumer+perception+of+frooti&ot
s=3_Fj9l1c19&sig=CYPZogPJORR6gxO
ZdVVp02oy9OE#v=onepage&q=consume
r%20perception%20of%20frooti&f=false
http://journals.sagepub.com/doi/abs/10.117
7/0971890720130105
http://www.sciencedirect.com/science/artic
le/pii/S030917400300130X
http://www.sciencedirect.com/science/artic
le/pii/S0969698902000061