Bridging the Gap Between Evidence-based Innovation and National Health-sector Reform in Ghana
Upload
independentCategory
view
2download
0
Documents de travail
Faculté des sciences économiques et de
gestionPôle européen de gestion et
d'économie (PEGE)61 avenue de la Forêt NoireF-67085 Strasbourg Cedex
Secétariat du BETAGéraldine ManderscheidtTél. : (33) 03 68 85 20 69Fax : (33) 03 68 85 20 70
[email protected]://cournot2.u–strasbg.fr/beta
« Innovation and Development. The Evidence from Innovation Surveys »
Auteurs
Francesco Bogliacino, Giulio Perani, Mario Pianta, Stefano Supino
Document de Travail n° 2010 - 13
Avril 2010
1
Innovation and Development.The Evidence from Innovation Surveys.
Francesco Bogliacino1
European Commission – JRC-Institute for Perspective Technological StudiesDepartamento de Economía-Universidad EAFIT
Centro de Estudios Para America Latina y el Caribe-Universidad EAFITRISE-Group
Giulio PeraniISTAT, Roma
Mario PiantaUniversità di Urbino
Stefano SupinoBureau d’Économie Théorique et Appliquée, Université de Strasbourg
Università di Urbino
Abstract
In this article we investigate the existing evidence on innovation produced by innovation surveys indeveloping and emerging countries in Europe, Asia, Africa and Latin America. We review therelevant literature, discuss methodological issues, and analyse the results for the countries with themost comparable surveys, considering the well established findings of innovation surveys forEurope as a benchmark. From the evidence we considered, regional patterns are identified and somestylized facts on innovation and development are proposed, pointing out the specificity ofinnovation processes in economies engaged in industrialisation and catching-up.
Keywords: Innovation Surveys, Patterns of Innovation, Emerging Countries
JEL Classification: O14, O19, O3, O54
1 Corresponding Author. Address for correspondence: Francesco Bogliacino, JRC-IPTS, calle Inca Garcilaso, 3.41092 Seville (Spain). E-mail: [email protected]. The views expressed are purely those of the authorand may not in any circumstances be regarded as stating an official position of the European Commission.

2
1. Introduction
Innovation is receiving increasing attention in the development debate. Far from being aconcern of advanced countries alone, the ability to introduce new technologies and organisations isnow seen in developing economies as a crucial element in the process of industrialisation andmodernisation. Major efforts to introduce new products and processes, to imitate rapidly frontierinnovators, to widely adopt new capital equipment and production technologies, to diffuse the useof new goods and services are now under way in many developing and emerging economies, fromEastern Europe to China, from India to Latin America, from Mediterranean countries to SouthernAfrica (for brevity's sake, we will refer to them as Developing Countries2). This process ishighlighted by the success of some Asian countries (most recently China and India) in shiftingfrom a paradigm of technology adoption to one of domestic knowledge generation (Chadha, 2009;Altenburg et al. 2008; OECD, 2007), although the ability of other countries to follow the same roadhas been questioned (Sargent and Matthews, 2008; Perez, 20083). Such attention has led to a rapiddiffusion in these countries of innovation surveys, replicating and adapting the model firstdeveloped in Europe (Eurostat, 2008). The advantage of innovation surveys is in their ability todocument the complex and multi-dimensional nature of technological change in firms (Dosi, 1988;Pavitt, 1984), offering a variety of indicators on inputs, outputs, sources, objectives and hamperingfactors.
The aim of this article is twofold. First, we systematically review the evidence now availableon innovation in Developing Countries, discussing methodological issues and comparing results;second, we propose an interpretation of the emerging patterns of technological change - in relationalso to the experience of Europe - and identify different technological strategies that shape andconstrain the development process. These insights may contribute to a more effective design ofpolicies, both at the national level, with more appropriate innovation and industrial policies4, and atthe international level, with regards to the governance of knowledge and technology flows,including the rules on Intellectual Property Rights.5
The relationship between technological change and the process of development has beeninvestigated by a variety of approaches, from the historical perspective of Abramovitz (1986) to theneoclassical framework of Keller (2004), from the industrialization-focussed theory by Lall (1992)to the Evolutionary and Neo-Schumpeterian theories by Freeman and Louça (2001), Perez (2002)and Nelson (2006), ending with the Global Value Chain Approach (for a review see Morrison et al.,2006). Although they have major differences, there is an underlying consensus that the origin of thedevelopment process is rooted in the growth of productivity, and not in a simple factoraccumulation process; technological change is recognised unanimously as the main force enhancing
2 Some of the European and Asian countries we will consider are developed economies. However, our evidenceincludes the Nineties, when industrialisation and international integration accelerated, and is illustrative of the role ofinnovation in successful development strategies.3 Perez (2008) argues that in the established techno-economic paradigm this shift is impossible without aspecific development strategy, coordinated by the government.4 The positive role that innovation surveys can play in a better design of policies is stressed by Mairesse andMohnen (2008), especially with reference to the existence of policy complementarities. Fagerberg and Srholec (2009)carried out a comprehensive analysis of innovative patterns, showing that policies tailored to the attraction of high techactivities can be an appropriate strategy only when coupled with a strengthening of the quality of the environment(capacity to mobilize the proper factors, reliability of the social and institutional structure, capability to move from ideato innovation). Cimoli, Dosi and Stiglitz (2009) link policies for technological change, accumulation of capabilities anddevelopment.5 A growing debate is addressing the global governance of technology flows; although some of the reforms ofthe 1990s have been recognized as productivity enhancing (Figuereido, 2008; Lopez, 2008; Dijofack-Zebaze and Keck,2009), there is a widespread concern that the actual regime of Intellectual Property Rights Protection is too strong(Chang, 2001; Falvey et al., 2006, Bogliacino and Naranjo, 2008; Stiglitz, 2008); new avenues could be opened in termsof South-South cooperation (Perez, 1994), while new conflicts may emerge with the rise of new actors such as China(Gu et al. 2008).
3
productivity growth (OECD, 2007). However, most studies have so far looked at technology in arather undifferentiated way, using indicators - such as R&D and patents - that are inappropriate forDeveloping Countries (and limited for the developed ones as well, see Archibugi and Pianta, 1996;Smith, 2005). A major contribution of innovation surveys investigated in this article is their abilityto show the diversity of innovative activities and the alternative directions that efforts at improvingtechnologies and organisations may take, with diverging effects on the development process. Inorder to identify these patterns, we will investigate the main typologies of innovation (new productsand processes), the sources and hampering factors, the expenditures and outputs - including theshare of innovative turnover - and the strategies pursued by innovative activities.
Moreover, this article integrates the evidence provided by efforts to build internationallycomparable measures of technological capabilities using traditional indicators of scientificactivities, R&D, patenting, etc. International organizations have addressed this challenge fromdifferent perspectives (see World Bank, 1999; UNDP, 2001; UNIDO, 2003) and several studieshave been produced by scholars (Amsden and Mourshed, 1997; Bell and Pavitt, 1997) and businesssources (for a review see Archibugi et al. 2009). A systematic comparison on different dimensions,leading to a synthetic composite indicator has been carried out by Archibugi and Coco (2004). Therichness of comparable results from innovation surveys can now complement the limitations oftechnology indicators relying on traditional indicators.
The article proceeds as follows: Section 2 discusses the diffusion of innovation surveys;Section 3 critically reviews the results and the methodological issues; Section 4 shows the results ona subset of major countries; Section 5 presents a set of stylized facts on innovation anddevelopment.
2. The diffusion of innovation surveys
Europe has pioneered the surveys on innovation in firms, developing a commonmethodology, described in the Oslo Manual6 (OECD, 2006), and four comparable waves of thesurveys have now been carried out (for the most recent results of the third survey, see Eurostat,2008). The EU practice has progressively extended to other countries and represents the currentinternational standard for the methodology of innovation surveys; the Oslo Manual has been used inthe Central and Eastern European Countries of New Accession to the EU (EU-NAC), in thecandidate countries to European membership (Radosevic, 2004), and has provided the guidelinesfor all other surveys.
In Eastern Europe and the Balkans, the EU model of innovation surveys has been adoptedby Russia, Ukraine, Macedonia, Croatia and Turkey. In the first two countries the evidence showsthat after the end of the Soviet Union a drastic reduction of technological and scientific activitiestook place, followed by a modest rise in recent years. A detailed picture on Russia can be found inEU-Russia cooperation program (2007), and firm level data have been object of analysis by Roud(2008); for the case of Ukraine, empirical data and policies have been assessed in Yegorov (2008).
Turkey has followed a methodology comparable to the European one and provides scholarswith a significant amount of data (Meschi et al. 2008); several strands of literature have emerged,including studies on the relations between openness, innovation and market outcomes, and on theimpact on the quantity and skill composition of employment.
Outside Europe, a major effort has been carried out in Latin America. After a firstgeneration of innovation surveys conducted on pilot samples, countries moved towards astandardization, which culminated into the Manual de Bogotá (2001): grounded on the OsloManual, its main aim was the design of a survey tailored for Developing Countries. Three waves of
6 The Oslo Manual was the result of a joint effort of the European Union and the OECD. Developed Countrieswith surveys comparable to the Community Innovation Surveys (CIS) include EU member countries, Norway, Iceland,Switzerland, Canada, Australia, New Zealand, Turkey and Japan. The United States has only recently planned aninnovation survey, with its own methodology.

4
innovation surveys in different Latin American countries have been conducted.The first innovation surveys took place in 1995-1997 in five countries (Argentina,
Colombia, Chile, Mexico and Venezuela), with results that are not comparable in any of the relevantdimensions (Sutz, 2000). A second wave of surveys has been conducted in eight countries(Argentina, Brazil, Uruguay, Chile, Mexico, Cuba, Ecuador, Panama, Peru, Trinidad and Tobago).Finally, in recent years two other surveys have been undertaken in Brazil and Colombia, anotherone in Chile, Uruguay and Argentina.
The objective of the Bogotá Manual was to adapt the Oslo Manual to a region with adifferent environment in terms of innovation systems, average firm size, integration among keyactors, location of relevant markets. The Oslo Manual is considered too much focused on frontiertechnologies and original innovations. Compared to Europe, the typical Latin American economycarries out less R&D, has a more complex set of strategies for acquiring, adaptating and improvingtechnologies, and has weak interactions among firms and institutions involved in innovation. Thereis a consensus among Latin American scholars that the main determinant of this lagging behind isthe lack of basic capabilities to exploit advanced technologies (Lugones, 2006; Salazar andHolbrook, 2004).
This far-from-the-frontier innovative activity can be better described by addressing the roleplayed by different objectives and hindering factors (especially with regards to small and mediumfirms), by paying more attention to the experiences of "failure", and by systematically investigatingthe imitation activities that sometimes represent a continuous incremental change of capabilitieswith significant effects on productivity (see Dosi, 1988 for a theoretical discussion, and Salazar andHolbrook, 2004, for specific issues). As a consequence, the Bogotá Manual is more activity-relatedthan centered on the innovative firm; there is space to register intermediate innovative efforts,adaptation of technologies, organizational changes, marketing efforts, quality management (Salazarand Holbrook, 2004).
Few studies have discussed the results in a comparative perspective (Turriago, 2003, onArgentina, Chile, Colombia and Venezuela; Hall e Maffioli, 2008, on Argentina, Brasile, Chile ePanama; Raffo et al., 2008, for a comparison with Europe). The main part of this literature is limitedto either one country or a specific industry. Brazil, Chile and Colombia are the most studied, and themost important contributions include De Negri et al. (2007) and Langeback and Vasquez (2007) onthe relation between inputs and outputs of the innovative process; the relation between innovationand productivity has been investigated by Goedhuys (2007) and Benavente (2006) – using theCrepon, Duguet and Mairesse (1998) approach; the labour market effect of innovation isinvestigated by Benavente and Lauterbach (2008); an overall discussion over Latin America is inCassiolato et al. (2003).
Important efforts at surveying innovation have also been carried out in Asia. China has along experience in measuring innovation performances; the last survey, covering the years 2004-2006, is comparable to EU standards and has a large sample size, even among small firms. Thisimpulse to data gathering comes from the desire to monitor the relevant changes in the Chineseinnovative system in terms of actors and institutions. This statistical evidence has been elaborated ina large literature, focused on the sources of knowledge, regional disparities, and the impact on thegrowth potential (DeBresson et al. 2006; Alcorta et al. 2008).
In East and South East Asia a number of countries have carried out innovation surveyssimilar to the European ones. A rich strand of literature has developed on the cases of South Korea(Oh et al., 2007), Taiwan (Hsien-Ta Wang et al., 2003), Thailand (Intarakumnerd et al. 2002), whilesome studies exist on Singapore, Malaysia and other countries..
In Africa, innovation surveys have been conducted in Morocco, South Africa, Tanzania, andTunisia with a limited success when compared with international standards (Blankley and Kaplan,2006). More general studies on African development stressed the role played by the lack ofresources and the inability to absorb external knowledge as hindering factors (Lall and Pietrobelli,2002).
All these contributions provide a significant improvement in the documentation and

5
understanding of the variety and complexity of technological activities carried out in DevelopingCountries; results and methodologies for specific countries are addressed in detail in the nextsection.
3. Methodological issues and overview of the evidence
In order to examine the empirical evidence on innovation in Developing Countries we haveto assess the reliability, significance and comparability of results. The debate over the measurementof innovation has grown substantially in the last two decades and the efforts of statistical institutesand international organisations have provided a major base for obtaining high quality informationon innovation in firms (for reviews, see Archibugi and Pianta, 1996; Smith, 2005; Mairesse andMohnen, 2008).
In this Section we review the methodology and the quality of the available data forDeveloping Countries (see also Blankley et al. 2006). Two problems tend to emerge in differentexperiences; first, the specificity of the innovation processes and institutional settings ofDeveloping Countries has led to a primary focus on the domestic generation of knowledge andcapabilities; the distance from the frontier is often so large that countries and firms lack a criticalmass of knowledge needed to exploit externally generated knowledge. As a consequence, in LatinAmerica the regional Manual has devoted more attention to a better measurement of trainingactivities, technology acquisition and organizational innovations (Lugones, 2006; Anlló, 2006). Thesecond problem concerns sample design, and the main shortcoming is often the bias towards largefirms: the lack of significant coverage of small firms - that in Developing Countries represent thelargest part of industry and services - prevents an understanding of the actual process of knowledgegeneration and diffusion.
We will now present an overview of the different regions in order to identify a subset ofcomparable countries for which we can investigate the results of innovation surveys.
3.1 Central and Eastern Europe and Russia.
Central and Eastern European countries which carried out innovation survey include newmembers of the European Union (Bulgaria, Czech Republic, Latvia, Estonia, Lithuania, Hungary,Poland, Slovenia, Slovakia, Romania), candidate countries such as Croatia, Turkey and finallyUkraine and Russia. For these countries the problems of modernisation overlapped with those oftransition to market economies and a key question concerned the role of innovation in thetransformation of the economic system and integration in Europe and in international markets.
The international supervision of policies for the transition was inspired by the mainstreamrecipes typical of the "Washington consensus"; such approach argued that macroeconomicstabilization, trade liberalization and privatization of state firms would stimulate efforts to innovate;openness and FDIs would function as channels of transmission of knowledge, while privatizationand competition would serve as sufficient pressures to build networks of new entrepreneurs able tocompete on international markets through more efficient organization and an orientation towardsproduct innovation.
After the dramatic fall in economic activity of the early 1990s, in the last decade a strongeconomic performance – with high growth rates of per capita GDP – has led to a moderateconvergence towards EU average incomes. However, an analysis of innovation data (Radosevic,1999, 2006) raises some doubts over the long term sustainability of growth and some fears thatthese economies will not be able to move from a path based on imitation towards a growthtrajectory based on the introduction of new products and processes. Even for the countries of newaccession to the EU, data on innovative activities, on the amount and distribution of expenditure, onthe sources, objectives and hampering factors, and on the network of relationships within nationalsystems of innovation provide a picture rich in national specificities, but with little room foroptimism (see Eurostat, 2008).

6
Although these countries show different patterns in terms of income, educationalattainments of the labour force, infrastructure, institutions, quality of regulations (Aghion, 2008),innovation data witness a systematic gap in innovation generation with respect to the rest of Europe– independently from firm dimension – and in systemic interactions among actors of the nationalinnovation system. Moreover, a frequent shortcoming is the excessive dependence on a singleindustrial production, usually with low value added (Hogselius, 2003). Such problems are partlydue to the current process of restructuring, but the excessive fragmentation of firms and the lack ofa critical mass of industrial and technological capabilities mean that the systemic interactionsnecessary to generate, exchange and recombine knowledge among producers and users remaininadequate. This may hinder the learning process and the progress from a pure imitative strategy tothe domestic generation of technological knowledge.
These challenges clearly emerge from a number of empirical studies. In a microeconomicstudy of the first Croatian CIS (covering the years 2001-2003), Aralica et al. (2008) analyse thedeterminants of innovative activities, showing that demand plays the dominant role, while humancapital and R&D have only a weak impact on the propensity to innovate.
Knell and Srholec (2006) - using the third CIS - analyse the role played by FDIs andmultinational corporations in technology transfer to the Czech Republic. They conclude that foreignsubsidiaries have more propensity to cooperate globally than locally, and that the subset of nationalfirms with international cooperations look for similar partners. It appears that operating behind thetechnological frontier implies for local firms a difficulty in accessing knowledge flows and aweakening of the spillover effects from multinational corporations to local firms.
Another set of studies have assessed the impact of innovation on productivity. Vahter (2006)uses data from the third wave of the Estonian CIS (including both manufacturing and services),finding that the impact of product and process innovation is positive and significant over both totalfactor and labour productivity. Masso and Vahter (2008) carry out a similar exercise matching CISthree (1998-2000) and four (2002-2004) with balance sheet data. They found that productinnovation is the main determinant for the first wave, while process innovation becomes the leadingfactor in the second one. They interpret the results as evidence of a different behaviour of Estonianfirms during the business cycle.
Other empirical evidence on the relation between innovation and productivity comes fromRoud (2007), who uses data from the Russian innovation survey for 2005, comparable with the CIS.The positive relation of product and process innovation with productivity is confirmed, and a keyrole appears to be played by the presence of public funding.
3.2 East Asia
Many Asian countries – South Korea, Taiwan, Singapore, Malaysia, Thailand and China –have innovation surveys based on the Oslo Manual7.
Malaysia led the group in 1995. In the 1990s Malaysian industrial and technology policyfavoured the construction of a national system of innovation oriented towards new technologies,less dependent on foreign affiliates of multinationals and more oriented towards local and regionalchannels of technology flows. This is the picture provided by the last survey (referring to the years2002-2004). Four fifths of Malaysian innovative firms are controlled by national capital and twothirds of them are relatively young (they were born in the 1990s), innovate both in products andprocesses, rely on internal sources and on local partnerships. Innovation performances in Malaysianmanufacturing are therefore comparable with European standards, with a large share of turnoverrelated to new and improved products.
South Korea has collected in a systematic way data on innovation since 1996, and theresulting database has been used for monitoring economic progress. Sung (2004) uses the 2002
7 A private survey following the Oslo Manual has been realized also in Sri Lanka, mainly addressing the issue ofentrepreneurship; preliminary evidence can be found in De Mel et al. (2009).

7
survey to analyzes the determinants of innovative activity, finding that technological opportunitiesand networking have a positive and significant impact on all output measures. Seo (2004) usesfactor analysis to distinguish the relative importance of alternative sources (universities, researchinstitutes, internal sources and private partnership), showing that a key role is played by internalsources. In a further contribution Seo and Lee (2004) use the same data and technique to investigatethe role of hampering factors: they conclude that appropriability conditions explain a large share ofthe variance of innovative activity, while the opposite happens with firm size.
In a study of the determinants of innovative activity in South Korea, Shin (2003) - usingdata for the period 1997-1999- shows that firm size appears to be non significant, while industrialconcentration emerges as a negative incentive to innovate. Moreover, technological activity seemsto be stronger at the beginning of a firm's life, declining afterwards. Sung and Carlsson (2007) focuson the determinants, distinguishing high and low tech firms, stressing the role of networking effects,whose enhancing should be a priority for policy in their conclusions. Oh et al. (2007) analyze thesequence between innovative inputs, innovative outputs and productivity growth using acombination of innovation survey and financial data from other sources. R&D is not affectinginnovative output, so they suggest caution in public subsidies. A similar analysis is carried out byLee and Kang (2007), who investigate the impact of innovation output on productivity, showing thatprocess innovation has the strongest effect.
Taiwan's first innovation survey covers 1998-2000. The results have been investigated byShia et al. (2003), showing that around 50% of firms can be classified as innovative and that publicpolicy is actively involved in technological development; in particular, the country has been able toexploit its structure of small and medium businesses, specializing in semi-conductors and otherhighly innovative industries, with strong results in innovative performances and export of hightechnology goods.
Singapore started to gather innovation data in 1999, for both manufacturing and a subset ofbusiness services with high technological intensity (KIBS). It is well known that the economicperformance of this city-state has been very strong, with a fundamental change from an investorfriendly, technology adapting country, to an economy operating at the technological frontier. Anempirical investigation of this process can be found in Wong and Sing (2005), who use the 1999innovation data and show that the transformation is still under way; while KIBS data areimpressive, with 75% of innovative firms and at least 50% of firms with a 20% share of innovativeturnover, manufacturing industries are still concentrated on technological adoption, with less thanone third of innovative firms.
In Thailand, the empirical evidence has been used to document the fragility of the country'seconomy. Comparing Thailand with South Korea, Intakamnerd (2007) calculates that in 2003 thetwo countries show respectively six versus 43% of innovative firms, the former being too biasedtowards process innovation, independently of the size. The expenditure by Thailand's firms isdevoted to new machinery; there is a scarce ability to exploit opportunities (even public funding isoften disregarded) and to interact with other actors. Subsequent studies have confirmed this patternof weakness; Chaminade et al. (2008) use 2003 data to detect the structural deficits through ahierarchic factorial analysis, coming to the same results.
China conducted surveys starting from 1993 and a variety of studies have resulted fromthem. DeBresson et al. (2006) provide detailed analyses, assessing the move of the economy froman adopter to a generator of knowledge (see also Altenburg et al. 2008; Lunnan et al. 2006 on therole of entrepreneurship). OECD (2007) defines China as a key global player in R&D and stressesthat although all BRIC (Brazil, Russia, India and China) countries increased their share of high techexports, China accounts for the largest part of this increase. The labour market impact of innovationis also investigated (see Ping et al, 2008 and Mairesse et al. 2009); the very large productivityimprovements are raising concerns on the possible emergence of technological unemployment.
3.3 Latin America

8
Among the large Latin American literature resulting from the Bogotá Manual and thesurveys carried out in several countries, we focus in this section on the results of the most recentwave for four large economies of the area - Brazil, Argentina, Chile and Colombia; the surveys ofreference include the 2005 Argentinean ENIT (ENIT, 2005), the 2005 Brazilian PINTEC (IBGE,2005), the Chilean 2005 survey (INE, 2005), and the 2003-2004 Colombian survey (EIDT, 2005).In methodological terms, if we compare the implementation of the surveys with therecommendations of the Bogotá Manual several problems emerge. The first issue regards therepresentativeness of the sample. Brazilian and Chilean surveys are on manufacturing and services,while for the other two countries the reference is only to the former. The Chilean survey focuses onindustrial establishments, while the other ones investigate firms. Argentina has a stratified sample,Colombia has a census of firms with more than 10 employees (or 65 million pesos of turnover),Brazil collects data on all firms with more than 500 employees, sampling the smaller ones with acomplicate technique which over-represents innovative firms; Chile adopts a standard sampling atfive percent confidence level.
The second problematic issue regards the ability of the surveys to document innovativeactivities beyond the "success stories" of the largest firms. In the Brazilian case there is a biastowards very large and innovative firms. In the Colombian case the elimination of micro-firms isalso problematic, because they represent a non negligible part of the economy.
The third problem concerns comparability, the question at the root of the Bogotá Manual;major differences in questionnaire design persist among the four countries. In the first section of thequestionnaire, on background data, the Chilean survey gathers information on the share of foreigncapital, turnover and exports; the Colombian one considers only the share of foreign capital; theArgentinean one disregards exports; the Brazilian one ignores exports but includes many details onwho is the respondent, its charge and the geographical dimension of the market. In the secondsection, on innovative activities, the surveys in Brazil and Chile follow the European model, theArgentinean case is more R&D focused, leaving aside organizational activities and failed projects.Colombia considers a larger set of activities, from organizational change to training, fromacquisition of machinery to R&D, but it neglects the performance part and the share of turnover dueto new products, with few questions that try to relate objectives with results and concern intellectualproperty rights.
An additional set of problems with questionnaires concerns the sources, objectives andhampering factors for innovation. These parts provide the most direct indicators of capabilities,since they report the resources available for innovation, the strategies related to it and the hinderingelements that prevent it. The Brazilian questionnaire is closer to the Oslo Manual, but there is adeclination of the objectives in terms of impacts of the innovation which is clearly biased towards"success stories". The Argentinean one ignores the source of ideas, but has a specific section on therelationships with the National Innovation System, while the Chilean one is concise on theobjectives. In Colombia the hampering factors are associated to a long list of objectives, and thereis no attention to cooperation.
Summing up these methodological issues, we may argue that several comparabilityproblems persist; a similar conclusion is reached by Peirano and Crespi (2004) and Anlló (2006),who have monitored the surveys and reviewed the evidence for Latin America. The surveys that arecloser and comparable to the European ones - i.e. Brazil and Chile (as well as Mexico) – tend to bebiased towards large firms.
Looking at the main results obtained by such surveys, we find a significant gap betweenLatin America and European countries in terms of R&D; the private share of R&D is less than onethird of the total, while in advanced countries the proportion is almost double (Benavente et al.2005).
3.4 Africa
In spite of the slow down of the development process in most African countries - where the

9
majority of the labour force remains employed in low productivity or subsistence agriculture -innovation has received a growing attention also in Africa. Here the opportunities for catching upand imitation are often limited by the lack of capabilities, industrial techno-structure, adequatedemand and access to markets.
As an example, Diyamett and Wangwe (2006) analyse Tanzania: the country has doubled thegrowth rate from the 1980s to the late 1990s (from two to four percent per year), but 51% of thepopulation remains under the poverty line. They propose a number of indicators to be consideredfor an innovation survey and argue that a major problem is the lack of science and technologyinfrastructures; the universities are poorly graded and people have limited access to them. Theysuggest considering more closely the role played by government R&D centres, in particular thoselinked with agriculture, and they propose a focus on human resources, their skills andcomplementarities.
The only country in Africa that has systematically performed data gathering exercises oninnovation is South Africa. The country has R&D surveys covering 1991-92, 2001-02, 2003-04, and2004-05 (Gerryts and Buys, 2008). Building on these results, two innovation surveys wereconducted in 2001 and 2005. The design of the questionnaire is close to the CIS one, with asimplification of some questions (Blankley and Kaplan, 2006). The results from the R&D surveysare used to detect the likelihood of innovators, which is biasing the potential inference (Oerlemandet al. 2006); the rate of response of the survey reached 60%.
Most South African studies refer to the first innovation survey and to R&D data, because ofdissemination delays in the second survey. Gettys and Buys (2008) analyze R&D as a determinantof innovative output and show that 88% of innovators conduct R&D, either internally of externally;most R&D focuses on development and little cooperation takes place with universities.
In the context of North African countries, both Morocco and Tunisia developed an interest ininnovation surveys (Arvanidis and Mhenni, 2008). After a first – and more oriented to the R&Dactivity – survey conducted in 1999, a second survey was designed and run in Morocco in 2005,roughly following Oslo Manual guidelines.
A more systematic engagement in gathering innovation data marked the Tunisianexperience, where two innovation surveys based on the Oslo Manual were carried out, covering2002-2004 and 2005-2007. Using the first survey micro data, Ayadi et al. (2007) studied thedeterminants of product and process innovation and the configuration of sectoral patterns ofinnovation of Tunisian firms, providing a detailed analysis of the innovation process in four sectors– Agri–Food Industries; Mechanical and Metal Industries; Electrics, Electronics and ElectricalHome Appliance Industries; Textile and Clothing Industries – that exhibit a superior innovationcapacity (in terms of incidence of product and process innovation) compared to the manufacturingaverage. Their results showed that the main determinant of product innovation in Tunisianinnovative firms is demand, followed by the existence of an R&D Department and the capacity tocarry out technological and scientific cooperation with other actors. Regarding process innovation,competitive pressure, demand and cooperation appear to play a stimulating role. Conversely,openness to foreign markets is not associated to a higher innovation dynamism. As usual, sectoralspecificities exist and matter. In a successive investigation, Ayadi et al. (2009) investigate the maindeterminants of the propensity to innovate by Tunisian firms. They obtain interesting evidence onthe essential role played by sources of technical knowledge external to firms – such as universities,research centres, laboratories, national and international bodies, other firms and external technicalassistance. These results confirm that, in order to generate innovation in firms lacking internalinventive capabilities, absorptive capacity plays a crucial role. Two other results are noteworthy; thefirst one concerns the negative association between state participation in the capital of firms andinnovation propensity, suggesting that bureaucratic resistance to change may prevail over thepotential of access to public resources for innovation. The second one regards the non monotonicrole of exports: the most innovative firms are the ones that serve both domestic and foreignmarkets; conversely the exclusive exporters and the firms that serve only internal market laggedbehind in innovation. The drivers of innovation in Tunisia were the object of another investigation

10
conducted by Gabsy et al. (2008), showing the presence of an “inverted U" type relationshipbetween size of firms and market structure and the decision to innovate; they also emphasize theweak effect of skilled workers and public incentives on the innovative behaviour of Tunisian firms.
4. A comparative analysis
The results reviewed in the previous section show persisting problems of comparability andthe methodological difficulties in studying innovation in Developing Countries; however, importantprogress has been made and the findings of the studies carried out on individual countries or regionsreport patterns that are broadly similar. In order to advance our understanding of innovation, wecarry out in this section a comparison among the results of innovation surveys in a subset ofcountries chosen on the basis of their closeness to the Oslo Manual questionnaire and similarity ofsample design; the largest economies of each continent are included in our analysis. The countrieswe examine include the average for the New Accession Countries of the European Union (EU-NAC)8, Russia, Ukraine, Turkey, China, South Korea, Malaysia, Thailand, Singapore, Taiwan,South Africa, Argentina, Brazil, Chile, Colombia9. We consider the average values for the coregroup of the European Union (EU-15) as terms of reference typical of advanced economies.
We investigate the time period between 2002 and 2006, choosing the appropriate wave ofinnovation surveys in each country. When data are not available or accessible, we choose the closestwave. In the Appendix we indicate the source, with the years covered and the statistical samplingused.
In tables 1-5 below, we show - for the selected countries - the results of innovation surveysfor the following key dimensions:a) the innovative output, in terms of new products and processes, and share of innovative turnover;b) the structure of innovative expenditure, focusing on the core distinction between R&D andacquisition of new machinery;c) the sources of knowledge, distinguishing between internal, external (clients or suppliers) andinstitutional, taking into account also the existence of public funding for innovation;d) the objectives of innovation, that allow to identify the different strategies of innovating firms;e) the hindering factors, that are crucial to understand the barriers to innovation.Data refer to the total of manufacturing or services, providing an aggregate picture of the overallinnovative activities in an economy10.
Table 1 shows that in general EU-1511 outperforms emerging countries in terms ofinnovative output, but the degree of variability among the latter is very large. There are a few Asiancountries – such as South Korea – whose performances are comparable or higher than the EU-15.Most emerging countries and EU-NAC have innovative outputs that are moderately behind EUlevels. A few countries lag behind the EU by a substantial margin – such as Russia, Ukraine andThailand. It should be pointed out here that data on the share of innovative firms report theintroduction of new products or new processes that are new to the firm (rather than new for national
8 New Accession Countries of the European Union (EU-NAC) include the following countries of Central andEastern Europe: Bulgaria, Cyprus, Czech Republic, Estonia, Latvia, Lithuania, Hungary, Malta, Poland, Romania,Slovenia, Slovakia.9 When analyzing data for Malaysia, South Africa and Brazil, we should keep in mind that the sampling design isbiased towards innovators, so the results are likely to be an upper bound.10 As shown by a large literature, the strong differences in innovative patterns across industries and the frequentconcentration of technological activities in a limited number of industries present in Developing Countries suggest thatan industry break down would greatly improve our understanding of the position of each country. Limitation in accessto data has made more detailed data not available.11 When considering data for EU-15 - a benchmark for advanced countries - we should keep in mind a few caveats.EU-15 data are unweighted averages of values for the 15 countries, that include some economies with limitedinnovative activities. European countries are characterised by slow growth, industrial decline, consolidated markets andstrong international integration, and this reflects on their innovative performances.

11
or international industries); likewise, data on innovative turnover refer to the share of sales ofproducts that are new to the firm, including therefore both innovation and imitation; for example,Malaysia has a 42% share on innovative turnover, but the percentage which does not result fromimitation is about 14%. In Developing Countries these variables are mainly an indicator of theextent of imitation and of the ability to modernise production and find new markets, that in turn isaffected by the growth of domestic and foreign demand. This explains why Asian countries andChina have such strong performances on both variables. The cases of Brazil and South Africa areaffected, as already pointed out, by the over-representation of innovative firms in the surveys.Conversely, countries with slow-growing economies, such as Eastern Europe, Russia and others,show much lower shares of innovative firms and turnover. The position of EU-15 reflects thestrength of advanced countries in terms of shares of innovative firms and the consolidation of alarge and integrated production system where firms report relatively low (and stable) shares ofinnovative sales. In presence of strong capabilities and competition, and with slow growth ofmarkets, it is unlikely that most firms can reach and sustain a high share of innovation-related sales.
Table 1. Innovative output.
Legend: M Manufacture, S services, KIBS refers to knowledge intensive business services
Countries Manuf.orServ.
Share ofInnovative
Firms
Product andProcess
(as share ofinnovative
firms)
Product Only(as share ofinnovative
firms)
Process Only(as share ofinnovative
firms)
Share ofturnover
due to new,improvedproducts
EU NAC M 30.7 48.2 22.0 24.9 11.5S 23.8 42.0 23.0 28.1 11.1
EU 15 M 48.9 45.2 21.3 27.7 10.4S 41.5 41.7 22.7 30.7 6.3
RUSSIA M 9.3 10.6S 15.3 3.1
UKRAINE M 11.5 6.7TURKEY M 35.3 25.1 25.0
S 24.6 16.7 18.5CHINA M 30.0 21.3 3.8 4.8 14.4SOUTH KOREA M 42.0 18 18 5 54
S 21.0MALAYSIA M 53.8 10.6 6.2 42*THAILAND M 6.4 4.10 4.3
S 4.0TAIWAN M 39.6 27.6 27.2
S 32.4 23.2 20.4SINGAPORE M 31.7 24.1 22.4 29
KIBS 56.9 44.4 49.4SOUTH AFRICA M 54.8 38.4 11.1 3.5 13.7
S 49.3 22.9 12.7 7.3 7.6ARGENTINA M 41.7BRAZIL M 33.3 38.7
S 51.7 50.4COLOMBIA M 33.4CHILE M, S 37.9 24.9
*includes turnover due to imitationSources: see Appendix.
12
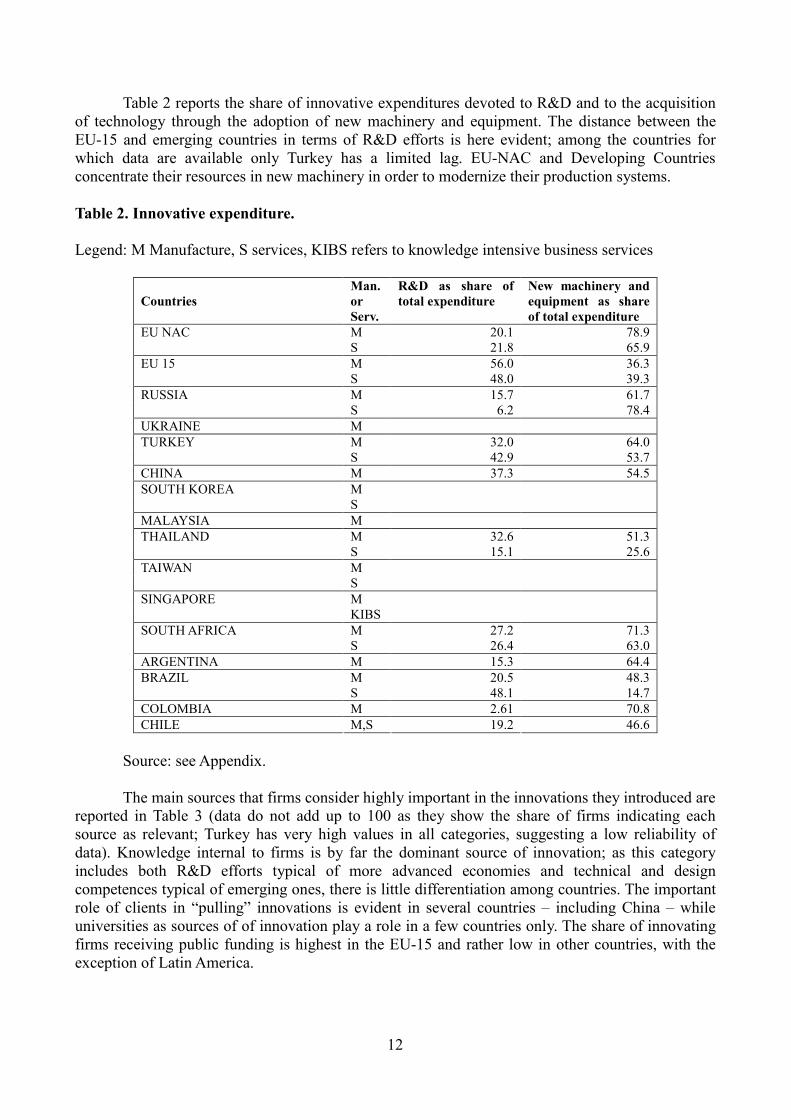
Table 2 reports the share of innovative expenditures devoted to R&D and to the acquisitionof technology through the adoption of new machinery and equipment. The distance between theEU-15 and emerging countries in terms of R&D efforts is here evident; among the countries forwhich data are available only Turkey has a limited lag. EU-NAC and Developing Countriesconcentrate their resources in new machinery in order to modernize their production systems.
Table 2. Innovative expenditure.
Legend: M Manufacture, S services, KIBS refers to knowledge intensive business services
CountriesMan.orServ.
R&D as share oftotal expenditure
New machinery andequipment as shareof total expenditure
EU NAC M 20.1 78.9S 21.8 65.9
EU 15 M 56.0 36.3S 48.0 39.3
RUSSIA M 15.7 61.7S 6.2 78.4
UKRAINE MTURKEY M 32.0 64.0
S 42.9 53.7CHINA M 37.3 54.5SOUTH KOREA M
SMALAYSIA MTHAILAND M 32.6 51.3
S 15.1 25.6TAIWAN M
SSINGAPORE M
KIBSSOUTH AFRICA M 27.2 71.3
S 26.4 63.0ARGENTINA M 15.3 64.4BRAZIL M 20.5 48.3
S 48.1 14.7COLOMBIA M 2.61 70.8CHILE M,S 19.2 46.6
Source: see Appendix.
The main sources that firms consider highly important in the innovations they introduced arereported in Table 3 (data do not add up to 100 as they show the share of firms indicating eachsource as relevant; Turkey has very high values in all categories, suggesting a low reliability ofdata). Knowledge internal to firms is by far the dominant source of innovation; as this categoryincludes both R&D efforts typical of more advanced economies and technical and designcompetences typical of emerging ones, there is little differentiation among countries. The importantrole of clients in “pulling” innovations is evident in several countries – including China – whileuniversities as sources of of innovation play a role in a few countries only. The share of innovatingfirms receiving public funding is highest in the EU-15 and rather low in other countries, with theexception of Latin America.

13
Table 3. Sources of Innovation and Public Support.
Legend: M Manufacture, S services, KIBS refers to knowledge intensive business servicesData are expressed as shares of innovative firms
Countries Man.orServ.
InternalSources
Suppliers Clients Universities Firms receivingpublic financingfor innovation
EU NAC M 39.1 23.6 28.5 3.1 14.7S 39.8 24.1 30.0 3.4 10.0
EU 15 M 47.7 26.8 29.3 5.4 32.9S 49.3 26.4 30.9 4.0 18.0
RUSSIA M 2.4 2.1 4.9 0.3S 3.2 4.6 4.4 0.3
UKRAINE M 3.7TURKEY M 71.0 72.8 74.4 23.4 22.6
S 70.0 73.7 73.8 24.8 8.8CHINA M 37.9 21.6 59.7 8.9SOUTH KOREA M 10-30
SMALAYSIA M 29.3 27.9 41.9 5.7THAILAND M
STAIWAN M
SSINGAPORE M
KIBSSOUTH AFRICA M 54.3 25.9 43.7 10.2 11.9
S 44.9 23.1 26.2 1.1 1.6ARGENTINA M 8.2 21.1 21.1 9.5 1.6BRAZIL M 50.8 40.0 43.0 0.1 19.2
S 74.8 37.3 46.6 11.5 37.7COLOMBIA M 79.0 11.7 22.6 4.6 31.7CHILE M/S 49.8 39.4 14.6 16.7

14
Source: see Appendix.
Table 4. The Objectives of Innovation.
Legend: M Manufacture, S services, KIBS refers to knowledge intensive business servicesData are expressed as shares of innovative firms
Source: see Appendix.
Table 4 shows the main objectives of innovation; strategies based on new and improvedproducts may be linked to a search for new markets and a wider product range, while effortsfocused on production processes may lead to greater capacity and flexibility, or lower labour andother production costs (again, data do not add up to 100 as they show the share of firms indicatingeach objective as relevant; Turkey has again very high values in all categories). Qualityimprovement appears as the dominant objective in emerging countries, associated to other product-related efforts; in parallel, innovation in processes aims at strengthening the productive capacity -especially in Asia and Latin America – with concerns on labour costs playing a more limited role.
The barriers to innovation are highlighted in Table 5 (again, data do not add up to 100 asthey show the share of firms indicating each barrier as relevant; Turkey has very high values in allcategories). Firms in Developing Countries report that the dominant barrier to innovation is the lackof funds - due either to the high costs of innovation or to the lack of internal or external funds
12 Chilean data on objectives should be taken with caution, because the proposed alternatives are very different.
Countries Man.orServ.
Quality
Improvem
ent
Range of Products
New
Markets
Productivecapacity
Flexibility
Labour cost
Other cost
EU NAC M 32.2 30.0 24.9 25.9 22.7 13.3 11.9S
EU 15 M 37.5 33.0 28.5 26.6 26.9 20.4 12.3S
RUSSIA M 34.0 40.5 21.3 17.7 15.2 3.7 7.2S 55.9 50.3 15.0 27.1 25.8 2.9 5.6
UKRAINE MTURKEY M 83.4 76.8 74.2 79.4 78.4 68.1 55.0
S 82.1 70.0 77.0 77.4 76.5 54.3 42.3CHINA M 49.2 45.2 47.3 47.3 32.5 31.9 37.5SOUTH KOREA M 63.0 46.0 52.0 45.3 43.0
S 41.5 32.8 25.0 17.5 24.2 25.0MALAYSIA MTHAILAND M
STAIWAN M
SSINGAPORE M 48.3 44.6 29.9 16.0 16.1 14.4 13.3
KIBS 43.6 25.1 17.8 22.0 14.5 2.2 2.2SOUTH AFRICA M 48.3 44.6 29.9 16.0 16.1 14.4 13.3
S 43.6 25.1 17.8 22.0 14.5 2.2 2.2ARGENTINA MBRAZIL M 68.4 42.0 28.1 58.0 48.3 38.5 39.7
S 82.5 69.3 46.3 66.4 62.3 35.3 33.8COLOMBIA M 53.4 26.5 31.7 46.3 25.5 24.4 24.0CHILE12 M/S 51.8 60.1 59.1 59.1 59.1

15
available – while the lack of human resources, information and demand constraints have a lessrelevant role. In most of these factors, emerging countries report higher difficulties than firms inEU-1513.
Table 5. Hampering Factors.
Legend: M Manufacture, S services, KIBS refers to knowledge intensive business servicesData are expressed as shares of innovative firms
Source: see Appendix.a. The Argentinean questionnaire asks about high risk and not high cost of innovation.b. Brazil does not distinguish between internal and external source of financing, so the total
value is reported in both columns.c. Chilean data do not consider the lack of markets, w and we have replaced it with
13 Hampering factors tend to correlate positively with the resources invested in innovation, a clear evidence thatinnovation is a matter of capabilities, i.e. of seeing the opportunities and the difficulties. When we move towardscountries closer to the technological frontier, we may find that data are more representative of the problems encounteredby the universe of firms and not just by the more innovative ones. Moreover, in a subjective survey firms may point outthe lack of funds as an issue that sums up all problems. In the case of Colombia, where we have investigated themicrodata of the second innovation survey (2003-2004), when we run a regression of innovative expenditures on thehampering factors we have always positive (and sometimes significant) coefficients for all factors except financing,which is negative and significant; technically, we run Tobit-II and hurdles models, so the estimates are robust to thesample selection induced by the survey (non innovators do not fill in this part of the questionnaire).
Countries Man.orServ.
InnovationC
ost
Lack ofinternalresources
Lack ofexternalfinancing
Lack of h uman
Resources
Lack ofinform
ation ontechnologies
Lack ofinform
ationon
ma rkets
Lack ofdem
and
Structure ofthe m
arket
EU NAC M 27.4 27.3 22.4 14.9 7.9 8.8 15.6 18.5S 18.0 17.2 15.3 10.9 7.2 7.3 11.8 15.2
EU 15 M 22.2 22.3 15.4 13.5 7.3 7.9 13.4 14.8S 17.7 18.2 12.7 11.9 6.1 7.8 12.3 12.9
RUSSIA M 22.8 40.3 19.9 6.2 3.4 3.4 6.7S
UKRAINE MTURKEY M 71.1 67.9 57.5 68.3 63.0 50.1 62.3 53.2
S 64.6 59.1 49.0 59.2 47.6 45.8 61.1 50.4CHINA M 5.5 4.5 6.5SOUTH KOREA M
SMALAYSIA MTHAILAND M
STAIWAN M
SSINGAPORE M
KIBSSOUTH AFRICA M 15.5 32.4 16.3 15.3 5.9 1.1 3.3 14.0
S 29.3 26.6 20.7 25.1 1.3 5.2 14.9 30.9ARGENTINAa M 10.5 31.0 3.0 17.4 4.1 3.9 16.7 15.4BRAZILb M 80.6 77.4 77.4 38.7 16.1 45.2 19.4
S 67.1 48.0 48.0 57.6 29.2 38.3 26.4COLOMBIA M 36.3 22.4 22.4 24.4 23.2 25.5 27.5 29.3CHILEc M/S 58.8 31.8 31.8 47.6 25.0 25.0 38.1

16
information on "long period of return"; there is no distinction between the two types of informationproblems, and the total value is reported in both columns.
In the evidence above a systematic comparison between manufacturing and serviceindustries has been provided. Results are generally consistent, showing that innovation can be foundthroughout the economy; innovative efforts and outputs are likely to be stronger in manufacturing,but services are likely to follow closely in most countries; innovation in knowledge intensivebusiness services tends to be higher than in manufacturing. Some specificities emerge on the basisof particular variables: in manufacturing there is a greater role of acquisition of new machinery andcosts are a heavier constrain; in services, internal sources of innovation are more important andpublic funding is lower.
A preliminary way of summarizing this evidence on innovation in emerging countries is tocombine key dimensions of technological efforts – for both manufacturing ans services - in thefigure below. Figure 1 shows the trade off between the two major priorities in the expenditure oninnovation - on the one hand the prevalence of R&D, typical of countries closer to the technologicalfrontier and engaging in original innovation; on the other hand the concentration of resources on theintroduction of new production technologies (usually developed elsewhere) through the acquisitionof new machinery and equipment. Countries in the process of industrialisation tend to devote thelarge majority of their technological efforts to the latter; this is the case of Latin America (with theexception of Brazil), Russia, South Africa, but also of the Central and Eastern European countriesthat have recently joined the EU. On the other hand, China, other Asian countries and Turkey havean intermediate position, devoting their efforts in roughly equal shares to R&D and new machinery;this shows that such countries are moving closer, at least in some sectors, to the European pattern ofexpenditure for innovation.
Figure 1. R&D and acquisition of new machinery in selected countries.Data are expressed as share of total innovation expenditure.

17
Source: see Appendix.
The evidence on innovation can be examined in terms of regional and country patterns,considering also the information offered by more traditional R&D, investment and educationindicators (Table 6 in the Appendix summarises this evidence).
Central and Eastern European countries of new accession to the EU show a substantial gaprelatively to the EU-15 in terms of shares of innovative firms (about 30% against 50%) and in termsof the relevance of internal sources of innovation (about 40% against 50%), while a broadconvergence appears in other variables - innovative sales, other sources, objectives. The keyindicator of the existing gap, however, is the low value of R&D expenditure (one third of the shareof the EU-15) and the dominance of the acquisition of new machinery (with a share double than inthe EU-15). Russia and Ukraine share similar problems and show a much larger gap with theEuropean innovative performances.
The position of Turkey appears closer to the EU-15 averages in most of these variables,suggesting a stronger process of industrialisation and a more solid national science and technologyinfrastructure.
China shows these same characteristics, supported by the very high growth rates of theeconomy, with strong demand "pulling" innovative sales. The most advanced Asian countries -South Korea, Taiwan and Singapore - have innovative performances and shares of R&D in GDPthat are similar to those of the EU-15, with a strong internal generation of innovation and attentionto product improvement in the objectives of innovation. Conversely, Malaysia and Thailand lagbehind in a number of key indicators.
Latin America shows weaker performances in innovation that are associated also to thepatterns of industrialisation that have emerged in the last two decades. The opening up of theeconomies in the 1990s and the introduction of competitive pressure have operated in the directionof improving efficiency through the adoption of technologies developed in advanced economies.The previous model of industrialization through import substitution - inspired in the 1960s by thestructuralist approach of CEPAL - was successful in leading to a take off, but not in putting thosecountries on a sustainable growth path (also for the endemic inefficiency of the government and thenegative impact of the military dictatorships imposed in the 1980s for geopolitical reasons). Incurrent developments, however, there are two main shortcomings: on the one hand, the adoption oftechnology developed for economies with a different factor content has worsened the alreadyunequal wage distribution through skill biased technical change (Attanasio et al, 2003; Lee andVivarelli, 2004); on the other hand, macroeconomic stability is not a sufficient condition for thedomestic generation and accumulation of knowledge, especially in presence of structural capabilitygaps. Even Chile, which is generally praised for the good management of the economy, has a muchweaker innovative performance when compared to countries with a similar income per capita(Benavente et al. 2005). The result is that all indicators of knowledge generation and innovativeperformance (R&D, product innovation, innovative turnover, etc.) maintain a gap versus developedand emerging countries, with the exception of Brazil, where a group of high performance firms hasemerged (De Negri, et al. 2007c). Finally, among the structural problems of Latin America, weshould keep in mind the productivity gap determined by an informal sector that on average accountsfor 40% of GDP.
South Africa has several problems in common with Latin American countries, including theweakness of industrialisation and science and technology infrastructures, a large informal economyand slow growth and demand expansion, resulting in modest innovation performances.
5. Stylized facts on innovation and development
Building on the existing literature - in particular Abramovitz (1986), Lall (1992), Freeman

18
and Louça (2001), Perez (2002) and Nelson (2006) - and based on the empirical evidencesummarised above, we can now propose the following stylized facts on innovation anddevelopment.
Developing Countries have distinct patterns of innovation from countries at the technologyfrontier. Comparisons between advanced and developing countries should be aware that innovationinvolves two largely different processes in the two groups of economies. In the former, a strongR&D capability and science and technology infrastructure is needed to acquire and develop theknowledge and competences needed to operate at the technology frontier; in the latter technologicalchange mainly takes the form of acquisition of new machinery and imitation of the products andprocesses developed elsewhere. Both technology adoption and imitation can spread rapidly amongfirms in emerging countries, with the benefits typical of catching-up processes.
Innovation needs both resources and integration of national systems. In DevelopingCountries the gaps are not simply of a quantitative nature - the amount of R&D, of highereducation, of high technology investment - but concern the nature of the national system ofinnovation, with a lack of integration between firms in the production system, the financial sector,research and education activities and the policies of the public sector. The evidence on the sourcesof knowledge and obstacles to innovation points out the importance of a coherent innovationsystem.
Innovation is pushed by industrialisation and pulled by growth of markets. On the supplyside, innovation is closely linked to the process of industrialisation, as shown by the dominance ofnew machinery among innovative expenditures. One of the necessary requirements for developmentis the emergence of modern services, and an important empirical finding is that innovation inservices has a relevance that is often close to the levels found in manufacturing. On the demandside, countries with strong economic growth and integration in international markets are able torapidly diffuse modern production competences adopting new process technologies and newmachinery, and to find expanding markets for products that imitate those of advanced countries.Industrialisation with technology adoption and growing markets with imitation appear as highlycomplementary developments in the countries that are most successful in the catching up process.
Large firms are more likely to engage in innovation or spend for it. This traditionalSchumpeterian thesis is generally confirmed also in Developing Countries, where the polarisationof the industrial structure tends to be stronger than elsewhere. The capital intensive nature ofinnovation - considering the importance of investment in new machinery - means that the relevanceof large firms (usually in "Fordist" industries) is stronger than in advanced countries, while thespace for small high technology firms (for example in ICTs) is rather limited14.
Being exposed to international competition favours innovation. Firms that face externalcompetition tend to adopt technology faster (an efficiency effect à la Arrow, 1962), a result that hasemerged also in advanced countries15. However, this finding does not mean that developingeconomies may benefit from opening up to trade and foreign competition in all industries; wheredomestic capabilities are inadequate and dynamic scale economies are not yet reached, opening upmay simply put domestic firms out of business, losing part of the production system. The search fora trade off between these opportunities and risks is a matter better left to national industrial policies.
The affiliates of multinational corporations tend to be more innovative. Innovative activitiesoccurring in the affiliates of multinational corporations tend to be higher than the nationalaverage16. This result has emerged also in advanced countries (Castellani and Zanfei, 2006), and is
14 In studies of the determinants of innovation, Langeback and Vasquez (2007) found this result for Colombia,Turriago (2003) for Argentina, Colombia and Venezuela, Benavente (2005a), (2005b) and (2006) for Chile.Chudnovsky et al. (2006) for Argentina, Johnson (2002) for Brazil, and finally Goncalves et al. (2008) for Argentinaand Brazil. Partial confirmation can be found in Marotta et al. (2007), whose coefficient for large firms is significant forColombia but not for Chile.15 The supporting evidence can be found in Alvarez (2001) for Chile, Goncalves et al. (2008) for Argentina andBrazil, Marotta et al. (2007) for Chile, Correa (2005) for a sample of a metropolitan area in Colombia.16 See Langeback and Vasquez (2007) for Colombia, Alvarez (2001) and Benavente et al. (2005) for Chile, while for

19
linked to intra-firm knowledge flows and to the strategies by foreign firms aiming to exploit theircompetences and technologies in local markets. However, in Developing Countries the integrationbetween foreign affiliates and local firms is often modest and the spillover effects in terms ofknowledge, competences and productivity can be small.
The main obstacle to innovation is its economic cost and the lack of finance. While thisresult can be found also in advanced countries, in emerging ones the dimension of the problem ismore serious, and can be interpreted as an indicator of the difficulties of small and mediumenterprises that dominate the industrial structure of Developing Countries (Benavente et al., 2005;Prochnik and Dias, 2005). The absence of advanced and forward-looking financial systems ready tofund long term technology projects and the lack of venture capital are contributing to suchobstacles, and represent a major weakness of national innovation systems in Developing Countries.
It should be pointed out that some of these stylised facts are common to the trajectory ofdevelopment of countries that are now advanced, in particular of "latecomer" economies inSouthern Europe, that experienced a "take-off" in the 1950s and 1960s (see Antonelli et al. 2007 forthe case of Italy).
5.1 Different trajectories in innovation and development
Studies on technology and development have often underplayed the variety of the sourcesand patterns of innovation and the importance of technological trajectories, defined (Dosi, 1982) asthe dominant pattern of accumulation of technological and production capabilities, introduction ofinnovation and economic performance that can characterize firms, industries and countries in theirdevelopment process. Our previous work on advanced countries has identified different innovativestrategies, - e.g. technological competitiveness, active and passive price competitiveness (seePianta, 2001) – that have specific consequences on the evolution of performances, growth,employment and distribution. Building on the empirical evidence provided by innovation surveys,we can now propose a typology of four trajectories linking innovation and development.
a) Technological dependency is typical of countries with little industrial base, where themain part of the economy is made up by agriculture or by few export commodities. The lack of atechnological infrastructure prevents the exploitation of foreign technology, so it becomes difficulteven to imitate. Technology - its different forms - is generally acquired from abroad.
b) Passive technological capabilities is characterized by the acquisition of foreigntechnologies by domestic firms through new machinery and learning processes, leading to newproductions, but with no internal innovative capabilities. This pattern may be typical of economiesthat are resource intensive, commodities exporting or at the first stages of offshore production; theytend to be unable to build a critical mass of domestic knowledge base.
c) Integration in international technology networks is the pattern typical of open economieswith close links between foreign owned domestic firms and the system of international productionof multinational firms. We can find here transfer of technologies, growing production capabilitiesand participation to innovative activities, mainly through the acquisition of new machinery. Thismay lead to positive innovative performances, but with a limited consolidation of the domesticknowledge base.
d) Independent technological capabilities is a trajectory characterized by the development ofinternal innovative capabilities and activities by domestic firms (ranging from R&D to design,imitation and adaptation of foreign know how), leading to new productions for the internal andinternational markets, and the ability to compete with advanced countries at least in someindustries.
Elements of these different trajectories may coexist in different industries of emerging
Brazil we can quote Costa and Robles (2002).

20
countries, and the empirical documentation offered by innovation surveys may further articulate thevariety of the innovative patterns that are associated to the development process. The internationalcomparison we have offered and the stylised facts we have identified show how the use ofinnovation surveys can shed new light on the complexity and specificities of technological changein Developing Countries. This may have important policy implications for national actions andinternational governance in the fields of knowledge production and diffusion, rules on intellectualproperty rights, national innovation systems, investment and industrialisation efforts, trade andforeign investment regimes.
References
Abramovitz, M., (1986): "Catching-up, Forging Ahead and Falling Behind". Journal of EconomicHistory, 46, 385-406.
Alcorta L., Urem B., An T. (2008a): "Foreign ownership and novelty of product innovations inChina". Paper presented at MEIDE II 2008.
Alcorta, L., B. Urem and T. An (2008b): "Do manufacturing firms in China innovate?". Journal ofContemporary Asia, forthcoming.
Altenburg, T., H. Schmitz and A. Stamm (2008): "Breakthrough? China’s and India’s Transitionfrom Production to Innovation". World Development, 36(2): 325-344
Alvarez, R. (2001): "External sources of technological innovation in Chilean manufacturingindustry". Estudios de Economía, 28(1), pp. 53-68
Amsden, A. H., and Mourshed, M. (1997): "Scientific publications, patents and technologicalcapabilities in late-industrializing countries". Technology Analysis and StrategicManagement, 9(3): 343–359.
Anlló, G. (2006): "An overview of Latin America innovation surveys". In: Blankley, et al. (2006)Anlló, G., (2003): "La medicion de la Innovación en America Latina: ¿Porqué el Manual de Oslo no
es suficiente?" Tesis de Maestría, Universidad Nacional de Quilmés, Instituto de EstudiosSociales de la Ciencia y la Technología.
Antonelli C, Barbiellini Amidei F, Giannetti R, Gomellini M, Pastorelli S, Pianta M (2007):"Innovazione tecnologica e sviluppo industriale nel secondo dopoguerra". Laterza, Roma-Bari, pp. 359-594.
Aralica, Z., Domagoj R., Dubravko R. (2008): "Innovation Propensity in Croatian Enterprises:Results of the Community Innovation Survey". South East European Journal of Economicsand Business, 3 (2008) , 1; 77-88
Archibugi, D. and M. Pianta (1996): "Measuring technological change through patents andinnovation surveys". Technovation, 16(9), pp. 451-468.
Archibugi, D and A. Coco (2004): "A New Indicator of Technological Capabilities for Developedand Developing Countries (ArCo)". World Development, 32(4): 629–654.
Archibugi, D., M. Denni, and A. Filippetti (2009): "The technological capabilities of nations: Thestate of the art of synthetic indicators". Technological Forecasting and Social Change, 76:917-931
Archibugi, D. and J. Michie (1997), Technology, globalisation and economic performance (pp. 83–137). Cambridge: Cambridge University Press.
Archibugi, D., Pianta, M. (1996), Innovation Surveys and Patents as Technology Indicators: TheState of the Art, in OECD, Innovation, Patents and Technological Strategies, OECD, Paris,pp.17-56.
Arrow, K. J. (1962) "Economic Welfare and the Allocation of Resources for Innovation" in Nelson(ed.)
Assad, J. (2007) : "La recherche - développement et l’innovation dans les entreprises marocaines:déterminants et impact à partir de l’enquête nationale sur la R&D et l’Innovation",Casablanca, Université Hassan II Faculté des Sciences Juridiques Economiques et Sociales:
21
102.Attanasio, O. P.K. Goldberg and N. Pavnick (2003): "Trade Reforms and Wage Inequality in
Colombia". IFS EWP 03/01Aubert J. (2006): "Innovation systems in emerging and developing economies", in Blankley et al.
(2006)Ayadi, M., Rahmouni, M., and M. Yıldızoğlu (2007): "Les modèles sectoriels d’innovations dans
un pays en développement : le cas de la Tunisie", Cahiers du GREThA No. 2007–19.Ayadi M., Rahmouni M., and M. Yıldızoğlu (2009): "Determinants of the Innovation Propensity in
Tunisia: the Central Role of External Knowledge Sources", GREQAM Document de TravailNo. 2009–05.
Baptista, M. B. (2004): "Indicadores de innovación en Uruguay (1998-2000): balance metodológicoy principales resultados empíricos" Ciencia, Tecnología y Sociedad, 1(2).
Bell, M., and Pavitt, K. (1997): "Technological accumulation and industrial growth: contrastsbetween developed and developing countries" In Archibugi and Michie (eds)
Benavente, J. M. (2006) "The role of research and innovation in promoting productivity in Chile".Economics of Innovation ad New Technology, 15(4-5), pp 301-315
Benavente, J. M. (2005a): "Investigación y Desarrollo, innovación y productividad: un análisiseconométrico a nivel de la firma". Estudios de Economía, 32(1), pp. 39-67
Benavente, J. M. (2005b): "Innovación tecnológica en Chile: donde estamos y qué se puede hacer",Revista Economía, 8(1), pp. 53-74
Benavente, J.M. and R. Lauterbach (2008): "Technological Innovation and employment:complements or substitutes?" European Journal of Development Reearch, 20(2): 318-329
Benavente J.M., R. Lauterbach, (2007a): "R&D Cooperation Determinants, Evidence with ChileanFirms" mimeo.
Benavente J.M., R. Lauterbach, (2007b): "The Effect of Innovation on Employment: Evidence fromChilean Firms", mimeo.
Benavente, J.M. L. De Mello and N. Mulder (2005): "Fostering Innovation in Chile". OECDworking paper 454
Bhagwati, J. (2008) Termites in the Trading System New York: Oxford University PressBlankey W. and D. Kaplan (2006): "South Africa’s first survey of innovation in the manufacturing
sector and recommendations for the next survey" in Blankley et al. (eds) (2006)Blankley, W. (2006): "Measuring innovation in South Africa". Paper presented at the Exhibition
and Conference on Innovative South Africa, Brussels, 26-27 June.Blankley, W. (2007): "Preliminary Results of the South African Innovation Survey, 2005". South
African Journal of Science, 103: 190-192.Blankley, W., M. Scerri, N. Molotia and I. Saloojee (2006): "Measuring Innovation in OECD and
non- OECD countries". South Africa: HSRC PressBlankley, W., C. Moses, M. Kahn, (2007): "Better than Expected Results from First Official
Innovation Survey" HSCR Review 5/2.Blankley, W., C. Moses, M. Ritter, and M. Kahn, (2007): "South African innovation survey 2005:
highlights". (Commissioned by the Department of Science and Technology, April).Bogliacino, F. and A.J. Naranjo R. (2008): "Optimal Intellectual Property Rights Protection: The
case of Colombia". Economics Bulletin, 15(20): 1-15.Breschi, S., F. Malerba and L. Orsenigo (2000): "Technological Regimes and Schumpeterian
Patterns of Innovation", Economic Journal, 110(4): 388-410Brimble, P. (2002): "The Results of Thailand’s R&D and Innovation Survey in the Manufacturing
and Services Sectors", Asia Policy Research Co. Ltd., slides presented during the Seminaron Thailand R&D and Innovation Survey 2002: Final Results.
Cassiolato, J., H. Lastres and Maciel (2003): "Systems of Innovation and Development: evidencefrom Brazil". London: Edward Elgar Publishers.
Castellani, D. and A. Zanfei (2006): "Multinational firms, innovation and productivity".Cheltenham, Elgar.

22
Chadha, A. (2009): "Product Cycles, Innovation, and Exports: A Study of Indian Pharmaceuticals".World Development, 37(9): 1478-1483
Chaminade C., P. Intarakumnerd, and K. Sapprasert, (2008): "Measuring systemic failures ininnovation systems in developing countries using innovation survey data: The case ofThailand", mimeo.
Chang H.-J. (2001): "Intellectual property rights and economic development. Historical lessons andemerging issues". Journal of Human Development, 2, 2.
Cheng X. (2008): "Research on Regional Enterprise Innovation through the Innovation Survey inHaidian District", paper presented at MEIDE II 2008.
Chudnovsky, D., A. Lopez, and G. Pupato (2006) "Innovation and Productivity in DevelopingCountries: A study of Argentine manufacturing firms' behavior (1992-2001)" ResearchPolicy, 35(2): 266-88
Cimoli, M., Dosi, G. and Stiglitz, J. (eds) (2009): Industrial Policy and Development. The PoliticalEconomy of Capabilities Accumulation. Oxford, Oxford University Press.
Cohen, W. M. and R. C. Levin (1989), "Empirical Studies of Innovation and Market Structure" inR. Schmalensee, R. D. Willig (eds.), 2: 1059-1107
Commission on Growth and Development (2008): "The Growth Report: Strategies for SustainedGrowth and Inclusive Development", Washington, DC.
Correa Ospina, A. (2005): "Intensidad innovadora, permanencia exportadora, y destino de lasexportaciones: análisis para una muestra de empresas de Cali" Revista Economía, Gestión yDesarrollo, 3:9-20
Costa, I. and S. Robles R. de Q. (2002): "Foreign Direct Investment and Technological Capabilitiesin Brazilian Industry" Research Policy, 31(8-9): 1431-1443
Crépon B., Duguet E., Mairesse J. (1998) "Research and development, innovation and productivity:an econometric analysis at the firm level". Economics of Innovation and New Technology,7(2): 115-158.
Crespi G. and Peirano F. (2007a): "Innovation surveys in Latin America: an overview of theexperience in Argentina, Brazil, Chile and Uruguay" mimeo.
Crespi, G. and F. Peirano (2007b): "Measuring Innovation In Latin America. What we did, wherewe are and what we want to do" paper presented at MEIDE I 2007
Damijan J.P., Kostevc C, Rojec M., Majcen B., (2008): "Innovation and firms' productivity growthin Slovenia. Does estimation method influence the result?" mimeo.
De Bresson C., Shiqing X. and Mohnen P. (2006): "Estimating disparities, complementarities andgaps between regions and countries: The case of China and its provinces in 1993" inBlackley et a. (eds), 2006
De Mel, S., D. McKenzie and C. Woodruff (2009) "Innovative Firms or Innovative Owners?Determinants of Innovation in Micro, Small, and Medium Enterprises". Mimeo presented atthe Aspirations and Poverty Workshop, University of Warwick, 14th and 15th December2009.
De Negri J.A., De Negri F., Arujo B.C. (2007a): "Channels of international technology transfer inbrazilian industrial firms", mimeo.
De Negri J.A., De Negri F., Freitas F. (2007b): "Does technological innovation cause Exports inBrazil and Argentina?", mimeo.
De Negri J.A., Salerno M.S., de Castro A.B. (2007c): "Innovations, Technological Patterns andPerformance of Brazilian Industrial Companies" paper presented at MEIDE I 2007.
De Negri, J.A., L. Esteves and F. Freitas (2007d) "Knowledge production and firm growth inBrazil", Universidade Federal do Paraná working paper 0020.
Deardorff, A.V. (1992): "Welfare Effects of Global Patent Protection". Economica, 59(323): 35-51Djiofack-Zebaze, C. and Keck, A. (2009): "Telecommunications Services in Africa: The Impact of
WTO Commitments and Unilateral Reform on Sector Performance and Economic Growth".World Development, 37(5): 919-940
Dosi, G. (1988): "Sources, Procedures and the Microeconomic Effects of Innovations". Journal of
23
Economic Literature, 26(3), pp. 1120-1171Dosi, G. (1982): "Technological paradigms and technological trajectories: a suggested
interpretations of the determinants and directions of technical change". Research Policy, 11:147-162
Doumbia-Henry, C. and E. Gravel (2006) "Free trade agreements and labour rights: Recentdevelopments" International Labour Review, 145(3)
Echevarría, J. J., M. A. Arbelaez, and M. F. Rosales (2006): "La productividad y sus determinantes:el caso de la industria colombiana" Desarrollo y Sociedad, 57: 77-122
ENIT (2005) "Encuesta Nacional Sobre Innovación y Conducta Tecológica" Institudo Nacional deEstadística y Censos, Buenos Aires
EU-Russia Cooperation Programme (2007): "Indicators of innovation in the Russian Federation",Databook. State University-Higher School of Economics, Moscow.
Eurostat, (2008): "Science, technology and innovation in Europe, 2008 edition". Luxembourg,European Commission.
Fagerberg, J. and M. Srholec (2009) "Innovation systems, technology and development: unpackingthe relationships" in B. Lundvall, K. J. Koseph, C. Chaminade and J. Vang (eds.) Handbookof Innovation Systems and Developing Countries, Cheltenham, UK and Northampton, MA,USA: Edward Elgar Publishing
Falvey R., Folster N., Memedovic O. (2006): "The Role of Intellectual Property Rights inTechnology Transfer and Economic Growth: Theory and Evidence", paper for the UNIDOProject "Public Goods for Economic Development".
Figuereido, P. N. (2008): "Industrial Policy Changes and Firm-Level Technological CapabilityDevelopment: Evidence from Northern Brazil". World Development, 36(1): 55-88
Freeman, C. and Louçã, F. (2001): "As time goes by. From the industrial revolution to theinformation revolution". Oxford: Oxford University Press.
Gabsi, F., Mhenni, H., and Koouba, K. (2008): "Innovation Determinants in Emerging Countries:An Empirical Study at the Tunisian Firms level", MPRA paper No. 17940.
Gerryts, B. A. and A.J Buys (2008): "R&D as a source of innovation in South Africa". University ofPretoria, mimeo
Goedhuis, M. (2007): "The impact of innovation activities on productivity and firm growth:evidence from Brazil" UNU-MERIT working paper 002
Goedhuys M., Janz N., Mohnen P. (2008): "Knowledge-based productivity in ‘low-tech’ industries:evidence from firms in developing countries", mimeo.
Goedhuys, M., Janz, N., Mairesse J. and Mohnen P., (2008): "Micro evidence on innovation anddevelopment (MEIDE): an introduction". European Journal of Development Research, 20,167-171
Goedhuys, M, (2005): "Measuring innovation: Making innovation surveys work for developingcountries" Technology Policy Brief, 4(1), UNU-MERIT, Maastricht, Netherlands
Goncalves, E., J. de for a, M. Borges L., and J. de Negri (2008): "Condicionantes de la innovacióntecnológica en Argentina y Brasil", CEPAL Review, 94:75-99
Gu, J, J. Humphrey and D. Messner (2008): "Global Governance and Developing Countries: TheImplications of the Rise of China". World Development, 36(2): 274-292
Hall, B.H. and A. Maffioli (2008): "Evaluating the impact of Technology Development Funds inEmerging Economies. Evidence from Latin America". NBER wp 13835
Hitendra P. and Chakarian E., (2008): "The State of Innovation at firm level in Singapore."Singapore: SNP Reference for Institute of Policy Studies.
Hoekman, B. M., K. E. Maskus, and K. Saggi (2005) "Transfer of Technology to DevelopingCountries: Unilateral and Multilateral Policy Options", World Development, 33(10): 1587-1602
Hsien-Ta Wang, Tsui Mu, Li-Kung Chen, Tzy-Mei Lin, Chih-Ming Chiang, Hsin-Neng Hsieh, Yu-Ting Cheng and Ben-Chang Shia, (2003): "A Survey for Technological Innovation inTaiwan", Journal of Data Science 1, 337-360.
24
IBGE (2005) "Pesquisa de Inovaçao tecnológica 2005" Instituto Brasileiro de Geografia eEstatística.
Ijichi T., (2005): "Japanese experiences on the Innovation Survey", paper presented at NESTI,Reijkiavik.
INE (2005) "Resultados Cuarta Encuesta de Innovación Tecnológica" INE Documentos de trabajoIntarakumnerd, P. and Chaminade, C. (2007): "Strategy versus Practice in Innovation Systems
Policy: the case of Thailand", Asian Journal of Technology Innovation, 15(2): 197-213.Intarakumnerd, P. et al. (2002): "National Innovation System in Less Successful Developing
Countries: the Case of Thailand", Research Policy, 31(8-9): 1445-1457Intarakumnerd, P. et al. (2003): "Thailand’s National Innovation System (NIS) in the Context of
East Asian Economies: Initial Findings, National Science and Technology DevelopmentAgency" downloadable from www.nstda.or.th/nstc.
Janz N., Kahn M. (2008): "Innovation and Knowledge Flows in the South African ManufacturingIndustry: Econometric Evidence from the National Innovation Survey", mimeo.
Johnson, D. K. N. (2002) "Learning-by-Licensing: R&D and Technology Licensing in BrazilianInvention" Economics of Innovation and New Technology, 11(3): 163-177
Kam P.W., M. Kiese, A. Singh and F. Wong, (2002): "The Pattern of Innovation in Singapore’sManufacturing Sector", Centre for Entrepreneurship Working Paper
Keller, W. (2004): "International Technology Diffusion", Journal of Economic Literature, 42: 752-782
Knell M. and Srholec M., (2004): "Innovation Cooperation and Foreign Ownership in the CzechRepublic", paper presented at 30th EIBA Annual Conference, Ljubljana.
Lall, S and Pietrobelli, C. (2002): "Failing to Compete: Technology Development and TechnologySystems in Africa", Cheltenham: Elgar.
Lall, S. (1992): "Technological capabilities and industrialisation", World Development, 20(2): 165-186.
Langebaek R., A. and D. Vasquez E. (2007): "Determinantes de la actividad innovadora en laindustria manufacturera colombiana", Banco de la República, Borradores de Economía 433.
Lederman, D. and L. Saenz (2005): "Innovation and Development around the World, 1960-2000",Policy Research Working Paper Series, 3739, The World Bank
Lee, E. and M. Vivarelli (2006): "The Social Impact of Globalization in the Developing Countries,International Labour Review, 145: 167-184.
López, R. A. (2008): "Foreign Technology Licensing, Productivity, and Spillovers". WorldDevelopment, 36(4): 560-574
Lucidi, F. and A. Kleinknecht (2009) " Little innovation, many jobs: An econometric analysis of theItalian labour productivity crisis" Cambridge Journal of Economics, published online April,17
Lugones, G. (2006): "The Bogotá Manual: Standardising innovation indicators for Latin Americaand the Caribbean" in: Blankley et al. (2006)
Lugones G., and Peirano F. (2003): "The innovation Surveys in Latin America: Results andmethodological novelties", paper presented at Conferência internacional sobre sistemas deinovação e estratégias de desenvolvimento para o terceiro milênio.
Lugones G., and Peirano F. (2004a): "Proposal for an annex to the OSLO manual as a guide forinnovation surveys in less developed countries non-member of the OECD", mimeo.
Lugones, G. and Peirano F. (2004b): "Segunda encuesta Argentina de innovación (1998/2001).Resultados e implicancias metodológicas". Ciencia, Tecnología y Sociedad, 1(2).
Lundin N., Mannfelt B., Guan X., Deng (2008): "S&T and innovation statistics in China", paperpresented at NESTI, Vinnova, Vienna.
Mairesse, J. and P. Mohnen (2008) "Innovation surveys and innovation policy" paper presented atthe conference "En route vers Lisbone", 4th and 5th December 2008
Mairesse, J., Y. Zhao and F. Zhen (2009) "Employment Growth and Innovation in China: A FirmLevel Comparison across Provinces and City Districts", paper presented at the MEIDE III
25
conference.Malaysian Science and Technology Information Centre (MASTIC) (2006), National Survey of
Innovation 2002-2004Malaysian Science and Technology Information Centre (MASTIC) (1994) National Survey of
Innovation in Industry, downloadable at www.mastic.gov.myMalaysian Science and Technology Information Centre (MASTIC), (1997-1999) National Survey of
Innovation, downloadable at www.mastic.gov.myMalaysian Science and Technology Information Centre (MASTIC), (2000-2001) National Survey of
Innovation, downloadable at www.mastic.gov.myMalerba F. (2004): "Sectoral systems of innovation". Cambridge, Cambridge University Press.Maloney, W. F. and G. Perry (2005): "Hacia una política de innovación eficiente en América Latina"
CEPAL Review, 8, pp. 25-44Mani S. (2008): "Innovation surveys in developing countries: what can we learn from it for public
innovation policies?", paper presented at the conference on Micro evidence on innovationdeveloping countries, May 31- June 1, UNU-MERIT, Maastricht, The Netherlands.
Manual de Bogotá (2001): "Normalización de Indicadores de Innovación Tecnológica en AméricaLatina y el Caribe". RICYT / OEA / CYTED/ COLCIENCIAS / OCYT. available on line atwww.ricyt.org/interior/difusion/pubs/bogota/bogota.pdf
Marotta, D., M. Mark, A. Blom and C. Thorn (2007): "Human Capital and Unievrsity-Industrylinkages’ role in fostering firm innovation: an empirical study of Chile and Colombia",World Bank, Policy Research Working Paper, 4443
Masso J., and P. Vahter (2008) "Technological innovation and productivity in late-transitionEstonia: econometric evidence from innovation surveys" The European Journal ofDevelopment Research, 20(2): 240 - 261
Meschi, E., E. Taymaz, E. and M. Vivarelli (2008): "Trade Openness and the Demand for Skills:Evidence from Turkish Microdata", IZA Discussion Paper No. 3887
Mohnen, P. and Mairesse J. (2007): "A survey of innovation surveys: Taking stock of a growingliterature", paper for the Banque de France conference on innovation, Paris.
Morrison, A., C. Pietrobelli, and R. Rabelotti (2006): "Global Value Chains and TechnologicalCapabilities: A Framework to Study Industrial Innovation in Developing Countries".Quaderni SEMeQ, n.03/2006
Mytelka, L. K., Goedhuys M., Arundel A. and Gachino G., (2004): "Designing a policy-relevantinnovation survey for NEPAD". Study prepared for the Memorandum of Agreement betweenThe Development Bank of Southern Africa Limited and the United Nations UniversityInstitute for New Technologies (UNU-INTECH).
National Bureau of Statistics of China (2008): "Innovation Survey on Chinese IndustrialEnterprises", paper for the OECD NESTI Meeting, Paris.
National Science and Technology Development Agency (2002): "Thailand R&D and InnovationSurvey 2002".
Nelson R.R. (2006): "Economic Development From the Perspective of Evolutionary EconomicTheory", Working Papers in Technology Governance and Economic Dynamics, 2.
Nelson, R.R. (1962): "The rate and Direction of Inventive Activity", Princeton University PressNiedbalska, G. (2001): "Innovation Activities in Polish Industry in 1998-2000: Main Results from
the GUS 2001 Innovation Survey". Centre for the Study of Economics and Social Change inEurope School of Slavonic and East European Studies Working Paper No.25. UniversityCollege London.
Nannan L., Fredrik Sjöholm and Jinchang Qian (2006), "The Role of Small Firms in China’sTechnology development", Working Paper 227, Stockholm School of Economics.
Ocampo, J. A. (2010) "Rethinking Global Economic and Social Governance" Journal ofGlobalization and Development, 1(1), article 6
OECD (2007) "Innovation and Growth. Rationale for an Innovation Strategy" mimeo Paris: OECDOerlemans L. and J. Knoben (2007): "The relative effect of utilizing knowledge from competitors
26
on the newness of innovations", mimeo.Oerlemans, L, M.W. Pretorius, A.J. Buys, and G. Rooks (2003): "South African Innovation Survey
2001: Report on the South African Innovation Survey for the Period 1998-2000", Universityof Pretoria, South Africa and Eindhoven Centre for Innovation Studies, The Netherlands,December, downloadable from www.sais2001.up.ac.za/index.htm.
Oerlemans, L., A.J. Buys and M.W. Pretorius (2001): "Research Design for the South AfricanInnovation Survey 2001" paper presented at the International Seminar on the Measurementof Innovation Activities, 28-29 March 2001, Pretoria, South Africa.
Oh I., S. Han, A. Heshmati (2007): "The Relationship between Innovation and Performance ofKorean Manufacturing Firms" paper for the UNU-MERIT conference on Micro evidence oninnovation developing countries, Maastricht.
Pamukcu T. and P. de Boer (2000): "Determinants of Technological Activities in TurkishManufacturing Industries: A Microeconometric Analysis", MEEA Journal. Middle EastEconomic Association and Loyola University of Chicago. Downloadable fromwww.luc.edu/publicatons/academic
Patarapong and Intarakumnerd, (2007): "Measuring Innovation in Catching-up Economies: AnExperience from Thailand", mimeo
Pavitt K. (1984): "Patterns of technical change: towards a taxonomy and a theory", ResearchPolicy, 13, 343-74.
Pavnick, N., A. Blom, P. Goldberg and N. Schady (2003): "Trade Liberalization and Labor Marketin Brazil". Policy Research Working Paper 2932. World Bank
Perez, C. (1994) "Technical change and the new context for development" in Mytelka, L. (ed.)South and South Co-Operation in a global perspective", OECD (Organization for EconomicCo-operation and Development), Paris, pp. 55-87
Perez, C. (2002): "Technological revolutions and financial capital", Cheltenham, Edwrad Elgar.Perez, C. (2008): "A VISION FOR LATIN AMERICA: a resource-based strategy for technological
dynamism and social inclusion" Globelics working paper series, WPG0804Petit, P., Soete, L. (2001): "Technology and the future of European Employment". Elgar,
CheltenhamPianta M. (2001): "Innovation, Demand and Employment," in: Petit, P., Soete, L. (Eds.): 142-165.Pietrobelli, C. (2000): "Technology transfer for developing countries". In D. Schroeer & M. Elena
(Eds.), Technology transfer (pp. 209–234). London: Ashgate.Ping, H., J. Qian, N. Lundin, and F. Sjöholm (2008), "Technology Development and Job Creation in
China’s Manufacturing Sector", Mimeo presented at the 2d MEIDE Conference, RenminUniversity, Beijing, April 21-23, 2008.
Prima A. and Rovira S. (2007): "Science-industry links in Latin America: empirical evidence fromNational Innovation Surveys", paper for the UNU-MERIT conference on Micro evidence oninnovation developing countries, Maastricht.
Prochnik, V. and R. Dias d. A. (2005): "Uma análise do baixo grau de inovaçao na indústriabrasileira a partir do estudio das firmas menos inovadoras" IBGE mimeo
Radosevic S. (1999): "Patterns of innovative activities in countries of Central and Eastern Europe:An analysis based on comparison of innovation surveys", SPRU Electronic Working PaperSeries 35, University of Sussex, SPRU - Science and Technology Policy Research.
Radosevic S. (2004): "A Two-Tier or Multi-Tier Europe? Assessing the Innovation Capacities ofCentral and East European Countries in the Enlarged EU", Journal of Common MarketStudies, 42(3), 641-666
Radosevic S. (2006): "Innovation surveys in Central and Eastern Europe: Results and policyissues" in Blackley et al. (2006)
Radosevic, S. (2002): "Regional Innovation Systems in Central and Eastern Europe: Determinants,Organizers and Alignments", The Journal of Technology Transfer, 27(1): 87-96
Raffo J., S. Lhuillery and L. Miotti (2008): "Northern and Southern innovativity: a comparisonacross European and Latin American countries", The European Journal of Development

27
Research, 20(2): 219-239.R&D Maroc and J. Assad (2007): "Rapport sur la recherche-développement et l’innovation dans les
entreprises marocaines. Application de l’analyse factorielle des correspondances multiples",Bondy et Casablanca, Projet ESTIME, R&D Maroc & IRD.
Revilla Diez J., and M. Berger (2003): "Technological capabilities and innovation in southeast asia- empirical evidence from Singapore, Penang (malaysia) and Thailand", Paper to bepresented at the DRUID Summer Conference 2003 on CREATING, SHARING ANDTRANSFERRING KNOWLEDGE. The role of Geography, Institutions and Organizations.
Robledo V., J., F. A. Gomez J., and J. F. Restrepo A. (2008): "Relación entre capacidades deinnovación tecnológica y desempeño empresarial en Colombia".
Rodrik, D. (1997) Has Globalization Gone To Far? Washington D.C., Institute for InternationalEconomics
Roud V. (2007): "Firm-level Research on Innovation and Productivity: Russian Experience",mimeo.
Roud V. (2008): "Patterns of innovative behaviour of Russian manufacturing firms: analysis offirm- level data", paper presented at MEIDE conference.
Salazar, M. and A. Holbrook (2004): "A debate on innovation surveys", Science and Public Policy,31(4), pp. 254-266
Sargent, J. And L. Matthews (2008): "Capital Intensity, Technology Intensity, and SkillDevelopment in Post China/WTO Maquiladoras". World Development, 36(4): 541-559
Schmalensee, R. and R. D. Willig (1989) Handbook of Industrial Organization. North-Holland:Amsterdam.
Shin, T.Y. (2002): "Korean Innovation Survey 2002: Manufacturing Sector", downloadable fromwww.stepi.re.kr
Silva A., Araújo B., Raffo J. (2008): "The microeconomics of growth of manufacturing firms andtechnological innovation: evidence from Brazil and 7 European countries", mimeo.
Sirilli, G. (1997): "Science and technology indicators: the state of the art and prospects for thefuture". In G. Antonelli & N. De Liso (Eds.), Economics of structural and technologicalchange (pp. 281–306). London: Routledge.
Smith, K. (2005): "Measuring innovation". In Fagerberg, J., Mowery, D and Nelson, R. (eds), TheOxford Handbook of Innovation, Oxford, Oxford University Press.
Srholec, M., (2008): "A multilevel analysis of innovation in developing countries", UNU-MERITWorking Paper n. 40.
Stiglitz J. (2008): "Economic Foundations of Intellectual Property Rights", Duke Law Journal, 57:1692-1724.
Sutz J. (2007): "Building accurate mirrors: innovation indicators for better innovation policies inunderdevelopment", mimeo
Sutz J. (2007): "Innovation surveys: Critical Assessment of a Potentially Powerful Policy Tool",paper presented at Atlanta Conference on Science, Technology, and Innovation Policy 2007,Georgia, Atlanta.
Sutz, J. (2000): "Las encuestas de innovación latinoamericanas : an ánalisis comparativo de lasformas de indagación". Working paper for the project Normalización de Indicadores deInnovación Tecnológica en America Latina. OEA.
Turriago, A. (2003): "Some aspects of technological innovation and activities in Colombia:comparison with three Latin American countries". Cuadernos de administración de laUniversidad Javeriana
UNDP (2001): "Human development report. Making new technologies work for humandevelopment." New York: Oxford University Press.
UNIDO (2003): "Industrial development report 2002–2003. Competing through innovation andlearning". Vienna: UNIDO.
Vergara, R. and R. Riverio (2005): "Productividad Sectorial en Chile: 1986-2001" IE-PUCDocumento de Trabajo, 286

28
Viotti E. (2008): "Innovation Indicators and Policy: Some reflections on limitations andpotentialities of innovation surveys", paper presented at Atlanta Conference on Science,Technology, and Innovation Policy 2007, Georgia, Atlanta
Viotti, E. and Baessa A. (2005): "Innovation in developing countries versus developed countries,Some evidences from a comparison of the innovation surveys of Brazil and selectedEuropean countries", paper presented at the Globelics 2005 Africa, Tshwane University ofTechnology, Tshwane.
World Bank, (1999): "World Development Report 1998-1999: Knowledge for development".Washington: World Bank
Yegorov, I. (2008): "Innovation Policy and Problems of Creation and Development of the NationalInnovation System in Ukraine", paper for the UNECE conference, 14-15 February 2008,Geneva.
Zao X., Cheng X. (2008): "Research on Regional Enterprise Innovation through the InnovationSurvey in Haidian District", paper presented at MEIDE II 2008.

29
Appendix
We report here a set of variables on technology and industry that can be compared with theinnovation data of previous tables. R&D expenditure and employment are a proxy for theknowledge base; the share of gross fixed capital formation is an indicator of investment andtechnology adoption; the share of manufacturing on GDP provides evidence of industrialisation,expansion of the formal economy and technology use; Foreign Direct Investment (FDI) on GDP isan indicator of international openness and dynamism; the share of people with secondary educationis a measure of human capital.
Table 6. Selected indicators for emerging countries
Country R&Das a shareof GDP2000
R&D empl.per thous.LabourForce2000
Gross fix.capital
form. as ashare of
GDP, avg.2002-2006
Manuf.industry
as a share ofvalue added
avg. 2002-2006
FDI as ashare of
GDPavg.
2002-2006
Secondaryeducationas share ofpopul. aged25-64, avg.2002-2006
EU-15 1.91 5.5 19.46 26.40 0.034 64.92EU-NAC 0.68 2.9 23.49 31.68 0.071 75.55RUSSIA 1.09 5.0 20.62 36.05 0.018 78.06UKRAINE 0.96 3.1 21.36 33.43 0.040 88.28TURKEY 0.48 0.9 19.32 28.59 0.010 26.75CHINA 0.99 0.8 42.17 46.66 0.032SOUTHKOREA
2.65 4.9 29.66 37.18 0.007 77.42
MALAYSIA 0.48 0.6 22.30 47.92 0.030 21.49THAILAND 0.25 0.3 27.10
/27.6543.57 0.037
TAIWAN 2.05 5.6 18.58 27.59 -0.011 64.18SINGAPORE 1.87 5.8---7.6 19.98 32.42 0.126 45.59SOUTHAFRICA
0.70 0.8 17.81 31.51 0.010 13.92
ARGENTINA 0.43 1.2 18.24 34.71 0.022 40.38BRAZIL 0.99 1.9 16.76 28.78 0.024 36.80CHILE 0.54 0.6 20.44 46.92 0.058 73.13COLOMBIA 0.24 0.1 20.39 32.54 0.035
Sources:
- column two, three and four: Lederman and Saenz (2005); Eurostat New Cronos Database; WorldBank,World Development Indicators database; South Africa Human Science Research Council;Association of Southeast Asian Nations (2010), S&T Indicators/Technology CompetitivenessIndicators.- column five: World Bank, 54 indicators; Taiwan Council for Economic Planning and Development(2009), Taiwan Statistical Data Book.- column six: both FDI and GDP are expressed in current USD; for countries outside Europe theaverage covers 2002-2005; World Bank, 54 indicators; Taiwan Council for Economic Planning andDevelopment (2009), Taiwan Statistical Data Book.- column seven: ILO, LaborSta; OECD Labour Force Statistics, Education at Glance; TaiwanStatistical Data Book.

30
In Table 7 below we report the details on the innovation surveys analyzed in the article,listing the wave of reference, years, population covered and sampling procedures. The publicationsused for each country as sources of the data reported in our tables are listed in the bibliography.
Table 7. Details on the Innovation Surveys considered.
Country Wave Years Population Sample
EU-15 IV 2002-2004 Manufacturingand Services Stratified sample (above ten employees)
EU-NAC IV 2002-2004 Manufacturingand Services Stratified sample (above ten employees)
ARGENTINA IV 2005 Manufacturing Stratified sample
BRAZIL III 2003-2005 Manufacturingand some services
All firms with more than 500 (100)employees in manufacturing (services);sampling below the threshold; biasedtowards innovators
CHILE IV 2003-2004 Manufacturing Stratified sample
CHINA I 2004-2006 Manufacturing All firms with a turnover larger than 5millions won
COLOMBIA II 2003-2004 Manufacturing All firms with more than 10 employees
MALAYSIA IV 2002-2004 Manufacturing Stratfified sample of firms with more than5 employees
RUSSIA
SINGAPORE I 1996Manufacturingand High TechServices (KIBS)
Stratified sample
SOUTH AFRICA II 2002-2004 Manufacturingand Services
Stratified sample, innovators are detectedthrough the use of R&D surveys, thus thesample may be biased.
SOUTH KOREA 2002-2004 Manufacturing Stratified sample of firms with more thanten employees
TAIWAN III 2007 Manufacturingand Services
Stratified sample of firms with more than 5employees
THAILAND III 2003 Manufacturingand Services
Stratified sample of firms with more than10 employees
TURKEY V 2004-2006 Manufacturing Stratified sample of firms with more than10 employees
UKRAINE

Documents de travail du BETA _____
2010–01 The Aggregation of Individual Distributive Preferences through the Distributive Liberal Social
Contract : Normative Analysis Jean MERCIER-YTHIER, janvier 2010. 2010–02 Monnaie et Crise Bancaire dans une Petite Economie Ouverte Jin CHENG, janvier 2010. 2010–03 A Structural nonparametric reappraisal of the CO2 emissions-income relationships Theophile AZOMAHOU, Micheline GOEDHUYS, Phu NGUYEN-VAN, janvier 2010. 2010–04 The signaling role of policy action Romain BAERISWYL, Camille CORNAND, février 2010. 2010–05 Pro-development growth and international income mobility: evidence world-wide Jalal EL OUARDIGHI, mars 2010. 2010–06 The determinants of scientific research agenda: Why do academic inventors choose to
perform patentable versus non-patentable research? Caroline HUSSLER, Julien PENIN, mars 2010. 2010–07 Adverse Selection, Emission Permits and Optimal Price Differentiation Mourad AFIF, Sandrine SPAETER, mars 2010. 2010–08 The impact of ambiguity on health prevention and insurance Johanna ETNER, Sandrine SPAETER, mars 2010. 2010–09 Equité du plaider coupable : une analyse économétrique dans trois tribunaux de grande
instance français. Lydie ANCELOT, mars 2010. 2010–10 Networks, Irreversibility and Knowledge Creation. Patrick LLERENA , Muge OZMAN, mars 2010. 2010–11 Les clusters et les réseaux comme fondements de la dynamique d'innovation dans l'industrie
biopharmaceutique Marc Hubert DEPRET, Abelillah HAMDOUCH, avril 2010. 2010–12 Large-scale risks and technological change: What about limited liability? Julien JACOB, Sandrine SPAETER, avril 2010. 2010–13 Innovation and Development. The Evidence from Innovation Surveys Francesco BOGLIACINO, Giulio PERANI, Mario PIANTA, Stefano SUPINO, avril 2010.
La présente liste ne comprend que les Documents de Travail publiés à partir du 1er janvier 2010. La liste complète peut être donnée sur demande. This list contains the Working Paper writen after January 2010, 1rst. The complet list is available upon request.
___________________________________________
Copyright © 2022 FDOKUMEN