Innovation, profitability and growth in medium and high-tech manufacturing industries: evidence from...
27
KITeS Knowledge, Internationalization and Technology Studies Working Paper KITeS - Università Bocconi Via Röntgen 1- 20136 Milano tel. +39 025836.3395/7 fax +39 025836.3399 www.kites.unibocconi.it Università Commerciale Luigi Bocconi n. 28/2009 Claudio Cozza, Franco Malerba, Maria Luisa Mancusi, Giulio Perani and Andrea Vezzulli Innovation, profitability and growth in medium and high-tech manufacturing industries: Evidence from Italy.
-
Upload
independent -
Category
Documents
-
view
1 -
download
0
Transcript of Innovation, profitability and growth in medium and high-tech manufacturing industries: evidence from...

KITeS Knowledge, Internationalization and Technology Studies
Working Paper
KITeS - Università Bocconi Via Röntgen 1- 20136 Milano tel. +39 025836.3395/7 fax +39 025836.3399 www.kites.unibocconi.it
Via
Sar
fatti
25
2013
6 M
ilano
Uni
vers
ità C
omm
erci
ale
Luig
i Boc
coni
n. 28/2009
Claudio Cozza, Franco Malerba, Maria Luisa Mancusi, Giulio Perani and Andrea
Vezzulli
Innovation, profitability and growth
in medium and high-tech manufacturing industries:
Evidence from Italy.

Innovation, profitability and growth in medium and high-tech manufacturing industries:
Evidence from Italya.
Claudio Cozzab, Franco Malerbac,f, Maria Luisa Mancusic,f, Giulio Peranid, Andrea Vezzullie,f
Abstract
The main goal of this paper is to assess the impact of product innovation on the economic performance of firms operating in medium and high-tech industries in general and of SMEs in particular. Using information from a large and unique dataset on Italian firms we estimate, by means of propensity scores matching methods, a positive and significant “innovation premium” both in terms of profitability and growth (in the short run) for those firms who introduced new innovative products. We also find that this innovation premium is particularly large for small firms and even more so when considering new established firms. JEL Codes: L11, L25, O30 Keywords: innovation, profitability, growth, propensity score estimation
a We would like to thank Bettina Peters and participants to the 3rd ZEW Conference on the Economics of Innovation and Patenting in Mannheim for useful comments. Franco Malerba, Maria Luisa Mancusi and Andrea Vezzulli acknowledge the financial support of the MIUR, Italian Ministry for Education, Universities and Research (FIRB, Project RISC - RBNE039XKA: "Research and entrepreneurship in the knowledge-based economy: the effects on the competitiveness of Italy in the European Union”). b European Commission, Joint Research Centre (JRC), Institute for Prospective Technological Studies (IPTS) c Department of Economics, Bocconi University, via Sarfatti 25, 20136 Milano d ISTAT - SSI/D (Italian National Institute of Statistics), via Tuscolana 1782, 00173 Roma e Department of Management, University of Bologna, via Capo di Lucca 34, 40126 Bologna f KITeS/CESPRI, Bocconi University, via Sarfatti 25, 20136 Milano
1. Introduction
This paper aims to study the impact of product innovation on the economic performance
of firms (in terms of profitability and growth) using a large sample of Italian firms
operating in Medium and High-Tech (M&HT) industries. We employ an original dataset
which combines both data on firm’s innovation activities coming from the Third
Community Innovation Survey (CIS3) and economic performance indicators coming from
the firm’s accounting registers covering the period 1998-2003.
In the last two decades, firm-level analyses on the relationship between innovation and
economic performance have flourished thanks to the growing availability of longitudinal
micro data collecting not only financial and economic information, but also indicators of
innovative activities carried out by firms. By this way, a large body of empirical literature
has grown to test if and to what extent innovative firms perform better than non
innovative ones in terms of different performance indicators, including profits and
growth1. However, the empirical evidence on the the beneficial effects of innovation on
firms' performance is still not conclusive, and deserves further exploration.
With reference to the relationship between innovation and profitability, previous studies
(Geroski et al., 1993; Geroski et al., 1997) have found a positive, although modest direct
effect, but a large indirect effect due to the relative insensitiveness of innovating firms to
adverse macroeconomic shocks. This suggests that differences in profitability between
innovative and non-innovative firms are likely to be due to higher competencies of
innovating firms that allow them to face the challenges of the market better than the non-
innovating firms, rather than to a transitory change in the competitive position of the
innovating firms.
With reference to growth, most of the empirical contributions aim to test the so-called
Gibrat’s law framework, according to which firm’s size follows a random walk and firm's
growth is driven by small idiosyncratic shocks. Hence, assuming that innovation is a
1 There are a number of studies also studying the effects of innovation on productivity, (see, for
example, Crepon et al., 1998), export (e.g. Wakelin, 1998) and survival (e.g. Audretsch, 1995; Cefis and Marsili, 2006).

3
driving force for growth, this framework would imply that it is a process that occurs
randomly among firms (Geroski et al. 1993, Dosi et al., 1995).
This assumption is far from being accepted in the economics of innovation literature,
where instead innovation is viewed as a strategic and crucial activity and the decision for a
firm to engage in innovation activities is driven by entrepreneurial market opportunities.
In particular, according to Schumpeter’s Mark I scenario (Malerba and Orsenigo, 1993),
(product) innovation is mainly pursued by new entrants in order to gain new market
shares for surviving longer and growing faster than competitors. This fact should be
particularly true in M&HT industries, where firms are more likely to recognize the key
role played by innovation and pursue it strategically in order to achieve larger long term
growth rates, possibly even at the cost of small short term profits.
From a methodological point of view, the driving force that pushes firms to engage
innovation activities can be seen as a self-selection mechanism which makes the estimation
of its economic impact trickier if confounding factors affecting this mechanism also affect
the economic performance of the firms (e.g. managerial abilities, unobservable changes in
the firm’s operating environment or in the business cycle, etc.). We therefore use
propensity score matching to “correct” the estimation of the treatment effect of
innovation, controlling for the existence of such confounding factors.
The paper is organized as follows. Section 2 briefly reviews the relevant literature on
innovation and performance at the firm level with particular attention devoted to studies
on Italy. Section 3 describes the dataset employed in the analysis and explains in detail
our definition of innovation and M&HT industries. Section 4 introduces our economic
performance indicators and reports the corresponding main descriptive statistics in our
sample. Section 5 describes the methodology adopted for estimating the firm’s economic
return to innovation and reports the main results. Finally, Section 6 draws some
conclusions on the main findings and proposes future paths of research.
4
2. Related literature
Traditionally, scholars have followed two main approaches in studying how innovative
activities may affect the profitability of firms. In the first one, innovations only have a
transitory effect on firm’s profitability by increasing its competitiveness in the short-run.
The introduction of an innovative product gives to the firm a temporary monopoly power
and allows it to exploit higher profits by increasing the firm’s market share until other
firms can imitate the innovation (Aghion and Howitt, 1992; Klepper, 1996).
A second approach stresses the assumption that innovations intrinsically “characterize” a
firm by creating a structural difference between innovating and non-innovating firms.
According to this point of view, each firm owns specific and cumulative technological
competencies developed from the various learning processes experienced. These specific
competencies enable the firm to better face changes in the market in order to survive or
even to obtain persistent profits over time (Malerba and Orsenigo, 1995; Cohen and
Levin, 1989; Dosi et al., 1995).
Previous empirical studies for United Kingdom (Geroski, Machin and Van Reenen, 1993;
Geroski, Van Reenen and Walters, 1997) have found positive, although modest, direct
effects of innovations on profitability in the short run, and large indirect effects due to the
relative insensitiveness of innovating firms to adverse macroeconomic shocks. This might
suggest that innovating firms develop internal competencies and behavioral patterns that
allow them to face the challenges of the market better than non-innovating firms (Cefis
and Ciccarelli, 2005).
Economic theory also recognizes the key role of innovation in growth of firm sales (see for
example Geroski, 1999). However, empirical studies have had difficulty in identifying any
strong link between innovation and sales growth. This might be due to the existence of
considerable lags between the time of discovery of a valuable innovation and its
conversion into commercial success and to the uncertainty associated to every stage of the
innovation process, with the overall outcome requiring success at each step of the process
(Mansfield, 1977). It must however remain true that innovations do indeed pay off on
average, otherwise firms would have no incentive to perform R&D in the first place.
5
Geroski and Machin (1992) suggest that innovating firms (i.e. firms that produced at least
one ‘major’ innovation) are both more profitable and grow faster than non-innovators, but
the influence of specific innovations on sales growth are short-lived. Coad and Rao (2008)
use a semi-parametric quantile regression approach and explore the influence of
innovation at a range of points of the conditional growth rate distribution. Their results
indicate that most firms don’t grow very much, and that their growth can hardly be
related to their attempts at innovation. Nevertheless, innovation is found to be of critical
importance for a handful of fast-growth firms. This emphasizes the inherent uncertainty
in firm-level innovative activity and, once again, the potential relevant role of firm
heterogeneity.
The unsound empirical results from both strands of literature therefore suggest the need
to control for the role of innovating firms’ inherent characteristics and abilities in
evaluating the returns to innovation, which is the main focus of our paper.
We use a relatively new and original dataset to estimate the magnitude of the impact of
innovativeness (measured with an indicator based on the firm’s responses to the CIS
questionnaire) on both profitability and growth by means of (propensity scores based)
matching techniques, which have the advantage of not requiring the specification of a
structural model relating innovation to firm’s performance.
We further concentrate on the relationship between innovation and employment growth.
Our results are in line with those emerging from recent empirical studies concerned with
such relationship. When the distinction is made between product and process innovation,
the former is usually linked to employment creation, because the new products create new
demand (although it is possible that they might replace existing products). Empirical
results have mostly been in line with this interpretation (Van Reenen, 1997; Smolny,
1998; Harrison et al., 2008). In particular, with reference to Italy, using survey data on an
unbalanced panel of 9462 manufacturing firms, Hall et al (2008) find a positive
contribution of product innovation on employment growth.

6
3. Data description
Our analysis is based on a novel and original dataset obtained combining data from two
different sources: the third Italian Innovation Survey (1998-2000) and the accounting
register data2 of the observed firms for the years 1998-2003.
The third Community Innovation Survey (CIS3) has been carried out for Italy by the
Italian National Institute of Statistics (ISTAT) on behalf of the Statistical Office of the
European Communities (EUROSTAT) during 2002. The target population of the survey
included all the enterprises with at least 10 employees operating in the manufacturing and
service sectors during 2000. The final sample of about 30.000 surveyed firms included all
enterprises with more than 250 employees and a random sample of enterprises with less
than 250 employees, stratified according to their industrial sector (2 digits NACE
classification), their size class (number of employees: 10-19, 20-49, 50-249) and their
region of residence (Nuts classification)3. The final sample of respondents to the survey
includes 15512 Italian firms.
We merged data from the CIS3 survey with data from the accounting registers database
using the firm’s fiscal code, which uniquely identifies every firm operating in Italy. Firms
included in the CIS3 survey with no accounting data matches have been dropped from the
sample.
Since our interest focuses on M&HT industries, we restrict our sample only on the
following manufacturing sectors (classified according to their NACE-ATECO 2 digits
code), which show a high share of innovating firms:
24 - Manufacture of chemicals and chemical products;
25 - Manufacture of rubber and plastic products;
29 - Manufacture of machinery and equipment n.e.c;
30_72 – It encompasses sector 30 (Manufacture of office machinery and computers) and
72 (Computers and related activities);
31- Manufacture of electrical machinery and apparatus n.e.c;
2 As resulting by each firm’s accounting register filed yearly at the Italian Chamber of Commerce. 3 For more details on the survey’s methodology see ISTAT (2004).
7
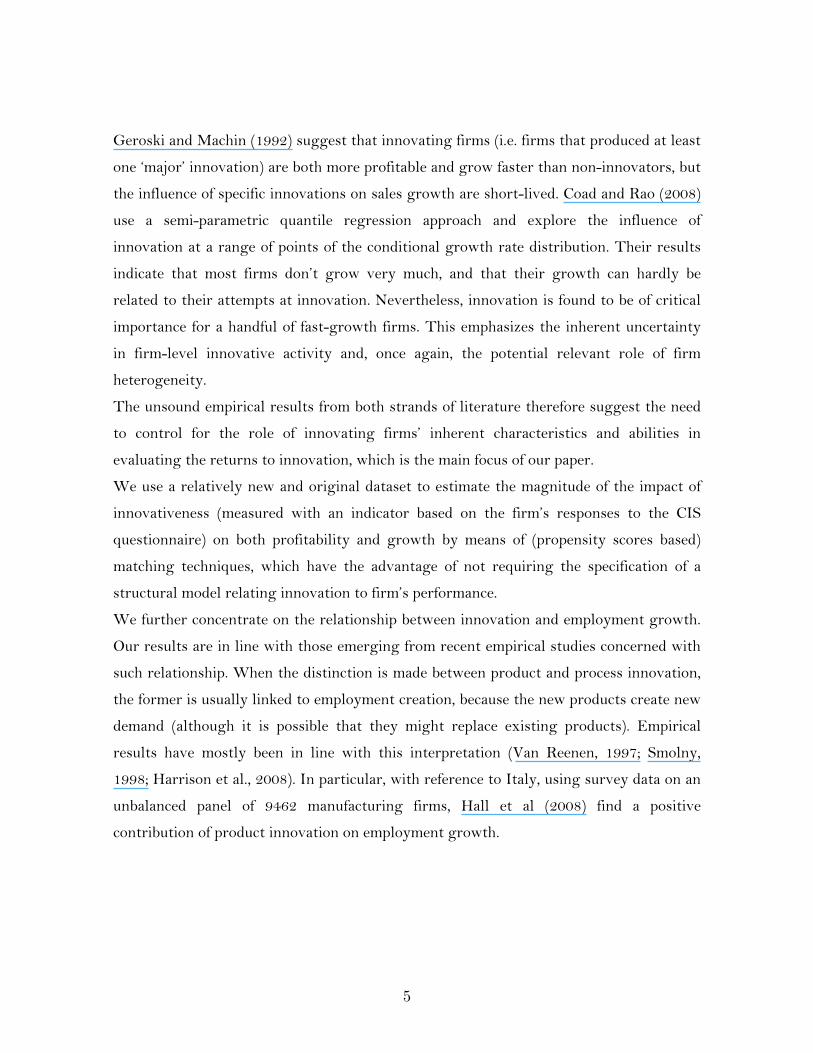
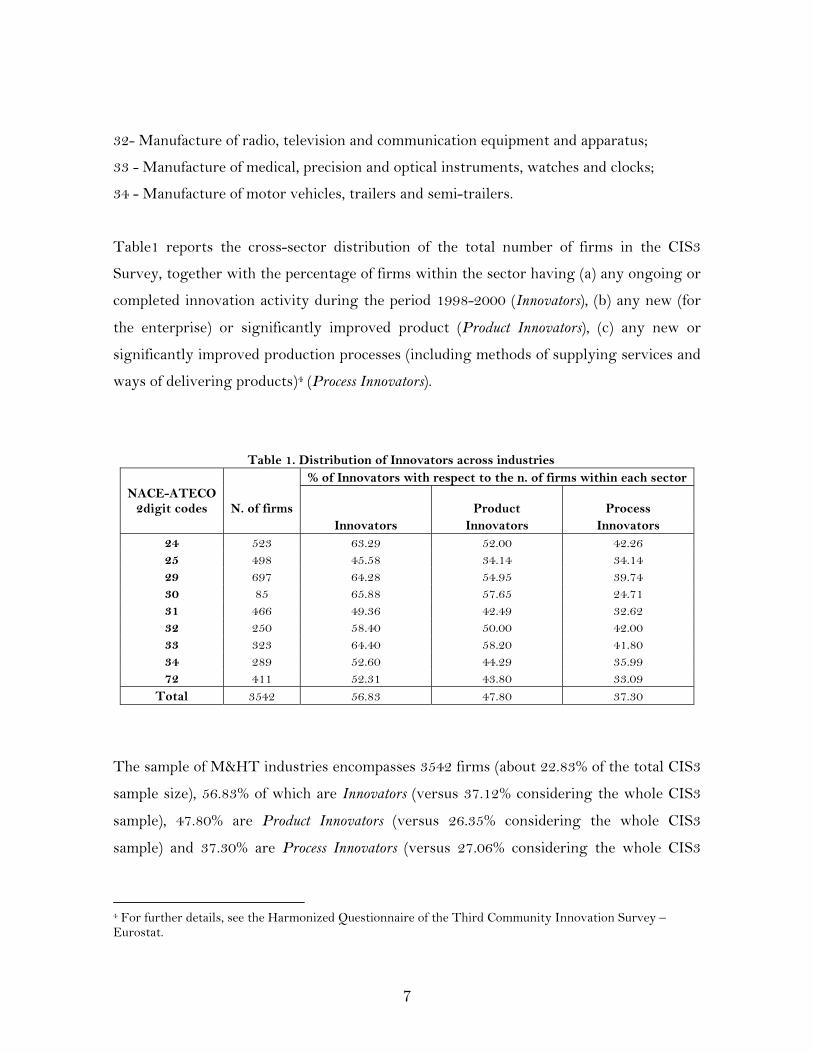
32- Manufacture of radio, television and communication equipment and apparatus;
33 - Manufacture of medical, precision and optical instruments, watches and clocks;
34 - Manufacture of motor vehicles, trailers and semi-trailers.
Table1 reports the cross-sector distribution of the total number of firms in the CIS3
Survey, together with the percentage of firms within the sector having (a) any ongoing or
completed innovation activity during the period 1998-2000 (Innovators), (b) any new (for
the enterprise) or significantly improved product (Product Innovators), (c) any new or
significantly improved production processes (including methods of supplying services and
ways of delivering products)4 (Process Innovators).
Table 1. Distribution of Innovators across industries % of Innovators with respect to the n. of firms within each sector
NACE-ATECO 2digit codes N. of firms Product Process
Innovators Innovators Innovators 24 523 63.29 52.00 42.26 25 498 45.58 34.14 34.14 29 697 64.28 54.95 39.74 30 85 65.88 57.65 24.71 31 466 49.36 42.49 32.62 32 250 58.40 50.00 42.00 33 323 64.40 58.20 41.80 34 289 52.60 44.29 35.99 72 411 52.31 43.80 33.09
Total 3542 56.83 47.80 37.30
The sample of M&HT industries encompasses 3542 firms (about 22.83% of the total CIS3
sample size), 56.83% of which are Innovators (versus 37.12% considering the whole CIS3
sample), 47.80% are Product Innovators (versus 26.35% considering the whole CIS3
sample) and 37.30% are Process Innovators (versus 27.06% considering the whole CIS3
4 For further details, see the Harmonized Questionnaire of the Third Community Innovation Survey – Eurostat.

8
sample), thus evidencing a higher intensity of innovation activities in the M&HT sub-
sample with respect to the whole CIS3 sample.
Table 2 summarizes the further steps followed in cleaning the original M&HT sub-sample
from the firms which did not match with accounting data for any year during the period
1998-2003 (i.e. unbalanced observations), from the potential outliers (i.e. firms with
turnover greater than 2blns of euros in any year) and from potential split and merges of
firms (i.e. firms with yearly sales or employment growth rates outside the range [-200%,
+200%]). We are then left with a final working M&HT sample of 1930 firms.
Table 2. Panel Cleaning Sample Size Dropouts
Original M&HT sub-sample (unbalanced) 3542 Balanced M&HT sub-sample (1998-2003) 2116 1426 Outliers dropped 2090 26 Splits and merges dropped 1988 102
Due to the relatively high number of observations dropped when moving from the
unbalanced panel of firms to the balanced one, some concerns may arise for potential
sample selection bias caused by panel attrition5. We check for the severity of this problem
by comparing the distribution of firms’ size for the dropped vs. retained observations.
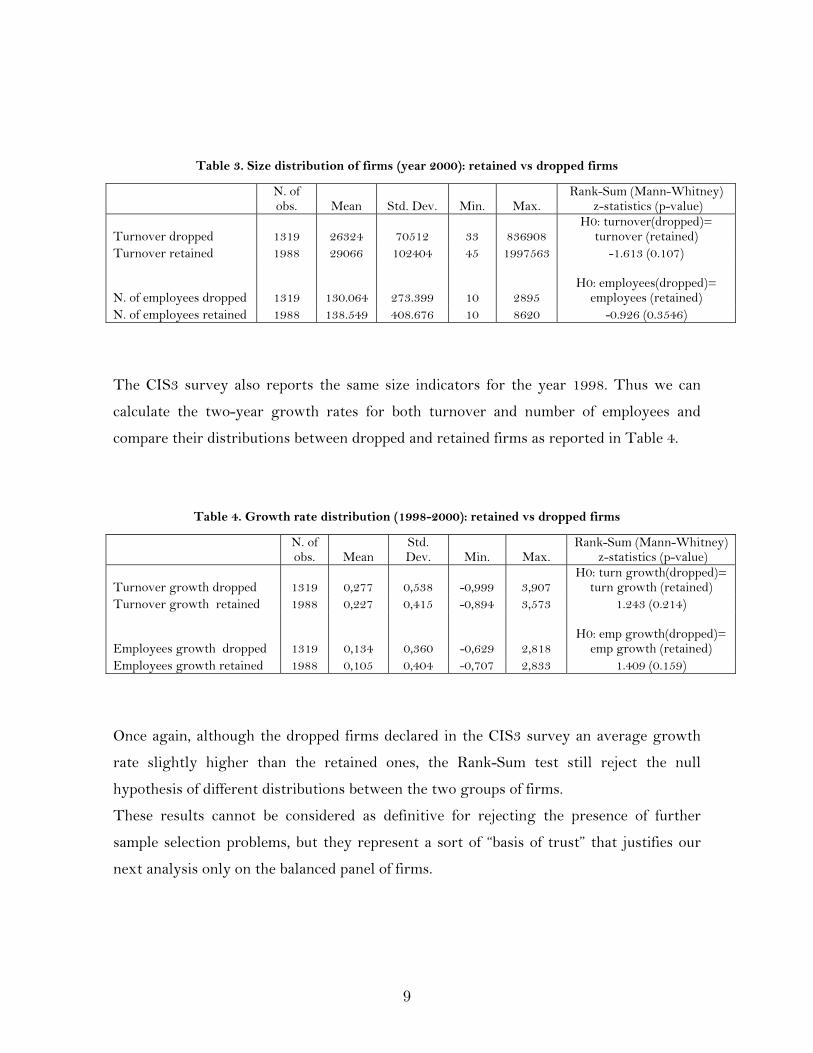
Table 3 reports the main descriptive statistics of the total turnover and the number of
employees for the firms included in the balanced panel (retained) and the dropped ones,
using information on these variables as stated in the CIS3 survey for the year 2000. The
dropped firms tend to be smaller on average than the ones included in the balanced panel,
but the two distributions seems not to differ significantly according to the Mann-Whitney
nonparametric test for the equality of distributions.
5 Unfortunately we have no precise information on the causes of attrition, whereas we are aware that it can occurs for both entry and exit of firms during the period 1998-2003 as a consequence of different events such as post 1998 establishment, change in fiscal domicile or juridical form, fusion, merger, acquisition, inheritance and succession, bankruptcy.
9
Table 3. Size distribution of firms (year 2000): retained vs dropped firms
The CIS3 survey also reports the same size indicators for the year 1998. Thus we can
calculate the two-year growth rates for both turnover and number of employees and
compare their distributions between dropped and retained firms as reported in Table 4.
Table 4. Growth rate distribution (1998-2000): retained vs dropped firms
Once again, although the dropped firms declared in the CIS3 survey an average growth
rate slightly higher than the retained ones, the Rank-Sum test still reject the null
hypothesis of different distributions between the two groups of firms.
These results cannot be considered as definitive for rejecting the presence of further
sample selection problems, but they represent a sort of “basis of trust” that justifies our
next analysis only on the balanced panel of firms.
N. of obs. Mean Std. Dev. Min. Max.
Rank-Sum (Mann-Whitney) z-statistics (p-value)
Turnover dropped 1319 26324 70512 33 836908
H0: turnover(dropped)= turnover (retained)
Turnover retained 1988 29066 102404 45 1997563 -1.613 (0.107) N. of employees dropped 1319 130.064 273.399 10 2895
H0: employees(dropped)= employees (retained)
N. of employees retained 1988 138.549 408.676 10 8620 -0.926 (0.3546)
N. of obs. Mean
Std. Dev. Min. Max.
Rank-Sum (Mann-Whitney) z-statistics (p-value)
Turnover growth dropped 1319 0,277 0,538 -0,999 3,907
H0: turn growth(dropped)= turn growth (retained)
Turnover growth retained 1988 0,227 0,415 -0,894 3,573 1.243 (0.214) Employees growth dropped 1319 0,134 0,360 -0,629 2,818
H0: emp growth(dropped)= emp growth (retained)
Employees growth retained 1988 0,105 0,404 -0,707 2,833 1.409 (0.159)
10
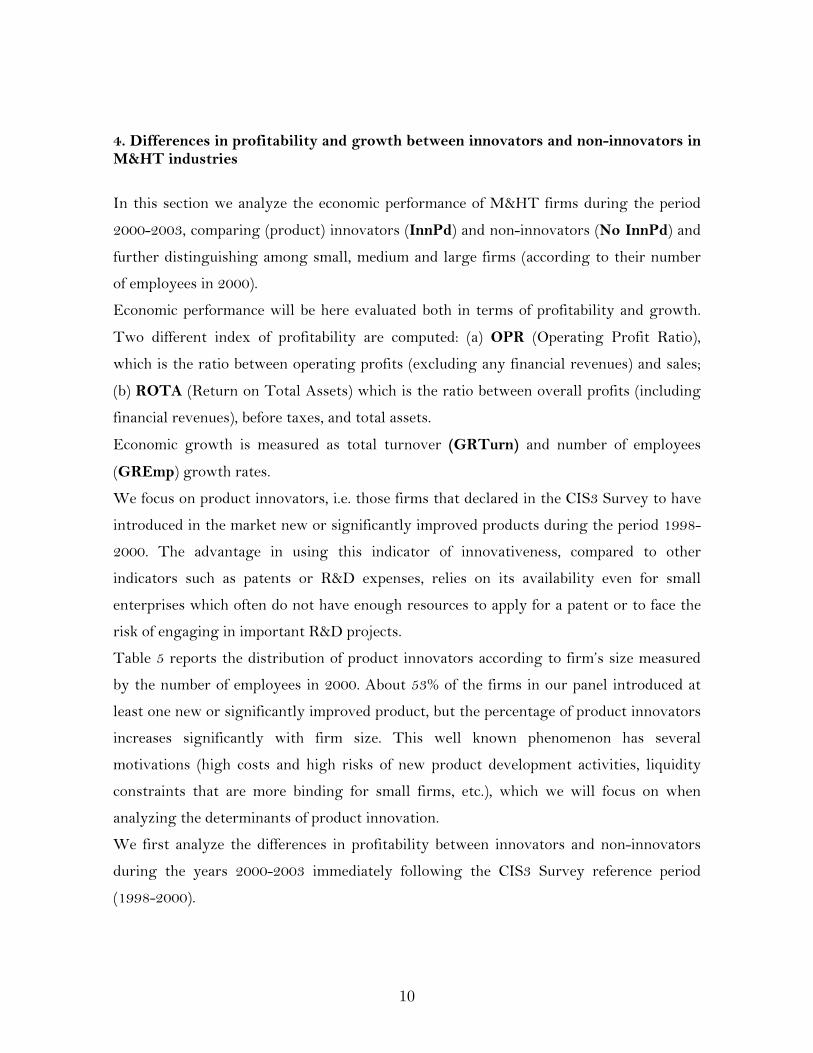
4. Differences in profitability and growth between innovators and non-innovators in M&HT industries
In this section we analyze the economic performance of M&HT firms during the period
2000-2003, comparing (product) innovators (InnPd) and non-innovators (No InnPd) and
further distinguishing among small, medium and large firms (according to their number
of employees in 2000).
Economic performance will be here evaluated both in terms of profitability and growth.
Two different index of profitability are computed: (a) OPR (Operating Profit Ratio),
which is the ratio between operating profits (excluding any financial revenues) and sales;
(b) ROTA (Return on Total Assets) which is the ratio between overall profits (including
financial revenues), before taxes, and total assets.
Economic growth is measured as total turnover (GRTurn) and number of employees
(GREmp) growth rates.
We focus on product innovators, i.e. those firms that declared in the CIS3 Survey to have
introduced in the market new or significantly improved products during the period 1998-
2000. The advantage in using this indicator of innovativeness, compared to other
indicators such as patents or R&D expenses, relies on its availability even for small
enterprises which often do not have enough resources to apply for a patent or to face the
risk of engaging in important R&D projects.
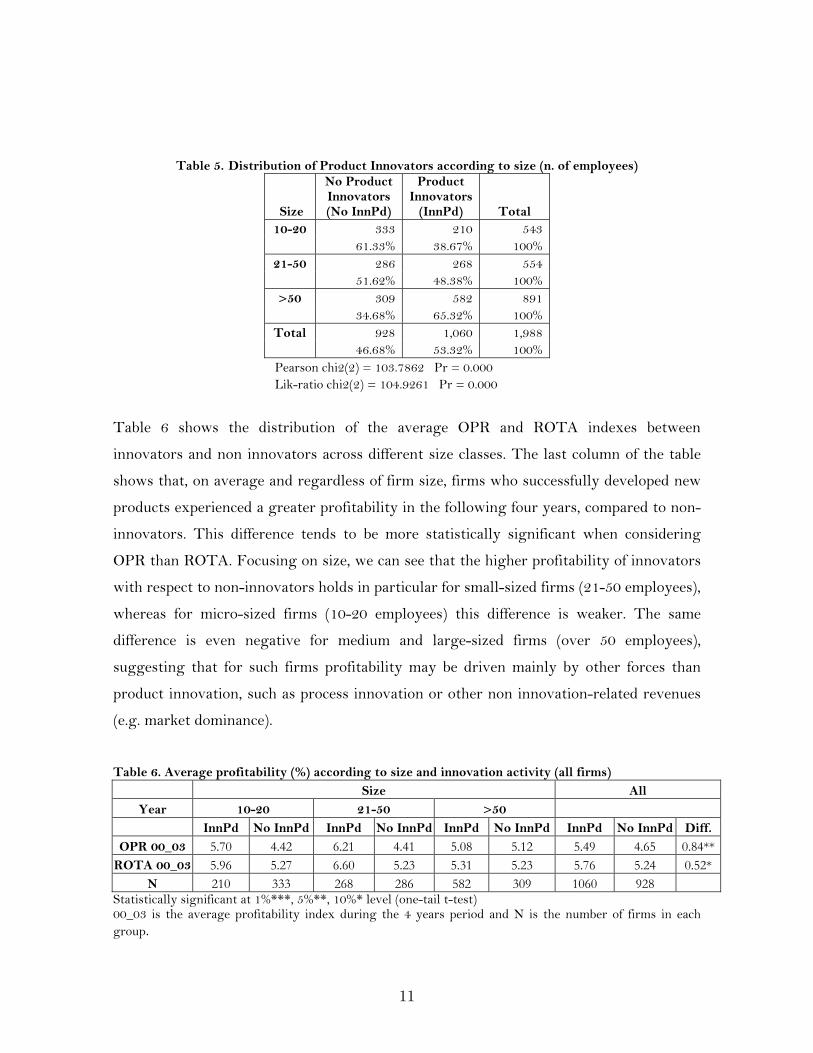
Table 5 reports the distribution of product innovators according to firm’s size measured
by the number of employees in 2000. About 53% of the firms in our panel introduced at
least one new or significantly improved product, but the percentage of product innovators
increases significantly with firm size. This well known phenomenon has several
motivations (high costs and high risks of new product development activities, liquidity
constraints that are more binding for small firms, etc.), which we will focus on when
analyzing the determinants of product innovation.
We first analyze the differences in profitability between innovators and non-innovators
during the years 2000-2003 immediately following the CIS3 Survey reference period
(1998-2000).
11
Table 5. Distribution of Product Innovators according to size (n. of employees)
Size
No Product Innovators (No InnPd)
Product Innovators
(InnPd) Total 10-20 333 210 543
61.33% 38.67% 100% 21-50 286 268 554
51.62% 48.38% 100% >50 309 582 891
34.68% 65.32% 100% Total 928 1,060 1,988
46.68% 53.32% 100% Pearson chi2(2) = 103.7862 Pr = 0.000 Lik-ratio chi2(2) = 104.9261 Pr = 0.000
Table 6 shows the distribution of the average OPR and ROTA indexes between
innovators and non innovators across different size classes. The last column of the table
shows that, on average and regardless of firm size, firms who successfully developed new
products experienced a greater profitability in the following four years, compared to non-
innovators. This difference tends to be more statistically significant when considering
OPR than ROTA. Focusing on size, we can see that the higher profitability of innovators
with respect to non-innovators holds in particular for small-sized firms (21-50 employees),
whereas for micro-sized firms (10-20 employees) this difference is weaker. The same
difference is even negative for medium and large-sized firms (over 50 employees),
suggesting that for such firms profitability may be driven mainly by other forces than
product innovation, such as process innovation or other non innovation-related revenues
(e.g. market dominance).
Table 6. Average profitability (%) according to size and innovation activity (all firms)
Size All
Year 10-20 21-50 >50
InnPd No InnPd InnPd No InnPd InnPd No InnPd InnPd No InnPd Diff.
OPR 00_03 5.70 4.42 6.21 4.41 5.08 5.12 5.49 4.65 0.84**ROTA 00_03 5.96 5.27 6.60 5.23 5.31 5.23 5.76 5.24 0.52*
N 210 333 268 286 582 309 1060 928 Statistically significant at 1%***, 5%**, 10%* level (one-tail t-test) 00_03 is the average profitability index during the 4 years period and N is the number of firms in each group.

12
In Table 7 we restrict our analysis to new entrants, i.e. those firms established between
1993 and 1998. For this sub-sample we find no overall significant differences in
profitability between innovators and non-innovators, although micro and small sized
innovative firms tend to show a higher profitability than non-innovative ones. On the
other side, for medium and large sized firms we find a higher average profitability for non-
innovators.
Table 7. Average profitability (%) according to size and innovation activity (new entrants) Size All
Year 10-20 21-50 >50 InnPd No InnPd InnPd No InnPd InnPd No InnPd InnPd No InnPd Diff.
OPR 00_03 5.02 4.25 5.12 4.82 3.16 5.62 4.27 4.64 -0.37
ROTA 00_03 6.30 5.23 4.95 3.17 4.33 5.72 5.03 4.69 0.34
N 29 77 38 43 49 23 116 143Statistically significant at 1%***, 5%**, 10%* level (one-tail t-test) 00_03 is the average profitability index during the 4 years period and N is the number of firms in each group.
Profitability may be an incomplete indicator for firm’s economic performance, especially
for new firms, which may be more interested in increasing market shares or creating new
market niches than maximizing profits in the short run. Such firms might even trade off
profits with market shares if, for example, they lower prices in order to reach the
minimum efficient operating scale.
We do not have information on firms’ market shares, but we measure firms’ growth
through total turnover (GRTurn) and number of employees (GREmp) growth rates.
Table 8 summarizes the differences in growth rates between innovating and non-
innovating firms. During the period 2000-2003 innovative firms experienced an average
growth rate (both in term of total turnover and number of employees) which is almost
two percentage points greater than non-innovative ones, especially for micro-sized firms.

13
Table 8. Average Growth Rate (%) according to size and innovation activity (all firms) Size All
Year 10-20 21-50 >50 InnPd No InnPd InnPd No InnPd InnPd No InnPd InnPd No InnPd Diff.
GRTurn00_03 3.25 1.12 3.77 2.80 3.97 2.72 3.78 2.17 1.61***
GREmp00_03 1.42 -0.94 2.17 0.79 2.13 0.45 2.00 0.06 1.94***
N 210 333 268 286 582 309 1060 928 Statistically significant at 1%***, 5%**, 10%* level (one-tail t-test)
Table 9. Average Growth Rate (%) according to size and innovation activity (new entrants)
Size All
Year 10-20 21-50 >50
InnPd No InnPd InnPd No InnPd InnPd No InnPd InnPd No InnPd Diff.
GRTurn00_03 7.81 2.04 6.36 4.87 4.89 7.66 6.10 3.91 2.19**
GREmp00_03 4.23 0.34 5.49 4.37 2.64 4.45 3.98 2.20 1.78**
N 29 77 38 43 49 23 116 143 Statistically significant at 1%***, 5%**, 10%* level (one-tail t-test)
These differences are more striking when considering newly established firms (see Table
9): micro-sized innovating firms experience an average growth rate more than three times
larger than the growth rate of non-innovating firms.
These results seem to suggest that developing new products is a crucial activity for small
and newly founded firms: product innovation enables them to expand their market shares
more rapidly than their non-innovative competitors and strongly affects their ability to
grow. By contrast, no similar evidence can be found for medium- and large-sized firms (i.e.
firms with more than 50 employees in year 2000).
5. Estimating the economic returns to innovation.
So far our analysis has been focused on differences in profitability and growth rates
between innovators and non-innovators. Since our ultimate goal is not only to test the

14
statistical significance of such differences but also to estimate the magnitude of the impact
of innovation on profitability and growth we first need to analyze the reverse causality
question: which are the main determinants of innovation activities? In particular we will
try to analyze which firm’s and industry’s characteristics affect the probability to develop
new or significantly improved products (InnPd). The resulting predicted probabilities can
be interpreted as propensity scores, i.e. the conditional probabilities of receiving a
treatment (i.e. to introduce product innovations) given pre-treatment characteristics
(Rosembaum and Rubin, 1983; Imbens, 2000).
5.1 Method
Propensity Score (PS) matching methods are widely known in evaluation problem
literature to reduce the bias in the estimation of treatment effects with observational
studies when traditional regression methods often are unreliable because of the non-
random assignments of subjects to the treatment and control group which leads the
estimation of the treatment effect to be biased for the existence of confounding factors. In
our particular case these confounding factors can be viewed as unobserved (to the
researcher) factors which may affect both the firm’s economic performance and the firm’s
propensity to innovate (e.g. intrinsic managerial abilities, unobservable changes in the
firm’s operating environment or in the business cycle and so on). Propensity score
matching is a way to “correct” the estimation of the treatment effects (TE) controlling for
the existence of these confounding factors based on the idea that bias is reduced when the
comparison of outcomes is performed using treated and control subjects (e.g. innovators
and non-innovators) who are as similar as possible, by “summarizing” pre-treatment
characteristics of each subject into the propensity score which makes the matching feasible
when the n-dimensional vector of characteristics is large (Rosembaum and Rubin, 1983;
Imbens, 2000; Becker and Ichino, 2002; Dehejia and Wahba, 2002).
This method, however, is not immune from drawbacks. The main criticisms arisen in the
literature focus on the reliability of the estimated propensity scores. Smith an Todd (2005)
have shown that TE estimation based on propensity score matching are highly sensitive

15
to its specification (based on both the set of variables included in the scores and the
particular sample used in the estimation). This potential limitation has recently driven
the attention of many researchers to alternative algorithms of matching for TE estimation
based on random recursive partitions of the observations and on coarsened levels of the
covariates (Iacus and Porro 2009, Iacus et al. 2008).
In our case what we want to estimate is the average effect of the treatment on the treated
(ATT) which is defined as:
}{ iE }1|01 iii DYYE }1|1 ii DYE }1|0 ii DYE (4.1)
where Y1i is the economic performance of firm i in case of innovation performed and Y0i is
the economic performance of the same firm in case of non-innovation performed. D={1,0}
is an indicator of exposure to the treatment (1 = innovate, 0 = did not innovate).
Unfortunately only }1|1 ii DYE and }0|0 ii DYE are observed, whereas
}1|0 ii DYE and }0|1 ii DYE are unobserved counterfactuals.
Note that in a randomized experimental setting this problem does not hold since
iii DYYE }, 01 .
The rational behind matching estimator is to assume that such independence holds for
within cells defined by a set of observed characteristics X:
XDYYE iii |}, 01 (4.2)
which is known in the literature as the conditional independence assumption (C.I.A.).
Rosembaum and Rubin (1983) show that if C.I.A. holds, it also holds within cells defined
by the values of the mono-dimensional variable p(X), which is called propensity score, i.e.
the conditional probability of receiving a treatment given pre-treatment characteristics:
}|{}|1Pr{)( XDEXDXp (4.3)

16
Given this result the ATT can be estimated as follows:
}1|)](,0|[)](,1|[{ˆ 01 iiiiiii DXpDYEXpDYEE (4.4)
Equation 4.4 implies two different conditions which must be satisfied in order to let ̂ an
unbiased estimator of ̂ :
1) Balancing of pre-treatment variables given the propensity score:
)(| XpXD (4.5)
2) Unconfoundedness given the propensity score:
)(|01 XpDYY (4.6)
5.2 Propensity score estimation.
In order to estimate p(X) we studied the role played by several firm’s and industry’s
characteristics on the probability of introducing new products by running a logit
regressions with InnPd as dependent variable.
Table10 provides a description of the variables employed in the analysis and Table 11
reports some descriptive statistics for these variables.
Our regressors include a number of potentially relevant firm’s characteristics, including
size, measured by the logarithm of the number of employees in 1998, and an indicator for
newly established firms (dumnew), which will be interacted with most of our regressors
in order to detect potential differences between old firms (incumbents) and new firms with
respect to factors affecting the propensity to innovate.

17
Table 10 - Variable description Variable Description Definition DEPENDENT VARIABLE
InnPd The firm introduced new products (for the firm) during the period 1998-2000. dummy: 0=no; 1=yes
FIRM LEVEL REGRESSORS Dumnew Firm established during 1993-1998 dummy: 0=no; 1=yes Gp Firm belongs to a group. dummy: 0=no; 1=yes GRTurn1999 Firm’s turnover growth rate in 1999 continuous GREmp1999 Firm’s employees growth rate in 1999 continuous OPR1999 Firm’s OPR in 1999 continuous ROTA1999 Firm’s ROTA in 1999 continuous Lemp98 Firm’s size = Log of the firm’s number of employees in 1998. continuous turn_exp98 Firm’s share of turnover 1998 from export continuous [0-1] debt_assets98 Firm’s total debts in 1998 / Total assets in 1998 continuous [0-1] cf_assets98 Firm’s available liquidity in 1998 / Total assets 1998 continuous [0-1] grad_emp Firm’s share of employees with higher education in 2000 continuous [0-1] Cap_assets98 Firm’s stock of physical capital 1998 / Total assets 1998 continuous [0-1] capimm_assets98 Firm’s stock of non-physical capital 1998 / Total assets 1998 continuous [0-1]
We further add the firm’s share of turnover from export in 1998 (tunr_exp98), in order to
proxy for the degree of internationalization of the firm. We then include the firm’s share
of employees with university degree (grad_emp) in 2000 (a measure of the stock of human
capital intensity), and firm’s total debt over total assets ratio (debt_assets98) in 1998 (a
measure of firm’s financial leverage-exposure). Finally, we add further financial variables,
such as firm’s total liquidity over total assets ratio (cf_assets98) in 1998, which is meant
to capture the firm’s ability to generate cash flow for self financing (R&D) investments;
the firm’s stock of, respectively, physical (durable assets) and non-physical (immaterial
durable assets excluded financial assets) capital over its total assets in 1998 (cap_assets98
and capimm_assets98); a dummy variable which equal to 1 if the firm belongs to a
mutual financing group of firms (gp)6.
6 The number of observations involved in this analysis is further reduced to 1499 firms (from the previous working sample of 1988 firms) due to the presence of missing values for some of the regressors listed in Tables 10-11.
18
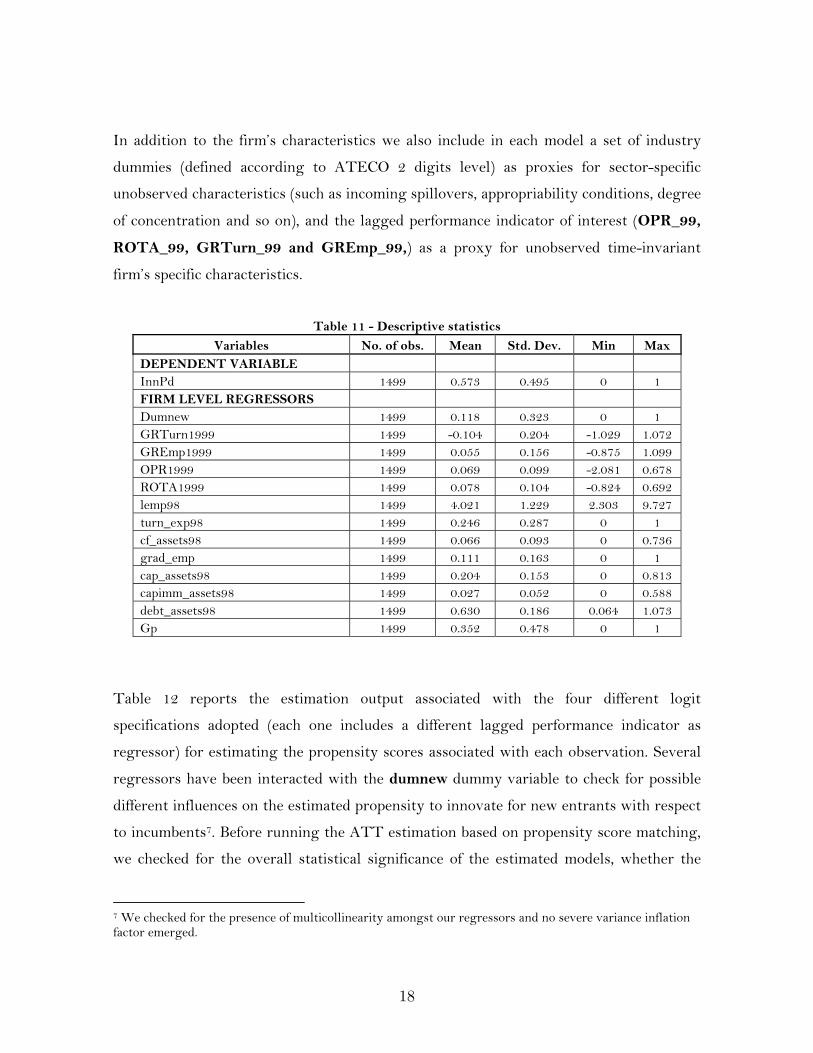
In addition to the firm’s characteristics we also include in each model a set of industry
dummies (defined according to ATECO 2 digits level) as proxies for sector-specific
unobserved characteristics (such as incoming spillovers, appropriability conditions, degree
of concentration and so on), and the lagged performance indicator of interest (OPR_99,
ROTA_99, GRTurn_99 and GREmp_99,) as a proxy for unobserved time-invariant
firm’s specific characteristics.
Table 11 - Descriptive statistics
Variables No. of obs. Mean Std. Dev. Min Max DEPENDENT VARIABLE InnPd 1499 0.573 0.495 0 1 FIRM LEVEL REGRESSORS Dumnew 1499 0.118 0.323 0 1 GRTurn1999 1499 -0.104 0.204 -1.029 1.072 GREmp1999 1499 0.055 0.156 -0.875 1.099 OPR1999 1499 0.069 0.099 -2.081 0.678 ROTA1999 1499 0.078 0.104 -0.824 0.692 lemp98 1499 4.021 1.229 2.303 9.727 turn_exp98 1499 0.246 0.287 0 1 cf_assets98 1499 0.066 0.093 0 0.736 grad_emp 1499 0.111 0.163 0 1 cap_assets98 1499 0.204 0.153 0 0.813 capimm_assets98 1499 0.027 0.052 0 0.588 debt_assets98 1499 0.630 0.186 0.064 1.073 Gp 1499 0.352 0.478 0 1
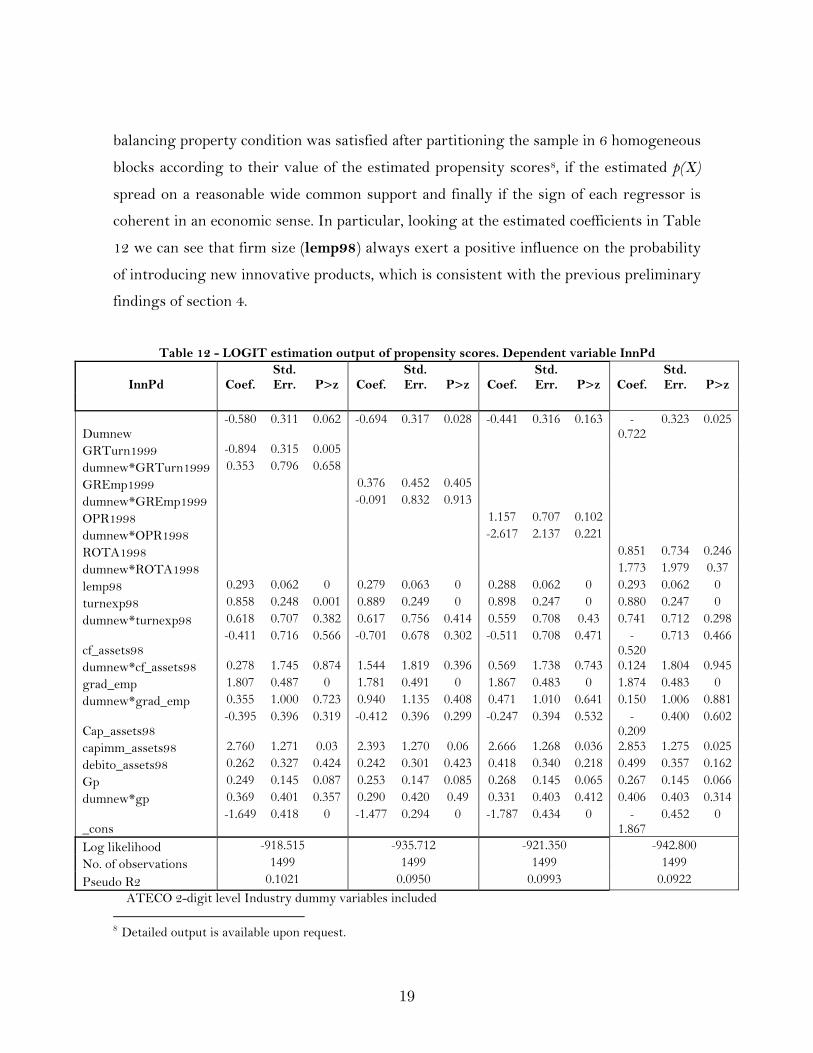
Table 12 reports the estimation output associated with the four different logit
specifications adopted (each one includes a different lagged performance indicator as
regressor) for estimating the propensity scores associated with each observation. Several
regressors have been interacted with the dumnew dummy variable to check for possible
different influences on the estimated propensity to innovate for new entrants with respect
to incumbents7. Before running the ATT estimation based on propensity score matching,
we checked for the overall statistical significance of the estimated models, whether the
7 We checked for the presence of multicollinearity amongst our regressors and no severe variance inflation factor emerged.
19
balancing property condition was satisfied after partitioning the sample in 6 homogeneous
blocks according to their value of the estimated propensity scores8, if the estimated p(X)
spread on a reasonable wide common support and finally if the sign of each regressor is
coherent in an economic sense. In particular, looking at the estimated coefficients in Table
12 we can see that firm size (lemp98) always exert a positive influence on the probability
of introducing new innovative products, which is consistent with the previous preliminary
findings of section 4.
Table 12 - LOGIT estimation output of propensity scores. Dependent variable InnPd
ATECO 2-digit level Industry dummy variables included 8 Detailed output is available upon request.
InnPd Coef. Std. Err. P>z Coef.
Std. Err. P>z Coef.
Std. Err. P>z Coef.
Std. Err. P>z
Dumnew -0.580 0.311 0.062 -0.694 0.317 0.028 -0.441 0.316 0.163 -
0.722 0.323 0.025
GRTurn1999 -0.894 0.315 0.005
dumnew*GRTurn1999 0.353 0.796 0.658
GREmp1999 0.376 0.452 0.405
dumnew*GREmp1999 -0.091 0.832 0.913
OPR1998 1.157 0.707 0.102
dumnew*OPR1998 -2.617 2.137 0.221
ROTA1998 0.851 0.734 0.246
dumnew*ROTA1998 1.773 1.979 0.37
lemp98 0.293 0.062 0 0.279 0.063 0 0.288 0.062 0 0.293 0.062 0
turnexp98 0.858 0.248 0.001 0.889 0.249 0 0.898 0.247 0 0.880 0.247 0
dumnew*turnexp98 0.618 0.707 0.382 0.617 0.756 0.414 0.559 0.708 0.43 0.741 0.712 0.298
cf_assets98 -0.411 0.716 0.566 -0.701 0.678 0.302 -0.511 0.708 0.471 -
0.520 0.713 0.466
dumnew*cf_assets98 0.278 1.745 0.874 1.544 1.819 0.396 0.569 1.738 0.743 0.124 1.804 0.945
grad_emp 1.807 0.487 0 1.781 0.491 0 1.867 0.483 0 1.874 0.483 0
dumnew*grad_emp 0.355 1.000 0.723 0.940 1.135 0.408 0.471 1.010 0.641 0.150 1.006 0.881
Cap_assets98 -0.395 0.396 0.319 -0.412 0.396 0.299 -0.247 0.394 0.532 -
0.209 0.400 0.602
capimm_assets98 2.760 1.271 0.03 2.393 1.270 0.06 2.666 1.268 0.036 2.853 1.275 0.025
debito_assets98 0.262 0.327 0.424 0.242 0.301 0.423 0.418 0.340 0.218 0.499 0.357 0.162
Gp 0.249 0.145 0.087 0.253 0.147 0.085 0.268 0.145 0.065 0.267 0.145 0.066
dumnew*gp 0.369 0.401 0.357 0.290 0.420 0.49 0.331 0.403 0.412 0.406 0.403 0.314
_cons -1.649 0.418 0 -1.477 0.294 0 -1.787 0.434 0 -
1.867 0.452 0
Log likelihood -918.515 -935.712 -921.350 -942.800
No. of observations 1499 1499 1499 1499
Pseudo R2 0.1021 0.0950 0.0993 0.0922

20
Also export intensity (turnexp98) positively affects the firm’s propensity to innovate,
consistently with the empirical literature focusing on innovation-export
complementarity9. Finally our proxies for firm’s human and knowledge capital (grad_emp
and capimm_assets98 respectively) positively correlate with the probability of
introducing new innovative products.
5.3 ATT estimation.
Given the PS calculated as predictions of the logit models estimated in the previous
section, we calculated the average treatment effects on the treated (ATT) for all the three
performance indicators by using different matching methods: radious, kernel and
stratification10.
The standard errors associated with the ATT estimates based on radious and
stratification methods are computed analytically11, whereas for kernel matching we
computed standard errors with bootstrap methods.
Table 13 reports the ATT estimated for each of the matching methods described above.
The “treated” firms are those that introduced any new or significantly improved products
(InnPd) whereas the “controls” are the non-innovative firms (No InnPd).
Table 13 - ATT estimation (Treated=InnPd) all firms (mean 2000-2003).
Treated Control ATT (Yi=GRTurn)
ATT (Yi=GREmp)
ATT (Yi=OPR)
ATT (Yi=ROTA)
Matching method: Kernel 838 617 1.0** 1.8*** 0.9** 0.8* Radious 838 617 1.1** 1.9*** 1.1* 0.8** Stratification 838 617 1.1** 1.9*** 0.8* 0.7* Statistically significant at 1%***, 5%**, 10%* level (one-tail t-test)
9 See for instance Bernard and Jensen (1999), Hitt et al. (1997), Alvarez and Robertson (2004). 10 See for instance Becker and Ichino (2002) for an extensive review of matching methods based on propensity scores estimation. 11 See Becker and Ichino (2002) for the analytical formulas.

21
Our results confirm the findings of section 4: over the period 2000-2003, innovative firms
show and higher economic performance with respect to non innovative ones. On average,
during the period 2000-2003, the yearly growth rate premium for “product” innovating
firms is estimated to be about +1.1% in term of turnover and about +1.9% in term of
number of employees. Also the average profitability premium is estimated to be about
+0.9% and +0.8% in term of OPR and ROTA respectively.
5.4 New established firms
The previous findings do not hold when restricting our analysis only to new entrants.
However, some interesting aspects emerge.
Looking at Table 14, ATT analysis estimates an average “negative premium” in terms of
profitability for new innovating firms which ranges from -0.6% to -1.7% for OPR. On the
other side, a positive innovation premium is estimated in terms of growth rates, which
seems to be negligible when considering turnover but relevant (about +3%) when
considering employment. These findings seem to support the hypothesis of strategic
different behavior of new entrants firms in the M&HT industries with respect to
incumbents, as described in Section 1. In particular, innovation seems more to be a crucial
activity for achieving higher economic growth rates (in the short run) in entrants rather
than in incumbents. Furthermore, the fact that growth rate premiums are more consistent
when considering employment than turnover may be due to simultaneous price-cutting
policies pursued by innovating firms. Unfortunately this is a hypothesis we cannot test, as
we have no information on prices.
Table 14 - ATT estimation (Treated=InnPd) new established firms (mean 2000-2003).
Treated Control ATT (Yi=GRTurn)
ATT (Yi=GREmp)
ATT (Yi=OPR)
ATT (Yi=ROTA)
Matching method: Kernel 82 78 0.9 2.9* -1.5 -1.1 Radious 82 78 0.0 1.7 -0.6 0.6 Stratification 82 78 1.1 3.1* -1.7* -1.2 Statistically significant at 1%***, 5%**, 10%* level (one-tail t-test)

22
6. Comments and conclusions.
The main purpose of this paper was to assess the impact of innovation on the economic
performance at the micro (i.e. firm) level. We concentrate on one particular type of
innovation activity - product innovation - and estimate its impact on firm’s economic
performance by using information coming from an original dataset, which combines data
from the CIS3 Survey for Italy and the economic data of the surveyed firms from the their
balance sheets. One of the advantages in using this source of data was to have a
representative sample also of the small (and new) firms, which are often underrepresented
or even completely excluded from the analysis when other indicators for innovativeness
(e.g. patents or R&D expenditures) are adopted. We specifically refer to firms that have
introduced new or significantly improved products during the period 1998-2000. Since the
definition of “new or significantly improved products” may change dramatically according
to the sector of the firm’s economic activity, we focused our analysis on Medium and
High-Tech (M&HT) industries.
We have found significant differences between innovative and non-innovative firms both
in terms of profitability and growth rates over the three-year period immediately
following the CIS3 Survey reference period (i.e. over 2000-2003). In particular the
differences in profitability are remarkable when considering micro and small sized firms,
whereas they tend to disappear when considering medium and large firms.
In order to estimate the impact of innovative activities on the economic performance of
the firms (i.e. the “innovation premium”) we adopted a quasi-experimental design setting
by using several matching methods based on propensity scores estimation. These methods
do not require any structural (imposed) model (i.e. they are robust to model
misspecification) when estimating the treatment effect.
One of the limitations of this paper is the scarcity of information concerning firm’s
survival: we do not have information on exited firms during the reference period. Since
firm’s survival may represent itself an (unobserved) indicator of economic performance
this issue rises concern for potential sample selection problems. For alleviating this
concern we tested non-parametrically the equality of distribution (for a set of “key”

23
variables observed in year 2000 for all the firms) between the firms included in the
balanced dataset and those ones not included because of panel attrition.
Finally, some interesting results emerge when estimating the innovation premium only
for the “new entrants” (i.e. those firms established during the period 1993-1998). In this
case we estimated a negative innovation premium in terms of profitability and a positive
and remarkable (about +3%) innovation premium in terms of employment growth rate.
These findings may add new useful evidence and new insights to de debate on the
different economic returns from innovative activities pursued by new entrant and
incumbent firms.

24
References
Alvarez, R. and Robertson R. (2004). - “Exposure to Foreign Markets and Firm-Level Innovation: Evidence from Chile and Mexico.”, Journal of International Trade and Economic Development 13 (1), pp. 57-87. Aghion, P. and Howitt, P., (1992) - “A Model of Growth through Creative Destruction”, Econometrica, 60(2), pp. 323-351. Audretsch D. B. (1995) – “Innovation, Growth and Survival”, International Journal of Industrial Organization, 13(4), pp. 441-457. Baldwin (1995) – “The dynamics of industrial competition”, Cambridge University Press, Cambridge, 13(4), MA. Becker S. and Ichino A. (2002) – “Estimation of Average Treatment Effects Based on Propensity Scores", The Stata Journal , 2(4), pp. 358-377. Bernard A. B. and Jensen J. B. (1999) - “Exceptional exporter performance: cause, effect or both?”, Journal of International Economics, 47, pp. 1-25. Cassiman B. and Veugelers R. (2002) – “R&D Cooperation and Spillovers: Some Empirical Evidence from Belgium”, The American Economic Review, 92(4), pp. 1169-1184. Cefis E. and Ciccarelli M.(2005), “Profit Differentials and Innovation”, Economics of Innovation and New Technology, 14(1-2), pp. 43-61. Cefis E., and O. Marsili (2006), Survivor: The Role of Innovation in Firm’s Survival. Research Policy, 35(5) 626-641. Coad A. and R. Rao (2008) – “Innovation and Firm Growth in High-Tech Sectors: A quantile Regression Approach”, Research Policy, 37(4) 633-648 Cohen, W. and Levin, R., (1989) - “Empirical Studies of Innovation and Market Structure”, in Schmalensee, R. and Willig, R. (eds.) Handbook of Industrial Organization, Amsterdam, North Holland. Crépon, B., E. Duguet, and J. Mairesse (1998) - “Research, innovation, and productivity: An econometric analysis at the firm level”, NBER Working Paper no. 6696. Dehejia R. H. and Wahba S. (2002) – “Propensity score-matching methods for nonexperimental causal studies”, The Review of Economics and Statistics, 84(1), pp. 151-161.

25
Dosi G., Marsili O., Orsenigo L., and Salvatore R. (1995) - “Learning, Market Selection and the Evolution of Market Structure”, Small Business Economics, 7, December, pp. 411-436. Geroski P.A. (1994) - “Market Structure, corporate performance and innovative activity”, Oxford University Press, Oxford. Geroski P.A. (1999) - “The Growth of Firms in Theory and in Practice” CEPR Discussion Paper No.2092 Geroski P.A. and Machin S. (1992) - “Do Innovating Firms Outperform Non-innovators?” Business Strategy Review (Summer), 79-90. Geroski P.A., Machin S., and Van Reenen J. (1993) - “The Profitability of Innovating Firms”, RAND Journal of Economics, 24(2), pp. 198-211. Geroski P.A., Van Reenen J. and Walters C.F. (1997) - “How Persistently Do Firms Innovate?”, Research Policy, 26(1), pp. 33-48. Klepper S. (1996) - “Entry, Exit and Innovation over the Product Life Cycle”, American Economic Review, 86(3), pp. 562-582. Klepper S. (2002) - “Firm Survival and the Evolution of Oligopoly”, RAND Journal of Economics, 33(1), pp. 37-61. Imbens G.W. (2000) - “The Role of Propensity Score in Estimating Dose—Response Functions”, Biometrika, 87(3), pp. 706-710. Iacus S. and Porro G. (2009) - "Random recursive partitioning: a matching method for the estimation of the average treatment effect", Journal fo Applied Econometrics, 24(1), pp. 163-195. Iacus S., King G. and Porro G. (2008) - "Matching for Causal Inference Without Balance Checking," UNIMI - Research Papers in Economics, Business, and Statistics 1073, Universitá degli Studi di Milano. Hall B. H., F. Lotti and J. Mairesse (2008), “Employment, innovation, and productivity: evidence from Italian microdata”, Industrial and Corporate Change 17(4):813-839 Hitt M.A., Hoskisson R.E., Ireland R.D. and Harrison J.S. (1991) - “Effects of acquisitions on R&D inputs and outputs”. Academy of Management Journal, 34, pp. 693-706. Malerba F. Orsenigo L. (1993), Technological regimes and firm behavior, Industrial and corporate change v.2 p.45-74

26
Malerba F. and Orsenigo, L. (1999) - “Technological Entry, Exit and Survival”, Research Policy, 28, pp. 643-60. Rosenbaum P.R. and Rubin D.B. (1983) - “The Central Role of the Propensity in Observational Studies for Causal Effects”, Biometrika, 70(1), pp. 41-55. Santarelli E. and Lotti F. (2008) - “Innovative Output, Productivity, and Profitability. A Test Comparing USPTO and EPO data”, Industry and Innovation, 15(4), pp. 393-409; Smith J.A. and Todd P.E. (2005) – “Does matching overcome LaLonde’s critique of nonexperimental estimators?”, Journal of Econometrics, 125, pp. 305-353. Smolny W. (1998), “Innovation, Prices, and Employment - A Theoretical Model and an Empirical Application for West German Manufacturing Firms”, Journal of Industrial Economics, 46 (3), 359-381. Van Reenen, J., (1997), “Employment and Technological Innovation: Evidence from UK Manufacturing Firms”, Journal of Labor Economics 15 (2), 255-284. Wakelin, K., (1998) – “Innovation and export behaviour at the firm level”, Research Policy 26, pp. 829–841