High-throughput sequencing of a South American Amerindian
8
High-Throughput Sequencing of a South American Amerindian Andre ´ M. Ribeiro-dos-Santos 1. , Jorge Estefano Santana de Souza 2,3. , Renan Almeida 3 , Dayse O. Alencar 1 , Maria Silvanira Barbosa 1 , Leonor Gusma ˜o 1,4 , Wilson A. Silva, Jr. 2,5 , Sandro J. de Souza 3,6 , Artur Silva 1 ,A ˆ ndrea Ribeiro-dos-Santos 1 , Sylvain Darnet 1 , Sidney Santos 1 * 1 Instituto de Cie ˆ ncias Biolo ´ gicas, Universidade Federal do Para ´, Bele ´m, Para ´, Brazil, 2 Centro Regional de Hemoterapia, Faculdade de Medicina de Ribeira ˜o Preto, Universidade de Sa ˜ o Paulo, Ribeira ˜o Preto, Sa ˜ o Paulo, Brazil, 3 Institute of Bioinformatics and Biotechnology, Sa ˜o Paulo, Sa ˜o Paulo, Brazil, 4 Institute of Molecular Pathology and Immunology, University of Porto, Porto, Portugal, 5 Departamento de Gene ´ tica, Faculdade de Medicina de Ribeira ˜o Preto, Universidade de Sa ˜o Paulo, Ribeira ˜o Preto, Sa ˜o Paulo, Brazil, 6 Brain Institute, Universidade Federal do Rio Grande do Norte, Natal, Rio Grande do Norte, Brazil Abstract The emergence of next-generation sequencing technologies allowed access to the vast amounts of information that are contained in the human genome. This information has contributed to the understanding of individual and population- based variability and improved the understanding of the evolutionary history of different human groups. However, the genome of a representative of the Amerindian populations had not been previously sequenced. Thus, the genome of an individual from a South American tribe was completely sequenced to further the understanding of the genetic variability of Amerindians. A total of 36.8 giga base pairs (Gbp) were sequenced and aligned with the human genome. These Gbp corresponded to 95.92% of the human genome with an estimated miscall rate of 0.0035 per sequenced bp. The data obtained from the alignment were used for SNP (single-nucleotide) and INDEL (insertion-deletion) calling, which resulted in the identification of 502,017 polymorphisms, of which 32,275 were potentially new high-confidence SNPs and 33,795 new INDELs, specific of South Native American populations. The authenticity of the sample as a member of the South Native American populations was confirmed through the analysis of the uniparental (maternal and paternal) lineages. The autosomal comparison distinguished the investigated sample from others continental populations and revealed a close relation to the Eastern Asian populations and Aboriginal Australian. Although, the findings did not discard the classical model of America settlement; it brought new insides to the understanding of the human population history. The present study indicates a remarkable genetic variability in human populations that must still be identified and contributes to the understanding of the genetic variability of South Native American populations and of the human populations history. Citation: Ribeiro-dos-Santos AM, de Souza JES, Almeida R, Alencar DO, Barbosa MS, et al. (2013) High-Throughput Sequencing of a South American Amerindian. PLoS ONE 8(12): e83340. doi:10.1371/journal.pone.0083340 Editor: Francesc Calafell, Universitat Pompeu Fabra, Spain Received March 26, 2013; Accepted October 30, 2013; Published December 30, 2013 Copyright: ß 2013 Ribeiro-dos-Santos et al. This is an open-access article distributed under the terms of the Creative Commons Attribution License, which permits unrestricted use, distribution, and reproduction in any medium, provided the original author and source are credited. Funding: The work was supported by the Rede Paraense de Geno ˆ mica e Proteo ˆ mica (Governo do Para/Secretaria de Estado de Desenvolvimento, Cie ˆncia e Tecnologia/Fundac ¸a ˜o de Amparo a Pesquisa do Estado do Para ´ (FAPESPA)), Pro ´ -Reitoria de Pesquisa e Po ´ s-Graduac ¸a ˜ o/Universidade Federal do Para ´, Fundac ¸a ˜o de Amparo e Desenvolvimento da Pesquisa, Coordenac ¸a ˜ o de Aperfeicoamento de Pessoal de Nivel Superior (Capes), FAPESPA and Conselho Nacional de Desenvolvimento Cientı ´fico e Tecnolo ´ gico. LG was supported by a grant from CAPES/Brasil. The funders had no role in the study design, the data collection and analysis, the decision to publish, or the preparation of the manuscript. Competing Interests: The authors have declared that no competing interests exist. * E-mail: [email protected]/[email protected] . These authors contributed equally to this work. Introduction The emergence of next-generation sequencing (NGS) technol- ogies, such as Solexa (Illumina) [1], 454 (Roche) [2] and SOLiD (Life Technologies) [3], allowed access to the vast amounts of information that are contained in the genomes of various organisms. In recent years, two large projects, HapMap [4] and the 1,000 Genomes Project [5], and other more specific initiatives [6–14] sought to document the genetic variability in the human genomes of different ethnic and geographic groups. This type of investigation allowed the identification of rare genetic variants [11,15], the ability to make more precise inferences from association studies with complex diseases [16], and the formulation of new insights in the history of the formation and migration of human populations [6–10,12–14,17–19]. The Americas were the last continents to be occupied by human populations. According to the most widely accepted model, which is based on anthropological, archaeological, and genetic evidence [18,20–22], the American natives originated in Eastern Asia 20 to 30 thousand years ago (kya) and expanded across the Americas along the North-South direction [18]. Despite the large number of publications on the occupation of the Americas [18,20,23,24], several questions have not yet been answered. Information on individual and/or population-based genetic variability, such as the information provided by whole genome sequencing (WGS), might contribute to the solution of many of these questions. The literature records at least 15 fully annotated WGSs of individuals from European [8], Asian [6,7,11,13–15], Oceanic [12], and African [9] populations, but have no Native American representatives. To obtain a better understanding of the genetic variability of Native Americans and to infer genetic associations PLOS ONE | www.plosone.org 1 December 2013 | Volume 8 | Issue 12 | e83340
Transcript of High-throughput sequencing of a South American Amerindian
High-Throughput Sequencing of a South AmericanAmerindianAndre M. Ribeiro-dos-Santos1., Jorge Estefano Santana de Souza2,3., Renan Almeida3,
Dayse O. Alencar1, Maria Silvanira Barbosa1, Leonor Gusmao1,4, Wilson A. Silva, Jr.2,5, Sandro J. de
Souza3,6, Artur Silva1, Andrea Ribeiro-dos-Santos1, Sylvain Darnet1, Sidney Santos1*
1 Instituto de Ciencias Biologicas, Universidade Federal do Para, Belem, Para, Brazil, 2 Centro Regional de Hemoterapia, Faculdade de Medicina de Ribeirao Preto,
Universidade de Sao Paulo, Ribeirao Preto, Sao Paulo, Brazil, 3 Institute of Bioinformatics and Biotechnology, Sao Paulo, Sao Paulo, Brazil, 4 Institute of Molecular
Pathology and Immunology, University of Porto, Porto, Portugal, 5 Departamento de Genetica, Faculdade de Medicina de Ribeirao Preto, Universidade de Sao Paulo,
Ribeirao Preto, Sao Paulo, Brazil, 6 Brain Institute, Universidade Federal do Rio Grande do Norte, Natal, Rio Grande do Norte, Brazil
Abstract
The emergence of next-generation sequencing technologies allowed access to the vast amounts of information that arecontained in the human genome. This information has contributed to the understanding of individual and population-based variability and improved the understanding of the evolutionary history of different human groups. However, thegenome of a representative of the Amerindian populations had not been previously sequenced. Thus, the genome of anindividual from a South American tribe was completely sequenced to further the understanding of the genetic variability ofAmerindians. A total of 36.8 giga base pairs (Gbp) were sequenced and aligned with the human genome. These Gbpcorresponded to 95.92% of the human genome with an estimated miscall rate of 0.0035 per sequenced bp. The dataobtained from the alignment were used for SNP (single-nucleotide) and INDEL (insertion-deletion) calling, which resulted inthe identification of 502,017 polymorphisms, of which 32,275 were potentially new high-confidence SNPs and 33,795 newINDELs, specific of South Native American populations. The authenticity of the sample as a member of the South NativeAmerican populations was confirmed through the analysis of the uniparental (maternal and paternal) lineages. Theautosomal comparison distinguished the investigated sample from others continental populations and revealed a closerelation to the Eastern Asian populations and Aboriginal Australian. Although, the findings did not discard the classicalmodel of America settlement; it brought new insides to the understanding of the human population history. The presentstudy indicates a remarkable genetic variability in human populations that must still be identified and contributes to theunderstanding of the genetic variability of South Native American populations and of the human populations history.
Citation: Ribeiro-dos-Santos AM, de Souza JES, Almeida R, Alencar DO, Barbosa MS, et al. (2013) High-Throughput Sequencing of a South AmericanAmerindian. PLoS ONE 8(12): e83340. doi:10.1371/journal.pone.0083340
Editor: Francesc Calafell, Universitat Pompeu Fabra, Spain
Received March 26, 2013; Accepted October 30, 2013; Published December 30, 2013
Copyright: � 2013 Ribeiro-dos-Santos et al. This is an open-access article distributed under the terms of the Creative Commons Attribution License, whichpermits unrestricted use, distribution, and reproduction in any medium, provided the original author and source are credited.
Funding: The work was supported by the Rede Paraense de Genomica e Proteomica (Governo do Para/Secretaria de Estado de Desenvolvimento, Ciencia eTecnologia/Fundacao de Amparo a Pesquisa do Estado do Para (FAPESPA)), Pro-Reitoria de Pesquisa e Pos-Graduacao/Universidade Federal do Para, Fundacao deAmparo e Desenvolvimento da Pesquisa, Coordenacao de Aperfeicoamento de Pessoal de Nivel Superior (Capes), FAPESPA and Conselho Nacional deDesenvolvimento Cientıfico e Tecnologico. LG was supported by a grant from CAPES/Brasil. The funders had no role in the study design, the data collection andanalysis, the decision to publish, or the preparation of the manuscript.
Competing Interests: The authors have declared that no competing interests exist.
* E-mail: [email protected]/[email protected]
. These authors contributed equally to this work.
Introduction
The emergence of next-generation sequencing (NGS) technol-
ogies, such as Solexa (Illumina) [1], 454 (Roche) [2] and SOLiD
(Life Technologies) [3], allowed access to the vast amounts of
information that are contained in the genomes of various
organisms. In recent years, two large projects, HapMap [4] and
the 1,000 Genomes Project [5], and other more specific initiatives
[6–14] sought to document the genetic variability in the human
genomes of different ethnic and geographic groups. This type of
investigation allowed the identification of rare genetic variants
[11,15], the ability to make more precise inferences from
association studies with complex diseases [16], and the formulation
of new insights in the history of the formation and migration of
human populations [6–10,12–14,17–19].
The Americas were the last continents to be occupied by human
populations. According to the most widely accepted model, which
is based on anthropological, archaeological, and genetic evidence
[18,20–22], the American natives originated in Eastern Asia 20 to
30 thousand years ago (kya) and expanded across the Americas
along the North-South direction [18]. Despite the large number of
publications on the occupation of the Americas [18,20,23,24],
several questions have not yet been answered. Information on
individual and/or population-based genetic variability, such as the
information provided by whole genome sequencing (WGS), might
contribute to the solution of many of these questions.
The literature records at least 15 fully annotated WGSs of
individuals from European [8], Asian [6,7,11,13–15], Oceanic
[12], and African [9] populations, but have no Native American
representatives. To obtain a better understanding of the genetic
variability of Native Americans and to infer genetic associations
PLOS ONE | www.plosone.org 1 December 2013 | Volume 8 | Issue 12 | e83340

with complex diseases, such as diabetes mellitus type 2 and
coronary artery diseases frequently detected in South American
populations, the full genome of an individual from a South
American indigenous population was sequenced. The data
obtained served as a basis for the comparison with representatives
from different geographic areas, the discovery of new polymor-
phisms (SNPs – single nucleotide polymorphisms; and INDEL -
insertion/deletion polymorphisms) and represents the first WGS of
a South Native American individual.
Results
Whole genome sequencing and mappingThe two mate-paired full-slide runs that were performed produced
36.8 Gbp of raw data (Table 1). The total number of Gbp that
were mapped on the human genome was 31.4 (85.5%). Of these
mapped Gbp, 25.9 Gbp (70.34%) exhibited single alignment, and
35.62% of the reads were paired. A 95.92% genome mapping was
achieved with an average sequencing coverage of 8.236 and a
physical coverage of 99.836. The sequencing error rate was
estimated to be 0.0035 per base pair (bp), as suggested by Fujimoto
et al. [11].
Identification and annotation of SNPs and INDELsApproximately 2.1 million SNP and INDEL polymorphisms
were identified. Of these polymorphisms, 502,017 were considered
to have high confidence (coverage equal to or higher than 106and a minimum support of 46), of which 435,947 (86.84%) were
already described in the Single Nucleotide Polymorphism database
(dbSNP) and 66,070 (32,280 SNPs and 33,785) were considered
potentially new polymorphisms (Table 2).
The total number of high-confidence SNPs with coverage equal
to or higher than 106was 433,310 (available at Table S1). These
polymorphisms were classified according to their mutation type
(transition or transversion) and their relative position to the closest
gene, 59-UTR, introns, and other gene characteristics (e.g.,
synonymous, non-synonymous, stop codon loss, stop codon gain,
intronic, 59-UTR, 39-UTR, near 39 end of gene, 59 splice site, and
39 splice site; Table 3). The mutations were more frequently found
at the intronic regions; the next most common locations were the
39 end of the gene (500 bp after the 39 end of the gene) and the 39-
UTR. Of the 32,275 potentially new SNPs, 1,899 (5.88%) and 123
(0.38%) exhibited a coverage that was equal to or higher than 206and 506, respectively. The following analyses were based on the
complete set of high-quality SNPs, as described above.
Maternal and paternal lineagesThe maternal and paternal lineages of the sample were assessed
through a comparison of the SNPs found in the mitochondrial
DNA (mtDNA) and the SNPs found in chromosome Y (Y-DNA)
[18,25,26]. The mtDNA exhibited an average coverage of 7296and 41 variable points were detected along the mitochondrial
genome; among those 16 mutations (064 C.T; 146 T.C; 153
A.G; 235 A.G; 663 A.G; 1,736 A.G; 4,248 T.C; 4,824
A.G; 8,027 G.A; 8,794 C.T; 12,007 G.A; 16,111 C.T;
16,223 C.T; 16,290 C.T; 16,319 G.A; and 16,362 T.C) are
commonly found among the Amerindian populations, and
classified the sample within the A2 haplogroup [21,25–30]. The
analysis of the Y-DNA revealed the mutations M242, M346, and
M3, which allowed the classification of the sample within
haplogroup Q1a3a* [31].
HapMap’s population-based comparisonsWe compared the set of high-confidence SNPs that were found
in this study with those obtained in the HapMap project phases 1,
2, and 3 [4]. Of the reliable SNPs identified in the sample, 205,634
had not been previously genotyped in any of the populations
included in the database, whereas 227,676 had already been found
in at least one individual. The Asian populations (CHB and JPT)
shared the most, 222,644 SNPs (Figure S1). Moreover, these
comparisons revealed that 2,955 SNPs genotyped in all of the
populations included at HapMap. The genotype data regarding
these 2,955 SNPs (dataset A, see Material and Methods) was
applied to following analysis.
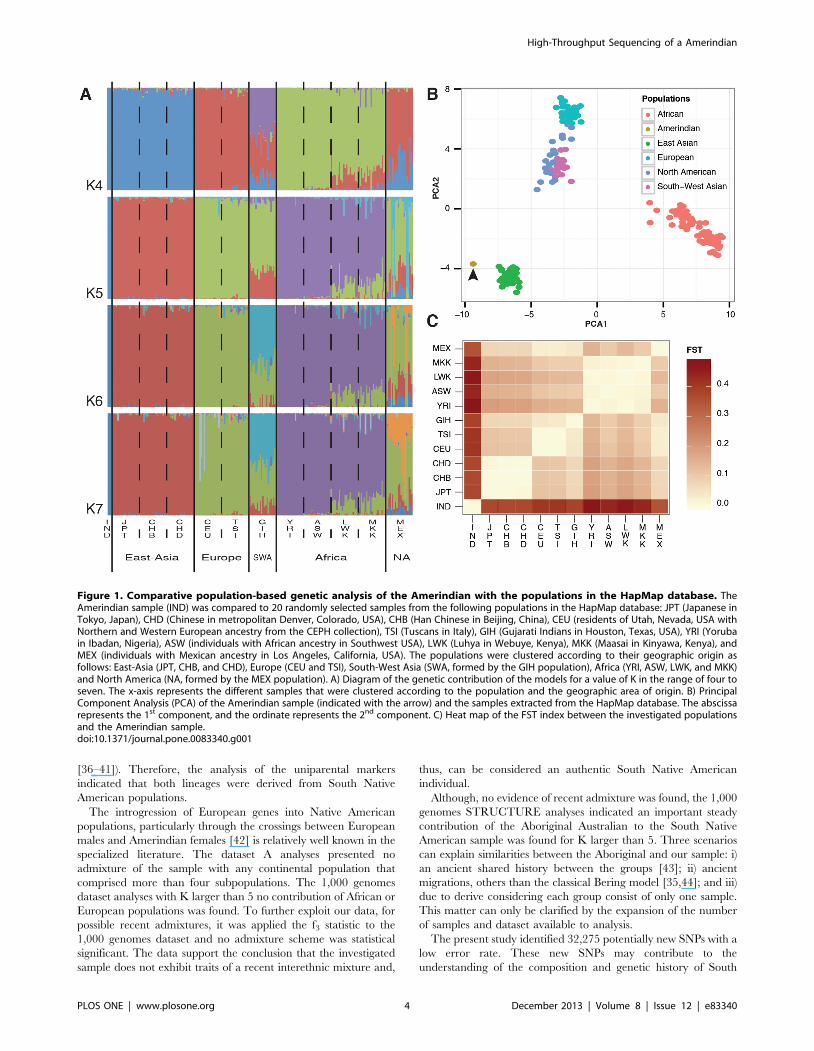
The results of STRUCTURE analyses are represented at
Figure 1A. With a K value of four, the Amerindian sample
clustered with the Asian populations (JPT, CHD, and CHB), with
only 1% of external contribution. The results also indicated a
group of the European populations (CEU and TSI), a group of the
African populations (YRI, ASW, LWK, and MKK), and the
admixed group of Mexican (MEX) and Indian (GIH) samples.
With a K value in the range of five to seven, no gene flow with
the Native American was found. At this level of analysis, the
European (CEU and TSI), Asian (JPT, CHD and CHB), and
African (YRI, ASW, LWK and MKK) populations were found to
form homogeneous groups, although the LWK and MKK
populations exhibited a small degree of mixture, mainly with
Europeans. As expected, the Mexican (MEX) and Indian (GIH)
populations exhibited a high proportion of admixture with the
various populations.
Two other approaches were used to estimate the genetic
differences: discriminant analysis of the principal components
(DAPC), which illustrated the differences among the individuals
and populations (Figure 1B); and the fixation index (FST) among
the 12 populations. To facilitate the visualization of the results, the
measures were plotted using a heat map (Figure 1C). Both results
showed that the sample was isolated from the others populations.
With the exception of the Mexican population, which is known to
result from a mixture of Europeans and Amerindians, the Eastern
Asian populations (JPT, CHB, and CHD) were found to be closest
to the South Amerindian sample. The African and European
populations were the most distant populations from the sample.
Table 1. Sequencing runs and mapping of the Amerindiansample genome.
Run
1st* 2nd** Total
Read Length 50/50 50/50
Number of Reads 95,242,345 640,615,685 735,858,030
Total Bases (Gbp) 4.8 32.0 36.8
Mapped Reads (%) 79.50% 86.44% 85.54%
Unique MappedReads (%)
60.04% 71.88% 70.34%
Unmapped Reads(%)
20.50% 13.56% 14.46%
Mapped Pairs (%) 68.63% 78.49% 77.21%
Paired Reads (%) 53.60% 32.95% 35.62%
*Physical coverage of 10.26with a mean insertion size of 1238 bp;**Physical coverage of 7.376with a mean insertion size of 1,055 bp.doi:10.1371/journal.pone.0083340.t001
High-Throughput Sequencing of a Amerindian
PLOS ONE | www.plosone.org 2 December 2013 | Volume 8 | Issue 12 | e83340
1,000 genomes population-based comparisonsThe high-confidence SNPs were also compared with those
found by 1,000 genomes project phase 1 [5] and the Aboriginal
Australian [12]. It was found a set of 13,177 SNPs (dataset B, see
Material and Methods) used for STRUCTURE and Threepop
analyses. The analysis of f3 statistics did not reveal any gene flow
involving the Native American sample with any other population
(Table 4).
The STRUCTURE analyses (Figure 2, Figure S2) reveal an
important contribution of Eastern Asian populations to the Native
American sample (K less than 4). For K between 4 and 5, the
sample distinguished from others groups, with more than 88%
specific contribution. For K values higher or equal to 6, a new
group emerges, isolating the Australian Aboriginal sample with
more than 90% of specific contribution. Interesting to notice that
for these analyses our sample presented 30% of contribution from
the Aboriginal population.
The American populations (CLM, PUR and MXL) presented a
similar scheme of contribution for K values higher or equals to 5.
They had the same population-structure formed by three major
groups: European, African and Native American.
Discussion
The aim of the present study was to describe potential new
genetic variations to be further analyzed among South Native
American populations through the use of NGS technologies. The
specialized literature describes the fully sequenced genomes of
samples of other populations, including samples of Japanese [11],
Chinese [15], Korean [6,7], Indian [13,14], Aboriginal Australian
[12], and African [9] populations; these samples are available for
comparison analyses. The accumulation of additional data might
contribute to a better understanding of the genetic diversity that is
present in those populations and to an improved historical
description of the expansion of the human population across the
various continents.
The results of the present study contribute to the catalogs of
genetic variation that have been organized by various projects,
such as the 1,000 Genome [5] and the HapMap [4] projects,
which did not include any South Native American samples until
the moment.
The comparison of the findings with the available dbSNP,
HapMap and 1,000 genomes datasets showed a high number of
potentially new polymorphisms. This result indicated the impor-
tance of acquiring information on the genetic variability of human
populations through the sequencing of individuals from different
ethnic groups, particularly those that have not been previously
investigated, such as the Native Americans. This approach is
specially important to the study of isolated populations regarding
their healthy, such as, the finding of markers associated to complex
diseases like diabetes type 2, coronary diseases, hypertension and
others.
The analyses performed limit the possibility of sequencing errors
and sample contamination. This study mapping, genome coverage
and SNP detection was similar to previous studies [12,13,15]. The
quality of these results is attested by the low error rate (estimated as
0.0035 per bp) as the one obtained by Fujimoto et al. [11].
A STRUCTURE analyses was performed to establish the
relationship between the investigated sample and samples from
several different populations. The high number of SNPs shared
with Eastern Asian populations corroborate to the classical model
of the America occupation.
The sample ancestry origin was through the analysis of the
maternal (mitochondrial DNA) and paternal (Y-DNA) lineages.
The A2 mitochondrial haplogroup is typical of the indigenous
populations of the Americas, including the South American
indigenous groups, and it is found in approximately 15% of the
Amazonian tribes [32], 3.7% of the Andean tribes [33], and 5.9%
of the southern South American tribes [33]. The Q1a3a* Y-DNA
haplogroup [31] is specific to Native American tribes [34]. It is the
most frequent among the South Native American tribes (more
than 90%; [35]). With rare exceptions, other lineages belonging to
clade Q were detected, although at a much lower frequency; (e.g.
Table 2. High-quality polymorphisms identified and not identified in the dbSNP build 135 database.
Mutation Type Total %* Described in dbSNP %* Not described in dbSNP %*
SNP 433,310 86.3% 401,035 92.0% 32,275 48.8%
Small INDEL 46,657 9.3% 34,736 8.0% 11,921 18.0%
Large INDEL 22,050 4.4% 176 0.0% 21,874 33.1%
Total 502,017 100.0% 435,947 86.8% 66,070 13.2%
*These percentages correspond to the column total.doi:10.1371/journal.pone.0083340.t002
Table 3. Nature (genomic position and type of mutation) ofthe SNPs identified in the dbSNP database.
Annotation Identified SNPsUnidentifiedSNPs Total
Total 401,035 32,275 433,310
Transitions 272,498 24,462 296,960
Transversions 128,537 7,813 136,350
Synonymous 1,318 91 1,409
Non-synonymous 1,179 157 1,336
Stop codon loss 7 1 8
Stop codon gain 16 14 30
Intronic 36,949 3,041 39,990
59-UTR 205 13 218
39-UTR 2,166 152 2,318
Near 59 end of gene 1,664 92 1,756
Near 39 end of gene 2,303 173 2,476
59 splice site 2,166 152 2,318
39 splice site 3 3 6
doi:10.1371/journal.pone.0083340.t003
High-Throughput Sequencing of a Amerindian
PLOS ONE | www.plosone.org 3 December 2013 | Volume 8 | Issue 12 | e83340
[36–41]). Therefore, the analysis of the uniparental markers
indicated that both lineages were derived from South Native
American populations.
The introgression of European genes into Native American
populations, particularly through the crossings between European
males and Amerindian females [42] is relatively well known in the
specialized literature. The dataset A analyses presented no
admixture of the sample with any continental population that
comprised more than four subpopulations. The 1,000 genomes
dataset analyses with K larger than 5 no contribution of African or
European populations was found. To further exploit our data, for
possible recent admixtures, it was applied the f3 statistic to the
1,000 genomes dataset and no admixture scheme was statistical
significant. The data support the conclusion that the investigated
sample does not exhibit traits of a recent interethnic mixture and,
thus, can be considered an authentic South Native American
individual.
Although, no evidence of recent admixture was found, the 1,000
genomes STRUCTURE analyses indicated an important steady
contribution of the Aboriginal Australian to the South Native
American sample was found for K larger than 5. Three scenarios
can explain similarities between the Aboriginal and our sample: i)
an ancient shared history between the groups [43]; ii) ancient
migrations, others than the classical Bering model [35,44]; and iii)
due to derive considering each group consist of only one sample.
This matter can only be clarified by the expansion of the number
of samples and dataset available to analysis.
The present study identified 32,275 potentially new SNPs with a
low error rate. These new SNPs may contribute to the
understanding of the composition and genetic history of South
Figure 1. Comparative population-based genetic analysis of the Amerindian with the populations in the HapMap database. TheAmerindian sample (IND) was compared to 20 randomly selected samples from the following populations in the HapMap database: JPT (Japanese inTokyo, Japan), CHD (Chinese in metropolitan Denver, Colorado, USA), CHB (Han Chinese in Beijing, China), CEU (residents of Utah, Nevada, USA withNorthern and Western European ancestry from the CEPH collection), TSI (Tuscans in Italy), GIH (Gujarati Indians in Houston, Texas, USA), YRI (Yorubain Ibadan, Nigeria), ASW (individuals with African ancestry in Southwest USA), LWK (Luhya in Webuye, Kenya), MKK (Maasai in Kinyawa, Kenya), andMEX (individuals with Mexican ancestry in Los Angeles, California, USA). The populations were clustered according to their geographic origin asfollows: East-Asia (JPT, CHB, and CHD), Europe (CEU and TSI), South-West Asia (SWA, formed by the GIH population), Africa (YRI, ASW, LWK, and MKK)and North America (NA, formed by the MEX population). A) Diagram of the genetic contribution of the models for a value of K in the range of four toseven. The x-axis represents the different samples that were clustered according to the population and the geographic area of origin. B) PrincipalComponent Analysis (PCA) of the Amerindian sample (indicated with the arrow) and the samples extracted from the HapMap database. The abscissarepresents the 1st component, and the ordinate represents the 2nd component. C) Heat map of the FST index between the investigated populationsand the Amerindian sample.doi:10.1371/journal.pone.0083340.g001
High-Throughput Sequencing of a Amerindian
PLOS ONE | www.plosone.org 4 December 2013 | Volume 8 | Issue 12 | e83340

Native American populations. The authenticity of the sample was
demonstrated through the analysis of the maternal, paternal, and
autosomal lineages. In addition, an autosomal analysis was able to
distinguish the sample from the other continental populations and
showed that it is close to the Eastern Asian populations. Other
important finding was the indication of a shared history between
our sample and the Australian Aboriginal, although no conclusion
may be taken. Although, the findings did not discard the classical
model of America settlement; it brought new insides to the
understanding of the human population history.
Materials and Methods
Ethics StatementEthical consent was obtained according to the Helsinki
Declaration. Ethical approval was obtained from the Brazilian
National Committee on Research Ethics (CONEP- Parecer
No 1062/2006). A signed informed consent was obtained from
the village leaders since most subjects were not literate in
Portuguese, but all subjects provided verbal assent to participate.
A FUNAI/FUNASA health agent, who helped explain the aims
and scope of the study to individuals, accompanied all activities.
Preparation of the Sample and Sequencing LibraryThe genomic DNA was obtained from an Amazon tribe male
healthy individual. Along the years, our group gathered a pool of
samples from several Amazon tribes. To guarantee the best ethical
behavior regarding our samples and their tribes, the studied
sample was selected randomly from our pool of male samples
together with Roewer’s Amazon samples (recently investigated in
Roewer et al. [35]). From the genomic DNA sample, a 1,000-bp
insert mate-pair library was prepared. The library was sequenced
using the SOLiD v.4 Plus platform (Life Technologies, CA, USA)
according to the manufacturer’s protocol. Based on the purpose of
the present study, two runs were performed each one in a full slide.
Ultra-Deep Sequencing of SOLiD v.4 Plus and MappingThe SOLiD platform generated thousands of reads with a
length of 50 bp. The results were transferred to the processing
server, where both runs were aligned to the reference human
genome (NCBI Genome Reference build 37 – HG19/GRCh37
Feb. 2009) using the BioscopeTM v.1.3 platform (Life Technologies,
CA, USA) following the manufacturer’s recommended protocol.
After the alignment, the output of the Bioscope software was
converted to the BAM format, and the sequencings were paired.
Table 4. Three-population admixture test f3*.
Outgroup Ingroup 1 Ingroup 2 f3 SD Z score
IND ABO ASN 0,066 0,003 22,001
IND ABO EUR 0,080 0,003 24,311
IND ABO AFR 0,092 0,004 24,460
IND ABO AMR 0,067 0,003 22,704
IND ASN EUR 0,165 0,004 37,771
IND ASN AFR 0,165 0,004 38,438
IND ASN AMR 0,158 0,004 37,665
IND EUR AFR 0,184 0,004 41,561
IND EUR AMR 0,168 0,004 38,888
IND AFR AMR 0,167 0,004 39,274
*The f3 tests the hypothesis that the outgroup is result of admixture of twoingroups (see Material and Methods). The groups were identified as: IND - SouthNative American; ABO - Australian Aboriginal (Rasmussen et al. 2011); ASN -Asian populations (CHS, CHB and JPT); EUR - European populations (CEU, IBS,TSI, FIN and GBR); AFR - African populations (ASW, LWK, MKK and YRI); and AMR- American populations (CLM, PUR and MXL).doi:10.1371/journal.pone.0083340.t004
Figure 2. Population genetic structure analysis of 1,000 genomes project’s, Aboriginal Australian and Native South Americangenotype dataset. The diagram of genetic contribution was obtained using Structure software for models of 4 to 6 subpopulations. Thepopulations were grouped labeled as follow, according to their major continental ancestry: IND (Native South American individual, this work); ABO(Aboriginal Australian individual, Rasmussen et al. 2011); Eastern Asian (CHS, CHB and JPT); Europeans (CEU, IBS, TSI, FIN and GBR); African (ASW, LWK,MKK and YRI); and New Americans (CLM, PUR and MXL). The plot represents the rate of contribution from each subpopulation (colors) to the samples(x axis).doi:10.1371/journal.pone.0083340.g002
High-Throughput Sequencing of a Amerindian
PLOS ONE | www.plosone.org 5 December 2013 | Volume 8 | Issue 12 | e83340

Error RateThe sequencing error rate was estimated using the data from
chromosomes X and Y, as suggested by Fujimoto et al. [11]. The
regions that were classified by Repeat Marker [45] to contain
pseudo-autosomal contigs, short repeats, and repeat sequences
were not considered. The predominant base call at each position
was considered correct, and the other calls were considered
erroneous.
Polymorphism callThe polymorphisms were called using the mpileup software of
the SAMtools v.0.1.17 package [46] and the Bioscope v.1.3
platform. The following criteria were applied for the detection of
the high-quality SNPs: (1) the mapping quality of the reads
(MAPQ) should be greater than 25 (Phred scale), (2) the SNP
coverage should be equal to or greater than 106, and (3) the 10-bp
window can contain up to three polymorphisms. The polymor-
phism zygousis was determined according to the filtered total and
variant coverage. A variant was called as heterozygous when the
ratio of variant coverage (variant/total) was less than 0.66 and
mutant homozygous when the ratio is above 0.66. The large
INDEL calling analyzes the read pairs and identifies those that
exhibit significant changes in the average distance between pairs;
the results were sorted according to the following criteria: (1)
minimum coverage of 36, (2) pairing quality equal to or greater
than 25 (Phred scale), (3) mapping with a minimum size of 30 bp,
and (4) maximum coverage of 10,0006. The small INDEL calling
analyzed the small gaps in the alignment of the reads, and the
results were sorted according to the following criteria: (1) the
polymorphism was supported by at least two pieces of evidence
and (2) the quality of the best mapping among the reads should be
equal to or greater than five. All of the detected polymorphisms
were compared to the polymorphisms described in the dbSNP
build 135 database [47] to identify the rsID (dbSNP identification
code) and genomic loci.
Maternal and Paternal linage analysisThe sample ancestry was inferred studying the maternal and
paternal linage. Both linages were based on motifs (of mitochon-
drial and Y DNA, respectively) that characterize ethnic groups.
The mitochondrial mutations were identified aligning the reads
from the mitochondrial to the Andrews Reference Genome
(rCRS, Revised Cambridge Reference Genome) [48,49]. The
haplogroup was determined according to the PhyloTree build 15
[26] classification and others papers [21,25,27–30]. The Y-DNA
haplogroup was determined according to Karafet et al. [31] binary
classification tree.
Population-based ComparisonsTo further investigate our sample, it was collect two dataset of
bi-allelic SNPs genotype data. The first dataset (dataset A) consists
in 220 HapMap samples’ and our sample’s genotype data for
2,955 SNPs genotyped for all HapMap’s samples and identified as
high quality in our sample. The 220 samples were selected
randomly, including 20 representatives for each population:
Japanese in Tokyo, Japan (JPT); Han Chinese in Beijing, China
(CHB); Chinese in Metropolitan Denver, Colorado (CHD);
Gujarati Indians in Houston, Texas (GIH); Yoruban in Ibadan,
Nigeria (YRI); African ancestry in Southwest USA (ASW); Maasai
in Kinyawa, Kenya (MKK); Luhya in Webuye (LWK); Utah
residents with Northern and Western European ancestry from the
CEPH collection (CEU); Tuscan in Italy (TSI); and Mexican
ancestry in Los Angeles, California (MEX).
The second dataset (Dataset B) consists in 1092 samples of
project 1,000 genomes phase 1 [5], Aboriginal Australian’s [12],
and our sample’s genotype data for 13,177 SNPs. Those SNPs
were identified as high quality in the studied sample, genotyped for
90% of the 1000 genomes project samples and the Aboriginal
Australian. This dataset included the following individual per
population: 89 GBR (British individuals from England and
Scotland); 93 FIN (HapMap Finnish individuals from Finland);
100 CHS (Han Chinese South); 55 PUR (Puerto Rican in Puerto
Rico); 60 CLM (Colombian in Medellin, Colombia); 14 IBS
(Iberian populations in Spain); 85 CEU; 88 YRI; 88 CHB; 89 JPT;
97 LWK; 61 ASW; 66 MXL; and 98 TSI.
To infer the genetic distance, the FST was calculated by
Arlequin v.3.5 software [50], and visualized with a discriminant
analysis of the principal components (DAPC), included in the
adegenet v.1.3-1 library [51] of the R statistical package [52] using
dataset A. DAPC was chosen over the conventional principal
component analysis (PCA) because it maximizes the differences
among groups, which results in a more accurate representation of
the differences between the populations. It was also perform the
test of ‘‘treeness’’ for 3 populations (f3 statistic [53]) by the
Threepop v0.1 software (included in the treemix packge [54])
using dataset B to evaluate the sample admixture. The populations
included in this dataset were grouped according to their continent
as: Asian (CHB, CHS, and JPT); European (GBR, TSI, IBS,
CEU, and FIN); African (ASW, MKK, LWK, and YRI); New
Americans (MXL, PUR, and CLM); Australian Aboriginal; and
South Native American. The f3 statistic test if a population 1 is
admixed regarding the others two populations (this test is formally
written as: f3(X1; X2, X3)), where f3 values significantly negatives
indicates that population 1 is admixed.
The admixture analyses were performed using Structure v. 2.3.4
software [55] with 150,000 learning repetitions. The dataset A was
analyzed with four to seven subpopulations and dataset B with two
to nine subpopulations.
Supporting Information
Figure S1 Venn diagram of the shared SNPs amongAmerindian sample, CEU, YRI, JPT, and CHB popula-tions. The Venn diagram represents the total set of SNPs that
were found in the Amerindian sample and those SNPs that are
shared with the genotyped samples of the CEU (residents of Utah,
Nevada, USA with Northern and Western European ancestry
from the CEPH collection), YRI (Yoruba in Ibadan, Nigeria),
CHB (Han Chinese in Beijing, China), and JPT (Japanese in
Tokyo, Japan) populations. Due to the high similarity between the
genotypes of the CHB and JPT populations, their representatives
were grouped into a single set (CHB+JPT) that represents the
mutations that are shared between the Amerindian sample and the
CHB and JPT populations.
(EPS)
Figure S2 Complete population genetic structure anal-ysis of 1,000 genomes project’s, Aboriginal Australianand Native South American genotype dataset. The
diagram of genetic contribution was obtained using Structure
software for models of 2 to 9 subpopulations. The populations
were grouped labeled as follow, according to their major
continental ancestry: IND (Native South American individual,
this work); ABO (Aboriginal Australian individual, Rasmussen et
al. 2011); Eastern Asian (CHS, CHB and JPT); Europeans (CEU,
IBS, TSI, FIN and GBR); African (ASW, LWK, MKK and YRI);
and New Americans (CLM, PUR and MXL). The plot represents
High-Throughput Sequencing of a Amerindian
PLOS ONE | www.plosone.org 6 December 2013 | Volume 8 | Issue 12 | e83340

the rate of contribution from each subpopulation (colors) to the
samples (x axis).
(TIF)
Table S1 Total high-confidence SNPs detected. A com-
plete list of all high-confidence SNPs detected in the sample,
including its’ chromossomic position relative to hg19 reference
genome, the reference and mutant base observed with their
relative base coverage and dbSNP identification.
(ZIP)
Acknowledgments
The authors thank Lutz Roewer for collaborating to our sample pool.
Author Contributions
Conceived and designed the experiments: ARdS AS SJS SS WASJ.
Performed the experiments: ARdS AS DOA MSB. Analyzed the data:
AMRdS JESS RA SJS SD WASJ. Contributed reagents/materials/analysis
tools: ARdS AS SS. Wrote the paper: AMRdS ARdS LG SS SD.
References
1. Bentley DR, Balasubramanian S, Swerdlow HP, Smith GP, Milton J, et al.
(2008) Accurate whole human genome sequencing using reversible terminator
chemistry. Nature 456: 53–59. doi:10.1038/nature07517.
2. Margulies M, Egholm M, Altman WE, Attiya S, Bader JS, et al. (2005) Genome
sequencing in microfabricated high-density picolitre reactors. Nature 437: 376–
380. doi:10.1038/nature03959.
3. McKernan KJ, Peckham HE, Costa GL, McLaughlin SF, Fu Y, et al. (2009)
Sequence and structural variation in a human genome uncovered by short-read,
massively parallel ligation sequencing using two-base encoding. Genome Res 19:
1527–1541. doi:10.1101/gr.091868.109.
4. Gibbs RA, Belmont JW, Hardenbol P, Willis TD, Yu F (2003) The International
HapMap Project. Nature 426: 789–796. doi:10.1038/nature02168.
5. The 1000 Genomes Project Consortium (2010) A map of human genome
variation from population-scale sequencing. Nature 467: 1061–1073.
doi:10.1038/nature09534.
6. Ahn SM, Kim TH, Lee S, Kim DS, Ghang H, et al. (2009) The first Korean
genome sequence and analysis: full genome sequencing for a socio-ethnic group.
Genome 19: 1622–1629. doi:10.1101/gr.092197.109.
7. Kim J-I, Ju YS, Park H, Kim S, Lee S, et al. (2009) A highly annotated whole-
genome sequence of a Korean individual. Nature 460: 1011–1015. doi:10.1038/
nature08211.
8. Tong P, Prendergast JGD, Lohan AJ, Farrington SM, Cronin S, et al. (2010)
Sequencing and analysis of an Irish human genome. Genome Biol 11: R91.
doi:10.1186/gb-2010-11-9-r91.
9. Schuster SC, Miller W, Ratan A, Tomsho LP, Giardine B, et al. (2010)
Complete Khoisan and Bantu genomes from southern Africa. Nature 463: 943–
947. doi:10.1038/nature08795.
10. Shapiro B, Hofreiter M (2010) Analysis of ancient human genomes. BioEssays
32: 388–391. doi:10.1002/bies.201000026.
11. Fujimoto A, Nakagawa H, Hosono N, Nakano K, Abe T, et al. (2010) Whole-
genome sequencing and comprehensive variant analysis of a Japanese individual
using massively parallel sequencing. Nat Genet 42: 931–936. doi:10.1038/
ng.691.
12. Rasmussen M, Guo X, Wang Y, Lohmueller KE, Rasmussen S, et al. (2011) An
Aboriginal Australian genome reveals separate human dispersals into Asia.
Science 334: 94–98. doi:10.1126/science.1211177.
13. Patowary A, Purkanti R, Singh M, Chauhan RK, Bhartiya D, et al. (2012)
Systematic analysis and functional annotation of variations in the genome of an
Indian individual. Hum Mutat 33: 1133–1140. doi:10.1002/humu.22091.
14. Gupta R, Ratan A, Rajesh C, Chen R, Kim HL, et al. (2012) Sequencing and
analysis of a South Asian-Indian personal genome. BMC Genomics 13: 440.
doi:10.1186/1471-2164-13-440.
15. Wang J, Wang W, Li R, Li Y, Tian G, et al. (2008) The diploid genome
sequence of an Asian individual. Nature 456: 60–65. doi:10.1038/nature07484.
16. Gonzaga-Jauregui C, Lupski JR, Gibbs R a (2012) Human Genome Sequencing
in Health and Disease. Annu Rev Med 63: 35–61. doi:10.1146/annurev-med-
051010-162644.
17. Burbano HA, Hodges E, Green RE, Briggs AW, Krause J, et al. (2010) Targeted
investigation of the Neandertal genome by array-based sequence capture.
Science 328: 723–725. doi:10.1126/science.1188046.
18. Fagundes NJR, Kanitz R, Bonatto SL (2008) A reevaluation of the Native
American mtDNA genome diversity and its bearing on the models of early
colonization of Beringia. PLoS One 3: e3157. doi:10.1371/journal.-
pone.0003157.
19. Green RE, Krause J, Briggs AW, Maricic T, Stenzel U, et al. (2010) A draft
sequence of the Neandertal genome. Science 328: 710–722. doi:10.1126/
science.1188021.
20. O’Rourke DH, Raff JA (2010) The human genetic history of the Americas: the
final frontier. Curr Biol 20: R202–7. doi:10.1016/j.cub.2009.11.051.
21. Forster P, Harding R, Torroni A, Bandelt HJ (1996) Origin and evolution of
Native American mtDNA variation: a reappraisal. Am J Hum Genet 59: 935–
945.
22. Rothhammer F, Dillehay TD (2009) The late Pleistocene colonization of South
America: An interdisciplinary perspective. Ann Hum Genet 73: 540–549.
23. Reich D, Patterson N, Campbell D, Tandon A, Mazieres S, et al. (2012)
Reconstructing Native American population history. Nature 488: 370–374.
doi:10.1038/nature11258.
24. Bisso-Machado R, Bortolini MC, Salzano FM (2012) Uniparental geneticmarkers in South Amerindians. Genet Mol Biol 35: 365–387. doi:10.1590/
S1415-47572012005000027.
25. Silva Jr WA, Bonatto SL, Holanda AJ, Ribeiro-dos-Santos AK, Paixao BM, etal. (2002) Mitochondrial Genome Diversity of Native Americans Supports a
Single Early Entry of Founder Populations into America. Am J Hum Genet 71:187–192.
26. Van Oven M, Kayser M (2009) Updated comprehensive phylogenetic tree of
global human mitochondrial DNA variation. Hum Mutat 30: E386–94.doi:10.1002/humu.20921.
27. Smith DG, Malhi RS, Eshleman J, Lorenz JG, Kaestle FA (1999) Distribution ofmtDNA haplogroup X among Native North Americans. Am J Phys Anthropol
110: 271–284. doi:10.1002/(SICI)1096-8644(199911)110:3,271::AID-AJ-
PA2.3.0.CO;2-C.
28. Kong Q-P, Bandelt H-J, Sun C, Yao Y-G, Salas A, et al. (2006) Updating the
East Asian mtDNA phylogeny: a prerequisite for the identification of pathogenicmutations. Hum Mol Genet 15: 2076–2086. doi:10.1093/hmg/ddl130.
29. Starikovskaya EB, Sukernik RI, Derbeneva OA, Volodko N V, Ruiz-Pesini E, et
al. (2005) Mitochondrial DNA diversity in indigenous populations of thesouthern extent of Siberia, and the origins of Native American haplogroups. Ann
Hum Genet 69: 67–89. doi:10.1046/j.1529-8817.2003.00127.x.
30. Ribeiro-Dos-Santos AKC, Santos SEB, L MA, Guapindaia V, Zago MA (1996)
Heterogeneity of mitochondrial DNA haplotypes in Pre-Columbian natives ofthe Amazon region. Am J Phys Anthropol 101: 29–37. doi:10.1002/(SICI)1096-
8644(199609)101:1,29::AID-AJPA3.3.0.CO;2-8.
31. Karafet TM, Mendez FL, Meilerman MB, Underhill PA, Zegura SL, et al.(2008) New binary polymorphisms reshape and increase resolution of the human
Y chromosomal haplogroup tree. Genome Res 18: 830–838. doi:10.1101/gr.7172008.
32. Santos SE, Ribeiro-dos-Santos AK, Meyer D, Zago MA (1996) Multiple founder
haplotypes of mitochondrial DNA in Amerindians revealed by RFLP andsequencing. Ann Hum Genet 60: 305–319.
33. Rodriguez-Delfin LA, Rubin-de-Celis VE, Zago MA (2001) Genetic diversity inan Andean population from Peru and regional migration patterns of
Amerindians in South America: data from Y chromosome and mitochondrial
DNA. Hum Hered 51: 97–106. doi:22964.
34. Zegura SL, Karafet TM, Zhivotovsky LA, Hammer MF (2004) High-resolution
SNPs and microsatellite haplotypes point to a single, recent entry of NativeAmerican Y chromosomes into the Americas. Mol Biol Evol 21: 164–175.
doi:10.1093/molbev/msh009.
35. Roewer L, Nothnagel M, Gusmao L, Gomes V, Gonzalez M, et al. (2013)Continent-wide decoupling of Y-chromosomal genetic variation from language
and geography in native South Americans. PLoS Genet 9: e1003460.doi:10.1371/journal.pgen.1003460.
36. Bailliet G, Ramallo V, Muzzio M, Garcıa A, Santos MR, et al. (2009) Brief
communication: Restricted geographic distribution for Y-Q* paragroup inSouth America. Am J Phys Anthropol 140: 578–582. doi:10.1002/ajpa.21133.
37. Toscanini U, Gusmao L, Berardi G, Gomes V, Amorim A, et al. (2011) Malelineages in South American native groups: evidence of M19 traveling south.
Am J Phys Anthropol 146: 188–196. doi:10.1002/ajpa.21562.
38. Bortolini MC, Salzano FM, Thomas MG, Stuart S, Nasanen SPK, et al. (2003)
Y-chromosome evidence for differing ancient demographic histories in the
Americas. Am J Hum Genet 73: 524–539. doi:10.1086/377588.
39. Demarchi DA, Mitchell RJ (2004) Genetic structure and gene flow in Gran
Chaco populations of Argentina: evidence from Y-chromosome markers. HumBiol 76: 413–429.
40. Sala A, Arguelles CF, Marino ME, Bobillo C, Fenocchio A, et al. (2010) Genetic
analysis of six communities of Mbya-Guaranı inhabiting northeastern Argentinaby means of nuclear and mitochondrial polymorphic markers. Hum Biol 82:
433–456. doi:10.3378/027.082.0406.
41. Blanco-Verea A, Jaime JC, Brion M, Carracedo A (2010) Y-chromosome
lineages in native South American population. Forensic Sci Int Genet 4: 187–
193. doi:10.1016/j.fsigen.2009.08.008.
42. Dos Santos SEB, Rodrigues JD, Ribeiro-dos-Santos AK, Zago MA (1999)
Differential contribution of indigenous men and women to the formation of anurban population in the Amazon region as revealed by mtDNA and Y-DNA.
Am J Phys Anthropol 109: 175–180. doi:10.1002/(SICI)1096-
8644(199906)109:2,175::AID-AJPA3.3.0.CO;2.
High-Throughput Sequencing of a Amerindian
PLOS ONE | www.plosone.org 7 December 2013 | Volume 8 | Issue 12 | e83340

43. Goncalves VF, Stenderup J, Rodrigues-Carvalho C, Silva HP, Goncalves-
Dornelas H, et al. (2013) Identification of Polynesian mtDNA haplogroups inremains of Botocudo Amerindians from Brazil. Proc Natl Acad Sci U S A 110:
6465–6469. doi:10.1073/pnas.1217905110.
44. Balter M (2008) Archaeology. Ancient algae suggest sea route for firstAmericans. Science 320: 729. doi:10.1126/science.320.5877.729.
45. Smit AFA, Hubley R, Green P. (n.d.) RepeatMasker Open-3.0.46. Li H, Handsaker B, Wysoker A, Fennell T, Ruan J, et al. (2009) The Sequence
Alignment/Map format and SAMtools. Bioinformatics 25: 2078–2079.
doi:10.1093/bioinformatics/btp352.47. Sherry ST, Ward MH, Kholodov M, Baker J, Phan L, et al. (2001) dbSNP: the
NCBI database of genetic variation. Nucleic Acids Res 29: 308–311.48. Anderson S, Bankier AT, Barrell BG, de Bruijn MH, Coulson AR, et al. (1981)
Sequence and organization of the human mitochondrial genome. Nature 290:457–465.
49. Andrews RM, Kubacka I, Chinnery PF, Lightowlers RN, Turnbull DM, et al.
(1999) Reanalysis and revision of the Cambridge reference sequence for humanmitochondrial DNA. Nat Genet 23: 147. doi:10.1038/13779.
50. Excoffier L, Lischer HEL (2010) Arlequin suite ver 3.5: a new series of programs
to perform population genetics analyses under Linux and Windows. Mol Ecol
Resour 10: 564–567. doi:10.1111/j.1755-0998.2010.02847.x.
51. Jombart T, Ahmed I (2011) adegenet 1.3-1: new tools for the analysis of genome-
wide SNP data. Bioinformatics 27: 3070–3071. doi:10.1093/bioinformatics/
btr521.
52. R Core Team (2013) R: A Language and Environment for Statistical
Computing. R Foundation for Statistical Computing, Vienna, Austria. ISBN
3-900051-07-0.
53. Reich D, Thangaraj K, Patterson N, Price AL, Singh L (2009) Reconstructing
Indian population history. Nature 461: 489–494. doi:10.1038/nature08365.
54. Pickrell JK, Pritchard JK (2012) Inference of population splits and mixtures from
genome-wide allele frequency data. PLoS Genet 8: e1002967. doi:10.1371/
journal.pgen.1002967.
55. Falush D, Stephens M, Pritchard JK (2007) Inference of population structure
using multilocus genotype data: dominant markers and null alleles. Mol Ecol
Notes 7: 574–578. doi:10.1111/j.1471-8286.2007.01758.x.
High-Throughput Sequencing of a Amerindian
PLOS ONE | www.plosone.org 8 December 2013 | Volume 8 | Issue 12 | e83340