High-Throughput Screening-Compatible Single-Step Protocol to Differentiate Embryonic Stem Cells in...
12
STEM CELLS AND DEVELOPMENT 17:573–584 (2008) © Mary Ann Liebert, Inc. DOI: 10.1089/scd.2007.0130 Original Research Report High-Throughput Screening-Compatible Single-step Protocol to Differentiate Embryonic Stem Cells in Neurons* ANNALISA FICO, 1 GENESIA MANGANELLI, 1 MARINO SIMEONE, 2 STEFANO GUIDO, 2 GABRIELLA MINCHIOTTI, 1 and STEFANIA FILOSA 1 ABSTRACT Biotechnologies such as high-throughput screening (HTS) enable evaluation of large compound li- braries for their biological activity and toxic properties. In the field of drug development, embry- onic stem (ES) cells have been instrumental in HTS for testing the effect of new compounds. We re- port an innovative method in one step to differentiate ES cells in neurons and glial cells. The four different neuronal subtypes, -aminobutyric acid (GABA)-ergic, dopaminergic, serotonergic, and motor neurons, are formed in culture. This protocol is adaptable to small wells and is highly re- producible, as indicated by the Z-factor value. Moreover, by using either leukemia inhibitory fac- tor (LIF) or recombinant Cripto protein in our culture conditions, we provide evidence that this protocol is suitable for testing the effect of different molecules on neuronal differentiation of ES cells. Finally, thanks to the simplicity in carrying out the experiment, this method provides the pos- sibility of following the morphological evolution of the in vitro differentiating neuronal cells by time- lapse videomicroscopy. Our experimental system provides a powerful tool for testing the effect of different substances on survival and/or differentiation of neuronal and glial cells in an HTS-based approach. Furthermore, using genetically modified ES cells, it would be possible to screen for drugs that have a therapeutic effect on specific neuronal pathologies or to follow, by time-lapse videomi- croscopy, their ability to in vitro differentiate. 573 INTRODUCTION E MBRYONIC STEM (ES) CELLS are pluripotent cells de- rived from the inner cell mass (CIM) of blastocyst- stage embryos [1,2]. They can be maintained and ex- panded as a pure population of undifferentiated cells and they can be genetically modified. In addition, ES cells display a remarkable capacity to form differentiated cell types in culture [3]. These properties have made ES cells a very useful system for introducing specific genetic al- terations in vivo and for studying gene function during differentiation in vitro [4]. More recently, ES cells have been used as a powerful model for testing new compounds in the field of drug de- velopment. Indeed, testing new compounds in vitro has a high priority before animal and human treatments are 1 Stem Cell Fate Lab, Istituto di Genetica e Biofisica “Adriano Buzzati Traverso” CNR, Via Pietro Castellino 111, 80131 Napoli, Italy. 2 Laboratori Giovanni Astarita, Dipartimento di Ingegneria Chimica, Università degli Studi di Napoli Federico II, 80125 Naples, Italy. *A video described here is available online at www.liebertpub.com/scd
-
Upload
independent -
Category
Documents
-
view
2 -
download
0
Transcript of High-Throughput Screening-Compatible Single-Step Protocol to Differentiate Embryonic Stem Cells in...
STEM CELLS AND DEVELOPMENT 17:573–584 (2008)© Mary Ann Liebert, Inc.DOI: 10.1089/scd.2007.0130
Original Research Report
High-Throughput Screening-Compatible Single-step Protocolto Differentiate Embryonic Stem Cells in Neurons*
ANNALISA FICO,1 GENESIA MANGANELLI,1 MARINO SIMEONE,2 STEFANO GUIDO,2GABRIELLA MINCHIOTTI,1 and STEFANIA FILOSA1
ABSTRACT
Biotechnologies such as high-throughput screening (HTS) enable evaluation of large compound li-braries for their biological activity and toxic properties. In the field of drug development, embry-onic stem (ES) cells have been instrumental in HTS for testing the effect of new compounds. We re-port an innovative method in one step to differentiate ES cells in neurons and glial cells. The fourdifferent neuronal subtypes, �-aminobutyric acid (GABA)-ergic, dopaminergic, serotonergic, andmotor neurons, are formed in culture. This protocol is adaptable to small wells and is highly re-producible, as indicated by the Z-factor value. Moreover, by using either leukemia inhibitory fac-tor (LIF) or recombinant Cripto protein in our culture conditions, we provide evidence that thisprotocol is suitable for testing the effect of different molecules on neuronal differentiation of EScells. Finally, thanks to the simplicity in carrying out the experiment, this method provides the pos-sibility of following the morphological evolution of the in vitro differentiating neuronal cells by time-lapse videomicroscopy. Our experimental system provides a powerful tool for testing the effect ofdifferent substances on survival and/or differentiation of neuronal and glial cells in an HTS-basedapproach. Furthermore, using genetically modified ES cells, it would be possible to screen for drugsthat have a therapeutic effect on specific neuronal pathologies or to follow, by time-lapse videomi-croscopy, their ability to in vitro differentiate.
573
INTRODUCTION
EMBRYONIC STEM (ES) CELLS are pluripotent cells de-rived from the inner cell mass (CIM) of blastocyst-
stage embryos [1,2]. They can be maintained and ex-panded as a pure population of undifferentiated cells andthey can be genetically modified. In addition, ES cellsdisplay a remarkable capacity to form differentiated cell
types in culture [3]. These properties have made ES cellsa very useful system for introducing specific genetic al-terations in vivo and for studying gene function duringdifferentiation in vitro [4].
More recently, ES cells have been used as a powerfulmodel for testing new compounds in the field of drug de-velopment. Indeed, testing new compounds in vitro hasa high priority before animal and human treatments are
1Stem Cell Fate Lab, Istituto di Genetica e Biofisica “Adriano Buzzati Traverso” CNR, Via Pietro Castellino 111, 80131 Napoli,Italy.
2Laboratori Giovanni Astarita, Dipartimento di Ingegneria Chimica, Università degli Studi di Napoli Federico II, 80125 Naples,Italy.
*A video described here is available online at www.liebertpub.com/scd

started. Thus, there is an increasing demand for new invitro models that can be used in high-throughput systemsfor facilitating drug development. Whole embryo cul-tures, primary cell cultures, and stable cell lines are con-sidered suitable in vitro alternatives. Recently, either un-differentiated or in vitro differentiated ES cells are usedpreferentially to test embryotoxicity [5].
To this end, a great effort has been made to set up pro-tocols in high-throughput screening (HTS) to enable eval-uation of large chemical libraries for their biological ac-tivity and toxic properties using undifferentiated anddifferentiated ES cells. Moreover, differentiated ES cellshave been instrumental in HTS to identify chemical com-pounds enhancing cardiac differentiation [6].
A number of different protocols describe culture con-ditions for in vitro generation of neuronal and glial cellsfrom mouse ES cells. However, to achieve efficient neu-ronal differentiation of ES cells, current protocols exploitmultistep strategies requiring either co-culture, sphere, orembryoid body (EB) formation and/or addition of spe-cific growth factors [4,7–14]. It is worth noting that aprotocol has been previously described to convert EScells into neuroectodermal precursors using adherentmonoculture; however, to obtain terminally differentiatedneurons and glial cells, a step of cell dissociation and re-plating was required [15]. Obviously, this step is incom-patible with automated applications of the differentiationprotocol.
Here we describe a simple one-step method to differ-entiate ES cells into neurons and glia cells, which doesnot require intermediate cell dissociation and replatingsteps, special equipment or training, other than regulartissue culture, and is suitable for time-lapse videomi-croscopy.
MATERIALS AND METHODS
ES cell culture and in vitro differentiation protocol
AK7 and R1 ES cells were maintained in an undifferentiatedstate by culture on a monolayer of mitomycin C-inactivated fi-broblasts in the presence of leukemia-inhibiting factor (LIF)[16]. At 48 h before inducing differentiation, cells were seededon gelatin-coated plates. At day 0, ES cells were dissociated ina single-cell suspension and 1,000 cells/cm2 were plated ongelatin-coated plates (diameter from 10 to 0.8 cm). The culturemedium was replaced daily during differentiation process. Cul-ture medium for neuronal differentiation [serum-free KnockoutSerum Replacement (KSR)-supplemented medium] containedknockout Dulbecco minimal essential medium supplementedwith 15% KSR (Invitrogen), 2 mM glutamine, 100 U/ml peni-cillin/streptomycin, and 0.1 mM �-mercaptoethanol. Inhibitionof neuronal differentiation was performed adding 750 U/ml or1,500 U/ml of LIF, or adding �g/ml or 10 �g/ml of Cripto tothe described culture condition.
RNA isolation and RT-PCR
Total RNA was isolated by acid-phenol extraction (Trizol;Gibco/BRL, Gaithersburg, MD). Reverse transcription-PCR(RT-PCR) was performed with the Perkin-Elmer RT-PCR kit,as recommended by the manufacturer. cDNA was amplified byPCR. The number of cycles was chosen to select PCR condi-tions on the linear portion of the reaction curve to avoid the sat-uration effects of PCR. Sequences of specific primers, numberof cycles, annealing temperature and the length of the ampli-fied products were reported in Table 1.
Western blotting
Total cell lysates were prepared either from undifferentiatedor differentiated cells. Cells were lysed in 10 mM Tris-HCl,pH,7.4, 150 mM NaCl, 1 mM EDTA, 1% Triton X-100, 10%glycerol, supplemented with 0.5 mM dithiothreitol (DTT), 0.5mM phenylmethylsulfonyl fluoride (PMSF), 2 mM benzami-dine, 20 mg/ml aprotinin, 4 mg/ml pepstatin, 10 mM leupeptin,10 mM sodium fluoride, 1 mM sodium orthovanadate, and 25mM �-glycerophosphate (Sigma-Aldrich). After 15 min incu-bation on ice, the lysates were cleared by centrifugation. Totalcell extracts were separated on 12.5% sodium dodecyl sulfate-polyacrylamide gel electrophoresis (SDS-PAGE) and trans-ferred to Immobilon-P transfer membranes (Millipore). Afterblocking with 5% nonfat milk, membranes were incubated withpolyclonal anti-Cripto antiserum [17]. The immune complexeswere detected by the ECL Plus detection system according tothe manufacturer’s protocol (Amersham Bioscience).
Immunocytochemistry
Cells were fixed in 4% paraformaldehyde and 1� phosphate-buffered saline (PBS) at room temperature for 30 min. Fol-lowing fixation, samples were washed three times with 1� PBSfor 5 min and then incubated with 10% normal goat serum(Dako Cytomation, Glostrup, Denmark, http://dakocytoma-tion.com) and 0.1% Triton X-100 in 1� PBS for 15 min atroom temperature. The cells were then washed three times in1� PBS for 5 min and incubated with primary antibodies in10% normal goat serum and 1� PBS at the following workingdilutions: monoclonal anti-�III-tubulin (1:400; Sigma-Aldrich),monoclonal anti-NeuN (1:100, Chemicon International), mono-clonal anti-microtubule-associated protein-2 (MAP2, 1:500;Chemicon International), monoclonal anti-nestin (1:10; ob-tained from the Developmental Studies of Hybridoma Bank,University of Iowa), polyclonal anti-glial fibrillary acidic pro-tein (GFAP, 1:300; Dako Cytomation), polyclonal anti-tyrosinehydroxylase (TH, 1:100; Chemicon International), polyclonalanti-GABA (1:100; Sigma-Aldrich), polyclonal anti-5-hydrox-ytryptamine (5-HT, 1:600; Sigma-Aldrich); monoclonal anti-Islet1 (1:100; obtained from the Developmental Studies of Hy-bridoma Bank, University of Iowa), polyclonal anti-NF-M(Neurofilament-M) (1:200; Chemicon International), monoclo-nal anti-E-cadherin (1:100; Sigma-Aldrich), and monoclonalanti-desmin (1:50; Abcam). Following primary antibody incu-bation, cells were rinsed three times in 1� PBS and further in-cubated with secondary antibodies: either goat anti-rabbit im-
FICO ET AL.
574
Tabl
e 1:
Prim
ers
used
and
PCR
con
ditio
ns
For
war
dR
ever
seT
m (
°C)
Cyc
les
Pro
duct
sB
F1
5’-A
CT
TT
GA
GT
TA
CA
AC
GG
GA
CC
AC
G-3
’5’
-AA
AG
TA
AC
TG
GT
CT
GG
CC
CG
C-3
’60
3528
2 bp
BL
BP
5’-C
CG
AG
TT
CC
TC
CA
GT
TC
CT
GC
C-3
’5’
-TC
TT
GC
CA
TC
CT
TA
AT
TT
CT
CT
-3’
6535
389
bpD
AT
5’-G
TG
GG
CT
TC
AC
TG
TC
AT
CC
TC
A-3
’5’
-CC
CA
GG
TC
AT
CA
AT
GC
CA
CG
A-3
’62
3532
8 bp
Em
x15’
-CA
AC
CC
CC
TC
AC
TC
TT
TC
TT
CA
-3’
5’-G
TT
TG
TA
TT
TT
GT
CC
TC
CG
AT
T-3
’58
3532
1 bp
En1
5’-T
CA
AG
AC
TG
AC
TC
AC
AG
CA
AC
CC
C-3
’5’
-TG
AA
TG
TC
CA
CT
CG
GA
GG
AT
T-3
’55
3556
4 bp
GA
D65
5’-G
GC
TC
TG
GC
TT
TT
GG
TC
CT
TC
-3’
5’-T
GC
CA
AT
TC
CC
AA
TT
AT
AC
TC
TT
G-3
’60
3543
7 bp
GA
TA
45’
-CA
CT
AT
GG
GC
AC
AG
CA
GC
TC
C-3
’5’
-TT
GG
AG
CT
GG
CC
TG
CG
AT
GT
C-3
’65
3517
6 bp
GF
AP
5'-G
CT
GG
AG
GT
GG
AG
AG
GG
AC
A-3
'5'
-TG
GC
GG
CG
AT
AG
TC
GT
TA
GC
-3'
5830
456
bpH
B9
5’-A
CA
GG
CG
GC
TC
TC
TA
TG
GG
AC
AC
-3’
5’-T
TC
CC
CA
AG
AG
GT
TC
GA
CT
GC
-3’
5835
258
bpH
oxb4
5’-C
CT
GG
AT
GC
GC
AA
AG
TT
CA
C-3
’5’
-GT
GT
TG
GG
CA
AC
TT
GT
GG
TC
-3’
5828
240
bpH
oxb9
5’-T
CC
GT
GT
GC
CA
CC
TT
TT
CC
CT
-3’
5’-G
GT
AT
TT
GG
TG
TA
GG
GA
CA
GC
-3’
6030
643
bpH
PR
T5’
-CC
TG
CT
GG
AT
TA
CA
TT
AA
AG
CA
CT
G-3
’5’
-CC
TG
AA
GT
AC
TC
AT
TA
TA
GT
CA
AG
G-3
’60
3536
9 bp
Mat
h15’
-CT
TC
CT
CT
GG
GG
GT
TA
CT
CG
-3’
5’-A
AA
CT
CT
CC
GT
CA
CT
TC
TG
TG
G-3
’58
3218
5 bp
MH
C5-
GG
AA
GA
GT
GA
GC
GG
CG
CA
TC
AA
GG
-3
5- C
TG
CT
GG
AG
AG
GT
TA
TT
CC
TC
G -
360
2629
8 bp
Nan
og5’
-GT
GG
AG
TC
AC
AG
AG
TA
GT
TC
AG
G-3
’5’
-GT
GC
AC
TC
AA
GG
AC
AG
GT
TT
CA
G-3
’65
3257
8 bp
Nes
tin
5’-C
GG
GA
GA
GT
CG
CT
TA
GA
GG
TG
CA
GC
AG
-3’
5’-C
CC
CC
AA
GA
GA
AG
GA
TG
TT
GG
GC
TG
-3’
5835
400
bpN
F-L
5’-C
TC
CT
AC
TT
GA
TG
TC
TG
CT
CG
C-3
’5’
-TC
AG
AC
TC
AT
CC
TT
GG
CA
GC
-3’
6035
232
bpN
kx2.
25’
-AT
GT
CG
CT
GA
CC
AA
CA
CA
AA
-3’
5’-A
AA
GG
GC
TC
TT
AA
GG
GG
CA
G-3
’58
3019
4 bp
Nkx
2.5
5’-T
GC
AG
AA
GG
CA
GT
GG
AG
CT
GG
AC
AA
G-3
’5’
-TT
GC
AC
TT
GT
AG
CG
AC
GG
TT
CT
GG
AA
C-3
’59
3523
7 bp
Oct
45’
-AG
GG
AT
GG
CA
TA
CT
GT
GG
AC
-3’
5’-C
CT
GG
GA
AA
GG
TG
TC
CC
TG
TA
-3’
6230
700
bpO
tx2
5’-T
CC
GT
CA
CT
CC
AA
AT
CT
AC
CC
AC
C-3
’5’
-AG
TT
GA
TT
TT
CA
GT
GC
CA
CC
TC
TT
-3’
6530
347
bpP
ax6
5’-T
GC
CC
TT
CC
AT
CT
TT
GC
TT
G-3
’5’
-TC
TG
CC
CG
TT
CA
AC
AT
CC
TT
AG
-3’
6530
177
bpSh
h5’
-GG
AA
GA
TC
AC
AA
GA
AA
CT
CC
GA
AC
-3’
5’-G
GA
TG
TG
AG
CT
TT
GG
AT
TC
AT
-3’
6035
354
bpSo
x25’
-AC
TC
CA
TG
AC
CA
GC
TC
GC
AG
AC
-3’
5’-T
CT
CT
CC
CC
TT
CT
CC
AG
TT
CG
C-3
’65
3236
3 bp
Sox1
75’
-GC
CA
AA
GA
CG
AA
CG
CA
AG
CG
GT
-3’
5’-T
CA
TG
CG
CT
TC
AC
CT
GC
TT
G65
3521
1 bp
T5’
-GA
AC
CT
CG
GA
TT
CA
CA
TC
GT
GA
GA
-3’
5’-A
TC
AA
GG
AA
GG
CT
TT
AG
CA
AA
TG
GG
-3’
5535
160
bpT
DO
5’-A
GA
GC
CA
GC
AA
AG
GA
GG
A-3
’5’
-GC
GT
CT
GC
TC
CT
GC
TC
TG
AT
-3’
6335
258
bpT
H5’
-TG
TC
AC
GT
CC
CC
AA
GG
TT
CA
T-3
’5’
-GG
GC
AG
GC
CG
GG
TC
TC
TA
AG
T-3
’60
3527
6 bp
TpH
15’
-TG
AT
GG
TT
TC
CA
GT
GC
AT
AT
CC
-3’
5’-C
GT
GG
CA
CG
TG
AA
CT
AT
AT
TT
CC
-3’
5835
501
bpT
rkC
5’-C
AT
GA
GC
AC
AT
TG
TC
AA
GT
TC
-3’
5’-G
CA
GT
TC
CT
GG
TG
GC
CA
GG
TC
-3’
6535
266
bp
munoglobulin G (IgG) fluorescein isothiocyanate (FITC)-con-jugated (1:200; Santa Cruz Biotechnology, Santa Cruz CA,http://www.scbt.com) or goat anti-mouse IgG Texas Red-con-jugated (1:400; Molecular Probes) in 10% normal goat serumand 1� PBS for 30 min at room temperature. Finally, sampleswere washed four times in 1� PBS and counterstained with4�,6-diamidino-2-phenylindole (DAPI, 250 ng/ml; Sigma-Aldrich). Labeling was detected by fluorescent illumination us-ing an inverted microscope (DMIRB, Leica Microsystems,Wetzelar, DE, http://www.leica-microsystems.com); imageswere acquired on a DC 350 FX camera (Leica).
Fluorescence-activated cell sorting analysis
As described by Solene Sergent-Tanguy et al. [18], neuronsand astrocytes were detached with 0.5% trypsin, washed, anddissociated to a single-cell suspension in 1� PBS. Cells weredistributed into 96-well U-bottomed microtiter plates (Nunc,Denmark), fixed in 2% PFA (Paraformaldehyde) for 20 min onice, washed, and incubated in PBS and 0.5% saponin for 20min on ice. After three washes in PBS and 0.1% saponin, cellswere incubated for 30 min on ice with primary antibodies[monoclonal anti-�III-tubulin (1:400) or polyclonal anti-GFAP(1:300)] diluted in PBS containing 0.1% saponin. After a fur-ther three washes, the cells were incubated for 30 min with agoat anti-rabbit IgG FITC-conjugated (1:400) or goat anti-mouse IgG Texas Red-conjugated (1:400) diluted in PBS con-taining 0.1% saponin. The cells were then washed in PBS con-taining 0.1% saponin and resuspended in 1�PBS prior tofluorescence-activated cell sorting (FACS) analysis.
Cell counts
Quantitative immunocytochemical analysis was performedon randomly selected visual fields from at least two indepen-dent differentiation experiments. On average, 10–15 visualfields, at 40� magnification were acquired and a total of3,000–6,000 DAPI� cells were counted per experiment in ablinded manner by two investigators. The total numbers ofTH�, 5-HT�, Islet1�, GABA� cells were then plotted as thepercentage of total DAPI� cells.
Time-lapse video microscopy
Time-lapse video microscopy was performed with a ZeissAxiovert 200 inverted microscope equipped with a CO2 Mi-croscope Cage Incubator (Okolab, Italy) to maintain the cellsin a 5% CO2 atmosphere at 37°C. The Cage incubator was madeof a plastic enclosure surrounding the microscope and of a mi-croenvironmental chamber placed on the microscope stage.Temperature was controlled by blowing warm air into the en-closure. A PID (Proportional-Integral-Derivative) controllermodulated the intensity of the air flux to maintain the specimenat the desired temperature (37°C, in this case). A very smallamount of air and CO2, mixed and humidified by the Cage In-cubator components, was continuously fed to the microenvi-ronmental chamber, to ensure proper cell culture conditions.
The video microscopy workstation was equipped with XYZmotorized sample positioning and focusing from Prior Scien-tific and with a CCD monochromatic video camera (Hitachi).
Images of selected regions were acquired in an iterative fash-ion by using a time-lapse software (Oko-vision 2.7, Okolab),which allows the user to select the fields of view to be imagedat a given time step (15 min in this case) by controlling mi-croscope XYZ motorization and video camera operation.
As described in the Results, in a typical experiment, the cellswere plated onto multiwell dishes and then transferred to themicroscope incubator after day 3 of differentiation. The time-lapse software was then started by selecting �15 fields of viewin different wells. The selected field of views were followedcontinuously for 10 days at the given time step.
During the experiment, the culture medium was changed bysetting the time-lapse software in a stand-by mode and gentlyopening the microenvironmental chamber and the multiwellplate. The horizontal displacement of the plate due to this ma-neuver was small with respect to the dimension of the image,and no correction was needed before restarting the time-lapseoperation. When some loss of focus was noticed, an interactivetool available in Oko-Vision 2.7 was used to refocus the fieldsof view under observation. The images of each field of viewwere stored in a separate directory and then merged into se-quences to be displayed as movies for later analysis. To im-prove image quality, small fluctuations of the average gray leveldue to camera noise were averaged out by applying an image-processing macro based on automatic control of image contrastand brightness.
Model evaluation
The model was evaluated with Z-factor according to formuladescribed in Zhang et al. [19].
RESULTS
Neuronal differentiation in monolayer
The serum-free KSR-supplemented medium has beendescribed to induce neuronal differentiation of both EScells in co-culture with a stromal cell line of ES cell-de-rived EBs by floating ES cells aggregation or by hang-ing drops [11,13]. We optimized neural and glial differ-entiation of ES cells in monolayer, without co-culture,EBs formation, or intermediary steps of cell dissociationand replating, using the KSR-supplemented medium.
When plating ES cells at different confluences (from500 to 10,000 cells/ cm2) on gelatin-coated plates inKSR-supplemented medium, we observed the presenceof cells showing a neuron-like morphology. To confirmthat those cells were indeed neurons, we analyzed by RT-PCR the expression of specific neuronal markers. The ex-pression of NF-L and Pax 6 confirmed the presence ofneuronal cells in the culture (Fig. 1).
The plating density was found to be crucial. In fact,analyzing the expression of specific markers of the othertwo germ layers, we observed that the levels of meso-en-dodermal (GATA4) and mesodermal (T and �MHC)
FICO ET AL.
576
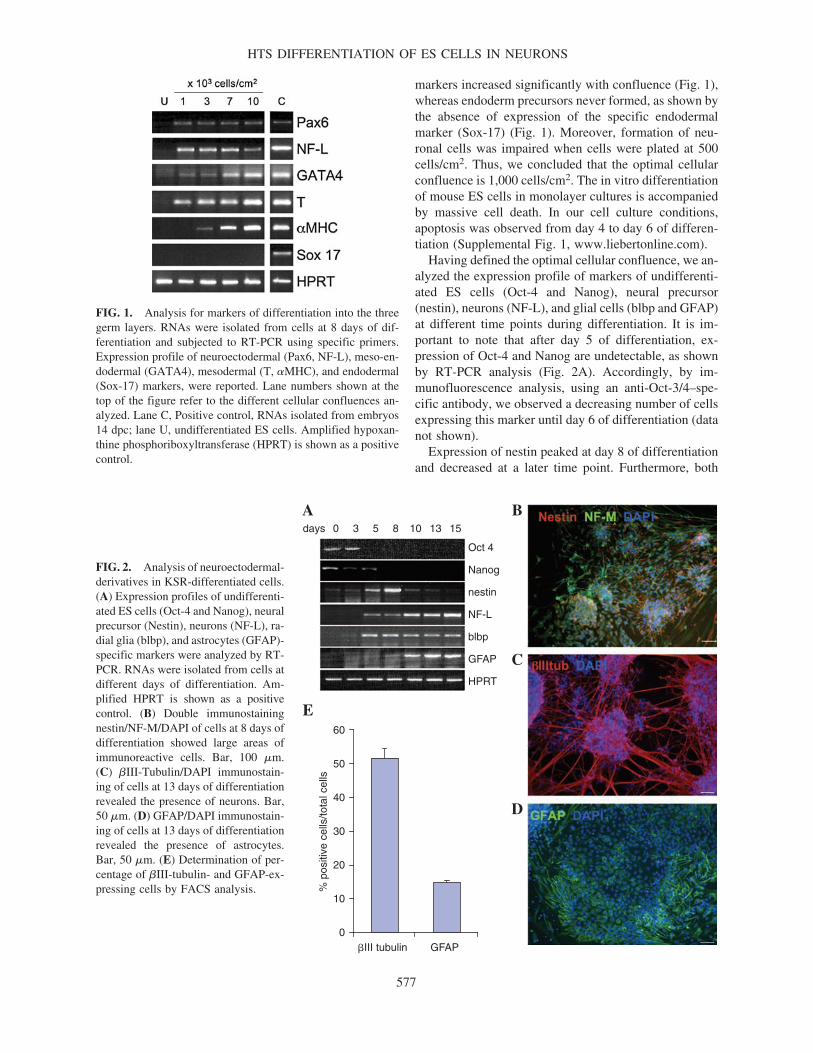
markers increased significantly with confluence (Fig. 1),whereas endoderm precursors never formed, as shown bythe absence of expression of the specific endodermalmarker (Sox-17) (Fig. 1). Moreover, formation of neu-ronal cells was impaired when cells were plated at 500cells/cm2. Thus, we concluded that the optimal cellularconfluence is 1,000 cells/cm2. The in vitro differentiationof mouse ES cells in monolayer cultures is accompaniedby massive cell death. In our cell culture conditions,apoptosis was observed from day 4 to day 6 of differen-tiation (Supplemental Fig. 1, www.liebertonline.com).
Having defined the optimal cellular confluence, we an-alyzed the expression profile of markers of undifferenti-ated ES cells (Oct-4 and Nanog), neural precursor(nestin), neurons (NF-L), and glial cells (blbp and GFAP)at different time points during differentiation. It is im-portant to note that after day 5 of differentiation, ex-pression of Oct-4 and Nanog are undetectable, as shownby RT-PCR analysis (Fig. 2A). Accordingly, by im-munofluorescence analysis, using an anti-Oct-3/4–spe-cific antibody, we observed a decreasing number of cellsexpressing this marker until day 6 of differentiation (datanot shown).
Expression of nestin peaked at day 8 of differentiationand decreased at a later time point. Furthermore, both
HTS DIFFERENTIATION OF ES CELLS IN NEURONS
577
A B
C
D
E
0
20
30
40
60
50
% p
ositi
ve c
ells
/tota
l cel
ls
10
�III tubulin GFAP
days
Oct 4
Nanog
nestin
NF-L
blbp
GFAP
HPRT
0 3 5 8 10 13 15
FIG. 2. Analysis of neuroectodermal-derivatives in KSR-differentiated cells.(A) Expression profiles of undifferenti-ated ES cells (Oct-4 and Nanog), neuralprecursor (Nestin), neurons (NF-L), ra-dial glia (blbp), and astrocytes (GFAP)-specific markers were analyzed by RT-PCR. RNAs were isolated from cells atdifferent days of differentiation. Am-plified HPRT is shown as a positivecontrol. (B) Double immunostainingnestin/NF-M/DAPI of cells at 8 days ofdifferentiation showed large areas ofimmunoreactive cells. Bar, 100 �m.(C) �III-Tubulin/DAPI immunostain-ing of cells at 13 days of differentiationrevealed the presence of neurons. Bar,50 �m. (D) GFAP/DAPI immunostain-ing of cells at 13 days of differentiationrevealed the presence of astrocytes.Bar, 50 �m. (E) Determination of per-centage of �III-tubulin- and GFAP-ex-pressing cells by FACS analysis.
FIG. 1. Analysis for markers of differentiation into the threegerm layers. RNAs were isolated from cells at 8 days of dif-ferentiation and subjected to RT-PCR using specific primers.Expression profile of neuroectodermal (Pax6, NF-L), meso-en-dodermal (GATA4), mesodermal (T, �MHC), and endodermal(Sox-17) markers, were reported. Lane numbers shown at thetop of the figure refer to the different cellular confluences an-alyzed. Lane C, Positive control, RNAs isolated from embryos14 dpc; lane U, undifferentiated ES cells. Amplified hypoxan-thine phosphoriboxyltransferase (HPRT) is shown as a positivecontrol.
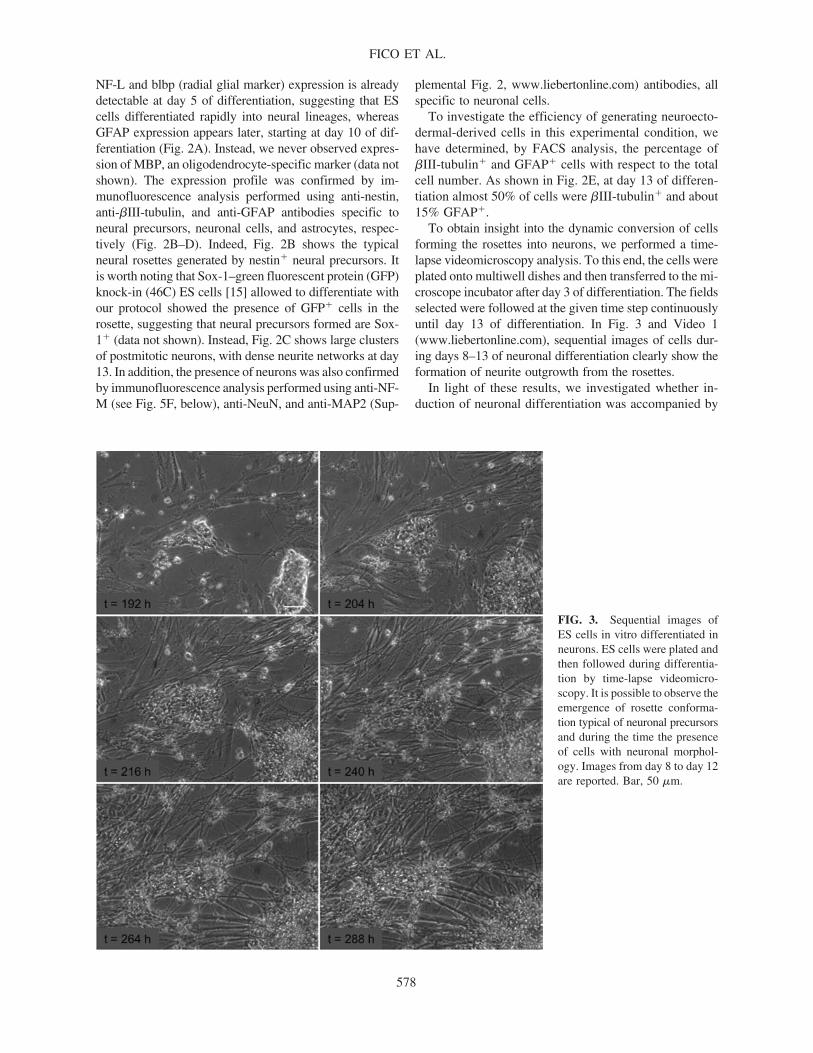
NF-L and blbp (radial glial marker) expression is alreadydetectable at day 5 of differentiation, suggesting that EScells differentiated rapidly into neural lineages, whereasGFAP expression appears later, starting at day 10 of dif-ferentiation (Fig. 2A). Instead, we never observed expres-sion of MBP, an oligodendrocyte-specific marker (data notshown). The expression profile was confirmed by im-munofluorescence analysis performed using anti-nestin,anti-�III-tubulin, and anti-GFAP antibodies specific toneural precursors, neuronal cells, and astrocytes, respec-tively (Fig. 2B–D). Indeed, Fig. 2B shows the typicalneural rosettes generated by nestin� neural precursors. Itis worth noting that Sox-1–green fluorescent protein (GFP)knock-in (46C) ES cells [15] allowed to differentiate withour protocol showed the presence of GFP� cells in therosette, suggesting that neural precursors formed are Sox-1� (data not shown). Instead, Fig. 2C shows large clustersof postmitotic neurons, with dense neurite networks at day13. In addition, the presence of neurons was also confirmedby immunofluorescence analysis performed using anti-NF-M (see Fig. 5F, below), anti-NeuN, and anti-MAP2 (Sup-
plemental Fig. 2, www.liebertonline.com) antibodies, allspecific to neuronal cells.
To investigate the efficiency of generating neuroecto-dermal-derived cells in this experimental condition, wehave determined, by FACS analysis, the percentage of�III-tubulin� and GFAP� cells with respect to the totalcell number. As shown in Fig. 2E, at day 13 of differen-tiation almost 50% of cells were �III-tubulin� and about15% GFAP�.
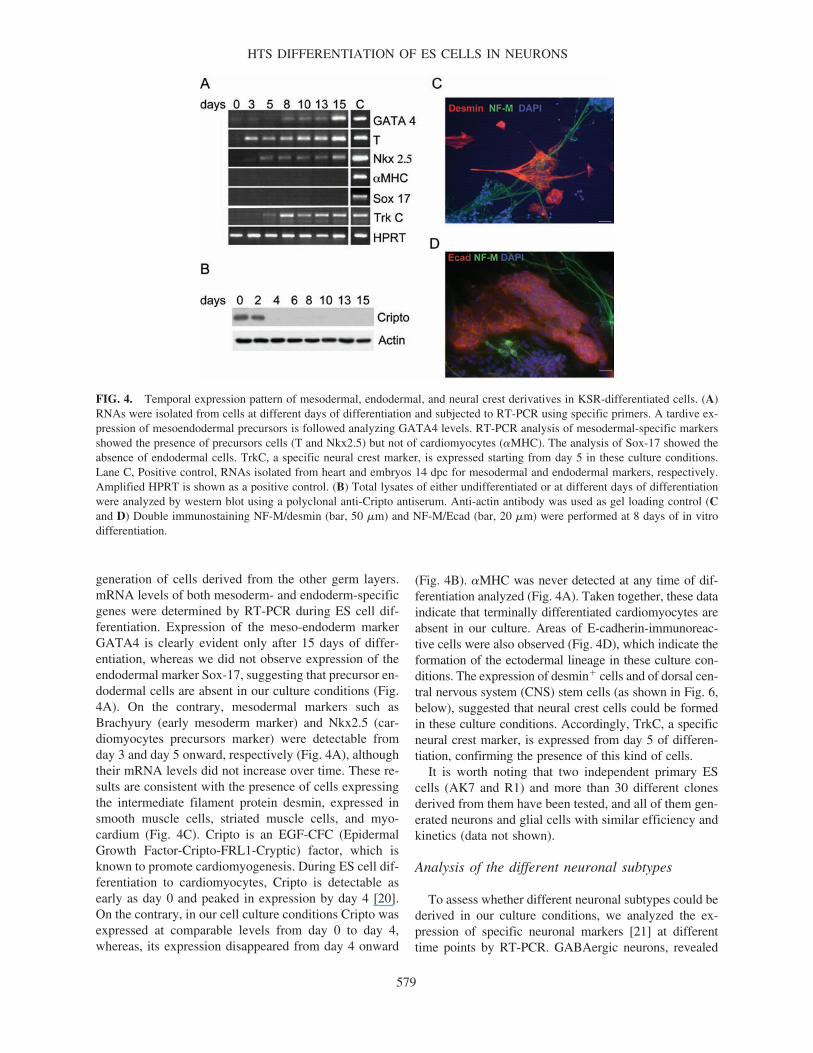
To obtain insight into the dynamic conversion of cellsforming the rosettes into neurons, we performed a time-lapse videomicroscopy analysis. To this end, the cells wereplated onto multiwell dishes and then transferred to the mi-croscope incubator after day 3 of differentiation. The fieldsselected were followed at the given time step continuouslyuntil day 13 of differentiation. In Fig. 3 and Video 1(www.liebertonline.com), sequential images of cells dur-ing days 8–13 of neuronal differentiation clearly show theformation of neurite outgrowth from the rosettes.
In light of these results, we investigated whether in-duction of neuronal differentiation was accompanied by
FICO ET AL.
578
FIG. 3. Sequential images ofES cells in vitro differentiated inneurons. ES cells were plated andthen followed during differentia-tion by time-lapse videomicro-scopy. It is possible to observe theemergence of rosette conforma-tion typical of neuronal precursorsand during the time the presenceof cells with neuronal morphol-ogy. Images from day 8 to day 12are reported. Bar, 50 �m.
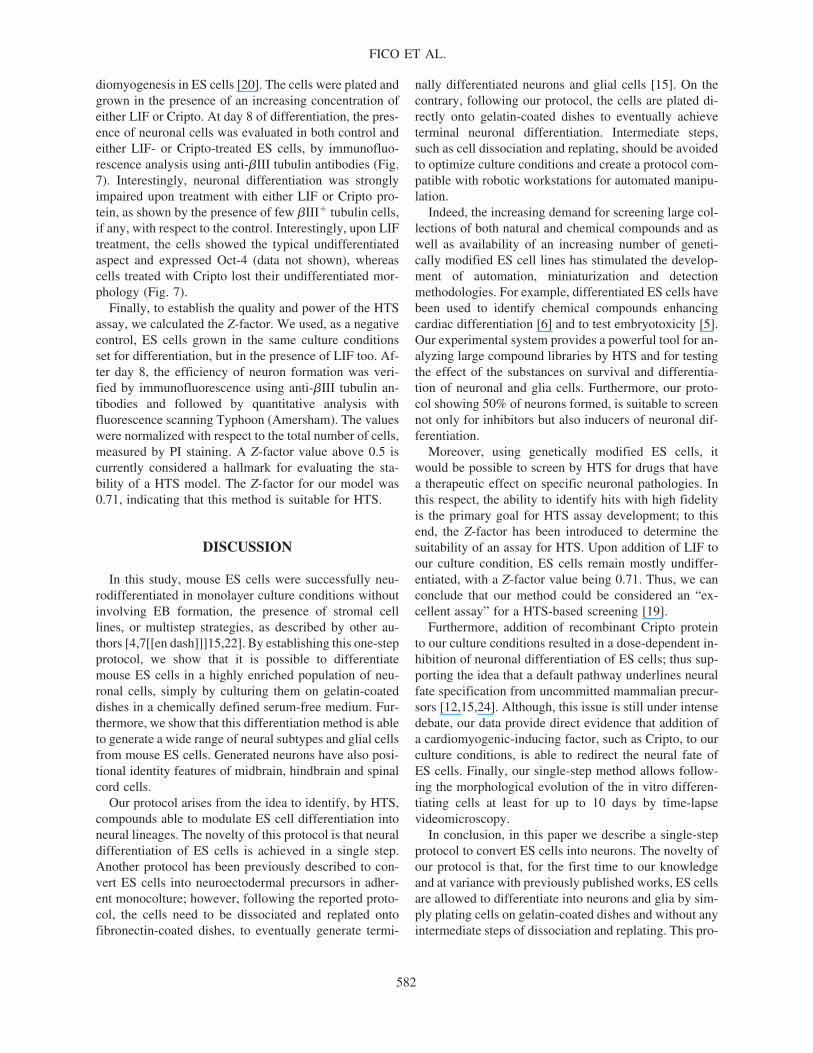
generation of cells derived from the other germ layers.mRNA levels of both mesoderm- and endoderm-specificgenes were determined by RT-PCR during ES cell dif-ferentiation. Expression of the meso-endoderm markerGATA4 is clearly evident only after 15 days of differ-entiation, whereas we did not observe expression of theendodermal marker Sox-17, suggesting that precursor en-dodermal cells are absent in our culture conditions (Fig.4A). On the contrary, mesodermal markers such asBrachyury (early mesoderm marker) and Nkx2.5 (car-diomyocytes precursors marker) were detectable fromday 3 and day 5 onward, respectively (Fig. 4A), althoughtheir mRNA levels did not increase over time. These re-sults are consistent with the presence of cells expressingthe intermediate filament protein desmin, expressed insmooth muscle cells, striated muscle cells, and myo-cardium (Fig. 4C). Cripto is an EGF-CFC (EpidermalGrowth Factor-Cripto-FRL1-Cryptic) factor, which isknown to promote cardiomyogenesis. During ES cell dif-ferentiation to cardiomyocytes, Cripto is detectable asearly as day 0 and peaked in expression by day 4 [20].On the contrary, in our cell culture conditions Cripto wasexpressed at comparable levels from day 0 to day 4,whereas, its expression disappeared from day 4 onward
(Fig. 4B). �MHC was never detected at any time of dif-ferentiation analyzed (Fig. 4A). Taken together, these dataindicate that terminally differentiated cardiomyocytes areabsent in our culture. Areas of E-cadherin-immunoreac-tive cells were also observed (Fig. 4D), which indicate theformation of the ectodermal lineage in these culture con-ditions. The expression of desmin� cells and of dorsal cen-tral nervous system (CNS) stem cells (as shown in Fig. 6,below), suggested that neural crest cells could be formedin these culture conditions. Accordingly, TrkC, a specificneural crest marker, is expressed from day 5 of differen-tiation, confirming the presence of this kind of cells.
It is worth noting that two independent primary EScells (AK7 and R1) and more than 30 different clonesderived from them have been tested, and all of them gen-erated neurons and glial cells with similar efficiency andkinetics (data not shown).
Analysis of the different neuronal subtypes
To assess whether different neuronal subtypes could bederived in our culture conditions, we analyzed the ex-pression of specific neuronal markers [21] at differenttime points by RT-PCR. GABAergic neurons, revealed
HTS DIFFERENTIATION OF ES CELLS IN NEURONS
579
FIG. 4. Temporal expression pattern of mesodermal, endodermal, and neural crest derivatives in KSR-differentiated cells. (A)RNAs were isolated from cells at different days of differentiation and subjected to RT-PCR using specific primers. A tardive ex-pression of mesoendodermal precursors is followed analyzing GATA4 levels. RT-PCR analysis of mesodermal-specific markersshowed the presence of precursors cells (T and Nkx2.5) but not of cardiomyocytes (�MHC). The analysis of Sox-17 showed theabsence of endodermal cells. TrkC, a specific neural crest marker, is expressed starting from day 5 in these culture conditions.Lane C, Positive control, RNAs isolated from heart and embryos 14 dpc for mesodermal and endodermal markers, respectively.Amplified HPRT is shown as a positive control. (B) Total lysates of either undifferentiated or at different days of differentiationwere analyzed by western blot using a polyclonal anti-Cripto antiserum. Anti-actin antibody was used as gel loading control (Cand D) Double immunostaining NF-M/desmin (bar, 50 �m) and NF-M/Ecad (bar, 20 �m) were performed at 8 days of in vitrodifferentiation.

by the presence of glutamate decarboxylase GAD65mRNA, were detected by RT-PCR after 3 days of differ-entiation. The expression of both the TH, the rate-limit-ing enzyme in dopamine biosynthesis, and the dopaminetransporter (DAT) suggests the presence of functionallyactive dopaminergic neurons. Moreover, the expressionof the serotonin biosynthetic enzyme tryptophan hydrox-ylase (TpH1) during differentiation indicates that sero-tonergic neurons were also present. Furthermore, HB9, ahomeobox specifically expressed in the motor neurons, isexpressed from day 8 onward, indicating that also mo-toneurons are differentiated with this protocol (Fig. 5A).
In addition, to confirm the data obtained by RT-PCR,immunofluorescence analysis was performed on differ-entiated ES cells at day 13, using neuronal subtype-spe-cific antibodies. Most of the neurons formed are im-munoreactive to the neurotransmitter GABA (Fig. 5B),indicating that GABAergic neurons are predominant inthis culture conditions; however, TH� as well as 5-HT�
neurons are also observed (Fig. 5B–D), indicating that
both dopaminergic and serotonergic neurons are presentat this developmental stage. The ability of the neurons toproduce serotonin and GABA neurotransmitters suggeststhat they are functionally active. To analyze whether mo-tor neurons were present, we performed immunofluores-cence analysis using anti-NF-M antibody in combinationwith anti-Islet1, a motor neuron nuclear marker. Asshown in Fig. 5F, cells showing immunoreactivity to bothNF-M and islet1 were present in our culture conditions.These data reported show that neurons of the four dif-ferent neuronal subtypes can be differentiated using thisnew protocol.
Brain regional markers of the ES cells-derived neurons
To investigate the positional identities of the ES cell-derived neurons in KSR monolayer culture conditions,we have performed RT-PCR analysis of rostrocaudal anddorsoventral CNS markers [9]. As shown in Fig. 6, ES
FICO ET AL.
580
A B
C D
E F
0
20
30
40
50
% p
ositi
ve c
ells
/tota
l cel
ls
10
GABA TH 5-HT Islet 1
days
GAD 65
TH
DAT
TPH 1
HB 9
HPRT
0 3 5 8 10 13 15 C
FIG. 5. Neuronal subtypes in KSR-differentiated cells. (A) RNAs were iso-lated from cells at different days of dif-ferentiation and subjected to RT-PCRusing specific primers. RT-PCR analy-sis of neural-specific markers showedthe presence of multiple neuronal sub-types such as GABAergic (GAD65),dopaminergic (TH and DAT), seroton-ergic (Tph1), and motor neurons (HB9)starting from days 3–5 of the in vitro dif-ferentiation. Lane C, Positive control,RNAs isolated from brain of adult. Am-plified HPRT is shown as a positive con-trol. (B) Percentage of GABA�, TH�,5-HT�, and Islet1� cells among totaldifferentiated cells. (C–F) Immunos-taining with GABA (C), TH (D), and 5-HT (E) antibodies (bar, 50 �m) and dou-bleimmunostaining NF-M/Islet (F) (bar,20 �m).

cell-derived neurons do not express significant mRNAlevels of the telencephalic marker BF1, whereas they ex-press genes specific to forebrain (Emx1, Otx2), mid-hind-brain (En1), and spinal cord (Hoxb4); in contrast, themost rostral spinal cord marker Hoxb9 is not expressedin differentiated cells.
The expression profile analysis of positional markersalong the dorsal–ventral axis suggests that our cultureconditions allow differentiation of a variety of dorsal andventral neural tube cells. In particular, Math1, whichmarks the most dorsal cells, and sonic hedgehog (SHH),present in ventral cells, are significantly expressed. Theseresults indicate that KSR-differentiated ES cells giveraise to a variety of neuronal cell types along rostrocau-dal and dorsoventral axis of the neural tube, with the ex-ception of the most rostral cells of the CNS.
Suitability of the protocol in HTS
To test whether the conditions set up to differentiateES in neuronal and glial cells could be used for minia-turized HTS applications, undifferentiated ES cellsclones were seeded in 24-, 48-, 96-, and 384-well plates.After day 13 of differentiation, the efficiency of both neu-rons and glia cells formation was verified by immuno-fluorescence using anti-�III tubulin or anti-GFAP anti-bodies, with respect to the total number of cells stainedwith propidium iodide (PI), followed by analysis withfluorescence scanning Typhoon (Amersham). We ob-served the same efficiency of neuronal and glial differ-entiation in all the plates analyzed (data not shown).
We next asked whether the described protocol mightbe suitable for screening the biological effect of differ-ent molecules on ES cells differentiation to be used even-tually on an HTS-based screening. For this purpose, weevaluated the effect of molecules known to interfere withES cell differentiation. In particular, we used LIF, whichkeeps ES cells undifferentiated [22], and Cripto, which,as described above, is strictly required to promote car-
HTS DIFFERENTIATION OF ES CELLS IN NEURONS
581
FIG. 6. Positional identity of KSR-derived neurons. RNAswere isolated from cells at different days of differentiation(numbers referring to the days of differentiation are shown atthe top of the figure) and subjected to RT-PCR using specificprimers. Expression profile of anteroposterior (BF1, Emx1,Otx2, En1, Hoxb4, Hoxb9) and dorsoventral (Math1, Pax6,Nkx2.2, Shh) markers, were reported. Lane C, Positive control,RNAs isolated from embryos 14 dpc. Amplified HPRT is shownas a positive control.
FIG. 7. Effect of LIF and Cripto on neuronal differentiation of ES cells. A �III-tubulin/DAPI immunostaining of cells at 8days of differentiation revealed the presence of neurons. Addition of 750 U/ml (B) or 1,500U/ml (BI) of LIF, or addition of 5�g/ml (C) or 10 �g/ml (CI) of Cripto to the culture medium inhibit differentiation of ES in neurons. Bar, 50 �m.
diomyogenesis in ES cells [20]. The cells were plated andgrown in the presence of an increasing concentration ofeither LIF or Cripto. At day 8 of differentiation, the pres-ence of neuronal cells was evaluated in both control andeither LIF- or Cripto-treated ES cells, by immunofluo-rescence analysis using anti-�III tubulin antibodies (Fig.7). Interestingly, neuronal differentiation was stronglyimpaired upon treatment with either LIF or Cripto pro-tein, as shown by the presence of few �III� tubulin cells,if any, with respect to the control. Interestingly, upon LIFtreatment, the cells showed the typical undifferentiatedaspect and expressed Oct-4 (data not shown), whereascells treated with Cripto lost their undifferentiated mor-phology (Fig. 7).
Finally, to establish the quality and power of the HTSassay, we calculated the Z-factor. We used, as a negativecontrol, ES cells grown in the same culture conditionsset for differentiation, but in the presence of LIF too. Af-ter day 8, the efficiency of neuron formation was veri-fied by immunofluorescence using anti-�III tubulin an-tibodies and followed by quantitative analysis withfluorescence scanning Typhoon (Amersham). The valueswere normalized with respect to the total number of cells,measured by PI staining. A Z-factor value above 0.5 iscurrently considered a hallmark for evaluating the sta-bility of a HTS model. The Z-factor for our model was0.71, indicating that this method is suitable for HTS.
DISCUSSION
In this study, mouse ES cells were successfully neu-rodifferentiated in monolayer culture conditions withoutinvolving EB formation, the presence of stromal celllines, or multistep strategies, as described by other au-thors [4,7[[en dash]]]15,22]. By establishing this one-stepprotocol, we show that it is possible to differentiatemouse ES cells in a highly enriched population of neu-ronal cells, simply by culturing them on gelatin-coateddishes in a chemically defined serum-free medium. Fur-thermore, we show that this differentiation method is ableto generate a wide range of neural subtypes and glial cellsfrom mouse ES cells. Generated neurons have also posi-tional identity features of midbrain, hindbrain and spinalcord cells.
Our protocol arises from the idea to identify, by HTS,compounds able to modulate ES cell differentiation intoneural lineages. The novelty of this protocol is that neuraldifferentiation of ES cells is achieved in a single step.Another protocol has been previously described to con-vert ES cells into neuroectodermal precursors in adher-ent monocolture; however, following the reported proto-col, the cells need to be dissociated and replated ontofibronectin-coated dishes, to eventually generate termi-
nally differentiated neurons and glial cells [15]. On thecontrary, following our protocol, the cells are plated di-rectly onto gelatin-coated dishes to eventually achieveterminal neuronal differentiation. Intermediate steps,such as cell dissociation and replating, should be avoidedto optimize culture conditions and create a protocol com-patible with robotic workstations for automated manipu-lation.
Indeed, the increasing demand for screening large col-lections of both natural and chemical compounds and aswell as availability of an increasing number of geneti-cally modified ES cell lines has stimulated the develop-ment of automation, miniaturization and detectionmethodologies. For example, differentiated ES cells havebeen used to identify chemical compounds enhancingcardiac differentiation [6] and to test embryotoxicity [5].Our experimental system provides a powerful tool for an-alyzing large compound libraries by HTS and for testingthe effect of the substances on survival and differentia-tion of neuronal and glia cells. Furthermore, our proto-col showing 50% of neurons formed, is suitable to screennot only for inhibitors but also inducers of neuronal dif-ferentiation.
Moreover, using genetically modified ES cells, itwould be possible to screen by HTS for drugs that havea therapeutic effect on specific neuronal pathologies. Inthis respect, the ability to identify hits with high fidelityis the primary goal for HTS assay development; to thisend, the Z-factor has been introduced to determine thesuitability of an assay for HTS. Upon addition of LIF toour culture condition, ES cells remain mostly undiffer-entiated, with a Z-factor value being 0.71. Thus, we canconclude that our method could be considered an “ex-cellent assay” for a HTS-based screening [19].
Furthermore, addition of recombinant Cripto proteinto our culture conditions resulted in a dose-dependent in-hibition of neuronal differentiation of ES cells; thus sup-porting the idea that a default pathway underlines neuralfate specification from uncommitted mammalian precur-sors [12,15,24]. Although, this issue is still under intensedebate, our data provide direct evidence that addition ofa cardiomyogenic-inducing factor, such as Cripto, to ourculture conditions, is able to redirect the neural fate ofES cells. Finally, our single-step method allows follow-ing the morphological evolution of the in vitro differen-tiating cells at least for up to 10 days by time-lapsevideomicroscopy.
In conclusion, in this paper we describe a single-stepprotocol to convert ES cells into neurons. The novelty ofour protocol is that, for the first time to our knowledgeand at variance with previously published works, ES cellsare allowed to differentiate into neurons and glia by sim-ply plating cells on gelatin-coated dishes and without anyintermediate steps of dissociation and replating. This pro-
FICO ET AL.
582
cedure renders our method compatible with robotic work-stations for automated manipulation, and thus suitable forHTS-based screening. Hence, it represents a powerfultool to test the effect of different substances on survivaland/or differentiation of neuronal and glial cells in anHTS-based approach. We believe that the protocol de-scribed will contribute to the expansion and populariza-tion of the ES cell differentiation approach, thus helpingto understand the signals and the mechanisms that regu-late embryonic development in mice.
ACKNOWLEDGMENTS
We thank Maria Terracciano and Rita Vito for theirskilful laboratory assistance. Anna Maria Aliperti is ac-knowledged for proofreading the manuscript. We aregrateful to Flavio Maina who allowed AF to perform theexperiments with Sox-1-GFP ES cells in his lab. Thiswork was supported by the Regione Campania PRO-GRAMMA OPERATIVO REGIONALE 2000/2006.Asse prioritario di riferimento 3–Risorse Umane–Misura3.16 Centro Regionale di Competenza in Diagnostica eFarmaceutica Molecolari (CRdC DFM) and by the Ital-ian Telethon Foundation, grant N. GGP05112.
REFERENCES
1. Evans MJ and MH. Kaufman. (1981). Establishment in cul-ture of pluripotential cells from mouse embryos. Nature292:154–156.
2. Martin GR. (1981). Isolation of a pluripotent cell line fromearly mouse embryos cultured in medium conditioned byteratocarcinoma stem cells. Proc Natl Acad Sci USA 78:7634–7638.
3. Keller G. (2005). Embryonic stem cell differentiation:emergence of a new era in biology and medicine. GenesDev 19:1129–1155.
4. Stavridis MP and AG Smith. (2003). Neural differentiationof mouse embryonic stem cells. Biochem Soc Trans 31:45–49.
5. Seiler A, A Visan, R Buesen, E Genschow and H Spiel-mann. (2004). Improvement of an in vitro stem cell assayfor developmental toxicity: the use of molecular endpointsin the embryonic stem cell test. Reprod Toxicol 18:231–240.
6. Takahashi, T, B Lord, PC Schulze, RM Fryer, SS Sarang,SR Gullans and RT Lee. (2003). Ascorbic acid enhancesdifferentiation of embryonic stem cells into cardiac my-ocytes. Circulation 107:1912–1916.
7. Bibel M, J Richter, K Schrenk, KL Tucker, V Staiger, M.Korte, M Goetz and YA Barde. (2004). Differentiation ofmouse embryonic stem cells into a defined neuronal lin-eage. Nature Neurosci 7:1003–1009.
8. Conti L, SM Pollard, T Gorba, E Reitano, M Toselli, GBiella, Y Sun, S Sanzone, QL Ying, E Cattaneo and ASmith. (2005). Niche-independent symmetrical self-re-newal of a mammalian tissue stem cell. PLoS Biol 3:e283.
9. Irioka T, K Watanabe, H Mizusawa, K Mizuseki and Y Sa-sai. (2005). Distinct effects of caudalizing factors on re-gional specification of embryonic stem cell-derived neuralprecursors. Brain Res Dev Brain Res 154:63–70.
10. Kawasaki H, K Mizuseki, S Nishikawa, S Kaneko, YKuwana, S Nakanishi, SI Nishikawa and Y Sasai. (2000).Induction of midbrain dopaminergic neurons from ES cellsby stromal cell-derived inducing activity. Neuron 28:31–40.
11. Parisi S, E Lonardo, A Fico, S Filosa and G Minchiotti.(2007). A versatile method for differentiation of multipleneuronal subtypes from mouse embryonic stem vells. JStem Cells 1:259–269.
12. Tropepe V, S Hitoshi, C Sirard, TW Mak, J Rossant andD van der Kooy. (2001). Direct neural fate specificationfrom embryonic stem cells: a primitive mammalian neuralstem cell stage acquired through a default mechanism. Neu-ron 30:65–78.
13. Watanabe K, D Kamiya, A Nishiyama, T Katayama, SNozaki, H Kawasaki, Y Watanabe, K Mizuseki and Y Sa-sai. (2005). Directed differentiation of telencephalic pre-cursors from embryonic stem cells. Nature Neurosci 8:288–296.
14. Yamazoe H, M Kobori, Y Murakami, K Yano, M Satoh,K Mizuseki, Y Sasai and H Iwata. (2006). One-step in-duction of neurons from mouse embryonic stem cells inserum-free media containing vitamin B12 and heparin. CellTransplant 15:135–145.
15. Ying QL, M Stavridis, D Griffiths, M Li and A Smith.(2003). Conversion of embryonic stem cells into neuroec-todermal precursors in adherent monoculture. Nature Bio-technol 21:183–186.
16. Robertson EJ. (1987). Embryo-derived stem cell lines, pp.71-112. In E.J. Robertson (ed.), Teratocarcinomas and em-bryonic stem cells: a pratical approach. IRL Press, Oxford,England.
17. Minchiotti G, S Parisi, G Liguori, M. Signore, G Lania,ED Adamson, CT Lago and MG Persico. (2000). Mem-brane-anchorage of Cripto protein by glycosylphos-phatidylinositol and its distribution during early mouse de-velopment. Mech Dev 90:133–142.
18. Sergent-Tanguy S, C Chagneau, I Neveu and P Naveilhan.(2003). Fluorescent activated cell sorting (FACS): a rapidand reliable method to estimate the number of neurons ina mixed population. J Neurosci Methods 129:73–79.
19. Zhang JH, TD Chung and KR. Oldenburg. (1999). A simplestatistical parameter for use in evaluation and validation ofhigh throughput screening assays. J Biomol Screen 4:67–73.
20. Parisi S, D D’Andrea, CT Lago, ED Adamson, MG Per-sico and G Minchiotti. (2003). Nodal-dependent Cripto sig-naling promotes cardiomyogenesis and redirects the neuralfate of embryonic stem cells. J Cell Biol 163:303–314.
21. Barberi T, P Klivenyi, NY Calingasan, H Lee, H Kawa-mata, K Loonam, AL Perrier, J Bruses, ME Rubio, N Topf,V Tabar, NL Harrison, MF Beal, MA Moore and L Studer.(2003). Neural subtype specification of fertilization and nu-
HTS DIFFERENTIATION OF ES CELLS IN NEURONS
583
clear transfer embryonic stem cells and application inparkinsonian mice. Nature Biotechnol 21:1200–1207.
22. Rathjen PD, J Nichols, S Toth, DR Edwards, JK Heath andAG Smith. (1990). Developmentally programmed induc-tion of differentiation inhibiting activity and the control ofstem cell populations. Genes Dev 4:2308–2318.
23. Ying QL and AG Smith. (2003). Defined conditions forneural commitment and differentiation. Methods Enzymol365:327–341.
24. Smukler SR, SB Runciman, S Xu and D van der Kooy.(2006). Embryonic stem cells assume a primitive neuralstem cell fate in the absence of extrinsic influences. J CellBiol 172:79–90.
Address reprint requests to:Dr. Stefania FilosaStem Cell Fate Lab
Istituto di Genetica e Biofisica “Adriano BuzzatiTraverso” CNR
Via Pietro Castellino 11180131 Napoli, Italy
E-mail: [email protected]
Received for publication July 17, 2007; accepted after re-vision September 17, 2007.
FICO ET AL.
584