Plasmonic–perovskite solar cells, light emitters, and sensors

High-Pressure Mossbauer Measurements
on Nanocrystalline Perovskite (La,Sr)(Mn,Fe)O3
USHA CHANDRA1,*, PRERANA MUDGAL1, MANOJ KUMAR1,
RAJEEV RAWAT2, G. PARTHASARATHY3, NITA DILAWAR4
and A. K. BANDYOPADHYAY4
1Department of Physics, University of Rajasthan, Jaipur 302004, India;
e-mail: ushac_ [email protected]/DAE Consortium for Scientific Research, Khandawa Road, Indore 452017, India3National Geophysical Research Institute, Hyderabad 500 007, India4National Physical Laboratory, Pusa Road, New Delhi 110012, India
Abstract. We report here the Mossbauer measurements on nanocrystalline perovskite structured
manganite La0.8Sr0.2Mn0.8Fe0.1957Fe0.01O3 as a function of pressure up to 10 GPa at room tem-
perature. The nanocrystalline sample, prepared by solYgel technique found to have crystallite sizes
of ~138 T 10 A. Zero-field electrical resistivity measurements with temperature support the
nanocrystalline nature. At ambient pressure, Fe3+ as well as Fe4+ ions are distributed in two
different environments Y Fe3+ in low symmetric site surrounded by Mn3+ ions only while Fe4+ in
high symmetric site with at least one Mn3+ ion. Pressure seems to affect the higher symmetric site.
A sudden increase in isomer shift at 0.52 GPa indicates the first order phase transition representing
the transformation of Fe4+ to Fe3+. Another transition at 3.7 GPa, represents the presence of Fe3+ in
single kind of environment. Pressure dependence of electrical resistivity measurements verifies
the transitions attributing the first order transition to the cross over of localized-electron to band
magnetism.
Key Words: high-pressure electrical resistivity, high-pressure Mossbauer spectroscopy, manganite,
nanocrystalline, perovskite.
1. Introduction
Complex perovskite oxides are particularly important since their properties can
be tailored for specific applications, ranging from superconductivity to oxidation
catalysis by subtle doping. Also the most abundant mineral in the earth’s lower
mantle is thought to be magnesium silicate perovskite [1Y4].
Manganese perovskite (AMnO3) contains octahedrally-coordinated manga-
nese ions having a valence, when doped, fluctuating between 3+ and 4+. Phase
diagram of these compounds is particularly rich and many variables such as
pressure, applied magnetic field, doping concentration, and FA_ site average ionic
* Author for correspondence.
Hyperfine Interactions (2005)
DOI 10.1007/s10751-005-9001-y # Springer 2006

radius can determine the different phases of the system including charge-ordering
transitions, anti-ferromagnetism, and metal-insulator transition [5Y7]. There are
very few studies on the high-pressure behaviour of the manganese perov-
skite compounds (see the review by Goodenough [7]).
In undoped manganese oxide, all the Mn ions have four 3d electrons; three
occupying t2g triplet states and the one in a eg state. The eg orbital is aligned
along the MnYO bond. Pauli’s exclusion principle allows only anti-parallel cou-
pling of spins on both the sides of MnYOYMn bond. When a rare earth
trivalent ion A is substituted by a divalent ion, there would be a change in
3d configuration; some of Mn3+ ions become Mn4+ after transfer of the eg
electron to the divalent ions. The presence of Mn3+YOYMn4+ units give rise to
ferromagnetism and semiconductor to metal transition due to a double-exchange
mechanism [8]. The interplay between superexchange and double-exchange can
be controlled either by the doping level which changes the Mn3+/Mn4+ ratio or by
applying pressure which affects the overlap between cation anion orbitals in the
MnYO bonding. The application of pressure is the best probe to study such in-
teractions since the number of charge carriers remains the same.
The substitution of other transition metal like Fe in place of Mn can lead to
the formation of Fe4+ in the solid phase leading to important modifications in the
various properties of (La, Sr)(Mn, Fe)O3 system. Role of Fe as Fe4+ has been
studied in polycrystalline bulk system as a mixed Fe3+/Fe5+ state in CaFeO3 [9]
and SrFeO3 [10]. Lebon et al. [11] observed for single crystal SrFeO3, a com-
bined Fe4+Y Fe3+ charge-magnetic ordering which is different from the
Fe3+YFe5+ charge ordering phenomenon observed in polycrystalline counterpart.
Urushibara et al. [12] have studied insulatorYmetal transition for the poly-
crystalline bulk La1jxSrx MnO3 (0 < x < 0.4) and for x = 0.2, the phenomenon
occurs around 300 K. Khazeni et al. [13] observed that both resistivity and
magneto-resistance for single crystal NdSrPbMnO systems are strongly sup-
pressed upon application of pressure. On the other hand, Zhu et al. [14] mea-
sured the temperature dependence of normalized zero field resistivity (RT/R300 K)
for La2/3Sr1/3 MnO3 with varying grain size and indicated insulator like behav-
iour due to the damage of the double exchange mechanism in the distorted
interfacial region. Not much work has been done on the low Fe doped nano-
crystalline systems under high pressure. We report here the pressure dependence
study of the nanocrystalline sample La0.8 Sr0.2 (Mn0.8Fe0.1957Fe0.01) O3 up to 10
GPa using diamond anvil cell and 57Fe Mossbauer spectroscopy.
2. Experimental procedure
2.1. SYNTHESIS TECHNIQUE
Samples La0.8Sr0.2 (Mn1jxFex)O3 with various values of x (from 0.02 to 1.00)were prepared by the solYgel technique. Synthesis by this technique not only
U. CHANDRA ET AL.
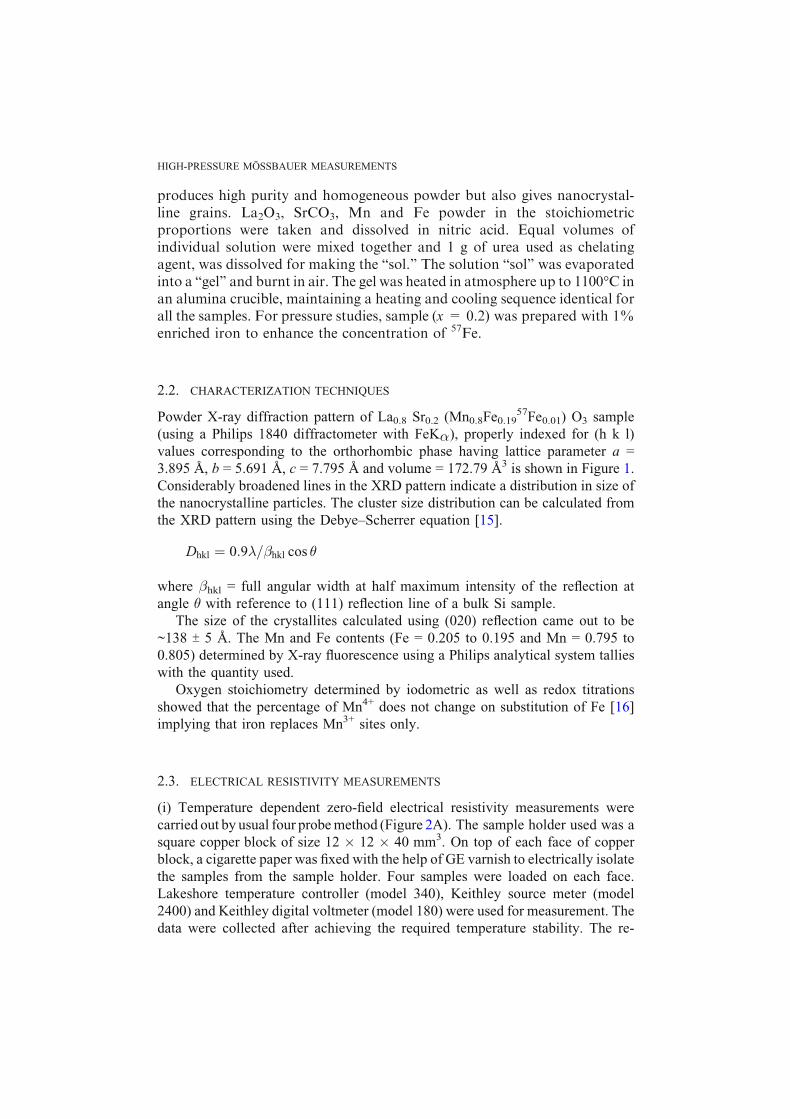
produces high purity and homogeneous powder but also gives nanocrystal-line grains. La2O3, SrCO3, Mn and Fe powder in the stoichiometricproportions were taken and dissolved in nitric acid. Equal volumes ofindividual solution were mixed together and 1 g of urea used as chelatingagent, was dissolved for making the Bsol.’’ The solution Bsol’’ was evaporatedinto a Bgel’’ and burnt in air. The gel was heated in atmosphere up to 1100-C inan alumina crucible, maintaining a heating and cooling sequence identical forall the samples. For pressure studies, sample (x = 0.2) was prepared with 1%enriched iron to enhance the concentration of 57Fe.
2.2. CHARACTERIZATION TECHNIQUES
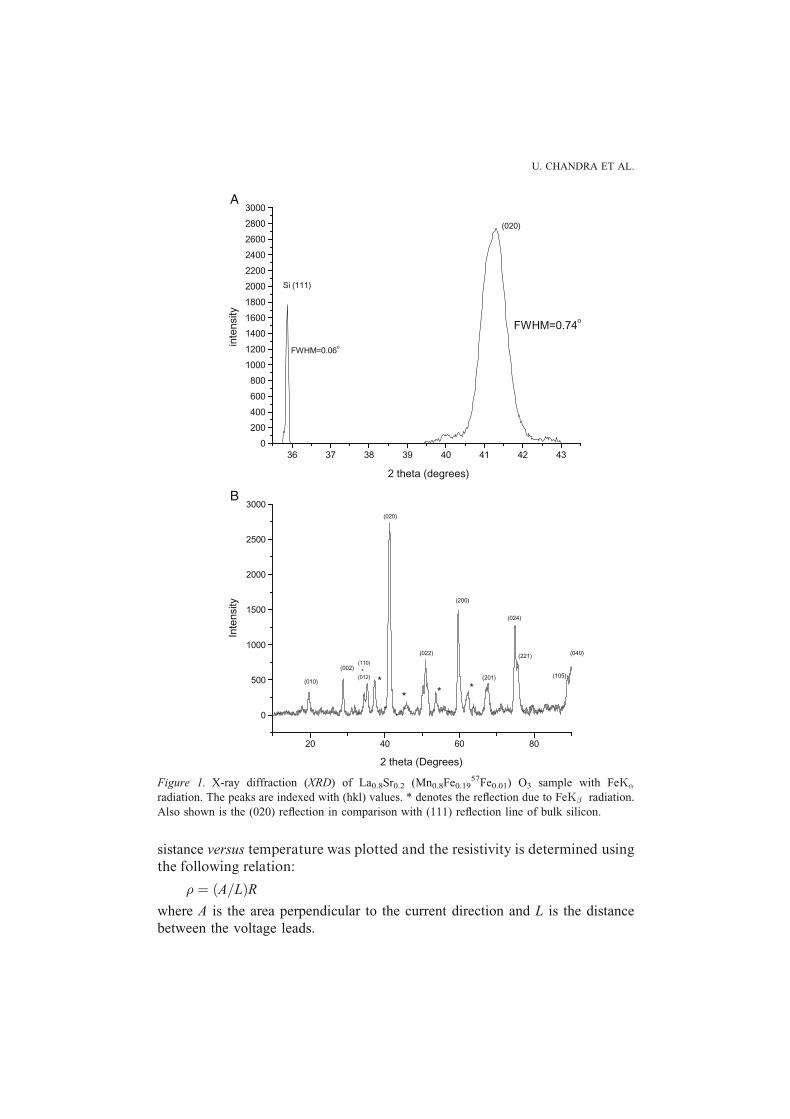
Powder X-ray diffraction pattern of La0.8 Sr0.2 (Mn0.8Fe0.1957Fe0.01) O3 sample
(using a Philips 1840 diffractometer with FeK�), properly indexed for (h k l)
values corresponding to the orthorhombic phase having lattice parameter a =
3.895 A, b = 5.691 A, c = 7.795 A and volume = 172.79 A3 is shown in Figure 1.
Considerably broadened lines in the XRD pattern indicate a distribution in size of
the nanocrystalline particles. The cluster size distribution can be calculated from
the XRD pattern using the DebyeYScherrer equation [15].
Dhkl ¼ 0:9�=�hkl cos �
where �hkl = full angular width at half maximum intensity of the reflection at
angle � with reference to (111) reflection line of a bulk Si sample.
The size of the crystallites calculated using (020) reflection came out to be
~138 T 5 A. The Mn and Fe contents (Fe = 0.205 to 0.195 and Mn = 0.795 to
0.805) determined by X-ray fluorescence using a Philips analytical system tallies
with the quantity used.
Oxygen stoichiometry determined by iodometric as well as redox titrations
showed that the percentage of Mn4+ does not change on substitution of Fe [16]
implying that iron replaces Mn3+ sites only.
2.3. ELECTRICAL RESISTIVITY MEASUREMENTS
(i) Temperature dependent zero-field electrical resistivity measurements were
carried out by usual four probe method (Figure 2A). The sample holder used was a
square copper block of size 12 � 12 � 40 mm3. On top of each face of copper
block, a cigarette paper was fixed with the help of GE varnish to electrically isolate
the samples from the sample holder. Four samples were loaded on each face.
Lakeshore temperature controller (model 340), Keithley source meter (model
2400) and Keithley digital voltmeter (model 180) were used for measurement. The
data were collected after achieving the required temperature stability. The re-
HIGH-PRESSURE MOSSBAUER MEASUREMENTS
sistance versus temperature was plotted and the resistivity is determined usingthe following relation:
� ¼ A=Lð ÞRwhere A is the area perpendicular to the current direction and L is the distance
between the voltage leads.
36 37 38 39 40 41 42 430
200
400
600
800
1000
1200
1400
1600
1800
2000
2200
2400
2600
2800
3000
FWHM=0.74
FWHM=0.06
Si (111)
(020)in
tens
ity
2 theta (degrees)
20 40 60 80
0
500
1000
1500
2000
2500
3000
Inte
nsity
2 theta (Degrees)
A
B
Figure 1. X-ray diffraction (XRD) of La0.8Sr0.2 (Mn0.8Fe0.1957Fe0.01) O3 sample with FeK�
radiation. The peaks are indexed with (hkl) values. * denotes the reflection due to FeK� radiation.
Also shown is the (020) reflection in comparison with (111) reflection line of bulk silicon.
U. CHANDRA ET AL.
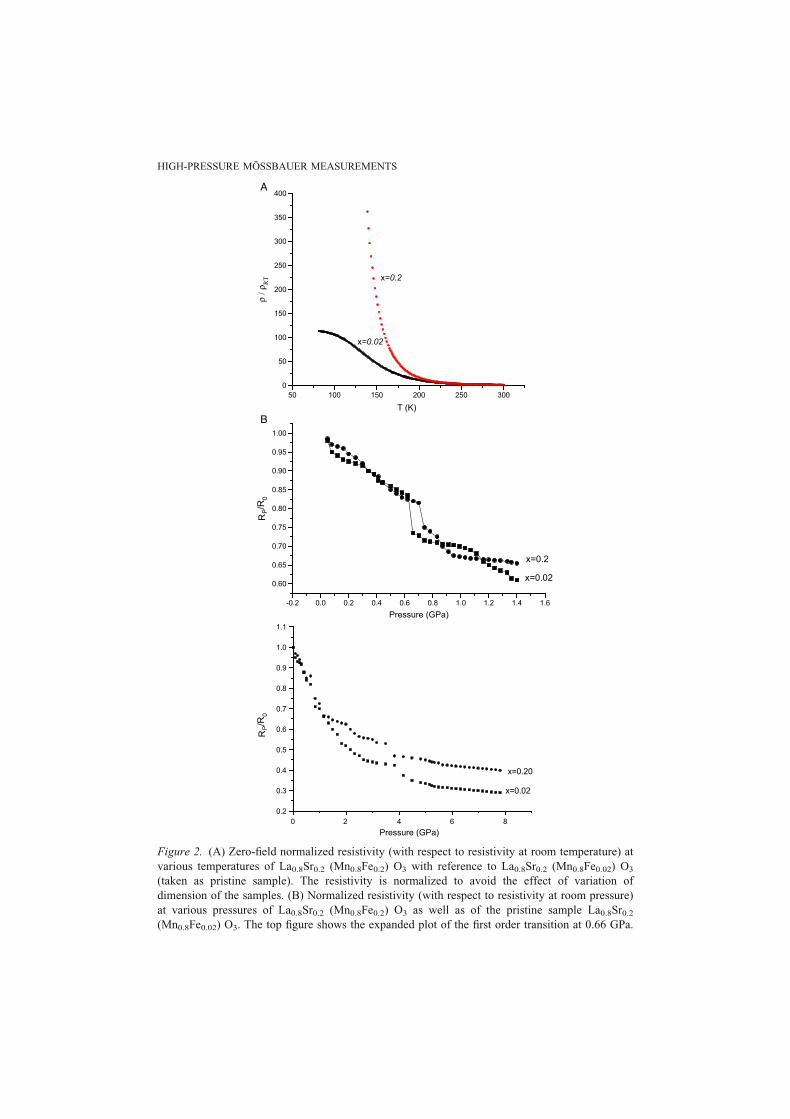
Figure 2. (A) Zero-field normalized resistivity (with respect to resistivity at room temperature) at
various temperatures of La0.8Sr0.2 (Mn0.8Fe0.2) O3 with reference to La0.8Sr0.2 (Mn0.8Fe0.02) O3
(taken as pristine sample). The resistivity is normalized to avoid the effect of variation of
dimension of the samples. (B) Normalized resistivity (with respect to resistivity at room pressure)
at various pressures of La0.8Sr0.2 (Mn0.8Fe0.2) O3 as well as of the pristine sample La0.8Sr0.2
(Mn0.8Fe0.02) O3. The top figure shows the expanded plot of the first order transition at 0.66 GPa.
HIGH-PRESSURE MOSSBAUER MEASUREMENTS
The insulator like behaviour along with the absence of metal-insulator tran-
sition is quite obvious in the Figure 2A supporting grain boundary dominance in
the sample. The chances of observing transition at lower temperature are weak as
the grain boundary resistance increases with decreasing temperature [14].
(ii) High pressure resistivity data are obtained by four probe method using
a Keithley constant-current source (model 263), Keithley electrometer (model
614), a Keithley scanner (model 199) and Hewlett-Packard multimeter (model
3455A). The powdered sample in the form of pallet was placed in an opposed
anvil system. High pressure cell was calibrated against the well known solid
phase transitions in tellurium, bismuth and thallium. Typical error in the pressure
measurement is 4.2%. The resistivity data is normalized with respect to that at
ambient condition. The pressure dependence electrical resistivity (Figure 2B) is
used as supportive tool to emphasize our Mossbauer observations.
2.4. MOSSBAUER MEASUREMENTS
Room pressure measurement was done using a 10 mci 57Co(Rh) source at constant
acceleration mode using krypton filled proportional counter as detector. A Si PIN
solid state detector (Amptek XR100CR) with a resolution of 250 eV was used in
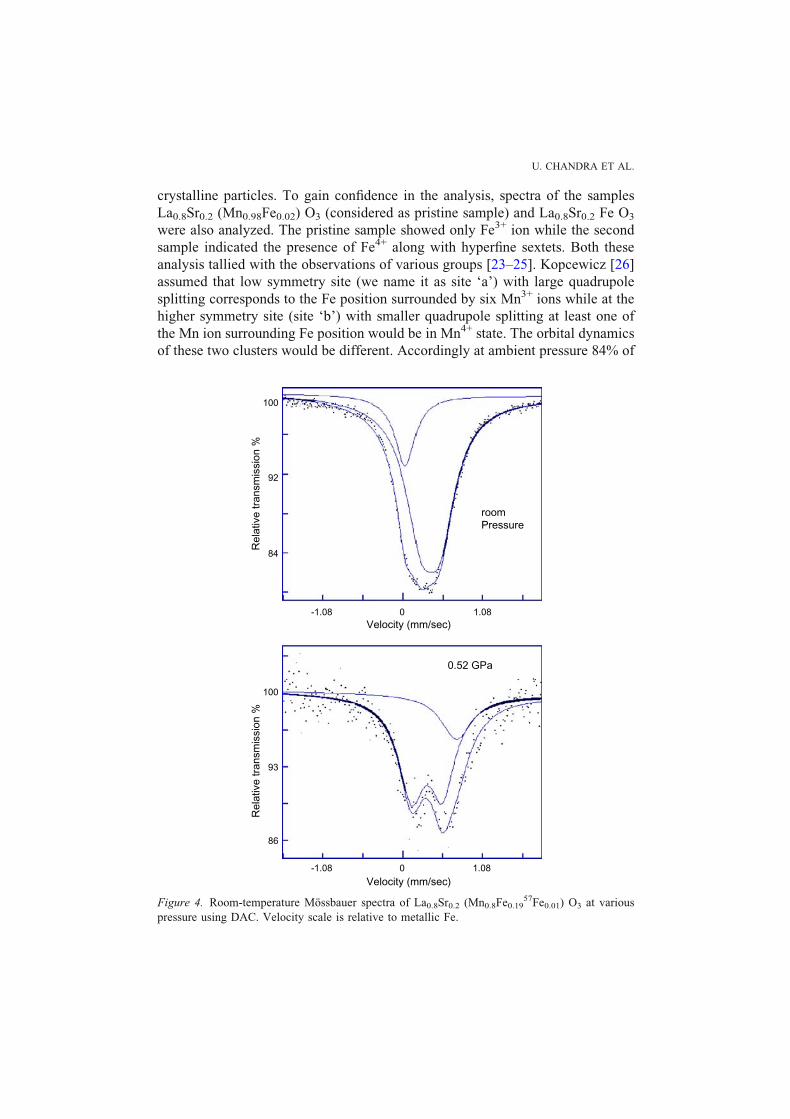
place of proportional counter to measure the transmitted 14.4 KeV �-rays. The
PHA (pulse height analysis) of both the detectors is shown in Figure 3. The
advantage of using krypton gas is that along with 14.4 KeV, an escape peak ~2
KeV is deposited in the counter. Both 14.4 KeV photo peak and 2 KeV escape peak
represent good Mossbauer events and using them through two independent single
channel analyzers increase the detection efficiency. For high-pressure Mossbauer
measurements, the experimental arrangement has been reported elsewhere in
detail [17] wherein the importance of resolution of the detector for Mossbauer
signal is emphasized. The sample was loaded in a Merrill Bassett type diamond
anvil cell (DAC) using tantalum gasket and a methanol : ethanol (4 : 1) mixture as
the pressure transmitting medium [18]. Owing to small quantity of sample in the
cell, the exposure time was about 10 days for fairly reasonable spectral statistics.
The pressure on the sample in the DAC was determined using Ruby fluorescence
technique and the shift in the R1 and R2 lines of ruby, linearly varying with
pressure were measured. The shift varies as 0.365 cmj1/Kbar [19]. The Mossbauer
patterns were analyzed with an appreciable goodness-of fit parameter and a spectral
line width using the program by Jernberg and Sundquist [20].
3. Results and discussion
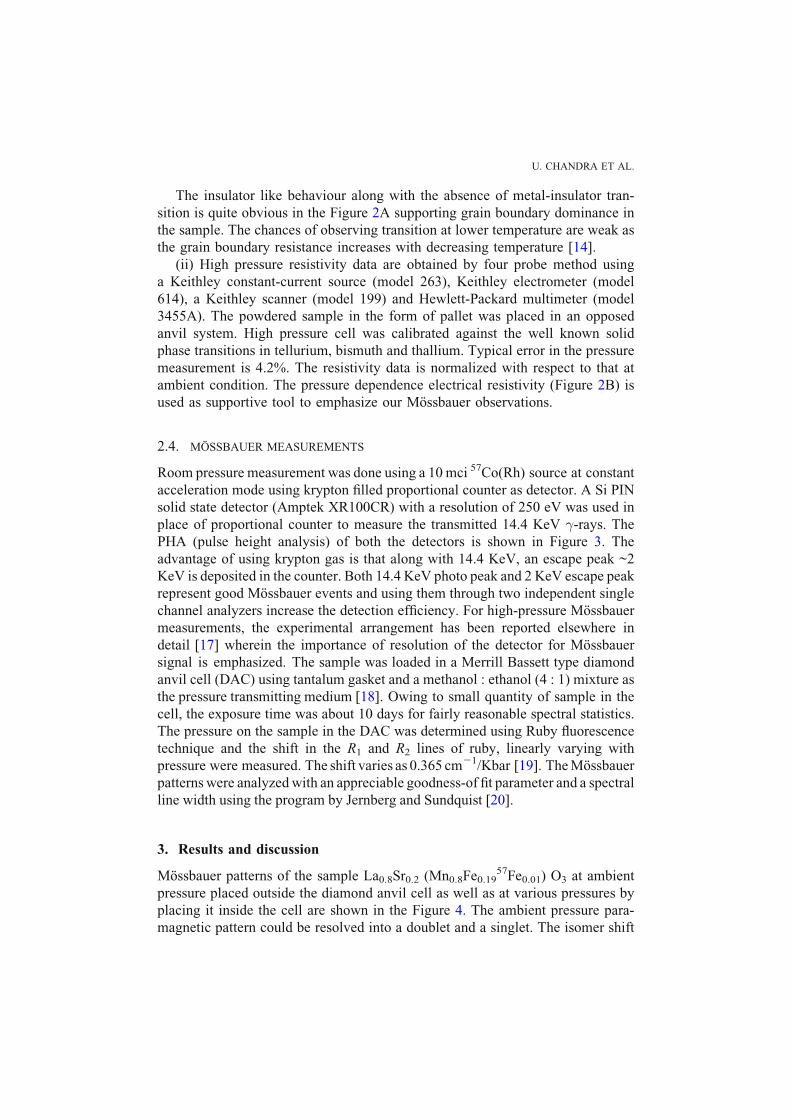
Mossbauer patterns of the sample La0.8Sr0.2 (Mn0.8Fe0.1957Fe0.01) O3 at ambient
pressure placed outside the diamond anvil cell as well as at various pressures by
placing it inside the cell are shown in the Figure 4. The ambient pressure para-
magnetic pattern could be resolved into a doublet and a singlet. The isomer shift
U. CHANDRA ET AL.

and quadrupole splitting suggest the presence of both Fe3+ and Fe4+ at two dif-
ferent environments while X-ray diffraction pattern of the sample show a single
phase orthorhombic structure. Goodenough [21] predicted different chemical and
crystallographic environment in perovskite manganite which were not detected
by XRD [22]. Mossbauer spectroscopy, being sensitive could detect such varia-
nce in environment. The large line width may be due to the distribution of nano-
0 2 4 6 8 10 12 14 16 180
100
200
300
400
500
600
700
Si PIN detector
coun
ts p
er 3
0 se
c
energy (KeV)
0 2 4 6 8 10 12 14 16 18 200
1000
2000
3000
4000
5000
6000
7000
proportional counter
energy (KeV)
coun
ts p
er 3
0 se
cA
B
Figure 3. PHA (pulse height analysis) curves of Co57 (Rh) Mossbauer source using krypton filled
proportional counter and Si-PIN solid state detector.
HIGH-PRESSURE MOSSBAUER MEASUREMENTS
crystalline particles. To gain confidence in the analysis, spectra of the samples
La0.8Sr0.2 (Mn0.98Fe0.02) O3 (considered as pristine sample) and La0.8Sr0.2 Fe O3
were also analyzed. The pristine sample showed only Fe3+ ion while the second
sample indicated the presence of Fe4+ along with hyperfine sextets. Both these
analysis tallied with the observations of various groups [23Y25]. Kopcewicz [26]
assumed that low symmetry site (we name it as site Fa_) with large quadrupole
splitting corresponds to the Fe position surrounded by six Mn3+ ions while at the
higher symmetry site (site Fb_) with smaller quadrupole splitting at least one of
the Mn ion surrounding Fe position would be in Mn4+ state. The orbital dynamics
of these two clusters would be different. Accordingly at ambient pressure 84% of
100
100
93
86
92
84
-1.08 1.08
roomPressure
Rel
ativ
e tr
ansm
issi
on %
Velocity (mm/sec)
Velocity (mm/sec)
Rel
ativ
e tr
ansm
issi
on %
0.52 GPa
0
-1.08 1.080
Figure 4. Room-temperature Mossbauer spectra of La0.8Sr0.2 (Mn0.8Fe0.1957Fe0.01) O3 at various
pressure using DAC. Velocity scale is relative to metallic Fe.
U. CHANDRA ET AL.

-1.08 1.08
3.7GPa
0.87 GPa
0
-1.08
82
91
100
1.080
Velocity (mm/sec)
Velocity (mm/sec)
Rel
ativ
e tr
ansm
issi
on %
84
92
100
Rel
ativ
e tr
ansm
issi
on %
-1.08 1.08
9.2 GPa
0
Velocity (mm/sec)
84
92
100
Rel
ativ
e tr
ansm
issi
on %
Figure 4. (Continued.)
HIGH-PRESSURE MOSSBAUER MEASUREMENTS

Fe3+ is seen in the symmetric environment of Mn3+ surrounding the Fe3+ ion
whereas 16% of Fe4+ with at least one Mn4+ in the octahedral.
The effect of pressure on the oxidation states of iron has been studied in
details [27]. The oxidation state of Fe4+ and Fe6+ is found to be reduced to Fe3+
and Fe4+, respectively with increase in pressure. In many compounds, both ionic
and covalent, pressure reduces the high spin ferric ion to ferrous state. The iso-
mer shift and quadrupole splitting of high spin Ferric ion is in the range of
0.3Y0.5 mm/s and 0Y0.6 mm/s, respectively while those parameters for high spin
ferrous are 1.2Y1.4 mm/s and 2.0Y3.0 mm/s, respectively. Isomer shift is a
measure of s electron density at the Fe site. Higher isomer shift might be due to
(a) extra 3d shielding lowering the s electron density at the Fe nucleus and (b)
due to electron transfer from a nonbonding ligand level to an antibonding 3d
level of the iron. Increase in pressure lowers the energy of 3d orbitals vis-a-vis
the ligand levels, thus permitting the thermal transfer of an electron from ligand
to metal. Quadrupole splitting (QS) is a measure of electric field gradient (EFG)
at the nucleus comprising of the contribution from the valence electrons as well
as lattice. In the case of perfect octahedral, the four valence electrons of
Fe4+ occupy the three-fold degenerate t2g (dxy, dyz, dzx) and produce no EFG, Vzz
(Fe) = 0. For lower symmetry, the degeneracy is removed and electrons will
preferentially occupy the low lying energy levels hence non-zero EFG. Similarly
for Fe3+ ions, half filled shell being spherically symmetric, makes no contribution
to EFG. As the pressure is increased, only the lattice contribution affects the
electric field gradient or the QS.
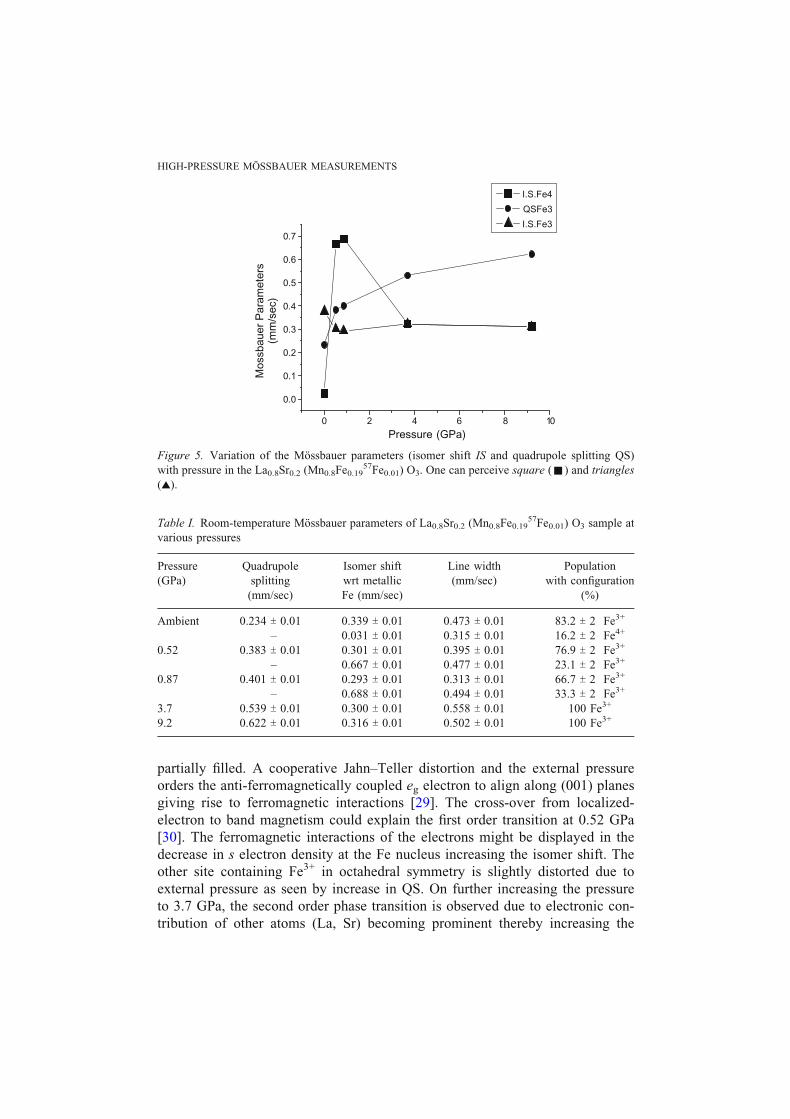
The pressure dependence of isomer shift and quadrupole splitting of Fe pres-
ent at different environment is shown in Figure 5, Table I. The behaviour of iron
in both the sites (Fa_ and Fb_) is different. Mossbauer patterns at 0.52 and 0.87
GPa could be resolved into one doublet and a singlet whereas the pattern at 3.7 as
well as at 9.2 GPa could be fitted by one doublet only. A sudden increase in
isomer shift observed for site Fb_ of Fe4+ configuration at 0.52 GPa represents
first order phase transition to high spin Fe3+. However for the site Fa_ the isomer
shift remains almost the same throughout the range up to 10 GPa. The variation
in percentage abundance with pressure shows the some of ferric ion of site Fa_has transformed into higher symmetry site. Another phase transition is seen at
3.7 GPa where isomer shift of site Fb_ drops down to coincide with that of
site Fa_; there seems to be only one site corresponding to ferric state up to 10
GPa. The increase in QS and width indicates the distribution of iron in dis-
torted octahedral.
Owing to crystal field effects, the 3d states are split into t2g and eg orbitals. In
order of increasing energy, these states are t32gj, eg
1j, t3
2g,, eg1,. The electronic
configurations are t32gj eg2j for Fe3+; t3
2gj eg1j for Fe4+ and Mn3+ and t3
2gj for Mn4+
respectively. In a mixed (Mn, Fe) manganite system, Jonker [28] concluded
that the bottom of the Mn3+egj band should be slightly higher than the top of the
Fe3+egj band, thereby completely filling the Fe band while keeping the Mn band
U. CHANDRA ET AL.
partially filled. A cooperative JahnYTeller distortion and the external pressure
orders the anti-ferromagnetically coupled eg electron to align along (001) planes
giving rise to ferromagnetic interactions [29]. The cross-over from localized-
electron to band magnetism could explain the first order transition at 0.52 GPa
[30]. The ferromagnetic interactions of the electrons might be displayed in the
decrease in s electron density at the Fe nucleus increasing the isomer shift. The
other site containing Fe3+ in octahedral symmetry is slightly distorted due to
external pressure as seen by increase in QS. On further increasing the pressure
to 3.7 GPa, the second order phase transition is observed due to electronic con-
tribution of other atoms (La, Sr) becoming prominent thereby increasing the
0 2 4 6 8 10
0.0
0.1
0.2
0.3
0.4
0.5
0.6
0.7
I.S.Fe4
QSFe3
I.S.Fe3
Mos
sbau
er P
aram
eter
s(m
m/s
ec)
Pressure (GPa)
Figure 5. Variation of the Mossbauer parameters (isomer shift IS and quadrupole splitting QS)
with pressure in the La0.8Sr0.2 (Mn0.8Fe0.1957Fe0.01) O3. One can perceive square (Í) and triangles
(r).
Table I. Room-temperature Mossbauer parameters of La0.8Sr0.2 (Mn0.8Fe0.1957Fe0.01) O3 sample at
various pressures
Pressure
(GPa)
Quadrupole
splitting
(mm/sec)
Isomer shift
wrt metallic
Fe (mm/sec)
Line width
(mm/sec)
Population
with configuration
(%)
Ambient 0.234 T 0.01 0.339 T 0.01 0.473 T 0.01 83.2 T 2 Fe3+
Y 0.031 T 0.01 0.315 T 0.01 16.2 T 2 Fe4+
0.52 0.383 T 0.01 0.301 T 0.01 0.395 T 0.01 76.9 T 2 Fe3+
Y 0.667 T 0.01 0.477 T 0.01 23.1 T 2 Fe3+
0.87 0.401 T 0.01 0.293 T 0.01 0.313 T 0.01 66.7 T 2 Fe3+
Y 0.688 T 0.01 0.494 T 0.01 33.3 T 2 Fe3+
3.7 0.539 T 0.01 0.300 T 0.01 0.558 T 0.01 100 Fe3+
9.2 0.622 T 0.01 0.316 T 0.01 0.502 T 0.01 100 Fe3+
HIGH-PRESSURE MOSSBAUER MEASUREMENTS
s electron density at the Fe nucleus and decreasing the isomer shift again. The
further increase in pressure up to 9.2 GPa just distorts the lattice as indicated by
large QS and linewidth. Moreover, one could also notice from percentage
abundance of the sites that participation towards the transformation is mainly
due to Fe4+ ion in site Fb_ as suggested by Banks and Tashima [31]. The pressure
dependence of normalized electrical resistivity (shown in Figure 2B) shows very
interesting features not observed in bulk sample [30]. Around 0.66 GPa one
can notice a first order change in the resistivity and a subtle second order phase
transition at about 3.6 GPa. Zhou and Goodenough [29] observed the existence
of two peaks in the ac susceptibility measurements corresponding to pressure 0.7
GPa indicating a two phase region characterized by first order transition and
proposed these to be due to the behaviour of ej electron of Mn3+ (t2g3 eg
1) in the
single crystal LaMnO3.
4. Conclusion
Nanocrystalline La0.8Sr0.2Mn0.8Fe0.1957Fe0.01O3 as a function of pressure up to 10
GPa show sudden increase in isomer shift at 0.52 GPa indicating the trans-
formation from Fe4+ to Fe3+ due to transfer of eg electrons from ligand to iron 3d
level under pressure. A second transition is seen at 3.7 GPa where only Fe3+ is
distributed with single kind of environment. Pressure prominently affects the
higher symmetry sites with Fe4+ ions. Pressure dependence of electrical resistivity
measurements verifies these transitions and attributes first order phase transition at
0.66 GPa to the transition from localized-electron to band magnetism.
Acknowledgements
We acknowledge Magnetism and Mossbauer lab for the XRD measurement.
PM and MK are grateful to Council of Scientific and Industrial Research (CSIR,
Delhi) and Defence Research and Development Organization (DRDO, Delhi)
for the financial supports respectively. Acknowledgement is due to DAAD/
GTZ, Germany for gifting Mossbauer set up. UC is grateful to Dr. Y.K. Sharma,
Department of Physics, University of Rajasthan, for the fruitful and critical dis-
cussions. We also thank the referees of the manuscript for the valuable comments
and suggestions.
References
1. Liu L. G., Geophys. Res. Lett. 2 (1975), 417.
2. Wood B. J., Nature 341 (1989), 278.
3. Knitlle E. and Jeanloz R., Nature 319 (1986), 214; Science 235 (1987), 668.
4. Hemley R. J. and Cohen R. E., In: Annual Rev. Earth and Planetary Sciences 20 (1992), 553.
5. Millis A. J., Nature 392 (1998), 147.
U. CHANDRA ET AL.

6. Tokura Y. (ed.), Colossal Magneto-Resistive Oxides, Gordon and Breach, Amsterdam, 2000;
Physics Today 56 (2003), 50.
7. Goodenough J. B., In: Gschneider Jr K. A., Buenzil J. C. G. and Pecharsky V. K. (eds.),
Handbook on the Physics and Chemistry of Rare Earths, Vol. 33, Elsevier North Holland,
Amsterdam, 2003, p. 249.
8. Zener C., Phys. Rev. 82 (1951), 403.
9. Kuzushita K., Morimoto S., Nasu S. and Nakamura S., J. Phys. Soc. Jpn. 69 (2000), 2767.
10. Kawasaki S., Takano M. and Takeda Y., J. Solid State Chem. 121 (1996), 174.
11. Lebon A., Adler P., Bernhard C., Boris A. V., Pimenov A. V., Maljuk A., Lin C. J., Ulrich C.
and Keimer B., Phys. Rev. Lett. 92 (2004), 037202.
12. Urushibara A., Morimoto Y., Arima T., Asamitsu A., Kidu G. and Tokura Y., Phys. Rev. B 51
(1995), 14103.
13. Khazeni K., Jia Y. X., Lu L., Crespi V. H., Cohen M. L. and Zettl A., Phys. Rev. Lett. 76
(1996), 295.
14. Zhu T., Shen B. G., Sun J. R., Zhao H. W. and Zhan W. S., Appl. Phys. Lett. 78 (2001), 24.
15. Cullity B. D., In: Elements of X-ray Diffraction, Addison Wiley, USA, 1959, p. 132.
16. Tkachul A., Rogacki K., Brown D. E., Dabrowski B., Fedro A. J., Kimball C. W., Pyles B.,
Xiong X., Rosenmann D. and Dunlap B. D., Phys. Rev. B 57 (1998), 8509.
17. Chandra U., Siddha S., Malhotra N. and Gupta A., In: Victor Jaya N., Rajagopalan M. and
Natarajan S. (eds.), Advances in High Pressure Science and Technology, Allied Publisher,
Chennai, 2000, p. 257.
18. Jayaraman A., Rev. Mod. Phys. 55 (1983), p. 65.
19. Piermarini G. J., Block S., Barnett J. D. and Forman R. A., J. Appl. Phys. 46 (1975), 2774.
20. Jernberg P. and Sundquist T., Report UUIP-1090, Institute of Physics, University of Uppsala,
1983.
21. Goodenough J. B., Phys. Rev. 100 (1955), 564.
22. Wollen E. O. and Koehler W., Phys. Rev. 100 (1955), 545.
23. Ahn K. H., Wu X. U., Liu K. and Chien C. L., Phys. Rev. B 54 (1996), 15299.
24. Gutierez J., Pena A., Barandiaran J. M., Pizarro J. L., Hernandez T., Lezano L., Insausti M.
and Rojo T., Phys. Rev. B 61 (2000), 9028.
25. Pasternak M. P. and Taylor R. D., In: Manghnani M. H. (ed.), Proceedings of Int. Conf. on
High Pressure Science and Technology, AIRAPT-17, Honolulu, 1999.
26. Kopcewicz M., Khomchenko V. A., Troyanchuk I. O. and Szymczak H., J. Phys., Condens.
Matter 16 (2004), 4335.
27. Champion A. R., Vaughan R. W. and Drickamer H. G., J. Chem. Phys. 47 (1967), 2583;
Champion A. R. and Drickamer H. G., J. Chem. Phys. 47 (1967), 2591; Holzapfel W. and
Drickamer H. G., J. Chem. Phys. 50 (1969), 1480; Panyushkin V. N., De Pasquali G. and
Drickamer H. G., J. Chem. Phys. 51 (1969), 3305.
28. Jonker G. H., Physica 20 (1954), 1118.
29. Zhou J. S. and Goodenough J. B., Phys. Rev. Lett. 89 (2002), 087201.
30. Chandra U. and Parthasarathy G., Philos. Mag. Lett. 84 (2004), 565.
31. Banks E. and Tashima N., J. Appl. Phys. 41 (1970), 1186.
HIGH-PRESSURE MOSSBAUER MEASUREMENTS
Copyright © 2022 FDOKUMEN